UNITED STATES
SECURITIES AND EXCHANGE COMMISSION
Washington, D.C. 20549
FORM N-CSR
CERTIFIED SHAREHOLDER REPORT OF REGISTERED
MANAGEMENT INVESTMENT COMPANIES
| | |
Investment Company Act file number: | | 811-3618 |
Metropolitan Series Fund, Inc.
|
| (Exact name of registrant as specified in charter) |
| | |
501 Boylston Street Boston, Massachusetts 02116 |
| (Address of Principal Executive Office) |
MICHAEL P. LAWLOR, ESQ.
MetLife Advisers, LLC
501 Boylston Street
Boston, Massachusetts 02116
|
| (Name and address of agent for service) |
Copy to:
JOHN M. LODER, ESQ.
Ropes & Gray, LLP
One International Place
Boston, Massachusetts 02110
Registrant’s telephone number, including area code: 617-578-3104
Date of fiscal year end: December 31
Date of reporting period: January 1, 2008 through December 31, 2008
Form N-CSR is to be used by management investment companies to file reports with the Commission not later than 10 days after the transmission to stockholders of any report that is required to be transmitted to stockholders under Rule 30e-1 under the Investment Company Act of 1940 (17 CFR 270.30e-1). The Commission may use the information provided on Form N-CSR in its regulatory, disclosure review, inspection, and policymaking roles.
A registrant is required to disclose the information specified by Form N-CSR, and the Commission will make this information public. A registrant is not required to respond to the collection of information contained in Form N-CSR unless the Form displays a currently valid Office of Management and Budget (“OMB”) control number. Please direct comments concerning the accuracy of the information collection
burden estimate and any suggestions for reducing the burden to Secretary, Securities and Exchange Commission, 450 Fifth Street, NW, Washington, DC 20549-0609. The OMB has reviewed this collection of information under the clearance requirements of 44 U.S.C. §3507.
| Item 1. | Reports to Stockholders |
The following is a copy of the report transmitted to stockholders pursuant to Rule 30e-1 under the Investment Company Act of 1940 (the “Act”):

Simplify your life…
with MetLife eDelivery® while helping MetLife preserve the planet’s natural resources.
(see details on inside cover)
| | |
Metropolitan Series Fund, Inc. BlackRock Aggressive Growth Portfolio Annual Report | | December 31, 2008 |
NOT PART OF THE ANNUAL REPORT
Letter from the President
February 1, 2009
Letter to Policy Holders:
2008 was an extraordinary year in the capital markets around the world and for the global economy. Energy prices rose to record levels early in the year before falling by two-thirds by year-end. A credit crisis that began with concerns about sub-prime mortgages led to massive changes in the financial landscape with government takeovers, forced sales, and outright failures of a number of large, once venerable firms.
While bonds as measured by the Barclays Capital U.S. Aggregate Bond Index (formerly known as, Lehman Brothers U.S. Aggregate Bond Index) were up 5.2% for the year in response to declining interest rates, there were large differences in the total returns of the various sectors of the bond market. U.S. treasury securities were up over 13% as frightened investors sought refuge in what they perceived to be the safest and most liquid investments. In contrast, investment grade corporate securities lost nearly 5% as credit spreads widened and below investment grade or high yield bonds fell over 26%.
In response to the growing credit crisis and the weakening economy, common stocks fell sharply across all regions, styles, and capitalizations. As measured by the Standard and Poor’s 500, U.S. common stocks fell 37% for the year, the worst calendar year decline since the 1930s. Foreign stocks were down even more with the MSCI EAFE Index down 43% for the year.
On the following pages, you will find a complete review of your Portfolio and its investment performance.
MetLife is committed to building your financial freedom. We appreciate your trust and will continue to focus our efforts on meeting your investment needs.
Sincerely,

Elizabeth M. Forget
President, Metropolitan Series Fund, Inc.
Metropolitan Series Fund, Inc.
BlackRock Aggressive Growth Portfolio
Managed by BlackRock Advisors, LLC
Portfolio Manager Commentary*
PORTFOLIO PERFORMANCE
For the twelve-month period ended December 31, 2008, the Class A shares of the BlackRock Aggressive Growth Portfolio returned -45.7%, compared to its benchmark, the Russell Midcap Growth Index1, which returned -44.3%. The average return of its peer group, the Lipper Variable Insurance Products2 Mid-Cap Growth Funds Universe, was -45.2% over the same period.
PORTFOLIO REVIEW
The U.S. equity market trended lower through the first half of 2008, as weakness in the housing and mortgage market, fear of recession, and sharply rising energy and commodity costs dominated investor attention. The credit market troubles which had begun in 2007 with subprime mortgages rapidly spread in September 2008 with a number of large and previously distinguished financial institutions either failing, being rescued by the federal government or selling themselves as a last resort. Volatility rose to extreme levels as continued government intervention and economic stimuli grappled with massive deleveraging and a flight to safety. The uncertainty of the credit crisis, combined with the lack of lending activity, resulted in a sharp downturn in economic activity during the fall, guaranteeing a second consecutive decline in quarterly GDP. Investors in stocks found no safe haven, as sharp declines impacted all sectors, market capitalizations and styles.
The BlackRock Aggressive Growth Portfolio underperformed the -44.3% return of the Russell Midcap Growth Index. Stock selection in the consumer staples sector was the most significant detractor for the Portfolio during the year. Strong stock selection in the information technology sector was a positive contributor to Portfolio returns during the period.
Weaker stock selection in the consumer staples sector, which was the best relative performer in the benchmark, was the most significant detractor from relative returns for the Portfolio. The Portfolio’s slight underweight in the sector also hindered performance comparisons. Minerals-based cosmetic company Bare Escentuals dropped more than 75% on investor worries about increased domestic competition and slower growth. Weakening fundamentals, along with management’s lack of execution has confirmed the prudence of our exit from the position. Elsewhere in the Portfolio, video game retailer GameStop fell 65% on concerns about slowing revenue growth. The company operates retail centers for selling video game hardware and software, as well as used video gaming equipment. The Portfolio continues to hold a position in the name, as we believe its fundamentals and valuations are currently attractive. Finally, an overweight in the energy sector had a slightly negative effect on the Portfolio, as the sector dropped more than 55% for the year.
Stronger stock selection in the information technology sector was the biggest contributor to relative returns for the period. Although not spared the volatility, semiconductor names Broadcom and PMC-Sierra held up relatively well on strong execution. Elsewhere in technology, software provider Intuit relatively outperformed on continued demand for its tax filing software.
The most notable changes in sector positioning during the year came in the consumer discretionary, energy and industrials sectors. Within the consumer discretionary sector, an increase in both relative and absolute weights was the result of selectively adding names to the Portfolio. During the second half of the year, we added some very small positions in early cyclical names. These included Darden Restaurants, Bed Bath & Beyond and Burger King. We also eliminated a few consumer discretionary holdings during the year, as the individual company fundamentals warranted. Notable names include International Game Technology and Pinnacle Entertainment, as fundamentals in casino & gaming operators indicated early signs of weakness. The reductions in our relative positions in energy and materials were mostly related to the unwinding of these sectors in the broad market. We did add some small additional positions in the energy sector, as the valuations looked attractive. Within industrials, we decreased Portfolio exposure by selling Quanex and Precision Castparts.
At year-end, the Portfolio’s largest overweights were in the healthcare and information technology sectors, and the most significant underweight was in the financials sector. We continue to look for names with good growth opportunities, regardless of sector or market conditions.
* The views expressed above are those of the subadvisory firm as of December 31, 2008 and are subject to change based on market and other conditions. Information about the Portfolio’s holdings, asset allocation, industry allocation, or country diversification is historical and is not an indication of future Portfolio composition, which will vary. The performance of any index mentioned in this commentary has not been adjusted for ongoing management, distribution and operating expenses, and sales charges applicable to mutual fund investments. Direct investment in any index is not possible.
1 The Russell Midcap® Growth Index is an unmanaged measure of performance of those Russell Midcap companies (the 800 smallest companies in the Russell 1000 Index) with higher price-to-book ratios and higher forecasted growth values.
2 The Lipper Variable Products Fund Average is an average of the total return performance (calculated on the basis of net asset value) of variable product funds with similar investment objectives to those of the subject Portfolio as calculated by Lipper Analytical Services, an independent mutual fund ranking service.
MSF-2
Metropolitan Series Fund, Inc.
BlackRock Aggressive Growth Portfolio
A $10,000 INVESTMENT COMPARED TO THE RUSSELL MIDCAP GROWTH INDEX
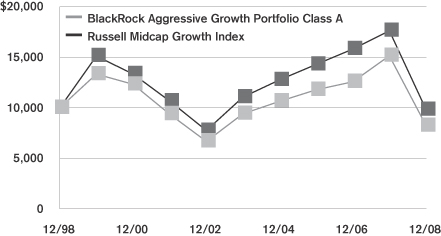
Average Annual Returns as of December 31, 2008
| | | | | | | | | | | | | | | |
| | | BlackRock Aggressive Growth Portfolio | | | Russell
Midcap
Growth Index | |
| | | Class A | | | Class B | | | Class D | | | Class E | | |
| 1 Year | | -45.7 | % | | -45.8 | % | | -45.7 | % | | -45.8 | % | | -44.3 | % |
| 5 Year | | -2.7 | | | — | | | — | | | -2.8 | | | -2.3 | |
| 10 Year | | -1.9 | | | — | | | — | | | — | | | -0.2 | |
| Since Inception | | — | | | -4.1 | | | -15.2 | | | -3.7 | | | — | |
Performance numbers are net of all Portfolio expenses but do not include any insurance, sales, or administrative charges of variable annuity or life insurance contracts or any additional expenses that participants in certain eligible qualified plans may bear relating to the operations of their plans. If these charges were included, the returns would be lower.
Inception dates of the Class A, Class B, Class D and Class E shares are: 4/29/88, 4/26/04, 5/2/06 and 5/1/01, respectively.
This information represents past performance and is not indicative of future results. Investment return and principal value may fluctuate so that shares, upon redemption, may be worth more or less than the original cost.
PORTFOLIO COMPOSITION
as of December 31, 2008
Top Holdings
| | |
| | | % of Total
Net Assets |
Ametek, Inc. | | 3.2% |
Scientific Games Corp. | | 2.9% |
Harris Corp. | | 2.6% |
IDEX Corp. | | 2.5% |
Shire, Plc. (ADR) | | 2.4% |
Mednax, Inc. | | 2.4% |
Medco Health Solutions, Inc. | | 2.3% |
Apollo Group, Inc. (Class A) | | 2.3% |
Amdocs, Ltd. | | 2.2% |
Iron Mountain, Inc. | | 2.2% |
Top Sectors
| | |
| | | % of Total
Market Value |
Information Technology | | 22.4% |
Health Care | | 19.0% |
Consumer Discretionary | | 16.9% |
Industrials | | 13.9% |
Energy | | 10.4% |
Materials | | 5.1% |
Financials | | 4.9% |
Cash | | 3.7% |
Consumer Staples | | 2.7% |
Telecommunication Services | | 1.0% |
MSF-3
Metropolitan Series Fund, Inc.
Shareholder Expense Example
As a shareholder of the Portfolio, you incur ongoing costs, including management fees; distribution and service (12b-1) fees; and other Portfolio expenses. This example is intended to help you understand your ongoing costs (in dollars) (referred to as “expenses”) of investing in the Portfolio and compare these costs with the ongoing costs of investing in other mutual funds. The example is based on an investment of $1,000 invested at the beginning of the period and held for the entire period, July 1, 2008 through December 31, 2008.
Actual Expenses
The first line for each share class of the Portfolio in the table below provides information about actual account values and actual expenses. You may use the information in this line, together with the amount you invested in the particular share class of the Portfolio, to estimate the expenses that you paid over the period. Simply divide your account value by $1,000 (for example, an $8,600 account value divided by $1,000=8.6), then multiply the result by the number in the first line under the heading entitled “Expenses Paid During Period” to estimate the expenses you paid on your account during this period.
Hypothetical Example for Comparison Purposes
The second line for each share class of the Portfolio in the table below provides information about hypothetical account values and hypothetical expenses based on the Portfolio’s actual expense ratio and an assumed rate of return of 5% per year before expenses, which is not the Portfolio’s actual return. The hypothetical account values and expenses may not be used to estimate the actual ending account balance or expenses you paid for the period. You may use this information to compare the ongoing costs of investing in the Portfolio and other funds. To do so, compare this 5% hypothetical example with the 5% hypothetical examples that appear in the shareholder reports of the other funds.
Please note that the expenses shown in the table are meant to highlight your ongoing costs only and do not reflect any fees or charges of your variable insurance product or any additional expenses that participants in certain eligible qualified plans may bear relating to the operations of their plan. Therefore, the second line for each share class in the table is useful in comparing ongoing costs only, and will not help you determine the relative total costs of owning different funds. In addition, if these other costs were included, your costs would have been higher.
| | | | | | | | | | | | | | |
Portfolio | | | | Annualized
Expense
Ratio | | | Beginning
Account Value
July 1,
2008 | | Ending
Account Value
December 31,
2008 | | Expenses Paid
During Period*
July 1, 2008
to
December 31,
2008 |
BlackRock Aggressive Growth—Class A | | Actual | | 0.77 | % | | $ | 1,000.00 | | $ | 569.35 | | $ | 3.04 |
| | Hypothetical | | 0.77 | % | | $ | 1,000.00 | | $ | 1,021.22 | | $ | 3.91 |
| | | | | |
BlackRock Aggressive Growth—Class B | | Actual | | 1.02 | % | | $ | 1,000.00 | | $ | 568.70 | | $ | 4.02 |
| | Hypothetical | | 1.02 | % | | $ | 1,000.00 | | $ | 1,019.95 | | $ | 5.18 |
| | | | | |
BlackRock Aggressive Growth—Class D | | Actual | | 0.87 | % | | $ | 1,000.00 | | $ | 569.39 | | $ | 3.43 |
| | Hypothetical | | 0.87 | % | | $ | 1,000.00 | | $ | 1,020.71 | | $ | 4.42 |
| | | | | |
BlackRock Aggressive Growth—Class E | | Actual | | 0.92 | % | | $ | 1,000.00 | | $ | 569.07 | | $ | 3.63 |
| | Hypothetical | | 0.92 | % | | $ | 1,000.00 | | $ | 1,020.46 | | $ | 4.67 |
* Expenses paid are equal to the Portfolio’s annualized expense ratio for the most recent six month period, as shown above, multiplied by the average account value over the period, multiplied by the number of days in the most recent fiscal half-year, divided by 366 (to reflect the the one-half year period).
MSF-4
Metropolitan Series Fund, Inc.
BlackRock Aggressive Growth Portfolio
Schedule of Investments as of December 31, 2008
Common Stock—95.3% of Total Net Assets
| | | | | |
Security Description | | Shares | | Value* |
| | | | | |
| | |
Aerospace & Defense—2.2% | | | | | |
BE Aerospace, Inc. (a) | | 663,300 | | $ | 5,100,777 |
Goodrich Corp. | | 225,600 | | | 8,351,712 |
| | | | | |
| | | | | 13,452,489 |
| | | | | |
| | |
Biotechnology—1.4% | | | | | |
Martek Biosciences Corp. (a) (b) | | 283,200 | | | 8,583,792 |
| | | | | |
| | |
Capital Markets—1.1% | | | | | |
Invesco, Ltd. | | 457,521 | | | 6,606,603 |
| | | | | |
| | |
Chemicals—3.0% | | | | | |
Agrium, Inc. | | 180,600 | | | 6,163,878 |
Airgas, Inc. | | 138,000 | | | 5,380,620 |
Celanese Corp. (Series A) (b) | | 538,100 | | | 6,688,583 |
| | | | | |
| | | | | 18,233,081 |
| | | | | |
| | |
Commercial & Professional Services—2.2% | | | | | |
Employee Solutions, Inc. (c) (d) | | 484 | | | 0 |
Iron Mountain, Inc. (a) (b) | | 541,100 | | | 13,381,403 |
| | | | | |
| | | | | 13,381,403 |
| | | | | |
| | |
Communications Equipment—2.6% | | | | | |
Harris Corp. | | 425,264 | | | 16,181,296 |
| | | | | |
| | |
Construction & Engineering—1.9% | | | | | |
Quanta Services, Inc. (a) | | 581,100 | | | 11,505,780 |
| | | | | |
| | |
Containers & Packaging—1.3% | | | | | |
Rock-Tenn Co. | | 243,619 | | | 8,326,898 |
| | | | | |
| | |
Diversified Consumer Services—2.3% | | | | | |
Apollo Group, Inc. (Class A) (a) | | 186,200 | | | 14,266,644 |
| | | | | |
| | |
Diversified Financial Services—2.8% | | | | | |
CME Group, Inc. | | 21,930 | | | 4,563,852 |
MSCI, Inc. (a) | | 730,900 | | | 12,980,784 |
| | | | | |
| | | | | 17,544,636 |
| | | | | |
| | |
Electrical Equipment—3.2% | | | | | |
Ametek, Inc. | | 649,100 | | | 19,609,311 |
| | | | | |
|
Electronic Equipment, Instruments & Components—1.5% |
Amphenol Corp. (Class A) | | 380,700 | | | 9,129,186 |
| | | | | |
| | |
Energy Equipment & Services—5.7% | | | | | |
Acergy S.A. (ADR) (b) | | 503,500 | | | 2,910,230 |
IHS, Inc. (a) | | 242,900 | | | 9,089,318 |
National Oilwell Varco, Inc. (a) | | 196,400 | | | 4,800,016 |
Noble Corp. | | 343,800 | | | 7,594,542 |
Superior Energy Services, Inc. (a) | | 369,800 | | | 5,890,914 |
Weatherford International, Ltd. (a) | | 450,000 | | | 4,869,000 |
| | | | | |
| | | | | 35,154,020 |
| | | | | |
| | | | | |
Security Description | | Shares | | Value* |
| | | | | |
| | |
Health Care Equipment & Supplies—2.8% | | | | | |
Hologic, Inc. (a) (b) | | 649,600 | | $ | 8,490,272 |
ResMed, Inc. (a) | | 242,500 | | | 9,088,900 |
| | | | | |
| | | | | 17,579,172 |
| | | | | |
| | |
Health Care Providers & Services—10.1% | | | | | |
AmerisourceBergen Corp. | | 223,100 | | | 7,955,746 |
Laboratory Corp. of America Holdings (a) (b) | | 69,700 | | | 4,489,377 |
Lincare Holdings, Inc. (a) (b) | | 291,700 | | | 7,855,481 |
Magellan Health Services, Inc. (a) | | 328,400 | | | 12,860,144 |
Medco Health Solutions, Inc. (a) | | 345,000 | | | 14,458,950 |
Mednax, Inc. (a) | | 460,700 | | | 14,604,190 |
| | | | | |
| | | | | 62,223,888 |
| | | | | |
| | |
Hotels, Restaurants & Leisure—7.1% | | | | | |
Burger King Holdings, Inc. | | 289,200 | | | 6,906,096 |
Darden Restaurants, Inc. (b) | | 343,200 | | | 9,671,376 |
Orient-Express Hotels, Ltd. (Class A) (a) (b) | | 263,500 | | | 2,018,410 |
Panera Bread Co. (a) (b) | | 142,500 | | | 7,444,200 |
Scientific Games Corp. (a) (b) | | 1,009,900 | | | 17,713,646 |
| | | | | |
| | | | | 43,753,728 |
| | | | | |
| | |
Household Products—1.2% | | | | | |
Church & Dwight Co., Inc. | | 135,600 | | | 7,609,872 |
| | | | | |
| | |
IT Services—6.2% | | | | | |
Genpact, Ltd. (a) | | 1,039,200 | | | 8,542,224 |
Lender Processing Services, Inc. | | 395,250 | | | 11,640,113 |
SAIC, Inc. (a) | | 644,900 | | | 12,562,652 |
TeleTech Holdings, Inc. (a) | | 707,000 | | | 5,903,450 |
| | | | | |
| | | | | 38,648,439 |
| | | | | |
| | |
Life Sciences Tools & Services—1.2% | | | | | |
Thermo Fisher Scientific, Inc. (a) (b) | | 214,100 | | | 7,294,387 |
| | | | | |
| | |
Machinery—4.5% | | | | | |
IDEX Corp. | | 634,704 | | | 15,328,102 |
Joy Global, Inc. | | 317,200 | | | 7,260,708 |
Oshkosh Corp. (b) | | 597,100 | | | 5,308,219 |
| | | | | |
| | | | | 27,897,029 |
| | | | | |
| | |
Media—2.3% | | | | | |
CKX, Inc. (a) (b) | | 1,069,400 | | | 3,924,698 |
DreamWorks Animation SKG, Inc. (a) | | 415,300 | | | 10,490,478 |
| | | | | |
| | | | | 14,415,176 |
| | | | | |
| | |
Metals & Mining—0.8% | | | | | |
Century Aluminum Co. (a) (b) | | 510,698 | | | 5,106,980 |
| | | | | |
| | |
Oil, Gas & Consumable Fuels—4.7% | | | | | |
Chesapeake Energy Corp. | | 361,200 | | | 5,840,604 |
Consol Energy, Inc. | | 281,500 | | | 8,045,270 |
Massey Energy Co. | | 307,300 | | | 4,237,667 |
Plains Exploration & Production Co. (a) | | 276,200 | | | 6,418,888 |
*See accompanying notes to financial statements.
MSF-5
Metropolitan Series Fund, Inc.
BlackRock Aggressive Growth Portfolio
Schedule of Investments as of December 31, 2008
Common Stock—(Continued)
| | | | | |
Security Description | | Shares | | Value* |
| | | | | |
| | |
Oil, Gas & Consumable Fuels—(Continued) | | | | | |
Ultra Petroleum Corp. (a) | | 130,700 | | $ | 4,510,457 |
| | | | | |
| | | | | 29,052,886 |
| | | | | |
| | |
Personal Products—1.4% | | | | | |
Avon Products, Inc. | | 214,500 | | | 5,154,435 |
Bare Escentuals, Inc. (a) (b) | | 711,900 | | | 3,723,237 |
| | | | | |
| | | | | 8,877,672 |
| | | | | |
| | |
Pharmaceuticals—3.5% | | | | | |
Medicis Pharmaceutical Corp. (b) | | 507,300 | | | 7,051,470 |
Shire, Plc. (ADR) (b) | | 331,100 | | | 14,826,658 |
| | | | | |
| | | | | 21,878,128 |
| | | | | |
| |
Real Estate Management & Development—0.0% | | | |
FX Real Estate & Entertainment, Inc. (a) (b) | | 209,779 | | | 31,467 |
| | | | | |
| |
Semiconductors & Semiconductor Equipment—4.5% | | | |
Broadcom Corp. (a) | | 690,500 | | | 11,717,785 |
Lam Research Corp. (a) (b) | | 289,800 | | | 6,166,944 |
PMC-Sierra, Inc. (a) (b) | | 1,991,490 | | | 9,678,641 |
| | | | | |
| | | | | 27,563,370 |
| | | | | |
| | |
Software—7.6% | | | | | |
Adobe Systems, Inc. (a) | | 490,440 | | | 10,441,468 |
Amdocs, Ltd. (a) | | 759,950 | | | 13,899,485 |
Ansys, Inc. (a) | | 154,600 | | | 4,311,794 |
Intuit, Inc. (a) (b) | | 496,500 | | | 11,811,735 |
Salesforce.com, Inc. (a) (b) | | 211,700 | | | 6,776,517 |
| | | | | |
| | | | | 47,240,999 |
| | | | | |
| | |
Specialty Retail—4.7% | | | | | |
Bed Bath & Beyond, Inc. (a) (b) | | 251,600 | | | 6,395,672 |
GameStop Corp. (Class A) (a) (b) | | 507,500 | | | 10,992,450 |
The TJX Cos., Inc. | | 345,600 | | | 7,108,992 |
Urban Outfitters, Inc. (a) | | 321,600 | | | 4,817,568 |
| | | | | |
| | | | | 29,314,682 |
| | | | | |
| |
Textiles, Apparel & Luxury Goods—0.5% | | | |
Lululemon Athletica, Inc. (a) (b) | | 370,600 | | | 2,938,858 |
| | | | | |
| |
Wireless Telecommunication Services—1.0% | | | |
American Tower Corp. (Class A) (a) | | 217,327 | | | 6,372,028 |
| | | | | |
Total Common Stock
(Identified Cost $873,672,563) | | | | | 589,773,900 |
| | | | | |
| | |
| Mutual Funds—1.0% | | | | | |
| | |
Exchange Traded Funds—1.0% | | | | | |
iShares Russell Midcap Growth Index Fund | | 201,400 | | | 6,307,848 |
| | | | | |
Total Mutual Funds
(Identified Cost $10,276,636) | | | | | 6,307,848 |
| | | | | |
| | | | | | | |
| |
| Short Term Investments—20.9% | | | | |
| Security Description | | Shares/Face
Amount | | Value* | |
| | | | | | | |
| | |
Mutual Funds—17.0% | | | | | | | |
State Street Navigator Securities Lending Prime Portfolio (e) | | | 105,303,762 | | $ | 105,303,762 | |
| | | | | | | |
| | |
Repurchase Agreement—3.9% | | | | | | | |
State Street Repurchase Agreement dated 12/31/08 at 0.010% to be repurchased at $23,804,013 on 01/02/09, collateralized by $24,010,000 Federal Home Loan Bank 2.730% due 06/10/09 with a value of $24,281,313. | | $ | 23,804,000 | | | 23,804,000 | |
| | | | | | | |
Total Short Term Investments
(Identified Cost $129,107,762) | | | | | | 129,107,762 | |
| | | | | | | |
Total Investments—117.2%
(Identified Cost $1,013,056,961) (f) | | | | | | 725,189,510 | |
Liabilities in excess of other assets | | | | | | (106,374,286 | ) |
| | | | | | | |
| Total Net Assets—100% | | | | | $ | 618,815,224 | |
| | | | | | | |
| (b) | A portion or all of the security was on loan. As of December 31, 2008, the market value of securities loaned was $105,655,960 and the collateral received consisted of cash in the amount of $105,303,762. The cash collateral is invested in a money market fund managed by an affiliate of the custodian. |
| (d) | Non-Income Producing; issuer filed under Chapter 11 of the Federal Bankruptcy Code. |
| (e) | Represents investment of cash collateral received from securities lending transactions. |
| (f) | The aggregate cost of investments for federal income tax purposes as of December 31, 2008 was $1,022,435,919 and the composition of unrealized appreciation and depreciation of investment securities was $21,009,966 and $(318,256,375), respectively. |
| (ADR)— | An American Depositary Receipt is a certificate issued by a custodian bank representing the right to receive securities of the foreign issuer described. Trading on exchanges not located in the United States or Canada significantly influences the value of ADRs. |
*See accompanying notes to financial statements.
MSF-6
Metropolitan Series Fund, Inc.
BlackRock Aggressive Growth Portfolio
The Portfolio adopted the provisions of Statement of Financial Accounting Standards No. 157, “Fair Value Measurements” (FAS 157), effective with the beginning of the Portfolio’s fiscal year. FAS 157 establishes a framework for measuring fair value and expands disclosures about fair value measurements in financial statements. The three levels of the hierarchy under FAS 157 are described below:
Level 1 - quoted prices in active markets for identical securities
Level 2 - other significant observable inputs (including quoted prices for similar securities, interest rates, credit risk, etc.)
Level 3 - significant unobservable inputs (including the Portfolio’s own assumptions in determining the fair value of investments)
The inputs or methodology used for valuing securities are not necessarily an indication of the risk associated with investing in those securities.
The following is a summary of the inputs used to value the Portfolio’s net assets as of December 31, 2008:
| | | | | | |
| Valuation Inputs | | Investments In
Securities | | Other Financial
Instruments* |
Level 1 - Quoted Prices | | $ | 701,385,510 | | $ | 0 |
Level 2 - Other Significant Observable Inputs | | | 23,804,000 | | | 0 |
Level 3 - Significant Unobservable Inputs | | | 0 | | | 0 |
Total | | $ | 725,189,510 | | $ | 0 |
* Other financial instruments are derivative instruments not reflected in the Schedule of Investments, such as futures, forwards, swap contracts and written options, which are valued based on the unrealized appreciation/depreciation on the instrument.
MSF-7
Metropolitan Series Fund, Inc.
BlackRock Aggressive Growth Portfolio
Statement of Assets & Liabilities
December 31, 2008
| | | | | | | |
Assets | | | | | | | |
Investments at value (a) (b) | | | | | $ | 725,189,510 | |
Cash | | | | | | 335 | |
Receivable for: | | | | | | | |
Fund shares sold | | | | | | 194,427 | |
Accrued interest and dividends | | | | | | 146,188 | |
Foreign taxes | | | | | | 18 | |
| | | | | | | |
Total Assets | | | | | | 725,530,478 | |
Liabilities | | | | | | | |
Payable for: | | | | | | | |
Securities purchased | | $ | 312,747 | | | | |
Fund shares redeemed | | | 670,448 | | | | |
Withholding taxes | | | 1,490 | | | | |
Collateral for securities loaned | | | 105,303,762 | | | | |
Due to custodian bank | | | 2,898 | | | | |
Accrued expenses: | | | | | | | |
Management fees | | | 366,674 | | | | |
Service and distribution fees | | | 16,974 | | | | |
Other expenses | | | 40,261 | | | | |
| | | | | | | |
Total Liabilities | | | | | | 106,715,254 | |
| | | | | | | |
Net Assets | | | | | $ | 618,815,224 | |
| | | | | | | |
Net assets consists of: | | | | | | | |
Capital paid in | | | | | $ | 1,206,648,645 | |
Undistributed net investment income | | | | | | 1,045,714 | |
Accumulated net realized losses | | | | | | (301,011,684 | ) |
Unrealized depreciation on investments | | | | | | (287,867,451 | ) |
| | | | | | | |
Net Assets | | | | | $ | 618,815,224 | |
| | | | | | | |
| Computation of offering price: | | | | | | | |
Class A | | | | | | | |
Net asset value and redemption price per share ($457,840,230 divided by 29,193,478 shares outstanding) | | | | | $ | 15.68 | |
| | | | | | | |
Class B | | | | | | | |
Net asset value and redemption price per share ($32,045,568 divided by 2,150,663 shares outstanding) | | | | | $ | 14.90 | |
| | | | | | | |
Class D | | | | | | | |
Net asset value and redemption price per share ($117,943,945 divided by 7,587,364 shares outstanding) | | | | | $ | 15.54 | |
| | | | | | | |
Class E | | | | | | | |
Net asset value and redemption price per share ($10,985,481 divided by 707,494 shares outstanding) | | | | | $ | 15.53 | |
| | | | | | | |
(a) Identified cost of investments | | | | | $ | 1,013,056,961 | |
| | | | | | | |
(b) Includes cash collateral for securities loaned of | | | | | $ | 105,303,762 | |
| | | | | | | |
Statement of Operations
For the Year Ended December 31, 2008
| | | | | | | | |
Investment Income | | | | | | | | |
Dividends | | | | | | $ | 6,288,795 | (a) |
Interest | | | | | | | 2,745,777 | (b) |
| | | | | | | | |
| | | | | | | 9,034,572 | |
Expenses | | | | | | | | |
Management fees | | $ | 7,197,439 | | | | | |
Service and distribution fees—Class B | | | 108,738 | | | | | |
Service and distribution fees—Class D | | | 201,694 | | | | | |
Service and distribution fees—Class E | | | 24,194 | | | | | |
Directors’ fees and expenses | | | 31,905 | | | | | |
Custodian | | | 88,600 | | | | | |
Audit and tax services | | | 31,946 | | | | | |
Legal | | | 16,516 | | | | | |
Printing | | | 248,204 | | | | | |
Insurance | | | 19,936 | | | | | |
Miscellaneous | | | 19,686 | | | | | |
| | | | | | | | |
Total expenses | | | 7,988,858 | | | | | |
Expense reductions | | | (188,815 | ) | | | 7,800,043 | |
| | | | | | | | |
Net Investment Income | | | | | | | 1,234,529 | |
| | | | | | | | |
Realized and Unrealized Loss | | | | | | | | |
| Realized loss on: | | | | | | | | |
Investments—net | | | | | | | (13,997,593 | ) |
| Change in unrealized depreciation on: | | | | | | | | |
Investments—net | | | | | | | (530,783,936 | ) |
| | | | | | | | |
Net loss | | | | | | | (544,781,529 | ) |
| | | | | | | | |
Net Decrease in Net Assets From Operations | | | | | | $ | (543,547,000 | ) |
| | | | | | | | |
| (a) | Net of foreign taxes of $26,351. |
| (b) | Includes income on securities loaned of $2,120,507. |
See accompanying notes to financial statements.
MSF-8
Metropolitan Series Fund, Inc.
BlackRock Aggressive Growth Portfolio
Statements of Changes in Net Assets
| | | | | | | | |
| | | Year ended
December 31,
2008 | | | Year ended
December 31,
2007 | |
From Operations | | | | | | | | |
Net investment income (loss) | | $ | 1,234,529 | | | $ | (3,366,482 | ) |
Net realized gain (loss) | | | (13,997,593 | ) | | | 137,208,639 | |
Change in unrealized appreciation (depreciation) | | | (530,783,936 | ) | | | 94,696,186 | |
| | | | | | | | |
Increase (decrease) in net assets from operations | | | (543,547,000 | ) | | | 228,538,343 | |
| | | | | | | | |
Decrease in net assets from capital share transactions | | | (109,634,253 | ) | | | (145,603,986 | ) |
| | | | | | | | |
Net increase (decrease) in net assets | | | (653,181,253 | ) | | | 82,934,357 | |
| | |
Net Assets | | | | | | | | |
Beginning of the period | | | 1,271,996,477 | | | | 1,189,062,120 | |
| | | | | | | | |
End of the period | | $ | 618,815,224 | | | $ | 1,271,996,477 | |
| | | | | | | | |
Undistributed Net Investment Income | | | | | | | | |
End of the period | | $ | 1,045,714 | | | $ | 0 | |
| | | | | | | | |
Other Information:
Capital Shares
Transactions in capital shares were as follows:
| | | | | | | | | | | | | | |
| | | Year ended
December 31, 2008 | | | Year ended
December 31, 2007 | |
| | | Shares | | | $ | | | Shares | | | $ | |
Class A | | | | | | | | | | | | | | |
Sales | | 1,083,815 | | | $ | 23,861,568 | | | 2,125,807 | | | $ | 56,726,170 | |
Redemptions | | (4,349,912 | ) | | | (102,062,908 | ) | | (6,434,262 | ) | | | (170,180,611 | ) |
| | | | | | | | | | | | | | |
Net decrease | | (3,266,097 | ) | | $ | (78,201,340 | ) | | (4,308,455 | ) | | $ | (113,454,441 | ) |
| | | | | | | | | | | | | | |
Class B | | | | | | | | | | | | | | |
Sales | | 1,231,192 | | | $ | 26,842,935 | | | 1,107,249 | | | $ | 28,952,558 | |
Redemptions | | (724,956 | ) | | | (15,061,146 | ) | | (408,530 | ) | | | (10,419,375 | ) |
| | | | | | | | | | | | | | |
Net increase | | 506,236 | | | $ | 11,781,789 | | | 698,719 | | | $ | 18,533,183 | |
| | | | | | | | | | | | | | |
Class D | | | | | | | | | | | | | | |
Sales | | 772,219 | | | $ | 18,133,231 | | | 468,353 | | | $ | 12,656,593 | |
Redemptions | | (2,567,742 | ) | | | (61,103,088 | ) | | (2,438,024 | ) | | | (64,215,232 | ) |
| | | | | | | | | | | | | | |
Net decrease | | (1,795,523 | ) | | $ | (42,969,857 | ) | | (1,969,671 | ) | | $ | (51,558,639 | ) |
| | | | | | | | | | | | | | |
Class E | | | | | | | | | | | | | | |
Sales | | 256,311 | | | $ | 5,557,784 | | | 205,002 | | | $ | 5,675,736 | |
Redemptions | | (253,021 | ) | | | (5,802,629 | ) | | (186,065 | ) | | | (4,799,825 | ) |
| | | | | | | | | | | | | | |
Net increase (decrease) | | 3,290 | | | $ | (244,845 | ) | | 18,937 | | | $ | 875,911 | |
| | | | | | | | | | | | | | |
Decrease derived from capital share transactions | | | | | $ | (109,634,253 | ) | | | | | $ | (145,603,986 | ) |
| | | | | | | | | | | | | | |
See accompanying notes to financial statements.
MSF-9
Metropolitan Series Fund, Inc.
BlackRock Aggressive Growth Portfolio
Financial Highlights
| | | | | | | | | | | | | | | | | | | | |
| | | Class A | |
| | | Year ended December 31, | |
| | | 2008 | | | 2007 | | | 2006 | | | 2005 | | | 2004 | |
Net Asset Value, Beginning of Period | | $ | 28.89 | | | $ | 23.96 | | | $ | 22.45 | | | $ | 20.28 | | | $ | 17.95 | |
| | | | | | | | | | | | | | | | | | | | |
Income From Investment Operations | | | | | | | | | | | | | | | | | | | | |
Net investment income (loss) | | | 0.04 | (a) | | | (0.06 | )(a) | | | (0.07 | ) | | | (0.07 | ) | | | (0.07 | ) |
Net realized and unrealized gain (loss) of investments | | | (13.25 | ) | | | 4.99 | | | | 1.58 | | | | 2.24 | | | | 2.40 | |
| | | | | | | | | | | | | | | | | | | | |
Total from investment operations | | | (13.21 | ) | | | 4.93 | | | | 1.51 | | | | 2.17 | | | | 2.33 | |
| | | | | | | | | | | | | | | | | | | | |
Net Asset Value, End of Period | | $ | 15.68 | | | $ | 28.89 | | | $ | 23.96 | | | $ | 22.45 | | | $ | 20.28 | |
| | | | | | | | | | | | | | | | | | | | |
Total Return (%) | | | (45.7 | ) | | | 20.6 | | | | 6.7 | | | | 10.7 | | | | 13.0 | |
Ratio of operating expenses to average net assets before expense reductions (%) | | | 0.77 | | | | 0.76 | | | | 0.79 | | | | 0.79 | | | | 0.79 | |
Ratio of operating expenses to average net assets after expense reductions (%) (b) | | | 0.75 | | | | 0.74 | | | | 0.77 | | | | 0.77 | | | | 0.78 | |
Ratio of net investment income (loss) to average net assets (%) | | | 0.16 | | | | (0.24 | ) | | | (0.29 | ) | | | (0.33 | ) | | | (0.38 | ) |
Portfolio turnover rate (%) | | | 48 | | | | 49 | | | | 91 | | | | 71 | | | | 95 | |
Net assets, end of period (000) | | $ | 457,840 | | | $ | 937,655 | | | $ | 880,965 | | | $ | 938,550 | | | $ | 954,736 | |
| | | | | | | | | | | | | | | | | | | | |
| | | Class B | |
| | | Year ended December 31, | |
| | | 2008 | | | 2007 | | | 2006 | | | 2005 | | | 2004(c) | |
Net Asset Value, Beginning of Period | | $ | 27.51 | | | $ | 22.88 | | | $ | 21.49 | | | $ | 19.46 | | | $ | 18.12 | |
| | | | | | | | | | | | | | | | | | | | |
Income From Investment Operations | | | | | | | | | | | | | | | | | | | | |
Net investment loss | | | (0.02 | )(a) | | | (0.12 | )(a) | | | (0.09 | ) | | | (0.08 | ) | | | (0.03 | ) |
Net realized and unrealized gain (loss) of investments | | | (12.59 | ) | | | 4.75 | | | | 1.48 | | | | 2.11 | | | | 1.37 | |
| | | | | | | | | | | | | | | | | | | | |
Total from investment operations | | | (12.61 | ) | | | 4.63 | | | | 1.39 | | | | 2.03 | | | | 1.34 | |
| | | | | | | | | | | | | | | | | | | | |
Net Asset Value, End of Period | | $ | 14.90 | | | $ | 27.51 | | | $ | 22.88 | | | $ | 21.49 | | | $ | 19.46 | |
| | | | | | | | | | | | | | | | | | | | |
Total Return (%) | | | (45.8 | ) | | | 20.2 | | | | 6.5 | | | | 10.4 | | | | 7.4 | (d) |
Ratio of operating expenses to average net assets before expense reductions (%) | | | 1.02 | | | | 1.01 | | | | 1.04 | | | | 1.04 | | | | 1.04 | (e) |
Ratio of operating expenses to average net assets after expense reductions (%) (b) | | | 1.00 | | | | 0.99 | | | | 1.02 | | | | 1.01 | | | | 1.03 | (e) |
Ratio of net investment loss to average net assets (%) | | | (0.11 | ) | | | (0.48 | ) | | | (0.53 | ) | | | (0.56 | ) | | | (0.56 | )(e) |
Portfolio turnover rate (%) | | | 48 | | | | 49 | | | | 91 | | | | 71 | | | | 95 | |
Net assets, end of period (000) | | $ | 32,046 | | | $ | 45,243 | | | $ | 21,634 | | | $ | 11,761 | | | $ | 4,165 | |
| Please | see following page for Financial Highlights footnote legend. |
See accompanying notes to financial statements.
MSF-10
Metropolitan Series Fund, Inc.
BlackRock Aggressive Growth Portfolio
Financial Highlights
| | | | | | | | | | | | |
| | | Class D | |
| | | Year ended December 31, | |
| | | 2008 | | | 2007 | | | 2006(c) | |
Net Asset Value, Beginning of Period | | $ | 28.66 | | | $ | 23.80 | | | $ | 24.12 | |
| | | | | | | | | | | | |
Income From Investment Operations | | | | | | | | | | | | |
Net investment income (loss) | | | 0.01 | (a) | | | (0.09 | )(a) | | | (0.06 | ) |
Net realized and unrealized gain (loss) of investments | | | (13.13 | ) | | | 4.95 | | | | (0.26 | ) |
| | | | | | | | | | | | |
Total from investment operations | | | (13.12 | ) | | | 4.86 | | | | (0.32 | ) |
| | | | | | | | | | | | |
Net Asset Value, End of Period | | $ | 15.54 | | | $ | 28.66 | | | $ | 23.80 | |
| | | | | | | | | | | | |
Total Return (%) | | | (45.7 | ) | | | 20.4 | | | | (1.3 | )(d) |
Ratio of operating expenses to average net assets before expense reductions (%) | | | 0.87 | | | | 0.86 | | | | 0.89 | (e) |
Ratio of operating expenses to average net assets after expense reductions (%) (b) | | | 0.85 | | | | 0.84 | | | | 0.87 | (e) |
Ratio of net investment income (loss) to average net assets (%) | | | 0.06 | | | | (0.34 | ) | | | (0.36 | )(e) |
Portfolio turnover rate (%) | | | 48 | | | | 49 | | | | 91 | |
Net assets, end of period (000) | | $ | 117,944 | | | $ | 268,928 | | | $ | 270,158 | |
| | | | | | | | | | | | | | | | | | | | |
| | | Class E | |
| | | Year ended December 31, | |
| | | 2008 | | | 2007 | | | 2006 | | | 2005 | | | 2004 | |
Net Asset Value, Beginning of Period | | $ | 28.64 | | | $ | 23.79 | | | $ | 22.33 | | | $ | 20.20 | | | $ | 17.90 | |
| | | | | | | | | | | | | | | | | | | | |
Income from Investment Operations | | | | | | | | | | | | | | | | | | | | |
Net investment income (loss) | | | 0.00 | (a)(f) | | | (0.10 | )(a) | | | (0.12 | ) | | | (0.11 | ) | | | (0.09 | ) |
Net realized and unrealized gain (loss) of investments | | | (13.11 | ) | | | 4.95 | | | | 1.58 | | | | 2.24 | | | | 2.39 | |
| | | | | | | | | | | | | | | | | | | | |
Total from investment operations | | | (13.11 | ) | | | 4.85 | | | | 1.46 | | | | 2.13 | | | | 2.30 | |
| | | | | | | | | | | | | | | | | | | | |
Net Asset Value, End of Period | | $ | 15.53 | | | $ | 28.64 | | | $ | 23.79 | | | $ | 22.33 | | | $ | 20.20 | |
| | | | | | | | | | | | | | | | | | | | |
Total Return (%) | | | (45.8 | ) | | | 20.4 | | | | 6.5 | | | | 10.5 | | | | 12.8 | |
Ratio of operating expenses to average net assets before expense reductions (%) | | | 0.92 | | | | 0.91 | | | | 0.94 | | | | 0.94 | | | | 0.94 | |
Ratio of operating expenses to average net assets after expense reductions (%) (b) | | | 0.90 | | | | 0.89 | | | | 0.92 | | | | 0.92 | | | | 0.93 | |
Ratio of net investment income (loss) to average net assets (%) | | | 0.00 | (g) | | | (0.39 | ) | | | (0.44 | ) | | | (0.48 | ) | | | (0.52 | ) |
Portfolio turnover rate (%) | | | 48 | | | | 49 | | | | 91 | | | | 71 | | | | 95 | |
Net assets, end of period (000) | | $ | 10,985 | | | $ | 20,171 | | | $ | 16,305 | | | $ | 17,653 | | | $ | 17,893 | |
| (a) | Per share amount is based on average shares outstanding during the period. |
| (b) | The Portfolio has entered into arrangements with certain brokers who paid a portion of the Portfolio’s expenses. |
| (c) | Commencement of operations was April 26, 2004 and May 2, 2006 for Classes B and D, respectively. |
| (d) | Periods less than one year are not computed on an annualized basis. |
| (e) | Computed on an annualized basis. |
| (f) | Net investment income was less than $0.01 per share. |
| (g) | Ratio of net investment income to average net assets was less than 0.01%. |
See accompanying notes to financial statements.
MSF-11
Metropolitan Series Fund, Inc.
BlackRock Aggressive Growth Portfolio
Notes to Financial Statements—December 31, 2008
Metropolitan Series Fund, Inc. (the “Fund”) is organized as a corporation under the laws of Maryland pursuant to Articles of Incorporation filed on November 23, 1982, as amended, and registered under the Investment Company Act of 1940, as amended (the “1940 Act”), as an open-end investment company. The Fund is a “series” type of mutual fund, which issues separate series of stock. Each series represents an interest in a separate portfolio of Fund investments. The BlackRock Aggressive Growth Portfolio (the “Portfolio”) is a diversified series of the Fund. Shares in the Fund are not offered directly to the general public and are currently available only to separate accounts established by Metropolitan Life Insurance Company (“MetLife”), New England Life Insurance Company, General American Life Insurance Company (“General American”), The MetLife Investors Group of Insurance Companies, MetLife Insurance Company of Connecticut and other affiliated insurance companies (collectively, the “Insurance Companies”) and to certain eligible qualified retirement plans (“Qualified Plans”), as an investment vehicle for variable life insurance, group annuity or variable annuity products of these insurance companies or Qualified Plans, although the Portfolio is not available to all such separate accounts and Qualified Plans. The Portfolio’s shares may be divided into different classes. Currently, the classes being offered by the Portfolio are named Class A, Class B, Class D and Class E. The classes of the Portfolio’s shares are identical, except that certain additional charges (Rule 12b-1 fees) are made against Class B, Class D and Class E shares. Investment income, realized and unrealized capital gains and losses, the common expenses of the Portfolio and certain Portfolio-level expense reductions, if any, are allocated daily, on a pro rata basis, to each class based on the relative net assets of each class to the total net assets of the Portfolio.
| 2. | SIGNIFICANT ACCOUNTING POLICIES: |
The preparation of financial statements in conformity with accounting principles generally accepted in the United States of America (“GAAP”) requires management to make estimates and assumptions that affect the reported amounts of assets and liabilities and disclosure of contingent assets and liabilities as of the date of the financial statements and the reported amounts of income and expenses during the reporting period. Actual results could differ from those estimates.
The following is a summary of significant accounting policies consistently followed by the Portfolio in the preparation of its financial statements. The policies are in conformity with GAAP.
Investment Valuation:
Debt securities (other than short term obligations with a remaining maturity of sixty days or less) are generally valued on the basis of evaluated or composite bid quotations obtained by independent pricing services and/or brokers and dealers selected by the relevant subadviser pursuant to authorization of the Board of Directors of the Fund (the “Board” or “Directors”). Such quotations take into account appropriate factors such as institutional-sized trading in similar groups of securities, yield, quality, coupon rate, maturity, type of issue, trading characteristics and other data. Short term obligations with a remaining maturity of sixty days or less are valued at amortized cost which approximates fair market value.
Equity securities traded on a national securities exchange or other exchanges are valued at their last sale price on the principal trading market. Equity securities traded on the NASDAQ National Market System are valued at the NASDAQ Official Closing Price (the “NOCP”). The NOCP is the last reported sale price if the last reported sale price falls between the spread of the last reported bid and asked prices. If the last reported bid and asked prices are above the last reported sale price, the NOCP will be the last reported bid price. If the last reported bid and asked prices are below the last reported sale price, the NOCP will be the last reported asked price. Equity securities traded on a national securities exchange or other exchanges or on the NASDAQ National Market System for which there is no reported sale during the day are valued at the last reported bid price. A security that is listed or traded on more than one exchange is valued at the quotation on the exchange determined to be the primary market for that security by the Board or its delegates. If no closing price is available, then such securities are valued by using the last reported bid price. Equity securities traded over-the-counter are valued at the last reported sales price.
If no current market value quotation is readily available or reliable for a portfolio security, fair value will be determined in accordance with procedures established by and under the general supervision of the Board. When the Portfolio uses fair value pricing, it may take into account any factors it deems appropriate. The value of securities used by the Portfolio to calculate its net asset value may differ from quoted or published prices for the same securities. Fair value pricing involves subjective judgments and the fair value determined for a security may be materially different than the value that could be realized upon the sale of that security.
The Portfolio expects to use fair value pricing for securities primarily traded on U.S. exchanges only under very limited circumstances. For example, the Portfolio may use fair value pricing if the exchange on which a security is traded closes early or trading in the security is suspended.
MSF-12
Metropolitan Series Fund, Inc.
BlackRock Aggressive Growth Portfolio
Notes to Financial Statements—December 31, 2008—(Continued)
Securities traded primarily on an exchange outside of the United States which closes before the close of the New York Stock Exchange will be valued at the last sales price on that non-U.S. exchange. Securities traded primarily on an exchange outside of the United States for which there is no reported sale during the day are valued at the mean between the last reported bid and asked prices. However, because most foreign markets close well before the Portfolio values its securities (typically at 4 p.m. Eastern Time), the earlier close of these foreign markets gives rise to the possibility that significant events, including broad market moves, may have occurred after these foreign markets close but before the Portfolio values its securities. To account for this, the Portfolio may frequently value many of its foreign equity securities using fair value prices based on third party vendor modeling tools.
Forward foreign currency exchange contracts are valued based on the mean between closing bid and asked prices of the forward currency contract rates in the London foreign exchange markets on a daily basis as provided by a reliable bank or dealer.
Options, whether on securities, indices, futures contracts, or otherwise, are valued at the last sales price available as of the close of business on the day of valuation or, if there is no such sale price available, at the mean between the bid and asked prices. Options on currencies are valued at the spot price each day.
The value of futures contracts will be the sum of the margin deposit plus or minus the difference between the value of the futures contract on each day the net asset value is calculated and the value on the date the futures contract originated, value being that established on a recognized commodity exchange, or by reference to other customary sources, with gain or loss being realized when the futures contract closes or expires.
Subject to the Board’s oversight, the Board has delegated the day-to-day oversight of pricing matters, including determinations in good faith under the Fund’s procedures the fair value of securities for which current market quotations are not readily available to the subadviser of the Portfolio.
Investment Transactions and Related Investment Income:
Portfolio security transactions are recorded on the trade date. Dividend income is recorded on the ex-dividend date or, for certain foreign securities, when notified. Interest income, which includes amortization of premium and accretion of discount on debt securities, is recorded on the accrual basis. Realized gains and losses on investments and unrealized appreciation and depreciation are determined on the identified cost basis, which is the same basis used for federal income tax purposes.
Repurchase Agreements:
The Portfolio, through the custodian or a subcustodian, receives delivery of the underlying securities collateralizing repurchase agreements. The Portfolio requires the custodian to take possession, to have legally segregated in the Federal Reserve Book Entry System, or to have segregated within the custodian’s vault, all securities held as collateral for repurchase agreements. It is the Portfolio’s policy that the market value of the collateral be at least equal to 100% of the repurchase price in the case of a repurchase agreement of one-day duration and 102% on all other repurchase agreements. The Portfolio’s subadviser is responsible for determining that the value of the collateral is at all times at least equal to the repurchase price. In connection with transactions in repurchase agreements, if the seller defaults and the value of the collateral declines or if the seller enters an insolvency proceeding, realization of the collateral by the Portfolio may be delayed, limited or wholly denied.
Foreign Currency Translation:
The books and records of the Portfolio are maintained in U.S. dollars. The values of securities, currencies and other assets and liabilities denominated in currencies other than U.S. dollars are translated into U.S. dollars based upon foreign exchange rates prevailing at the end of the period. Purchases and sales of investment securities, income and expenses are translated on the respective dates of such transactions. Since the values of investment securities are presented at the foreign exchange rates prevailing at the end of the period, it is not practical to isolate that portion of the results of operations arising from changes in exchange rates from that portion of the results of operations reflecting fluctuations arising from changes in market prices of the investment securities. Such fluctuations are included in the net realized and unrealized gain or loss on investments.
Net realized foreign exchange gains or losses arise from sales of foreign currency, currency gains or losses realized between the trade and settlement dates on securities transactions, and the difference between the amounts of dividends, interest, and foreign withholding taxes recorded by the Portfolio and the U.S. dollar equivalent of the amounts actually received or paid by the Portfolio. Net unrealized foreign exchange gains and losses arise from changes in the value of assets and liabilities, other than investment securities, resulting from changes in the exchange rate.
MSF-13
Metropolitan Series Fund, Inc.
BlackRock Aggressive Growth Portfolio
Notes to Financial Statements—December 31, 2008—(Continued)
Forward Foreign Currency Exchange Contracts:
The Portfolio may enter into forward foreign currency exchange contracts primarily to hedge against foreign currency exchange rate risks on its non-U.S. dollar denominated investment securities. When entering into a forward currency contract, the Portfolio agrees to receive or deliver a fixed quantity of foreign currency for an agreed-upon price on an agreed future date. These contracts are valued daily and the Portfolio’s net equity therein, representing unrealized gain or loss on the contracts as measured by the difference between the foreign exchange rates at the dates of entry into the contracts and the forward rates at the settlement date, is included in the Statement of Assets and Liabilities. Realized and unrealized gains and losses are included in the Statement of Operations. These instruments involve market and/or credit risk in excess of the amount recognized in the Statement of Assets and Liabilities. Risks arise from the possible inability of counterparties to meet the terms of their contracts and from movement in currency and securities values and interest rates.
Futures Contracts:
The Portfolio may buy and sell futures contracts (on recognized exchanges) as a hedge, to maintain exposure to the broad equity markets or to enhance return. Futures contracts are agreements to buy or sell a security, or deliver a final cash settlement price in connection with an index, interest rate, currency, or other contracts not calling for physical delivery, for a set price in the future. The Portfolio must post an amount equal to a portion of the total market value of the futures contract as futures variation margin, which is returned when the Portfolio’s obligations under the contract have been satisfied. From time to time thereafter, the Portfolio may have to post variation margin to maintain this amount as the market value of the contract fluctuates. Risks of entering into futures contracts (and related options) include the possibility that there may be an illiquid market and that a change in the value of the contract or option may not correlate with changes in the value of the underlying securities.
Options:
The Portfolio may use options to hedge against changes in values of securities the Portfolio owns or expects to purchase, to maintain exposure to the broad equity markets or to enhance return. Writing puts or buying calls tends to increase the Portfolio’s exposure to the underlying instrument and writing calls or buying puts tends to decrease the Portfolio’s exposure to the underlying instrument, and can be used to hedge other Portfolio investments. For options purchased to hedge the Portfolio’s investments, the potential risk to the Portfolio is that the change in value of options contracts may not correspond to the change in value of the hedged instruments. In addition, losses may arise from changes in the value of the underlying instruments, if there is an illiquid secondary market, or if the counterparty is unable to perform. The maximum loss for purchased options is limited to the premium initially paid for the option. For options written by the Portfolio, the maximum loss is not limited to the premium initially received for the option.
The main risk associated with purchasing an option is that the option expires without being exercised. In this case, the option expires worthless and the premium paid for the option is considered the loss. The risk associated with writing a call option is that the Portfolio may forgo the opportunity for a profit if the market value of the underlying position increases and the option is exercised. The risk in writing a put option is that the Portfolio may incur a loss if the market value of the underlying position decreases and the option is exercised. In addition, the Portfolio risks not being able to enter into a closing transaction for the written option as the result of an illiquid market.
“When-Issued” Securities:
Purchasing securities “when-issued” is a forward commitment by the Portfolio to buy a security. The estimated amount of the Portfolio’s payment obligation and the security’s interest rate are determined when the commitment is made, even though no interest accrues until the security is issued, which is generally 15 to 120 days later. The Portfolio will segregate liquid assets with its custodian sufficient at all times to satisfy these commitments. If the value of the security is less when delivered than when the commitment was made, the Portfolio will suffer a loss.
Federal Income Taxes:
It is the Portfolio’s policy to comply with the requirements of the Internal Revenue Code of 1986, as amended (the “Code”), and regulations thereunder, applicable to regulated investment companies and to distribute, with respect to each taxable year, all of its taxable income to shareholders. Therefore, no federal income tax provision is required. The Portfolio is subject to the provisions of the Financial Accounting Standards Board Interpretation (“FASB”) No. 48, Accounting for Uncertainties in Income
MSF-14
Metropolitan Series Fund, Inc.
BlackRock Aggressive Growth Portfolio
Notes to Financial Statements—December 31, 2008—(Continued)
Taxes (FIN 48). FIN 48 sets forth a minimum threshold for financial statement recognition of the benefit of a tax position taken or expected to be taken in a tax return. The implementation of FIN 48 did not result in any unrecognized tax benefits in the accompanying financial statements. Each of the Portfolio’s federal tax returns for the prior three fiscal years remains subject to examination by the Internal Revenue Service.
As of December 31, 2008, the Portfolio had capital loss carryforwards as follows:
| | | | | | | |
Expiring
12/31/09 | | Expiring
12/31/10 | | Total |
| $ | 227,327,608 | | $ | 20,631,133 | | $ | 247,958,741 |
The utilization of the capital loss carryforward acquired as part of a merger may be limited under section 382 of the Code.
As of December 31, 2008, the components of distributable earnings (accumulated losses) on a federal income tax basis were as follows:
| | | | | | | | | | | | | | | | |
Undistributed
Ordinary
Income | | Undistributed
Long Term
Gain | | Unrealized
Depreciation | | | Loss
Carryforwards | | | Total | |
| $ | 1,045,714 | | $ | — | | $ | (297,246,409 | ) | | $ | (247,958,741 | ) | | $ | (544,159,436 | ) |
Pursuant to Federal income tax regulations applicable to investment companies, the Portfolio has elected to treat net capital losses realized between November 1 and December 31 of each year as occurring on the first day of the following tax year. For the year ended December 31, 2008, the following amounts of realized capital and currency losses reflected in the accompanying financial statements will not be recognized for Federal income tax purposes until January 1, 2009:
| | | | |
Currency | | Capital | |
$— | | $ | (43,673,987 | ) |
Dividends and Distributions to Shareholders:
The Portfolio records dividends and distributions on the ex-dividend date. Net realized gains from security transactions (if any) are generally distributed annually to shareholders. The timing and characterization of certain income and capital gains distributions are determined in accordance with federal tax regulations that may differ from GAAP. Permanent book and tax basis differences relating to shareholder distributions will result in reclassification between under/over distributed net investment income, accumulated net realized gains/losses and paid in capital.
Expense Reductions:
Certain Portfolio trades are directed to brokers who paid a portion of the Portfolio’s expenses. Amounts paid for the Portfolio are shown as expense reductions in the Statement of Operations.
| 3. | INVESTMENT TRANSACTIONS: |
For the year ended December 31, 2008, purchases and sales of securities (excluding short term investments) for the Portfolio were as follows:
| | | | | | | | | | |
| Purchases | | Sales |
| U.S. Government | | Other | | U.S. Government | | Other |
| $ | 0 | | $ | 469,175,067 | | $ | 0 | | $ | 571,997,195 |
MSF-15
Metropolitan Series Fund, Inc.
BlackRock Aggressive Growth Portfolio
Notes to Financial Statements—December 31, 2008—(Continued)
| 4. | INVESTMENT MANAGEMENT FEES AND OTHER TRANSACTIONS WITH AFFILIATES: |
Investment Management Agreement:
MetLife Advisers, LLC (“MetLife Advisers”) is the investment adviser to the Portfolio. The Fund has entered into an investment management agreement with MetLife Advisers with respect to the Portfolio. For providing investment management services to the Portfolio, MetLife Advisers receives monthly compensation at the following annual rates:
| | | | |
Management
Fees earned by
MetLife Advisers
for the year ended
December 31, 2008 | | Annual
percentage
rates paid to
MetLife Advisers | | Based on Portfolios
average daily net asset
levels |
| $7,197,439 | | 0.750% | | Of the first $500 million |
| | 0.700% | | Of the next $500 million |
| | 0.650% | | On amounts in excess of $1 billion |
Certain officers and directors of the Fund may also be officers of MetLife Advisers; however, such officers and directors receive no compensation from the Fund.
MetLife Advisers has entered into an investment subadvisory agreement with respect to the Portfolio. BlackRock Advisors, LLC is compensated by MetLife Advisers to provide subadvisory services for the Portfolio.
Service and Distribution Fees:
The Fund has adopted a Distribution and Service Plan under Rule 12b-1 of the 1940 Act for the Portfolio’s Class B, D and E shares. Under the Distribution and Service Plan, the Class B, D and E shares of the Portfolio pay a fee to compensate the Insurance Companies (or their affiliates) and other broker-dealers and financial intermediaries involved in the offer and sale of Portfolio shares for promoting or selling and servicing the Class B, D and E shares. The fees under the Distribution and Service Plan for each applicable class of the Portfolio’s shares are calculated as a percentage of the Portfolio’s average daily net assets that are attributable to that Class. Currently, the fee is 0.25% per year for Class B shares, 0.10% per year for Class D shares and 0.15% per year for Class E shares. Amounts paid by the Portfolio for the year ended December 31, 2008 are shown as Service and Distribution fees in the Statement of Operations.
The Fund has entered into a securities lending arrangement with the Fund’s custodian, State Street Bank and Trust Company (the “custodian”). Under the agreement, the custodian is authorized to loan securities on the Portfolios’ behalf. In exchange, the Portfolio receives either cash or securities as collateral against the loaned securities. The Portfolio receives collateral at least equal to 102% of the market value of the loaned securities (105% for foreign securities), at each loan’s inception. Collateral must be maintained at least at 100% of the market value of the loaned securities for the duration of the loan. The cash collateral is invested in the Navigator Securities Lending Prime Portfolio, an affiliate of the custodian, which invests in a variety of high quality U.S. dollar-denominated instruments. If the market value of the collateral at the close of trading on a business day is less than 100% of the market value of the loaned securities at the close of trading on that day, the borrower shall be required to deliver, by the close of business on the following business day, an additional amount of collateral, equal to at least 100% of the market value of all the loaned securities as of such preceding day. The Portfolio receives 80% of the annual net income from securities lending transactions, which is included in interest income of the Portfolio. The remaining 20% is paid to the custodian as compensation for its securities lending services. Interest income received by the Portfolio via lending transactions during the year ended December 31, 2008 is footnoted in the Statement of Operations. The Portfolio bears the risk of any deficiency in the amount of collateral available for return to a borrower due to a loss in an approved investment purchased with such collateral. Any outstanding loans by the Portfolio at December 31, 2008 are footnoted in the Schedule of Investments.
| 6. | MARKET AND CREDIT RISK: |
In the normal course of business, the Portfolio invests in securities and enters into transactions where risks exist due to fluctuations in the market (market risk) or failure of the other party to a transaction to perform (credit risk). The value of securities held by the Portfolio may decline in response to certain events, including those directly involving the companies whose securities are owned by the Portfolio; conditions affecting the general economy; overall market changes; local, regional or global
MSF-16
Metropolitan Series Fund, Inc.
BlackRock Aggressive Growth Portfolio
Notes to Financial Statements—December 31, 2008—(Continued)
political, social or economic instability; and currency and interest rate and price fluctuations. Similar to credit risk, the Portfolio may be exposed to counterparty risk, or the risk that an entity with which the Portfolio has unsettled or open transactions may default. Financial assets, which potentially expose the Portfolio to credit and counterparty risks, consist principally of investments and cash due from counterparties. The extent of the Portfolio’s exposure to credit and counterparty risks in respect to these financial assets approximates their value as recorded in the Portfolio’s Statements of Assets and Liabilities.
| 7. | RECENT ACCOUNTING PRONOUNCEMENTS: |
In March 2008, the FASB issued Statement of Financial Accounting Standards No. 161, Disclosures about Derivative Instruments and Hedging Activities (“FAS 161”), an amendment of FASB Statement No. 133. FAS 161 requires enhanced disclosures about (a) how and why an entity uses derivative instruments, (b) how derivative instruments and hedging activities are accounted for, and (c) how derivative instruments and related hedging activities affect a fund’s financial position, financial performance, and cash flows. Management does not believe the adoption of FAS 161 will materially impact the financial statement amounts, but will require additional disclosures. This will include qualitative and quantitative disclosures on derivative positions existing at period end and the effect of using derivatives during the reporting period. FAS 161 is effective for financial statements issued for fiscal years and interim periods beginning after November 15, 2008. Management is currently evaluating the impact the adoption of FAS 161 will have on the Portfolio’s financial statement disclosures.
MSF-17
Metropolitan Series Fund, Inc.
BlackRock Aggressive Growth Portfolio
Report of Independent Registered Public Accounting Firm
To the Shareholders and Board of Directors of Metropolitan Series Fund, Inc.:
We have audited the accompanying statement of assets and liabilities, including the schedule of investments, of the BlackRock Aggressive Growth Portfolio (one of the portfolios constituting the Metropolitan Series Fund, Inc.) (the “Fund”) as of December 31, 2008, and the related statement of operations for the year then ended, the statements of changes in net assets for each of the two years in the period then ended, and the financial highlights for each of the five years in the period then ended. These financial statements and financial highlights are the responsibility of the Fund’s management. Our responsibility is to express an opinion on these financial statements and financial highlights based on our audits.
We conducted our audits in accordance with the standards of the Public Company Accounting Oversight Board (United States). Those standards require that we plan and perform the audit to obtain reasonable assurance about whether the financial statements and financial highlights are free of material misstatement. The Fund is not required to have, nor were we engaged to perform, an audit of its internal control over financial reporting. Our audits included consideration of internal control over financial reporting as a basis for designing audit procedures that are appropriate in the circumstances, but not for the purpose of expressing an opinion on the effectiveness of the Fund’s internal control over financial reporting. Accordingly, we express no such opinion. An audit also includes examining, on a test basis, evidence supporting the amounts and disclosures in the financial statements, assessing the accounting principles used and significant estimates made by management, as well as evaluating the overall financial statement presentation. Our procedures included confirmation of securities owned as of December 31, 2008, by correspondence with the custodian and brokers; where replies were not received from brokers, we performed other auditing procedures. We believe that our audits provide a reasonable basis for our opinion.
In our opinion, the financial statements and financial highlights referred to above present fairly, in all material respects, the financial position of the BlackRock Aggressive Growth Portfolio of the Metropolitan Series Fund, Inc. as of December 31, 2008, the results of its operations for the year then ended, the changes in its net assets for each of the two years in the period then ended, and the financial highlights for each of the five years in the period then ended, in conformity with accounting principles generally accepted in the United States of America.
Deloitte & Touche LLP
Boston, Massachusetts
February 24, 2009
MSF-18
Metropolitan Series Fund, Inc.
Directors and Officers
The Fund’s Directors review actions of the Fund’s investment adviser and subadvisers, and decide upon matters of general policy. The Fund’s officers supervise the daily business operations of the Fund. The Board of Directors and the Fund’s officers are listed below. Each Director is responsible for overseeing all 38 Portfolios of the Fund. There is no limit to the term a Director may serve. Directors serve until their resignation, retirement or removal in accordance with the Fund’s organizational documents and policies adopted by the Board from time to time. Officers hold office at the pleasure of the Board or until the election or appointment and the qualification of a successor. The address of the Directors and officers is c/o Metropolitan Series Fund, Inc., 501 Boylston Street, Boston, MA 02116.
Interested Directors(1)
Each Director below is an “interested person” (as defined by the 1940 Act) with respect to the Fund in that Ms. Forget is an employee of MetLife and Mr. Typermass is a former employee of MetLife and owns securities issued by MetLife, Inc., the ultimate parent company of MetLife Advisers.
| | | | | | | | |
Name, Address and Age | | Current
position(s)
with Fund | | Position(s)
held since | | Principal occupations
over past five years, including other directorships(2) | | Number of
Portfolios in
Fund Complex
Overseen by
Director(3) |
Elizabeth M. Forget Age: 42 | | Director, Chairman of the Board, President and Chief Executive Officer | | 2006 | | Senior Vice President (since 2007), MetLife, Inc.; President, Met Investors Advisory, LLC; Trustee and President, Met Investors Series Trust; Executive Vice President, MetLife Investors Group, Inc.; President, Chief Executive Officer and Chair of the Board of Managers (since 2006), MetLife Advisers; President, Met Investors Advisory, LLC. | | 87 |
| | | | |
Arthur G. Typermass Age: 71 | | Director | | 1998 | | Formerly, Senior Vice President and Treasurer, MetLife. | | 38 |
Non-Interested Directors(1)
Each Director below is not an “interested person” (as defined by the 1940 Act) with respect to the Fund (collectively, the “Independent Directors”).
| | | | | | | | |
Name, Address and Age | | Current
position(s)
with Fund | | Position(s)
held since | | Principal occupations
over past five years, including other directorships(2) | | Number of
Portfolios in
Fund Complex
Overseen by
Director(3) |
Steve A. Garban† Age: 71 | | Director | | 1985 | | Formerly, Chief Financial Officer, Senior Vice President Finance and Operations and Treasurer (Emeritus), The Pennsylvania State University. | | 38 |
| | | | |
Linda B. Strumpf Age: 61 | | Director | | 2000 | | Vice President and Chief Investment Officer, Ford Foundation. | | 38 |
| | | | |
Michael S. Scott Morton† Age: 71 | | Director | | 1993 | | Jay W. Forrester Professor of Management (Emeritus) at Sloan School of Management, MIT. | | 38 |
| | | | |
H. Jesse Arnelle Age: 75 | | Director | | 2001 | | Formerly, Counsel, Womble Carlyle Sandrie & Rice; Director, Textron Inc. (global multi- industry company)*; formerly, Director, Gannet Co. Inc. (diversified news and information company)*; formerly, Director, Eastman Chemical Company (global chemical company)*; formerly, Director, Waste Management, Inc.*; formerly, Director, Armstrong Holdings Inc. (parent company of floor and ceiling products business)*; formerly, Director, FPL Group Inc. (public utility holding company)*; Director, URS Corporation (engineering design services firm)*. | | 38 |
MSF-19
Metropolitan Series Fund, Inc.
Directors and Officers—(Continued)
| | | | | | | | |
Name, Address and Age | | Current
position(s)
with Fund | | Position(s)
held since | | Principal occupations
over past five years, including other directorships(2) | | Number of
Portfolios in
Fund Complex
Overseen by
Director(3) |
Nancy Hawthorne Age: 57 | | Director | | 2003 | | Chief Executive Officer, Clerestory LLC (corporate financial advisor); Director, Avid Technologies (computer software company)*; formerly, Chairman of the Board of Avid Technologies; formerly, Board of Advisors, L. Knife & Sons, Inc. (beverage distributor); formerly, Trustee, New England Zenith Fund (“Zenith Fund”)**; formerly, Chief Executive Officer and Managing Partner, Hawthorne, Krauss and Associates (corporate financial advisor); formerly, Chief Financial Officer and Executive Vice President, Continental Cablevision, subsequently renamed MediaOne (cable television company); formerly, Director, Life F/X, Inc.; formerly, Chairman of the Board, WorldClinic (distance medicine company); formerly, Director, Perini Corporation (construction company)*; formerly, Director, CGU (property and casualty insurance company); formerly, Director, Beacon Power Corporation (energy company)*. | | 38 |
| | | | |
John T. Ludes Age: 72 | | Director | | 2003 | | President, LFP Properties (consulting firm); Formerly, Trustee, Zenith Fund**; formerly, Vice Chairman, President and Chief Operating Officer, Fortune Brands/American Brands (global conglomerate); formerly, President and CEO, Acushnet Company (athletic equipment company). | | 38 |
Officers(1)
| | | | | | | | |
Name and address | | Age | | Current
position(s)
with Fund | | Position(s)
held since | | Principal occupations over past five years(2) |
| Jeffrey L. Bernier | | 37 | | Senior Vice President | | 2008 | | Vice President (since 2008), MetLife, Inc.; Vice President (since 2008), MetLife; Senior Vice President (since 2008), MetLife Advisers; formerly, Director and Senior Investment Analyst (2004 to 2007), John Hancock Financial Services; formerly, Assistant Vice President (2000 to 2001), Wachovia Securities. |
| | | | |
| Alan C. Leland | | 56 | | Senior Vice President | | 2005 | | Treasurer and Chief Financial Officer, MetLife Advisers, LLC; Treasurer (since 2005), Met Investors Advisory, LLC; Vice President (since 2004), Met Investors Advisory, LLC; Vice President (since 2003), MetLife, Inc.; Vice President, MetLife; Senior Vice President, NELICO. |
| | | | |
| Peter Duffy | | 53 | | Vice President
and Treasurer | | 2000 | | Senior Vice President, MetLife Advisers; Second Vice President (since 2003), NELICO; Vice President, MetLife (since 2004); Vice President (since 2004), MetLife, Inc.; formerly, Vice President and Treasurer, Zenith Fund**. |
| | | | |
| Jeffrey P. Halperin | | 41 | | Chief
Compliance Officer | | 2007 | | Vice President (since 2006), MetLife, Inc.; Vice President (since 2006), MetLife; Chief Compliance Officer (since 2006), Met Investors Series Trust, MetLife Advisers, Met Investors Advisory, LLC and MetLife Investment Advisors Company, LLC. |
| * | Indicates a directorship with a registered investment company or a company subject to the reporting requirements of the Securities Exchange Act of 1934, as amended. |
| ** | The Zenith Fund deregistered with the Securities and Exchange Commission (“SEC”) in 2004. |
| (†) | Served as a trustee, director and/or officer of one or more of the following companies, each of which had a direct or indirect advisory relationship with MetLife Advisers or its affiliates prior to January 31, 2005: State Street Research Financial Trust, State Street Research Income Trust, State Street Research Money Market Trust, State Street Research Institutional Funds, State Street Research Capital Trust, State Street Research Master Investment Trust, State Street Research Equity Trust, State Street Research Securities Trust and State Street Research Exchange Trust (collectively, the “State Street Research Funds”). |
| (1) | During the period shown, each Director of the Fund served as a Trustee of Metropolitan Series Fund II, a registered investment company that ceased investment operations in June of 2008 and has applied for deregistration under the Investment Company Act of 1940. During this period, each officer of the Fund served in the same position with Metropolitan Series Fund II. |
| (2) | Previous positions during the past five years with the Fund; Met Investors Series Trust; MetLife; MetLife, Inc.; MetLife Advisers; Met Investors Advisory, LLC; Zenith Fund; NELICO; or New England Securities Corporation are omitted if not materially different. |
| (3) | The Fund Complex includes the Fund (38 portfolios) and Met Investors Series Trust (49 portfolios). |
MSF-20
Metropolitan Series Fund, Inc.
BlackRock Aggressive Growth Portfolio
Board Approval of Advisory and Subadvisory Agreements
The Fund’s Contract Review Committees of the Board of Directors (the “Board” or the “Directors”) typically meet in early fall to review the Portfolios’ advisory agreements (the “Advisory Agreements”) and subadvisory agreements (the “Subadvisory Agreements,” and, together with the Advisory Agreements, the “Agreements”) and determine whether to recommend that the full Board approve the continuation of the Agreements for an additional one-year period. (Following the initial approval of an Agreement for a new Portfolio or with a new adviser or subadviser, such annual reviews are not required until 2 years following the execution of such Agreement.) After each Committee has made its recommendations, the full Board, including the Independent Directors, determines whether to approve the continuation of each of the Agreements. In addition, the Board, including the Independent Directors, considers matters bearing on the Agreements at most of its other meetings throughout the year and regularly interviews various individuals at MetLife Advisers responsible for the management of the Portfolios. The Directors also interview selected investment managers and other professionals at the subadvisers at various times throughout the year.
The Directors receive all materials that they or MetLife Advisers, the Fund’s investment adviser, and the subadvisers believe to be reasonably necessary for the Directors to evaluate the Agreements and determine whether to approve the continuation of the Agreements. These materials generally include, among other items, (i) information on the investment performance of the Portfolios and the performance of peer groups of funds and the Portfolios’ performance benchmarks, (ii) information on the Portfolios’ advisory and subadvisory fees and other expenses, including information comparing the Portfolios’ expenses to those of peer groups of funds and information about any applicable expense caps and fee “breakpoints,” (iii) sales and redemption data, (iv) information related to the profitability of the Agreements to MetLife Advisers and certain of the subadvisers, and potential “fall-out” or ancillary benefits that MetLife Advisers, the subadvisers or their affiliates may receive as a result of their relationships with the Fund and (v) information obtained through the subadvisers’ responses to certain requests from MetLife Advisers and the Directors and MetLife Advisers’ responses to requests from the Directors. The Directors may also consider other information such as (vi) MetLife Advisers’ and the subadvisers’ financial results and condition, (vii) each Portfolio’s investment objectives and strategies and the size, education and experience of the investment staffs of MetLife Advisers and the relevant subadvisers and their use of technology and external research, (viii) the allocation of the Portfolios’ brokerage, if any, including allocations to brokers affiliated with the subadvisers and the use of “soft” commission dollars to pay Portfolio expenses and to pay for research and other similar services, (ix) the resources devoted to, and the record of compliance with, the Portfolios’ investment policies and restrictions, policies on personal securities transactions and other compliance policies, (x) the responses of MetLife Advisers, the subadvisers and/or their affiliates to certain legal and regulatory proceedings and (xi) the economic outlook generally and for the mutual fund industry in particular. Throughout the process, the Directors have the opportunity to ask questions of and request additional materials from MetLife Advisers and the subadvisers.
Following meetings of each Contract Review Committee on September 10, 2008, the Board, including the Independent Directors, at its November 6-7, 2008 meeting, approved the continuation through December 31, 2009 of the Advisory Agreements for each Portfolio of the Fund and the Subadvisory Agreements for each Portfolio other than the Zenith Equity Portfolio and Asset Allocation Portfolios (which do not have subadvisers) and the Van Eck Global Natural Resources Portfolio, Met/Dimensional International Small Cap Portfolio and Loomis Sayles Small Cap Growth Portfolio (formerly known as the Franklin Templeton Small Cap Growth Portfolio). The Agreements approved for continuation are referred to below as the “Continued Agreements.”
In considering whether to approve the continuation of the Continued Agreements, the Directors, including the Independent Directors, did not identify any single factor as determinative, and each weighed the various factors as he or she deemed appropriate. The Directors considered the following matters in connection with their approval of the Continued Agreements:
The nature, extent and quality of the services provided to the relevant Portfolios under the Continued Agreements. The Directors considered the nature, extent and quality of the services provided by MetLife Advisers, the relevant subadvisers (if any) and their affiliates (each, an “Adviser,” and, collectively, the “Advisers”) to the relevant Portfolios pursuant to the Continued Agreements and the resources dedicated to these Portfolios by the Advisers. In particular, the Directors considered the Advisers’ abilities to attract and retain highly qualified investment professionals. With respect to MetLife Advisers, the Directors considered (for each Portfolio other than the Zenith Equity and Asset Allocation Portfolios) that MetLife Advisers is (i) ultimately responsible for the performance of such Portfolios; (ii) ultimately responsible for the establishment of the investment strategies of each such Portfolio, primarily through its recommendations to the Board regarding the hiring and selection of subadvisers; (iii) responsible for the hiring and selection, subject to Board approval, of subadvisers; and (iv) responsible for maintaining a program of Subadviser oversight reasonably designed to ensure that the subadvisers have reasonable compliance policies and procedures in place. The Directors also considered that MetLife Advisers provides a full range of day-to-day administrative services for the Portfolios involving all aspects of such Portfolios’ day-to-day operations (other than portfolio management). With respect to the Zenith Equity and Asset Allocation Portfolios, the Directors considered both the portfolio management services and the administrative services provided by MetLife Advisers. After reviewing
MSF-21
Metropolitan Series Fund, Inc.
BlackRock Aggressive Growth Portfolio
Board Approval of Advisory and Subadvisory Agreements—(Continued)
these and related factors, the Directors concluded, within the context of their overall conclusions regarding each of the Continued Agreements, that the nature, extent and quality of services provided supported the renewal of these Agreements.
Investment performance of the relevant Portfolios. The Directors reviewed information about the performance of the relevant Portfolios over various time periods, including information prepared by an independent third party that compared the performance of the Portfolios to the performance of peer groups of funds and performance benchmarks. The Directors also reviewed a description of the third party’s methodology for identifying a Portfolio’s peer group(s) for purposes of performance and expense comparisons.
In the case of each relevant Portfolio that had performance that lagged its peer group(s) for certain periods, the Directors concluded that other factors relevant to performance were sufficient, in light of other considerations, to warrant renewal of the Continued Agreements relating to such Portfolio. These factors varied from Portfolio to Portfolio, but included one or more of the following: (i) that such Portfolio’s performance, although lagging in certain recent periods, was stronger over the longer term; (ii) that the underperformance was attributable, to a significant extent, to investment decisions that were reasonable and consistent with the Portfolio’s investment objective(s) and policies and that the Portfolio was performing within the range of reasonable expectations, given market conditions and the Portfolio’s investment objective(s) and policies; (iii) that the Portfolio’s performance was competitive when compared to other relevant performance benchmarks or peer groups; and (iv) that MetLife Advisers and/or the relevant subadviser (if any) had taken or was taking steps designed to help improve the Portfolio’s investment performance (including, in the case of certain Portfolios, that MetLife Advisers was formulating possible proposals, for presentation to the Board in November 2008, to replace the Portfolio’s subadviser or to merge the Portfolio into another Portfolio with a similar investment objective and better investment performance).
The Directors also considered the investment performance of the Advisers and their reputations generally, the historical responsiveness of the Advisers to Director concerns about performance and the willingness of the Advisers to take steps intended to improve performance.
After reviewing these and related factors, the Directors concluded, within the context of their overall conclusions regarding each of the Continued Agreements, that the investment performance of each relevant Portfolio and Adviser was sufficient, in light of other considerations, to warrant the renewal of the Continued Agreements.
The costs of the services to be provided and profits to be realized by the Advisers and their affiliates from their relationships with the Portfolios. The Directors considered the fees charged by MetLife Advisers to the Portfolios for advisory services and, with respect to the subadvised Portfolios, by such subadvisers to MetLife Advisers for subadvisory services (such advisory and subadvisory fees (if any), collectively, “Fees”), as well as the total expense levels of the Portfolios. This information included comparisons (provided by an independent third party) of the Portfolios’ advisory fees and total expense levels to those of their peer groups. In evaluating Fees for the relevant Portfolios, the Directors also took into account the demands, complexity and quality of the investment management services provided to each Portfolio. The Directors considered MetLife Advisers’ recommendations regarding reductions in Fee rates, implementation of Fee breakpoints and institution of Fee waivers and expense caps.
The Directors also considered the compensation directly or indirectly received by the Advisers and their affiliates from their relationships with the relevant Portfolios. The Directors reviewed information relating to the profits received by MetLife Advisers, certain of the subadvisers and their affiliates as a result of their relationships with the relevant Portfolios, and information about the allocation of expenses used to calculate profitability. When reviewing profitability, the Directors also considered the performance of the relevant Portfolios, the expense levels of such Portfolios and whether the relevant Advisers had implemented breakpoints, fee waivers and/or expense caps with respect to such Portfolios.
After reviewing these and related factors, the Directors concluded, within the context of their overall conclusions regarding each of the Continued Agreements, that the Fees charged to each of the relevant Portfolios were fair and reasonable, and that the information provided regarding costs of these services generally, and the related profitability (if known) to the relevant Advisers of their relationships with the relevant Portfolios, supported the renewal of the Continued Agreements.
Economies of Scale. The Directors considered the existence of any economies of scale in the provision of services by the Advisers and whether those economies were shared with the relevant Portfolios through breakpoints in their advisory fees or other means, such as expense caps, fee waivers or relatively low levels of fees. The Directors noted that most of the relevant Portfolios benefited or will benefit from breakpoints, expense caps and/or fee waivers with respect to their advisory fees. In considering these issues, the Directors also took into consideration information relating to the costs of the services provided and the profitability to MetLife Advisers, the relevant subadvisers (if any) and each of their affiliates of their relationships with the relevant Portfolios, as discussed above.
MSF-22
Metropolitan Series Fund, Inc.
BlackRock Aggressive Growth Portfolio
Board Approval of Advisory and Subadvisory Agreements—(Continued)
After reviewing these and related factors, the Directors concluded, within the context of their overall conclusions regarding each of the Continued Agreements, that the extent to which economies of scale were shared with the relevant Portfolios supported the renewal of such Agreements.
Other Factors. The Directors also considered other factors, which included but were not limited to the following:
| | • | | the extent to which each relevant Portfolio operated in accordance with its investment objective, and its record of compliance with its investment restrictions and the compliance programs of the Fund and the Advisers. They also considered the compliance-related resources the Advisers and their affiliates provide to the relevant Portfolios; |
| | • | | the nature, quality, cost and extent of administrative and shareholder services performed by MetLife Advisers and its affiliates under the Advisory Agreements; and |
| | • | | so-called “fall-out benefits” to the Advisers, such as the engagement of their affiliates to provide distribution, brokerage and transfer agency services to the Portfolios, and the benefits of research made available to the relevant Advisers by reason of brokerage commissions generated by the relevant Portfolios’ securities transactions. The Directors also considered the possible conflicts of interest associated with these fall-out and other benefits, and the reporting and other processes in place to disclose and monitor these possible conflicts of interest. |
Based on their evaluation of all factors that they deemed to be material, including those factors described above, and assisted by the advice of independent counsel, the Directors, including the Independent Directors, concluded that each of the Continued Agreements should be continued through December 31, 2009.
MSF-23
A description of the policies and procedures that the Fund uses to determine how to vote proxies relating to portfolio securities is available (i) without charge, upon request, by calling (800) 638-7732 and (ii) on the Securities and Exchange Commission’s (the “SEC”) website at http://www.sec.gov.
Information regarding how the Fund voted proxies relating to portfolio securities during the most recent twelve-month period ended December 31, 2008 is available (i) without charge, upon request, by calling (800) 638-7732 and (ii) on the SEC’s website at http://www.sec.gov.
The Fund’s Statement of Additional Information includes additional information about the Directors of the Fund and is available (i) without charge, upon request, by calling (800) 638-7732 and (ii) on the SEC’s website at http://www.sec.gov.
The Fund files with the SEC a complete schedule of its portfolio holdings, as of the close of the first and third quarters of its fiscal year, on “Form N-Q”. These filings are available on the SEC’s website at www.sec.gov and may be reviewed and copied at the SEC’s Public Reference Room in Washington, DC. (Call 1-800-SEC-0330 for information on the operation of the Public Reference Room.)
MSF-24
Simplify your life…
with MetLife eDelivery® while helping MetLife preserve the planet’s natural resources.
(see details on inside cover)
| | |
Metropolitan Series Fund, Inc. BlackRock Bond Income Portfolio Annual Report | | December 31, 2008 |
NOT PART OF THE ANNUAL REPORT
Letter from the President
February 1, 2009
Letter to Policy Holders:
2008 was an extraordinary year in the capital markets around the world and for the global economy. Energy prices rose to record levels early in the year before falling by two-thirds by year-end. A credit crisis that began with concerns about sub-prime mortgages led to massive changes in the financial landscape with government takeovers, forced sales, and outright failures of a number of large, once venerable firms.
While bonds as measured by the Barclays Capital U.S. Aggregate Bond Index (formerly known as, Lehman Brothers U.S. Aggregate Bond Index) were up 5.2% for the year in response to declining interest rates, there were large differences in the total returns of the various sectors of the bond market. U.S. treasury securities were up over 13% as frightened investors sought refuge in what they perceived to be the safest and most liquid investments. In contrast, investment grade corporate securities lost nearly 5% as credit spreads widened and below investment grade or high yield bonds fell over 26%.
In response to the growing credit crisis and the weakening economy, common stocks fell sharply across all regions, styles, and capitalizations. As measured by the Standard and Poor’s 500, U.S. common stocks fell 37% for the year, the worst calendar year decline since the 1930s. Foreign stocks were down even more with the MSCI EAFE Index down 43% for the year.
On the following pages, you will find a complete review of your Portfolio and its investment performance.
MetLife is committed to building your financial freedom. We appreciate your trust and will continue to focus our efforts on meeting your investment needs.
Sincerely,
Elizabeth M. Forget
President, Metropolitan Series Fund, Inc.
Metropolitan Series Fund, Inc.
BlackRock Bond Income Portfolio
Managed by BlackRock Advisors, LLC
Portfolio Manager Commentary*
PORTFOLIO PERFORMANCE
For the twelve-month period ended December 31, 2008, the Class A shares of the BlackRock Bond Income Portfolio returned -3.4%, compared to its benchmark, the Barclays Capital U.S. Aggregate Bond Index 1, which returned 5.2%. The average return of its peer group, the Lipper Variable Insurance Products2 Corporate Debt A Rated Funds Universe, was -5.2% over the same period.
PORTFOLIO REVIEW
Unprecedented events of the past 12 months included the failures of several prominent U.S. financial institutions; the U.S. government’s provision of credit assistance to Fannie Mae and Freddie Mac (the government-sponsored enterprises representing a large portion of the U.S. residential mortgage market); the reorganization of Wall Street’s remaining investment banks, Goldman Sachs and Morgan Stanley, as bank holding companies; and the passing of a $700 billion Troubled Asset Relief Program (TARP) bill by the U.S. Congress. Due to the abundance of negative financial news, fixed income markets continued to be heavily affected by the flight-to-quality trade in which investors have been fleeing credit-related securities in favor of Treasury bonds. Housing market turmoil, severe liquidity issues and global financial market contagion all contributed to the re-emergence of overall volatility, with spreads between U.S. Treasury securities and all major sectors widening dramatically, and in most cases, to record levels. Over the 12 months, the yield on the 10-year Treasury note fell from 4.03% to 2.21%, as prices correspondingly rose.
The Federal Open Market Committee (FOMC) was very active throughout the period, lowering the federal funds target rate by 250 basis points (2.50%) between December 2007 and April 2008. The central bank remained on hold until early October, when, in a rare move coordinated with five other global central banks, it cut interest rates by 50 basis points to stave off worldwide economic damage from the intensifying financial market turmoil. The FOMC followed with an additional 50 basis point cut on October 29, and then finally reduced the target federal funds rate to a range of 0% to 0.25% on December 16. The committee anticipates that weak economic conditions are likely to warrant exceptionally low levels of the federal funds rate for some time. In its statement, the FOMC said its focus “will be to support the functioning of financial markets and stimulate the economy through open market operations and other measures that sustain the size of the Federal Reserve’s balance sheet at a high level.”
During the year, the BlackRock Bond Income Portfolio traded duration and yield curve positioning tactically, ending the period with a neutral duration and a slight yield curve steepener. Overall, the Portfolio’s duration and yield curve positioning trades benefited performance for the 12-month period. Over the course of the year, while Treasury bonds rallied (+13.7% in 2008), high-quality spread assets—particularly non-agency mortgage-backed securities (MBS), commercial mortgage-backed securities (CMBS) and asset-backed securities (ABS)—were under extreme pressure, most notably during the second half of the year. During 2008, the CMBS sector lost 20.5% and the ABS sector fell 12.7% (as reported by the Barclay’s Capital U.S. Aggregate Bond Index). There is no index that tracks non-agency MBS, but non-agency paper generally fell more than 30%. Corporate bonds were also volatile, posting losses of 4.9% for the year, with the financials sub-sector alone falling 8.4%. The markets began showing some signs of stabilizing from late November through year-end. In December alone, the CMBS sector was up 17%, corporates gained 6.8% and agency MBS rose 1.7%. However, while the year ended with a better tone, the Portfolio’s broad overweights in these high-quality spread sectors, combined with an underweight in Treasuries, detracted from performance for the period. While our exposure to the aforementioned spread sectors (non-agency MBS, CMBS, ABS) detracted from performance, our security selection proved beneficial, with our focus on the highest quality issues within the CMBS and ABS sectors helping us outperform the respective sector averages. The Portfolio remains underweight in U.S. Treasury and agency debt in favor of high-quality spread sectors. As a result, we maintained core holdings in agency and non-agency MBS, AAA-rated CMBS and ABS. During the period, as spreads on credit approached historically wide levels, we began to look for opportunities in both the new issue and secondary markets, bringing our credit allocation closer to neutral versus the benchmark.
* The views expressed above are those of the subadvisory firm as of December 31, 2008 and are subject to change based on market and other conditions. Information about the Portfolio’s holdings, asset allocation, industry allocation, or country diversification is historical and is not an indication of future Portfolio composition, which will vary. The performance of any index mentioned in this commentary has not been adjusted for ongoing management, distribution and operating expenses, and sales charges applicable to mutual fund investments. Direct investment in any index is not possible.
1 Barclays Capital U.S. Aggregate Bond Index (formerly, Lehman Brothers U.S. Aggregate Bond Index) includes most obligations of the U.S. Treasury, agencies and quasi-federal corporations, most publicly issued investment grade corporate bonds and most bonds backed by mortgage pools of GNMA, FNMA and FHLMC. The index itself remains unchanged since Barclays assumed responsibility for the index from Lehman.
2 The Lipper Variable Products Fund Average is an average of the total return performance (calculated on the basis of net asset value) of variable product funds with similar investment objectives to those of the subject Portfolio as calculated by Lipper Analytical Services, an independent mutual fund ranking service.
MSF-2
Metropolitan Series Fund, Inc.
BlackRock Bond Income Portfolio
A $10,000 INVESTMENT COMPARED TO THE BARCLAYS CAPITAL U.S. AGGREGATE BOND INDEX
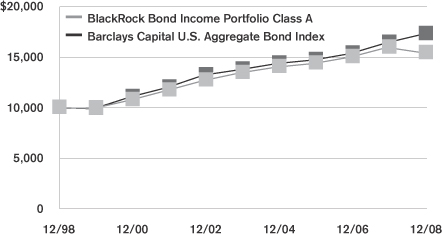
Average Annual Returns as of December 31, 2008
| | | | | | | | | | | | |
| | | BlackRock Bond Income Portfolio | | | Barclays Capital U.S. Aggregate Bond Index | |
| | | Class A | | | Class B | | | Class E | | |
| 1 Year | | -3.4 | % | | -3.7 | % | | -3.6 | % | | 5.2 | % |
| 5 Year | | 2.8 | | | 2.5 | | | 2.6 | | | 4.7 | |
| 10 Year | | 4.4 | | | — | | | — | | | 5.6 | |
| Since Inception | | — | | | 4.1 | | | 3.8 | | | — | |
Performance numbers are net of all Portfolio expenses but do not include any insurance, sales, or administrative charges of variable annuity or life insurance contracts or any additional expenses that participants in certain eligible qualified plans may bear relating to the operations of their plans. If these charges were included, the returns would be lower.
Inception dates of the Class A, Class B and Class E shares are: 8/26/83, 5/1/01 and 4/23/02, respectively.
This information represents past performance and is not indicative of future results. Investment return and principal value may fluctuate so that shares, upon redemption, may be worth more or less than the original cost.
PORTFOLIO COMPOSITION
as of December 31, 2008
Top Holdings
| | |
| | | % of Total
Net Assets |
Federal National Mortgage Association | | 35.2% |
Federal Home Loan Mortgage Corp. | | 20.7% |
Government National Mortgage Association | | 10.5% |
LB-UBS Commercial Mortgage Trust | | 2.8% |
General Electric Capital Corp. | | 2.0% |
Banc of America Commercial Mortgage, Inc. | | 1.9% |
JPMorgan Chase Commercial Mortgage Securities | | 1.7% |
GMAC Commercial Mortgage Securities, Inc. | | 1.6% |
First Union National Bank Commercial Mortgage Trust | | 1.4% |
Federal Home Loan Bank | | 1.3% |
Top Sectors
| | |
| | | % of Fixed Income
Market Value |
Mortgages | | 51.7% |
Investment Grade Corporates | | 21.5% |
Commercial Mortgage-Backed | | 17.4% |
Asset Backed | | 3.4% |
Other | | 2.9% |
Agency Issues | | 2.2% |
High Yield | | 0.9% |
MSF-3
Metropolitan Series Fund, Inc.
Shareholder Expense Example
As a shareholder of the Portfolio, you incur ongoing costs, including management fees; distribution and service (12b-1) fees; and other Portfolio expenses. This example is intended to help you understand your ongoing costs (in dollars) (referred to as “expenses”) of investing in the Portfolio and compare these costs with the ongoing costs of investing in other mutual funds. The example is based on an investment of $1,000 invested at the beginning of the period and held for the entire period, July 1, 2008 through December 31, 2008.
Actual Expenses
The first line for each share class of the Portfolio in the table below provides information about actual account values and actual expenses. You may use the information in this line, together with the amount you invested in the particular share class of the Portfolio, to estimate the expenses that you paid over the period. Simply divide your account value by $1,000 (for example, an $8,600 account value divided by $1,000=8.6), then multiply the result by the number in the first line under the heading entitled “Expenses Paid During Period” to estimate the expenses you paid on your account during this period.
Hypothetical Example for Comparison Purposes
The second line for each share class of the Portfolio in the table below provides information about hypothetical account values and hypothetical expenses based on the Portfolio’s actual expense ratio and an assumed rate of return of 5% per year before expenses, which is not the Portfolio’s actual return. The hypothetical account values and expenses may not be used to estimate the actual ending account balance or expenses you paid for the period. You may use this information to compare the ongoing costs of investing in the Portfolio and other funds. To do so, compare this 5% hypothetical example with the 5% hypothetical examples that appear in the shareholder reports of the other funds.
Please note that the expenses shown in the table are meant to highlight your ongoing costs only and do not reflect any fees or charges of your variable insurance product or any additional expenses that participants in certain eligible qualified plans may bear relating to the operations of their plan. Therefore, the second line for each share class in the table is useful in comparing ongoing costs only, and will not help you determine the relative total costs of owning different funds. In addition, if these other costs were included, your costs would have been higher.
| | | | | | | | | | | | | | |
Portfolio | | | | Annualized
Expense
Ratio | | | Beginning
Account Value
July 1,
2008 | | Ending
Account Value
December 31,
2008 | | Expenses Paid
During Period*
July 1, 2008
to
December 31,
2008 |
BlackRock Bond Income—Class A(a) | | Actual | | 0.41 | % | | $ | 1,000.00 | | $ | 968.20 | | $ | 2.03 |
| | Hypothetical | | 0.41 | % | | $ | 1,000.00 | | $ | 1,023.05 | | $ | 2.08 |
| | | | | |
BlackRock Bond Income—Class B(a) | | Actual | | 0.66 | % | | $ | 1,000.00 | | $ | 966.95 | | $ | 3.26 |
| | Hypothetical | | 0.66 | % | | $ | 1,000.00 | | $ | 1,021.78 | | $ | 3.35 |
| | | | | |
BlackRock Bond Income—Class E(a) | | Actual | | 0.56 | % | | $ | 1,000.00 | | $ | 967.49 | | $ | 2.77 |
| | Hypothetical | | 0.56 | % | | $ | 1,000.00 | | $ | 1,022.29 | | $ | 2.85 |
* Expenses paid are equal to the Portfolio’s annualized expense ratio for the most recent six month period, as shown above, multiplied by the average account value over the period, multiplied by the number of days in the most recent fiscal half-year, divided by 366 (to reflect the the one-half year period).
(a) The annualized expense ratio shown reflects the impact of the management fee waiver as described in Note 4 to the Financial Statements.
MSF-4
Metropolitan Series Fund, Inc.
BlackRock Bond Income Portfolio
Schedule of Investments as of December 31, 2008
Fixed Income—120.1% of Total Net Assets
| | | | | | |
| Security Description | | Face
Amount | | Value* |
| | | | | | |
| | |
Aerospace & Defense—0.2% | | | | | | |
L-3 Communications Corp.
5.875%, 01/15/15 | | $ | 370,000 | | $ | 333,000 |
6.375%, 10/15/15 (a) | | | 650,000 | | | 607,750 |
Northrop Grumman Systems Corp.
7.125%, 02/15/11 | | | 1,000,000 | | | 1,039,764 |
| | | | | | |
| | | | | | 1,980,514 |
| | | | | | |
| | |
Asset Backed—3.4% | | | | | | |
ARES CLO Funds (144A)
4.819%, 02/26/16 (b) | | | 1,600,000 | | | 254,464 |
Centex Home Equity
3.445%, 12/25/32 (b) | | | 625,393 | | | 74,451 |
Chase Funding Mortgage Loan Asset-Backed Certificates
5.833%, 04/25/32 (b) | | | 1,320,517 | | | 1,147,549 |
Chase Issuance Trust
4.230%, 01/15/13 (b) | | | 2,115,000 | | | 2,045,545 |
5.120%, 10/15/14 | | | 10,100,000 | | | 9,369,666 |
Chase Manhattan Auto Owner Trust
5.340%, 07/15/10 | | | 2,446,406 | | | 2,441,821 |
Countrywide Asset-Backed Certificates
1.545%, 07/25/36 (b) | | | 7,577,512 | | | 5,381,309 |
Knollwood CDO, Ltd. (144A)
7.489%, 02/08/39 (b) (c) (g) | | | 604,726 | | | 0 |
Merrill Lynch First Franklin Mortgage Loan Trust
1.515%, 04/25/37 (b) | | | 2,879,039 | | | 2,511,469 |
Option One Mortgage Loan Trust
2.520%, 01/25/33 (b) | | | 339,243 | | | 216,650 |
SLM Student Loan Trust
4.635%, 10/25/16 (b) | | | 970,000 | | | 907,708 |
4.835%, 01/25/28 (b) | | | 3,620,000 | | | 3,209,358 |
5.235%, 07/25/23 (b) | | | 9,750,000 | | | 8,036,135 |
Structured Asset Investment Loan Trust
4.320%, 04/25/33 (b) | | | 59,325 | | | 10,307 |
Wachovia Auto Owner Trust
5.380%, 03/20/13 | | | 8,900,000 | | | 8,035,509 |
| | | | | | |
| | | | | | 43,641,941 |
| | | | | | |
| | |
Capital Markets—1.6% | | | | | | |
Credit Suisse USA, Inc.
3.875%, 01/15/09 (a) | | | 3,600,000 | | | 3,599,575 |
6.125%, 11/15/11 | | | 1,600,000 | | | 1,616,066 |
Lehman Brothers Holdings, Inc.
4.800%, 03/13/14 (d) | | | 3,700,000 | | | 351,500 |
6.750%, 12/28/17 (d) | | | 4,775,000 | | | 477 |
7.000%, 09/27/27 (d) | | | 3,350,000 | | | 318,250 |
Morgan Stanley
4.570%, 01/09/12 (b) | | | 2,140,000 | | | 1,688,486 |
5.050%, 01/21/11 | | | 6,800,000 | | | 6,531,359 |
5.625%, 01/09/12 | | | 1,290,000 | | | 1,223,316 |
6.250%, 08/28/17 | | | 3,840,000 | | | 3,271,246 |
The Bear Stearns Cos., LLC
4.903%, 07/19/10 (b) | | | 2,040,000 | | | 1,974,212 |
| | | | | | |
| | | | | | 20,574,487 |
| | | | | | |
| | | | | | |
| Security Description | | Face
Amount | | Value* |
| | | | | | |
| |
Collateralized-Mortgage Obligation—7.3% | | | |
American Home Mortgage Assets
1.585%, 11/25/36 (b) | | $ | 1,546,222 | | $ | 640,167 |
Banc of America Alternative Loan Trust
5.500%, 10/25/35 | | | 8,498,472 | | | 7,207,998 |
Bear Stearns Adjustable Rate Mortgage Trust
5.471%, 11/25/34 (b) | | | 3,351,794 | | | 2,268,209 |
5.523%, 02/25/47 (b) | | | 1,931,677 | | | 992,195 |
Citicorp Mortgage Securities, Inc.
6.000%, 10/25/36 | | | 5,850,285 | | | 5,525,941 |
Citigroup Mortgage Loan Trust, Inc.
5.739%, 03/25/37 (b) | | | 11,471,105 | | | 5,910,992 |
CitiMortgage Alternative Loan Trust
6.000%, 10/25/37 | | | 9,815,217 | | | 4,705,170 |
Countrywide Alternative Loan Trust
0.698%, 03/20/47 (b) | | | 4,313,502 | | | 1,767,527 |
1.485%, 11/25/36 (b) | | | 1,330,612 | | | 1,159,392 |
3.439%, 08/25/46 (b) | | | 1,618,213 | | | 697,178 |
5.500%, 11/25/35 | | | 4,593,351 | | | 2,273,709 |
5.500%, 04/25/37 | | | 4,653,251 | | | 2,757,119 |
Countrywide Home Loan Mortgage Pass Through Trust
1.595%, 04/25/46 (b) | | | 1,917,286 | | | 750,743 |
6.500%, 10/25/37 | | | 5,677,906 | | | 3,852,107 |
Credit Suisse Mortgage Capital Certificates
6.000%, 10/25/21 | | | 2,491,849 | | | 1,463,961 |
6.000%, 02/25/37 | | | 4,142,341 | | | 2,688,374 |
Deutsche ALT-A Securities, Inc. Alternate
Loan Trust
1.595%, 02/25/47 (b) | | | 2,197,495 | | | 891,903 |
1.795%, 04/25/35 (b) | | | 2,549,309 | | | 1,199,040 |
GSR Mortgage Loan Trust
1.585%, 08/25/46 (b) | | | 4,542,854 | | | 2,207,633 |
5.246%, 11/25/35 (b) | | | 4,919,162 | | | 3,659,620 |
6.000%, 07/25/37 | | | 5,951,199 | | | 4,043,096 |
Harborview Mortgage Loan Trust
0.751%, 12/19/36 (b) | | | 8,653,695 | | | 3,434,584 |
0.791%, 11/19/36 (b) | | | 6,635,195 | | | 2,853,701 |
0.891%, 11/19/35 (b) | | | 3,117,904 | | | 1,420,462 |
0.911%, 09/19/35 (b) | | | 496,235 | | | 230,077 |
IndyMac INDA Mortgage Loan Trust
5.917%, 09/25/36 (b) | | | 3,224,859 | | | 1,748,220 |
JPMorgan Mortgage Trust
5.433%, 08/25/35 (b) | | | 3,129,526 | | | 2,509,446 |
5.500%, 03/25/22 | | | 1,040,174 | | | 706,994 |
5.875%, 07/25/36 | | | 1,200,682 | | | 885,503 |
6.500%, 08/25/36 | | | 6,045,879 | | | 4,439,752 |
Merrill Lynch Mortgage Investors, Inc. 5.827%, 05/25/36 (b) | | | 6,735,809 | | | 3,348,443 |
Structured Adjustable Rate Mortgage
Loan Trust
5.710%, 04/25/37 (b) | | | 3,611,329 | | | 1,746,853 |
WaMu Mortgage Pass-Through Certificates
3.229%, 06/25/47 (b) | | | 3,734,971 | | | 1,638,232 |
3.249%, 05/25/47 (b) | | | 2,159,434 | | | 952,052 |
4.562%, 06/25/33 | | | 627,910 | | | 363,716 |
4.920%, 08/25/35 (b) | | | 3,539,532 | | | 2,076,241 |
*See accompanying notes to financial statements.
MSF-5
Metropolitan Series Fund, Inc.
BlackRock Bond Income Portfolio
Schedule of Investments as of December 31, 2008
Fixed Income—(Continued)
| | | | | | |
| Security Description | | Face
Amount | | Value* |
| | | | | | |
| |
Collateralized-Mortgage Obligation—(Continued) | | | |
Wells Fargo Mortgage Backed Securities Trust
5.500%, 03/25/36 | | $ | 3,800,028 | | $ | 3,319,214 |
5.776%, 04/25/36 (b) | | | 2,903,000 | | | 1,661,015 |
6.000%, 08/25/36 | | | 3,887,153 | | | 3,219,202 |
6.100%, 09/25/36 (b) | | | 3,167,314 | | | 2,029,878 |
| | | | | | |
| | | | | | 95,245,659 |
| | | | | | |
| | |
Commercial Banks—3.0% | | | | | | |
Barclays Bank, Plc. (144A)
5.926%, 12/31/49 | | | 2,540,000 | | | 934,014 |
7.434%, 09/29/49 (b) | | | 3,755,000 | | | 1,898,453 |
HSBC Bank USA, N.A.
5.875%, 11/01/34 | | | 2,300,000 | | | 2,239,220 |
Royal Bank of Scotland Group, Plc.
5.050%, 01/08/15 | | | 2,300,000 | | | 1,952,256 |
Royal Bank of Scotland Group, Plc. (144A)
6.990%, 10/29/49 (b) | | | 4,650,000 | | | 2,174,042 |
U.S. Bank, N.A.
4.950%, 10/30/14 | | | 2,300,000 | | | 2,326,574 |
UBS AG (Stamford Branch)
5.750%, 04/25/18 | | | 5,400,000 | | | 4,901,013 |
5.875%, 12/20/17 | | | 7,760,000 | | | 7,128,685 |
Wachovia Bank, N.A.
6.600%, 01/15/38 | | | 3,770,000 | | | 4,090,103 |
Wachovia Corp.
7.980%, 12/31/49 (b) | | | 8,675,000 | | | 7,394,570 |
Wells Fargo & Co.
4.625%, 08/09/10 | | | 2,765,000 | | | 2,777,714 |
4.875%, 01/12/11 | | | 940,000 | | | 940,036 |
| | | | | | |
| | | | | | 38,756,680 |
| | | | | | |
| |
Commercial Mortgage-Backed Securities—17.6% | | | |
Banc of America Commercial Mortgage, Inc.
4.621%, 07/10/43 | | | 5,225,000 | | | 4,236,608 |
4.870%, 12/10/42 (b) | | | 8,450,000 | | | 4,016,136 |
5.356%, 12/10/16 | | | 8,305,000 | | | 6,346,380 |
6.186%, 06/11/35 | | | 5,530,000 | | | 5,294,961 |
7.333%, 10/15/09 | | | 5,307,183 | | | 5,292,267 |
Bear Stearns Commercial Mortgage Securities
4.361%, 06/11/41 | | | 2,699,473 | | | 2,659,631 |
5.694%, 06/11/50 (b) | | | 7,350,000 | | | 5,472,685 |
5.742%, 09/11/42 (b) | | | 8,775,000 | | | 6,854,407 |
Chase Commerical Mortgage Securities Corp.
7.319%, 10/15/32 | | | 2,104,253 | | | 2,094,034 |
Citigroup Commercial Mortgage Trust
5.431%, 10/15/49 | | | 1,885,000 | | | 1,477,531 |
5.700%, 06/10/17 (b) | | | 3,975,000 | | | 1,820,645 |
Citigroup/Deutsche Bank Commercial Mortgage Trust
5.886%, 11/15/44 | | | 4,050,000 | | | 3,054,069 |
Commercial Mortgage Pass Through Certificates
5.167%, 06/10/44 (b) | | | 7,050,000 | | | 5,749,691 |
5.816%, 12/10/49 (b) | | | 11,120,000 | | | 8,431,905 |
| | | | | | |
| Security Description | | Face
Amount | | Value* |
| | | | | | |
|
Commercial Mortgage-Backed Securities—(Continued) |
CS First Boston Mortgage Securities Corp.
3.936%, 05/15/38 (b) | | $ | 10,000,000 | | $ | 8,506,347 |
4.889%, 11/15/37 (b) | | | 2,220,000 | | | 1,044,360 |
4.940%, 12/15/35 | | | 7,295,000 | | | 6,563,159 |
DLJ Commercial Mortgage Corp.
7.180%, 11/10/33 | | | 5,817,337 | | | 5,793,603 |
First Union National Bank Commercial Mortgage Trust
7.390%, 12/15/31 | | | 8,796,111 | | | 8,777,047 |
First Union National Bank Commercial Mortgage Trust (144A)
7.793%, 12/15/31 (b) | | | 9,412,000 | | | 9,120,396 |
GE Capital Commercial Mortgage Corp.
4.578%, 06/10/48 | | | 5,200,000 | | | 4,349,521 |
GMAC Commercial Mortgage Securities, Inc.
5.134%, 08/10/38 (b) | | | 3,000,000 | | | 2,674,178 |
6.465%, 04/15/34 | | | 6,242,942 | | | 6,102,767 |
6.957%, 09/15/35 | | | 7,241,655 | | | 7,166,620 |
7.455%, 08/16/33 | | | 4,436,158 | | | 4,427,048 |
JPMorgan Chase Commercial Mortgage Securities Corp.
4.922%, 01/15/42 (b) | | | 8,600,000 | | | 4,055,396 |
4.996%, 08/15/42 (b) | | | 2,300,000 | | | 1,596,839 |
4.999%, 10/15/42 (b) | | | 2,580,000 | | | 1,515,019 |
5.804%, 06/15/49 (b) | | | 3,825,000 | | | 2,923,926 |
5.827%, 02/15/51 (b) | | | 3,125,000 | | | 2,436,503 |
5.857%, 10/12/35 | | | 5,710,000 | | | 5,450,343 |
JPMorgan Chase Commercial Mortgage Securities Corp. (144A)
4.158%, 01/12/39 | | | 4,572,127 | | | 3,758,480 |
LB-UBS Commercial Mortgage Trust
4.071%, 09/15/26 | | | 2,541,781 | | | 2,430,923 |
4.559%, 07/17/12 (b) | | | 4,075,000 | | | 3,849,728 |
4.806%, 02/15/40 (b) | | | 3,600,000 | | | 1,655,782 |
5.205%, 04/15/30 (b) | | | 3,575,000 | | | 1,656,025 |
5.430%, 02/17/40 (b) | | | 16,920,000 | | | 12,160,478 |
5.642%, 12/15/25 | | | 1,805,823 | | | 1,759,954 |
5.866%, 09/15/45 | | | 8,820,000 | | | 6,240,979 |
7.950%, 05/15/25 (b) | | | 5,246,562 | | | 5,269,239 |
LB-UBS Commercial Mortgage Trust (144A)
6.155%, 07/14/16 | | | 1,635,196 | | | 1,606,771 |
Morgan Stanley Capital I
5.632%, 04/12/49 (b) | | | 1,390,000 | | | 1,045,774 |
5.650%, 06/11/42 (b) | | | 10,415,000 | | | 7,950,437 |
5.693%, 10/15/42 | | | 2,695,000 | | | 2,312,504 |
Nomura Asset Securities Corp.
6.590%, 03/15/30 | | | 187,712 | | | 187,451 |
Salomon Brothers Mortgage Securities VII, Inc.
6.499%, 10/13/11 | | | 5,474,216 | | | 5,317,517 |
6.592%, 12/18/33 | | | 5,603,928 | | | 5,501,172 |
TIAA Seasoned Commercial Mortgage Trust
6.086%, 08/15/39 (b) | | | 3,755,000 | | | 3,233,898 |
Wachovia Bank Commercial Mortgage Trust
4.935%, 04/15/42 | | | 4,950,000 | | | 4,007,031 |
5.740%, 05/15/43 (b) | | | 9,000,000 | | | 7,112,248 |
5.902%, 02/15/51 (b) | | | 4,300,000 | | | 3,107,503 |
*See accompanying notes to financial statements.
MSF-6
Metropolitan Series Fund, Inc.
BlackRock Bond Income Portfolio
Schedule of Investments as of December 31, 2008
Fixed Income—(Continued)
| | | | | | |
| Security Description | | Face
Amount | | Value* |
| | | | | | |
|
Commercial Mortgage-Backed Securities—(Continued) |
WaMu Commercial Mortgage Securities Trust (144A)
5.150%, 05/25/36 | | $ | 4,131,671 | | $ | 3,994,606 |
| | | | | | |
| | | | | | 229,462,522 |
| | | | | | |
| | |
Computers & Peripherals—0.5% | | | | | | |
International Business Machines Corp.
7.625%, 10/15/18 | | | 5,200,000 | | | 6,235,814 |
| | | | | | |
| | |
Consumer Finance—0.5% | | | | | | |
SLM Corp.
3.695%, 07/26/10 (b) | | | 5,145,000 | | | 4,391,160 |
5.400%, 10/25/11 | | | 2,470,000 | | | 1,868,392 |
| | | | | | |
| | | | | | 6,259,552 |
| | | | | | |
| | |
Diversified Financial Services—7.3% | | | | | | |
AES Ironwood, LLC
8.857%, 11/30/25 | | | 169,040 | | | 147,065 |
AES Red Oak, LLC
9.200%, 11/30/29 | | | 85,000 | | | 73,100 |
Anadarko Finance Co.
6.750%, 05/01/11 (a) | | | 1,900,000 | | | 1,900,680 |
Atlantic Marine Corps Communities, LLC (144A)
5.343%, 12/01/50 | | | 150,000 | | | 98,391 |
BA Master Credit Card Trust
7.000%, 02/15/12 | | | 1,125,000 | | | 1,128,471 |
Bank of America Corp.
5.375%, 06/15/14 | | | 3,100,000 | | | 3,038,499 |
5.650%, 05/01/18 | | | 1,285,000 | | | 1,292,625 |
5.750%, 12/01/17 (a) | | | 1,020,000 | | | 1,018,410 |
6.000%, 09/01/17 (a) | | | 2,550,000 | | | 2,589,836 |
8.000%, 12/29/49 (b) | | | 4,470,000 | | | 3,215,217 |
8.125%, 12/29/49 (b) | | | 2,525,000 | | | 1,888,700 |
Bank of America, N.A.
6.100%, 06/15/17 | | | 1,200,000 | | | 1,183,224 |
Belvoir Land, LLC (144A)
5.270%, 12/15/47 | | | 900,000 | | | 575,199 |
Berkshire Hathaway Finance Corp.
4.750%, 05/15/12 | | | 2,100,000 | | | 2,155,707 |
Citigroup Capital XXI
8.300%, 12/21/57 (b) | | | 1,890,000 | | | 1,457,638 |
Citigroup, Inc.
5.300%, 10/17/12 (a) | | | 7,375,000 | | | 7,107,479 |
Credit Suisse Guernsey, Ltd.
5.860%, 05/29/49 (b) | | | 5,320,000 | | | 2,483,020 |
Daimler Finance North America, LLC
7.300%, 01/15/12 | | | 3,800,000 | | | 3,284,644 |
Devon Financing Corp.
6.875%, 09/30/11 | | | 2,800,000 | | | 2,825,651 |
Gaz Capital S.A. (144A)
7.288%, 08/16/37 | | | 2,710,000 | | | 1,598,900 |
General Electric Capital Corp.
5.000%, 11/15/11 | | | 16,940,000 | | | 17,167,165 |
5.000%, 04/10/12 (f) | | | 2,135,000 | | | 2,116,231 |
| | | | | | |
| Security Description | | Face
Amount | | Value* |
| | | | | | |
| |
Diversified Financial Services—(Continued) | | | |
General Electric Capital Corp.
6.150%, 08/01/37 (f) | | $ | 4,310,000 | | $ | 4,321,275 |
6.375%, 11/15/67 (a) (b) | | | 3,875,000 | | | 2,435,705 |
GlaxoSmithKline Capital, Inc.
4.850%, 05/15/13 | | | 3,475,000 | | | 3,485,623 |
Goldman Sachs Capital II
5.793%, 12/29/49 (b) | | | 2,435,000 | | | 936,070 |
Icahn Enterprises, L.P.
8.125%, 06/01/12 | | | 225,000 | | | 173,250 |
Irwin Land, LLC (144A)
5.400%, 12/15/47 | | | 1,650,000 | | | 1,063,145 |
JPMorgan Chase & Co.
7.900%, 12/31/49 (b) | | | 4,775,000 | | | 3,971,988 |
JPMorgan Chase Bank, N.A.
6.000%, 07/05/17 | | | 6,325,000 | | | 6,379,382 |
JPMorgan Chase Capital XXV
6.800%, 10/01/37 | | | 7,435,000 | | | 6,850,497 |
Petrobras International Finance Co.
5.875%, 03/01/18 | | | 1,295,000 | | | 1,164,205 |
Rabobank Capital Funding Trust (144A)
5.254%, 12/29/49 (b) | | | 1,000,000 | | | 548,273 |
Sprint Capital Corp.
8.375%, 03/15/12 | | | 200,000 | | | 160,000 |
Telecom Italia Capital S.A.
4.000%, 01/15/10 (a) | | | 2,000,000 | | | 1,840,000 |
5.250%, 11/15/13 | | | 850,000 | | | 648,125 |
5.250%, 10/01/15 | | | 1,100,000 | | | 837,375 |
Wind Acquisition Finance S.A. (144A)
10.750%, 12/01/15 | | | 475,000 | | | 408,500 |
ZFS Finance USA Trust I (144A)
6.500%, 05/09/37 (b) | | | 2,130,000 | | | 873,300 |
| | | | | | |
| | | | | | 94,442,565 |
| | | | | | |
| |
Diversified Telecommunication Services—1.5% | | | |
AT&T, Inc.
6.500%, 09/01/37 (a) | | | 7,275,000 | | | 7,835,102 |
Cincinnati Bell, Inc.
7.250%, 07/15/13 (a) | | | 80,000 | | | 70,400 |
Qwest Communications International, Inc.
7.500%, 02/15/14 | | | 810,000 | | | 579,150 |
Qwest Communications International, Inc. (Series B)
7.500%, 02/15/14 (a) | | | 350,000 | | | 250,250 |
Qwest Corp.
5.246%, 06/15/13 (b) | | | 415,000 | | | 309,175 |
Verizon Communications, Inc.
8.750%, 11/01/18 | | | 8,150,000 | | | 9,561,760 |
Windstream Corp.
8.125%, 08/01/13 | | | 1,030,000 | | | 947,600 |
8.625%, 08/01/16 | | | 305,000 | | | 269,925 |
| | | | | | |
| | | | | | 19,823,362 |
| | | | | | |
| | |
Electric Utilities—1.0% | | | | | | |
Elwood Energy, LLC
8.159%, 07/05/26 | | | 206,571 | | | 140,047 |
*See accompanying notes to financial statements.
MSF-7
Metropolitan Series Fund, Inc.
BlackRock Bond Income Portfolio
Schedule of Investments as of December 31, 2008
Fixed Income—(Continued)
| | | | | | |
| Security Description | | Face
Amount | | Value* |
| | | | | | |
| | |
Electric Utilities—(Continued) | | | | | | |
Florida Power & Light Co.
5.625%, 04/01/34 | | $ | 475,000 | | $ | 504,051 |
5.950%, 02/01/38 (a) | | | 1,330,000 | | | 1,481,421 |
Florida Power Corp.
6.400%, 06/15/38 | | | 2,850,000 | | | 3,182,709 |
MidAmerican Energy Holdings Co.
5.950%, 05/15/37 | | | 1,650,000 | | | 1,496,142 |
6.500%, 09/15/37 | | | 1,900,000 | | | 1,854,676 |
PECO Energy Co.
4.750%, 10/01/12 | | | 947,000 | | | 921,767 |
Southern California Edison Co.
5.950%, 02/01/38 | | | 1,100,000 | | | 1,225,235 |
Texas Competitive Electric Holdings Co., LLC (144A)
10.500%, 11/01/15 (b) | | | 3,130,000 | | | 2,222,300 |
| | | | | | |
| | | | | | 13,028,348 |
| | | | | | |
| | |
Energy Equipment & Services—0.2% | | | | | | |
Kinder Morgan Energy Partners, L.P.
5.125%, 11/15/14 | | | 1,000,000 | | | 871,197 |
Tennessee Gas Pipeline Co.
7.000%, 10/15/28 (a) | | | 500,000 | | | 382,568 |
Transocean, Ltd.
6.000%, 03/15/18 | | | 680,000 | | | 619,345 |
6.800%, 03/15/38 | | | 865,000 | | | 771,534 |
| | | | | | |
| | | | | | 2,644,644 |
| | | | | | |
| | |
Federal Agencies—66.4% | | | | | | |
Federal Home Loan Bank
5.625%, 06/11/21 | | | 14,865,000 | | | 17,128,271 |
Federal Home Loan Mortgage Corp.
4.500%, TBA | | | 15,000,000 | | | 15,332,820 |
4.500%, TBA | | | 3,200,000 | | | 3,242,000 |
4.769%, 03/01/35 (b) | | | 8,492,147 | | | 8,541,229 |
5.000%, 02/01/36 | | | 880,574 | | | 901,112 |
5.000%, TBA | | | 65,700,000 | | | 67,185,312 |
5.297%, 07/01/38 (b) | | | 9,724,477 | | | 9,893,939 |
5.304%, 08/01/38 (b) | | | 7,313,203 | | | 7,442,757 |
5.355%, 10/15/33 (b) | | | 77,917,405 | | | 6,985,591 |
5.500%, 09/01/21 | | | 42,244,211 | | | 43,570,566 |
5.500%, 07/01/33 | | | 4,295,705 | | | 4,416,208 |
5.500%, TBA | | | 53,800,000 | | | 55,060,964 |
5.674%, 01/01/37 (b) | | | 6,485,321 | | | 6,619,730 |
6.000%, 03/15/29 | | | 5,111,080 | | | 5,228,655 |
6.000%, 09/01/38 | | | 7,111,726 | | | 7,333,160 |
6.000%, TBA | | | 9,500,000 | | | 9,806,500 |
9.000%, 12/01/09 | | | 798 | | | 800 |
Federal National Mortgage Association
4.000%, TBA | | | 15,900,000 | | | 15,943,215 |
4.500%, 02/01/35 | | | 992,061 | | | 1,007,280 |
4.500%, 03/01/35 | | | 676,511 | | | 686,889 |
4.500%, 09/01/35 | | | 67,017 | | | 68,045 |
4.500%, 07/01/36 | | | 7,191,323 | | | 7,306,139 |
4.500%, TBA | | | 33,600,000 | | | 34,032,147 |
4.961%, 06/01/38 (b) | | | 8,065,891 | | | 8,192,946 |
| | | | | | |
| Security Description | | Face
Amount | | Value* |
| | | | | | |
| | |
Federal Agencies—(Continued) | | | | | | |
Federal National Mortgage Association
5.000%, 06/01/23 | | $ | 1,966,411 | | $ | 2,016,627 |
5.000%, 12/01/32 | | | 288,537 | | | 295,627 |
5.000%, 06/01/33 | | | 14,676,747 | | | 15,023,652 |
5.000%, 07/01/33 | | | 4,369,776 | | | 4,473,062 |
5.000%, 08/01/33 | | | 23,043,619 | | | 23,588,285 |
5.000%, 09/01/33 | | | 2,308,204 | | | 2,362,761 |
5.000%, 10/01/33 | | | 3,766,901 | | | 3,855,937 |
5.000%, 12/01/33 | | | 822,976 | | | 842,428 |
5.000%, 04/01/34 | | | 16,505,988 | | | 16,885,814 |
5.000%, 04/25/35 | | | 2,321,021 | | | 2,383,109 |
5.000%, 07/01/35 | | | 363,920 | | | 372,067 |
5.000%, 09/01/35 | | | 1,362,636 | | | 1,394,844 |
5.000%, 12/01/35 | | | 3,364,125 | | | 3,439,436 |
5.000%, 02/01/36 | | | 11,651,777 | | | 11,912,618 |
5.000%, 05/01/36 | | | 7,620,654 | | | 7,791,252 |
5.000%, 07/01/36 (e) | | | 15,058,512 | | | 1,443,024 |
5.000%, 07/01/37 | | | 1,460,604 | | | 1,495,127 |
5.052%, 07/01/38 (b) | | | 7,878,666 | | | 8,003,612 |
5.125%, 01/02/14 | | | 7,600,000 | | | 8,031,376 |
5.250%, 08/01/12 (a) | | | 3,100,000 | | | 3,267,462 |
5.500%, 04/01/17 | | | 113,293 | | | 117,293 |
5.500%, 05/01/19 | | | 25,460,875 | | | 26,359,736 |
5.500%, 08/01/19 | | | 13,374 | | | 13,821 |
5.500%, 03/01/20 | | | 388,134 | | | 400,745 |
5.500%, 05/01/20 | | | 109,779 | | | 113,346 |
5.500%, 06/01/20 | | | 1,284,993 | | | 1,330,358 |
5.500%, 10/01/20 | | | 329,845 | | | 340,562 |
5.500%, 02/01/21 | | | 89,491 | | | 92,399 |
5.500%, 03/01/21 | | | 573,773 | | | 591,967 |
5.500%, 01/01/24 | | | 1,112,652 | | | 1,144,677 |
5.500%, 06/25/28 | | | 1,668,470 | | | 1,705,751 |
5.500%, 05/01/34 | | | 64,125,055 | | | 65,891,226 |
5.500%, 11/01/34 | | | 4,014,727 | | | 4,122,794 |
5.500%, 06/01/35 | | | 2,486,928 | | | 2,552,316 |
5.500%, 08/01/35 | | | 6,608,542 | | | 6,783,759 |
5.500%, 11/01/35 | | | 1,811,950 | | | 1,859,591 |
5.500%, 11/01/35 (e) | | | 7,586,774 | | | 818,864 |
5.500%, 12/01/35 | | | 10,968,320 | | | 11,256,706 |
5.500%, 01/25/36 (e) | | | 6,908,448 | | | 731,021 |
5.500%, 06/01/36 | | | 77,708 | | | 79,752 |
5.500%, 07/01/36 | | | 1,723,818 | | | 1,769,142 |
5.500%, 12/01/36 (b) | | | 28,118,345 | | | 28,857,650 |
5.500%, 04/01/37 | | | 19,002,097 | | | 19,500,643 |
5.500%, 08/01/37 | | | 1,522,937 | | | 1,562,893 |
5.500%, 11/01/37 | | | 1,910,608 | | | 1,960,735 |
5.500%, 12/01/37 | | | 1,893,184 | | | 1,942,855 |
5.500%, 02/01/38 | | | 953,665 | | | 978,591 |
5.500%, 03/01/38 | | | 1,545,558 | | | 1,585,953 |
5.500%, 07/01/38 | | | 1,015,340 | | | 1,041,877 |
5.500%, 09/01/38 | | | 4,735,775 | | | 4,859,550 |
6.000%, 04/01/16 | | | 512,464 | | | 540,239 |
6.000%, 03/25/27 | | | 5,684,021 | | | 5,810,862 |
6.000%, 02/01/34 | | | 2,599,693 | | | 2,684,700 |
6.000%, 08/01/34 | | | 2,167,927 | | | 2,238,816 |
6.000%, 04/01/35 | | | 13,317,665 | | | 13,761,461 |
*See accompanying notes to financial statements.
MSF-8
Metropolitan Series Fund, Inc.
BlackRock Bond Income Portfolio
Schedule of Investments as of December 31, 2008
Fixed Income—(Continued)
| | | | | | |
| Security Description | | Face
Amount | | Value* |
| | | | | | |
| | |
Federal Agencies—(Continued) | | | | | | |
Federal National Mortgage Association
6.000%, 08/01/35 | | $ | 432,070 | | $ | 446,639 |
6.000%, 01/01/36 | | | 133,016 | | | 137,095 |
6.000%, 05/01/36 | | | 91,596 | | | 94,405 |
6.000%, 06/01/36 | | | 7,231,338 | | | 7,453,106 |
6.000%, 11/01/36 | | | 3,263,163 | | | 3,363,236 |
6.000%, 12/01/36 | | | 3,116,290 | | | 3,211,859 |
6.000%, 06/01/37 | | | 407,307 | | | 419,776 |
6.000%, 08/01/37 | | | 148,400 | | | 152,943 |
6.000%, 09/01/37 | | | 2,421,037 | | | 2,457,823 |
6.000%, 10/01/37 | | | 7,211,421 | | | 7,432,172 |
6.000%, 03/01/38 | | | 5,523,410 | | | 5,692,496 |
6.000%, 06/01/38 | | | 6,355,501 | | | 6,549,416 |
6.000%, 08/01/38 | | | 1,182,610 | | | 1,218,693 |
6.000%, 09/01/38 | | | 6,214,695 | | | 6,404,314 |
6.500%, 11/01/27 | | | 167,572 | | | 175,479 |
6.500%, 12/01/29 (b) | | | 1,097,604 | | | 1,149,397 |
6.500%, TBA | | | 1,700,000 | | | 1,765,345 |
7.000%, 04/01/37 | | | 5,986,028 | | | 6,303,026 |
7.500%, 11/01/37 | | | 1,804,735 | | | 1,894,351 |
9.000%, 04/01/16 | | | 78 | | | 79 |
Government National Mortgage Association
5.000%, 10/20/33 | | | 7,323,794 | | | 7,520,149 |
5.500%, 04/15/33 | | | 345,488 | | | 357,065 |
5.500%, TBA | | | 20,400,000 | | | 20,932,313 |
5.500%, TBA | | | 29,800,000 | | | 30,461,322 |
6.000%, 09/20/33 | | | 1,078,402 | | | 1,113,200 |
6.000%, 10/20/33 | | | 1,782,393 | | | 1,844,543 |
6.000%, 11/20/33 | | | 2,434,894 | | | 2,513,463 |
6.000%, TBA | | | 34,800,000 | | | 35,786,482 |
6.500%, 07/15/28 | | | 98,194 | | | 103,210 |
6.500%, 05/15/29 | | | 185,673 | | | 195,737 |
6.500%, 12/15/29 | | | 3,705 | | | 3,906 |
6.500%, 07/15/32 | | | 49,147 | | | 51,658 |
6.500%, 10/15/32 | | | 951,168 | | | 1,003,115 |
6.500%, 11/15/32 | | | 334,583 | | | 352,853 |
6.500%, 02/15/33 | | | 1,478,964 | | | 1,553,858 |
6.500%, 04/15/33 | | | 262,694 | | | 274,143 |
6.500%, 06/15/34 | | | 965,986 | | | 1,018,758 |
6.500%, 08/15/34 | | | 7,518,196 | | | 7,878,161 |
6.500%, 09/15/34 | | | 17,211 | | | 17,950 |
6.500%, 02/15/35 | | | 10,663,843 | | | 11,170,823 |
6.500%, 07/15/35 | | | 289,727 | | | 301,902 |
6.500%, 12/15/35 | | | 8,210,674 | | | 8,598,386 |
6.500%, TBA | | | 2,900,000 | | | 3,000,601 |
7.500%, 12/15/14 | | | 206,828 | | | 218,830 |
8.000%, 11/15/29 | | | 31,773 | | | 33,898 |
8.500%, 01/15/17 | | | 10,393 | | | 11,111 |
8.500%, 02/15/17 | | | 3,731 | | | 3,989 |
8.500%, 03/15/17 | | | 7,840 | | | 8,382 |
8.500%, 05/15/17 | | | 11,307 | | | 12,088 |
8.500%, 10/15/21 | | | 1,348 | | | 1,440 |
8.500%, 11/15/21 | | | 4,129 | | | 4,413 |
8.500%, 05/15/22 | | | 3,229 | | | 3,450 |
9.000%, 10/15/16 | | | 6,798 | | | 7,267 |
| | | | | | |
| | | | | | 862,887,162 |
| | | | | | |
| | | | | | |
| Security Description | | Face
Amount | | Value* |
| | | | | | |
| | |
Food & Staples Retailing—0.1% | | | | | | |
Delhaize America, Inc.
9.000%, 04/15/31 | | $ | 1,000,000 | | $ | 1,011,321 |
| | | | | | |
| | |
Food Products—0.5% | | | | | | |
Kraft Foods, Inc.
6.125%, 02/01/18 | | | 4,245,000 | | | 4,159,663 |
6.500%, 08/11/17 (b) | | | 2,855,000 | | | 2,869,680 |
| | | | | | |
| | | | | | 7,029,343 |
| | | | | | |
| | |
Foreign Government—4.2% | | | | | | |
Emirate of Abu Dhabi (144A)
5.500%, 08/02/12 | | | 11,600,000 | | | 12,834,240 |
Federal Republic of Germany
4.000%, 01/04/37 (EUR) | | | 870,000 | | | 1,295,738 |
4.250%, 07/04/39 (EUR) | | | 2,100,000 | | | 3,315,284 |
Israel Government AID Bond
5.500%, 12/04/23 | | | 4,725,000 | | | 5,852,810 |
Japan Government
1.000%, 11/20/21 (JPY) (b) | | | 1,287,000,000 | | | 13,940,489 |
U.K. Treasury Bond
4.250%, 12/07/49 (GBP) | | | 2,055,000 | | | 3,225,660 |
United Mexican States
7.250%, 12/15/16 (MXN) | | | 41,000,000 | | | 2,837,152 |
10.000%, 12/05/24 (MXN) | | | 137,180,000 | | | 11,378,753 |
| | | | | | |
| | | | | | 54,680,126 |
| | | | | | |
|
Health Care Providers & Services—0.1% |
WellPoint, Inc.
5.950%, 12/15/34 | | | 1,750,000 | | | 1,453,844 |
| | | | | | |
| | |
Hotels, Restaurants & Leisure—0.0% | | | | | | |
Harrah’s Operating Co., Inc. (144A)
10.000%, 12/15/18 | | | 621,000 | | | 226,665 |
10.750%, 02/01/18 | | | 2,515,000 | | | 326,950 |
| | | | | | |
| | | | | | 553,615 |
| | | | | | |
|
Independent Power Producers & Energy Traders—0.0% |
NRG Energy, Inc.
7.375%, 02/01/16 | | | 275,000 | | | 255,750 |
| | | | | | |
| | |
Insurance—0.6% | | | | | | |
American International Group, Inc. (144A)
8.175%, 05/15/58 | | | 5,800,000 | | | 2,256,345 |
Chubb Corp.
6.375%, 03/29/67 (b) | | | 2,775,000 | | | 1,721,033 |
Lincoln National Corp.
7.000%, 05/17/66 (b) | | | 1,735,000 | | | 728,700 |
The Progressive Corp.
6.700%, 06/15/37 (b) | | | 2,640,000 | | | 1,297,779 |
The Travelers Cos., Inc.
6.250%, 03/15/67 (b) | | | 3,075,000 | | | 2,014,239 |
| | | | | | |
| | | | | | 8,018,096 |
| | | | | | |
*See accompanying notes to financial statements.
MSF-9
Metropolitan Series Fund, Inc.
BlackRock Bond Income Portfolio
Schedule of Investments as of December 31, 2008
Fixed Income—(Continued)
| | | | | | |
| Security Description | | Face
Amount | | Value* |
| | | | | | |
| | |
Media—1.7% | | | | | | |
Comcast Cable Communications Holdings, Inc. 8.375%, 03/15/13 (a) | | $ | 1,330,000 | | $ | 1,375,917 |
Comcast Cable Communications, LLC
8.500%, 05/01/27 | | | 2,400,000 | | | 2,704,550 |
Comcast Corp.
6.500%, 01/15/17 | | | 1,200,000 | | | 1,185,257 |
6.950%, 08/15/37 | | | 4,250,000 | | | 4,475,471 |
7.050%, 03/15/33 | | | 1,775,000 | | | 1,851,487 |
COX Communications, Inc.
7.125%, 10/01/12 | | | 4,600,000 | | | 4,402,278 |
CSC Holdings, Inc.
8.125%, 07/15/09 | | | 350,000 | | | 348,250 |
News America, Inc.
6.200%, 12/15/34 | | | 1,500,000 | | | 1,368,821 |
Time Warner Cable, Inc.
5.850%, 05/01/17 | | | 3,975,000 | | | 3,631,373 |
Time Warner Entertainment Co., L.P.
8.375%, 03/15/23 | | | 590,000 | | | 594,167 |
| | | | | | |
| | | | | | 21,937,571 |
| | | | | | |
| | |
Metals & Mining—0.2% | | | | | | |
Freeport-McMoRan Copper & Gold, Inc.
8.250%, 04/01/15 (a) | | | 1,250,000 | | | 1,062,500 |
8.375%, 04/01/17 | | | 2,410,000 | | | 1,976,200 |
| | | | | | |
| | | | | | 3,038,700 |
| | | | | | |
| | |
Office Electronics—0.1% | | | | | | |
Xerox Corp.
6.875%, 08/15/11 | | | 1,450,000 | | | 1,253,390 |
| | | | | | |
| | |
Oil, Gas & Consumable Fuels—0.7% | | | | | | |
Anadarko Petroleum Corp.
5.950%, 09/15/16 (a) | | | 2,900,000 | | | 2,561,596 |
6.450%, 09/15/36 | | | 1,105,000 | | | 871,661 |
Canadian Natural Resources, Ltd.
6.250%, 03/15/38 | | | 1,850,000 | | | 1,454,091 |
Enterprise Products Operating, LLC
4.950%, 06/01/10 | | | 25,000 | | | 23,945 |
Newfield Exploration Co.
6.625%, 09/01/14 | | | 590,000 | | | 483,800 |
6.625%, 04/15/16 | | | 555,000 | | | 441,225 |
Sabine Pass LNG, L.P.
7.500%, 11/30/16 (a) | | | 1,900,000 | | | 1,368,000 |
XTO Energy, Inc.
6.750%, 08/01/37 | | | 2,500,000 | | | 2,341,410 |
| | | | | | |
| | | | | | 9,545,728 |
| | | | | | |
| | |
Pharmaceuticals—0.5% | | | | | | |
Wyeth
5.500%, 02/01/14 | | | 6,000,000 | | | 6,094,728 |
| | | | | | |
| | |
Real Estate Investment Trusts—0.1% | | | | | | |
AvalonBay Communities, Inc.
4.950%, 03/15/13 (a) | | | 400,000 | | | 292,827 |
| | | | | | | |
| Security Description | | Face
Amount | | Value* | |
| | | | | | | |
| |
Real Estate Investment Trusts—(Continued) | | | | |
Simon Property Group, L.P.
4.600%, 06/15/10 | | $ | 1,000,000 | | $ | 891,309 | |
5.100%, 06/15/15 | | | 1,000,000 | | | 613,025 | |
| | | | | | | |
| | | | | | 1,797,161 | |
| | | | | | | |
| | |
Software—0.2% | | | | | | | |
Oracle Corp.
5.750%, 04/15/18 | | | 2,310,000 | | | 2,416,186 | |
| | | | | | | |
| | |
Thrifts & Mortgage Finance—0.1% | | | | | | | |
Countrywide Financial Corp.
5.800%, 06/07/12 (a) | | | 625,000 | | | 609,158 | |
Nationwide Building Society (144A)
4.250%, 02/01/10 | | | 765,000 | | | 757,102 | |
| | | | | | | |
| | | | | | 1,366,260 | |
| | | | | | | |
| |
Wireless Telecommunication Services—0.5% | | | | |
America Movil S.A.B. de C.V.
6.375%, 03/01/35 | | | 325,000 | | | 275,604 | |
Cellco Partnership (144A)
8.500%, 11/15/18 | | | 2,100,000 | | | 2,460,522 | |
Rogers Communications, Inc.
7.500%, 03/15/15 | | | 385,000 | | | 381,199 | |
Sprint Nextel Corp.
6.000%, 12/01/16 | | | 1,100,000 | | | 775,500 | |
Vodafone Group, Plc.
7.750%, 02/15/10 | | | 2,570,000 | | | 2,626,578 | |
| | | | | | | |
| | | | | | 6,519,403 | |
| | | | | | | |
| | |
Yankee—0.0% | | | | | | | |
Compton Petroleum Finance Corp.
7.625%, 12/01/13 | | | 95,000 | | | 28,500 | |
| | | | | | | |
Total Fixed Income
(Identified Cost $1,696,162,492) | | | | | | 1,561,982,972 | |
| | | | | | | |
| |
| Short Term Investments—2.8% | | | | |
| | |
Mutual Funds—0.9% | | | | | | | |
State Street Navigator Securities Lending
Prime Portfolio (h) | | | 11,140,169 | | | 11,140,169 | |
| | | | | | | |
| | |
Repurchase Agreement—1.9% | | | | | | | |
State Street Repurchase Agreement dated 12/31/08 at 0.010% to be repurchased at $24,834,014 on 01/02/09, collateralized by $25,335,000 U.S. Treasury Bill due 02/19/09 with a value of $25,335,000. | | | 24,834,000 | | | 24,834,000 | |
| | | | | | | |
Total Short Term Investments
(Identified Cost $35,974,169) | | | | | | 35,974,169 | |
| | | | | | | |
Total Investments—122.9%
(Identified Cost $1,732,136,661) (i) | | | | | | 1,597,957,141 | |
Liabilities in excess of other assets | | | | | | (297,897,577 | ) |
| | | | | | | |
| Total Net Assets—100% | | | | | $ | 1,300,059,564 | |
| | | | | | | |
*See accompanying notes to financial statements.
MSF-10
Metropolitan Series Fund, Inc.
BlackRock Bond Income Portfolio
Schedule of Investments as of December 31, 2008
| (a) | A portion or all of the security was on loan. As of December 31, 2008, the market value of securities loaned was $ 10,898,969 and the collateral received consisted of cash in the amount of $11,140,169. The cash collateral is invested in a money market fund managed by an affiliate of the custodian. |
| (b) | Variable or Floating Rate Security. Rate disclosed is as of December 31, 2008. |
| (d) | Non-Income Producing; Defaulted Bond. |
| (e) | Interest Only Certificate. This security receives monthly interest payments but is not entitled to principal payments. |
| (f) | A portion or all of the security was pledged as collateral against open futures contracts. |
| (g) | Security was valued in good faith under procedures established by the Board of Directors. |
| (h) | Represents investment of cash collateral received from securities lending transactions. |
| (i) | The aggregate cost of investments for federal income tax purposes as of December 31, 2008 was $1,736,951,846 and the composition of unrealized appreciation and depreciation of investment securities was $39,282,812 and $(178,277,517), respectively. |
| (144A)— | Securities exempt from registration under Rule 144A of the Securities Act of 1933. These securities may be resold in transactions exempt from registration, normally to qualified institutional buyers. As of December 31, 2008, the market value of 144A securities was $49,991,058, which is 3.9% of total net assets. |
| (TBA)— | A contract for the purchase or sale of a Mortgage Backed Security to be delivered at a future date but does not include a specified pool or precise amount to be delivered. |
Forward Contracts
| | | | | | | | | | | | | | |
Forward Currency Contracts | | Delivery Date | | Local
Currency
Amount | | Aggregate
Face
Value | | Valuation as of
12/31/2008 | | Unrealized
Appreciation/
(Depreciation) | |
Euro (sold) | | 1/21/2009 | | 1,490,000 | | $ | 1,905,066 | | $ | 2,069,680 | | $ | (164,614 | ) |
Euro (sold) | | 1/21/2009 | | 3,154,000 | | | 4,005,612 | | | 4,381,055 | | | (375,443 | ) |
Japanese Yen (bought) | | 1/21/2009 | | 595,690,000 | | | 6,639,426 | | | 6,573,322 | | | (66,104 | ) |
Japanese Yen (sold) | | 1/21/2009 | | 1,799,066,000 | | | 17,985,984 | | | 19,852,339 | | | (1,866,355 | ) |
Mexican Peso (sold) | | 1/21/2009 | | 17,020,000 | | | 1,264,656 | | | 1,222,077 | | | 42,579 | |
Mexican Peso (sold) | | 1/21/2009 | | 183,849,000 | | | 14,335,205 | | | 13,200,804 | | | 1,134,401 | |
Pound Sterling (sold) | | 1/21/2009 | | 835,000 | | | 1,234,314 | | | 1,199,983 | | | 34,331 | |
Pound Sterling (sold) | | 1/21/2009 | | 860,000 | | | 1,290,113 | | | 1,235,910 | | | 54,203 | |
Pound Sterling (sold) | | 1/21/2009 | | 2,126,000 | | | 3,164,561 | | | 3,055,285 | | | 109,276 | |
| | | | | | | | | | | | | | |
Net Unrealized Depreciation | | $ | (1,097,727 | ) |
| | | | | | | | | | | | | | |
*See accompanying notes to financial statements.
MSF-11
Metropolitan Series Fund, Inc.
BlackRock Bond Income Portfolio
Schedule of Investments as of December 31, 2008
Futures Contracts
| | | | | | | | | | | | | | | | | |
Futures Contracts—Long | | Expiration Date | | Number of
Contracts | | | Contract
Amount | | | Valuation as of
12/31/2008 | | | Unrealized
Appreciation/
(Depreciation) | |
Eurodollar Futures | | 6/15/2009 | | 248 | | | $ | 60,251,830 | | | $ | 61,299,400 | | | $ | 1,047,570 | |
German Euro Bond Futures | | 3/6/2009 | | 149 | | | | 25,480,784 | | | | 25,856,527 | | | | 375,743 | |
UK Long GILT Bond Futures | | 3/27/2009 | | 160 | | | | 26,613,571 | | | | 28,403,047 | | | | 1,789,476 | |
U.S. Treasury Bond Futures | | 3/20/2009 | | 501 | | | | 65,147,487 | | | | 69,161,484 | | | | 4,013,997 | |
U.S. Treasury Notes 5 Year Futures | | 3/31/2009 | | 1,503 | | | | 175,713,681 | | | | 178,939,196 | | | | 3,225,515 | |
| | | | | |
Futures Contracts—Short | | | | | | | | | | | | | | |
U.S. Treasury Notes 2 Year Futures | | 3/31/2009 | | (258 | ) | | | (55,835,378 | ) | | | (56,260,125 | ) | | | (424,747 | ) |
U.S. Treasury Notes 10 Year Futures | | 3/20/2009 | | (913 | ) | | | (109,905,937 | ) | | | (114,809,750 | ) | | | (4,903,813 | ) |
| | | | | | | | | | | | | | | | | |
Net Unrealized Appreciation | | | $ | 5,123,741 | |
| | | | | | | | | | | | | | | | | |
TBA Sale Commitments
| | | | | | | | |
Federal Agencies | | Face
Amount | | | Value | |
Federal Home Loan Mortgage Corp. | | | | | | | | |
5.500% (15 Year TBA) | | $ | (27,800,000 | ) | | $ | (28,616,625 | ) |
Federal National Mortgage Association | | | | | | | | |
5.000% (30 Year TBA) | | | (60,100,000 | ) | | | (61,281,787 | ) |
5.500% (15 Year TBA) | | | (28,300,000 | ) | | | (29,140,170 | ) |
5.500% (30 Year TBA) | | | (104,900,000 | ) | | | (107,478,125 | ) |
6.000% (30 Year TBA) | | | (14,600,000 | ) | | | (15,028,875 | ) |
Government National Mortgage Association | | | | | | | | |
5.500% (30 Year TBA) | | | (13,600,000 | ) | | | (14,003,757 | ) |
6.500% (30 Year TBA) | | | (10,600,000 | ) | | | (11,003,444 | ) |
| | | | | | | | |
Total TBA Sale Commitments (Proceeds Cost $(263,771,192)) | | | $ | (266,552,783 | ) |
| | | | | | | | |
The Portfolio adopted the provisions of Statement of Financial Accounting Standards No. 157, “Fair Value Measurements” (FAS 157), effective with the beginning of the Portfolio’s fiscal year. FAS 157 establishes a framework for measuring fair value and expands disclosures about fair value measurements in financial statements. The three levels of the hierarchy under FAS 157 are described below:
Level 1 - quoted prices in active markets for identical securities
Level 2 - other significant observable inputs (including quoted prices for similar securities, interest rates, credit risk, etc.)
Level 3 - significant unobservable inputs (including the Portfolio’s own assumptions in determining the fair value of investments)
The inputs or methodology used for valuing securities are not necessarily an indication of the risk associated with investing in those securities.
The following is a summary of the inputs used to value the Portfolio’s net assets as of December 31, 2008:
| | | | | | | | | | | |
| Valuation Inputs | | Investments In
Securities | | TBA Sale
Commitments | | | Other Financial
Instruments* | |
Level 1 - Quoted Prices | | $ | 42,792,937 | | $ | 0 | | | $ | 5,123,741 | |
Level 2 - Other Significant Observable Inputs | | | 1,555,164,204 | | | (266,552,783 | ) | | | (1,097,727 | ) |
Level 3 - Significant Unobservable Inputs | | | 0 | | | 0 | | | | 0 | |
Total | | $ | 1,597,957,141 | | $ | (266,552,783 | ) | | $ | 4,026,014 | |
* Other financial instruments are derivative instruments not reflected in the Schedule of Investments, such as futures, forwards, swap contracts and written options, which are valued based on the unrealized appreciation/depreciation on the instrument.
*See accompanying notes to financial statements.
MSF-12
Metropolitan Series Fund, Inc.
BlackRock Bond Income Portfolio
Statement of Assets & Liabilities
December 31, 2008
| | | | | | | |
Assets | | | | | | | |
Investments at value (a) (b) | | | | | $ | 1,597,957,141 | |
Cash | | | | | | 27,023 | |
Foreign cash at value (c) | | | | | | 607,429 | |
Receivable for: | | | | | | | |
Securities sold | | | | | | 616,721,949 | |
Fund shares sold | | | | | | 375,671 | |
Open forward currency contracts—net | | | | | | 898,912 | |
Accrued interest and dividends | | | | | | 11,967,681 | |
Foreign taxes | | | | | | 87,052 | |
| | | | | | | |
Total Assets | | | | | | 2,228,642,858 | |
Liabilities | | | | | | | |
TBA sales commitments at value (d) | | $ | 266,552,783 | | | | |
Payable for: | | | | | | | |
Securities purchased | | | 641,448,869 | | | | |
Fund shares redeemed | | | 5,088,164 | | | | |
Futures variation margin | | | 965,113 | | | | |
Open forward currency contracts—net | | | 1,996,639 | | | | |
Collateral for securities loaned | | | 11,140,169 | | | | |
Interest (Short) | | | 801,471 | | | | |
Accrued expenses: | | | | | | | |
Management fees | | | 418,957 | | | | |
Service and distribution fees | | | 88,927 | | | | |
Deferred directors’ fees | | | 30,170 | | | | |
Other expenses | | | 52,032 | | | | |
| | | | | | | |
Total Liabilities | | | | | | 928,583,294 | |
| | | | | | | |
Net Assets | | | | | $ | 1,300,059,564 | |
| | | | | | | |
Net assets consists of: | | | | | | | |
Capital paid in | | | | | $ | 1,380,979,344 | |
Undistributed net investment income | | | | | | 90,221,418 | |
Accumulated net realized losses | | | | | | (38,156,032 | ) |
Unrealized depreciation on investments, futures contracts, and foreign currency | | | | | | (132,985,166 | ) |
| | | | | | | |
Net Assets | | | | | $ | 1,300,059,564 | |
| | | | | | | |
| Computation of offering price: | | | | | | | |
Class A | | | | | | | |
Net asset value and redemption price per share ($784,261,882 divided by 7,650,927 shares outstanding) | | | | | $ | 102.51 | |
| | | | | | | |
Class B | | | | | | | |
Net asset value and redemption price per share ($279,253,658 divided by 2,758,544 shares outstanding) | | | | | $ | 101.23 | |
| | | | | | | |
Class E | | | | | | | |
Net asset value and redemption price per share ($236,544,024 divided by 2,323,838 shares outstanding) | | | | | $ | 101.79 | |
| | | | | | | |
(a) Identified cost of investments | | | | | $ | 1,732,136,661 | |
| | | | | | | |
(b) Includes cash collateral for securities loaned of | | | | | $ | 11,140,169 | |
| | | | | | | |
(c) Identified cost of foreign cash | | | | | $ | 633,610 | |
| | | | | | | |
(d) Proceeds of TBA sales commitments | | | | | $ | 263,771,192 | |
| | | | | | | |
Statement of Operations
For the Year Ended December 31, 2008
| | | | | | | | |
Investment Income | | | | | | | | |
Dividends | | | | | | $ | 900,702 | |
Interest | | | | | | | 87,763,744 | (a) |
| | | | | | | | |
| | | | | | | 88,664,446 | |
Expenses | | | | | | | | |
Management fees | | $ | 5,764,854 | | | | | |
Service and distribution fees—Class B | | | 774,028 | | | | | |
Service and distribution fees—Class E | | | 422,508 | | | | | |
Directors’ fees and expenses | | | 30,834 | | | | | |
Custodian | | | 216,968 | | | | | |
Audit and tax services | | | 34,791 | | | | | |
Legal | | | 16,610 | | | | | |
Printing | | | 281,397 | | | | | |
Insurance | | | 19,085 | | | | | |
Miscellaneous | | | 23,567 | | | | | |
| | | | | | | | |
Total expenses | | | 7,584,642 | | | | | |
Management fee waivers | | | (126,061 | ) | | | 7,458,581 | |
| | | | | | | | |
Net Investment Income | | | | | | | 81,205,865 | |
| | | | | | | | |
Realized and Unrealized Gain (Loss) | | | | | | | | |
| Realized gain on: | | | | | | | | |
Investments—net | | | 1,472,839 | | | | | |
Futures contracts—net | | | 7,195,903 | | | | | |
Foreign currency transactions—net | | | 5,550,804 | | | | | |
Options—net | | | 1,267,159 | | | | 15,486,705 | |
| | | | | | | | |
| Change in unrealized appreciation (depreciation) on: | | | | | | | | |
Investments—net | | | (155,493,477 | ) | | | | |
Futures contracts—net | | | 4,598,824 | | | | | |
Foreign currency transactions—net | | | (1,901,258 | ) | | | | |
Options—net | | | (20,871 | ) | | | (152,816,782 | ) |
| | | | | | | | |
Net loss | | | | | | | (137,330,077 | ) |
| | | | | | | | |
Net Decrease in Net Assets From Operations | | | | | | $ | (56,124,212 | ) |
| | | | | | | | |
| (a) | Includes income on securities loaned of $233,213. |
See accompanying notes to financial statements.
MSF-13
Metropolitan Series Fund, Inc.
BlackRock Bond Income Portfolio
Statements of Changes in Net Assets
| | | | | | | | |
| | | Year ended
December 31,
2008 | | | Year ended
December 31,
2007 | |
From Operations | | | | | | | | |
Net investment income | | $ | 81,205,865 | | | $ | 76,717,556 | |
Net realized gain (loss) | | | 15,486,705 | | | | (11,842,631 | ) |
Change in unrealized appreciation (depreciation) | | | (152,816,782 | ) | | | 30,416,968 | |
| | | | | | | | |
Increase (decrease) in net assets from operations | | | (56,124,212 | ) | | | 95,291,893 | |
| | | | | | | | |
From Distributions to Shareholders | | | | | | | | |
Net investment income | | | | | | | | |
Class A | | | (48,466,756 | ) | | | (31,735,232 | ) |
Class B | | | (14,964,604 | ) | | | (8,796,845 | ) |
Class E | | | (14,665,783 | ) | | | (9,494,875 | ) |
| | | | | | | | |
Total distributions | | | (78,097,143 | ) | | | (50,026,952 | ) |
| | | | | | | | |
Decrease in net assets from capital share transactions | | | (171,181,743 | ) | | | (3,850,293 | ) |
| | | | | | | | |
Net increase (decrease) in net assets | | | (305,403,098 | ) | | | 41,414,648 | |
| | |
Net Assets | | | | | | | | |
Beginning of the period | | | 1,605,462,662 | | | | 1,564,048,014 | |
| | | | | | | | |
End of the period | | $ | 1,300,059,564 | | | $ | 1,605,462,662 | |
| | | | | | | | |
Undistributed Net Investment Income | | | | | | | | |
End of the period | | $ | 90,221,418 | | | $ | 77,250,999 | |
| | | | | | | | |
Other Information:
Capital Shares
Transactions in capital shares were as follows:
| | | | | | | | | | | | | | |
| | | Year ended
December 31, 2008 | | | Year ended
December 31, 2007 | |
| | | Shares | | | $ | | | Shares | | | $ | |
Class A | | | | | | | | | | | | | | |
Sales | | 1,097,076 | | | $ | 116,901,330 | | | 1,687,659 | | | $ | 182,728,894 | |
Reinvestments | | 454,319 | | | | 48,466,756 | | | 296,508 | | | | 31,735,232 | |
Redemptions | | (2,706,085 | ) | | | (283,431,663 | ) | | (2,042,297 | ) | | | (221,110,438 | ) |
| | | | | | | | | | | | | | |
Net decrease | | (1,154,690 | ) | | $ | (118,063,577 | ) | | (58,130 | ) | | $ | (6,646,312 | ) |
| | | | | | | | | | | | | | |
Class B | | | | | | | | | | | | | | |
Sales | | 507,058 | | | $ | 53,473,821 | | | 741,024 | | | $ | 79,187,847 | |
Reinvestments | | 141,791 | | | | 14,964,604 | | | 83,028 | | | | 8,796,845 | |
Redemptions | | (750,450 | ) | | | (77,571,198 | ) | | (687,193 | ) | | | (73,627,604 | ) |
| | | | | | | | | | | | | | |
Net increase (decrease) | | (101,601 | ) | | $ | (9,132,773 | ) | | 136,859 | | | $ | 14,357,088 | |
| | | | | | | | | | | | | | |
Class E | | | | | | | | | | | | | | |
Sales | | 358,685 | | | $ | 38,598,665 | | | 409,838 | | | $ | 44,043,744 | |
Reinvestments | | 138,291 | | | | 14,665,783 | | | 89,212 | | | | 9,494,875 | |
Redemptions | | (931,005 | ) | | | (97,249,841 | ) | | (604,310 | ) | | | (65,099,688 | ) |
| | | | | | | | | | | | | | |
Net decrease | | (434,029 | ) | | $ | (43,985,393 | ) | | (105,260 | ) | | $ | (11,561,069 | ) |
| | | | | | | | | | | | | | |
Decrease derived from capital share transactions | | | | | $ | (171,181,743 | ) | | | | | $ | (3,850,293 | ) |
| | | | | | | | | | | | | | |
See accompanying notes to financial statements.
MSF-14
Metropolitan Series Fund, Inc.
BlackRock Bond Income Portfolio
Financial Highlights
| | | | | | | | | | | | | | | | | | | | |
| | | Class A | |
| | | Year ended December 31, | |
| | | 2008 | | | 2007 | | | 2006 | | | 2005 | | | 2004 | |
Net Asset Value, Beginning of Period | | $ | 111.71 | | | $ | 108.62 | | | $ | 110.48 | | | $ | 113.72 | | | $ | 115.62 | |
| | | | | | | | | | | | | | | | | | | | |
Income From Investment Operations | | | | | | | | | | | | | | | | | | | | |
Net investment income | | | 5.82 | (a) | | | 5.36 | (a) | | | 4.55 | | | | 4.69 | | | | 4.44 | |
Net realized and unrealized gain (loss) of investments | | | (9.42 | ) | | | 1.31 | | | | 0.01 | | | | (2.06 | ) | | | 0.41 | |
| | | | | | | | | | | | | | | | | | | | |
Total from investment operations | | | (3.60 | ) | | | 6.67 | | | | 4.56 | | | | 2.63 | | | | 4.85 | |
| | | | | | | | | | | | | | | | | | | | |
Less Distributions | | | | | | | | | | | | | | | | | | | | |
Distributions from net investment income | | | (5.60 | ) | | | (3.58 | ) | | | (6.31 | ) | | | (4.55 | ) | | | (4.76 | ) |
Distributions from net realized capital gains | | | 0.00 | | | | 0.00 | | | | (0.11 | ) | | | (1.32 | ) | | | (1.99 | ) |
| | | | | | | | | | | | | | | | | | | | |
Total distributions | | | (5.60 | ) | | | (3.58 | ) | | | (6.42 | ) | | | (5.87 | ) | | | (6.75 | ) |
| | | | | | | | | | | | | | | | | | | | |
Net Asset Value, End of Period | | $ | 102.51 | | | $ | 111.71 | | | $ | 108.62 | | | $ | 110.48 | | | $ | 113.72 | |
| | | | | | | | | | | | | | | | | | | | |
Total Return (%) | | | (3.4 | ) | | | 6.3 | | | | 4.4 | | | | 2.4 | | | | 4.4 | |
Ratio of operating expenses to average net assets (%) | | | 0.42 | | | | 0.43 | | | | 0.46 | | | | 0.47 | | | | 0.46 | |
Ratio of operating expenses to average net assets without giving effect to the contractual expense agreement would have been (%) (b) | | | 0.43 | | | | 0.43 | | | | N/A | | | | N/A | | | | N/A | |
Ratio of net investment income to average net assets (%) | | | 5.48 | | | | 4.95 | | | | 4.28 | | | | 3.96 | | | | 3.57 | |
Portfolio turnover rate (%) | | | 1,014 | | | | 931 | | | | 503 | | | | 890 | | | | 458 | |
Net assets, end of period (000) | | $ | 784,262 | | | $ | 983,686 | | | $ | 962,770 | | | $ | 763,205 | | | $ | 814,560 | |
| | | | | | | | | | | | | | | | | | | | |
| | | Class B | |
| | | Year ended December 31, | |
| | | 2008 | | | 2007 | | | 2006 | | | 2005 | | | 2004 | |
Net Asset Value, Beginning of Period | | $ | 110.39 | | | $ | 107.36 | | | $ | 109.20 | | | $ | 112.47 | | | $ | 114.51 | |
| | | | | | | | | | | | | | | | | | | | |
Income From Investment Operations | | | | | | | | | | | | | | | | | | | | |
Net investment income | | | 5.49 | (a) | | | 5.03 | (a) | | | 4.54 | | | | 4.06 | | | | 3.78 | |
Net realized and unrealized gain (loss) of investments | | | (9.32 | ) | | | 1.30 | | | | (0.32 | ) | | | (1.72 | ) | | | 0.73 | |
| | | | | | | | | | | | | | | | | | | | |
Total from investment operations | | | (3.83 | ) | | | 6.33 | | | | 4.22 | | | | 2.34 | | | | 4.51 | |
| | | | | | | | | | | | | | | | | | | | |
Less Distributions | | | | | | | | | | | | | | | | | | | | |
Distributions from net investment income | | | (5.33 | ) | | | (3.30 | ) | | | (5.95 | ) | | | (4.29 | ) | | | (4.56 | ) |
Distributions from net realized capital gains | | | 0.00 | | | | 0.00 | | | | (0.11 | ) | | | (1.32 | ) | | | (1.99 | ) |
| | | | | | | | | | | | | | | | | | | | |
Total distributions | | | (5.33 | ) | | | (3.30 | ) | | | (6.06 | ) | | | (5.61 | ) | | | (6.55 | ) |
| | | | | | | | | | | | | | | | | | | | |
Net Asset Value, End of Period | | $ | 101.23 | | | $ | 110.39 | | | $ | 107.36 | | | $ | 109.20 | | | $ | 112.47 | |
| | | | | | | | | | | | | | | | | | | | |
Total Return (%) | | | (3.7 | ) | | | 6.0 | | | | 4.1 | | | | 2.2 | | | | 4.2 | |
Ratio of operating expenses to average net assets (%) | | | 0.67 | | | | 0.68 | | | | 0.71 | | | | 0.72 | | | | 0.71 | |
Ratio of operating expenses to average net assets without giving effect to the contractual expense agreement would have been (%) (b) | | | 0.68 | | | | 0.68 | | | | N/A | | | | N/A | | | | N/A | |
Ratio of net investment income to average net assets (%) | | | 5.24 | | | | 4.70 | | | | 4.04 | | | | 3.73 | | | | 3.35 | |
Portfolio turnover rate (%) | | | 1,014 | | | | 931 | | | | 503 | | | | 890 | | | | 458 | |
Net assets, end of period (000) | | $ | 279,254 | | | $ | 315,737 | | | $ | 292,377 | | | $ | 235,057 | | | $ | 143,107 | |
| Please | see following page for Financial Highlights footnote legend. |
See accompanying notes to financial statements.
MSF-15
Metropolitan Series Fund, Inc.
BlackRock Bond Income Portfolio
Financial Highlights
| | | | | | | | | | | | | | | | | | | | |
| | | Class E | |
| | | Year ended December 31, | |
| | | 2008 | | | 2007 | | | 2006 | | | 2005 | | | 2004 | |
Net Asset Value, Beginning of Period | | $ | 110.97 | | | $ | 107.89 | | | $ | 109.73 | | | $ | 112.97 | | | $ | 114.98 | |
| | | | | | | | | | | | | | | | | | | | |
Income From Investment Operations | | | | | | | | | | | | | | | | | | | | |
Net investment income | | | 5.63 | (a) | | | 5.16 | (a) | | | 7.07 | | | | 4.34 | | | | 3.52 | |
Net realized and unrealized gain (loss) of investments | | | (9.37 | ) | | | 1.31 | | | | (2.71 | ) | | | (1.89 | ) | | | 1.12 | |
| | | | | | | | | | | | | | | | | | | | |
Total from investment operations | | | (3.74 | ) | | | 6.47 | | | | 4.36 | | | | 2.45 | | | | 4.64 | |
| | | | | | | | | | | | | | | | | | | | |
Less Distributions | | | | | | | | | | | | | | | | | | | | |
Distributions from net investment income | | | (5.44 | ) | | | (3.39 | ) | | | (6.09 | ) | | | (4.37 | ) | | | (4.66 | ) |
Distributions from net realized capital gains | | | 0.00 | | | | 0.00 | | | | (0.11 | ) | | | (1.32 | ) | | | (1.99 | ) |
| | | | | | | | | | | | | | | | | | | | |
Total distributions | �� | | (5.44 | ) | | | (3.39 | ) | | | (6.20 | ) | | | (5.69 | ) | | | (6.65 | ) |
| | | | | | | | | | | | | | | | | | | | |
Net Asset Value, End of Period | | $ | 101.79 | | | $ | 110.97 | | | $ | 107.89 | | | $ | 109.73 | | | $ | 112.97 | |
| | | | | | | | | | | | | | | | | | | | |
Total Return (%) | | | (3.6 | ) | | | 6.1 | | | | 4.3 | | | | 2.3 | | | | 4.3 | |
Ratio of operating expenses to average net assets (%) | | | 0.57 | | | | 0.58 | | | | 0.61 | | | | 0.62 | | | | 0.61 | |
Ratio of operating expenses to average net assets without giving effect to the contractual expense agreement would have been (%) (b) | | | 0.58 | | | | 0.58 | | | | N/A | | | | N/A | | | | N/A | |
Ratio of net investment income to average net assets (%) | | | 5.33 | | | | 4.79 | | | | 4.16 | | | | 3.81 | | | | 3.44 | |
Portfolio turnover rate (%) | | | 1,014 | | | | 931 | | | | 503 | | | | 890 | | | | 458 | |
Net assets, end of period (000) | | $ | 236,544 | | | $ | 306,040 | | | $ | 308,901 | | | $ | 64,396 | | | $ | 65,275 | |
| (a) | Per share amount is based on average shares outstanding during the period. |
| (b) | See Note 4 of the Notes to Financial Statements. |
See accompanying notes to financial statements.
MSF-16
Metropolitan Series Fund, Inc.
BlackRock Bond Income Portfolio
Notes to Financial Statements—December 31, 2008
Metropolitan Series Fund, Inc. (the “Fund”) is organized as a corporation under the laws of Maryland pursuant to Articles of Incorporation filed on November 23, 1982, as amended, and registered under the Investment Company Act of 1940, as amended (the “1940 Act”), as an open-end investment company. The Fund is a “series” type of mutual fund, which issues separate series of stock. Each series represents an interest in a separate portfolio of Fund investments. The BlackRock Bond Income Portfolio (the “Portfolio”) is a diversified series of the Fund. Shares in the Fund are not offered directly to the general public and are currently available only to separate accounts established by Metropolitan Life Insurance Company (“MetLife”), New England Life Insurance Company, General American Life Insurance Company (“General American”), The MetLife Investors Group of Insurance Companies, MetLife Insurance Company of Connecticut and other affiliated insurance companies (collectively, the “Insurance Companies”) and to certain eligible qualified retirement plans (“Qualified Plans”), as an investment vehicle for variable life insurance, group annuity or variable annuity products of these insurance companies or Qualified Plans, although the Portfolio is not available to all such separate accounts and Qualified Plans. The Portfolio’s shares may be divided into different classes. Currently, the classes being offered by the Portfolio are named Class A, Class B and Class E. The classes of the Portfolio’s shares are identical, except that certain additional charges (Rule 12b-1 fees) are made against Class B and Class E shares. Investment income, realized and unrealized capital gains and losses, the common expenses of the Portfolio and certain Portfolio-level expense reductions, if any, are allocated daily, on a pro rata basis, to each class based on the relative net assets of each class to the total net assets of the Portfolio.
| 2. | SIGNIFICANT ACCOUNTING POLICIES: |
The preparation of financial statements in conformity with accounting principles generally accepted in the United States of America (“GAAP”) requires management to make estimates and assumptions that affect the reported amounts of assets and liabilities and disclosure of contingent assets and liabilities as of the date of the financial statements and the reported amounts of income and expenses during the reporting period. Actual results could differ from those estimates.
The following is a summary of significant accounting policies consistently followed by the Portfolio in the preparation of its financial statements. The policies are in conformity with GAAP.
Investment Valuation:
Debt securities (other than short term obligations with a remaining maturity of sixty days or less) are generally valued on the basis of evaluated or composite bid quotations obtained by independent pricing services and/or brokers and dealers selected by the relevant subadviser pursuant to authorization of the Board of Directors of the Fund (the “Board” or “Directors”). Such quotations take into account appropriate factors such as institutional-sized trading in similar groups of securities, yield, quality, coupon rate, maturity, type of issue, trading characteristics and other data. Short term obligations with a remaining maturity of sixty days or less are valued at amortized cost which approximates fair market value.
Equity securities traded on a national securities exchange or other exchanges are valued at their last sale price on the principal trading market. Equity securities traded on the NASDAQ National Market System are valued at the NASDAQ Official Closing Price (the “NOCP”). The NOCP is the last reported sale price if the last reported sale price falls between the spread of the last reported bid and asked prices. If the last reported bid and asked prices are above the last reported sale price, the NOCP will be the last reported bid price. If the last reported bid and asked prices are below the last reported sale price, the NOCP will be the last reported asked price. Equity securities traded on a national securities exchange or other exchanges or on the NASDAQ National Market System for which there is no reported sale during the day are valued at the last reported bid price. A security that is listed or traded on more than one exchange is valued at the quotation on the exchange determined to be the primary market for that security by the Board or its delegates. If no closing price is available, then such securities are valued by using the last reported bid price. Equity securities traded over-the-counter are valued at the last reported sales price.
If no current market value quotation is readily available or reliable for a portfolio security, fair value will be determined in accordance with procedures established by and under the general supervision of the Board. When the Portfolio uses fair value pricing, it may take into account any factors it deems appropriate. The value of securities used by the Portfolio to calculate its net asset value may differ from quoted or published prices for the same securities. Fair value pricing involves subjective judgments and the fair value determined for a security may be materially different than the value that could be realized upon the sale of that security.
The Portfolio expects to use fair value pricing for securities primarily traded on U.S. exchanges only under very limited circumstances. For example, the Portfolio may use fair value pricing if the exchange on which a security is traded closes early or trading in the security is suspended.
MSF-17
Metropolitan Series Fund, Inc.
BlackRock Bond Income Portfolio
Notes to Financial Statements—December 31, 2008—(Continued)
Securities traded primarily on an exchange outside of the United States, which closes before the close of the New York Stock Exchange, will be valued at the last sales price on that non-U.S. exchange. Securities traded primarily on an exchange outside of the United States for which there is no reported sale during the day are valued at the mean between the last reported bid and asked prices. However, because most foreign markets close well before the Portfolio values its securities (typically at 4 p.m. Eastern Time), the earlier close of these foreign markets gives rise to the possibility that significant events, including broad market moves, may have occurred after these foreign markets close but before the Portfolio values its securities. To account for this, the Portfolio may frequently value many of its foreign equity securities using fair value prices based on third party vendor modeling tools.
Forward foreign currency exchange contracts are valued based on the mean between closing bid and asked prices of the forward currency contract rates in the London foreign exchange markets on a daily basis as provided by a reliable bank or dealer.
Options, whether on securities, indices, futures contracts, or otherwise, are valued at the last sales price available as of the close of business on the day of valuation or, if there is no such sale price available, at the mean between the bid and asked prices. Options on currencies are valued at the spot price each day.
The value of futures contracts will be the sum of the margin deposit plus or minus the difference between the value of the futures contract on each day the net asset value is calculated and the value on the date the futures contract originated, value being that established on a recognized commodity exchange, or by reference to other customary sources, with gain or loss being realized when the futures contract closes or expires.
Subject to the Board’s oversight, the Board has delegated the day-to-day oversight of pricing matters, including determinations in good faith under the Fund’s procedures the fair value of securities for which current market quotations are not readily available to the subadviser of the Portfolio.
Investment Transactions and Related Investment Income:
Portfolio security transactions are recorded on the trade date. Dividend income is recorded on the ex-dividend date or, for certain foreign securities, when notified. Interest income, which includes amortization of premium and accretion of discount on debt securities, is recorded on the accrual basis. Realized gains and losses on investments and unrealized appreciation and depreciation are determined on the identified cost basis, which is the same basis used for federal income tax purposes.
Repurchase Agreements:
The Portfolio, through the custodian or a subcustodian, receives delivery of the underlying securities collateralizing repurchase agreements. The Portfolio requires the custodian to take possession, to have legally segregated in the Federal Reserve Book Entry System, or to have segregated within the custodian’s vault, all securities held as collateral for repurchase agreements. It is the Portfolio’s policy that the market value of the collateral be at least equal to 100% of the repurchase price in the case of a repurchase agreement of one-day duration and 102% on all other repurchase agreements. The Portfolio’s subadviser is responsible for determining that the value of the collateral is at all times at least equal to the repurchase price. In connection with transactions in repurchase agreements, if the seller defaults and the value of the collateral declines or if the seller enters an insolvency proceeding, realization of the collateral by the Portfolio may be delayed, limited or wholly denied.
Foreign Currency Translation:
The books and records of the Portfolio are maintained in U.S. dollars. The values of securities, currencies and other assets and liabilities denominated in currencies other than U.S. dollars are translated into U.S. dollars based upon foreign exchange rates prevailing at the end of the period. Purchases and sales of investment securities, income and expenses are translated on the respective dates of such transactions. Since the values of investment securities are presented at the foreign exchange rates prevailing at the end of the period, it is not practical to isolate that portion of the results of operations arising from changes in exchange rates from that portion of the results of operations reflecting fluctuations arising from changes in market prices of the investment securities. Such fluctuations are included in the net realized and unrealized gain or loss on investments.
Net realized foreign exchange gains or losses arise from sales of foreign currency, currency gains or losses realized between the trade and settlement dates on securities transactions, and the difference between the amounts of dividends, interest, and foreign withholding taxes recorded by the Portfolio and the U.S. dollar equivalent of the amounts actually received or paid by the Portfolio. Net unrealized foreign exchange gains and losses arise from changes in the value of assets and liabilities, other than investment securities, resulting from changes in the exchange rate.
MSF-18
Metropolitan Series Fund, Inc.
BlackRock Bond Income Portfolio
Notes to Financial Statements—December 31, 2008—(Continued)
Forward Foreign Currency Exchange Contracts:
The Portfolio may enter into forward foreign currency exchange contracts primarily to hedge against foreign currency exchange rate risks on its non-U.S. dollar denominated investment securities. When entering into a forward currency contract, the Portfolio agrees to receive or deliver a fixed quantity of foreign currency for an agreed-upon price on an agreed future date. These contracts are valued daily and the Portfolio’s net equity therein, representing unrealized gain or loss on the contracts as measured by the difference between the foreign exchange rates at the dates of entry into the contracts and the forward rates at the settlement date, is included in the Statement of Assets and Liabilities. Realized and unrealized gains and losses are included in the Statement of Operations. These instruments involve market and/or credit risk in excess of the amount recognized in the Statement of Assets and Liabilities. Risks arise from the possible inability of counterparties to meet the terms of their contracts and from movement in currency and securities values and interest rates.
Futures Contracts:
The Portfolio may buy and sell futures contracts (on recognized exchanges) as a hedge, to maintain exposure to the broad market or to enhance return. Futures contracts are agreements to buy or sell a security, or deliver a final cash settlement price in connection with an index, interest rate, currency, or other contracts not calling for physical delivery, for a set price in the future. The Portfolio must post an amount equal to a portion of the total market value of the futures contract as futures variation margin, which is returned when the Portfolio’s obligations under the contract have been satisfied. From time to time thereafter, the Portfolio may have to post variation margin to maintain this amount as the market value of the contract fluctuates. Risks of entering into futures contracts (and related options) include the possibility that there may be an illiquid market and that a change in the value of the contract or option may not correlate with changes in the value of the underlying securities.
Options:
The Portfolio may use options to hedge against changes in values of securities the Portfolio owns or expects to purchase, to maintain exposure to the broad market or to enhance return. Writing puts or buying calls tends to increase the Portfolio’s exposure to the underlying instrument and writing calls or buying puts tends to decrease the Portfolio’s exposure to the underlying instrument, and can be used to hedge other Portfolio investments. For options purchased to hedge the Portfolio’s investments, the potential risk to the Portfolio is that the change in value of options contracts may not correspond to the change in value of the hedged instruments. In addition, losses may arise from changes in the value of the underlying instruments, if there is an illiquid secondary market, or if the counterparty is unable to perform. The maximum loss for purchased options is limited to the premium initially paid for the option. For options written by the Portfolio, the maximum loss is not limited to the premium initially received for the option.
The main risk associated with purchasing an option is that the option expires without being exercised. In this case, the option expires worthless and the premium paid for the option is considered the loss. The risk associated with writing a call option is that the Portfolio may forgo the opportunity for a profit if the market value of the underlying position increases and the option is exercised. The risk in writing a put option is that the Portfolio may incur a loss if the market value of the underlying position decreases and the option is exercised. In addition, the Portfolio risks not being able to enter into a closing transaction for the written option as the result of an illiquid market.
Mortgage Dollar Rolls:
The Portfolio may enter into mortgage “dollar rolls” in which a Portfolio sells mortgage-backed securities for delivery in the current month and simultaneously contracts to repurchase substantially similar (same type, coupon and maturity) securities on a specified future date. Dollar rolls are accounted for as purchase and sale transactions; gain/loss is recognized at the end of the term of the dollar roll. The average monthly balance of dollar rolls outstanding during the year ended December 31, 2008 was $1,065,012,205.
A Portfolio that enters into mortgage dollar rolls is subject to the risk that the market value of the securities the Portfolio is obligated to repurchase under the agreement may decline below the repurchase price. In the event the buyer of securities under a mortgage dollar roll files for bankruptcy or becomes insolvent, the Portfolio’s use of proceeds from the dollar roll may be restricted pending a court determination, a determination by the other party, or its trustee or receiver, whether to enforce the Portfolio’s obligation to repurchase the securities.
MSF-19
Metropolitan Series Fund, Inc.
BlackRock Bond Income Portfolio
Notes to Financial Statements—December 31, 2008—(Continued)
“When-Issued” Securities:
Purchasing securities “when-issued” is a forward commitment by the Portfolio to buy a security. The estimated amount of the Portfolio’s payment obligation and the security’s interest rate are determined when the commitment is made, even though no interest accrues until the security is issued, which is generally 15 to 120 days later. The Portfolio will segregate liquid assets with its custodian sufficient at all times to satisfy these commitments. If the value of the security is less when delivered than when the commitment was made, the Portfolio will suffer a loss.
High Yield Securities:
The Portfolio may invest in high yield instruments that are subject to certain credit and market risks. The yields of high yield instruments reflect, among other things, perceived credit risk. The Portfolio’s investments in securities rated below investment grade typically involve risks not associated with higher rated securities including, among others, greater risk related to timely and ultimate payment of interest and principal, greater market price volatility and less liquid secondary market trading.
Mortgage-Backed Securities:
The Portfolio invests a significant portion of its assets in securities of issuers that hold mortgage and asset backed securities and direct investments in securities backed by commercial and residential mortgage loans and other financial assets. The value and related income of these securities are sensitive to changes in economic conditions, including delinquencies and/or defaults. Continuing shifts in the market’s perception of credit quality on securities backed by commercial and residential mortgage loans and other financial assets may result in increased volatility of market price and periods of illiquidity that can negatively impact the valuation of certain issuers held by the Portfolio. At December 31, 2008, the Portfolio held securities of issuers that hold mortgage and asset backed securities and direct investments in mortgage and asset backed securities (excluding federal agencies) with an aggregate value of $368,350,122 (representing 28.3% of the Portfolio’s total net assets).
TBA Purchase & Sale Commitments:
The Portfolio may enter into to-be-announced (“TBA”) commitments to purchase or sell securities for a fixed price at a future date. TBA commitments are considered securities in themselves, and involve a risk of loss if the value of the security to be purchased or sold declines or increases prior to settlement date, which is in addition to the risk of decline in the value of the Portfolio’s other assets. Unsettled TBA commitments are valued at the current market value of the underlying securities, according to the procedures described under “Investment Valuation”.
Federal Income Taxes:
It is the Portfolio’s policy to comply with the requirements of the Internal Revenue Code of 1986, as amended (the “Code”), and regulations thereunder, applicable to regulated investment companies and to distribute, with respect to each taxable year, all of its taxable income to shareholders. Therefore, no federal income tax provision is required. The Portfolio is subject to the provisions of the Financial Accounting Standards Board Interpretation (“FASB”) No. 48, Accounting for Uncertainties in Income Taxes (FIN 48). FIN 48 sets forth a minimum threshold for financial statement recognition of the benefit of a tax position taken or expected to be taken in a tax return. The implementation of FIN 48 did not result in any unrecognized tax benefits in the accompanying financial statements. Each of the Portfolio’s federal tax returns for the prior three fiscal years remains subject to examination by the Internal Revenue Service.
As of December 31, 2008, the Portfolio had capital loss carryforwards as follows:
| | | | | | | | | | | | | |
Expiring
12/31/15 | | Expiring
12/31/14 | | Expiring
12/31/13 | | Expiring
12/31/12 | | Total |
| $ | 13,263,486 | | $ | 11,623,394 | | $ | 3,820,752 | | $ | 1,674,692 | | $ | 30,382,324 |
MSF-20
Metropolitan Series Fund, Inc.
BlackRock Bond Income Portfolio
Notes to Financial Statements—December 31, 2008—(Continued)
Pursuant to Section 852 of the Code, the Portfolio designated the amount shown below under Long Term Gain as capital gain dividends for its taxable year ended December 31, 2008. The tax character of distributions paid for the periods ended December 31, 2008 and 2007 was as follows:
| | | | | | | | | | | | | | | | | | | | | | |
| Ordinary Income | | Long Term Gain | | Return of Capital | | Total |
| 2008 | | 2007 | | 2008 | | 2007 | | 2008 | | 2007 | | 2008 | | 2007 |
| $ | 78,097,143 | | $ | 50,026,952 | | $ | — | | $ | — | | $ | — | | $ | — | | $ | 78,097,143 | | $ | 50,026,952 |
As of December 31, 2008, the components of distributable earnings (accumulated losses) on a federal income tax basis were as follows:
| | | | | | | | | | | | | | | | |
Undistributed
Ordinary
Income | | Undistributed
Long Term
Gain | | Unrealized
Depreciation | | | Loss
Carryforwards | | | Total | |
| $ | 89,134,460 | | $ | — | | $ | (139,661,148 | ) | | $ | (30,382,324 | ) | | $ | (80,909,012 | ) |
Dividends and Distributions to Shareholders:
The Portfolio records dividends and distributions on the ex-dividend date. Net realized gains from security transactions (if any) are generally distributed annually to shareholders. The timing and characterization of certain income and capital gains distributions are determined in accordance with federal tax regulations that may differ from GAAP. Permanent book and tax basis differences relating to shareholder distributions will result in reclassification between under/over distributed net investment income, accumulated net realized gains/losses and paid in capital.
| 3. | INVESTMENT TRANSACTIONS: |
For the year ended December 31, 2008, purchases and sales of securities (excluding short term investments) for the Portfolio were as follows:
| | | | | | | | | | |
| Purchases | | Sales |
| U.S. Government | | Other | | U.S. Government | | Other |
| $ | 14,994,474,856 | | $ | 267,748,274 | | $ | 15,042,582,428 | | $ | 316,919,474 |
Options Written:
The Portfolio transactions in options written during the year ended December 31, 2008 were as follows:
| | | | | | | |
Call Options | | Number of
contracts | | | Premiums
received | |
Options outstanding December 31, 2007 | | 156 | | | $ | 89,121 | |
Options written | | 253 | | | | 199,254 | |
Options closed | | (175 | ) | | | (158,035 | ) |
Options expired | | (234 | ) | | | (130,340 | ) |
| | | | | | | |
Options outstanding December 31, 2008 | | 0 | | | $ | 0 | |
| | | | | | | |
| | | | | | | |
Put Options | | Number of
contracts | | | Premiums
received | |
Options outstanding December 31, 2007 | | 0 | | | $ | 0 | |
Options written | | 1,361 | | | | 1,025,453 | |
Options closed | | (426 | ) | | | (335,227 | ) |
Options expired | | (935 | ) | | | (690,226 | ) |
| | | | | | | |
Options outstanding December 31, 2008 | | 0 | | | $ | 0 | |
| | | | | | | |
MSF-21
Metropolitan Series Fund, Inc.
BlackRock Bond Income Portfolio
Notes to Financial Statements—December 31, 2008—(Continued)
| 4. | INVESTMENT MANAGEMENT FEES AND OTHER TRANSACTIONS WITH AFFILIATES: |
Investment Management Agreement:
MetLife Advisers, LLC (“MetLife Advisers”) is the investment adviser to the Portfolio. The Fund has entered into an investment management agreement with MetLife Advisers with respect to the Portfolio. For providing investment management services to the Portfolio, MetLife Advisers receives monthly compensation at the following annual rates:
| | | | |
Management
Fees earned by
MetLife Advisers
for the year ended
December 31, 2008 | | Annual
percentage
rates paid to
MetLife Advisers | | Based on Portfolios
average daily net asset
levels |
| $5,764,854 | | 0.400% | | Of the first $1 billion |
| | 0.350% | | Of the next $1 billion |
| | 0.300% | | Of the next $1 billion |
| | 0.250% | | On amounts in excess of $3 billion |
Certain officers and directors of the Fund may also be officers of MetLife Advisers; however, such officers and directors receive no compensation from the Fund.
MetLife Advisers has entered into an investment subadvisory agreement with respect to the Portfolio. BlackRock Advisors, LLC is compensated by MetLife Advisers to provide subadvisory services for the Portfolio.
Service and Distribution Fees:
The Fund has adopted a Distribution and Service Plan under Rule 12b-1 of the 1940 Act for the Portfolio’s Class B and E shares. Under the Distribution and Service Plan, the Class B and E shares of the Portfolio pay a fee to compensate the Insurance Companies (or their affiliates) and other broker-dealers and financial intermediaries involved in the offer and sale of Portfolio shares for promoting or selling and servicing the Class B and E. The fees under the Distribution and Service Plan for each class of the Portfolio’s shares are calculated as a percentage of the Portfolio’s average daily net assets that are attributable to that Class. Currently, the fee is 0.25% per year for Class B shares and 0.15% per year for Class E shares. Amounts paid by the Portfolio for the year ended December 31, 2008 are shown as Service and Distribution fees in the Statement of Operations.
Management Fee Waivers:
Pursuant to an expense agreement, MetLife Advisers has agreed, for the period May 1, 2008 to April 30, 2009, to reduce its advisory fees set out above under “Investment Management Agreement” for each class of the Portfolio as follows:
| | |
Annual Percentage
Rate Reduction | | Average Daily Net Asset
Value Levels |
| 0.025% | | Over $1 billion and less than $2 billion |
A similar expense agreement was in place for the period May 1, 2007 through April 30, 2008. Amounts waived for the year ended December 31, 2008 are shown as management fee waivers in the Statement of Operations.
The Fund has entered into a securities lending arrangement with the Fund’s custodian, State Street Bank and Trust Company (the “custodian”). Under the agreement, the custodian is authorized to loan securities on the Portfolios’ behalf. In exchange, the Portfolio receives either cash or securities as collateral against the loaned securities. The Portfolio receives collateral at least equal to 102% of the market value of the loaned securities (105% for foreign securities), at each loan’s inception. Collateral must be maintained at least at 100% of the market value of the loaned securities for the duration of the loan. The cash collateral is invested in the Navigator Securities Lending Prime Portfolio, an affiliate of the custodian, which invests in a variety of high quality U.S. dollar-denominated instruments. If the market value of the collateral at the close of trading on a business day is less than 100% of the market value of the loaned securities at the close of trading on that day, the borrower shall be required to deliver, by the close of business on the following business day, an additional amount of collateral, equal to at least 100% of the market value of all the loaned securities as of such preceding day. The Portfolio receives 80% of the annual net income from securities lending transactions, which is included in interest income of the Portfolio. The remaining 20% is paid to the custodian as compensation for its securities lending services. Interest income received by the Portfolio via lending transactions during the
MSF-22
Metropolitan Series Fund, Inc.
BlackRock Bond Income Portfolio
Notes to Financial Statements—December 31, 2008—(Continued)
year ended December 31, 2008 is footnoted in the Statement of Operations. The Portfolio bears the risk of any deficiency in the amount of collateral available for return to a borrower due to a loss in an approved investment purchased with such collateral. Any outstanding loans by the Portfolio at December 31, 2008 are footnoted in the Schedule of Investments.
| 6. | MARKET AND CREDIT RISK: |
In the normal course of business, the Portfolio invests in securities and enters into transactions where risks exist due to fluctuations in the market (market risk) or failure of the other party to a transaction to perform (credit risk). The value of securities held by the Portfolio may decline in response to certain events, including those directly involving the companies whose securities are owned by the Portfolio; conditions affecting the general economy; overall market changes; local, regional or global political, social or economic instability; and currency and interest rate and price fluctuations. Similar to credit risk, the Portfolio may be exposed to counterparty risk, or the risk that an entity with which the Portfolio has unsettled or open transactions may default. Financial assets, which potentially expose the Portfolio to credit and counterparty risks, consist principally of investments and cash due from counterparties. The extent of the Portfolio’s exposure to credit and counterparty risks in respect to these financial assets approximates their value as recorded in the Portfolio’s Statements of Assets and Liabilities.
| 7. | RECENT ACCOUNTING PRONOUNCEMENTS: |
In March 2008, the FASB issued Statement of Financial Accounting Standards No. 161, Disclosures about Derivative Instruments and Hedging Activities (“FAS 161”), an amendment of FASB Statement No. 133. FAS 161 requires enhanced disclosures about (a) how and why an entity uses derivative instruments, (b) how derivative instruments and hedging activities are accounted for, and (c) how derivative instruments and related hedging activities affect a fund’s financial position, financial performance, and cash flows. Management does not believe the adoption of FAS 161 will materially impact the financial statement amounts, but will require additional disclosures. This will include qualitative and quantitative disclosures on derivative positions existing at period end and the effect of using derivatives during the reporting period. FAS 161 is effective for financial statements issued for fiscal years and interim periods beginning after November 15, 2008. Management is currently evaluating the impact the adoption of FAS 161 will have on the Portfolio’s financial statement disclosures.
MSF-23
Metropolitan Series Fund, Inc.
BlackRock Bond Income Portfolio
Report of Independent Registered Public Accounting Firm
To the Shareholders and Board of Directors of Metropolitan Series Fund, Inc.:
We have audited the accompanying statement of assets and liabilities, including the schedule of investments, of the BlackRock Bond Income Portfolio (one of the portfolios constituting the Metropolitan Series Fund, Inc.) (the “Fund”) as of December 31, 2008, and the related statement of operations for the year then ended, the statements of changes in net assets for each of the two years in the period then ended, and the financial highlights for each of the five years in the period then ended. These financial statements and financial highlights are the responsibility of the Fund’s management. Our responsibility is to express an opinion on these financial statements and financial highlights based on our audits.
We conducted our audits in accordance with the standards of the Public Company Accounting Oversight Board (United States). Those standards require that we plan and perform the audit to obtain reasonable assurance about whether the financial statements and financial highlights are free of material misstatement. The Fund is not required to have, nor were we engaged to perform, an audit of its internal control over financial reporting. Our audits included consideration of internal control over financial reporting as a basis for designing audit procedures that are appropriate in the circumstances, but not for the purpose of expressing an opinion on the effectiveness of the Fund’s internal control over financial reporting. Accordingly, we express no such opinion. An audit also includes examining, on a test basis, evidence supporting the amounts and disclosures in the financial statements, assessing the accounting principles used and significant estimates made by management, as well as evaluating the overall financial statement presentation. Our procedures included confirmation of securities owned as of December 31, 2008, by correspondence with the custodian and brokers; where replies were not received from brokers, we performed other auditing procedures. We believe that our audits provide a reasonable basis for our opinion.
In our opinion, the financial statements and financial highlights referred to above present fairly, in all material respects, the financial position of the BlackRock Bond Income Portfolio of the Metropolitan Series Fund, Inc. as of December 31, 2008, the results of its operations for the year then ended, the changes in its net assets for each of the two years in the period then ended, and the financial highlights for each of the five years in the period then ended, in conformity with accounting principles generally accepted in the United States of America.
Deloitte & Touche LLP
Boston, Massachusetts
February 26, 2009
MSF-24
Metropolitan Series Fund, Inc.
Directors and Officers
The Fund’s Directors review actions of the Fund’s investment adviser and subadvisers, and decide upon matters of general policy. The Fund’s officers supervise the daily business operations of the Fund. The Board of Directors and the Fund’s officers are listed below. Each Director is responsible for overseeing all 38 Portfolios of the Fund. There is no limit to the term a Director may serve. Directors serve until their resignation, retirement or removal in accordance with the Fund’s organizational documents and policies adopted by the Board from time to time. Officers hold office at the pleasure of the Board or until the election or appointment and the qualification of a successor. The address of the Directors and officers is c/o Metropolitan Series Fund, Inc., 501 Boylston Street, Boston, MA 02116.
Interested Directors(1)
Each Director below is an “interested person” (as defined by the 1940 Act) with respect to the Fund in that Ms. Forget is an employee of MetLife and Mr. Typermass is a former employee of MetLife and owns securities issued by MetLife, Inc., the ultimate parent company of MetLife Advisers.
| | | | | | | | |
Name, Address and Age | | Current
position(s)
with Fund | | Position(s)
held since | | Principal occupations
over past five years, including other directorships(2) | | Number of
Portfolios in
Fund Complex
Overseen by
Director(3) |
Elizabeth M. Forget Age: 42 | | Director, Chairman of the Board, President and Chief Executive Officer | | 2006 | | Senior Vice President (since 2007), MetLife, Inc.; President, Met Investors Advisory, LLC; Trustee and President, Met Investors Series Trust; Executive Vice President, MetLife Investors Group, Inc.; President, Chief Executive Officer and Chair of the Board of Managers (since 2006), MetLife Advisers; President, Met Investors Advisory, LLC. | | 87 |
| | | | |
Arthur G. Typermass Age: 71 | | Director | | 1998 | | Formerly, Senior Vice President and Treasurer, MetLife. | | 38 |
Non-Interested Directors(1)
Each Director below is not an “interested person” (as defined by the 1940 Act) with respect to the Fund (collectively, the “Independent Directors”).
| | | | | | | | |
Name, Address and Age | | Current
position(s)
with Fund | | Position(s)
held since | | Principal occupations
over past five years, including other directorships(2) | | Number of
Portfolios in
Fund Complex
Overseen by
Director(3) |
Steve A. Garban† Age: 71 | | Director | | 1985 | | Formerly, Chief Financial Officer, Senior Vice President Finance and Operations and Treasurer (Emeritus), The Pennsylvania State University. | | 38 |
| | | | |
Linda B. Strumpf Age: 61 | | Director | | 2000 | | Vice President and Chief Investment Officer, Ford Foundation. | | 38 |
| | | | |
Michael S. Scott Morton† Age: 71 | | Director | | 1993 | | Jay W. Forrester Professor of Management (Emeritus) at Sloan School of Management, MIT. | | 38 |
| | | | |
H. Jesse Arnelle Age: 75 | | Director | | 2001 | | Formerly, Counsel, Womble Carlyle Sandrie & Rice; Director, Textron Inc. (global multi- industry company)*; formerly, Director, Gannet Co. Inc. (diversified news and information company)*; formerly, Director, Eastman Chemical Company (global chemical company)*; formerly, Director, Waste Management, Inc.*; formerly, Director, Armstrong Holdings Inc. (parent company of floor and ceiling products business)*; formerly, Director, FPL Group Inc. (public utility holding company)*; Director, URS Corporation (engineering design services firm)*. | | 38 |
MSF-25
Metropolitan Series Fund, Inc.
Directors and Officers—(Continued)
| | | | | | | | |
Name, Address and Age | | Current
position(s)
with Fund | | Position(s)
held since | | Principal occupations
over past five years, including other directorships(2) | | Number of
Portfolios in
Fund Complex
Overseen by
Director(3) |
Nancy Hawthorne Age: 57 | | Director | | 2003 | | Chief Executive Officer, Clerestory LLC (corporate financial advisor); Director, Avid Technologies (computer software company)*; formerly, Chairman of the Board of Avid Technologies; formerly, Board of Advisors, L. Knife & Sons, Inc. (beverage distributor); formerly, Trustee, New England Zenith Fund (“Zenith Fund”)**; formerly, Chief Executive Officer and Managing Partner, Hawthorne, Krauss and Associates (corporate financial advisor); formerly, Chief Financial Officer and Executive Vice President, Continental Cablevision, subsequently renamed MediaOne (cable television company); formerly, Director, Life F/X, Inc.; formerly, Chairman of the Board, WorldClinic (distance medicine company); formerly, Director, Perini Corporation (construction company)*; formerly, Director, CGU (property and casualty insurance company); formerly, Director, Beacon Power Corporation (energy company)*. | | 38 |
| | | | |
John T. Ludes Age: 72 | | Director | | 2003 | | President, LFP Properties (consulting firm); Formerly, Trustee, Zenith Fund**; formerly, Vice Chairman, President and Chief Operating Officer, Fortune Brands/American Brands (global conglomerate); formerly, President and CEO, Acushnet Company (athletic equipment company). | | 38 |
Officers(1)
| | | | | | | | |
Name and address | | Age | | Current
position(s)
with Fund | | Position(s)
held since | | Principal occupations over past five years(2) |
| Jeffrey L. Bernier | | 37 | | Senior Vice President | | 2008 | | Vice President (since 2008), MetLife, Inc.; Vice President (since 2008), MetLife; Senior Vice President (since 2008), MetLife Advisers; formerly, Director and Senior Investment Analyst (2004 to 2007), John Hancock Financial Services; formerly, Assistant Vice President (2000 to 2001), Wachovia Securities. |
| | | | |
| Alan C. Leland | | 56 | | Senior Vice President | | 2005 | | Treasurer and Chief Financial Officer, MetLife Advisers, LLC; Treasurer (since 2005), Met Investors Advisory, LLC; Vice President (since 2004), Met Investors Advisory, LLC; Vice President (since 2003), MetLife, Inc.; Vice President, MetLife; Senior Vice President, NELICO. |
| | | | |
| Peter Duffy | | 53 | | Vice President
and Treasurer | | 2000 | | Senior Vice President, MetLife Advisers; Second Vice President (since 2003), NELICO; Vice President, MetLife (since 2004); Vice President (since 2004), MetLife, Inc.; formerly, Vice President and Treasurer, Zenith Fund**. |
| | | | |
| Jeffrey P. Halperin | | 41 | | Chief
Compliance Officer | | 2007 | | Vice President (since 2006), MetLife, Inc.; Vice President (since 2006), MetLife; Chief Compliance Officer (since 2006), Met Investors Series Trust, MetLife Advisers, Met Investors Advisory, LLC and MetLife Investment Advisors Company, LLC. |
| * | Indicates a directorship with a registered investment company or a company subject to the reporting requirements of the Securities Exchange Act of 1934, as amended. |
| ** | The Zenith Fund deregistered with the Securities and Exchange Commission (“SEC”) in 2004. |
| (†) | Served as a trustee, director and/or officer of one or more of the following companies, each of which had a direct or indirect advisory relationship with MetLife Advisers or its affiliates prior to January 31, 2005: State Street Research Financial Trust, State Street Research Income Trust, State Street Research Money Market Trust, State Street Research Institutional Funds, State Street Research Capital Trust, State Street Research Master Investment Trust, State Street Research Equity Trust, State Street Research Securities Trust and State Street Research Exchange Trust (collectively, the “State Street Research Funds”). |
| (1) | During the period shown, each Director of the Fund served as a Trustee of Metropolitan Series Fund II, a registered investment company that ceased investment operations in June of 2008 and has applied for deregistration under the Investment Company Act of 1940. During this period, each officer of the Fund served in the same position with Metropolitan Series Fund II. |
| (2) | Previous positions during the past five years with the Fund; Met Investors Series Trust; MetLife; MetLife, Inc.; MetLife Advisers; Met Investors Advisory, LLC; Zenith Fund; NELICO; or New England Securities Corporation are omitted if not materially different. |
| (3) | The Fund Complex includes the Fund (38 portfolios) and Met Investors Series Trust (49 portfolios). |
MSF-26
Metropolitan Series Fund, Inc.
BlackRock Bond Income Portfolio
Board Approval of Advisory and Subadvisory Agreements
The Fund’s Contract Review Committees of the Board of Directors (the “Board” or the “Directors”) typically meet in early fall to review the Portfolios’ advisory agreements (the “Advisory Agreements”) and subadvisory agreements (the “Subadvisory Agreements,” and, together with the Advisory Agreements, the “Agreements”) and determine whether to recommend that the full Board approve the continuation of the Agreements for an additional one-year period. (Following the initial approval of an Agreement for a new Portfolio or with a new adviser or subadviser, such annual reviews are not required until 2 years following the execution of such Agreement.) After each Committee has made its recommendations, the full Board, including the Independent Directors, determines whether to approve the continuation of each of the Agreements. In addition, the Board, including the Independent Directors, considers matters bearing on the Agreements at most of its other meetings throughout the year and regularly interviews various individuals at MetLife Advisers responsible for the management of the Portfolios. The Directors also interview selected investment managers and other professionals at the subadvisers at various times throughout the year.
The Directors receive all materials that they or MetLife Advisers, the Fund’s investment adviser, and the subadvisers believe to be reasonably necessary for the Directors to evaluate the Agreements and determine whether to approve the continuation of the Agreements. These materials generally include, among other items, (i) information on the investment performance of the Portfolios and the performance of peer groups of funds and the Portfolios’ performance benchmarks, (ii) information on the Portfolios’ advisory and subadvisory fees and other expenses, including information comparing the Portfolios’ expenses to those of peer groups of funds and information about any applicable expense caps and fee “breakpoints,” (iii) sales and redemption data, (iv) information related to the profitability of the Agreements to MetLife Advisers and certain of the subadvisers, and potential “fall-out” or ancillary benefits that MetLife Advisers, the subadvisers or their affiliates may receive as a result of their relationships with the Fund and (v) information obtained through the subadvisers’ responses to certain requests from MetLife Advisers and the Directors and MetLife Advisers’ responses to requests from the Directors. The Directors may also consider other information such as (vi) MetLife Advisers’ and the subadvisers’ financial results and condition, (vii) each Portfolio’s investment objectives and strategies and the size, education and experience of the investment staffs of MetLife Advisers and the relevant subadvisers and their use of technology and external research, (viii) the allocation of the Portfolios’ brokerage, if any, including allocations to brokers affiliated with the subadvisers and the use of “soft” commission dollars to pay Portfolio expenses and to pay for research and other similar services, (ix) the resources devoted to, and the record of compliance with, the Portfolios’ investment policies and restrictions, policies on personal securities transactions and other compliance policies, (x) the responses of MetLife Advisers, the subadvisers and/or their affiliates to certain legal and regulatory proceedings and (xi) the economic outlook generally and for the mutual fund industry in particular. Throughout the process, the Directors have the opportunity to ask questions of and request additional materials from MetLife Advisers and the subadvisers.
Following meetings of each Contract Review Committee on September 10, 2008, the Board, including the Independent Directors, at its November 6-7, 2008 meeting, approved the continuation through December 31, 2009 of the Advisory Agreements for each Portfolio of the Fund and the Subadvisory Agreements for each Portfolio other than the Zenith Equity Portfolio and Asset Allocation Portfolios (which do not have subadvisers) and the Van Eck Global Natural Resources Portfolio, Met/Dimensional International Small Cap Portfolio and Loomis Sayles Small Cap Growth Portfolio (formerly known as the Franklin Templeton Small Cap Growth Portfolio). The Agreements approved for continuation are referred to below as the “Continued Agreements.”
In considering whether to approve the continuation of the Continued Agreements, the Directors, including the Independent Directors, did not identify any single factor as determinative, and each weighed the various factors as he or she deemed appropriate. The Directors considered the following matters in connection with their approval of the Continued Agreements:
The nature, extent and quality of the services provided to the relevant Portfolios under the Continued Agreements. The Directors considered the nature, extent and quality of the services provided by MetLife Advisers, the relevant subadvisers (if any) and their affiliates (each, an “Adviser,” and, collectively, the “Advisers”) to the relevant Portfolios pursuant to the Continued Agreements and the resources dedicated to these Portfolios by the Advisers. In particular, the Directors considered the Advisers’ abilities to attract and retain highly qualified investment professionals. With respect to MetLife Advisers, the Directors considered (for each Portfolio other than the Zenith Equity and Asset Allocation Portfolios) that MetLife Advisers is (i) ultimately responsible for the performance of such Portfolios; (ii) ultimately responsible for the establishment of the investment strategies of each such Portfolio, primarily through its recommendations to the Board regarding the hiring and selection of subadvisers; (iii) responsible for the hiring and selection, subject to Board approval, of subadvisers; and (iv) responsible for maintaining a program of Subadviser oversight reasonably designed to ensure that the subadvisers have reasonable compliance policies and procedures in place. The Directors also considered that MetLife Advisers provides a full range of day-to-day administrative services for the Portfolios involving all aspects of such Portfolios’ day-to-day operations (other than portfolio management). With respect to the Zenith Equity and Asset Allocation Portfolios, the Directors considered both the portfolio management services and the administrative services provided by MetLife Advisers. After reviewing
MSF-27
Metropolitan Series Fund, Inc.
BlackRock Bond Income Portfolio
Board Approval of Advisory and Subadvisory Agreements—(Continued)
these and related factors, the Directors concluded, within the context of their overall conclusions regarding each of the Continued Agreements, that the nature, extent and quality of services provided supported the renewal of these Agreements.
Investment performance of the relevant Portfolios. The Directors reviewed information about the performance of the relevant Portfolios over various time periods, including information prepared by an independent third party that compared the performance of the Portfolios to the performance of peer groups of funds and performance benchmarks. The Directors also reviewed a description of the third party’s methodology for identifying a Portfolio’s peer group(s) for purposes of performance and expense comparisons.
In the case of each relevant Portfolio that had performance that lagged its peer group(s) for certain periods, the Directors concluded that other factors relevant to performance were sufficient, in light of other considerations, to warrant renewal of the Continued Agreements relating to such Portfolio. These factors varied from Portfolio to Portfolio, but included one or more of the following: (i) that such Portfolio’s performance, although lagging in certain recent periods, was stronger over the longer term; (ii) that the underperformance was attributable, to a significant extent, to investment decisions that were reasonable and consistent with the Portfolio’s investment objective(s) and policies and that the Portfolio was performing within the range of reasonable expectations, given market conditions and the Portfolio’s investment objective(s) and policies; (iii) that the Portfolio’s performance was competitive when compared to other relevant performance benchmarks or peer groups; and (iv) that MetLife Advisers and/or the relevant subadviser (if any) had taken or was taking steps designed to help improve the Portfolio’s investment performance (including, in the case of certain Portfolios, that MetLife Advisers was formulating possible proposals, for presentation to the Board in November 2008, to replace the Portfolio’s subadviser or to merge the Portfolio into another Portfolio with a similar investment objective and better investment performance).
The Directors also considered the investment performance of the Advisers and their reputations generally, the historical responsiveness of the Advisers to Director concerns about performance and the willingness of the Advisers to take steps intended to improve performance.
After reviewing these and related factors, the Directors concluded, within the context of their overall conclusions regarding each of the Continued Agreements, that the investment performance of each relevant Portfolio and Adviser was sufficient, in light of other considerations, to warrant the renewal of the Continued Agreements.
The costs of the services to be provided and profits to be realized by the Advisers and their affiliates from their relationships with the Portfolios. The Directors considered the fees charged by MetLife Advisers to the Portfolios for advisory services and, with respect to the subadvised Portfolios, by such subadvisers to MetLife Advisers for subadvisory services (such advisory and subadvisory fees (if any), collectively, “Fees”), as well as the total expense levels of the Portfolios. This information included comparisons (provided by an independent third party) of the Portfolios’ advisory fees and total expense levels to those of their peer groups. In evaluating Fees for the relevant Portfolios, the Directors also took into account the demands, complexity and quality of the investment management services provided to each Portfolio. The Directors considered MetLife Advisers’ recommendations regarding reductions in Fee rates, implementation of Fee breakpoints and institution of Fee waivers and expense caps.
The Directors also considered the compensation directly or indirectly received by the Advisers and their affiliates from their relationships with the relevant Portfolios. The Directors reviewed information relating to the profits received by MetLife Advisers, certain of the subadvisers and their affiliates as a result of their relationships with the relevant Portfolios, and information about the allocation of expenses used to calculate profitability. When reviewing profitability, the Directors also considered the performance of the relevant Portfolios, the expense levels of such Portfolios and whether the relevant Advisers had implemented breakpoints, fee waivers and/or expense caps with respect to such Portfolios.
After reviewing these and related factors, the Directors concluded, within the context of their overall conclusions regarding each of the Continued Agreements, that the Fees charged to each of the relevant Portfolios were fair and reasonable, and that the information provided regarding costs of these services generally, and the related profitability (if known) to the relevant Advisers of their relationships with the relevant Portfolios, supported the renewal of the Continued Agreements.
Economies of Scale. The Directors considered the existence of any economies of scale in the provision of services by the Advisers and whether those economies were shared with the relevant Portfolios through breakpoints in their advisory fees or other means, such as expense caps, fee waivers or relatively low levels of fees. The Directors noted that most of the relevant Portfolios benefited or will benefit from breakpoints, expense caps and/or fee waivers with respect to their advisory fees. In considering these issues, the Directors also took into consideration information relating to the costs of the services provided and the profitability to MetLife Advisers, the relevant subadvisers (if any) and each of their affiliates of their relationships with the relevant Portfolios, as discussed above.
MSF-28
Metropolitan Series Fund, Inc.
BlackRock Bond Income Portfolio
Board Approval of Advisory and Subadvisory Agreements—(Continued)
After reviewing these and related factors, the Directors concluded, within the context of their overall conclusions regarding each of the Continued Agreements, that the extent to which economies of scale were shared with the relevant Portfolios supported the renewal of such Agreements.
Other Factors. The Directors also considered other factors, which included but were not limited to the following:
| | • | | the extent to which each relevant Portfolio operated in accordance with its investment objective, and its record of compliance with its investment restrictions and the compliance programs of the Fund and the Advisers. They also considered the compliance-related resources the Advisers and their affiliates provide to the relevant Portfolios; |
| | • | | the nature, quality, cost and extent of administrative and shareholder services performed by MetLife Advisers and its affiliates under the Advisory Agreements; and |
| | • | | so-called “fall-out benefits” to the Advisers, such as the engagement of their affiliates to provide distribution, brokerage and transfer agency services to the Portfolios, and the benefits of research made available to the relevant Advisers by reason of brokerage commissions generated by the relevant Portfolios’ securities transactions. The Directors also considered the possible conflicts of interest associated with these fall-out and other benefits, and the reporting and other processes in place to disclose and monitor these possible conflicts of interest. |
Based on their evaluation of all factors that they deemed to be material, including those factors described above, and assisted by the advice of independent counsel, the Directors, including the Independent Directors, concluded that each of the Continued Agreements should be continued through December 31, 2009.
MSF-29
A description of the policies and procedures that the Fund uses to determine how to vote proxies relating to portfolio securities is available (i) without charge, upon request, by calling (800) 638-7732 and (ii) on the Securities and Exchange Commission’s (the “SEC”) website at http://www.sec.gov.
Information regarding how the Fund voted proxies relating to portfolio securities during the most recent twelve-month period ended December 31, 2008 is available (i) without charge, upon request, by calling (800) 638-7732 and (ii) on the SEC’s website at http://www.sec.gov.
The Fund’s Statement of Additional Information includes additional information about the Directors of the Fund and is available (i) without charge, upon request, by calling (800) 638-7732 and (ii) on the SEC’s website at http://www.sec.gov.
The Fund files with the SEC a complete schedule of its portfolio holdings, as of the close of the first and third quarters of its fiscal year, on “Form N-Q”. These filings are available on the SEC’s website at www.sec.gov and may be reviewed and copied at the SEC’s Public Reference Room in Washington, DC. (Call 1-800-SEC-0330 for information on the operation of the Public Reference Room.)
MSF-30
Simplify your life…
with MetLife eDelivery® while helping MetLife preserve the planet’s natural resources.
(see details on inside cover)
| | |
Metropolitan Series Fund, Inc. BlackRock Diversified Portfolio Annual Report | | December 31, 2008 |
NOT PART OF THE ANNUAL REPORT
Letter from the President
February 1, 2009
Letter to Policy Holders:
2008 was an extraordinary year in the capital markets around the world and for the global economy. Energy prices rose to record levels early in the year before falling by two-thirds by year-end. A credit crisis that began with concerns about sub-prime mortgages led to massive changes in the financial landscape with government takeovers, forced sales, and outright failures of a number of large, once venerable firms.
While bonds as measured by the Barclays Capital U.S. Aggregate Bond Index (formerly known as, Lehman Brothers U.S. Aggregate Bond Index) were up 5.2% for the year in response to declining interest rates, there were large differences in the total returns of the various sectors of the bond market. U.S. treasury securities were up over 13% as frightened investors sought refuge in what they perceived to be the safest and most liquid investments. In contrast, investment grade corporate securities lost nearly 5% as credit spreads widened and below investment grade or high yield bonds fell over 26%.
In response to the growing credit crisis and the weakening economy, common stocks fell sharply across all regions, styles, and capitalizations. As measured by the Standard and Poor’s 500, U.S. common stocks fell 37% for the year, the worst calendar year decline since the 1930s. Foreign stocks were down even more with the MSCI EAFE Index down 43% for the year.
On the following pages, you will find a complete review of your Portfolio and its investment performance.
MetLife is committed to building your financial freedom. We appreciate your trust and will continue to focus our efforts on meeting your investment needs.
Sincerely,
Elizabeth M. Forget
President, Metropolitan Series Fund, Inc.
Metropolitan Series Fund, Inc.
BlackRock Diversified Portfolio
Managed by BlackRock Advisors, LLC
Portfolio Manager Commentary*
PORTFOLIO PERFORMANCE
For the twelve-month period ended December 31, 2008, the Class A shares of the BlackRock Diversified Portfolio returned -24.8%, compared to its benchmark, a blend of the Russell 1000 Index1 (60%) and the Barclays Capital U.S. Aggregate Bond Index2 (40%), which returned -20.5%. The average return of its peer group, the Lipper Variable Insurance Products3 Mixed-Asset Target Allocation Growth Funds Universe, was -29.6% over the same period.
PORTFOLIO REVIEW
2008 will turn out to be a year investors would like to forget, but instead will vividly remember. For much of the first half of the year, equity markets held together as the hope of global decoupling kept investors from panicking, despite substantial deterioration in credit markets. The seminal event appears to have been the September Lehman Brothers bankruptcy, which drove fear higher and confidence lower, causing a massive decline in economic activity in the U.S. and globally. Although at times somewhat erratic, monetary and fiscal policy efforts became aggressive, attempting to fight off systemic collapse and growing deflationary forces. As a result, risk premia of all types rose substantially and geographic and other correlations increased. The price of risk assets, including equities, low-quality bonds and commodities collapsed in record time, as volatility levels soared. By contrast, high-quality assets, especially Treasury instruments, soared as returns on cash fell to near zero. Most governments have announced, or are in the process of announcing, massive stimulus packages in an effort to stem economic decline and encourage eventual recovery. Defensive stocks (consumer staples and healthcare) declined the least as financial stocks crumbled. Oil prices soared to $150 and then collapsed to below $40, less than half the level where they started the year. The U.S. equity market noticeably outperformed by falling less than many other markets, and the U.S. dollar enjoyed a second half rally. The year ends with uncertainty high, expectations low and problems significant.
For most of the year, the Portfolio maintained a moderate underweight in stocks versus bonds, reflecting our view that the risk of holding equities was high. Our moderate underweight became a significant underweight when the stock market fell precipitously during the month of October, reaching approximately 10% at the market low. By the end of October, having just witnessed new multi-year lows on the S&P 500 Index and record levels of volatility indicating panic and forced selling, we believed it was time to add exposure to equities. In early November, we raised the equity exposure in the Portfolio, but kept it below the benchmark weight of 60%. The Portfolio ended the year with a moderate underweight in stocks.
During the year, the fixed income portion of the Portfolio traded duration and yield curve positioning tactically, ending the period with a neutral duration and a slight yield curve steepener. Overall, the Portfolio’s duration and yield curve positioning trades benefited performance for the 12-month period. Over the course of the year, while Treasury bonds rallied (13.7% in 2008), high-quality spread assets—particularly non-agency mortgage-backed securities (MBS), commercial mortgage-backed securities (CMBS) and asset-backed securities (ABS)—were under extreme pressure, most notably during the second half of the year. During 2008, the CMBS sector lost 20.5% and the ABS sector fell 12.7% (as reported by the Barclay’s Capital U.S. Aggregate Bond Index). There is no index that tracks non-agency MBS, but non-agency paper generally fell more than 30%. Corporate bonds were also volatile, posting losses of 4.9% for the year, with the financials sub-sector alone falling 8.4%. The markets began showing some signs of stabilizing from late November through year-end. In December alone, the CMBS sector was up 17%, corporates gained 6.8% and agency MBS rose 1.7%. However, while the year ended with a better tone, the Portfolio’s broad overweights in these high-quality spread sectors, combined with an underweight in Treasuries, detracted from performance for the period. While our exposure to the aforementioned spread sectors (non-agency MBS, CMBS, ABS) detracted from performance, our security selection proved beneficial, with our focus on the highest quality issues within the CMBS and ABS sectors helping us outperform the respective sector averages. The Portfolio remains underweight in U.S. Treasury and agency debt in favor of high-quality spread sectors. As a result, we maintained core holdings in agency and non-agency MBS, AAA-rated CMBS and ABS. During the period, as spreads on credit approached historically wide levels, we began to look for opportunities in both the new issue and secondary markets, bringing our credit allocation closer to neutral versus the benchmark. We continue to see long-term value in these sectors, and believe that as stability returns to financial markets, spreads will recover gradually over time, ultimately benefiting the Portfolio.
For the equity portion of the Portfolio, an underweight and security selection in financials was the most important contributor to performance. In financials, the Portfolio benefited from underweighting diversified financials opting for exposure to the sector mainly through the insurance industry, where Portfolio holdings significantly outperformed the broader sector. Also contributing to performance was our security selection in the energy sector. Within the sector, Portfolio positioning in high-quality, asset-based integrated oil companies was a positive factor. Also, we avoided the high-risk oil services companies, whose fortunes are closely tied to the price of crude oil. We have made some tactical purchases of refiners (at very depressed valuations), as lower crude prices should drive improving margins. In the long term, we remain bullish on commodities and believe that the best way to profit from this view is by focusing on high-quality companies.
On the negative side, the equity Portfolio’s underweight in consumer staples and security selection in industrials detracted from performance. Throughout the year, we believed the consumer staples sector to be overvalued given our expectations of future earnings growth. The sector was, however, the best performer in the Russell 1000 Index for the year. In healthcare, our difficulty came mostly during the first quarter. The sector was, however, the best performer in the Russell 1000 Index for the year. Our industrials names did not fare well during the year, with holdings in the machinery industry detracting the most from that sector. We believe that the Portfolio’s orientation toward the defense industry—which is typically insulated from macroeconomic events—is the right call at this time.
At period-end, the Portfolio’s largest overweights versus the benchmark were in the energy, information technology and healthcare sectors. The Portfolio continued to be underweight in financials, consumer staples and utilities.
* The views expressed above are those of the subadvisory firm as of December 31, 2008 and are subject to change based on market and other conditions. Information about the Portfolio’s holdings, asset allocation, industry allocation, or country diversification is historical and is not an indication of future Portfolio composition, which will vary. The performance of any index mentioned in this commentary has not been adjusted for ongoing management, distribution and operating expenses, and sales charges applicable to mutual fund investments. Direct investment in any index is not possible.
1 The Russell 1000® Index is an unmanaged measure of the 1,000 largest companies in the Russell 3000® Index, which represents approximately 90% of the investable U.S. equity market.
2 Barclays Capital U.S. Aggregate Bond Index (formerly, Lehman Brothers U.S. Aggregate Bond Index) includes most obligations of the U.S. Treasury, agencies and quasi-federal corporations, most publicly issued investment grade corporate bonds and most bonds backed by mortgage pools of GNMA, FNMA and FHLMC. The index itself remains unchanged since Barclays assumed responsibility for the index from Lehman.
3 The Lipper Variable Products Fund Average is an average of the total return performance (calculated on the basis of net asset value) of variable product funds with similar investment objectives to those of the subject Portfolio as calculated by Lipper Analytical Services, an independent mutual fund ranking service.
MSF-2
Metropolitan Series Fund, Inc.
BlackRock Diversified Portfolio
A $10,000 INVESTMENT COMPARED TO
THE RUSSELL 1000 INDEX AND THE BARCLAYS CAPITAL U.S. AGGREGATE BOND INDEX
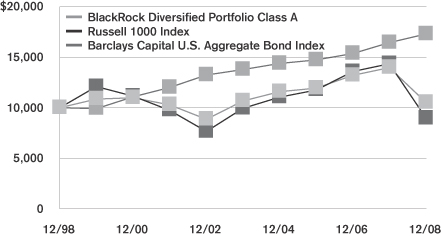
Average Annual Returns as of December 31, 2008
| | | | | | | | | | | | | | | |
| | | BlackRock Diversified Portfolio | | | Russell 1000 Index | | | Barclays Capital U.S. Aggregate Bond Index | |
| | | Class A | | | Class B | | | Class E | | | |
| 1 Year | | -24.8 | % | | -25.0 | % | | -24.9 | % | | -37.6 | % | | 5.2 | % |
| 5 Year | | -0.3 | | | — | | | -0.5 | | | -2.0 | | | 4.7 | |
| 10 Year | | 0.5 | | | — | | | — | | | -1.1 | | | 5.6 | |
| Since Inception | | — | | | -0.8 | | | -0.4 | | | — | | | — | |
Performance numbers are net of all Portfolio expenses but do not include any insurance, sales, or administrative charges of variable annuity or life insurance contracts or any additional expenses that participants in certain eligible qualified plans may bear relating to the operations of their plans. If these charges were included, the returns would be lower.
Inception dates of the Class A, Class B and Class E shares are: 7/25/86, 4/26/04 and 5/1/01, respectively.
This information represents past performance and is not indicative of future results. Investment return and principal value may fluctuate so that shares, upon redemption, may be worth more or less than the original cost.
PORTFOLIO COMPOSITION
as of December 31, 2008
Top Holdings
| | |
| | | % of Total
Net Assets |
Federal National Mortgage Association | | 15.4% |
Federal Home Loan Mortgage Corp. | | 6.5% |
Government National Mortgage Association | | 4.7% |
Exxon Mobil Corp. | | 3.4% |
Johnson & Johnson | | 1.7% |
Chevron Corp. | | 1.6% |
Pfizer, Inc. | | 1.4% |
Wal-Mart Stores, Inc. | | 1.3% |
CS First Boston Mortgage Securities Corp. | | 1.3% |
Hewlett-Packard Co. | | 1.2% |
Top Equity Sectors
| | |
| | | % of Equity
Market Value |
Energy | | 22.6% |
Health Care | | 22.0% |
Information Technology | | 19.0% |
Industrials | | 10.7% |
Consumer Discretionary | | 10.5% |
|
| Top Fixed Income Sectors |
| | | % of Fixed Income
Market Value |
Mortgages | | 51.8% |
Investment Grade Corporates | | 19.2% |
Commercial Mortgage-Backed | | 16.6% |
Asset Backed | | 4.7% |
Agency Issues | | 2.6% |
MSF-3
Metropolitan Series Fund, Inc.
Shareholder Expense Example
As a shareholder of the Portfolio, you incur ongoing costs, including management fees; distribution and service (12b-1) fees; and other Portfolio expenses. This example is intended to help you understand your ongoing costs (in dollars) (referred to as “expenses”) of investing in the Portfolio and compare these costs with the ongoing costs of investing in other mutual funds. The example is based on an investment of $1,000 invested at the beginning of the period and held for the entire period, July 1, 2008 through December 31, 2008.
Actual Expenses
The first line for each share class of the Portfolio in the table below provides information about actual account values and actual expenses. You may use the information in this line, together with the amount you invested in the particular share class of the Portfolio, to estimate the expenses that you paid over the period. Simply divide your account value by $1,000 (for example, an $8,600 account value divided by $1,000=8.6), then multiply the result by the number in the first line under the heading entitled “Expenses Paid During Period” to estimate the expenses you paid on your account during this period.
Hypothetical Example for Comparison Purposes
The second line for each share class of the Portfolio in the table below provides information about hypothetical account values and hypothetical expenses based on the Portfolio’s actual expense ratio and an assumed rate of return of 5% per year before expenses, which is not the Portfolio’s actual return. The hypothetical account values and expenses may not be used to estimate the actual ending account balance or expenses you paid for the period. You may use this information to compare the ongoing costs of investing in the Portfolio and other funds. To do so, compare this 5% hypothetical example with the 5% hypothetical examples that appear in the shareholder reports of the other funds.
Please note that the expenses shown in the table are meant to highlight your ongoing costs only and do not reflect any fees or charges of your variable insurance product or any additional expenses that participants in certain eligible qualified plans may bear relating to the operations of their plan. Therefore, the second line for each share class in the table is useful in comparing ongoing costs only, and will not help you determine the relative total costs of owning different funds. In addition, if these other costs were included, your costs would have been higher.
| | | | | | | | | | | | | | |
Portfolio | | | | Annualized
Expense
Ratio | | | Beginning
Account Value
July 1,
2008 | | Ending
Account value
December 31,
2008 | | Expenses Paid
During Period*
July 1, 2008
to
December 31,
2008 |
BlackRock Diversified—Class A | | Actual | | 0.49 | % | | $ | 1,000.00 | | $ | 817.11 | | $ | 2.24 |
| | Hypothetical | | 0.49 | % | | $ | 1,000.00 | | $ | 1,022.65 | | $ | 2.49 |
| | | | | |
BlackRock Diversified—Class B | | Actual | | 0.74 | % | | $ | 1,000.00 | | $ | 815.81 | | $ | 3.38 |
| | Hypothetical | | 0.74 | % | | $ | 1,000.00 | | $ | 1,021.37 | | $ | 3.76 |
| | | | | |
BlackRock Diversified—Class E | | Actual | | 0.64 | % | | $ | 1,000.00 | | $ | 816.26 | | $ | 2.92 |
| | Hypothetical | | 0.64 | % | | $ | 1,000.00 | | $ | 1,021.88 | | $ | 3.25 |
* Expenses paid are equal to the Portfolio’s annualized expense ratio for the most recent six month period, as shown above, multiplied by the average account value over the period, multiplied by the number of days in the most recent fiscal half-year, divided by 366 (to reflect the the one-half year period).
MSF-4
Metropolitan Series Fund, Inc.
BlackRock Diversified Portfolio
Schedule of Investments as of December 31, 2008
Common Stock—58.3% of Total Net Assets
| | | | | |
| Security Description | | Shares | | Value* |
| | | | | |
| | |
Aerospace & Defense—3.0% | | | | | |
General Dynamics Corp. | | 154,000 | | $ | 8,868,860 |
L-3 Communications Holdings, Inc. | | 17,200 | | | 1,269,016 |
Lockheed Martin Corp. | | 90,000 | | | 7,567,200 |
Northrop Grumman Corp. | | 188,000 | | | 8,467,520 |
Raytheon Co. | | 165,000 | | | 8,421,600 |
| | | | | |
| | | | | 34,594,196 |
| | | | | |
| | |
Airlines—0.1% | | | | | |
Southwest Airlines Co. | | 140,000 | | | 1,206,800 |
| | | | | |
| | |
Beverages—0.2% | | | | | |
The Coca-Cola Co. | | 43,000 | | | 1,946,610 |
| | | | | |
| | |
Biotechnology—1.0% | | | | | |
Amgen, Inc. (a) | | 204,000 | | | 11,781,000 |
| | | | | |
| |
Commercial & Professional Services—0.2% | | | |
R.R. Donnelley & Sons Co. | | 140,000 | | | 1,901,200 |
| | | | | |
| | |
Commercial Banks—0.2% | | | | | |
Wells Fargo & Co. | | 63,000 | | | 1,857,240 |
| | | | | |
| | |
Communications Equipment—0.1% | | | | | |
Cisco Systems, Inc. (a) | | 64,000 | | | 1,043,200 |
| | | | | |
| | |
Computers & Peripherals—3.0% | | | | | |
Hewlett-Packard Co. | | 377,000 | | | 13,681,330 |
International Business Machines Corp. | | 120,000 | | | 10,099,200 |
NetApp, Inc. (a) (b) | | 545,000 | | | 7,613,650 |
Western Digital Corp. (a) | | 324,000 | | | 3,709,800 |
| | | | | |
| | | | | 35,103,980 |
| | | | | |
| | |
Consumer Finance—0.7% | | | | | |
Capital One Financial Corp. | | 262,000 | | | 8,355,180 |
| | | | | |
| | |
Diversified Consumer Services—0.2% | | | | | |
H&R Block, Inc. | | 131,000 | | | 2,976,320 |
| | | | | |
| | |
Diversified Financial Services—0.2% | | | | | |
JPMorgan Chase & Co. | | 63,000 | | | 1,986,390 |
| | | | | |
| |
Diversified Telecommunication Services—0.7% | | | |
AT&T, Inc. | | 220,000 | | | 6,270,000 |
CenturyTel, Inc. (b) | | 40,000 | | | 1,093,200 |
Verizon Communications, Inc. | | 20,000 | | | 678,000 |
| | | | | |
| | | | | 8,041,200 |
| | | | | |
|
Electronic Equipment, Instruments & Components—0.2% |
Jabil Circuit, Inc. | | 344,000 | | | 2,322,000 |
| | | | | |
| | |
Energy Equipment & Services—0.8% | | | | | |
ENSCO International, Inc. (b) | | 156,000 | | | 4,428,840 |
Nabors Industries, Ltd. (a) (b) | | 437,000 | | | 5,230,890 |
| | | | | |
| | | | | 9,659,730 |
| | | | | |
| | | | | |
| Security Description | | Shares | | Value* |
| | | | | |
| | |
Food & Staples Retailing—2.6% | | | | | |
SYSCO Corp. | | 292,000 | | $ | 6,698,480 |
The Kroger Co. | | 309,000 | | | 8,160,690 |
Wal-Mart Stores, Inc. | | 265,000 | | | 14,855,900 |
| | | | | |
| | | | | 29,715,070 |
| | | | | |
| | |
Food Products—0.2% | | | | | |
Archer-Daniels-Midland Co. | | 99,000 | | | 2,854,170 |
| | | | | |
| |
Health Care Equipment & Supplies—1.4% | | | |
Baxter International, Inc. | | 142,000 | | | 7,609,780 |
St. Jude Medical, Inc. (a) | | 118,000 | | | 3,889,280 |
Varian Medical Systems, Inc. (a) | | 148,000 | | | 5,185,920 |
| | | | | |
| | | | | 16,684,980 |
| | | | | |
| |
Health Care Providers & Services—3.5% | | | |
Aetna, Inc. | | 94,000 | | | 2,679,000 |
AmerisourceBergen Corp. | | 30,700 | | | 1,094,762 |
Community Health Systems, Inc. (a) (b) | | 77,000 | | | 1,122,660 |
Express Scripts, Inc. (a) | | 124,000 | | | 6,817,520 |
Humana, Inc. (a) | | 182,000 | | | 6,784,960 |
McKesson Corp. | | 151,800 | | | 5,879,214 |
Medco Health Solutions, Inc. (a) | | 161,000 | | | 6,747,510 |
UnitedHealth Group, Inc. | | 26,000 | | | 691,600 |
WellPoint, Inc. (a) | | 201,000 | | | 8,468,130 |
| | | | | |
| | | | | 40,285,356 |
| | | | | |
| | |
Hotels, Restaurants & Leisure—1.0% | | | | | |
McDonald’s Corp. | | 186,000 | | | 11,567,340 |
| | | | | |
| | |
Household Durables—1.3% | | | | | |
Lennar Corp. (Class A) (b) | | 679,000 | | | 5,886,930 |
Pulte Homes, Inc. | | 177,000 | | | 1,934,610 |
Toll Brothers, Inc. (a) (b) | | 318,000 | | | 6,814,740 |
| | | | | |
| | | | | 14,636,280 |
| | | | | |
| | |
Household Products—0.7% | | | | | |
Procter & Gamble Co. | | 138,000 | | | 8,531,160 |
| | | | | |
|
Independent Power Producers & Energy Traders—0.3% |
NRG Energy, Inc. (a) (b) | | 140,000 | | | 3,266,200 |
| | | | | |
| | |
Industrial Conglomerates—0.6% | | | | | |
General Electric Co. | | 401,000 | | | 6,496,200 |
| | | | | |
| | |
Insurance—2.3% | | | | | |
The Allstate Corp. | | 216,000 | | | 7,076,160 |
The Chubb Corp. | | 144,000 | | | 7,344,000 |
The Travelers Cos., Inc. | | 180,000 | | | 8,136,000 |
W.R. Berkley Corp. | | 144,275 | | | 4,472,525 |
| | | | | |
| | | | | 27,028,685 |
| | | | | |
| | |
IT Services—1.0% | | | | | |
Accenture, Ltd. (Class A) | | 253,000 | | | 8,295,870 |
Automatic Data Processing, Inc. | | 37,000 | | | 1,455,580 |
Computer Sciences Corp. (a) | | 54,500 | | | 1,915,130 |
| | | | | |
| | | | | 11,666,580 |
| | | | | |
*See accompanying notes to financial statements.
MSF-5
Metropolitan Series Fund, Inc.
BlackRock Diversified Portfolio
Schedule of Investments as of December 31, 2008
Common Stock—(Continued)
| | | | | |
| Security Description | | Shares | | Value* |
| | | | | |
| | |
Machinery—0.6% | | | | | |
Cummins, Inc. | | 267,000 | | $ | 7,136,910 |
| | | | | |
| | |
Media—0.1% | | | | | |
Omnicom Group, Inc. | | 52,000 | | | 1,399,840 |
| | | | | |
| | |
Metals & Mining—0.7% | | | | | |
Reliance Steel & Aluminum Co. | | 110,000 | | | 2,193,400 |
United States Steel Corp. (b) | | 177,000 | | | 6,584,400 |
| | | | | |
| | | | | 8,777,800 |
| | | | | |
| | |
Multiline Retail—0.4% | | | | | |
Dollar Tree, Inc. (a) | | 126,000 | | | 5,266,800 |
| | | | | |
| | |
Oil, Gas & Consumable Fuels—12.4% | | | | | |
Anadarko Petroleum Corp. | | 223,000 | | | 8,596,650 |
Apache Corp. | | 117,000 | | | 8,720,010 |
Chevron Corp. | | 253,000 | | | 18,714,410 |
ConocoPhillips (b) | | 252,000 | | | 13,053,600 |
Devon Energy Corp. | | 94,000 | | | 6,176,740 |
Exxon Mobil Corp. | | 488,000 | | | 38,957,040 |
Hess Corp. | | 134,000 | | | 7,187,760 |
Marathon Oil Corp. | | 318,000 | | | 8,700,480 |
Murphy Oil Corp. | | 178,000 | | | 7,894,300 |
Occidental Petroleum Corp. | | 183,000 | | | 10,978,170 |
Sunoco, Inc. (b) | | 167,000 | | | 7,257,820 |
Valero Energy Corp. | | 357,000 | | | 7,725,480 |
| | | | | |
| | | | | 143,962,460 |
| | | | | |
| | |
Pharmaceuticals—6.9% | | | | | |
Bristol-Myers Squibb Co. | | 434,000 | | | 10,090,500 |
Eli Lilly & Co. | | 251,000 | | | 10,107,770 |
Forest Laboratories, Inc. (a) | | 220,000 | | | 5,603,400 |
Johnson & Johnson | | 330,000 | | | 19,743,900 |
Pfizer, Inc. | | 925,000 | | | 16,381,750 |
Schering-Plough Corp. | | 482,000 | | | 8,208,460 |
Wyeth | | 282,000 | | | 10,577,820 |
| | | | | |
| | | | | 80,713,600 |
| | | | | |
| | |
Road & Rail—1.8% | | | | | |
CSX Corp. | | 210,000 | | | 6,818,700 |
Norfolk Southern Corp. | | 125,000 | | | 5,881,250 |
Union Pacific Corp. (b) | | 172,000 | | | 8,221,600 |
| | | | | |
| | | | | 20,921,550 |
| | | | | |
| |
Semiconductors & Semiconductor Equipment—3.4% | | | |
Altera Corp. | | 440,000 | | | 7,352,400 |
Broadcom Corp. (a) | | 437,000 | | | 7,415,890 |
Integrated Device Technology, Inc. (a) | | 460,000 | | | 2,580,600 |
Intersil Corp. | | 274,000 | | | 2,518,060 |
KLA-Tencor Corp. (b) | | 230,000 | | | 5,011,700 |
Microchip Technology, Inc. (b) | | 200,000 | | | 3,906,000 |
Silicon Laboratories, Inc. (a) (b) | | 110,000 | | | 2,725,800 |
Xilinx, Inc. (b) | | 422,000 | | | 7,520,040 |
| | | | | |
| | | | | 39,030,490 |
| | | | | |
| | | | | | |
| Security Description | | Shares | | Value* |
| | | | | | |
| | |
Software—3.5% | | | | | | |
Adobe Systems, Inc. (a) | | | 334,000 | | $ | 7,110,860 |
Autodesk, Inc. (a) (b) | | | 210,000 | | | 4,126,500 |
BMC Software, Inc. (a) (b) | | | 46,100 | | | 1,240,551 |
CA, Inc. | | | 57,200 | | | 1,059,916 |
McAfee, Inc. (a) | | | 46,100 | | | 1,593,677 |
Microsoft Corp. | | | 278,000 | | | 5,404,320 |
Oracle Corp. (a) (b) | | | 619,000 | | | 10,974,870 |
Symantec Corp. (a) | | | 571,000 | | | 7,719,920 |
Synopsys, Inc. (a) | | | 53,100 | | | 983,412 |
| | | | | | |
| | | | | | 40,214,026 |
| | | | | | |
| | |
Specialty Retail—1.8% | | | | | | |
AutoZone, Inc. (a) | | | 56,000 | | | 7,810,320 |
Ross Stores, Inc. | | | 228,000 | | | 6,778,440 |
The Gap, Inc. | | | 493,000 | | | 6,601,270 |
| | | | | | |
| | | | | | 21,190,030 |
| | | | | | |
| |
Textiles, Apparel & Luxury Goods—1.2% | | | |
Coach, Inc. (a) | | | 351,000 | | | 7,290,270 |
Polo Ralph Lauren Corp. (b) | | | 136,000 | | | 6,175,760 |
| | | | | | |
| | | | | | 13,466,030 |
| | | | | | |
Total Common Stock
(Identified Cost $830,033,545) | | | | | | 677,586,603 |
| | | | | | |
| |
| Fixed Income—49.7% | | | |
| Security Description | | Face
Amount | | Value* |
| | |
Aerospace & Defense—0.0% | | | | | | |
L-3 Communications Corp.
5.875%, 01/15/15 | | $ | 150,000 | | | 135,000 |
6.375%, 10/15/15 | | | 75,000 | | | 70,125 |
| | | | | | |
| | | | | | 205,125 |
| | | | | | |
| | |
Air Freight & Logistics—0.0% | | | | | | |
United Parcel Service, Inc.
6.200%, 01/15/38 | | | 395,000 | | | 435,469 |
| | | | | | |
| | |
Asset Backed—2.0% | | | | | | |
ARES CLO Funds (144A)
4.819%, 02/26/16 (c) | | | 1,150,000 | | | 182,896 |
Chase Issuance Trust
5.120%, 10/15/14 | | | 4,500,000 | | | 4,174,604 |
Countrywide Asset-Backed Certificates
0.621%, 07/25/36 (c) | | | 3,226,460 | | | 2,291,330 |
2.196%, 12/25/31 (c) | | | 60,341 | | | 25,250 |
Ford Credit Auto Owner Trust
5.070%, 12/15/10 | | | 4,150,000 | | | 4,074,936 |
GSAA Trust
0.571%, 03/25/47 (c) | | | 2,107,574 | | | 1,117,489 |
Home Equity Asset Trust
0.581%, 07/25/37 (c) | | | 1,270,853 | | | 1,059,256 |
Knollwood CDO, Ltd. (144A)
7.489%, 02/08/39 (c) (d) (h) | | | 443,756 | | | 0 |
*See accompanying notes to financial statements.
MSF-6
Metropolitan Series Fund, Inc.
BlackRock Diversified Portfolio
Schedule of Investments as of December 31, 2008
Fixed Income—(Continued)
| | | | | | |
| Security Description | | Face
Amount | | Value* |
| | | | | | |
| | |
Asset Backed—(Continued) | | | | | | |
Long Beach Mortgage Loan Trust
1.571%, 03/25/34 (c) | | $ | 513,155 | | $ | 308,047 |
SLM Student Loan Trust
4.635%, 10/25/16 (c) | | | 6,010,000 | | | 5,624,044 |
4.835%, 01/25/28 (c) | | | 1,520,000 | | | 1,347,576 |
5.235%, 07/25/23 (c) | | | 4,100,000 | | | 3,379,298 |
Structured Asset Investment Loan Trust
3.396%, 04/25/33 (c) | | | 40,741 | | | 7,078 |
| | | | | | |
| | | | | | 23,591,804 |
| | | | | | |
| | |
Capital Markets—0.6% | | | | | | |
Lehman Brothers Holdings, Inc.
5.250%, 02/06/12 (e) | | | 1,310,000 | | | 124,450 |
6.500%, 07/19/17 (e) | | | 900,000 | | | 90 |
6.750%, 12/28/17 (e) | | | 2,075,000 | | | 208 |
7.000%, 09/27/27 (e) | | | 1,110,000 | | | 105,450 |
Morgan Stanley
4.570%, 01/09/12 (c) | | | 6,605,000 | | | 5,211,424 |
6.750%, 04/15/11 | | | 550,000 | | | 541,159 |
The Bear Stearns Cos., LLC
4.903%, 07/19/10 (c) | | | 790,000 | | | 764,523 |
| | | | | | |
| | | | | | 6,747,304 |
| | | | | | |
| |
Collateralized-Mortgage Obligation—3.2% | | | |
American Home Mortgage Assets
0.661%, 11/25/36 (c) | | | 630,254 | | | 260,938 |
Bear Stearns Adjustable Rate Mortgage Trust
5.995%, 06/25/47 (c) | | | 4,442,765 | | | 2,700,880 |
Citicorp Mortgage Securities, Inc.
6.000%, 10/25/36 | | | 1,555,139 | | | 1,468,921 |
Countrywide Alternative Loan Trust
0.698%, 03/20/47 (c) | | | 1,859,268 | | | 761,865 |
3.216%, 08/25/46 (c) | | | 699,228 | | | 301,250 |
5.500%, 11/25/35 | | | 2,500,000 | | | 1,114,356 |
5.500%, 04/25/37 | | | 2,115,114 | | | 1,253,236 |
Countrywide Home Loan Mortgage Pass Through Trust
0.671%, 04/25/46 (c) | | | 811,159 | | | 317,622 |
6.500%, 10/25/37 | | | 2,236,751 | | | 1,517,497 |
Credit Suisse Mortgage Capital Certificates
6.000%, 10/25/21 | | | 1,067,935 | | | 627,412 |
CS First Boston Mortgage Securities Corp.
6.000%, 01/25/36 | | | 2,295,407 | | | 1,215,131 |
Deutsche ALT-A Securities, Inc. Alternate Loan Trust
0.671%, 02/25/47 (c) | | | 913,565 | | | 370,791 |
GSR Mortgage Loan Trust
0.661%, 08/25/46 (c) | | | 1,928,742 | | | 937,286 |
5.244%, 11/25/35 (c) | | | 1,935,408 | | | 1,439,851 |
6.000%, 07/25/37 | | | 2,187,941 | | | 1,486,432 |
Harborview Mortgage Loan Trust
0.791%, 11/19/36 (c) | | | 1,362,215 | | | 585,869 |
0.891%, 11/19/35 (c) | | | 1,757,016 | | | 800,465 |
0.911%, 09/19/35 (c) | | | 206,060 | | | 95,539 |
| | | | | | |
| Security Description | | Face
Amount | | Value* |
| | | | | | |
| |
Collateralized-Mortgage Obligation—(Continued) | | | |
IndyMac INDA Mortgage Loan Trust
5.899%, 09/25/36 (c) | | $ | 1,381,615 | | $ | 748,984 |
JPMorgan Mortgage Trust
3.883%, 08/25/34 (c) | | | 3,515,965 | | | 2,625,442 |
5.432%, 08/25/35 (c) | | | 9,597,212 | | | 7,695,634 |
5.500%, 03/25/22 | | | 445,789 | | | 302,997 |
5.875%, 07/25/36 | | | 494,398 | | | 364,619 |
6.500%, 08/25/36 | | | 1,607,132 | | | 1,180,187 |
WaMu Mortgage Pass-Through Certificates
4.919%, 08/25/35 (c) | | | 1,516,942 | | | 889,818 |
5.647%, 03/25/37 (c) | | | 5,326,725 | | | 2,668,078 |
5.706%, 02/25/37 (c) | | | 2,121,049 | | | 1,156,987 |
Wells Fargo Mortgage Backed Securities Trust
5.500%, 03/25/36 | | | 1,610,181 | | | 1,406,446 |
6.099%, 09/25/36 (c) | | | 1,366,946 | | | 876,053 |
| | | | | | |
| | | | | | 37,170,586 |
| | | | | | |
| | |
Commercial Banks—1.2% | | | | | | |
Barclays Bank, Plc. (144A)
7.434%, 09/29/49 (c) | | | 2,090,000 | | | 1,056,662 |
Royal Bank of Scotland Group, Plc.
7.640%, 03/31/49 (c) | | | 2,000,000 | | | 796,568 |
UBS AG (Stamford Branch)
5.750%, 04/25/18 | | | 1,100,000 | | | 998,355 |
5.875%, 12/20/17 | | | 3,375,000 | | | 3,100,427 |
Wachovia Bank, N.A.
6.600%, 01/15/38 | | | 1,550,000 | | | 1,681,607 |
Wachovia Corp.
7.980%, 12/31/49 (c) | | | 4,100,000 | | | 3,494,840 |
Wells Fargo & Co.
4.625%, 08/09/10 | | | 1,710,000 | | | 1,717,863 |
4.875%, 01/12/11 (b) | | | 590,000 | | | 590,022 |
| | | | | | |
| | | | | | 13,436,344 |
| | | | | | |
| |
Commercial Mortgage-Backed Securities—7.0% | | | |
Banc of America Commercial Mortgage, Inc.
4.988%, 11/10/42 (c) | | | 3,630,000 | | | 3,358,877 |
7.333%, 10/15/09 | | | 3,180,948 | | | 3,172,008 |
Bear Stearns Commercial Mortgage Securities
4.361%, 06/11/41 | | | 1,822,144 | | | 1,795,251 |
4.674%, 06/11/41 | | | 930,000 | | | 785,698 |
5.742%, 09/11/42 (c) | | | 3,875,000 | | | 3,026,875 |
5.920%, 10/15/36 | | | 834,200 | | | 825,146 |
Chase Commerical Mortgage Securities Corp.
7.319%, 10/15/32 | | | 1,398,396 | | | 1,391,605 |
Citigroup Commercial Mortgage Trust
5.700%, 06/10/17 (c) | | | 1,750,000 | | | 801,542 |
Citigroup/Deutsche Bank Commercial Mortgage Trust
5.886%, 11/15/44 | | | 1,750,000 | | | 1,319,660 |
Credit Suisse Mortgage Capital Certificates
5.311%, 12/15/39 | | | 4,000,000 | | | 3,103,698 |
*See accompanying notes to financial statements.
MSF-7
Metropolitan Series Fund, Inc.
BlackRock Diversified Portfolio
Schedule of Investments as of December 31, 2008
Fixed Income—(Continued)
| | | | | | |
| Security Description | | Face
Amount | | Value* |
| | | | | | |
|
Commercial Mortgage-Backed Securities—(Continued) |
CS First Boston Mortgage Securities Corp.
3.936%, 05/15/38 (c) | | $ | 4,000,000 | | $ | 3,402,539 |
4.940%, 12/15/35 | | | 4,405,000 | | | 3,963,086 |
5.183%, 11/15/36 | | | 2,890,000 | | | 2,641,564 |
5.603%, 07/15/35 | | | 3,850,000 | | | 3,577,465 |
First Union National Bank Commercial Mortgage
6.663%, 01/12/43 | | | 3,641,263 | | | 3,578,789 |
First Union National Bank Commercial Mortgage Trust (144A)
7.793%, 12/15/31 (c) | | | 3,700,000 | | | 3,585,366 |
GE Business Loan Trust (144A)
2.495%, 04/15/31 (c) | | | 462,544 | | | 179,462 |
GE Capital Commercial Mortgage Corp.
4.578%, 06/10/48 | | | 3,480,000 | | | 2,910,833 |
4.996%, 12/10/37 | | | 4,340,000 | | | 3,935,650 |
6.269%, 12/10/35 | | | 3,440,000 | | | 3,230,513 |
GMAC Commercial Mortgage Securities, Inc.
7.455%, 08/16/33 | | | 2,971,795 | | | 2,965,692 |
Greenwich Capital Commercial Funding Corp.
5.301%, 04/10/37 (c) | | | 1,120,000 | | | 500,029 |
5.914%, 07/10/38 | | | 3,280,000 | | | 2,559,906 |
JPMorgan Chase Commercial Mortgage Securities Corp.
5.804%, 06/15/49 (c) | | | 1,700,000 | | | 1,299,523 |
5.827%, 02/15/51 (c) | | | 1,390,000 | | | 1,083,756 |
JPMorgan Commercial Mortgage Finance Corp.
7.351%, 09/15/29 | | | 584,999 | | | 582,584 |
LB-UBS Commercial Mortgage Trust
4.023%, 09/15/26 | | | 822,273 | | | 809,776 |
4.071%, 09/15/26 | | | 1,407,057 | | | 1,345,690 |
5.372%, 09/15/39 | | | 1,570,000 | | | 1,231,674 |
5.430%, 02/15/40 (c) | | | 2,800,000 | | | 2,012,372 |
5.642%, 12/15/25 (c) | | | 856,608 | | | 834,850 |
5.934%, 12/15/25 | | | 777,358 | | | 760,712 |
7.950%, 05/15/25 (c) | | | 3,504,091 | | | 3,519,236 |
LB-UBS Commercial Mortgage Trust (144A)
6.155%, 07/14/16 | | | 1,924,291 | | | 1,890,841 |
Morgan Stanley Capital I
5.632%, 04/12/49 (c) | | | 620,000 | | | 466,460 |
5.650%, 06/11/42 (c) | | | 5,925,000 | | | 4,522,932 |
5.693%, 10/15/42 | | | 1,130,000 | | | 969,621 |
Salomon Brothers Mortgage Securities VII, Inc.
6.499%, 10/13/11 | | | 3,661,933 | | | 3,557,110 |
Wachovia Bank Commercial Mortgage Trust
5.368%, 11/15/48 (c) | | | 430,000 | | | 120,796 |
5.632%, 10/15/48 (c) | | | 430,000 | | | 126,278 |
| | | | | | |
| | | | | | 81,745,465 |
| | | | | | |
| | |
Computers & Peripherals—0.2% | | | | | | |
International Business Machines Corp.
5.700%, 09/14/17 | | | 1,420,000 | | | 1,518,143 |
7.625%, 10/15/18 | | | 900,000 | | | 1,079,276 |
| | | | | | |
| | | | | | 2,597,419 |
| | | | | | |
| | | | | | |
| Security Description | | Face
Amount | | Value* |
| | | | | | |
| | |
Consumer Finance—0.2% | | | | | | |
SLM Corp.
4.000%, 01/15/09 | | $ | 700,000 | | $ | 696,803 |
5.125%, 08/27/12 | | | 1,700,000 | | | 1,272,211 |
5.400%, 10/25/11 | | | 890,000 | | | 673,226 |
| | | | | | |
| | | | | | 2,642,240 |
| | | | | | |
| | |
Diversified Financial Services—2.5% | | | | | | |
AES Ironwood, LLC
8.857%, 11/30/25 | | | 118,328 | | | 102,945 |
AES Red Oak, LLC
9.200%, 11/30/29 | | | 50,000 | | | 43,000 |
Bank of America Corp.
5.650%, 05/01/18 | | | 785,000 | | | 789,658 |
5.750%, 12/01/17 (g) | | | 920,000 | | | 918,566 |
7.800%, 09/15/16 | | | 925,000 | | | 941,637 |
8.000%, 12/29/49 (c) | | | 1,925,000 | | | 1,384,629 |
8.125%, 12/29/49 (c) | | | 920,000 | | | 688,160 |
Citigroup Capital XXI
8.300%, 12/21/57 (c) | | | 875,000 | | | 674,832 |
Citigroup, Inc.
4.125%, 02/22/10 (g) | | | 2,000,000 | | | 1,970,850 |
Credit Suisse Guernsey, Ltd.
5.860%, 05/29/49 | | | 2,070,000 | | | 966,137 |
Devon Financing Corp.
7.875%, 09/30/31 | | | 575,000 | | | 633,135 |
Gaz Capital S.A. (144A)
7.288%, 08/16/37 | | | 1,060,000 | | | 625,400 |
General Electric Capital Corp.
5.000%, 11/15/11 | | | 5,220,000 | | | 5,290,000 |
5.000%, 04/10/12 | | | 1,080,000 | | | 1,070,506 |
6.150%, 08/01/37 | | | 1,610,000 | | | 1,614,212 |
6.375%, 11/15/67 (b) (c) | | | 1,700,000 | | | 1,068,567 |
GlaxoSmithKline Capital, Inc.
4.850%, 05/15/13 (b) | | | 1,450,000 | | | 1,454,433 |
Goldman Sachs Capital II
5.793%, 12/29/49 (c) | | | 1,510,000 | | | 580,479 |
Icahn Enterprises, L.P.
8.125%, 06/01/12 | | | 145,000 | | | 111,650 |
JPMorgan Chase & Co.
7.900%, 12/31/49 (c) | | | 1,775,000 | | | 1,476,498 |
JPMorgan Chase Bank, N.A.
6.000%, 07/05/17 | | | 2,500,000 | | | 2,521,495 |
JPMorgan Chase Capital XXV
6.800%, 10/01/37 | | | 1,880,000 | | | 1,732,204 |
Lehman Brothers Holdings Capital Trust VII
5.857%, 11/29/49 (e) | | | 305,000 | | | 31 |
Petrobras International Finance Co.
5.875%, 03/01/18 | | | 570,000 | | | 512,430 |
Telecom Italia Capital S.A.
5.250%, 10/01/15 | | | 975,000 | | | 742,219 |
Wind Acquisition Finance S.A. (144A)
10.750%, 12/01/15 | | | 295,000 | | | 253,700 |
ZFS Finance USA Trust I (144A)
6.500%, 05/09/37 (c) | | | 900,000 | | | 369,000 |
| | | | | | |
| | | | | | 28,536,373 |
| | | | | | |
*See accompanying notes to financial statements.
MSF-8
Metropolitan Series Fund, Inc.
BlackRock Diversified Portfolio
Schedule of Investments as of December 31, 2008
Fixed Income—(Continued)
| | | | | | |
| Security Description | | Face
Amount | | Value* |
| | | | | | |
| |
Diversified Telecommunication Services—0.7% | | | |
AT&T, Inc.
6.500%, 09/01/37 | | $ | 2,850,000 | | $ | 3,069,421 |
Cincinnati Bell, Inc.
7.250%, 07/15/13 | | | 50,000 | | | 44,000 |
GTE Corp.
6.940%, 04/15/28 | | | 100,000 | | | 92,537 |
Qwest Communications International, Inc.
7.500%, 02/15/14 | | | 315,000 | | | 225,225 |
Qwest Communications International, Inc. (Series B)
7.500%, 02/15/14 | | | 155,000 | | | 110,825 |
Qwest Corp.
5.246%, 06/15/13 (c) | | | 285,000 | | | 212,325 |
Verizon Communications, Inc.
8.750%, 11/01/18 | | | 3,400,000 | | | 3,988,955 |
Windstream Corp.
8.125%, 08/01/13 | | | 410,000 | | | 377,200 |
8.625%, 08/01/16 | | | 115,000 | | | 101,775 |
| | | | | | |
| | | | | | 8,222,263 |
| | | | | | |
| | |
Electric Utilities—0.5% | | | | | | |
Elwood Energy, LLC
8.159%, 07/05/26 | | | 115,970 | | | 78,623 |
Florida Power & Light Co.
5.625%, 04/01/34 | | | 300,000 | | | 318,348 |
5.950%, 02/01/38 | | | 525,000 | | | 584,771 |
Florida Power Corp.
6.400%, 06/15/38 | | | 525,000 | | | 586,289 |
MidAmerican Energy Holdings Co.
5.950%, 05/15/37 | | | 1,125,000 | | | 1,020,097 |
6.500%, 09/15/37 (c) | | | 725,000 | | | 707,705 |
PECO Energy Co.
4.750%, 10/01/12 | | | 650,000 | | | 632,681 |
Southern California Edison Co.
5.950%, 02/01/38 (b) | | | 475,000 | | | 529,079 |
Texas Competitive Electric Holdings Co., LLC (144A)
10.250%, 11/01/15 | | | 1,365,000 | | | 969,150 |
| | | | | | |
| | | | | | 5,426,743 |
| | | | | | |
| | |
Energy Equipment & Services—0.1% | | | | | | |
Tennessee Gas Pipeline Co.
7.000%, 10/15/28 (b) | | | 190,000 | | | 145,376 |
Transocean, Ltd.
6.000%, 03/15/18 | | | 295,000 | | | 268,686 |
6.800%, 03/15/38 | | | 385,000 | | | 343,400 |
| | | | | | |
| | | | | | 757,462 |
| | | | | | |
| | |
Federal Agencies—27.5% | | | | | | |
Federal Home Loan Bank
3.625%, 10/18/13 (b) | | | 5,550,000 | | | 5,838,533 |
5.500%, 06/01/35 | | | 3,376,154 | | | 3,462,284 |
5.625%, 06/13/16 | | | 1,640,000 | | | 1,722,061 |
| | | | | | |
| Security Description | | Face
Amount | | Value* |
| | | | | | |
| | |
Federal Agencies—(Continued) | | | | | | |
Federal Home Loan Mortgage Corp.
4.500%, TBA | | $ | 11,000,000 | | $ | 11,244,068 |
4.500%, TBA | | | 1,400,000 | | | 1,418,375 |
5.000%, 06/01/36 | | | 921,721 | | | 943,075 |
5.000%, TBA | | | 12,200,000 | | | 12,466,875 |
5.355%, 09/15/33 (c) (f) | | | 34,539,235 | | | 3,090,650 |
5.500%, 07/01/33 | | | 2,943,572 | | | 3,026,145 |
5.500%, 10/01/35 | | | 656,531 | | | 672,870 |
5.500%, TBA | | | 17,900,000 | | | 18,319,540 |
5.674%, 01/01/37 (c) | | | 2,598,286 | | | 2,652,135 |
5.743%, 04/01/37 (c) | | | 2,965,684 | | | 3,025,831 |
6.000%, 08/01/38 | | | 5,855,117 | | | 6,038,009 |
6.000%, 09/01/38 | | | 9,758,418 | | | 10,062,260 |
6.000%, TBA | | | 2,000,000 | | | 2,070,000 |
Federal National Mortgage Association
4.000%, 04/01/23 | | | 1,147,011 | | | 1,160,786 |
4.000%, 05/01/23 | | | 1,833,064 | | | 1,854,832 |
4.000%, TBA | | | 2,800,000 | | | 2,788,625 |
4.500%, 08/01/35 | | | 2,986,100 | | | 3,031,909 |
4.500%, TBA | | | 9,600,000 | | | 9,725,504 |
4.919%, 06/01/38 (c) | | | 3,438,824 | | | 3,478,189 |
5.000%, 06/01/23 | | | 1,269,706 | | | 1,302,130 |
5.000%, 09/01/33 | | | 16,415,795 | | | 16,803,805 |
5.000%, 03/01/34 | | | 9,143,842 | | | 9,359,969 |
5.000%, 08/01/34 | | | 4,718,241 | | | 4,829,763 |
5.000%, 07/01/35 | | | 200,149 | | | 204,630 |
5.000%, 12/01/35 | | | 299,033 | | | 305,728 |
5.000%, 02/01/36 | | | 3,883,926 | | | 3,970,873 |
5.000%, 05/01/36 | | | 1,557,378 | | | 1,592,242 |
5.000%, 07/01/36 (f) | | | 5,755,240 | | | 551,512 |
5.000%, TBA | | | 8,000,000 | | | 8,210,000 |
5.125%, 01/02/14 | | | 1,350,000 | | | 1,426,626 |
5.494%, 09/01/38 (c) | | | 3,342,190 | | | 3,418,696 |
5.500%, 10/01/18 | | | 934,555 | | | 966,964 |
5.500%, 12/01/18 | | | 604,894 | | | 625,871 |
5.500%, 01/01/19 | | | 1,023,944 | | | 1,059,453 |
5.500%, 03/01/19 | | | 21,867 | | | 22,626 |
5.500%, 05/01/19 | | | 1,294,610 | | | 1,340,315 |
5.500%, 07/01/19 | | | 417,490 | | | 431,446 |
5.500%, 09/01/19 | | | 9,541,173 | | | 9,876,250 |
5.500%, 06/01/20 | | | 1,284,993 | | | 1,330,358 |
5.500%, 01/01/21 | | | 84,903 | | | 87,595 |
5.500%, 02/01/21 | | | 176,926 | | | 182,536 |
5.500%, 01/01/24 | | | 778,857 | | | 801,274 |
5.500%, 05/01/34 | | | 13,744,823 | | | 14,123,392 |
5.500%, 11/01/34 | | | 5,007,131 | | | 5,141,911 |
5.500%, 04/01/35 | | | 1,437,998 | | | 1,475,806 |
5.500%, 06/01/35 | | | 1,475,416 | | | 1,514,209 |
5.500%, 11/01/35 (f) | | | 4,624,319 | | | 499,117 |
5.500%, 12/01/35 | | | 7,906,738 | | | 8,117,426 |
5.500%, 01/25/36 (f) | | | 1,802,204 | | | 190,701 |
5.500%, 12/01/36 (c) | | | 15,030,195 | | | 15,425,378 |
5.500%, 05/01/38 | | | 81,466 | | | 83,596 |
6.000%, 04/01/16 | | | 359,748 | | | 379,246 |
6.000%, 03/01/21 | | | 140,628 | | | 146,098 |
6.000%, 05/01/21 | | | 758,686 | | | 788,197 |
*See accompanying notes to financial statements.
MSF-9
Metropolitan Series Fund, Inc.
BlackRock Diversified Portfolio
Schedule of Investments as of December 31, 2008
Fixed Income—(Continued)
| | | | | | |
| Security Description | | Face
Amount | | Value* |
| | | | | | |
| | |
Federal Agencies—(Continued) | | | | | | |
Federal National Mortgage Association
6.000%, 06/01/21 | | $ | 79,015 | | $ | 82,089 |
6.000%, 07/01/21 | | | 967,244 | | | 1,004,867 |
6.000%, 08/01/21 | | | 1,039,674 | | | 1,080,113 |
6.000%, 02/01/34 | | | 2,205,800 | | | 2,277,927 |
6.000%, 08/01/34 | | | 1,307,638 | | | 1,350,397 |
6.000%, 04/01/35 | | | 5,231,940 | | | 5,406,288 |
6.000%, 06/01/36 | | | 3,649,731 | | | 3,761,660 |
6.000%, 07/01/36 | | | 3,507,842 | | | 3,615,419 |
6.000%, 09/01/36 | | | 3,503,785 | | | 3,611,237 |
6.000%, 06/01/37 | | | 1,352,475 | | | 1,393,876 |
6.000%, 07/01/38 | | | 4,533,542 | | | 4,671,867 |
6.250%, 02/01/11 | | | 3,285,000 | | | 3,480,927 |
6.500%, 12/01/29 (c) | | | 791,541 | | | 828,892 |
6.500%, TBA | | | 4,200,000 | | | 4,361,440 |
7.000%, 04/01/37 | | | 2,537,555 | | | 2,671,935 |
7.500%, 11/01/37 | | | 784,668 | | | 823,631 |
9.000%, 04/01/16 | | | 26 | | | 26 |
Government National Mortgage Association
5.000%, 10/20/33 | | | 5,176,754 | | | 5,315,545 |
5.500%, 04/15/33 | | | 374,409 | | | 386,956 |
5.500%, TBA | | | 9,100,000 | | | 9,337,454 |
5.500%, TBA | | | 8,300,000 | | | 8,484,194 |
6.000%, 02/15/09 | | | 133 | | | 133 |
6.000%, 09/20/33 | | | 775,322 | | | 800,340 |
6.000%, 10/20/33 | | | 1,265,863 | | | 1,310,002 |
6.000%, 11/20/33 | | | 1,730,459 | | | 1,786,298 |
6.000%, TBA | | | 11,900,000 | | | 12,240,669 |
6.500%, 07/15/14 | | | 20,747 | | | 21,872 |
6.500%, 07/15/31 | | | 4,424,075 | | | 4,665,604 |
6.500%, 10/15/32 | | | 427,650 | | | 451,018 |
6.500%, 06/15/34 | | | 4,341,217 | | | 4,578,372 |
6.500%, 08/15/34 | | | 3,331,928 | | | 3,491,458 |
6.500%, TBA | | | 1,500,000 | | | 1,553,534 |
7.500%, 12/15/14 | | | 368,782 | | | 390,182 |
| | | | | | |
| | | | | | 319,914,517 |
| | | | | | |
| | |
Food Products—0.3% | | | | | | |
Kraft Foods, Inc.
6.125%, 02/01/18 | | | 950,000 | | | 930,902 |
6.500%, 08/11/17 | | | 1,830,000 | | | 1,839,410 |
| | | | | | |
| | | | | | 2,770,312 |
| | | | | | |
| | |
Foreign Government—2.0% | | | | | | |
Emirate of Abu Dhabi (144A)
5.500%, 08/02/12 | | | 4,600,000 | | | 5,089,440 |
Federal Republic of Germany
4.000%, 01/04/37 (EUR) | | | 515,000 | | | 767,018 |
4.250%, 07/04/39 (EUR) | | | 850,000 | | | 1,341,901 |
Israel Government AID Bond
5.500%, 12/04/23 | | | 3,175,000 | | | 3,932,841 |
Japan Government
1.000%, 11/20/21 (JPY) (c) | | | 482,000,000 | | | 5,220,913 |
U.K. Treasury Bond
4.250%, 12/07/49 (GBP) | | | 780,000 | | | 1,224,338 |
| | | | | | |
| Security Description | | Face
Amount | | Value* |
| | | | | | |
| |
Foreign Government—(Continued) | | | |
United Mexican States
7.250%, 12/15/16 (MXN) | | $ | 17,000,000 | | $ | 1,176,380 |
10.000%, 12/05/24 (MXN) | | | 56,820,000 | | | 4,713,083 |
| | | | | | |
| | | | | | 23,465,914 |
| | | | | | |
| | |
Gas Utilities—0.0% | | | | | | |
CenterPoint Energy, Inc.
7.250%, 09/01/10 | | | 345,000 | | | 339,643 |
| | | | | | |
| |
Health Care Providers & Services—0.1% | | | |
WellPoint, Inc.
5.950%, 12/15/34 | | | 700,000 | | | 581,537 |
| | | | | | |
| | |
Hotels, Restaurants & Leisure—0.0% | | | | | | |
Harrah’s Operating Co., Inc. (144A)
10.000%, 12/15/18 | | | 275,000 | | | 100,375 |
10.750%, 02/01/18 | | | 1,118,000 | | | 145,340 |
| | | | | | |
| | | | | | 245,715 |
| | | | | | |
|
Independent Power Producers & Energy Traders—0.0% |
NRG Energy, Inc.
7.375%, 02/01/16 | | | 170,000 | | | 158,100 |
| | | | | | |
| | |
Insurance—0.3% | | | | | | |
American International Group, Inc. (144A)
8.175%, 05/15/58 | | | 2,450,000 | | | 953,111 |
Chubb Corp.
6.375%, 03/29/67 (c) | | | 1,100,000 | | | 682,211 |
Lincoln National Corp.
6.050%, 04/20/67 | | | 675,000 | | | 270,000 |
7.000%, 05/17/66 (c) | | | 640,000 | | | 268,800 |
The Progressive Corp.
6.700%, 06/15/37 (c) | | | 1,040,000 | | | 511,247 |
The Travelers Cos., Inc.
6.250%, 03/15/67 (c) | | | 735,000 | | | 481,452 |
| | | | | | |
| | | | | | 3,166,821 |
| | | | | | |
| | |
Media—0.6% | | | | | | |
Comcast Corp.
6.500%, 11/15/35 | | | 555,000 | | | 552,358 |
6.950%, 08/15/37 | | | 450,000 | | | 473,874 |
7.050%, 03/15/33 | | | 275,000 | | | 286,850 |
CSC Holdings, Inc.
8.125%, 07/15/09 | | | 135,000 | | | 134,325 |
News America, Inc.
6.200%, 12/15/34 | | | 640,000 | | | 584,030 |
TCI Communications, Inc.
7.875%, 02/15/26 | | | 1,300,000 | | | 1,348,946 |
Time Warner Cable, Inc.
6.200%, 07/01/13 | | | 1,250,000 | | | 1,182,369 |
Time Warner Entertainment Co., L.P.
8.375%, 03/15/23 | | | 350,000 | | | 352,472 |
Time Warner, Inc.
6.875%, 05/01/12 | | | 1,875,000 | | | 1,801,305 |
| | | | | | |
| | | | | | 6,716,529 |
| | | | | | |
*See accompanying notes to financial statements.
MSF-10
Metropolitan Series Fund, Inc.
BlackRock Diversified Portfolio
Schedule of Investments as of December 31, 2008
Fixed Income—(Continued)
| | | | | | |
| Security Description | | Face
Amount | | Value* |
| | | | | | |
| | |
Metals & Mining—0.1% | | | | | | |
Freeport-McMoRan Copper & Gold, Inc.
8.250%, 04/01/15 | | $ | 485,000 | | $ | 412,250 |
8.375%, 04/01/17 | | | 965,000 | | | 791,300 |
Ispat Inland, U.L.C.
9.750%, 04/01/14 | | | 155,000 | | | 132,668 |
| | | | | | |
| | | | | | 1,336,218 |
| | | | | | |
| | |
Office Electronics—0.1% | | | | | | |
Xerox Corp.
6.875%, 08/15/11 | | | 975,000 | | | 842,797 |
| | | | | | |
| | |
Oil, Gas & Consumable Fuels—0.3% | | | | | | |
Anadarko Petroleum Corp.
5.950%, 09/15/16 | | | 1,140,000 | | | 1,006,972 |
Canadian Natural Resources, Ltd.
6.250%, 03/15/38 | | | 800,000 | | | 628,796 |
Newfield Exploration Co.
6.625%, 09/01/14 | | | 395,000 | | | 323,900 |
6.625%, 04/15/16 | | | 375,000 | | | 298,125 |
Sabine Pass LNG, L.P.
7.500%, 11/30/16 | | | 700,000 | | | 504,000 |
XTO Energy, Inc.
6.750%, 08/01/37 | | | 900,000 | | | 842,908 |
| | | | | | |
| | | | | | 3,604,701 |
| | | | | | |
| | |
Software—0.1% | | | | | | |
Oracle Corp.
5.750%, 04/15/18 | | | 980,000 | | | 1,025,049 |
| | | | | | |
| |
Wireless Telecommunication Services—0.1% | | | |
Rogers Communications, Inc.
7.500%, 03/15/15 | | | 240,000 | | | 237,630 |
Vodafone Group, Plc.
6.150%, 02/27/37 | | | 650,000 | | | 642,481 |
7.750%, 02/15/10 | | | 665,000 | | | 679,640 |
| | | | | | |
| | | | | | 1,559,751 |
| | | | | | |
| | |
Yankee—0.0% | | | | | | |
Compton Petroleum Finance Corp.
7.625%, 12/01/13 | | | 35,000 | | | 10,500 |
| | | | | | |
Total Fixed Income
(Identified Cost $623,445,719) | | | | | | 577,252,701 |
| | | | | | |
| | | | | | | |
| |
| Short Term Investments—4.0% | | | | |
| Security Description | | Shares/Face
Amount | | Value* | |
| | | | | | | |
| | |
Mutual Funds—3.3% | | | | | | | |
State Street Navigator Securities Lending Prime Portfolio (i) | | | 38,633,706 | | $ | 38,633,706 | |
| | | | | | | |
| | |
Repurchase Agreement—0.7% | | | | | | | |
State Street Repurchase Agreement dated 12/31/08 at 0.010% to be repurchased at $8,016,004 on 1/02/09, collateralized by $8,085,000 Federal Home Loan Bank 2.730% due 06/10/09 with a value of $8,176,361. | | $ | 8,016,000 | | | 8,016,000 | |
| | | | | | | |
Total Short Term Investments
(Identified Cost $46,649,706) | | | | | | 46,649,706 | |
| | | | | | | |
Total Investments—112.0%
(Identified Cost $1,500,128,970) (j) | | | | | | 1,301,489,010 | |
Liabilities in excess of other assets | | | | | | (139,761,005 | ) |
| | | | | | | |
| Total Net Assets—100% | | | | | $ | 1,161,728,005 | |
| | | | | | | |
| (b) | A portion or all of the security was on loan. As of December 31, 2008, the market value of securities loaned was $38,179,917 and the collateral received consisted of cash in the amount of $38,633,706. The cash collateral is invested in a money market fund managed by an affiliate of the custodian. |
| (c) | Variable or Floating Rate Security. Rate disclosed is as of December 31, 2008. |
| (e) | Non-Income Producing; Defaulted Bond. |
| (f) | Interest Only Certificate. This security receives monthly interest payments but is not entitled to principal payments. |
| (g) | A portion or all of the security was pledged as collateral against open futures contracts. |
| (h) | Security was valued in good faith under procedures established by the Board of Directors. |
| (i) | Represents investment of cash collateral received from securities lending transactions. |
| (j) | The aggregate cost of investments for federal income tax purposes as of December 31, 2008 was $1,528,524,136 and the composition of unrealized appreciation and depreciation of investment securities was $30,459,412 and $(257,494,538), respectively. |
| (144A)— | Securities exempt from registration under Rule 144A of the Securities Act of 1933. These securities may be resold in transactions exempt from registration, normally to qualified institutional buyers. As of December 31, 2008, the market value of 144A securities was $15,400,743, which is 1.3% of total net assets. |
| (TBA)— | A contract for the purchase or sale of a Mortgage Backed Security to be delivered at a future date but does not include a specified pool or precise amount to be delivered. |
*See accompanying notes to financial statements.
MSF-11
Metropolitan Series Fund, Inc.
BlackRock Diversified Portfolio
Schedule of Investments as of December 31, 2008
*See accompanying notes to financial statements.
Forward Contracts
| | | | | | | | | | | | | | |
Forward Currency Contracts | | Delivery Date | | Local
Currency
Amount | | Aggregate
Face
Value | | Valuation as of
12/31/2008 | | Unrealized
Appreciation/
(Depreciation) | |
Euro (sold) | | 1/21/2009 | | 560,000 | | $ | 715,998 | | $ | 778,715 | | $ | (62,717 | ) |
Euro (sold) | | 1/21/2009 | | 1,427,000 | | | 1,812,304 | | | 1,984,332 | | | (172,028 | ) |
Japanese Yen (bought) | | 1/21/2009 | | 229,036,000 | | | 2,552,784 | | | 2,523,197 | | | (29,587 | ) |
Japanese Yen (sold) | | 1/21/2009 | | 675,443,000 | | | 6,752,674 | | | 7,441,084 | | | (688,410 | ) |
Mexican Peso (sold) | | 1/21/2009 | | 6,395,000 | | | 475,175 | | | 458,803 | | | 16,372 | |
Mexican Peso (sold) | | 1/21/2009 | | 76,116,000 | | | 5,934,971 | | | 5,460,873 | | | 474,098 | |
Pound Sterling (sold) | | 1/21/2009 | | 205,000 | | | 301,217 | | | 299,474 | | | 1,743 | |
Pound Sterling (sold) | | 1/21/2009 | | 315,000 | | | 465,639 | | | 460,168 | | | 5,471 | |
Pound Sterling (sold) | | 1/21/2009 | | 325,000 | | | 487,543 | | | 474,776 | | | 12,767 | |
Pound Sterling (sold) | | 1/21/2009 | | 807,000 | | | 1,201,224 | | | 1,178,906 | | | 22,318 | |
| | | | | | | | | | | | | | |
Net Unrealized Depreciation | | $ | (419,973 | ) |
| | | | | | | | | | | | | | |
Futures Contracts
| | | | | | | | | | | | | | | | | |
Futures Contracts—Long | | Expiration Date | | Number of
Contracts | | | Contract
Amount | | | Valuation as of
12/31/2008 | | | Unrealized
Appreciation/
(Depreciation) | |
Eurodollar Futures | | 6/15/2009 | | 278 | | | $ | 67,732,028 | | | $ | 68,714,650 | | | $ | 982,622 | |
German Bond Futures | | 3/6/2009 | | 54 | | | | 9,234,491 | | | | 9,370,822 | | | | 136,331 | |
United Kingdom Long GILT Bond Futures | | 3/27/2009 | | 70 | | | | 11,643,432 | | | | 12,426,333 | | | | 782,901 | |
U.S. Treasury Bonds Futures | | 3/20/2009 | | 137 | | | | 17,857,582 | | | | 18,912,422 | | | | 1,054,840 | |
U.S. Treasury Notes 5 Year Futures | | 3/31/2009 | | 649 | | | | 75,527,478 | | | | 77,266,493 | | | | 1,739,015 | |
| | | | | |
Futures Contracts—Short | | | | | | | | | | | | | | |
U.S. Treasury Notes 2 Year Futures | | 3/31/2009 | | (233 | ) | | | (50,316,347 | ) | | | (50,808,563 | ) | | | (492,216 | ) |
U.S. Treasury Notes 10 Year Futures | | 3/20/2009 | | (265 | ) | | | (32,331,500 | ) | | | (33,323,750 | ) | | | (992,250 | ) |
| | | | | | | | | | | | | | | | | |
Net Unrealized Appreciation | | | $ | 3,211,243 | |
| | | | | | | | | | | | | | | | | |
TBA Sale Commitments
| | | | | | | | |
Federal Agencies | | Face
Amount | | | Value | |
| Federal Home Loan Mortgage Corp. | | | | | | | | |
6.000% (30 Year TBA) | | $ | (6,900,000 | ) | | $ | (7,107,000 | ) |
| Federal National Mortgage Association | | | | | | | | |
5.000% (30 Year TBA) | | | (31,600,000 | ) | | | (32,176,613 | ) |
5.500% (15 Year TBA) | | | (11,800,000 | ) | | | (12,150,318 | ) |
5.500% (30 Year TBA) | | | (27,600,000 | ) | | | (28,214,688 | ) |
6.000% (15 Year TBA) | | | (2,900,000 | ) | | | (3,006,938 | ) |
6.000% (30 Year TBA) | | | (4,700,000 | ) | | | (4,838,063 | ) |
| Government National Mortgage Association | | | | | | | | |
5.500% (30 Year TBA) | | | (6,800,000 | ) | | | (7,001,878 | ) |
6.000% (30 Year TBA) | | | (15,900,000 | ) | | | (16,401,836 | ) |
6.500% (30 Year TBA) | | | (1,500,000 | ) | | | (1,556,627 | ) |
| | | | | | | | |
Total TBA Sale Commitments (Proceeds Cost $(111,478,222)) | | | $ | (112,453,961 | ) |
| | | | | | | | |
MSF-12
Metropolitan Series Fund, Inc.
BlackRock Diversified Portfolio
The Portfolio adopted the provisions of Statement of Financial Accounting Standards No. 157, “Fair Value Measurements” (FAS 157), effective with the beginning of the Portfolio’s fiscal year. FAS 157 establishes a framework for measuring fair value and expands disclosures about fair value measurements in financial statements. The three levels of the hierarchy under FAS 157 are described below:
Level 1 - quoted prices in active markets for identical securities
Level 2 - other significant observable inputs (including quoted prices for similar securities, interest rates, credit risk, etc.)
Level 3 - significant unobservable inputs (including the Portfolio’s own assumptions in determining the fair value of investments)
The inputs or methodology used for valuing securities are not necessarily an indication of the risk associated with investing in those securities.
The following is a summary of the inputs used to value the Portfolio’s net assets as of December 31, 2008:
| | | | | | | | | | | |
| Valuation Inputs | | Investments In
Securities | | TBA Sale
Commitments | | | Other Financial
Instruments* | |
Level 1 - Quoted Prices | | $ | 729,912,794 | | $ | 0 | | | $ | 3,211,243 | |
Level 2 - Other Significant Observable Inputs | | | 571,213,858 | | | (112,453,961 | ) | | | (419,973 | ) |
Level 3 - Significant Unobservable Inputs | | | 362,358 | | | 0 | | | | 0 | |
Total | | $ | 1,301,489,010 | | $ | (112,453,961 | ) | | $ | 2,791,270 | |
* Other financial instruments are derivative instruments not reflected in the Schedule of Investments, such as futures, forwards, swap contracts and written options, which are valued based on the unrealized appreciation/depreciation on the instrument.
Following is a reconciliation of Level 3 assets for which significant unobservable inputs were used to determine fair value:
| | | | | | | | | | |
| | | Investments In
Securities | | | TBA Sale
Commitments | | Other Financial
Instruments |
Balance as of January 1, 2008 | | $ | 1,325,000 | | | $ | 0 | | $ | 0 |
Transfers In (Out) of Level 3 | | | 0 | | | | 0 | | | 0 |
Accrued discounts/premiums | | | (20,790 | ) | | | 0 | | | 0 |
Realized Gain (Loss) | | | 0 | | | | 0 | | | 0 |
Change in unrealized appreciation (depreciation) | | | (941,288 | ) | | | 0 | | | 0 |
Net Purchases (Sales) | | | (564 | ) | | | 0 | | | 0 |
Balance as of December 31, 2008 | | $ | 362,358 | | | $ | 0 | | $ | 0 |
MSF-13
Metropolitan Series Fund, Inc.
BlackRock Diversified Portfolio
Statement of Assets & Liabilities
December 31, 2008
| | | | | | | |
Assets | | | | | | | |
Investments at value (a) (b) | | | | | $ | 1,301,489,010 | |
Cash | | | | | | 4,373 | |
Foreign cash at value (c) | | | | | | 251,829 | |
Receivable for: | | | | | | | |
Securities sold | | | | | | 315,164,747 | |
Fund shares sold | | | | | | 7,038 | |
Open forward currency contracts—net | | | | | | 323,939 | |
Accrued interest and dividends | | | | | | 5,164,033 | |
Foreign taxes | | | | | | 84,615 | |
| | | | | | | |
Total Assets | | | | | | 1,622,489,584 | |
Liabilities | | | | | | | |
TBA sales commitments at value (d) | | $ | 112,453,961 | | | | |
Payable for: | | | | | | | |
Securities purchased | | | 306,380,332 | | | | |
Fund shares redeemed | | | 1,355,401 | | | | |
Futures variation margin | | | 343,424 | | | | |
Open forward currency contracts—net | | | 743,912 | | | | |
Collateral for securities loaned | | | 38,633,706 | | | | |
Interest (Short) | | | 334,996 | | | | |
Accrued expenses: | | | | | | | |
Management fees | | | 447,691 | | | | |
Service and distribution fees | | | 17,621 | | | | |
Other expenses | | | 50,535 | | | | |
| | | | | | | |
Total Liabilities | | | | | | 460,761,579 | |
| | | | | | | |
Net Assets | | | | | $ | 1,161,728,005 | |
| | | | | | | |
Net assets consists of: | | | | | | | |
Capital paid in | | | | | $ | 1,467,494,597 | |
Undistributed net investment income | | | | | | 48,434,103 | |
Accumulated net realized losses | | | | | | (157,369,662 | ) |
Unrealized depreciation on investments, futures contracts, and foreign currency | | | | | | (196,831,033 | ) |
| | | | | | | |
Net Assets | | | | | $ | 1,161,728,005 | |
| | | | | | | |
| Computation of offering price: | | | | | | | |
Class A | | | | | | | |
Net asset value and redemption price per share ($1,058,178,126 divided by 80,294,061 shares outstanding) | | | | | $ | 13.18 | |
| | | | | | | |
Class B | | | | | | | |
Net asset value and redemption price per share ($59,980,197 divided by 4,576,163 shares outstanding) | | | | | $ | 13.11 | |
| | | | | | | |
Class E | | | | | | | |
Net asset value and redemption price per share ($43,569,682 divided by 3,313,992 shares outstanding) | | | | | $ | 13.15 | |
| | | | | | | |
(a) Identified cost of investments | | | | | $ | 1,500,128,970 | |
| | | | | | | |
(b) Includes cash collateral for securities loaned of | | | | | $ | 38,633,706 | |
| | | | | | | |
(c) Identified cost of foreign cash | | | | | $ | 299,466 | |
| | | | | | | |
(d) Proceeds of TBA sales commitments | | | | | $ | 111,478,222 | |
| | | | | | | |
Statement of Operations
For the Year Ended December 31, 2008
| | | | | | | | |
Investment Income | | | | | | | | |
Dividends | | | | | | $ | 18,155,129 | |
Interest | | | | | | | 36,736,204 | (a) |
| | | | | | | | |
| | | | | | | 54,891,333 | |
Expenses | | | | | | | | |
Management fees | | $ | 6,768,709 | | | | | |
Service and distribution fees—Class B | | | 176,066 | | | | | |
Service and distribution fees—Class E | | | 87,822 | | | | | |
Directors’ fees and expenses | | | 31,905 | | | | | |
Custodian | | | 215,957 | | | | | |
Audit and tax services | | | 39,291 | | | | | |
Legal | | | 26,112 | | | | | |
Printing | | | 321,338 | | | | | |
Insurance | | | 21,168 | | | | | |
Miscellaneous | | | 23,250 | | | | | |
| | | | | | | | |
Total expenses | | | | | | | 7,711,618 | |
| | | | | | | | |
Net Investment Income | | | | | | | 47,179,715 | |
| | | | | | | | |
Realized and Unrealized Loss | | | | | | | | |
| Realized gain (loss) on: | | | | | | | | |
Investments—net | | | (155,873,367 | ) | | | | |
Futures contracts—net | | | 3,989,991 | | | | | |
Foreign currency transactions—net | | | (427,319 | ) | | | | |
Options—net | | | 56,815 | | | | (152,253,880 | ) |
| | | | | | | | |
Change in unrealized appreciation (depreciation) on: | | | | | | | | |
Investments—net | | | (323,730,448 | ) | | | | |
Futures contracts—net | | | 2,840,536 | | | | | |
Foreign currency transactions—net | | | (330,998 | ) | | | | |
Options—net | | | (9,098 | ) | | | (321,230,008 | ) |
| | | | | | | | |
Net loss | | | | | | | (473,483,888 | ) |
| | | | | | | | |
Net Decrease in Net Assets From Operations | | | | | | $ | (426,304,173 | ) |
| | | | | | | | |
| (a) | Includes income on securities loaned of $428,626. |
See accompanying notes to financial statements.
MSF-14
Metropolitan Series Fund, Inc.
BlackRock Diversified Portfolio
Statements of Changes in Net Assets
| | | | | | | | |
| | | Year ended
December 31,
2008 | | | Year ended
December 31,
2007 | |
From Operations | | | | | | | | |
Net investment income | | $ | 47,179,715 | | | $ | 42,441,930 | |
Net realized gain (loss) | | | (152,253,880 | ) | | | 64,437,134 | |
Unrealized depreciation | | | (321,230,008 | ) | | | (6,417,080 | ) |
| | | | | | | | |
Increase (decrease) in net assets from operations | | | (426,304,173 | ) | | | 100,461,984 | |
| | | | | | | | |
From Distributions to Shareholders | | | | | | | | |
Net investment income | | | | | | | | |
Class A | | | (39,625,297 | ) | | | (40,533,989 | ) |
Class B | | | (1,690,116 | ) | | | (1,503,984 | ) |
Class E | | | (1,607,411 | ) | | | (1,827,170 | ) |
| | | | | | | | |
| | | (42,922,824 | ) | | | (43,865,143 | ) |
| | | | | | | | |
Net realized gain | | | | | | | | |
Class A | | | (15,424,612 | ) | | | 0 | |
Class B | | | (731,543 | ) | | | 0 | |
Class E | | | (665,928 | ) | | | 0 | |
| | | | | | | | |
| | | (16,822,083 | ) | | | 0 | |
| | | | | | | | |
Total distributions | | | (59,744,907 | ) | | | (43,865,143 | ) |
| | | | | | | | |
Increase (decrease) in net assets from capital share transactions | | | (187,207,258 | ) | | | 22,239,497 | |
| | | | | | | | |
Net increase (decrease) in net assets | | | (673,256,338 | ) | | | 78,836,338 | |
| | | | | | | | |
Net Assets | | | | | | | | |
Beginning of the period | | | 1,834,984,343 | | | | 1,756,148,005 | |
| | | | | | | | |
End of the period | | $ | 1,161,728,005 | | | $ | 1,834,984,343 | |
| | | | | | | | |
Undistributed Net Investment Income | | | | | | | | |
End of the period | | $ | 48,434,103 | | | $ | 42,985,221 | |
| | | | | | | | |
Other Information:
Capital Shares
Transactions in capital shares were as follows:
| | | | | | | | | | | | | | |
| | | Year ended
December 31, 2008 | | | Year ended
December 31, 2007 | |
| | | Shares | | | $ | | | Shares | | | $ | |
Class A | | | | | | | | | | | | | | |
Sales | | 768,618 | | | $ | 11,711,388 | | | 15,428,384 | | | $ | 276,471,148 | |
Reinvestments | | 3,316,260 | | | | 55,049,909 | | | 2,270,812 | | | | 40,533,989 | |
Redemptions | | (16,666,765 | ) | | | (252,581,475 | ) | | (16,923,992 | ) | | | (303,258,831 | ) |
| | | | | | | | | | | | | | |
Net increase (decrease) | | (12,581,887 | ) | | $ | (185,820,178 | ) | | 775,204 | | | $ | 13,746,306 | |
| | | | | | | | | | | | | | |
Class B | | | | | | | | | | | | | | |
Sales | | 1,180,845 | | | $ | 18,894,094 | | | 1,483,082 | | | $ | 26,479,747 | |
Reinvestments | | 146,412 | | | | 2,421,659 | | | 84,589 | | | | 1,503,984 | |
Redemptions | | (906,167 | ) | | | (13,446,795 | ) | | (721,595 | ) | | | (12,859,245 | ) |
| | | | | | | | | | | | | | |
Net increase | | 421,090 | | | $ | 7,868,958 | | | 846,076 | | | $ | 15,124,486 | |
| | | | | | | | | | | | | | |
Class E | | | | | | | | | | | | | | |
Sales | | 124,009 | | | $ | 1,939,820 | | | 289,023 | | | $ | 5,161,012 | |
Reinvestments | | 137,113 | | | | 2,273,339 | | | 102,535 | | | | 1,827,170 | |
Redemptions | | (908,928 | ) | | | (13,469,197 | ) | | (761,913 | ) | | | (13,619,477 | ) |
| | | | | | | | | | | | | | |
Net decrease | | (647,806 | ) | | $ | (9,256,038 | ) | | (370,355 | ) | | $ | (6,631,295 | ) |
| | | | | | | | | | | | | | |
Increase (decrease) derived from capital share transactions | | | | | $ | (187,207,258 | ) | | | | | $ | 22,239,497 | |
| | | | | | | | | | | | | | |
See accompanying notes to financial statements.
MSF-15
Metropolitan Series Fund, Inc.
BlackRock Diversified Portfolio
Financial Highlights
| | | | | | | | | | | | | | | | | | | | |
| | | Class A | |
| | | Year ended December 31, | |
| | | 2008 | | | 2007 | | | 2006 | | | 2005 | | | 2004 | |
Net Asset Value, Beginning of Period | | $ | 18.18 | | | $ | 17.61 | | | $ | 16.33 | | | $ | 16.11 | | | $ | 15.13 | |
| | | | | | | | | | | | | | | | | | | | |
Income From Investment Operations | | | | | | | | | | | | | | | | | | | | |
Net investment income | | | 0.49 | (a) | | | 0.41 | (a) | | | 0.46 | | | | 0.39 | | | | 0.32 | |
Net realized and unrealized gain (loss) of investments | | | (4.87 | ) | | | 0.62 | | | | 1.23 | | | | 0.09 | | | | 0.95 | |
| | | | | | | | | | | | | | | | | | | | |
Total from investment operations | | | (4.38 | ) | | | 1.03 | | | | 1.69 | | | | 0.48 | | | | 1.27 | |
| | | | | | | | | | | | | | | | | | | | |
Less Distributions | | | | | | | | | | | | | | | | | | | | |
Distributions from net investment income | | | (0.45 | ) | | | (0.46 | ) | | | (0.41 | ) | | | (0.26 | ) | | | (0.29 | ) |
Distributions from net realized capital gains | | | (0.17 | ) | | | 0.00 | | | | 0.00 | | | | 0.00 | | | | 0.00 | |
| | | | | | | | | | | | | | | | | | | | |
Total distributions | | | (0.62 | ) | | | (0.46 | ) | | | (0.41 | ) | | | (0.26 | ) | | | (0.29 | ) |
| | | | | | | | | | | | | | | | | | | | |
Net Asset Value, End of Period | | $ | 13.18 | | | $ | 18.18 | | | $ | 17.61 | | | $ | 16.33 | | | $ | 16.11 | |
| | | | | | | | | | | | | | | | | | | | |
Total Return (%) | | | (24.8 | ) | | | 5.9 | | | | 10.5 | | | | 3.1 | | | | 8.5 | |
Ratio of operating expenses to average net assets before expense reductions (%) | | | 0.49 | | | | 0.50 | | | | 0.52 | | | | 0.50 | | | | 0.50 | |
Ratio of operating expenses to average net assets after expense reductions (%) (b) | | | N/A | | | | N/A | | | | 0.51 | | | | 0.49 | | | | 0.49 | |
Ratio of net investment income to average net assets (%) | | | 3.15 | | | | 2.32 | | | | 2.46 | | | | 2.22 | | | | 1.99 | |
Portfolio turnover rate (%) | | | 501 | | | | 372 | | | | 265 | | | | 443 | | | | 232 | |
Net assets, end of period (000) | | $ | 1,058,178 | | | $ | 1,688,044 | | | $ | 1,622,051 | | | $ | 1,705,344 | | | $ | 1,875,196 | |
| | | | | | | | | | | | | | | | | | | | |
| | | Class B | |
| | | Year ended December 31, | |
| | | 2008 | | | 2007 | | | 2006 | | | 2005 | | | 2004(c) | |
Net Asset Value, Beginning of Period | | $ | 18.08 | | | $ | 17.52 | | | $ | 16.25 | | | $ | 16.03 | | | $ | 14.97 | |
| | | | | | | | | | | | | | | | | | | | |
Income From Investment Operations | | | | | | | | | | | | | | | | | | | | |
Net investment income | | | 0.45 | (a) | | | 0.37 | (a) | | | 0.34 | | | | 0.25 | | | | 0.11 | |
Net realized and unrealized gain (loss) of investments | | | (4.85 | ) | | | 0.61 | | | | 1.30 | | | | 0.19 | | | | 0.95 | |
| | | | | | | | | | | | | | | | | | | | |
Total from investment operations | | | (4.40 | ) | | | 0.98 | | | | 1.64 | | | | 0.44 | | | | 1.06 | |
| | | | | | | | | | | | | | | | | | | | |
Less Distributions | | | | | | | | | | | | | | | | | | | | |
Distributions from net investment income | | | (0.40 | ) | | | (0.42 | ) | | | (0.37 | ) | | | (0.22 | ) | | | 0.00 | |
Distributions from net realized capital gains | | | (0.17 | ) | | | 0.00 | | | | 0.00 | | | | 0.00 | | | | 0.00 | |
| | | | | | | | | | | | | | | | | | | | |
Total distributions | | | (0.57 | ) | | | (0.42 | ) | | | (0.37 | ) | | | (0.22 | ) | | | 0.00 | |
| | | | | | | | | | | | | | | | | | | | |
Net Asset Value, End of Period | | $ | 13.11 | | | $ | 18.08 | | | $ | 17.52 | | | $ | 16.25 | | | $ | 16.03 | |
| | | | | | | | | | | | | | | | | | | | |
Total Return (%) | | | (25.0 | ) | | | 5.6 | | | | 10.3 | | | | 2.8 | | | | 7.1 | (d) |
Ratio of operating expenses to average net assets before expense reductions (%) | | | 0.74 | | | | 0.75 | | | | 0.77 | | | | 0.75 | | | | 0.75 | (e) |
Ratio of operating expenses to average net assets after expense reductions (%) (b) | | | N/A | | | | N/A | | | | 0.76 | | | | 0.74 | | | | 0.74 | (e) |
Ratio of net investment income to average net assets (%) | | | 2.94 | | | | 2.07 | | | | 2.22 | | | | 2.01 | | | | 2.27 | (e) |
Portfolio turnover rate (%) | | | 501 | | | | 372 | | | | 265 | | | | 443 | | | | 232 | |
Net assets, end of period (000) | | $ | 59,980 | | | $ | 75,109 | | | $ | 57,973 | | | $ | 40,749 | | | $ | 20,413 | |
| Please | see following page for Financial Highlights footnote legend. |
See accompanying notes to financial statements.
MSF-16
Metropolitan Series Fund, Inc.
BlackRock Diversified Portfolio
Financial Highlights
| | | | | | | | | | | | | | | | | | | | |
| | | Class E | |
| | | Year ended December 31, | |
| | | 2008 | | | 2007 | | | 2006 | | | 2005 | | | 2004 | |
Net Asset Value, Beginning of Period | | $ | 18.13 | | | $ | 17.57 | | | $ | 16.30 | | | $ | 16.07 | | | $ | 15.11 | |
| | | | | | | | | | | | | | | | | | | | |
Income From Investment Operations | | | | | | | | | | | | | | | | | | | | |
Net investment income | | | 0.47 | (a) | | | 0.39 | (a) | | | 0.40 | | | | 0.33 | | | | 0.29 | |
Net realized and unrealized gain (loss) of investments | | | (4.86 | ) | | | 0.61 | | | | 1.25 | | | | 0.13 | | | | 0.94 | |
| | | | | | | | | | | | | | | | | | | | |
Total from investment operations | | | (4.39 | ) | | | 1.00 | | | | 1.65 | | | | 0.46 | | | | 1.23 | |
| | | | | | | | | | | | | | | | | | | | |
Less Distributions | | | | | | | | | | | | | | | | | | | | |
Distributions from net investment income | | | (0.42 | ) | | | (0.44 | ) | | | (0.38 | ) | | | (0.23 | ) | | | (0.27 | ) |
Distributions from net realized capital gains | | | (0.17 | ) | | | 0.00 | | | | 0.00 | | | | 0.00 | | | | 0.00 | |
| | | | | | | | | | | | | | | | | | | | |
Total distributions | | | (0.59 | ) | | | (0.44 | ) | | | (0.38 | ) | | | (0.23 | ) | | | (0.27 | ) |
| | | | | | | | | | | | | | | | | | | | |
Net Asset Value, End of Period | | $ | 13.15 | | | $ | 18.13 | | | $ | 17.57 | | | $ | 16.30 | | | $ | 16.07 | |
| | | | | | | | | | | | | | | | | | | | |
Total Return (%) | | | (24.9 | ) | | | 5.7 | | | | 10.3 | | | | 3.0 | | | | 8.3 | |
Ratio of operating expenses to average net assets before expense reductions (%) | | | 0.64 | | | | 0.65 | | | | 0.67 | | | | 0.65 | | | | 0.65 | |
Ratio of operating expenses to average net assets after expense reductions (%) (b) | | | N/A | | | | N/A | | | | 0.66 | | | | 0.64 | | | | 0.64 | |
Ratio of net investment income to average net assets (%) | | | 2.99 | | | | 2.16 | | | | 2.31 | | | | 2.07 | | | | 1.88 | |
Portfolio turnover rate (%) | | | 501 | | | | 372 | | | | 265 | | | | 443 | | | | 232 | |
Net assets, end of period (000) | | $ | 43,570 | | | $ | 71,831 | | | $ | 76,124 | | | $ | 80,444 | | | $ | 85,223 | |
| (a) | Per share amount is based on average shares outstanding during the period. |
| (b) | The Portfolio has entered into arrangements with certain brokers who paid a portion of the Portfolio’s expenses. |
| (c) | Commencement of operations was April 26, 2004 for Class B. |
| (d) | Periods less than one year are not computed on an annualized basis. |
| (e) | Computed on an annualized basis. |
See accompanying notes to financial statements.
MSF-17
Metropolitan Series Fund, Inc.
BlackRock Diversified Portfolio
Notes to Financial Statements—December 31, 2008
Metropolitan Series Fund, Inc. (the “Fund”) is organized as a corporation under the laws of Maryland pursuant to Articles of Incorporation filed on November 23, 1982, as amended, and registered under the Investment Company Act of 1940, as amended (the “1940 Act”), as an open-end investment company. The Fund is a “series” type of mutual fund, which issues separate series of stock. Each series represents an interest in a separate portfolio of Fund investments. The BlackRock Diversified Portfolio (the “Portfolio”) is a diversified series of the Fund. Shares in the Fund are not offered directly to the general public and are currently available only to separate accounts established by Metropolitan Life Insurance Company (“MetLife”), New England Life Insurance Company, General American Life Insurance Company (“General American”), The MetLife Investors Group of Insurance Companies, MetLife Insurance Company of Connecticut and other affiliated insurance companies (collectively, the “Insurance Companies”) and to certain eligible qualified retirement plans (“Qualified Plans”), as an investment vehicle for variable life insurance, group annuity or variable annuity products of these insurance companies or Qualified Plans, although the Portfolio is not available to all such separate accounts and Qualified Plans. The Portfolio’s shares may be divided into different classes. Currently, the classes being offered by the Portfolio are named Class A, Class B and Class E. The classes of the Portfolio’s shares are identical, except that certain additional charges (Rule 12b-1 fees) are made against Class B and Class E shares. Investment income, realized and unrealized capital gains and losses, the common expenses of the Portfolio and certain Portfolio-level expense reductions, if any, are allocated daily, on a pro rata basis, to each class based on the relative net assets of each class to the total net assets of the Portfolio.
| 2. | SIGNIFICANT ACCOUNTING POLICIES: |
The preparation of financial statements in conformity with accounting principles generally accepted in the United States of America (“GAAP”) requires management to make estimates and assumptions that affect the reported amounts of assets and liabilities and disclosure of contingent assets and liabilities as of the date of the financial statements and the reported amounts of income and expenses during the reporting period. Actual results could differ from those estimates.
The following is a summary of significant accounting policies consistently followed by the Portfolio in the preparation of its financial statements. The policies are in conformity with GAAP.
Investment Valuation:
Debt securities (other than short term obligations with a remaining maturity of sixty days or less) are generally valued on the basis of evaluated or composite bid quotations obtained by independent pricing services and/or brokers and dealers selected by the relevant subadviser pursuant to authorization of the Board of Directors of the Fund (the “Board” or “Directors”). Such quotations take into account appropriate factors such as institutional-sized trading in similar groups of securities, yield, quality, coupon rate, maturity, type of issue, trading characteristics and other data. Short term obligations with a remaining maturity of sixty days or less are valued at amortized cost which approximates fair market value.
Equity securities traded on a national securities exchange or other exchanges are valued at their last sale price on the principal trading market. Equity securities traded on the NASDAQ National Market System are valued at the NASDAQ Official Closing Price (the “NOCP”). The NOCP is the last reported sale price if the last reported sale price falls between the spread of the last reported bid and asked prices. If the last reported bid and asked prices are above the last reported sale price, the NOCP will be the last reported bid price. If the last reported bid and asked prices are below the last reported sale price, the NOCP will be the last reported asked price. Equity securities traded on a national securities exchange or other exchanges or on the NASDAQ National Market System for which there is no reported sale during the day are valued at the last reported bid price. A security that is listed or traded on more than one exchange is valued at the quotation on the exchange determined to be the primary market for that security by the Board or its delegates. If no closing price is available, then such securities are valued by using the last reported bid price. Equity securities traded over-the-counter are valued at the last reported sales price.
If no current market value quotation is readily available or reliable for a portfolio security, fair value will be determined in accordance with procedures established by and under the general supervision of the Board. When the Portfolio uses fair value pricing, it may take into account any factors it deems appropriate. The value of securities used by the Portfolio to calculate its net asset value may differ from quoted or published prices for the same securities. Fair value pricing involves subjective judgments and the fair value determined for a security may be materially different than the value that could be realized upon the sale of that security.
MSF-18
Metropolitan Series Fund, Inc.
BlackRock Diversified Portfolio
Notes to Financial Statements—December 31, 2008—(Continued)
The Portfolio expects to use fair value pricing for securities primarily traded on U.S. exchanges only under very limited circumstances. For example, the Portfolio may use fair value pricing if the exchange on which a security is traded closes early or trading in the security is suspended.
Securities traded primarily on an exchange outside of the United States which closes before the close of the New York Stock Exchange will be valued at the last sales price on that non-U.S. exchange. Securities traded primarily on an exchange outside of the United States for which there is no reported sale during the day are valued at the mean between the last reported bid and asked prices. However, because most foreign markets close well before the Portfolio values its securities (typically at 4 p.m. Eastern Time), the earlier close of these foreign markets gives rise to the possibility that significant events, including broad market moves, may have occurred after these foreign markets close but before the Portfolio values its securities. To account for this, the Portfolio may frequently value many of its foreign equity securities using fair value prices based on third party vendor modeling tools.
Forward foreign currency exchange contracts are valued based on the mean between closing bid and asked prices of the forward currency contract rates in the London foreign exchange markets on a daily basis as provided by a reliable bank or dealer.
Options, whether on securities, indices, futures contracts, or otherwise, are valued at the last sales price available as of the close of business on the day of valuation or, if there is no such sale price available, at the mean between the bid and asked prices. Options on currencies are valued at the spot price each day.
The value of futures contracts will be the sum of the margin deposit plus or minus the difference between the value of the futures contract on each day the net asset value is calculated and the value on the date the futures contract originated, value being that established on a recognized commodity exchange, or by reference to other customary sources, with gain or loss being realized when the futures contract closes or expires.
Subject to the Board’s oversight, the Board has delegated the day-to-day oversight of pricing matters, including determinations in good faith under the Fund’s procedures the fair value of securities for which current market quotations are not readily available to the subadviser of the Portfolio.
Investment Transactions and Related Investment Income:
Portfolio security transactions are recorded on the trade date. Dividend income is recorded on the ex-dividend date or, for certain foreign securities, when notified. Interest income, which includes amortization of premium and accretion of discount on debt securities, is recorded on the accrual basis. Realized gains and losses on investments and unrealized appreciation and depreciation are determined on the identified cost basis, which is the same basis used for federal income tax purposes.
Repurchase Agreements:
The Portfolio, through the custodian or a subcustodian, receives delivery of the underlying securities collateralizing repurchase agreements. The Portfolio requires the custodian to take possession, to have legally segregated in the Federal Reserve Book Entry System, or to have segregated within the custodian’s vault, all securities held as collateral for repurchase agreements. It is the Portfolio’s policy that the market value of the collateral be at least equal to 100% of the repurchase price in the case of a repurchase agreement of one-day duration and 102% on all other repurchase agreements. The Portfolio’s subadviser is responsible for determining that the value of the collateral is at all times at least equal to the repurchase price. In connection with transactions in repurchase agreements, if the seller defaults and the value of the collateral declines or if the seller enters an insolvency proceeding, realization of the collateral by the Portfolio may be delayed, limited or wholly denied.
Foreign Currency Translation:
The books and records of the Portfolio are maintained in U.S. dollars. The values of securities, currencies and other assets and liabilities denominated in currencies other than U.S. dollars are translated into U.S. dollars based upon foreign exchange rates prevailing at the end of the period. Purchases and sales of investment securities, income and expenses are translated on the respective dates of such transactions. Since the values of investment securities are presented at the foreign exchange rates prevailing at the end of the period, it is not practical to isolate that portion of the results of operations arising from changes in exchange rates from that portion of the results of operations reflecting fluctuations arising from changes in market prices of the investment securities. Such fluctuations are included in the net realized and unrealized gain or loss on investments.
MSF-19
Metropolitan Series Fund, Inc.
BlackRock Diversified Portfolio
Notes to Financial Statements—December 31, 2008—(Continued)
Net realized foreign exchange gains or losses arise from sales of foreign currency, currency gains or losses realized between the trade and settlement dates on securities transactions, and the difference between the amounts of dividends, interest, and foreign withholding taxes recorded by the Portfolio and the U.S. dollar equivalent of the amounts actually received or paid by the Portfolio. Net unrealized foreign exchange gains and losses arise from changes in the value of assets and liabilities, other than investment securities, resulting from changes in the exchange rate.
Forward Foreign Currency Exchange Contracts:
The Portfolio may enter into forward foreign currency exchange contracts primarily to hedge against foreign currency exchange rate risks on its non-U.S. dollar denominated investment securities. When entering into a forward currency contract, the Portfolio agrees to receive or deliver a fixed quantity of foreign currency for an agreed-upon price on an agreed future date. These contracts are valued daily and the Portfolio’s net equity therein, representing unrealized gain or loss on the contracts as measured by the difference between the foreign exchange rates at the dates of entry into the contracts and the forward rates at the settlement date, is included in the Statement of Assets and Liabilities. Realized and unrealized gains and losses are included in the Statement of Operations. These instruments involve market and/or credit risk in excess of the amount recognized in the Statement of Assets and Liabilities. Risks arise from the possible inability of counterparties to meet the terms of their contracts and from movement in currency and securities values and interest rates.
Futures Contracts:
The Portfolio may buy and sell futures contracts (on recognized exchanges) as a hedge, to maintain exposure to the broad market or to enhance return. Futures contracts are agreements to buy or sell a security, or deliver a final cash settlement price in connection with an index, interest rate, currency, or other contracts not calling for physical delivery, for a set price in the future. The Portfolio must post an amount equal to a portion of the total market value of the futures contract as futures variation margin, which is returned when the Portfolio’s obligations under the contract have been satisfied. From time to time thereafter, the Portfolio may have to post variation margin to maintain this amount as the market value of the contract fluctuates. Risks of entering into futures contracts (and related options) include the possibility that there may be an illiquid market and that a change in the value of the contract or option may not correlate with changes in the value of the underlying securities.
Options:
The Portfolio may use options to hedge against changes in values of securities the Portfolio owns or expects to purchase, to maintain exposure to the broad market or to enhance return. Writing puts or buying calls tends to increase the Portfolio’s exposure to the underlying instrument and writing calls or buying puts tends to decrease the Portfolio’s exposure to the underlying instrument, and can be used to hedge other Portfolio investments. For options purchased to hedge the Portfolio’s investments, the potential risk to the Portfolio is that the change in value of options contracts may not correspond to the change in value of the hedged instruments. In addition, losses may arise from changes in the value of the underlying instruments, if there is an illiquid secondary market, or if the counterparty is unable to perform. The maximum loss for purchased options is limited to the premium initially paid for the option. For options written by the Portfolio, the maximum loss is not limited to the premium initially received for the option.
The main risk associated with purchasing an option is that the option expires without being exercised. In this case, the option expires worthless and the premium paid for the option is considered the loss. The risk associated with writing a call option is that the Portfolio may forgo the opportunity for a profit if the market value of the underlying position increases and the option is exercised. The risk in writing a put option is that the Portfolio may incur a loss if the market value of the underlying position decreases and the option is exercised. In addition, the Portfolio risks not being able to enter into a closing transaction for the written option as the result of an illiquid market.
Mortgage Dollar Rolls:
The Portfolio may enter into mortgage “dollar rolls” in which a Portfolio sells mortgage-backed securities for delivery in the current month and simultaneously contracts to repurchase substantially similar (same type, coupon and maturity) securities on a specified future date. Dollar rolls are accounted for as purchase and sale transactions; gain/loss is recognized at the end of the term of the dollar roll. The average monthly balance of dollar rolls outstanding during the year ended December 31, 2008 was $401,140,851.
MSF-20
Metropolitan Series Fund, Inc.
BlackRock Diversified Portfolio
Notes to Financial Statements—December 31, 2008—(Continued)
A Portfolio that enters into mortgage dollar rolls is subject to the risk that the market value of the securities the Portfolio is obligated to repurchase under the agreement may decline below the repurchase price. In the event the buyer of securities under a mortgage dollar roll files for bankruptcy or becomes insolvent, the Portfolio’s use of proceeds from the dollar roll may be restricted pending a court determination, a determination by the other party, or its trustee or receiver, whether to enforce the Portfolio’s obligation to repurchase the securities.
“When-Issued” Securities:
Purchasing securities “when-issued” is a forward commitment by the Portfolio to buy a security. The estimated amount of the Portfolio’s payment obligation and the security’s interest rate are determined when the commitment is made, even though no interest accrues until the security is issued, which is generally 15 to 120 days later. The Portfolio will segregate liquid assets with its custodian sufficient at all times to satisfy these commitments. If the value of the security is less when delivered than when the commitment was made, the Portfolio will suffer a loss.
High Yield Securities:
The Portfolio may invest in high yield instruments that are subject to certain credit and market risks. The yields of high yield instruments reflect, among other things, perceived credit risk. The Portfolio’s investments in securities rated below investment grade typically involve risks not associated with higher rated securities including, among others, greater risk related to timely and ultimate payment of interest and principal, greater market price volatility and less liquid secondary market trading.
Mortgage-Backed Securities:
The Portfolio invests a significant portion of its assets in securities of issuers that hold mortgage and asset backed securities and direct investments in securities backed by commercial and residential mortgage loans and other financial assets. The value and related income of these securities are sensitive to changes in economic conditions, including delinquencies and/or defaults. Continuing shifts in the market’s perception of credit quality on securities backed by commercial and residential mortgage loans and other financial assets may result in increased volatility of market price and periods of illiquidity that can negatively impact the valuation of certain issuers held by the Portfolio. At December 31, 2008, the Portfolio held securities of issuers that hold mortgage and asset backed securities and direct investments in mortgage and asset backed securities (excluding federal agencies) with an aggregate value of $142,507,855 (representing 12.2% of the Portfolio’s total net assets).
TBA Purchase & Sale Commitments:
The Portfolio may enter into to-be-announced (“TBA”) commitments to purchase or sell securities for a fixed price at a future date. TBA commitments are considered securities in themselves, and involve a risk of loss if the value of the security to be purchased or sold declines or increases prior to settlement date, which is in addition to the risk of decline in the value of the Portfolio’s other assets. Unsettled TBA commitments are valued at the current market value of the underlying securities, according to the procedures described under “Investment Valuation”.
Federal Income Taxes:
It is the Portfolio’s policy to comply with the requirements of the Internal Revenue Code of 1986, as amended (the “Code”), and regulations thereunder, applicable to regulated investment companies and to distribute, with respect to each taxable year, all of its taxable income to shareholders. Therefore, no federal income tax provision is required. The Portfolio is subject to the provisions of the Financial Accounting Standards Board Interpretation (“FASB”) No. 48, Accounting for Uncertainties in Income Taxes (FIN 48). FIN 48 sets forth a minimum threshold for financial statement recognition of the benefit of a tax position taken or expected to be taken in a tax return. The implementation of FIN 48 did not result in any unrecognized tax benefits in the accompanying financial statements. Each of the Portfolio’s federal tax returns for the prior three fiscal years remains subject to examination by the Internal Revenue Service.
As of December 31, 2008, the Portfolio had $81,144,186 in capital loss carryforwards expiring on December 31, 2016.
MSF-21
Metropolitan Series Fund, Inc.
BlackRock Diversified Portfolio
Notes to Financial Statements—December 31, 2008—(Continued)
Pursuant to Section 852 of the Code, the Portfolio designated the amount shown below under Long Term Gain as capital gain dividends for its taxable year ended December 31, 2008. The tax character of distributions paid for the periods ended December 31, 2008 and 2007 was as follows:
| | | | | | | | | | | | | | | | | | | | | |
| Ordinary Income | | Long Term Gain | | Return of Capital | | Total |
| 2008 | | 2007 | | 2008 | | 2007 | | 2008 | | 2007 | | 2008 | | 2007 |
| $42,969,274 | | $ | 43,865,143 | | $ | 16,775,633 | | $ | — | | $ | — | | $ | — | | $ | 59,744,907 | | $ | 43,865,143 |
As of December 31, 2008, the components of distributable earnings (accumulated losses) on a federal income tax basis were as follows:
| | | | | | | | | | | | | | | | |
Undistributed
Ordinary
Income | | Undistributed
Long Term
Gain | | Unrealized
Depreciation | | | Loss
Carryforwards | | | Total | |
| $ | 48,014,130 | | $ | — | | $ | (227,098,237 | ) | | $ | (81,144,186 | ) | | $ | (260,228,293 | ) |
Pursuant to Federal income tax regulations applicable to investment companies, the Portfolio has elected to treat net capital losses realized between November 1 and December 31 of each year as occurring on the first day of the following tax year. For the year ended December 31, 2008, the following amounts of realized capital and currency losses reflected in the accompanying financial statements will not be recognized for Federal income tax purposes until January 1, 2009:
| | | | |
Currency | | Capital | |
$— | | $ | (45,538,299 | ) |
Dividends and Distributions to Shareholders:
The Portfolio records dividends and distributions on the ex-dividend date. Net realized gains from security transactions (if any) are generally distributed annually to shareholders. The timing and characterization of certain income and capital gains distributions are determined in accordance with federal tax regulations that may differ from GAAP. Permanent book and tax basis differences relating to shareholder distributions will result in reclassification between under/over distributed net investment income, accumulated net realized gains/losses and paid in capital.
| 3. | INVESTMENT TRANSACTIONS: |
For the year ended December 31, 2008, purchases and sales of securities (excluding short term investments) for the Portfolio were as follows:
| | | | | | | | | | |
| Purchases | | Sales |
U.S. Government | | Other | | U.S. Government | | Other |
| $ | 6,534,285,870 | | $ | 1,008,028,575 | | $ | 6,829,505,826 | | $ | 918,543,829 |
Options Written:
The Portfolio transactions in options written during the year ended December 31, 2008 were as follows:
| | | | | | | |
Call Options | | Number of
contracts | | | Premiums
received | |
Options outstanding December 31, 2007 | | 68 | | | $ | 38,848 | |
Options written | | 34 | | | | 17,967 | |
Options closed | | 0 | | | | 0 | |
Options expired | | (102 | ) | | | (56,815 | ) |
| | | | | | | |
Options outstanding December 31, 2008 | | 0 | | | $ | 0 | |
| | | | | | | |
MSF-22
Metropolitan Series Fund, Inc.
BlackRock Diversified Portfolio
Notes to Financial Statements—December 31, 2008—(Continued)
| 4. | INVESTMENT MANAGEMENT FEES AND OTHER TRANSACTIONS WITH AFFILIATES: |
Investment Management Agreement:
MetLife Advisers, LLC (“MetLife Advisers”) is the investment adviser to the Portfolio. The Fund has entered into an investment management agreement with MetLife Advisers with respect to the Portfolio. For providing investment management services to the Portfolio, MetLife Advisers receives monthly compensation at the following annual rates:
| | | | |
Management
Fees earned by
MetLife Advisers
for the year ended
December 31, 2008 | | Annual
percentage
rates paid to
MetLife Advisers | | Based on Portfolios
average daily net asset
levels |
| $6,768,709 | | 0.500% | | Of the first $500 million |
| | 0.450% | | Of the next $500 million |
| | 0.400% | | On amounts in excess of $1 billion |
Certain officers and directors of the Fund may also be officers of MetLife Advisers; however, such officers and directors receive no compensation from the Fund.
MetLife Advisers has entered into an investment subadvisory agreement with respect to the Portfolio. BlackRock Advisors, LLC is compensated by MetLife Advisers to provide subadvisory services for the Portfolio.
Service and Distribution Fees:
The Fund has adopted a Distribution and Service Plan under Rule 12b-1 of the 1940 Act for the Portfolio’s Class B and E shares. Under the Distribution and Service Plan, the Class B and E shares of the Portfolio pay a fee to compensate the Insurance Companies (or their affiliates) and other broker-dealers and financial intermediaries involved in the offer and sale of Portfolio shares for promoting or selling and servicing the Class B and E shares. The fees under the Distribution and Service Plan for each class of the Portfolio’s shares are calculated as a percentage of the Portfolio’s average daily net assets that are attributable to that Class. Currently, the fee is 0.25% per year for Class B shares and 0.15% per year for Class E shares. Amounts paid by the Portfolio for the year ended December 31, 2008 are shown as Service and Distribution fees in the Statement of Operations.
The Fund has entered into a securities lending arrangement with the Fund’s custodian, State Street Bank and Trust Company (the “custodian”). Under the agreement, the custodian is authorized to loan securities on the Portfolios’ behalf. In exchange, the Portfolio receives either cash or securities as collateral against the loaned securities. The Portfolio receives collateral at least equal to 102% of the market value of the loaned securities (105% for foreign securities), at each loan’s inception. Collateral must be maintained at least at 100% of the market value of the loaned securities for the duration of the loan. The cash collateral is invested in the Navigator Securities Lending Prime Portfolio, an affiliate of the custodian, which invests in a variety of high quality U.S. dollar-denominated instruments. If the market value of the collateral at the close of trading on a business day is less than 100% of the market value of the loaned securities at the close of trading on that day, the borrower shall be required to deliver, by the close of business on the following business day, an additional amount of collateral, equal to at least 100% of the market value of all the loaned securities as of such preceding day. The Portfolio receives 80% of the annual net income from securities lending transactions, which is included in interest income of the Portfolio. The remaining 20% is paid to the custodian as compensation for its securities lending services. Interest income received by the Portfolio via lending transactions during the year ended December 31, 2008 is footnoted in the Statement of Operations. The Portfolio bears the risk of any deficiency in the amount of collateral available for return to a borrower due to a loss in an approved investment purchased with such collateral. Any outstanding loans by the Portfolio at December 31, 2008 are footnoted in the Schedule of Investments.
| 6. | MARKET AND CREDIT RISK: |
In the normal course of business, the Portfolio invests in securities and enters into transactions where risks exist due to fluctuations in the market (market risk) or failure of the other party to a transaction to perform (credit risk). The value of securities held by the Portfolio may decline in response to certain events, including those directly involving the companies whose securities are owned by the Portfolio; conditions affecting the general economy; overall market changes; local, regional or global political, social or economic instability; and currency and interest rate and price fluctuations. Similar to credit risk, the Portfolio
MSF-23
Metropolitan Series Fund, Inc.
BlackRock Diversified Portfolio
Notes to Financial Statements—December 31, 2008—(Continued)
may be exposed to counterparty risk, or the risk that an entity with which the Portfolio has unsettled or open transactions may default. Financial assets, which potentially expose the Portfolio to credit and counterparty risks, consist principally of investments and cash due from counterparties. The extent of the Portfolio’s exposure to credit and counterparty risks in respect to these financial assets approximates their value as recorded in the Portfolio’s Statements of Assets and Liabilities.
On November 13, 2008, the Board approved the acquisition of the Met Investors Series Trust Legg Mason Partners Managed Assets Portfolio (“MIST Legg Mason Managed Assets Portfolio”) by the Portfolio, subject to the approval of shareholders of MIST Legg Mason Managed Assets Portfolio. On or about April 30, 2009, the shareholders of MIST Legg Mason Managed Assets Portfolio will consider the approval of a proposed Agreement and Plan of Reorganization providing for the acquisition of all the assets of MIST Legg Mason Managed Assets Portfolio by the Portfolio in exchange for shares of the Portfolio and the assumption by the Portfolio of the liabilities of MIST Legg Mason Managed Assets Portfolio. If approved by shareholders, the reorganization will close on or about May 1, 2009.
| 8. | RECENT ACCOUNTING PRONOUNCEMENTS: |
In March 2008, the FASB issued Statement of Financial Accounting Standards No. 161, Disclosures about Derivative Instruments and Hedging Activities (“FAS 161”), an amendment of FASB Statement No. 133. FAS 161 requires enhanced disclosures about (a) how and why an entity uses derivative instruments, (b) how derivative instruments and hedging activities are accounted for, and (c) how derivative instruments and related hedging activities affect a fund’s financial position, financial performance, and cash flows. Management does not believe the adoption of FAS 161 will materially impact the financial statement amounts, but will require additional disclosures. This will include qualitative and quantitative disclosures on derivative positions existing at period end and the effect of using derivatives during the reporting period. FAS 161 is effective for financial statements issued for fiscal years and interim periods beginning after November 15, 2008. Management is currently evaluating the impact the adoption of FAS 161 will have on the Portfolio’s financial statement disclosures.
MSF-24
Metropolitan Series Fund, Inc.
BlackRock Diversified Portfolio
Report of Independent Registered Public Accounting Firm
To the Shareholders and Board of Directors of Metropolitan Series Fund, Inc.:
We have audited the accompanying statement of assets and liabilities, including the schedule of investments, of the BlackRock Diversified Portfolio (one of the portfolios constituting the Metropolitan Series Fund, Inc.) (the “Fund”) as of December 31, 2008, and the related statement of operations for the year then ended, the statements of changes in net assets for each of the two years in the period then ended, and the financial highlights for each of the five years in the period then ended. These financial statements and financial highlights are the responsibility of the Fund’s management. Our responsibility is to express an opinion on these financial statements and financial highlights based on our audits.
We conducted our audits in accordance with the standards of the Public Company Accounting Oversight Board (United States). Those standards require that we plan and perform the audit to obtain reasonable assurance about whether the financial statements and financial highlights are free of material misstatement. The Fund is not required to have, nor were we engaged to perform, an audit of its internal control over financial reporting. Our audits included consideration of internal control over financial reporting as a basis for designing audit procedures that are appropriate in the circumstances, but not for the purpose of expressing an opinion on the effectiveness of the Fund’s internal control over financial reporting. Accordingly, we express no such opinion. An audit also includes examining, on a test basis, evidence supporting the amounts and disclosures in the financial statements, assessing the accounting principles used and significant estimates made by management, as well as evaluating the overall financial statement presentation. Our procedures included confirmation of securities owned as of December 31, 2008, by correspondence with the custodian and brokers; where replies were not received from brokers, we performed other auditing procedures. We believe that our audits provide a reasonable basis for our opinion.
In our opinion, the financial statements and financial highlights referred to above present fairly, in all material respects, the financial position of the BlackRock Diversified Portfolio of the Metropolitan Series Fund, Inc. as of December 31, 2008, the results of its operations for the year then ended, the changes in its net assets for each of the two years in the period then ended, and the financial highlights for each of the five years in the period then ended, in conformity with accounting principles generally accepted in the United States of America.
Deloitte & Touche LLP
Boston, Massachusetts
February 26, 2009
MSF-25
Metropolitan Series Fund, Inc.
Directors and Officers
The Fund’s Directors review actions of the Fund’s investment adviser and subadvisers, and decide upon matters of general policy. The Fund’s officers supervise the daily business operations of the Fund. The Board of Directors and the Fund’s officers are listed below. Each Director is responsible for overseeing all 38 Portfolios of the Fund. There is no limit to the term a Director may serve. Directors serve until their resignation, retirement or removal in accordance with the Fund’s organizational documents and policies adopted by the Board from time to time. Officers hold office at the pleasure of the Board or until the election or appointment and the qualification of a successor. The address of the Directors and officers is c/o Metropolitan Series Fund, Inc., 501 Boylston Street, Boston, MA 02116.
Interested Directors(1)
Each Director below is an “interested person” (as defined by the 1940 Act) with respect to the Fund in that Ms. Forget is an employee of MetLife and Mr. Typermass is a former employee of MetLife and owns securities issued by MetLife, Inc., the ultimate parent company of MetLife Advisers.
| | | | | | | | |
Name, Address and Age | | Current
position(s)
with Fund | | Position(s)
held since | | Principal occupations
over past five years, including other directorships(2) | | Number of
Portfolios in
Fund Complex
Overseen by
Director(3) |
Elizabeth M. Forget Age: 42 | | Director, Chairman of the Board, President and Chief Executive Officer | | 2006 | | Senior Vice President (since 2007), MetLife, Inc.; President, Met Investors Advisory, LLC; Trustee and President, Met Investors Series Trust; Executive Vice President, MetLife Investors Group, Inc.; President, Chief Executive Officer and Chair of the Board of Managers (since 2006), MetLife Advisers; President, Met Investors Advisory, LLC. | | 87 |
| | | | |
Arthur G. Typermass Age: 71 | | Director | | 1998 | | Formerly, Senior Vice President and Treasurer, MetLife. | | 38 |
Non-Interested Directors(1)
Each Director below is not an “interested person” (as defined by the 1940 Act) with respect to the Fund (collectively, the “Independent Directors”).
| | | | | | | | |
Name, Address and Age | | Current
position(s)
with Fund | | Position(s)
held since | | Principal occupations
over past five years, including other directorships(2) | | Number of
Portfolios in
Fund Complex
Overseen by
Director(3) |
Steve A. Garban† Age: 71 | | Director | | 1985 | | Formerly, Chief Financial Officer, Senior Vice President Finance and Operations and Treasurer (Emeritus), The Pennsylvania State University. | | 38 |
| | | | |
Linda B. Strumpf Age: 61 | | Director | | 2000 | | Vice President and Chief Investment Officer, Ford Foundation. | | 38 |
| | | | |
Michael S. Scott Morton† Age: 71 | | Director | | 1993 | | Jay W. Forrester Professor of Management (Emeritus) at Sloan School of Management, MIT. | | 38 |
| | | | |
H. Jesse Arnelle Age: 75 | | Director | | 2001 | | Formerly, Counsel, Womble Carlyle Sandrie & Rice; Director, Textron Inc. (global multi- industry company)*; formerly, Director, Gannet Co. Inc. (diversified news and information company)*; formerly, Director, Eastman Chemical Company (global chemical company)*; formerly, Director, Waste Management, Inc.*; formerly, Director, Armstrong Holdings Inc. (parent company of floor and ceiling products business)*; formerly, Director, FPL Group Inc. (public utility holding company)*; Director, URS Corporation (engineering design services firm)*. | | 38 |
MSF-26
Metropolitan Series Fund, Inc.
Directors and Officers—(Continued)
| | | | | | | | |
Name, Address and Age | | Current
position(s)
with Fund | | Position(s)
held since | | Principal occupations
over past five years, including other directorships(2) | | Number of
Portfolios in
Fund Complex
Overseen by
Director(3) |
Nancy Hawthorne Age: 57 | | Director | | 2003 | | Chief Executive Officer, Clerestory LLC (corporate financial advisor); Director, Avid Technologies (computer software company)*; formerly, Chairman of the Board of Avid Technologies; formerly, Board of Advisors, L. Knife & Sons, Inc. (beverage distributor); formerly, Trustee, New England Zenith Fund (“Zenith Fund”)**; formerly, Chief Executive Officer and Managing Partner, Hawthorne, Krauss and Associates (corporate financial advisor); formerly, Chief Financial Officer and Executive Vice President, Continental Cablevision, subsequently renamed MediaOne (cable television company); formerly, Director, Life F/X, Inc.; formerly, Chairman of the Board, WorldClinic (distance medicine company); formerly, Director, Perini Corporation (construction company)*; formerly, Director, CGU (property and casualty insurance company); formerly, Director, Beacon Power Corporation (energy company)*. | | 38 |
| | | | |
John T. Ludes Age: 72 | | Director | | 2003 | | President, LFP Properties (consulting firm); Formerly, Trustee, Zenith Fund**; formerly, Vice Chairman, President and Chief Operating Officer, Fortune Brands/American Brands (global conglomerate); formerly, President and CEO, Acushnet Company (athletic equipment company). | | 38 |
Officers(1)
| | | | | | | | |
Name and address | | Age | | Current
position(s)
with Fund | | Position(s)
held since | | Principal occupations over past five years(2) |
| Jeffrey L. Bernier | | 37 | | Senior Vice President | | 2008 | | Vice President (since 2008), MetLife, Inc.; Vice President (since 2008), MetLife; Senior Vice President (since 2008), MetLife Advisers; formerly, Director and Senior Investment Analyst (2004 to 2007), John Hancock Financial Services; formerly, Assistant Vice President (2000 to 2001), Wachovia Securities. |
| | | | |
| Alan C. Leland | | 56 | | Senior Vice President | | 2005 | | Treasurer and Chief Financial Officer, MetLife Advisers, LLC; Treasurer (since 2005), Met Investors Advisory, LLC; Vice President (since 2004), Met Investors Advisory, LLC; Vice President (since 2003), MetLife, Inc.; Vice President, MetLife; Senior Vice President, NELICO. |
| | | | |
| Peter Duffy | | 53 | | Vice President
and Treasurer | | 2000 | | Senior Vice President, MetLife Advisers; Second Vice President (since 2003), NELICO; Vice President, MetLife (since 2004); Vice President (since 2004), MetLife, Inc.; formerly, Vice President and Treasurer, Zenith Fund**. |
| | | | |
| Jeffrey P. Halperin | | 41 | | Chief
Compliance Officer | | 2007 | | Vice President (since 2006), MetLife, Inc.; Vice President (since 2006), MetLife; Chief Compliance Officer (since 2006), Met Investors Series Trust, MetLife Advisers, Met Investors Advisory, LLC and MetLife Investment Advisors Company, LLC. |
| * | Indicates a directorship with a registered investment company or a company subject to the reporting requirements of the Securities Exchange Act of 1934, as amended. |
| ** | The Zenith Fund deregistered with the Securities and Exchange Commission (“SEC”) in 2004. |
| (†) | Served as a trustee, director and/or officer of one or more of the following companies, each of which had a direct or indirect advisory relationship with MetLife Advisers or its affiliates prior to January 31, 2005: State Street Research Financial Trust, State Street Research Income Trust, State Street Research Money Market Trust, State Street Research Institutional Funds, State Street Research Capital Trust, State Street Research Master Investment Trust, State Street Research Equity Trust, State Street Research Securities Trust and State Street Research Exchange Trust (collectively, the “State Street Research Funds”). |
| (1) | During the period shown, each Director of the Fund served as a Trustee of Metropolitan Series Fund II, a registered investment company that ceased investment operations in June of 2008 and has applied for deregistration under the Investment Company Act of 1940. During this period, each officer of the Fund served in the same position with Metropolitan Series Fund II. |
| (2) | Previous positions during the past five years with the Fund; Met Investors Series Trust; MetLife; MetLife, Inc.; MetLife Advisers; Met Investors Advisory, LLC; Zenith Fund; NELICO; or New England Securities Corporation are omitted if not materially different. |
| (3) | The Fund Complex includes the Fund (38 portfolios) and Met Investors Series Trust (49 portfolios). |
MSF-27
Metropolitan Series Fund, Inc.
BlackRock Diversified Portfolio
Board Approval of Advisory and Subadvisory Agreements
The Fund’s Contract Review Committees of the Board of Directors (the “Board” or the “Directors”) typically meet in early fall to review the Portfolios’ advisory agreements (the “Advisory Agreements”) and subadvisory agreements (the “Subadvisory Agreements,” and, together with the Advisory Agreements, the “Agreements”) and determine whether to recommend that the full Board approve the continuation of the Agreements for an additional one-year period. (Following the initial approval of an Agreement for a new Portfolio or with a new adviser or subadviser, such annual reviews are not required until 2 years following the execution of such Agreement.) After each Committee has made its recommendations, the full Board, including the Independent Directors, determines whether to approve the continuation of each of the Agreements. In addition, the Board, including the Independent Directors, considers matters bearing on the Agreements at most of its other meetings throughout the year and regularly interviews various individuals at MetLife Advisers responsible for the management of the Portfolios. The Directors also interview selected investment managers and other professionals at the subadvisers at various times throughout the year.
The Directors receive all materials that they or MetLife Advisers, the Fund’s investment adviser, and the subadvisers believe to be reasonably necessary for the Directors to evaluate the Agreements and determine whether to approve the continuation of the Agreements. These materials generally include, among other items, (i) information on the investment performance of the Portfolios and the performance of peer groups of funds and the Portfolios’ performance benchmarks, (ii) information on the Portfolios’ advisory and subadvisory fees and other expenses, including information comparing the Portfolios’ expenses to those of peer groups of funds and information about any applicable expense caps and fee “breakpoints,” (iii) sales and redemption data, (iv) information related to the profitability of the Agreements to MetLife Advisers and certain of the subadvisers, and potential “fall-out” or ancillary benefits that MetLife Advisers, the subadvisers or their affiliates may receive as a result of their relationships with the Fund and (v) information obtained through the subadvisers’ responses to certain requests from MetLife Advisers and the Directors and MetLife Advisers’ responses to requests from the Directors. The Directors may also consider other information such as (vi) MetLife Advisers’ and the subadvisers’ financial results and condition, (vii) each Portfolio’s investment objectives and strategies and the size, education and experience of the investment staffs of MetLife Advisers and the relevant subadvisers and their use of technology and external research, (viii) the allocation of the Portfolios’ brokerage, if any, including allocations to brokers affiliated with the subadvisers and the use of “soft” commission dollars to pay Portfolio expenses and to pay for research and other similar services, (ix) the resources devoted to, and the record of compliance with, the Portfolios’ investment policies and restrictions, policies on personal securities transactions and other compliance policies, (x) the responses of MetLife Advisers, the subadvisers and/or their affiliates to certain legal and regulatory proceedings and (xi) the economic outlook generally and for the mutual fund industry in particular. Throughout the process, the Directors have the opportunity to ask questions of and request additional materials from MetLife Advisers and the subadvisers.
Following meetings of each Contract Review Committee on September 10, 2008, the Board, including the Independent Directors, at its November 6-7, 2008 meeting, approved the continuation through December 31, 2009 of the Advisory Agreements for each Portfolio of the Fund and the Subadvisory Agreements for each Portfolio other than the Zenith Equity Portfolio and Asset Allocation Portfolios (which do not have subadvisers) and the Van Eck Global Natural Resources Portfolio, Met/Dimensional International Small Cap Portfolio and Loomis Sayles Small Cap Growth Portfolio (formerly known as the Franklin Templeton Small Cap Growth Portfolio). The Agreements approved for continuation are referred to below as the “Continued Agreements.”
In considering whether to approve the continuation of the Continued Agreements, the Directors, including the Independent Directors, did not identify any single factor as determinative, and each weighed the various factors as he or she deemed appropriate. The Directors considered the following matters in connection with their approval of the Continued Agreements:
The nature, extent and quality of the services provided to the relevant Portfolios under the Continued Agreements. The Directors considered the nature, extent and quality of the services provided by MetLife Advisers, the relevant subadvisers (if any) and their affiliates (each, an “Adviser,” and, collectively, the “Advisers”) to the relevant Portfolios pursuant to the Continued Agreements and the resources dedicated to these Portfolios by the Advisers. In particular, the Directors considered the Advisers’ abilities to attract and retain highly qualified investment professionals. With respect to MetLife Advisers, the Directors considered (for each Portfolio other than the Zenith Equity and Asset Allocation Portfolios) that MetLife Advisers is (i) ultimately responsible for the performance of such Portfolios; (ii) ultimately responsible for the establishment of the investment strategies of each such Portfolio, primarily through its recommendations to the Board regarding the hiring and selection of subadvisers; (iii) responsible for the hiring and selection, subject to Board approval, of subadvisers; and (iv) responsible for maintaining a program of Subadviser oversight reasonably designed to ensure that the subadvisers have reasonable compliance policies and procedures in place. The Directors also considered that MetLife Advisers provides a full range of day-to-day administrative services for the Portfolios involving all aspects of such Portfolios’ day-to-day operations (other than portfolio management). With respect to the Zenith Equity and Asset Allocation Portfolios, the Directors considered both the portfolio management services and the administrative services provided by MetLife Advisers. After reviewing
MSF-28
Metropolitan Series Fund, Inc.
BlackRock Diversified Portfolio
Board Approval of Advisory and Subadvisory Agreements—(Continued)
these and related factors, the Directors concluded, within the context of their overall conclusions regarding each of the Continued Agreements, that the nature, extent and quality of services provided supported the renewal of these Agreements.
Investment performance of the relevant Portfolios. The Directors reviewed information about the performance of the relevant Portfolios over various time periods, including information prepared by an independent third party that compared the performance of the Portfolios to the performance of peer groups of funds and performance benchmarks. The Directors also reviewed a description of the third party’s methodology for identifying a Portfolio’s peer group(s) for purposes of performance and expense comparisons.
In the case of each relevant Portfolio that had performance that lagged its peer group(s) for certain periods, the Directors concluded that other factors relevant to performance were sufficient, in light of other considerations, to warrant renewal of the Continued Agreements relating to such Portfolio. These factors varied from Portfolio to Portfolio, but included one or more of the following: (i) that such Portfolio’s performance, although lagging in certain recent periods, was stronger over the longer term; (ii) that the underperformance was attributable, to a significant extent, to investment decisions that were reasonable and consistent with the Portfolio’s investment objective(s) and policies and that the Portfolio was performing within the range of reasonable expectations, given market conditions and the Portfolio’s investment objective(s) and policies; (iii) that the Portfolio’s performance was competitive when compared to other relevant performance benchmarks or peer groups; and (iv) that MetLife Advisers and/or the relevant subadviser (if any) had taken or was taking steps designed to help improve the Portfolio’s investment performance (including, in the case of certain Portfolios, that MetLife Advisers was formulating possible proposals, for presentation to the Board in November 2008, to replace the Portfolio’s subadviser or to merge the Portfolio into another Portfolio with a similar investment objective and better investment performance).
The Directors also considered the investment performance of the Advisers and their reputations generally, the historical responsiveness of the Advisers to Director concerns about performance and the willingness of the Advisers to take steps intended to improve performance.
After reviewing these and related factors, the Directors concluded, within the context of their overall conclusions regarding each of the Continued Agreements, that the investment performance of each relevant Portfolio and Adviser was sufficient, in light of other considerations, to warrant the renewal of the Continued Agreements.
The costs of the services to be provided and profits to be realized by the Advisers and their affiliates from their relationships with the Portfolios. The Directors considered the fees charged by MetLife Advisers to the Portfolios for advisory services and, with respect to the subadvised Portfolios, by such subadvisers to MetLife Advisers for subadvisory services (such advisory and subadvisory fees (if any), collectively, “Fees”), as well as the total expense levels of the Portfolios. This information included comparisons (provided by an independent third party) of the Portfolios’ advisory fees and total expense levels to those of their peer groups. In evaluating Fees for the relevant Portfolios, the Directors also took into account the demands, complexity and quality of the investment management services provided to each Portfolio. The Directors considered MetLife Advisers’ recommendations regarding reductions in Fee rates, implementation of Fee breakpoints and institution of Fee waivers and expense caps.
The Directors also considered the compensation directly or indirectly received by the Advisers and their affiliates from their relationships with the relevant Portfolios. The Directors reviewed information relating to the profits received by MetLife Advisers, certain of the subadvisers and their affiliates as a result of their relationships with the relevant Portfolios, and information about the allocation of expenses used to calculate profitability. When reviewing profitability, the Directors also considered the performance of the relevant Portfolios, the expense levels of such Portfolios and whether the relevant Advisers had implemented breakpoints, fee waivers and/or expense caps with respect to such Portfolios.
After reviewing these and related factors, the Directors concluded, within the context of their overall conclusions regarding each of the Continued Agreements, that the Fees charged to each of the relevant Portfolios were fair and reasonable, and that the information provided regarding costs of these services generally, and the related profitability (if known) to the relevant Advisers of their relationships with the relevant Portfolios, supported the renewal of the Continued Agreements.
Economies of Scale. The Directors considered the existence of any economies of scale in the provision of services by the Advisers and whether those economies were shared with the relevant Portfolios through breakpoints in their advisory fees or other means, such as expense caps, fee waivers or relatively low levels of fees. The Directors noted that most of the relevant Portfolios benefited or will benefit from breakpoints, expense caps and/or fee waivers with respect to their advisory fees. In considering these issues, the Directors also took into consideration information relating to the costs of the services provided and the profitability to MetLife Advisers, the relevant subadvisers (if any) and each of their affiliates of their relationships with the relevant Portfolios, as discussed above.
MSF-29
Metropolitan Series Fund, Inc.
BlackRock Diversified Portfolio
Board Approval of Advisory and Subadvisory Agreements—(Continued)
After reviewing these and related factors, the Directors concluded, within the context of their overall conclusions regarding each of the Continued Agreements, that the extent to which economies of scale were shared with the relevant Portfolios supported the renewal of such Agreements.
Other Factors. The Directors also considered other factors, which included but were not limited to the following:
| | • | | the extent to which each relevant Portfolio operated in accordance with its investment objective, and its record of compliance with its investment restrictions and the compliance programs of the Fund and the Advisers. They also considered the compliance-related resources the Advisers and their affiliates provide to the relevant Portfolios; |
| | • | | the nature, quality, cost and extent of administrative and shareholder services performed by MetLife Advisers and its affiliates under the Advisory Agreements; and |
| | • | | so-called “fall-out benefits” to the Advisers, such as the engagement of their affiliates to provide distribution, brokerage and transfer agency services to the Portfolios, and the benefits of research made available to the relevant Advisers by reason of brokerage commissions generated by the relevant Portfolios’ securities transactions. The Directors also considered the possible conflicts of interest associated with these fall-out and other benefits, and the reporting and other processes in place to disclose and monitor these possible conflicts of interest. |
Based on their evaluation of all factors that they deemed to be material, including those factors described above, and assisted by the advice of independent counsel, the Directors, including the Independent Directors, concluded that each of the Continued Agreements should be continued through December 31, 2009.
MSF-30
A description of the policies and procedures that the Fund uses to determine how to vote proxies relating to portfolio securities is available (i) without charge, upon request, by calling (800) 638-7732 and (ii) on the Securities and Exchange Commission’s (the “SEC”) website at http://www.sec.gov.
Information regarding how the Fund voted proxies relating to portfolio securities during the most recent twelve-month period ended December 31, 2008 is available (i) without charge, upon request, by calling (800) 638-7732 and (ii) on the SEC’s website at http://www.sec.gov.
The Fund’s Statement of Additional Information includes additional information about the Directors of the Fund and is available (i) without charge, upon request, by calling (800) 638-7732 and (ii) on the SEC’s website at http://www.sec.gov.
The Fund files with the SEC a complete schedule of its portfolio holdings, as of the close of the first and third quarters of its fiscal year, on “Form N-Q”. These filings are available on the SEC’s website at www.sec.gov and may be reviewed and copied at the SEC’s Public Reference Room in Washington, DC. (Call 1-800-SEC-0330 for information on the operation of the Public Reference Room.)
MSF-31
Simplify your life…
with MetLife eDelivery® while helping MetLife preserve the planet’s natural resources.
(see details on inside cover)
| | |
Metropolitan Series Fund, Inc. BlackRock Large Cap Value Portfolio Annual Report | | December 31, 2008 |
NOT PART OF THE ANNUAL REPORT
Letter from the President
February 1, 2009
Letter to Policy Holders:
2008 was an extraordinary year in the capital markets around the world and for the global economy. Energy prices rose to record levels early in the year before falling by two-thirds by year-end. A credit crisis that began with concerns about sub-prime mortgages led to massive changes in the financial landscape with government takeovers, forced sales, and outright failures of a number of large, once venerable firms.
While bonds as measured by the Barclays Capital U.S. Aggregate Bond Index (formerly known as, Lehman Brothers U.S. Aggregate Bond Index) were up 5.2% for the year in response to declining interest rates, there were large differences in the total returns of the various sectors of the bond market. U.S. treasury securities were up over 13% as frightened investors sought refuge in what they perceived to be the safest and most liquid investments. In contrast, investment grade corporate securities lost nearly 5% as credit spreads widened and below investment grade or high yield bonds fell over 26%.
In response to the growing credit crisis and the weakening economy, common stocks fell sharply across all regions, styles, and capitalizations. As measured by the Standard and Poor’s 500, U.S. common stocks fell 37% for the year, the worst calendar year decline since the 1930s. Foreign stocks were down even more with the MSCI EAFE Index down 43% for the year.
On the following pages, you will find a complete review of your Portfolio and its investment performance.
MetLife is committed to building your financial freedom. We appreciate your trust and will continue to focus our efforts on meeting your investment needs.
Sincerely,
Elizabeth M. Forget
President, Metropolitan Series Fund, Inc.
Metropolitan Series Fund, Inc.
BlackRock Large Cap Value Portfolio
Managed by BlackRock Advisors, LLC
Portfolio Manager Commentary*
PORTFOLIO PERFORMANCE
For the twelve-month period ended December 31, 2008, the Class A shares of the BlackRock Large Cap Value Portfolio returned -34.9%, compared to its benchmark, the Russell 1000 Value Index1, which returned -36.8%. The average return of its peer group, the Lipper Variable Insurance Products2 Large-Cap Value Funds Universe, was -37.1% over the same period.
PORTFOLIO REVIEW
2008 will turn out to be a year investors would like to forget, but instead will vividly remember. For much of the first half of the year, equity markets held together as the hope of global decoupling kept investors from panicking, despite substantial deterioration in credit markets. The seminal event appears to have been the September Lehman Brothers bankruptcy, which drove fear higher and confidence lower, causing a massive decline in economic activity in the U.S. and globally. Although at times somewhat erratic, monetary and fiscal policy efforts became aggressive, attempting to fight off systemic collapse and growing deflationary forces. As a result, risk premia of all types rose substantially and geographic and other correlations increased. The price of risk assets, including equities, low-quality bonds and commodities collapsed in record time, as volatility levels soared. By contrast, high-quality assets, especially Treasury instruments, soared as returns on cash fell to near zero. Most governments have announced, or are in the process of announcing, massive stimulus packages in an effort to stem economic decline and encourage eventual recovery. Defensive stocks (consumer staples and healthcare) declined the least as financial stocks crumbled. Oil prices soared to $150 and then collapsed to below $40, less than half the level where they started the year. The U.S. equity market noticeably outperformed by falling less than many other markets, and the U.S. dollar enjoyed a second half rally. The year ends with uncertainty high, expectations low and problems significant.
Looking at the Portfolio broadly, the relative performance was driven primarily by security selection. From a sector standpoint, our positioning in financials was the largest contributor to positive relative performance during the year. The Portfolio has remained underweight in large money center banks and those with big capital markets operations. Even though these firms account for a sizeable portion of the sector, we are not convinced that they have figured out which business model will succeed in what has become a game-changing regulatory environment. Instead, we stuck to our long-standing focus on property and casualty insurers and selected life insurers, where we see good value. Also contributing to relative performance was our security selection in the consumer discretionary sector. We continue to focus on companies in the sector that are positioned to benefit from an increasingly cost-conscious consumer, such as large discounters and dollar stores.
Detracting from relative performance for the year was the Portfolio’s underweight in consumer staples and security selection in materials. The underweight in the consumer staples sector is predicated on our belief that the stocks have been overvalued given our expectations for future earnings growth. In materials, the metals & mining industry was the largest drag on performance as commodity prices fell.
At period-end, the Portfolio’s largest overweights versus the benchmark were in the healthcare, energy and information technology sectors. The Portfolio continued to be underweight in financials, utilities and telecommunication services.
* The views expressed above are those of the subadvisory firm as of December 31, 2008 and are subject to change based on market and other conditions. Information about the Portfolio’s holdings, asset allocation, industry allocation, or country diversification is historical and is not an indication of future Portfolio composition, which will vary. The performance of any index mentioned in this commentary has not been adjusted for ongoing management, distribution and operating expenses, and sales charges applicable to mutual fund investments. Direct investment in any index is not possible.
1 The Russell 1000® Value Index is an unmanaged measure of the largest capitalized U.S. domiciled companies with a less than average growth orientation. Companies in this Index generally have a low price-to-book and price-to-earnings ratio, higher divided yields and lower forecasted growth values.
2 The Lipper Variable Products Fund Average is an average of the total return performance (calculated on the basis of net asset value) of variable product funds with similar investment objectives to those of the subject Portfolio as calculated by Lipper Analytical Services, an independent mutual fund ranking service.
MSF-2
Metropolitan Series Fund, Inc.
BlackRock Large Cap Value Portfolio
A $10,000 INVESTMENT COMPARED TO THE RUSSELL 1000 VALUE INDEX
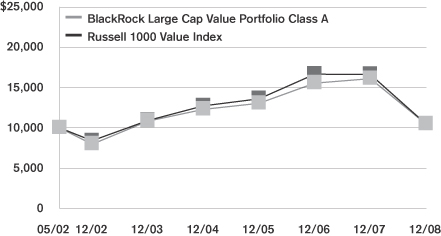
Average Annual Returns as of December 31, 2008
| | | | | | | | | | | | |
| | | BlackRock Large Cap Value Portfolio | | | Russell 1000
Value Index | |
| | | Class A | | | Class B | | | Class E | | |
| 1 Year | | -34.9 | % | | -35.1 | % | | -35.0 | % | | -36.8 | % |
| 5 Year | | -0.7 | | | -1.0 | | | -0.9 | | | -0.8 | |
| Since Inception | | 0.7 | | | 3.4 | | | 0.6 | | | 0.7 | |
Performance numbers are net of all Portfolio expenses but do not include any insurance, sales, or administrative charges of variable annuity or life insurance contracts or any additional expenses that participants in certain eligible qualified plans may bear relating to the operations of their plans. If these charges were included, the returns would be lower.
Inception dates of the Class A, Class B and Class E shares are: 5/1/02, 7/30/02, 5/1/02, respectively. Index since inception return is based on the Class A inception date.
This information represents past performance and is not indicative of future results. Investment return and principal value may fluctuate so that shares, upon redemption, may be worth more or less than the original cost.
PORTFOLIO COMPOSITION as of December 31, 2008
Top Holdings
| | |
| | | % of Total
Net Assets |
Exxon Mobil Corp. | | 8.2% |
Chevron Corp. | | 4.4% |
Johnson & Johnson | | 3.7% |
Pfizer, Inc. | | 3.7% |
Procter & Gamble Co. | | 2.9% |
ConocoPhillips | | 2.8% |
Amgen, Inc. | | 2.4% |
Eli Lilly & Co. | | 1.9% |
General Electric Co. | | 1.9% |
AT&T, Inc. | | 1.8% |
Top Sectors
| | |
| | | % of Total
Market Value |
Energy | | 27.0% |
Health Care | | 19.6% |
Financials | | 13.7% |
Industrials | | 10.2% |
Consumer Discretionary | | 8.9% |
Information Technology | | 8.0% |
Consumer Staples | | 7.3% |
Telecommunication Services | | 3.6% |
Materials | | 1.3% |
Cash | | 0.4% |
MSF-3
Metropolitan Series Fund, Inc.
Shareholder Expense Example
As a shareholder of the Portfolio, you incur ongoing costs, including management fees; distribution and service (12b-1) fees; and other Portfolio expenses. This example is intended to help you understand your ongoing costs (in dollars) (referred to as “expenses”) of investing in the Portfolio and compare these costs with the ongoing costs of investing in other mutual funds. The example is based on an investment of $1,000 invested at the beginning of the period and held for the entire period, July 1, 2008 through December 31, 2008.
Actual Expenses
The first line for each share class of the Portfolio in the table below provides information about actual account values and actual expenses. You may use the information in this line, together with the amount you invested in the particular share class of the Portfolio, to estimate the expenses that you paid over the period. Simply divide your account value by $1,000 (for example, an $8,600 account value divided by $1,000=8.6), then multiply the result by the number in the first line under the heading entitled “Expenses Paid During Period” to estimate the expenses you paid on your account during this period.
Hypothetical Example for Comparison Purposes
The second line for each share class of the Portfolio in the table below provides information about hypothetical account values and hypothetical expenses based on the Portfolio’s actual expense ratio and an assumed rate of return of 5% per year before expenses, which is not the Portfolio’s actual return. The hypothetical account values and expenses may not be used to estimate the actual ending account balance or expenses you paid for the period. You may use this information to compare the ongoing costs of investing in the Portfolio and other funds. To do so, compare this 5% hypothetical example with the 5% hypothetical examples that appear in the shareholder reports of the other funds.
Please note that the expenses shown in the table are meant to highlight your ongoing costs only and do not reflect any fees or charges of your variable insurance product or any additional expenses that participants in certain eligible qualified plans may bear relating to the operations of their plan. Therefore, the second line for each share class in the table is useful in comparing ongoing costs only, and will not help you determine the relative total costs of owning different funds. In addition, if these other costs were included, your costs would have been higher.
| | | | | | | | | | | | | | |
Portfolio | | | | Annualized
Expense
Ratio | | | Beginning
Account Value
July 1,
2008 | | Ending
Account Value
December 31,
2008 | | Expenses Paid
During Period*
July 1, 2008
to
December 31,
2008 |
BlackRock Large Cap Value—Class A | | Actual | | 0.73 | % | | $ | 1,000.00 | | $ | 727.73 | | $ | 3.17 |
| | Hypothetical | | 0.73 | % | | $ | 1,000.00 | | $ | 1,021.42 | | $ | 3.71 |
| | | | | |
BlackRock Large Cap Value—Class B | | Actual | | 0.98 | % | | $ | 1,000.00 | | $ | 725.97 | | $ | 4.25 |
| | Hypothetical | | 0.98 | % | | $ | 1,000.00 | | $ | 1,020.15 | | $ | 4.98 |
| | | | | |
BlackRock Large Cap Value—Class E | | Actual | | 0.88 | % | | $ | 1,000.00 | | $ | 726.43 | | $ | 3.82 |
| | Hypothetical | | 0.88 | % | | $ | 1,000.00 | | $ | 1,020.66 | | $ | 4.47 |
* Expenses paid are equal to the Portfolio's annualized expense ratio for the most recent six month period, as shown above, multiplied by the average account value over the period, multiplied by the number of days in the most recent fiscal half-year, divided by 366 (to reflect the the one-half year period).
MSF-4
Metropolitan Series Fund, Inc.
BlackRock Large Cap Value Portfolio
Schedule of Investments as of December 31, 2008
Common Stock—99.6% of Total Net Assets
| | | | | |
| Security Description | | Shares | | Value* |
| | | | | |
| | |
Aerospace & Defense—5.1% | | | | | |
General Dynamics Corp. | | 142,000 | | $ | 8,177,780 |
L-3 Communications Holdings, Inc. | | 63,000 | | | 4,648,140 |
Lockheed Martin Corp. | | 13,100 | | | 1,101,448 |
Northrop Grumman Corp. | | 152,000 | | | 6,846,080 |
Raytheon Co. | | 137,000 | | | 6,992,480 |
| | | | | |
| | | | | 27,765,928 |
| | | | | |
| | |
Airlines—1.1% | | | | | |
Southwest Airlines Co. | | 664,000 | | | 5,723,680 |
| | | | | |
| | |
Biotechnology—2.4% | | | | | |
Amgen, Inc. (a) | | 221,000 | | | 12,762,750 |
| | | | | |
| | |
Commercial & Professional Services—0.8% | | | | | |
R.R. Donnelley & Sons Co. | | 9,000 | | | 122,220 |
Waste Management, Inc. | | 125,000 | | | 4,142,500 |
| | | | | |
| | | | | 4,264,720 |
| | | | | |
| | |
Commercial Banks—0.5% | | | | | |
Wells Fargo & Co. | | 97,000 | | | 2,859,560 |
| | | | | |
| | |
Communications Equipment—0.4% | | | | | |
Tellabs, Inc. (a) | | 572,000 | | | 2,356,640 |
| | | | | |
| | |
Computers & Peripherals—2.0% | | | | | |
Hewlett-Packard Co. | | 115,000 | | | 4,173,350 |
Lexmark International, Inc. (Class A) (a) (b) | | 19,000 | | | 511,100 |
QLogic Corp. (a) | | 275,000 | | | 3,696,000 |
Western Digital Corp. (a) | | 208,000 | | | 2,381,600 |
| | | | | |
| | | | | 10,762,050 |
| | | | | |
| | |
Consumer Finance—1.3% | | | | | |
Capital One Financial Corp. | | 224,000 | | | 7,143,360 |
| | | | | |
| | |
Diversified Financial Services—0.6% | | | | | |
JPMorgan Chase & Co. | | 99,000 | | | 3,121,470 |
| | | | | |
|
Diversified Telecommunication Services—3.6% |
AT&T, Inc. | | 345,000 | | | 9,832,500 |
CenturyTel, Inc. (b) | | 93,000 | | | 2,541,690 |
Embarq Corp. | | 160,000 | | | 5,753,600 |
Verizon Communications, Inc. | | 32,000 | | | 1,084,800 |
| | | | | |
| | | | | 19,212,590 |
| | | | | |
|
Electronic Equipment, Instruments & Components—0.8% |
Arrow Electronics, Inc. | | 133,000 | | | 2,505,720 |
Ingram Micro, Inc. (a) | | 104,000 | | | 1,392,560 |
Jabil Circuit, Inc. | | 90,000 | | | 607,500 |
| | | | | |
| | | | | 4,505,780 |
| | | | | |
| | |
Energy Equipment & Services—2.7% | | | | | |
ENSCO International, Inc. | | 152,000 | | | 4,315,280 |
Nabors Industries, Ltd. (a) (b) | | 445,000 | | | 5,326,650 |
Rowan Cos., Inc. | | 8,000 | | | 127,200 |
Tidewater, Inc. (b) | | 123,000 | | | 4,953,210 |
| | | | | |
| | | | | 14,722,340 |
| | | | | |
| | | | | |
| Security Description | | Shares | | Value* |
| | | | | |
| | |
Food & Staples Retailing—2.1% | | | | | |
BJ's Wholesale Club, Inc. (a) (b) | | 133,000 | | $ | 4,556,580 |
The Kroger Co. | | 248,000 | | | 6,549,680 |
| | | | | |
| | | | | 11,106,260 |
| | | | | |
| | |
Food Products—2.1% | | | | | |
General Mills, Inc. | | 104,000 | | | 6,318,000 |
H.J. Heinz Co. | | 129,000 | | | 4,850,400 |
| | | | | |
| | | | | 11,168,400 |
| | | | | |
| | |
Health Care Providers & Services—6.1% | | | | | |
Aetna, Inc. | | 214,000 | | | 6,099,000 |
AmerisourceBergen Corp. | | 106,900 | | | 3,812,054 |
Cigna Corp. | | 195,000 | | | 3,285,750 |
Community Health Systems, Inc. (a) | | 55,000 | | | 801,900 |
Humana, Inc. (a) | | 155,000 | | | 5,778,400 |
LifePoint Hospitals, Inc. (a) (b) | | 6,000 | | | 137,040 |
Lincare Holdings, Inc. (a) | | 5,000 | | | 134,650 |
McKesson Corp. (b) | | 131,000 | | | 5,073,630 |
Omnicare, Inc. (b) | | 5,000 | | | 138,800 |
WellPoint, Inc. (a) | | 184,000 | | | 7,751,920 |
| | | | | |
| | | | | 33,013,144 |
| | | | | |
| | |
Health Care Technology—0.2% | | | | | |
IMS Health, Inc. | | 64,000 | | | 970,240 |
| | | | | |
| | |
Hotels, Restaurants & Leisure—1.1% | | | | | |
McDonald's Corp. | | 91,000 | | | 5,659,290 |
| | | | | |
| | |
Household Durables—3.3% | | | | | |
Jarden Corp. (a) (b) | | 8,000 | | | 92,000 |
M.D.C. Holdings, Inc. (b) | | 136,000 | | | 4,120,800 |
NVR, Inc. (a) (b) | | 8,000 | | | 3,650,000 |
Pulte Homes, Inc. (b) | | 438,000 | | | 4,787,340 |
Toll Brothers, Inc. (a) (b) | | 241,000 | | | 5,164,630 |
| | | | | |
| | | | | 17,814,770 |
| | | | | |
| | |
Household Products—2.9% | | | | | |
Procter & Gamble Co. | | 255,000 | | | 15,764,100 |
| | | | | |
| | |
Industrial Conglomerates—1.9% | | | | | |
General Electric Co. | | 624,000 | | | 10,108,800 |
| | | | | |
| | |
Insurance—11.2% | | | | | |
American Financial Group, Inc. | | 74,000 | | | 1,693,120 |
HCC Insurance Holdings, Inc. | | 216,000 | | | 5,778,000 |
Lincoln National Corp. | | 306,000 | | | 5,765,040 |
PartnerRe, Ltd. | | 82,000 | | | 5,844,140 |
Prudential Financial, Inc. | | 216,000 | | | 6,536,160 |
RenaissanceRe Holdings, Ltd. | | 12,000 | | | 618,720 |
The Allstate Corp. | | 230,000 | | | 7,534,800 |
The Chubb Corp. | | 137,000 | | | 6,987,000 |
The Travelers Cos., Inc. | | 196,000 | | | 8,859,200 |
Transatlantic Holdings, Inc. | | 23,500 | | | 941,410 |
Unum Group | | 298,000 | | | 5,542,800 |
W.R. Berkley Corp. | | 148,000 | | | 4,588,000 |
| | | | | |
| | | | | 60,688,390 |
| | | | | |
*See accompanying notes to financial statements.
MSF-5
Metropolitan Series Fund, Inc.
BlackRock Large Cap Value Portfolio
Schedule of Investments as of December 31, 2008
Common Stock—(Continued)
| | | | | |
| Security Description | | Shares | | Value* |
| | | | | |
| | |
IT Services—0.1% | | | | | |
Affiliated Computer Services, Inc. (Class A) (a) | | 13,000 | | $ | 597,350 |
Computer Sciences Corp. (a) | | 5,000 | | | 175,700 |
| | | | | |
| | | | | 773,050 |
| | | | | |
| | |
Leisure Equipment & Products—0.6% | | | | | |
Hasbro, Inc. (b) | | 108,000 | | | 3,150,360 |
| | | | | |
| | |
Machinery—0.5% | | | | | |
AGCO Corp. (a) | | 105,000 | | | 2,476,950 |
Dover Corp. | | 14,000 | | | 460,880 |
| | | | | |
| | | | | 2,937,830 |
| | | | | |
| | |
Media—0.0% | | | | | |
Warner Music Group Corp. (a) (b) | | 35,000 | | | 105,700 |
| | | | | |
| | |
Metals & Mining—1.3% | | | | | |
Reliance Steel & Aluminum Co. | | 99,000 | | | 1,974,060 |
United States Steel Corp. (b) | | 131,000 | | | 4,873,200 |
| | | | | |
| | | | | 6,847,260 |
| | | | | |
| | |
Multiline Retail—0.9% | | | | | |
Family Dollar Stores, Inc. (b) | | 190,000 | | | 4,953,300 |
| | | | | |
| | |
Office Electronics—0.4% | | | | | |
Xerox Corp. | | 251,000 | | | 2,000,470 |
| | | | | |
| | |
Oil, Gas & Consumable Fuels—24.4% | | | | | |
Anadarko Petroleum Corp. | | 200,000 | | | 7,710,000 |
Apache Corp. | | 110,000 | | | 8,198,300 |
Chevron Corp. | | 322,000 | | | 23,818,340 |
ConocoPhillips (b) | | 291,000 | | | 15,073,800 |
Devon Energy Corp. | | 112,000 | | | 7,359,520 |
Exxon Mobil Corp. | | 556,000 | | | 44,385,480 |
Marathon Oil Corp. | | 304,000 | | | 8,317,440 |
Occidental Petroleum Corp. | | 77,000 | | | 4,619,230 |
Sunoco, Inc. (b) | | 129,000 | | | 5,606,340 |
Valero Energy Corp. | | 313,000 | | | 6,773,320 |
| | | | | |
| | | | | 131,861,770 |
| | | | | |
| | |
Pharmaceuticals—11.0% | | | | | |
Bristol-Myers Squibb Co. | | 244,000 | | | 5,673,000 |
Eli Lilly & Co. | | 255,000 | | | 10,268,850 |
Endo Pharmaceuticals Holdings, Inc. (a) | | 8,000 | | | 207,040 |
Forest Laboratories, Inc. (a) | | 7,000 | | | 178,290 |
Johnson & Johnson | | 337,000 | | | 20,162,710 |
King Pharmaceuticals, Inc. (a) | | 94,900 | | | 1,007,838 |
Pfizer, Inc. | | 1,115,000 | | | 19,746,650 |
Watson Pharmaceuticals, Inc. (a) | | 5,000 | | | 132,850 |
Wyeth | | 48,000 | | | 1,800,480 |
| | | | | |
| | | | | 59,177,708 |
| | | | | |
| | |
Professional Services—0.1% | | | | | |
Manpower, Inc. | | 20,000 | | | 679,800 |
| | | | | |
| | | | | | | |
| Security Description | | Shares | | Value* | |
| | | | | | | |
| | |
Road & Rail—0.7% | | | | | | | |
CSX Corp. | | | 108,000 | | $ | 3,506,760 | |
| | | | | | | |
|
Semiconductors & Semiconductor Equipment—1.6% | |
Integrated Device Technology, Inc. (a) | | | 237,000 | | | 1,329,570 | |
Intersil Corp. | | | 210,000 | | | 1,929,900 | |
KLA-Tencor Corp. (b) | | | 173,000 | | | 3,769,670 | |
Novellus Systems, Inc. (a) (b) | | | 143,000 | | | 1,764,620 | |
| | | | | | | |
| | | | | | 8,793,760 | |
| | | | | | | |
| | |
Software—2.6% | | | | | | | |
CA, Inc. | | | 48,000 | | | 889,440 | |
Compuware Corp. (a) | | | 80,000 | | | 540,000 | |
McAfee, Inc. (a) | | | 126,600 | | | 4,376,562 | |
Symantec Corp. (a) | | | 517,000 | | | 6,989,840 | |
Synopsys, Inc. (a) | | | 57,400 | | | 1,063,048 | |
| | | | | | | |
| | | | | | 13,858,890 | |
| | | | | | | |
| | |
Specialty Retail—3.0% | | | | | | | |
Foot Locker, Inc. (b) | | | 10,000 | | | 73,400 | |
Limited Brands, Inc. | | | 571,000 | | | 5,732,840 | |
RadioShack Corp. (b) | | | 454,000 | | | 5,420,760 | |
The Gap, Inc. | | | 383,000 | | | 5,128,370 | |
| | | | | | | |
| | | | | | 16,355,370 | |
| | | | | | | |
| | |
Tobacco—0.2% | | | | | | | |
Reynolds American, Inc. | | | 32,000 | | | 1,289,920 | |
| | | | | | | |
| |
Trading Companies & Distributors—0.0% | | | | |
United Rentals, Inc. (a) (b) | | | 10,000 | | | 91,200 | |
| | | | | | | |
Total Common Stock
(Identified Cost $656,682,259) | | | | | | 537,877,410 | |
| | | | | | | |
| | |
| Short Term Investments—4.7% | | | | | | | |
| Security Description | | Shares/Face
Amount | | Value* | |
| | |
Mutual Funds—3.9% | | | | | | | |
State Street Navigator Securities Lending Prime Portfolio (c) | | | 21,170,957 | | | 21,170,957 | |
| | | | | | | |
| | |
Repurchase Agreement—0.8% | | | | | | | |
State Street Repurchase Agreement dated 12/31/08 at 0.010% to be repurchased at $3,922,002 on 01/02/09, collateralized by $4,005,000 U.S. Treasury Bill due 02/26/09 with a value of $4,004,600. | | $ | 3,922,000 | | | 3,922,000 | |
| | | | | | | |
Total Short Term Investments
(Identified Cost $25,092,957) | | | | | | 25,092,957 | |
| | | | | | | |
Total Investments—104.3%
(Identified Cost $681,775,216) (d) | | | | | | 562,970,367 | |
Liabilities in excess of other assets | | | | | | (23,040,492 | ) |
| | | | | | | |
| Total Net Assets—100% | | | | | $ | 539,929,875 | |
| | | | | | | |
*See accompanying notes to financial statements.
MSF-6
Metropolitan Series Fund, Inc.
BlackRock Large Cap Value Portfolio
Schedule of Investments as of December 31, 2008
| (b) | A portion or all of the security was on loan. As of December 31, 2008, the market value of securities loaned was $20,923,871 and the collateral received consisted of cash in the amount of $21,170,957. The cash collateral is invested in a money market fund managed by an affiliate of the custodian. |
| (c) | Represents investment of cash collateral received from securities lending transactions. |
| (d) | The aggregate cost of investments for federal income tax purposes as of December 31, 2008 was $699,952,487 and the composition of unrealized appreciation and depreciation of investment securities was $9,562,846 and $(146,544,966), respectively. |
The Portfolio adopted the provisions of Statement of Financial Accounting Standards No. 157, “Fair Value Measurements” (FAS 157), effective with the beginning of the Portfolio’s fiscal year. FAS 157 establishes a framework for measuring fair value and expands disclosures about fair value measurements in financial statements. The three levels of the hierarchy under FAS 157 are described below:
Level 1 - quoted prices in active markets for identical securities
Level 2 - other significant observable inputs (including quoted prices for similar securities, interest rates, credit risk, etc.)
Level 3 - significant unobservable inputs (including the Portfolio’s own assumptions in determining the fair value of investments)
The inputs or methodology used for valuing securities are not necessarily an indication of the risk associated with investing in those securities.
The following is a summary of the inputs used to value the Portfolio’s net assets as of December 31, 2008:
| | | | | | |
| Valuation Inputs | | Investments In
Securities | | Other Financial
Instruments* |
Level 1 - Quoted Prices | | $ | 559,048,367 | | $ | 0 |
Level 2 - Other Significant Observable Inputs | | | 3,922,000 | | | 0 |
Level 3 - Significant Unobservable Inputs | | | 0 | | | 0 |
Total | | $ | 562,970,367 | | $ | 0 |
* Other financial instruments are derivative instruments not reflected in the Schedule of Investments, such as futures, forwards, swap contracts and written options, which are valued based on the unrealized appreciation/depreciation on the instrument.
*See accompanying notes to financial statements.
MSF-7
Metropolitan Series Fund, Inc.
BlackRock Large Cap Value Portfolio
Statement of Assets & Liabilities
December 31, 2008
| | | | | | | |
Assets | | | | | | | |
Investments at value (a) (b) | | | | | $ | 562,970,367 | |
Cash | | | | | | 192 | |
Receivable for: | | | | | | | |
Securities sold | | | | | | 7,541,106 | |
Fund shares sold | | | | | | 316,674 | |
Accrued interest and dividends | | | | | | 764,359 | |
| | | | | | | |
Total Assets | | | | | | 571,592,698 | |
Liabilities | | | | | | | |
Payable for: | | | | | | | |
Securities purchased | | $ | 9,950,544 | | | | |
Fund shares redeemed | | | 180,963 | | | | |
Collateral for securities loaned | | | 21,170,957 | | | | |
Accrued expenses: | | | | | | | |
Management fees | | | 290,245 | | | | |
Service and distribution fees | | | 33,675 | | | | |
Other expenses | | | 36,439 | | | | |
| | | | | | | |
Total Liabilities | | | | | | 31,662,823 | |
| | | | | | | |
Net Assets | | | | | $ | 539,929,875 | |
| | | | | | | |
Net assets consists of: | | | | | | | |
Capital paid in | | | | | $ | 786,994,483 | |
Undistributed net investment income | | | | | | 8,081,808 | |
Accumulated net realized losses | | | | | | (136,341,567 | ) |
Unrealized depreciation on investments | | | | | | (118,804,849 | ) |
| | | | | | | |
Net Assets | | | | | $ | 539,929,875 | |
| | | | | | | |
| Computation of offering price: | | | | | | | |
Class A | | | | | | | |
Net asset value and redemption price per share ($345,230,331 divided by 39,881,904 shares outstanding) | | | | | $ | 8.66 | |
| | | | | | | |
Class B | | | | | | | |
Net asset value and redemption price per share ($134,467,357 divided by 15,611,630 shares outstanding) | | | | | $ | 8.61 | |
| | | | | | | |
Class E | | | | | | | |
Net asset value and redemption price per share ($60,232,187 divided by 6,976,686 shares outstanding) | | | | | $ | 8.63 | |
| | | | | | | |
(a) Identified cost of investments | | | | | $ | 681,775,216 | |
| | | | | | | |
(b) Includes cash collateral for securities loaned of | | | | | $ | 21,170,957 | |
| | | | | | | |
Statement of Operations
For the Year Ended December 31, 2008
| | | | | | | |
Investment Income | | | | | | | |
Dividends | | | | | $ | 12,846,281 | |
Interest | | | | | | 209,802 | (a) |
| | | | | | | |
| | | | | | 13,056,083 | |
Expenses | | | | | | | |
Management fees | | $ | 4,111,680 | | | | |
Service and distribution fees—Class B | | | 378,933 | | | | |
Service and distribution fees—Class E | | | 125,654 | | | | |
Directors’ fees and expenses | | | 31,905 | | | | |
Custodian | | | 68,369 | | | | |
Audit and tax services | | | 36,941 | | | | |
Legal | | | 10,886 | | | | |
Printing | | | 133,249 | | | | |
Insurance | | | 7,221 | | | | |
Miscellaneous | | | 12,396 | | | | |
| | | | | | | |
Total expenses | | | | | | 4,917,234 | |
| | | | | | | |
Net Investment Income | | | | | | 8,138,849 | |
| | | | | | | |
Realized and Unrealized Loss | | | | | | | |
| Realized loss on: | | | | | | | |
Investments—net | | | | | | (129,273,044 | ) |
| Change in unrealized depreciation on: | | | | | | | |
Investments—net | | | | | | (142,069,908 | ) |
| | | | | | | |
Net loss | | | | | | (271,342,952 | ) |
| | | | | | | |
Net Decrease in Net Assets From Operations | | | | | $ | (263,204,103 | ) |
| | | | | | | |
| (a) | Includes income on securities loaned of $188,966. |
See accompanying notes to financial statements.
MSF-8
Metropolitan Series Fund, Inc.
BlackRock Large Cap Value Portfolio
Statements of Changes in Net Assets
| | | | | | | | |
| | | Year ended
December 31,
2008 | | | Year ended
December 31,
2007 | |
From Operations | | | | | | | | |
Net investment income | | $ | 8,138,849 | | | $ | 4,378,141 | |
Net realized gain (loss) | | | (129,273,044 | ) | | | 3,307,732 | |
Change in unrealized depreciation | | | (142,069,908 | ) | | | (4,793,424 | ) |
| | | | | | | | |
Increase (decrease) in net assets from operations | | | (263,204,103 | ) | | | 2,892,449 | |
| | | | | | | | |
From Distributions to Shareholders | | | | | | | | |
Net investment income | | | | | | | | |
Class A | | | (2,961,716 | ) | | | (518,185 | ) |
Class B | | | (766,021 | ) | | | (1,134,029 | ) |
Class E | | | (589,033 | ) | | | (1,065,888 | ) |
| | | | | | | | |
| | | (4,316,770 | ) | | | (2,718,102 | ) |
| | | | | | | | |
Net realized gain | | | | | | | | |
Class A | | | (5,743,934 | ) | | | (1,970,563 | ) |
Class B | | | (2,262,707 | ) | | | (5,371,717 | ) |
Class E | | | (1,449,927 | ) | | | (4,641,772 | ) |
| | | | | | | | |
| | | (9,456,568 | ) | | | (11,984,052 | ) |
| | | | | | | | |
Total distributions | | | (13,773,338 | ) | | | (14,702,154 | ) |
| | | | | | | | |
Increase in net assets from capital share transactions | | | 170,270,857 | | | | 389,343,171 | |
| | | | | | | | |
Net increase (decrease) in net assets | | | (106,706,584 | ) | | | 377,533,466 | |
| | |
Net Assets | | | | | | | | |
Beginning of the period | | | 646,636,459 | | | | 269,102,993 | |
| | | | | | | | |
End of the period | | $ | 539,929,875 | | | $ | 646,636,459 | |
| | | | | | | | |
Undistributed Net Investment Income | | | | | | | | |
End of the period | | $ | 8,081,808 | | | $ | 4,290,705 | |
| | | | | | | | |
Other Information:
Capital Shares
Transactions in capital shares were as follows:
| | | | | | | | | | | | | | |
| | | Year ended
December 31, 2008 | | | Year ended
December 31, 2007 | |
| | | Shares | | | $ | | | Shares | | | $ | |
Class A | | | | | | | | | | | | | | |
Sales | | 14,355,442 | | | $ | 163,039,898 | | | 25,075,646 | | | $ | 347,828,727 | |
Reinvestments | | 692,023 | | | | 8,705,650 | | | 179,305 | | | | 2,488,748 | |
Redemptions | | (2,406,003 | ) | | | (25,982,888 | ) | | (1,502,776 | ) | | | (20,751,708 | ) |
| | | | | | | | | | | | | | |
Net increase | | 12,641,462 | | | $ | 145,762,660 | | | 23,752,175 | | | $ | 329,565,767 | |
| | | | | | | | | | | | | | |
Class B | | | | | | | | | | | | | | |
Sales | | 6,285,369 | | | $ | 70,187,731 | | | 5,888,414 | | | $ | 81,721,981 | |
Reinvestments | | 241,525 | | | | 3,028,728 | | | 470,408 | | | | 6,505,746 | |
Redemptions | | (3,050,251 | ) | | | (34,475,668 | ) | | (2,299,463 | ) | | | (31,784,678 | ) |
| | | | | | | | | | | | | | |
Net increase | | 3,476,643 | | | $ | 38,740,791 | | | 4,059,359 | | | $ | 56,443,049 | |
| | | | | | | | | | | | | | |
Class E | | | | | | | | | | | | | | |
Sales | | 1,106,830 | | | $ | 11,991,811 | | | 3,380,179 | | | $ | 47,119,568 | |
Reinvestments | | 162,338 | | | | 2,038,960 | | | 412,105 | | | | 5,707,660 | |
Redemptions | | (2,497,411 | ) | | | (28,263,365 | ) | | (3,569,274 | ) | | | (49,492,873 | ) |
| | | | | | | | | | | | | | |
Net increase (decrease) | | (1,228,243 | ) | | $ | (14,232,594 | ) | | 223,010 | | | $ | 3,334,355 | |
| | | | | | | | | | | | | | |
Increase derived from capital share transactions | | | | | $ | 170,270,857 | | | | | | $ | 389,343,171 | |
| | | | | | | | | | | | | | |
See accompanying notes to financial statements.
MSF-9
Metropolitan Series Fund, Inc.
BlackRock Large Cap Value Portfolio
Financial Highlights
| | | | | | | | | | | | | | | | | | | |
| | | Class A |
| | | Year ended December 31, |
| | | 2008 | | | 2007 | | | 2006 | | | 2005 | | | 2004 |
Net Asset Value, Beginning of Period | | $ | 13.61 | | | $ | 13.81 | | | $ | 12.56 | | | $ | 12.11 | | | $ | 10.67 |
| | | | | | | | | | | | | | | | | | | |
Income From Investment Operations | | | | | | | | | | | | | | | | | | | |
Net investment income | | | 0.16 | (a) | | | 0.15 | (a) | | | 0.20 | | | | 0.19 | | | | 0.15 |
Net realized and unrealized gain (loss) of investments | | | (4.82 | ) | | | 0.33 | | | | 2.10 | | | | 0.51 | | | | 1.29 |
| | | | | | | | | | | | | | | | | | | |
Total from investment operations | | | (4.66 | ) | | | 0.48 | | | | 2.30 | | | | 0.70 | | | | 1.44 |
| | | | | | | | | | | | | | | | | | | |
Less Distributions | | | | | | | | | | | | | | | | | | | |
Distributions from net investment income | | | (0.10 | ) | | | (0.14 | ) | | | (0.18 | ) | | | (0.12 | ) | | | 0.00 |
Distributions from net realized capital gains | | | (0.19 | ) | | | (0.54 | ) | | | (0.87 | ) | | | (0.13 | ) | | | 0.00 |
| | | | | | | | | | | | | | | | | | | |
Total distributions | | | (0.29 | ) | | | (0.68 | ) | | | (1.05 | ) | | | (0.25 | ) | | | 0.00 |
| | | | | | | | | | | | | | | | | | | |
Net Asset Value, End of Period | | $ | 8.66 | | | $ | 13.61 | | | $ | 13.81 | | | $ | 12.56 | | | $ | 12.11 |
| | | | | | | | | | | | | | | | | | | |
Total Return (%) | | | (34.9 | ) | | | 3.4 | | | | 19.3 | | | | 6.0 | | | | 13.4 |
Ratio of operating expenses to average net assets before expense reductions (%) | | | 0.72 | | | | 0.74 | | | | 0.84 | | | | 0.85 | | | | 0.93 |
Ratio of operating expenses to average net assets after expense reductions (%) (b) | | | N/A | | | | N/A | | | | 0.82 | | | | 0.83 | | | | 0.89 |
Ratio of net investment income to average net assets (%) | | | 1.42 | | | | 1.10 | | | | 1.69 | | | | 1.59 | | | | 1.31 |
Portfolio turnover rate (%) | | | 85 | | | | 66 | | | | 96 | | | | 109 | | | | 31 |
Net assets, end of period (000) | | $ | 345,230 | | | $ | 370,865 | | | $ | 48,176 | | | $ | 38,850 | | | $ | 37,259 |
| | | | | | | | | | | | | | | | | | | |
| | | Class B |
| | | Year ended December 31, |
| | | 2008 | | | 2007 | | | 2006 | | | 2005 | | | 2004 |
Net Asset Value, Beginning of Period | | $ | 13.55 | | | $ | 13.75 | | | $ | 12.50 | | | $ | 12.07 | | | $ | 10.66 |
| | | | | | | | | | | | | | | | | | | |
Income From Investment Operations | | | | | | | | | | | | | | | | | | | |
Net investment income | | | 0.13 | (a) | | | 0.11 | (a) | | | 0.14 | | | | 0.13 | | | | 0.08 |
Net realized and unrealized gain (loss) of investments | | | (4.81 | ) | | | 0.34 | | | | 2.13 | | | | 0.53 | | | | 1.33 |
| | | | | | | | | | | | | | | | | | | |
Total from investment operations | | | (4.68 | ) | | | 0.45 | | | | 2.27 | | | | 0.66 | | | | 1.41 |
| | | | | | | | | | | | | | | | | | | |
Less Distributions | | | | | | | | | | | | | | | | | | | |
Distributions from net investment income | | | (0.07 | ) | | | (0.11 | ) | | | (0.15 | ) | | | (0.10 | ) | | | 0.00 |
Distributions from net realized capital gains | | | (0.19 | ) | | | (0.54 | ) | | | (0.87 | ) | | | (0.13 | ) | | | 0.00 |
| | | | | | | | | | | | | | | | | | | |
Total distributions | | | (0.26 | ) | | | (0.65 | ) | | | (1.02 | ) | | | (0.23 | ) | | | 0.00 |
| | | | | | | | | | | | | | | | | | | |
Net Asset Value, End of Period | | $ | 8.61 | | | $ | 13.55 | | | $ | 13.75 | | | $ | 12.50 | | | $ | 12.07 |
| | | | | | | | | | | | | | | | | | | |
Total Return (%) | | | (35.1 | ) | | | 3.1 | | | | 19.1 | | | | 5.6 | | | | 13.2 |
Ratio of operating expenses to average net assets before expense reductions (%) | | | 0.97 | | | | 0.99 | | | | 1.09 | | | | 1.10 | | | | 1.18 |
Ratio of operating expenses to average net assets after expense reductions (%) (b) | | | N/A | | | | N/A | | | | 1.07 | | | | 1.08 | | | | 1.14 |
Ratio of net investment income to average net assets (%) | | | 1.15 | | | | 0.78 | | | | 1.46 | | | | 1.38 | | | | 1.46 |
Portfolio turnover rate (%) | | | 85 | | | | 66 | | | | 96 | | | | 109 | | | | 31 |
Net assets, end of period (000) | | $ | 134,467 | | | $ | 164,376 | | | $ | 111,007 | | | $ | 36,725 | | | $ | 15,880 |
| Please | see following page for Financial Highlights footnote legend. |
See accompanying notes to financial statements.
MSF-10
Metropolitan Series Fund, Inc.
BlackRock Large Cap Value Portfolio
Financial Highlights
| | | | | | | | | | | | | | | | | | | |
| | | Class E |
| | | Year ended December 31, |
| | | 2008 | | | 2007 | | | 2006 | | | 2005 | | | 2004 |
Net Asset Value, Beginning of Period | | $ | 13.58 | | | $ | 13.77 | | | $ | 12.52 | | | $ | 12.08 | | | $ | 10.66 |
| | | | | | | | | | | | | | | | | | | |
Income From Investment Operations | | | | | | | | | | | | | | | | | | | |
Net investment income | | | 0.14 | (a) | | | 0.12 | (a) | | | 0.14 | | | | 0.18 | | | | 0.12 |
Net realized and unrealized gain (loss) of investments | | | (4.82 | ) | | | 0.35 | | | | 2.14 | | | | 0.49 | | | | 1.30 |
| | | | | | | | | | | | | | | | | | | |
Total from investment operations | | | (4.68 | ) | | | 0.47 | | | | 2.28 | | | | 0.67 | | | | 1.42 |
| | | | | | | | | | | | | | | | | | | |
Less Distributions | | | | | | | | | | | | | | | | | | | |
Distributions from net investment income | | | (0.08 | ) | | | (0.12 | ) | | | (0.16 | ) | | | (0.10 | ) | | | 0.00 |
Distributions from net realized capital gains | | | (0.19 | ) | | | (0.54 | ) | | | (0.87 | ) | | | (0.13 | ) | | | 0.00 |
| | | | | | | | | | | | | | | | | | | |
Total distributions | | | (0.27 | ) | | | (0.66 | ) | | | (1.03 | ) | | | (0.23 | ) | | | 0.00 |
| | | | | | | | | | | | | | | | | | | |
Net Asset Value, End of Period | | $ | 8.63 | | | $ | 13.58 | | | $ | 13.77 | | | $ | 12.52 | | | $ | 12.08 |
| | | | | | | | | | | | | | | | | | | |
Total Return (%) | | | (35.0 | ) | | | 3.3 | | | | 19.2 | | | | 5.7 | | | | 13.3 |
Ratio of operating expenses to average net assets before expense reductions (%) | | | 0.87 | | | | 0.89 | | | | 0.99 | | | | 1.00 | | | | 1.08 |
Ratio of operating expenses to average net assets after expense reductions (%) (b) | | | N/A | | | | N/A | | | | 0.97 | | | | 0.98 | | | | 1.04 |
Ratio of net investment income to average net assets (%) | | | 1.20 | | | | 0.87 | | | | 1.55 | | | | 1.44 | | | | 1.21 |
Portfolio turnover rate (%) | | | 85 | | | | 66 | | | | 96 | | | | 109 | | | | 31 |
Net assets, end of period (000) | | $ | 60,232 | | | $ | 111,396 | | | $ | 109,920 | | | $ | 58,269 | | | $ | 59,449 |
| (a) | Per share amount is based on average shares outstanding during the period. |
| (b) | The Portfolio has entered into arrangements with certain brokers who paid a portion of the Portfolio's expenses. |
See accompanying notes to financial statements.
MSF-11
Metropolitan Series Fund, Inc.
BlackRock Large Cap Value Portfolio
Notes to Financial Statements—December 31, 2008
Metropolitan Series Fund, Inc. (the “Fund”) is organized as a corporation under the laws of Maryland pursuant to Articles of Incorporation filed on November 23, 1982, as amended, and registered under the Investment Company Act of 1940, as amended (the “1940 Act”), as an open-end investment company. The Fund is a “series” type of mutual fund, which issues separate series of stock. Each series represents an interest in a separate portfolio of Fund investments. The BlackRock Large Cap Value Portfolio (the “Portfolio”) is a diversified series of the Fund. Shares in the Fund are not offered directly to the general public and are currently available only to separate accounts established by Metropolitan Life Insurance Company (“MetLife”), New England Life Insurance Company, General American Life Insurance Company (“General American”), The MetLife Investors Group of Insurance Companies, MetLife Insurance Company of Connecticut and other affiliated insurance companies (collectively, the “Insurance Companies”) and to certain eligible qualified retirement plans (“Qualified Plans”), as an investment vehicle for variable life insurance, group annuity or variable annuity products of these insurance companies or Qualified Plans, although the Portfolio is not available to all such separate accounts and Qualified Plans. The Portfolio’s shares may be divided into different classes. Currently, the classes being offered by the Portfolio are named Class A, Class B and Class E. The classes of the Portfolio’s shares are identical, except that certain additional charges (Rule 12b-1 fees) are made against Class B and Class E shares. Investment income, realized and unrealized capital gains and losses, the common expenses of the Portfolio and certain Portfolio-level expense reductions, if any, are allocated daily, on a pro rata basis, to each class based on the relative net assets of each class to the total net assets of the Portfolio.
| 2. | SIGNIFICANT ACCOUNTING POLICIES: |
The preparation of financial statements in conformity with accounting principles generally accepted in the United States of America (“GAAP”) requires management to make estimates and assumptions that affect the reported amounts of assets and liabilities and disclosure of contingent assets and liabilities as of the date of the financial statements and the reported amounts of income and expenses during the reporting period. Actual results could differ from those estimates.
The following is a summary of significant accounting policies consistently followed by the Portfolio in the preparation of its financial statements. The policies are in conformity with GAAP.
Investment Valuation:
Debt securities (other than short term obligations with a remaining maturity of sixty days or less) are generally valued on the basis of evaluated or composite bid quotations obtained by independent pricing services and/or brokers and dealers selected by the relevant subadviser pursuant to authorization of the Board of Directors of the Fund (the “Board” or “Directors”). Such quotations take into account appropriate factors such as institutional-sized trading in similar groups of securities, yield, quality, coupon rate, maturity, type of issue, trading characteristics and other data. Short term obligations with a remaining maturity of sixty days or less are valued at amortized cost which approximates fair market value.
Equity securities traded on a national securities exchange or other exchanges are valued at their last sale price on the principal trading market. Equity securities traded on the NASDAQ National Market System are valued at the NASDAQ Official Closing Price (the “NOCP”). The NOCP is the last reported sale price if the last reported sale price falls between the spread of the last reported bid and asked prices. If the last reported bid and asked prices are above the last reported sale price, the NOCP will be the last reported bid price. If the last reported bid and asked prices are below the last reported sale price, the NOCP will be the last reported asked price. Equity securities traded on a national securities exchange or other exchanges or on the NASDAQ National Market System for which there is no reported sale during the day are valued at the last reported bid price. A security that is listed or traded on more than one exchange is valued at the quotation on the exchange determined to be the primary market for that security by the Board or its delegates. If no closing price is available, then such securities are valued by using the last reported bid price. Equity securities traded over-the-counter are valued at the last reported sales price.
If no current market value quotation is readily available or reliable for a portfolio security, fair value will be determined in accordance with procedures established by and under the general supervision of the Board. When the Portfolio uses fair value pricing, it may take into account any factors it deems appropriate. The value of securities used by the Portfolio to calculate its net asset value may differ from quoted or published prices for the same securities. Fair value pricing involves subjective judgments and the fair value determined for a security may be materially different than the value that could be realized upon the sale of that security.
MSF-12
Metropolitan Series Fund, Inc.
BlackRock Large Cap Value Portfolio
Notes to Financial Statements—December 31, 2008—(Continued)
The Portfolio expects to use fair value pricing for securities primarily traded on U.S. exchanges only under very limited circumstances. For example, the Portfolio may use fair value pricing if the exchange on which a security is traded closes early or trading in the security is suspended.
Securities traded primarily on an exchange outside of the United States which closes before the close of the New York Stock Exchange will be valued at the last sales price on that non-U.S. exchange. Securities traded primarily on an exchange outside of the United States for which there is no reported sale during the day are valued at the mean between the last reported bid and asked prices. However, because most foreign markets close well before the Portfolio values its securities (typically at 4 p.m. Eastern Time), the earlier close of these foreign markets gives rise to the possibility that significant events, including broad market moves, may have occurred after these foreign markets close but before the Portfolio values its securities. To account for this, the Portfolio may frequently value many of its foreign equity securities using fair value prices based on third party vendor modeling tools.
Forward foreign currency exchange contracts are valued based on the mean between closing bid and asked prices of the forward currency contract rates in the London foreign exchange markets on a daily basis as provided by a reliable bank or dealer.
Options, whether on securities, indices, futures contracts, or otherwise, are valued at the last sales price available as of the close of business on the day of valuation or, if there is no such sale price available, at the mean between the bid and asked prices. Options on currencies are valued at the spot price each day.
The value of futures contracts will be the sum of the margin deposit plus or minus the difference between the value of the futures contract on each day the net asset value is calculated and the value on the date the futures contract originated, value being that established on a recognized commodity exchange, or by reference to other customary sources, with gain or loss being realized when the futures contract closes or expires.
Subject to the Board’s oversight, the Board has delegated the day-to-day oversight of pricing matters, including determinations in good faith under the Fund’s procedures the fair value of securities for which current market quotations are not readily available to the subadviser of the Portfolio.
Investment Transactions and Related Investment Income:
Portfolio security transactions are recorded on the trade date. Dividend income is recorded on the ex-dividend date or, for certain foreign securities, when notified. Interest income, which includes amortization of premium and accretion of discount on debt securities, is recorded on the accrual basis. Realized gains and losses on investments and unrealized appreciation and depreciation are determined on the identified cost basis, which is the same basis used for federal income tax purposes.
Repurchase Agreements:
The Portfolio, through the custodian or a subcustodian, receives delivery of the underlying securities collateralizing repurchase agreements. The Portfolio requires the custodian to take possession, to have legally segregated in the Federal Reserve Book Entry System, or to have segregated within the custodian’s vault, all securities held as collateral for repurchase agreements. It is the Portfolio’s policy that the market value of the collateral be at least equal to 100% of the repurchase price in the case of a repurchase agreement of one-day duration and 102% on all other repurchase agreements. The Portfolio’s subadviser is responsible for determining that the value of the collateral is at all times at least equal to the repurchase price. In connection with transactions in repurchase agreements, if the seller defaults and the value of the collateral declines or if the seller enters an insolvency proceeding, realization of the collateral by the Portfolio may be delayed, limited or wholly denied.
Foreign Currency Translation:
The books and records of the Portfolio are maintained in U.S. dollars. The values of securities, currencies and other assets and liabilities denominated in currencies other than U.S. dollars are translated into U.S. dollars based upon foreign exchange rates prevailing at the end of the period. Purchases and sales of investment securities, income and expenses are translated on the respective dates of such transactions. Since the values of investment securities are presented at the foreign exchange rates prevailing at the end of the period, it is not practical to isolate that portion of the results of operations arising from changes in exchange rates from that portion of the results of operations reflecting fluctuations arising from changes in market prices of the investment securities. Such fluctuations are included in the net realized and unrealized gain or loss on investments.
MSF-13
Metropolitan Series Fund, Inc.
BlackRock Large Cap Value Portfolio
Notes to Financial Statements—December 31, 2008—(Continued)
Net realized foreign exchange gains or losses arise from sales of foreign currency, currency gains or losses realized between the trade and settlement dates on securities transactions, and the difference between the amounts of dividends, interest, and foreign withholding taxes recorded by the Portfolio and the U.S. dollar equivalent of the amounts actually received or paid by the Portfolio. Net unrealized foreign exchange gains and losses arise from changes in the value of assets and liabilities, other than investment securities, resulting from changes in the exchange rate.
Forward Foreign Currency Exchange Contracts:
The Portfolio may enter into forward foreign currency exchange contracts primarily to hedge against foreign currency exchange rate risks on its non-U.S. dollar denominated investment securities. When entering into a forward currency contract, the Portfolio agrees to receive or deliver a fixed quantity of foreign currency for an agreed-upon price on an agreed future date. These contracts are valued daily and the Portfolio’s net equity therein, representing unrealized gain or loss on the contracts as measured by the difference between the foreign exchange rates at the dates of entry into the contracts and the forward rates at the settlement date, is included in the Statement of Assets and Liabilities. Realized and unrealized gains and losses are included in the Statement of Operations. These instruments involve market and/or credit risk in excess of the amount recognized in the Statement of Assets and Liabilities. Risks arise from the possible inability of counterparties to meet the terms of their contracts and from movement in currency and securities values and interest rates.
Futures Contracts:
The Portfolio may buy and sell futures contracts (on recognized exchanges) as a hedge, to maintain exposure to the broad equity markets or to enhance return. Futures contracts are agreements to buy or sell a security, or deliver a final cash settlement price in connection with an index, interest rate, currency, or other contracts not calling for physical delivery, for a set price in the future. The Portfolio must post an amount equal to a portion of the total market value of the futures contract as futures variation margin, which is returned when the Portfolio’s obligations under the contract have been satisfied. From time to time thereafter, the Portfolio may have to post variation margin to maintain this amount as the market value of the contract fluctuates. Risks of entering into futures contracts (and related options) include the possibility that there may be an illiquid market and that a change in the value of the contract or option may not correlate with changes in the value of the underlying securities.
Options:
The Portfolio may use options to hedge against changes in values of securities the Portfolio owns or expects to purchase, to maintain exposure to the broad equity markets or to enhance return. Writing puts or buying calls tends to increase the Portfolio’s exposure to the underlying instrument and writing calls or buying puts tends to decrease the Portfolio’s exposure to the underlying instrument, and can be used to hedge other Portfolio investments. For options purchased to hedge the Portfolio’s investments, the potential risk to the Portfolio is that the change in value of options contracts may not correspond to the change in value of the hedged instruments. In addition, losses may arise from changes in the value of the underlying instruments, if there is an illiquid secondary market, or if the counterparty is unable to perform. The maximum loss for purchased options is limited to the premium initially paid for the option. For options written by the Portfolio, the maximum loss is not limited to the premium initially received for the option.
The main risk associated with purchasing an option is that the option expires without being exercised. In this case, the option expires worthless and the premium paid for the option is considered the loss. The risk associated with writing a call option is that the Portfolio may forgo the opportunity for a profit if the market value of the underlying position increases and the option is exercised. The risk in writing a put option is that the Portfolio may incur a loss if the market value of the underlying position decreases and the option is exercised. In addition, the Portfolio risks not being able to enter into a closing transaction for the written option as the result of an illiquid market.
“When-Issued” Securities:
Purchasing securities “when-issued” is a forward commitment by the Portfolio to buy a security. The estimated amount of the Portfolio’s payment obligation and the security’s interest rate are determined when the commitment is made, even though no interest accrues until the security is issued, which is generally 15 to 120 days later. The Portfolio will segregate liquid assets with its custodian sufficient at all times to satisfy these commitments. If the value of the security is less when delivered than when the commitment was made, the Portfolio will suffer a loss.
MSF-14
Metropolitan Series Fund, Inc.
BlackRock Large Cap Value Portfolio
Notes to Financial Statements—December 31, 2008—(Continued)
Federal Income Taxes:
It is the Portfolio’s policy to comply with the requirements of the Internal Revenue Code of 1986, as amended (the “Code”), and regulations thereunder, applicable to regulated investment companies and to distribute, with respect to each taxable year, all of its taxable income to shareholders. Therefore, no federal income tax provision is required. The Portfolio is subject to the provisions of the Financial Accounting Standards Board Interpretation (“FASB”) No. 48, Accounting for Uncertainties in Income Taxes (FIN 48). FIN 48 sets forth a minimum threshold for financial statement recognition of the benefit of a tax position taken or expected to be taken in a tax return. The implementation of FIN 48 did not result in any unrecognized tax benefits in the accompanying financial statements. Each of the Portfolio's federal tax returns for the prior three fiscal years remains subject to examination by the Internal Revenue Service.
As of December 31, 2008, the Portfolio had $67,576,872 in capital loss carryforwards expiring on December 31, 2016.
Pursuant to Section 852 of the Code, the Portfolio designated the amount shown below under Long Term Gain as capital gain dividends for its taxable year ended December 31, 2008. The tax character of distributions paid for the periods ended December 31, 2008 and 2007 was as follows:
| | | | | | | | | | | | | | | | | | | | | | |
| Ordinary Income | | Long Term Gain | | Return of Capital | | Total |
| 2008 | | 2007 | | 2008 | | 2007 | | 2008 | | 2007 | | 2008 | | 2007 |
| $ | 4,347,746 | | $ | 3,228,534 | | $ | 9,425,592 | | $ | 11,473,620 | | $ | — | | $ | — | | $ | 13,773,338 | | $ | 14,702,154 |
As of December 31, 2008, the components of distributable earnings (accumulated losses) on a federal income tax basis were as follows:
| | | | | | | | | | | | | | | | |
Undistributed
Ordinary
Income | | Undistributed
Long Term
Gain | | Unrealized
Depreciation | | | Loss
Carryforwards | | | Total | |
| $ | 8,081,808 | | $ | — | | $ | (136,982,120 | ) | | $ | (67,576,872 | ) | | $ | (196,477,184 | ) |
Pursuant to Federal income tax regulations applicable to investment companies, the Portfolio has elected to treat net capital losses realized between November 1 and December 31 of each year as occurring on the first day of the following tax year. For the year ended December 31, 2008, the following amounts of realized capital and currency losses reflected in the accompanying financial statements will not be recognized for Federal income tax purposes until January 1, 2009:
| | | | |
Currency | | Capital | |
$— | | $ | (50,587,424 | ) |
Dividends and Distributions to Shareholders:
The Portfolio records dividends and distributions on the ex-dividend date. Net realized gains from security transactions (if any) are generally distributed annually to shareholders. The timing and characterization of certain income and capital gains distributions are determined in accordance with federal tax regulations that may differ from GAAP. Permanent book and tax basis differences relating to shareholder distributions will result in reclassification between under/over distributed net investment income, accumulated net realized gains/losses and paid in capital.
| 3. | INVESTMENT TRANSACTIONS: |
For the year ended December 31, 2008, purchases and sales of securities (excluding short term investments) for the Portfolio were as follows:
| | | | | | | | | | |
| Purchases | | Sales |
| U.S. Government | | Other | | U.S. Government | | Other |
| $ | 0 | | $ | 689,199,499 | | $ | 0 | | $ | 525,097,524 |
MSF-15
Metropolitan Series Fund, Inc.
BlackRock Large Cap Value Portfolio
Notes to Financial Statements—December 31, 2008—(Continued)
| 4. | INVESTMENT MANAGEMENT FEES AND OTHER TRANSACTIONS WITH AFFILIATES: |
Investment Management Agreement:
MetLife Advisers, LLC (“MetLife Advisers”) is the investment adviser to the Portfolio. The Fund has entered into an investment management agreement with MetLife Advisers with respect to the Portfolio. For providing investment management services to the Portfolio, MetLife Advisers receives monthly compensation at the following annual rates:
| | | | |
Management
Fees earned by
MetLife Advisers
for the year ended
December 31, 2008 | | Annual
percentage
rates paid to
MetLife Advisers | | Based on Portfolios
average daily net asset
levels |
| $4,111,680 | | 0.700% | | Of the first $250 million |
| | 0.650% | | Of the next $500 million |
| | 0.600% | | On amounts in excess of $750 million |
Certain officers and directors of the Fund may also be officers of MetLife Advisers; however, such officers and directors receive no compensation from the Fund.
MetLife Advisers has entered into an investment subadvisory agreement with respect to the Portfolio. BlackRock Advisors, LLC is compensated by MetLife Advisers to provide subadvisory services for the Portfolio.
Service and Distribution Fees:
The Fund has adopted a Distribution and Service Plan under Rule 12b-1 of the 1940 Act for the Portfolio’s Class B and E shares. Under the Distribution and Service Plan, the Class B and E shares of the Portfolio pay a fee to compensate the Insurance Companies (or their affiliates) and other broker-dealers and financial intermediaries involved in the offer and sale of Portfolio shares for promoting or selling and servicing the Class B and E shares. The fees under the Distribution and Service Plan for each class of the Portfolio’s shares are calculated as a percentage of the Portfolio’s average daily net assets that are attributable to that Class. Currently, the fee is 0.25% per year for Class B shares and 0.15% per year for Class E shares. Amounts paid by the Portfolio for the year ended December 31, 2008 are shown as Service and Distribution fees in the Statement of Operations.
The Fund has entered into a securities lending arrangement with the Fund’s custodian, State Street Bank and Trust Company (the “custodian”). Under the agreement, the custodian is authorized to loan securities on the Portfolios’ behalf. In exchange, the Portfolio receives either cash or securities as collateral against the loaned securities. The Portfolio receives collateral at least equal to 102% of the market value of the loaned securities (105% for foreign securities), at each loan’s inception. Collateral must be maintained at least at 100% of the market value of the loaned securities for the duration of the loan. The cash collateral is invested in the Navigator Securities Lending Prime Portfolio, an affiliate of the custodian, which invests in a variety of high quality U.S. dollar-denominated instruments. If the market value of the collateral at the close of trading on a business day is less than 100% of the market value of the loaned securities at the close of trading on that day, the borrower shall be required to deliver, by the close of business on the following business day, an additional amount of collateral, equal to at least 100% of the market value of all the loaned securities as of such preceding day. The Portfolio receives 80% of the annual net income from securities lending transactions, which is included in interest income of the Portfolio. The remaining 20% is paid to the custodian as compensation for its securities lending services. Interest income received by the Portfolio via lending transactions during the year ended December 31, 2008 is footnoted in the Statement of Operations. The Portfolio bears the risk of any deficiency in the amount of collateral available for return to a borrower due to a loss in an approved investment purchased with such collateral. Any outstanding loans by the Portfolio at December 31, 2008 are footnoted in the Schedule of Investments.
| 6. | MARKET AND CREDIT RISK: |
In the normal course of business, the Portfolio invests in securities and enters into transactions where risks exist due to fluctuations in the market (market risk) or failure of the other party to a transaction to perform (credit risk). The value of securities held by the Portfolio may decline in response to certain events, including those directly involving the companies whose securities are owned by the Portfolio; conditions affecting the general economy; overall market changes; local, regional or global political, social or economic instability; and currency and interest rate and price fluctuations. Similar to credit risk, the Portfolio
MSF-16
Metropolitan Series Fund, Inc.
BlackRock Large Cap Value Portfolio
Notes to Financial Statements—December 31, 2008—(Continued)
may be exposed to counterparty risk, or the risk that an entity with which the Portfolio has unsettled or open transactions may default. Financial assets, which potentially expose the Portfolio to credit and counterparty risks, consist principally of investments and cash due from counterparties. The extent of the Portfolio’s exposure to credit and counterparty risks in respect to these financial assets approximates their value as recorded in the Portfolio’s Statements of Assets and Liabilities.
| 7. | RECENT ACCOUNTING PRONOUNCEMENTS: |
In March 2008, the FASB issued Statement of Financial Accounting Standards No. 161, Disclosures about Derivative Instruments and Hedging Activities (“FAS 161”), an amendment of FASB Statement No. 133. FAS 161 requires enhanced disclosures about (a) how and why an entity uses derivative instruments, (b) how derivative instruments and hedging activities are accounted for, and (c) how derivative instruments and related hedging activities affect a fund’s financial position, financial performance, and cash flows. Management does not believe the adoption of FAS 161 will materially impact the financial statement amounts, but will require additional disclosures. This will include qualitative and quantitative disclosures on derivative positions existing at period end and the effect of using derivatives during the reporting period. FAS 161 is effective for financial statements issued for fiscal years and interim periods beginning after November 15, 2008. Management is currently evaluating the impact the adoption of FAS 161 will have on the Portfolio’s financial statement disclosures.
MSF-17
Metropolitan Series Fund, Inc.
BlackRock Large Cap Value Portfolio
Report of Independent Registered Public Accounting Firm
To the Shareholders and Board of Directors of Metropolitan Series Fund, Inc.:
We have audited the accompanying statement of assets and liabilities, including the schedule of investments, of the BlackRock Large Cap Value Portfolio (one of the portfolios constituting the Metropolitan Series Fund, Inc.) (the “Fund”) as of December 31, 2008, and the related statement of operations for the year then ended, the statements of changes in net assets for each of the two years in the period then ended, and the financial highlights for each of the five years in the period then ended. These financial statements and financial highlights are the responsibility of the Fund’s management. Our responsibility is to express an opinion on these financial statements and financial highlights based on our audits.
We conducted our audits in accordance with the standards of the Public Company Accounting Oversight Board (United States). Those standards require that we plan and perform the audit to obtain reasonable assurance about whether the financial statements and financial highlights are free of material misstatement. The Fund is not required to have, nor were we engaged to perform, an audit of its internal control over financial reporting. Our audits included consideration of internal control over financial reporting as a basis for designing audit procedures that are appropriate in the circumstances, but not for the purpose of expressing an opinion on the effectiveness of the Fund’s internal control over financial reporting. Accordingly, we express no such opinion. An audit also includes examining, on a test basis, evidence supporting the amounts and disclosures in the financial statements, assessing the accounting principles used and significant estimates made by management, as well as evaluating the overall financial statement presentation. Our procedures included confirmation of securities owned as of December 31, 2008, by correspondence with the custodian and brokers; where replies were not received from brokers, we performed other auditing procedures. We believe that our audits provide a reasonable basis for our opinion.
In our opinion, the financial statements and financial highlights referred to above present fairly, in all material respects, the financial position of the BlackRock Large Cap Value Portfolio of the Metropolitan Series Fund, Inc. as of December 31, 2008, the results of its operations for the year then ended, the changes in its net assets for each of the two years in the period then ended, and the financial highlights for each of the five years in the period then ended, in conformity with accounting principles generally accepted in the United States of America.
Deloitte & Touche LLP
Boston, Massachusetts
February 23, 2009
MSF-18
Metropolitan Series Fund, Inc.
Directors and Officers
The Fund’s Directors review actions of the Fund’s investment adviser and subadvisers, and decide upon matters of general policy. The Fund’s officers supervise the daily business operations of the Fund. The Board of Directors and the Fund’s officers are listed below. Each Director is responsible for overseeing all 38 Portfolios of the Fund. There is no limit to the term a Director may serve. Directors serve until their resignation, retirement or removal in accordance with the Fund’s organizational documents and policies adopted by the Board from time to time. Officers hold office at the pleasure of the Board or until the election or appointment and the qualification of a successor. The address of the Directors and officers is c/o Metropolitan Series Fund, Inc., 501 Boylston Street, Boston, MA 02116.
Interested Directors(1)
Each Director below is an “interested person” (as defined by the 1940 Act) with respect to the Fund in that Ms. Forget is an employee of MetLife and Mr. Typermass is a former employee of MetLife and owns securities issued by MetLife, Inc., the ultimate parent company of MetLife Advisers.
| | | | | | | | |
Name, Address and Age | | Current
position(s)
with Fund | | Position(s)
held since | | Principal occupations
over past five years, including other directorships(2) | | Number of
Portfolios in
Fund Complex
Overseen by
Director(3) |
Elizabeth M. Forget Age: 42 | | Director, Chairman of the Board, President and Chief Executive Officer | | 2006 | | Senior Vice President (since 2007), MetLife, Inc.; President, Met Investors Advisory, LLC; Trustee and President, Met Investors Series Trust; Executive Vice President, MetLife Investors Group, Inc.; President, Chief Executive Officer and Chair of the Board of Managers (since 2006), MetLife Advisers; President, Met Investors Advisory, LLC. | | 87 |
| | | | |
Arthur G. Typermass Age: 71 | | Director | | 1998 | | Formerly, Senior Vice President and Treasurer, MetLife. | | 38 |
Non-Interested Directors(1)
Each Director below is not an “interested person” (as defined by the 1940 Act) with respect to the Fund (collectively, the “Independent Directors”).
| | | | | | | | |
Name, Address and Age | | Current
position(s)
with Fund | | Position(s)
held since | | Principal occupations
over past five years, including other directorships(2) | | Number of
Portfolios in
Fund Complex
Overseen by
Director(3) |
Steve A. Garban† Age: 71 | | Director | | 1985 | | Formerly, Chief Financial Officer, Senior Vice President Finance and Operations and Treasurer (Emeritus), The Pennsylvania State University. | | 38 |
| | | | |
Linda B. Strumpf Age: 61 | | Director | | 2000 | | Vice President and Chief Investment Officer, Ford Foundation. | | 38 |
| | | | |
Michael S. Scott Morton† Age: 71 | | Director | | 1993 | | Jay W. Forrester Professor of Management (Emeritus) at Sloan School of Management, MIT. | | 38 |
| | | | |
H. Jesse Arnelle Age: 75 | | Director | | 2001 | | Formerly, Counsel, Womble Carlyle Sandrie & Rice; Director, Textron Inc. (global multi- industry company)*; formerly, Director, Gannet Co. Inc. (diversified news and information company)*; formerly, Director, Eastman Chemical Company (global chemical company)*; formerly, Director, Waste Management, Inc.*; formerly, Director, Armstrong Holdings Inc. (parent company of floor and ceiling products business)*; formerly, Director, FPL Group Inc. (public utility holding company)*; Director, URS Corporation (engineering design services firm)*. | | 38 |
MSF-19
Metropolitan Series Fund, Inc.
Directors and Officers—(Continued)
| | | | | | | | |
Name, Address and Age | | Current
position(s)
with Fund | | Position(s)
held since | | Principal occupations
over past five years, including other directorships(2) | | Number of
Portfolios in
Fund Complex
Overseen by
Director(3) |
Nancy Hawthorne Age: 57 | | Director | | 2003 | | Chief Executive Officer, Clerestory LLC (corporate financial advisor); Director, Avid Technologies (computer software company)*; formerly, Chairman of the Board of Avid Technologies; formerly, Board of Advisors, L. Knife & Sons, Inc. (beverage distributor); formerly, Trustee, New England Zenith Fund (“Zenith Fund”)**; formerly, Chief Executive Officer and Managing Partner, Hawthorne, Krauss and Associates (corporate financial advisor); formerly, Chief Financial Officer and Executive Vice President, Continental Cablevision, subsequently renamed MediaOne (cable television company); formerly, Director, Life F/X, Inc.; formerly, Chairman of the Board, WorldClinic (distance medicine company); formerly, Director, Perini Corporation (construction company)*; formerly, Director, CGU (property and casualty insurance company); formerly, Director, Beacon Power Corporation (energy company)*. | | 38 |
| | | | |
John T. Ludes Age: 72 | | Director | | 2003 | | President, LFP Properties (consulting firm); Formerly, Trustee, Zenith Fund**; formerly, Vice Chairman, President and Chief Operating Officer, Fortune Brands/American Brands (global conglomerate); formerly, President and CEO, Acushnet Company (athletic equipment company). | | 38 |
Officers(1)
| | | | | | | | |
Name and address | | Age | | Current
position(s)
with Fund | | Position(s)
held since | | Principal occupations over past five years(2) |
| Jeffrey L. Bernier | | 37 | | Senior Vice President | | 2008 | | Vice President (since 2008), MetLife, Inc.; Vice President (since 2008), MetLife; Senior Vice President (since 2008), MetLife Advisers; formerly, Director and Senior Investment Analyst (2004 to 2007), John Hancock Financial Services; formerly, Assistant Vice President (2000 to 2001), Wachovia Securities. |
| | | | |
| Alan C. Leland | | 56 | | Senior Vice President | | 2005 | | Treasurer and Chief Financial Officer, MetLife Advisers, LLC; Treasurer (since 2005), Met Investors Advisory, LLC; Vice President (since 2004), Met Investors Advisory, LLC; Vice President (since 2003), MetLife, Inc.; Vice President, MetLife; Senior Vice President, NELICO. |
| | | | |
| Peter Duffy | | 53 | | Vice President
and Treasurer | | 2000 | | Senior Vice President, MetLife Advisers; Second Vice President (since 2003), NELICO; Vice President, MetLife (since 2004); Vice President (since 2004), MetLife, Inc.; formerly, Vice President and Treasurer, Zenith Fund**. |
| | | | |
| Jeffrey P. Halperin | | 41 | | Chief
Compliance Officer | | 2007 | | Vice President (since 2006), MetLife, Inc.; Vice President (since 2006), MetLife; Chief Compliance Officer (since 2006), Met Investors Series Trust, MetLife Advisers, Met Investors Advisory, LLC and MetLife Investment Advisors Company, LLC. |
| * | Indicates a directorship with a registered investment company or a company subject to the reporting requirements of the Securities Exchange Act of 1934, as amended. |
| ** | The Zenith Fund deregistered with the Securities and Exchange Commission (“SEC”) in 2004. |
| (†) | Served as a trustee, director and/or officer of one or more of the following companies, each of which had a direct or indirect advisory relationship with MetLife Advisers or its affiliates prior to January 31, 2005: State Street Research Financial Trust, State Street Research Income Trust, State Street Research Money Market Trust, State Street Research Institutional Funds, State Street Research Capital Trust, State Street Research Master Investment Trust, State Street Research Equity Trust, State Street Research Securities Trust and State Street Research Exchange Trust (collectively, the “State Street Research Funds”). |
| (1) | During the period shown, each Director of the Fund served as a Trustee of Metropolitan Series Fund II, a registered investment company that ceased investment operations in June of 2008 and has applied for deregistration under the Investment Company Act of 1940. During this period, each officer of the Fund served in the same position with Metropolitan Series Fund II. |
| (2) | Previous positions during the past five years with the Fund; Met Investors Series Trust; MetLife; MetLife, Inc.; MetLife Advisers; Met Investors Advisory, LLC; Zenith Fund; NELICO; or New England Securities Corporation are omitted if not materially different. |
| (3) | The Fund Complex includes the Fund (38 portfolios) and Met Investors Series Trust (49 portfolios). |
MSF-20
Metropolitan Series Fund, Inc.
BlackRock Large Cap Value Portfolio
Board Approval of Advisory and Subadvisory Agreements
The Fund’s Contract Review Committees of the Board of Directors (the “Board” or the “Directors”) typically meet in early fall to review the Portfolios’ advisory agreements (the “Advisory Agreements”) and subadvisory agreements (the “Subadvisory Agreements,” and, together with the Advisory Agreements, the “Agreements”) and determine whether to recommend that the full Board approve the continuation of the Agreements for an additional one-year period. (Following the initial approval of an Agreement for a new Portfolio or with a new adviser or subadviser, such annual reviews are not required until 2 years following the execution of such Agreement.) After each Committee has made its recommendations, the full Board, including the Independent Directors, determines whether to approve the continuation of each of the Agreements. In addition, the Board, including the Independent Directors, considers matters bearing on the Agreements at most of its other meetings throughout the year and regularly interviews various individuals at MetLife Advisers responsible for the management of the Portfolios. The Directors also interview selected investment managers and other professionals at the subadvisers at various times throughout the year.
The Directors receive all materials that they or MetLife Advisers, the Fund’s investment adviser, and the subadvisers believe to be reasonably necessary for the Directors to evaluate the Agreements and determine whether to approve the continuation of the Agreements. These materials generally include, among other items, (i) information on the investment performance of the Portfolios and the performance of peer groups of funds and the Portfolios’ performance benchmarks, (ii) information on the Portfolios’ advisory and subadvisory fees and other expenses, including information comparing the Portfolios’ expenses to those of peer groups of funds and information about any applicable expense caps and fee “breakpoints,” (iii) sales and redemption data, (iv) information related to the profitability of the Agreements to MetLife Advisers and certain of the subadvisers, and potential “fall-out” or ancillary benefits that MetLife Advisers, the subadvisers or their affiliates may receive as a result of their relationships with the Fund and (v) information obtained through the subadvisers’ responses to certain requests from MetLife Advisers and the Directors and MetLife Advisers’ responses to requests from the Directors. The Directors may also consider other information such as (vi) MetLife Advisers’ and the subadvisers’ financial results and condition, (vii) each Portfolio’s investment objectives and strategies and the size, education and experience of the investment staffs of MetLife Advisers and the relevant subadvisers and their use of technology and external research, (viii) the allocation of the Portfolios’ brokerage, if any, including allocations to brokers affiliated with the subadvisers and the use of “soft” commission dollars to pay Portfolio expenses and to pay for research and other similar services, (ix) the resources devoted to, and the record of compliance with, the Portfolios’ investment policies and restrictions, policies on personal securities transactions and other compliance policies, (x) the responses of MetLife Advisers, the subadvisers and/or their affiliates to certain legal and regulatory proceedings and (xi) the economic outlook generally and for the mutual fund industry in particular. Throughout the process, the Directors have the opportunity to ask questions of and request additional materials from MetLife Advisers and the subadvisers.
Following meetings of each Contract Review Committee on September 10, 2008, the Board, including the Independent Directors, at its November 6-7, 2008 meeting, approved the continuation through December 31, 2009 of the Advisory Agreements for each Portfolio of the Fund and the Subadvisory Agreements for each Portfolio other than the Zenith Equity Portfolio and Asset Allocation Portfolios (which do not have subadvisers) and the Van Eck Global Natural Resources Portfolio, Met/Dimensional International Small Cap Portfolio and Loomis Sayles Small Cap Growth Portfolio (formerly known as the Franklin Templeton Small Cap Growth Portfolio). The Agreements approved for continuation are referred to below as the “Continued Agreements.”
In considering whether to approve the continuation of the Continued Agreements, the Directors, including the Independent Directors, did not identify any single factor as determinative, and each weighed the various factors as he or she deemed appropriate. The Directors considered the following matters in connection with their approval of the Continued Agreements:
The nature, extent and quality of the services provided to the relevant Portfolios under the Continued Agreements. The Directors considered the nature, extent and quality of the services provided by MetLife Advisers, the relevant subadvisers (if any) and their affiliates (each, an “Adviser,” and, collectively, the “Advisers”) to the relevant Portfolios pursuant to the Continued Agreements and the resources dedicated to these Portfolios by the Advisers. In particular, the Directors considered the Advisers’ abilities to attract and retain highly qualified investment professionals. With respect to MetLife Advisers, the Directors considered (for each Portfolio other than the Zenith Equity and Asset Allocation Portfolios) that MetLife Advisers is (i) ultimately responsible for the performance of such Portfolios; (ii) ultimately responsible for the establishment of the investment strategies of each such Portfolio, primarily through its recommendations to the Board regarding the hiring and selection of subadvisers; (iii) responsible for the hiring and selection, subject to Board approval, of subadvisers; and (iv) responsible for maintaining a program of Subadviser oversight reasonably designed to ensure that the subadvisers have reasonable compliance policies and procedures in place. The Directors also considered that MetLife Advisers provides a full range of day-to-day administrative services for the Portfolios involving all aspects of such Portfolios’ day-to-day operations (other than portfolio management). With respect to the Zenith Equity and Asset Allocation Portfolios, the Directors considered both the portfolio management services and the administrative services provided by MetLife Advisers. After reviewing
MSF-21
Metropolitan Series Fund, Inc.
BlackRock Large Cap Value Portfolio
Board Approval of Advisory and Subadvisory Agreements—(Continued)
these and related factors, the Directors concluded, within the context of their overall conclusions regarding each of the Continued Agreements, that the nature, extent and quality of services provided supported the renewal of these Agreements.
Investment performance of the relevant Portfolios. The Directors reviewed information about the performance of the relevant Portfolios over various time periods, including information prepared by an independent third party that compared the performance of the Portfolios to the performance of peer groups of funds and performance benchmarks. The Directors also reviewed a description of the third party’s methodology for identifying a Portfolio’s peer group(s) for purposes of performance and expense comparisons.
In the case of each relevant Portfolio that had performance that lagged its peer group(s) for certain periods, the Directors concluded that other factors relevant to performance were sufficient, in light of other considerations, to warrant renewal of the Continued Agreements relating to such Portfolio. These factors varied from Portfolio to Portfolio, but included one or more of the following: (i) that such Portfolio’s performance, although lagging in certain recent periods, was stronger over the longer term; (ii) that the underperformance was attributable, to a significant extent, to investment decisions that were reasonable and consistent with the Portfolio’s investment objective(s) and policies and that the Portfolio was performing within the range of reasonable expectations, given market conditions and the Portfolio’s investment objective(s) and policies; (iii) that the Portfolio’s performance was competitive when compared to other relevant performance benchmarks or peer groups; and (iv) that MetLife Advisers and/or the relevant subadviser (if any) had taken or was taking steps designed to help improve the Portfolio’s investment performance (including, in the case of certain Portfolios, that MetLife Advisers was formulating possible proposals, for presentation to the Board in November 2008, to replace the Portfolio’s subadviser or to merge the Portfolio into another Portfolio with a similar investment objective and better investment performance).
The Directors also considered the investment performance of the Advisers and their reputations generally, the historical responsiveness of the Advisers to Director concerns about performance and the willingness of the Advisers to take steps intended to improve performance.
After reviewing these and related factors, the Directors concluded, within the context of their overall conclusions regarding each of the Continued Agreements, that the investment performance of each relevant Portfolio and Adviser was sufficient, in light of other considerations, to warrant the renewal of the Continued Agreements.
The costs of the services to be provided and profits to be realized by the Advisers and their affiliates from their relationships with the Portfolios. The Directors considered the fees charged by MetLife Advisers to the Portfolios for advisory services and, with respect to the subadvised Portfolios, by such subadvisers to MetLife Advisers for subadvisory services (such advisory and subadvisory fees (if any), collectively, “Fees”), as well as the total expense levels of the Portfolios. This information included comparisons (provided by an independent third party) of the Portfolios’ advisory fees and total expense levels to those of their peer groups. In evaluating Fees for the relevant Portfolios, the Directors also took into account the demands, complexity and quality of the investment management services provided to each Portfolio. The Directors considered MetLife Advisers’ recommendations regarding reductions in Fee rates, implementation of Fee breakpoints and institution of Fee waivers and expense caps.
The Directors also considered the compensation directly or indirectly received by the Advisers and their affiliates from their relationships with the relevant Portfolios. The Directors reviewed information relating to the profits received by MetLife Advisers, certain of the subadvisers and their affiliates as a result of their relationships with the relevant Portfolios, and information about the allocation of expenses used to calculate profitability. When reviewing profitability, the Directors also considered the performance of the relevant Portfolios, the expense levels of such Portfolios and whether the relevant Advisers had implemented breakpoints, fee waivers and/or expense caps with respect to such Portfolios.
After reviewing these and related factors, the Directors concluded, within the context of their overall conclusions regarding each of the Continued Agreements, that the Fees charged to each of the relevant Portfolios were fair and reasonable, and that the information provided regarding costs of these services generally, and the related profitability (if known) to the relevant Advisers of their relationships with the relevant Portfolios, supported the renewal of the Continued Agreements.
Economies of Scale. The Directors considered the existence of any economies of scale in the provision of services by the Advisers and whether those economies were shared with the relevant Portfolios through breakpoints in their advisory fees or other means, such as expense caps, fee waivers or relatively low levels of fees. The Directors noted that most of the relevant Portfolios benefited or will benefit from breakpoints, expense caps and/or fee waivers with respect to their advisory fees. In considering these issues, the Directors also took into consideration information relating to the costs of the services provided and the profitability to MetLife Advisers, the relevant subadvisers (if any) and each of their affiliates of their relationships with the relevant Portfolios, as discussed above.
MSF-22
Metropolitan Series Fund, Inc.
BlackRock Large Cap Value Portfolio
Board Approval of Advisory and Subadvisory Agreements—(Continued)
After reviewing these and related factors, the Directors concluded, within the context of their overall conclusions regarding each of the Continued Agreements, that the extent to which economies of scale were shared with the relevant Portfolios supported the renewal of such Agreements.
Other Factors. The Directors also considered other factors, which included but were not limited to the following:
| | • | | the extent to which each relevant Portfolio operated in accordance with its investment objective, and its record of compliance with its investment restrictions and the compliance programs of the Fund and the Advisers. They also considered the compliance-related resources the Advisers and their affiliates provide to the relevant Portfolios; |
| | • | | the nature, quality, cost and extent of administrative and shareholder services performed by MetLife Advisers and its affiliates under the Advisory Agreements; and |
| | • | | so-called “fall-out benefits” to the Advisers, such as the engagement of their affiliates to provide distribution, brokerage and transfer agency services to the Portfolios, and the benefits of research made available to the relevant Advisers by reason of brokerage commissions generated by the relevant Portfolios’ securities transactions. The Directors also considered the possible conflicts of interest associated with these fall-out and other benefits, and the reporting and other processes in place to disclose and monitor these possible conflicts of interest. |
Based on their evaluation of all factors that they deemed to be material, including those factors described above, and assisted by the advice of independent counsel, the Directors, including the Independent Directors, concluded that each of the Continued Agreements should be continued through December 31, 2009.
MSF-23
A description of the policies and procedures that the Fund uses to determine how to vote proxies relating to portfolio securities is available (i) without charge, upon request, by calling (800) 638-7732 and (ii) on the Securities and Exchange Commission’s (the “SEC”) website at http://www.sec.gov.
Information regarding how the Fund voted proxies relating to portfolio securities during the most recent twelve-month period ended December 31, 2008 is available (i) without charge, upon request, by calling (800) 638-7732 and (ii) on the SEC’s website at http://www.sec.gov.
The Fund’s Statement of Additional Information includes additional information about the Directors of the Fund and is available (i) without charge, upon request, by calling (800) 638-7732 and (ii) on the SEC’s website at http://www.sec.gov.
The Fund files with the SEC a complete schedule of its portfolio holdings, as of the close of the first and third quarters of its fiscal year, on “Form N-Q”. These filings are available on the SEC’s website at www.sec.gov and may be reviewed and copied at the SEC’s Public Reference Room in Washington, DC. (Call 1-800-SEC-0330 for information on the operation of the Public Reference Room.)
MSF-24
Simplify your life…
with MetLife eDelivery® while helping MetLife preserve the planet’s natural resources.
(see details on inside cover)
| | |
Metropolitan Series Fund, Inc. BlackRock Legacy Large Cap Growth Portfolio Annual Report | | December 31, 2008 |
NOT PART OF THE ANNUAL REPORT
Letter from the President
February 1, 2009
Letter to Policy Holders:
2008 was an extraordinary year in the capital markets around the world and for the global economy. Energy prices rose to record levels early in the year before falling by two-thirds by year-end. A credit crisis that began with concerns about sub-prime mortgages led to massive changes in the financial landscape with government takeovers, forced sales, and outright failures of a number of large, once venerable firms.
While bonds as measured by the Barclays Capital U.S. Aggregate Bond Index (formerly known as, Lehman Brothers U.S. Aggregate Bond Index) were up 5.2% for the year in response to declining interest rates, there were large differences in the total returns of the various sectors of the bond market. U.S. treasury securities were up over 13% as frightened investors sought refuge in what they perceived to be the safest and most liquid investments. In contrast, investment grade corporate securities lost nearly 5% as credit spreads widened and below investment grade or high yield bonds fell over 26%.
In response to the growing credit crisis and the weakening economy, common stocks fell sharply across all regions, styles, and capitalizations. As measured by the Standard and Poor’s 500, U.S. common stocks fell 37% for the year, the worst calendar year decline since the 1930s. Foreign stocks were down even more with the MSCI EAFE Index down 43% for the year.
On the following pages, you will find a complete review of your Portfolio and its investment performance.
MetLife is committed to building your financial freedom. We appreciate your trust and will continue to focus our efforts on meeting your investment needs.
Sincerely,
Elizabeth M. Forget
President, Metropolitan Series Fund, Inc.
Metropolitan Series Fund, Inc.
BlackRock Legacy Large Cap Growth Portfolio
Managed by BlackRock Advisors, LLC
Portfolio Manager Commentary*
PORTFOLIO PERFORMANCE
For the twelve-month period ended December 31, 2008, the Class A shares of the BlackRock Legacy Large Cap Growth Portfolio returned -36.5%, compared to its benchmark, the Russell 1000 Growth Index1, which returned -38.4%. The average return of its peer group, the Lipper Variable Insurance Products2 Large-Cap Growth Funds Universe, was -41.7% over the same period.
PORTFOLIO REVIEW
The U.S. equity market trended lower through the first half of 2008, as weakness in housing and the mortgage market, fear of recession, and sharply rising energy and commodity costs dominated investor attention. The credit market troubles which had begun in 2007 with subprime mortgages rapidly spread in September 2008 with a number of large and previously distinguished financial institutions either failing, being rescued by the federal government or selling themselves as a last resort. Volatility rose to extreme levels as continued government intervention and economic stimuli grappled with massive deleveraging and a flight to safety. The uncertainty of the credit crisis, combined with the lack of lending activity, resulted in a sharp downturn in economic activity during the fall, guaranteeing a second consecutive decline in quarterly GDP. Investors in stocks found no safe haven, as sharp declines impacted all sectors, market capitalizations and styles. All sectors within the benchmark Russell 1000 Growth Index experienced double-digit declines as the index dropped -38.4% in 2008. The Portfolio declined in this hostile investing environment, but outperformed the Russell 1000 Growth Index. Our sector positioning added significant value, as did stock selection in the healthcare and consumer discretionary sectors.
Sector allocation turned out to be critical in 2008 given the wide dispersion among sector returns. The Portfolio’s emphasis on the more defensive healthcare and consumer staples sectors aided relative returns, as these sectors delivered the strongest performance among all sectors within the benchmark. In healthcare, stock selection among both opportunistic and stable growth holdings contributed to relative outperformance. On the opportunistic side, Gilead Sciences Inc. and Celgene Corp. both delivered positive returns, despite the double-digit decline for the healthcare sector. Johnson & Johnson and Abbott Laboratories, large diversified pharmaceuticals companies, also protected the Portfolio and added value in 2008. The Portfolio’s top consumer staples holding, Wal-Mart, rose 20%, and was one of only two stocks in the Dow Jones Industrial Average to post a gain for the year. Stock selection in the consumer discretionary sector also contributed meaningfully to the Portfolio’s outperformance. As an example, Apollo Group, the operator of the University of Phoenix, surged higher during the second half of the year as rising unemployment resulted in significant enrollment growth in the company’s degree programs. While consumers generally cut back on spending and became more price-sensitive, some companies were able to take advantage of this dynamic and outperform their peers, including Burger King, Kohl’s and Ross Stores. Finally, the Portfolio’s modest underweight in the energy sector benefited performance in the second half of the year.
During the period, positive relative results overshadowed negative performance factors, which included stock selection in the information technology sector. Investments in the software industry detracted in 2008, with higher growth holdings (Adobe Systems, salesforce.com) selling off on investor fears about the scope of the global recession. Stock selection in the industrials sector also detracted from relative return comparisons. This sector was particularly impacted by the onset of a global recession during the second half of 2008. Positions in both Cummins and Foster Wheeler negatively impacted the Portfolio.
While the turn-of-the-calendar has brought renewed optimism to the market, we remain mindful of the many existing and potential landmines in our investment universe. As volatility moderates and investors look to selectively re-deploy cash into stocks after the indiscriminate selling in 2008, we believe fundamental analysis of individual stocks will be critical in the coming year. Our process continues to be built on bottom-up fundamental research, and our Portfolio positioning reflects the outgrowth of those individual decisions. Recently, we have been adding to the Portfolio’s opportunistic holdings as we are finding greater performance potential from select domestically-oriented cyclicals. Many of these stocks were punished in 2007 and 2008, but we believe they have potential to show upside earnings surprise in coming quarters. At year-end, the most meaningful overweights were in the healthcare and telecommunication services sectors, while the most substantial underweights were in the information technology and industrials sectors.
* The views expressed above are those of the subadvisory firm as of December 31, 2008 and are subject to change based on market and other conditions. Information about the Portfolio’s holdings, asset allocation, industry allocation, or country diversification is historical and is not an indication of future Portfolio composition, which will vary. The performance of any index mentioned in this commentary has not been adjusted for ongoing management, distribution and operating expenses, and sales charges applicable to mutual fund investments. Direct investment in any index is not possible.
1 The Russell 1000® Growth Index is an unmanaged measure of performance of the largest capitalized U.S. companies, within the Russell 1000 companies, that have higher price-to-book ratios and forecasted growth values.
2 The Lipper Variable Products Fund Average is an average of the total return performance (calculated on the basis of net asset value) of variable product funds with similar investment objectives to those of the subject Portfolio as calculated by Lipper Analytical Services, an independent mutual fund ranking service.
MSF-2
Metropolitan Series Fund, Inc.
BlackRock Legacy Large Cap Growth Portfolio
A $10,000 INVESTMENT COMPARED TO THE RUSSELL 1000 GROWTH INDEX
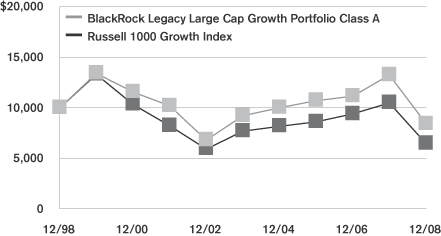
Average Annual Returns as of December 31, 2008
| | | | | | | | | | | | |
| | | BlackRock Legacy Large Cap Growth Portfolio | | | Russell 1000
Growth Index | |
| | | Class A | | | Class B | | | Class E | | |
| 1 Year | | -36.5 | % | | -36.7 | % | | -36.6 | % | | -38.4 | % |
| 5 Year | | -1.8 | | | -2.0 | | | -1.9 | | | -3.4 | |
| 10 Year | | -1.7 | | | — | | | — | | | -4.3 | |
| Since Inception | | — | | | 2.0 | | | -4.2 | | | — | |
Performance numbers are net of all Portfolio expenses but do not include any insurance, sales, or administrative charges of variable annuity or life insurance contracts or any additional expenses that participants in certain eligible qualified plans may bear relating to the operations of their plans. If these charges were included, the returns would be lower.
Inception dates of the Class A, Class B and Class E shares are: 10/31/94, 7/30/02, 5/1/01, respectively.
This information represents past performance and is not indicative of future results. Investment return and principal value may fluctuate so that shares, upon redemption, may be worth more or less than the original cost.
PORTFOLIO COMPOSITION
as of December 31, 2008
Top Holdings
| | |
| | | % of Total
Net Assets |
Wal-Mart Stores, Inc. | | 4.8% |
QUALCOMM, Inc. | | 3.8% |
Cisco Systems, Inc. | | 3.5% |
Abbott Laboratories | | 2.9% |
Danaher Corp. | | 2.9% |
Philip Morris International, Inc. | | 2.9% |
The Coca-Cola Co. | | 2.7% |
Google, Inc. (Class A) | | 2.6% |
Microsoft Corp. | | 2.5% |
American Tower Corp. (Class A) | | 2.2% |
Top Sectors
| | |
| | | % of Total
Market Value |
Information Technology | | 25.1% |
Health Care | | 19.7% |
Consumer Staples | | 15.3% |
Industrials | | 11.4% |
Consumer Discretionary | | 10.0% |
Energy | | 6.7% |
Financials | | 3.9% |
Materials | | 3.1% |
Telecommunication Services | | 2.8% |
Utilities | | 1.5% |
MSF-3
Metropolitan Series Fund, Inc.
Shareholder Expense Example
As a shareholder of the Portfolio, you incur ongoing costs, including management fees; distribution and service (12b-1) fees; and other Portfolio expenses. This example is intended to help you understand your ongoing costs (in dollars) (referred to as “expenses”) of investing in the Portfolio and compare these costs with the ongoing costs of investing in other mutual funds. The example is based on an investment of $1,000 invested at the beginning of the period and held for the entire period, July 1, 2008 through December 31, 2008.
Actual Expenses
The first line for each share class of the Portfolio in the table below provides information about actual account values and actual expenses. You may use the information in this line, together with the amount you invested in the particular share class of the Portfolio, to estimate the expenses that you paid over the period. Simply divide your account value by $1,000 (for example, an $8,600 account value divided by $1,000=8.6), then multiply the result by the number in the first line under the heading entitled “Expenses Paid During Period” to estimate the expenses you paid on your account during this period.
Hypothetical Example for Comparison Purposes
The second line for each share class of the Portfolio in the table below provides information about hypothetical account values and hypothetical expenses based on the Portfolio’s actual expense ratio and an assumed rate of return of 5% per year before expenses, which is not the Portfolio’s actual return. The hypothetical account values and expenses may not be used to estimate the actual ending account balance or expenses you paid for the period. You may use this information to compare the ongoing costs of investing in the Portfolio and other funds. To do so, compare this 5% hypothetical example with the 5% hypothetical examples that appear in the shareholder reports of the other funds.
Please note that the expenses shown in the table are meant to highlight your ongoing costs only and do not reflect any fees or charges of your variable insurance product or any additional expenses that participants in certain eligible qualified plans may bear relating to the operations of their plan. Therefore, the second line for each share class in the table is useful in comparing ongoing costs only, and will not help you determine the relative total costs of owning different funds. In addition, if these other costs were included, your costs would have been higher.
| | | | | | | | | | | | | | |
Portfolio | | | | Annualized
Expense
Ratio | | | Beginning
Account Value
July 1,
2008 | | Ending
Account Value
December 31,
2008 | | Expenses Paid
During Period*
July 1, 2008
to
December 31,
2008 |
BlackRock Legacy Large Cap Growth—Class A | | Actual | | 0.77 | % | | $ | 1,000.00 | | $ | 667.32 | | $ | 3.23 |
| | Hypothetical | | 0.77 | % | | $ | 1,000.00 | | $ | 1,021.22 | | $ | 3.91 |
| | | | | |
BlackRock Legacy Large Cap Growth—Class B | | Actual | | 1.02 | % | | $ | 1,000.00 | | $ | 666.27 | | $ | 4.27 |
| | Hypothetical | | 1.02 | % | | $ | 1,000.00 | | $ | 1,019.95 | | $ | 5.18 |
| | | | | |
BlackRock Legacy Large Cap Growth—Class E | | Actual | | 0.92 | % | | $ | 1,000.00 | | $ | 666.53 | | $ | 3.85 |
| | Hypothetical | | 0.92 | % | | $ | 1,000.00 | | $ | 1,020.46 | | $ | 4.67 |
* Expenses paid are equal to the Portfolio’s annualized expense ratio for the most recent six month period, as shown above, multiplied by the average account value over the period, multiplied by the number of days in the most recent fiscal half-year, divided by 366 (to reflect the the one-half year period).
MSF-4
Metropolitan Series Fund, Inc.
BlackRock Legacy Large Cap Growth Portfolio
Schedule of Investments as of December 31, 2008
Common Stock—99.4% of Total Net Assets
| | | | | |
| Security Description | | Shares | | Value* |
| | | | | |
| | | | | |
|
Aerospace & Defense—2.7% |
Honeywell International, Inc. | | 149,723 | | $ | 4,915,406 |
Northrop Grumman Corp. | | 73,400 | | | 3,305,936 |
| | | | | |
| | | | | 8,221,342 |
| | | | | |
|
Air Freight & Logistics—1.8% |
Expeditors International of Washington, Inc. | | 113,785 | | | 3,785,627 |
United Parcel Service, Inc. (Class B) | | 28,100 | | | 1,549,996 |
| | | | | |
| | | | | 5,335,623 |
| | | | | |
|
Airlines—1.1% |
Delta Air Lines, Inc. (a) | | 290,800 | | | 3,332,568 |
| | | | | |
|
Beverages—3.8% |
PepsiCo, Inc. | | 61,100 | | | 3,346,447 |
The Coca-Cola Co. | | 180,797 | | | 8,184,680 |
| | | | | |
| | | | | 11,531,127 |
| | | | | |
|
Biotechnology—5.5% |
Celgene Corp. (a) | | 107,100 | | | 5,920,488 |
Genzyme Corp. (a) | | 74,800 | | | 4,964,476 |
Gilead Sciences, Inc. (a) (b) | | 114,600 | | | 5,860,644 |
| | | | | |
| | | | | 16,745,608 |
| | | | | |
|
Capital Markets—0.4% |
Janus Capital Group, Inc. (b) | | 154,402 | | | 1,239,848 |
| | | | | |
|
Chemicals—0.8% |
Ecolab, Inc. | | 69,200 | | | 2,432,380 |
| | | | | |
|
Commercial & Professional Services—1.1% |
Waste Management, Inc. | | 98,800 | | | 3,274,232 |
| | | | | |
|
Commercial Banks—1.0% |
Wells Fargo & Co. | | 103,200 | | | 3,042,336 |
| | | | | |
|
Communications Equipment—7.3% |
Cisco Systems, Inc. (a) | | 657,337 | | | 10,714,593 |
QUALCOMM, Inc. | | 318,148 | | | 11,399,243 |
| | | | | |
| | | | | 22,113,836 |
| | | | | |
|
Computers & Peripherals—3.9% |
Apple, Inc. (a) | | 72,717 | | | 6,206,396 |
Hewlett-Packard Co. | | 153,100 | | | 5,555,999 |
| | | | | |
| | | | | 11,762,395 |
| | | | | |
|
Construction & Engineering—0.9% |
Fluor Corp. (b) | | 60,800 | | | 2,728,096 |
| | | | | |
|
Diversified Consumer Services—2.0% |
Apollo Group, Inc. (Class A) (a) | | 80,700 | | | 6,183,234 |
| | | | | |
|
Diversified Financial Services—1.3% |
CME Group, Inc. | | 5,800 | | | 1,207,038 |
JPMorgan Chase & Co. | | 91,000 | | | 2,869,230 |
| | | | | |
| | | | | 4,076,268 |
| | | | | |
| | | | | |
| Security Description | | Shares | | Value* |
| | | | | |
|
Diversified Telecommunication Services—0.6% |
AT&T, Inc. | | 63,872 | | $ | 1,820,352 |
| | | | | |
|
Electric Utilities—1.5% |
Exelon Corp. | | 83,795 | | | 4,659,840 |
| | | | | |
|
Energy Equipment & Services—1.7% |
Schlumberger, Ltd. | | 98,493 | | | 4,169,209 |
Transocean, Ltd. | | 22,263 | | | 1,051,927 |
| | | | | |
| | | | | 5,221,136 |
| | | | | |
|
Food & Staples Retailing—7.4% |
CVS Caremark Corp. | | 119,000 | | | 3,420,060 |
Safeway, Inc. | | 100,500 | | | 2,388,885 |
The Kroger Co. (b) | | 78,700 | | | 2,078,467 |
Wal-Mart Stores, Inc. | | 259,256 | | | 14,533,891 |
| | | | | |
| | | | | 22,421,303 |
| | | | | |
|
Health Care Equipment & Supplies—2.2% |
C.R. Bard, Inc. | | 25,100 | | | 2,114,926 |
Medtronic, Inc. | | 141,000 | | | 4,430,220 |
| | | | | |
| | | | | 6,545,146 |
| | | | | |
|
Health Care Providers & Services—3.9% |
Henry Schein, Inc. (a) | | 64,100 | | | 2,351,829 |
Medco Health Solutions, Inc. (a) | | 125,940 | | | 5,278,145 |
UnitedHealth Group, Inc. | | 162,600 | | | 4,325,160 |
| | | | | |
| | | | | 11,955,134 |
| | | | | |
|
Hotels, Restaurants & Leisure—2.8% |
Burger King Holdings, Inc. | | 147,200 | | | 3,515,136 |
McDonald’s Corp. | | 78,100 | | | 4,857,039 |
| | | | | |
| | | | | 8,372,175 |
| | | | | |
|
Household Durables—0.5% |
D.R. Horton, Inc. (b) | | 196,200 | | | 1,387,134 |
| | | | | |
|
Household Products—1.2% |
Clorox Co. | | 39,800 | | | 2,211,288 |
Procter & Gamble Co. (b) | | 24,300 | | | 1,502,226 |
| | | | | |
| | | | | 3,713,514 |
| | | | | |
|
Insurance—1.2% |
The Travelers Cos., Inc. | | 77,900 | | | 3,521,080 |
| | | | | |
|
Internet & Catalog Retail—1.1% |
Amazon.com, Inc. (a) (b) | | 67,600 | | | 3,466,528 |
| | | | | |
|
Internet Software & Services—2.6% |
Google, Inc. (Class A) (a) | | 25,855 | | | 7,954,291 |
| | | | | |
|
Life Sciences Tools & Services—1.1% |
Thermo Fisher Scientific, Inc. (a) (b) | | 96,700 | | | 3,294,569 |
| | | | | |
*See accompanying notes to financial statements.
MSF-5
Metropolitan Series Fund, Inc.
BlackRock Legacy Large Cap Growth Portfolio
Schedule of Investments as of December 31, 2008
Common Stock—(Continued)
| | | | | |
| Security Description | |
Shares | | Value* |
| | | | | |
|
Machinery—3.9% |
Cummins, Inc. | | 115,000 | | $ | 3,073,950 |
Danaher Corp. (b) | | 153,300 | | | 8,678,313 |
| | | | | |
| | | | | 11,752,263 |
| | | | | |
|
Metals & Mining—2.3% |
Agnico-Eagle Mines, Ltd. | | 100,200 | | | 5,143,266 |
Freeport-McMoRan Copper & Gold, Inc. (a) | | 75,625 | | | 1,848,275 |
| | | | | |
| | | | | 6,991,541 |
| | | | | |
|
Multiline Retail—1.9% |
Kohl’s Corp. (a) (b) | | 163,022 | | | 5,901,396 |
| | | | | |
|
Oil, Gas & Consumable Fuels—4.9% |
EOG Resources, Inc. | | 95,450 | | | 6,355,061 |
Exxon Mobil Corp. | | 68,700 | | | 5,484,321 |
Massey Energy Co. | | 124,842 | | | 1,721,571 |
Valero Energy Corp. | | 67,800 | | | 1,467,192 |
| | | | | |
| | | | | 15,028,145 |
| | | | | |
|
Pharmaceuticals—7.0% |
Abbott Laboratories | | 166,400 | | | 8,880,768 |
Bristol-Myers Squibb Co. | | 207,000 | | | 4,812,750 |
Johnson & Johnson | | 87,900 | | | 5,259,057 |
Teva Pharmaceutical Industries, Ltd. (ADR) (b) | | 52,000 | | | 2,213,640 |
| | | | | |
| | | | | 21,166,215 |
| | | | | |
|
Semiconductors & Semiconductor Equipment—3.0% |
Broadcom Corp. (a) | | 196,500 | | | 3,334,605 |
Lam Research Corp. (a) (b) | | 76,706 | | | 1,632,304 |
PMC-Sierra, Inc. (a) (b) | | 836,984 | | | 4,067,742 |
| | | | | |
| | | | | 9,034,651 |
| | | | | |
|
Software—8.3% |
Activision Blizzard, Inc. (a) | | 481,500 | | | 4,160,160 |
Adobe Systems, Inc. (a) | | 129,887 | | | 2,765,294 |
Check Point Software Technologies, Ltd. (a) | | 208,000 | | | 3,949,920 |
Microsoft Corp. | | 389,100 | | | 7,564,104 |
Oracle Corp. (a) (b) | | 212,600 | | | 3,769,398 |
Salesforce.com, Inc. (a) (b) | | 89,938 | | | 2,878,916 |
| | | | | |
| | | | | 25,087,792 |
| | | | | |
|
Specialty Retail—1.7% |
Home Depot, Inc. | | 59,900 | | | 1,378,898 |
Ross Stores, Inc. (b) | | 123,261 | | | 3,664,550 |
| | | | | |
| | | | | 5,043,448 |
| | | | | |
|
Tobacco—2.8% |
Philip Morris International, Inc. | | 198,769 | | | 8,648,439 |
| | | | | |
|
Wireless Telecommunication Services—2.2% |
American Tower Corp. (Class A) (a) | | 224,798 | | | 6,591,077 |
| | | | | |
Total Common Stock
(Identified Cost $380,997,515) | | | | | 301,596,062 |
| | | | | |
| | | | | | | |
| | |
| Short Term Investments—6.7% | | | | | | | |
| Security Description | | Shares/Face
Amount | | Value* | |
| | |
Mutual Funds – 6.0% | | | | | | | |
State Street Navigator Securities Lending Prime Portfolio (c) | | | 18,095,026 | | $ | 18,095,026 | |
| | | | | | | |
| | |
Repurchase Agreement—0.7% | | | | | | | |
State Street Corp. Repurchase Agreement dated 12/31/08 at 0.010% to be repurchased at $2,248,001 on 01/02/09, collateralized by $2,270,000 Federal Home Loan Bank 2.730% due 06/10/09 with a value of $2,295,651. | | $ | 2,248,000 | | | 2,248,000 | |
| | | | | | | |
Total Short Term Investments
(Identified Cost $20,343,026) | | | | | | 20,343,026 | |
| | | | | | | |
Total Investments—106.1%
(Identified Cost $401,340,541) (d) | | | | | | 321,939,088 | |
Liabilities in excess of other assets | | | | | | (18,478,129 | ) |
| | | | | | | |
| Total Net Assets—100% | | | | | $ | 303,460,959 | |
| | | | | | | |
| (b) | A portion or all of the security was on loan. As of December 31, 2008, the market value of securities loaned was $17,855,738 and the collateral received consisted of cash in the amount of $18,095,026. The cash collateral is invested in a money market fund managed by an affiliate of the custodian. |
| (c) | Represents investment of cash collateral received from securities lending transactions. |
| (d) | The aggregate cost of investments for federal income tax purposes as of December 31, 2008 was $403,720,605 and the composition of unrealized appreciation and depreciation of investment securities was $9,836,769 and $(91,618,286), respectively. |
| (ADR)— | An American Depositary Receipt is a certificate issued by a custodian bank representing the right to receive securities of the foreign issuer described. Trading on exchanges not located in the United States or Canada significantly influences the value of ADRs. |
*See accompanying notes to financial statements.
MSF-6
Metropolitan Series Fund, Inc.
BlackRock Legacy Large Cap Growth Portfolio
The Portfolio adopted the provisions of Statement of Financial Accounting Standards No. 157, “Fair Value Measurements” (FAS 157), effective with the beginning of the Portfolio’s fiscal year. FAS 157 establishes a framework for measuring fair value and expands disclosures about fair value measurements in financial statements. The three levels of the hierarchy under FAS 157 are described below:
Level 1 - quoted prices in active markets for identical securities
Level 2 - other significant observable inputs (including quoted prices for similar securities, interest rates, credit risk, etc.)
Level 3 - significant unobservable inputs (including the Portfolio’s own assumptions in determining the fair value of investments)
The inputs or methodology used for valuing securities are not necessarily an indication of the risk associated with investing in those securities.
The following is a summary of the inputs used to value the Portfolio’s net assets as of December 31, 2008:
| | | | | | |
| Valuation Inputs | | Investments In
Securities | | Other Financial
Instruments* |
Level 1 - Quoted Prices | | $ | 319,691,088 | | $ | 0 |
Level 2 - Other Significant Observable Inputs | | | 2,248,000 | | | 0 |
Level 3 - Significant Unobservable Inputs | | | 0 | | | 0 |
Total | | $ | 321,939,088 | | $ | 0 |
* Other financial instruments are derivative instruments not reflected in the Schedule of Investments, such as futures, forwards, swap contracts and written options, which are valued based on the unrealized appreciation/depreciation on the instrument.
MSF-7
Metropolitan Series Fund, Inc.
BlackRock Legacy Large Cap Growth Portfolio
Statement of Assets & Liabilities
December 31, 2008
| | | | | | | |
Assets | | | | | | | |
Investments at value (a) (b) | | | | | $ | 321,939,088 | |
Cash | | | | | | 896 | |
Receivable for: | | | | | | | |
Fund shares sold | | | | | | 563,574 | |
Accrued interest and dividends | | | | | | 415,126 | |
Foreign taxes | | | | | | 13,331 | |
| | | | | | | |
Total Assets | | | | | | 322,932,015 | |
Liabilities | | | | | | | |
Payable for: | | | | | | | |
Securities purchased | | $ | 1,005,167 | | | | |
Fund shares redeemed | | | 124,265 | | | | |
Collateral for securities loaned | | | 18,095,026 | | | | |
Accrued expenses: | | | | | | | |
Management fees | | | 181,095 | | | | |
Service and distribution fees | | | 16,426 | | | | |
Deferred directors’ fees | | | 14,793 | | | | |
Other expenses | | | 34,284 | | | | |
| | | | | | | |
Total Liabilities | | | | | | 19,471,056 | |
| | | | | | | |
Net Assets | | | | | $ | 303,460,959 | |
| | | | | | | |
Net assets consists of: | | | | | | | |
Capital paid in | | | | | $ | 523,975,430 | |
Undistributed net investment income | | | | | | 1,413,094 | |
Accumulated net realized losses | | | | | | (142,526,112 | ) |
Unrealized depreciation on investments | | | | | | (79,401,453 | ) |
| | | | | | | |
Net Assets | | | | | $ | 303,460,959 | |
| | | | | | | |
| Computation of offering price: | | | | | | | |
Class A | | | | | | | |
Net asset value and redemption price per share ($209,248,010 divided by 12,375,701 shares outstanding) | | | | | $ | 16.91 | |
| | | | | | | |
Class B | | | | | | | |
Net asset value and redemption price per share ($63,611,194 divided by 3,829,265 shares outstanding) | | | | | $ | 16.61 | |
| | | | | | | |
Class E | | | | | | | |
Net asset value and redemption price per share ($30,601,755 divided by 1,826,571 shares outstanding) | | | | | $ | 16.75 | |
| | | | | | | |
(a) Identified cost of investments | | | | | $ | 401,340,541 | |
| | | | | | | |
(b) Includes cash collateral for securities loaned of | | | | | $ | 18,095,026 | |
| | | | | | | |
Statement of Operations
For the Year Ended December 31, 2008
| | | | | | | | |
Investment Income | | | | | | | | |
Dividends | | | | | | $ | 4,865,087 | (a) |
Interest | | | | | | | 306,439 | (b) |
| | | | | | | | |
| | | | | | | 5,171,526 | |
Expenses | | | | | | | | |
Management fees | | $ | 3,111,699 | | | | | |
Service and distribution fees—Class B | | | 184,206 | | | | | |
Service and distribution fees—Class E | | | 63,754 | | | | | |
Directors’ fees and expenses | | | 23,400 | | | | | |
Custodian | | | 50,653 | | | | | |
Audit and tax services | | | 36,941 | | | | | |
Legal | | | 7,266 | | | | | |
Printing | | | 94,502 | | | | | |
Insurance | | | 5,800 | | | | | |
Miscellaneous | | | 12,497 | | | | | |
| | | | | | | | |
Total expenses | | | 3,590,718 | | | | | |
Expense reductions | | | (84,479 | ) | | | 3,506,239 | |
| | | | | | | | |
Net Investment Income | | | | | | | 1,665,287 | |
| | | | | | | | |
Realized and Unrealized Loss | | | | | | | | |
| Realized loss on: | | | | | | | | |
Investments—net | | | | | | | (30,795,454 | ) |
| Change in unrealized depreciation on: | | | | | | | | |
Investments—net | | | | | | | (150,534,733 | ) |
| | | | | | | | |
Net loss | | | | | | | (181,330,187 | ) |
| | | | | | | | |
Net Decrease in Net Assets From Operations | | | | | | $ | (179,664,900 | ) |
| | | | | | | | |
| (a) | Net of foreign taxes of $773. |
| (b) | Includes income on securities loaned of $218,883. |
See accompanying notes to financial statements.
MSF-8
Metropolitan Series Fund, Inc.
BlackRock Legacy Large Cap Growth Portfolio
Statements of Changes in Net Assets
| | | | | | | | |
| | | Year ended
December 31,
2008 | | | Year ended
December 31,
2007 | |
From Operations | | | | | | | | |
Net investment income | | $ | 1,665,287 | | | $ | 1,631,916 | |
Net realized gain (loss) | | | (30,795,454 | ) | | | 67,216,679 | |
Change in unrealized appreciation (depreciation) | | | (150,534,733 | ) | | | 14,975,300 | |
| | | | | | | | |
Increase (decrease) in net assets from operations | | | (179,664,900 | ) | | | 83,823,895 | |
| | | | | | | | |
From Distributions to Shareholders | | | | | | | | |
Net investment income | | | | | | | | |
Class A | | | (1,410,497 | ) | | | (800,699 | ) |
Class B | | | (137,200 | ) | | | 0 | |
Class E | | | (124,635 | ) | | | (29,877 | ) |
| | | | | | | | |
Total distributions | | | (1,672,332 | ) | | | (830,576 | ) |
| | | | | | | | |
Decrease in net assets from capital share transactions | | | (27,774,462 | ) | | | (58,806,350 | ) |
| | | | | | | | |
Net increase (decrease) in net assets | | | (209,111,694 | ) | | | 24,186,969 | |
| | |
Net Assets | | | | | | | | |
Beginning of the period | | | 512,572,653 | | | | 488,385,684 | |
| | | | | | | | |
End of the period | | $ | 303,460,959 | | | $ | 512,572,653 | |
| | | | | | | | |
Undistributed Net Investment Income | | | | | | | | |
End of the period | | $ | 1,413,094 | | | $ | 1,490,946 | |
| | | | | | | | |
Other Information:
Capital Shares
Transactions in capital shares were as follows:
| | | | | | | | | | | | | | |
| | | Year ended
December 31, 2008 | | | Year ended
December 31, 2007 | |
| | | Shares | | | $ | | | Shares | | | $ | |
Class A | | | | | | | | | | | | | | |
Sales | | 2,035,366 | | | $ | 41,704,042 | | �� | 2,849,706 | | | $ | 69,031,420 | |
Reinvestments | | 55,379 | | | | 1,410,497 | | | 33,685 | | | | 800,699 | |
Redemptions | | (4,324,378 | ) | | | (93,538,671 | ) | | (6,056,174 | ) | | | (147,825,954 | ) |
| | | | | | | | | | | | | | |
Net decrease | | (2,233,633 | ) | | $ | (50,424,132 | ) | | (3,172,783 | ) | | $ | (77,993,835 | ) |
| | | | | | | | | | | | | | |
Class B | | | | | | | | | | | | | | |
Sales | | 1,944,385 | | | $ | 43,351,360 | | | 1,506,472 | | | $ | 37,679,464 | |
Reinvestments | | 5,475 | | | | 137,200 | | | 0 | | | | 0 | |
Redemptions | | (854,396 | ) | | | (19,492,204 | ) | | (725,368 | ) | | | (17,341,934 | ) |
| | | | | | | | | | | | | | |
Net increase | | 1,095,464 | | | $ | 23,996,356 | | | 781,104 | | | $ | 20,337,530 | |
| | | | | | | | | | | | | | |
Class E | | | | | | | | | | | | | | |
Sales | | 455,494 | | | $ | 10,449,663 | | | 639,544 | | | $ | 16,008,631 | |
Reinvestments | | 4,934 | | | | 124,635 | | | 1,267 | | | | 29,877 | |
Redemptions | | (522,459 | ) | | | (11,920,984 | ) | | (703,392 | ) | | | (17,188,553 | ) |
| | | | | | | | | | | | | | |
Net decrease | | (62,031 | ) | | $ | (1,346,686 | ) | | (62,581 | ) | | $ | (1,150,045 | ) |
| | | | | | | | | | | | | | |
Decrease derived from capital share transactions | | | | | $ | (27,774,462 | ) | | | | | $ | (58,806,350 | ) |
| | | | | | | | | | | | | | |
See accompanying notes to financial statements.
MSF-9
Metropolitan Series Fund, Inc.
BlackRock Legacy Large Cap Growth Portfolio
Financial Highlights
| | | | | | | | | | | | | | | | | | | |
| | | Class A |
| | | Year ended December 31, |
| | | 2008 | | | 2007 | | | 2006 | | | 2005 | | | 2004 |
Net Asset Value, Beginning of Period | | $ | 26.74 | | | $ | 22.57 | | | $ | 21.70 | | | $ | 20.37 | | | $ | 18.72 |
| | | | | | | | | | | | | | | | | | | |
Income From Investment Operations | | | | | | | | | | | | | | | | | | | |
Net investment income | | | 0.10 | (a) | | | 0.09 | (a) | | | 0.06 | | | | 0.04 | | | | 0.08 |
Net realized and unrealized gain (loss) of investments | | | (9.83 | ) | | | 4.13 | | | | 0.84 | | | | 1.37 | | | | 1.57 |
| | | | | | | | | | | | | | | | | | | |
Total from investment operations | | | (9.73 | ) | | | 4.22 | | | | 0.90 | | | | 1.41 | | | | 1.65 |
| | | | | | | | | | | | | | | | | | | |
Less Distributions | | | | | | | | | | | | | | | | | | | |
Distributions from net investment income | | | (0.10 | ) | | | (0.05 | ) | | | (0.03 | ) | | | (0.08 | ) | | | 0.00 |
| | | | | | | | | | | | | | | | | | | |
Total distributions | | | (0.10 | ) | | | (0.05 | ) | | | (0.03 | ) | | | (0.08 | ) | | | 0.00 |
| | | | | | | | | | | | | | | | | | | |
Net Asset Value, End of Period | | $ | 16.91 | | | $ | 26.74 | | | $ | 22.57 | | | $ | 21.70 | | | $ | 20.37 |
| | | | | | | | | | | | | | | | | | | |
Total Return (%) | | | (36.5 | ) | | | 18.7 | | | | 4.1 | | | | 7.0 | | | | 8.8 |
Ratio of operating expenses to average net assets before expense reductions (%) | | | 0.78 | | | | 0.79 | | | | 0.81 | | | | 0.80 | | | | 0.80 |
Ratio of operating expenses to average net assets after expense reductions (%) (b) | | | 0.76 | | | | 0.76 | | | | 0.76 | | | | 0.76 | | | | 0.76 |
Ratio of net investment income to average net assets (%) | | | 0.44 | | | | 0.37 | | | | 0.24 | | | | 0.15 | | | | 0.39 |
Portfolio turnover rate (%) | | | 74 | | | | 99 | | | | 104 | | | | 76 | | | | 190 |
Net assets, end of period (000) | | $ | 209,248 | | | $ | 390,686 | | | $ | 401,398 | | | $ | 468,532 | | | $ | 510,771 |
| | | | | | | | | | | | | | | | | | |
| | | Class B |
| | | Year ended December 31, |
| | | 2008 | | | 2007 | | | 2006 | | 2005 | | | 2004 |
Net Asset Value, Beginning of Period | | $ | 26.28 | | | $ | 22.19 | | | $ | 21.36 | | $ | 20.04 | | | $ | 18.46 |
| | | | | | | | | | | | | | | | | | |
Income From Investment Operations | | | | | | | | | | | | | | | | | | |
Net investment income (loss) | | | 0.05 | (a) | | | 0.03 | (a) | | | 0.00 | | | (0.03 | ) | | | 0.07 |
Net realized and unrealized gain (loss) of investments | | | (9.68 | ) | | | 4.06 | | | | 0.83 | | | 1.38 | | | | 1.51 |
| | | | | | | | | | | | | | | | | | |
Total from investment operations | | | (9.63 | ) | | | 4.09 | | | | 0.83 | | | 1.35 | | | | 1.58 |
| | | | | | | | | | | | | | | | | | |
Less Distributions | | | | | | | | | | | | | | | | | | |
Distributions from net investment income | | | (0.04 | ) | | | 0.00 | | | | 0.00 | | | (0.03 | ) | | | 0.00 |
| | | | | | | | | | | | | | | | | | |
Total distributions | | | (0.04 | ) | | | 0.00 | | | | 0.00 | | | (0.03 | ) | | | 0.00 |
| | | | | | | | | | | | | | | | | | |
Net Asset Value, End of Period | | $ | 16.61 | | | $ | 26.28 | | | $ | 22.19 | | $ | 21.36 | | | $ | 20.04 |
| | | | | | | | | | | | | | | | | | |
Total Return (%) | | | (36.7 | ) | | | 18.4 | | | | 3.9 | | | 6.8 | | | | 8.6 |
Ratio of operating expenses to average net assets before expense reductions (%) | | | 1.03 | | | | 1.04 | | | | 1.06 | | | 1.05 | | | | 1.05 |
Ratio of operating expenses to average net assets after expense reductions (%) (b) | | | 1.01 | | | | 1.01 | | | | 1.01 | | | 1.01 | | | | 1.01 |
Ratio of net investment income (loss) to average net assets (%) | | | 0.22 | | | | 0.12 | | | | 0.00 | | | (0.10 | ) | | | 0.59 |
Portfolio turnover rate (%) | | | 74 | | | | 99 | | | | 104 | | | 76 | | | | 190 |
Net assets, end of period (000) | | $ | 63,611 | | | $ | 71,838 | | | $ | 43,334 | | $ | 36,798 | | | $ | 28,818 |
| Please | see following page for Financial Highlights footnote legend. |
See accompanying notes to financial statements.
MSF-10
Metropolitan Series Fund, Inc.
BlackRock Legacy Large Cap Growth Portfolio
Financial Highlights
| | | | | | | | | | | | | | | | | | |
| | | Class E |
| | | Year ended December 31, |
| | | 2008 | | | 2007 | | | 2006 | | 2005 | | | 2004 |
Net Asset Value, Beginning of Period | | $ | 26.50 | | | $ | 22.37 | | | $ | 21.51 | | $ | 20.19 | | | $ | 18.59 |
| | | | | | | | | | | | | | | | | | |
Income From Investment Operations | | | | | | | | | | | | | | | | | | |
Net investment income | | | 0.07 | (a) | | | 0.05 | (a) | | | 0.02 | | | 0.00 | | | | 0.06 |
Net realized and unrealized gain (loss) of investments | | | (9.75 | ) | | | 4.10 | | | | 0.84 | | | 1.38 | | | | 1.54 |
| | | | | | | | | | | | | | | | | | |
Total from investment operations | | | (9.68 | ) | | | 4.15 | | | | 0.86 | | | 1.38 | | | | 1.60 |
| | | | | | | | | | | | | | | | | | |
Less Distributions | | | | | | | | | | | | | | | | | | |
Distributions from net investment income | | | (0.07 | ) | | | (0.02 | ) | | | 0.00 | | | (0.06 | ) | | | 0.00 |
| | | | | | | | | | | | | | | | | | |
Total distributions | | | (0.07 | ) | | | (0.02 | ) | | | 0.00 | | | (0.06 | ) | | | 0.00 |
| | | | | | | | | | | | | | | | | | |
Net Asset Value, End of Period | | $ | 16.75 | | | $ | 26.50 | | | $ | 22.37 | | $ | 21.51 | | | $ | 20.19 |
| | | | | | | | | | | | | | | | | | |
Total Return (%) | | | (36.6 | ) | | | 18.5 | | | | 4.0 | | | 6.9 | | | | 8.6 |
Ratio of operating expenses to average net assets before expense reductions (%) | | | 0.93 | | | | 0.94 | | | | 0.96 | | | 0.95 | | | | 0.95 |
Ratio of operating expenses to average net assets after expense reductions (%) (b) | | | 0.91 | | | | 0.91 | | | | 0.91 | | | 0.91 | | | | 0.91 |
Ratio of net investment income to average net assets (%) | | | 0.30 | | | | 0.22 | | | | 0.09 | | | 0.00 | | | | 0.29 |
Portfolio turnover rate (%) | | | 74 | | | | 99 | | | | 104 | | | 76 | | | | 190 |
Net assets, end of period (000) | | $ | 30,602 | | | $ | 50,049 | | | $ | 43,653 | | $ | 45,163 | | | $ | 47,251 |
| (a) | Per share amount is based on average shares outstanding during the period. |
| (b) | The Portfolio has entered into arrangements with certain brokers who paid a portion of the Portfolio’s expenses. |
See accompanying notes to financial statements.
MSF-11
Metropolitan Series Fund, Inc.
BlackRock Legacy Large Cap Growth Portfolio
Notes to Financial Statements—December 31, 2008
Metropolitan Series Fund, Inc. (the “Fund”) is organized as a corporation under the laws of Maryland pursuant to Articles of Incorporation filed on November 23, 1982, as amended, and registered under the Investment Company Act of 1940, as amended (the “1940 Act”), as an open-end investment company. The Fund is a “series” type of mutual fund, which issues separate series of stock. Each series represents an interest in a separate portfolio of Fund investments. The BlackRock Legacy Large Cap Growth Portfolio (the “Portfolio”) is a diversified series of the Fund. Shares in the Fund are not offered directly to the general public and are currently available only to separate accounts established by Metropolitan Life Insurance Company (“MetLife”), New England Life Insurance Company, General American Life Insurance Company (“General American”), The MetLife Investors Group of Insurance Companies, MetLife Insurance Company of Connecticut and other affiliated insurance companies (collectively, the “Insurance Companies”) and to certain eligible qualified retirement plans (“Qualified Plans”), as an investment vehicle for variable life insurance, group annuity or variable annuity products of these insurance companies or Qualified Plans, although the Portfolio is not available to all such separate accounts and Qualified Plans. The Portfolio’s shares may be divided into different classes. Currently, the classes being offered by the Portfolio are named Class A, Class B and Class E. The classes of the Portfolio’s shares are identical, except that certain additional charges (Rule 12b-1 fees) are made against Class B and Class E shares. Investment income, realized and unrealized capital gains and losses, the common expenses of the Portfolio and certain Portfolio-level expense reductions, if any, are allocated daily, on a pro rata basis, to each class based on the relative net assets of each class to the total net assets of the Portfolio.
| 2. | SIGNIFICANT ACCOUNTING POLICIES: |
The preparation of financial statements in conformity with accounting principles generally accepted in the United States of America (“GAAP”) requires management to make estimates and assumptions that affect the reported amounts of assets and liabilities and disclosure of contingent assets and liabilities as of the date of the financial statements and the reported amounts of income and expenses during the reporting period. Actual results could differ from those estimates.
The following is a summary of significant accounting policies consistently followed by the Portfolio in the preparation of its financial statements. The policies are in conformity with GAAP.
Investment Valuation:
Debt securities (other than short term obligations with a remaining maturity of sixty days or less) are generally valued on the basis of evaluated or composite bid quotations obtained by independent pricing services and/or brokers and dealers selected by the relevant subadviser pursuant to authorization of the Board of Directors of the Fund (the “Board” or “Directors”). Such quotations take into account appropriate factors such as institutional-sized trading in similar groups of securities, yield, quality, coupon rate, maturity, type of issue, trading characteristics and other data. Short term obligations with a remaining maturity of sixty days or less are valued at amortized cost which approximates fair market value.
Equity securities traded on a national securities exchange or other exchanges are valued at their last sale price on the principal trading market. Equity securities traded on the NASDAQ National Market System are valued at the NASDAQ Official Closing Price (the “NOCP”). The NOCP is the last reported sale price if the last reported sale price falls between the spread of the last reported bid and asked prices. If the last reported bid and asked prices are above the last reported sale price, the NOCP will be the last reported bid price. If the last reported bid and asked prices are below the last reported sale price, the NOCP will be the last reported asked price. Equity securities traded on a national securities exchange or other exchanges or on the NASDAQ National Market System for which there is no reported sale during the day are valued at the last reported bid price. A security that is listed or traded on more than one exchange is valued at the quotation on the exchange determined to be the primary market for that security by the Board or its delegates. If no closing price is available, then such securities are valued by using the last reported bid price. Equity securities traded over-the-counter are valued at the last reported sales price.
If no current market value quotation is readily available or reliable for a portfolio security, fair value will be determined in accordance with procedures established by and under the general supervision of the Board. When the Portfolio uses fair value pricing, it may take into account any factors it deems appropriate. The value of securities used by the Portfolio to calculate its net asset value may differ from quoted or published prices for the same securities. Fair value pricing involves subjective judgments and the fair value determined for a security may be materially different than the value that could be realized upon the sale of that security.
MSF-12
Metropolitan Series Fund, Inc.
BlackRock Legacy Large Cap Growth Portfolio
Notes to Financial Statements—December 31, 2008—(Continued)
The Portfolio expects to use fair value pricing for securities primarily traded on U.S. exchanges only under very limited circumstances. For example, the Portfolio may use fair value pricing if the exchange on which a security is traded closes early or trading in the security is suspended.
Securities traded primarily on an exchange outside of the United States which closes before the close of the New York Stock Exchange will be valued at the last sales price on that non-U.S. exchange. Securities traded primarily on an exchange outside of the United States for which there is no reported sale during the day are valued at the mean between the last reported bid and asked prices. However, because most foreign markets close well before the Portfolio values its securities (typically at 4 p.m. Eastern Time), the earlier close of these foreign markets gives rise to the possibility that significant events, including broad market moves, may have occurred after these foreign markets close but before the Portfolio values its securities. To account for this, the Portfolio may frequently value many of its foreign equity securities using fair value prices based on third party vendor modeling tools.
Forward foreign currency exchange contracts are valued based on the mean between closing bid and asked prices of the forward currency contract rates in the London foreign exchange markets on a daily basis as provided by a reliable bank or dealer.
Options, whether on securities, indices, futures contracts, or otherwise, are valued at the last sales price available as of the close of business on the day of valuation or, if there is no such sale price available, at the mean between the bid and asked prices. Options on currencies are valued at the spot price each day.
The value of futures contracts will be the sum of the margin deposit plus or minus the difference between the value of the futures contract on each day the net asset value is calculated and the value on the date the futures contract originated, value being that established on a recognized commodity exchange, or by reference to other customary sources, with gain or loss being realized when the futures contract closes or expires.
Subject to the Board’s oversight, the Board has delegated the day-to-day oversight of pricing matters, including determinations in good faith under the Fund’s procedures the fair value of securities for which current market quotations are not readily available to the subadviser of the Portfolio.
Investment Transactions and Related Investment Income:
Portfolio security transactions are recorded on the trade date. Dividend income is recorded on the ex-dividend date or, for certain foreign securities, when notified. Interest income, which includes amortization of premium and accretion of discount on debt securities, is recorded on the accrual basis. Realized gains and losses on investments and unrealized appreciation and depreciation are determined on the identified cost basis, which is the same basis used for federal income tax purposes.
Repurchase Agreements:
The Portfolio, through the custodian or a subcustodian, receives delivery of the underlying securities collateralizing repurchase agreements. The Portfolio requires the custodian to take possession, to have legally segregated in the Federal Reserve Book Entry System, or to have segregated within the custodian’s vault, all securities held as collateral for repurchase agreements. It is the Portfolio’s policy that the market value of the collateral be at least equal to 100% of the repurchase price in the case of a repurchase agreement of one-day duration and 102% on all other repurchase agreements. The Portfolio’s subadviser is responsible for determining that the value of the collateral is at all times at least equal to the repurchase price. In connection with transactions in repurchase agreements, if the seller defaults and the value of the collateral declines or if the seller enters an insolvency proceeding, realization of the collateral by the Portfolio may be delayed, limited or wholly denied.
Foreign Currency Translation:
The books and records of the Portfolio are maintained in U.S. dollars. The values of securities, currencies and other assets and liabilities denominated in currencies other than U.S. dollars are translated into U.S. dollars based upon foreign exchange rates prevailing at the end of the period. Purchases and sales of investment securities, income and expenses are translated on the respective dates of such transactions. Since the values of investment securities are presented at the foreign exchange rates prevailing at the end of the period, it is not practical to isolate that portion of the results of operations arising from changes in exchange rates from that portion of the results of operations reflecting fluctuations arising from changes in market prices of the investment securities. Such fluctuations are included in the net realized and unrealized gain or loss on investments.
MSF-13
Metropolitan Series Fund, Inc.
BlackRock Legacy Large Cap Growth Portfolio
Notes to Financial Statements—December 31, 2008—(Continued)
Net realized foreign exchange gains or losses arise from sales of foreign currency, currency gains or losses realized between the trade and settlement dates on securities transactions, and the difference between the amounts of dividends, interest, and foreign withholding taxes recorded by the Portfolio and the U.S. dollar equivalent of the amounts actually received or paid by the Portfolio. Net unrealized foreign exchange gains and losses arise from changes in the value of assets and liabilities, other than investment securities, resulting from changes in the exchange rate.
Forward Foreign Currency Exchange Contracts:
The Portfolio may enter into forward foreign currency exchange contracts primarily to hedge against foreign currency exchange rate risks on its non-U.S. dollar denominated investment securities. When entering into a forward currency contract, the Portfolio agrees to receive or deliver a fixed quantity of foreign currency for an agreed-upon price on an agreed future date. These contracts are valued daily and the Portfolio’s net equity therein, representing unrealized gain or loss on the contracts as measured by the difference between the foreign exchange rates at the dates of entry into the contracts and the forward rates at the settlement date, is included in the Statement of Assets and Liabilities. Realized and unrealized gains and losses are included in the Statement of Operations. These instruments involve market and/or credit risk in excess of the amount recognized in the Statement of Assets and Liabilities. Risks arise from the possible inability of counterparties to meet the terms of their contracts and from movement in currency and securities values and interest rates.
Futures Contracts:
The Portfolio may buy and sell futures contracts (on recognized exchanges) as a hedge, to maintain exposure to the broad equity markets or to enhance return. Futures contracts are agreements to buy or sell a security, or deliver a final cash settlement price in connection with an index, interest rate, currency, or other contracts not calling for physical delivery, for a set price in the future. The Portfolio must post an amount equal to a portion of the total market value of the futures contract as futures variation margin, which is returned when the Portfolio’s obligations under the contract have been satisfied. From time to time thereafter, the Portfolio may have to post variation margin to maintain this amount as the market value of the contract fluctuates. Risks of entering into futures contracts (and related options) include the possibility that there may be an illiquid market and that a change in the value of the contract or option may not correlate with changes in the value of the underlying securities.
Options:
The Portfolio may use options to hedge against changes in values of securities the Portfolio owns or expects to purchase, to maintain exposure to the broad equity markets or to enhance return. Writing puts or buying calls tends to increase the Portfolio’s exposure to the underlying instrument and writing calls or buying puts tends to decrease the Portfolio’s exposure to the underlying instrument, and can be used to hedge other Portfolio investments. For options purchased to hedge the Portfolio’s investments, the potential risk to the Portfolio is that the change in value of options contracts may not correspond to the change in value of the hedged instruments. In addition, losses may arise from changes in the value of the underlying instruments, if there is an illiquid secondary market, or if the counterparty is unable to perform. The maximum loss for purchased options is limited to the premium initially paid for the option. For options written by the Portfolio, the maximum loss is not limited to the premium initially received for the option.
The main risk associated with purchasing an option is that the option expires without being exercised. In this case, the option expires worthless and the premium paid for the option is considered the loss. The risk associated with writing a call option is that the Portfolio may forgo the opportunity for a profit if the market value of the underlying position increases and the option is exercised. The risk in writing a put option is that the Portfolio may incur a loss if the market value of the underlying position decreases and the option is exercised. In addition, the Portfolio risks not being able to enter into a closing transaction for the written option as the result of an illiquid market.
“When-Issued” Securities:
Purchasing securities “when-issued” is a forward commitment by the Portfolio to buy a security. The estimated amount of the Portfolio’s payment obligation and the security’s interest rate are determined when the commitment is made, even though no interest accrues until the security is issued, which is generally 15 to 120 days later. The Portfolio will segregate liquid assets with its custodian sufficient at all times to satisfy these commitments. If the value of the security is less when delivered than when the commitment was made, the Portfolio will suffer a loss.
MSF-14
Metropolitan Series Fund, Inc.
BlackRock Legacy Large Cap Growth Portfolio
Notes to Financial Statements—December 31, 2008—(Continued)
Federal Income Taxes:
It is the Portfolio’s policy to comply with the requirements of the Internal Revenue Code of 1986, as amended (the “Code”), and regulations thereunder, applicable to regulated investment companies and to distribute, with respect to each taxable year, all of its taxable income to shareholders. Therefore, no federal income tax provision is required. The Portfolio is subject to the provisions of the Financial Accounting Standards Board Interpretation (“FASB”) No. 48, Accounting for Uncertainties in Income Taxes (FIN 48). FIN 48 sets forth a minimum threshold for financial statement recognition of the benefit of a tax position taken or expected to be taken in a tax return. The implementation of FIN 48 did not result in any unrecognized tax benefits in the accompanying financial statements. Each of the Portfolio’s federal tax returns for the prior three fiscal years remains subject to examination by the Internal Revenue Service.
As of December 31, 2008, the Portfolio had capital loss carryforwards as follows:
| | | | | | | |
Expiring
12/31/10 | | Expiring
12/31/16 | | Total |
| $ | 110,044,174 | | $ | 13,790,425 | | $ | 123,834,599 |
Pursuant to Section 852 of the Code, the Portfolio designated the amount shown below under Long Term Gain as capital gain dividends for its taxable year ended December 31, 2008. The tax character of distributions paid for the periods ended December 31, 2008 and 2007 was as follows:
| | | | | | | | | | | | | | | | | | | | | | |
| Ordinary Income | | Long Term Gain | | Return of Capital | | Total |
| 2008 | | 2007 | | 2008 | | 2007 | | 2008 | | 2007 | | 2008 | | 2007 |
| $ | 1,672,332 | | $ | 830,576 | | $ | — | | $ | — | | $ | — | | $ | — | | $ | 1,672,332 | | $ | 830,576 |
As of December 31, 2008, the components of distributable earnings (accumulated losses) on a federal income tax basis were as follows:
| | | | | | | | | | | | | | | | |
Undistributed
Ordinary
Income | | Undistributed
Long Term
Gain | | Unrealized
Depreciation | | | Loss
Carryforwards | | | Total | |
| $ | 1,425,417 | | $ | — | | $ | (81,781,517 | ) | | $ | (123,834,599 | ) | | $ | (204,190,699 | ) |
Pursuant to Federal income tax regulations applicable to investment companies, the Portfolio has elected to treat net capital losses realized between November 1 and December 31 of each year as occurring on the first day of the following tax year. For the year ended December 31, 2008, the following amounts of realized capital and currency losses reflected in the accompanying financial statements will not be recognized for Federal income tax purposes until January 1, 2009:
| | | | |
Currency | | Capital | |
$— | | $ | (16,311,450 | ) |
Dividends and Distributions to Shareholders:
The Portfolio records dividends and distributions on the ex-dividend date. Net realized gains from security transactions (if any) are generally distributed annually to shareholders. The timing and characterization of certain income and capital gains distributions are determined in accordance with federal tax regulations that may differ from GAAP. Permanent book and tax basis differences relating to shareholder distributions will result in reclassification between under/over distributed net investment income, accumulated net realized gains/losses and paid in capital.
Expense Reductions:
Certain Portfolio trades are directed to brokers who paid a portion of the Portfolio’s expenses. Amounts paid for the Portfolio are shown as expense reductions in the Statement of Operations.
| 3. | INVESTMENT TRANSACTIONS: |
For the year ended December 31, 2008, purchases and sales of securities (excluding short term investments) for the Portfolio were as follows:
| | | | | | | | | | |
| Purchases | | Sales |
| U.S. Government | | Other | | U.S. Government | | Other |
| $ | 0 | | $ | 312,926,947 | | $ | 0 | | $ | 333,719,493 |
MSF-15
Metropolitan Series Fund, Inc.
BlackRock Legacy Large Cap Growth Portfolio
Notes to Financial Statements—December 31, 2008—(Continued)
| 4. | INVESTMENT MANAGEMENT FEES AND OTHER TRANSACTIONS WITH AFFILIATES: |
Investment Management Agreement:
MetLife Advisers, LLC (“MetLife Advisers”) is the investment adviser to the Portfolio. The Fund has entered into an investment management agreement with MetLife Advisers with respect to the Portfolio. For providing investment management services to the Portfolio, MetLife Advisers receives monthly compensation at the following annual rates:
| | | | | |
Management
Fees earned by
MetLife Advisers
for the year ended
December 31, 2008 | | Annual
percentage
rates paid to
MetLife Advisers | | | Based on Portfolios
average daily net asset
levels |
| $3,111,699 | | 0.730 | % | | Of the first $1 billion |
| | 0.650 | % | | On amounts in excess of $1 billion |
Certain officers and directors of the Fund may also be officers of MetLife Advisers; however, such officers and directors receive no compensation from the Fund.
MetLife Advisers has entered into an investment subadvisory agreement with respect to the Portfolio. BlackRock Advisors, LLC is compensated by MetLife Advisers to provide subadvisory services for the Portfolio.
Service and Distribution Fees:
The Fund has adopted a Distribution and Service Plan under Rule 12b-1 of the 1940 Act for the Portfolio’s Class B and E shares. Under the Distribution and Service Plan, the Class B and E shares of the Portfolio pay a fee to compensate the Insurance Companies (or their affiliates) and other broker-dealers and financial intermediaries involved in the offer and sale of Portfolio shares for promoting or selling and servicing the Class B and E shares. The fees under the Distribution and Service Plan for each class of the Portfolio’s shares are calculated as a percentage of the Portfolio’s average daily net assets that are attributable to that Class. Currently, the fee is 0.25% per year for Class B shares and 0.15% per year for Class E shares. Amounts paid by the Portfolio for the year ended December 31, 2008 are shown as Service and Distribution fees in the Statement of Operations.
The Fund has entered into a securities lending arrangement with the Fund’s custodian, State Street Bank and Trust Company (the “custodian”). Under the agreement, the custodian is authorized to loan securities on the Portfolios’ behalf. In exchange, the Portfolio receives either cash or securities as collateral against the loaned securities. The Portfolio receives collateral at least equal to 102% of the market value of the loaned securities (105% for foreign securities), at each loan’s inception. Collateral must be maintained at least at 100% of the market value of the loaned securities for the duration of the loan. The cash collateral is invested in the Navigator Securities Lending Prime Portfolio, an affiliate of the custodian, which invests in a variety of high quality U.S. dollar-denominated instruments. If the market value of the collateral at the close of trading on a business day is less than 100% of the market value of the loaned securities at the close of trading on that day, the borrower shall be required to deliver, by the close of business on the following business day, an additional amount of collateral, equal to at least 100% of the market value of all the loaned securities as of such preceding day. The Portfolio receives 80% of the annual net income from securities lending transactions, which is included in interest income of the Portfolio. The remaining 20% is paid to the custodian as compensation for its securities lending services. Interest income received by the Portfolio via lending transactions during the year ended December 31, 2008 is footnoted in the Statement of Operations. The Portfolio bears the risk of any deficiency in the amount of collateral available for return to a borrower due to a loss in an approved investment purchased with such collateral. Any outstanding loans by the Portfolio at December 31, 2008 are footnoted in the Schedule of Investments.
| 6. | MARKET AND CREDIT RISK: |
In the normal course of business, the Portfolio invests in securities and enters into transactions where risks exist due to fluctuations in the market (market risk) or failure of the other party to a transaction to perform (credit risk). The value of securities held by the Portfolio may decline in response to certain events, including those directly involving the companies whose securities are owned by the Portfolio; conditions affecting the general economy; overall market changes; local, regional or global political, social or economic instability; and currency and interest rate and price fluctuations. Similar to credit risk, the Portfolio may be exposed to counterparty risk, or the risk that an entity with which the Portfolio has unsettled or open transactions may
MSF-16
Metropolitan Series Fund, Inc.
BlackRock Legacy Large Cap Growth Portfolio
Notes to Financial Statements—December 31, 2008—(Continued)
default. Financial assets, which potentially expose the Portfolio to credit and counterparty risks, consist principally of investments and cash due from counterparties. The extent of the Portfolio’s exposure to credit and counterparty risks in respect to these financial assets approximates their value as recorded in the Portfolio’s Statements of Assets and Liabilities.
On November 7, 2008, the Board approved the acquisition of the Metropolitan Series Fund, Inc. FI Large Cap Portfolio (“FI Large Cap Portfolio”) by the Portfolio, subject to the approval of shareholders of FI Large Cap Portfolio. On or about February 27, 2009, the shareholders of FI Large Cap Portfolio will consider the approval of a proposed Agreement and Plan of Reorganization providing for the acquisition of all the assets of FI Large Cap Portfolio by the Portfolio in exchange for shares of the Portfolio and the assumption by the Portfolio of the liabilities of FI Large Cap Portfolio. If approved by shareholders, the reorganization will close on or about May 1, 2009.
On January 27, 2009, the Board approved the acquisition of the Met Investors Series Trust—Met/AIM Capital Appreciation Portfolio (the “AIM Portfolio”) by the Portfolio, subject to the approval of shareholders of the AIM Portfolio. On or about April 30, 2009, the shareholders of the AIM Portfolio will consider the approval of a proposed Agreement and Plan of Reorganization providing for the acquisition of all the assets of the AIM Portfolio by the Portfolio in exchange for shares of the Portfolio and the assumption by the Portfolio of the liabilities of the AIM Portfolio. If approved by shareholders, the reorganization will close on or about May 1, 2009.
| 8. | RECENT ACCOUNTING PRONOUNCEMENTS: |
In March 2008, the FASB issued Statement of Financial Accounting Standards No. 161, Disclosures about Derivative Instruments and Hedging Activities (“FAS 161”), an amendment of FASB Statement No. 133. FAS 161 requires enhanced disclosures about (a) how and why an entity uses derivative instruments, (b) how derivative instruments and hedging activities are accounted for, and (c) how derivative instruments and related hedging activities affect a fund’s financial position, financial performance, and cash flows. Management does not believe the adoption of FAS 161 will materially impact the financial statement amounts, but will require additional disclosures. This will include qualitative and quantitative disclosures on derivative positions existing at period end and the effect of using derivatives during the reporting period. FAS 161 is effective for financial statements issued for fiscal years and interim periods beginning after November 15, 2008. Management is currently evaluating the impact the adoption of FAS 161 will have on the Portfolio’s financial statement disclosures.
MSF-17
Metropolitan Series Fund, Inc.
BlackRock Legacy Large Cap Growth Portfolio
Report of Independent Registered Public Accounting Firm
To the Shareholders and Board of Directors of Metropolitan Series Fund, Inc.:
We have audited the accompanying statement of assets and liabilities, including the schedule of investments, of the BlackRock Legacy Large Cap Growth Portfolio) (one of the portfolios constituting the Metropolitan Series Fund, Inc.) (the “Fund”) as of December 31, 2008, and the related statement of operations for the year then ended, the statements of changes in net assets for each of the two years in the period then ended, and the financial highlights for each of the five years in the period then ended. These financial statements and financial highlights are the responsibility of the Fund’s management. Our responsibility is to express an opinion on these financial statements and financial highlights based on our audits.
We conducted our audits in accordance with the standards of the Public Company Accounting Oversight Board (United States). Those standards require that we plan and perform the audit to obtain reasonable assurance about whether the financial statements and financial highlights are free of material misstatement. The Fund is not required to have, nor were we engaged to perform, an audit of its internal control over financial reporting. Our audits included consideration of internal control over financial reporting as a basis for designing audit procedures that are appropriate in the circumstances, but not for the purpose of expressing an opinion on the effectiveness of the Fund’s internal control over financial reporting. Accordingly, we express no such opinion. An audit also includes examining, on a test basis, evidence supporting the amounts and disclosures in the financial statements, assessing the accounting principles used and significant estimates made by management, as well as evaluating the overall financial statement presentation. Our procedures included confirmation of securities owned as of December 31, 2008, by correspondence with the custodian and brokers; where replies were not received from brokers, we performed other auditing procedures. We believe that our audits provide a reasonable basis for our opinion.
In our opinion, the financial statements and financial highlights referred to above present fairly, in all material respects, the financial position of the BlackRock Legacy Large Cap Growth Portfolio of the Metropolitan Series Fund, Inc. as of December 31, 2008, the results of its operations for the year then ended, the changes in its net assets for each of the two years in the period then ended, and the financial highlights for each of the five years in the period then ended, in conformity with accounting principles generally accepted in the United States of America.
Deloitte & Touche LLP
Boston, Massachusetts
February 20, 2009
MSF-18
Metropolitan Series Fund, Inc.
Directors and Officers
The Fund’s Directors review actions of the Fund’s investment adviser and subadvisers, and decide upon matters of general policy. The Fund’s officers supervise the daily business operations of the Fund. The Board of Directors and the Fund’s officers are listed below. Each Director is responsible for overseeing all 38 Portfolios of the Fund. There is no limit to the term a Director may serve. Directors serve until their resignation, retirement or removal in accordance with the Fund’s organizational documents and policies adopted by the Board from time to time. Officers hold office at the pleasure of the Board or until the election or appointment and the qualification of a successor. The address of the Directors and officers is c/o Metropolitan Series Fund, Inc., 501 Boylston Street, Boston, MA 02116.
Interested Directors(1)
Each Director below is an “interested person” (as defined by the 1940 Act) with respect to the Fund in that Ms. Forget is an employee of MetLife and Mr. Typermass is a former employee of MetLife and owns securities issued by MetLife, Inc., the ultimate parent company of MetLife Advisers.
| | | | | | | | |
Name, Address and Age | | Current
position(s)
with Fund | | Position(s)
held since | | Principal occupations
over past five years, including other directorships(2) | | Number of
Portfolios in
Fund Complex
Overseen by
Director(3) |
Elizabeth M. Forget Age: 42 | | Director, Chairman of the Board, President and Chief Executive Officer | | 2006 | | Senior Vice President (since 2007), MetLife, Inc.; President, Met Investors Advisory, LLC; Trustee and President, Met Investors Series Trust; Executive Vice President, MetLife Investors Group, Inc.; President, Chief Executive Officer and Chair of the Board of Managers (since 2006), MetLife Advisers; President, Met Investors Advisory, LLC. | | 87 |
| | | | |
Arthur G. Typermass Age: 71 | | Director | | 1998 | | Formerly, Senior Vice President and Treasurer, MetLife. | | 38 |
Non-Interested Directors(1)
Each Director below is not an “interested person” (as defined by the 1940 Act) with respect to the Fund (collectively, the “Independent Directors”).
| | | | | | | | |
Name, Address and Age | | Current
position(s)
with Fund | | Position(s)
held since | | Principal occupations
over past five years, including other directorships(2) | | Number of
Portfolios in
Fund Complex
Overseen by
Director(3) |
Steve A. Garban† Age: 71 | | Director | | 1985 | | Formerly, Chief Financial Officer, Senior Vice President Finance and Operations and Treasurer (Emeritus), The Pennsylvania State University. | | 38 |
| | | | |
Linda B. Strumpf Age: 61 | | Director | | 2000 | | Vice President and Chief Investment Officer, Ford Foundation. | | 38 |
| | | | |
Michael S. Scott Morton† Age: 71 | | Director | | 1993 | | Jay W. Forrester Professor of Management (Emeritus) at Sloan School of Management, MIT. | | 38 |
| | | | |
H. Jesse Arnelle Age: 75 | | Director | | 2001 | | Formerly, Counsel, Womble Carlyle Sandrie & Rice; Director, Textron Inc. (global multi- industry company)*; formerly, Director, Gannet Co. Inc. (diversified news and information company)*; formerly, Director, Eastman Chemical Company (global chemical company)*; formerly, Director, Waste Management, Inc.*; formerly, Director, Armstrong Holdings Inc. (parent company of floor and ceiling products business)*; formerly, Director, FPL Group Inc. (public utility holding company)*; Director, URS Corporation (engineering design services firm)*. | | 38 |
MSF-19
Metropolitan Series Fund, Inc.
Directors and Officers—(Continued)
| | | | | | | | |
Name, Address and Age | | Current
position(s)
with Fund | | Position(s)
held since | | Principal occupations
over past five years, including other directorships(2) | | Number of
Portfolios in
Fund Complex
Overseen by
Director(3) |
Nancy Hawthorne Age: 57 | | Director | | 2003 | | Chief Executive Officer, Clerestory LLC (corporate financial advisor); Director, Avid Technologies (computer software company)*; formerly, Chairman of the Board of Avid Technologies; formerly, Board of Advisors, L. Knife & Sons, Inc. (beverage distributor); formerly, Trustee, New England Zenith Fund (“Zenith Fund”)**; formerly, Chief Executive Officer and Managing Partner, Hawthorne, Krauss and Associates (corporate financial advisor); formerly, Chief Financial Officer and Executive Vice President, Continental Cablevision, subsequently renamed MediaOne (cable television company); formerly, Director, Life F/X, Inc.; formerly, Chairman of the Board, WorldClinic (distance medicine company); formerly, Director, Perini Corporation (construction company)*; formerly, Director, CGU (property and casualty insurance company); formerly, Director, Beacon Power Corporation (energy company)*. | | 38 |
| | | | |
John T. Ludes Age: 72 | | Director | | 2003 | | President, LFP Properties (consulting firm); Formerly, Trustee, Zenith Fund**; formerly, Vice Chairman, President and Chief Operating Officer, Fortune Brands/American Brands (global conglomerate); formerly, President and CEO, Acushnet Company (athletic equipment company). | | 38 |
Officers(1)
| | | | | | | | |
Name and address | | Age | | Current
position(s)
with Fund | | Position(s)
held since | | Principal occupations over past five years(2) |
| Jeffrey L. Bernier | | 37 | | Senior Vice President | | 2008 | | Vice President (since 2008), MetLife, Inc.; Vice President (since 2008), MetLife; Senior Vice President (since 2008), MetLife Advisers; formerly, Director and Senior Investment Analyst (2004 to 2007), John Hancock Financial Services; formerly, Assistant Vice President (2000 to 2001), Wachovia Securities. |
| | | | |
| Alan C. Leland | | 56 | | Senior Vice President | | 2005 | | Treasurer and Chief Financial Officer, MetLife Advisers, LLC; Treasurer (since 2005), Met Investors Advisory, LLC; Vice President (since 2004), Met Investors Advisory, LLC; Vice President (since 2003), MetLife, Inc.; Vice President, MetLife; Senior Vice President, NELICO. |
| | | | |
| Peter Duffy | | 53 | | Vice President
and Treasurer | | 2000 | | Senior Vice President, MetLife Advisers; Second Vice President (since 2003), NELICO; Vice President, MetLife (since 2004); Vice President (since 2004), MetLife, Inc.; formerly, Vice President and Treasurer, Zenith Fund**. |
| | | | |
| Jeffrey P. Halperin | | 41 | | Chief
Compliance Officer | | 2007 | | Vice President (since 2006), MetLife, Inc.; Vice President (since 2006), MetLife; Chief Compliance Officer (since 2006), Met Investors Series Trust, MetLife Advisers, Met Investors Advisory, LLC and MetLife Investment Advisors Company, LLC. |
| * | Indicates a directorship with a registered investment company or a company subject to the reporting requirements of the Securities Exchange Act of 1934, as amended. |
| ** | The Zenith Fund deregistered with the Securities and Exchange Commission (“SEC”) in 2004. |
| (†) | Served as a trustee, director and/or officer of one or more of the following companies, each of which had a direct or indirect advisory relationship with MetLife Advisers or its affiliates prior to January 31, 2005: State Street Research Financial Trust, State Street Research Income Trust, State Street Research Money Market Trust, State Street Research Institutional Funds, State Street Research Capital Trust, State Street Research Master Investment Trust, State Street Research Equity Trust, State Street Research Securities Trust and State Street Research Exchange Trust (collectively, the “State Street Research Funds”). |
| (1) | During the period shown, each Director of the Fund served as a Trustee of Metropolitan Series Fund II, a registered investment company that ceased investment operations in June of 2008 and has applied for deregistration under the Investment Company Act of 1940. During this period, each officer of the Fund served in the same position with Metropolitan Series Fund II. |
| (2) | Previous positions during the past five years with the Fund; Met Investors Series Trust; MetLife; MetLife, Inc.; MetLife Advisers; Met Investors Advisory, LLC; Zenith Fund; NELICO; or New England Securities Corporation are omitted if not materially different. |
| (3) | The Fund Complex includes the Fund (38 portfolios) and Met Investors Series Trust (49 portfolios). |
MSF-20
Metropolitan Series Fund, Inc.
BlackRock Legacy Large Cap Growth Portfolio
Board Approval of Advisory and Subadvisory Agreements
The Fund’s Contract Review Committees of the Board of Directors (the “Board” or the “Directors”) typically meet in early fall to review the Portfolios’ advisory agreements (the “Advisory Agreements”) and subadvisory agreements (the “Subadvisory Agreements,” and, together with the Advisory Agreements, the “Agreements”) and determine whether to recommend that the full Board approve the continuation of the Agreements for an additional one-year period. (Following the initial approval of an Agreement for a new Portfolio or with a new adviser or subadviser, such annual reviews are not required until 2 years following the execution of such Agreement.) After each Committee has made its recommendations, the full Board, including the Independent Directors, determines whether to approve the continuation of each of the Agreements. In addition, the Board, including the Independent Directors, considers matters bearing on the Agreements at most of its other meetings throughout the year and regularly interviews various individuals at MetLife Advisers responsible for the management of the Portfolios. The Directors also interview selected investment managers and other professionals at the subadvisers at various times throughout the year.
The Directors receive all materials that they or MetLife Advisers, the Fund’s investment adviser, and the subadvisers believe to be reasonably necessary for the Directors to evaluate the Agreements and determine whether to approve the continuation of the Agreements. These materials generally include, among other items, (i) information on the investment performance of the Portfolios and the performance of peer groups of funds and the Portfolios’ performance benchmarks, (ii) information on the Portfolios’ advisory and subadvisory fees and other expenses, including information comparing the Portfolios’ expenses to those of peer groups of funds and information about any applicable expense caps and fee “breakpoints,” (iii) sales and redemption data, (iv) information related to the profitability of the Agreements to MetLife Advisers and certain of the subadvisers, and potential “fall-out” or ancillary benefits that MetLife Advisers, the subadvisers or their affiliates may receive as a result of their relationships with the Fund and (v) information obtained through the subadvisers’ responses to certain requests from MetLife Advisers and the Directors and MetLife Advisers’ responses to requests from the Directors. The Directors may also consider other information such as (vi) MetLife Advisers’ and the subadvisers’ financial results and condition, (vii) each Portfolio’s investment objectives and strategies and the size, education and experience of the investment staffs of MetLife Advisers and the relevant subadvisers and their use of technology and external research, (viii) the allocation of the Portfolios’ brokerage, if any, including allocations to brokers affiliated with the subadvisers and the use of “soft” commission dollars to pay Portfolio expenses and to pay for research and other similar services, (ix) the resources devoted to, and the record of compliance with, the Portfolios’ investment policies and restrictions, policies on personal securities transactions and other compliance policies, (x) the responses of MetLife Advisers, the subadvisers and/or their affiliates to certain legal and regulatory proceedings and (xi) the economic outlook generally and for the mutual fund industry in particular. Throughout the process, the Directors have the opportunity to ask questions of and request additional materials from MetLife Advisers and the subadvisers.
Following meetings of each Contract Review Committee on September 10, 2008, the Board, including the Independent Directors, at its November 6-7, 2008 meeting, approved the continuation through December 31, 2009 of the Advisory Agreements for each Portfolio of the Fund and the Subadvisory Agreements for each Portfolio other than the Zenith Equity Portfolio and Asset Allocation Portfolios (which do not have subadvisers) and the Van Eck Global Natural Resources Portfolio, Met/Dimensional International Small Cap Portfolio and Loomis Sayles Small Cap Growth Portfolio (formerly known as the Franklin Templeton Small Cap Growth Portfolio). The Agreements approved for continuation are referred to below as the “Continued Agreements.”
In considering whether to approve the continuation of the Continued Agreements, the Directors, including the Independent Directors, did not identify any single factor as determinative, and each weighed the various factors as he or she deemed appropriate. The Directors considered the following matters in connection with their approval of the Continued Agreements:
The nature, extent and quality of the services provided to the relevant Portfolios under the Continued Agreements. The Directors considered the nature, extent and quality of the services provided by MetLife Advisers, the relevant subadvisers (if any) and their affiliates (each, an “Adviser,” and, collectively, the “Advisers”) to the relevant Portfolios pursuant to the Continued Agreements and the resources dedicated to these Portfolios by the Advisers. In particular, the Directors considered the Advisers’ abilities to attract and retain highly qualified investment professionals. With respect to MetLife Advisers, the Directors considered (for each Portfolio other than the Zenith Equity and Asset Allocation Portfolios) that MetLife Advisers is (i) ultimately responsible for the performance of such Portfolios; (ii) ultimately responsible for the establishment of the investment strategies of each such Portfolio, primarily through its recommendations to the Board regarding the hiring and selection of subadvisers; (iii) responsible for the hiring and selection, subject to Board approval, of subadvisers; and (iv) responsible for maintaining a program of Subadviser oversight reasonably designed to ensure that the subadvisers have reasonable compliance policies and procedures in place. The Directors also considered that MetLife Advisers provides a full range of day-to-day administrative services for the Portfolios involving all aspects of such Portfolios’ day-to-day operations (other than portfolio management). With respect to the Zenith Equity and Asset Allocation Portfolios, the Directors considered both the portfolio management services and the administrative services provided by MetLife Advisers. After reviewing
MSF-21
Metropolitan Series Fund, Inc.
BlackRock Legacy Large Cap Growth Portfolio
Board Approval of Advisory and Subadvisory Agreements—(Continued)
these and related factors, the Directors concluded, within the context of their overall conclusions regarding each of the Continued Agreements, that the nature, extent and quality of services provided supported the renewal of these Agreements.
Investment performance of the relevant Portfolios. The Directors reviewed information about the performance of the relevant Portfolios over various time periods, including information prepared by an independent third party that compared the performance of the Portfolios to the performance of peer groups of funds and performance benchmarks. The Directors also reviewed a description of the third party’s methodology for identifying a Portfolio’s peer group(s) for purposes of performance and expense comparisons.
In the case of each relevant Portfolio that had performance that lagged its peer group(s) for certain periods, the Directors concluded that other factors relevant to performance were sufficient, in light of other considerations, to warrant renewal of the Continued Agreements relating to such Portfolio. These factors varied from Portfolio to Portfolio, but included one or more of the following: (i) that such Portfolio’s performance, although lagging in certain recent periods, was stronger over the longer term; (ii) that the underperformance was attributable, to a significant extent, to investment decisions that were reasonable and consistent with the Portfolio’s investment objective(s) and policies and that the Portfolio was performing within the range of reasonable expectations, given market conditions and the Portfolio’s investment objective(s) and policies; (iii) that the Portfolio’s performance was competitive when compared to other relevant performance benchmarks or peer groups; and (iv) that MetLife Advisers and/or the relevant subadviser (if any) had taken or was taking steps designed to help improve the Portfolio’s investment performance (including, in the case of certain Portfolios, that MetLife Advisers was formulating possible proposals, for presentation to the Board in November 2008, to replace the Portfolio’s subadviser or to merge the Portfolio into another Portfolio with a similar investment objective and better investment performance).
The Directors also considered the investment performance of the Advisers and their reputations generally, the historical responsiveness of the Advisers to Director concerns about performance and the willingness of the Advisers to take steps intended to improve performance.
After reviewing these and related factors, the Directors concluded, within the context of their overall conclusions regarding each of the Continued Agreements, that the investment performance of each relevant Portfolio and Adviser was sufficient, in light of other considerations, to warrant the renewal of the Continued Agreements.
The costs of the services to be provided and profits to be realized by the Advisers and their affiliates from their relationships with the Portfolios. The Directors considered the fees charged by MetLife Advisers to the Portfolios for advisory services and, with respect to the subadvised Portfolios, by such subadvisers to MetLife Advisers for subadvisory services (such advisory and subadvisory fees (if any), collectively, “Fees”), as well as the total expense levels of the Portfolios. This information included comparisons (provided by an independent third party) of the Portfolios’ advisory fees and total expense levels to those of their peer groups. In evaluating Fees for the relevant Portfolios, the Directors also took into account the demands, complexity and quality of the investment management services provided to each Portfolio. The Directors considered MetLife Advisers’ recommendations regarding reductions in Fee rates, implementation of Fee breakpoints and institution of Fee waivers and expense caps.
The Directors also considered the compensation directly or indirectly received by the Advisers and their affiliates from their relationships with the relevant Portfolios. The Directors reviewed information relating to the profits received by MetLife Advisers, certain of the subadvisers and their affiliates as a result of their relationships with the relevant Portfolios, and information about the allocation of expenses used to calculate profitability. When reviewing profitability, the Directors also considered the performance of the relevant Portfolios, the expense levels of such Portfolios and whether the relevant Advisers had implemented breakpoints, fee waivers and/or expense caps with respect to such Portfolios.
After reviewing these and related factors, the Directors concluded, within the context of their overall conclusions regarding each of the Continued Agreements, that the Fees charged to each of the relevant Portfolios were fair and reasonable, and that the information provided regarding costs of these services generally, and the related profitability (if known) to the relevant Advisers of their relationships with the relevant Portfolios, supported the renewal of the Continued Agreements.
Economies of Scale. The Directors considered the existence of any economies of scale in the provision of services by the Advisers and whether those economies were shared with the relevant Portfolios through breakpoints in their advisory fees or other means, such as expense caps, fee waivers or relatively low levels of fees. The Directors noted that most of the relevant Portfolios benefited or will benefit from breakpoints, expense caps and/or fee waivers with respect to their advisory fees. In considering these issues, the Directors also took into consideration information relating to the costs of the services provided and the profitability to MetLife Advisers, the relevant subadvisers (if any) and each of their affiliates of their relationships with the relevant Portfolios, as discussed above.
MSF-22
Metropolitan Series Fund, Inc.
BlackRock Legacy Large Cap Growth Portfolio
Board Approval of Advisory and Subadvisory Agreements—(Continued)
After reviewing these and related factors, the Directors concluded, within the context of their overall conclusions regarding each of the Continued Agreements, that the extent to which economies of scale were shared with the relevant Portfolios supported the renewal of such Agreements.
Other Factors. The Directors also considered other factors, which included but were not limited to the following:
| | • | | the extent to which each relevant Portfolio operated in accordance with its investment objective, and its record of compliance with its investment restrictions and the compliance programs of the Fund and the Advisers. They also considered the compliance-related resources the Advisers and their affiliates provide to the relevant Portfolios; |
| | • | | the nature, quality, cost and extent of administrative and shareholder services performed by MetLife Advisers and its affiliates under the Advisory Agreements; and |
| | • | | so-called “fall-out benefits” to the Advisers, such as the engagement of their affiliates to provide distribution, brokerage and transfer agency services to the Portfolios, and the benefits of research made available to the relevant Advisers by reason of brokerage commissions generated by the relevant Portfolios’ securities transactions. The Directors also considered the possible conflicts of interest associated with these fall-out and other benefits, and the reporting and other processes in place to disclose and monitor these possible conflicts of interest. |
Based on their evaluation of all factors that they deemed to be material, including those factors described above, and assisted by the advice of independent counsel, the Directors, including the Independent Directors, concluded that each of the Continued Agreements should be continued through December 31, 2009.
MSF-23
A description of the policies and procedures that the Fund uses to determine how to vote proxies relating to portfolio securities is available (i) without charge, upon request, by calling (800) 638-7732 and (ii) on the Securities and Exchange Commission’s (the “SEC”) website at http://www.sec.gov.
Information regarding how the Fund voted proxies relating to portfolio securities during the most recent twelve-month period ended December 31, 2008 is available (i) without charge, upon request, by calling (800) 638-7732 and (ii) on the SEC’s website at http://www.sec.gov.
The Fund’s Statement of Additional Information includes additional information about the Directors of the Fund and is available (i) without charge, upon request, by calling (800) 638-7732 and (ii) on the SEC’s website at http://www.sec.gov.
The Fund files with the SEC a complete schedule of its portfolio holdings, as of the close of the first and third quarters of its fiscal year, on “Form N-Q”. These filings are available on the SEC’s website at www.sec.gov and may be reviewed and copied at the SEC’s Public Reference Room in Washington, DC. (Call 1-800-SEC-0330 for information on the operation of the Public Reference Room.)
MSF-24
Simplify your life…
with MetLife eDelivery® while helping MetLife preserve the planet’s natural resources.
(see details on inside cover)
| | |
Metropolitan Series Fund, Inc. BlackRock Money Market Portfolio Annual Report | | December 31, 2008 |
NOT PART OF THE ANNUAL REPORT
Letter from the President
February 1, 2009
Letter to Policy Holders:
2008 was an extraordinary year in the capital markets around the world and for the global economy. Energy prices rose to record levels early in the year before falling by two-thirds by year-end. A credit crisis that began with concerns about sub-prime mortgages led to massive changes in the financial landscape with government takeovers, forced sales, and outright failures of a number of large, once venerable firms.
While bonds as measured by the Barclays Capital U.S. Aggregate Bond Index (formerly known as, Lehman Brothers U.S. Aggregate Bond Index) were up 5.2% for the year in response to declining interest rates, there were large differences in the total returns of the various sectors of the bond market. U.S. treasury securities were up over 13% as frightened investors sought refuge in what they perceived to be the safest and most liquid investments. In contrast, investment grade corporate securities lost nearly 5% as credit spreads widened and below investment grade or high yield bonds fell over 26%.
In response to the growing credit crisis and the weakening economy, common stocks fell sharply across all regions, styles, and capitalizations. As measured by the Standard and Poor’s 500, U.S. common stocks fell 37% for the year, the worst calendar year decline since the 1930s. Foreign stocks were down even more with the MSCI EAFE Index down 43% for the year.
On the following pages, you will find a complete review of your Portfolio and its investment performance.
MetLife is committed to building your financial freedom. We appreciate your trust and will continue to focus our efforts on meeting your investment needs.
Sincerely,
Elizabeth M. Forget
President, Metropolitan Series Fund, Inc.
Metropolitan Series Fund, Inc.
BlackRock Money Market Portfolio
Managed by BlackRock Advisors, LLC
Portfolio Manager Commentary*
PORTFOLIO PERFORMANCE
For the twelve-month period ended December 31, 2008, the Class A shares of the BlackRock Money Market Portfolio returned 2.9%; the Class B shares returned 2.6%; and the Class E shares returned 2.7%. The average return of its peer group, the Lipper Variable Insurance Products1 Money Market Funds Universe, was 2.2% over the same period.
PORTFOLIO REVIEW
During the first quarter of 2008, the Federal Open Market Committee (FOMC) provided a significant degree of monetary stimulus, beginning with a 75-basis-point inter-meeting reduction in the federal funds target rate to 3.50% in late January. This action represented the first inter-meeting move by the committee since September 2001, and was the largest single reduction in rates in more than two decades. The FOMC reduced the target rate another 50 basis points at the January 30 meeting, and an additional 75 basis points at the March 18 meeting, bringing the level to 2.25%. The FOMC reduced the target rate an additional 25 basis points to 2.00% at the April 30 meeting. The committee acknowledged that financial markets remain under considerable stress. It was also noted that tighter credit conditions and weakness in the housing sector were expected to have a negative impact on growth over the next few quarters. At the same time, the committee also expressed uncertainty about the outlook for inflation.
Beginning late in the third quarter, concerns about the health of Lehman Brothers and various other financial institutions contributed to a sharp increase in market volatility. In response, the Federal Reserve provided a substantial amount of funds through open market operations and the expansion of its dollar liquidity facilities. As a result, various programs were created to address dislocations in the money markets, all of which are scheduled to expire on April 30, 2009. For example, the U.S. Treasury established a Temporary Guarantee Program designed to protect money fund investors. The program provides a guarantee to shareholders of participating funds up to the amount held in the fund as of the close of business on September 19. Any increase in the number of shares an investor holds after the close of business on September 19, 2008 will not be guaranteed. If a customer closes his/her account with a fund or broker-dealer, any future investment in the fund will not be guaranteed. If the number of shares an investor holds fluctuates over the period, the investor will be covered for either the number of shares held as of the close of business on September 19, 2008, or the current amount, whichever is less. The program is set to expire on April 30, 2009. The Federal Reserve also created the Asset Backed Money Market Mutual Fund Liquidity Facility (AMLF) program, which enables money funds to sell asset-backed commercial paper (ABCP) at amortized cost through various banks on a non-recourse basis to the Federal Reserve. This program peaked at $152 billion during the fourth quarter and ended the period at just under $24 billion. The Commercial Paper Funding Facility (CPFF), which officially launched on October 27, allows the Federal Reserve to finance the purchase of three-month unsecured CP and ABCP from eligible issuers. This program reached a high of over $334 billion, but has since been utilized at a decelerating rate. The Federal Reserve also created the Money Market Investor Funding Facility (MMIFF) to finance the purchase of certificates of deposit (CDs), bank notes and CP issued by various banks and financial institutions from U.S. money market mutual funds at amortized cost. This program has not been utilized by market participants.
The FOMC maintained the federal funds target rate at 2.00% at the August 5 and September 16 meetings before unexpectedly reducing the target rate 50 basis points to 1.5% on October 8, as part of a globally coordinated effort to address the “intensification of the financial crisis.” Afterwards, the FOMC unanimously voted to decrease the target rate by an additional 50 basis points to 1.00% at the October 29 meeting. At the December 16 FOMC meeting, the committee elected to establish a “target range” for the federal funds rate of 0.00% to 0.25%, and suggested that economic conditions augur for an “exceptionally low” level of interest rates for a protracted period of time.
After a period of relative stability during much of the third quarter, rates rose sharply beginning in mid-September. Indeed, settings across the LIBOR curve between one and 12 months climbed as much as 209 basis points before peaking on October 10. The various initiatives described above subsequently contributed to a sharp decline in rates through year-end. For example, settings across the LIBOR curve contracted as much as 415 basis points. The slope of the LIBOR curve between one month and one year stood at a positive 157 basis points at the end of December, up from a positive slope of just four basis points at the end of September.
The Portfolio continued to maintain a laddered structure during most of the period and, consistent with past strategies, the majority of investments purchased had maturity dates of approximately 30 to 90 days. Yields on such obligations, which were comprised mostly of CP and CDs, range from approximately 0.45% to 4.77%. Incremental purchases of CP and CDs due in approximately six months were also made in order to maintain the Portfolio’s average weighted maturity and add incremental yield. Yields on such obligations ranged from about 1.60% to 4.50%. Similarly, investments in agency discount notes due in approximately six months were made at yields ranging from 1.30% to 2.53%. Investments were also made in variable rate obligations based on the monthly and quarterly LIBOR indices. Due to increased market volatility beginning in mid-September, an above-average percentage of assets were maintained in either securities due in 30 days or less or ABCP available for sale through the AMLF at amortized cost.
* The views expressed above are those of the subadvisory firm as of December 31, 2008 and are subject to change based on market and other conditions. Information about the Portfolio’s holdings, asset allocation, industry allocation, or country diversification is historical and is not an indication of future Portfolio composition, which will vary. The performance of any index mentioned in this commentary has not been adjusted for ongoing management, distribution and operating expenses, and sales charges applicable to mutual fund investments. Direct investment in any index is not possible.
1 The Lipper Variable Products Fund Average is an average of the total return performance (calculated on the basis of net asset value) of variable product funds with similar investment objectives to those of the subject Portfolio as calculated by Lipper Analytical Services, an independent mutual fund ranking service.
MSF-2
Metropolitan Series Fund, Inc.
Shareholder Expense Example
As a shareholder of the Portfolio, you incur ongoing costs, including management fees; distribution and service (12b-1) fees; and other Portfolio expenses. This example is intended to help you understand your ongoing costs (in dollars) (referred to as “expenses”) of investing in the Portfolio and compare these costs with the ongoing costs of investing in other mutual funds. The example is based on an investment of $1,000 invested at the beginning of the period and held for the entire period, July 1, 2008 through December 31, 2008.
Actual Expenses
The first line for each share class of the Portfolio in the table below provides information about actual account values and actual expenses. You may use the information in this line, together with the amount you invested in the particular share class of the Portfolio, to estimate the expenses that you paid over the period. Simply divide your account value by $1,000 (for example, an $8,600 account value divided by $1,000=8.6), then multiply the result by the number in the first line under the heading entitled “Expenses Paid During Period” to estimate the expenses you paid on your account during this period.
Hypothetical Example for Comparison Purposes
The second line for each share class of the Portfolio in the table below provides information about hypothetical account values and hypothetical expenses based on the Portfolio’s actual expense ratio and an assumed rate of return of 5% per year before expenses, which is not the Portfolio’s actual return. The hypothetical account values and expenses may not be used to estimate the actual ending account balance or expenses you paid for the period. You may use this information to compare the ongoing costs of investing in the Portfolio and other funds. To do so, compare this 5% hypothetical example with the 5% hypothetical examples that appear in the shareholder reports of the other funds.
Please note that the expenses shown in the table are meant to highlight your ongoing costs only and do not reflect any fees or charges of your variable insurance product or any additional expenses that participants in certain eligible qualified plans may bear relating to the operations of their plan. Therefore, the second line for each share class in the table is useful in comparing ongoing costs only, and will not help you determine the relative total costs of owning different funds. In addition, if these other costs were included, your costs would have been higher.
| | | | | | | | | | | | | | |
Portfolio | | | | Annualized
Expense
Ratio | | | Beginning
Account Value
July 1,
2008 | | Ending
Account Value
December 31,
2008 | | Expenses Paid
During Period*
July 1, 2008
to
December 31,
2008 |
BlackRock Money Market—Class A(a) | | Actual | | 0.32 | % | | $ | 1,000.00 | | $ | 1,012.01 | | $ | 1.62 |
| | Hypothetical | | 0.32 | % | | $ | 1,000.00 | | $ | 1,023.51 | | $ | 1.63 |
| | | | | |
BlackRock Money Market—Class B(a) | | Actual | | 0.57 | % | | $ | 1,000.00 | | $ | 1,010.76 | | $ | 2.88 |
| | Hypothetical | | 0.57 | % | | $ | 1,000.00 | | $ | 1,022.24 | | $ | 2.90 |
| | | | | |
BlackRock Money Market—Class E(a) | | Actual | | 0.47 | % | | $ | 1,000.00 | | $ | 1,011.27 | | $ | 2.38 |
| | Hypothetical | | 0.47 | % | | $ | 1,000.00 | | $ | 1,022.75 | | $ | 2.39 |
* Expenses paid are equal to the Portfolio’s annualized expense ratio for the most recent six month period, as shown above, multiplied by the average account value over the period,
multiplied by the number of days in the most recent fiscal half-year, divided by 366 (to reflect the the one-half year period).
(a) The annualized expense ratio shown reflects the impact of the management fee waiver as described in Note 4 to the Financial Statements.
MSF-3
Metropolitan Series Fund, Inc.
BlackRock Money Market Portfolio
Schedule of Investments as of December 31, 2008
Commercial Paper—60.2% of Total Net Assets
| | | | | | |
| Security Description | | Face
Amount | | Value* |
| | |
Asset Backed—25.0% | | | | | | |
Apreco, LLC
1.650%, 01/07/09 | | $ | 10,500,000 | | $ | 10,497,113 |
1.600%, 02/02/09 | | | 15,000,000 | | | 14,978,667 |
Cafco, LLC
2.250%, 02/02/09 | | | 25,000,000 | | | 24,950,000 |
0.870%, 03/09/09 | | | 12,000,000 | | | 11,980,570 |
Chariot Funding, LLC
1.400%, 01/08/09 | | | 29,750,000 | | | 29,741,901 |
0.250%, 01/22/09 | | | 35,000,000 | | | 34,994,896 |
Ciesco, LLC
3.000%, 01/12/09 | | | 45,000,000 | | | 44,958,750 |
CRC Funding, LLC
2.100%, 02/02/09 | | | 30,000,000 | | | 29,944,000 |
3.100%, 02/17/09 | | | 30,000,000 | | | 29,878,583 |
Enterprise Funding, LLC
1.500%, 01/12/09 | | | 25,000,000 | | | 24,988,542 |
Galleon Capital, LLC
0.550%, 01/02/09 | | | 34,000,000 | | | 33,999,481 |
Jupiter Securitization Co., LLC
1.400%, 01/05/09 | | | 25,000,000 | | | 24,996,111 |
Kitty Hawk Funding Corp.
2.800%, 02/02/09 | | | 20,000,000 | | | 19,950,222 |
2.250%, 02/03/09 | | | 15,000,000 | | | 14,969,062 |
Liberty Street Funding, LLC
2.250%, 02/09/09 | | | 25,000,000 | | | 24,939,062 |
Mont Blanc Capital Corp.
0.700%, 01/30/09 | | | 25,000,000 | | | 24,985,903 |
Nieuw Amsterdam Receivables Corp.
3.050%, 02/05/09 | | | 10,000,000 | | | 9,970,347 |
Old Line Funding, LLC
2.000%, 02/02/09 | | | 45,000,000 | | | 44,920,000 |
0.450%, 03/16/09 | | | 5,000,000 | | | 4,995,375 |
Ranger Funding Co., LLC
2.000%, 02/05/09 | | | 25,000,000 | | | 24,951,389 |
1.400%, 02/09/09 | | | 30,000,000 | | | 29,954,500 |
Yorktown Capital, LLC
1.450%, 02/18/09 | | | 69,904,000 | | | 69,768,852 |
| | | | | | |
| | | | | | 585,313,326 |
| | | | | | |
| | |
Asset Backed—Other—2.4% | | | | | | |
Fairway Finance Co., LLC
0.750%, 01/12/09 | | | 15,000,000 | | | 14,996,562 |
1.690%, 02/10/09 | | | 35,000,000 | | | 34,934,278 |
Solitaire Funding, LLC
0.700%, 01/15/09 | | | 6,509,000 | | | 6,507,228 |
| | | | | | |
| | | | | | 56,438,068 |
| | | | | | |
| | |
Chemicals—2.1% | | | | | | |
BASF AG
1.800%, 01/20/09 | | | 35,000,000 | | | 34,966,750 |
1.850%, 01/30/09 | | | 15,000,000 | | | 14,977,646 |
| | | | | | |
| | | | | | 49,944,396 |
| | | | | | |
| | | | | | |
| Security Description | | Face
Amount | | Value* |
| | |
Commercial Banks—6.1% | | | | | | |
Banco Santander (Puerto Rico)
0.400%, 01/15/09 | | $ | 18,000,000 | | $ | 17,997,200 |
San Paolo IMI U.S. Financial Co.
2.360%, 02/02/09 | | | 35,000,000 | | | 34,926,578 |
Santander Central Hispano Finance
2.650%, 03/17/09 | | | 29,000,000 | | | 28,839,896 |
Societe Generale North America, Inc.
0.360%, 01/13/09 | | | 10,000,000 | | | 9,998,800 |
1.430%, 03/16/09 | | | 9,600,000 | | | 9,571,781 |
UBS Finance Delaware, LLC
1.130%, 01/30/09 | | | 10,000,000 | | | 9,990,897 |
0.580%, 02/27/09 | | | 31,213,000 | | | 31,184,336 |
| | | | | | |
| | | | | | 142,509,488 |
| | | | | | |
|
Diversified Financial Services—11.1% |
Bank of America Corp.
2.960%, 03/12/09 | | | 20,000,000 | | | 19,884,889 |
BNP Paribas Finance, Inc.
2.190%, 02/05/09 | | | 10,000,000 | | | 9,978,708 |
2.155%, 02/18/09 | | | 10,000,000 | | | 9,971,267 |
Citigroup Funding, Inc.
2.000%, 01/09/09 | | | 20,000,000 | | | 19,991,111 |
Danske Corp.
1.880%, 01/14/09 | | | 25,000,000 | | | 24,983,028 |
3.375%, 01/23/09 | | | 30,000,000 | | | 29,938,125 |
1.950%, 02/02/09 | | | 15,201,000 | | | 15,174,652 |
3.500%, 02/09/09 | | | 13,200,000 | | | 13,149,950 |
1.280%, 03/30/09 | | | 10,000,000 | | | 9,968,711 |
ING U.S. Funding, LLC
2.855%, 01/08/09 | | | 22,000,000 | | | 21,987,787 |
1.350%, 03/19/09 | | | 25,000,000 | | | 24,927,812 |
Nordea North America
2.110%, 02/24/09 | | | 20,000,000 | | | 19,936,700 |
1.950%, 03/05/09 | | | 40,000,000 | | | 39,863,500 |
| | | | | | |
| | | | | | 259,756,240 |
| | | | | | |
| | |
Federal Agencies—6.1% | | | | | | |
Federal Home Loan Bank
1.345%, 03/20/09 (a) | | | 8,905,000 | | | 8,905,000 |
1.120%, 08/13/09 (a) | | | 9,400,000 | | | 9,400,000 |
1.100%, 08/14/09 (a) | | | 13,825,000 | | | 13,822,926 |
Federal Home Loan Mortgage Corp.
1.331%, 09/25/09 (a) | | | 25,230,000 | | | 25,230,000 |
0.401%, 09/28/09 (a) | | | 15,375,000 | | | 15,369,268 |
Federal National Mortgage Association
1.050%, 02/09/09 | | | 25,000,000 | | | 24,937,709 |
2.000%, 05/14/09 | | | 9,450,000 | | | 9,380,175 |
1.220%, 05/15/09 | | | 15,000,000 | | | 14,931,883 |
1.300%, 06/22/09 | | | 10,000,000 | | | 9,937,889 |
0.008%, 07/01/09 | | | 10,000,000 | | | 9,982,403 |
| | | | | | |
| | | | | | 141,897,253 |
| | | | | | |
*See accompanying notes to financial statements.
MSF-4
Metropolitan Series Fund, Inc.
BlackRock Money Market Portfolio
Schedule of Investments as of December 31, 2008
Commercial Paper—(Continued)
| | | | | | |
| Security Description | | Face
Amount | | Value* |
| | |
Yankee—7.4% | | | | | | |
Bank of Nova Scotia (ScotiaBank)
0.240%, 02/02/09 | | $ | 40,000,000 | | $ | 39,991,467 |
DnB NOR Bank ASA
1.950%, 01/20/09 | | | 25,000,000 | | | 24,974,271 |
1.300%, 03/23/09 | | | 15,000,000 | | | 14,956,125 |
Lloyds TSB Bank, Plc.
3.120%, 01/27/09 | | | 42,000,000 | | | 41,905,360 |
Svenska Handelsbanken, Inc.
1.000%, 01/22/09 | | | 25,000,000 | | | 24,952,750 |
3.240%, 02/02/09 | | | 25,000,000 | | | 24,928,000 |
| | | | | | |
| | | | | | 171,707,973 |
| | | | | | |
Total Commercial Paper
(Identified Cost $1,407,566,744) | | | | | | 1,407,566,744 |
| | | | | | |
|
| Certificate of Deposit—37.3% |
| | |
Commercial Banks—28.6% | | | | | | |
Banco Bilbao Vizcaya (NY)
3.610%, 01/30/09 | | | 30,850,000 | | | 30,850,246 |
Banco Bilbao Vizcaya Argentaria
1.930%, 03/12/09 (a) | | | 12,000,000 | | | 12,000,298 |
2.710%, 04/14/09 (a) | | | 40,000,000 | | | 40,001,702 |
2.770%, 05/12/09 (a) | | | 20,000,000 | | | 20,000,992 |
Banco Santander (NY)
3.700%, 02/24/09 | | | 35,000,000 | | | 35,000,000 |
2.780%, 05/12/09 (a) | | | 18,000,000 | | | 18,000,000 |
Barclays Bank, Plc. (NY)
2.330%, 02/03/09 (a) | | | 25,000,000 | | | 25,000,000 |
2.000%, 02/05/09 | | | 30,000,000 | | | 30,000,000 |
BNP Paribas (NY)
3.050%, 01/15/09 | | | 8,000,000 | | | 8,000,000 |
3.470%, 02/27/09 | | | 35,000,000 | | | 35,000,000 |
2.080%, 03/05/09 | | | 25,000,000 | | | 25,000,000 |
2.290%, 06/08/09 (a) | | | 22,600,000 | | | 22,600,000 |
Citibank N.A.
3.280%, 01/29/09 | | | 31,253,000 | | | 31,253,000 |
1.500%, 03/17/09 (a) | | | 12,000,000 | | | 12,000,000 |
1.330%, 03/31/09 (a) | | | 5,100,000 | | | 5,100,000 |
Deutsche Bank (NY)
3.414%, 01/21/09 (a) | | | 12,400,000 | | | 12,400,000 |
DnB NOR Bank ASA (NY)
2.380%, 02/10/09 (a) | | | 55,000,000 | | | 55,000,000 |
Intesa San Paolo S.p.A. (NY)
1.850%, 03/10/09 (a) | | | 7,550,000 | | | 7,550,000 |
1.450%, 03/11/09 (a) | | | 16,350,000 | | | 16,350,000 |
Mizuho Corporate Bank, Ltd. (NY)
2.000%, 02/12/09 (a) | | | 7,650,000 | | | 7,650,000 |
1.500%, 02/17/09 (a) | | | 16,000,000 | | | 16,000,000 |
Nordea Bank Finland, Plc. (NY)
3.410%, 02/24/09 | | | 8,000,000 | | | 8,000,000 |
Rabobank Nederland NV (NY)
3.010%, 02/19/09 | | | 10,000,000 | | | 10,000,000 |
3.020%, 03/09/09 (a) | | | 25,000,000 | | | 25,046,692 |
| | | | | | |
| Security Description | | Face
Amount | | Value* |
|
Commercial Banks—(Continued) |
Societe Generale (NY)
2.200%, 02/18/09 (a) | | $ | 25,000,000 | | $ | 25,000,000 |
2.230%, 03/04/09 | | | 20,000,000 | | | 20,000,000 |
1.960%, 03/05/09 (a) | | | 12,250,000 | | | 12,250,000 |
1.500%, 03/11/09 (a) | | | 4,600,000 | | | 4,600,000 |
1.600%, 06/17/09 (a) | | | 12,500,000 | | | 12,500,000 |
Svenska Handelsbanken (NY)
2.960%, 02/03/09 (a) | | | 19,000,000 | | | 19,000,482 |
1.400%, 02/12/09 (a) | | | 20,000,000 | | | 20,000,000 |
Toronto-Dominion Bank (NY)
3.030%, 02/11/09 | | | 4,500,000 | | | 4,500,000 |
2.000%, 02/20/09 (a) | | | 20,000,000 | | | 20,000,000 |
2.500%, 06/09/09 (a) | | | 8,500,000 | | | 8,500,000 |
2.420%, 06/11/09 (a) | | | 13,950,000 | | | 13,950,000 |
| | | | | | |
| | | | | | 668,103,412 |
| | | | | | |
| | |
Diversified Financial Services—6.0% | | | | | | |
Lloyds TSB Bank, Plc. (NY)
1.850%, 01/20/09 (a) | | | 20,000,000 | | | 20,000,000 |
1.900%, 02/09/09 (a) | | | 13,000,000 | | | 13,000,000 |
2.080%, 03/05/09 | | | 15,050,000 | | | 15,050,000 |
Royal Bank of Scotland, Plc. (NY)
3.150%, 02/20/09 (a) | | | 10,000,000 | | | 10,000,000 |
3.140%, 03/09/09 (a) | | | 25,000,000 | | | 25,000,000 |
San Paolo IMI S.p.A. (NY)
2.240%, 03/03/09 | | | 20,000,000 | | | 20,000,000 |
3.240%, 03/03/09 (a) | | | 17,000,000 | | | 17,000,000 |
2.850%, 05/12/09 (a) | | | 20,000,000 | | | 20,000,000 |
| | | | | | |
| | | | | | 140,050,000 |
| | | | | | |
| | |
Insurance—0.7% | | | | | | |
New York Life Insurance Co.
2.938%, 04/13/09 (a) (b) | | | 16,520,000 | | | 16,520,000 |
| | | | | | |
| | |
Yankee—2.0% | | | | | | |
Nordea Bank AB
3.891%, 10/23/09 (a) | | | 11,800,000 | | | 11,800,000 |
UBS AG (Stamford)
1.400%, 03/31/09 (a) | | | 35,000,000 | | | 35,000,000 |
| | | | | | |
| | | | | | 46,800,000 |
| | | | | | |
Total Certificate of Deposit
(Identified Cost $871,473,412) | | | | | | 871,473,412 |
| | | | | | |
|
| Medium Term Notes—2.6% |
| | |
Commercial Banks—1.1% | | | | | | |
Bank of Montreal (Chicago)
2.390%, 10/05/09 (a) | | | 14,950,000 | | | 14,950,000 |
HSBC USA, Inc.
5.219%, 10/15/09 (a) | | | 2,740,000 | | | 2,740,000 |
Wachoiva Bank N.A.
4.608%, 08/04/09 (a) | | | 9,400,000 | | | 9,397,518 |
| | | | | | |
| | | | | | 27,087,518 |
| | | | | | |
*See accompanying notes to financial statements.
MSF-5
Metropolitan Series Fund, Inc.
BlackRock Money Market Portfolio
Schedule of Investments as of December 31, 2008
Medium Term Notes—(Continued)
| | | | | | | |
| Security Description | | Face
Amount | | Value* | |
|
Diversified Financial Services—0.5% | |
General Electric Capital Corp.
0.501%, 04/24/09 (a) | | $ | 7,500,000 | | $ | 7,500,000 | |
ING USA Global Funding
2.029%, 09/18/09 (a) | | | 4,440,000 | | | 4,440,000 | |
| | | | | | | |
| | | | | | 11,940,000 | |
| | | | | | | |
| | |
Yankee—1.0% | | | | | | | |
ING Bank NV
2.473%, 09/24/09 (a) | | | 10,000,000 | | | 10,000,000 | |
Lloyds TSB Group, Plc.
2.806%, 08/07/09 (a) | | | 12,700,000 | | | 12,700,000 | |
| | | | | | | |
| | | | | | 22,700,000 | |
| | | | | | | |
Total Medium Term Notes
(Identified Cost $61,727,518) | | | | | | 61,727,518 | |
| | | | | | | |
Total Investments—100.1%
(Identified Cost $2,340,767,674) (c) | | | | | | 2,340,767,674 | |
Liabilities in excess of other assets | | | | | | (2,206,394 | ) |
| | | | | | | |
| Total Net Assets—100% | | | | | $ | 2,338,561,280 | |
| | | | | | | |
| (a) | Variable or Floating Rate Security. Rate disclosed is as of December 31, 2008. |
| (b) | Illiquid securities representing 0.7% of total net assets. |
| (c) | The aggregate cost of investments for federal income tax purposes as of December 31, 2008 was $2,340,767,674. |
The Portfolio adopted the provisions of Statement of Financial Accounting Standards No. 157, “Fair Value Measurements” (FAS 157), effective with the beginning of the Portfolio’s fiscal year. FAS 157 establishes a framework for measuring fair value and expands disclosures about fair value measurements in financial statements. The three levels of the hierarchy under FAS 157 are described below:
Level 1 - quoted prices in active markets for identical securities
Level 2 - other significant observable inputs (including quoted prices for similar securities, interest rates, credit risk, etc.)
Level 3 - significant unobservable inputs (including the Portfolio’s own assumptions in determining the fair value of investments)
The inputs or methodology used for valuing securities are not necessarily an indication of the risk associated with investing in those securities.
The following is a summary of the inputs used to value the Portfolio’s net assets as of December 31, 2008:
| | | | | | |
| Valuation Inputs | | Investments In
Securities | | Other Financial
Instruments* |
Level 1 - Quoted Prices | | $ | 0 | | $ | 0 |
Level 2 - Other Significant Observable Inputs | | | 2,340,767,674 | | | 0 |
Level 3 - Significant Unobservable Inputs | | | 0 | | | 0 |
Total | | $ | 2,340,767,674 | | $ | 0 |
* Other financial instruments are derivative instruments not reflected in the Schedule of Investments, such as futures, forwards, swap contracts and written options, which are valued based on the unrealized appreciation/depreciation on the instrument.
*See accompanying notes to financial statements.
MSF-6
Metropolitan Series Fund, Inc.
BlackRock Money Market Portfolio
Statement of Assets & Liabilities
December 31, 2008
| | | | | | | |
Assets | | | | | | | |
Investments at amortized cost | | | | | $ | 2,340,767,674 | |
Cash | | | | | | 723 | |
Receivable for: | | | | | | | |
Fund shares sold | | | | | | 3,442,454 | |
Accrued interest | | | | | | 3,595,803 | |
Prepaid expenses | | | | | | 275,039 | |
| | | | | | | |
Total Assets | | | | | | 2,348,081,693 | |
Liabilities | | | | | | | |
Payable for: | | | | | | | |
Fund shares redeemed | | $ | 8,585,856 | | | | |
Accrued expenses: | | | | | | | |
Management fees | | | 613,524 | | | | |
Service and distribution fees | | | 231,385 | | | | |
Deferred directors’ fees | | | 50,256 | | | | |
Other expenses | | | 39,392 | | | | |
| | | | | | | |
Total Liabilities | | | | | | 9,520,413 | |
| | | | | | | |
Net Assets | | | | | $ | 2,338,561,280 | |
| | | | | | | |
Net assets consists of: | | | | | | | |
Capital paid in | | | | | $ | 2,338,578,328 | |
Overdistributed net investment income | | | | | | (50,256 | ) |
Accumulated net realized gains | | | | | | 33,208 | |
| | | | | | | |
Net Assets | | | | | $ | 2,338,561,280 | |
| | | | | | | |
| Computation of offering price: | | | | | | | |
Class A | | | | | | | |
Net asset value and redemption price per share ($1,228,992,907 divided by 12,289,929 shares outstanding) | | | | | $ | 100.00 | |
| | | | | | | |
Class B | | | | | | | |
Net asset value and redemption price per share ($1,097,179,835 divided by 10,971,798 shares outstanding) | | | | | $ | 100.00 | |
| | | | | | | |
Class E | | | | | | | |
Net asset value and redemption price per share ($12,388,538 divided by 123,885 shares outstanding) | | | | | $ | 100.00 | |
| | | | | | | |
Statement of Operations
For the Year Ended December 31, 2008
| | | | | | | |
Investment Income | | | | | | | |
Interest | | | | | | $ | 60,482,946 |
| | | | | | | |
Expenses | | | | | | | |
Management fees | | $ | 6,318,394 | | | | |
Service and distribution fees—Class B | | | 1,866,213 | | | | |
Service and distribution fees—Class E | | | 17,621 | | | | |
Directors’ fees and expenses | | | 33,396 | | | | |
Custodian | | | 49,599 | | | | |
Audit and tax services | | | 31,941 | | | | |
Legal | | | 30,937 | | | | |
Printing | | | 89,954 | | | | |
Insurance | | | 186,220 | | | | |
| | | | | | | |
Total expenses | | | 8,624,275 | | | | |
Management fee waivers | | | (100,000 | ) | | | 8,524,275 |
| | | | | | | |
Net Investment Income | | | | | | | 51,958,671 |
| | | | | | | |
Net Increase in Net Assets From Operations | | | | | | $ | 51,958,671 |
| | | | | | | |
See accompanying notes to financial statements.
MSF-7
Metropolitan Series Fund, Inc.
BlackRock Money Market Portfolio
Statements of Changes in Net Assets
| | | | | | | | |
| | | Year ended
December 31,
2008 | | | Year ended
December 31,
2007 | |
From Operations | | | | | | | | |
Net investment income | | $ | 51,958,671 | | | $ | 73,104,647 | |
| | | | | | | | |
Increase in net assets from operations | | | 51,958,671 | | | | 73,104,647 | |
| | | | | | | | |
From Distributions to Shareholders | | | | | | | | |
Net investment income | | | | | | | | |
Class A | | | (33,329,415 | ) | | | (50,923,892 | ) |
Class B | | | (18,318,986 | ) | | | (21,649,891 | ) |
Class E | | | (310,270 | ) | | | (530,864 | ) |
| | | | | | | | |
Total distributions | | | (51,958,671 | ) | | | (73,104,647 | ) |
| | | | | | | | |
Increase in net assets from capital share transactions | | | 702,723,013 | | | | 356,010,434 | |
| | | | | | | | |
Net increase in net assets | | | 702,723,013 | | | | 356,010,434 | |
| | |
Net Assets | | | | | | | | |
Beginning of the period | | | 1,635,838,267 | | | | 1,279,827,833 | |
| | | | | | | | |
End of the period | | $ | 2,338,561,280 | | | $ | 1,635,838,267 | |
| | | | | | | | |
Undistributed (Overdistributed) Net Investment Income | | | | | | | | |
End of the period | | $ | (50,256 | ) | | $ | 27,950 | |
| | | | | | | | |
Other Information:
Capital Shares
Transactions in capital shares were as follows:
| | | | | | | | | | | | | | |
| | | Year ended
December 31, 2008 | | | Year ended
December 31, 2007 | |
| | | Shares | | | $ | | | Shares | | | $ | |
Class A | | | | | | | | | | | | | | |
Sales | | 7,968,963 | | | $ | 796,896,315 | | | 11,717,171 | | | $ | 1,171,715,791 | |
Reinvestments | | 334,466 | | | | 33,446,586 | | | 509,081 | | | | 50,923,892 | |
Redemptions | | (7,297,612 | ) | | | (729,761,176 | ) | | (9,696,563 | ) | | | (969,656,339 | ) |
| | | | | | | | | | | | | | |
Net increase | | 1,005,817 | | | $ | 100,581,725 | | | 2,529,689 | | | $ | 252,983,344 | |
| | | | | | | | | | | | | | |
Class B | | | | | | | | | | | | | | |
Sales | | 11,686,518 | | | $ | 1,168,651,866 | | | 9,686,387 | | | $ | 968,637,226 | |
Reinvestments | | 183,940 | | | | 18,393,964 | | | 216,391 | | | | 21,649,891 | |
Redemptions | | (5,860,942 | ) | | | (586,094,144 | ) | | (8,883,191 | ) | | | (888,319,060 | ) |
| | | | | | | | | | | | | | |
Net increase | | 6,009,516 | | | $ | 600,951,686 | | | 1,019,587 | | | $ | 101,968,057 | |
| | | | | | | | | | | | | | |
Class E | | | | | | | | | | | | | | |
Sales | | 44,287 | | | $ | 4,428,652 | | | 45,750 | | | $ | 4,575,018 | |
Reinvestments | | 3,114 | | | | 311,410 | | | 5,308 | | | | 530,864 | |
Redemptions | | (35,505 | ) | | | (3,550,460 | ) | | (40,468 | ) | | | (4,046,849 | ) |
| | | | | | | | | | | | | | |
Net increase | | 11,896 | | | $ | 1,189,602 | | | 10,590 | | | $ | 1,059,033 | |
| | | | | | | | | | | | | | |
Increase derived from capital share transactions | | | | | $ | 702,723,013 | | | | | | $ | 356,010,434 | |
| | | | | | | | | | | | | | |
See accompanying notes to financial statements.
MSF-8
Metropolitan Series Fund, Inc.
BlackRock Money Market Portfolio
Financial Highlights
| | | | | | | | | | | | | | | | | | | | |
| | | Class A | |
| | | Year ended December 31, | |
| | | 2008 | | | 2007 | | | 2006 | | | 2005 | | | 2004 | |
Net Asset Value, Beginning of Period | | $ | 100.00 | | | $ | 100.00 | | | $ | 100.00 | | | $ | 100.00 | | | $ | 100.00 | |
| | | | | | | | | | | | | | | | | | | | |
Income From Investment Operations | | | | | | | | | | | | | | | | | | | | |
Net investment income | | | 2.82 | | | | 4.95 | | | | 4.70 | | | | 2.85 | | | | 0.98 | |
| | | | | | | | | | | | | | | | | | | | |
Total from investment operations | | | 2.82 | | | | 4.95 | | | | 4.70 | | | | 2.85 | | | | 0.98 | |
| | | | | | | | | | | | | | | | | | | | |
Less Distributions | | | | | | | | | | | | | | | | | | | | |
Distributions from net investment income | | | (2.82 | ) | | | (4.95 | ) | | | (4.70 | ) | | | (2.85 | ) | | | (0.98 | ) |
| | | | | | | | | | | | | | | | | | | | |
Total distributions | | | (2.82 | ) | | | (4.95 | ) | | | (4.70 | ) | | | (2.85 | ) | | | (0.98 | ) |
| | | | | | | | | | | | | | | | | | | | |
Net Asset Value, End of Period | | $ | 100.00 | | | $ | 100.00 | | | $ | 100.00 | | | $ | 100.00 | | | $ | 100.00 | |
| | | | | | | | | | | | | | | | | | | | |
Total Return (%) | | | 2.9 | | | | 5.1 | | | | 4.8 | | | | 2.9 | | | | 1.0 | |
Ratio of operating expenses to average net assets (%) | | | 0.34 | | | | 0.40 | | | | 0.38 | | | | 0.41 | | | | 0.42 | |
Ratio of operating expenses to average net assets without giving effect to the contractual expense agreement would have been (%) (a) | | | 0.34 | | | | 0.40 | | | | N/A | | | | N/A | | | | N/A | |
Ratio of net investment income to average net assets (%) | | | 2.79 | | | | 4.97 | | | | 4.79 | | | | 2.83 | | | | 0.97 | |
Net assets, end of period (000) | | $ | 1,228,993 | | | $ | 1,128,411 | | | $ | 875,428 | | | $ | 429,019 | | | $ | 469,674 | |
| | | | | | | | | | | | | | | | | | | | |
| | | Class B | |
| | | Year ended December 31, | |
| | | 2008 | | | 2007 | | | 2006 | | | 2005 | | | 2004 | |
Net Asset Value, Beginning of Period | | $ | 100.00 | | | $ | 100.00 | | | $ | 100.00 | | | $ | 100.00 | | | $ | 100.00 | |
| | | | | | | | | | | | | | | | | | | | |
Income From Investment Operations | | | | | | | | | | | | | | | | | | | | |
Net investment income | | | 2.57 | | | | 4.70 | | | | 4.45 | | | | 2.60 | | | | 0.73 | |
| | | | | | | | | | | | | | | | | | | | |
Total from investment operations | | | 2.57 | | | | 4.70 | | | | 4.45 | | | | 2.60 | | | | 0.73 | |
| | | | | | | | | | | | | | | | | | | | |
Less Distributions | | | | | | | | | | | | | | | | | | | | |
Distributions from net investment income | | | (2.57 | ) | | | (4.70 | ) | | | (4.45 | ) | | | (2.60 | ) | | | (0.73 | ) |
| | | | | | | | | | | | | | | | | | | | |
Total distributions | | | (2.57 | ) | | | (4.70 | ) | | | (4.45 | ) | | | (2.60 | ) | | | (0.73 | ) |
| | | | | | | | | | | | | | | | | | | | |
Net Asset Value, End of Period | | $ | 100.00 | | | $ | 100.00 | | | $ | 100.00 | | | $ | 100.00 | | | $ | 100.00 | |
| | | | | | | | | | | | | | | | | | | | |
Total Return (%) | | | 2.6 | | | | 4.8 | | | | 4.5 | | | | 2.6 | | | | 0.7 | |
Ratio of operating expenses to average net assets (%) | | | 0.59 | | | | 0.65 | | | | 0.63 | | | | 0.66 | | | | 0.67 | |
Ratio of operating expenses to average net assets without giving effect to the contractual expense agreement would have been (%) (a) | | | 0.59 | | | | 0.65 | | | | N/A | | | | N/A | | | | N/A | |
Ratio of net investment income to average net assets (%) | | | 2.45 | | | | 4.71 | | | | 4.50 | | | | 2.84 | | | | 0.74 | |
Net assets, end of period (000) | | $ | 1,097,180 | | | $ | 496,228 | | | $ | 394,260 | | | $ | 273,052 | | | $ | 78,809 | |
| Please | see following page for Financial Highlights footnote legend. |
See accompanying notes to financial statements.
MSF-9
Metropolitan Series Fund, Inc.
BlackRock Money Market Portfolio
Financial Highlights
| | | | | | | | | | | | | | | | | | | | |
| | | Class E | |
| | | Year ended December 31, | |
| | | 2008 | | | 2007 | | | 2006 | | | 2005 | | | 2004 | |
Net Asset Value, Beginning of Period | | $ | 100.00 | | | $ | 100.00 | | | $ | 100.00 | | | $ | 100.00 | | | $ | 100.00 | |
| | | | | | | | | | | | | | | | | | | | |
Income From Investment Operations | | | | | | | | | | | | | | | | | | | | |
Net investment income | | | 2.67 | | | | 4.80 | | | | 4.55 | | | | 2.70 | | | | 0.83 | |
| | | | | | | | | | | | | | | | | | | | |
Total from investment operations | | | 2.67 | | | | 4.80 | | | | 4.55 | | | | 2.70 | | | | 0.83 | |
| | | | | | | | | | | | | | | | | | | | |
Less Distributions | | | | | | | | | | | | | | | | | | | | |
Distributions from net investment income | | | (2.67 | ) | | | (4.80 | ) | | | (4.55 | ) | | | (2.70 | ) | | | (0.83 | ) |
| | | | | | | | | | | | | | | | | | | | |
Total distributions | | | (2.67 | ) | | | (4.80 | ) | | | (4.55 | ) | | | (2.70 | ) | | | (0.83 | ) |
| | | | | | | | | | | | | | | | | | | | |
Net Asset Value, End of Period | | $ | 100.00 | | | $ | 100.00 | | | $ | 100.00 | | | $ | 100.00 | | | $ | 100.00 | |
| | | | | | | | | | | | | | | | | | | | |
Total Return (%) | | | 2.7 | | | | 4.9 | | | | 4.7 | | | | 2.7 | | | | 0.8 | |
Ratio of operating expenses to average net assets (%) | | | 0.49 | | | | 0.55 | | | | 0.53 | | | | 0.56 | | | | 0.57 | |
Ratio of operating expenses to average net assets without giving effect to the contractual expense agreement would have been (%) (a) | | | 0.49 | | | | 0.55 | | | | N/A | | | | N/A | | | | N/A | |
Ratio of net investment income to average net assets (%) | | | 2.64 | | | | 4.81 | | | | 4.57 | | | | 2.66 | | | | 0.88 | |
Net assets, end of period (000) | | $ | 12,389 | | | $ | 11,199 | | | $ | 10,140 | | | $ | 8,569 | | | $ | 11,619 | |
| (a) | See Note 4 of the Notes to Financial Statements. |
See accompanying notes to financial statements.
MSF-10
Metropolitan Series Fund, Inc.
BlackRock Money Market Portfolio
Notes to Financial Statements—December 31, 2008
Metropolitan Series Fund, Inc. (the “Fund”) is organized as a corporation under the laws of Maryland pursuant to Articles of Incorporation filed on November 23, 1982, as amended, and registered under the Investment Company Act of 1940, as amended (the “1940 Act”), as an open-end investment company. The Fund is a “series” type of mutual fund, which issues separate series of stock. Each series represents an interest in a separate portfolio of Fund investments. The BlackRock Money Market Portfolio (the “Portfolio”) is a diversified series of the Fund. Shares in the Fund are not offered directly to the general public and are currently available only to separate accounts established by Metropolitan Life Insurance Company (“MetLife”), New England Life Insurance Company, General American Life Insurance Company (“General American”), The MetLife Investors Group of Insurance Companies, MetLife Insurance Company of Connecticut and other affiliated insurance companies (collectively, the “Insurance Companies”) and to certain eligible qualified retirement plans (“Qualified Plans”), as an investment vehicle for variable life insurance, group annuity or variable annuity products of these insurance companies or Qualified Plans, although the Portfolio is not available to all such separate accounts and Qualified Plans. The Portfolio’s shares may be divided into different classes. Currently, the classes being offered by the Portfolio are named Class A, Class B and Class E. The classes of the Portfolio’s shares are identical, except that certain additional charges (Rule 12b-1 fees) are made against Class B and Class E shares. Investment income, realized and unrealized capital gains and losses, the common expenses of the Portfolio and certain Portfolio-level expense reductions, if any, are allocated daily, on a pro rata basis, to each class based on the relative net assets of each class to the total net assets of the Portfolio.
| 2. | SIGNIFICANT ACCOUNTING POLICIES: |
The preparation of financial statements in conformity with accounting principles generally accepted in the United States of America (“GAAP”) requires management to make estimates and assumptions that affect the reported amounts of assets and liabilities and disclosure of contingent assets and liabilities as of the date of the financial statements and the reported amounts of income and expenses during the reporting period. Actual results could differ from those estimates.
The following is a summary of significant accounting policies consistently followed by the Portfolio in the preparation of its financial statements. The policies are in conformity with GAAP.
Investment Valuation:
As permitted by Rule 2a-7 under the 1940 Act, and subject to certain conditions therein, the Portfolio employs the amortized cost method of security valuation that the Fund’s Board of Directors (the “Board” or “Directors”) has determined approximates the fair market net asset value per share of the Portfolio. The Board monitors the deviations between the Portfolio’s net asset value per share, as determined by using available market quotations, and its amortized cost price per share. If the deviation exceeds 1/2 of 1%, the Board will consider what action, if any, should be initiated.
Subject to the Board’s oversight, the Board has delegated the day-to-day oversight of pricing matters, including determinations in good faith under the Fund’s procedures the fair value of securities for which current market quotations are not readily available to the subadviser of the Portfolio.
Investment Transactions and Related Investment Income:
Portfolio security transactions are recorded on the trade date. Interest income, which includes amortization of premium and accretion of discount on debt securities, is recorded on the accrual basis. Realized gains and losses on investments and unrealized appreciation and depreciation are determined on the identified cost basis, which is the same basis used for federal income tax purposes.
Repurchase Agreements:
The Portfolio, through the custodian or a subcustodian, receives delivery of the underlying securities collateralizing repurchase agreements. The Portfolio requires the custodian to take possession, to have legally segregated in the Federal Reserve Book Entry System, or to have segregated within the custodian’s vault, all securities held as collateral for repurchase agreements. It is the Portfolio’s policy that the market value of the collateral be at least equal to 100% of the repurchase price in the case of a repurchase agreement of one-day duration and 102% on all other repurchase agreements. The Portfolio’s subadviser is responsible for determining that the value of the collateral is at all times at least equal to the repurchase price. In connection with transactions in repurchase agreements, if the seller defaults and the value of the collateral declines or if the seller enters an insolvency proceeding, realization of the collateral by the Portfolio may be delayed, limited or wholly denied.
MSF-11
Metropolitan Series Fund, Inc.
BlackRock Money Market Portfolio
Notes to Financial Statements—December 31, 2008—(Continued)
“When-Issued” Securities:
Purchasing securities “when-issued” is a forward commitment by the Portfolio to buy a security. The estimated amount of the Portfolio’s payment obligation and the security’s interest rate are determined when the commitment is made, even though no interest accrues until the security is issued, which is generally 15 to 120 days later. The Portfolio will segregate liquid assets with its custodian sufficient at all times to satisfy these commitments. If the value of the security is less when delivered than when the commitment was made, the Portfolio will suffer a loss.
Federal Income Taxes:
It is the Portfolio’s policy to comply with the requirements of the Internal Revenue Code of 1986, as amended (the “Code”), and regulations thereunder, applicable to regulated investment companies and to distribute, with respect to each taxable year, all of its taxable income to shareholders. Therefore, no federal income tax provision is required. The Portfolio is subject to the provisions of the Financial Accounting Standards Board Interpretation (“FASB”) No. 48, Accounting for Uncertainties in Income Taxes (FIN 48). FIN 48 sets forth a minimum threshold for financial statement recognition of the benefit of a tax position taken or expected to be taken in a tax return. The implementation of FIN 48 did not result in any unrecognized tax benefits in the accompanying financial statements. Each of the Portfolio’s federal tax returns for the prior three fiscal years remains subject to examination by the Internal Revenue Service.
As of December 31, 2008, the Portfolio had no capital loss carryovers.
Pursuant to Section 852 of the Code, the Portfolio designated the amount shown below under Long Term Gain as capital gain dividends for its taxable year ended December 31, 2008. The tax character of distributions paid for the periods ended December 31, 2008 and 2007 was as follows.
| | | | | | | | | | | | | | | | | | | | | | |
| Ordinary Income | | Long Term Gain | | Return of Capital | | Total |
| 2008 | | 2007 | | 2008 | | 2007 | | 2008 | | 2007 | | 2008 | | 2007 |
| $ | 51,958,671 | | $ | 73,104,647 | | $ | — | | $ | — | | $ | — | | $ | — | | $ | 51,958,671 | | $ | 73,104,647 |
As of December 31, 2008, the components of distributable earnings (accumulated losses) on a federal income tax basis were as follows:
| | | | | | | | | | | | | |
Undistributed
Ordinary
Income | | Undistributed
Long Term
Gain | | Unrealized
Appreciation | | Loss
Carryforwards | | Total |
| $ | 33,208 | | $ | — | | $ | — | | $ | — | | $ | 33,208 |
Dividends and Distributions to Shareholders:
The BlackRock Money Market Portfolio dividends are declared daily to shareholders of record at the time and are paid monthly. Net realized gains from security transactions (if any) are generally distributed annually to shareholders. The timing and characterization of certain income and capital gains distributions are determined in accordance with federal tax regulations that may differ from GAAP. Permanent book and tax basis differences relating to shareholder distributions will result in reclassification between under/over distributed net investment income, accumulated net realized gains/losses and paid in capital.
MSF-12
Metropolitan Series Fund, Inc.
BlackRock Money Market Portfolio
Notes to Financial Statements—December 31, 2008—(Continued)
| 3. | INVESTMENT MANAGEMENT FEES AND OTHER TRANSACTIONS WITH AFFILIATES: |
Investment Management Agreement:
MetLife Advisers, LLC (“MetLife Advisers”) is the investment adviser to the Portfolio. The Fund has entered into an investment management agreement with MetLife Advisers with respect to the Portfolio. For providing investment management services to the Portfolio, MetLife Advisers receives monthly compensation at the following annual rates:
| | | | |
Management
Fees earned by
MetLife Advisers
for the year ended
December 31, 2008 | | Annual
percentage
rates paid to
MetLife Advisers | | Based on Portfolios
average daily net asset
levels |
| $6,318,394 | | 0.350% | | Of the first $1 billion |
| | 0.300% | | Of the next $1 billion |
| | 0.250% | | On amounts in excess of $2 billion |
Certain officers and directors of the Fund may also be officers of MetLife Advisers; however, such officers and directors receive no compensation from the Fund.
MetLife Advisers has entered into an investment subadvisory agreement with respect to the Portfolio. BlackRock Advisors, LLC is compensated by MetLife Advisers to provide subadvisory services for the Portfolio.
Management Fee Waivers:
Pursuant to an expense agreement, MetLife Advisers has agreed, for the period May 1, 2008 to April 30, 2009, to reduce its advisory fees set out above under “Investment Management Agreement” for each class of the Portfolio as follows:
| | |
Annual Percentage
Rate Reduction | | Average Daily
Net Asset Value
Levels |
| 0.005% | | First $500 million |
| 0.015% | | Next $500 million |
A similar expense agreement was in place for the period May 1, 2007 through April 30, 2008. Amounts waived for the year ended December 31, 2008 are shown as management fee waivers in the Statement of Operations.
Service and Distribution Fees:
The Fund has adopted a Distribution and Service Plan under Rule 12b-1 of the 1940 Act for the Portfolio’s Class B and E shares. Under the Distribution and Service Plan, the Class B and E shares of the Portfolio pay a fee to compensate the Insurance Companies (or their affiliates) and other broker-dealers and financial intermediaries involved in the offer and sale of Portfolio shares for promoting or selling and servicing the Class B and E shares. The fees under the Distribution and Service Plan for each class of the Portfolio’s shares are calculated as a percentage of the Portfolio’s average daily net assets that are attributable to that Class. Currently, the fee is 0.25% per year for Class B shares and 0.15% per year for Class E shares. Amounts paid by the Portfolio for the year ended December 31, 2008 are shown as Service and Distribution fees in the Statement of Operations.
| 4. | U.S. TREASURY TEMPORARY GUARANTEE PROGRAM: |
The Portfolio currently participates in the U.S. Department of the Treasury’s Temporary Guarantee Program for Money Market Funds (the “Program”). Subject to certain conditions and limitations, amounts held in the Portfolio by policyholders through a Separate Account as of the close of business on September 19, 2008 are guaranteed against loss under the Program in the event that the market-value based net asset value per share of the Portfolio falls below $99.50 and the Portfolio subsequently liquidates (a “Guarantee Event”). In the event that a Guarantee Event is triggered, a shareholder’s shares covered by the Program will be the lesser of (i) the amount held in the Portfolio as of close of business on September 19, 2008, or (ii) the amount held in the Portfolio on the date the Program’s guarantee is triggered. In this event and subject to the limitations of the Program, a policyholder who has remained invested in the Portfolio since September 19, 2008 would receive an increase in his or her account value with respect to each covered share of the Portfolio, equal to the difference between the amount received in the liquidation and $100.00 per share. As of December 31, 2008, assets available to the Program to support all participating money market funds do not exceed approximately $50 billion and the Program covers approximately $3 trillion in assets held in money market funds. The Program’s guarantee only applies to policyholders invested in the Portfolio through a Separate Account as of the close of business on September 19, 2008.
The Program will end on April 30, 2009; however, the Secretary of the Treasury may extend the Program through a date no later than September 18, 2009. If the Program is further extended, the Board will consider whether to continue to participate in the Program at that time. Any additional cost to participate in the extended Program may also be borne by the Portfolio.
MSF-13
Metropolitan Series Fund, Inc.
BlackRock Money Market Portfolio
Report of Independent Registered Public Accounting Firm
To the Shareholders and Board of Directors of Metropolitan Series Fund, Inc.:
We have audited the accompanying statement of assets and liabilities, including the schedule of investments, of the BlackRock Money Market Portfolio (one of the portfolios constituting the Metropolitan Series Fund, Inc.) (the “Fund”) as of December 31, 2008, and the related statement of operations for the year then ended, the statements of changes in net assets for each of the two years in the period then ended, and the financial highlights for each of the five years in the period then ended. These financial statements and financial highlights are the responsibility of the Fund’s management. Our responsibility is to express an opinion on these financial statements and financial highlights based on our audits.
We conducted our audits in accordance with the standards of the Public Company Accounting Oversight Board (United States). Those standards require that we plan and perform the audit to obtain reasonable assurance about whether the financial statements and financial highlights are free of material misstatement. The Fund is not required to have, nor were we engaged to perform, an audit of its internal control over financial reporting. Our audits included consideration of internal control over financial reporting as a basis for designing audit procedures that are appropriate in the circumstances, but not for the purpose of expressing an opinion on the effectiveness of the Fund’s internal control over financial reporting. Accordingly, we express no such opinion. An audit also includes examining, on a test basis, evidence supporting the amounts and disclosures in the financial statements, assessing the accounting principles used and significant estimates made by management, as well as evaluating the overall financial statement presentation. Our procedures included confirmation of securities owned as of December 31, 2008, by correspondence with the custodian and brokers; where replies were not received from brokers, we performed other auditing procedures. We believe that our audits provide a reasonable basis for our opinion.
In our opinion, the financial statements and financial highlights referred to above present fairly, in all material respects, the financial position of the BlackRock Money Market Portfolio of the Metropolitan Series Fund, Inc. as of December 31, 2008, the results of its operations for the year then ended, the changes in its net assets for each of the two years in the period then ended, and the financial highlights for each of the five years in the period then ended, in conformity with accounting principles generally accepted in the United States of America.
Deloitte & Touche LLP
Boston, Massachusetts
February 25, 2009
MSF-14
Metropolitan Series Fund, Inc.
Directors and Officers
The Fund’s Directors review actions of the Fund’s investment adviser and subadvisers, and decide upon matters of general policy. The Fund’s officers supervise the daily business operations of the Fund. The Board of Directors and the Fund’s officers are listed below. Each Director is responsible for overseeing all 38 Portfolios of the Fund. There is no limit to the term a Director may serve. Directors serve until their resignation, retirement or removal in accordance with the Fund’s organizational documents and policies adopted by the Board from time to time. Officers hold office at the pleasure of the Board or until the election or appointment and the qualification of a successor. The address of the Directors and officers is c/o Metropolitan Series Fund, Inc., 501 Boylston Street, Boston, MA 02116.
Interested Directors(1)
Each Director below is an “interested person” (as defined by the 1940 Act) with respect to the Fund in that Ms. Forget is an employee of MetLife and Mr. Typermass is a former employee of MetLife and owns securities issued by MetLife, Inc., the ultimate parent company of MetLife Advisers.
| | | | | | | | |
Name, Address and Age | | Current
position(s)
with Fund | | Position(s)
held since | | Principal occupations
over past five years, including other directorships(2) | | Number of
Portfolios in
Fund Complex
Overseen by
Director(3) |
Elizabeth M. Forget Age: 42 | | Director, Chairman of the Board, President and Chief Executive Officer | | 2006 | | Senior Vice President (since 2007), MetLife, Inc.; President, Met Investors Advisory, LLC; Trustee and President, Met Investors Series Trust; Executive Vice President, MetLife Investors Group, Inc.; President, Chief Executive Officer and Chair of the Board of Managers (since 2006), MetLife Advisers; President, Met Investors Advisory, LLC. | | 87 |
| | | | |
Arthur G. Typermass Age: 71 | | Director | | 1998 | | Formerly, Senior Vice President and Treasurer, MetLife. | | 38 |
Non-Interested Directors(1)
Each Director below is not an “interested person” (as defined by the 1940 Act) with respect to the Fund (collectively, the “Independent Directors”).
| | | | | | | | |
Name, Address and Age | | Current
position(s)
with Fund | | Position(s)
held since | | Principal occupations
over past five years, including other directorships(2) | | Number of
Portfolios in
Fund Complex
Overseen by
Director(3) |
Steve A. Garban† Age: 71 | | Director | | 1985 | | Formerly, Chief Financial Officer, Senior Vice President Finance and Operations and Treasurer (Emeritus), The Pennsylvania State University. | | 38 |
| | | | |
Linda B. Strumpf Age: 61 | | Director | | 2000 | | Vice President and Chief Investment Officer, Ford Foundation. | | 38 |
| | | | |
Michael S. Scott Morton† Age: 71 | | Director | | 1993 | | Jay W. Forrester Professor of Management (Emeritus) at Sloan School of Management, MIT. | | 38 |
| | | | |
H. Jesse Arnelle Age: 75 | | Director | | 2001 | | Formerly, Counsel, Womble Carlyle Sandrie & Rice; Director, Textron Inc. (global multi- industry company)*; formerly, Director, Gannet Co. Inc. (diversified news and information company)*; formerly, Director, Eastman Chemical Company (global chemical company)*; formerly, Director, Waste Management, Inc.*; formerly, Director, Armstrong Holdings Inc. (parent company of floor and ceiling products business)*; formerly, Director, FPL Group Inc. (public utility holding company)*; Director, URS Corporation (engineering design services firm)*. | | 38 |
MSF-15
Metropolitan Series Fund, Inc.
Directors and Officers—(Continued)
| | | | | | | | |
Name, Address and Age | | Current
position(s)
with Fund | | Position(s)
held since | | Principal occupations
over past five years, including other directorships(2) | | Number of
Portfolios in
Fund Complex
Overseen by
Director(3) |
Nancy Hawthorne Age: 57 | | Director | | 2003 | | Chief Executive Officer, Clerestory LLC (corporate financial advisor); Director, Avid Technologies (computer software company)*; formerly, Chairman of the Board of Avid Technologies; formerly, Board of Advisors, L. Knife & Sons, Inc. (beverage distributor); formerly, Trustee, New England Zenith Fund (“Zenith Fund”)**; formerly, Chief Executive Officer and Managing Partner, Hawthorne, Krauss and Associates (corporate financial advisor); formerly, Chief Financial Officer and Executive Vice President, Continental Cablevision, subsequently renamed MediaOne (cable television company); formerly, Director, Life F/X, Inc.; formerly, Chairman of the Board, WorldClinic (distance medicine company); formerly, Director, Perini Corporation (construction company)*; formerly, Director, CGU (property and casualty insurance company); formerly, Director, Beacon Power Corporation (energy company)*. | | 38 |
| | | | |
John T. Ludes Age: 72 | | Director | | 2003 | | President, LFP Properties (consulting firm); Formerly, Trustee, Zenith Fund**; formerly, Vice Chairman, President and Chief Operating Officer, Fortune Brands/American Brands (global conglomerate); formerly, President and CEO, Acushnet Company (athletic equipment company). | | 38 |
Officers(1)
| | | | | | | | |
Name and address | | Age | | Current
position(s)
with Fund | | Position(s)
held since | | Principal occupations over past five years(2) |
| Jeffrey L. Bernier | | 37 | | Senior Vice President | | 2008 | | Vice President (since 2008), MetLife, Inc.; Vice President (since 2008), MetLife; Senior Vice President (since 2008), MetLife Advisers; formerly, Director and Senior Investment Analyst (2004 to 2007), John Hancock Financial Services; formerly, Assistant Vice President (2000 to 2001), Wachovia Securities. |
| | | | |
| Alan C. Leland | | 56 | | Senior Vice President | | 2005 | | Treasurer and Chief Financial Officer, MetLife Advisers, LLC; Treasurer (since 2005), Met Investors Advisory, LLC; Vice President (since 2004), Met Investors Advisory, LLC; Vice President (since 2003), MetLife, Inc.; Vice President, MetLife; Senior Vice President, NELICO. |
| | | | |
| Peter Duffy | | 53 | | Vice President
and Treasurer | | 2000 | | Senior Vice President, MetLife Advisers; Second Vice President (since 2003), NELICO; Vice President, MetLife (since 2004); Vice President (since 2004), MetLife, Inc.; formerly, Vice President and Treasurer, Zenith Fund**. |
| | | | |
| Jeffrey P. Halperin | | 41 | | Chief
Compliance Officer | | 2007 | | Vice President (since 2006), MetLife, Inc.; Vice President (since 2006), MetLife; Chief Compliance Officer (since 2006), Met Investors Series Trust, MetLife Advisers, Met Investors Advisory, LLC and MetLife Investment Advisors Company, LLC. |
| * | Indicates a directorship with a registered investment company or a company subject to the reporting requirements of the Securities Exchange Act of 1934, as amended. |
| ** | The Zenith Fund deregistered with the Securities and Exchange Commission (“SEC”) in 2004. |
| (†) | Served as a trustee, director and/or officer of one or more of the following companies, each of which had a direct or indirect advisory relationship with MetLife Advisers or its affiliates prior to January 31, 2005: State Street Research Financial Trust, State Street Research Income Trust, State Street Research Money Market Trust, State Street Research Institutional Funds, State Street Research Capital Trust, State Street Research Master Investment Trust, State Street Research Equity Trust, State Street Research Securities Trust and State Street Research Exchange Trust (collectively, the “State Street Research Funds”). |
| (1) | During the period shown, each Director of the Fund served as a Trustee of Metropolitan Series Fund II, a registered investment company that ceased investment operations in June of 2008 and has applied for deregistration under the Investment Company Act of 1940. During this period, each officer of the Fund served in the same position with Metropolitan Series Fund II. |
| (2) | Previous positions during the past five years with the Fund; Met Investors Series Trust; MetLife; MetLife, Inc.; MetLife Advisers; Met Investors Advisory, LLC; Zenith Fund; NELICO; or New England Securities Corporation are omitted if not materially different. |
| (3) | The Fund Complex includes the Fund (38 portfolios) and Met Investors Series Trust (49 portfolios). |
MSF-16
Metropolitan Series Fund, Inc.
BlackRock Money Market Portfolio
Board Approval of Advisory and Subadvisory Agreements
The Fund’s Contract Review Committees of the Board of Directors (the “Board” or the “Directors”) typically meet in early fall to review the Portfolios’ advisory agreements (the “Advisory Agreements”) and subadvisory agreements (the “Subadvisory Agreements,” and, together with the Advisory Agreements, the “Agreements”) and determine whether to recommend that the full Board approve the continuation of the Agreements for an additional one-year period. (Following the initial approval of an Agreement for a new Portfolio or with a new adviser or subadviser, such annual reviews are not required until 2 years following the execution of such Agreement.) After each Committee has made its recommendations, the full Board, including the Independent Directors, determines whether to approve the continuation of each of the Agreements. In addition, the Board, including the Independent Directors, considers matters bearing on the Agreements at most of its other meetings throughout the year and regularly interviews various individuals at MetLife Advisers responsible for the management of the Portfolios. The Directors also interview selected investment managers and other professionals at the subadvisers at various times throughout the year.
The Directors receive all materials that they or MetLife Advisers, the Fund’s investment adviser, and the subadvisers believe to be reasonably necessary for the Directors to evaluate the Agreements and determine whether to approve the continuation of the Agreements. These materials generally include, among other items, (i) information on the investment performance of the Portfolios and the performance of peer groups of funds and the Portfolios’ performance benchmarks, (ii) information on the Portfolios’ advisory and subadvisory fees and other expenses, including information comparing the Portfolios’ expenses to those of peer groups of funds and information about any applicable expense caps and fee “breakpoints,” (iii) sales and redemption data, (iv) information related to the profitability of the Agreements to MetLife Advisers and certain of the subadvisers, and potential “fall-out” or ancillary benefits that MetLife Advisers, the subadvisers or their affiliates may receive as a result of their relationships with the Fund and (v) information obtained through the subadvisers’ responses to certain requests from MetLife Advisers and the Directors and MetLife Advisers’ responses to requests from the Directors. The Directors may also consider other information such as (vi) MetLife Advisers’ and the subadvisers’ financial results and condition, (vii) each Portfolio’s investment objectives and strategies and the size, education and experience of the investment staffs of MetLife Advisers and the relevant subadvisers and their use of technology and external research, (viii) the allocation of the Portfolios’ brokerage, if any, including allocations to brokers affiliated with the subadvisers and the use of “soft” commission dollars to pay Portfolio expenses and to pay for research and other similar services, (ix) the resources devoted to, and the record of compliance with, the Portfolios’ investment policies and restrictions, policies on personal securities transactions and other compliance policies, (x) the responses of MetLife Advisers, the subadvisers and/or their affiliates to certain legal and regulatory proceedings and (xi) the economic outlook generally and for the mutual fund industry in particular. Throughout the process, the Directors have the opportunity to ask questions of and request additional materials from MetLife Advisers and the subadvisers.
Following meetings of each Contract Review Committee on September 10, 2008, the Board, including the Independent Directors, at its November 6-7, 2008 meeting, approved the continuation through December 31, 2009 of the Advisory Agreements for each Portfolio of the Fund and the Subadvisory Agreements for each Portfolio other than the Zenith Equity Portfolio and Asset Allocation Portfolios (which do not have subadvisers) and the Van Eck Global Natural Resources Portfolio, Met/Dimensional International Small Cap Portfolio and Loomis Sayles Small Cap Growth Portfolio (formerly known as the Franklin Templeton Small Cap Growth Portfolio). The Agreements approved for continuation are referred to below as the “Continued Agreements.”
In considering whether to approve the continuation of the Continued Agreements, the Directors, including the Independent Directors, did not identify any single factor as determinative, and each weighed the various factors as he or she deemed appropriate. The Directors considered the following matters in connection with their approval of the Continued Agreements:
The nature, extent and quality of the services provided to the relevant Portfolios under the Continued Agreements. The Directors considered the nature, extent and quality of the services provided by MetLife Advisers, the relevant subadvisers (if any) and their affiliates (each, an “Adviser,” and, collectively, the “Advisers”) to the relevant Portfolios pursuant to the Continued Agreements and the resources dedicated to these Portfolios by the Advisers. In particular, the Directors considered the Advisers’ abilities to attract and retain highly qualified investment professionals. With respect to MetLife Advisers, the Directors considered (for each Portfolio other than the Zenith Equity and Asset Allocation Portfolios) that MetLife Advisers is (i) ultimately responsible for the performance of such Portfolios; (ii) ultimately responsible for the establishment of the investment strategies of each such Portfolio, primarily through its recommendations to the Board regarding the hiring and selection of subadvisers; (iii) responsible for the hiring and selection, subject to Board approval, of subadvisers; and (iv) responsible for maintaining a program of Subadviser oversight reasonably designed to ensure that the subadvisers have reasonable compliance policies and procedures in place. The Directors also considered that MetLife Advisers provides a full range of day-to-day administrative services for the Portfolios involving all aspects of such Portfolios’ day-to-day operations (other than portfolio management). With respect to the Zenith Equity and Asset Allocation Portfolios, the Directors considered both the portfolio management services and the administrative services provided by MetLife Advisers. After reviewing
MSF-17
Metropolitan Series Fund, Inc.
BlackRock Money Market Portfolio
Board Approval of Advisory and Subadvisory Agreements—(Continued)
these and related factors, the Directors concluded, within the context of their overall conclusions regarding each of the Continued Agreements, that the nature, extent and quality of services provided supported the renewal of these Agreements.
Investment performance of the relevant Portfolios. The Directors reviewed information about the performance of the relevant Portfolios over various time periods, including information prepared by an independent third party that compared the performance of the Portfolios to the performance of peer groups of funds and performance benchmarks. The Directors also reviewed a description of the third party’s methodology for identifying a Portfolio’s peer group(s) for purposes of performance and expense comparisons.
In the case of each relevant Portfolio that had performance that lagged its peer group(s) for certain periods, the Directors concluded that other factors relevant to performance were sufficient, in light of other considerations, to warrant renewal of the Continued Agreements relating to such Portfolio. These factors varied from Portfolio to Portfolio, but included one or more of the following: (i) that such Portfolio’s performance, although lagging in certain recent periods, was stronger over the longer term; (ii) that the underperformance was attributable, to a significant extent, to investment decisions that were reasonable and consistent with the Portfolio’s investment objective(s) and policies and that the Portfolio was performing within the range of reasonable expectations, given market conditions and the Portfolio’s investment objective(s) and policies; (iii) that the Portfolio’s performance was competitive when compared to other relevant performance benchmarks or peer groups; and (iv) that MetLife Advisers and/or the relevant subadviser (if any) had taken or was taking steps designed to help improve the Portfolio’s investment performance (including, in the case of certain Portfolios, that MetLife Advisers was formulating possible proposals, for presentation to the Board in November 2008, to replace the Portfolio’s subadviser or to merge the Portfolio into another Portfolio with a similar investment objective and better investment performance).
The Directors also considered the investment performance of the Advisers and their reputations generally, the historical responsiveness of the Advisers to Director concerns about performance and the willingness of the Advisers to take steps intended to improve performance.
After reviewing these and related factors, the Directors concluded, within the context of their overall conclusions regarding each of the Continued Agreements, that the investment performance of each relevant Portfolio and Adviser was sufficient, in light of other considerations, to warrant the renewal of the Continued Agreements.
The costs of the services to be provided and profits to be realized by the Advisers and their affiliates from their relationships with the Portfolios. The Directors considered the fees charged by MetLife Advisers to the Portfolios for advisory services and, with respect to the subadvised Portfolios, by such subadvisers to MetLife Advisers for subadvisory services (such advisory and subadvisory fees (if any), collectively, “Fees”), as well as the total expense levels of the Portfolios. This information included comparisons (provided by an independent third party) of the Portfolios’ advisory fees and total expense levels to those of their peer groups. In evaluating Fees for the relevant Portfolios, the Directors also took into account the demands, complexity and quality of the investment management services provided to each Portfolio. The Directors considered MetLife Advisers’ recommendations regarding reductions in Fee rates, implementation of Fee breakpoints and institution of Fee waivers and expense caps.
The Directors also considered the compensation directly or indirectly received by the Advisers and their affiliates from their relationships with the relevant Portfolios. The Directors reviewed information relating to the profits received by MetLife Advisers, certain of the subadvisers and their affiliates as a result of their relationships with the relevant Portfolios, and information about the allocation of expenses used to calculate profitability. When reviewing profitability, the Directors also considered the performance of the relevant Portfolios, the expense levels of such Portfolios and whether the relevant Advisers had implemented breakpoints, fee waivers and/or expense caps with respect to such Portfolios.
After reviewing these and related factors, the Directors concluded, within the context of their overall conclusions regarding each of the Continued Agreements, that the Fees charged to each of the relevant Portfolios were fair and reasonable, and that the information provided regarding costs of these services generally, and the related profitability (if known) to the relevant Advisers of their relationships with the relevant Portfolios, supported the renewal of the Continued Agreements.
Economies of Scale. The Directors considered the existence of any economies of scale in the provision of services by the Advisers and whether those economies were shared with the relevant Portfolios through breakpoints in their advisory fees or other means, such as expense caps, fee waivers or relatively low levels of fees. The Directors noted that most of the relevant Portfolios benefited or will benefit from breakpoints, expense caps and/or fee waivers with respect to their advisory fees. In considering these issues, the Directors also took into consideration information relating to the costs of the services provided and the profitability to MetLife Advisers, the relevant subadvisers (if any) and each of their affiliates of their relationships with the relevant Portfolios, as discussed above.
MSF-18
Metropolitan Series Fund, Inc.
BlackRock Money Market Portfolio
Board Approval of Advisory and Subadvisory Agreements—(Continued)
After reviewing these and related factors, the Directors concluded, within the context of their overall conclusions regarding each of the Continued Agreements, that the extent to which economies of scale were shared with the relevant Portfolios supported the renewal of such Agreements.
Other Factors. The Directors also considered other factors, which included but were not limited to the following:
| | • | | the extent to which each relevant Portfolio operated in accordance with its investment objective, and its record of compliance with its investment restrictions and the compliance programs of the Fund and the Advisers. They also considered the compliance-related resources the Advisers and their affiliates provide to the relevant Portfolios; |
| | • | | the nature, quality, cost and extent of administrative and shareholder services performed by MetLife Advisers and its affiliates under the Advisory Agreements; and |
| | • | | so-called “fall-out benefits” to the Advisers, such as the engagement of their affiliates to provide distribution, brokerage and transfer agency services to the Portfolios, and the benefits of research made available to the relevant Advisers by reason of brokerage commissions generated by the relevant Portfolios’ securities transactions. The Directors also considered the possible conflicts of interest associated with these fall-out and other benefits, and the reporting and other processes in place to disclose and monitor these possible conflicts of interest. |
Based on their evaluation of all factors that they deemed to be material, including those factors described above, and assisted by the advice of independent counsel, the Directors, including the Independent Directors, concluded that each of the Continued Agreements should be continued through December 31, 2009.
MSF-19
A description of the policies and procedures that the Fund uses to determine how to vote proxies relating to portfolio securities is available (i) without charge, upon request, by calling (800) 638-7732 and (ii) on the Securities and Exchange Commission’s (the “SEC”) website at http://www.sec.gov.
Information regarding how the Fund voted proxies relating to portfolio securities during the most recent twelve-month period ended December 31, 2008 is available (i) without charge, upon request, by calling (800) 638-7732 and (ii) on the SEC’s website at http://www.sec.gov.
The Fund’s Statement of Additional Information includes additional information about the Directors of the Fund and is available (i) without charge, upon request, by calling (800) 638-7732 and (ii) on the SEC’s website at http://www.sec.gov.
The Fund files with the SEC a complete schedule of its portfolio holdings, as of the close of the first and third quarters of its fiscal year, on “Form N-Q”. These filings are available on the SEC’s website at www.sec.gov and may be reviewed and copied at the SEC’s Public Reference Room in Washington, DC. (Call 1-800-SEC-0330 for information on the operation of the Public Reference Room.)
MSF-20
Simplify your life…
with MetLife eDelivery® while helping MetLife preserve the planet’s natural resources.
(see details on inside cover)
| | |
Metropolitan Series Fund, Inc. BlackRock Strategic Value Portfolio Annual Report | | December 31, 2008 |
NOT PART OF THE ANNUAL REPORT
Letter from the President
February 1, 2009
Letter to Policy Holders:
2008 was an extraordinary year in the capital markets around the world and for the global economy. Energy prices rose to record levels early in the year before falling by two-thirds by year-end. A credit crisis that began with concerns about sub-prime mortgages led to massive changes in the financial landscape with government takeovers, forced sales, and outright failures of a number of large, once venerable firms.
While bonds as measured by the Barclays Capital U.S. Aggregate Bond Index (formerly known as, Lehman Brothers U.S. Aggregate Bond Index) were up 5.2% for the year in response to declining interest rates, there were large differences in the total returns of the various sectors of the bond market. U.S. treasury securities were up over 13% as frightened investors sought refuge in what they perceived to be the safest and most liquid investments. In contrast, investment grade corporate securities lost nearly 5% as credit spreads widened and below investment grade or high yield bonds fell over 26%.
In response to the growing credit crisis and the weakening economy, common stocks fell sharply across all regions, styles, and capitalizations. As measured by the Standard and Poor’s 500, U.S. common stocks fell 37% for the year, the worst calendar year decline since the 1930s. Foreign stocks were down even more with the MSCI EAFE Index down 43% for the year.
On the following pages, you will find a complete review of your Portfolio and its investment performance.
MetLife is committed to building your financial freedom. We appreciate your trust and will continue to focus our efforts on meeting your investment needs.
Sincerely,
Elizabeth M. Forget
President, Metropolitan Series Fund, Inc.
Metropolitan Series Fund, Inc.
BlackRock Strategic Value Portfolio
Managed by BlackRock Advisors, LLC
Portfolio Manager Commentary*
PORTFOLIO PERFORMANCE
For the twelve-month period ended December 31, 2008, the Class A shares of the BlackRock Strategic Value Portfolio returned -38.4%, compared to its benchmark, the Russell 2000 Value Index1, which returned -28.9%. The average return of its peer group, the Lipper Variable Insurance Products2 Small-Cap Value Funds Universe, was -32.9% over the same period.
PORTFOLIO REVIEW
Amid record volatility, U.S. equity markets moved sharply lower as plummeting home values, a weakening global economy, tight credit markets and the reshaping of the financial services industry pushed investor sentiment to historic lows. Within the small cap segment of the market, value stocks outperformed their growth counterparts, though both styles endured steep absolute losses. The disparity in style returns was driven largely by the relative performance impact of the financials sector. The benchmark Russell 2000 Value Index sank 28.92%, the worst annual loss for the index since its inception. All sectors finished in negative territory, with sharp drops in financials, consumer discretionary and information technology having the most significant negative impact on overall index returns. In this challenging environment, active managers struggled to beat the benchmark. In fact, over 70% of small cap value managers underperformed the Russell 2000 Value Index in 2008, with the average manager trailing the benchmark by 450 basis points3. Performance for the BlackRock Strategic Value Portfolio fell short of the benchmark, as relative strength in the consumer staples and industrials sectors was overcome by weakness primarily in financials, information technology and energy.
Given their more defensive characteristics, consumer staples stocks became a haven for many investors as turmoil in the equity markets intensified, particularly in the second half of the year. Although indiscriminate selling did result in significant declines for the sector, the damage was much more severe in other areas. Accordingly, a significant overweight in consumer staples names, particularly among food & staples retailers and food products producers, benefited performance comparisons. Positive stock selection also added value. Notable individual contributors included BJ’s Wholesale Club, which benefited from more cost-conscious consumers, and Chattem Inc., a maker of branded over-the-counter healthcare products. The slowing global economy had a negative impact on many names in the industrials sector, as demand for their products and services waned. Against this backdrop, modest overweights among marine shippers and professional services providers and underweights to home builders and machinery producers added value. Stock selection among commercial services companies also contributed to outperformance in the sector. Key contributors included pest control services provider Rollins Inc. and refuse collector Waste Connections.
From the failure of Bear Stearns in mid-March to the bailout of AIG in November, investors were besieged by a series of unprecedented events that altered the financial services landscape. Given the turmoil in the industry, the Portfolio was underweight in the sector for much of the year. While this positioning benefited performance comparisons early in 2008, it worked against us in the third and fourth quarters as the sector performed relatively well following the extraordinary steps taken by the federal government, the Treasury and the Federal Reserve to shore up bank balance sheets, ease credit markets and inject liquidity into the system. Information technology stocks sold off sharply during the year as weakening economic data lowered expectations for corporate technology spending and clouded earnings visibility. Although an underweight in the sector added value, these relative gains were overshadowed by the negative impact of stock selection, particularly within the semiconductor, IT services and communications equipment areas. In energy, violent moves in commodity prices wreaked havoc on stock prices. Allocations within the sector and disappointing relative performance from the Portfolio’s exploration & production holdings accounted for much of the performance shortfall.
During the fourth quarter, we continued to take advantage of indiscriminate selling in the market to upgrade the overall quality of the Portfolio. The most notable trading activity occurred within the financials, consumer discretionary and information technology sectors. In financials, we increased our exposure significantly, particularly late in the year, as we believe the painful consolidation and aggressive fiscal and monetary stimulus implemented in recent months will ultimately improve industry balance sheets and ease credit spreads. While the Portfolio remains underweight in commercial banks, we added exposure in that area. We also increased the Portfolio’s weighting in the thrift & mortgage finance, real estate investment trust and insurance areas. Conversely, we reduced an overweight in the consumer discretionary sector, particularly among specialty retailers and hotels, restaurants and casinos. We expect that discretionary spending will remain tight, and that additional store closings and bankruptcy filings are likely in the wake of a disastrous holiday shopping season. We also decreased exposure in information technology, eliminating several semiconductor and software holdings. Entering 2009, the most notable Portfolio positioning relative to the Russell 2000 Value Index included modest overweights in the industrials, consumer staples and materials sectors, and underweights in utilities, financials and information technology.
* The views expressed above are those of the subadvisory firm as of December 31, 2008 and are subject to change based on market and other conditions. Information about the Portfolio’s holdings, asset allocation, industry allocation, or country diversification is historical and is not an indication of future Portfolio composition, which will vary. The performance of any index mentioned in this commentary has not been adjusted for ongoing management, distribution and operating expenses, and sales charges applicable to mutual fund investments. Direct investment in any index is not possible.
1 The Russell 2000® Value Index is an unmanaged measure of performance of those Russell 2000® companies that have lower price-to-book ratios and lower forecasted growth values.
2 The Lipper Variable Products Fund Average is an average of the total return performance (calculated on the basis of net asset value) of variable product funds with similar investment objectives to those of the subject Portfolio as calculated by Lipper Analytical Services, an independent mutual fund ranking service.
3 Source: Lipper Analytical Services; BAS-Merrill Lynch Small Cap Research; Russell Investment Group
MSF-2
Metropolitan Series Fund, Inc.
BlackRock Strategic Value Portfolio
A $10,000 INVESTMENT COMPARED TO THE RUSSELL 2000 VALUE INDEX
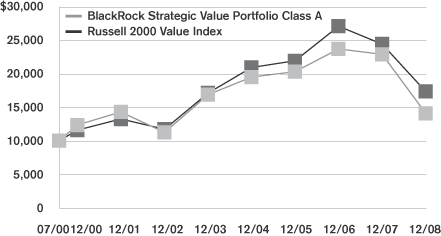
Average Annual Returns as of December 31, 2008
| | | | | | | | | | | | |
| | | BlackRock Strategic Value Portfolio | | | Russell 2000
Value Index | |
| | | Class A | | | Class B | | | Class E | | |
| 1 Year | | -38.4 | % | | -38.6 | % | | -38.5 | % | | -28.9 | % |
| 5 Year | | -3.6 | | | -3.9 | | | -3.7 | | | 0.3 | |
| Since Inception | | 4.1 | | | -0.5 | | | -0.3 | | | 6.7 | |
Performance numbers are net of all Portfolio expenses but do not include any insurance, sales, or administrative charges of variable annuity or life insurance contracts or any additional expenses that participants in certain eligible qualified plans may bear relating to the operations of their plans. If these charges were included, the returns would be lower.
Inception dates of the Class A, Class B and Class E shares are: 7/5/00, 5/1/01 and 5/1/01, respectively. Index since inception return is based on the Class A inception date.
This information represents past performance and is not indicative of future results. Investment return and principal value may fluctuate so that shares, upon redemption, may be worth more or less than the original cost.
PORTFOLIO COMPOSITION as of December 31, 2008
Top Holdings
| | |
| | | % of Total
Net Assets |
PHH Corp. | | 3.4% |
First Niagara Financial Group, Inc. | | 3.0% |
Hain Celestial Group, Inc. | | 2.5% |
The Hanover Insurance Group, Inc. | | 2.5% |
MFA Mortgage Investments, Inc. | | 2.3% |
Platinum Underwriters Holdings, Ltd. | | 2.3% |
United Bankshares, Inc. | | 2.2% |
Aspen Insurance Holdings, Ltd. | | 2.0% |
Lennox International, Inc. | | 1.7% |
KBW, Inc. | | 1.7% |
Top Sectors
| | |
| | | % of Total
Market Value |
Financials | | 36.6% |
Industrials | | 16.8% |
Consumer Discretionary | | 11.1% |
Information Technology | | 8.6% |
Health Care | | 6.5% |
Consumer Staples | | 6.5% |
Materials | | 5.9% |
Energy | | 3.0% |
Utilities | | 2.5% |
Cash | | 2.5% |
MSF-3
Metropolitan Series Fund, Inc.
Shareholder Expense Example
As a shareholder of the Portfolio, you incur ongoing costs, including management fees; distribution and service (12b-1) fees; and other Portfolio expenses. This example is intended to help you understand your ongoing costs (in dollars) (referred to as “expenses”) of investing in the Portfolio and compare these costs with the ongoing costs of investing in other mutual funds. The example is based on an investment of $1,000 invested at the beginning of the period and held for the entire period, July 1, 2008 through December 31, 2008.
Actual Expenses
The first line for each share class of the Portfolio in the table below provides information about actual account values and actual expenses. You may use the information in this line, together with the amount you invested in the particular share class of the Portfolio, to estimate the expenses that you paid over the period. Simply divide your account value by $1,000 (for example, an $8,600 account value divided by $1,000=8.6), then multiply the result by the number in the first line under the heading entitled “Expenses Paid During Period” to estimate the expenses you paid on your account during this period.
Hypothetical Example for Comparison Purposes
The second line for each share class of the Portfolio in the table below provides information about hypothetical account values and hypothetical expenses based on the Portfolio’s actual expense ratio and an assumed rate of return of 5% per year before expenses, which is not the Portfolio’s actual return. The hypothetical account values and expenses may not be used to estimate the actual ending account balance or expenses you paid for the period. You may use this information to compare the ongoing costs of investing in the Portfolio and other funds. To do so, compare this 5% hypothetical example with the 5% hypothetical examples that appear in the shareholder reports of the other funds.
Please note that the expenses shown in the table are meant to highlight your ongoing costs only and do not reflect any fees or charges of your variable insurance product or any additional expenses that participants in certain eligible qualified plans may bear relating to the operations of their plan. Therefore, the second line for each share class in the table is useful in comparing ongoing costs only, and will not help you determine the relative total costs of owning different funds. In addition, if these other costs were included, your costs would have been higher.
| | | | | | | | | | | | | | |
Portfolio | | | | Annualized
Expense
Ratio | | | Beginning
Account Value
July 1,
2008 | | Ending
Account Value
December 31,
2008 | | Expenses Paid
During Period*
July 1, 2008
to
December 31,
2008 |
BlackRock Strategic Value—Class A | | Actual | | 0.90 | % | | $ | 1,000.00 | | $ | 694.51 | | $ | 3.83 |
| | Hypothetical | | 0.90 | % | | $ | 1,000.00 | | $ | 1,020.56 | | $ | 4.57 |
| | | | | |
BlackRock Strategic Value—Class B | | Actual | | 1.15 | % | | $ | 1,000.00 | | $ | 693.52 | | $ | 4.90 |
| | Hypothetical | | 1.15 | % | | $ | 1,000.00 | | $ | 1,019.29 | | $ | 5.84 |
| | | | | |
BlackRock Strategic Value—Class E | | Actual | | 1.05 | % | | $ | 1,000.00 | | $ | 694.54 | | $ | 4.47 |
| | Hypothetical | | 1.05 | % | | $ | 1,000.00 | | $ | 1,019.79 | | $ | 5.33 |
* Expenses paid are equal to the Portfolio’s annualized expense ratio for the most recent six month period, as shown above, multiplied by the average account value over the period, multiplied by the number of days in the most recent fiscal half-year, divided by 366 (to reflect the the one-half year period).
MSF-4
Metropolitan Series Fund, Inc.
BlackRock Strategic Value Portfolio
Schedule of Investments as of December 31, 2008
Common Stock—97.2% of Total Net Assets
| | | | | |
| Security Description | | Shares | | Value* |
| | | | | |
|
Aerospace & Defense—2.4% |
Curtiss-Wright Corp. (a) | | 119,400 | | $ | 3,986,766 |
Orbital Sciences Corp. (a) (b) | | 230,600 | | | 4,503,618 |
Teledyne Technologies, Inc. (b) | | 56,900 | | | 2,534,895 |
| | | | | |
| | | | | 11,025,279 |
| | | | | |
|
Airlines—1.1% |
JetBlue Airways Corp. (a) (b) | | 733,000 | | | 5,204,300 |
| | | | | |
|
Building Products—1.7% |
Lennox International, Inc. | | 247,000 | | | 7,975,630 |
| | | | | |
|
Capital Markets—3.4% |
Affiliated Managers Group, Inc. (b) | | 62,500 | | | 2,620,000 |
Jefferies Group, Inc. (a) | | 375,314 | | | 5,276,915 |
KBW, Inc. (b) | | 335,318 | | | 7,712,314 |
| | | | | |
| | | | | 15,609,229 |
| | | | | |
|
Chemicals—1.5% |
Sensient Technologies Corp. (a) | | 297,448 | | | 7,103,058 |
| | | | | |
|
Commercial & Professional Services—4.0% |
Rollins, Inc. (a) | | 120,900 | | | 2,185,872 |
The Brink’s Co. | | 263,600 | | | 7,085,568 |
The GEO Group, Inc. (a) (b) | | 231,100 | | | 4,166,733 |
Waste Connections, Inc. (b) | | 165,650 | | | 5,229,570 |
| | | | | |
| | | | | 18,667,743 |
| | | | | |
|
Commercial Banks—8.8% |
City National Corp. | | 101,500 | | | 4,943,050 |
CVB Financial Corp. | | 331,200 | | | 3,941,280 |
First Midwest Bancorp, Inc. | | 112,000 | | | 2,236,640 |
Glacier Bancorp, Inc. | | 247,700 | | | 4,711,254 |
PacWest Bancorp | | 148,800 | | | 4,002,720 |
Prosperity Bancshares, Inc. | | 211,800 | | | 6,267,162 |
United Bankshares, Inc. (a) | | 311,897 | | | 10,361,218 |
Westamerica Bancorp | | 42,167 | | | 2,156,842 |
Wintrust Financial Corp. | | 97,935 | | | 2,014,523 |
| | | | | |
| | | | | 40,634,689 |
| | | | | |
|
Communications Equipment—1.1% |
Adtran, Inc. (a) | | 215,900 | | | 3,212,592 |
Polycom, Inc. (b) | | 134,600 | | | 1,818,446 |
| | | | | |
| | | | | 5,031,038 |
| | | | | |
|
Computers & Peripherals—0.5% |
Seagate Technology (a) | | 499,000 | | | 2,210,570 |
| | | | | |
|
Construction & Engineering—0.5% |
Granite Construction, Inc. (a) | | 55,900 | | | 2,455,687 |
| | | | | |
|
Containers & Packaging—2.5% |
Silgan Holdings, Inc. | | 133,600 | | | 6,387,416 |
Temple-Inland, Inc. (a) | | 1,058,100 | | | 5,078,880 |
| | | | | |
| | | | | 11,466,296 |
| | | | | |
| | | | | |
| Security Description | | Shares | | Value* |
| | | | | |
|
Diversified Consumer Services—1.1% |
Brink’s Home Security Holdings, Inc. (b) | | 224,900 | | $ | 4,929,808 |
| | | | | |
|
Diversified Financial Services—3.4% |
PHH Corp. (b) | | 1,226,558 | | | 15,614,083 |
| | | | | |
|
Electric Utilities—1.2% |
CLECO Corp. (a) | | 154,100 | | | 3,518,103 |
UIL Holdings Corp. | | 70,395 | | | 2,113,962 |
| | | | | |
| | | | | 5,632,065 |
| | | | | |
|
Electrical Equipment—1.3% |
Regal-Beloit Corp. (a) | | 153,700 | | | 5,839,063 |
| | | | | |
|
Energy Equipment & Services—1.0% |
Cal Dive International, Inc. (a) (b) | | 358,700 | | | 2,335,137 |
Lufkin Industries, Inc. (a) | | 61,244 | | | 2,112,918 |
| | | | | |
| | | | | 4,448,055 |
| | | | | |
|
Food & Staples Retailing—1.2% |
Ruddick Corp. (a) | | 81,958 | | | 2,266,139 |
Spartan Stores, Inc. (a) | | 136,500 | | | 3,173,625 |
| | | | | |
| | | | | 5,439,764 |
| | | | | |
|
Food Products—4.8% |
Chiquita Brands International, Inc. (a) (b) | | 229,000 | | | 3,384,620 |
Hain Celestial Group, Inc. (a) (b) | | 615,000 | | | 11,740,350 |
Ralcorp Holdings, Inc. (b) | | 83,669 | | | 4,886,270 |
TreeHouse Foods, Inc. (a) (b) | | 87,472 | | | 2,382,737 |
| | | | | |
| | | | | 22,393,977 |
| | | | | |
|
Gas Utilities—0.7% |
Southwest Gas Corp. (a) | | 131,279 | | | 3,310,856 |
| | | | | |
|
Health Care Equipment & Supplies—3.0% |
Greatbatch, Inc. (a) (b) | | 214,800 | | | 5,683,608 |
Integra LifeSciences Holdings Corp. (b) | | 80,800 | | | 2,874,056 |
Symmetry Medical, Inc. (b) | | 323,533 | | | 2,578,558 |
Teleflex, Inc. | | 52,100 | | | 2,610,210 |
| | | | | |
| | | | | 13,746,432 |
| | | | | |
| | |
Health Care Providers & Services—3.5% | | | | | |
Amedisys, Inc. (a) (b) | | 50,800 | | | 2,100,072 |
AmSurg Corp. (a) (b) | | 164,242 | | | 3,833,408 |
HMS Holdings Corp. (b) | | 81,971 | | | 2,583,726 |
Magellan Health Services, Inc. (b) | | 132,761 | | | 5,198,921 |
Sun Healthcare Group, Inc. (b) | | 286,278 | | | 2,533,560 |
| | | | | |
| | | | | 16,249,687 |
| | | | | |
| | |
Hotels, Restaurants & Leisure—2.4% | | | | | |
Brinker International, Inc. | | 278,900 | | | 2,939,606 |
Pinnacle Entertainment, Inc. (a) (b) | | 316,800 | | | 2,433,024 |
Scientific Games Corp. (a) (b) | | 238,500 | | | 4,183,290 |
The Cheesecake Factory (b) | | 159,500 | | | 1,610,950 |
| | | | | |
| | | | | 11,166,870 |
| | | | | |
*See accompanying notes to financial statements.
MSF-5
Metropolitan Series Fund, Inc.
BlackRock Strategic Value Portfolio
Schedule of Investments as of December 31, 2008
Common Stock—(Continued)
| | | | | |
| Security Description | | Shares | | Value* |
| | | | | |
| | |
Household Durables—3.1% | | | | | |
Centex Corp. (a) (b) | | 438,700 | | $ | 4,667,768 |
Jarden Corp. (a) (b) | | 281,520 | | | 3,237,480 |
Lennar Corp. (Class A) (a) | | 730,000 | | | 6,329,100 |
| | | | | |
| | | | | 14,234,348 |
| | | | | |
| | |
Insurance—8.8% | | | | | |
Aspen Insurance Holdings, Ltd. | | 372,800 | | | 9,040,400 |
Endurance Specialty Holdings, Ltd. | | 172,900 | | | 5,278,637 |
Navigators Group, Inc. (b) | | 80,104 | | | 4,398,511 |
Platinum Underwriters Holdings, Ltd. | | 289,107 | | | 10,430,980 |
The Hanover Insurance Group, Inc. | | 263,842 | | | 11,337,291 |
| | | | | |
| | | | | 40,485,819 |
| | | | | |
| | |
Internet Software & Services—1.5% | | | | | |
SkillSoft, Plc. (ADR) (b) | | 951,929 | | | 6,796,773 |
| | | | | |
| | |
IT Services—3.0% | | | | | |
Forrester Research, Inc. (b) | | 162,000 | | | 4,570,020 |
Hewitt Associates, Inc. (b) | | 157,300 | | | 4,464,174 |
Lender Processing Services, Inc. | | 157,900 | | | 4,650,155 |
| | | | | |
| | | | | 13,684,349 |
| | | | | |
| | |
Leisure Equipment & Products—0.5% | | | | | |
LeapFrog Enterprises, Inc. (a) (b) | | 720,301 | | | 2,521,054 |
| | | | | |
| | |
Machinery—2.6% | | | | | |
Astec Industries, Inc. (a) (b) | | 116,500 | | | 3,649,945 |
IDEX Corp. (a) | | 251,700 | | | 6,078,555 |
Wabtec Corp. | | 63,100 | | | 2,508,225 |
| | | | | |
| | | | | 12,236,725 |
| | | | | |
| | |
Media—1.2% | | | | | |
Lions Gate Entertainment Corp. (a) (b) | | 1,006,600 | | | 5,536,300 |
| | | | | |
| | |
Metals & Mining—1.9% | | | | | |
Reliance Steel & Aluminum Co. | | 213,400 | | | 4,255,196 |
Steel Dynamics, Inc. | | 386,700 | | | 4,323,306 |
| | | | | |
| | | | | 8,578,502 |
| | | | | |
| | |
Multi-Utilities—0.6% | | | | | |
Black Hills Corp. | | 99,700 | | | 2,687,912 |
| | | | | |
| | |
Oil, Gas & Consumable Fuels—2.1% | | | | | |
Berry Petroleum Co. | | 285,200 | | | 2,156,112 |
Delta Petroleum Corp. (a) (b) | | 227,341 | | | 1,082,143 |
Goodrich Petroleum Corp. (a) (b) | | 69,900 | | | 2,093,505 |
James River Coal Co. (a) (b) | | 210,802 | | | 3,231,595 |
Swift Energy Co. (a) (b) | | 60,600 | | | 1,018,686 |
| | | | | |
| | | | | 9,582,041 |
| | | | | |
| | |
Personal Products—0.5% | | | | | |
Chattem, Inc. (b) | | 32,168 | | | 2,300,977 |
| | | | | |
| | | | | |
| Security Description | | Shares | | Value* |
| | | | | |
| | |
Professional Services—0.9% | | | | | |
Huron Consulting Group, Inc. (a) (b) | | 75,100 | | $ | 4,300,977 |
| | | | | |
| | |
Real Estate Investment Trusts—8.0% | | | | | |
Corporate Office Properties Trust (a) | | 110,500 | | | 3,392,350 |
Duke Realty Corp. | | 367,000 | | | 4,022,320 |
Mack-Cali Realty Corp. | | 133,200 | | | 3,263,400 |
MFA Mortgage Investments, Inc. | | 1,803,400 | | | 10,622,026 |
Mid-America Apartment Communities, Inc. (a) | | 175,200 | | | 6,510,432 |
Redwood Trust, Inc. | | 148,000 | | | 2,206,680 |
Washington Real Estate Investment Trust (a) | | 251,500 | | | 7,117,450 |
| | | | | |
| | | | | 37,134,658 |
| | | | | |
| | |
Road & Rail—2.1% | | | | | |
Genesee & Wyoming, Inc. (b) | | 217,400 | | | 6,630,700 |
Ryder System, Inc. | | 83,902 | | | 3,253,720 |
| | | | | |
| | | | | 9,884,420 |
| | | | | |
|
Semiconductors & Semiconductor Equipment—1.4% |
Microsemi Corp. (b) | | 172,700 | | | 2,182,928 |
ON Semiconductor Corp. (a) (b) | | 472,200 | | | 1,605,480 |
Verigy, Ltd. (b) | | 305,700 | | | 2,940,834 |
| | | | | |
| | | | | 6,729,242 |
| | | | | |
|
Software—1.1% |
Lawson Software, Inc. (b) | | 1,114,100 | | | 5,280,834 |
| | | | | |
|
Specialty Retail—2.8% |
Abercrombie & Fitch Co. (Class A) (a) | | 182,300 | | | 4,205,661 |
Gymboree Corp. (b) | | 208,300 | | | 5,434,547 |
Tractor Supply Co. (a) (b) | | 88,700 | | | 3,205,618 |
| | | | | |
| | | | | 12,845,826 |
| | | | | |
|
Thrifts & Mortgage Finance—4.0% |
Astoria Financial Corp. | | 281,447 | | | 4,638,247 |
First Niagara Financial Group, Inc. | | 844,800 | | | 13,660,416 |
| | | | | |
| | | | | 18,298,663 |
| | | | | |
Total Common Stock
(Identified Cost $492,585,593) | | | | | 449,273,599 |
| | | | | |
*See accompanying notes to financial statements.
MSF-6
Metropolitan Series Fund, Inc.
BlackRock Strategic Value Portfolio
Schedule of Investments as of December 31, 2008
Short Term Investments—13.5%
| | | | | | | |
| Security Description | | Shares/Face
Amount | | Value* | |
|
Mutual Funds—11.9% | |
State Street Navigator Securities Lending Prime Portfolio (c) | | | 55,164,303 | | $ | 55,164,303 | |
| | | | | | | |
|
Repurchase Agreement—1.6% | |
State Street Repurchase Agreement dated 12/31/08 at 0.010% to be repurchased at $7,289,004 on 01/02/09, collateralized by $7,435,000 U.S. Treasury Bill due 02/19/09 with a value of $7,435,000. | | $ | 7,289,000 | | | 7,289,000 | |
| | | | | | | |
Total Short Term Investments
(Identified Cost $62,453,303) | | | | | | 62,453,303 | |
| | | | | | | |
Total Investments—110.7%
(Identified Cost $555,038,896) (d) | | | | | | 511,726,902 | |
Liabilities in excess of other assets | | | | | | (49,660,154 | ) |
| | | | | | | |
| Total Net Assets—100% | | | | | $ | 462,066,748 | |
| | | | | | | |
| (a) | A portion or all of the security was on loan. As of December 31, 2008, the market value of securities loaned was $55,402,686 and the collateral received consisted of cash in the amount of $55,164,303. The cash collateral is invested in a money market fund managed by an affiliate of the custodian. |
| (c) | Represents investment of cash collateral received from securities lending transactions. |
| (d) | The aggregate cost of investments for federal income tax purposes as of December 31, 2008 was $577,452,636 and the composition of unrealized appreciation and depreciation of investment securities was $24,752,500 and $(90,478,234), respectively. |
| (ADR)— | An American Depositary Receipt is a certificate issued by a custodian bank representing the right to receive securities of the foreign issuer described. Trading on exchanges not located in the United States or Canada significantly influences the value of ADRs. |
The Portfolio adopted the provisions of Statement of Financial Accounting Standards No. 157, “Fair Value Measurements” (FAS 157), effective with the beginning of the Portfolio’s fiscal year. FAS 157 establishes a framework for measuring fair value and expands disclosures about fair value measurements in financial statements. The three levels of the hierarchy under FAS 157 are described below:
Level 1 - quoted prices in active markets for identical securities
Level 2 - other significant observable inputs (including quoted prices for similar securities, interest rates, credit risk, etc.)
Level 3 - significant unobservable inputs (including the Portfolio’s own assumptions in determining the fair value of investments)
The inputs or methodology used for valuing securities are not necessarily an indication of the risk associated with investing in those securities.
The following is a summary of the inputs used to value the Portfolio’s net assets as of December 31, 2008:
| | | | | | |
| Valuation Inputs | | Investments In
Securities | | Other Financial
Instruments* |
Level 1 - Quoted Prices | | $ | 504,437,902 | | $ | 0 |
Level 2 - Other Significant Observable Inputs | | | 7,289,000 | | | 0 |
Level 3 - Significant Unobservable Inputs | | | 0 | | | 0 |
Total | | $ | 511,726,902 | | $ | 0 |
* Other financial instruments are derivative instruments not reflected in the Schedule of Investments, such as futures, forwards, swap contracts and written options, which are valued based on the unrealized appreciation/depreciation on the instrument.
*See accompanying notes to financial statements.
MSF-7
Metropolitan Series Fund, Inc.
BlackRock Strategic Value Portfolio
Statement of Assets & Liabilities
December 31, 2008
| | | | | | | |
Assets | | | | | | | |
Investments at value (a) (b) | | | | | $ | 511,726,902 | |
Cash | | | | | | 351 | |
Receivable for: | | | | | | | |
Securities sold | | | | | | 3,764,248 | |
Fund shares sold | | | | | | 1,465,872 | |
Accrued interest and dividends | | | | | | 926,293 | |
| | | | | | | |
Total Assets | | | | | | 517,883,666 | |
Liabilities | | | | | | | |
Payable for: | | | | | | | |
Fund shares redeemed | | $ | 272,560 | | | | |
Collateral for securities loaned | | | 55,164,303 | | | | |
Accrued expenses: | | | | | | | |
Management fees | | | 308,388 | | | | |
Service and distribution fees | | | 31,231 | | | | |
Other expenses | | | 40,436 | | | | |
| | | | | | | |
Total Liabilities | | | | | | 55,816,918 | |
| | | | | | | |
Net Assets | | | | | $ | 462,066,748 | |
| | | | | | | |
Net assets consists of: | | | | | | | |
Capital paid in | | | | | $ | 791,009,386 | |
Undistributed net investment income | | | | | | 3,872,235 | |
Accumulated net realized losses | | | | | | (289,502,879 | ) |
Unrealized depreciation on investments | | | | | | (43,311,994 | ) |
| | | | | | | |
Net Assets | | | | | $ | 462,066,748 | |
| | | | | | | |
| Computation of offering price: | | | | | | | |
Class A | | | | | | | |
Net asset value and redemption price per share ($260,771,074 divided by 30,755,127 shares outstanding) | | | | | $ | 8.48 | |
| | | | | | | |
Class B | | | | | | | |
Net asset value and redemption price per share ($96,606,302 divided by 11,571,195 shares outstanding) | | | | | $ | 8.35 | |
| | | | | | | |
Class E | | | | | | | |
Net asset value and redemption price per share ($104,689,372 divided by 12,484,602 shares outstanding) | | | | | $ | 8.39 | |
| | | | | | | |
(a) Identified cost of investments | | | | | $ | 555,038,896 | |
| | | | | | | |
(b) Includes cash collateral for securities loaned of | | | | | $ | 55,164,303 | |
| | | | | | | |
Statement of Operations
For the Year Ended December 31, 2008
| | | | | | | | |
Investment Income | | | | | | | | |
Dividends | | | | | | $ | 8,538,909 | |
Interest | | | | | | | 2,625,460 | (a) |
| | | | | | | | |
| | | | | | | 11,164,369 | |
Expenses | | | | | | | | |
Management fees | | $ | 5,691,931 | | | | | |
Service and distribution fees—Class B | | | 337,092 | | | | | |
Service and distribution fees—Class E | | | 235,250 | | | | | |
Directors’ fees and expenses | | | 31,907 | | | | | |
Custodian | | | 89,010 | | | | | |
Audit and tax services | | | 36,941 | | | | | |
Legal | | | 11,528 | | | | | |
Printing | | | 192,594 | | | | | |
Insurance | | | 10,374 | | | | | |
Miscellaneous | | | 16,906 | | | | | |
| | | | | | | | |
Total expenses | | | 6,653,533 | | | | | |
Expense reductions | | | (296,356 | ) | | | 6,357,177 | |
| | | | | | | | |
Net Investment Income | | | | | | | 4,807,192 | |
| | | | | | | | |
Realized and Unrealized Loss | | | | | | | | |
| Realized loss on: | | | | | | | | |
Investments—net | | | | | | | (273,233,979 | ) |
| Change in unrealized depreciation on: | | | | | | | | |
Investments—net | | | | | | | (38,833,396 | ) |
| | | | | | | | |
Net loss | | | | | | | (312,067,375 | ) |
| | | | | | | | |
Net Decrease in Net Assets From Operations | | | | | | $ | (307,260,183 | ) |
| | | | | | | | |
| (a) | Includes income on securities loaned of $2,266,957. |
See accompanying notes to financial statements.
MSF-8
Metropolitan Series Fund, Inc.
BlackRock Strategic Value Portfolio
Statements of Changes in Net Assets
| | | | | | | | |
| | | Year ended
December 31,
2008 | | | Year ended
December 31,
2007 | |
From Operations | | | | | | | | |
Net investment income | | $ | 4,807,192 | | | $ | 5,405,187 | |
Net realized gain (loss) | | | (273,233,979 | ) | | | 51,593,377 | |
Change in unrealized depreciation | | | (38,833,396 | ) | | | (88,014,608 | ) |
| | | | | | | | |
Decrease in net assets from operations | | | (307,260,183 | ) | | | (31,016,044 | ) |
| | | | | | | | |
From Distributions to Shareholders | | | | | | | | |
Net investment income | | | | | | | | |
Class A | | | (2,161,034 | ) | | | (1,793,872 | ) |
Class B | | | (303,929 | ) | | | (99,321 | ) |
Class E | | | (563,452 | ) | | | (369,395 | ) |
| | | | | | | | |
| | | (3,028,415 | ) | | | (2,262,588 | ) |
| | | | | | | | |
Net realized gain | | | | | | | | |
Class A | | | (39,211,797 | ) | | | (68,897,991 | ) |
Class B | | | (13,589,956 | ) | | | (20,599,114 | ) |
Class E | | | (16,032,765 | ) | | | (28,374,988 | ) |
| | | | | | | | |
| | | (68,834,518 | ) | | | (117,872,093 | ) |
| | | | | | | | |
Total distributions | | | (71,862,933 | ) | | | (120,134,681 | ) |
| | | | | | | | |
Increase (decrease) in net assets from capital share transactions | | | (46,724,869 | ) | | | 7,479,154 | |
| | | | | | | | |
Net decrease in net assets | | | (425,847,985 | ) | | | (143,671,571 | ) |
| | |
Net Assets | | | | | | | | |
Beginning of the period | | | 887,914,733 | | | | 1,031,586,304 | |
| | | | | | | | |
End of the period | | $ | 462,066,748 | | | $ | 887,914,733 | |
| | | | | | | | |
Undistributed Net Investment Income | | | | | | | | |
End of the period | | $ | 3,872,235 | | | $ | 4,343,873 | |
| | | | | | | | |
Other Information:
Capital Shares
Transactions in capital shares were as follows:
| | | | | | | | | | | | | | |
| | | Year ended
December 31, 2008 | | | Year ended
December 31, 2007 | |
| | | Shares | | | $ | | | Shares | | | $ | |
Class A | | | | | | | | | | | | | | |
Sales | | 2,144,593 | | | $ | 21,819,627 | | | 4,125,452 | | | $ | 69,435,674 | |
Reinvestments | | 3,192,348 | | | | 41,372,831 | | | 4,286,954 | | | | 70,691,863 | |
Redemptions | | (8,154,388 | ) | | | (95,223,080 | ) | | (9,213,618 | ) | | | (152,838,244 | ) |
| | | | | | | | | | | | | | |
Net decrease | | (2,817,447 | ) | | $ | (32,030,622 | ) | | (801,212 | ) | | $ | (12,710,707 | ) |
| | | | | | | | | | | | | | |
Class B | | | | | | | | | | | | | | |
Sales | | 1,210,337 | | | $ | 13,142,441 | | | 2,362,092 | | | $ | 38,933,096 | |
Reinvestments | | 1,087,158 | | | | 13,893,885 | | | 1,271,403 | | | | 20,698,435 | |
Redemptions | | (2,172,732 | ) | | | (26,217,724 | ) | | (1,837,032 | ) | | | (29,976,931 | ) |
| | | | | | | | | | | | | | |
Net increase | | 124,763 | | | $ | 818,602 | | | 1,796,463 | | | $ | 29,654,600 | |
| | | | | | | | | | | | | | |
Class E | | | | | | | | | | | | | | |
Sales | | 664,408 | | | $ | 6,925,316 | | | 856,416 | | | $ | 13,920,361 | |
Reinvestments | | 1,293,548 | | | | 16,596,217 | | | 1,759,142 | | | | 28,744,383 | |
Redemptions | | (3,290,097 | ) | | | (39,034,382 | ) | | (3,175,252 | ) | | | (52,129,483 | ) |
| | | | | | | | | | | | | | |
Net decrease | | (1,332,141 | ) | | $ | (15,512,849 | ) | | (559,694 | ) | | $ | (9,464,739 | ) |
| | | | | | | | | | | | | | |
Increase (decrease) derived from capital share transactions | | | | | $ | (46,724,869 | ) | | | | | $ | 7,479,154 | |
| | | | | | | | | | | | | | |
See accompanying notes to financial statements.
MSF-9
Metropolitan Series Fund, Inc.
BlackRock Strategic Value Portfolio
Financial Highlights
| | | | | | | | | | | | | | | | | | | | |
| | | Class A | |
| | | Year ended December 31, | |
| | | 2008 | | | 2007 | | | 2006 | | | 2005 | | | 2004 | |
Net Asset Value, Beginning of Period | | $ | 15.17 | | | $ | 17.74 | | | $ | 18.55 | | | $ | 19.17 | | | $ | 16.62 | |
| | | | | | | | | | | | | | | | | | | | |
Income From Investment Operations | | | | | | | | | | | | | | | | | | | | |
Net investment income | | | 0.09 | (a) | | | 0.10 | (a) | | | 0.08 | | | | 0.08 | | | | 0.00 | |
Net realized and unrealized gain (loss) of investments | | | (5.46 | ) | | | (0.55 | ) | | | 2.84 | | | | 0.57 | | | | 2.55 | |
| | | | | | | | | | | | | | | | | | | | |
Total from investment operations | | | (5.37 | ) | | | (0.45 | ) | | | 2.92 | | | | 0.65 | | | | 2.55 | |
| | | | | | | | | | | | | | | | | | | | |
Less Distributions | | | | | | | | | | | | | | | | | | | | |
Distributions from net investment income | | | (0.07 | ) | | | (0.05 | ) | | | (0.06 | ) | | | 0.00 | | | | 0.00 | |
Distributions from net realized capital gains | | | (1.25 | ) | | | (2.07 | ) | | | (3.67 | ) | | | (1.27 | ) | | | 0.00 | |
| | | | | | | | | | | | | | | | | | | | |
Total distributions | | | (1.32 | ) | | | (2.12 | ) | | | (3.73 | ) | | | (1.27 | ) | | | 0.00 | |
| | | | | | | | | | | | | | | | | | | | |
Net Asset Value, End of Period | | $ | 8.48 | | | $ | 15.17 | | | $ | 17.74 | | | $ | 18.55 | | | $ | 19.17 | |
| | | | | | | | | | | | | | | | | | | | |
Total Return (%) | | | (38.4 | ) | | | (3.5 | ) | | | 16.7 | | | | 4.2 | | | | 15.3 | |
Ratio of operating expenses to average net assets before expense reductions (%) | | | 0.89 | | | | 0.88 | | | | 0.89 | | | | 0.89 | | | | 0.89 | |
Ratio of operating expenses to average net assets after expense reductions (%) (b) | | | 0.85 | | | | 0.85 | | | | 0.85 | | | | 0.84 | | | | 0.87 | |
Ratio of net investment income (loss) to average net assets (%) | | | 0.79 | | | | 0.62 | | | | 0.48 | | | | 0.42 | | | | (0.03 | ) |
Portfolio turnover rate (%) | | | 184 | | | | 121 | | | | 141 | | | | 175 | | | | 33 | |
Net assets, end of period (000) | | $ | 260,771 | | | $ | 509,332 | | | $ | 609,877 | | | $ | 604,086 | | | $ | 666,800 | |
| | | | | | | | | | | | | | | | | | | | |
| | | Class B | |
| | | Year ended December 31, | |
| | | 2008 | | | 2007 | | | 2006 | | | 2005 | | | 2004 | |
Net Asset Value, Beginning of Period | | $ | 14.95 | | | $ | 17.51 | | | $ | 18.35 | | | $ | 19.02 | | | $ | 16.53 | |
| | | | | | | | | | | | | | | | | | | | |
Income From Investment Operations | | | | | | | | | | | | | | | | | | | | |
Net investment income | | | 0.06 | (a) | | | 0.06 | (a) | | | 0.04 | | | | 0.03 | | | | 0.00 | |
Net realized and unrealized gain (loss) of investments | | | (5.38 | ) | | | (0.54 | ) | | | 2.81 | | | | 0.57 | | | | 2.49 | |
| | | | | | | | | | | | | | | | | | | | |
Total from investment operations | | | (5.32 | ) | | | (0.48 | ) | | | 2.85 | | | | 0.60 | | | | 2.49 | |
| | | | | | | | | | | | | | | | | | | | |
Less Distributions | | | | | | | | | | | | | | | | | | | | |
Distributions from net investment income | | | (0.03 | ) | | | (0.01 | ) | | | (0.02 | ) | | | 0.00 | | | | 0.00 | |
Distributions from net realized capital gains | | | (1.25 | ) | | | (2.07 | ) | | | (3.67 | ) | | | (1.27 | ) | | | 0.00 | |
| | | | | | | | | | | | | | | | | | | | |
Total distributions | | | (1.28 | ) | | | (2.08 | ) | | | (3.69 | ) | | | (1.27 | ) | | | 0.00 | |
| | | | | | | | | | | | | | | | | | | | |
Net Asset Value, End of Period | | $ | 8.35 | | | $ | 14.95 | | | $ | 17.51 | | | $ | 18.35 | | | $ | 19.02 | |
| | | | | | | | | | | | | | | | | | | | |
Total Return (%) | | | (38.6 | ) | | | (3.7 | ) | | | 16.4 | | | | 3.9 | | | | 15.1 | |
Ratio of operating expenses to average net assets before expense reductions (%) | | | 1.14 | | | | 1.13 | | | | 1.14 | | | | 1.14 | | | | 1.14 | |
Ratio of operating expenses to average net assets after expense reductions (%) (b) | | | 1.10 | | | | 1.10 | | | | 1.10 | | | | 1.09 | | | | 1.12 | |
Ratio of net investment income (loss) to average net assets (%) | | | 0.55 | | | | 0.39 | | | | 0.26 | | | | 0.20 | | | | (0.09 | ) |
Portfolio turnover rate (%) | | | 184 | | | | 121 | | | | 141 | | | | 175 | | | | 33 | |
Net assets, end of period (000) | | $ | 96,606 | | | $ | 171,141 | | | $ | 169,004 | | | $ | 116,849 | | | $ | 58,676 | |
| Please | see following page for Financial Highlights footnote legend. |
See accompanying notes to financial statements.
MSF-10
Metropolitan Series Fund, Inc.
BlackRock Strategic Value Portfolio
Financial Highlights
| | | | | | | | | | | | | | | | | | | | |
| | | Class E | |
| | | Year ended December 31, | |
| | | 2008 | | | 2007 | | | 2006 | | | 2005 | | | 2004 | |
Net Asset Value, Beginning of Period | | $ | 15.01 | | | $ | 17.58 | | | $ | 18.41 | | | $ | 19.06 | | | $ | 16.55 | |
| | | | | | | | | | | | | | | | | | | | |
Income From Investment Operations | | | | | | | | | | | | | | | | | | | | |
Net investment income (loss) | | | 0.08 | (a) | | | 0.08 | (a) | | | 0.06 | | | | 0.05 | | | | (0.02 | ) |
Net realized and unrealized gain (loss) of investments | | | (5.41 | ) | | | (0.55 | ) | | | 2.82 | | | | 0.57 | | | | 2.53 | |
| | | | | | | | | | | | | | | | | | | | |
Total from investment operations | | | (5.33 | ) | | | (0.47 | ) | | | 2.88 | | | | 0.62 | | | | 2.51 | |
| | | | | | | | | | | | | | | | | | | | |
Less Distributions | | | | | | | | | | | | | | | | | | | | |
Distributions from net investment income | | | (0.04 | ) | | | (0.03 | ) | | | (0.04 | ) | | | 0.00 | | | | 0.00 | |
Distributions from net realized capital gains | | | (1.25 | ) | | | (2.07 | ) | | | (3.67 | ) | | | (1.27 | ) | | | 0.00 | |
| | | | | | | | | | | | | | | | | | | | |
Total distributions | | | (1.29 | ) | | | (2.10 | ) | | | (3.71 | ) | | | (1.27 | ) | | | 0.00 | |
| | | | | | | | | | | | | | | | | | | | |
Net Asset Value, End of Period | | $ | 8.39 | | | $ | 15.01 | | | $ | 17.58 | | | $ | 18.41 | | | $ | 19.06 | |
| | | | | | | | | | | | | | | | | | | | |
Total Return (%) | | | (38.5 | ) | | | (3.6 | ) | | | 16.6 | | | | 4.0 | | | | 15.2 | |
Ratio of operating expenses to average net assets before expense reductions (%) | | | 1.04 | | | | 1.03 | | | | 1.04 | | | | 1.04 | | | | 1.04 | |
Ratio of operating expenses to average net assets after expense reductions (%) (b) | | | 1.00 | | | | 1.00 | | | | 1.00 | | | | 0.99 | | | | 1.02 | |
Ratio of net investment income (loss) to average net assets (%) | | | 0.64 | | | | 0.47 | | | | 0.32 | | | | 0.27 | | | | (0.16 | ) |
Portfolio turnover rate (%) | | | 184 | | | | 121 | | | | 141 | | | | 175 | | | | 33 | |
Net assets, end of period (000) | | $ | 104,689 | | | $ | 207,442 | | | $ | 252,705 | | | $ | 253,532 | | | $ | 273,771 | |
| (a) | Per share amount is based on average shares outstanding during the period. |
| (b) | The Portfolio has entered into arrangements with certain brokers who paid a portion of the Portfolio’s expenses. |
See accompanying notes to financial statements.
MSF-11
Metropolitan Series Fund, Inc.
BlackRock Strategic Value Portfolio
Notes to Financial Statements—December 31, 2008
Metropolitan Series Fund, Inc. (the “Fund”) is organized as a corporation under the laws of Maryland pursuant to Articles of Incorporation filed on November 23, 1982, as amended, and registered under the Investment Company Act of 1940, as amended (the “1940 Act”), as an open-end investment company. The Fund is a “series” type of mutual fund, which issues separate series of stock. Each series represents an interest in a separate portfolio of Fund investments. The BlackRock Strategic Value Portfolio (the “Portfolio”) is a diversified series of the Fund. Shares in the Fund are not offered directly to the general public and are currently available only to separate accounts established by Metropolitan Life Insurance Company (“MetLife”), New England Life Insurance Company, General American Life Insurance Company (“General American”), The MetLife Investors Group of Insurance Companies, MetLife Insurance Company of Connecticut and other affiliated insurance companies (collectively, the “Insurance Companies”) and to certain eligible qualified retirement plans (“Qualified Plans”), as an investment vehicle for variable life insurance, group annuity or variable annuity products of these insurance companies or Qualified Plans, although the Portfolio is not available to all such separate accounts and Qualified Plans. The Portfolio’s shares may be divided into different classes. Currently, the classes being offered by the Portfolio are named Class A, Class B and Class E. The classes of the Portfolio’s shares are identical, except that certain additional charges (Rule 12b-1 fees) are made against Class B and Class E shares. Investment income, realized and unrealized capital gains and losses, the common expenses of the Portfolio and certain Portfolio-level expense reductions, if any, are allocated daily, on a pro rata basis, to each class based on the relative net assets of each class to the total net assets of the Portfolio.
| 2. | SIGNIFICANT ACCOUNTING POLICIES: |
The preparation of financial statements in conformity with accounting principles generally accepted in the United States of America (“GAAP”) requires management to make estimates and assumptions that affect the reported amounts of assets and liabilities and disclosure of contingent assets and liabilities as of the date of the financial statements and the reported amounts of income and expenses during the reporting period. Actual results could differ from those estimates.
The following is a summary of significant accounting policies consistently followed by the Portfolio in the preparation of its financial statements. The policies are in conformity with GAAP.
Investment Valuation:
Debt securities (other than short term obligations with a remaining maturity of sixty days or less) are generally valued on the basis of evaluated or composite bid quotations obtained by independent pricing services and/or brokers and dealers selected by the relevant subadviser pursuant to authorization of the Board of Directors of the Fund (the “Board” or “Directors”). Such quotations take into account appropriate factors such as institutional-sized trading in similar groups of securities, yield, quality, coupon rate, maturity, type of issue, trading characteristics and other data. Short term obligations with a remaining maturity of sixty days or less are valued at amortized cost which approximates fair market value.
Equity securities traded on a national securities exchange or other exchanges are valued at their last sale price on the principal trading market. Equity securities traded on the NASDAQ National Market System are valued at the NASDAQ Official Closing Price (the “NOCP”). The NOCP is the last reported sale price if the last reported sale price falls between the spread of the last reported bid and asked prices. If the last reported bid and asked prices are above the last reported sale price, the NOCP will be the last reported bid price. If the last reported bid and asked prices are below the last reported sale price, the NOCP will be the last reported asked price. Equity securities traded on a national securities exchange or other exchanges or on the NASDAQ National Market System for which there is no reported sale during the day are valued at the last reported bid price. A security that is listed or traded on more than one exchange is valued at the quotation on the exchange determined to be the primary market for that security by the Board or its delegates. If no closing price is available, then such securities are valued by using the last reported bid price. Equity securities traded over-the-counter are valued at the last reported sales price.
If no current market value quotation is readily available or reliable for a portfolio security, fair value will be determined in accordance with procedures established by and under the general supervision of the Board. When the Portfolio uses fair value pricing, it may take into account any factors it deems appropriate. The value of securities used by the Portfolio to calculate its net asset value may differ from quoted or published prices for the same securities. Fair value pricing involves subjective judgments and the fair value determined for a security may be materially different than the value that could be realized upon the sale of that security.
MSF-12
Metropolitan Series Fund, Inc.
BlackRock Strategic Value Portfolio
Notes to Financial Statements—December 31, 2008—(Continued)
The Portfolio expects to use fair value pricing for securities primarily traded on U.S. exchanges only under very limited circumstances. For example, the Portfolio may use fair value pricing if the exchange on which a security is traded closes early or trading in the security is suspended.
Securities traded primarily on an exchange outside of the United States which closes before the close of the New York Stock Exchange will be valued at the last sales price on that non-U.S. exchange. Securities traded primarily on an exchange outside of the United States for which there is no reported sale during the day are valued at the mean between the last reported bid and asked prices. However, because most foreign markets close well before the Portfolio values its securities (typically at 4 p.m. Eastern Time), the earlier close of these foreign markets gives rise to the possibility that significant events, including broad market moves, may have occurred after these foreign markets close but before the Portfolio values its securities. To account for this, the Portfolio may frequently value many of its foreign equity securities using fair value prices based on third party vendor modeling tools.
Forward foreign currency exchange contracts are valued based on the mean between closing bid and asked prices of the forward currency contract rates in the London foreign exchange markets on a daily basis as provided by a reliable bank or dealer.
Options, whether on securities, indices, futures contracts, or otherwise, are valued at the last sales price available as of the close of business on the day of valuation or, if there is no such sale price available, at the mean between the bid and asked prices. Options on currencies are valued at the spot price each day.
The value of futures contracts will be the sum of the margin deposit plus or minus the difference between the value of the futures contract on each day the net asset value is calculated and the value on the date the futures contract originated, value being that established on a recognized commodity exchange, or by reference to other customary sources, with gain or loss being realized when the futures contract closes or expires.
Subject to the Board’s oversight, the Board has delegated the day-to-day oversight of pricing matters, including determinations in good faith under the Fund’s procedures the fair value of securities for which current market quotations are not readily available to the subadviser of the Portfolio.
Investment Transactions and Related Investment Income:
Portfolio security transactions are recorded on the trade date. Dividend income is recorded on the ex-dividend date or, for certain foreign securities, when notified. Interest income, which includes amortization of premium and accretion of discount on debt securities, is recorded on the accrual basis. Realized gains and losses on investments and unrealized appreciation and depreciation are determined on the identified cost basis, which is the same basis used for federal income tax purposes.
Repurchase Agreements:
The Portfolio, through the custodian or a subcustodian, receives delivery of the underlying securities collateralizing repurchase agreements. The Portfolio requires the custodian to take possession, to have legally segregated in the Federal Reserve Book Entry System, or to have segregated within the custodian’s vault, all securities held as collateral for repurchase agreements. It is the Portfolio’s policy that the market value of the collateral be at least equal to 100% of the repurchase price in the case of a repurchase agreement of one-day duration and 102% on all other repurchase agreements. The Portfolio’s subadviser is responsible for determining that the value of the collateral is at all times at least equal to the repurchase price. In connection with transactions in repurchase agreements, if the seller defaults and the value of the collateral declines or if the seller enters an insolvency proceeding, realization of the collateral by the Portfolio may be delayed, limited or wholly denied.
Foreign Currency Translation:
The books and records of the Portfolio are maintained in U.S. dollars. The values of securities, currencies and other assets and liabilities denominated in currencies other than U.S. dollars are translated into U.S. dollars based upon foreign exchange rates prevailing at the end of the period. Purchases and sales of investment securities, income and expenses are translated on the respective dates of such transactions. Since the values of investment securities are presented at the foreign exchange rates prevailing at the end of the period, it is not practical to isolate that portion of the results of operations arising from changes in exchange rates from that portion of the results of operations reflecting fluctuations arising from changes in market prices of the investment securities. Such fluctuations are included in the net realized and unrealized gain or loss on investments.
MSF-13
Metropolitan Series Fund, Inc.
BlackRock Strategic Value Portfolio
Notes to Financial Statements—December 31, 2008—(Continued)
Net realized foreign exchange gains or losses arise from sales of foreign currency, currency gains or losses realized between the trade and settlement dates on securities transactions, and the difference between the amounts of dividends, interest, and foreign withholding taxes recorded by the Portfolio and the U.S. dollar equivalent of the amounts actually received or paid by the Portfolio. Net unrealized foreign exchange gains and losses arise from changes in the value of assets and liabilities, other than investment securities, resulting from changes in the exchange rate.
Forward Foreign Currency Exchange Contracts:
The Portfolio may enter into forward foreign currency exchange contracts primarily to hedge against foreign currency exchange rate risks on its non-U.S. dollar denominated investment securities. When entering into a forward currency contract, the Portfolio agrees to receive or deliver a fixed quantity of foreign currency for an agreed-upon price on an agreed future date. These contracts are valued daily and the Portfolio’s net equity therein, representing unrealized gain or loss on the contracts as measured by the difference between the foreign exchange rates at the dates of entry into the contracts and the forward rates at the settlement date, is included in the Statement of Assets and Liabilities. Realized and unrealized gains and losses are included in the Statement of Operations. These instruments involve market and/or credit risk in excess of the amount recognized in the Statement of Assets and Liabilities. Risks arise from the possible inability of counterparties to meet the terms of their contracts and from movement in currency and securities values and interest rates.
Futures Contracts:
The Portfolio may buy and sell futures contracts (on recognized exchanges) as a hedge, to maintain exposure to the broad equity markets or to enhance return. Futures contracts are agreements to buy or sell a security, or deliver a final cash settlement price in connection with an index, interest rate, currency, or other contracts not calling for physical delivery, for a set price in the future. The Portfolio must post an amount equal to a portion of the total market value of the futures contract as futures variation margin, which is returned when the Portfolio’s obligations under the contract have been satisfied. From time to time thereafter, the Portfolio may have to post variation margin to maintain this amount as the market value of the contract fluctuates. Risks of entering into futures contracts (and related options) include the possibility that there may be an illiquid market and that a change in the value of the contract or option may not correlate with changes in the value of the underlying securities.
Options:
The Portfolio may use options to hedge against changes in values of securities the Portfolio owns or expects to purchase, to maintain exposure to the broad equity markets or to enhance return. Writing puts or buying calls tends to increase the Portfolio’s exposure to the underlying instrument and writing calls or buying puts tends to decrease the Portfolio’s exposure to the underlying instrument, and can be used to hedge other Portfolio investments. For options purchased to hedge the Portfolio’s investments, the potential risk to the Portfolio is that the change in value of options contracts may not correspond to the change in value of the hedged instruments. In addition, losses may arise from changes in the value of the underlying instruments, if there is an illiquid secondary market, or if the counterparty is unable to perform. The maximum loss for purchased options is limited to the premium initially paid for the option. For options written by the Portfolio, the maximum loss is not limited to the premium initially received for the option.
The main risk associated with purchasing an option is that the option expires without being exercised. In this case, the option expires worthless and the premium paid for the option is considered the loss. The risk associated with writing a call option is that the Portfolio may forgo the opportunity for a profit if the market value of the underlying position increases and the option is exercised. The risk in writing a put option is that the Portfolio may incur a loss if the market value of the underlying position decreases and the option is exercised. In addition, the Portfolio risks not being able to enter into a closing transaction for the written option as the result of an illiquid market.
“When-Issued” Securities:
Purchasing securities “when-issued” is a forward commitment by the Portfolio to buy a security. The estimated amount of the Portfolio’s payment obligation and the security’s interest rate are determined when the commitment is made, even though no interest accrues until the security is issued, which is generally 15 to 120 days later. The Portfolio will segregate liquid assets with its custodian sufficient at all times to satisfy these commitments. If the value of the security is less when delivered than when the commitment was made, the Portfolio will suffer a loss.
MSF-14
Metropolitan Series Fund, Inc.
BlackRock Strategic Value Portfolio
Notes to Financial Statements—December 31, 2008—(Continued)
Federal Income Taxes:
It is the Portfolio’s policy to comply with the requirements of the Internal Revenue Code of 1986, as amended (the “Code”), and regulations thereunder, applicable to regulated investment companies and to distribute, with respect to each taxable year, all of its taxable income to shareholders. Therefore, no federal income tax provision is required. The Portfolio is subject to the provisions of the Financial Accounting Standards Board Interpretation (“FASB”) No. 48, Accounting for Uncertainties in Income Taxes (FIN 48). FIN 48 sets forth a minimum threshold for financial statement recognition of the benefit of a tax position taken or expected to be taken in a tax return. The implementation of FIN 48 did not result in any unrecognized tax benefits in the accompanying financial statements. Each of the Portfolio’s federal tax returns for the prior three fiscal years remains subject to examination by the Internal Revenue Service.
As of December 31, 2008, the Portfolio had $187,013,415 in capital loss carryforwards expiring on December 31, 2016.
Pursuant to Section 852 of the Code, the Portfolio designated the amount shown below under Long Term Gain as capital gain dividends for its taxable year ended December 31, 2008. The tax character of distributions paid for the periods ended December 31, 2008 and 2007 was as follows:
| | | | | | | | | | | | | | | | | | | | | | |
| Ordinary Income | | Long Term Gain | | Return of Capital | | Total |
| 2008 | | 2007 | | 2008 | | 2007 | | 2008 | | 2007 | | 2008 | | 2007 |
| $ | 31,951,000 | | $ | 75,634,272 | | $ | 39,911,933 | | $ | 44,500,409 | | $ | — | | $ | — | | $ | 71,862,933 | | $ | 120,134,681 |
As of December 31, 2008, the components of distributable earnings (accumulated losses) on a federal income tax basis were as follows:
| | | | | | | | | | | | | | | | |
Undistributed
Ordinary
Income | | Undistributed
Long Term
Gain | | Unrealized
Depreciation | | | Loss
Carryforwards | | | Total | |
| $ | 3,872,234 | | $ | — | | $ | (65,725,734 | ) | | $ | (187,013,415 | ) | | $ | (248,866,915 | ) |
Pursuant to Federal income tax regulations applicable to investment companies, the Portfolio has elected to treat net capital losses realized between November 1 and December 31 of each year as occurring on the first day of the following tax year. For the year ended December 31, 2008, the following amounts of realized capital and currency losses reflected in the accompanying financial statements will not be recognized for Federal income tax purposes until January 1, 2009:
| | | | |
Currency | | Capital | |
$— | | $ | (80,075,724 | ) |
Dividends and Distributions to Shareholders:
The Portfolio records dividends and distributions on the ex-dividend date. Net realized gains from security transactions (if any) are generally distributed annually to shareholders. The timing and characterization of certain income and capital gains distributions are determined in accordance with federal tax regulations that may differ from GAAP. Permanent book and tax basis differences relating to shareholder distributions will result in reclassification between under/over distributed net investment income, accumulated net realized gains/losses and paid in capital.
Expense Reductions:
Certain Portfolio trades are directed to brokers who paid a portion of the Portfolio’s expenses. Amounts paid for the Portfolio are shown as expense reductions in the Statement of Operations.
| 3. | INVESTMENT TRANSACTIONS: |
For the year ended December 31, 2008, purchases and sales of securities (excluding short term investments) for the Portfolio were as follows:
| | | | | | | | | | |
| Purchases | | Sales |
U.S. Government | | Other | | U.S. Government | | Other |
| $ | 0 | | $ | 1,237,699,344 | | $ | 0 | | $ | 1,327,092,653 |
MSF-15
Metropolitan Series Fund, Inc.
BlackRock Strategic Value Portfolio
Notes to Financial Statements—December 31, 2008—(Continued)
| 4. | INVESTMENT MANAGEMENT FEES AND OTHER TRANSACTIONS WITH AFFILIATES: |
Investment Management Agreement:
MetLife Advisers, LLC (“MetLife Advisers”) is the investment adviser to the Portfolio. The Fund has entered into an investment management agreement with MetLife Advisers with respect to the Portfolio. For providing investment management services to the Portfolio, MetLife Advisers receives monthly compensation at the following annual rates:
| | | | |
Management
Fees earned by
MetLife Advisers
for the year ended
December 31, 2008 | | Annual
percentage
rates paid to
MetLife Advisers | | Based on Portfolios
average daily net asset
levels |
| $5,691,931 | | 0.850% | | Of the first $500 million |
| | 0.800% | | Of the next $500 million |
| | 0.750% | | On amounts in excess of $1 billion |
Certain officers and directors of the Fund may also be officers of MetLife Advisers; however, such officers and directors receive no compensation from the Fund.
MetLife Advisers has entered into an investment subadvisory agreement with respect to the Portfolio. BlackRock Advisors, LLC is compensated by MetLife Advisers to provide subadvisory services for the Portfolio.
Service and Distribution Fees:
The Fund has adopted a Distribution and Service Plan under Rule 12b-1 of the 1940 Act for the Portfolio’s Class B and E shares. Under the Distribution and Service Plan, the Class B and E shares of the Portfolio pay a fee to compensate the Insurance Companies (or their affiliates) and other broker-dealers and financial intermediaries involved in the offer and sale of Portfolio shares for promoting or selling and servicing the Class B and E shares. The fees under the Distribution and Service Plan for each class of the Portfolio’s shares are calculated as a percentage of the Portfolio’s average daily net assets that are attributable to that Class. Currently, the fee is 0.25% per year for Class B shares and 0.15% per year for Class E shares. Amounts paid by the Portfolio for the year ended December 31, 2008 are shown as Service and Distribution fees in the Statement of Operations.
The Fund has entered into a securities lending arrangement with the Fund’s custodian, State Street Bank and Trust Company (the “custodian”). Under the agreement, the custodian is authorized to loan securities on the Portfolios’ behalf. In exchange, the Portfolio receives either cash or securities as collateral against the loaned securities. The Portfolio receives collateral at least equal to 102% of the market value of the loaned securities (105% for foreign securities), at each loan’s inception. Collateral must be maintained at least at 100% of the market value of the loaned securities for the duration of the loan. The cash collateral is invested in the Navigator Securities Lending Prime Portfolio, an affiliate of the custodian, which invests in a variety of high quality U.S. dollar-denominated instruments. If the market value of the collateral at the close of trading on a business day is less than 100% of the market value of the loaned securities at the close of trading on that day, the borrower shall be required to deliver, by the close of business on the following business day, an additional amount of collateral, equal to at least 100% of the market value of all the loaned securities as of such preceding day. The Portfolio receives 80% of the annual net income from securities lending transactions, which is included in interest income of the Portfolio. The remaining 20% is paid to the custodian as compensation for its securities lending services. Interest income received by the Portfolio via lending transactions during the year ended December 31, 2008 is footnoted in the Statement of Operations. The Portfolio bears the risk of any deficiency in the amount of collateral available for return to a borrower due to a loss in an approved investment purchased with such collateral. Any outstanding loans by the Portfolio at December 31, 2008 are footnoted in the Schedule of Investments.
| 6. | MARKET AND CREDIT RISK: |
In the normal course of business, the Portfolio invests in securities and enters into transactions where risks exist due to fluctuations in the market (market risk) or failure of the other party to a transaction to perform (credit risk). The value of securities held by the Portfolio may decline in response to certain events, including those directly involving the companies whose securities are owned by the Portfolio; conditions affecting the general economy; overall market changes; local, regional or global political, social or economic instability; and currency and interest rate and price fluctuations. Similar to credit risk, the Portfolio
MSF-16
Metropolitan Series Fund, Inc.
BlackRock Strategic Value Portfolio
Notes to Financial Statements—December 31, 2008—(Continued)
may be exposed to counterparty risk, or the risk that an entity with which the Portfolio has unsettled or open transactions may default. Financial assets, which potentially expose the Portfolio to credit and counterparty risks, consist principally of investments and cash due from counterparties. The extent of the Portfolio’s exposure to credit and counterparty risks in respect to these financial assets approximates their value as recorded in the Portfolio’s Statements of Assets and Liabilities.
| 7. | RECENT ACCOUNTING PRONOUNCEMENTS: |
In March 2008, the FASB issued Statement of Financial Accounting Standards No. 161, Disclosures about Derivative Instruments and Hedging Activities (“FAS 161”), an amendment of FASB Statement No. 133. FAS 161 requires enhanced disclosures about (a) how and why an entity uses derivative instruments, (b) how derivative instruments and hedging activities are accounted for, and (c) how derivative instruments and related hedging activities affect a fund’s financial position, financial performance, and cash flows. Management does not believe the adoption of FAS 161 will materially impact the financial statement amounts, but will require additional disclosures. This will include qualitative and quantitative disclosures on derivative positions existing at period end and the effect of using derivatives during the reporting period. FAS 161 is effective for financial statements issued for fiscal years and interim periods beginning after November 15, 2008. Management is currently evaluating the impact the adoption of FAS 161 will have on the Portfolio’s financial statement disclosures.
MSF-17
Metropolitan Series Fund, Inc.
BlackRock Strategic Value Portfolio
Report of Independent Registered Public Accounting Firm
To the Shareholders and Board of Directors of Metropolitan Series Fund, Inc.:
We have audited the accompanying statement of assets and liabilities, including the schedule of investments, of the BlackRock Strategic Value Portfolio (one of the portfolios constituting the Metropolitan Series Fund, Inc.) (the “Fund”) as of December 31, 2008, and the related statement of operations for the year then ended, the statements of changes in net assets for each of the two years in the period then ended, and the financial highlights for each of the five years in the period then ended. These financial statements and financial highlights are the responsibility of the Fund’s management. Our responsibility is to express an opinion on these financial statements and financial highlights based on our audits.
We conducted our audits in accordance with the standards of the Public Company Accounting Oversight Board (United States). Those standards require that we plan and perform the audit to obtain reasonable assurance about whether the financial statements and financial highlights are free of material misstatement. The Fund is not required to have, nor were we engaged to perform, an audit of its internal control over financial reporting. Our audits included consideration of internal control over financial reporting as a basis for designing audit procedures that are appropriate in the circumstances, but not for the purpose of expressing an opinion on the effectiveness of the Fund’s internal control over financial reporting. Accordingly, we express no such opinion. An audit also includes examining, on a test basis, evidence supporting the amounts and disclosures in the financial statements, assessing the accounting principles used and significant estimates made by management, as well as evaluating the overall financial statement presentation. Our procedures included confirmation of securities owned as of December 31, 2008, by correspondence with the custodian and brokers; where replies were not received from brokers, we performed other auditing procedures. We believe that our audits provide a reasonable basis for our opinion.
In our opinion, the financial statements and financial highlights referred to above present fairly, in all material respects, the financial position of the BlackRock Strategic Value Portfolio of the Metropolitan Series Fund, Inc. as of December 31, 2008, the results of its operations for the year then ended, the changes in its net assets for each of the two years in the period then ended, and the financial highlights for each of the five years in the period then ended, in conformity with accounting principles generally accepted in the United States of America.
Deloitte & Touche LLP
Boston, Massachusetts
February 20, 2009
MSF-18
Metropolitan Series Fund, Inc.
Directors and Officers
The Fund’s Directors review actions of the Fund’s investment adviser and subadvisers, and decide upon matters of general policy. The Fund’s officers supervise the daily business operations of the Fund. The Board of Directors and the Fund’s officers are listed below. Each Director is responsible for overseeing all 38 Portfolios of the Fund. There is no limit to the term a Director may serve. Directors serve until their resignation, retirement or removal in accordance with the Fund’s organizational documents and policies adopted by the Board from time to time. Officers hold office at the pleasure of the Board or until the election or appointment and the qualification of a successor. The address of the Directors and officers is c/o Metropolitan Series Fund, Inc., 501 Boylston Street, Boston, MA 02116.
Interested Directors(1)
Each Director below is an “interested person” (as defined by the 1940 Act) with respect to the Fund in that Ms. Forget is an employee of MetLife and Mr. Typermass is a former employee of MetLife and owns securities issued by MetLife, Inc., the ultimate parent company of MetLife Advisers.
| | | | | | | | |
Name, Address and Age | | Current
position(s)
with Fund | | Position(s)
held since | | Principal occupations
over past five years, including other directorships(2) | | Number of
Portfolios in
Fund Complex
Overseen by
Director(3) |
Elizabeth M. Forget Age: 42 | | Director, Chairman of the Board, President and Chief Executive Officer | | 2006 | | Senior Vice President (since 2007), MetLife, Inc.; President, Met Investors Advisory, LLC; Trustee and President, Met Investors Series Trust; Executive Vice President, MetLife Investors Group, Inc.; President, Chief Executive Officer and Chair of the Board of Managers (since 2006), MetLife Advisers; President, Met Investors Advisory, LLC. | | 87 |
| | | | |
Arthur G. Typermass Age: 71 | | Director | | 1998 | | Formerly, Senior Vice President and Treasurer, MetLife. | | 38 |
Non-Interested Directors(1)
Each Director below is not an “interested person” (as defined by the 1940 Act) with respect to the Fund (collectively, the “Independent Directors”).
| | | | | | | | |
Name, Address and Age | | Current
position(s)
with Fund | | Position(s)
held since | | Principal occupations
over past five years, including other directorships(2) | | Number of
Portfolios in
Fund Complex
Overseen by
Director(3) |
Steve A. Garban† Age: 71 | | Director | | 1985 | | Formerly, Chief Financial Officer, Senior Vice President Finance and Operations and Treasurer (Emeritus), The Pennsylvania State University. | | 38 |
| | | | |
Linda B. Strumpf Age: 61 | | Director | | 2000 | | Vice President and Chief Investment Officer, Ford Foundation. | | 38 |
| | | | |
Michael S. Scott Morton† Age: 71 | | Director | | 1993 | | Jay W. Forrester Professor of Management (Emeritus) at Sloan School of Management, MIT. | | 38 |
| | | | |
H. Jesse Arnelle Age: 75 | | Director | | 2001 | | Formerly, Counsel, Womble Carlyle Sandrie & Rice; Director, Textron Inc. (global multi- industry company)*; formerly, Director, Gannet Co. Inc. (diversified news and information company)*; formerly, Director, Eastman Chemical Company (global chemical company)*; formerly, Director, Waste Management, Inc.*; formerly, Director, Armstrong Holdings Inc. (parent company of floor and ceiling products business)*; formerly, Director, FPL Group Inc. (public utility holding company)*; Director, URS Corporation (engineering design services firm)*. | | 38 |
MSF-19
Metropolitan Series Fund, Inc.
Directors and Officers—(Continued)
| | | | | | | | |
Name, Address and Age | | Current
position(s)
with Fund | | Position(s)
held since | | Principal occupations
over past five years, including other directorships(2) | | Number of
Portfolios in
Fund Complex
Overseen by
Director(3) |
Nancy Hawthorne Age: 57 | | Director | | 2003 | | Chief Executive Officer, Clerestory LLC (corporate financial advisor); Director, Avid Technologies (computer software company)*; formerly, Chairman of the Board of Avid Technologies; formerly, Board of Advisors, L. Knife & Sons, Inc. (beverage distributor); formerly, Trustee, New England Zenith Fund (“Zenith Fund”)**; formerly, Chief Executive Officer and Managing Partner, Hawthorne, Krauss and Associates (corporate financial advisor); formerly, Chief Financial Officer and Executive Vice President, Continental Cablevision, subsequently renamed MediaOne (cable television company); formerly, Director, Life F/X, Inc.; formerly, Chairman of the Board, WorldClinic (distance medicine company); formerly, Director, Perini Corporation (construction company)*; formerly, Director, CGU (property and casualty insurance company); formerly, Director, Beacon Power Corporation (energy company)*. | | 38 |
| | | | |
John T. Ludes Age: 72 | | Director | | 2003 | | President, LFP Properties (consulting firm); Formerly, Trustee, Zenith Fund**; formerly, Vice Chairman, President and Chief Operating Officer, Fortune Brands/American Brands (global conglomerate); formerly, President and CEO, Acushnet Company (athletic equipment company). | | 38 |
Officers(1)
| | | | | | | | |
Name and address | | Age | | Current
position(s)
with Fund | | Position(s)
held since | | Principal occupations over past five years(2) |
| Jeffrey L. Bernier | | 37 | | Senior Vice President | | 2008 | | Vice President (since 2008), MetLife, Inc.; Vice President (since 2008), MetLife; Senior Vice President (since 2008), MetLife Advisers; formerly, Director and Senior Investment Analyst (2004 to 2007), John Hancock Financial Services; formerly, Assistant Vice President (2000 to 2001), Wachovia Securities. |
| | | | |
| Alan C. Leland | | 56 | | Senior Vice President | | 2005 | | Treasurer and Chief Financial Officer, MetLife Advisers, LLC; Treasurer (since 2005), Met Investors Advisory, LLC; Vice President (since 2004), Met Investors Advisory, LLC; Vice President (since 2003), MetLife, Inc.; Vice President, MetLife; Senior Vice President, NELICO. |
| | | | |
| Peter Duffy | | 53 | | Vice President
and Treasurer | | 2000 | | Senior Vice President, MetLife Advisers; Second Vice President (since 2003), NELICO; Vice President, MetLife (since 2004); Vice President (since 2004), MetLife, Inc.; formerly, Vice President and Treasurer, Zenith Fund**. |
| | | | |
| Jeffrey P. Halperin | | 41 | | Chief
Compliance Officer | | 2007 | | Vice President (since 2006), MetLife, Inc.; Vice President (since 2006), MetLife; Chief Compliance Officer (since 2006), Met Investors Series Trust, MetLife Advisers, Met Investors Advisory, LLC and MetLife Investment Advisors Company, LLC. |
| * | Indicates a directorship with a registered investment company or a company subject to the reporting requirements of the Securities Exchange Act of 1934, as amended. |
| ** | The Zenith Fund deregistered with the Securities and Exchange Commission (“SEC”) in 2004. |
| (†) | Served as a trustee, director and/or officer of one or more of the following companies, each of which had a direct or indirect advisory relationship with MetLife Advisers or its affiliates prior to January 31, 2005: State Street Research Financial Trust, State Street Research Income Trust, State Street Research Money Market Trust, State Street Research Institutional Funds, State Street Research Capital Trust, State Street Research Master Investment Trust, State Street Research Equity Trust, State Street Research Securities Trust and State Street Research Exchange Trust (collectively, the “State Street Research Funds”). |
| (1) | During the period shown, each Director of the Fund served as a Trustee of Metropolitan Series Fund II, a registered investment company that ceased investment operations in June of 2008 and has applied for deregistration under the Investment Company Act of 1940. During this period, each officer of the Fund served in the same position with Metropolitan Series Fund II. |
| (2) | Previous positions during the past five years with the Fund; Met Investors Series Trust; MetLife; MetLife, Inc.; MetLife Advisers; Met Investors Advisory, LLC; Zenith Fund; NELICO; or New England Securities Corporation are omitted if not materially different. |
| (3) | The Fund Complex includes the Fund (38 portfolios) and Met Investors Series Trust (49 portfolios). |
MSF-20
Metropolitan Series Fund, Inc.
BlackRock Strategic Value Portfolio
Board Approval of Advisory and Subadvisory Agreements
The Fund’s Contract Review Committees of the Board of Directors (the “Board” or the “Directors”) typically meet in early fall to review the Portfolios’ advisory agreements (the “Advisory Agreements”) and subadvisory agreements (the “Subadvisory Agreements,” and, together with the Advisory Agreements, the “Agreements”) and determine whether to recommend that the full Board approve the continuation of the Agreements for an additional one-year period. (Following the initial approval of an Agreement for a new Portfolio or with a new adviser or subadviser, such annual reviews are not required until 2 years following the execution of such Agreement.) After each Committee has made its recommendations, the full Board, including the Independent Directors, determines whether to approve the continuation of each of the Agreements. In addition, the Board, including the Independent Directors, considers matters bearing on the Agreements at most of its other meetings throughout the year and regularly interviews various individuals at MetLife Advisers responsible for the management of the Portfolios. The Directors also interview selected investment managers and other professionals at the subadvisers at various times throughout the year.
The Directors receive all materials that they or MetLife Advisers, the Fund’s investment adviser, and the subadvisers believe to be reasonably necessary for the Directors to evaluate the Agreements and determine whether to approve the continuation of the Agreements. These materials generally include, among other items, (i) information on the investment performance of the Portfolios and the performance of peer groups of funds and the Portfolios’ performance benchmarks, (ii) information on the Portfolios’ advisory and subadvisory fees and other expenses, including information comparing the Portfolios’ expenses to those of peer groups of funds and information about any applicable expense caps and fee “breakpoints,” (iii) sales and redemption data, (iv) information related to the profitability of the Agreements to MetLife Advisers and certain of the subadvisers, and potential “fall-out” or ancillary benefits that MetLife Advisers, the subadvisers or their affiliates may receive as a result of their relationships with the Fund and (v) information obtained through the subadvisers’ responses to certain requests from MetLife Advisers and the Directors and MetLife Advisers’ responses to requests from the Directors. The Directors may also consider other information such as (vi) MetLife Advisers’ and the subadvisers’ financial results and condition, (vii) each Portfolio’s investment objectives and strategies and the size, education and experience of the investment staffs of MetLife Advisers and the relevant subadvisers and their use of technology and external research, (viii) the allocation of the Portfolios’ brokerage, if any, including allocations to brokers affiliated with the subadvisers and the use of “soft” commission dollars to pay Portfolio expenses and to pay for research and other similar services, (ix) the resources devoted to, and the record of compliance with, the Portfolios’ investment policies and restrictions, policies on personal securities transactions and other compliance policies, (x) the responses of MetLife Advisers, the subadvisers and/or their affiliates to certain legal and regulatory proceedings and (xi) the economic outlook generally and for the mutual fund industry in particular. Throughout the process, the Directors have the opportunity to ask questions of and request additional materials from MetLife Advisers and the subadvisers.
Following meetings of each Contract Review Committee on September 10, 2008, the Board, including the Independent Directors, at its November 6-7, 2008 meeting, approved the continuation through December 31, 2009 of the Advisory Agreements for each Portfolio of the Fund and the Subadvisory Agreements for each Portfolio other than the Zenith Equity Portfolio and Asset Allocation Portfolios (which do not have subadvisers) and the Van Eck Global Natural Resources Portfolio, Met/Dimensional International Small Cap Portfolio and Loomis Sayles Small Cap Growth Portfolio (formerly known as the Franklin Templeton Small Cap Growth Portfolio). The Agreements approved for continuation are referred to below as the “Continued Agreements.”
In considering whether to approve the continuation of the Continued Agreements, the Directors, including the Independent Directors, did not identify any single factor as determinative, and each weighed the various factors as he or she deemed appropriate. The Directors considered the following matters in connection with their approval of the Continued Agreements:
The nature, extent and quality of the services provided to the relevant Portfolios under the Continued Agreements. The Directors considered the nature, extent and quality of the services provided by MetLife Advisers, the relevant subadvisers (if any) and their affiliates (each, an “Adviser,” and, collectively, the “Advisers”) to the relevant Portfolios pursuant to the Continued Agreements and the resources dedicated to these Portfolios by the Advisers. In particular, the Directors considered the Advisers’ abilities to attract and retain highly qualified investment professionals. With respect to MetLife Advisers, the Directors considered (for each Portfolio other than the Zenith Equity and Asset Allocation Portfolios) that MetLife Advisers is (i) ultimately responsible for the performance of such Portfolios; (ii) ultimately responsible for the establishment of the investment strategies of each such Portfolio, primarily through its recommendations to the Board regarding the hiring and selection of subadvisers; (iii) responsible for the hiring and selection, subject to Board approval, of subadvisers; and (iv) responsible for maintaining a program of Subadviser oversight reasonably designed to ensure that the subadvisers have reasonable compliance policies and procedures in place. The Directors also considered that MetLife Advisers provides a full range of day-to-day administrative services for the Portfolios involving all aspects of such Portfolios’ day-to-day operations (other than portfolio management). With respect to the Zenith Equity and Asset Allocation Portfolios, the Directors considered both the portfolio management services and the administrative services provided by MetLife Advisers. After reviewing
MSF-21
Metropolitan Series Fund, Inc.
BlackRock Strategic Value Portfolio
Board Approval of Advisory and Subadvisory Agreements—(Continued)
these and related factors, the Directors concluded, within the context of their overall conclusions regarding each of the Continued Agreements, that the nature, extent and quality of services provided supported the renewal of these Agreements.
Investment performance of the relevant Portfolios. The Directors reviewed information about the performance of the relevant Portfolios over various time periods, including information prepared by an independent third party that compared the performance of the Portfolios to the performance of peer groups of funds and performance benchmarks. The Directors also reviewed a description of the third party’s methodology for identifying a Portfolio’s peer group(s) for purposes of performance and expense comparisons.
In the case of each relevant Portfolio that had performance that lagged its peer group(s) for certain periods, the Directors concluded that other factors relevant to performance were sufficient, in light of other considerations, to warrant renewal of the Continued Agreements relating to such Portfolio. These factors varied from Portfolio to Portfolio, but included one or more of the following: (i) that such Portfolio’s performance, although lagging in certain recent periods, was stronger over the longer term; (ii) that the underperformance was attributable, to a significant extent, to investment decisions that were reasonable and consistent with the Portfolio’s investment objective(s) and policies and that the Portfolio was performing within the range of reasonable expectations, given market conditions and the Portfolio’s investment objective(s) and policies; (iii) that the Portfolio’s performance was competitive when compared to other relevant performance benchmarks or peer groups; and (iv) that MetLife Advisers and/or the relevant subadviser (if any) had taken or was taking steps designed to help improve the Portfolio’s investment performance (including, in the case of certain Portfolios, that MetLife Advisers was formulating possible proposals, for presentation to the Board in November 2008, to replace the Portfolio’s subadviser or to merge the Portfolio into another Portfolio with a similar investment objective and better investment performance).
The Directors also considered the investment performance of the Advisers and their reputations generally, the historical responsiveness of the Advisers to Director concerns about performance and the willingness of the Advisers to take steps intended to improve performance.
After reviewing these and related factors, the Directors concluded, within the context of their overall conclusions regarding each of the Continued Agreements, that the investment performance of each relevant Portfolio and Adviser was sufficient, in light of other considerations, to warrant the renewal of the Continued Agreements.
The costs of the services to be provided and profits to be realized by the Advisers and their affiliates from their relationships with the Portfolios. The Directors considered the fees charged by MetLife Advisers to the Portfolios for advisory services and, with respect to the subadvised Portfolios, by such subadvisers to MetLife Advisers for subadvisory services (such advisory and subadvisory fees (if any), collectively, “Fees”), as well as the total expense levels of the Portfolios. This information included comparisons (provided by an independent third party) of the Portfolios’ advisory fees and total expense levels to those of their peer groups. In evaluating Fees for the relevant Portfolios, the Directors also took into account the demands, complexity and quality of the investment management services provided to each Portfolio. The Directors considered MetLife Advisers’ recommendations regarding reductions in Fee rates, implementation of Fee breakpoints and institution of Fee waivers and expense caps.
The Directors also considered the compensation directly or indirectly received by the Advisers and their affiliates from their relationships with the relevant Portfolios. The Directors reviewed information relating to the profits received by MetLife Advisers, certain of the subadvisers and their affiliates as a result of their relationships with the relevant Portfolios, and information about the allocation of expenses used to calculate profitability. When reviewing profitability, the Directors also considered the performance of the relevant Portfolios, the expense levels of such Portfolios and whether the relevant Advisers had implemented breakpoints, fee waivers and/or expense caps with respect to such Portfolios.
After reviewing these and related factors, the Directors concluded, within the context of their overall conclusions regarding each of the Continued Agreements, that the Fees charged to each of the relevant Portfolios were fair and reasonable, and that the information provided regarding costs of these services generally, and the related profitability (if known) to the relevant Advisers of their relationships with the relevant Portfolios, supported the renewal of the Continued Agreements.
Economies of Scale. The Directors considered the existence of any economies of scale in the provision of services by the Advisers and whether those economies were shared with the relevant Portfolios through breakpoints in their advisory fees or other means, such as expense caps, fee waivers or relatively low levels of fees. The Directors noted that most of the relevant Portfolios benefited or will benefit from breakpoints, expense caps and/or fee waivers with respect to their advisory fees. In considering these issues, the Directors also took into consideration information relating to the costs of the services provided and the profitability to MetLife Advisers, the relevant subadvisers (if any) and each of their affiliates of their relationships with the relevant Portfolios, as discussed above.
MSF-22
Metropolitan Series Fund, Inc.
BlackRock Strategic Value Portfolio
Board Approval of Advisory and Subadvisory Agreements—(Continued)
After reviewing these and related factors, the Directors concluded, within the context of their overall conclusions regarding each of the Continued Agreements, that the extent to which economies of scale were shared with the relevant Portfolios supported the renewal of such Agreements.
Other Factors. The Directors also considered other factors, which included but were not limited to the following:
| | • | | the extent to which each relevant Portfolio operated in accordance with its investment objective, and its record of compliance with its investment restrictions and the compliance programs of the Fund and the Advisers. They also considered the compliance-related resources the Advisers and their affiliates provide to the relevant Portfolios; |
| | • | | the nature, quality, cost and extent of administrative and shareholder services performed by MetLife Advisers and its affiliates under the Advisory Agreements; and |
| | • | | so-called “fall-out benefits” to the Advisers, such as the engagement of their affiliates to provide distribution, brokerage and transfer agency services to the Portfolios, and the benefits of research made available to the relevant Advisers by reason of brokerage commissions generated by the relevant Portfolios’ securities transactions. The Directors also considered the possible conflicts of interest associated with these fall-out and other benefits, and the reporting and other processes in place to disclose and monitor these possible conflicts of interest. |
Based on their evaluation of all factors that they deemed to be material, including those factors described above, and assisted by the advice of independent counsel, the Directors, including the Independent Directors, concluded that each of the Continued Agreements should be continued through December 31, 2009.
MSF-23
A description of the policies and procedures that the Fund uses to determine how to vote proxies relating to portfolio securities is available (i) without charge, upon request, by calling (800) 638-7732 and (ii) on the Securities and Exchange Commission’s (the “SEC”) website at http://www.sec.gov.
Information regarding how the Fund voted proxies relating to portfolio securities during the most recent twelve-month period ended December 31, 2008 is available (i) without charge, upon request, by calling (800) 638-7732 and (ii) on the SEC’s website at http://www.sec.gov.
The Fund’s Statement of Additional Information includes additional information about the Directors of the Fund and is available (i) without charge, upon request, by calling (800) 638-7732 and (ii) on the SEC’s website at http://www.sec.gov.
The Fund files with the SEC a complete schedule of its portfolio holdings, as of the close of the first and third quarters of its fiscal year, on “Form N-Q”. These filings are available on the SEC’s website at www.sec.gov and may be reviewed and copied at the SEC’s Public Reference Room in Washington, DC. (Call 1-800-SEC-0330 for information on the operation of the Public Reference Room.)
MSF-24
Simplify your life…
with MetLife eDelivery® while helping MetLife preserve the planet’s natural resources.
(see details on inside cover)
| | |
Metropolitan Series Fund, Inc. Capital Guardian U.S. Equity Portfolio Annual Report | | December 31, 2008 |
NOT PART OF THE ANNUAL REPORT
Letter from the President
February 1, 2009
Letter to Policy Holders:
2008 was an extraordinary year in the capital markets around the world and for the global economy. Energy prices rose to record levels early in the year before falling by two-thirds by year-end. A credit crisis that began with concerns about sub-prime mortgages led to massive changes in the financial landscape with government takeovers, forced sales, and outright failures of a number of large, once venerable firms.
While bonds as measured by the Barclays Capital U.S. Aggregate Bond Index (formerly known as, Lehman Brothers U.S. Aggregate Bond Index) were up 5.2% for the year in response to declining interest rates, there were large differences in the total returns of the various sectors of the bond market. U.S. treasury securities were up over 13% as frightened investors sought refuge in what they perceived to be the safest and most liquid investments. In contrast, investment grade corporate securities lost nearly 5% as credit spreads widened and below investment grade or high yield bonds fell over 26%.
In response to the growing credit crisis and the weakening economy, common stocks fell sharply across all regions, styles, and capitalizations. As measured by the Standard and Poor’s 500, U.S. common stocks fell 37% for the year, the worst calendar year decline since the 1930s. Foreign stocks were down even more with the MSCI EAFE Index down 43% for the year.
On the following pages, you will find a complete review of your Portfolio and its investment performance.
MetLife is committed to building your financial freedom. We appreciate your trust and will continue to focus our efforts on meeting your investment needs.
Sincerely,
Elizabeth M. Forget
President, Metropolitan Series Fund, Inc.
Metropolitan Series Fund, Inc.
Capital Guardian U.S. Equity Portfolio
Managed by Capital Guardian Trust Company
Portfolio Manager Commentary*
PORTFOLIO PERFORMANCE
For the twelve-month period ended December 31, 2008, the Class A shares of the Capital Guardian U.S. Equity Portfolio returned -40.2%, compared to its benchmark, the Standard & Poor’s 500 Index1, which returned -37.0%. The average return of its peer group, the Lipper Variable Insurance Products2 Multi-Cap Core Funds Universe, was -38.6% over the same period.
PORTFOLIO REVIEW
The U.S. market was the epicenter of the global collapse, as a cascade of events threatened to crumble its bulwarks. Credit evaporated, investment banks went bust and U.S. housing and consumer spending broke down, pushing automakers to the brink of collapse. Despite heavy intervention by the U.S. government, investors became increasingly alarmed and sought shelter from the storm, sending the S&P 500 Index down 37.0%.
The year began cautiously as fallout from 2007’s subprime mortgage trouble rippled through the credit markets, causing the eventual collapse of collateralized debt obligations and leaving major financial institutions with massive amounts of untradeable bonds on their books. Though the government facilitated buyouts of many major banks and lenders it essentially refused to come to the aid of Lehman Brothers. The firm was forced to file for bankruptcy, igniting fear of a complete collapse of the banking system.
By the end of September, the carnage was substantial. All of the major independent investment banks had been taken over, gone under or had applied to become traditional bank-holding companies, and three major institutions, Freddie Mac, Fannie Mae and American International Group, were under the control of the government. Credit markets had seized up; companies began having trouble rolling over their commercial paper and cities were unable to market and sell municipal bonds.
The Portfolio underperformed the benchmark mainly due to stock selection in several sectors. We began the year with holdings in financials that we believed would come through the credit crunch able to grow and increase market share. However, we underestimated the severity of the credit crisis and the extent to which companies with strong balance sheets were vulnerable. Our selection of consumer discretionary and information technology companies also detracted from the Portfolio’s performance. The overweight position and selection in health care added to returns (although UnitedHealth Group was a detractor), as did the choice of materials and industrials stocks.
Freddie Mac and Fannie Mae were among the largest drags on relative results, along with Lehman Brothers and Wachovia. Yet other financial holdings, including JPMorgan Chase and Wells Fargo, were among the top contributors to relative returns. The Portfolio also benefited from not owning Citigroup. Elsewhere, ImClone Systems, which was bought by Eli Lilly, and Genentech, which received a bid from Roche, impacted results positively. Barrick Gold also helped returns as the price of the precious metal rose.
* The views expressed above are those of the subadvisory firm as of December 31, 2008 and are subject to change based on market and other conditions. Information about the Portfolio’s holdings, asset allocation, industry allocation, or country diversification is historical and is not an indication of future Portfolio composition, which will vary. The performance of any index mentioned in this commentary has not been adjusted for ongoing management, distribution and operating expenses, and sales charges applicable to mutual fund investments. Direct investment in any index is not possible.
1 The Standard & Poor’s (S&P) 500® Composite Stock Price Index is an unmanaged index representing the performance of 500 major companies, most of which are listed on the New York Stock Exchange.
2 The Lipper Variable Products Fund Average is an average of the total return performance (calculated on the basis of net asset value) of variable product funds with similar investment objectives to those of the subject Portfolio as calculated by Lipper Analytical Services, an independent mutual fund ranking service.
MSF-2
Metropolitan Series Fund, Inc.
Capital Guardian U.S. Equity Portfolio
A $10,000 INVESTMENT COMPARED TO THE S&P 500 INDEX
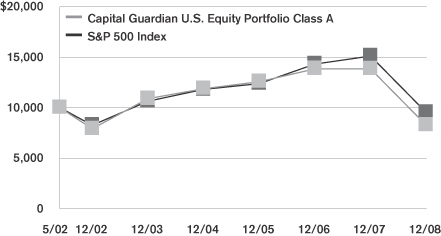
Average Annual Returns as of December 31, 2008
| | | | | | | | | |
| | | Capital Guardian U.S. Equity Portfolio | | | S&P 500
Index | |
| | | Class A | | | Class B | | |
| 1 Year | | -40.2 | % | | -40.4 | % | | -37.0 | % |
| 5 Year | | -5.3 | | | -5.6 | | | -2.2 | |
| Since Inception | | -2.8 | | | -3.0 | | | -0.7 | |
Performance numbers are net of all Portfolio expenses but do not include any insurance, sales, or administrative charges of variable annuity or life insurance contracts or any additional expenses that participants in certain eligible qualified plans may bear relating to the operations of their plans. If these charges were included, the returns would be lower.
Inception date of the Class A and Class B shares is 5/1/02. Index since inception return is based on the Class A inception date.
This information represents past performance and is not indicative of future results. Investment return and principal value may fluctuate so that shares, upon redemption, may be worth more or less than the original cost.
PORTFOLIO COMPOSITION
as of December 31, 2008
Top Holdings
| | |
| | | % of Total
Net Assets |
General Electric Co. | | 3.0% |
Google, Inc. (Class A) | | 2.9% |
United Parcel Service, Inc. (Class B) | | 2.9% |
JPMorgan Chase & Co. | | 2.8% |
PepsiCo, Inc. | | 2.6% |
Baxter International, Inc. | | 2.5% |
Genentech, Inc. | | 2.5% |
Kraft Foods, Inc. (Class A) | | 2.4% |
Celgene Corp. | | 2.4% |
Target Corp. | | 2.3% |
Top Sectors
| | |
| | | % of Total
Market Value |
Health Care | | 18.3% |
Information Technology | | 15.7% |
Industrials | | 12.3% |
Financials | | 12.0% |
Consumer Discretionary | | 11.8% |
Consumer Staples | | 11.8% |
Energy | | 6.9% |
Materials | | 5.3% |
Telecommunication Services | | 3.0% |
Utilities | | 0.9% |
MSF-3
Metropolitan Series Fund, Inc.
Shareholder Expense Example
As a shareholder of the Portfolio, you incur ongoing costs, including management fees; distribution and service (12b-1) fees; and other Portfolio expenses. This example is intended to help you understand your ongoing costs (in dollars) (referred to as “expenses”) of investing in the Portfolio and compare these costs with the ongoing costs of investing in other mutual funds. The example is based on an investment of $1,000 invested at the beginning of the period and held for the entire period, July 1, 2008 through December 31, 2008.
Actual Expenses
The first line for each share class of the Portfolio in the table below provides information about actual account values and actual expenses. You may use the information in this line, together with the amount you invested in the particular share class of the Portfolio, to estimate the expenses that you paid over the period. Simply divide your account value by $1,000 (for example, an $8,600 account value divided by $1,000=8.6), then multiply the result by the number in the first line under the heading entitled “Expenses Paid During Period” to estimate the expenses you paid on your account during this period.
Hypothetical Example for Comparison Purposes
The second line for each share class of the Portfolio in the table below provides information about hypothetical account values and hypothetical expenses based on the Portfolio’s actual expense ratio and an assumed rate of return of 5% per year before expenses, which is not the Portfolio’s actual return. The hypothetical account values and expenses may not be used to estimate the actual ending account balance or expenses you paid for the period. You may use this information to compare the ongoing costs of investing in the Portfolio and other funds. To do so, compare this 5% hypothetical example with the 5% hypothetical examples that appear in the shareholder reports of the other funds.
Please note that the expenses shown in the table are meant to highlight your ongoing costs only and do not reflect any fees or charges of your variable insurance product or any additional expenses that participants in certain eligible qualified plans may bear relating to the operations of their plan. Therefore, the second line for each share class in the table is useful in comparing ongoing costs only, and will not help you determine the relative total costs of owning different funds. In addition, if these other costs were included, your costs would have been higher.
| | | | | | | | | | | | | | |
Portfolio | | | | Annualized
Expense
Ratio | | | Beginning
Account Value
July 1,
2008 | | Ending
Account Value
December 31,
2008 | | Expenses Paid
During Period*
July 1, 2008
to
December 31,
2008 |
Capital Guardian U.S. Equity—Class A | | Actual | | 0.77 | % | | $ | 1,000.00 | | $ | 693.46 | | $ | 3.28 |
| | Hypothetical | | 0.77 | % | | $ | 1,000.00 | | $ | 1,021.22 | | $ | 3.91 |
| | | | | |
Capital Guardian U.S. Equity—Class B | | Actual | | 1.02 | % | | $ | 1,000.00 | | $ | 692.14 | | $ | 4.34 |
| | Hypothetical | | 1.02 | % | | $ | 1,000.00 | | $ | 1,019.95 | | $ | 5.18 |
* Expenses paid are equal to the Portfolio’s annualized expense ratio for the most recent six month period, as shown above, multiplied by the average account value over the period, multiplied by the number of days in the most recent fiscal half-year, divided by 366 (to reflect the the one-half year period).
MSF-4
Metropolitan Series Fund, Inc.
Capital Guardian U.S. Equity Portfolio
Schedule of Investments as of December 31, 2008
Common Stock—97.8% of Total Net Assets
| | | | | |
| Security Description | | Shares | | Value* |
| | | | | |
| | |
Aerospace & Defense—1.1% | | | | | |
United Technologies Corp. | | 56,490 | | $ | 3,027,864 |
| | | | | |
| | |
Air Freight & Logistics—3.3% | | | | | |
FedEx Corp. | | 16,680 | | | 1,070,022 |
United Parcel Service, Inc. (Class B) (a) | | 142,900 | | | 7,882,364 |
| | | | | |
| | | | | 8,952,386 |
| | | | | |
| | |
Airlines—0.4% | | | | | |
Southwest Airlines Co. | | 132,900 | | | 1,145,598 |
| | | | | |
| | |
Auto Components—0.2% | | | | | |
Johnson Controls, Inc. | | 36,200 | | | 657,392 |
| | | | | |
| | |
Automobiles—0.5% | | | | | |
Honda Motor Co., Ltd. (ADR) | | 62,800 | | | 1,340,152 |
| | | | | |
| | |
Beverages—3.1% | | | | | |
PepsiCo, Inc. | | 131,080 | | | 7,179,252 |
The Coca-Cola Co. | | 29,100 | | | 1,317,357 |
| | | | | |
| | | | | 8,496,609 |
| | | | | |
| | |
Biotechnology—5.5% | | | | | |
BioMarin Pharmaceutical, Inc. (a) (b) | | 29,500 | | | 525,100 |
Celgene Corp. (b) | | 117,300 | | | 6,484,344 |
Genentech, Inc. (b) | | 82,500 | | | 6,840,075 |
Gilead Sciences, Inc. (a) (b) | | 21,200 | | | 1,084,168 |
| | | | | |
| | | | | 14,933,687 |
| | | | | |
| | |
Capital Markets—2.4% | | | | | |
T. Rowe Price Group, Inc. | | 12,800 | | | 453,632 |
The Goldman Sachs Group, Inc. | | 71,780 | | | 6,057,514 |
| | | | | |
| | | | | 6,511,146 |
| | | | | |
| | |
Chemicals—1.4% | | | | | |
Celanese Corp. (Series A) | | 13,600 | | | 169,048 |
Ecolab, Inc. (a) | | 13,000 | | | 456,950 |
Monsanto Co. | | 25,500 | | | 1,793,925 |
Potash Corp. of Saskatchewan, Inc. | | 18,000 | | | 1,317,960 |
| | | | | |
| | | | | 3,737,883 |
| | | | | |
| |
Commercial & Professional Services—0.3% | | | |
Iron Mountain, Inc. (a) (b) | | 29,800 | | | 736,954 |
| | | | | |
| | |
Commercial Banks—2.3% | | | | | |
SunTrust Banks, Inc. (a) | | 5,300 | | | 156,562 |
Wells Fargo & Co. | | 207,200 | | | 6,108,256 |
| | | | | |
| | | | | 6,264,818 |
| | | | | |
| | |
Communications Equipment—4.0% | | | | | |
Brocade Communications Systems, Inc. (b) | | 448,000 | | | 1,254,400 |
Ciena Corp. (a) (b) | | 27,100 | | | 181,570 |
Cisco Systems, Inc. (b) | | 294,140 | | | 4,794,482 |
Polycom, Inc. (a) (b) | | 70,700 | | | 955,157 |
QUALCOMM, Inc. | | 102,260 | | | 3,663,976 |
| | | | | |
| | | | | 10,849,585 |
| | | | | |
| | | | | |
| Security Description | | Shares | | Value* |
| | | | | |
| | |
Computers & Peripherals—2.1% | | | | | |
Apple, Inc. (a) (b) | | 26,600 | | $ | 2,270,310 |
Dell, Inc. (b) | | 71,600 | | | 733,184 |
Hewlett-Packard Co. | | 25,400 | | | 921,766 |
International Business Machines Corp. | | 11,730 | | | 987,197 |
NetApp, Inc. (b) | | 55,100 | | | 769,747 |
| | | | | |
| | | | | 5,682,204 |
| | | | | |
| | |
Construction & Engineering—1.6% | | | | | |
Fluor Corp. | | 89,700 | | | 4,024,839 |
Jacobs Engineering Group, Inc. (a) (b) | | 8,500 | | | 408,850 |
| | | | | |
| | | | | 4,433,689 |
| | | | | |
| | |
Construction Materials—0.5% | | | | | |
Vulcan Materials Co. (a) | | 21,200 | | | 1,475,096 |
| | | | | |
| | |
Diversified Consumer Services—0.8% | | | | | |
Apollo Group, Inc. (Class A) (b) | | 28,000 | | | 2,145,360 |
| | | | | |
| | |
Diversified Financial Services—2.9% | | | | | |
Bank of America Corp. | | 24,500 | | | 344,960 |
JPMorgan Chase & Co. | | 241,872 | | | 7,626,224 |
| | | | | |
| | | | | 7,971,184 |
| | | | | |
| |
Diversified Telecommunication Services—1.9% | | | |
AT&T, Inc. | | 179,377 | | | 5,112,244 |
| | | | | |
| | |
Electric Utilities—0.2% | | | | | |
Edison International | | 18,400 | | | 591,008 |
| | | | | |
| | |
Electrical Equipment—0.8% | | | | | |
Emerson Electric Co. | | 29,100 | | | 1,065,351 |
First Solar, Inc. (a) (b) | | 7,300 | | | 1,007,108 |
| | | | | |
| | | | | 2,072,459 |
| | | | | |
|
Electronic Equipment, Instruments & Components—1.0% |
Agilent Technologies, Inc. (b) | | 64,305 | | | 1,005,087 |
Flextronics International, Ltd. (b) | | 148,000 | | | 378,880 |
Jabil Circuit, Inc. | | 208,010 | | | 1,404,068 |
| | | | | |
| | | | | 2,788,035 |
| | | | | |
| | |
Energy Equipment & Services—1.4% | | | | | |
Baker Hughes, Inc. (a) | | 19,610 | | | 628,893 |
Schlumberger, Ltd. | | 75,300 | | | 3,187,449 |
| | | | | |
| | | | | 3,816,342 |
| | | | | |
| | |
Food & Staples Retailing—1.1% | | | | | |
Costco Wholesale Corp. | | 17,900 | | | 939,750 |
Wal-Mart Stores, Inc. | | 37,000 | | | 2,074,220 |
| | | | | |
| | | | | 3,013,970 |
| | | | | |
| | |
Food Products—4.4% | | | | | |
Kraft Foods, Inc. (Class A) | | 241,536 | | | 6,485,242 |
Sara Lee Corp. | | 443,300 | | | 4,339,907 |
Unilever NV (NY Shares) | | 48,500 | | | 1,190,675 |
| | | | | |
| | | | | 12,015,824 |
| | | | | |
*See accompanying notes to financial statements.
MSF-5
Metropolitan Series Fund, Inc.
Capital Guardian U.S. Equity Portfolio
Schedule of Investments as of December 31, 2008
Common Stock—(Continued)
| | | | | |
| Security Description | | Shares | | Value* |
| | | | | |
| | |
Health Care Equipment & Supplies—3.1% | | | | | |
Baxter International, Inc. | | 127,800 | | $ | 6,848,802 |
Lumenis, Ltd. (a) (b) (c) | | 520 | | | 546 |
Medtronic, Inc. | | 48,000 | | | 1,508,160 |
| | | | | |
| | | | | 8,357,508 |
| | | | | |
| | |
Health Care Providers & Services—3.3% | | | | | |
Aetna, Inc. | | 2,300 | | | 65,550 |
Cardinal Health, Inc. | | 80,800 | | | 2,785,176 |
DaVita, Inc. (b) | | 86,400 | | | 4,282,848 |
UnitedHealth Group, Inc. | | 71,500 | | | 1,901,900 |
| | | | | |
| | | | | 9,035,474 |
| | | | | |
| | |
Health Care Technology—0.7% | | | | | |
Cerner Corp. (a) (b) | | 47,300 | | | 1,818,685 |
| | | | | |
| | |
Hotels, Restaurants & Leisure—1.1% | | | | | |
Carnival Corp. (b) | | 61,700 | | | 1,500,544 |
Las Vegas Sands Corp. (a) (b) | | 109,000 | | | 646,370 |
Wynn Resorts, Ltd. (a) (b) | | 17,600 | | | 743,776 |
| | | | | |
| | | | | 2,890,690 |
| | | | | |
| | |
Household Products—0.3% | | | | | |
Kimberly-Clark Corp. | | 13,100 | | | 690,894 |
| | | | | |
| | |
Industrial Conglomerates—3.0% | | | | | |
General Electric Co. | | 508,400 | | | 8,236,080 |
| | | | | |
| | |
Insurance—2.7% | | | | | |
ACE, Ltd. | | 17,500 | | | 926,100 |
Aflac, Inc. | | 37,400 | | | 1,714,416 |
Berkshire Hathaway, Inc. (Class A) (b) | | 21 | | | 2,028,600 |
RenaissanceRe Holdings, Ltd. | | 9,900 | | | 510,444 |
The Progressive Corp. | | 147,900 | | | 2,190,399 |
| | | | | |
| | | | | 7,369,959 |
| | | | | |
| | |
Internet Software & Services—3.7% | | | | | |
eBay, Inc. (b) | | 34,820 | | | 486,087 |
Google, Inc. (Class A) (b) | | 25,830 | | | 7,946,600 |
Yahoo!, Inc. (a) (b) | | 125,880 | | | 1,535,736 |
| | | | | |
| | | | | 9,968,423 |
| | | | | |
| | |
IT Services—1.5% | | | | | |
Cognizant Technology Solutions Corp. (Class A) (a) (b) | | 41,300 | | | 745,878 |
Paychex, Inc. (a) | | 98,900 | | | 2,599,092 |
Visa, Inc. (a) | | 13,600 | | | 713,320 |
| | | | | |
| | | | | 4,058,290 |
| | | | | |
| | |
Machinery—1.2% | | | | | |
Danaher Corp. (a) | | 13,100 | | | 741,591 |
Illinois Tool Works, Inc. | | 71,400 | | | 2,502,570 |
| | | | | |
| | | | | 3,244,161 |
| | | | | |
| | | | | |
| Security Description | | Shares | | Value* |
| | | | | |
| | |
Media—4.7% | | | | | |
CBS Corp. (Class B) | | 163,350 | | $ | 1,337,836 |
Comcast Corp. (Class A) | | 50,100 | | | 845,688 |
Gannett Co., Inc. (a) | | 80,600 | | | 644,800 |
Omnicom Group, Inc. | | 109,700 | | | 2,953,124 |
The Walt Disney Co. | | 153,500 | | | 3,482,915 |
Time Warner Cable, Inc. (Class A) (a) (b) | | 84,400 | | | 1,810,380 |
Time Warner, Inc. | | 76,700 | | | 771,602 |
Viacom, Inc. (Class B) (a) (b) | | 50,250 | | | 957,765 |
| | | | | |
| | | | | 12,804,110 |
| | | | | |
| | |
Metals & Mining—3.2% | | | | | |
Allegheny Technologies, Inc. (a) | | 70,900 | | | 1,810,077 |
Barrick Gold Corp. | | 126,600 | | | 4,655,082 |
Cliffs Natural Resources, Inc. | | 28,100 | | | 719,641 |
Nucor Corp. (a) | | 36,300 | | | 1,677,060 |
| | | | | |
| | | | | 8,861,860 |
| | | | | |
| | |
Multi-Utilities—0.2% | | | | | |
CMS Energy Corp. (a) | | 58,700 | | | 593,457 |
| | | | | |
| | |
Multiline Retail—2.7% | | | | | |
Nordstrom, Inc. (a) | | 81,000 | | | 1,078,110 |
Target Corp. (a) | | 185,000 | | | 6,388,050 |
| | | | | |
| | | | | 7,466,160 |
| | | | | |
| | |
Oil, Gas & Consumable Fuels—5.5% | | | | | |
Anadarko Petroleum Corp. | | 23,200 | | | 894,360 |
Chevron Corp. | | 39,633 | | | 2,931,653 |
ConocoPhillips (a) | | 34,900 | | | 1,807,820 |
EOG Resources, Inc. | | 8,400 | | | 559,272 |
Exxon Mobil Corp. | | 31,299 | | | 2,498,599 |
Kinder Morgan Management, LLC | | 15,834 | | | 633,043 |
Marathon Oil Corp. | | 118,700 | | | 3,247,632 |
Royal Dutch Shell, Plc. (Class A) (ADR) | | 27,400 | | | 1,450,556 |
Royal Dutch Shell, Plc. (Class B) (ADR) | | 17,244 | | | 886,859 |
| | | | | |
| | | | | 14,909,794 |
| | | | | |
| | |
Pharmaceuticals—5.6% | | | | | |
Abbott Laboratories | | 90,200 | | | 4,813,975 |
Allergan, Inc. | | 97,930 | | | 3,948,538 |
AstraZeneca, Plc. (ADR) (a) | | 40,300 | | | 1,653,509 |
Forest Laboratories, Inc. (b) | | 51,860 | | | 1,320,874 |
Pfizer, Inc. | | 48,400 | | | 857,164 |
Sanofi-Aventis S.A. (ADR) | | 27,100 | | | 871,536 |
Teva Pharmaceutical Industries, Ltd. (ADR) (a) | | 40,600 | | | 1,728,342 |
| | | | | |
| | | | | 15,193,938 |
| | | | | |
| | |
Professional Services—0.3% | | | | | |
Monster Worldwide, Inc. (a) (b) | | 68,500 | | | 828,165 |
| | | | | |
| | |
Road & Rail—0.3% | | | | | |
Union Pacific Corp. (a) | | 18,000 | | | 860,400 |
| | | | | |
*See accompanying notes to financial statements.
MSF-6
Metropolitan Series Fund, Inc.
Capital Guardian U.S. Equity Portfolio
Schedule of Investments as of December 31, 2008
Common Stock—(Continued)
| | | | | |
Security Description | | Shares | | Value* |
| | | | | |
|
Semiconductors & Semiconductor Equipment—1.1% |
Intel Corp. | | 50,000 | | $ | 733,000 |
KLA-Tencor Corp. (a) | | 69,700 | | | 1,518,763 |
Lam Research Corp. (a) (b) | | 17,300 | | | 368,144 |
Microchip Technology, Inc. (a) | | 24,000 | | | 468,720 |
| | | | | |
| | | | | 3,088,627 |
| | | | | |
| | |
Software—2.1% | | | | | |
Adobe Systems, Inc. (b) | | 54,500 | | | 1,160,305 |
Microsoft Corp. | | 134,530 | | | 2,615,263 |
Nintendo Co., Ltd. (ADR) (a) | | 33,000 | | | 1,575,750 |
Oracle Corp. (a) (b) | | 27,600 | | | 489,348 |
| | | | | |
| | | | | 5,840,666 |
| | | | | |
| | |
Specialty Retail—1.7% | | | | | |
Best Buy Co., Inc. (a) | | 32,800 | | | 922,008 |
Home Depot, Inc. | | 71,458 | | | 1,644,963 |
Lowe’s Cos., Inc. | | 69,100 | | | 1,487,032 |
Urban Outfitters, Inc. (a) (b) | | 45,100 | | | 675,598 |
| | | | | |
| | | | | 4,729,601 |
| | | | | |
| | |
Textiles, Apparel & Luxury Goods—0.3% | | | | | |
Hanesbrands, Inc. (a) (b) | | 60,387 | | | 769,934 |
| | | | | |
| | |
Thrifts & Mortgage Finance—1.7% | | | | | |
Astoria Financial Corp. (a) | | 43,500 | | | 716,880 |
Hudson City Bancorp, Inc. (a) | | 254,600 | | | 4,063,416 |
| | | | | |
| | | | | 4,780,296 |
| | | | | |
| | |
Tobacco—3.0% | | | | | |
Altria Group, Inc. | | 154,200 | | | 2,322,252 |
Philip Morris International, Inc. | | 137,500 | | | 5,982,625 |
| | | | | |
| | | | | 8,304,877 |
| | | | | |
| | |
Water Utilities—0.5% | | | | | |
American Water Works Co., Inc. (a) (b) | | 60,300 | | | 1,259,064 |
| | | | | |
| | |
Wireless Telecommunication Services—1.1% | | | | | |
American Tower Corp. (Class A) (b) | | 101,170 | | | 2,966,304 |
| | | | | |
Total Common Stock
(Identified Cost $351,395,629) | | | | | 266,698,906 |
| | | | | |
| | |
| Preferred Stock—0.3% | | | | | |
| | |
Pharmaceuticals—0.3% | | | | | |
Schering-Plough Corp. | | 5,000 | | | 871,563 |
| | | | | |
Total Preferred Stock
(Identified Cost $1,250,000) | | | | | 871,563 |
| | | | | |
| | | | | | | |
| |
| Short Term Investments—15.8% | | | | |
| Security Description | | Shares/Face
Amount | | Value* | |
| | |
Mutual Funds—14.0% | | | | | | | |
State Street Navigator Securities Lending Prime Portfolio (d) | | | 38,260,047 | | $ | 38,260,047 | |
| | | | | | | |
| | |
Repurchase Agreement—1.8% | | | | | | | |
State Street Repurchase Agreement dated 12/31/08 at 0.010% to be repurchased at $4,839,003 on 01/02/09, collateralized by $4,940,000 U.S. Treasury Bill due 02/12/09 with a value of $4,940,000. | | $ | 4,839,000 | | | 4,839,000 | |
| | | | | | | |
Total Short Term Investments
(Identified Cost $43,099,047) | | | | | | 43,099,047 | |
| | | | | | | |
Total Investments—113.9%
(Identified Cost $395,744,676) (e) | | | | | | 310,669,516 | |
Liabilities in excess of other assets | | | | | | (37,941,321 | ) |
| | | | | | | |
| Total Net Assets—100% | | | | | $ | 272,728,195 | |
| | | | | | | |
| (a) | A portion or all of the security was on loan. As of December 31, 2008, the market value of securities loaned was $38,148,408 and the collateral received consisted of cash in the amount of $38,260,047. The cash collateral is invested in a money market fund managed by an affiliate of the custodian. |
| (c) | Security was valued in good faith under procedures established by the Board of Directors. |
| (d) | Represents investment of cash collateral received from securities lending transactions. |
| (e) | The aggregate cost of investments for federal income tax purposes as of December 31, 2008 was $397,558,417 and the composition of unrealized appreciation and depreciation of investment securities was $5,985,414 and $(92,874,315), respectively. |
| (ADR)— | An American Depositary Receipt is a certificate issued by a custodian bank representing the right to receive securities of the foreign issuer described. Trading on exchanges not located in the United States or Canada significantly influences the value of ADRs. |
*See accompanying notes to financial statements.
MSF-7
Metropolitan Series Fund, Inc.
Capital Guardian U.S. Equity Portfolio
The Portfolio adopted the provisions of Statement of Financial Accounting Standards No. 157, “Fair Value Measurements” (FAS 157), effective with the beginning of the Portfolio’s fiscal year. FAS 157 establishes a framework for measuring fair value and expands disclosures about fair value measurements in financial statements. The three levels of the hierarchy under FAS 157 are described below:
Level 1 - quoted prices in active markets for identical securities
Level 2 - other significant observable inputs (including quoted prices for similar securities, interest rates, credit risk, etc.)
Level 3 - significant unobservable inputs (including the Portfolio’s own assumptions in determining the fair value of investments)
The inputs or methodology used for valuing securities are not necessarily an indication of the risk associated with investing in those securities.
The following is a summary of the inputs used to value the Portfolio’s net assets as of December 31, 2008:
| | | | | | |
| Valuation Inputs | | Investments In
Securities | | Other Financial
Instruments* |
Level 1 - Quoted Prices | | $ | 304,958,407 | | $ | 0 |
Level 2 - Other Significant Observable Inputs | | | 5,710,563 | | | 0 |
Level 3 - Significant Unobservable Inputs | | | 546 | | | 0 |
Total | | $ | 310,669,516 | | $ | 0 |
* Other financial instruments are derivative instruments not reflected in the Schedule of Investments, such as futures, forwards, swap contracts and written options, which are valued based on the unrealized appreciation/depreciation on the instrument.
Following is a reconciliation of Level 3 assets for which significant unobservable inputs were used to determine fair value:
| | | | | | |
| | | Investments in
Securities | | Other Financial
Instruments |
Balance as of January 1, 2008 | | $ | 546 | | $ | 0 |
Transfers in (Out) of Level 3 | | | 0 | | | 0 |
Accrued discounts/premiums | | | 0 | | | 0 |
Realized Gain (Loss) | | | 0 | | | 0 |
Change in unrealized appreciation (depreciation) | | | 0 | | | 0 |
Net Purchases (Sales) | | | 0 | | | 0 |
Balance as of December 31, 2008 | | $ | 546 | | $ | 0 |
MSF-8
Metropolitan Series Fund, Inc.
Capital Guardian U.S. Equity Portfolio
Statement of Assets & Liabilities
December 31, 2008
| | | | | | | |
Assets | | | | | | | |
Investments at value (a) (b) | | | | | $ | 310,669,516 | |
Cash | | | | | | 702 | |
Receivable for: | | | | | | | |
Fund shares sold | | | | | | 5,809 | |
Accrued interest and dividends | | | | | | 780,139 | |
Foreign taxes | | | | | | 26,133 | |
| | | | | | | |
Total Assets | | | | | | 311,482,299 | |
Liabilities | | | | | | | |
Payable for: | | | | | | | |
Securities purchased | | $ | 130,434 | | | | |
Fund shares redeemed | | | 159,007 | | | | |
Withholding taxes | | | 546 | | | | |
Collateral for securities loaned | | | 38,260,047 | | | | |
Accrued expenses: | | | | | | | |
Management fees | | | 154,647 | | | | |
Service and distribution fees | | | 11,449 | | | | |
Deferred directors’ fees | | | 1,778 | | | | |
Other expenses | | | 36,196 | | | | |
| | | | | | | |
Total Liabilities | | | | | | 38,754,104 | |
| | | | | | | |
Net Assets | | | | | $ | 272,728,195 | |
| | | | | | | |
Net assets consists of: | | | | | | | |
Capital paid in | | | | | $ | 461,798,401 | |
Undistributed net investment income | | | | | | 4,917,785 | |
Accumulated net realized losses | | | | | | (108,912,831 | ) |
Unrealized depreciation on investments | | | | | | (85,075,160 | ) |
| | | | | | | |
Net Assets | | | | | $ | 272,728,195 | |
| | | | | | | |
| Computation of offering price: | | | | | | | |
Class A | | | | | | | |
Net asset value and redemption price per share ($217,271,785 divided by 33,597,856 shares outstanding) | | | | | $ | 6.47 | |
| | | | | | | |
Class B | | | | | | | |
Net asset value and redemption price per share ($55,456,410 divided by 8,626,437 shares outstanding) | | | | | $ | 6.43 | |
| | | | | | | |
(a) Identified cost of investments | | | | | $ | 395,744,676 | |
| | | | | | | |
(b) Includes cash collateral for securities loaned of | | | | | $ | 38,260,047 | |
| | | | | | | |
Statement of Operations
For the Year Ended December 31, 2008
| | | | | | | | |
Investment Income | | | | | | | | |
Dividends | | | | | | $ | 7,811,963 | (a) |
Interest | | | | | | | 483,647 | (b) |
| | | | | | | | |
| | | | | | | 8,295,610 | |
Expenses | | | | | | | | |
Management fees | | $ | 2,736,756 | | | | | |
Service and distribution fees—Class B | | | 210,924 | | | | | |
Directors’ fees and expenses | | | 30,707 | | | | | |
Custodian | | | 54,837 | | | | | |
Audit and tax services | | | 31,941 | | | | | |
Legal | | | 6,873 | | | | | |
Printing | | | 140,305 | | | | | |
Insurance | | | 6,198 | | | | | |
Miscellaneous | | | 12,989 | | | | | |
| | | | | | | | |
Total expenses | | | 3,231,530 | | | | | |
Expense reductions | | | (20,082 | ) | | | 3,211,448 | |
| | | | | | | | |
Net Investment Income | | | | | | | 5,084,162 | |
| | | | | | | | |
Realized and Unrealized Loss | | | | | | | | |
| Realized loss on: | | | | | | | | |
Investments—net | | | | | | | (99,523,948 | ) |
| Change in unrealized depreciation on: | | | | | | | | |
Investments—net | | | | | | | (101,358,221 | ) |
| | | | | | | | |
Net loss | | | | | | | (200,882,169 | ) |
| | | | | | | | |
Net Decrease in Net Assets From Operations | | | | | | $ | (195,798,007 | ) |
| | | | | | | | |
| (a) | Net of foreign taxes of $69,847. |
| (b) | Includes income on securities loaned of $383,211. |
See accompanying notes to financial statements.
MSF-9
Metropolitan Series Fund, Inc.
Capital Guardian U.S. Equity Portfolio
Statements of Changes in Net Assets
| | | | | | | | |
| | | Year ended
December 31,
2008 | | | Year ended
December 31,
2007 | |
From Operations | | | | | | | | |
Net investment income | | $ | 5,084,162 | | | $ | 4,775,998 | |
Net realized gain (loss) | | | (99,523,948 | ) | | | 61,359,492 | |
Change in unrealized depreciation | | | (101,358,221 | ) | | | (65,773,349 | ) |
| | | | | | | | |
Increase (decrease) in net assets from operations | | | (195,798,007 | ) | | | 362,141 | |
| | | | | | | | |
From Distributions to Shareholders | | | | | | | | |
Net investment income | | | | | | | | |
Class A | | | (3,935,663 | ) | | | (2,110,792 | ) |
Class B | | | (777,776 | ) | | | (268,916 | ) |
| | | | | | | | |
| | | (4,713,439 | ) | | | (2,379,708 | ) |
| | | | | | | | |
Net realized gain | | | | | | | | |
Class A | | | (44,593,601 | ) | | | (26,256,976 | ) |
Class B | | | (12,008,512 | ) | | | (6,493,530 | ) |
| | | | | | | | |
| | | (56,602,113 | ) | | | (32,750,506 | ) |
| | | | | | | | |
Total distributions | | | (61,315,552 | ) | | | (35,130,214 | ) |
| | | | | | | | |
Increase in net assets from capital share transactions | | | 6,723,645 | | | | 4,604,611 | |
| | | | | | | | |
Net decrease in net assets | | | (250,389,914 | ) | | | (30,163,462 | ) |
| | |
Net Assets | | | | | | | | |
Beginning of the period | | | 523,118,109 | | | | 553,281,571 | |
| | | | | | | | |
End of the period | | $ | 272,728,195 | | | $ | 523,118,109 | |
| | | | | | | | |
Undistributed Net Investment Income | | | | | | | | |
End of the period | | $ | 4,917,785 | | | $ | 4,674,866 | |
| | | | | | | | |
Other Information:
Capital Shares
Transactions in capital shares were as follows:
| | | | | | | | | | | | | | |
| | | Year ended
December 31, 2008 | | | Year ended
December 31, 2007 | |
| | | Shares | | | $ | | | Shares | | | $ | |
Class A | | | | | | | | | | | | | | |
Sales | | 2,067,863 | | | $ | 18,511,389 | | | 4,411,021 | | | $ | 57,665,708 | |
Reinvestments | | 4,734,562 | | | | 48,529,264 | | | 2,183,816 | | | | 28,367,768 | |
Redemptions | | (6,491,763 | ) | | | (60,069,293 | ) | | (6,902,715 | ) | | | (91,386,169 | ) |
| | | | | | | | | | | | | | |
Net increase (decrease) | | 310,662 | | | $ | 6,971,360 | | | (307,878 | ) | | $ | (5,352,693 | ) |
| | | | | | | | | | | | | | |
Class B | | | | | | | | | | | | | | |
Sales | | 372,777 | | | $ | 3,545,714 | | | 1,765,336 | | | $ | 23,167,316 | |
Reinvestments | | 1,252,330 | | | | 12,786,288 | | | 522,600 | | | | 6,762,446 | |
Redemptions | | (1,815,674 | ) | | | (16,579,717 | ) | | (1,517,326 | ) | | | (19,972,458 | ) |
| | | | | | | | | | | | | | |
Net increase (decrease) | | (190,567 | ) | | $ | (247,715 | ) | | 770,610 | | | $ | 9,957,304 | |
| | | | | | | | | | | | | | |
Increase derived from capital share transactions | | | | | $ | 6,723,645 | | | | | | $ | 4,604,611 | |
| | | | | | | | | | | | | | |
See accompanying notes to financial statements.
MSF-10
Metropolitan Series Fund, Inc.
Capital Guardian U.S. Equity Portfolio
Financial Highlights
| | | | | | | | | | | | | | | | | | | | |
| | | Class A | |
| | | Year ended December 31, | |
| | | 2008 | | | 2007 | | | 2006 | | | 2005 | | | 2004 | |
Net Asset Value, Beginning of Period | | $ | 12.44 | | | $ | 13.30 | | | $ | 12.33 | | | $ | 11.66 | | | $ | 10.81 | |
| | | | | | | | | | | | | | | | | | | | |
Income From Investment Operations | | | | | | | | | | | | | | | | | | | | |
Net investment income | | | 0.12 | (a) | | | 0.12 | (a) | | | 0.11 | | | | 0.09 | | | | 0.09 | |
Net realized and unrealized gain (loss) of investments | | | (4.56 | ) | | | (0.09 | ) | | | 1.13 | | | | 0.58 | | | | 0.91 | |
| | | | | | | | | | | | | | | | | | | | |
Total from investment operations | | | (4.44 | ) | | | 0.03 | | | | 1.24 | | | | 0.67 | | | | 1.00 | |
| | | | | | | | | | | | | | | | | | | | |
Less Distributions | | | | | | | | | | | | | | | | | | | | |
Distributions from net investment income | | | (0.12 | ) | | | (0.07 | ) | | | (0.13 | ) | | | (0.00 | )(b) | | | (0.15 | ) |
Distributions from net realized capital gains | | | (1.41 | ) | | | (0.82 | ) | | | (0.14 | ) | | | 0.00 | | | | 0.00 | |
| | | | | | | | | | | | | | | | | | | | |
Total distributions | | | (1.53 | ) | | | (0.89 | ) | | | (0.27 | ) | | | (0.00 | ) | | | (0.15 | ) |
| | | | | | | | | | | | | | | | | | | | |
Net Asset Value, End of Period | | $ | 6.47 | | | $ | 12.44 | | | $ | 13.30 | | | $ | 12.33 | | | $ | 11.66 | |
| | | | | | | | | | | | | | | | | | | | |
Total Return (%) | | | (40.2 | ) | | | (0.1 | ) | | | 10.1 | | | | 5.8 | | | | 9.3 | |
Ratio of operating expenses to average net assets before expense reductions (%) | | | 0.74 | | | | 0.71 | | | | 0.73 | | | | 0.73 | | | | 0.75 | |
Ratio of operating expenses to average net assets after expense reductions (%) (c) | | | 0.74 | | | | 0.71 | | | | 0.73 | | | | 0.73 | | | | 0.74 | |
Ratio of net investment income to average net assets (%) | | | 1.31 | | | | 0.89 | | | | 0.76 | | | | 0.73 | | | | 0.77 | |
Portfolio turnover rate (%) | | | 49 | | | | 45 | | | | 42 | | | | 29 | | | | 45 | |
Net assets, end of period (000) | | $ | 217,272 | | | $ | 414,065 | | | $ | 446,828 | | | $ | 426,968 | | | $ | 455,938 | |
| | | | | | | | | | | | | | | | | | | |
| | | Class B | |
| | | Year ended December 31, | |
| | | 2008 | | | 2007 | | | 2006 | | | 2005 | | 2004 | |
Net Asset Value, Beginning of Period | | $ | 12.37 | | | $ | 13.23 | | | $ | 12.27 | | | $ | 11.63 | | $ | 10.78 | |
| | | | | | | | | | | | | | | | | | | |
Income From Investment Operations | | | | | | | | | | | | | | | | | | | |
Net investment income | | | 0.10 | (a) | | | 0.08 | (a) | | | 0.06 | | | | 0.06 | | | 0.07 | |
Net realized and unrealized gain (loss) of investments | | | (4.54 | ) | | | (0.09 | ) | | | 1.14 | | | | 0.58 | | | 0.90 | |
| | | | | | | | | | | | | | | | | | | |
Total from investment operations | | | (4.44 | ) | | | (0.01 | ) | | | 1.20 | | | | 0.64 | | | 0.97 | |
| | | | | | | | | | | | | | | | | | | |
Less Distributions | | | | | | | | | | | | | | | | | | | |
Distributions from net investment income | | | (0.09 | ) | | | (0.03 | ) | | | (0.10 | ) | | | 0.00 | | | (0.12 | ) |
Distributions from net realized capital gains | | | (1.41 | ) | | | (0.82 | ) | | | (0.14 | ) | | | 0.00 | | | 0.00 | |
| | | | | | | | | | | | | | | | | | | |
Total distributions | | | (1.50 | ) | | | (0.85 | ) | | | (0.24 | ) | | | 0.00 | | | (0.12 | ) |
| | | | | | | | | | | | | | | | | | | |
Net Asset Value, End of Period | | $ | 6.43 | | | $ | 12.37 | | | $ | 13.23 | | | $ | 12.27 | | $ | 11.63 | |
| | | | | | | | | | | | | | | | | | | |
Total Return (%) | | | (40.4 | ) | | | (0.3 | ) | | | 9.8 | | | | 5.5 | | | 9.0 | |
Ratio of operating expenses to average net assets before expense reductions (%) | | | 0.99 | | | | 0.96 | | | | 0.98 | | | | 0.98 | | | 1.00 | |
Ratio of operating expenses to average net assets after expense reductions (%) (c) | | | 0.99 | | | | 0.96 | | | | 0.98 | | | | 0.98 | | | 0.99 | |
Ratio of net investment income to average net assets (%) | | | 1.05 | | | | 0.64 | | | | 0.51 | | | | 0.48 | | | 0.56 | |
Portfolio turnover rate (%) | | | 49 | | | | 45 | | | | 42 | | | | 29 | | | 45 | |
Net assets, end of period (000) | | $ | 55,456 | | | $ | 109,053 | | | $ | 106,454 | | | $ | 89,728 | | $ | 68,440 | |
| (a) | Per share amount is based on average shares outstanding during the period. |
| (b) | Distributions for the period were less than $0.01. |
| (c) | The Portfolio has entered into arrangements with certain brokers who paid a portion of the Portfolio’s expenses. |
See accompanying notes to financial statements.
MSF-11
Metropolitan Series Fund, Inc.
Capital Guardian U.S. Equity Portfolio
Notes to Financial Statements—December 31, 2008
Metropolitan Series Fund, Inc. (the “Fund”) is organized as a corporation under the laws of Maryland pursuant to Articles of Incorporation filed on November 23, 1982, as amended, and registered under the Investment Company Act of 1940, as amended (the “1940 Act”), as an open-end investment company. The Fund is a “series” type of mutual fund, which issues separate series of stock. Each series represents an interest in a separate portfolio of Fund investments. The Capital Guardian U.S. Equity Portfolio (the “Portfolio”) is a diversified series of the Fund. Shares in the Fund are not offered directly to the general public and are currently available only to separate accounts established by Metropolitan Life Insurance Company (“MetLife”), New England Life Insurance Company, General American Life Insurance Company (“General American”), The MetLife Investors Group of Insurance Companies, MetLife Insurance Company of Connecticut and other affiliated insurance companies (collectively, the “Insurance Companies”) and to certain eligible qualified retirement plans (“Qualified Plans”), as an investment vehicle for variable life insurance, group annuity or variable annuity products of these insurance companies or Qualified Plans, although the Portfolio is not available to all such separate accounts and Qualified Plans. The Portfolio’s shares may be divided into different classes. Currently, the classes being offered by the Portfolio are named Class A and Class B. The classes of the Portfolio’s shares are identical, except that certain additional charges (Rule 12b-1 fees) are made against Class B shares. Investment income, realized and unrealized capital gains and losses, the common expenses of the Portfolio and certain Portfolio-level expense reductions, if any, are allocated daily, on a pro rata basis, to each class based on the relative net assets of each class to the total net assets of the Portfolio.
| 2. | SIGNIFICANT ACCOUNTING POLICIES: |
The preparation of financial statements in conformity with accounting principles generally accepted in the United States of America (“GAAP”) requires management to make estimates and assumptions that affect the reported amounts of assets and liabilities and disclosure of contingent assets and liabilities as of the date of the financial statements and the reported amounts of income and expenses during the reporting period. Actual results could differ from those estimates.
The following is a summary of significant accounting policies consistently followed by the Portfolio in the preparation of its financial statements. The policies are in conformity with GAAP.
Investment Valuation:
Debt securities (other than short term obligations with a remaining maturity of sixty days or less) are generally valued on the basis of evaluated or composite bid quotations obtained by independent pricing services and/or brokers and dealers selected by the relevant subadviser pursuant to authorization of the Board of Directors of the Fund (the “Board” or “Directors”). Such quotations take into account appropriate factors such as institutional-sized trading in similar groups of securities, yield, quality, coupon rate, maturity, type of issue, trading characteristics and other data. Short term obligations with a remaining maturity of sixty days or less are valued at amortized cost which approximates fair market value.
Equity securities traded on a national securities exchange or other exchanges are valued at their last sale price on the principal trading market. Equity securities traded on the NASDAQ National Market System are valued at the NASDAQ Official Closing Price (the “NOCP”). The NOCP is the last reported sale price if the last reported sale price falls between the spread of the last reported bid and asked prices. If the last reported bid and asked prices are above the last reported sale price, the NOCP will be the last reported bid price. If the last reported bid and asked prices are below the last reported sale price, the NOCP will be the last reported asked price. Equity securities traded on a national securities exchange or other exchanges or on the NASDAQ National Market System for which there is no reported sale during the day are valued at the last reported bid price. A security that is listed or traded on more than one exchange is valued at the quotation on the exchange determined to be the primary market for that security by the Board or its delegates. If no closing price is available, then such securities are valued by using the last reported bid price. Equity securities traded over-the-counter are valued at the last reported sales price.
If no current market value quotation is readily available or reliable for a portfolio security, fair value will be determined in accordance with procedures established by and under the general supervision of the Board. When the Portfolio uses fair value pricing, it may take into account any factors it deems appropriate. The value of securities used by the Portfolio to calculate its net asset value may differ from quoted or published prices for the same securities. Fair value pricing involves subjective judgments and the fair value determined for a security may be materially different than the value that could be realized upon the sale of that security.
MSF-12
Metropolitan Series Fund, Inc.
Capital Guardian U.S. Equity Portfolio
Notes to Financial Statements—December 31, 2008—(Continued)
The Portfolio expects to use fair value pricing for securities primarily traded on U.S. exchanges only under very limited circumstances. For example, the Portfolio may use fair value pricing if the exchange on which a security is traded closes early or trading in the security is suspended.
Securities traded primarily on an exchange outside of the United States which closes before the close of the New York Stock Exchange will be valued at the last sales price on that non-U.S. exchange. Securities traded primarily on an exchange outside of the United States for which there is no reported sale during the day are valued at the mean between the last reported bid and asked prices. However, because most foreign markets close well before the Portfolio values its securities (typically at 4 p.m. Eastern Time), the earlier close of these foreign markets gives rise to the possibility that significant events, including broad market moves, may have occurred after these foreign markets close but before the Portfolio values its securities. To account for this, the Portfolio may frequently value many of its foreign equity securities using fair value prices based on third party vendor modeling tools.
Forward foreign currency exchange contracts are valued based on the mean between closing bid and asked prices of the forward currency contract rates in the London foreign exchange markets on a daily basis as provided by a reliable bank or dealer.
Options, whether on securities, indices, futures contracts, or otherwise, are valued at the last sales price available as of the close of business on the day of valuation or, if there is no such sale price available, at the mean between the bid and asked prices. Options on currencies are valued at the spot price each day.
The value of futures contracts will be the sum of the margin deposit plus or minus the difference between the value of the futures contract on each day the net asset value is calculated and the value on the date the futures contract originated, value being that established on a recognized commodity exchange, or by reference to other customary sources, with gain or loss being realized when the futures contract closes or expires.
Subject to the Board’s oversight, the Board has delegated the day-to-day oversight of pricing matters, including determinations in good faith under the Fund’s procedures the fair value of securities for which current market quotations are not readily available to the subadviser of the Portfolio.
Investment Transactions and Related Investment Income:
Portfolio security transactions are recorded on the trade date. Dividend income is recorded on the ex-dividend date or, for certain foreign securities, when notified. Interest income, which includes amortization of premium and accretion of discount on debt securities, is recorded on the accrual basis. Realized gains and losses on investments and unrealized appreciation and depreciation are determined on the identified cost basis, which is the same basis used for federal income tax purposes.
Repurchase Agreements:
The Portfolio, through the custodian or a subcustodian, receives delivery of the underlying securities collateralizing repurchase agreements. The Portfolio requires the custodian to take possession, to have legally segregated in the Federal Reserve Book Entry System, or to have segregated within the custodian’s vault, all securities held as collateral for repurchase agreements. It is the Portfolio’s policy that the market value of the collateral be at least equal to 100% of the repurchase price in the case of a repurchase agreement of one-day duration and 102% on all other repurchase agreements. The Portfolio’s subadviser is responsible for determining that the value of the collateral is at all times at least equal to the repurchase price. In connection with transactions in repurchase agreements, if the seller defaults and the value of the collateral declines or if the seller enters an insolvency proceeding, realization of the collateral by the Portfolio may be delayed, limited or wholly denied.
Foreign Currency Translation:
The books and records of the Portfolio are maintained in U.S. dollars. The values of securities, currencies and other assets and liabilities denominated in currencies other than U.S. dollars are translated into U.S. dollars based upon foreign exchange rates prevailing at the end of the period. Purchases and sales of investment securities, income and expenses are translated on the respective dates of such transactions. Since the values of investment securities are presented at the foreign exchange rates prevailing at the end of the period, it is not practical to isolate that portion of the results of operations arising from changes in exchange rates from that portion of the results of operations reflecting fluctuations arising from changes in market prices of the investment securities. Such fluctuations are included in the net realized and unrealized gain or loss on investments.
MSF-13
Metropolitan Series Fund, Inc.
Capital Guardian U.S. Equity Portfolio
Notes to Financial Statements—December 31, 2008—(Continued)
Net realized foreign exchange gains or losses arise from sales of foreign currency, currency gains or losses realized between the trade and settlement dates on securities transactions, and the difference between the amounts of dividends, interest, and foreign withholding taxes recorded by the Portfolio and the U.S. dollar equivalent of the amounts actually received or paid by the Portfolio. Net unrealized foreign exchange gains and losses arise from changes in the value of assets and liabilities, other than investment securities, resulting from changes in the exchange rate.
Forward Foreign Currency Exchange Contracts:
The Portfolio may enter into forward foreign currency exchange contracts primarily to hedge against foreign currency exchange rate risks on its non-U.S. dollar denominated investment securities. When entering into a forward currency contract, the Portfolio agrees to receive or deliver a fixed quantity of foreign currency for an agreed-upon price on an agreed future date. These contracts are valued daily and the Portfolio’s net equity therein, representing unrealized gain or loss on the contracts as measured by the difference between the foreign exchange rates at the dates of entry into the contracts and the forward rates at the settlement date, is included in the Statement of Assets and Liabilities. Realized and unrealized gains and losses are included in the Statement of Operations. These instruments involve market and/or credit risk in excess of the amount recognized in the Statement of Assets and Liabilities. Risks arise from the possible inability of counterparties to meet the terms of their contracts and from movement in currency and securities values and interest rates.
Futures Contracts:
The Portfolio may buy and sell futures contracts (on recognized exchanges) as a hedge or to enhance return. Futures contracts are agreements to buy or sell a security, or deliver a final cash settlement price in connection with an index, interest rate, currency, or other contracts not calling for physical delivery, for a set price in the future. The Portfolio must post an amount equal to a portion of the total market value of the futures contract as futures variation margin, which is returned when the Portfolio’s obligations under the contract have been satisfied. From time to time thereafter, the Portfolio may have to post variation margin to maintain this amount as the market value of the contract fluctuates. Risks of entering into futures contracts (and related options) include the possibility that there may be an illiquid market and that a change in the value of the contract or option may not correlate with changes in the value of the underlying securities.
Options:
The Portfolio may use options to enhance returns or to hedge against changes in values of securities the Portfolio owns or expects to purchase. Writing puts or buying calls tends to increase the Portfolio’s exposure to the underlying instrument and writing calls or buying puts tends to decrease the Portfolio’s exposure to the underlying instrument, and can be used to hedge other Portfolio investments. For options purchased to hedge the Portfolio’s investments, the potential risk to the Portfolio is that the change in value of options contracts may not correspond to the change in value of the hedged instruments. In addition, losses may arise from changes in the value of the underlying instruments, if there is an illiquid secondary market, or if the counterparty is unable to perform. The maximum loss for purchased options is limited to the premium initially paid for the option. For options written by the Portfolio, the maximum loss is not limited to the premium initially received for the option.
The main risk associated with purchasing an option is that the option expires without being exercised. In this case, the option expires worthless and the premium paid for the option is considered the loss. The risk associated with writing a call option is that the Portfolio may forgo the opportunity for a profit if the market value of the underlying position increases and the option is exercised. The risk in writing a put option is that the Portfolio may incur a loss if the market value of the underlying position decreases and the option is exercised. In addition, the Portfolio risks not being able to enter into a closing transaction for the written option as the result of an illiquid market.
“When-Issued” Securities:
Purchasing securities “when-issued” is a forward commitment by the Portfolio to buy a security. The estimated amount of the Portfolio’s payment obligation and the security’s interest rate are determined when the commitment is made, even though no interest accrues until the security is issued, which is generally 15 to 120 days later. The Portfolio will segregate liquid assets with its custodian sufficient at all times to satisfy these commitments. If the value of the security is less when delivered than when the commitment was made, the Portfolio will suffer a loss.
MSF-14
Metropolitan Series Fund, Inc.
Capital Guardian U.S. Equity Portfolio
Notes to Financial Statements—December 31, 2008—(Continued)
Federal Income Taxes:
It is the Portfolio’s policy to comply with the requirements of the Internal Revenue Code of 1986, as amended (the “Code”), and regulations thereunder, applicable to regulated investment companies and to distribute, with respect to each taxable year, all of its taxable income to shareholders. Therefore, no federal income tax provision is required. The Portfolio is subject to the provisions of the Financial Accounting Standards Board Interpretation (“FASB”) No. 48, Accounting for Uncertainties in Income Taxes (FIN 48). FIN 48 sets forth a minimum threshold for financial statement recognition of the benefit of a tax position taken or expected to be taken in a tax return. The implementation of FIN 48 did not result in any unrecognized tax benefits in the accompanying financial statements. Each of the Portfolio’s federal tax returns for the prior three fiscal years remains subject to examination by the Internal Revenue Service.
As of December 31, 2008, the Portfolio had capital loss carryforwards as follows:
| | | | | | | |
Expiring
12/31/09 | | Expiring
12/31/16 | | Total |
| $ | 8,209,090 | | $ | 89,242,137 | | $ | 97,451,227 |
The utilization of the capital loss carryforward acquired as part of a merger may be limited under section 382 of the Code.
Pursuant to Section 852 of the Code, the Portfolio designated the amount shown below under Long Term Gain as capital gain dividends for its taxable year ended December 31, 2008. The tax character of distributions paid for the periods ended December 31, 2008 and 2007 was as follows:
| | | | | | | | | | | | | | | | | | | | | | |
| Ordinary Income | | Long Term Gain | | Return of Capital | | Total |
| 2008 | | 2007 | | 2008 | | 2007 | | 2008 | | 2007 | | 2008 | | 2007 |
| $ | 4,973,387 | | $ | 5,251,860 | | $ | 56,342,165 | | $ | 29,878,354 | | $ | — | | $ | — | | $ | 61,315,552 | | $ | 35,130,214 |
As of December 31, 2008, the components of distributable earnings (accumulated losses) on a federal income tax basis were as follows:
| | | | | | | | | | | | | | | | |
Undistributed
Ordinary
Income | | Undistributed
Long Term
Gain | | Unrealized
Depreciation | | | Loss
Carryforwards | | | Total | |
| $ | 4,920,440 | | $ | — | | $ | (86,888,901 | ) | | $ | (97,451,227 | ) | | $ | (179,419,688 | ) |
Pursuant to Federal income tax regulations applicable to investment companies, the Portfolio has elected to treat net capital losses realized between November 1 and December 31 of each year as occurring on the first day of the following tax year. For the year ended December 31, 2008, the following amounts of realized capital and currency losses reflected in the accompanying financial statements will not be recognized for Federal income tax purposes until January 1, 2009:
| | | | |
Currency | | Capital | |
$— | | $ | (9,647,863 | ) |
Dividends and Distributions to Shareholders:
The Portfolio records dividends and distributions on the ex-dividend date. Net realized gains from security transactions (if any) are generally distributed annually to shareholders. The timing and characterization of certain income and capital gains distributions are determined in accordance with federal tax regulations that may differ from GAAP. Permanent book and tax basis differences relating to shareholder distributions will result in reclassification between under/over distributed net investment income, accumulated net realized gains/losses and paid in capital.
Expense Reductions:
Certain Portfolio trades are directed to brokers who paid a portion of the Portfolio’s expenses. Amounts paid for the Portfolio are shown as expense reductions in the Statement of Operations.
MSF-15
Metropolitan Series Fund, Inc.
Capital Guardian U.S. Equity Portfolio
Notes to Financial Statements—December 31, 2008—(Continued)
| 3. | INVESTMENT TRANSACTIONS: |
For the year ended December 31, 2008, purchases and sales of securities (excluding short term investments) for the Portfolio were as follows:
| | | | | | | | | | |
| Purchases | | Sales |
| U.S. Government | | Other | | U.S. Government | | Other |
| $ | 0 | | $ | 199,195,199 | | $ | 0 | | $ | 249,709,651 |
| 4. | INVESTMENT MANAGEMENT FEES AND OTHER TRANSACTIONS WITH AFFILIATES: |
Investment Management Agreement:
MetLife Advisers, LLC (“MetLife Advisers”) is the investment adviser to the Portfolio. The Fund has entered into an investment management agreement with MetLife Advisers with respect to the Portfolio. For providing investment management services to the Portfolio, MetLife Advisers receives monthly compensation at the following annual rates:
| | | | |
Management
Fees earned by
MetLife Advisers
for the year ended
December 31, 2008 | | Annual
percentage
rates paid to
MetLife Advisers | | Based on Portfolios
average daily net asset
levels |
| $2,736,756 | | 0.700% | | Of the first $200 million |
| | 0.650% | | Of the next $300 million |
| | 0.600% | | Of the next $1.5 billion |
| | 0.550% | | On amounts in excess of $2 billion |
Certain officers and directors of the Fund may also be officers of MetLife Advisers; however, such officers and directors receive no compensation from the Fund.
MetLife Advisers has entered into an investment subadvisory agreement with respect to the Portfolio. Capital Guardian Trust Company is compensated by MetLife Advisers to provide subadvisory services for the Portfolio.
Service and Distribution Fees:
The Fund has adopted a Distribution and Service Plan under Rule 12b-1 of the 1940 Act for the Portfolio’s Class B shares. Under the Distribution and Service Plan, the Class B shares of the Portfolio pay a fee to compensate the Insurance Companies (or their affiliates) and other broker-dealers and financial intermediaries involved in the offer and sale of Portfolio shares for promoting or selling and servicing the Class B shares. The fees under the Distribution and Service Plan for each class of the Portfolio’s shares are calculated as a percentage of the Portfolio’s average daily net assets that are attributable to that Class. Currently, the fee is 0.25% per year for Class B shares. Amounts paid by the Portfolio for the year ended December 31, 2008 are shown as Service and Distribution fees in the Statement of Operations.
The Fund has entered into a securities lending arrangement with the Fund’s custodian, State Street Bank and Trust Company (the “custodian”). Under the agreement, the custodian is authorized to loan securities on the Portfolios’ behalf. In exchange, the Portfolio receives either cash or securities as collateral against the loaned securities. The Portfolio receives collateral at least equal to 102% of the market value of the loaned securities (105% for foreign securities), at each loan’s inception. Collateral must be maintained at least at 100% of the market value of the loaned securities for the duration of the loan. The cash collateral is invested in the Navigator Securities Lending Prime Portfolio, an affiliate of the custodian, which invests in a variety of high quality U.S. dollar-denominated instruments. If the market value of the collateral at the close of trading on a business day is less than 100% of the market value of the loaned securities at the close of trading on that day, the borrower shall be required to deliver, by the close of business on the following business day, an additional amount of collateral, equal to at least 100% of the market value of all the loaned securities as of such preceding day. The Portfolio receives 80% of the annual net income from securities lending transactions, which is included in interest income of the Portfolio. The remaining 20% is paid to the custodian as compensation for its securities lending services. Interest income received by the Portfolio via lending transactions during the year ended December 31, 2008 is footnoted in the Statement of Operations. The Portfolio bears the risk of any deficiency in the
MSF-16
Metropolitan Series Fund, Inc.
Capital Guardian U.S. Equity Portfolio
Notes to Financial Statements—December 31, 2008—(Continued)
amount of collateral available for return to a borrower due to a loss in an approved investment purchased with such collateral. Any outstanding loans by the Portfolio at December 31, 2008 are footnoted in the Schedule of Investments.
| 6. | MARKET AND CREDIT RISK: |
In the normal course of business, the Portfolio invests in securities and enters into transactions where risks exist due to fluctuations in the market (market risk) or failure of the other party to a transaction to perform (credit risk). The value of securities held by the Portfolio may decline in response to certain events, including those directly involving the companies whose securities are owned by the Portfolio; conditions affecting the general economy; overall market changes; local, regional or global political, social or economic instability; and currency and interest rate and price fluctuations. Similar to credit risk, the Portfolio may be exposed to counterparty risk, or the risk that an entity with which the Portfolio has unsettled or open transactions may default. Financial assets, which potentially expose the Portfolio to credit and counterparty risks, consist principally of investments and cash due from counterparties. The extent of the Portfolio’s exposure to credit and counterparty risks in respect to these financial assets approximates their value as recorded in the Portfolio’s Statements of Assets and Liabilities.
On November 7, 2008, the Board approved the acquisition of the Portfolio by the Met Investors Series Trust Pioneer Fund Portfolio (“MIST Pioneer Fund Portfolio”), subject to the approval of shareholders of the Portfolio. On or about April 30, 2009, the shareholders of the Portfolio will consider the approval of a proposed Agreement and Plan of Reorganization providing for the acquisition of all the assets of the Portfolio by the MIST Pioneer Fund Portfolio in exchange for shares of the MIST Pioneer Fund Portfolio and the assumption by the MIST Pioneer Fund Portfolio of the liabilities of the Portfolio. If approved by shareholders, the reorganization will close on or about May 1, 2009.
| 8. | RECENT ACCOUNTING PRONOUNCEMENTS: |
In March 2008, the FASB issued Statement of Financial Accounting Standards No. 161, Disclosures about Derivative Instruments and Hedging Activities (“FAS 161”), an amendment of FASB Statement No. 133. FAS 161 requires enhanced disclosures about (a) how and why an entity uses derivative instruments, (b) how derivative instruments and hedging activities are accounted for, and (c) how derivative instruments and related hedging activities affect a fund’s financial position, financial performance, and cash flows. Management does not believe the adoption of FAS 161 will materially impact the financial statement amounts, but will require additional disclosures. This will include qualitative and quantitative disclosures on derivative positions existing at period end and the effect of using derivatives during the reporting period. FAS 161 is effective for financial statements issued for fiscal years and interim periods beginning after November 15, 2008. Management is currently evaluating the impact the adoption of FAS 161 will have on the Portfolio’s financial statement disclosures.
MSF-17
Metropolitan Series Fund, Inc.
Capital Guardian U.S. Equity Portfolio
Report of Independent Registered Public Accounting Firm
To the Shareholders and Board of Directors of Metropolitan Series Fund, Inc.:
We have audited the accompanying statement of assets and liabilities, including the schedule of investments, of the Capital Guardian U.S. Equity Portfolio (one of the portfolios constituting the Metropolitan Series Fund, Inc.) (the “Fund”) as of December 31, 2008, and the related statement of operations for the year then ended, the statements of changes in net assets for each of the two years in the period then ended, and the financial highlights for each of the five years in the period then ended. These financial statements and financial highlights are the responsibility of the Fund’s management. Our responsibility is to express an opinion on these financial statements and financial highlights based on our audits.
We conducted our audits in accordance with the standards of the Public Company Accounting Oversight Board (United States). Those standards require that we plan and perform the audit to obtain reasonable assurance about whether the financial statements and financial highlights are free of material misstatement. The Fund is not required to have, nor were we engaged to perform, an audit of its internal control over financial reporting. Our audits included consideration of internal control over financial reporting as a basis for designing audit procedures that are appropriate in the circumstances, but not for the purpose of expressing an opinion on the effectiveness of the Fund’s internal control over financial reporting. Accordingly, we express no such opinion. An audit also includes examining, on a test basis, evidence supporting the amounts and disclosures in the financial statements, assessing the accounting principles used and significant estimates made by management, as well as evaluating the overall financial statement presentation. Our procedures included confirmation of securities owned as of December 31, 2008, by correspondence with the custodian and brokers; where replies were not received from brokers, we performed other auditing procedures. We believe that our audits provide a reasonable basis for our opinion.
In our opinion, the financial statements and financial highlights referred to above present fairly, in all material respects, the financial position of the Capital Guardian U.S. Equity Portfolio of the Metropolitan Series Fund, Inc. as of December 31, 2008, the results of its operations for the year then ended, the changes in its net assets for each of the two years in the period then ended, and the financial highlights for each of the five years in the period then ended, in conformity with accounting principles generally accepted in the United States of America.
Deloitte & Touche LLP
Boston, Massachusetts
February 20, 2009
MSF-18
Metropolitan Series Fund, Inc.
Directors and Officers
The Fund’s Directors review actions of the Fund’s investment adviser and subadvisers, and decide upon matters of general policy. The Fund’s officers supervise the daily business operations of the Fund. The Board of Directors and the Fund’s officers are listed below. Each Director is responsible for overseeing all 38 Portfolios of the Fund. There is no limit to the term a Director may serve. Directors serve until their resignation, retirement or removal in accordance with the Fund’s organizational documents and policies adopted by the Board from time to time. Officers hold office at the pleasure of the Board or until the election or appointment and the qualification of a successor. The address of the Directors and officers is c/o Metropolitan Series Fund, Inc., 501 Boylston Street, Boston, MA 02116.
Interested Directors(1)
Each Director below is an “interested person” (as defined by the 1940 Act) with respect to the Fund in that Ms. Forget is an employee of MetLife and Mr. Typermass is a former employee of MetLife and owns securities issued by MetLife, Inc., the ultimate parent company of MetLife Advisers.
| | | | | | | | |
Name, Address and Age | | Current
position(s)
with Fund | | Position(s)
held since | | Principal occupations
over past five years, including other directorships(2) | | Number of
Portfolios in
Fund Complex
Overseen by
Director(3) |
Elizabeth M. Forget Age: 42 | | Director, Chairman of the Board, President and Chief Executive Officer | | 2006 | | Senior Vice President (since 2007), MetLife, Inc.; President, Met Investors Advisory, LLC; Trustee and President, Met Investors Series Trust; Executive Vice President, MetLife Investors Group, Inc.; President, Chief Executive Officer and Chair of the Board of Managers (since 2006), MetLife Advisers; President, Met Investors Advisory, LLC. | | 87 |
| | | | |
Arthur G. Typermass Age: 71 | | Director | | 1998 | | Formerly, Senior Vice President and Treasurer, MetLife. | | 38 |
Non-Interested Directors(1)
Each Director below is not an “interested person” (as defined by the 1940 Act) with respect to the Fund (collectively, the “Independent Directors”).
| | | | | | | | |
Name, Address and Age | | Current
position(s)
with Fund | | Position(s)
held since | | Principal occupations
over past five years, including other directorships(2) | | Number of
Portfolios in
Fund Complex
Overseen by
Director(3) |
Steve A. Garban† Age: 71 | | Director | | 1985 | | Formerly, Chief Financial Officer, Senior Vice President Finance and Operations and Treasurer (Emeritus), The Pennsylvania State University. | | 38 |
| | | | |
Linda B. Strumpf Age: 61 | | Director | | 2000 | | Vice President and Chief Investment Officer, Ford Foundation. | | 38 |
| | | | |
Michael S. Scott Morton† Age: 71 | | Director | | 1993 | | Jay W. Forrester Professor of Management (Emeritus) at Sloan School of Management, MIT. | | 38 |
| | | | |
H. Jesse Arnelle Age: 75 | | Director | | 2001 | | Formerly, Counsel, Womble Carlyle Sandrie & Rice; Director, Textron Inc. (global multi- industry company)*; formerly, Director, Gannet Co. Inc. (diversified news and information company)*; formerly, Director, Eastman Chemical Company (global chemical company)*; formerly, Director, Waste Management, Inc.*; formerly, Director, Armstrong Holdings Inc. (parent company of floor and ceiling products business)*; formerly, Director, FPL Group Inc. (public utility holding company)*; Director, URS Corporation (engineering design services firm)*. | | 38 |
MSF-19
Metropolitan Series Fund, Inc.
Directors and Officers—(Continued)
| | | | | | | | |
Name, Address and Age | | Current
position(s)
with Fund | | Position(s)
held since | | Principal occupations
over past five years, including other directorships(2) | | Number of
Portfolios in
Fund Complex
Overseen by
Director(3) |
Nancy Hawthorne Age: 57 | | Director | | 2003 | | Chief Executive Officer, Clerestory LLC (corporate financial advisor); Director, Avid Technologies (computer software company)*; formerly, Chairman of the Board of Avid Technologies; formerly, Board of Advisors, L. Knife & Sons, Inc. (beverage distributor); formerly, Trustee, New England Zenith Fund (“Zenith Fund”)**; formerly, Chief Executive Officer and Managing Partner, Hawthorne, Krauss and Associates (corporate financial advisor); formerly, Chief Financial Officer and Executive Vice President, Continental Cablevision, subsequently renamed MediaOne (cable television company); formerly, Director, Life F/X, Inc.; formerly, Chairman of the Board, WorldClinic (distance medicine company); formerly, Director, Perini Corporation (construction company)*; formerly, Director, CGU (property and casualty insurance company); formerly, Director, Beacon Power Corporation (energy company)*. | | 38 |
| | | | |
John T. Ludes Age: 72 | | Director | | 2003 | | President, LFP Properties (consulting firm); Formerly, Trustee, Zenith Fund**; formerly, Vice Chairman, President and Chief Operating Officer, Fortune Brands/American Brands (global conglomerate); formerly, President and CEO, Acushnet Company (athletic equipment company). | | 38 |
Officers(1)
| | | | | | | | |
Name and address | | Age | | Current
position(s)
with Fund | | Position(s)
held since | | Principal occupations over past five years(2) |
| Jeffrey L. Bernier | | 37 | | Senior Vice President | | 2008 | | Vice President (since 2008), MetLife, Inc.; Vice President (since 2008), MetLife; Senior Vice President (since 2008), MetLife Advisers; formerly, Director and Senior Investment Analyst (2004 to 2007), John Hancock Financial Services; formerly, Assistant Vice President (2000 to 2001), Wachovia Securities. |
| | | | |
| Alan C. Leland | | 56 | | Senior Vice President | | 2005 | | Treasurer and Chief Financial Officer, MetLife Advisers, LLC; Treasurer (since 2005), Met Investors Advisory, LLC; Vice President (since 2004), Met Investors Advisory, LLC; Vice President (since 2003), MetLife, Inc.; Vice President, MetLife; Senior Vice President, NELICO. |
| | | | |
| Peter Duffy | | 53 | | Vice President
and Treasurer | | 2000 | | Senior Vice President, MetLife Advisers; Second Vice President (since 2003), NELICO; Vice President, MetLife (since 2004); Vice President (since 2004), MetLife, Inc.; formerly, Vice President and Treasurer, Zenith Fund**. |
| | | | |
| Jeffrey P. Halperin | | 41 | | Chief
Compliance Officer | | 2007 | | Vice President (since 2006), MetLife, Inc.; Vice President (since 2006), MetLife; Chief Compliance Officer (since 2006), Met Investors Series Trust, MetLife Advisers, Met Investors Advisory, LLC and MetLife Investment Advisors Company, LLC. |
| * | Indicates a directorship with a registered investment company or a company subject to the reporting requirements of the Securities Exchange Act of 1934, as amended. |
| ** | The Zenith Fund deregistered with the Securities and Exchange Commission (“SEC”) in 2004. |
| (†) | Served as a trustee, director and/or officer of one or more of the following companies, each of which had a direct or indirect advisory relationship with MetLife Advisers or its affiliates prior to January 31, 2005: State Street Research Financial Trust, State Street Research Income Trust, State Street Research Money Market Trust, State Street Research Institutional Funds, State Street Research Capital Trust, State Street Research Master Investment Trust, State Street Research Equity Trust, State Street Research Securities Trust and State Street Research Exchange Trust (collectively, the “State Street Research Funds”). |
| (1) | During the period shown, each Director of the Fund served as a Trustee of Metropolitan Series Fund II, a registered investment company that ceased investment operations in June of 2008 and has applied for deregistration under the Investment Company Act of 1940. During this period, each officer of the Fund served in the same position with Metropolitan Series Fund II. |
| (2) | Previous positions during the past five years with the Fund; Met Investors Series Trust; MetLife; MetLife, Inc.; MetLife Advisers; Met Investors Advisory, LLC; Zenith Fund; NELICO; or New England Securities Corporation are omitted if not materially different. |
| (3) | The Fund Complex includes the Fund (38 portfolios) and Met Investors Series Trust (49 portfolios). |
MSF-20
Metropolitan Series Fund, Inc.
Capital Guardian U.S. Equity Portfolio
Board Approval of Advisory and Subadvisory Agreements
The Fund’s Contract Review Committees of the Board of Directors (the “Board” or the “Directors”) typically meet in early fall to review the Portfolios’ advisory agreements (the “Advisory Agreements”) and subadvisory agreements (the “Subadvisory Agreements,” and, together with the Advisory Agreements, the “Agreements”) and determine whether to recommend that the full Board approve the continuation of the Agreements for an additional one-year period. (Following the initial approval of an Agreement for a new Portfolio or with a new adviser or subadviser, such annual reviews are not required until 2 years following the execution of such Agreement.) After each Committee has made its recommendations, the full Board, including the Independent Directors, determines whether to approve the continuation of each of the Agreements. In addition, the Board, including the Independent Directors, considers matters bearing on the Agreements at most of its other meetings throughout the year and regularly interviews various individuals at MetLife Advisers responsible for the management of the Portfolios. The Directors also interview selected investment managers and other professionals at the subadvisers at various times throughout the year.
The Directors receive all materials that they or MetLife Advisers, the Fund’s investment adviser, and the subadvisers believe to be reasonably necessary for the Directors to evaluate the Agreements and determine whether to approve the continuation of the Agreements. These materials generally include, among other items, (i) information on the investment performance of the Portfolios and the performance of peer groups of funds and the Portfolios’ performance benchmarks, (ii) information on the Portfolios’ advisory and subadvisory fees and other expenses, including information comparing the Portfolios’ expenses to those of peer groups of funds and information about any applicable expense caps and fee “breakpoints,” (iii) sales and redemption data, (iv) information related to the profitability of the Agreements to MetLife Advisers and certain of the subadvisers, and potential “fall-out” or ancillary benefits that MetLife Advisers, the subadvisers or their affiliates may receive as a result of their relationships with the Fund and (v) information obtained through the subadvisers’ responses to certain requests from MetLife Advisers and the Directors and MetLife Advisers’ responses to requests from the Directors. The Directors may also consider other information such as (vi) MetLife Advisers’ and the subadvisers’ financial results and condition, (vii) each Portfolio’s investment objectives and strategies and the size, education and experience of the investment staffs of MetLife Advisers and the relevant subadvisers and their use of technology and external research, (viii) the allocation of the Portfolios’ brokerage, if any, including allocations to brokers affiliated with the subadvisers and the use of “soft” commission dollars to pay Portfolio expenses and to pay for research and other similar services, (ix) the resources devoted to, and the record of compliance with, the Portfolios’ investment policies and restrictions, policies on personal securities transactions and other compliance policies, (x) the responses of MetLife Advisers, the subadvisers and/or their affiliates to certain legal and regulatory proceedings and (xi) the economic outlook generally and for the mutual fund industry in particular. Throughout the process, the Directors have the opportunity to ask questions of and request additional materials from MetLife Advisers and the subadvisers.
Following meetings of each Contract Review Committee on September 10, 2008, the Board, including the Independent Directors, at its November 6-7, 2008 meeting, approved the continuation through December 31, 2009 of the Advisory Agreements for each Portfolio of the Fund and the Subadvisory Agreements for each Portfolio other than the Zenith Equity Portfolio and Asset Allocation Portfolios (which do not have subadvisers) and the Van Eck Global Natural Resources Portfolio, Met/Dimensional International Small Cap Portfolio and Loomis Sayles Small Cap Growth Portfolio (formerly known as the Franklin Templeton Small Cap Growth Portfolio). The Agreements approved for continuation are referred to below as the “Continued Agreements.”
In considering whether to approve the continuation of the Continued Agreements, the Directors, including the Independent Directors, did not identify any single factor as determinative, and each weighed the various factors as he or she deemed appropriate. The Directors considered the following matters in connection with their approval of the Continued Agreements:
The nature, extent and quality of the services provided to the relevant Portfolios under the Continued Agreements. The Directors considered the nature, extent and quality of the services provided by MetLife Advisers, the relevant subadvisers (if any) and their affiliates (each, an “Adviser,” and, collectively, the “Advisers”) to the relevant Portfolios pursuant to the Continued Agreements and the resources dedicated to these Portfolios by the Advisers. In particular, the Directors considered the Advisers’ abilities to attract and retain highly qualified investment professionals. With respect to MetLife Advisers, the Directors considered (for each Portfolio other than the Zenith Equity and Asset Allocation Portfolios) that MetLife Advisers is (i) ultimately responsible for the performance of such Portfolios; (ii) ultimately responsible for the establishment of the investment strategies of each such Portfolio, primarily through its recommendations to the Board regarding the hiring and selection of subadvisers; (iii) responsible for the hiring and selection, subject to Board approval, of subadvisers; and (iv) responsible for maintaining a program of Subadviser oversight reasonably designed to ensure that the subadvisers have reasonable compliance policies and procedures in place. The Directors also considered that MetLife Advisers provides a full range of day-to-day administrative services for the Portfolios involving all aspects of such Portfolios’ day-to-day operations (other than portfolio management). With respect to the Zenith Equity and Asset Allocation Portfolios, the Directors considered both the portfolio management services and the administrative services provided by MetLife Advisers. After reviewing
MSF-21
Metropolitan Series Fund, Inc.
Capital Guardian U.S. Equity Portfolio
Board Approval of Advisory and Subadvisory Agreements—(Continued)
these and related factors, the Directors concluded, within the context of their overall conclusions regarding each of the Continued Agreements, that the nature, extent and quality of services provided supported the renewal of these Agreements.
Investment performance of the relevant Portfolios. The Directors reviewed information about the performance of the relevant Portfolios over various time periods, including information prepared by an independent third party that compared the performance of the Portfolios to the performance of peer groups of funds and performance benchmarks. The Directors also reviewed a description of the third party’s methodology for identifying a Portfolio’s peer group(s) for purposes of performance and expense comparisons.
In the case of each relevant Portfolio that had performance that lagged its peer group(s) for certain periods, the Directors concluded that other factors relevant to performance were sufficient, in light of other considerations, to warrant renewal of the Continued Agreements relating to such Portfolio. These factors varied from Portfolio to Portfolio, but included one or more of the following: (i) that such Portfolio’s performance, although lagging in certain recent periods, was stronger over the longer term; (ii) that the underperformance was attributable, to a significant extent, to investment decisions that were reasonable and consistent with the Portfolio’s investment objective(s) and policies and that the Portfolio was performing within the range of reasonable expectations, given market conditions and the Portfolio’s investment objective(s) and policies; (iii) that the Portfolio’s performance was competitive when compared to other relevant performance benchmarks or peer groups; and (iv) that MetLife Advisers and/or the relevant subadviser (if any) had taken or was taking steps designed to help improve the Portfolio’s investment performance (including, in the case of certain Portfolios, that MetLife Advisers was formulating possible proposals, for presentation to the Board in November 2008, to replace the Portfolio’s subadviser or to merge the Portfolio into another Portfolio with a similar investment objective and better investment performance).
The Directors also considered the investment performance of the Advisers and their reputations generally, the historical responsiveness of the Advisers to Director concerns about performance and the willingness of the Advisers to take steps intended to improve performance.
After reviewing these and related factors, the Directors concluded, within the context of their overall conclusions regarding each of the Continued Agreements, that the investment performance of each relevant Portfolio and Adviser was sufficient, in light of other considerations, to warrant the renewal of the Continued Agreements.
The costs of the services to be provided and profits to be realized by the Advisers and their affiliates from their relationships with the Portfolios. The Directors considered the fees charged by MetLife Advisers to the Portfolios for advisory services and, with respect to the subadvised Portfolios, by such subadvisers to MetLife Advisers for subadvisory services (such advisory and subadvisory fees (if any), collectively, “Fees”), as well as the total expense levels of the Portfolios. This information included comparisons (provided by an independent third party) of the Portfolios’ advisory fees and total expense levels to those of their peer groups. In evaluating Fees for the relevant Portfolios, the Directors also took into account the demands, complexity and quality of the investment management services provided to each Portfolio. The Directors considered MetLife Advisers’ recommendations regarding reductions in Fee rates, implementation of Fee breakpoints and institution of Fee waivers and expense caps.
The Directors also considered the compensation directly or indirectly received by the Advisers and their affiliates from their relationships with the relevant Portfolios. The Directors reviewed information relating to the profits received by MetLife Advisers, certain of the subadvisers and their affiliates as a result of their relationships with the relevant Portfolios, and information about the allocation of expenses used to calculate profitability. When reviewing profitability, the Directors also considered the performance of the relevant Portfolios, the expense levels of such Portfolios and whether the relevant Advisers had implemented breakpoints, fee waivers and/or expense caps with respect to such Portfolios.
After reviewing these and related factors, the Directors concluded, within the context of their overall conclusions regarding each of the Continued Agreements, that the Fees charged to each of the relevant Portfolios were fair and reasonable, and that the information provided regarding costs of these services generally, and the related profitability (if known) to the relevant Advisers of their relationships with the relevant Portfolios, supported the renewal of the Continued Agreements.
Economies of Scale. The Directors considered the existence of any economies of scale in the provision of services by the Advisers and whether those economies were shared with the relevant Portfolios through breakpoints in their advisory fees or other means, such as expense caps, fee waivers or relatively low levels of fees. The Directors noted that most of the relevant Portfolios benefited or will benefit from breakpoints, expense caps and/or fee waivers with respect to their advisory fees. In considering these issues, the Directors also took into consideration information relating to the costs of the services provided and the profitability to MetLife Advisers, the relevant subadvisers (if any) and each of their affiliates of their relationships with the relevant Portfolios, as discussed above.
MSF-22
Metropolitan Series Fund, Inc.
Capital Guardian U.S. Equity Portfolio
Board Approval of Advisory and Subadvisory Agreements—(Continued)
After reviewing these and related factors, the Directors concluded, within the context of their overall conclusions regarding each of the Continued Agreements, that the extent to which economies of scale were shared with the relevant Portfolios supported the renewal of such Agreements.
Other Factors. The Directors also considered other factors, which included but were not limited to the following:
| | • | | the extent to which each relevant Portfolio operated in accordance with its investment objective, and its record of compliance with its investment restrictions and the compliance programs of the Fund and the Advisers. They also considered the compliance-related resources the Advisers and their affiliates provide to the relevant Portfolios; |
| | • | | the nature, quality, cost and extent of administrative and shareholder services performed by MetLife Advisers and its affiliates under the Advisory Agreements; and |
| | • | | so-called “fall-out benefits” to the Advisers, such as the engagement of their affiliates to provide distribution, brokerage and transfer agency services to the Portfolios, and the benefits of research made available to the relevant Advisers by reason of brokerage commissions generated by the relevant Portfolios’ securities transactions. The Directors also considered the possible conflicts of interest associated with these fall-out and other benefits, and the reporting and other processes in place to disclose and monitor these possible conflicts of interest. |
Based on their evaluation of all factors that they deemed to be material, including those factors described above, and assisted by the advice of independent counsel, the Directors, including the Independent Directors, concluded that each of the Continued Agreements should be continued through December 31, 2009.
MSF-23
A description of the policies and procedures that the Fund uses to determine how to vote proxies relating to portfolio securities is available (i) without charge, upon request, by calling (800) 638-7732 and (ii) on the Securities and Exchange Commission’s (the “SEC”) website at http://www.sec.gov.
Information regarding how the Fund voted proxies relating to portfolio securities during the most recent twelve-month period ended December 31, 2008 is available (i) without charge, upon request, by calling (800) 638-7732 and (ii) on the SEC’s website at http://www.sec.gov.
The Fund’s Statement of Additional Information includes additional information about the Directors of the Fund and is available (i) without charge, upon request, by calling (800) 638-7732 and (ii) on the SEC’s website at http://www.sec.gov.
The Fund files with the SEC a complete schedule of its portfolio holdings, as of the close of the first and third quarters of its fiscal year, on “Form N-Q”. These filings are available on the SEC’s website at www.sec.gov and may be reviewed and copied at the SEC’s Public Reference Room in Washington, DC. (Call 1-800-SEC-0330 for information on the operation of the Public Reference Room.)
MSF-24
Simplify your life…
with MetLife eDelivery® while helping MetLife preserve the planet’s natural resources.
(see details on inside cover)
| | |
Metropolitan Series Fund, Inc. Davis Venture Value Portfolio Annual Report | | December 31, 2008 |
NOT PART OF THE ANNUAL REPORT
Letter from the President
February 1, 2009
Letter to Policy Holders:
2008 was an extraordinary year in the capital markets around the world and for the global economy. Energy prices rose to record levels early in the year before falling by two-thirds by year-end. A credit crisis that began with concerns about sub-prime mortgages led to massive changes in the financial landscape with government takeovers, forced sales, and outright failures of a number of large, once venerable firms.
While bonds as measured by the Barclays Capital U.S. Aggregate Bond Index (formerly known as, Lehman Brothers U.S. Aggregate Bond Index) were up 5.2% for the year in response to declining interest rates, there were large differences in the total returns of the various sectors of the bond market. U.S. treasury securities were up over 13% as frightened investors sought refuge in what they perceived to be the safest and most liquid investments. In contrast, investment grade corporate securities lost nearly 5% as credit spreads widened and below investment grade or high yield bonds fell over 26%.
In response to the growing credit crisis and the weakening economy, common stocks fell sharply across all regions, styles, and capitalizations. As measured by the Standard and Poor’s 500, U.S. common stocks fell 37% for the year, the worst calendar year decline since the 1930s. Foreign stocks were down even more with the MSCI EAFE Index down 43% for the year.
On the following pages, you will find a complete review of your Portfolio and its investment performance.
MetLife is committed to building your financial freedom. We appreciate your trust and will continue to focus our efforts on meeting your investment needs.
Sincerely,
Elizabeth M. Forget
President, Metropolitan Series Fund, Inc.
Metropolitan Series Portfolio, Inc.
Davis Venture Value Portfolio
Managed by Davis Selected Advisers, L.P.
Portfolio Manager Commentary*
PORTFOLIO PERFORMANCE
For the twelve-month period ended December 31, 2008, the Class A shares of the Davis Venture Value Portfolio returned -39.3%, compared to its benchmark, the Standard & Poor’s 500 Index 1, which returned -37.0%. The average return of its peer group, the Lipper Variable Insurance Products2 Large-Cap Value Funds Universe, was -37.1% over the same period.
PORTFOLIO REVIEW
The sectors within the S&P 500 Index that turned in the weakest performance over the year were financials, materials, and information technology. The sectors that turned in the strongest (but still negative) performance over the year were consumer staples and health care.
The Portfolio’s financial companies out-performed the corresponding sector within the Index (down 49% versus down 55% for the Index), but were still the largest detractors from performance. A higher relative average weighting in this sector (31% versus 16% for the Index) detracted from both absolute and relative performance. American International Group, American Express, Merrill Lynch, Berkshire Hathaway, Loews, Bank of New York Mellon, and JPMorgan Chase were among the top detractors from performance. Wells Fargo was among the top contributors to the Portfolio’s performance.
The second largest detractor from performance was energy companies. The Portfolio’s energy companies under-performed the corresponding sector within the Index (down 37% versus down 35% for the Index). A higher relative average weighting in this sector (16% versus 14% for the Index) detracted from performance. ConocoPhillips was among the top detractors from performance.
The Portfolio’s relative performance was helped by having a higher relative average weighting in consumer staple companies (14% versus 11% for the Index). Unfortunately, the Portfolio’s consumer staple companies under-performed the corresponding sector within the Index (down 24% versus down 16% for the Index). Wal-Mart Stores was among the most important contributors to performance while Costco was among the most important detractors. The Portfolio no longer owns Wal-Mart Stores.
The Portfolio’s relative performance was harmed by having a lower relative average weighting in health care companies (4% versus 13% for the Index). The Portfolio’s healthcare companies under-performed the corresponding sector within the Index (down 32% versus down 23% for the Index). Schering Plough, was among the most important contributors to performance.
H&R Block, a consumer discretionary company, was the single most important contributor to performance over the year.
The Portfolio held 10% of assets in foreign companies (including American Depositary Receipts) at December 31, 2008. As a whole these companies under-performed the domestic companies held by the Portfolio.
* The views expressed above are those of the subadvisory firm as of December 31, 2008 and are subject to change based on market and other conditions. Information about the Portfolio’s holdings, asset allocation, industry allocation, or country diversification is historical and is not an indication of future Portfolio composition, which will vary. The performance of any index mentioned in this commentary has not been adjusted for ongoing management, distribution and operating expenses, and sales charges applicable to mutual fund investments. Direct investment in any index is not possible.
1 The Standard & Poor’s (S&P) 500® Composite Stock Price Index is an unmanaged index representing the performance of 500 major companies, most of which are listed on the New York Stock Exchange.
2 The Lipper Variable Products Fund Average is an average of the total return performance (calculated on the basis of net asset value) of variable product funds with similar investment objectives to those of the subject Portfolio as calculated by Lipper Analytical Services, an independent mutual fund ranking service.
MSF-2
Metropolitan Series Fund, Inc.
Davis Venture Value Portfolio
A $10,000 INVESTMENT COMPARED TO THE S&P 500 INDEX
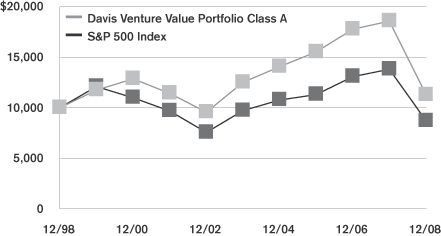
Average Annual Returns as of December 31, 2008
| | | | | | | | | | | | |
| | | Davis Venture Value Portfolio | | | S&P 500 Index | |
| | | Class A | | | Class B | | | Class E | | |
| 1 Year | | -39.3 | % | | -39.5 | % | | -39.5 | % | | -37.0 | % |
| 5 Year | | -2.1 | | | -2.3 | | | -2.2 | | | -2.2 | |
| 10 Year | | 1.2 | | | — | | | — | | | -1.4 | |
| Since Inception | | — | | | 2.1 | | | -1.3 | | | — | |
Performance numbers are net of all Portfolio expenses but do not include any insurance, sales, or administrative charges of variable annuity or life insurance contracts or any additional expenses that participants in certain eligible qualified plans may bear relating to the operations of their plans. If these charges were included, the returns would be lower.
Inception dates of the Class A, Class B and Class E shares are: 10/31/94, 7/30/02, 2/20/01, respectively.
This information represents past performance and is not indicative of future results. Investment return and principal value may fluctuate so that shares, upon redemption, may be worth more or less than the original cost.
PORTFOLIO COMPOSITION
as of December 31, 2008
Top Holdings
| | |
| | | % of Total
Net Assets |
Costco Wholesale Corp. | | 4.2% |
Wells Fargo & Co. | | 4.1% |
ConocoPhillips | | 4.1% |
JPMorgan Chase & Co. | | 4.0% |
Berkshire Hathaway, Inc. | | 3.8% |
Devon Energy Corp. | | 3.4% |
Philip Morris International, Inc. | | 3.3% |
Occidental Petroleum Corp. | | 2.9% |
EOG Resources, Inc. | | 2.7% |
The Bank of New York Mellon Corp. | | 2.7% |
Top Sectors
| | |
| | | % of Equity
Market Value |
Financials | | 29.3% |
Energy | | 17.0% |
Consumer Staples | | 15.5% |
Consumer Discretionary | | 11.5% |
Information Technology | | 8.8% |
Industrials | | 6.1% |
Materials | | 5.7% |
Health Care | | 5.5% |
Utilities | | 0.4% |
Telecommunication Services | | 0.2% |
MSF-3
Metropolitan Series Fund, Inc.
Shareholder Expense Example
As a shareholder of the Portfolio, you incur ongoing costs, including management fees; distribution and service (12b-1) fees; and other Portfolio expenses. This example is intended to help you understand your ongoing costs (in dollars) (referred to as “expenses”) of investing in the Portfolio and compare these costs with the ongoing costs of investing in other mutual funds. The example is based on an investment of $1,000 invested at the beginning of the period and held for the entire period, July 1, 2008 through December 31, 2008.
Actual Expenses
The first line for each share class of the Portfolio in the table below provides information about actual account values and actual expenses. You may use the information in this line, together with the amount you invested in the particular share class of the Portfolio, to estimate the expenses that you paid over the period. Simply divide your account value by $1,000 (for example, an $8,600 account value divided by $1,000=8.6), then multiply the result by the number in the first line under the heading entitled “Expenses Paid During Period” to estimate the expenses you paid on your account during this period.
Hypothetical Example for Comparison Purposes
The second line for each share class of the Portfolio in the table below provides information about hypothetical account values and hypothetical expenses based on the Portfolio’s actual expense ratio and an assumed rate of return of 5% per year before expenses, which is not the Portfolio’s actual return. The hypothetical account values and expenses may not be used to estimate the actual ending account balance or expenses you paid for the period. You may use this information to compare the ongoing costs of investing in the Portfolio and other funds. To do so, compare this 5% hypothetical example with the 5% hypothetical examples that appear in the shareholder reports of the other funds.
Please note that the expenses shown in the table are meant to highlight your ongoing costs only and do not reflect any fees or charges of your variable insurance product or any additional expenses that participants in certain eligible qualified plans may bear relating to the operations of their plan. Therefore, the second line for each share class in the table is useful in comparing ongoing costs only, and will not help you determine the relative total costs of owning different funds. In addition, if these other costs were included, your costs would have been higher.
| | | | | | | | | | | | | | |
Portfolio | | | | Annualized
Expense
Ratio | | | Beginning
Account Value
July 1,
2008 | | Ending
Account Value
December 31,
2008 | | Expenses Paid
During Period*
July 1, 2008
to
December 31,
2008 |
Davis Venture Value—Class A | | Actual | | 0.74 | % | | $ | 1,000.00 | | $ | 686.57 | | $ | 3.14 |
| | Hypothetical | | 0.74 | % | | $ | 1,000.00 | | $ | 1,021.37 | | $ | 3.76 |
| | | | | |
Davis Venture Value—Class B | | Actual | | 0.99 | % | | $ | 1,000.00 | | $ | 685.51 | | $ | 4.19 |
| | Hypothetical | | 0.99 | % | | $ | 1,000.00 | | $ | 1,020.10 | | $ | 5.03 |
| | | | | |
Davis Venture Value—Class E | | Actual | | 0.89 | % | | $ | 1,000.00 | | $ | 685.81 | | $ | 3.77 |
| | Hypothetical | | 0.89 | % | | $ | 1,000.00 | | $ | 1,020.61 | | $ | 4.52 |
* Expenses paid are equal to the Portfolio’s annualized expense ratio for the most recent six month period, as shown above, multiplied by the average account value over the period, multiplied by the number of days in the most recent fiscal half-year, divided by 366 (to reflect the one-half year period).
MSF-4
Metropolitan Series Fund, Inc.
Davis Venture Value Portfolio
Schedule of Investments as of December 31, 2008
Common Stock—91.6% of Total Net Assets
| | | | | |
| Security Description | | Shares | | Value* |
| | | | | |
| | |
Air Freight & Logistics—0.5% | | | | | |
United Parcel Service, Inc. (Class B) (a) | | 278,800 | | $ | 15,378,608 |
| | | | | |
| | |
Automobiles—0.6% | | | | | |
Harley-Davidson, Inc. (a) | | 973,270 | | | 16,516,392 |
| | | | | |
| | |
Beverages—2.2% | | | | | |
Diageo, Plc. (ADR) | | 764,000 | | | 43,349,360 |
Heineken Holding NV (EUR) | | 775,143 | | | 22,191,366 |
| | | | | |
| | | | | 65,540,726 |
| | | | | |
| | |
Capital Markets—4.0% | | | | | |
Ameriprise Financial, Inc. | | 562,196 | | | 13,132,898 |
E*TRADE Financial Corp. (b) | | 958,200 | | | 1,101,930 |
Merrill Lynch & Co., Inc. (a) | | 443,155 | | | 5,158,324 |
Morgan Stanley | | 134,596 | | | 2,158,920 |
State Street Corp. | | 174,600 | | | 6,867,018 |
The Bank of New York Mellon Corp. | | 2,770,164 | | | 78,478,746 |
The Goldman Sachs Group, Inc. | | 111,330 | | | 9,395,139 |
| | | | | |
| | | | | 116,292,975 |
| | | | | |
| | |
Chemicals—0.5% | | | | | |
Monsanto Co. | | 207,321 | | | 14,585,032 |
| | | | | |
|
Commercial & Professional Services—1.7% |
Iron Mountain, Inc. (a) (b) | | 2,021,550 | | | 49,992,932 |
| | | | | |
| | |
Commercial Banks—4.3% | | | | | |
Wachovia Corp. | | 866,619 | | | 4,801,069 |
Wells Fargo & Co. | | 4,121,163 | | | 121,491,885 |
| | | | | |
| | | | | 126,292,954 |
| | | | | |
| | |
Communications Equipment—0.6% | | | | | |
Cisco Systems, Inc. (b) | | 1,016,700 | | | 16,572,210 |
| | | | | |
| | |
Computers & Peripherals—1.6% | | | | | |
Dell, Inc. (b) | | 928,316 | | | 9,505,956 |
Hewlett-Packard Co. | | 1,066,800 | | | 38,714,172 |
| | | | | |
| | | | | 48,220,128 |
| | | | | |
| | |
Construction Materials—2.3% | | | | | |
Martin Marietta Materials, Inc. (a) | | 384,700 | | | 37,346,676 |
Vulcan Materials Co. (a) | | 440,300 | | | 30,636,074 |
| | | | | |
| | | | | 67,982,750 |
| | | | | |
| | |
Consumer Finance—2.6% | | | | | |
American Express Co. | | 3,995,000 | | | 74,107,250 |
Discover Financial Services | | 306,535 | | | 2,921,279 |
| | | | | |
| | | | | 77,028,529 |
| | | | | |
| | |
Containers & Packaging—1.4% | | | | | |
Sealed Air Corp. | | 2,783,300 | | | 41,582,502 |
| | | | | |
| | |
Diversified Consumer Services—1.7% | | | | | |
H&R Block, Inc. | | 2,202,830 | | | 50,048,298 |
| | | | | |
| | | | | |
| Security Description | | Shares | | Value* |
| | | | | |
| | |
Diversified Financial Services—4.9% | | | | | |
Citigroup, Inc. | | 1,035,873 | | $ | 6,950,708 |
JPMorgan Chase & Co. | | 3,768,687 | | | 118,826,701 |
Moody’s Corp. | | 937,100 | | | 18,826,339 |
| | | | | |
| | | | | 144,603,748 |
| | | | | |
| | |
Electrical Equipment—0.1% | | | | | |
ABB, Ltd. (ADR) | | 277,280 | | | 4,161,973 |
| | | | | |
|
Electronic Equipment, Instruments & Components—1.0% |
Agilent Technologies, Inc. (b) | | 1,296,570 | | | 20,265,389 |
Tyco Electronics, Ltd. | | 640,462 | | | 10,381,889 |
| | | | | |
| | | | | 30,647,278 |
| | | | | |
| | |
Energy Equipment & Services—0.5% | | | | | |
Transocean, Ltd. (b) | | 316,864 | | | 14,971,824 |
| | | | | |
| | |
Food & Staples Retailing—6.0% | | | | | |
Costco Wholesale Corp. | | 2,357,400 | | | 123,763,500 |
CVS Caremark Corp. | | 1,760,691 | | | 50,602,259 |
Whole Foods Market, Inc. (b) | | 322,600 | | | 3,045,344 |
| | | | | |
| | | | | 177,411,103 |
| | | | | |
| | |
Food Products—0.3% | | | | | |
The Hershey Co. (a) | | 245,352 | | | 8,523,528 |
| | | | | |
| | |
Health Care Providers & Services—3.2% | | | | | |
Cardinal Health, Inc. | | 534,800 | | | 18,434,556 |
Express Scripts, Inc. (b) | | 596,400 | | | 32,790,072 |
UnitedHealth Group, Inc. | | 1,631,430 | | | 43,396,038 |
| | | | | |
| | | | | 94,620,666 |
| | | | | |
| | |
Household Durables—0.3% | | | | | |
Garmin, Ltd. (a) | | 181,500 | | | 3,479,355 |
Hunter Douglas NV (EUR) (a) | | 112,851 | | | 3,712,261 |
| | | | | |
| | | | | 7,191,616 |
| | | | | |
| | |
Household Products—1.9% | | | | | |
Procter & Gamble Co. | | 914,300 | | | 56,522,026 |
| | | | | |
|
Independent Power Producers & Energy Traders—0.4% |
The AES Corp. (b) | | 1,374,000 | | | 11,321,760 |
| | | | | |
| | |
Industrial Conglomerates—0.9% | | | | | |
Siemens AG (EUR) | | 174,237 | | | 13,050,432 |
Tyco International, Ltd. | | 658,462 | | | 14,222,779 |
| | | | | |
| | | | | 27,273,211 |
| | | | | |
| | |
Insurance—10.4% | | | | | |
American International Group, Inc. (b) | | 3,141,674 | | | 4,932,428 |
Berkshire Hathaway, Inc. (Class A) (b) | | 1,123 | | | 108,481,800 |
Berkshire Hathaway, Inc. (Class B) (b) | | 1,326 | | | 4,261,764 |
Everest Re Group, Ltd. | | 61,800 | | | 4,705,452 |
Loews Corp. | | 2,331,044 | | | 65,851,993 |
Markel Corp. (b) | | 8,600 | | | 2,571,400 |
MBIA, Inc. (a) (b) | | 235,530 | | | 958,607 |
*See accompanying notes to financial statements.
MSF-5
Metropolitan Series Fund, Inc.
Davis Venture Value Portfolio
Schedule of Investments as of December 31, 2008
Common Stock—(Continued)
| | | | | |
| Security Description | | Shares | | Value* |
| | | | | |
| | |
Insurance—(Continued) | | | | | |
NIPPONKOA Insurance Co., Ltd. (JPY) (a) | | 2,408,300 | | $ | 18,721,883 |
Principal Financial Group, Inc. | | 258,500 | | | 5,834,345 |
Sun Life Financial, Inc. | | 153,200 | | | 3,545,048 |
The Progressive Corp. | | 4,151,851 | | | 61,488,913 |
Transatlantic Holdings, Inc. | | 592,856 | | | 23,749,812 |
| | | | | |
| | | | | 305,103,445 |
| | | | | |
| | |
Internet & Catalog Retail—0.6% | | | | | |
Amazon.com, Inc. (a) (b) | | 287,700 | | | 14,753,256 |
Liberty Media Interactive (Series A) (b) | | 618,150 | | | 1,928,628 |
| | | | | |
| | | | | 16,681,884 |
| | | | | |
| | |
Internet Software & Services—1.2% | | | | | |
eBay, Inc. (b) | | 395,600 | | | 5,522,576 |
Google, Inc. (Class A) (b) | | 100,598 | | | 30,948,975 |
| | | | | |
| | | | | 36,471,551 |
| | | | | |
| | |
IT Services—0.2% | | | | | |
Visa, Inc. | | 110,340 | | | 5,787,333 |
| | | | | |
| | |
Machinery—0.1% | | | | | |
PACCAR, Inc. (a) | | 134,990 | | | 3,860,714 |
| | | | | |
| | |
Marine—0.6% | | | | | |
China Shipping Development Co., Ltd. (HKD) (a) | | 6,842,000 | | | 6,886,529 |
Kuehne & Nagel International AG (CHF) (a) | | 177,555 | | | 11,511,979 |
| | | | | |
| | | | | 18,398,508 |
| | | | | |
| | |
Media—5.0% | | | | | |
Comcast Corp. (Class A) | | 4,123,422 | | | 66,593,265 |
Grupo Televisa S.A. (ADR) | | 2,118,060 | | | 31,643,816 |
Lagardere S.C.A. (EUR) (a) | | 136,796 | | | 5,552,492 |
Liberty Media Entertainment (Series A) (a) (b) | | 497,560 | | | 8,697,349 |
News Corp. (Class A) | | 3,468,000 | | | 31,524,120 |
WPP, Plc. (ADR) | | 65,700 | | | 1,944,063 |
| | | | | |
| | | | | 145,955,105 |
| | | | | |
| | |
Metals & Mining—0.4% | | | | | |
BHP Billiton, Plc. (GBP) | | 438,822 | | | 8,266,037 |
Rio Tinto, Plc. (GBP) | | 195,300 | | | 4,231,531 |
| | | | | |
| | | | | 12,497,568 |
| | | | | |
| | |
Multiline Retail—0.2% | | | | | |
Sears Holdings Corp. (a) (b) | | 151,622 | | | 5,893,547 |
| | | | | |
| | |
Oil, Gas & Consumable Fuels—15.1% | | | | | |
Canadian Natural Resources, Ltd. | | 1,154,000 | | | 46,136,920 |
China Coal Energy Co. (H Shares) (HKD) (a) | | 14,471,900 | | | 11,694,838 |
ConocoPhillips | | 2,302,228 | | | 119,255,411 |
Devon Energy Corp. | | 1,502,616 | | | 98,736,897 |
EOG Resources, Inc. | | 1,199,100 | | | 79,836,078 |
| | | | | |
| Security Description | | Shares | | Value* |
| | | | | |
| |
Oil, Gas & Consumable Fuels—(Continued) | | | |
Occidental Petroleum Corp. | | 1,411,400 | | $ | 84,669,886 |
OGX Petroleo e Gas Participacoes S.A. (BRL) (b) | | 14,700 | | | 3,353,385 |
| | | | | |
| | | | | 443,683,415 |
| | | | | |
| | |
Paper & Forest Products—0.5% | | | | | |
Sino-Forest Corp. (CAD) (b) | | 1,942,200 | | | 15,528,160 |
| | | | | |
| | |
Personal Products—0.3% | | | | | |
Avon Products, Inc. | | 358,827 | | | 8,622,613 |
| | | | | |
| | |
Pharmaceuticals—1.9% | | | | | |
Johnson & Johnson | | 298,200 | | | 17,841,306 |
Schering-Plough Corp. | | 2,161,100 | | | 36,803,533 |
| | | | | |
| | | | | 54,644,839 |
| | | | | |
|
Professional Services—0.9% |
Dun & Bradstreet Corp. | | 333,800 | | | 25,769,360 |
| | | | | |
|
Real Estate Management & Development—0.7% |
Brookfield Asset Management, Inc. | | 558,621 | | | 8,530,143 |
Hang Lung Group, Ltd. (HKD) | | 3,888,000 | | | 11,867,237 |
| | | | | |
| | | | | 20,397,380 |
| | | | | |
|
Semiconductors & Semiconductor Equipment—1.6% |
Texas Instruments, Inc. | | 2,980,420 | | | 46,256,118 |
| | | | | |
| | |
Software—1.8% | | | | | |
Microsoft Corp. | | 2,740,200 | | | 53,269,488 |
| | | | | |
| | |
Specialty Retail—2.3% | | | | | |
Bed Bath & Beyond, Inc. (a) (b) | | 1,240,600 | | | 31,536,052 |
Carmax, Inc. (a) (b) | | 1,750,520 | | | 13,794,098 |
Lowe’s Cos., Inc. | | 661,800 | | | 14,241,936 |
Staples, Inc. | | 390,900 | | | 7,004,928 |
| | | | | |
| | | | | 66,577,014 |
| | | | | |
| | |
Tobacco—3.4% | | | | | |
Altria Group, Inc. | | 120,723 | | | 1,818,088 |
Philip Morris International, Inc. | | 2,255,800 | | | 98,149,858 |
| | | | | |
| | | | | 99,967,946 |
| | | | | |
| | |
Transportation Infrastructure—0.7% | | | | | |
China Merchants Holdings International Co., Ltd. (HKD) (a) | | 8,448,635 | | | 16,648,553 |
Cosco Pacific, Ltd. (HKD) (a) | | 4,661,900 | | | 4,799,603 |
| | | | | |
| | | | | 21,448,156 |
| | | | | |
|
Wireless Telecommunication Services—0.2% |
Sprint Nextel Corp. (b) | | 2,307,200 | | | 4,222,176 |
| | | | | |
Total Common Stock
(Identified Cost $3,355,836,309) | | | | | 2,694,319,089 |
| | | | | |
*See accompanying notes to financial statements.
MSF-6
Metropolitan Series Fund, Inc.
Davis Venture Value Portfolio
Schedule of Investments as of December 31, 2008
Fixed Income—Convertible—0.1%
| | | | | | | |
| Security Description | | Face
Amount | | Value* | |
| | | | | | | |
| | |
Paper & Forest Products—0.1% | | | | | | | |
Sino-Forest Corp. (144A)
5.000%, 08/01/13 | | $ | 5,844,000 | | $ | 4,149,240 | |
| | | | | | | |
Total Fixed Income—Convertible
(Identified Cost $5,844,000) | | | | | | 4,149,240 | |
| | | | | | | |
| |
| Short Term Investments—12.7% | | | | |
| Security Description | | Face Amount/
Shares | | Value* | |
| | |
Commercial Paper—8.0% | | | | | | | |
Intesa Funding, LLC
0.350%, 01/07/09 | | $ | 76,913,000 | | | 76,908,514 | |
NATC California, LLC
0.230%, 01/02/09 | | | 26,195,000 | | | 26,194,833 | |
0.500%, 01/05/09 | | | 50,000,000 | | | 49,997,222 | |
0.540%, 01/05/09 | | | 11,000,000 | | | 10,999,340 | |
San Paolo US Financial
0.470%, 01/02/09 | | | 21,507,000 | | | 21,506,719 | |
Toyota Motor Credit Corp.
0.150%, 01/06/09 | | | 50,000,000 | | | 49,998,958 | |
| | | | | | | |
| | | | | | 235,605,586 | |
| | | | | | | |
| | |
Mutual Funds—4.7% | | | | | | | |
State Street Navigator Securities Lending Prime Portfolio (c) | | | 138,483,924 | | | 138,483,924 | |
| | | | | | | |
Total Short Term Investments
(Identified Cost $374,089,510) | | | | | | 374,089,510 | |
| | | | | | | |
Total Investments—104.4%
(Identified Cost $3,735,769,819) (d) | | | | | | 3,072,557,839 | |
Liabilities in excess of other assets | | | | | | (129,478,382 | ) |
| | | | | | | |
| Total Net Assets—100% | | | | | $ | 2,943,079,457 | |
| | | | | | | |
| (a) | A portion or all of the security was on loan. As of December 31, 2008, the market value of securities loaned was $136,109,442 and the collateral received consisted of cash in the amount of $138,483,924. The cash collateral is invested in a money market fund managed by an affiliate of the custodian. |
| (c) | Represents investment of cash collateral received from securities lending transactions. |
| (d) | The aggregate cost of investments for federal income tax purposes as of December 31, 2008 was $3,712,155,498 and the composition of unrealized appreciation and depreciation of investment securities was $362,481,447 and $(1,002,079,106), respectively. |
| (144A)— | Securities exempt from registration under Rule 144A of the Securities Act of 1933. These securities may be resold in transactions exempt from registration, normally to qualified institutional buyers. As of December 31, 2008, the market value of 144A securities was $4,149,240, which is 0.1% of total net assets. |
| (ADR)— | An American Depositary Receipt is a certificate issued by a custodian bank representing the right to receive securities of the foreign issuer described. Trading on exchanges not located in the United States or Canada significantly influences the value of ADRs. |
The Portfolio adopted the provisions of Statement of Financial Accounting Standards No. 157, “Fair Value Measurements” (FAS 157), effective with the beginning of the Portfolio’s fiscal year. FAS 157 establishes a framework for measuring fair value and expands disclosures about fair value measurements in financial statements. The three levels of the hierarchy under FAS 157 are described below:
Level 1 - quoted prices in active markets for identical securities
Level 2 - other significant observable inputs (including quoted prices for similar securities, interest rates, credit risk, etc.)
Level 3 - significant unobservable inputs (including the Portfolio’s own assumptions in determining the fair value of investments)
The inputs or methodology used for valuing securities are not necessarily an indication of the risk associated with investing in those securities.
The following is a summary of the inputs used to value the Portfolio’s net assets as of December 31, 2008:
| | | | | | |
| Valuation Inputs | | Investments In
Securities | | Other Financial
Instruments* |
Level 1 - Quoted Prices | | $ | 2,674,786,727 | | $ | 0 |
Level 2 - Other Significant Observable Inputs | | | 397,771,112 | | | 0 |
Level 3 - Significant Unobservable Inputs | | | 0 | | | 0 |
Total | | $ | 3,072,557,839 | | $ | 0 |
* Other financial instruments are derivative instruments not reflected in the Schedule of Investments, such as futures, forwards, swap contracts and written options, which are valued based on the unrealized appreciation/depreciation on the instrument.
*See accompanying notes to financial statements.
MSF-7
Metropolitan Series Fund, Inc.
Davis Venture Value Portfolio
Statement of Assets & Liabilities
December 31, 2008
| | | | | | | |
Assets | | | | | | | |
Investments at value (a) (b) | | | | | $ | 3,072,557,839 | |
Cash | | | | | | 50,227 | |
Foreign cash at value (c) | | | | | | 2,643,191 | |
Receivable for: | | | | | | | |
Securities sold | | | | | | 3,958,210 | |
Fund shares sold | | | | | | 3,588,297 | |
Accrued interest and dividends | | | | | | 2,717,643 | |
Foreign taxes | | | | | | 89,386 | |
| | | | | | | |
Total Assets | | | | | | 3,085,604,793 | |
Liabilities | | | | | | | |
Payable for: | | | | | | | |
Fund shares redeemed | | $ | 2,070,420 | | | | |
Withholding taxes | | | 20,548 | | | | |
Collateral for securities loaned | | | 138,483,924 | | | | |
Accrued expenses: | | | | | | | |
Management fees | | | 1,729,358 | | | | |
Service and distribution fees | | | 148,838 | | | | |
Deferred directors’ fees | | | 18,776 | | | | |
Other expenses | | | 53,472 | | | | |
| | | | | | | |
Total Liabilities | | | | | | 142,525,336 | |
| | | | | | | |
Net Assets | | | | | $ | 2,943,079,457 | |
| | | | | | | |
Net assets consists of: | | | | | | | |
Capital paid in | | | | | $ | 3,642,457,095 | |
Undistributed net investment income | | | | | | 49,438,969 | |
Accumulated net realized losses | | | | | | (85,594,311 | ) |
Unrealized depreciation on investments and foreign currency | | | | | | (663,222,296 | ) |
| | | | | | | |
Net Assets | | | | | $ | 2,943,079,457 | |
| | | | | | | |
| Computation of offering price: | | | | | | | |
Class A | | | | | | | |
Net asset value and redemption price per share ($1,949,357,390 divided by 89,732,025 shares outstanding) | | | | | $ | 21.72 | |
| | | | | | | |
Class B | | | | | | | |
Net asset value and redemption price per share ($331,673,922 divided by 15,371,546 shares outstanding) | | | | | $ | 21.58 | |
| | | | | | | |
Class E | | | | | | | |
Net asset value and redemption price per share ($662,048,145 divided by 30,636,256 shares outstanding) | | | | | $ | 21.61 | |
| | | | | | | |
(a) Identified cost of investments | | | | | $ | 3,735,769,819 | |
| | | | | | | |
(b) Includes cash collateral for securities loaned of | | | | | $ | 138,483,924 | |
| | | | | | | |
(c) Identified cost of foreign cash | | | | | $ | 2,665,911 | |
| | | | | | | |
Statement of Operations
For the Year Ended December 31, 2008
| | | | | | | | |
Investment Income | | | | | | | | |
Dividends | | | | | | $ | 71,243,659 | (a) |
Interest | | | | | | | 10,494,861 | (b) |
| | | | | | | | |
| | | | | | | 81,738,520 | |
Expenses | | | | | | | | |
Management fees | | $ | 28,175,363 | | | | | |
Service and distribution fees—Class B | | | 1,077,642 | | | | | |
Service and distribution fees—Class E | | | 1,422,466 | | | | | |
Directors’ fees and expenses | | | 19,726 | | | | | |
Custodian | | | 406,587 | | | | | |
Audit and tax services | | | 36,941 | | | | | |
Legal | | | 70,012 | | | | | |
Printing | | | 733,863 | | | | | |
Insurance | | | 53,795 | | | | | |
Miscellaneous | | | 52,198 | | | | | |
| | | | | | | | |
Total expenses | | | 32,048,593 | | | | | |
Expense reductions | | | (11,084 | ) | | | 32,037,509 | |
| | | | | | | | |
Net Investment Income | | | | | | | 49,701,011 | |
| | | | | | | | |
Realized and Unrealized Loss | | | | | | | | |
| Realized gain (loss) on: | | | | | | | | |
Investments—net | | | (85,331,174 | ) | | | | |
Futures contracts—net | | | 1,035,663 | | | | | |
Foreign currency transactions—net | | | (45,621 | ) | | | (84,341,132 | ) |
| | | | | | | | |
| Change in unrealized depreciation on: | | | | | | | | |
Investments—net | | | (1,854,883,523 | ) | | | | |
Foreign currency transactions—net | | | (14,940 | ) | | | (1,854,898,463 | ) |
| | | | | | | | |
Net loss | | | | | | | (1,939,239,595 | ) |
| | | | | | | | |
Net Decrease in Net Assets From Operations | | | | | | $ | (1,889,538,584 | ) |
| | | | | | | | |
| (a) | Net of foreign taxes of $733,319. |
| (b) | Includes income on securities loaned of $7,248,910. |
See accompanying notes to financial statements.
MSF-8
Metropolitan Series Fund, Inc.
Davis Venture Value Portfolio
Statements of Changes in Net Assets
| | | | | | | | |
| | | Year ended
December 31,
2008 | | | Year ended
December 31,
2007 | |
From Operations | | | | | | | | |
Net investment income | | $ | 49,701,011 | | | $ | 53,942,307 | |
Net realized gain (loss) | | | (84,341,132 | ) | | | 134,312,074 | |
Change in unrealized depreciation | | | (1,854,898,463 | ) | | | (3,435,879 | ) |
| | | | | | | | |
Increase (decrease) in net assets from operations | | | (1,889,538,584 | ) | | | 184,818,502 | |
| | | | | | | | |
From Distributions to Shareholders | | | | | | | | |
Net investment income | | | | | | | | |
Class A | | | (36,794,851 | ) | | | (21,061,873 | ) |
Class B | | | (4,483,109 | ) | | | (2,489,165 | ) |
Class E | | | (11,473,648 | ) | | | (8,444,356 | ) |
| | | | | | | | |
| | | (52,751,608 | ) | | | (31,995,394 | ) |
| | | | | | | | |
Net realized gain | | | | | | | | |
Class A | | | (15,316,517 | ) | | | 0 | |
Class B | | | (2,378,235 | ) | | | 0 | |
Class E | | | (5,484,656 | ) | | | 0 | |
| | | | | | | | |
| | | (23,179,408 | ) | | | 0 | |
| | | | | | | | |
Total distributions | | | (75,931,016 | ) | | | (31,995,394 | ) |
| | | | | | | | |
Increase in net assets from capital share transactions | | | 34,283,279 | | | | 624,349,038 | |
| | | | | | | | |
Net increase (decrease) in net assets | | | (1,931,186,321 | ) | | | 777,172,146 | |
| | |
Net Assets | | | | | | | | |
Beginning of the period | | | 4,874,265,778 | | | | 4,097,093,632 | |
| | | | | | | | |
End of the period | | $ | 2,943,079,457 | | | $ | 4,874,265,778 | |
| | | | | | | | |
Undistributed Net Investment Income | | | | | | | | |
End of the period | | $ | 49,438,969 | | | $ | 52,593,236 | |
| | | | | | | | |
Other Information:
Capital Shares
Transactions in capital shares were as follows:
| | | | | | | | | | | | | | |
| | | Year ended
December 31, 2008 | | | Year ended
December 31, 2007 | |
| | | Shares | | | $ | | | Shares | | | $ | |
Class A | | | | | | | | | | | | | | |
Sales | | 18,631,514 | | | $ | 552,806,197 | | | 29,142,259 | | | $ | 1,061,299,488 | |
Reinvestments | | 1,506,109 | | | | 52,111,368 | | | 577,512 | | | | 21,061,873 | |
Redemptions | | (17,761,795 | ) | | | (549,673,012 | ) | | (11,011,385 | ) | | | (400,478,491 | ) |
| | | | | | | | | | | | | | |
Net increase | | 2,375,828 | | | $ | 55,244,553 | | | 18,708,386 | | | $ | 681,882,870 | |
| | | | | | | | | | | | | | |
Class B | | | | | | | | | | | | | | |
Sales | | 3,114,572 | | | $ | 93,633,234 | | | 3,829,951 | | | $ | 138,472,695 | |
Reinvestments | | 199,284 | | | | 6,861,344 | | | 68,610 | | | | 2,489,165 | |
Redemptions | | (1,515,098 | ) | | | (44,723,797 | ) | | (1,466,918 | ) | | | (53,162,469 | ) |
| | | | | | | | | | | | | | |
Net increase | | 1,798,758 | | | $ | 55,770,781 | | | 2,431,643 | | | $ | 87,799,391 | |
| | | | | | | | | | | | | | |
Class E | | | | | | | | | | | | | | |
Sales | | 3,092,292 | | | $ | 87,889,735 | | | 4,143,510 | | | $ | 149,983,783 | |
Reinvestments | | 492,116 | | | | 16,958,304 | | | 232,563 | | | | 8,444,356 | |
Redemptions | | (6,038,218 | ) | | | (181,580,094 | ) | | (8,417,359 | ) | | | (303,761,362 | ) |
| | | | | | | | | | | | | | |
Net decrease | | (2,453,810 | ) | | $ | (76,732,055 | ) | | (4,041,286 | ) | | $ | (145,333,223 | ) |
| | | | | | | | | | | | | | |
Increase derived from capital share transactions | | | | | $ | 34,283,279 | | | | | | $ | 624,349,038 | |
| | | | | | | | | | | | | | |
See accompanying notes to financial statements.
MSF-9
Metropolitan Series Fund, Inc.
Davis Venture Value Portfolio
Financial Highlights
| | | | | | | | | | | | | | | | | | | | |
| | | Class A | |
| | | Year ended December 31, | |
| | | 2008 | | | 2007 | | | 2006 | | | 2005 | | | 2004 | |
Net Asset Value, Beginning of Period | | $ | 36.44 | | | $ | 35.12 | | | $ | 30.91 | | | $ | 28.23 | | | $ | 25.27 | |
| | | | | | | | | | | | | | | | | | | | |
Income From Investment Operations | | | | | | | | | | | | | | | | | | | | |
Net investment income | | | 0.39 | (a) | | | 0.46 | (a) | | | 0.32 | (a) | | | 0.25 | | | | 0.15 | |
Net realized and unrealized gain (loss) of investments | | | (14.52 | ) | | | 1.15 | | | | 4.16 | | | | 2.63 | | | | 2.96 | |
| | | | | | | | | | | | | | | | | | | | |
Total from investment operations | | | (14.13 | ) | | | 1.61 | | | | 4.48 | | | | 2.88 | | | | 3.11 | |
| | | | | | | | | | | | | | | | | | | | |
Less Distributions | | | | | | | | | | | | | | | | | | | | |
Distributions from net investment income | | | (0.42 | ) | | | (0.29 | ) | | | (0.27 | ) | | | (0.20 | ) | | | (0.15 | ) |
Distributions from net realized capital gains | | | (0.17 | ) | | | 0.00 | | | | 0.00 | | | | 0.00 | | | | 0.00 | |
| | | | | | | | | | | | | | | | | | | | |
Total distributions | | | (0.59 | ) | | | (0.29 | ) | | | (0.27 | ) | | | (0.20 | ) | | | (0.15 | ) |
| | | | | | | | | | | | | | | | | | | | |
Net Asset Value, End of Period | | $ | 21.72 | | | $ | 36.44 | | | $ | 35.12 | | | $ | 30.91 | | | $ | 28.23 | |
| | | | | | | | | | | | | | | | | | | | |
Total Return (%) | | | (39.3 | ) | | | 4.6 | | | | 14.6 | | | | 10.3 | | | | 12.4 | |
Ratio of operating expenses to average net assets before expense reductions (%) | | | 0.73 | | | | 0.73 | | | | 0.76 | | | | 0.76 | | | | 0.78 | |
Ratio of operating expenses to average net assets after expense reductions (%) (b) | | | 0.73 | | | | 0.73 | | | | 0.76 | | | | 0.76 | | | | 0.77 | |
Ratio of net investment income to average net assets (%) | | | 1.30 | | | | 1.25 | | | | 0.99 | | | | 1.05 | | | | 0.97 | |
Portfolio turnover rate (%) | | | 23 | | | | 11 | | | | 20 | | | | 27 | | | | 5 | |
Net assets, end of period (000) | | $ | 1,949,357 | | | $ | 3,183,429 | | | $ | 2,410,877 | | | $ | 1,759,491 | | | $ | 1,413,953 | |
| | | | | | | | | | | | | | | | | | | | |
| | | Class B | |
| | | Year ended December 31, | |
| | | 2008 | | | 2007 | | | 2006 | | | 2005 | | | 2004 | |
Net Asset Value, Beginning of Period | | $ | 36.20 | | | $ | 34.89 | | | $ | 30.71 | | | $ | 28.07 | | | $ | 25.18 | |
| | | | | | | | | | | | | | | | | | | | |
Income From Investment Operations | | | | | | | | | | | | | | | | | | | | |
Net investment income | | | 0.32 | (a) | | | 0.36 | (a) | | | 0.24 | (a) | | | 0.17 | | | | 0.14 | |
Net realized and unrealized gain (loss) of investments | | | (14.44 | ) | | | 1.16 | | | | 4.14 | | | | 2.62 | | | | 2.86 | |
| | | | | | | | | | | | | | | | | | | | |
Total from investment operations | | | (14.12 | ) | | | 1.52 | | | | 4.38 | | | | 2.79 | | | | 3.00 | |
| | | | | | | | | | | | | | | | | | | | |
Less Distributions | | | | | | | | | | | | | | | | | | | | |
Distributions from net investment income | | | (0.33 | ) | | | (0.21 | ) | | | (0.20 | ) | | | (0.15 | ) | | | (0.11 | ) |
Distributions from net realized capital gains | | | (0.17 | ) | | | 0.00 | | | | 0.00 | | | | 0.00 | | | | 0.00 | |
| | | | | | | | | | | | | | | | | | | | |
Total distributions | | | (0.50 | ) | | | (0.21 | ) | | | (0.20 | ) | | | (0.15 | ) | | | (0.11 | ) |
| | | | | | | | | | | | | | | | | | | | |
Net Asset Value, End of Period | | $ | 21.58 | | | $ | 36.20 | | | $ | 34.89 | | | $ | 30.71 | | | $ | 28.07 | |
| | | | | | | | | | | | | | | | | | | | |
Total Return (%) | | | (39.5 | ) | | | 4.3 | | | | 14.3 | | | | 10.0 | | | | 12.0 | |
Ratio of operating expenses to average net assets before expense reductions (%) | | | 0.98 | | | | 0.98 | | | | 1.01 | | | | 1.02 | | | | 1.03 | |
Ratio of operating expenses to average net assets after expense reductions (%) (b) | | | 0.98 | | | | 0.98 | | | | 1.01 | | | | 1.01 | | | | 1.02 | |
Ratio of net investment income to average net assets (%) | | | 1.06 | | | | 1.00 | | | | 0.74 | | | | 0.77 | | | | 0.92 | |
Portfolio turnover rate (%) | | | 23 | | | | 11 | | | | 20 | | | | 27 | | | | 5 | |
Net assets, end of period (000) | | $ | 331,674 | | | $ | 491,271 | | | $ | 388,739 | | | $ | 202,221 | | | $ | 56,301 | |
| Please | see following page for Financial Highlights footnote legend. |
See accompanying notes to financial statements.
MSF-10
Metropolitan Series Fund, Inc.
Davis Venture Value Portfolio
Financial Highlights
| | | | | | | | | | | | | | | | | | | | |
| | | Class E | |
| | | Year ended December 31, | |
| | | 2008 | | | 2007 | | | 2006 | | | 2005 | | | 2004 | |
Net Asset Value, Beginning of Period | | $ | 36.25 | | | $ | 34.94 | | | $ | 30.76 | | | $ | 28.09 | | | $ | 25.18 | |
| | | | | | | | | | | | | | | | | | | | |
Income From Investment Operations | | | | | | | | | | | | | | | | | | | | |
Net investment income | | | 0.34 | (a) | | | 0.40 | (a) | | | 0.27 | (a) | | | 0.27 | | | | 0.23 | |
Net realized and unrealized gain (loss) of investments | | | (14.45 | ) | | | 1.15 | | | | 4.14 | | | | 2.56 | | | | 2.82 | |
| | | | | | | | | | | | | | | | | | | | |
Total from investment operations | | | (14.11 | ) | | | 1.55 | | | | 4.41 | | | | 2.83 | | | | 3.05 | |
| | | | | | | | | | | | | | | | | | | | |
Less Distributions | | | | | | | | | | | | | | | | | | | | |
Distributions from net investment income | | | (0.36 | ) | | | (0.24 | ) | | | (0.23 | ) | | | (0.16 | ) | | | (0.14 | ) |
Distributions from net realized capital gains | | | (0.17 | ) | | | 0.00 | | | | 0.00 | | | | 0.00 | | | | 0.00 | |
| | | | | | | | | | | | | | | | | | | | |
Total distributions | | | (0.53 | ) | | | (0.24 | ) | | | (0.23 | ) | | | (0.16 | ) | | | (0.14 | ) |
| | | | | | | | | | | | | | | | | | | | |
Net Asset Value, End of Period | | $ | 21.61 | | | $ | 36.25 | | | $ | 34.94 | | | $ | 30.76 | | | $ | 28.09 | |
| | | | | | | | | | | | | | | | | | | | |
Total Return (%) | | | (39.5 | ) | | | 4.4 | | | | 14.4 | | | | 10.1 | | | | 12.1 | |
Ratio of operating expenses to average net assets before expense reductions (%) | | | 0.88 | | | | 0.88 | | | | 0.91 | | | | 0.91 | | | | 0.93 | |
Ratio of operating expenses to average net assets after expense reductions (%) (b) | | | 0.88 | | | | 0.88 | | | | 0.91 | | | | 0.91 | | | | 0.92 | |
Ratio of net investment income to average net assets (%) | | | 1.14 | | | | 1.11 | | | | 0.84 | | | | 0.88 | | | | 0.85 | |
Portfolio turnover rate (%) | | | 23 | | | | 11 | | | | 20 | | | | 27 | | | | 5 | |
Net assets, end of period (000) | | $ | 662,048 | | | $ | 1,199,566 | | | $ | 1,297,477 | | | $ | 1,179,405 | | | $ | 1,189,119 | |
| (a) | Per share amount is based on average shares outstanding during the period. |
| (b) | The Portfolio has entered into arrangements with certain brokers who paid a portion of the Portfolio’s expenses. |
See accompanying notes to financial statements.
MSF-11
Metropolitan Series Fund, Inc.
Davis Venture Value Portfolio
Notes to Financial Statements—December 31, 2008
Metropolitan Series Fund, Inc. (the “Fund”) is organized as a corporation under the laws of Maryland pursuant to Articles of Incorporation filed on November 23, 1982, as amended, and registered under the Investment Company Act of 1940, as amended (the “1940 Act”), as an open-end investment company. The Fund is a “series” type of mutual fund, which issues separate series of stock. Each series represents an interest in a separate portfolio of Fund investments. The Davis Venture Value Portfolio (the “Portfolio”) is a diversified series of the Fund. Shares in the Fund are not offered directly to the general public and are currently available only to separate accounts established by Metropolitan Life Insurance Company (“MetLife”), New England Life Insurance Company, General American Life Insurance Company (“General American”), The MetLife Investors Group of Insurance Companies, MetLife Insurance Company of Connecticut and other affiliated insurance companies (collectively, the “Insurance Companies”) and to certain eligible qualified retirement plans (“Qualified Plans”), as an investment vehicle for variable life insurance, group annuity or variable annuity products of these insurance companies or Qualified Plans, although the Portfolio is not available to all such separate accounts and Qualified Plans. The Portfolio’s shares may be divided into different classes. Currently, the classes being offered by the Portfolio are named Class A, Class B and Class E. The classes of the Portfolio’s shares are identical, except that certain additional charges (Rule 12b-1 fees) are made against Class B and Class E shares. Investment income, realized and unrealized capital gains and losses, the common expenses of the Portfolio and certain Portfolio-level expense reductions, if any, are allocated daily, on a pro rata basis, to each class based on the relative net assets of each class to the total net assets of the Portfolio.
| 2. | SIGNIFICANT ACCOUNTING POLICIES: |
The preparation of financial statements in conformity with accounting principles generally accepted in the United States of America (“GAAP”) requires management to make estimates and assumptions that affect the reported amounts of assets and liabilities and disclosure of contingent assets and liabilities as of the date of the financial statements and the reported amounts of income and expenses during the reporting period. Actual results could differ from those estimates.
The following is a summary of significant accounting policies consistently followed by the Portfolio in the preparation of its financial statements. The policies are in conformity with GAAP.
Investment Valuation:
Debt securities (other than short term obligations with a remaining maturity of sixty days or less) are generally valued on the basis of evaluated or composite bid quotations obtained by independent pricing services and/or brokers and dealers selected by the relevant subadviser pursuant to authorization of the Board of Directors of the Fund (the “Board” or “Directors”). Such quotations take into account appropriate factors such as institutional-sized trading in similar groups of securities, yield, quality, coupon rate, maturity, type of issue, trading characteristics and other data. Short term obligations with a remaining maturity of sixty days or less are valued at amortized cost which approximates fair market value.
Equity securities traded on a national securities exchange or other exchanges are valued at their last sale price on the principal trading market. Equity securities traded on the NASDAQ National Market System are valued at the NASDAQ Official Closing Price (the “NOCP”). The NOCP is the last reported sale price if the last reported sale price falls between the spread of the last reported bid and asked prices. If the last reported bid and asked prices are above the last reported sale price, the NOCP will be the last reported bid price. If the last reported bid and asked prices are below the last reported sale price, the NOCP will be the last reported asked price. Equity securities traded on a national securities exchange or other exchanges or on the NASDAQ National Market System for which there is no reported sale during the day are valued at the last reported bid price. A security that is listed or traded on more than one exchange is valued at the quotation on the exchange determined to be the primary market for that security by the Board or its delegates. If no closing price is available, then such securities are valued by using the last reported bid price. Equity securities traded over-the-counter are valued at the last reported sales price.
If no current market value quotation is readily available or reliable for a portfolio security, fair value will be determined in accordance with procedures established by and under the general supervision of the Board. When the Portfolio uses fair value pricing, it may take into account any factors it deems appropriate. The value of securities used by the Portfolio to calculate its net asset value may differ from quoted or published prices for the same securities. Fair value pricing involves subjective judgments and the fair value determined for a security may be materially different than the value that could be realized upon the sale of that security.
MSF-12
Metropolitan Series Fund, Inc.
Davis Venture Value Portfolio
Notes to Financial Statements—December 31, 2008—(Continued)
The Portfolio expects to use fair value pricing for securities primarily traded on U.S. exchanges only under very limited circumstances. For example, the Portfolio may use fair value pricing if the exchange on which a security is traded closes early or trading in the security is suspended.
Securities traded primarily on an exchange outside of the United States which closes before the close of the New York Stock Exchange will be valued at the last sales price on that non-U.S. exchange. Securities traded primarily on an exchange outside of the United States for which there is no reported sale during the day are valued at the mean between the last reported bid and asked prices. However, because most foreign markets close well before the Portfolio values its securities (typically at 4 p.m. Eastern Time), the earlier close of these foreign markets gives rise to the possibility that significant events, including broad market moves, may have occurred after these foreign markets close but before the Portfolio values its securities. To account for this, the Portfolio may frequently value many of its foreign equity securities using fair value prices based on third party vendor modeling tools.
Forward foreign currency exchange contracts are valued based on the mean between closing bid and asked prices of the forward currency contract rates in the London foreign exchange markets on a daily basis as provided by a reliable bank or dealer.
Options, whether on securities, indices, futures contracts, or otherwise, are valued at the last sales price available as of the close of business on the day of valuation or, if there is no such sale price available, at the mean between the bid and asked prices. Options on currencies are valued at the spot price each day.
The value of futures contracts will be the sum of the margin deposit plus or minus the difference between the value of the futures contract on each day the net asset value is calculated and the value on the date the futures contract originated, value being that established on a recognized commodity exchange, or by reference to other customary sources, with gain or loss being realized when the futures contract closes or expires.
Subject to the Board’s oversight, the Board has delegated the day-to-day oversight of pricing matters, including determinations in good faith under the Fund’s procedures the fair value of securities for which current market quotations are not readily available to the subadviser of the Portfolio.
Investment Transactions and Related Investment Income:
Portfolio security transactions are recorded on the trade date. Dividend income is recorded on the ex-dividend date or, for certain foreign securities, when notified. Interest income, which includes amortization of premium and accretion of discount on debt securities, is recorded on the accrual basis. Realized gains and losses on investments and unrealized appreciation and depreciation are determined on the identified cost basis, which is the same basis used for federal income tax purposes.
Repurchase Agreements:
The Portfolio, through the custodian or a subcustodian, receives delivery of the underlying securities collateralizing repurchase agreements. The Portfolio requires the custodian to take possession, to have legally segregated in the Federal Reserve Book Entry System, or to have segregated within the custodian’s vault, all securities held as collateral for repurchase agreements. It is the Portfolio’s policy that the market value of the collateral be at least equal to 100% of the repurchase price in the case of a repurchase agreement of one-day duration and 102% on all other repurchase agreements. The Portfolio’s subadviser is responsible for determining that the value of the collateral is at all times at least equal to the repurchase price. In connection with transactions in repurchase agreements, if the seller defaults and the value of the collateral declines or if the seller enters an insolvency proceeding, realization of the collateral by the Portfolio may be delayed, limited or wholly denied.
Foreign Currency Translation:
The books and records of the Portfolio are maintained in U.S. dollars. The values of securities, currencies and other assets and liabilities denominated in currencies other than U.S. dollars are translated into U.S. dollars based upon foreign exchange rates prevailing at the end of the period. Purchases and sales of investment securities, income and expenses are translated on the respective dates of such transactions. Since the values of investment securities are presented at the foreign exchange rates prevailing at the end of the period, it is not practical to isolate that portion of the results of operations arising from changes in exchange rates from that portion of the results of operations reflecting fluctuations arising from changes in market prices of the investment securities. Such fluctuations are included in the net realized and unrealized gain or loss on investments.
MSF-13
Metropolitan Series Fund, Inc.
Davis Venture Value Portfolio
Notes to Financial Statements—December 31, 2008—(Continued)
Net realized foreign exchange gains or losses arise from sales of foreign currency, currency gains or losses realized between the trade and settlement dates on securities transactions, and the difference between the amounts of dividends, interest, and foreign withholding taxes recorded by the Portfolio and the U.S. dollar equivalent of the amounts actually received or paid by the Portfolio. Net unrealized foreign exchange gains and losses arise from changes in the value of assets and liabilities, other than investment securities, resulting from changes in the exchange rate.
Forward Foreign Currency Exchange Contracts:
The Portfolio may enter into forward foreign currency exchange contracts primarily to hedge against foreign currency exchange rate risks on its non-U.S. dollar denominated investment securities. When entering into a forward currency contract, the Portfolio agrees to receive or deliver a fixed quantity of foreign currency for an agreed-upon price on an agreed future date. These contracts are valued daily and the Portfolio’s net equity therein, representing unrealized gain or loss on the contracts as measured by the difference between the foreign exchange rates at the dates of entry into the contracts and the forward rates at the settlement date, is included in the Statement of Assets and Liabilities. Realized and unrealized gains and losses are included in the Statement of Operations. These instruments involve market and/or credit risk in excess of the amount recognized in the Statement of Assets and Liabilities. Risks arise from the possible inability of counterparties to meet the terms of their contracts and from movement in currency and securities values and interest rates.
Futures Contracts:
The Portfolio may buy and sell futures contracts (on recognized exchanges) as a hedge or to enhance return. Futures contracts are agreements to buy or sell a security, or deliver a final cash settlement price in connection with an index, interest rate, currency, or other contracts not calling for physical delivery, for a set price in the future. The Portfolio must post an amount equal to a portion of the total market value of the futures contract as futures variation margin, which is returned when the Portfolio’s obligations under the contract have been satisfied. From time to time thereafter, the Portfolio may have to post variation margin to maintain this amount as the market value of the contract fluctuates. Risks of entering into futures contracts (and related options) include the possibility that there may be an illiquid market and that a change in the value of the contract or option may not correlate with changes in the value of the underlying securities.
Options:
The Portfolio may use options to enhance returns or to hedge against changes in values of securities the Portfolio owns or expects to purchase. Writing puts or buying calls tends to increase the Portfolio’s exposure to the underlying instrument and writing calls or buying puts tends to decrease the Portfolio’s exposure to the underlying instrument, and can be used to hedge other Portfolio investments. For options purchased to hedge the Portfolio’s investments, the potential risk to the Portfolio is that the change in value of options contracts may not correspond to the change in value of the hedged instruments. In addition, losses may arise from changes in the value of the underlying instruments, if there is an illiquid secondary market, or if the counterparty is unable to perform. The maximum loss for purchased options is limited to the premium initially paid for the option. For options written by the Portfolio, the maximum loss is not limited to the premium initially received for the option.
The main risk associated with purchasing an option is that the option expires without being exercised. In this case, the option expires worthless and the premium paid for the option is considered the loss. The risk associated with writing a call option is that the Portfolio may forgo the opportunity for a profit if the market value of the underlying position increases and the option is exercised. The risk in writing a put option is that the Portfolio may incur a loss if the market value of the underlying position decreases and the option is exercised. In addition, the Portfolio risks not being able to enter into a closing transaction for the written option as the result of an illiquid market.
“When-Issued” Securities:
Purchasing securities “when-issued” is a forward commitment by the Portfolio to buy a security. The estimated amount of the Portfolio’s payment obligation and the security’s interest rate are determined when the commitment is made, even though no interest accrues until the security is issued, which is generally 15 to 120 days later. The Portfolio will segregate liquid assets with its custodian sufficient at all times to satisfy these commitments. If the value of the security is less when delivered than when the commitment was made, the Portfolio will suffer a loss.
MSF-14
Metropolitan Series Fund, Inc.
Davis Venture Value Portfolio
Notes to Financial Statements—December 31, 2008—(Continued)
Federal Income Taxes:
It is the Portfolio’s policy to comply with the requirements of the Internal Revenue Code of 1986, as amended (the “Code”), and regulations thereunder, applicable to regulated investment companies and to distribute, with respect to each taxable year, all of its taxable income to shareholders. Therefore, no federal income tax provision is required. The Portfolio is subject to the provisions of the Financial Accounting Standards Board Interpretation (“FASB”) No. 48, Accounting for Uncertainties in Income Taxes (FIN 48). FIN 48 sets forth a minimum threshold for financial statement recognition of the benefit of a tax position taken or expected to be taken in a tax return. The implementation of FIN 48 did not result in any unrecognized tax benefits in the accompanying financial statements. Each of the Portfolio’s federal tax returns for the prior three fiscal years remains subject to examination by the Internal Revenue Service.
As of December 31, 2008, the Portfolio had $85,412,099 in capital loss carryforwards expiring on December 31, 2016.
Pursuant to Section 852 of the Code, the Portfolio designated the amount shown below under Long Term Gain as capital gain dividends for its taxable year ended December 31, 2008. The tax character of distributions paid for the periods ended December 31, 2008 and 2007 was as follows:
| | | | | | | | | | | | | | | | | | | | | | |
| Ordinary Income | | Long Term Gain | | Return of Capital | | Total |
| 2008 | | 2007 | | 2008 | | 2007 | | 2008 | | 2007 | | 2008 | | 2007 |
| $ | 52,798,573 | | $ | 31,995,394 | | $ | 23,132,443 | | $ | — | | $ | — | | $ | — | | $ | 75,931,016 | | $ | 31,995,394 |
As of December 31, 2008, the components of distributable earnings (accumulated losses) on a federal income tax basis were as follows:
| | | | | | | | | | | | | | | | |
Undistributed
Ordinary
Income | | Undistributed
Long Term
Gain | | Unrealized
Depreciation | | | Loss
Carryforwards | | | Total | |
| $ | 49,459,954 | | $ | — | | $ | (639,607,975 | ) | | $ | (85,412,099 | ) | | $ | (675,560,120 | ) |
Pursuant to Federal income tax regulations applicable to investment companies, the Portfolio has elected to treat net capital losses realized between November 1 and December 31 of each year as occurring on the first day of the following tax year. For the year ended December 31, 2008, the following amounts of realized capital and currency losses reflected in the accompanying financial statements will not be recognized for Federal income tax purposes until January 1, 2009:
| | | | |
Currency | | Capital | |
$— | | $ | (23,796,533 | ) |
Dividends and Distributions to Shareholders:
The Portfolio records dividends and distributions on the ex-dividend date. Net realized gains from security transactions (if any) are generally distributed annually to shareholders. The timing and characterization of certain income and capital gains distributions are determined in accordance with federal tax regulations that may differ from GAAP. Permanent book and tax basis differences relating to shareholder distributions will result in reclassification between under/over distributed net investment income, accumulated net realized gains/losses and paid in capital.
Expense Reductions:
Certain Portfolio trades are directed to brokers who paid a portion of the Portfolio’s expenses. Amounts paid for the Portfolio are shown as expense reductions in the Statement of Operations.
| 3. | INVESTMENT TRANSACTIONS: |
For the year ended December 31, 2008, purchases and sales of securities (excluding short term investments) for the Portfolio were as follows:
| | | | | | | | | | |
| Purchases | | Sales |
| U.S. Government | | Other | | U.S. Government | | Other |
| $ | 0 | | $ | 907,573,559 | | $ | 0 | | $ | 936,003,780 |
MSF-15
Metropolitan Series Fund, Inc.
Davis Venture Value Portfolio
Notes to Financial Statements—December 31, 2008—(Continued)
| 4. | INVESTMENT MANAGEMENT FEES AND OTHER TRANSACTIONS WITH AFFILIATES: |
Investment Management Agreement:
MetLife Advisers, LLC (“MetLife Advisers”) is the investment adviser to the Portfolio. The Fund has entered into an investment management agreement with MetLife Advisers with respect to the Portfolio. For providing investment management services to the Portfolio, MetLife Advisers receives monthly compensation at the following annual rates:
| | | | |
Management
Fees earned by
MetLife Advisers
for the year ended
December 31, 2008 | | Annual
percentage
rates paid to
MetLife Advisers | | Based on Portfolios
average daily net asset
levels |
| $28,175,363 | | 0.750% | | Of the first $1 billion |
| | 0.700% | | On the next $2 billion |
| | 0.650% | | On amounts in excess of $3 billion |
Certain officers and directors of the Fund may also be officers of MetLife Advisers; however, such officers and directors receive no compensation from the Fund.
MetLife Advisers has entered into an investment subadvisory agreement with respect to the Portfolio. Davis Selected Advisers, L.P. is compensated by MetLife Advisers to provide subadvisory services for the Portfolio.
Service and Distribution Fees:
The Fund has adopted a Distribution and Service Plan under Rule 12b-1 of the 1940 Act for the Portfolio’s Class B and E shares. Under the Distribution and Service Plan, the Class B and E shares of the Portfolio pay a fee to compensate the Insurance Companies (or their affiliates) and other broker-dealers and financial intermediaries involved in the offer and sale of Portfolio shares for promoting or selling and servicing the Class B and E shares. The fees under the Distribution and Service Plan for each class of the Portfolio’s shares are calculated as a percentage of the Portfolio’s average daily net assets that are attributable to that Class. Currently, the fee is 0.25% per year for Class B shares and 0.15% per year for Class E shares. Amounts paid by the Portfolio for the year ended December 31, 2008 are shown as Service and Distribution fees in the Statement of Operations.
The Fund has entered into a securities lending arrangement with the Fund’s custodian, State Street Bank and Trust Company (the “custodian”). Under the agreement, the custodian is authorized to loan securities on the Portfolios’ behalf. In exchange, the Portfolio receives either cash or securities as collateral against the loaned securities. The Portfolio receives collateral at least equal to 102% of the market value of the loaned securities (105% for foreign securities), at each loan’s inception. Collateral must be maintained at least at 100% of the market value of the loaned securities for the duration of the loan. The cash collateral is invested in the Navigator Securities Lending Prime Portfolio, an affiliate of the custodian, which invests in a variety of high quality U.S. dollar-denominated instruments. If the market value of the collateral at the close of trading on a business day is less than 100% of the market value of the loaned securities at the close of trading on that day, the borrower shall be required to deliver, by the close of business on the following business day, an additional amount of collateral, equal to at least 100% of the market value of all the loaned securities as of such preceding day. The Portfolio receives 80% of the annual net income from securities lending transactions, which is included in interest income of the Portfolio. The remaining 20% is paid to the custodian as compensation for its securities lending services. Interest income received by the Portfolio via lending transactions during the year ended December 31, 2008 is footnoted in the Statement of Operations. The Portfolio bears the risk of any deficiency in the amount of collateral available for return to a borrower due to a loss in an approved investment purchased with such collateral. Any outstanding loans by the Portfolio at December 31, 2008 are footnoted in the Schedule of Investments.
| 6. | MARKET AND CREDIT RISK: |
In the normal course of business, the Portfolio invests in securities and enters into transactions where risks exist due to fluctuations in the market (market risk) or failure of the other party to a transaction to perform (credit risk). The value of securities held by the Portfolio may decline in response to certain events, including those directly involving the companies whose securities are owned by the Portfolio; conditions affecting the general economy; overall market changes; local, regional or global political, social or economic instability; and currency and interest rate and price fluctuations. Similar to credit risk, the Portfolio may be exposed to counterparty risk, or the risk that an entity with which the Portfolio has unsettled or open transactions may
MSF-16
Metropolitan Series Fund, Inc.
Davis Venture Value Portfolio
Notes to Financial Statements—December 31, 2008—(Continued)
default. Financial assets, which potentially expose the Portfolio to credit and counterparty risks, consist principally of investments and cash due from counterparties. The extent of the Portfolio’s exposure to credit and counterparty risks in respect to these financial assets approximates their value as recorded in the Portfolio’s Statements of Assets and Liabilities.
| 7. | RECENT ACCOUNTING PRONOUNCEMENTS: |
In March 2008, the FASB issued Statement of Financial Accounting Standards No. 161, Disclosures about Derivative Instruments and Hedging Activities (“FAS 161”), an amendment of FASB Statement No. 133. FAS 161 requires enhanced disclosures about (a) how and why an entity uses derivative instruments, (b) how derivative instruments and hedging activities are accounted for, and (c) how derivative instruments and related hedging activities affect a fund’s financial position, financial performance, and cash flows. Management does not believe the adoption of FAS 161 will materially impact the financial statement amounts, but will require additional disclosures. This will include qualitative and quantitative disclosures on derivative positions existing at period end and the effect of using derivatives during the reporting period. FAS 161 is effective for financial statements issued for fiscal years and interim periods beginning after November 15, 2008. Management is currently evaluating the impact the adoption of FAS 161 will have on the Portfolio’s financial statement disclosures.
MSF-17
Metropolitan Series Fund, Inc.
Davis Venture Value Portfolio
Report of Independent Registered Public Accounting Firm
To the Shareholders and Board of Directors of Metropolitan Series Fund, Inc.:
We have audited the accompanying statement of assets and liabilities, including the schedule of investments, of the Davis Venture Value Portfolio (one of the portfolios constituting the Metropolitan Series Fund, Inc.) (the “Fund”) as of December 31, 2008, and the related statement of operations for the year then ended, the statements of changes in net assets for each of the two years in the period then ended, and the financial highlights for each of the five years in the period then ended. These financial statements and financial highlights are the responsibility of the Fund’s management. Our responsibility is to express an opinion on these financial statements and financial highlights based on our audits.
We conducted our audits in accordance with the standards of the Public Company Accounting Oversight Board (United States). Those standards require that we plan and perform the audit to obtain reasonable assurance about whether the financial statements and financial highlights are free of material misstatement. The Fund is not required to have, nor were we engaged to perform, an audit of its internal control over financial reporting. Our audits included consideration of internal control over financial reporting as a basis for designing audit procedures that are appropriate in the circumstances, but not for the purpose of expressing an opinion on the effectiveness of the Fund’s internal control over financial reporting. Accordingly, we express no such opinion. An audit also includes examining, on a test basis, evidence supporting the amounts and disclosures in the financial statements, assessing the accounting principles used and significant estimates made by management, as well as evaluating the overall financial statement presentation. Our procedures included confirmation of securities owned as of December 31, 2008, by correspondence with the custodian and brokers; where replies were not received from brokers, we performed other auditing procedures. We believe that our audits provide a reasonable basis for our opinion.
In our opinion, the financial statements and financial highlights referred to above present fairly, in all material respects, the financial position of the Davis Venture Value Portfolio of the Metropolitan Series Fund, Inc. as of December 31, 2008, the results of its operations for the year then ended, the changes in its net assets for each of the two years in the period then ended, and the financial highlights for each of the five years in the period then ended, in conformity with accounting principles generally accepted in the United States of America.
Deloitte & Touche LLP
Boston, Massachusetts
February 24, 2009
MSF-18
Metropolitan Series Fund, Inc.
Directors and Officers
The Fund’s Directors review actions of the Fund’s investment adviser and subadvisers, and decide upon matters of general policy. The Fund’s officers supervise the daily business operations of the Fund. The Board of Directors and the Fund’s officers are listed below. Each Director is responsible for overseeing all 38 Portfolios of the Fund. There is no limit to the term a Director may serve. Directors serve until their resignation, retirement or removal in accordance with the Fund’s organizational documents and policies adopted by the Board from time to time. Officers hold office at the pleasure of the Board or until the election or appointment and the qualification of a successor. The address of the Directors and officers is c/o Metropolitan Series Fund, Inc., 501 Boylston Street, Boston, MA 02116.
Interested Directors(1)
Each Director below is an “interested person” (as defined by the 1940 Act) with respect to the Fund in that Ms. Forget is an employee of MetLife and Mr. Typermass is a former employee of MetLife and owns securities issued by MetLife, Inc., the ultimate parent company of MetLife Advisers.
| | | | | | | | |
Name, Address and Age | | Current
position(s)
with Fund | | Position(s)
held since | | Principal occupations
over past five years, including other directorships(2) | | Number of
Portfolios in
Fund Complex
Overseen by
Director(3) |
Elizabeth M. Forget Age: 42 | | Director, Chairman of the Board, President and Chief Executive Officer | | 2006 | | Senior Vice President (since 2007), MetLife, Inc.; President, Met Investors Advisory, LLC; Trustee and President, Met Investors Series Trust; Executive Vice President, MetLife Investors Group, Inc.; President, Chief Executive Officer and Chair of the Board of Managers (since 2006), MetLife Advisers; President, Met Investors Advisory, LLC. | | 87 |
| | | | |
Arthur G. Typermass Age: 71 | | Director | | 1998 | | Formerly, Senior Vice President and Treasurer, MetLife. | | 38 |
Non-Interested Directors(1)
Each Director below is not an “interested person” (as defined by the 1940 Act) with respect to the Fund (collectively, the “Independent Directors”).
| | | | | | | | |
Name, Address and Age | | Current
position(s)
with Fund | | Position(s)
held since | | Principal occupations
over past five years, including other directorships(2) | | Number of
Portfolios in
Fund Complex
Overseen by
Director(3) |
Steve A. Garban† Age: 71 | | Director | | 1985 | | Formerly, Chief Financial Officer, Senior Vice President Finance and Operations and Treasurer (Emeritus), The Pennsylvania State University. | | 38 |
| | | | |
Linda B. Strumpf Age: 61 | | Director | | 2000 | | Vice President and Chief Investment Officer, Ford Foundation. | | 38 |
| | | | |
Michael S. Scott Morton† Age: 71 | | Director | | 1993 | | Jay W. Forrester Professor of Management (Emeritus) at Sloan School of Management, MIT. | | 38 |
| | | | |
H. Jesse Arnelle Age: 75 | | Director | | 2001 | | Formerly, Counsel, Womble Carlyle Sandrie & Rice; Director, Textron Inc. (global multi- industry company)*; formerly, Director, Gannet Co. Inc. (diversified news and information company)*; formerly, Director, Eastman Chemical Company (global chemical company)*; formerly, Director, Waste Management, Inc.*; formerly, Director, Armstrong Holdings Inc. (parent company of floor and ceiling products business)*; formerly, Director, FPL Group Inc. (public utility holding company)*; Director, URS Corporation (engineering design services firm)*. | | 38 |
MSF-19
Metropolitan Series Fund, Inc.
Directors and Officers—(Continued)
| | | | | | | | |
Name, Address and Age | | Current
position(s)
with Fund | | Position(s)
held since | | Principal occupations
over past five years, including other directorships(2) | | Number of
Portfolios in
Fund Complex
Overseen by
Director(3) |
Nancy Hawthorne Age: 57 | | Director | | 2003 | | Chief Executive Officer, Clerestory LLC (corporate financial advisor); Director, Avid Technologies (computer software company)*; formerly, Chairman of the Board of Avid Technologies; formerly, Board of Advisors, L. Knife & Sons, Inc. (beverage distributor); formerly, Trustee, New England Zenith Fund (“Zenith Fund”)**; formerly, Chief Executive Officer and Managing Partner, Hawthorne, Krauss and Associates (corporate financial advisor); formerly, Chief Financial Officer and Executive Vice President, Continental Cablevision, subsequently renamed MediaOne (cable television company); formerly, Director, Life F/X, Inc.; formerly, Chairman of the Board, WorldClinic (distance medicine company); formerly, Director, Perini Corporation (construction company)*; formerly, Director, CGU (property and casualty insurance company); formerly, Director, Beacon Power Corporation (energy company)*. | | 38 |
| | | | |
John T. Ludes Age: 72 | | Director | | 2003 | | President, LFP Properties (consulting firm); Formerly, Trustee, Zenith Fund**; formerly, Vice Chairman, President and Chief Operating Officer, Fortune Brands/American Brands (global conglomerate); formerly, President and CEO, Acushnet Company (athletic equipment company). | | 38 |
Officers(1)
| | | | | | | | |
Name and address | | Age | | Current
position(s)
with Fund | | Position(s)
held since | | Principal occupations over past five years(2) |
| Jeffrey L. Bernier | | 37 | | Senior Vice President | | 2008 | | Vice President (since 2008), MetLife, Inc.; Vice President (since 2008), MetLife; Senior Vice President (since 2008), MetLife Advisers; formerly, Director and Senior Investment Analyst (2004 to 2007), John Hancock Financial Services; formerly, Assistant Vice President (2000 to 2001), Wachovia Securities. |
| | | | |
| Alan C. Leland | | 56 | | Senior Vice President | | 2005 | | Treasurer and Chief Financial Officer, MetLife Advisers, LLC; Treasurer (since 2005), Met Investors Advisory, LLC; Vice President (since 2004), Met Investors Advisory, LLC; Vice President (since 2003), MetLife, Inc.; Vice President, MetLife; Senior Vice President, NELICO. |
| | | | |
| Peter Duffy | | 53 | | Vice President
and Treasurer | | 2000 | | Senior Vice President, MetLife Advisers; Second Vice President (since 2003), NELICO; Vice President, MetLife (since 2004); Vice President (since 2004), MetLife, Inc.; formerly, Vice President and Treasurer, Zenith Fund**. |
| | | | |
| Jeffrey P. Halperin | | 41 | | Chief
Compliance Officer | | 2007 | | Vice President (since 2006), MetLife, Inc.; Vice President (since 2006), MetLife; Chief Compliance Officer (since 2006), Met Investors Series Trust, MetLife Advisers, Met Investors Advisory, LLC and MetLife Investment Advisors Company, LLC. |
| * | Indicates a directorship with a registered investment company or a company subject to the reporting requirements of the Securities Exchange Act of 1934, as amended. |
| ** | The Zenith Fund deregistered with the Securities and Exchange Commission (“SEC”) in 2004. |
| (†) | Served as a trustee, director and/or officer of one or more of the following companies, each of which had a direct or indirect advisory relationship with MetLife Advisers or its affiliates prior to January 31, 2005: State Street Research Financial Trust, State Street Research Income Trust, State Street Research Money Market Trust, State Street Research Institutional Funds, State Street Research Capital Trust, State Street Research Master Investment Trust, State Street Research Equity Trust, State Street Research Securities Trust and State Street Research Exchange Trust (collectively, the “State Street Research Funds”). |
| (1) | During the period shown, each Director of the Fund served as a Trustee of Metropolitan Series Fund II, a registered investment company that ceased investment operations in June of 2008 and has applied for deregistration under the Investment Company Act of 1940. During this period, each officer of the Fund served in the same position with Metropolitan Series Fund II. |
| (2) | Previous positions during the past five years with the Fund; Met Investors Series Trust; MetLife; MetLife, Inc.; MetLife Advisers; Met Investors Advisory, LLC; Zenith Fund; NELICO; or New England Securities Corporation are omitted if not materially different. |
| (3) | The Fund Complex includes the Fund (38 portfolios) and Met Investors Series Trust (49 portfolios). |
MSF-20
Metropolitan Series Fund, Inc.
Davis Venture Value Portfolio
Board Approval of Advisory and Subadvisory Agreements
The Fund’s Contract Review Committees of the Board of Directors (the “Board” or the “Directors”) typically meet in early fall to review the Portfolios’ advisory agreements (the “Advisory Agreements”) and subadvisory agreements (the “Subadvisory Agreements,” and, together with the Advisory Agreements, the “Agreements”) and determine whether to recommend that the full Board approve the continuation of the Agreements for an additional one-year period. (Following the initial approval of an Agreement for a new Portfolio or with a new adviser or subadviser, such annual reviews are not required until 2 years following the execution of such Agreement.) After each Committee has made its recommendations, the full Board, including the Independent Directors, determines whether to approve the continuation of each of the Agreements. In addition, the Board, including the Independent Directors, considers matters bearing on the Agreements at most of its other meetings throughout the year and regularly interviews various individuals at MetLife Advisers responsible for the management of the Portfolios. The Directors also interview selected investment managers and other professionals at the subadvisers at various times throughout the year.
The Directors receive all materials that they or MetLife Advisers, the Fund’s investment adviser, and the subadvisers believe to be reasonably necessary for the Directors to evaluate the Agreements and determine whether to approve the continuation of the Agreements. These materials generally include, among other items, (i) information on the investment performance of the Portfolios and the performance of peer groups of funds and the Portfolios’ performance benchmarks, (ii) information on the Portfolios’ advisory and subadvisory fees and other expenses, including information comparing the Portfolios’ expenses to those of peer groups of funds and information about any applicable expense caps and fee “breakpoints,” (iii) sales and redemption data, (iv) information related to the profitability of the Agreements to MetLife Advisers and certain of the subadvisers, and potential “fall-out” or ancillary benefits that MetLife Advisers, the subadvisers or their affiliates may receive as a result of their relationships with the Fund and (v) information obtained through the subadvisers’ responses to certain requests from MetLife Advisers and the Directors and MetLife Advisers’ responses to requests from the Directors. The Directors may also consider other information such as (vi) MetLife Advisers’ and the subadvisers’ financial results and condition, (vii) each Portfolio’s investment objectives and strategies and the size, education and experience of the investment staffs of MetLife Advisers and the relevant subadvisers and their use of technology and external research, (viii) the allocation of the Portfolios’ brokerage, if any, including allocations to brokers affiliated with the subadvisers and the use of “soft” commission dollars to pay Portfolio expenses and to pay for research and other similar services, (ix) the resources devoted to, and the record of compliance with, the Portfolios’ investment policies and restrictions, policies on personal securities transactions and other compliance policies, (x) the responses of MetLife Advisers, the subadvisers and/or their affiliates to certain legal and regulatory proceedings and (xi) the economic outlook generally and for the mutual fund industry in particular. Throughout the process, the Directors have the opportunity to ask questions of and request additional materials from MetLife Advisers and the subadvisers.
Following meetings of each Contract Review Committee on September 10, 2008, the Board, including the Independent Directors, at its November 6-7, 2008 meeting, approved the continuation through December 31, 2009 of the Advisory Agreements for each Portfolio of the Fund and the Subadvisory Agreements for each Portfolio other than the Zenith Equity Portfolio and Asset Allocation Portfolios (which do not have subadvisers) and the Van Eck Global Natural Resources Portfolio, Met/Dimensional International Small Cap Portfolio and Loomis Sayles Small Cap Growth Portfolio (formerly known as the Franklin Templeton Small Cap Growth Portfolio). The Agreements approved for continuation are referred to below as the “Continued Agreements.”
In considering whether to approve the continuation of the Continued Agreements, the Directors, including the Independent Directors, did not identify any single factor as determinative, and each weighed the various factors as he or she deemed appropriate. The Directors considered the following matters in connection with their approval of the Continued Agreements:
The nature, extent and quality of the services provided to the relevant Portfolios under the Continued Agreements. The Directors considered the nature, extent and quality of the services provided by MetLife Advisers, the relevant subadvisers (if any) and their affiliates (each, an “Adviser,” and, collectively, the “Advisers”) to the relevant Portfolios pursuant to the Continued Agreements and the resources dedicated to these Portfolios by the Advisers. In particular, the Directors considered the Advisers’ abilities to attract and retain highly qualified investment professionals. With respect to MetLife Advisers, the Directors considered (for each Portfolio other than the Zenith Equity and Asset Allocation Portfolios) that MetLife Advisers is (i) ultimately responsible for the performance of such Portfolios; (ii) ultimately responsible for the establishment of the investment strategies of each such Portfolio, primarily through its recommendations to the Board regarding the hiring and selection of subadvisers; (iii) responsible for the hiring and selection, subject to Board approval, of subadvisers; and (iv) responsible for maintaining a program of Subadviser oversight reasonably designed to ensure that the subadvisers have reasonable compliance policies and procedures in place. The Directors also considered that MetLife Advisers provides a full range of day-to-day administrative services for the Portfolios involving all aspects of such Portfolios’ day-to-day operations (other than portfolio management). With respect to the Zenith Equity and Asset Allocation Portfolios, the Directors considered both the portfolio management services and the administrative services provided by MetLife Advisers. After reviewing
MSF-21
Metropolitan Series Fund, Inc.
Davis Venture Value Portfolio
Board Approval of Advisory and Subadvisory Agreements—(Continued)
these and related factors, the Directors concluded, within the context of their overall conclusions regarding each of the Continued Agreements, that the nature, extent and quality of services provided supported the renewal of these Agreements.
Investment performance of the relevant Portfolios. The Directors reviewed information about the performance of the relevant Portfolios over various time periods, including information prepared by an independent third party that compared the performance of the Portfolios to the performance of peer groups of funds and performance benchmarks. The Directors also reviewed a description of the third party’s methodology for identifying a Portfolio’s peer group(s) for purposes of performance and expense comparisons.
In the case of each relevant Portfolio that had performance that lagged its peer group(s) for certain periods, the Directors concluded that other factors relevant to performance were sufficient, in light of other considerations, to warrant renewal of the Continued Agreements relating to such Portfolio. These factors varied from Portfolio to Portfolio, but included one or more of the following: (i) that such Portfolio’s performance, although lagging in certain recent periods, was stronger over the longer term; (ii) that the underperformance was attributable, to a significant extent, to investment decisions that were reasonable and consistent with the Portfolio’s investment objective(s) and policies and that the Portfolio was performing within the range of reasonable expectations, given market conditions and the Portfolio’s investment objective(s) and policies; (iii) that the Portfolio’s performance was competitive when compared to other relevant performance benchmarks or peer groups; and (iv) that MetLife Advisers and/or the relevant subadviser (if any) had taken or was taking steps designed to help improve the Portfolio’s investment performance (including, in the case of certain Portfolios, that MetLife Advisers was formulating possible proposals, for presentation to the Board in November 2008, to replace the Portfolio’s subadviser or to merge the Portfolio into another Portfolio with a similar investment objective and better investment performance).
The Directors also considered the investment performance of the Advisers and their reputations generally, the historical responsiveness of the Advisers to Director concerns about performance and the willingness of the Advisers to take steps intended to improve performance.
After reviewing these and related factors, the Directors concluded, within the context of their overall conclusions regarding each of the Continued Agreements, that the investment performance of each relevant Portfolio and Adviser was sufficient, in light of other considerations, to warrant the renewal of the Continued Agreements.
The costs of the services to be provided and profits to be realized by the Advisers and their affiliates from their relationships with the Portfolios. The Directors considered the fees charged by MetLife Advisers to the Portfolios for advisory services and, with respect to the subadvised Portfolios, by such subadvisers to MetLife Advisers for subadvisory services (such advisory and subadvisory fees (if any), collectively, “Fees”), as well as the total expense levels of the Portfolios. This information included comparisons (provided by an independent third party) of the Portfolios’ advisory fees and total expense levels to those of their peer groups. In evaluating Fees for the relevant Portfolios, the Directors also took into account the demands, complexity and quality of the investment management services provided to each Portfolio. The Directors considered MetLife Advisers’ recommendations regarding reductions in Fee rates, implementation of Fee breakpoints and institution of Fee waivers and expense caps.
The Directors also considered the compensation directly or indirectly received by the Advisers and their affiliates from their relationships with the relevant Portfolios. The Directors reviewed information relating to the profits received by MetLife Advisers, certain of the subadvisers and their affiliates as a result of their relationships with the relevant Portfolios, and information about the allocation of expenses used to calculate profitability. When reviewing profitability, the Directors also considered the performance of the relevant Portfolios, the expense levels of such Portfolios and whether the relevant Advisers had implemented breakpoints, fee waivers and/or expense caps with respect to such Portfolios.
After reviewing these and related factors, the Directors concluded, within the context of their overall conclusions regarding each of the Continued Agreements, that the Fees charged to each of the relevant Portfolios were fair and reasonable, and that the information provided regarding costs of these services generally, and the related profitability (if known) to the relevant Advisers of their relationships with the relevant Portfolios, supported the renewal of the Continued Agreements.
Economies of Scale. The Directors considered the existence of any economies of scale in the provision of services by the Advisers and whether those economies were shared with the relevant Portfolios through breakpoints in their advisory fees or other means, such as expense caps, fee waivers or relatively low levels of fees. The Directors noted that most of the relevant Portfolios benefited or will benefit from breakpoints, expense caps and/or fee waivers with respect to their advisory fees. In considering these issues, the Directors also took into consideration information relating to the costs of the services provided and the profitability to MetLife Advisers, the relevant subadvisers (if any) and each of their affiliates of their relationships with the relevant Portfolios, as discussed above.
MSF-22
Metropolitan Series Fund, Inc.
Davis Venture Value Portfolio
Board Approval of Advisory and Subadvisory Agreements—(Continued)
After reviewing these and related factors, the Directors concluded, within the context of their overall conclusions regarding each of the Continued Agreements, that the extent to which economies of scale were shared with the relevant Portfolios supported the renewal of such Agreements.
Other Factors. The Directors also considered other factors, which included but were not limited to the following:
| | • | | the extent to which each relevant Portfolio operated in accordance with its investment objective, and its record of compliance with its investment restrictions and the compliance programs of the Fund and the Advisers. They also considered the compliance-related resources the Advisers and their affiliates provide to the relevant Portfolios; |
| | • | | the nature, quality, cost and extent of administrative and shareholder services performed by MetLife Advisers and its affiliates under the Advisory Agreements; and |
| | • | | so-called “fall-out benefits” to the Advisers, such as the engagement of their affiliates to provide distribution, brokerage and transfer agency services to the Portfolios, and the benefits of research made available to the relevant Advisers by reason of brokerage commissions generated by the relevant Portfolios’ securities transactions. The Directors also considered the possible conflicts of interest associated with these fall-out and other benefits, and the reporting and other processes in place to disclose and monitor these possible conflicts of interest. |
Based on their evaluation of all factors that they deemed to be material, including those factors described above, and assisted by the advice of independent counsel, the Directors, including the Independent Directors, concluded that each of the Continued Agreements should be continued through December 31, 2009.
MSF-23
A description of the policies and procedures that the Fund uses to determine how to vote proxies relating to portfolio securities is available (i) without charge, upon request, by calling (800) 638-7732 and (ii) on the Securities and Exchange Commission’s (the “SEC”) website at http://www.sec.gov.
Information regarding how the Fund voted proxies relating to portfolio securities during the most recent twelve-month period ended December 31, 2008 is available (i) without charge, upon request, by calling (800) 638-7732 and (ii) on the SEC’s website at http://www.sec.gov.
The Fund’s Statement of Additional Information includes additional information about the Directors of the Fund and is available (i) without charge, upon request, by calling (800) 638-7732 and (ii) on the SEC’s website at http://www.sec.gov.
The Fund files with the SEC a complete schedule of its portfolio holdings, as of the close of the first and third quarters of its fiscal year, on “Form N-Q”. These filings are available on the SEC’s website at www.sec.gov and may be reviewed and copied at the SEC’s Public Reference Room in Washington, DC. (Call 1-800-SEC-0330 for information on the operation of the Public Reference Room.)
MSF-24
Simplify your life…
with MetLife eDelivery® while helping MetLife preserve the planet’s natural resources.
(see details on inside cover)
| | |
Metropolitan Series Fund, Inc. FI Large Cap Portfolio Annual Report | | December 31, 2008 |
NOT PART OF THE ANNUAL REPORT
Letter from the President
February 1, 2009
Letter to Policy Holders:
2008 was an extraordinary year in the capital markets around the world and for the global economy. Energy prices rose to record levels early in the year before falling by two-thirds by year-end. A credit crisis that began with concerns about sub-prime mortgages led to massive changes in the financial landscape with government takeovers, forced sales, and outright failures of a number of large, once venerable firms.
While bonds as measured by the Barclays Capital U.S. Aggregate Bond Index (formerly known as, Lehman Brothers U.S. Aggregate Bond Index) were up 5.2% for the year in response to declining interest rates, there were large differences in the total returns of the various sectors of the bond market. U.S. treasury securities were up over 13% as frightened investors sought refuge in what they perceived to be the safest and most liquid investments. In contrast, investment grade corporate securities lost nearly 5% as credit spreads widened and below investment grade or high yield bonds fell over 26%.
In response to the growing credit crisis and the weakening economy, common stocks fell sharply across all regions, styles, and capitalizations. As measured by the Standard and Poor’s 500, U.S. common stocks fell 37% for the year, the worst calendar year decline since the 1930s. Foreign stocks were down even more with the MSCI EAFE Index down 43% for the year.
On the following pages, you will find a complete review of your Portfolio and its investment performance.
MetLife is committed to building your financial freedom. We appreciate your trust and will continue to focus our efforts on meeting your investment needs.
Sincerely,
Elizabeth M. Forget
President, Metropolitan Series Fund, Inc.
Metropolitan Series Fund, Inc.
FI Large Cap Portfolio
Managed by Fidelity Management & Research Company
Portfolio Manager Commentary*
PORTFOLIO PERFORMANCE
For the twelve-month period ended December 31, 2008, the Class A shares of the FI Large Cap Portfolio returned -44.8%, compared to its benchmark, the Russell 1000 Growth Index1, which returned -38.4%. The average return of its peer group, the Lipper Variable Insurance Products2 Large-Cap Growth Funds Universe, was -41.7% over the same period.
PORTFOLIO REVIEW
For the 12-month period, the Portfolio underperformed the Russell 1000 Growth Index. The Industrials and Energy sectors were among the largest detractors from performance, while Health Care and Financials were the largest contributors to relative performance.
Within Industrials, the overweights in Manitowoc and Bucyrus International were among the top detractors. Manitowoc is a diversified machine manufacturer that focuses on three principal business segments: cranes, foodservice equipment, and marine equipment. The company’s shares fell during the year as investors feared the economic slowdown would slow global infrastructure building and hurt demand for the company’s construction cranes. Furthermore, the company’s acquisition of British foodservice equipment company Enodis, which was intended to further diversify the company, was not well received by investors who own Manitowoc for exposure to the company’s crane manufacturing business. Bucyrus designs and manufactures mining equipment. Bucyrus shares declined on fears that falling commodity prices and the global credit crisis would result in decreased demand for mining equipment. Within Energy, natural gas production company Chesapeake Energy and oil and gas equipment manufacturer National Oilwell Varco detracted from performance. Chesapeake Energy shares fell as investors worried about declining natural gas prices and contracting demand. National Oilwell Varco shares fell on concerns the global credit crisis will lead to decreased capital spending from oil and gas companies. Among individual holdings, fertilizer manufacturer CF Industries and internet search engine Google detracted. CF Industries shares declined as falling commodity prices and concern over decreasing agricultural demand weighed on fertilizer companies. Google shares fell during the period on concerns that the global recession will lead to reductions in advertising spending, slowing Google’s revenue growth.
Within Health Care, the overweights in biotechnology companies Amgen and Biogen Idec (no longer held at year-end were among the largest contributors to performance. During the period, Amgen raised its full year 2008 profit guidance and received positive late stage clinical trial results for its osteoporosis drug, Denosumab. Biogen’s shares were attractive from a valuation perspective as the company reported strong sales of its multiple sclerosis drugs, Tysabri and Avonex. Within Financials, not owning credit card and travel services provider American Express (no longer held at year-end and home mortgage company Freddie Mac contributed to relative performance. American Express shares fell sharply during the second half of the year as turmoil in the capital markets and the global credit crisis weighed on shares. Freddie Mac shares plummeted 98% during the period as fallout from the subprime mortgage crisis forced the government sponsored enterprise to be placed under conservatorship by the federal government. Among individual holdings, the overweights in Wal-Mart and Lowe’s were among the largest contributors to relative performance. Wal-Mart shares rose during the period as it benefited from increased store traffic due to the weak consumer favoring the low-cost retailer. Lowe’s operates a chain of home improvement retail stores that cater to the do-it-yourself consumer. After initiating a position in Lowe’s, the retailer reported solid Q2 and Q3 earnings in a difficult environment, driving shares higher.
* The views expressed above are those of the subadvisory firm as of December 31, 2008 and are subject to change based on market and other conditions. Information about the Portfolio’s holdings, asset allocation, industry allocation, or country diversification is historical and is not an indication of future Portfolio composition, which will vary. The performance of any index mentioned in this commentary has not been adjusted for ongoing management, distribution and operating expenses, and sales charges applicable to mutual fund investments. Direct investment in any index is not possible.
1 The Russell 1000® Growth Index is an unmanaged measure of performance of the largest capitalized U.S. companies, within the Russell 1000 companies, that have higher price-to-book ratios and forecasted growth values.
2 The Lipper Variable Products Fund Average is an average of the total return performance (calculated on the basis of net asset value) of variable product funds with similar investment objectives to those of the subject Portfolio as calculated by Lipper Analytical Services, an independent mutual fund ranking service.
MSF-2
Metropolitan Series Fund, Inc.
FI Large Cap Portfolio
A $10,000 INVESTMENT COMPARED TO THE RUSSELL 1000 GROWTH INDEX
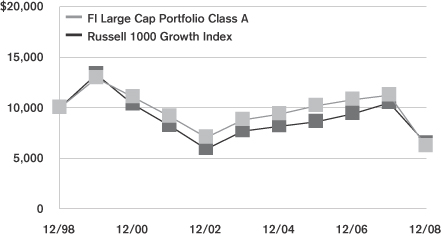
Average Annual Returns as of December 31, 2008
| | | | | | | | | | | | |
| | | FI Large Cap Portfolio | | | Russell 1000
Growth Index | |
| | | Class A | | | Class B | | | Class E | | |
| 1 Year | | -44.8 | % | | -44.9 | % | | -44.9 | % | | -38.4 | % |
| 5 Year | | -6.8 | | | — | | | — | | | -3.4 | |
| 10 Year | | -4.7 | | | — | | | — | | | -4.3 | |
| Since Inception | | — | | | -18.2 | | | -18.1 | | | — | |
Performance numbers are net of all Portfolio expenses but do not include any insurance, sales, or administrative charges of variable annuity or life insurance contracts or any additional expenses that participants in certain eligible qualified plans may bear relating to the operations of their plans. If these charges were included, the returns would be lower.
Inception dates of the Class A, Class B and Class E shares are: 8/30/96, 5/2/06, 5/2/06, respectively.
This information represents past performance and is not indicative of future results. Investment return and principal value may fluctuate so that shares, upon redemption, may be worth more or less than the original cost.
PORTFOLIO COMPOSITION
as of December 31, 2008
Top Holdings
| | |
| | | % of Total
Net Assets |
Google, Inc. (Class A) | | 4.8% |
Wal-Mart Stores, Inc. | | 3.9% |
Apple, Inc. | | 3.9% |
McDonald’s Corp. | | 3.9% |
Microsoft Corp. | | 3.3% |
Oracle Corp. | | 3.1% |
Bristol-Myers Squibb Co. | | 3.1% |
Monsanto Co. | | 2.7% |
Hewlett-Packard Co. | | 2.6% |
QUALCOMM, Inc. | | 2.6% |
Top Sectors
| | |
| | | % of Total
Market Value |
Information Technology | | 26.5% |
Health Care | | 15.6% |
Industrials | | 13.6% |
Consumer Staples | | 13.3% |
Consumer Discretionary | | 10.3% |
Energy | | 7.4% |
Financials | | 6.1% |
Materials | | 5.4% |
Telecommunication Services | | 0.6% |
Utilities | | 0.5% |
MSF-3
Metropolitan Series Fund, Inc.
Shareholder Expense Example
As a shareholder of the Portfolio, you incur ongoing costs, including management fees; distribution and service (12b-1) fees; and other Portfolio expenses. This example is intended to help you understand your ongoing costs (in dollars) (referred to as “expenses”) of investing in the Portfolio and compare these costs with the ongoing costs of investing in other mutual funds. The example is based on an investment of $1,000 invested at the beginning of the period and held for the entire period, July 1, 2008 through December 31, 2008.
Actual Expenses
The first line for each share class of the Portfolio in the table below provides information about actual account values and actual expenses. You may use the information in this line, together with the amount you invested in the particular share class of the Portfolio, to estimate the expenses that you paid over the period. Simply divide your account value by $1,000 (for example, an $8,600 account value divided by $1,000=8.6), then multiply the result by the number in the first line under the heading entitled “Expenses Paid During Period” to estimate the expenses you paid on your account during this period.
Hypothetical Example for Comparison Purposes
The second line for each share class of the Portfolio in the table below provides information about hypothetical account values and hypothetical expenses based on the Portfolio’s actual expense ratio and an assumed rate of return of 5% per year before expenses, which is not the Portfolio’s actual return. The hypothetical account values and expenses may not be used to estimate the actual ending account balance or expenses you paid for the period. You may use this information to compare the ongoing costs of investing in the Portfolio and other funds. To do so, compare this 5% hypothetical example with the 5% hypothetical examples that appear in the shareholder reports of the other funds.
Please note that the expenses shown in the table are meant to highlight your ongoing costs only and do not reflect any fees or charges of your variable insurance product or any additional expenses that participants in certain eligible qualified plans may bear relating to the operations of their plan. Therefore, the second line for each share class in the table is useful in comparing ongoing costs only, and will not help you determine the relative total costs of owning different funds. In addition, if these other costs were included, your costs would have been higher.
| | | | | | | | | | | | | | |
Portfolio | | | | Annualized
Expense
Ratio | | | Beginning
Account Value
July 1,
2008 | | Ending
Account Value
December 31,
2008 | | Expenses Paid
During Period*
July 1, 2008
to
December 31,
2008 |
FI Large Cap—Class A | | Actual | | 0.89 | % | | $ | 1,000.00 | | $ | 645.14 | | $ | 3.68 |
| | Hypothetical | | 0.89 | % | | $ | 1,000.00 | | $ | 1,020.61 | | $ | 4.52 |
| | | | | |
FI Large Cap—Class B | | Actual | | 1.14 | % | | $ | 1,000.00 | | $ | 643.89 | | $ | 4.71 |
| | Hypothetical | | 1.14 | % | | $ | 1,000.00 | | $ | 1,019.34 | | $ | 5.79 |
| | | | | |
FI Large Cap—Class E | | Actual | | 1.04 | % | | $ | 1,000.00 | | $ | 644.80 | | $ | 4.30 |
| | Hypothetical | | 1.04 | % | | $ | 1,000.00 | | $ | 1,019.85 | | $ | 5.28 |
* Expenses paid are equal to the Portfolio’s annualized expense ratio for the most recent six month period, as shown above, multiplied by the average account value over the period, multiplied by the number of days in the most recent fiscal half-year, divided by 366 (to reflect the the one-half year period).
MSF-4
Metropolitan Series Fund, Inc.
FI Large Cap Portfolio
Schedule of Investments as of December 31, 2008
Common Stock—99.4% of Total Net Assets
| | | | | |
| Security Description | | Shares | | Value* |
| | | | | |
| | |
Aerospace & Defense—5.6% | | | | | |
BE Aerospace, Inc. (a) | | 141,210 | | $ | 1,085,905 |
Boeing Co. | | 44,560 | | | 1,901,375 |
Honeywell International, Inc. | | 83,830 | | | 2,752,139 |
Lockheed Martin Corp. | | 52,310 | | | 4,398,225 |
United Technologies Corp. | | 54,990 | | | 2,947,464 |
| | | | | |
| | | | | 13,085,108 |
| | | | | |
| | |
Auto Components—1.2% | | | | | |
BorgWarner, Inc. (b) | | 73,130 | | | 1,592,040 |
The Goodyear Tire & Rubber Co. (a) | | 200,330 | | | 1,195,970 |
| | | | | |
| | | | | 2,788,010 |
| | | | | |
| | |
Beverages—3.1% | | | | | |
Hansen Natural Corp. (a) | | 60,340 | | | 2,023,200 |
PepsiCo, Inc. | | 97,230 | | | 5,325,287 |
| | | | | |
| | | | | 7,348,487 |
| | | | | |
| | |
Biotechnology—4.2% | | | | | |
Amgen, Inc. (a) | | 83,260 | | | 4,808,265 |
Gilead Sciences, Inc. (a) | | 97,540 | | | 4,988,196 |
| | | | | |
| | | | | 9,796,461 |
| | | | | |
| | |
Capital Markets—1.6% | | | | | |
BlackRock, Inc. | | 8,070 | | | 1,082,591 |
The Bank of New York Mellon Corp. | | 37,730 | | | 1,068,891 |
The Goldman Sachs Group, Inc. | | 18,790 | | | 1,585,688 |
| | | | | |
| | | | | 3,737,170 |
| | | | | |
| | |
Chemicals—4.1% | | | | | |
CF Industries Holdings, Inc. | | 30,100 | | | 1,479,716 |
Monsanto Co. | | 88,858 | | | 6,251,160 |
The Mosaic Co. | | 53,900 | | | 1,864,940 |
| | | | | |
| | | | | 9,595,816 |
| | | | | |
| | |
Commercial Banks—0.9% | | | | | |
PNC Financial Services Group, Inc. | | 21,940 | | | 1,075,060 |
SunTrust Banks, Inc. | | 31,600 | | | 933,464 |
| | | | | |
| | | | | 2,008,524 |
| | | | | |
| | |
Communications Equipment—4.3% | | | | | |
Cisco Systems, Inc. (a) | | 247,121 | | | 4,028,072 |
QUALCOMM, Inc. | | 168,840 | | | 6,049,537 |
| | | | | |
| | | | | 10,077,609 |
| | | | | |
| | |
Computers & Peripherals—7.0% | | | | | |
Apple, Inc. (a) | | 107,100 | | | 9,140,985 |
Hewlett-Packard Co. | | 167,560 | | | 6,080,753 |
International Business Machines Corp. | | 13,790 | | | 1,160,566 |
| | | | | |
| | | | | 16,382,304 |
| | | | | |
| | | | | |
| Security Description | | Shares | | Value* |
| | | | | |
| | |
Diversified Consumer Services—1.7% | | | | | |
H&R Block, Inc. | | 87,130 | | $ | 1,979,593 |
ITT Educational Services, Inc. (a) (b) | | 20,720 | | | 1,967,986 |
| | | | | |
| | | | | 3,947,579 |
| | | | | |
| | |
Diversified Financial Services—2.4% | | | | | |
CME Group, Inc. | | 21,500 | | | 4,474,365 |
Interactive Brokers Group, Inc. (a) | | 59,090 | | | 1,057,120 |
| | | | | |
| | | | | 5,531,485 |
| | | | | |
| | |
Electrical Equipment—2.4% | | | | | |
Emerson Electric Co. | | 116,560 | | | 4,267,262 |
Energy Conversion Devices, Inc. (a) (b) | | 56,740 | | | 1,430,415 |
| | | | | |
| | | | | 5,697,677 |
| | | | | |
| | |
Energy Equipment & Services—0.5% | | | | | |
National Oilwell Varco, Inc. (a) | | 44,820 | | | 1,095,401 |
| | | | | |
| | |
Food & Staples Retailing—3.9% | | | | | |
Wal-Mart Stores, Inc. | | 163,840 | | | 9,184,870 |
| | | | | |
| | |
Food Products—3.0% | | | | | |
Kellogg Co. | | 73,930 | | | 3,241,830 |
Kraft Foods, Inc. (Class A) | | 83,450 | | | 2,240,633 |
Tyson Foods, Inc. (Class A) (b) | | 173,750 | | | 1,522,050 |
| | | | | |
| | | | | 7,004,513 |
| | | | | |
| | |
Health Care Equipment & Supplies—1.8% | | | | | |
Baxter International, Inc. | | 57,090 | | | 3,059,453 |
Hospira, Inc. (a) (b) | | 39,780 | | | 1,066,900 |
| | | | | |
| | | | | 4,126,353 |
| | | | | |
| | |
Health Care Providers & Services—3.3% | | | | | |
Express Scripts, Inc. (a) | | 28,490 | | | 1,566,380 |
Medco Health Solutions, Inc. (a) | | 28,370 | | | 1,188,987 |
WellPoint, Inc. (a) | | 120,160 | | | 5,062,341 |
| | | | | |
| | | | | 7,817,708 |
| | | | | |
| | |
Hotels, Restaurants & Leisure—4.5% | | | | | |
Burger King Holdings, Inc. (b) | | 57,657 | | | 1,376,849 |
McDonald’s Corp. | | 146,740 | | | 9,125,761 |
| | | | | |
| | | | | 10,502,610 |
| | | | | |
|
Household Products—0.5% |
Procter & Gamble Co. | | 19,400 | | | 1,199,308 |
| | | | | |
|
Insurance—1.2% |
Assurant, Inc. | | 58,840 | | | 1,765,200 |
The Chubb Corp. | | 22,170 | | | 1,130,670 |
| | | | | |
| | | | | 2,895,870 |
| | | | | |
*See accompanying notes to financial statements.
MSF-5
Metropolitan Series Fund, Inc.
FI Large Cap Portfolio
Schedule of Investments as of December 31, 2008
Common Stock—(Continued)
| | | | | |
| Security Description | | Shares | | Value* |
| | | | | |
|
Internet Software & Services—4.8% |
Google, Inc. (Class A) (a) | | 36,360 | | $ | 11,186,154 |
| | | | | |
|
IT Services—0.5% |
Cognizant Technology Solutions Corp.
(Class A) (a) (b) | | 69,350 | | | 1,252,461 |
| | | | | |
|
Machinery—3.6% |
AGCO Corp. (a) | | 33,170 | | | 782,480 |
Bucyrus International, Inc. (b) | | 59,690 | | | 1,105,459 |
Cummins, Inc. (b) | | 60,570 | | | 1,619,036 |
Ingersoll-Rand Co., Ltd. (Class A) | | 124,300 | | | 2,156,605 |
Joy Global, Inc. (b) | | 48,400 | | | 1,107,876 |
The Manitowoc Co., Inc. | | 193,620 | | | 1,676,749 |
| | | | | |
| | | | | 8,448,205 |
| | | | | |
|
Metals & Mining—1.3% |
Nucor Corp. (b) | | 63,510 | | | 2,934,162 |
| | | | | |
|
Multi-Utilities—0.5% |
MDU Resources Group, Inc. | | 57,170 | | | 1,233,729 |
| | | | | |
|
Oil, Gas & Consumable Fuels—6.9% |
Apache Corp. | | 65,550 | | | 4,885,442 |
Chesapeake Energy Corp. (b) | | 155,830 | | | 2,519,771 |
ConocoPhillips | | 48,585 | | | 2,516,703 |
Pioneer Natural Resources Co. (b) | | 119,100 | | | 1,927,038 |
Southwestern Energy Co. (a) (b) | | 42,220 | | | 1,223,113 |
St. Mary Land & Exploration Co. (b) | | 150,110 | | | 3,048,734 |
| | | | | |
| | | | | 16,120,801 |
| | | | | |
|
Pharmaceuticals—6.3% |
Allergan, Inc. | | 37,890 | | | 1,527,725 |
Bristol-Myers Squibb Co. | | 306,920 | | | 7,135,890 |
Johnson & Johnson | | 57,130 | | | 3,418,088 |
Mylan, Inc. (a) (b) | | 118,390 | | | 1,170,877 |
Schering-Plough Corp. | | 87,530 | | | 1,490,636 |
| | | | | |
| | | | | 14,743,216 |
| | | | | |
|
Road & Rail—2.0% |
Union Pacific Corp. (b) | | 96,910 | | | 4,632,298 |
| | | | | |
|
Semiconductors & Semiconductor Equipment—0.5% |
Xilinx, Inc. (b) | | 69,580 | | | 1,239,916 |
| | | | | |
|
Software—9.4% |
BMC Software, Inc. (a) | | 59,800 | | | 1,609,218 |
Macrovision Solutions Corp. (a) (b) | | 96,540 | | | 1,221,231 |
McAfee, Inc. (a) (b) | | 56,800 | | | 1,963,576 |
Microsoft Corp. | | 396,710 | | | 7,712,042 |
Nuance Communications, Inc. (a) (b) | | 100,420 | | | 1,040,351 |
Oracle Corp. (a) (b) | | 407,960 | | | 7,233,131 |
Symantec Corp. (a) | | 80,050 | | | 1,082,276 |
| | | | | |
| | | | | 21,861,825 |
| | | | | |
| | | | | | | |
| Security Description | | Shares | | Value* | |
| | | | | | | |
|
Specialty Retail—3.0% | |
Abercrombie & Fitch Co. (Class A) (b) | | | 41,920 | | $ | 967,094 | |
Best Buy Co., Inc. (b) | | | 43,320 | | | 1,217,725 | |
Lowe’s Cos., Inc. | | | 221,680 | | | 4,770,554 | |
| | | | | | | |
| | | | | | 6,955,373 | |
| | | | | | | |
|
Tobacco—2.8% | |
Lorillard, Inc. | | | 66,910 | | | 3,770,378 | |
Philip Morris International, Inc. | | | 61,200 | | | 2,662,812 | |
| | | | | | | |
| | | | | | 6,433,190 | |
| | | | | | | |
|
Wireless Telecommunication Services—0.6% | |
NII Holdings, Inc. (a) | | | 76,550 | | | 1,391,679 | |
| | | | | | | |
Total Common Stock
(Identified Cost $305,553,102) | | | | | | 232,255,872 | |
| | | | | | | |
|
| Short Term Investments—12.1% | |
| Security Description | | Shares/Face
Amount | | Value* | |
|
Mutual Funds—12.0% | |
State Street Navigator Securities Lending Prime Portfolio (c) | | | 27,940,611 | | | 27,940,611 | |
| | | | | | | |
|
Repurchase Agreement—0.1% | |
State Street Repurchase Agreement dated 12/31/08 at 0.010% to be repurchased at $289,000 on 01/02/09, collateralized by $295,000 U.S. Treasury Bill due 02/19/09 with a value of $295,000. | | $ | 289,000 | | | 289,000 | |
| | | | | | | |
Total Short Term Investments
(Identified Cost $28,229,611) | | | | | | 28,229,611 | |
| | | | | | | |
Total Investments—111.5%
(Identified Cost $333,782,713) (d) | | | | | | 260,485,483 | |
Liabilities in excess of other assets | | | | | | (26,911,715 | ) |
| | | | | | | |
| Total Net Assets—100% | | | | | $ | 233,573,768 | |
| | | | | | | |
| (b) | A portion or all of the security was on loan. As of December 31, 2008, the market value of securities loaned was $ 27,828,516 and the collateral received consisted of cash in the amount of $ 27,940,611. The cash collateral is invested in a money market fund managed by an affiliate of the custodian. |
| (c) | Represents investment of cash collateral received from securities lending transactions. |
| (d) | The aggregate cost of investments for federal income tax purposes as of December 31, 2008 was $341,173,545 and the composition of unrealized appreciation and depreciation of investment securities was $6,062,429 and $(86,750,491), respectively. |
*See accompanying notes to financial statements.
MSF-6
Metropolitan Series Fund, Inc.
FI Large Cap Portfolio
The Portfolio adopted the provisions of Statement of Financial Accounting Standards No. 157, “Fair Value Measurements” (FAS 157), effective with the beginning of the Portfolio’s fiscal year. FAS 157 establishes a framework for measuring fair value and expands disclosures about fair value measurements in financial statements. The three levels of the hierarchy under FAS 157 are described below:
Level 1 - quoted prices in active markets for identical securities
Level 2 - other significant observable inputs (including quoted prices for similar securities, interest rates, credit risk, etc.)
Level 3 - significant unobservable inputs (including the Portfolio’s own assumptions in determining the fair value of investments)
The inputs or methodology used for valuing securities are not necessarily an indication of the risk associated with investing in those securities.
The following is a summary of the inputs used to value the Portfolio’s net assets as of December 31, 2008:
| | | | | | |
| Valuation Inputs | | Investments In
Securities | | Other Financial
Instruments* |
Level 1 - Quoted Prices | | $ | 260,196,483 | | $ | 0 |
Level 2 - Other Significant Observable Inputs | | | 289,000 | | | 0 |
Level 3 - Significant Unobservable Inputs | | | 0 | | | 0 |
Total | | $ | 260,485,483 | | $ | 0 |
* Other financial instruments are derivative instruments not reflected in the Schedule of Investments, such as futures, forwards, swap contracts and written options, which are valued based on the unrealized appreciation/depreciation on the instrument.
MSF-7
Metropolitan Series Fund, Inc.
FI Large Cap Portfolio
Statement of Assets & Liabilities
December 31, 2008
| | | | | | | |
Assets | | | | | | | |
Investments at value (a) (b) | | | | | $ | 260,485,483 | |
Cash | | | | | | 706 | |
Foreign cash at value (c) | | | | | | 115,824 | |
Receivable for: | | | | | | | |
Securities sold | | | | | | 985,705 | |
Fund shares sold | | | | | | 112,554 | |
Accrued interest and dividends | | | | | | 371,388 | |
Foreign taxes | | | | | | 7,805 | |
| | | | | | | |
Total Assets | | | | | | 262,079,465 | |
Liabilities | | | | | | | |
Payable for: | | | | | | | |
Fund shares redeemed | | $ | 374,668 | | | | |
Collateral for securities loaned | | | 27,940,611 | | | | |
Accrued expenses: | | | | | | | |
Management fees | | | 153,282 | | | | |
Service and distribution fees | | | 1,232 | | | | |
Other expenses | | | 35,904 | | | | |
| | | | | | | |
Total Liabilities | | | | | | 28,505,697 | |
| | | | | | | |
Net Assets | | | | | $ | 233,573,768 | |
| | | | | | | |
Net assets consists of: | | | | | | | |
Capital paid in | | | | | $ | 453,414,332 | |
Undistributed net investment income | | | | | | 1,219,901 | |
Accumulated net realized losses | | | | | | (147,758,747 | ) |
Unrealized depreciation on investments and foreign currency | | | | | | (73,301,718 | ) |
| | | | | | | |
Net Assets | | | | | $ | 233,573,768 | |
| | | | | | | |
| Computation of offering price: | | | | | | | |
Class A | | | | | | | |
Net asset value and redemption price per share ($226,809,722 divided by 28,037,746 shares outstanding) | | | | | $ | 8.09 | |
| | | | | | | |
Class B | | | | | | | |
Net asset value and redemption price per share ($5,604,964 divided by 699,646 shares outstanding) | | | | | $ | 8.01 | |
| | | | | | | |
Class E | | | | | | | |
Net asset value and redemption price per share ($1,159,082 divided by 143,844 shares outstanding) | | | | | $ | 8.06 | |
| | | | | | | |
(a) Identified cost of investments | | | | | $ | 333,782,713 | |
| | | | | | | |
(b) Includes cash collateral for securities loaned of | | | | | $ | 27,940,611 | |
| | | | | | | |
(c) Identified cost of foreign cash | | | | | $ | 122,288 | |
| | | | | | | |
Statement of Operations
For the Year Ended December 31, 2008
| | | | | | | | |
Investment Income | | | | | | | | |
Dividends | | | | | | $ | 4,197,330 | |
Interest | | | | | | | 275,632 | (a) |
| | | | | | | | |
| | | | | | | 4,472,962 | |
Expenses | | | | | | | | |
Management fees | | $ | 2,838,880 | | | | | |
Service and distribution fees—Class B | | | 14,841 | | | | | |
Service and distribution fees—Class E | | | 2,246 | | | | | |
Directors’ fees and expenses | | | 31,907 | | | | | |
Custodian | | | 60,241 | | | | | |
Audit and tax services | | | 39,191 | | | | | |
Legal | | | 81,050 | | | | | |
Printing | | | 158,610 | | | | | |
Insurance | | | 5,711 | | | | | |
Miscellaneous | | | 20,060 | | | | | |
| | | | | | | | |
Total expenses | | | | | | | 3,252,737 | |
| | | | | | | | |
Net Investment Income | | | | | | | 1,220,225 | |
| | | | | | | | |
Realized and Unrealized Loss | | | | | | | | |
| Realized loss on: | | | | | | | | |
Investments—net | | | | | | | (125,543,594 | ) |
| Change in unrealized depreciation on: | | | | | | | | |
Investments—net | | | (80,356,917 | ) | | | | |
Foreign currency transactions—net | | | (1,305 | ) | | | (80,358,222 | ) |
| | | | | | | | |
Net loss | | | | | | | (205,901,816 | ) |
| | | | | | | | |
Net Decrease in Net Assets From Operations | | | | | | $ | (204,681,591 | ) |
| | | | | | | | |
| (a) | Includes income on securities loaned of $241,239. |
See accompanying notes to financial statements.
MSF-8
Metropolitan Series Fund, Inc.
FI Large Cap Portfolio
Statements of Changes in Net Assets
| | | | | | | | |
| | | Year ended
December 31,
2008 | | | Year ended
December 31,
2007 | |
From Operations | | | | | | | | |
Net investment income (loss) | | $ | 1,220,225 | | | $ | (141,516 | ) |
Net realized gain (loss) | | | (125,543,594 | ) | | | 14,209,804 | |
Change in unrealized appreciation (depreciation) | | | (80,358,222 | ) | | | 8,662,309 | |
| | | | | | | | |
Increase (decrease) in net assets from operations | | | (204,681,591 | ) | | | 22,730,597 | |
| | | | | | | | |
From Distributions to Shareholders | | | | | | | | |
Net investment income | | | | | | | | |
Class A | | | 0 | | | | (809,614 | ) |
Class E | | | 0 | | | | (684 | ) |
| | | | | | | | |
| | | 0 | | | | (810,298 | ) |
| | | | | | | | |
Net realized gain | | | | | | | | |
Class A | | | 0 | | | | (23,034,977 | ) |
Class B | | | 0 | | | | (156,563 | ) |
Class E | | | 0 | | | | (48,662 | ) |
| | | | | | | | |
| | | 0 | | | | (23,240,202 | ) |
| | | | | | | | |
Tax return of capital | | | | | | | | |
Class A | | | 0 | | | | (14,880,350 | ) |
Class B | | | 0 | | | | (98,757 | ) |
Class E | | | 0 | | | | (30,991 | ) |
| | | | | | | | |
| | | 0 | | | | (15,010,098 | ) |
| | | | | | | | |
Total distributions | | | 0 | | | | (39,060,598 | ) |
| | | | | | | | |
Decrease in net assets from capital share transactions | | | (59,965,167 | ) | | | (77,075,870 | ) |
| | | | | | | | |
Net decrease in net assets | | | (264,646,758 | ) | | | (93,405,871 | ) |
| | |
Net Assets | | | | | | | | |
Beginning of the period | | | 498,220,526 | | | | 591,626,397 | |
| | | | | | | | |
End of the period | | $ | 233,573,768 | | | $ | 498,220,526 | |
| | | | | | | | |
Undistributed Net Investment Income | | | | | | | | |
End of the period | | $ | 1,219,901 | | | $ | 0 | |
| | | | | | | | |
Other Information:
Capital Shares
Transactions in capital shares were as follows:
| | | | | | | | | | | | | | |
| | | Year ended
December 31, 2008 | | | Year ended
December 31, 2007 | |
| | | Shares | | | $ | | | Shares | | | $ | |
Class A | | | | | | | | | | | | | | |
Sales | | 1,920,599 | | | $ | 21,356,194 | | | 982,880 | | | $ | 14,622,824 | |
Reinvestments | | 0 | | | | 0 | | | 2,627,066 | | | | 38,722,956 | |
Redemptions | | (7,357,645 | ) | | | (84,788,459 | ) | | (9,041,192 | ) | | | (134,743,307 | ) |
| | | | | | | | | | | | | | |
Net decrease | | (5,437,046 | ) | | $ | (63,432,265 | ) | | (5,431,246 | ) | | $ | (81,397,527 | ) |
| | | | | | | | | | | | | | |
Class B | | | | | | | | | | | | | | |
Sales | | 414,592 | | | $ | 4,531,250 | | | 369,937 | | | $ | 5,486,910 | |
Reinvestments | | 0 | | | | 0 | | | 17,530 | | | | 256,994 | |
Redemptions | | (126,460 | ) | | | (1,428,057 | ) | | (143,296 | ) | | | (2,124,761 | ) |
| | | | | | | | | | | | | | |
Net increase | | 288,132 | | | $ | 3,103,193 | | | 244,171 | | | $ | 3,619,143 | |
| | | | | | | | | | | | | | |
Class E | | | | | | | | | | | | | | |
Sales | | 187,109 | | | $ | 2,110,334 | | | 162,105 | | | $ | 2,414,931 | |
Reinvestments | | 0 | | | | 0 | | | 5,479 | | | | 80,648 | |
Redemptions | | (153,814 | ) | | | (1,746,429 | ) | | (121,278 | ) | | | (1,793,065 | ) |
| | | | | | | | | | | | | | |
Net increase | | 33,295 | | | $ | 363,905 | | | 46,306 | | | $ | 702,514 | |
| | | | | | | | | | | | | | |
Decrease derived from capital share transactions | | | | | $ | (59,965,167 | ) | | | | | $ | (77,075,870 | ) |
| | | | | | | | | | | | | | |
See accompanying notes to financial statements.
MSF-9
Metropolitan Series Fund, Inc.
FI Large Cap Portfolio
Financial Highlights
| | | | | | | | | | | | | | | | | | | |
| | | Class A | |
| | | Year ended December 31, | |
| | | 2008 | | | 2007 | | | 2006 | | | 2005 | | 2004(a) | |
Net Asset Value, Beginning of Period | | $ | 14.66 | | | $ | 15.12 | | | $ | 15.15 | | | $ | 13.93 | | $ | 13.18 | |
| | | | | | | | | | | | | | | | | | | |
Income From Investment Operations | | | | | | | | | | | | | | | | | | | |
Net investment income | | | 0.04 | (b) | | | 0.00 | (b) | | | 0.08 | | | | 0.02 | | | 0.10 | |
Net realized and unrealized gain (loss) of investments | | | (6.61 | ) | | | 0.61 | | | | 0.82 | | | | 1.20 | | | 0.76 | |
| | | | | | | | | | | | | | | | | | | |
Total from investment operations | | | (6.57 | ) | | | 0.61 | | | | 0.90 | | | | 1.22 | | | 0.86 | |
| | | | | | | | | | | | | | | | | | | |
Less Distributions | | | | | | | | | | | | | | | | | | | |
Distributions from net investment income | | | 0.00 | | | | (0.03 | ) | | | (0.07 | ) | | | 0.00 | | | (0.11 | ) |
Distributions from net realized capital gains | | | 0.00 | | | | (0.63 | ) | | | (0.86 | ) | | | 0.00 | | | 0.00 | |
Distributions from Tax return of capital | | | 0.00 | | | | (0.41 | ) | | | 0.00 | | | | 0.00 | | | 0.00 | |
| | | | | | | | | | | | | | | | | | | |
Total distributions | | | 0.00 | | | | (1.07 | ) | | | (0.93 | ) | | | 0.00 | | | (0.11 | ) |
| | | | | | | | | | | | | | | | | | | |
Net Asset Value, End of Period | | $ | 8.09 | | | $ | 14.66 | | | $ | 15.12 | | | $ | 15.15 | | $ | 13.93 | |
| | | | | | | | | | | | | | | | | | | |
Total Return (%) | | | (44.8 | ) | | | 3.9 | | | | 6.1 | | | | 8.7 | | | 6.5 | |
Ratio of operating expenses to average net assets before expense reductions (%) | | | 0.89 | | | | 0.84 | | | | 0.85 | | | | 0.86 | | | 0.86 | (c) |
Ratio of operating expenses to average net assets after expense reductions (%) (d) | | | N/A | | | | 0.84 | | | | 0.84 | | | | 0.86 | | | 0.86 | |
Ratio of net investment income (loss) to average net assets (%) | | | 0.34 | | | | (0.02 | ) | | | 0.37 | | | | 0.11 | | | 0.81 | |
Portfolio turnover rate (%) | | | 302 | | | | 250 | | | | 245 | | | | 217 | | | 56 | |
Net assets, end of period (000) | | $ | 226,810 | | | $ | 490,617 | | | $ | 588,143 | | | $ | 265,860 | | $ | 268,160 | |
| | | | | | | | | | | | |
| | | Class B | |
| | | Year ended December 31, | |
| | | 2008 | | | 2007 | | | 2006(e) | |
Net Asset Value, Beginning of Period | | $ | 14.55 | | | $ | 15.02 | | | $ | 14.68 | |
| | | | | | | | | | | | |
Income From Investment Operations | | | | | | | | | | | | |
Net investment income (loss) | | | 0.02 | (b) | | | (0.03 | )(b) | | | (0.01 | ) |
Net realized and unrealized gain (loss) of investments | | | (6.56 | ) | | | 0.60 | | | | 0.35 | |
| | | | | | | | | | | | |
Total from investment operations | | | (6.54 | ) | | | 0.57 | | | | 0.34 | |
| | | | | | | | | | | | |
Less Distributions | | | | | | | | | | | | |
Distributions from net realized capital gains | | | 0.00 | | | | (0.63 | ) | | | 0.00 | |
Distributions from Tax return of capital | | | 0.00 | | | | (0.41 | ) | | | 0.00 | |
| | | | | | | | �� | | | | |
Total distributions | | | 0.00 | | | | (1.04 | ) | | | 0.00 | |
| | | | | | | | | | | | |
Net Asset Value, End of Period | | $ | 8.01 | | | $ | 14.55 | | | $ | 15.02 | |
| | | | | | | | | | | | |
Total Return (%) | | | (44.9 | ) | | | 3.7 | | | | 2.3 | (f) |
Ratio of operating expenses to average net assets before expense reductions (%) | | | 1.14 | | | | 1.09 | | | | 1.10 | (g) |
Ratio of operating expenses to average net assets after expense reductions (%) (d) | | | N/A | | | | 1.09 | | | | 1.09 | (g) |
Ratio of net investment income (loss) to average net assets (%) | | | 0.15 | | | | (0.24 | ) | | | (0.13 | )(g) |
Portfolio turnover rate (%) | | | 302 | | | | 250 | | | | 245 | |
Net assets, end of period (000) | | $ | 5,605 | | | $ | 5,987 | | | $ | 2,514 | |
| Please | see following page for Financial Highlights footnote legend. |
See accompanying notes to financial statements.
MSF-10
Metropolitan Series Fund, Inc.
FI Large Cap Portfolio
Financial Highlights
| | | | | | | | | | | | |
| | | Class E | |
| | | Year ended
December 31, | |
| | | 2008 | | | 2007 | | | 2006(e) | |
Net Asset Value, Beginning of Period | | $ | 14.62 | | | $ | 15.09 | | | $ | 14.74 | |
| | | | | | | | | | | | |
Income From Investment Operations | | | | | | | | | | | | |
Net investment income (loss) | | | 0.02 | (b) | | | (0.02 | )(b) | | | (0.00 | )(h) |
Net realized and unrealized gain (loss) of investments | | | (6.58 | ) | | | 0.60 | | | | 0.35 | |
| | | | | | | | | | | | |
Total from investment operations | | | (6.56 | ) | | | 0.58 | | | | 0.35 | |
| | | | | | | | | | | | |
Less Distributions | | | | | | | | | | | | |
Distributions from net investment income | | | 0.00 | | | | (0.01 | ) | | | 0.00 | |
Distributions from net realized capital gains | | | 0.00 | | | | (0.63 | ) | | | 0.00 | |
Distributions from Tax return of capital | | | 0.00 | | | | (0.41 | ) | | | 0.00 | |
| | | | | | | | | | | | |
Total distributions | | | 0.00 | | | | (1.05 | ) | | | 0.00 | |
| | | | | | | | | | | | |
Net Asset Value, End of Period | | $ | 8.06 | | | $ | 14.62 | | | $ | 15.09 | |
| | | | | | | | | | | | |
Total Return (%) | | | (44.9 | ) | | | 3.8 | | | | 2.4 | (f) |
Ratio of operating expenses to average net assets before expense reductions (%) | | | 1.04 | | | | 0.99 | | | | 1.00 | (g) |
Ratio of operating expenses to average net assets after expense reductions (%) (d) | | | N/A | | | | 0.99 | | | | 0.99 | (g) |
Ratio of net investment income (loss) to average net assets (%) | | | 0.21 | | | | (0.15 | ) | | | (0.02 | )(g) |
Portfolio turnover rate (%) | | | 302 | | | | 250 | | | | 245 | |
Net assets, end of period (000) | | $ | 1,159 | | | $ | 1,616 | | | $ | 969 | |
| (a) | Audited by other Independent Registered Public Accounting Firm. |
| (b) | Per share amount is based on average shares outstanding during the period. |
| (c) | The investment manager waived a portion of its management fee for the year. |
| (d) | The Portfolio has entered into arrangements with certain brokers who paid a portion of the Portfolio’s expenses. |
| (e) | Commencement of operations was May 2, 2006 for Classes B and E. |
| (f) | Periods less than one year are not computed on an annualized basis. |
| (g) | Computed on an annualized basis. |
| (h) | Net investment loss per share was less than $(0.01). |
See accompanying notes to financial statements.
MSF-11
Metropolitan Series Fund, Inc.
FI Large Cap Portfolio
Notes to Financial Statements—December 31, 2008
Metropolitan Series Fund, Inc. (the “Fund”) is organized as a corporation under the laws of Maryland pursuant to Articles of Incorporation filed on November 23, 1982, as amended, and registered under the Investment Company Act of 1940, as amended (the “1940 Act”), as an open-end investment company. The Fund is a “series” type of mutual fund, which issues separate series of stock. Each series represents an interest in a separate portfolio of Fund investments. The FI Large Cap Portfolio (the “Portfolio”) is a diversified series of the Fund. Shares in the Fund are not offered directly to the general public and are currently available only to separate accounts established by Metropolitan Life Insurance Company (“MetLife”), New England Life Insurance Company, General American Life Insurance Company (“General American”), The MetLife Investors Group of Insurance Companies, MetLife Insurance Company of Connecticut and other affiliated insurance companies (collectively, the “Insurance Companies”) and to certain eligible qualified retirement plans (“Qualified Plans”), as an investment vehicle for variable life insurance, group annuity or variable annuity products of these insurance companies or Qualified Plans, although the Portfolio is not available to all such separate accounts and Qualified Plans. The Portfolio’s shares may be divided into three different classes. Currently, the classes being offered by the Portfolio are named Class A, Class B and Class E. The classes of the Portfolio’s shares are identical, except that certain additional charges (Rule 12b-1 fees) are made against Class B and Class E shares. Investment income, realized and unrealized capital gains and losses, the common expenses of the Portfolio and certain Portfolio-level expense reductions, if any, are allocated daily, on a pro rata basis, to each class based on the relative net assets of each class to the total net assets of the Portfolio.
| 2. | SIGNIFICANT ACCOUNTING POLICIES: |
The preparation of financial statements in conformity with accounting principles generally accepted in the United States of America (“GAAP”) requires management to make estimates and assumptions that affect the reported amounts of assets and liabilities and disclosure of contingent assets and liabilities as of the date of the financial statements and the reported amounts of income and expenses during the reporting period. Actual results could differ from those estimates.
The following is a summary of significant accounting policies consistently followed by the Portfolio in the preparation of its financial statements. The policies are in conformity with GAAP.
Investment Valuation:
Debt securities (other than short term obligations with a remaining maturity of sixty days or less) are generally valued on the basis of evaluated or composite bid quotations obtained by independent pricing services and/or brokers and dealers selected by the relevant subadviser pursuant to authorization of the Board of Directors of the Fund (the “Board” or “Directors”). Such quotations take into account appropriate factors such as institutional-sized trading in similar groups of securities, yield, quality, coupon rate, maturity, type of issue, trading characteristics and other data. Short term obligations with a remaining maturity of sixty days or less are valued at amortized cost which approximates fair market value.
Equity securities traded on a national securities exchange or other exchanges are valued at their last sale price on the principal trading market. Equity securities traded on the NASDAQ National Market System are valued at the NASDAQ Official Closing Price (the “NOCP”). The NOCP is the last reported sale price if the last reported sale price falls between the spread of the last reported bid and asked prices. If the last reported bid and asked prices are above the last reported sale price, the NOCP will be the last reported bid price. If the last reported bid and asked prices are below the last reported sale price, the NOCP will be the last reported asked price. Equity securities traded on a national securities exchange or other exchanges or on the NASDAQ National Market System for which there is no reported sale during the day are valued at the last reported bid price. A security that is listed or traded on more than one exchange is valued at the quotation on the exchange determined to be the primary market for that security by the Board or its delegates. If no closing price is available, then such securities are valued by using the last reported bid price. Equity securities traded over-the-counter are valued at the last reported sales price.
If no current market value quotation is readily available or reliable for a portfolio security, fair value will be determined in accordance with procedures established by and under the general supervision of the Board. When the Portfolio uses fair value pricing, it may take into account any factors it deems appropriate. The value of securities used by the Portfolio to calculate its net asset value may differ from quoted or published prices for the same securities. Fair value pricing involves subjective judgments and the fair value determined for a security may be materially different than the value that could be realized upon the sale of that security.
MSF-12
Metropolitan Series Fund, Inc.
FI Large Cap Portfolio
Notes to Financial Statements—December 31, 2008—(Continued)
The Portfolio expects to use fair value pricing for securities primarily traded on U.S. exchanges only under very limited circumstances. For example, the Portfolio may use fair value pricing if the exchange on which a security is traded closes early or trading in the security is suspended.
Securities traded primarily on an exchange outside of the United States which closes before the close of the New York Stock Exchange will be valued at the last sales price on that non-U.S. exchange. Securities traded primarily on an exchange outside of the United States for which there is no reported sale during the day are valued at the mean between the last reported bid and asked prices. However, because most foreign markets close well before the Portfolio values its securities (typically at 4 p.m. Eastern Time), the earlier close of these foreign markets gives rise to the possibility that significant events, including broad market moves, may have occurred after these foreign markets close but before the Portfolio values its securities. To account for this, the Portfolio may frequently value many of its foreign equity securities using fair value prices based on third party vendor modeling tools.
Forward foreign currency exchange contracts are valued based on the mean between closing bid and asked prices of the forward currency contract rates in the London foreign exchange markets on a daily basis as provided by a reliable bank or dealer.
Options, whether on securities, indices, futures contracts, or otherwise, are valued at the last sales price available as of the close of business on the day of valuation or, if there is no such sale price available, at the mean between the bid and asked prices. Options on currencies are valued at the spot price each day.
The value of futures contracts will be the sum of the margin deposit plus or minus the difference between the value of the futures contract on each day the net asset value is calculated and the value on the date the futures contract originated, value being that established on a recognized commodity exchange, or by reference to other customary sources, with gain or loss being realized when the futures contract closes or expires.
Subject to the Board’s oversight, the Board has delegated the day-to-day oversight of pricing matters, including determinations in good faith under the Fund’s procedures the fair value of securities for which current market quotations are not readily available to MetLife Advisers, LLC (“MetLife Advisers” or the “Adviser”).
Investment Transactions and Related Investment Income:
Portfolio security transactions are recorded on the trade date. Dividend income is recorded on the ex-dividend date or, for certain foreign securities, when notified. Interest income, which includes amortization of premium and accretion of discount on debt securities, is recorded on the accrual basis. Realized gains and losses on investments and unrealized appreciation and depreciation are determined on the identified cost basis, which is the same basis used for federal income tax purposes.
Repurchase Agreements:
The Portfolio, through the custodian or a subcustodian, receives delivery of the underlying securities collateralizing repurchase agreements. The Portfolio requires the custodian to take possession, to have legally segregated in the Federal Reserve Book Entry System, or to have segregated within the custodian’s vault, all securities held as collateral for repurchase agreements. It is the Portfolio’s policy that the market value of the collateral be at least equal to 100% of the repurchase price in the case of a repurchase agreement of one-day duration and 102% on all other repurchase agreements. The Portfolio’s subadviser is responsible for determining that the value of the collateral is at all times at least equal to the repurchase price. In connection with transactions in repurchase agreements, if the seller defaults and the value of the collateral declines or if the seller enters an insolvency proceeding, realization of the collateral by the Portfolio may be delayed, limited or wholly denied.
Foreign Currency Translation:
The books and records of the Portfolio are maintained in U.S. dollars. The values of securities, currencies and other assets and liabilities denominated in currencies other than U.S. dollars are translated into U.S. dollars based upon foreign exchange rates prevailing at the end of the period. Purchases and sales of investment securities, income and expenses are translated on the respective dates of such transactions. Since the values of investment securities are presented at the foreign exchange rates prevailing at the end of the period, it is not practical to isolate that portion of the results of operations arising from changes in exchange rates from that portion of the results of operations reflecting fluctuations arising from changes in market prices of the investment securities. Such fluctuations are included in the net realized and unrealized gain or loss on investments.
MSF-13
Metropolitan Series Fund, Inc.
FI Large Cap Portfolio
Notes to Financial Statements—December 31, 2008—(Continued)
Net realized foreign exchange gains or losses arise from sales of foreign currency, currency gains or losses realized between the trade and settlement dates on securities transactions, and the difference between the amounts of dividends, interest, and foreign withholding taxes recorded by the Portfolio and the U.S. dollar equivalent of the amounts actually received or paid by the Portfolio. Net unrealized foreign exchange gains and losses arise from changes in the value of assets and liabilities, other than investment securities, resulting from changes in the exchange rate.
Forward Foreign Currency Exchange Contracts:
The Portfolio may enter into forward foreign currency exchange contracts primarily to hedge against foreign currency exchange rate risks on its non-U.S. dollar denominated investment securities. When entering into a forward currency contract, the Portfolio agrees to receive or deliver a fixed quantity of foreign currency for an agreed-upon price on an agreed future date. These contracts are valued daily and the Portfolio’s net equity therein, representing unrealized gain or loss on the contracts as measured by the difference between the foreign exchange rates at the dates of entry into the contracts and the forward rates at the settlement date, is included in the Statement of Assets and Liabilities. Realized and unrealized gains and losses are included in the Statement of Operations. These instruments involve market and/or credit risk in excess of the amount recognized in the Statement of Assets and Liabilities. Risks arise from the possible inability of counterparties to meet the terms of their contracts and from movement in currency and securities values and interest rates.
Futures Contracts:
The Portfolio may buy and sell futures contracts (on recognized exchanges) as a hedge, to maintain exposure to the broad equity markets or to enhance return. Futures contracts are agreements to buy or sell a security, or deliver a final cash settlement price in connection with an index, interest rate, currency, or other contracts not calling for physical delivery, for a set price in the future. The Portfolio must post an amount equal to a portion of the total market value of the futures contract as futures variation margin, which is returned when the Portfolio’s obligations under the contract have been satisfied. From time to time thereafter, the Portfolio may have to post variation margin to maintain this amount as the market value of the contract fluctuates. Risks of entering into futures contracts (and related options) include the possibility that there may be an illiquid market and that a change in the value of the contract or option may not correlate with changes in the value of the underlying securities.
Options:
The Portfolio may use options to hedge against changes in values of securities the Portfolio owns or expects to purchase, to maintain exposure to the broad equity markets or to enhance return. Writing puts or buying calls tends to increase the Portfolio’s exposure to the underlying instrument and writing calls or buying puts tends to decrease the Portfolio’s exposure to the underlying instrument, and can be used to hedge other Portfolio investments. For options purchased to hedge the Portfolio’s investments, the potential risk to the Portfolio is that the change in value of options contracts may not correspond to the change in value of the hedged instruments. In addition, losses may arise from changes in the value of the underlying instruments, if there is an illiquid secondary market, or if the counterparty is unable to perform. The maximum loss for purchased options is limited to the premium initially paid for the option. For options written by the Portfolio, the maximum loss is not limited to the premium initially received for the option.
The main risk associated with purchasing an option is that the option expires without being exercised. In this case, the option expires worthless and the premium paid for the option is considered the loss. The risk associated with writing a call option is that the Portfolio may forgo the opportunity for a profit if the market value of the underlying position increases and the option is exercised. The risk in writing a put option is that the Portfolio may incur a loss if the market value of the underlying position decreases and the option is exercised. In addition, the Portfolio risks not being able to enter into a closing transaction for the written option as the result of an illiquid market.
“When-Issued” Securities:
Purchasing securities “when-issued” is a forward commitment by the Portfolio to buy a security. The estimated amount of the Portfolio’s payment obligation and the security’s interest rate are determined when the commitment is made, even though no interest accrues until the security is issued, which is generally 15 to 120 days later. The Portfolio will segregate liquid assets with its custodian sufficient at all times to satisfy these commitments. If the value of the security is less when delivered than when the commitment was made, the Portfolio will suffer a loss.
MSF-14
Metropolitan Series Fund, Inc.
FI Large Cap Portfolio
Notes to Financial Statements—December 31, 2008—(Continued)
Federal Income Taxes:
It is the Portfolio’s policy to comply with the requirements of the Internal Revenue Code of 1986, as amended (the “Code”), and regulations thereunder, applicable to regulated investment companies and to distribute, with respect to each taxable year, all of its taxable income to shareholders. Therefore, no federal income tax provision is required. The Portfolio is subject to the provisions of the Financial Accounting Standards Board Interpretation (“FASB”) No. 48, Accounting for Uncertainties in Income Taxes (FIN 48). FIN 48 sets forth a minimum threshold for financial statement recognition of the benefit of a tax position taken or expected to be taken in a tax return. The implementation of FIN 48 did not result in any unrecognized tax benefits in the accompanying financial statements. Each of the Portfolio’s federal tax returns for the prior three fiscal years remains subject to examination by the Internal Revenue Service.
As of December 31, 2008, the Portfolio had capital loss carryforwards as follows:
| | | | | | | |
Expiring
12/31/09 | | Expiring
12/31/16 | | Total |
| $ | 14,415,260 | | $ | 96,840,232 | | $ | 111,255,492 |
The utilization of the capital loss carryforward acquired as part of a merger may be limited under section 382 of the Code.
Pursuant to Section 852 of the Code, the Portfolio designated the amount shown below under Long Term Gain as capital gain dividends for its taxable year ended December 31, 2008. The tax character of distributions paid for the periods ended December 31, 2008 and 2007 was as follows:
| | | | | | | | | | | | | | | | | | | | | | |
| Ordinary Income | | Long Term Gain | | Return of Capital | | Total |
| 2008 | | 2007 | | 2008 | | 2007 | | 2008 | | 2007 | | 2008 | | 2007 |
| $ | — | | $ | 5,785,132 | | $ | — | | $ | 18,265,368 | | $ | — | | $ | 15,010,098 | | $ | — | | $ | 39,060,598 |
As of December 31, 2008, the components of distributable earnings (accumulated losses) on a federal income tax basis were as follows:
| | | | | | | | | | | | | | | | |
Undistributed
Ordinary
Income | | Undistributed
Long Term
Gain | | Unrealized
Depreciation | | | Loss
Carryforwards | | | Total | |
| $ | 1,197,527 | | $ | — | | $ | (80,692,549 | ) | | $ | (111,255,492 | ) | | $ | (190,750,514 | ) |
Pursuant to Federal income tax regulations applicable to investment companies, the Portfolio has elected to treat net capital losses realized between November 1 and December 31 of each year as occurring on the first day of the following tax year. For the year ended December 31, 2008, the following amounts of realized capital and currency losses reflected in the accompanying financial statements will not be recognized for Federal income tax purposes until January 1, 2009:
| | | | |
Currency | | Capital | |
$— | | $ | (29,090,050 | ) |
Dividends and Distributions to Shareholders:
The Portfolio records dividends and distributions on the ex-dividend date. Net realized gains from security transactions (if any) are generally distributed annually to shareholders. The timing and characterization of certain income and capital gains distributions are determined in accordance with federal tax regulations that may differ from GAAP. Permanent book and tax basis differences relating to shareholder distributions will result in reclassification between under/over distributed net investment income, accumulated net realized gains/losses and paid in capital.
| 3. | INVESTMENT TRANSACTIONS: |
For the year ended December 31, 2008, purchases and sales of securities (excluding short term investments) for the Portfolio were as follows:
| | | | | | | | | | |
| Purchases | | Sales |
| U.S. Government | | Other | | U.S. Government | | Other |
| $ | 0 | | $ | 1,096,246,813 | | $ | 0 | | $ | 1,145,605,084 |
MSF-15
Metropolitan Series Fund, Inc.
FI Large Cap Portfolio
Notes to Financial Statements—December 31, 2008—(Continued)
| 4. | INVESTMENT MANAGEMENT FEES AND OTHER TRANSACTIONS WITH AFFILIATES: |
Investment Management Agreement:
MetLife Advisers is the investment adviser to the Portfolio. The Fund has entered into an investment management agreement with MetLife Advisers with respect to the Portfolio. For providing investment management services to the Portfolio, MetLife Advisers receives monthly compensation at the following annual rates:
| | | | |
Management
Fees earned by
MetLife Advisers
for the year ended
December 31, 2008 | | Annual
percentage
rates paid to
MetLife Advisers | | Based on Portfolios
average daily net asset
levels |
| $2,838,880 | | 0.800% | | Of the first $250 million |
| | 0.750% | | Of the next $500 million |
| | 0.700% | | On amounts in excess of $750 million |
Certain officers and directors of the Fund may also be officers of MetLife Advisers; however, such officers and directors receive no compensation from the Fund.
Fidelity Management & Research Company (“FMR”) was compensated by MetLife Advisers to provide subadvisory services to the Portfolio from January 1, 2008 through April 27, 2008. Effective April 28, 2008, Pyramis Global Advisors, LLC, a wholly owned subsidiary of FMR, became subadviser to the Portfolio and receives compensation for providing subadvisory services thereto.
Service and Distribution Fees:
The Fund has adopted a Distribution and Service Plan under Rule 12b-1 of the 1940 Act for the Portfolio’s Class B and E shares. Under the Distribution and Service Plan, the Class B and E shares of the Portfolio pay a fee to compensate the Insurance Companies (or their affiliates) and other broker-dealers and financial intermediaries involved in the offer and sale of Portfolio shares for promoting or selling and servicing the Class B and E shares. The fees under the Distribution and Service Plan for each class of the Portfolio’s shares are calculated as a percentage of the Portfolio’s average daily net assets that are attributable to that Class. Currently, the fee is 0.25% per year for Class B shares and 0.15% per year for Class E shares. Amounts paid by the Portfolio for the year ended December 31, 2008 are shown as Service and Distribution fees in the Statement of Operations.
The Fund has entered into a securities lending arrangement with the Fund’s custodian, State Street Bank and Trust Company (the “custodian”). Under the agreement, the custodian is authorized to loan securities on the Portfolios’ behalf. In exchange, the Portfolio receives either cash or securities as collateral against the loaned securities. The Portfolio receives collateral at least equal to 102% of the market value of the loaned securities (105% for foreign securities), at each loan’s inception. Collateral must be maintained at least at 100% of the market value of the loaned securities for the duration of the loan. The cash collateral is invested in the Navigator Securities Lending Prime Portfolio, an affiliate of the custodian, which invests in a variety of high quality U.S. dollar-denominated instruments. If the market value of the collateral at the close of trading on a business day is less than 100% of the market value of the loaned securities at the close of trading on that day, the borrower shall be required to deliver, by the close of business on the following business day, an additional amount of collateral, equal to at least 100% of the market value of all the loaned securities as of such preceding day. The Portfolio receives 80% of the annual net income from securities lending transactions, which is included in interest income of the Portfolio. The remaining 20% is paid to the custodian as compensation for its securities lending services. Interest income received by the Portfolio via lending transactions during the year ended December 31, 2008 is footnoted in the Statement of Operations. The Portfolio bears the risk of any deficiency in the amount of collateral available for return to a borrower due to a loss in an approved investment purchased with such collateral. Any outstanding loans by the Portfolio at December 31, 2008 are footnoted in the Schedule of Investments.
| 6. | MARKET AND CREDIT RISK: |
In the normal course of business, the Portfolio invests in securities and enters into transactions where risks exist due to fluctuations in the market (market risk) or failure of the other party to a transaction to perform (credit risk). The value of securities held by the Portfolio may decline in response to certain events, including those directly involving the companies whose securities are owned by the Portfolio; conditions affecting the general economy; overall market changes; local, regional or global
MSF-16
Metropolitan Series Fund, Inc.
FI Large Cap Portfolio
Notes to Financial Statements—December 31, 2008—(Continued)
political, social or economic instability; and currency and interest rate and price fluctuations. Similar to credit risk, the Portfolio may be exposed to counterparty risk, or the risk that an entity with which the Portfolio has unsettled or open transactions may default. Financial assets, which potentially expose the Portfolio to credit and counterparty risks, consist principally of investments and cash due from counterparties. The extent of the Portfolio’s exposure to credit and counterparty risks in respect to these financial assets approximates their value as recorded in the Portfolio’s Statements of Assets and Liabilities.
On November 7, 2008, the Board approved the acquisition of the Portfolio by the Metropolitan Series Fund, Inc. BlackRock Legacy Large Cap Portfolio (“BlackRock Legacy Large Cap Portfolio”), subject to the approval of shareholders of the Portfolio. On or about February 27, 2009, the shareholders of Portfolio will consider the approval of a proposed Agreement and Plan of Reorganization providing for the acquisition of all the assets of the Portfolio by the BlackRock Legacy Large Cap Portfolio in exchange for shares of the BlackRock Legacy Large Cap Portfolio and the assumption by the BlackRock Legacy Large Cap Portfolio of the liabilities of the Portfolio. If approved by shareholders, the reorganization will close on or about May 1, 2009.
| 8. | RECENT ACCOUNTING PRONOUNCEMENTS: |
In March 2008, the FASB issued Statement of Financial Accounting Standards No. 161, Disclosures about Derivative Instruments and Hedging Activities (“FAS 161”), an amendment of FASB Statement No. 133. FAS 161 requires enhanced disclosures about (a) how and why an entity uses derivative instruments, (b) how derivative instruments and hedging activities are accounted for, and (c) how derivative instruments and related hedging activities affect a fund’s financial position, financial performance, and cash flows. Management does not believe the adoption of FAS 161 will materially impact the financial statement amounts, but will require additional disclosures. This will include qualitative and quantitative disclosures on derivative positions existing at period end and the effect of using derivatives during the reporting period. FAS 161 is effective for financial statements issued for fiscal years and interim periods beginning after November 15, 2008. Management is currently evaluating the impact the adoption of FAS 161 will have on the Portfolio’s financial statement disclosures.
MSF-17
Metropolitan Series Fund, Inc.
FI Large Cap Portfolio
Report of Independent Registered Public Accounting Firm
To the Shareholders and Board of Directors of Metropolitan Series Fund, Inc.:
We have audited the accompanying statement of assets and liabilities, including the schedule of investments, of the Fl Large Cap Portfolio (one of the portfolios constituting the Metropolitan Series Fund, Inc.) (the “Fund”) as of December 31, 2008, and the related statement of operations for the year then ended, the statements of changes in net assets for each of the two years in the period then ended and the financial highlights for each of the four years in the period then ended. The financial highlights for the year ended December 31, 2004 were audited by other auditors whose report, dated February 18, 2005, expressed an unqualified opinion on those financial highlights. These financial statements and financial highlights are the responsibility of the Fund’s management. Our responsibility is to express an opinion on these financial statements and financial highlights based on our audits.
We conducted our audits in accordance with the standards of the Public Company Accounting Oversight Board (United States). Those standards require that we plan and perform the audit to obtain reasonable assurance about whether the financial statements and financial highlights are free of material misstatement. The Fund is not required to have, nor were we engaged to perform, an audit of its internal control over financial reporting. Our audits included consideration of internal control over financial reporting as a basis for designing audit procedures that are appropriate in the circumstances, but not for the purpose of expressing an opinion on the effectiveness of the Fund’s internal control over financial reporting. Accordingly, we express no such opinion. An audit also includes examining, on a test basis, evidence supporting the amounts and disclosures in the financial statements, assessing the accounting principles used and significant estimates made by management, as well as evaluating the overall financial statement presentation. Our procedures included confirmation of securities owned as of December 31, 2008, by correspondence with the custodian and brokers; where replies were not received from brokers, we performed other auditing procedures. We believe that our audits provide a reasonable basis for our opinion.
In our opinion, the financial statements and financial highlights referred to above present fairly, in all material respects, the financial position of the Fl Large Cap Portfolio of the Metropolitan Series Fund, Inc. as of December 31, 2008, the results of its operations for the year then ended, the changes in its net assets for each of the two years in the period then ended, and the financial highlights for each of the four years in the period then ended, in conformity with accounting principles generally accepted in the United States of America.
Deloitte & Touche LLP
Boston, Massachusetts
February 23, 2009
MSF-18
Metropolitan Series Fund, Inc.
Directors and Officers
The Fund’s Directors review actions of the Fund’s investment adviser and subadvisers, and decide upon matters of general policy. The Fund’s officers supervise the daily business operations of the Fund. The Board of Directors and the Fund’s officers are listed below. Each Director is responsible for overseeing all 38 Portfolios of the Fund. There is no limit to the term a Director may serve. Directors serve until their resignation, retirement or removal in accordance with the Fund’s organizational documents and policies adopted by the Board from time to time. Officers hold office at the pleasure of the Board or until the election or appointment and the qualification of a successor. The address of the Directors and officers is c/o Metropolitan Series Fund, Inc., 501 Boylston Street, Boston, MA 02116.
Interested Directors(1)
Each Director below is an “interested person” (as defined by the 1940 Act) with respect to the Fund in that Ms. Forget is an employee of MetLife and Mr. Typermass is a former employee of MetLife and owns securities issued by MetLife, Inc., the ultimate parent company of MetLife Advisers.
| | | | | | | | |
Name, Address and Age | | Current
position(s)
with Fund | | Position(s)
held since | | Principal occupations
over past five years, including other directorships(2) | | Number of
Portfolios in
Fund Complex
Overseen by
Director(3) |
Elizabeth M. Forget Age: 42 | | Director, Chairman of the Board, President and Chief Executive Officer | | 2006 | | Senior Vice President (since 2007), MetLife, Inc.; President, Met Investors Advisory, LLC; Trustee and President, Met Investors Series Trust; Executive Vice President, MetLife Investors Group, Inc.; President, Chief Executive Officer and Chair of the Board of Managers (since 2006), MetLife Advisers; President, Met Investors Advisory, LLC. | | 87 |
| | | | |
Arthur G. Typermass Age: 71 | | Director | | 1998 | | Formerly, Senior Vice President and Treasurer, MetLife. | | 38 |
Non-Interested Directors(1)
Each Director below is not an “interested person” (as defined by the 1940 Act) with respect to the Fund (collectively, the “Independent Directors”).
| | | | | | | | |
Name, Address and Age | | Current
position(s)
with Fund | | Position(s)
held since | | Principal occupations
over past five years, including other directorships(2) | | Number of
Portfolios in
Fund Complex
Overseen by
Director(3) |
Steve A. Garban† Age: 71 | | Director | | 1985 | | Formerly, Chief Financial Officer, Senior Vice President Finance and Operations and Treasurer (Emeritus), The Pennsylvania State University. | | 38 |
| | | | |
Linda B. Strumpf Age: 61 | | Director | | 2000 | | Vice President and Chief Investment Officer, Ford Foundation. | | 38 |
| | | | |
Michael S. Scott Morton† Age: 71 | | Director | | 1993 | | Jay W. Forrester Professor of Management (Emeritus) at Sloan School of Management, MIT. | | 38 |
| | | | |
H. Jesse Arnelle Age: 75 | | Director | | 2001 | | Formerly, Counsel, Womble Carlyle Sandrie & Rice; Director, Textron Inc. (global multi- industry company)*; formerly, Director, Gannet Co. Inc. (diversified news and information company)*; formerly, Director, Eastman Chemical Company (global chemical company)*; formerly, Director, Waste Management, Inc.*; formerly, Director, Armstrong Holdings Inc. (parent company of floor and ceiling products business)*; formerly, Director, FPL Group Inc. (public utility holding company)*; Director, URS Corporation (engineering design services firm)*. | | 38 |
MSF-19
Metropolitan Series Fund, Inc.
Directors and Officers—(Continued)
| | | | | | | | |
Name, Address and Age | | Current
position(s)
with Fund | | Position(s)
held since | | Principal occupations
over past five years, including other directorships(2) | | Number of
Portfolios in
Fund Complex
Overseen by
Director(3) |
Nancy Hawthorne Age: 57 | | Director | | 2003 | | Chief Executive Officer, Clerestory LLC (corporate financial advisor); Director, Avid Technologies (computer software company)*; formerly, Chairman of the Board of Avid Technologies; formerly, Board of Advisors, L. Knife & Sons, Inc. (beverage distributor); formerly, Trustee, New England Zenith Fund (“Zenith Fund”)**; formerly, Chief Executive Officer and Managing Partner, Hawthorne, Krauss and Associates (corporate financial advisor); formerly, Chief Financial Officer and Executive Vice President, Continental Cablevision, subsequently renamed MediaOne (cable television company); formerly, Director, Life F/X, Inc.; formerly, Chairman of the Board, WorldClinic (distance medicine company); formerly, Director, Perini Corporation (construction company)*; formerly, Director, CGU (property and casualty insurance company); formerly, Director, Beacon Power Corporation (energy company)*. | | 38 |
| | | | |
John T. Ludes Age: 72 | | Director | | 2003 | | President, LFP Properties (consulting firm); Formerly, Trustee, Zenith Fund**; formerly, Vice Chairman, President and Chief Operating Officer, Fortune Brands/American Brands (global conglomerate); formerly, President and CEO, Acushnet Company (athletic equipment company). | | 38 |
Officers(1)
| | | | | | | | |
Name and address | | Age | | Current
position(s)
with Fund | | Position(s)
held since | | Principal occupations over past five years(2) |
| Jeffrey L. Bernier | | 37 | | Senior Vice President | | 2008 | | Vice President (since 2008), MetLife, Inc.; Vice President (since 2008), MetLife; Senior Vice President (since 2008), MetLife Advisers; formerly, Director and Senior Investment Analyst (2004 to 2007), John Hancock Financial Services; formerly, Assistant Vice President (2000 to 2001), Wachovia Securities. |
| | | | |
| Alan C. Leland | | 56 | | Senior Vice President | | 2005 | | Treasurer and Chief Financial Officer, MetLife Advisers, LLC; Treasurer (since 2005), Met Investors Advisory, LLC; Vice President (since 2004), Met Investors Advisory, LLC; Vice President (since 2003), MetLife, Inc.; Vice President, MetLife; Senior Vice President, NELICO. |
| | | | |
| Peter Duffy | | 53 | | Vice President
and Treasurer | | 2000 | | Senior Vice President, MetLife Advisers; Second Vice President (since 2003), NELICO; Vice President, MetLife (since 2004); Vice President (since 2004), MetLife, Inc.; formerly, Vice President and Treasurer, Zenith Fund**. |
| | | | |
| Jeffrey P. Halperin | | 41 | | Chief
Compliance Officer | | 2007 | | Vice President (since 2006), MetLife, Inc.; Vice President (since 2006), MetLife; Chief Compliance Officer (since 2006), Met Investors Series Trust, MetLife Advisers, Met Investors Advisory, LLC and MetLife Investment Advisors Company, LLC. |
| * | Indicates a directorship with a registered investment company or a company subject to the reporting requirements of the Securities Exchange Act of 1934, as amended. |
| ** | The Zenith Fund deregistered with the Securities and Exchange Commission (“SEC”) in 2004. |
| (†) | Served as a trustee, director and/or officer of one or more of the following companies, each of which had a direct or indirect advisory relationship with MetLife Advisers or its affiliates prior to January 31, 2005: State Street Research Financial Trust, State Street Research Income Trust, State Street Research Money Market Trust, State Street Research Institutional Funds, State Street Research Capital Trust, State Street Research Master Investment Trust, State Street Research Equity Trust, State Street Research Securities Trust and State Street Research Exchange Trust (collectively, the “State Street Research Funds”). |
| (1) | During the period shown, each Director of the Fund served as a Trustee of Metropolitan Series Fund II, a registered investment company that ceased investment operations in June of 2008 and has applied for deregistration under the Investment Company Act of 1940. During this period, each officer of the Fund served in the same position with Metropolitan Series Fund II. |
| (2) | Previous positions during the past five years with the Fund; Met Investors Series Trust; MetLife; MetLife, Inc.; MetLife Advisers; Met Investors Advisory, LLC; Zenith Fund; NELICO; or New England Securities Corporation are omitted if not materially different. |
| (3) | The Fund Complex includes the Fund (38 portfolios) and Met Investors Series Trust (49 portfolios). |
MSF-20
Metropolitan Series Fund, Inc.
FI Large Cap Portfolio
Board Approval of Advisory and Subadvisory Agreements
The Fund’s Contract Review Committees of the Board of Directors (the “Board” or the “Directors”) typically meet in early fall to review the Portfolios’ advisory agreements (the “Advisory Agreements”) and subadvisory agreements (the “Subadvisory Agreements,” and, together with the Advisory Agreements, the “Agreements”) and determine whether to recommend that the full Board approve the continuation of the Agreements for an additional one-year period. (Following the initial approval of an Agreement for a new Portfolio or with a new adviser or subadviser, such annual reviews are not required until 2 years following the execution of such Agreement.) After each Committee has made its recommendations, the full Board, including the Independent Directors, determines whether to approve the continuation of each of the Agreements. In addition, the Board, including the Independent Directors, considers matters bearing on the Agreements at most of its other meetings throughout the year and regularly interviews various individuals at MetLife Advisers responsible for the management of the Portfolios. The Directors also interview selected investment managers and other professionals at the subadvisers at various times throughout the year.
The Directors receive all materials that they or MetLife Advisers, the Fund’s investment adviser, and the subadvisers believe to be reasonably necessary for the Directors to evaluate the Agreements and determine whether to approve the continuation of the Agreements. These materials generally include, among other items, (i) information on the investment performance of the Portfolios and the performance of peer groups of funds and the Portfolios’ performance benchmarks, (ii) information on the Portfolios’ advisory and subadvisory fees and other expenses, including information comparing the Portfolios’ expenses to those of peer groups of funds and information about any applicable expense caps and fee “breakpoints,” (iii) sales and redemption data, (iv) information related to the profitability of the Agreements to MetLife Advisers and certain of the subadvisers, and potential “fall-out” or ancillary benefits that MetLife Advisers, the subadvisers or their affiliates may receive as a result of their relationships with the Fund and (v) information obtained through the subadvisers’ responses to certain requests from MetLife Advisers and the Directors and MetLife Advisers’ responses to requests from the Directors. The Directors may also consider other information such as (vi) MetLife Advisers’ and the subadvisers’ financial results and condition, (vii) each Portfolio’s investment objectives and strategies and the size, education and experience of the investment staffs of MetLife Advisers and the relevant subadvisers and their use of technology and external research, (viii) the allocation of the Portfolios’ brokerage, if any, including allocations to brokers affiliated with the subadvisers and the use of “soft” commission dollars to pay Portfolio expenses and to pay for research and other similar services, (ix) the resources devoted to, and the record of compliance with, the Portfolios’ investment policies and restrictions, policies on personal securities transactions and other compliance policies, (x) the responses of MetLife Advisers, the subadvisers and/or their affiliates to certain legal and regulatory proceedings and (xi) the economic outlook generally and for the mutual fund industry in particular. Throughout the process, the Directors have the opportunity to ask questions of and request additional materials from MetLife Advisers and the subadvisers.
Following meetings of each Contract Review Committee on September 10, 2008, the Board, including the Independent Directors, at its November 6-7, 2008 meeting, approved the continuation through December 31, 2009 of the Advisory Agreements for each Portfolio of the Fund and the Subadvisory Agreements for each Portfolio other than the Zenith Equity Portfolio and Asset Allocation Portfolios (which do not have subadvisers) and the Van Eck Global Natural Resources Portfolio, Met/Dimensional International Small Cap Portfolio and Loomis Sayles Small Cap Growth Portfolio (formerly known as the Franklin Templeton Small Cap Growth Portfolio). The Agreements approved for continuation are referred to below as the “Continued Agreements.”
In considering whether to approve the continuation of the Continued Agreements, the Directors, including the Independent Directors, did not identify any single factor as determinative, and each weighed the various factors as he or she deemed appropriate. The Directors considered the following matters in connection with their approval of the Continued Agreements:
The nature, extent and quality of the services provided to the relevant Portfolios under the Continued Agreements. The Directors considered the nature, extent and quality of the services provided by MetLife Advisers, the relevant subadvisers (if any) and their affiliates (each, an “Adviser,” and, collectively, the “Advisers”) to the relevant Portfolios pursuant to the Continued Agreements and the resources dedicated to these Portfolios by the Advisers. In particular, the Directors considered the Advisers’ abilities to attract and retain highly qualified investment professionals. With respect to MetLife Advisers, the Directors considered (for each Portfolio other than the Zenith Equity and Asset Allocation Portfolios) that MetLife Advisers is (i) ultimately responsible for the performance of such Portfolios; (ii) ultimately responsible for the establishment of the investment strategies of each such Portfolio, primarily through its recommendations to the Board regarding the hiring and selection of subadvisers; (iii) responsible for the hiring and selection, subject to Board approval, of subadvisers; and (iv) responsible for maintaining a program of Subadviser oversight reasonably designed to ensure that the subadvisers have reasonable compliance policies and procedures in place. The Directors also considered that MetLife Advisers provides a full range of day-to-day administrative services for the Portfolios involving all aspects of such Portfolios’ day-to-day operations (other than portfolio management). With respect to the Zenith Equity and Asset Allocation Portfolios, the Directors considered both the portfolio management services and the administrative services provided by MetLife Advisers. After reviewing
MSF-21
Metropolitan Series Fund, Inc.
FI Large Cap Portfolio
Board Approval of Advisory and Subadvisory Agreements—(Continued)
these and related factors, the Directors concluded, within the context of their overall conclusions regarding each of the Continued Agreements, that the nature, extent and quality of services provided supported the renewal of these Agreements.
Investment performance of the relevant Portfolios. The Directors reviewed information about the performance of the relevant Portfolios over various time periods, including information prepared by an independent third party that compared the performance of the Portfolios to the performance of peer groups of funds and performance benchmarks. The Directors also reviewed a description of the third party’s methodology for identifying a Portfolio’s peer group(s) for purposes of performance and expense comparisons.
In the case of each relevant Portfolio that had performance that lagged its peer group(s) for certain periods, the Directors concluded that other factors relevant to performance were sufficient, in light of other considerations, to warrant renewal of the Continued Agreements relating to such Portfolio. These factors varied from Portfolio to Portfolio, but included one or more of the following: (i) that such Portfolio’s performance, although lagging in certain recent periods, was stronger over the longer term; (ii) that the underperformance was attributable, to a significant extent, to investment decisions that were reasonable and consistent with the Portfolio’s investment objective(s) and policies and that the Portfolio was performing within the range of reasonable expectations, given market conditions and the Portfolio’s investment objective(s) and policies; (iii) that the Portfolio’s performance was competitive when compared to other relevant performance benchmarks or peer groups; and (iv) that MetLife Advisers and/or the relevant subadviser (if any) had taken or was taking steps designed to help improve the Portfolio’s investment performance (including, in the case of certain Portfolios, that MetLife Advisers was formulating possible proposals, for presentation to the Board in November 2008, to replace the Portfolio’s subadviser or to merge the Portfolio into another Portfolio with a similar investment objective and better investment performance).
The Directors also considered the investment performance of the Advisers and their reputations generally, the historical responsiveness of the Advisers to Director concerns about performance and the willingness of the Advisers to take steps intended to improve performance.
After reviewing these and related factors, the Directors concluded, within the context of their overall conclusions regarding each of the Continued Agreements, that the investment performance of each relevant Portfolio and Adviser was sufficient, in light of other considerations, to warrant the renewal of the Continued Agreements.
The costs of the services to be provided and profits to be realized by the Advisers and their affiliates from their relationships with the Portfolios. The Directors considered the fees charged by MetLife Advisers to the Portfolios for advisory services and, with respect to the subadvised Portfolios, by such subadvisers to MetLife Advisers for subadvisory services (such advisory and subadvisory fees (if any), collectively, “Fees”), as well as the total expense levels of the Portfolios. This information included comparisons (provided by an independent third party) of the Portfolios’ advisory fees and total expense levels to those of their peer groups. In evaluating Fees for the relevant Portfolios, the Directors also took into account the demands, complexity and quality of the investment management services provided to each Portfolio. The Directors considered MetLife Advisers’ recommendations regarding reductions in Fee rates, implementation of Fee breakpoints and institution of Fee waivers and expense caps.
The Directors also considered the compensation directly or indirectly received by the Advisers and their affiliates from their relationships with the relevant Portfolios. The Directors reviewed information relating to the profits received by MetLife Advisers, certain of the subadvisers and their affiliates as a result of their relationships with the relevant Portfolios, and information about the allocation of expenses used to calculate profitability. When reviewing profitability, the Directors also considered the performance of the relevant Portfolios, the expense levels of such Portfolios and whether the relevant Advisers had implemented breakpoints, fee waivers and/or expense caps with respect to such Portfolios.
After reviewing these and related factors, the Directors concluded, within the context of their overall conclusions regarding each of the Continued Agreements, that the Fees charged to each of the relevant Portfolios were fair and reasonable, and that the information provided regarding costs of these services generally, and the related profitability (if known) to the relevant Advisers of their relationships with the relevant Portfolios, supported the renewal of the Continued Agreements.
Economies of Scale. The Directors considered the existence of any economies of scale in the provision of services by the Advisers and whether those economies were shared with the relevant Portfolios through breakpoints in their advisory fees or other means, such as expense caps, fee waivers or relatively low levels of fees. The Directors noted that most of the relevant Portfolios benefited or will benefit from breakpoints, expense caps and/or fee waivers with respect to their advisory fees. In considering these issues, the Directors also took into consideration information relating to the costs of the services provided and the profitability to MetLife Advisers, the relevant subadvisers (if any) and each of their affiliates of their relationships with the relevant Portfolios, as discussed above.
MSF-22
Metropolitan Series Fund, Inc.
FI Large Cap Portfolio
Board Approval of Advisory and Subadvisory Agreements—(Continued)
After reviewing these and related factors, the Directors concluded, within the context of their overall conclusions regarding each of the Continued Agreements, that the extent to which economies of scale were shared with the relevant Portfolios supported the renewal of such Agreements.
Other Factors. The Directors also considered other factors, which included but were not limited to the following:
| | • | | the extent to which each relevant Portfolio operated in accordance with its investment objective, and its record of compliance with its investment restrictions and the compliance programs of the Fund and the Advisers. They also considered the compliance-related resources the Advisers and their affiliates provide to the relevant Portfolios; |
| | • | | the nature, quality, cost and extent of administrative and shareholder services performed by MetLife Advisers and its affiliates under the Advisory Agreements; and |
| | • | | so-called “fall-out benefits” to the Advisers, such as the engagement of their affiliates to provide distribution, brokerage and transfer agency services to the Portfolios, and the benefits of research made available to the relevant Advisers by reason of brokerage commissions generated by the relevant Portfolios’ securities transactions. The Directors also considered the possible conflicts of interest associated with these fall-out and other benefits, and the reporting and other processes in place to disclose and monitor these possible conflicts of interest. |
Based on their evaluation of all factors that they deemed to be material, including those factors described above, and assisted by the advice of independent counsel, the Directors, including the Independent Directors, concluded that each of the Continued Agreements should be continued through December 31, 2009.
MSF-23
A description of the policies and procedures that the Fund uses to determine how to vote proxies relating to portfolio securities is available (i) without charge, upon request, by calling (800) 638-7732 and (ii) on the Securities and Exchange Commission’s (the “SEC”) website at http://www.sec.gov.
Information regarding how the Fund voted proxies relating to portfolio securities during the most recent twelve-month period ended December 31, 2008 is available (i) without charge, upon request, by calling (800) 638-7732 and (ii) on the SEC’s website at http://www.sec.gov.
The Fund’s Statement of Additional Information includes additional information about the Directors of the Fund and is available (i) without charge, upon request, by calling (800) 638-7732 and (ii) on the SEC’s website at http://www.sec.gov.
The Fund files with the SEC a complete schedule of its portfolio holdings, as of the close of the first and third quarters of its fiscal year, on “Form N-Q”. These filings are available on the SEC’s website at www.sec.gov and may be reviewed and copied at the SEC’s Public Reference Room in Washington, DC. (Call 1-800-SEC-0330 for information on the operation of the Public Reference Room.)
MSF-24
Simplify your life…
with MetLife eDelivery® while helping MetLife preserve the planet’s natural resources.
(see details on inside cover)
| | |
Metropolitan Series Fund, Inc. FI Mid Cap Opportunities Portfolio Annual Report | | December 31, 2008 |
NOT PART OF THE ANNUAL REPORT
Letter from the President
February 1, 2009
Letter to Policy Holders:
2008 was an extraordinary year in the capital markets around the world and for the global economy. Energy prices rose to record levels early in the year before falling by two-thirds by year-end. A credit crisis that began with concerns about sub-prime mortgages led to massive changes in the financial landscape with government takeovers, forced sales, and outright failures of a number of large, once venerable firms.
While bonds as measured by the Barclays Capital U.S. Aggregate Bond Index (formerly known as, Lehman Brothers U.S. Aggregate Bond Index) were up 5.2% for the year in response to declining interest rates, there were large differences in the total returns of the various sectors of the bond market. U.S. treasury securities were up over 13% as frightened investors sought refuge in what they perceived to be the safest and most liquid investments. In contrast, investment grade corporate securities lost nearly 5% as credit spreads widened and below investment grade or high yield bonds fell over 26%.
In response to the growing credit crisis and the weakening economy, common stocks fell sharply across all regions, styles, and capitalizations. As measured by the Standard and Poor’s 500, U.S. common stocks fell 37% for the year, the worst calendar year decline since the 1930s. Foreign stocks were down even more with the MSCI EAFE Index down 43% for the year.
On the following pages, you will find a complete review of your Portfolio and its investment performance.
MetLife is committed to building your financial freedom. We appreciate your trust and will continue to focus our efforts on meeting your investment needs.
Sincerely,
Elizabeth M. Forget
President, Metropolitan Series Fund, Inc.
Metropolitan Series Fund, Inc.
FI Mid Cap Opportunities Portfolio
Managed by Fidelity Management & Research Company
Portfolio Manager Commentary*
PORTFOLIO PERFORMANCE
For the twelve-month period ended December 31, 2008, the Class A shares of the FI Mid Cap Opportunities Portfolio returned -55.3%, compared to its new benchmark, the Russell MidCap Growth Index1, which returned -44.3%. The benchmark was changed because the portfolio manager felt that the new index better reflected the universe of stocks from which they selected. The old benchmark, the Standard & Poor’s MidCap 400 Index2, returned -36.2%. The average return of its peer group, the Lipper Variable Insurance Products3 Mid-Cap Growth Funds Universe, was -45.2% over the same period.
PORTFOLIO REVIEW
For the 12-month period, the Portfolio underperformed the Russell MidCap Growth Index. The Industrials, Materials, and Consumer Discretionary sectors were among the largest detractors from performance, while the Utilities sector contributed.
Within Industrials, the overweights in SunPower Corp. (no longer held at year-end) and Titan International were among the largest detractors from performance. SunPower shares fell as the credit crisis adversely impacted short-term demand for solar products by making it difficult for customers to obtain financing for new projects. Falling energy prices and foreign exchange concerns also drove shares lower. Titan International manufactures tires and wheel components used in agricultural and earthmoving vehicles. Titan shares fell over 70% as investors feared the global economic slowdown would cause heavy equipment makers to cut capital spending, thereby adversely impacting demand for Titan’s products. Within Materials, the overweights in agricultural seed producer Monsanto and fertilizer manufactures CF Industries (no longer held at year-end) and Mosaic (no longer held at year-end) were the largest detractors. Falling commodity prices and concern over decreasing agricultural demand drove the shares of all three companies lower. Within the Consumer Discretionary sector, the overweights in Gildan Activewear and Priceline.com (no longer held at year-end) were among the largest detractors. Gildan Activewear is a vertically integrated manufacturer of activewear and distributes its products to wholesalers in North America and Europe. Shares fell sharply after the company announced lower than expected fiscal Q4 earnings and that it had revised downward its fiscal 2009 outlook based on anticipated declines in consumer spending. Priceline is an online discount travel provider. Our position in Priceline detracted as the company’s shares dropped on investor speculation that a struggling consumer would reduce travel spending. Among individual holdings, the overweight in National Oilwell Varco (no longer held at year-end) was the largest Portfolio detractor. Concerns that the global credit crisis will lead to decreased capital spending from oil and gas companies weighed down shares of the oil and gas equipment maker.
The Utilities sector contributed positively to relative performance mainly due to our large underweight position in this poorly performing sector. Utility stocks fell sharply during the latter half of 2008 on concern that turmoil in the financial markets could disrupt energy-trading operations. Power producers need banking partners in order to trade power and fuel, and there was fear that the potential bankruptcies in the financial industry would threaten liquidity in the energy markets. Aside from the Utilities sector, individual security selection partially offset portfolio weakness elsewhere. Within Energy, for example, EOG Resources was a top contributor. EOG is a natural gas and crude oil exploration and production company. EOG shares gained over 50% in the Portfolio during the period we owned the stock earlier in 2008. EOG shares benefited from rising oil and gas prices during the first half of 2008. We closed our position before commodity prices fell during the latter half of the year.
Within Consumer Discretionary, we are overweight education companies including DeVry and ITT Educational Services. We expect both companies to benefit from increasing enrollments and rising student retention rates as a result of the difficult labor market. In Health Care, we favor biotechnology and life sciences companies since demand for health services should continue. Within Financials, we are overweight the Diversified Financial Services industry, focusing on securities and derivatives exchange providers such as Interactive Brokers Group and CME Group, which have come under selling pressure even though regulatory and legislative measures could increase trading activity. The Portfolio has remained consistently underweight Information Technology and overweight the Wireless Telecommunication industry because of the growth potential resulting from rising global demand. During the fourth quarter we decreased our exposure to Energy and Industrials companies as the global economic slowdown and deteriorating fundamentals made names unattractive.
* The views expressed above are those of the subadvisory firm as of December 31, 2008 and are subject to change based on market and other conditions. Information about the Portfolio’s holdings, asset allocation, industry allocation, or country diversification is historical and is not an indication of future Portfolio composition, which will vary. The performance of any index mentioned in this commentary has not been adjusted for ongoing management, distribution and operating expenses, and sales charges applicable to mutual fund investments. Direct investment in any index is not possible.
1 The Russell Midcap® Growth Index is an unmanaged measure of performance of those Russell Midcap companies (the 800 smallest companies in the Russell 1000 Index) with higher price-to-book ratios and higher forecasted growth values.
2 The Standard & Poor’s (S&P) MidCap 400® Index is an unmanaged index measuring the performance of the mid-size company segment of the U.S. market. The Index consists of 400 domestic stocks chosen for market size, liquidity, and industry group representation.
3 The Lipper Variable Products Fund Average is an average of the total return performance (calculated on the basis of net asset value) of variable product funds with similar investment objectives to those of the subject Portfolio as calculated by Lipper Analytical Services, an independent mutual fund ranking service.
MSF-2
Metropolitan Series Fund, Inc.
FI Mid Cap Opportunities Portfolio
A $10,000 INVESTMENT COMPARED TO THE S&P MIDCAP 400 INDEX & THE RUSSELL MIDCAP GROWTH INDEX
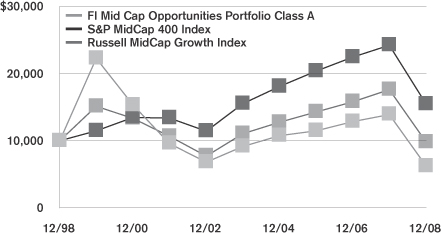
Average Annual Returns as of December 31, 2008
| | | | | | | | | | | | | | | |
| | | FI Mid Cap Opportunities Portfolio | | | S&P MidCap 400 Index | | | Russell
MidCap
Growth Index | |
| | | Class A | | | Class B | | | Class E | | | |
| 1 Year | | -55.3 | % | | -55.4 | % | | -55.4 | % | | -36.2 | % | | -44.3 | % |
| 5 Year | | -7.5 | | | -7.7 | | | -7.6 | | | -0.1 | | | -2.3 | |
| 10 Year | | -4.6 | | | — | | | — | | | 4.5 | | | -0.2 | |
| Since Inception | | — | | | -10.0 | | | -8.8 | | | — | | | — | |
Performance numbers are net of all Portfolio expenses but do not include any insurance, sales, or administrative charges of variable annuity or life insurance contracts or any additional expenses that participants in certain eligible qualified plans may bear relating to the operations of their plans. If these charges were included, the returns would be lower.
Inception dates of the Class A, Class B and Class E shares are: 3/3/97, 1/2/01 and 5/1/01, respectively.
This information represents past performance and is not indicative of future results. Investment return and principal value may fluctuate so that shares, upon redemption, may be worth more or less than the original cost.
PORTFOLIO COMPOSITION
as of December 31, 2008
Top Holdings
| | |
| | | % of Total
Net Assets |
American Tower Corp. (Class A) | | 5.3% |
Equinix, Inc. | | 5.2% |
NII Holdings, Inc. | | 4.8% |
Monsanto Co. | | 4.6% |
Energy Conversion Devices, Inc. | | 4.6% |
H&R Block, Inc. | | 3.7% |
Grifols S.A. | | 3.5% |
Interactive Brokers Group, Inc. | | 3.4% |
CSL, Ltd. | | 3.4% |
ACE, Ltd. | | 3.3% |
Top Sectors
| | |
| | | % of Total
Market Value |
Health Care | | 22.3% |
Consumer Discretionary | | 14.9% |
Telecommunication Services | | 12.5% |
Industrials | | 12.4% |
Information Technology | | 11.8% |
Financials | | 9.6% |
Materials | | 8.1% |
Energy | | 6.3% |
Consumer Staples | | 1.2% |
Cash | | 0.9% |
MSF-3
Metropolitan Series Fund, Inc.
Shareholder Expense Example
As a shareholder of the Portfolio, you incur ongoing costs, including management fees; distribution and service (12b-1) fees; and other Portfolio expenses. This example is intended to help you understand your ongoing costs (in dollars) (referred to as “expenses”) of investing in the Portfolio and compare these costs with the ongoing costs of investing in other mutual funds. The example is based on an investment of $1,000 invested at the beginning of the period and held for the entire period, July 1, 2008 through December 31, 2008.
Actual Expenses
The first line for each share class of the Portfolio in the table below provides information about actual account values and actual expenses. You may use the information in this line, together with the amount you invested in the particular share class of the Portfolio, to estimate the expenses that you paid over the period. Simply divide your account value by $1,000 (for example, an $8,600 account value divided by $1,000=8.6), then multiply the result by the number in the first line under the heading entitled “Expenses Paid During Period” to estimate the expenses you paid on your account during this period.
Hypothetical Example for Comparison Purposes
The second line for each share class of the Portfolio in the table below provides information about hypothetical account values and hypothetical expenses based on the Portfolio’s actual expense ratio and an assumed rate of return of 5% per year before expenses, which is not the Portfolio’s actual return. The hypothetical account values and expenses may not be used to estimate the actual ending account balance or expenses you paid for the period. You may use this information to compare the ongoing costs of investing in the Portfolio and other funds. To do so, compare this 5% hypothetical example with the 5% hypothetical examples that appear in the shareholder reports of the other funds.
Please note that the expenses shown in the table are meant to highlight your ongoing costs only and do not reflect any fees or charges of your variable insurance product or any additional expenses that participants in certain eligible qualified plans may bear relating to the operations of their plan. Therefore, the second line for each share class in the table is useful in comparing ongoing costs only, and will not help you determine the relative total costs of owning different funds. In addition, if these other costs were included, your costs would have been higher.
| | | | | | | | | | | | | | |
Portfolio | | | | Annualized
Expense
Ratio | | | Beginning
Account Value
July 1,
2008 | | Ending
Account Value
December 31,
2008 | | Expenses Paid
During Period*
July 1, 2008
to
December 31,
2008 |
FI Mid Cap Opportunities—Class A | | Actual | | 0.75 | % | | $ | 1,000.00 | | $ | 481.35 | | $ | 2.79 |
| | Hypothetical | | 0.75 | % | | $ | 1,000.00 | | $ | 1,021.32 | | $ | 3.81 |
| | | | | |
FI Mid Cap Opportunities—Class B | | Actual | | 1.00 | % | | $ | 1,000.00 | | $ | 480.42 | | $ | 3.72 |
| | Hypothetical | | 1.00 | % | | $ | 1,000.00 | | $ | 1,020.05 | | $ | 5.08 |
| | | | | |
FI Mid Cap Opportunities—Class E | | Actual | | 0.90 | % | | $ | 1,000.00 | | $ | 480.62 | | $ | 3.35 |
| | Hypothetical | | 0.90 | % | | $ | 1,000.00 | | $ | 1,020.56 | | $ | 4.57 |
* Expenses paid are equal to the Portfolio’s annualized expense ratio for the most recent six month period, as shown above, multiplied by the average account value over the period, multiplied by the number of days in the most recent fiscal half-year, divided by 366 (to reflect the the one-half year period).
MSF-4
Metropolitan Series Fund, Inc.
FI Mid Cap Opportunities Portfolio
Schedule of Investments as of December 31, 2008
Common Stock—98.9% of Total Net Assets
| | | | | |
| Security Description | | Shares | | Value* |
| | | | | |
|
Aerospace & Defense—0.3% |
AeroVironment, Inc. (a) (b) | | 43,560 | | $ | 1,603,444 |
| | | | | |
|
Air Freight & Logistics—0.6% |
Atlas Air Worldwide Holdings, Inc. (b) | | 79,030 | | | 1,493,667 |
FedEx Corp. | | 23,750 | | | 1,523,563 |
| | | | | |
| | | | | 3,017,230 |
| | | | | |
|
Biotechnology—12.7% |
Cephalon, Inc. (a) (b) | | 90,740 | | | 6,990,610 |
CSL, Ltd. (AUD) | | 751,240 | | | 17,739,414 |
Gilead Sciences, Inc. (a) (b) | | 290,600 | | | 14,861,284 |
Grifols S.A. (EUR) (a) | | 1,045,636 | | | 18,161,042 |
Myriad Genetics, Inc. (a) (b) | | 49,150 | | | 3,256,679 |
OSI Pharmaceuticals, Inc. (a) (b) | | 73,340 | | | 2,863,927 |
Theravance, Inc. (a) (b) | | 111,800 | | | 1,385,202 |
United Therapeutics Corp. (b) | | 25,240 | | | 1,578,762 |
| | | | | |
| | | | | 66,836,920 |
| | | | | |
|
Chemicals—5.3% |
FMC Corp. | | 75,060 | | | 3,357,434 |
Monsanto Co. | | 346,040 | | | 24,343,914 |
| | | | | |
| | | | | 27,701,348 |
| | | | | |
|
Commercial & Professional Services—3.5% |
Copart, Inc. (b) | | 485,794 | | | 13,208,739 |
Republic Services, Inc. | | 215,280 | | | 5,336,791 |
| | | | | |
| | | | | 18,545,530 |
| | | | | |
|
Computers & Peripherals—1.9% |
NCR Corp. (b) | | 716,220 | | | 10,127,351 |
| | | | | |
|
Distributors—0.6% |
LKQ Corp. (a) (b) | | 248,770 | | | 2,900,658 |
| | | | | |
|
Diversified Consumer Services—12.3% |
Apollo Group, Inc. (Class A) (b) | | 191,180 | | | 14,648,211 |
Corinthian Colleges, Inc. (a) (b) | | 155,120 | | | 2,539,314 |
DeVry, Inc. | | 211,788 | | | 12,158,749 |
H&R Block, Inc. | | 844,340 | | | 19,183,405 |
ITT Educational Services, Inc. (a) (b) | | 158,460 | | | 15,050,531 |
Universal Technical Institute, Inc. (a) (b) | | 69,110 | | | 1,186,619 |
| | | | | |
| | | | | 64,766,829 |
| | | | | |
|
Diversified Financial Services—5.2% |
CME Group, Inc. | | 29,050 | | | 6,045,596 |
Interactive Brokers Group, Inc. (b) | | 998,642 | | | 17,865,705 |
IntercontinentalExchange, Inc. (b) | | 43,370 | | | 3,575,423 |
| | | | | |
| | | | | 27,486,724 |
| | | | | |
|
Electrical Equipment—4.6% |
Energy Conversion Devices, Inc. (a) (b) | | 959,950 | | | 24,200,339 |
| | | | | |
|
Electronic Equipment, Instruments & Components—0.4% |
FLIR Systems, Inc. (a) (b) | | 63,650 | | | 1,952,782 |
| | | | | |
| | | | | |
| Security Description | | Shares | | Value* |
| | | | | |
|
Food Products—1.1% |
Green Mountain Coffee Roasters, Inc. (a) (b) | | 27,720 | | $ | 1,072,764 |
Ralcorp Holdings, Inc. (b) | | 79,950 | | | 4,669,080 |
| | | | | |
| | | | | 5,741,844 |
| | | | | |
|
Health Care Equipment & Supplies—2.0% |
Inverness Medical Innovations, Inc. (a) (b) | | 566,840 | | | 10,718,944 |
| | | | | |
|
Health Care Providers & Services—0.5% |
athenahealth, Inc. (b) | | 70,390 | | | 2,648,072 |
| | | | | |
|
Health Care Technology—0.2% |
MedAssets, Inc. (b) | | 70,490 | | | 1,029,154 |
| | | | | |
|
Household Products—0.2% |
Clorox Co. | | 13,620 | | | 756,727 |
| | | | | |
|
Insurance—4.4% |
ACE, Ltd. | | 330,820 | | | 17,506,994 |
Allied World Assurance Co. Holdings, Ltd. (b) | | 19,700 | | | 799,820 |
PartnerRe, Ltd. | | 15,200 | | | 1,083,304 |
W.R. Berkley Corp. | | 111,450 | | | 3,454,950 |
| | | | | |
| | | | | 22,845,068 |
| | | | | |
|
Internet Software & Services—6.1% |
Equinix, Inc. (a) (b) | | 513,260 | | | 27,300,300 |
Move, Inc. (b) | | 319,467 | | | 511,147 |
Telecity Group, Plc. (GBP) (b) | | 1,723,127 | | | 4,376,089 |
| | | | | |
| | | | | 32,187,536 |
| | | | | |
|
Life Sciences Tools & Services—6.3% |
Icon, Plc. (ADR) (b) | | 806,400 | | | 15,878,016 |
Sequenom, Inc. (a) (b) | | 862,120 | | | 17,104,461 |
| | | | | |
| | | | | 32,982,477 |
| | | | | |
| | |
Machinery—2.7% | | | | | |
AGCO Corp. (a) (b) | | 107,360 | | | 2,532,622 |
Titan International, Inc. (a) | | 1,421,147 | | | 11,724,463 |
| | | | | |
| | | | | 14,257,085 |
| | | | | |
| | |
Metals & Mining—2.8% | | | | | |
Commercial Metals Co. | | 85,110 | | | 1,010,256 |
Goldcorp, Inc. (CAD) | | 67,000 | | | 2,083,540 |
Newmont Mining Corp. | | 127,570 | | | 5,192,099 |
Nucor Corp. | | 98,350 | | | 4,543,770 |
Royal Gold, Inc. (a) | | 35,820 | | | 1,762,702 |
Schnitzer Steel Industries, Inc. (a) | | 7,200 | | | 271,080 |
| | | | | |
| | | | | 14,863,447 |
| | | | | |
| |
Oil, Gas & Consumable Fuels—6.3% | | | |
Chesapeake Energy Corp. (a) | | 351,130 | | | 5,677,772 |
EXCO Resources, Inc. (a) (b) | | 534,210 | | | 4,839,942 |
Frontier Oil Corp. | | 155,220 | | | 1,960,429 |
GMX Resources, Inc. (a) (b) | | 142,112 | | | 3,598,276 |
Goodrich Petroleum Corp. (a) (b) | | 134,180 | | | 4,018,691 |
*See accompanying notes to financial statements.
MSF-5
Metropolitan Series Fund, Inc.
FI Mid Cap Opportunities Portfolio
Schedule of Investments as of December 31, 2008
Common Stock—(Continued)
| | | | | | | |
| Security Description | | Shares | | Value* | |
| | | | | | | |
| |
Oil, Gas & Consumable Fuels—(Continued) | | | | |
PetroHawk Energy Corp. (a) (b) | | | 25,660 | | $ | 401,066 | |
Southwestern Energy Co. (b) | | | 431,385 | | | 12,497,223 | |
| | | | | | | |
| | | | | | 32,993,399 | |
| | | | | | | |
| | |
Pharmaceuticals—0.5% | | | | | | | |
Valeant Pharmaceuticals International (a) (b) | | | 115,280 | | | 2,639,912 | |
| | | | | | | |
| | |
Professional Services—0.4% | | | | | | | |
FTI Consulting, Inc. (a) (b) | | | 51,251 | | | 2,289,895 | |
| | | | | | | |
| | |
Software—3.3% | | | | | | | |
BMC Software, Inc. (a) (b) | | | 151,320 | | | 4,072,021 | |
Nuance Communications, Inc. (a) (b) | | | 1,273,374 | | | 13,192,155 | |
| | | | | | | |
| | | | | | 17,264,176 | |
| | | | | | | |
| |
Textiles, Apparel & Luxury Goods—2.0% | | | | |
Gildan Activewear, Inc. (a) (b) | | | 210,000 | | | 2,469,600 | |
Gildan Activewear, Inc. (CAD) (a) (b) | | | 682,800 | | | 7,848,467 | |
| | | | | | | |
| | | | | | 10,318,067 | |
| | | | | | | |
| |
Transportation Infrastructure—0.2% | | | | |
Aegean Marine Petroleum Network, Inc. (a) | | | 54,743 | | | 928,441 | |
| | | | | | | |
| |
Wireless Telecommunication Services—12.5% | | | | |
American Tower Corp. (Class A) (b) | | | 945,889 | | | 27,733,465 | |
NII Holdings, Inc. (b) | | | 1,388,613 | | | 25,244,984 | |
SBA Communications Corp. (a) (b) | | | 766,230 | | | 12,504,874 | |
| | | | | | | |
| | | | | | 65,483,323 | |
| | | | | | | |
Total Common Stock
(Identified Cost $662,891,546) | | | | | | 519,086,722 | |
| | | | | | | |
| |
| Short Term Investments—17.9% | | | | |
| Security Description | | Shares/Face
Amount | | Value* | |
| | |
Mutual Funds—16.3% | | | | | | | |
State Street Navigator Securities Lending Prime Portfolio (c) | | | 85,144,230 | | | 85,144,230 | |
| | | | | | | |
| | |
Repurchase Agreement—1.6% | | | | | | | |
State Street Repurchase Agreement dated 12/31/08 at 0.010% to be repurchased at $8,520,005 on 01/02/09, collateralized by $8,695,000 U.S. Treasury Bill due 02/19/09 with a value of $8,695,000. | | $ | 8,520,000 | | | 8,520,000 | |
| | | | | | | |
Total Short Term Investments
(Identified Cost $93,664,230) | | | | | | 93,664,230 | |
| | | | | | | |
Total Investments—116.8%
(Identified Cost $756,555,776) (d) | | | | | | 612,750,952 | |
Liabilities in excess of other assets | | | | | | (87,955,348 | ) |
| | | | | | | |
| Total Net Assets—100% | | | | | $ | 524,795,604 | |
| | | | | | | |
| (a) | A portion or all of the security was on loan. As of December 31, 2008, the market value of securities loaned was $83,959,920 and the collateral received consisted of cash in the amount of $85,144,230 and non-cash collateral with a value of $393,048. The cash collateral is invested in a money market fund managed by an affiliate of the custodian. The non-cash collateral received consists primarily of government securities and bank letters of credit, and are held for the benefit of the Portfolio at the Portfolio’s custodian. The Portfolio cannot repledge or resell this collateral. As such, these are excluded from the Statement of Assets and Liabilities. |
| (c) | Represents investment of cash collateral received from securities lending transactions. |
| (d) | The aggregate cost of investments for federal income tax purposes as of December 31, 2008 was $773,794,525 and the composition of unrealized appreciation and depreciation of investment securities was $16,655,440 and $(177,699,013), respectively. |
| (ADR)— | An American Depositary Receipt is a certificate issued by a custodian bank representing the right to receive securities of the foreign issuer described. Trading on exchanges not located in the United States or Canada significantly influences the value of ADRs. |
*See accompanying notes to financial statements.
MSF-6
Metropolitan Series Fund, Inc.
FI Mid Cap Opportunities Portfolio
The Portfolio adopted the provisions of Statement of Financial Accounting Standards No. 157, “Fair Value Measurements” (FAS 157), effective with the beginning of the Portfolio’s fiscal year. FAS 157 establishes a framework for measuring fair value and expands disclosures about fair value measurements in financial statements. The three levels of the hierarchy under FAS 157 are described below:
Level 1 - quoted prices in active markets for identical securities
Level 2 - other significant observable inputs (including quoted prices for similar securities, interest rates, credit risk, etc.)
Level 3 - significant unobservable inputs (including the Portfolio’s own assumptions in determining the fair value of investments)
The inputs or methodology used for valuing securities are not necessarily an indication of the risk associated with investing in those securities.
The following is a summary of the inputs used to value the Portfolio’s net assets as of December 31, 2008:
| | | | | | |
| Valuation Inputs | | Investments In
Securities | | Other Financial
Instruments* |
Level 1 - Quoted Prices | | $ | 554,022,400 | | $ | 0 |
Level 2 - Other Significant Observable Inputs | | | 58,728,552 | | | 0 |
Level 3 - Significant Unobservable Inputs | | | 0 | | | 0 |
Total | | $ | 612,750,952 | | $ | 0 |
* Other financial instruments are derivative instruments not reflected in the Schedule of Investments, such as futures, forwards, swap contracts and written options, which are valued based on the unrealized appreciation/depreciation on the instrument.
MSF-7
Metropolitan Series Fund, Inc.
FI Mid Cap Opportunities Portfolio
Statement of Assets & Liabilities
December 31, 2008
| | | | | | | |
Assets | | | | | | | |
Investments at value (a) (b) | | | | | $ | 612,750,952 | |
Cash | | | | | | 563 | |
Foreign cash at value (c) | | | | | | 232,173 | |
Receivable for: | | | | | | | |
Securities sold | | | | | | 408,219 | |
Fund shares sold | | | | | | 1,573,043 | |
Accrued interest and dividends | | | | | | 277,003 | |
| | | | | | | |
Total Assets | | | | | | 615,241,953 | |
Liabilities | | | | | | | |
Payable for: | | | | | | | |
Securities purchased | | $ | 4,699,559 | | | | |
Fund shares redeemed | | | 255,933 | | | | |
Collateral for securities loaned | | | 85,144,230 | | | | |
Accrued expenses: | | | | | | | |
Management fees | | | 297,124 | | | | |
Service and distribution fees | | | 9,544 | | | | |
Deferred directors’ fees | | | 690 | | | | |
Other expenses | | | 39,269 | | | | |
| | | | | | | |
Total Liabilities | | | | | | 90,446,349 | |
| | | | | | | |
Net Assets | | | | | $ | 524,795,604 | |
| | | | | | | |
Net assets consists of: | | | | | | | |
Capital paid in | | | | | $ | 1,581,286,363 | |
Undistributed net investment income | | | | | | 8,722,126 | |
Accumulated net realized losses | | | | | | (921,392,752 | ) |
Unrealized depreciation on investments and foreign currency | | | | | | (143,820,133 | ) |
| | | | | | | |
Net Assets | | | | | $ | 524,795,604 | |
| | | | | | | |
| Computation of offering price: | | | | | | | |
Class A | | | | | | | |
Net asset value and redemption price per share ($470,142,000 divided by 49,926,744 shares outstanding) | | | | | $ | 9.42 | |
| | | | | | | |
Class B | | | | | | | |
Net asset value and redemption price per share ($39,943,153 divided by 4,341,066 shares outstanding) | | | | | $ | 9.20 | |
| | | | | | | |
Class E | | | | | | | |
Net asset value and redemption price per share ($14,710,451 divided by 1,581,056 shares outstanding) | | | | | $ | 9.30 | |
| | | | | | | |
(a) Identified cost of investments | | | | | $ | 756,555,776 | |
| | | | | | | |
(b) Includes cash collateral for securities loaned of | | | | | $ | 85,144,230 | |
| | | | | | | |
(c) Identified cost of foreign cash | | | | | $ | 246,177 | |
| | | | | | | |
Statement of Operations
For the Year Ended December 31, 2008
| | | | | | | | |
Investment Income | | | | | | | | |
Dividends | | | | | | $ | 6,196,204 | (a) |
Interest | | | | | | | 1,936,950 | (b) |
| | | | | | | | |
| | | | | | | 8,133,154 | |
Expenses | | | | | | | | |
Management fees | | $ | 6,148,389 | | | | | |
Service and distribution fees—Class B | | | 160,027 | | | | | |
Service and distribution fees—Class E | | | 39,371 | | | | | |
Directors’ fees and expenses | | | 31,005 | | | | | |
Custodian | | | 213,240 | | | | | |
Audit and tax services | | | 36,941 | | | | | |
Legal | | | 15,537 | | | | | |
Printing | | | 271,187 | | | | | |
Insurance | | | 13,729 | | | | | |
Miscellaneous | | | 27,608 | | | | | |
| | | | | | | | |
Total expenses | | | 6,957,034 | | | | | |
Expense reductions | | | (70,636 | ) | | | 6,886,398 | |
| | | | | | | | |
Net Investment Income | | | | | | | 1,246,756 | |
| | | | | | | | |
Realized and Unrealized Loss | | | | | | | | |
| Realized gain (loss) on: | | | | | | | | |
Investments—net | | | (429,441,569 | ) | | | | |
Foreign currency transactions—net | | | 9,362,754 | | | | | |
Voluntary reimbursement of brokerage commissions and transaction costs | | | 877,217 | | | | (419,201,598 | ) |
| | | | | | | | |
| Change in unrealized depreciation on: | | | | | | | | |
Investments—net | | | (203,905,578 | ) | | | | |
Foreign currency transactions—net | | | 149,022 | | | | (203,756,556 | ) |
| | | | | | | | |
Net loss | | | | | | | (622,958,154 | ) |
| | | | | | | | |
Net Decrease in Net Assets From Operations | | | | | | $ | (621,711,398 | ) |
| | | | | | | | |
| (a) | Net of foreign taxes of $175,880. |
| (b) | Includes income on securities loaned of $1,771,135. |
See accompanying notes to financial statements.
MSF-8
Metropolitan Series Fund, Inc.
FI Mid Cap Opportunities Portfolio
Statements of Changes in Net Assets
| | | | | | | | |
| | | Year ended
December 31,
2008 | | | Year ended
December 31,
2007 | |
From Operations | | | | | | | | |
Net investment income | | $ | 1,246,756 | | | $ | 172,173 | |
Net realized gain (loss) | | | (419,201,598 | ) | | | 130,626,469 | |
Unrealized depreciation | | | (203,756,556 | ) | | | (40,920,232 | ) |
| | | | | | | | |
Increase (decrease) in net assets from operations | | | (621,711,398 | ) | | | 89,878,410 | |
| | | | | | | | |
From Distributions to Shareholders | | | | | | | | |
Net investment income | | | | | | | | |
Class A | | | (3,481,342 | ) | | | (1,400,249 | ) |
Class B | | | (67,510 | ) | | | 0 | |
Class E | | | (62,144 | ) | | | (1,896 | ) |
| | | | | | | | |
Total distributions | | | (3,610,996 | ) | | | (1,402,145 | ) |
| | | | | | | | |
Increase (decrease) in net assets from capital share transactions | | | (31,910,033 | ) | | | 5,575,867 | |
| | | | | | | | |
Net increase (decrease) in net assets | | | (657,232,427 | ) | | | 94,052,132 | |
| | |
Net Assets | | | | | | | | |
Beginning of the period | | | 1,182,028,031 | | | | 1,087,975,899 | |
| | | | | | | | |
End of the period | | $ | 524,795,604 | | | $ | 1,182,028,031 | |
| | | | | | | | |
Undistributed (Overdistributed) Net Investment Income | | | | | | | | |
End of the period | | $ | 8,722,126 | | | $ | 1,794,246 | |
| | | | | | | | |
Other Information:
Capital Shares
Transactions in capital shares were as follows:
| | | | | | | | | | | | | | |
| | | Year ended
December 31, 2008 | | | Year ended
December 31, 2007 | |
| | | Shares | | | $ | | | Shares | | | $ | |
Class A | | | | | | | | | | | | | | |
Sales | | 8,361,663 | | | $ | 113,359,995 | | | 8,542,036 | | | $ | 181,035,488 | |
Reinvestments | | 179,174 | | | | 3,481,342 | | | 66,112 | | | | 1,400,249 | |
Redemptions | | (8,892,500 | ) | | | (148,780,277 | ) | | (8,578,550 | ) | | | (181,458,569 | ) |
| | | | | | | | | | | | | | |
Net increase (decrease) | | (351,663 | ) | | $ | (31,938,940 | ) | | 29,598 | | | $ | 977,168 | |
| | | | | | | | | | | | | | |
Class B | | | | | | | | | | | | | | |
Sales | | 1,284,189 | | | $ | 18,518,543 | | | 1,373,277 | | | $ | 28,773,800 | |
Reinvestments | | 3,549 | | | | 67,510 | | | 0 | | | | 0 | |
Redemptions | | (949,113 | ) | | | (15,512,342 | ) | | (894,020 | ) | | | (18,596,495 | ) |
| | | | | | | | | | | | | | |
Net increase | | 338,625 | | | $ | 3,073,711 | | | 479,257 | | | $ | 10,177,305 | |
| | | | | | | | | | | | | | |
Class E | | | | | | | | | | | | | | |
Sales | | 224,387 | | | $ | 3,171,530 | | | 250,970 | | | $ | 5,322,439 | |
Reinvestments | | 3,233 | | | | 62,144 | | | 90 | | | | 1,896 | |
Redemptions | | (386,063 | ) | | | (6,278,478 | ) | | (522,976 | ) | | | (10,902,941 | ) |
| | | | | | | | | | | | | | |
Net decrease | | (158,443 | ) | | $ | (3,044,804 | ) | | (271,916 | ) | | $ | (5,578,606 | ) |
| | | | | | | | | | | | | | |
Increase (decrease) derived from capital share transactions | | | | | $ | (31,910,033 | ) | | | | | $ | 5,575,867 | |
| | | | | | | | | | | | | | |
See accompanying notes to financial statements.
MSF-9
Metropolitan Series Fund, Inc.
FI Mid Cap Opportunities Portfolio
Financial Highlights
| | | | | | | | | | | | | | | | | | | |
| | | Class A | |
| | | Year ended December 31, | |
| | | 2008 | | | 2007 | | | 2006 | | | 2005 | | 2004 | |
Net Asset Value, Beginning of Period | | $ | 21.14 | | | $ | 19.54 | | | $ | 17.47 | | | $ | 16.34 | | $ | 14.01 | |
| | | | | | | | | | | | | | | | | | | |
Income From Investment Operations | | | | | | | | | | | | | | | | | | | |
Net investment income | | | 0.03 | (a) | | | 0.01 | (a) | | | 0.01 | | | | 0.02 | | | 0.08 | |
Net realized and unrealized gain (loss) of investments | | | (11.68 | ) | | | 1.62 | | | | 2.06 | | | | 1.11 | | | 2.33 | |
| | | | | | | | | | | | | | | | | | | |
Total from investment operations | | | (11.65 | ) | | | 1.63 | | | | 2.07 | | | | 1.13 | | | 2.41 | |
| | | | | | | | | | | | | | | | | | | |
Less Distributions | | | | | | | | | | | | | | | | | | | |
Distributions from net investment income | | | (0.07 | ) | | | (0.03 | ) | | | (0.00 | )(b) | | | 0.00 | | | (0.08 | ) |
| | | | | | | | | | | | | | | | | | | |
Total distributions | | | (0.07 | ) | | | (0.03 | ) | | | (0.00 | ) | | | 0.00 | | | (0.08 | ) |
| | | | | | | | | | | | | | | | | | | |
Net Asset Value, End of Period | | $ | 9.42 | | | $ | 21.14 | | | $ | 19.54 | | | $ | 17.47 | | $ | 16.34 | |
| | | | | | | | | | | | | | | | | | | |
Total Return (%) | | | (55.3 | ) | | | 8.3 | | | | 11.9 | | | | 6.9 | | | 17.2 | |
Ratio of operating expenses to average net assets before expense reductions (%) | | | 0.75 | | | | 0.73 | | | | 0.75 | | | | 0.75 | | | 0.75 | |
Ratio of operating expenses to average net assets after expense reductions (%) (c) | | | 0.74 | | | | 0.73 | | | | 0.73 | | | | 0.68 | | | 0.70 | |
Ratio of net investment income to average net assets (%) | | | 0.16 | | | | 0.04 | | | | 0.07 | | | | 0.11 | | | 0.53 | |
Portfolio turnover rate (%) | | | 313 | | | | 113 | | | | 153 | | | | 149 | | | 217 | |
Net assets, end of period (000) | | $ | 470,142 | | | $ | 1,063,017 | | | $ | 981,804 | | | $ | 924,602 | | $ | 963,074 | |
| | | | | | | | | | | | | | | | | | | | |
| | | Class B | |
| | | Year ended December 31, | |
| | | 2008 | | | 2007 | | | 2006 | | | 2005 | | | 2004 | |
Net Asset Value, Beginning of Period | | $ | 20.66 | | | $ | 19.11 | | | $ | 17.13 | | | $ | 16.06 | | | $ | 13.79 | |
| | | | | | | | | | | | | | | | | | | | |
Income From Investment Operations | | | | | | | | | | | | | | | | | | | | |
Net investment income (loss) | | | (0.01 | )(a) | | | (0.04 | )(a) | | | (0.02 | ) | | | (0.01 | ) | | | 0.09 | |
Net realized and unrealized gain (loss) of investments | | | (11.43 | ) | | | 1.59 | | | | 2.00 | | | | 1.08 | | | | 2.23 | |
| | | | | | | | | | | | | | | | | | | | |
Total from investment operations | | | (11.44 | ) | | | 1.55 | | | | 1.98 | | | | 1.07 | | | | 2.32 | |
| | | | | | | | | | | | | | | | | | | | |
Less Distributions | | | | | | | | | | | | | | | | | | | | |
Distributions from net investment income | | | (0.02 | ) | | | 0.00 | | | | 0.00 | | | | 0.00 | | | | (0.05 | ) |
| | | | | | | | | | | | | | | | | | | | |
Total distributions | | | (0.02 | ) | | | 0.00 | | | | 0.00 | | | | 0.00 | | | | (0.05 | ) |
| | | | | | | | | | | | | | | | | | | | |
Net Asset Value, End of Period | | $ | 9.20 | | | $ | 20.66 | | | $ | 19.11 | | | $ | 17.13 | | | $ | 16.06 | |
| | | | | | | | | | | | | | | | | | | | |
Total Return (%) | | | (55.4 | ) | | | 8.1 | | | | 11.6 | | | | 6.7 | | | | 16.8 | |
Ratio of operating expenses to average net assets before expense reductions (%) | | | 1.00 | | | | 0.98 | | | | 1.00 | | | | 1.00 | | | | 1.00 | |
Ratio of operating expenses to average net assets after expense reductions (%) (c) | | | 0.99 | | | | 0.98 | | | | 0.98 | | | | 0.93 | | | | 0.95 | |
Ratio of net investment income (loss) to average net assets (%) | | | (0.09 | ) | | | (0.21 | ) | | | (0.18 | ) | | | (0.13 | ) | | | 0.44 | |
Portfolio turnover rate (%) | | | 313 | | | | 113 | | | | 153 | | | | 149 | | | | 217 | |
Net assets, end of period (000) | | $ | 39,943 | | | $ | 82,675 | | | $ | 67,334 | | | $ | 47,699 | | | $ | 36,819 | |
| Please | see following page for Financial Highlights footnote legend. |
See accompanying notes to financial statements.
MSF-10
Metropolitan Series Fund, Inc.
FI Mid Cap Opportunities Portfolio
Financial Highlights
| | | | | | | | | | | | | | | | | | | | |
| | | Class E | |
| | | Year ended December 31, | |
| | | 2008 | | | 2007 | | | 2006 | | | 2005 | | | 2004 | |
Net Asset Value, Beginning of Period | | $ | 20.89 | | | $ | 19.31 | | | $ | 17.29 | | | $ | 16.19 | | | $ | 13.90 | |
| | | | | | | | | | | | | | | | | | | | |
Income From Investment Operations | | | | | | | | | | | | | | | | | | | | |
Net investment income (loss) | | | 0.00 | (a)(d) | | | (0.02 | )(a) | | | (0.02 | ) | | | (0.01 | ) | | | 0.07 | |
Net realized and unrealized gain (loss) of investments | | | (11.55 | ) | | | 1.60 | | | | 2.04 | | | | 1.11 | | | | 2.28 | |
| | | | | | | | | | | | | | | | | | | | |
Total from investment operations | | | (11.55 | ) | | | 1.58 | | | | 2.02 | | | | 1.10 | | | | 2.35 | |
| | | | | | | | | | | | | | | | | | | | |
Less Distributions | | | | | | | | | | | | | | | | | | | | |
Distributions from net investment income | | | (0.04 | ) | | | 0.00 | | | | 0.00 | | | | 0.00 | | | | (0.06 | ) |
| | | | | | | | | | | | | | | | | | | | |
Total distributions | | | (0.04 | ) | | | 0.00 | | | | 0.00 | | | | 0.00 | | | | (0.06 | ) |
| | | | | | | | | | | | | | | | | | | | |
Net Asset Value, End of Period | | $ | 9.30 | | | $ | 20.89 | | | $ | 19.31 | | | $ | 17.29 | | | $ | 16.19 | |
| | | | | | | | | | | | | | | | | | | | |
Total Return (%) | | | (55.4 | ) | | | 8.2 | | | | 11.7 | | | | 6.7 | | | | 17.0 | |
Ratio of operating expenses to average net assets before expense reductions (%) | | | 0.90 | | | | 0.88 | | | | 0.90 | | | | 0.90 | | | | 0.90 | |
Ratio of operating expenses to average net assets after expense reductions (%) (c) | | | 0.89 | | | | 0.88 | | | | 0.88 | | | | 0.83 | | | | 0.85 | |
Ratio of net investment income (loss) to average net assets (%) | | | 0.01 | | | | (0.12 | ) | | | (0.08 | ) | | | (0.04 | ) | | | 0.55 | |
Portfolio turnover rate (%) | | | 313 | | | | 113 | | | | 153 | | | | 149 | | | | 217 | |
Net assets, end of period (000) | | $ | 14,710 | | | $ | 36,337 | | | $ | 38,839 | | | $ | 38,193 | | | $ | 40,402 | |
| (a) | Per share amount is based on average shares outstanding during the period. |
| (b) | Distributions for the period were less than $0.01. |
| (c) | The Portfolio has entered into arrangements with certain brokers who paid a portion of the Portfolio’s expenses. |
| (d) | Net investment income was less than $0.01 per share. |
See accompanying notes to financial statements.
MSF-11
Metropolitan Series Fund, Inc.
FI Mid Cap Opportunities Portfolio
Notes to Financial Statements—December 31, 2008
Metropolitan Series Fund, Inc. (the “Fund”) is organized as a corporation under the laws of Maryland pursuant to Articles of Incorporation filed on November 23, 1982, as amended, and registered under the Investment Company Act of 1940, as amended (the “1940 Act”), as an open-end investment company. The Fund is a “series” type of mutual fund, which issues separate series of stock. Each series represents an interest in a separate portfolio of Fund investments. The FI Mid Cap Opportunities Portfolio (the “Portfolio”) is a diversified series of the Fund. Shares in the Fund are not offered directly to the general public and are currently available only to separate accounts established by Metropolitan Life Insurance Company (“MetLife”), New England Life Insurance Company, General American Life Insurance Company (“General American”), The MetLife Investors Group of Insurance Companies, MetLife Insurance Company of Connecticut and other affiliated insurance companies (collectively, the “Insurance Companies”) and to certain eligible qualified retirement plans (“Qualified Plans”), as an investment vehicle for variable life insurance, group annuity or variable annuity products of these insurance companies or Qualified Plans, although the Portfolio is not available to all such separate accounts and Qualified Plans. The Portfolio’s shares may be divided into different classes. Currently, the classes being offered by the Portfolio are named Class A, Class B and Class E. The classes of the Portfolio’s shares are identical, except that certain additional charges (Rule 12b-1 fees) are made against Class B and Class E shares. Investment income, realized and unrealized capital gains and losses, the common expenses of the Portfolio and certain Portfolio-level expense reductions, if any, are allocated daily, on a pro rata basis, to each class based on the relative net assets of each class to the total net assets of the Portfolio.
| 2. | SIGNIFICANT ACCOUNTING POLICIES: |
The preparation of financial statements in conformity with accounting principles generally accepted in the United States of America (“GAAP”) requires management to make estimates and assumptions that affect the reported amounts of assets and liabilities and disclosure of contingent assets and liabilities as of the date of the financial statements and the reported amounts of income and expenses during the reporting period. Actual results could differ from those estimates.
The following is a summary of significant accounting policies consistently followed by the Portfolio in the preparation of its financial statements. The policies are in conformity with GAAP.
Investment Valuation:
Debt securities (other than short term obligations with a remaining maturity of sixty days or less) are generally valued on the basis of evaluated or composite bid quotations obtained by independent pricing services and/or brokers and dealers selected by the relevant subadviser pursuant to authorization of the Board of Directors of the Fund (the “Board” or “Directors”). Such quotations take into account appropriate factors such as institutional-sized trading in similar groups of securities, yield, quality, coupon rate, maturity, type of issue, trading characteristics and other data. Short term obligations with a remaining maturity of sixty days or less are valued at amortized cost which approximates fair market value.
Equity securities traded on a national securities exchange or other exchanges are valued at their last sale price on the principal trading market. Equity securities traded on the NASDAQ National Market System are valued at the NASDAQ Official Closing Price (the “NOCP”). The NOCP is the last reported sale price if the last reported sale price falls between the spread of the last reported bid and asked prices. If the last reported bid and asked prices are above the last reported sale price, the NOCP will be the last reported bid price. If the last reported bid and asked prices are below the last reported sale price, the NOCP will be the last reported asked price. Equity securities traded on a national securities exchange or other exchanges or on the NASDAQ National Market System for which there is no reported sale during the day are valued at the last reported bid price. A security that is listed or traded on more than one exchange is valued at the quotation on the exchange determined to be the primary market for that security by the Board or its delegates. If no closing price is available, then such securities are valued by using the last reported bid price. Equity securities traded over-the-counter are valued at the last reported sales price.
If no current market value quotation is readily available or reliable for a portfolio security, fair value will be determined in accordance with procedures established by and under the general supervision of the Board. When the Portfolio uses fair value pricing, it may take into account any factors it deems appropriate. The value of securities used by the Portfolio to calculate its net asset value may differ from quoted or published prices for the same securities. Fair value pricing involves subjective judgments and the fair value determined for a security may be materially different than the value that could be realized upon the sale of that security.
The Portfolio expects to use fair value pricing for securities primarily traded on U.S. exchanges only under very limited circumstances. For example, the Portfolio may use fair value pricing if the exchange on which a security is traded closes early or trading in the security is suspended.
MSF-12
Metropolitan Series Fund, Inc.
FI Mid Cap Opportunities Portfolio
Notes to Financial Statements—December 31, 2008—(Continued)
Securities traded primarily on an exchange outside of the United States which closes before the close of the New York Stock Exchange will be valued at the last sales price on that non-U.S. exchange. Securities traded primarily on an exchange outside of the United States for which there is no reported sale during the day are valued at the mean between the last reported bid and asked prices. However, because most foreign markets close well before the Portfolio values its securities (typically at 4 p.m. Eastern Time), the earlier close of these foreign markets gives rise to the possibility that significant events, including broad market moves, may have occurred after these foreign markets close but before the Portfolio values its securities. To account for this, the Portfolio may frequently value many of its foreign equity securities using fair value prices based on third party vendor modeling tools.
Forward foreign currency exchange contracts are valued based on the mean between closing bid and asked prices of the forward currency contract rates in the London foreign exchange markets on a daily basis as provided by a reliable bank or dealer.
Options, whether on securities, indices, futures contracts, or otherwise, are valued at the last sales price available as of the close of business on the day of valuation or, if there is no such sale price available, at the mean between the bid and asked prices. Options on currencies are valued at the spot price each day.
The value of futures contracts will be the sum of the margin deposit plus or minus the difference between the value of the futures contract on each day the net asset value is calculated and the value on the date the futures contract originated, value being that established on a recognized commodity exchange, or by reference to other customary sources, with gain or loss being realized when the futures contract closes or expires.
Subject to the Board’s oversight, the Board has delegated the day-to-day oversight of pricing matters, including determinations in good faith under the Fund’s procedures the fair value of securities for which current market quotations are not readily available to MetLife Advisers, LLC (“MetLife Advisers” or the “Adviser”).
Investment Transactions and Related Investment Income:
Portfolio security transactions are recorded on the trade date. Dividend income is recorded on the ex-dividend date or, for certain foreign securities, when notified. Interest income, which includes amortization of premium and accretion of discount on debt securities, is recorded on the accrual basis. Realized gains and losses on investments and unrealized appreciation and depreciation are determined on the identified cost basis, which is the same basis used for federal income tax purposes.
Repurchase Agreements:
The Portfolio, through the custodian or a subcustodian, receives delivery of the underlying securities collateralizing repurchase agreements. The Portfolio requires the custodian to take possession, to have legally segregated in the Federal Reserve Book Entry System, or to have segregated within the custodian’s vault, all securities held as collateral for repurchase agreements. It is the Portfolio’s policy that the market value of the collateral be at least equal to 100% of the repurchase price in the case of a repurchase agreement of one-day duration and 102% on all other repurchase agreements. The Portfolio’s subadviser is responsible for determining that the value of the collateral is at all times at least equal to the repurchase price. In connection with transactions in repurchase agreements, if the seller defaults and the value of the collateral declines or if the seller enters an insolvency proceeding, realization of the collateral by the Portfolio may be delayed, limited or wholly denied.
Foreign Currency Translation:
The books and records of the Portfolio are maintained in U.S. dollars. The values of securities, currencies and other assets and liabilities denominated in currencies other than U.S. dollars are translated into U.S. dollars based upon foreign exchange rates prevailing at the end of the period. Purchases and sales of investment securities, income and expenses are translated on the respective dates of such transactions. Since the values of investment securities are presented at the foreign exchange rates prevailing at the end of the period, it is not practical to isolate that portion of the results of operations arising from changes in exchange rates from that portion of the results of operations reflecting fluctuations arising from changes in market prices of the investment securities. Such fluctuations are included in the net realized and unrealized gain or loss on investments.
Net realized foreign exchange gains or losses arise from sales of foreign currency, currency gains or losses realized between the trade and settlement dates on securities transactions, and the difference between the amounts of dividends, interest, and foreign withholding taxes recorded by the Portfolio and the U.S. dollar equivalent of the amounts actually received or paid by the Portfolio. Net unrealized foreign exchange gains and losses arise from changes in the value of assets and liabilities, other than investment securities, resulting from changes in the exchange rate.
MSF-13
Metropolitan Series Fund, Inc.
FI Mid Cap Opportunities Portfolio
Notes to Financial Statements—December 31, 2008—(Continued)
Forward Foreign Currency Exchange Contracts:
The Portfolio may enter into forward foreign currency exchange contracts primarily to hedge against foreign currency exchange rate risks on its non-U.S. dollar denominated investment securities. When entering into a forward currency contract, the Portfolio agrees to receive or deliver a fixed quantity of foreign currency for an agreed-upon price on an agreed future date. These contracts are valued daily and the Portfolio’s net equity therein, representing unrealized gain or loss on the contracts as measured by the difference between the foreign exchange rates at the dates of entry into the contracts and the forward rates at the settlement date, is included in the Statement of Assets and Liabilities. Realized and unrealized gains and losses are included in the Statement of Operations. These instruments involve market and/or credit risk in excess of the amount recognized in the Statement of Assets and Liabilities. Risks arise from the possible inability of counterparties to meet the terms of their contracts and from movement in currency and securities values and interest rates.
Futures Contracts:
The Portfolio may buy and sell futures contracts (on recognized exchanges) as a hedge, to maintain exposure to the broad equity markets or to enhance return. Futures contracts are agreements to buy or sell a security, or deliver a final cash settlement price in connection with an index, interest rate, currency, or other contracts not calling for physical delivery, for a set price in the future. The Portfolio must post an amount equal to a portion of the total market value of the futures contract as futures variation margin, which is returned when the Portfolio’s obligations under the contract have been satisfied. From time to time thereafter, the Portfolio may have to post variation margin to maintain this amount as the market value of the contract fluctuates. Risks of entering into futures contracts (and related options) include the possibility that there may be an illiquid market and that a change in the value of the contract or option may not correlate with changes in the value of the underlying securities.
Options:
The Portfolio may use options to hedge against changes in values of securities the Portfolio owns or expects to purchase, to maintain exposure to the broad equity markets or to enhance return. Writing puts or buying calls tends to increase the Portfolio’s exposure to the underlying instrument and writing calls or buying puts tends to decrease the Portfolio’s exposure to the underlying instrument, and can be used to hedge other Portfolio investments. For options purchased to hedge the Portfolio’s investments, the potential risk to the Portfolio is that the change in value of options contracts may not correspond to the change in value of the hedged instruments. In addition, losses may arise from changes in the value of the underlying instruments, if there is an illiquid secondary market, or if the counterparty is unable to perform. The maximum loss for purchased options is limited to the premium initially paid for the option. For options written by the Portfolio, the maximum loss is not limited to the premium initially received for the option.
The main risk associated with purchasing an option is that the option expires without being exercised. In this case, the option expires worthless and the premium paid for the option is considered the loss. The risk associated with writing a call option is that the Portfolio may forgo the opportunity for a profit if the market value of the underlying position increases and the option is exercised. The risk in writing a put option is that the Portfolio may incur a loss if the market value of the underlying position decreases and the option is exercised. In addition, the Portfolio risks not being able to enter into a closing transaction for the written option as the result of an illiquid market.
“When-Issued” Securities:
Purchasing securities “when-issued” is a forward commitment by the Portfolio to buy a security. The estimated amount of the Portfolio’s payment obligation and the security’s interest rate are determined when the commitment is made, even though no interest accrues until the security is issued, which is generally 15 to 120 days later. The Portfolio will segregate liquid assets with its custodian sufficient at all times to satisfy these commitments. If the value of the security is less when delivered than when the commitment was made, the Portfolio will suffer a loss.
Federal Income Taxes:
It is the Portfolio’s policy to comply with the requirements of the Internal Revenue Code of 1986, as amended (the “Code”), and regulations thereunder, applicable to regulated investment companies and to distribute, with respect to each taxable year, all of its taxable income to shareholders. Therefore, no federal income tax provision is required. The Portfolio is subject to the provisions of the Financial Accounting Standards Board Interpretation (“FASB”) No. 48, Accounting for Uncertainties in Income
MSF-14
Metropolitan Series Fund, Inc.
FI Mid Cap Opportunities Portfolio
Notes to Financial Statements—December 31, 2008—(Continued)
Taxes (FIN 48). FIN 48 sets forth a minimum threshold for financial statement recognition of the benefit of a tax position taken or expected to be taken in a tax return. The implementation of FIN 48 did not result in any unrecognized tax benefits in the accompanying financial statements. Each of the Portfolio’s federal tax returns for the prior three fiscal years remains subject to examination by the Internal Revenue Service.
As of December 31, 2008, the Portfolio had capital loss carryforwards as follows:
| | | | | | | | | | | | |
Expiring
12/31/16 | | Expiring
12/31/11 | | Expiring
12/31/10 | | Expiring
12/31/09 | | Total |
$346,738,065 | | $ | 16,477,953 | | $ | 376,464,857 | | $ | 33,105,061 | | $ | 772,785,936 |
Pursuant to Section 852 of the Code, the Portfolio designated the amount shown below under Long Term Gain as capital gain dividends for its taxable year ended December 31, 2008. The tax character of distributions paid for the periods ended December 31, 2008 and 2007 was as follows:
| | | | | | | | | | | | | | | | | | | | | | |
| Ordinary Income | | Long Term Gain | | Return of Capital | | Total |
| 2008 | | 2007 | | 2008 | | 2007 | | 2008 | | 2007 | | 2008 | | 2007 |
| $ | 3,610,996 | | $ | 1,402,145 | | $ | — | | $ | — | | $ | — | | $ | — | | $ | 3,610,996 | | $ | 1,402,145 |
As of December 31, 2008, the components of distributable earnings (accumulated losses) on a federal income tax basis were as follows:
| | | | | | | | | | | | | | | | |
Undistributed
Ordinary
Income | | Undistributed
Long Term
Gain | | Unrealized
Depreciation | | | Loss
Carryforwards | | | Total | |
| $ | 8,721,229 | | $ | — | | $ | (161,058,882 | ) | | $ | (772,785,936 | ) | | $ | (925,123,589 | ) |
Pursuant to Federal income tax regulations applicable to investment companies, the Portfolio has elected to treat net capital losses realized between November 1 and December 31 of each year as occurring on the first day of the following tax year. For the year ended December 31, 2008, the following amounts of realized capital and currency losses reflected in the accompanying financial statements will not be recognized for Federal income tax purposes until January 1, 2009:
| | | | |
Currency | | Capital | |
$— | | $ | (131,368,064 | ) |
Dividends and Distributions to Shareholders:
The Portfolio records dividends and distributions on the ex-dividend date. Net realized gains from security transactions (if any) are generally distributed annually to shareholders. The timing and characterization of certain income and capital gains distributions are determined in accordance with federal tax regulations that may differ from GAAP. Permanent book and tax basis differences relating to shareholder distributions will result in reclassification between under/over distributed net investment income, accumulated net realized gains/losses and paid in capital.
Expense Reductions:
Certain Portfolio trades are directed to brokers who paid a portion of the Portfolio’s expenses. Amounts paid for the Portfolio are shown as expense reductions in the Statement of Operations.
| 3. | INVESTMENT TRANSACTIONS: |
For the year ended December 31, 2008, purchases and sales of securities (excluding short term investments) for the Portfolio were as follows:
| | | | | | | | | | |
| Purchases | | Sales |
U.S. Government | | Other | | U.S. Government | | Other |
| $ | 0 | | $ | 2,830,433,576 | | $ | 0 | | $ | 2,850,086,343 |
MSF-15
Metropolitan Series Fund, Inc.
FI Mid Cap Opportunities Portfolio
Notes to Financial Statements—December 31, 2008—(Continued)
| 4. | INVESTMENT MANAGEMENT FEES AND OTHER TRANSACTIONS WITH AFFILIATES: |
Investment Management Agreement:
MetLife Advisers is the investment adviser to the Portfolio. The Fund has entered into an investment management agreement with MetLife Advisers with respect to the Portfolio. For providing investment management services to the Portfolio, MetLife Advisers receives monthly compensation at the following annual rates:
| | | | |
Management
Fees earned by
MetLife Advisers
for the year ended
December 31, 2008 | | Annual
percentage
rates paid to
MetLife Advisers | | Based on Portfolios
average daily net asset
levels |
| $6,148,389 | | 0.750% | | Of the first $100 million |
| | 0.700% | | Of the next $400 million |
| | 0.650% | | On amounts in excess of $500 million |
Certain officers and directors of the Fund may also be officers of MetLife Advisers; however, such officers and directors receive no compensation from the Fund.
Fidelity Management & Research Company (“FMR”) was compensated by MetLife Advisers to provide subadvisory services to the Portfolio from January 1, 2008 through April 27, 2008. Effective April 28, 2008, Pyramis Global Advisors, LLC, a wholly owned subsidiary of FMR, became subadviser to the Portfolio and receives compensation for providing subadvisory services thereto.
During the period, Pyramis Global Advisors, LLC reimbursed MetLife Advisers $877,217, representing the cost of certain brokerage services and commissions incurred by the Portfolio in connection with a change of portfolio manager. MetLife Advisers reimbursed the Portfolio the same amount to pass the benefit of this reimbursement onto the Portfolio.
Service and Distribution Fees:
The Fund has adopted a Distribution and Service Plan under Rule 12b-1 of the 1940 Act for the Portfolio’s Class B and E shares. Under the Distribution and Service Plan, the Class B and E shares of the Portfolio pay a fee to compensate the Insurance Companies (or their affiliates) and other broker-dealers and financial intermediaries involved in the offer and sale of Portfolio shares for promoting or selling and servicing the Class B and E shares. The fees under the Distribution and Service Plan for each class of the Portfolio’s shares are calculated as a percentage of the Portfolio’s average daily net assets that are attributable to that Class. Currently, the fee is 0.25% per year for Class B shares and 0.15% per year for Class E shares. Amounts paid by the Portfolio for the year ended December 31, 2008 are shown as Service and Distribution fees in the Statement of Operations.
The Fund has entered into a securities lending arrangement with the Fund’s custodian, State Street Bank and Trust Company (the “custodian”). Under the agreement, the custodian is authorized to loan securities on the Portfolios’ behalf. In exchange, the Portfolio receives either cash or securities as collateral against the loaned securities. The Portfolio receives collateral at least equal to 102% of the market value of the loaned securities (105% for foreign securities), at each loan’s inception. Collateral must be maintained at least at 100% of the market value of the loaned securities for the duration of the loan. The cash collateral is invested in the Navigator Securities Lending Prime Portfolio, an affiliate of the custodian, which invests in a variety of high quality U.S. dollar-denominated instruments. If the market value of the collateral at the close of trading on a business day is less than 100% of the market value of the loaned securities at the close of trading on that day, the borrower shall be required to deliver, by the close of business on the following business day, an additional amount of collateral, equal to at least 100% of the market value of all the loaned securities as of such preceding day. The Portfolio receives 80% of the annual net income from securities lending transactions, which is included in interest income of the Portfolio. The remaining 20% is paid to the custodian as compensation for its securities lending services. Interest income received by the Portfolio via lending transactions during the year ended December 31, 2008 is footnoted in the Statement of Operations. The Portfolio bears the risk of any deficiency in the amount of collateral available for return to a borrower due to a loss in an approved investment purchased with such collateral. Any outstanding loans by the Portfolio at December 31, 2008 are footnoted in the Schedule of Investments.
| 6. | MARKET AND CREDIT RISK: |
In the normal course of business, the Portfolio invests in securities and enters into transactions where risks exist due to fluctuations in the market (market risk) or failure of the other party to a transaction to perform (credit risk). The value of
MSF-16
Metropolitan Series Fund, Inc.
FI Mid Cap Opportunities Portfolio
Notes to Financial Statements—December 31, 2008—(Continued)
securities held by the Portfolio may decline in response to certain events, including those directly involving the companies whose securities are owned by the Portfolio; conditions affecting the general economy; overall market changes; local, regional or global political, social or economic instability; and currency and interest rate and price fluctuations. Similar to credit risk, the Portfolio may be exposed to counterparty risk, or the risk that an entity with which the Portfolio has unsettled or open transactions may default. Financial assets, which potentially expose the Portfolio to credit and counterparty risks, consist principally of investments and cash due from counterparties. The extent of the Portfolio’s exposure to credit and counterparty risks in respect to these financial assets approximates their value as recorded in the Portfolio’s Statements of Assets and Liabilities.
| 7. | RECENT ACCOUNTING PRONOUNCEMENTS: |
In March 2008, the FASB issued Statement of Financial Accounting Standards No. 161, Disclosures about Derivative Instruments and Hedging Activities (“FAS 161”), an amendment of FASB Statement No. 133. FAS 161 requires enhanced disclosures about (a) how and why an entity uses derivative instruments, (b) how derivative instruments and hedging activities are accounted for, and (c) how derivative instruments and related hedging activities affect a fund’s financial position, financial performance, and cash flows. Management does not believe the adoption of FAS 161 will materially impact the financial statement amounts, but will require additional disclosures. This will include qualitative and quantitative disclosures on derivative positions existing at period end and the effect of using derivatives during the reporting period. FAS 161 is effective for financial statements issued for fiscal years and interim periods beginning after November 15, 2008. Management is currently evaluating the impact the adoption of FAS 161 will have on the Portfolio’s financial statement disclosures.
MSF-17
Metropolitan Series Fund, Inc.
FI Mid Cap Opportunities Portfolio
Report of Independent Registered Public Accounting Firm
To the Shareholders and Board of Directors of Metropolitan Series Fund, Inc.:
We have audited the accompanying statement of assets and liabilities, including the schedule of investments, of the Fl Mid Cap Opportunities Portfolio (one of the portfolios constituting the Metropolitan Series Fund, Inc.) (the “Fund”) as of December 31, 2008, and the related statement of operations for the year then ended, the statements of changes in net assets for each of the two years in the period then ended, and the financial highlights for each of the five years in the period then ended. These financial statements and financial highlights are the responsibility of the Fund’s management. Our responsibility is to express an opinion on these financial statements and financial highlights based on our audits.
We conducted our audits in accordance with the standards of the Public Company Accounting Oversight Board (United States). Those standards require that we plan and perform the audit to obtain reasonable assurance about whether the financial statements and financial highlights are free of material misstatement. The Fund is not required to have, nor were we engaged to perform, an audit of its internal control over financial reporting. Our audits included consideration of internal control over financial reporting as a basis for designing audit procedures that are appropriate in the circumstances, but not for the purpose of expressing an opinion on the effectiveness of the Fund’s internal control over financial reporting. Accordingly, we express no such opinion. An audit also includes examining, on a test basis, evidence supporting the amounts and disclosures in the financial statements, assessing the accounting principles used and significant estimates made by management, as well as evaluating the overall financial statement presentation. Our procedures included confirmation of securities owned as of December 31, 2008, by correspondence with the custodian and brokers; where replies were not received from brokers, we performed other auditing procedures. We believe that our audits provide a reasonable basis for our opinion.
In our opinion, the financial statements and financial highlights referred to above present fairly, in all material respects, the financial position of the Fl Mid Cap Opportunities Portfolio of the Metropolitan Series Fund, Inc. as of December 31, 2008, the results of its operations for the year then ended, the changes in its net assets for each of the two years in the period then ended, and the financial highlights for each of the five years in the period then ended, in conformity with accounting principles generally accepted in the United States of America.
Deloitte & Touche LLP
Boston, Massachusetts
February 23, 2009
MSF-18
Metropolitan Series Fund, Inc.
Directors and Officers
The Fund’s Directors review actions of the Fund’s investment adviser and subadvisers, and decide upon matters of general policy. The Fund’s officers supervise the daily business operations of the Fund. The Board of Directors and the Fund’s officers are listed below. Each Director is responsible for overseeing all 38 Portfolios of the Fund. There is no limit to the term a Director may serve. Directors serve until their resignation, retirement or removal in accordance with the Fund’s organizational documents and policies adopted by the Board from time to time. Officers hold office at the pleasure of the Board or until the election or appointment and the qualification of a successor. The address of the Directors and officers is c/o Metropolitan Series Fund, Inc., 501 Boylston Street, Boston, MA 02116.
Interested Directors(1)
Each Director below is an “interested person” (as defined by the 1940 Act) with respect to the Fund in that Ms. Forget is an employee of MetLife and Mr. Typermass is a former employee of MetLife and owns securities issued by MetLife, Inc., the ultimate parent company of MetLife Advisers.
| | | | | | | | |
Name, Address and Age | | Current
position(s)
with Fund | | Position(s)
held since | | Principal occupations
over past five years, including other directorships(2) | | Number of
Portfolios in
Fund Complex
Overseen by
Director(3) |
Elizabeth M. Forget Age: 42 | | Director, Chairman of the Board, President and Chief Executive Officer | | 2006 | | Senior Vice President (since 2007), MetLife, Inc.; President, Met Investors Advisory, LLC; Trustee and President, Met Investors Series Trust; Executive Vice President, MetLife Investors Group, Inc.; President, Chief Executive Officer and Chair of the Board of Managers (since 2006), MetLife Advisers; President, Met Investors Advisory, LLC. | | 87 |
| | | | |
Arthur G. Typermass Age: 71 | | Director | | 1998 | | Formerly, Senior Vice President and Treasurer, MetLife. | | 38 |
Non-Interested Directors(1)
Each Director below is not an “interested person” (as defined by the 1940 Act) with respect to the Fund (collectively, the “Independent Directors”).
| | | | | | | | |
Name, Address and Age | | Current
position(s)
with Fund | | Position(s)
held since | | Principal occupations
over past five years, including other directorships(2) | | Number of
Portfolios in
Fund Complex
Overseen by
Director(3) |
Steve A. Garban† Age: 71 | | Director | | 1985 | | Formerly, Chief Financial Officer, Senior Vice President Finance and Operations and Treasurer (Emeritus), The Pennsylvania State University. | | 38 |
| | | | |
Linda B. Strumpf Age: 61 | | Director | | 2000 | | Vice President and Chief Investment Officer, Ford Foundation. | | 38 |
| | | | |
Michael S. Scott Morton† Age: 71 | | Director | | 1993 | | Jay W. Forrester Professor of Management (Emeritus) at Sloan School of Management, MIT. | | 38 |
| | | | |
H. Jesse Arnelle Age: 75 | | Director | | 2001 | | Formerly, Counsel, Womble Carlyle Sandrie & Rice; Director, Textron Inc. (global multi- industry company)*; formerly, Director, Gannet Co. Inc. (diversified news and information company)*; formerly, Director, Eastman Chemical Company (global chemical company)*; formerly, Director, Waste Management, Inc.*; formerly, Director, Armstrong Holdings Inc. (parent company of floor and ceiling products business)*; formerly, Director, FPL Group Inc. (public utility holding company)*; Director, URS Corporation (engineering design services firm)*. | | 38 |
MSF-19
Metropolitan Series Fund, Inc.
Directors and Officers—(Continued)
| | | | | | | | |
Name, Address and Age | | Current
position(s)
with Fund | | Position(s)
held since | | Principal occupations
over past five years, including other directorships(2) | | Number of
Portfolios in
Fund Complex
Overseen by
Director(3) |
Nancy Hawthorne Age: 57 | | Director | | 2003 | | Chief Executive Officer, Clerestory LLC (corporate financial advisor); Director, Avid Technologies (computer software company)*; formerly, Chairman of the Board of Avid Technologies; formerly, Board of Advisors, L. Knife & Sons, Inc. (beverage distributor); formerly, Trustee, New England Zenith Fund (“Zenith Fund”)**; formerly, Chief Executive Officer and Managing Partner, Hawthorne, Krauss and Associates (corporate financial advisor); formerly, Chief Financial Officer and Executive Vice President, Continental Cablevision, subsequently renamed MediaOne (cable television company); formerly, Director, Life F/X, Inc.; formerly, Chairman of the Board, WorldClinic (distance medicine company); formerly, Director, Perini Corporation (construction company)*; formerly, Director, CGU (property and casualty insurance company); formerly, Director, Beacon Power Corporation (energy company)*. | | 38 |
| | | | |
John T. Ludes Age: 72 | | Director | | 2003 | | President, LFP Properties (consulting firm); Formerly, Trustee, Zenith Fund**; formerly, Vice Chairman, President and Chief Operating Officer, Fortune Brands/American Brands (global conglomerate); formerly, President and CEO, Acushnet Company (athletic equipment company). | | 38 |
Officers(1)
| | | | | | | | |
Name and address | | Age | | Current
position(s)
with Fund | | Position(s)
held since | | Principal occupations over past five years(2) |
| Jeffrey L. Bernier | | 37 | | Senior Vice President | | 2008 | | Vice President (since 2008), MetLife, Inc.; Vice President (since 2008), MetLife; Senior Vice President (since 2008), MetLife Advisers; formerly, Director and Senior Investment Analyst (2004 to 2007), John Hancock Financial Services; formerly, Assistant Vice President (2000 to 2001), Wachovia Securities. |
| | | | |
| Alan C. Leland | | 56 | | Senior Vice President | | 2005 | | Treasurer and Chief Financial Officer, MetLife Advisers, LLC; Treasurer (since 2005), Met Investors Advisory, LLC; Vice President (since 2004), Met Investors Advisory, LLC; Vice President (since 2003), MetLife, Inc.; Vice President, MetLife; Senior Vice President, NELICO. |
| | | | |
| Peter Duffy | | 53 | | Vice President
and Treasurer | | 2000 | | Senior Vice President, MetLife Advisers; Second Vice President (since 2003), NELICO; Vice President, MetLife (since 2004); Vice President (since 2004), MetLife, Inc.; formerly, Vice President and Treasurer, Zenith Fund**. |
| | | | |
| Jeffrey P. Halperin | | 41 | | Chief
Compliance Officer | | 2007 | | Vice President (since 2006), MetLife, Inc.; Vice President (since 2006), MetLife; Chief Compliance Officer (since 2006), Met Investors Series Trust, MetLife Advisers, Met Investors Advisory, LLC and MetLife Investment Advisors Company, LLC. |
| * | Indicates a directorship with a registered investment company or a company subject to the reporting requirements of the Securities Exchange Act of 1934, as amended. |
| ** | The Zenith Fund deregistered with the Securities and Exchange Commission (“SEC”) in 2004. |
| (†) | Served as a trustee, director and/or officer of one or more of the following companies, each of which had a direct or indirect advisory relationship with MetLife Advisers or its affiliates prior to January 31, 2005: State Street Research Financial Trust, State Street Research Income Trust, State Street Research Money Market Trust, State Street Research Institutional Funds, State Street Research Capital Trust, State Street Research Master Investment Trust, State Street Research Equity Trust, State Street Research Securities Trust and State Street Research Exchange Trust (collectively, the “State Street Research Funds”). |
| (1) | During the period shown, each Director of the Fund served as a Trustee of Metropolitan Series Fund II, a registered investment company that ceased investment operations in June of 2008 and has applied for deregistration under the Investment Company Act of 1940. During this period, each officer of the Fund served in the same position with Metropolitan Series Fund II. |
| (2) | Previous positions during the past five years with the Fund; Met Investors Series Trust; MetLife; MetLife, Inc.; MetLife Advisers; Met Investors Advisory, LLC; Zenith Fund; NELICO; or New England Securities Corporation are omitted if not materially different. |
| (3) | The Fund Complex includes the Fund (38 portfolios) and Met Investors Series Trust (49 portfolios). |
MSF-20
Metropolitan Series Fund, Inc.
FI Mid Cap Opportunities Portfolio
Board Approval of Advisory and Subadvisory Agreements
The Fund’s Contract Review Committees of the Board of Directors (the “Board” or the “Directors”) typically meet in early fall to review the Portfolios’ advisory agreements (the “Advisory Agreements”) and subadvisory agreements (the “Subadvisory Agreements,” and, together with the Advisory Agreements, the “Agreements”) and determine whether to recommend that the full Board approve the continuation of the Agreements for an additional one-year period. (Following the initial approval of an Agreement for a new Portfolio or with a new adviser or subadviser, such annual reviews are not required until 2 years following the execution of such Agreement.) After each Committee has made its recommendations, the full Board, including the Independent Directors, determines whether to approve the continuation of each of the Agreements. In addition, the Board, including the Independent Directors, considers matters bearing on the Agreements at most of its other meetings throughout the year and regularly interviews various individuals at MetLife Advisers responsible for the management of the Portfolios. The Directors also interview selected investment managers and other professionals at the subadvisers at various times throughout the year.
The Directors receive all materials that they or MetLife Advisers, the Fund’s investment adviser, and the subadvisers believe to be reasonably necessary for the Directors to evaluate the Agreements and determine whether to approve the continuation of the Agreements. These materials generally include, among other items, (i) information on the investment performance of the Portfolios and the performance of peer groups of funds and the Portfolios’ performance benchmarks, (ii) information on the Portfolios’ advisory and subadvisory fees and other expenses, including information comparing the Portfolios’ expenses to those of peer groups of funds and information about any applicable expense caps and fee “breakpoints,” (iii) sales and redemption data, (iv) information related to the profitability of the Agreements to MetLife Advisers and certain of the subadvisers, and potential “fall-out” or ancillary benefits that MetLife Advisers, the subadvisers or their affiliates may receive as a result of their relationships with the Fund and (v) information obtained through the subadvisers’ responses to certain requests from MetLife Advisers and the Directors and MetLife Advisers’ responses to requests from the Directors. The Directors may also consider other information such as (vi) MetLife Advisers’ and the subadvisers’ financial results and condition, (vii) each Portfolio’s investment objectives and strategies and the size, education and experience of the investment staffs of MetLife Advisers and the relevant subadvisers and their use of technology and external research, (viii) the allocation of the Portfolios’ brokerage, if any, including allocations to brokers affiliated with the subadvisers and the use of “soft” commission dollars to pay Portfolio expenses and to pay for research and other similar services, (ix) the resources devoted to, and the record of compliance with, the Portfolios’ investment policies and restrictions, policies on personal securities transactions and other compliance policies, (x) the responses of MetLife Advisers, the subadvisers and/or their affiliates to certain legal and regulatory proceedings and (xi) the economic outlook generally and for the mutual fund industry in particular. Throughout the process, the Directors have the opportunity to ask questions of and request additional materials from MetLife Advisers and the subadvisers.
Following meetings of each Contract Review Committee on September 10, 2008, the Board, including the Independent Directors, at its November 6-7, 2008 meeting, approved the continuation through December 31, 2009 of the Advisory Agreements for each Portfolio of the Fund and the Subadvisory Agreements for each Portfolio other than the Zenith Equity Portfolio and Asset Allocation Portfolios (which do not have subadvisers) and the Van Eck Global Natural Resources Portfolio, Met/Dimensional International Small Cap Portfolio and Loomis Sayles Small Cap Growth Portfolio (formerly known as the Franklin Templeton Small Cap Growth Portfolio). The Agreements approved for continuation are referred to below as the “Continued Agreements.”
In considering whether to approve the continuation of the Continued Agreements, the Directors, including the Independent Directors, did not identify any single factor as determinative, and each weighed the various factors as he or she deemed appropriate. The Directors considered the following matters in connection with their approval of the Continued Agreements:
The nature, extent and quality of the services provided to the relevant Portfolios under the Continued Agreements. The Directors considered the nature, extent and quality of the services provided by MetLife Advisers, the relevant subadvisers (if any) and their affiliates (each, an “Adviser,” and, collectively, the “Advisers”) to the relevant Portfolios pursuant to the Continued Agreements and the resources dedicated to these Portfolios by the Advisers. In particular, the Directors considered the Advisers’ abilities to attract and retain highly qualified investment professionals. With respect to MetLife Advisers, the Directors considered (for each Portfolio other than the Zenith Equity and Asset Allocation Portfolios) that MetLife Advisers is (i) ultimately responsible for the performance of such Portfolios; (ii) ultimately responsible for the establishment of the investment strategies of each such Portfolio, primarily through its recommendations to the Board regarding the hiring and selection of subadvisers; (iii) responsible for the hiring and selection, subject to Board approval, of subadvisers; and (iv) responsible for maintaining a program of Subadviser oversight reasonably designed to ensure that the subadvisers have reasonable compliance policies and procedures in place. The Directors also considered that MetLife Advisers provides a full range of day-to-day administrative services for the Portfolios involving all aspects of such Portfolios’ day-to-day operations (other than portfolio management). With respect to the Zenith Equity and Asset Allocation Portfolios, the Directors considered both the portfolio management services and the administrative services provided by MetLife Advisers. After reviewing
MSF-21
Metropolitan Series Fund, Inc.
FI Mid Cap Opportunities Portfolio
Board Approval of Advisory and Subadvisory Agreements—(Continued)
these and related factors, the Directors concluded, within the context of their overall conclusions regarding each of the Continued Agreements, that the nature, extent and quality of services provided supported the renewal of these Agreements.
Investment performance of the relevant Portfolios. The Directors reviewed information about the performance of the relevant Portfolios over various time periods, including information prepared by an independent third party that compared the performance of the Portfolios to the performance of peer groups of funds and performance benchmarks. The Directors also reviewed a description of the third party’s methodology for identifying a Portfolio’s peer group(s) for purposes of performance and expense comparisons.
In the case of each relevant Portfolio that had performance that lagged its peer group(s) for certain periods, the Directors concluded that other factors relevant to performance were sufficient, in light of other considerations, to warrant renewal of the Continued Agreements relating to such Portfolio. These factors varied from Portfolio to Portfolio, but included one or more of the following: (i) that such Portfolio’s performance, although lagging in certain recent periods, was stronger over the longer term; (ii) that the underperformance was attributable, to a significant extent, to investment decisions that were reasonable and consistent with the Portfolio’s investment objective(s) and policies and that the Portfolio was performing within the range of reasonable expectations, given market conditions and the Portfolio’s investment objective(s) and policies; (iii) that the Portfolio’s performance was competitive when compared to other relevant performance benchmarks or peer groups; and (iv) that MetLife Advisers and/or the relevant subadviser (if any) had taken or was taking steps designed to help improve the Portfolio’s investment performance (including, in the case of certain Portfolios, that MetLife Advisers was formulating possible proposals, for presentation to the Board in November 2008, to replace the Portfolio’s subadviser or to merge the Portfolio into another Portfolio with a similar investment objective and better investment performance).
The Directors also considered the investment performance of the Advisers and their reputations generally, the historical responsiveness of the Advisers to Director concerns about performance and the willingness of the Advisers to take steps intended to improve performance.
After reviewing these and related factors, the Directors concluded, within the context of their overall conclusions regarding each of the Continued Agreements, that the investment performance of each relevant Portfolio and Adviser was sufficient, in light of other considerations, to warrant the renewal of the Continued Agreements.
The costs of the services to be provided and profits to be realized by the Advisers and their affiliates from their relationships with the Portfolios. The Directors considered the fees charged by MetLife Advisers to the Portfolios for advisory services and, with respect to the subadvised Portfolios, by such subadvisers to MetLife Advisers for subadvisory services (such advisory and subadvisory fees (if any), collectively, “Fees”), as well as the total expense levels of the Portfolios. This information included comparisons (provided by an independent third party) of the Portfolios’ advisory fees and total expense levels to those of their peer groups. In evaluating Fees for the relevant Portfolios, the Directors also took into account the demands, complexity and quality of the investment management services provided to each Portfolio. The Directors considered MetLife Advisers’ recommendations regarding reductions in Fee rates, implementation of Fee breakpoints and institution of Fee waivers and expense caps.
The Directors also considered the compensation directly or indirectly received by the Advisers and their affiliates from their relationships with the relevant Portfolios. The Directors reviewed information relating to the profits received by MetLife Advisers, certain of the subadvisers and their affiliates as a result of their relationships with the relevant Portfolios, and information about the allocation of expenses used to calculate profitability. When reviewing profitability, the Directors also considered the performance of the relevant Portfolios, the expense levels of such Portfolios and whether the relevant Advisers had implemented breakpoints, fee waivers and/or expense caps with respect to such Portfolios.
After reviewing these and related factors, the Directors concluded, within the context of their overall conclusions regarding each of the Continued Agreements, that the Fees charged to each of the relevant Portfolios were fair and reasonable, and that the information provided regarding costs of these services generally, and the related profitability (if known) to the relevant Advisers of their relationships with the relevant Portfolios, supported the renewal of the Continued Agreements.
Economies of Scale. The Directors considered the existence of any economies of scale in the provision of services by the Advisers and whether those economies were shared with the relevant Portfolios through breakpoints in their advisory fees or other means, such as expense caps, fee waivers or relatively low levels of fees. The Directors noted that most of the relevant Portfolios benefited or will benefit from breakpoints, expense caps and/or fee waivers with respect to their advisory fees. In considering these issues, the Directors also took into consideration information relating to the costs of the services provided and the profitability to MetLife Advisers, the relevant subadvisers (if any) and each of their affiliates of their relationships with the relevant Portfolios, as discussed above.
MSF-22
Metropolitan Series Fund, Inc.
FI Mid Cap Opportunities Portfolio
Board Approval of Advisory and Subadvisory Agreements—(Continued)
After reviewing these and related factors, the Directors concluded, within the context of their overall conclusions regarding each of the Continued Agreements, that the extent to which economies of scale were shared with the relevant Portfolios supported the renewal of such Agreements.
Other Factors. The Directors also considered other factors, which included but were not limited to the following:
| | • | | the extent to which each relevant Portfolio operated in accordance with its investment objective, and its record of compliance with its investment restrictions and the compliance programs of the Fund and the Advisers. They also considered the compliance-related resources the Advisers and their affiliates provide to the relevant Portfolios; |
| | • | | the nature, quality, cost and extent of administrative and shareholder services performed by MetLife Advisers and its affiliates under the Advisory Agreements; and |
| | • | | so-called “fall-out benefits” to the Advisers, such as the engagement of their affiliates to provide distribution, brokerage and transfer agency services to the Portfolios, and the benefits of research made available to the relevant Advisers by reason of brokerage commissions generated by the relevant Portfolios’ securities transactions. The Directors also considered the possible conflicts of interest associated with these fall-out and other benefits, and the reporting and other processes in place to disclose and monitor these possible conflicts of interest. |
Based on their evaluation of all factors that they deemed to be material, including those factors described above, and assisted by the advice of independent counsel, the Directors, including the Independent Directors, concluded that each of the Continued Agreements should be continued through December 31, 2009.
MSF-23
A description of the policies and procedures that the Fund uses to determine how to vote proxies relating to portfolio securities is available (i) without charge, upon request, by calling (800) 638-7732 and (ii) on the Securities and Exchange Commission’s (the “SEC”) website at http://www.sec.gov.
Information regarding how the Fund voted proxies relating to portfolio securities during the most recent twelve-month period ended December 31, 2008 is available (i) without charge, upon request, by calling (800) 638-7732 and (ii) on the SEC’s website at http://www.sec.gov.
The Fund’s Statement of Additional Information includes additional information about the Directors of the Fund and is available (i) without charge, upon request, by calling (800) 638-7732 and (ii) on the SEC’s website at http://www.sec.gov.
The Fund files with the SEC a complete schedule of its portfolio holdings, as of the close of the first and third quarters of its fiscal year, on “Form N-Q”. These filings are available on the SEC’s website at www.sec.gov and may be reviewed and copied at the SEC’s Public Reference Room in Washington, DC. (Call 1-800-SEC-0330 for information on the operation of the Public Reference Room.)
MSF-24
Simplify your life…
with MetLife eDelivery® while helping MetLife preserve the planet’s natural resources.
(see details on inside cover)
| | |
Metropolitan Series Fund, Inc. FI Value Leaders Portfolio Annual Report | | December 31, 2008 |
NOT PART OF THE ANNUAL REPORT
Letter from the President
February 1, 2009
Letter to Policy Holders:
2008 was an extraordinary year in the capital markets around the world and for the global economy. Energy prices rose to record levels early in the year before falling by two-thirds by year-end. A credit crisis that began with concerns about sub-prime mortgages led to massive changes in the financial landscape with government takeovers, forced sales, and outright failures of a number of large, once venerable firms.
While bonds as measured by the Barclays Capital U.S. Aggregate Bond Index (formerly known as, Lehman Brothers U.S. Aggregate Bond Index) were up 5.2% for the year in response to declining interest rates, there were large differences in the total returns of the various sectors of the bond market. U.S. treasury securities were up over 13% as frightened investors sought refuge in what they perceived to be the safest and most liquid investments. In contrast, investment grade corporate securities lost nearly 5% as credit spreads widened and below investment grade or high yield bonds fell over 26%.
In response to the growing credit crisis and the weakening economy, common stocks fell sharply across all regions, styles, and capitalizations. As measured by the Standard and Poor’s 500, U.S. common stocks fell 37% for the year, the worst calendar year decline since the 1930s. Foreign stocks were down even more with the MSCI EAFE Index down 43% for the year.
On the following pages, you will find a complete review of your Portfolio and its investment performance.
MetLife is committed to building your financial freedom. We appreciate your trust and will continue to focus our efforts on meeting your investment needs.
Sincerely,
Elizabeth M. Forget
President, Metropolitan Series Fund, Inc.
Metropolitan Series Fund, Inc.
FI Value Leaders Portfolio
Managed by Fidelity Management & Research Company
Portfolio Manager Commentary*
PORTFOLIO PERFORMANCE
For the twelve-month period ended December 31, 2008, the Class A shares of the FI Value Leaders Portfolio returned -38.9%, compared to its benchmark, the Russell 1000 Value Index1, which returned -36.8%. The average return of its peer group, the Lipper Variable Insurance Products2 Multi-Cap Value Funds Universe, was -36.8% over the same period.
PORTFOLIO REVIEW
For the twelve-month period ended December 31, 2008, the Portfolio underperformed the Russell 1000 Value Index. Seven of ten sectors detracted from relative performance. Stock selection in the Energy, Utilities, and Consumer Staples sectors detracted the most from relative performance, while Financials was the largest sector contributor.
In the Energy sector, the overweight in refiner Valero Energy was the largest Portfolio detractor. Valero shares fell about 68% as sharply rising oil and gasoline prices earlier in the year squeezed refining margins and reduced earnings. Among Utilities, the overweights in electric utility Reliant Energy and gas utility Energen hurt performance. Reliant Energy shares fell 68% as the company cut its outlook due to Hurricane Ike and lower commodity prices, and secured $1 billion in new capital to replace a credit facility that raised concerns among analysts. Energen shares dropped 54%, mainly due to the company’s exposure to lower natural gas prices. In the Consumer Staples sector, the overweight in agribusiness and food products company Bunge Ltd. detracted from performance. Bunge shares dropped 55% as the freeze in the credit markets impacted many companies tied to farming, which is an extremely credit-dependent activity. Among individual holdings, the underweight in pharmaceutical company Johnson & Johnson and the overweight in mortgage finance company Fannie Mae were among the largest Portfolio detractors. Johnson & Johnson shares fell 7% but outperformed the Index by a wide margin as investors preferred shares of stable, defensive names amid the market downturn. Fannie Mae shares fell 74% as the U.S. Treasury placed it and Freddie Mac into conservatorship and announced that it will purchase mortgage-backed securities issued by the two companies.
Among Financials, the underweight in commercial bank Wachovia and the overweight in bank Wells Fargo were the largest Portfolio contributors. Wachovia shares fell nearly 85% amid the ongoing credit and liquidity crisis and mounting losses in the company’s mortgage portfolio. Wachovia subsequently agreed to sell the entire company to Wells Fargo for more than $15 billion. Wells Fargo shares gained nearly 2% as investors speculated that the company would benefit from cost and revenue synergies following its acquisition of Wachovia and that the worst of the credit and mortgage-related write-downs are behind it. The overweight in insurer ACE Ltd. also added to performance. ACE shares dropped 13% but outperformed the Index significantly thanks to investor expectations for improved insurance industry fundamentals in 2009, as significant stress at three of the top five insurers, catastrophe losses from Hurricane Ike, and a higher average industry combined ratio should all help to drive pricing higher. Among non-financial services contributors, the overweights in steel company Nucor and diversified telecommunication services provider Qwest Communications were large Portfolio contributors. Nucor shares fell 19% but outperformed as investors speculated that higher government infrastructure spending and a bailout of the Detroit automakers would be positive for the steel industry. Qwest shares declined about 4% in the Portfolio as the company reported revenue that beat expectations driven by improved results in its business segment and higher equipment sales.
* The views expressed above are those of the subadvisory firm as of December 31, 2008 and are subject to change based on market and other conditions. Information about the Portfolio’s holdings, asset allocation, industry allocation, or country diversification is historical and is not an indication of future Portfolio composition, which will vary. The performance of any index mentioned in this commentary has not been adjusted for ongoing management, distribution and operating expenses, and sales charges applicable to mutual fund investments. Direct investment in any index is not possible.
1 The Russell 1000® Value Index is an unmanaged measure of the largest capitalized U.S. domiciled companies with a less than average growth orientation. Companies in this Index generally have a low price-to-book and price-to-earnings ratio, higher divided yields and lower forecasted growth values.
2 The Lipper Variable Products Fund Average is an average of the total return performance (calculated on the basis of net asset value) of variable product funds with similar investment objectives to those of the subject Portfolio as calculated by Lipper Analytical Services, an independent mutual fund ranking service.
MSF-2
Metropolitan Series Fund, Inc.
FI Value Leaders Portfolio
A $10,000 INVESTMENT COMPARED TO THE RUSSELL 1000 VALUE INDEX
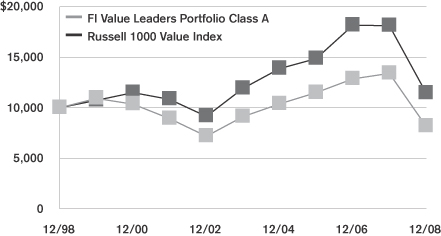
Average Annual Returns as of December 31, 2008
| | | | | | | | | | | | | | | |
| | | FI Value Leaders Portfolio | | | Russell 1000
Value Index | |
| | | Class A | | | Class B | | | Class D | | | Class E | | |
| 1 Year | | -38.9 | % | | -39.1 | % | | -39.0 | % | | -39.0 | % | | -36.8 | % |
| 5 Year | | -2.2 | | | -2.4 | | | — | | | -2.3 | | | -0.8 | |
| 10 Year | | -2.0 | | | — | | | — | | | — | | | 1.4 | |
| Since Inception | | — | | | 1.7 | | | -14.5 | | | -2.9 | | | — | |
Performance numbers are net of all Portfolio expenses but do not include any insurance, sales, or administrative charges of variable annuity or life insurance contracts or any additional expenses that participants in certain eligible qualified plans may bear relating to the operations of their plans. If these charges were included, the returns would be lower.
Inception dates of the Class A, Class B, Class D and Class E shares are: 4/30/93, 7/30/02, 5/2/06, 5/1/01 respectively.
This information represents past performance and is not indicative of future results. Investment return and principal value may fluctuate so that shares, upon redemption, may be worth more or less than the original cost.
PORTFOLIO COMPOSITION
as of December 31, 2008
Top Holdings
| | |
| | | % of Total
Net Assets |
Exxon Mobil Corp. | | 6.7% |
Pfizer, Inc. | | 3.4% |
Wells Fargo & Co. | | 3.3% |
ConocoPhillips | | 3.3% |
AT&T, Inc. | | 3.2% |
General Electric Co. | | 2.4% |
Chevron Corp. | | 2.3% |
Wyeth | | 2.2% |
Procter & Gamble Co. | | 2.2% |
Bank of America Corp. | | 2.0% |
Top Sectors
| | |
| | | % of Total
Market Value |
Financials | | 22.1% |
Energy | | 17.7% |
Health Care | | 14.1% |
Consumer Staples | | 9.7% |
Industrials | | 9.1% |
Consumer Discretionary | | 8.1% |
Telecommunication Services | | 6.5% |
Utilities | | 6.4% |
Materials | | 3.0% |
Information Technology | | 2.9% |
MSF-3
Metropolitan Series Fund, Inc.
Shareholder Expense Example
As a shareholder of the Portfolio, you incur ongoing costs, including management fees; distribution and service (12b-1) fees; and other Portfolio expenses. This example is intended to help you understand your ongoing costs (in dollars) (referred to as “expenses”) of investing in the Portfolio and compare these costs with the ongoing costs of investing in other mutual funds. The example is based on an investment of $1,000 invested at the beginning of the period and held for the entire period, July 1, 2008 through December 31, 2008.
Actual Expenses
The first line for each share class of the Portfolio in the table below provides information about actual account values and actual expenses. You may use the information in this line, together with the amount you invested in the particular share class of the Portfolio, to estimate the expenses that you paid over the period. Simply divide your account value by $1,000 (for example, an $8,600 account value divided by $1,000=8.6), then multiply the result by the number in the first line under the heading entitled “Expenses Paid During Period” to estimate the expenses you paid on your account during this period.
Hypothetical Example for Comparison Purposes
The second line for each share class of the Portfolio in the table below provides information about hypothetical account values and hypothetical expenses based on the Portfolio’s actual expense ratio and an assumed rate of return of 5% per year before expenses, which is not the Portfolio’s actual return. The hypothetical account values and expenses may not be used to estimate the actual ending account balance or expenses you paid for the period. You may use this information to compare the ongoing costs of investing in the Portfolio and other funds. To do so, compare this 5% hypothetical example with the 5% hypothetical examples that appear in the shareholder reports of the other funds.
Please note that the expenses shown in the table are meant to highlight your ongoing costs only and do not reflect any fees or charges of your variable insurance product or any additional expenses that participants in certain eligible qualified plans may bear relating to the operations of their plan. Therefore, the second line for each share class in the table is useful in comparing ongoing costs only, and will not help you determine the relative total costs of owning different funds. In addition, if these other costs were included, your costs would have been higher.
| | | | | | | | | | | | | | |
Portfolio | | | | Annualized
Expense
Ratio | | | Beginning
Account Value
July 1,
2008 | | Ending
Account Value
December 31,
2008 | | Expenses Paid
During Period*
July 1, 2008
to
December 31,
2008 |
FI Value Leaders—Class A | | Actual | | 0.72 | % | | $ | 1,000.00 | | $ | 709.69 | | $ | 3.09 |
| | Hypothetical | | 0.72 | % | | $ | 1,000.00 | | $ | 1,021.47 | | $ | 3.66 |
| | | | | |
FI Value Leaders—Class B | | Actual | | 0.97 | % | | $ | 1,000.00 | | $ | 708.76 | | $ | 4.17 |
| | Hypothetical | | 0.97 | % | | $ | 1,000.00 | | $ | 1,020.20 | | $ | 4.93 |
| | | | | |
FI Value Leaders—Class D | | Actual | | 0.82 | % | | $ | 1,000.00 | | $ | 709.33 | | $ | 3.52 |
| | Hypothetical | | 0.82 | % | | $ | 1,000.00 | | $ | 1,020.97 | | $ | 4.17 |
| | | | | |
FI Value Leaders—Class E | | Actual | | 0.87 | % | | $ | 1,000.00 | | $ | 709.13 | | $ | 3.74 |
| | Hypothetical | | 0.87 | % | | $ | 1,000.00 | | $ | 1,020.71 | | $ | 4.42 |
* Expenses paid are equal to the Portfolio’s annualized expense ratio for the most recent six month period, as shown above, multiplied by the average account value over the period, multiplied by the number of days in the most recent fiscal half-year, divided by 366 (to reflect the the one-half year period).
MSF-4
Metropolitan Series Fund, Inc.
FI Value Leaders Portfolio
Schedule of Investments as of December 31, 2008
Common Stock—99.8% of Total Net Assets
| | | | | |
| Security Description | | Shares | | Value* |
| | | | | |
|
Aerospace & Defense—2.3% |
Northrop Grumman Corp. | | 96,560 | | $ | 4,349,062 |
United Technologies Corp. | | 103,810 | | | 5,564,216 |
| | | | | |
| | | | | 9,913,278 |
| | | | | |
|
Auto Components—0.2% |
The Goodyear Tire & Rubber Co. (a) | | 118,480 | | | 707,326 |
| | | | | |
|
Beverages—1.4% |
Molson Coors Brewing Co. (b) | | 79,540 | | | 3,891,097 |
Pepsi Bottling Group, Inc. | | 101,010 | | | 2,273,735 |
| | | | | |
| | | | | 6,164,832 |
| | | | | |
|
Biotechnology—2.0% |
Amgen, Inc. (a) | | 148,510 | | | 8,576,452 |
| | | | | |
|
Capital Markets—3.2% |
Ameriprise Financial, Inc. | | 90,280 | | | 2,108,941 |
Franklin Resources, Inc. | | 63,160 | | | 4,028,345 |
The Bank of New York Mellon Corp. | | 80,130 | | | 2,270,083 |
The Goldman Sachs Group, Inc. | | 67,820 | | | 5,723,329 |
| | | | | |
| | | | | 14,130,698 |
| | | | | |
|
Chemicals—1.1% |
Celanese Corp. (Series A) (b) | | 109,570 | | | 1,361,955 |
CF Industries Holdings, Inc. (b) | | 39,420 | | | 1,937,887 |
Lubrizol Corp. (b) | | 45,730 | | | 1,664,115 |
| | | | | |
| | | | | 4,963,957 |
| | | | | |
|
Commercial Banks—4.4% |
National City Corp. | | 1,283,940 | | | 2,323,931 |
SunTrust Banks, Inc. | | 82,130 | | | 2,426,120 |
Wells Fargo & Co. | | 488,110 | | | 14,389,483 |
| | | | | |
| | | | | 19,139,534 |
| | | | | |
|
Construction & Engineering—0.8% |
KBR, Inc. (b) | | 239,180 | | | 3,635,536 |
| | | | | |
|
Consumer Finance—1.0% |
Capital One Financial Corp. | | 144,100 | | | 4,595,349 |
| | | | | |
|
Containers & Packaging—0.5% |
Owens-Illinois, Inc. (a) | | 83,740 | | | 2,288,614 |
| | | | | |
|
Diversified Financial Services—5.2% |
Bank of America Corp. | | 620,524 | | | 8,736,978 |
Citigroup, Inc. | | 173,150 | | | 1,161,836 |
CME Group, Inc. | | 20,980 | | | 4,366,148 |
Interactive Brokers Group, Inc. (a) | | 189,710 | | | 3,393,912 |
JPMorgan Chase & Co. | | 167,158 | | | 5,270,492 |
| | | | | |
| | | | | 22,929,366 |
| | | | | |
|
Diversified Telecommunication Services—5.1% |
AT&T, Inc. | | 499,480 | | | 14,235,180 |
Embarq Corp. | | 81,640 | | | 2,935,775 |
| | | | | |
| Security Description | | Shares | | Value* |
| | | | | |
|
Diversified Telecommunication Services—(Continued) |
Qwest Communications International, Inc. (b) | | 1,464,180 | | $ | 5,329,615 |
| | | | | |
| | | | | 22,500,570 |
| | | | | |
|
Electric Utilities—2.4% |
Edison International | | 142,480 | | | 4,576,458 |
Exelon Corp. | | 108,940 | | | 6,058,153 |
| | | | | |
| | | | | 10,634,611 |
| | | | | |
|
Electronic Equipment, Instruments & Components—0.3% |
Avnet, Inc. (a) | | 70,800 | | | 1,289,268 |
| | | | | |
|
Energy Equipment & Services—1.5% |
ENSCO International, Inc. (b) | | 106,560 | | | 3,025,238 |
Noble Corp. | | 100,600 | | | 2,222,254 |
Tidewater, Inc. (b) | | 32,240 | | | 1,298,305 |
| | | | | |
| | | | | 6,545,797 |
| | | | | |
|
Food & Staples Retailing—2.0% |
CVS Caremark Corp. | | 176,250 | | | 5,065,425 |
The Kroger Co. | | 133,480 | | | 3,525,207 |
| | | | | |
| | | | | 8,590,632 |
| | | | | |
|
Food Products—1.2% |
Corn Products International, Inc. (b) | | 91,300 | | | 2,634,005 |
Tyson Foods, Inc. (Class A) (b) | | 301,390 | | | 2,640,176 |
| | | | | |
| | | | | 5,274,181 |
| | | | | |
|
Gas Utilities—0.7% |
Energen Corp. | | 103,440 | | | 3,033,895 |
| | | | | |
|
Health Care Equipment & Supplies—0.8% |
Boston Scientific Corp. (a) | | 459,840 | | | 3,559,162 |
| | | | | |
|
Health Care Providers & Services—3.4% |
Lincare Holdings, Inc. (a) (b) | | 99,110 | | | 2,669,032 |
McKesson Corp. | | 119,130 | | | 4,613,905 |
WellPoint, Inc. (a) | | 176,390 | | | 7,431,311 |
| | | | | |
| | | | | 14,714,248 |
| | | | | |
| | |
Household Products—2.2% | | | | | |
Procter & Gamble Co. | | 153,190 | | | 9,470,206 |
| | | | | |
|
Independent Power Producers & Energy Traders—1.8% |
Mirant Corp. (a) (b) | | 125,890 | | | 2,375,544 |
NRG Energy, Inc. (a) (b) | | 237,040 | | | 5,530,143 |
| | | | | |
| | | | | 7,905,687 |
| | | | | |
| | |
Industrial Conglomerates—2.4% | | | | | |
General Electric Co. | | 659,370 | | | 10,681,794 |
| | | | | |
| | |
Insurance—7.6% | | | | | |
ACE, Ltd. | | 107,684 | | | 5,698,637 |
Assurant, Inc. | | 196,600 | | | 5,898,000 |
Berkshire Hathaway, Inc. (Class B) (a) | | 2,610 | | | 8,388,540 |
*See accompanying notes to financial statements.
MSF-5
Metropolitan Series Fund, Inc.
FI Value Leaders Portfolio
Schedule of Investments as of December 31, 2008
Common Stock—(Continued)
| | | | | |
| Security Description | | Shares | | Value* |
| | | | | |
| | |
Insurance—(Continued) | | | | | |
Loews Corp. | | 94,590 | | $ | 2,672,168 |
PartnerRe, Ltd. | | 32,400 | | | 2,309,148 |
The Chubb Corp. | | 116,890 | | | 5,961,390 |
W.R. Berkley Corp. | | 73,520 | | | 2,279,120 |
| | | | | |
| | | | | 33,207,003 |
| | | | | |
| | |
IT Services—1.7% | | | | | |
Accenture, Ltd. (Class A) | | 123,400 | | | 4,046,286 |
The Western Union Co. | | 238,270 | | | 3,416,792 |
| | | | | |
| | | | | 7,463,078 |
| | | | | |
| | |
Life Sciences Tools & Services—0.6% | | | | | |
Thermo Fisher Scientific, Inc. (a) (b) | | 79,850 | | | 2,720,490 |
| | | | | |
| | |
Machinery—2.0% | | | | | |
AGCO Corp. (a) (b) | | 117,410 | | | 2,769,702 |
Eaton Corp. (b) | | 79,050 | | | 3,929,575 |
The Manitowoc Co., Inc. | | 255,260 | | | 2,210,552 |
| | | | | |
| | | | | 8,909,829 |
| | | | | |
| | |
Marine—0.5% | | | | | |
Alexander & Baldwin, Inc. (b) | | 88,690 | | | 2,222,571 |
| | | | | |
| | |
Media—3.5% | | | | | |
DISH Network Corp. (a) | | 383,110 | | | 4,248,690 |
News Corp. (Class A) | | 627,470 | | | 5,703,702 |
Time Warner, Inc. (b) | | 522,900 | | | 5,260,374 |
| | | | | |
| | | | | 15,212,766 |
| | | | | |
| | |
Metals & Mining—1.3% | | | | | |
Freeport-McMoRan Copper & Gold, Inc. (a) (b) | | 104,310 | | | 2,549,336 |
Nucor Corp. | | 72,560 | | | 3,352,272 |
| | | | | |
| | | | | 5,901,608 |
| | | | | |
| | |
Multi-Utilities—1.5% | | | | | |
CMS Energy Corp. (b) | | 89,890 | | | 908,788 |
MDU Resources Group, Inc. | | 122,410 | | | 2,641,608 |
Public Service Enterprise Group, Inc. | | 107,070 | | | 3,123,232 |
| | | | | |
| | | | | 6,673,628 |
| | | | | |
| | |
Multiline Retail—1.0% | | | | | |
J.C. Penney Co., Inc. (b) | | 224,380 | | | 4,420,286 |
| | | | | |
| | |
Oil, Gas & Consumable Fuels—16.2% | | | | | |
Apache Corp. | | 88,100 | | | 6,566,093 |
Chevron Corp. | | 134,690 | | | 9,963,019 |
ConocoPhillips | | 277,631 | | | 14,381,286 |
Exxon Mobil Corp. | | 370,720 | | | 29,594,577 |
Occidental Petroleum Corp. (b) | | 130,930 | | | 7,854,491 |
Valero Energy Corp. | | 126,750 | | | 2,742,870 |
| | | | | |
| | | | | 71,102,336 |
| | | | | |
| | |
Personal Products—0.8% | | | | | |
Avon Products, Inc. | | 141,360 | | | 3,396,881 |
| | | | | |
| | | | | |
| Security Description | | Shares | | Value* |
| | | | | |
| | |
Pharmaceuticals—7.4% | | | | | |
Johnson & Johnson | | 133,230 | | $ | 7,971,151 |
Pfizer, Inc. | | 843,040 | | | 14,930,238 |
Wyeth | | 253,670 | | | 9,515,162 |
| | | | | |
| | | | | 32,416,551 |
| | | | | |
|
Real Estate Management & Development—0.7% |
Jones Lang LaSalle, Inc. (b) | | 104,460 | | | 2,893,542 |
| | | | | |
| | |
Road & Rail—1.1% | | | | | |
Norfolk Southern Corp. | | 101,140 | | | 4,758,637 |
| | | | | |
| | |
Software—0.9% | | | | | |
Microsoft Corp. | | 203,040 | | | 3,947,098 |
| | | | | |
| | |
Specialty Retail—2.4% | | | | | |
Abercrombie & Fitch Co. (Class A) (b) | | 125,000 | | | 2,883,750 |
Best Buy Co., Inc. (b) | | 153,850 | | | 4,324,723 |
Home Depot, Inc. (b) | | 147,280 | | | 3,390,386 |
| | | | | |
| | | | | 10,598,859 |
| | | | | |
|
Textiles, Apparel & Luxury Goods—1.1% |
Coach, Inc. (a) | | 119,470 | | | 2,481,392 |
Polo Ralph Lauren Corp. (b) | | 50,260 | | | 2,282,307 |
| | | | | |
| | | | | 4,763,699 |
| | | | | |
| | |
Tobacco—2.2% | | | | | |
Altria Group, Inc. | | 469,150 | | | 7,065,399 |
Lorillard, Inc. | | 48,540 | | | 2,735,229 |
| | | | | |
| | | | | 9,800,628 |
| | | | | |
|
Wireless Telecommunication Services—1.4% |
NII Holdings, Inc. (a) | | 269,150 | | | 4,893,147 |
Sprint Nextel Corp. (a) | | 729,170 | | | 1,334,381 |
| | | | | |
| | | | | 6,227,528 |
| | | | | |
Total Common Stock
(Identified Cost $537,256,423) | | | | | 437,882,011 |
| | | | | |
*See accompanying notes to financial statements.
MSF-6
Metropolitan Series Fund, Inc.
FI Value Leaders Portfolio
Schedule of Investments as of December 31, 2008
Short Term Investments—8.7%
| | | | | | | |
| Security Description | | Shares/Face
Amount | | Value* | |
| | |
Mutual Funds—8.6% | | | | | | | |
State Street Navigator Securities Lending Prime Portfolio (c) | | | 37,515,278 | | $ | 37,515,278 | |
| | | | | | | |
| | |
Repurchase Agreement—0.1% | | | | | | | |
State Street Repurchase Agreement dated 12/31/08 at 0.010% to be repurchased at $456,000 on 01/02/09, collateralized by $470,000 U.S. Treasury Bill due 02/26/09 with a value of $469,953. | | $ | 456,000 | | | 456,000 | |
| | | | | | | |
Total Short Term Investments
(Identified Cost $37,971,278) | | | | | | 37,971,278 | |
| | | | | | | |
Total Investments—108.5%
(Identified Cost $575,227,701) (d) | | | | | | 475,853,289 | |
Liabilities in excess of other assets | | | | | | (37,225,034 | ) |
| | | | | | | |
| Total Net Assets—100% | | | | | $ | 438,628,255 | |
| | | | | | | |
| (b) | A portion or all of the security was on loan. As of December 31, 2008, the market value of securities loaned was $40,721,855 and the collateral received consisted of cash in the amount of $37,515,278 and non-cash collateral with a value of $2,340,094. The cash collateral is invested in a money market fund managed by an affiliate of the custodian. The non-cash collateral received consists primarily of government securities and bank letters of credit, and are held for the benefit of the Portfolio at the Portfolio’s custodian. The Portfolio cannot repledge or resell this collateral. As such, these are excluded from the Statement of Assets and Liabilities. |
| (c) | Represents investment of cash collateral received from securities lending transactions. |
| (d) | The aggregate cost of investments for federal income tax purposes as of December 31, 2008 was $616,088,467 and the composition of unrealized appreciation and depreciation of investment securities was $12,201,296 and $(152,436,474), respectively. |
The Portfolio adopted the provisions of Statement of Financial Accounting Standards No. 157, “Fair Value Measurements” (FAS 157), effective with the beginning of the Portfolio’s fiscal year. FAS 157 establishes a framework for measuring fair value and expands disclosures about fair value measurements in financial statements. The three levels of the hierarchy under FAS 157 are described below:
Level 1 - quoted prices in active markets for identical securities
Level 2 - other significant observable inputs (including quoted prices for similar securities, interest rates, credit risk, etc.)
Level 3 - significant unobservable inputs (including the Portfolio’s own assumptions in determining the fair value of investments)
The inputs or methodology used for valuing securities are not necessarily an indication of the risk associated with investing in those securities.
The following is a summary of the inputs used to value the Portfolio’s net assets as of December 31, 2008:
| | | | | | |
| Valuation Inputs | | Investments In
Securities | | Other Financial
Instruments* |
Level 1 - Quoted Prices | | $ | 475,397,289 | | $ | 0 |
Level 2 - Other Significant Observable Inputs | | | 456,000 | | | 0 |
Level 3 - Significant Unobservable Inputs | | | 0 | | | 0 |
Total | | $ | 475,853,289 | | $ | 0 |
* Other financial instruments are derivative instruments not reflected in the Schedule of Investments, such as futures, forwards, swap contracts and written options, which are valued based on the unrealized appreciation/depreciation on the instrument.
*See accompanying notes to financial statements.
MSF-7
Metropolitan Series Fund, Inc.
FI Value Leaders Portfolio
Statement of Assets & Liabilities
December 31, 2008
| | | | | | | |
Assets | | | | | | | |
Investments at value (a) (b) | | | | | $ | 475,853,289 | |
Cash | | | | | | 413 | |
Foreign cash at value (c) | | | | | | 43 | |
Receivable for: | | | | | | | |
Securities sold | | | | | | 638,854 | |
Fund shares sold | | | | | | 193,061 | |
Accrued interest and dividends | | | | | | 569,789 | |
Foreign taxes | | | | | | 3,533 | |
| | | | | | | |
Total Assets | | | | | | 477,258,982 | |
Liabilities | | | | | | | |
Payable for: | | | | | | | |
Securities purchased | | $ | 373,047 | | | | |
Fund shares redeemed | | | 429,253 | | | | |
Collateral for securities loaned | | | 37,515,278 | | | | |
Accrued expenses: | | | | | | | |
Management fees | | | 241,874 | | | | |
Service and distribution fees | | | 23,708 | | | | |
Deferred directors’ fees | | | 11,084 | | | | |
Other expenses | | | 36,483 | | | | |
| | | | | | | |
Total Liabilities | | | | | | 38,630,727 | |
| | | | | | | |
Net Assets | | | | | $ | 438,628,255 | |
| | | | | | | |
Net assets consists of: | | | | | | | |
Capital paid in | | | | | $ | 731,351,398 | |
Undistributed net investment income | | | | | | 11,959,578 | |
Accumulated net realized losses | | | | | | (205,308,473 | ) |
Unrealized depreciation on investments and foreign currency | | | | | | (99,374,248 | ) |
| | | | | | | |
Net Assets | | | | | $ | 438,628,255 | |
| | | | | | | |
| Computation of offering price: | | | | | | | |
Class A | | | | | | | |
Net asset value and redemption price per share ($233,635,697 divided by 2,193,637 shares outstanding) | | | | | $ | 106.51 | |
| | | | | | | |
Class B | | | | | | | |
Net asset value and redemption price per share ($48,628,463 divided by 458,415 shares outstanding) | | | | | $ | 106.08 | |
| | | | | | | |
Class D | | | | | | | |
Net asset value and redemption price per share ($131,562,623 divided by 1,237,717 shares outstanding) | | | | | $ | 106.29 | |
| | | | | | | |
Class E | | | | | | | |
Net asset value and redemption price per share ($24,801,472 divided by 233,642 shares outstanding) | | | | | $ | 106.15 | |
| | | | | | | |
(a) Identified cost of investments | | | | | $ | 575,227,701 | |
| | | | | | | |
(b) Includes cash collateral for securities loaned of | | | | | $ | 37,515,278 | |
| | | | | | | |
(c) Identified cost of foreign cash | | | | | $ | 58 | |
| | | | | | | |
Statement of Operations
For the Year Ended December 31, 2008
| | | | | | | | |
Investment Income | | | | | | | | |
Dividends | | | | | | $ | 16,578,246 | |
Interest | | | | | | | 436,278 | (a) |
| | | | | | | | |
| | | | | | | 17,014,524 | |
Expenses | | | | | | | | |
Management fees | | $ | 4,191,190 | | | | | |
Service and distribution fees—Class B | | | 158,809 | | | | | |
Service and distribution fees—Class D | | | 201,881 | | | | | |
Service and distribution fees—Class E | | | 55,377 | | | | | |
Directors’ fees and expenses | | | 24,837 | | | | | |
Custodian | | | 78,773 | | | | | |
Audit and tax services | | | 31,941 | | | | | |
Legal | | | 11,682 | | | | | |
Printing | | | 183,710 | | | | | |
Insurance | | | 9,686 | | | | | |
Miscellaneous | | | 22,938 | | | | | |
| | | | | | | | |
Total expenses | | | | | | | 4,970,824 | |
| | | | | | | | |
Net Investment Income | | | | | | | 12,043,700 | |
| | | | | | | | |
Realized and Unrealized Loss | | | | | | | | |
| Realized loss on: | | | | | | | | |
Investments—net | | | | | | | (193,578,625 | ) |
| Change in unrealized depreciation on: | | | | | | | | |
Investments—net | | | (124,346,018 | ) | | | | |
Foreign currency transactions—net | | | (127 | ) | | | (124,346,145 | ) |
| | | | | | | | |
Net loss | | | | | | | (317,924,770 | ) |
| | | | | | | | |
Net Decrease in Net Assets From Operations | | | | | | $ | (305,881,070 | ) |
| | | | | | | | |
| (a) | Includes income on securities loaned of $420,397. |
See accompanying notes to financial statements.
MSF-8
Metropolitan Series Fund, Inc.
FI Value Leaders Portfolio
Statements of Changes in Net Assets
| | | | | | | | |
| | | Year ended
December 31,
2008 | | | Year ended
December 31,
2007 | |
From Operations | | | | | | | | |
Net investment income | | $ | 12,043,700 | | | $ | 12,200,579 | |
Net realized gain (loss) | | | (193,578,625 | ) | | | 62,216,927 | |
Change in unrealized depreciation | | | (124,346,145 | ) | | | (33,130,132 | ) |
| | | | | | | | |
Increase (decrease) in net assets from operations | | | (305,881,070 | ) | | | 41,287,374 | |
| | | | | | | | |
From Distributions to Shareholders | | | | | | | | |
Net investment income | | | | | | | | |
Class A | | | (6,721,932 | ) | | | (4,672,405 | ) |
Class B | | | (963,825 | ) | | | (503,782 | ) |
Class D | | | (3,814,463 | ) | | | (2,754,011 | ) |
Class E | | | (671,012 | ) | | | (460,718 | ) |
| | | | | | | | |
| | | (12,171,232 | ) | | | (8,390,916 | ) |
| | | | | | | | |
Net realized gain | | | | | | | | |
Class A | | | (36,518,543 | ) | | | (44,234,373 | ) |
Class B | | | (6,251,749 | ) | | | (6,426,938 | ) |
Class D | | | (22,175,254 | ) | | | (29,815,958 | ) |
Class E | | | (4,041,117 | ) | | | (5,232,496 | ) |
| | | | | | | | |
| | | (68,986,663 | ) | | | (85,709,765 | ) |
| | | | | | | | |
Total distributions | | | (81,157,895 | ) | | | (94,100,681 | ) |
| | | | | | | | |
Decrease in net assets from capital share transactions | | | (21,536,367 | ) | | | (69,648,099 | ) |
| | | | | | | | |
Net decrease in net assets | | | (408,575,332 | ) | | | (122,461,406 | ) |
| | |
Net Assets | | | | | | | | |
Beginning of the period | | | 847,203,587 | | | | 969,664,993 | |
| | | | | | | | |
End of the period | | $ | 438,628,255 | | | $ | 847,203,587 | |
| | | | | | | | |
Undistributed Net Investment Income | | | | | | | | |
End of the period | | $ | 11,959,578 | | | $ | 12,206,109 | |
| | | | | | | | |
Other Information:
Capital Shares
Transactions in capital shares were as follows:
| | | | | | | | | | | | | | |
| | | Year ended
December 31, 2008 | | | Year ended
December 31, 2007 | |
| | | Shares | | | $ | | | Shares | | | $ | |
Class A | | | | | | | | | | | | | | |
Sales | | 156,165 | | | $ | 20,207,043 | | | 185,630 | | | $ | 37,252,583 | |
Reinvestments | | 268,641 | | | | 43,240,475 | | | 242,689 | | | | 48,906,778 | |
Redemptions | | (513,225 | ) | | | (72,853,752 | ) | | (567,453 | ) | | | (116,169,360 | ) |
| | | | | | | | | | | | | | |
Net decrease | | (88,419 | ) | | $ | (9,406,234 | ) | | (139,134 | ) | | $ | (30,009,999 | ) |
| | | | | | | | | | | | | | |
Class B | | | | | | | | | | | | | | |
Sales | | 128,347 | | | $ | 19,444,677 | | | 116,244 | | | $ | 23,663,095 | |
Reinvestments | | 44,932 | | | | 7,215,574 | | | 34,474 | | | | 6,930,720 | |
Redemptions | | (102,518 | ) | | | (15,329,798 | ) | | (85,250 | ) | | | (17,333,521 | ) |
| | | | | | | | | | | | | | |
Net increase | | 70,761 | | | $ | 11,330,453 | | | 65,468 | | | $ | 13,260,294 | |
| | | | | | | | | | | | | | |
Class D | | | | | | | | | | | | | | |
Sales | | 102,216 | | | $ | 15,154,162 | | | 85,700 | | | $ | 17,391,469 | |
Reinvestments | | 161,678 | | | | 25,989,717 | | | 161,830 | | | | 32,569,969 | |
Redemptions | | (416,481 | ) | | | (60,066,892 | ) | | (480,052 | ) | | | (96,968,365 | ) |
| | | | | | | | | | | | | | |
Net decrease | | (152,587 | ) | | $ | (18,923,013 | ) | | (232,522 | ) | | $ | (47,006,927 | ) |
| | | | | | | | | | | | | | |
Class E | | | | | | | | | | | | | | |
Sales | | 25,263 | | | $ | 3,531,105 | | | 53,198 | | | $ | 10,867,925 | |
Reinvestments | | 29,348 | | | | 4,712,129 | | | 28,319 | | | | 5,693,214 | |
Redemptions | | (85,006 | ) | | | (12,780,807 | ) | | (110,393 | ) | | | (22,452,606 | ) |
| | | | | | | | | | | | | | |
Net decrease | | (30,395 | ) | | $ | (4,537,573 | ) | | (28,876 | ) | | $ | (5,891,467 | ) |
| | | | | | | | | | | | | | |
Decrease derived from capital share transactions | | | | | $ | (21,536,367 | ) | | | | | $ | (69,648,099 | ) |
| | | | | | | | | | | | | | |
See accompanying notes to financial statements.
MSF-9
Metropolitan Series Fund, Inc.
FI Value Leaders Portfolio
Financial Highlights
| | | | | | | | | | | | | | | | | | | | |
| | | Class A | |
| | | Year ended December 31, | |
| | | 2008 | | | 2007 | | | 2006 | | | 2005 | | | 2004 | |
Net Asset Value, Beginning of Period | | $ | 196.17 | | | $ | 208.36 | | | $ | 193.08 | | | $ | 176.54 | | | $ | 157.24 | |
| | | | | | | | | | | | | | | | | | | | |
Income From Investment Operations | | | | | | | | | | | | | | | | | | | | |
Net investment income | | | 2.88 | (a) | | | 2.81 | (a) | | | 2.58 | | | | 1.92 | | | | 2.21 | |
Net realized and unrealized gain (loss) of investments | | | (72.50 | ) | | | 6.52 | | | | 20.14 | | | | 16.67 | | | | 19.15 | |
| | | | | | | | | | | | | | | | | | | | |
Total from investment operations | | | (69.62 | ) | | | 9.33 | | | | 22.72 | | | | 18.59 | | | | 21.36 | |
| | | | | | | | | | | | | | | | | | | | |
Less Distributions | | | | | | | | | | | | | | | | | | | | |
Distributions from net investment income | | | (3.12 | ) | | | (2.06 | ) | | | (2.25 | ) | | | (2.05 | ) | | | (2.06 | ) |
Distributions from net realized capital gains | | | (16.92 | ) | | | (19.46 | ) | | | (5.19 | ) | | | 0.00 | | | | 0.00 | |
| | | | | | | | | | | | | | | | | | | | |
Total distributions | | | (20.04 | ) | | | (21.52 | ) | | | (7.44 | ) | | | (2.05 | ) | | | (2.06 | ) |
| | | | | | | | | | | | | | | | | | | | |
Net Asset Value, End of Period | | $ | 106.51 | | | $ | 196.17 | | | $ | 208.36 | | | $ | 193.08 | | | $ | 176.54 | |
| | | | | | | | | | | | | | | | | | | | |
Total Return (%) | | | (38.9 | ) | | | 4.2 | | | | 11.9 | | | | 10.7 | | | | 13.7 | |
Ratio of operating expenses to average net assets before expense reductions (%) | | | 0.71 | | | | 0.71 | | | | 0.72 | | | | 0.73 | | | | 0.74 | |
Ratio of operating expenses to average net assets after expense reductions (%) (b) | | | N/A | | | | N/A | | | | 0.71 | | | | 0.69 | | | | 0.72 | |
Ratio of net investment income to average net assets (%) | | | 1.94 | | | | 1.38 | | | | 1.18 | | | | 0.92 | | | | 1.23 | |
Portfolio turnover rate (%) | | | 191 | | | | 145 | | | | 213 | | | | 94 | | | | 161 | |
Net assets, end of period (000) | | $ | 233,636 | | | $ | 447,663 | | | $ | 504,489 | | | $ | 533,729 | | | $ | 552,323 | |
| | | | | | | | | | | | | | | | | | | | |
| | | Class B | |
| | | Year ended December 31, | |
| | | 2008 | | | 2007 | | | 2006 | | | 2005 | | | 2004 | |
Net Asset Value, Beginning of Period | | $ | 195.36 | | | $ | 207.58 | | | $ | 192.26 | | | $ | 175.91 | | | $ | 156.72 | |
| | | | | | | | | | | | | | | | | | | | |
Income From Investment Operations | | | | | | | | | | | | | | | | | | | | |
Net investment income | | | 2.51 | (a) | | | 2.30 | (a) | | | 2.10 | | | | 1.26 | | | | 1.88 | |
Net realized and unrealized gain (loss) of investments | | | (72.26 | ) | | | 6.47 | | | | 20.04 | | | | 16.86 | | | | 19.12 | |
| | | | | | | | | | | | | | | | | | | | |
Total from investment operations | | | (69.75 | ) | | | 8.77 | | | | 22.14 | | | | 18.12 | | | | 21.00 | |
| | | | | | | | | | | | | | | | | | | | |
Less Distributions | | | | | | | | | | | | | | | | | | | | |
Distributions from net investment income | | | (2.61 | ) | | | (1.53 | ) | | | (1.63 | ) | | | (1.77 | ) | | | (1.81 | ) |
Distributions from net realized capital gains | | | (16.92 | ) | | | (19.46 | ) | | | (5.19 | ) | | | 0.00 | | | | 0.00 | |
| | | | | | | | | | | | | | | | | | | | |
Total distributions | | | (19.53 | ) | | | (20.99 | ) | | | (6.82 | ) | | | (1.77 | ) | | | (1.81 | ) |
| | | | | | | | | | | | | | | | | | | | |
Net Asset Value, End of Period | | $ | 106.08 | | | $ | 195.36 | | | $ | 207.58 | | | $ | 192.26 | | | $ | 175.91 | |
| | | | | | | | | | | | | | | | | | | | |
Total Return (%) | | | (39.1 | ) | | | 3.9 | | | | 11.7 | | | | 10.4 | | | | 13.5 | |
Ratio of operating expenses to average net assets before expense reductions (%) | | | 0.96 | | | | 0.96 | | | | 0.97 | | | | 0.98 | | | | 0.99 | |
Ratio of operating expenses to average net assets after expense reductions (%) (b) | | | N/A | | | | N/A | | | | 0.96 | | | | 0.94 | | | | 0.97 | |
Ratio of net investment income to average net assets (%) | | | 1.72 | | | | 1.14 | | | | 1.00 | | | | 0.70 | | | | 1.41 | |
Portfolio turnover rate (%) | | | 191 | | | | 145 | | | | 213 | | | | 94 | | | | 161 | |
Net assets, end of period (000) | | $ | 48,628 | | | $ | 75,734 | | | $ | 66,879 | | | $ | 27,141 | | | $ | 5,311 | |
| Please | see following page for Financial Highlights footnote legend. |
See accompanying notes to financial statements.
MSF-10
Metropolitan Series Fund, Inc.
FI Value Leaders Portfolio
Financial Highlights
| | | | | | | | | | | | |
| | | Class D | |
| | | Year ended December 31, | |
| | | 2008 | | | 2007 | | | 2006(c) | |
Net Asset Value, Beginning of Period | | $ | 195.78 | | | $ | 207.95 | | | $ | 200.55 | |
| | | | | | | | | | | | |
Income From Investment Operations | | | | | | | | | | | | |
Net investment income | | | 2.73 | (a) | | | 2.60 | (a) | | | 1.80 | |
Net realized and unrealized gain (loss) of investments | | | (72.39 | ) | | | 6.49 | | | | 5.60 | |
| | | | | | | | | | | | |
Total from investment operations | | | (69.66 | ) | | | 9.09 | | | | 7.40 | |
| | | | | | | | | | | | |
Less Distributions | | | | | | | | | | | | |
Distributions from net investment income | | | (2.91 | ) | | | (1.80 | ) | | | 0.00 | |
Distributions from net realized capital gains | | | (16.92 | ) | | | (19.46 | ) | | | 0.00 | |
| | | | | | | | | | | | |
Total distributions | | | (19.83 | ) | | | (21.26 | ) | | | 0.00 | |
| | | | | | | | | | | | |
Net Asset Value, End of Period | | $ | 106.29 | | | $ | 195.78 | | | $ | 207.95 | |
| | | | | | | | | | | | |
Total Return (%) | | | (39.0 | ) | | | 4.1 | | | | 3.7 | (d) |
Ratio of operating expenses to average net assets before expense reductions (%) | | | 0.81 | | | | 0.81 | | | | 0.82 | (e) |
Ratio of operating expenses to average net assets after expense reductions (%) (b) | | | N/A | | | | N/A | | | | 0.81 | (e) |
Ratio of net investment income to average net assets (%) | | | 1.84 | | | | 1.27 | | | | 1.25 | (e) |
Portfolio turnover rate (%) | | | 191 | | | | 145 | | | | 213 | |
Net assets, end of period (000) | | $ | 131,563 | | | $ | 272,190 | | | $ | 337,462 | |
| | | | | | | | | | | | | | | | | | | | |
| | | Class E | |
| | | Year ended December 31, | |
| | | 2008 | | | 2007 | | | 2006 | | | 2005 | | | 2004 | |
Net Asset Value, Beginning of Period | | $ | 195.49 | | | $ | 207.69 | | | $ | 192.40 | | | $ | 175.93 | | | $ | 156.83 | |
| | | | | | | | | | | | | | | | | | | | |
Income From Investment Operations | | | | | | | | | | | | | | | | | | | | |
Net investment income | | | 2.65 | (a) | | | 2.49 | (a) | | | 2.17 | | | | 1.29 | | | | 1.58 | |
Net realized and unrealized gain (loss) of investments | | | (72.26 | ) | | | 6.48 | | | | 20.18 | | | | 16.98 | | | | 19.48 | |
| | | | | | | | | | | | | | | | | | | | |
Total from investment operations | | | (69.61 | ) | | | 8.97 | | | | 22.35 | | | | 18.27 | | | | 21.06 | |
| | | | | | | | | | | | | | | | | | | | |
Less Distributions | | | | | | | | | | | | | | | | | | | | |
Distributions from net investment income | | | (2.81 | ) | | | (1.71 | ) | | | (1.87 | ) | | | (1.80 | ) | | | (1.96 | ) |
Distributions from net realized capital gains | | | (16.92 | ) | | | (19.46 | ) | | | (5.19 | ) | | | 0.00 | | | | 0.00 | |
| | | | | | | | | | | | | | | | | | | | |
Total distributions | | | (19.73 | ) | | | (21.17 | ) | | | (7.06 | ) | | | (1.80 | ) | | | (1.96 | ) |
| | | | | | | | | | | | | | | | | | | | |
Net Asset Value, End of Period | | $ | 106.15 | | | $ | 195.49 | | | $ | 207.69 | | | $ | 192.40 | | | $ | 175.93 | |
| | | | | | | | | | | | | | | | | | | | |
Total Return (%) | | | (39.0 | ) | | | 4.0 | | | | 11.8 | | | | 10.5 | | | | 13.6 | |
Ratio of operating expenses to average net assets before expense reductions (%) | | | 0.86 | | | | 0.86 | | | | 0.87 | | | | 0.88 | | | | 0.89 | |
Ratio of operating expenses to average net assets after expense reductions (%) (b) | | | N/A | | | | N/A | | | | 0.86 | | | | 0.84 | | | | 0.87 | |
Ratio of net investment income to average net assets (%) | | | 1.78 | | | | 1.22 | | | | 1.05 | | | | 0.78 | | | | 1.12 | |
Portfolio turnover rate (%) | | | 191 | | | | 145 | | | | 213 | | | | 94 | | | | 161 | |
Net assets, end of period (000) | | $ | 24,801 | | | $ | 51,617 | | | $ | 60,835 | | | $ | 46,855 | | | $ | 31,192 | |
| (a) | Per share amount is based on average shares outstanding during the period. |
| (b) | The Portfolio has entered into arrangements with certain brokers who paid a portion of the Portfolio’s expenses. |
| (c) | Commencement of operations was May 2, 2006 for Class D. |
| (d) | Periods less than one year are not computed on an annualized basis. |
| (e) | Computed on an annualized basis. |
See accompanying notes to financial statements.
MSF-11
Metropolitan Series Fund, Inc.
FI Value Leaders Portfolio
Notes to Financial Statements—December 31, 2008
Metropolitan Series Fund, Inc. (the “Fund”) is organized as a corporation under the laws of Maryland pursuant to Articles of Incorporation filed on November 23, 1982, as amended, and registered under the Investment Company Act of 1940, as amended (the “1940 Act”), as an open-end investment company. The Fund is a “series” type of mutual fund, which issues separate series of stock. Each series represents an interest in a separate portfolio of Fund investments. The FI Value Leaders Portfolio (the “Portfolio”) is a diversified series of the Fund. Shares in the Fund are not offered directly to the general public and are currently available only to separate accounts established by Metropolitan Life Insurance Company (“MetLife”), New England Life Insurance Company, General American Life Insurance Company (“General American”), The MetLife Investors Group of Insurance Companies, MetLife Insurance Company of Connecticut and other affiliated insurance companies (collectively, the “Insurance Companies”) and to certain eligible qualified retirement plans (“Qualified Plans”), as an investment vehicle for variable life insurance, group annuity or variable annuity products of these insurance companies or Qualified Plans, although the Portfolio is not available to all such separate accounts and Qualified Plans. The Portfolio’s shares may be divided into different classes. Currently, the classes being offered by the Portfolio are named Class A, Class B, Class D and Class E. The classes of the Portfolio’s shares are identical, except that certain additional charges (Rule 12b-1 fees) are made against Class B, Class D and Class E shares. Investment income, realized and unrealized capital gains and losses, the common expenses of the Portfolio and certain Portfolio-level expense reductions, if any, are allocated daily, on a pro rata basis, to each class based on the relative net assets of each class to the total net assets of the Portfolio.
| 2. | SIGNIFICANT ACCOUNTING POLICIES: |
The preparation of financial statements in conformity with accounting principles generally accepted in the United States of America (“GAAP”) requires management to make estimates and assumptions that affect the reported amounts of assets and liabilities and disclosure of contingent assets and liabilities as of the date of the financial statements and the reported amounts of income and expenses during the reporting period. Actual results could differ from those estimates.
The following is a summary of significant accounting policies consistently followed by the Portfolio in the preparation of its financial statements. The policies are in conformity with GAAP.
Investment Valuation:
Debt securities (other than short term obligations with a remaining maturity of sixty days or less) are generally valued on the basis of evaluated or composite bid quotations obtained by independent pricing services and/or brokers and dealers selected by the relevant subadviser pursuant to authorization of the Board of Directors of the Fund (the “Board” or “Directors”). Such quotations take into account appropriate factors such as institutional-sized trading in similar groups of securities, yield, quality, coupon rate, maturity, type of issue, trading characteristics and other data. Short term obligations with a remaining maturity of sixty days or less are valued at amortized cost which approximates fair market value.
Equity securities traded on a national securities exchange or other exchanges are valued at their last sale price on the principal trading market. Equity securities traded on the NASDAQ National Market System are valued at the NASDAQ Official Closing Price (the “NOCP”). The NOCP is the last reported sale price if the last reported sale price falls between the spread of the last reported bid and asked prices. If the last reported bid and asked prices are above the last reported sale price, the NOCP will be the last reported bid price. If the last reported bid and asked prices are below the last reported sale price, the NOCP will be the last reported asked price. Equity securities traded on a national securities exchange or other exchanges or on the NASDAQ National Market System for which there is no reported sale during the day are valued at the last reported bid price. A security that is listed or traded on more than one exchange is valued at the quotation on the exchange determined to be the primary market for that security by the Board or its delegates. If no closing price is available, then such securities are valued by using the last reported bid price. Equity securities traded over-the-counter are valued at the last reported sales price.
If no current market value quotation is readily available or reliable for a portfolio security, fair value will be determined in accordance with procedures established by and under the general supervision of the Board. When the Portfolio uses fair value pricing, it may take into account any factors it deems appropriate. The value of securities used by the Portfolio to calculate its net asset value may differ from quoted or published prices for the same securities. Fair value pricing involves subjective judgments and the fair value determined for a security may be materially different than the value that could be realized upon the sale of that security.
MSF-12
Metropolitan Series Fund, Inc.
FI Value Leaders Portfolio
Notes to Financial Statements—December 31, 2008—(Continued)
The Portfolio expects to use fair value pricing for securities primarily traded on U.S. exchanges only under very limited circumstances. For example, the Portfolio may use fair value pricing if the exchange on which a security is traded closes early or trading in the security is suspended.
Securities traded primarily on an exchange outside of the United States which closes before the close of the New York Stock Exchange will be valued at the last sales price on that non-U.S. exchange. Securities traded primarily on an exchange outside of the United States for which there is no reported sale during the day are valued at the mean between the last reported bid and asked prices. However, because most foreign markets close well before the Portfolio values its securities (typically at 4 p.m. Eastern Time), the earlier close of these foreign markets gives rise to the possibility that significant events, including broad market moves, may have occurred after these foreign markets close but before the Portfolio values its securities. To account for this, the Portfolio may frequently value many of its foreign equity securities using fair value prices based on third party vendor modeling tools.
Forward foreign currency exchange contracts are valued based on the mean between closing bid and asked prices of the forward currency contract rates in the London foreign exchange markets on a daily basis as provided by a reliable bank or dealer.
Options, whether on securities, indices, futures contracts, or otherwise, are valued at the last sales price available as of the close of business on the day of valuation or, if there is no such sale price available, at the mean between the bid and asked prices. Options on currencies are valued at the spot price each day.
The value of futures contracts will be the sum of the margin deposit plus or minus the difference between the value of the futures contract on each day the net asset value is calculated and the value on the date the futures contract originated, value being that established on a recognized commodity exchange, or by reference to other customary sources, with gain or loss being realized when the futures contract closes or expires.
Subject to the Board’s oversight, the Board has delegated the day-to-day oversight of pricing matters, including determinations in good faith under the Fund’s procedures the fair value of securities for which current market quotations are not readily available to MetLife Advisers, LLC (“MetLife Advisers” or the “Adviser”).
Investment Transactions and Related Investment Income:
Portfolio security transactions are recorded on the trade date. Dividend income is recorded on the ex-dividend date or, for certain foreign securities, when notified. Interest income, which includes amortization of premium and accretion of discount on debt securities, is recorded on the accrual basis. Realized gains and losses on investments and unrealized appreciation and depreciation are determined on the identified cost basis, which is the same basis used for federal income tax purposes.
Repurchase Agreements:
The Portfolio, through the custodian or a subcustodian, receives delivery of the underlying securities collateralizing repurchase agreements. The Portfolio requires the custodian to take possession, to have legally segregated in the Federal Reserve Book Entry System, or to have segregated within the custodian’s vault, all securities held as collateral for repurchase agreements. It is the Portfolio’s policy that the market value of the collateral be at least equal to 100% of the repurchase price in the case of a repurchase agreement of one-day duration and 102% on all other repurchase agreements. The Portfolio’s subadviser is responsible for determining that the value of the collateral is at all times at least equal to the repurchase price. In connection with transactions in repurchase agreements, if the seller defaults and the value of the collateral declines or if the seller enters an insolvency proceeding, realization of the collateral by the Portfolio may be delayed, limited or wholly denied.
Foreign Currency Translation:
The books and records of the Portfolio are maintained in U.S. dollars. The values of securities, currencies and other assets and liabilities denominated in currencies other than U.S. dollars are translated into U.S. dollars based upon foreign exchange rates prevailing at the end of the period. Purchases and sales of investment securities, income and expenses are translated on the respective dates of such transactions. Since the values of investment securities are presented at the foreign exchange rates prevailing at the end of the period, it is not practical to isolate that portion of the results of operations arising from changes in exchange rates from that portion of the results of operations reflecting fluctuations arising from changes in market prices of the investment securities. Such fluctuations are included in the net realized and unrealized gain or loss on investments.
MSF-13
Metropolitan Series Fund, Inc.
FI Value Leaders Portfolio
Notes to Financial Statements—December 31, 2008—(Continued)
Net realized foreign exchange gains or losses arise from sales of foreign currency, currency gains or losses realized between the trade and settlement dates on securities transactions, and the difference between the amounts of dividends, interest, and foreign withholding taxes recorded by the Portfolio and the U.S. dollar equivalent of the amounts actually received or paid by the Portfolio. Net unrealized foreign exchange gains and losses arise from changes in the value of assets and liabilities, other than investment securities, resulting from changes in the exchange rate.
Forward Foreign Currency Exchange Contracts:
The Portfolio may enter into forward foreign currency exchange contracts primarily to hedge against foreign currency exchange rate risks on its non-U.S. dollar denominated investment securities. When entering into a forward currency contract, the Portfolio agrees to receive or deliver a fixed quantity of foreign currency for an agreed-upon price on an agreed future date. These contracts are valued daily and the Portfolio’s net equity therein, representing unrealized gain or loss on the contracts as measured by the difference between the foreign exchange rates at the dates of entry into the contracts and the forward rates at the settlement date, is included in the Statement of Assets and Liabilities. Realized and unrealized gains and losses are included in the Statement of Operations. These instruments involve market and/or credit risk in excess of the amount recognized in the Statement of Assets and Liabilities. Risks arise from the possible inability of counterparties to meet the terms of their contracts and from movement in currency and securities values and interest rates.
Futures Contracts:
The Portfolio may buy and sell futures contracts (on recognized exchanges) as a hedge or to enhance return. Futures contracts are agreements to buy or sell a security, or deliver a final cash settlement price in connection with an index, interest rate, currency, or other contracts not calling for physical delivery, for a set price in the future. The Portfolio must post an amount equal to a portion of the total market value of the futures contract as futures variation margin, which is returned when the Portfolio’s obligations under the contract have been satisfied. From time to time thereafter, the Portfolio may have to post variation margin to maintain this amount as the market value of the contract fluctuates. Risks of entering into futures contracts (and related options) include the possibility that there may be an illiquid market and that a change in the value of the contract or option may not correlate with changes in the value of the underlying securities.
Options:
The Portfolio may use options to enhance returns or to hedge against changes in values of securities the Portfolio owns or expects to purchase. Writing puts or buying calls tends to increase the Portfolio’s exposure to the underlying instrument and writing calls or buying puts tends to decrease the Portfolio’s exposure to the underlying instrument, and can be used to hedge other Portfolio investments. For options purchased to hedge the Portfolio’s investments, the potential risk to the Portfolio is that the change in value of options contracts may not correspond to the change in value of the hedged instruments. In addition, losses may arise from changes in the value of the underlying instruments, if there is an illiquid secondary market, or if the counterparty is unable to perform. The maximum loss for purchased options is limited to the premium initially paid for the option. For options written by the Portfolio, the maximum loss is not limited to the premium initially received for the option.
The main risk associated with purchasing an option is that the option expires without being exercised. In this case, the option expires worthless and the premium paid for the option is considered the loss. The risk associated with writing a call option is that the Portfolio may forgo the opportunity for a profit if the market value of the underlying position increases and the option is exercised. The risk in writing a put option is that the Portfolio may incur a loss if the market value of the underlying position decreases and the option is exercised. In addition, the Portfolio risks not being able to enter into a closing transaction for the written option as the result of an illiquid market.
“When-Issued” Securities:
Purchasing securities “when-issued” is a forward commitment by the Portfolio to buy a security. The estimated amount of the Portfolio’s payment obligation and the security’s interest rate are determined when the commitment is made, even though no interest accrues until the security is issued, which is generally 15 to 120 days later. The Portfolio will segregate liquid assets with its custodian sufficient at all times to satisfy these commitments. If the value of the security is less when delivered than when the commitment was made, the Portfolio will suffer a loss.
MSF-14
Metropolitan Series Fund, Inc.
FI Value Leaders Portfolio
Notes to Financial Statements—December 31, 2008—(Continued)
Federal Income Taxes:
It is the Portfolio’s policy to comply with the requirements of the Internal Revenue Code of 1986, as amended (the “Code”), and regulations thereunder, applicable to regulated investment companies and to distribute, with respect to each taxable year, all of its taxable income to shareholders. Therefore, no federal income tax provision is required. The Portfolio is subject to the provisions of the Financial Accounting Standards Board Interpretation (“FASB”) No. 48, Accounting for Uncertainties in Income Taxes (FIN 48). FIN 48 sets forth a minimum threshold for financial statement recognition of the benefit of a tax position taken or expected to be taken in a tax return. The implementation of FIN 48 did not result in any unrecognized tax benefits in the accompanying financial statements. Each of the Portfolio’s federal tax returns for the prior three fiscal years remains subject to examination by the Internal Revenue Service.
As of December 31, 2008, the Portfolio had 115,025,550 in capital loss carryforwards expiring on December 31, 2016.
Pursuant to Section 852 of the Code, the Portfolio designated the amount shown below under Long Term Gain as capital gain dividends for its taxable year ended December 31, 2008. The tax character of distributions paid for the periods ended December 31, 2008 and 2007 was as follows:
| | | | | | | | | | | | | | | | | | | | | | |
| Ordinary Income | | Long Term Gain | | Return of Capital | | Total |
| 2008 | | 2007 | | 2008 | | 2007 | | 2008 | | 2007 | | 2008 | | 2007 |
| $ | 53,474,329 | | $ | 41,560,220 | | $ | 27,683,566 | | $ | 52,540,461 | | $ | — | | $ | — | | $ | 81,157,895 | | $ | 94,100,681 |
As of December 31, 2008, the components of distributable earnings (accumulated losses) on a federal income tax basis were as follows:
| | | | | | | | | | | | | | | | |
Undistributed
Ordinary
Income | | Undistributed
Long Term
Gain | | Unrealized
Depreciation | | | Loss
Carryforwards | | | Total | |
| $ | 11,971,774 | | $ | — | | $ | (140,235,014 | ) | | $ | (115,025,550 | ) | | $ | (243,288,790 | ) |
Pursuant to Federal income tax regulations applicable to investment companies, the Portfolio has elected to treat net capital losses realized between November 1 and December 31 of each year as occurring on the first day of the following tax year. For the year ended December 31, 2008, the following amounts of realized capital and currency losses reflected in the accompanying financial statements will not be recognized for Federal income tax purposes until January 1, 2009:
| | | | |
Currency | | Capital | |
$— | | $ | (49,422,157 | ) |
Dividends and Distributions to Shareholders:
The Portfolio records dividends and distributions on the ex-dividend date. Net realized gains from security transactions (if any) are generally distributed annually to shareholders. The timing and characterization of certain income and capital gains distributions are determined in accordance with federal tax regulations that may differ from GAAP. Permanent book and tax basis differences relating to shareholder distributions will result in reclassification between under/over distributed net investment income, accumulated net realized gains/losses and paid in capital.
| 3. | INVESTMENT TRANSACTIONS: |
For the year ended December 31, 2008, purchases and sales of securities (excluding short term investments) for the Portfolio were as follows:
| | | | | | | | | | |
| Purchases | | Sales |
| U.S. Government | | Other | | U.S. Government | | Other |
| $ | 0 | | $ | 1,240,779,571 | | $ | 0 | | $ | 1,328,181,558 |
MSF-15
Metropolitan Series Fund, Inc.
FI Value Leaders Portfolio
Notes to Financial Statements—December 31, 2008—(Continued)
| 4. | INVESTMENT MANAGEMENT FEES AND OTHER TRANSACTIONS WITH AFFILIATES: |
Investment Management Agreement:
MetLife Advisers is the investment adviser to the Portfolio. The Fund has entered into an investment management agreement with MetLife Advisers with respect to the Portfolio. For providing investment management services to the Portfolio, MetLife Advisers receives monthly compensation at the following annual rates:
| | | | |
Management
Fees earned by
MetLife Advisers
for the year ended
December 31, 2008 | | Annual
percentage
rates paid to
MetLife Advisers | | Based on Portfolios
average daily net asset
levels |
| $4,191,190 | | 0.700% | | Of the first $200 million |
| | 0.650% | | Of the next $300 million |
| | 0.600% | | Of the next $1.5 billion |
| | 0.550% | | On amounts in excess of $2 billion |
Certain officers and directors of the Fund may also be officers of MetLife Advisers; however, such officers and directors receive no compensation from the Fund.
Fidelity Management & Research Company (“FMR”) was compensated by MetLife Advisers to provide subadvisory services to the Portfolio from January 1, 2008 through April 27, 2008. Effective April 28, 2008, Pyramis Global Advisors, LLC, a wholly owned subsidiary of FMR, became subadviser to the Portfolio and receives compensation for providing subadvisory services thereto.
Service and Distribution Fees:
The Fund has adopted a Distribution and Service Plan under Rule 12b-1 of the 1940 Act for the Portfolio’s Class B, D and E shares. Under the Distribution and Service Plan, the Class B, D and E shares of the Portfolio pay a fee to compensate the Insurance Companies (or their affiliates) and other broker-dealers and financial intermediaries involved in the offer and sale of Portfolio shares for promoting or selling and servicing the Class B, D and E shares. The fees under the Distribution and Service Plan for each applicable class of the Portfolio’s shares are calculated as a percentage of the Portfolio’s average daily net assets that are attributable to that Class. Currently, the fee is 0.25% per year for Class B shares, 0.10% per year for Class D shares and 0.15% per year for Class E shares. Amounts paid by the Portfolio for the year ended December 31, 2008 are shown as Service and Distribution fees in the Statement of Operations.
The Fund has entered into a securities lending arrangement with the Fund’s custodian, State Street Bank and Trust Company (the “custodian”). Under the agreement, the custodian is authorized to loan securities on the Portfolios’ behalf. In exchange, the Portfolio receives either cash or securities as collateral against the loaned securities. The Portfolio receives collateral at least equal to 102% of the market value of the loaned securities (105% for foreign securities), at each loan’s inception. Collateral must be maintained at least at 100% of the market value of the loaned securities for the duration of the loan. The cash collateral is invested in the Navigator Securities Lending Prime Portfolio, an affiliate of the custodian, which invests in a variety of high quality U.S. dollar-denominated instruments. If the market value of the collateral at the close of trading on a business day is less than 100% of the market value of the loaned securities at the close of trading on that day, the borrower shall be required to deliver, by the close of business on the following business day, an additional amount of collateral, equal to at least 100% of the market value of all the loaned securities as of such preceding day. The Portfolio receives 80% of the annual net income from securities lending transactions, which is included in interest income of the Portfolio. The remaining 20% is paid to the custodian as compensation for its securities lending services. Interest income received by the Portfolio via lending transactions during the year ended December 31, 2008 is footnoted in the Statement of Operations. The Portfolio bears the risk of any deficiency in the amount of collateral available for return to a borrower due to a loss in an approved investment purchased with such collateral. Any outstanding loans by the Portfolio at December 31, 2008 are footnoted in the Schedule of Investments.
| 6. | MARKET AND CREDIT RISK: |
In the normal course of business, the Portfolio invests in securities and enters into transactions where risks exist due to fluctuations in the market (market risk) or failure of the other party to a transaction to perform (credit risk). The value of securities held by the Portfolio may decline in response to certain events, including those directly involving the companies whose
MSF-16
Metropolitan Series Fund, Inc.
FI Value Leaders Portfolio
Notes to Financial Statements—December 31, 2008—(Continued)
securities are owned by the Portfolio; conditions affecting the general economy; overall market changes; local, regional or global political, social or economic instability; and currency and interest rate and price fluctuations. Similar to credit risk, the Portfolio may be exposed to counterparty risk, or the risk that an entity with which the Portfolio has unsettled or open transactions may default. Financial assets, which potentially expose the Portfolio to credit and counterparty risks, consist principally of investments and cash due from counterparties. The extent of the Portfolio’s exposure to credit and counterparty risks in respect to these financial assets approximates their value as recorded in the Portfolio’s Statements of Assets and Liabilities.
| 7. | RECENT ACCOUNTING PRONOUNCEMENTS: |
In March 2008, the FASB issued Statement of Financial Accounting Standards No. 161, Disclosures about Derivative Instruments and Hedging Activities (“FAS 161”), an amendment of FASB Statement No. 133. FAS 161 requires enhanced disclosures about (a) how and why an entity uses derivative instruments, (b) how derivative instruments and hedging activities are accounted for, and (c) how derivative instruments and related hedging activities affect a fund’s financial position, financial performance, and cash flows. Management does not believe the adoption of FAS 161 will materially impact the financial statement amounts, but will require additional disclosures. This will include qualitative and quantitative disclosures on derivative positions existing at period end and the effect of using derivatives during the reporting period. FAS 161 is effective for financial statements issued for fiscal years and interim periods beginning after November 15, 2008. Management is currently evaluating the impact the adoption of FAS 161 will have on the Portfolio’s financial statement disclosures.
MSF-17
Metropolitan Series Fund, Inc.
FI Value Leaders Portfolio
Report of Independent Registered Public Accounting Firm
To the Shareholders and Board of Directors of Metropolitan Series Fund, Inc.:
We have audited the accompanying statement of assets and liabilities, including the schedule of investments, of the Fl Value Leaders Portfolio (one of the portfolios constituting the Metropolitan Series Fund, Inc.) (the “Fund”) as of December 31, 2008, and the related statement of operations for the year then ended, the statements of changes in net assets for each of the two years in the period then ended, and the financial highlights for each of the five years in the period then ended. These financial statements and financial highlights are the responsibility of the Fund’s management. Our responsibility is to express an opinion on these financial statements and financial highlights based on our audits.
We conducted our audits in accordance with the standards of the Public Company Accounting Oversight Board (United States). Those standards require that we plan and perform the audit to obtain reasonable assurance about whether the financial statements and financial highlights are free of material misstatement. The Fund is not required to have, nor were we engaged to perform, an audit of its internal control over financial reporting. Our audits included consideration of internal control over financial reporting as a basis for designing audit procedures that are appropriate in the circumstances, but not for the purpose of expressing an opinion on the effectiveness of the Fund’s internal control over financial reporting. Accordingly, we express no such opinion. An audit also includes examining, on a test basis, evidence supporting the amounts and disclosures in the financial statements, assessing the accounting principles used and significant estimates made by management, as well as evaluating the overall financial statement presentation. Our procedures included confirmation of securities owned as of December 31, 2008, by correspondence with the custodian and brokers; where replies were not received from brokers, we performed other auditing procedures. We believe that our audits provide a reasonable basis for our opinion.
In our opinion, the financial statements and financial highlights referred to above present fairly, in all material respects, the financial position of the Fl Value Leaders Portfolio of the Metropolitan Series Fund, Inc. as of December 31, 2008, the results of its operations for the year then ended, the changes in its net assets for each of the two years in the period then ended, and the financial highlights for each of the five years in the period then ended, in conformity with accounting principles generally accepted in the United States of America.
Deloitte & Touche LLP
Boston, Massachusetts
February 20, 2009
MSF-18
Metropolitan Series Fund, Inc.
Directors and Officers
The Fund’s Directors review actions of the Fund’s investment adviser and subadvisers, and decide upon matters of general policy. The Fund’s officers supervise the daily business operations of the Fund. The Board of Directors and the Fund’s officers are listed below. Each Director is responsible for overseeing all 38 Portfolios of the Fund. There is no limit to the term a Director may serve. Directors serve until their resignation, retirement or removal in accordance with the Fund’s organizational documents and policies adopted by the Board from time to time. Officers hold office at the pleasure of the Board or until the election or appointment and the qualification of a successor. The address of the Directors and officers is c/o Metropolitan Series Fund, Inc., 501 Boylston Street, Boston, MA 02116.
Interested Directors(1)
Each Director below is an “interested person” (as defined by the 1940 Act) with respect to the Fund in that Ms. Forget is an employee of MetLife and Mr. Typermass is a former employee of MetLife and owns securities issued by MetLife, Inc., the ultimate parent company of MetLife Advisers.
| | | | | | | | |
Name, Address and Age | | Current
position(s)
with Fund | | Position(s)
held since | | Principal occupations
over past five years, including other directorships(2) | | Number of
Portfolios in
Fund Complex
Overseen by
Director(3) |
Elizabeth M. Forget Age: 42 | | Director, Chairman of the Board, President and Chief Executive Officer | | 2006 | | Senior Vice President (since 2007), MetLife, Inc.; President, Met Investors Advisory, LLC; Trustee and President, Met Investors Series Trust; Executive Vice President, MetLife Investors Group, Inc.; President, Chief Executive Officer and Chair of the Board of Managers (since 2006), MetLife Advisers; President, Met Investors Advisory, LLC. | | 87 |
| | | | |
Arthur G. Typermass Age: 71 | | Director | | 1998 | | Formerly, Senior Vice President and Treasurer, MetLife. | | 38 |
Non-Interested Directors(1)
Each Director below is not an “interested person” (as defined by the 1940 Act) with respect to the Fund (collectively, the “Independent Directors”).
| | | | | | | | |
Name, Address and Age | | Current
position(s)
with Fund | | Position(s)
held since | | Principal occupations
over past five years, including other directorships(2) | | Number of
Portfolios in
Fund Complex
Overseen by
Director(3) |
Steve A. Garban† Age: 71 | | Director | | 1985 | | Formerly, Chief Financial Officer, Senior Vice President Finance and Operations and Treasurer (Emeritus), The Pennsylvania State University. | | 38 |
| | | | |
Linda B. Strumpf Age: 61 | | Director | | 2000 | | Vice President and Chief Investment Officer, Ford Foundation. | | 38 |
| | | | |
Michael S. Scott Morton† Age: 71 | | Director | | 1993 | | Jay W. Forrester Professor of Management (Emeritus) at Sloan School of Management, MIT. | | 38 |
| | | | |
H. Jesse Arnelle Age: 75 | | Director | | 2001 | | Formerly, Counsel, Womble Carlyle Sandrie & Rice; Director, Textron Inc. (global multi- industry company)*; formerly, Director, Gannet Co. Inc. (diversified news and information company)*; formerly, Director, Eastman Chemical Company (global chemical company)*; formerly, Director, Waste Management, Inc.*; formerly, Director, Armstrong Holdings Inc. (parent company of floor and ceiling products business)*; formerly, Director, FPL Group Inc. (public utility holding company)*; Director, URS Corporation (engineering design services firm)*. | | 38 |
MSF-19
Metropolitan Series Fund, Inc.
Directors and Officers—(Continued)
| | | | | | | | |
Name, Address and Age | | Current
position(s)
with Fund | | Position(s)
held since | | Principal occupations
over past five years, including other directorships(2) | | Number of
Portfolios in
Fund Complex
Overseen by
Director(3) |
Nancy Hawthorne Age: 57 | | Director | | 2003 | | Chief Executive Officer, Clerestory LLC (corporate financial advisor); Director, Avid Technologies (computer software company)*; formerly, Chairman of the Board of Avid Technologies; formerly, Board of Advisors, L. Knife & Sons, Inc. (beverage distributor); formerly, Trustee, New England Zenith Fund (“Zenith Fund”)**; formerly, Chief Executive Officer and Managing Partner, Hawthorne, Krauss and Associates (corporate financial advisor); formerly, Chief Financial Officer and Executive Vice President, Continental Cablevision, subsequently renamed MediaOne (cable television company); formerly, Director, Life F/X, Inc.; formerly, Chairman of the Board, WorldClinic (distance medicine company); formerly, Director, Perini Corporation (construction company)*; formerly, Director, CGU (property and casualty insurance company); formerly, Director, Beacon Power Corporation (energy company)*. | | 38 |
| | | | |
John T. Ludes Age: 72 | | Director | | 2003 | | President, LFP Properties (consulting firm); Formerly, Trustee, Zenith Fund**; formerly, Vice Chairman, President and Chief Operating Officer, Fortune Brands/American Brands (global conglomerate); formerly, President and CEO, Acushnet Company (athletic equipment company). | | 38 |
Officers(1)
| | | | | | | | |
Name and address | | Age | | Current
position(s)
with Fund | | Position(s)
held since | | Principal occupations over past five years(2) |
| Jeffrey L. Bernier | | 37 | | Senior Vice President | | 2008 | | Vice President (since 2008), MetLife, Inc.; Vice President (since 2008), MetLife; Senior Vice President (since 2008), MetLife Advisers; formerly, Director and Senior Investment Analyst (2004 to 2007), John Hancock Financial Services; formerly, Assistant Vice President (2000 to 2001), Wachovia Securities. |
| | | | |
| Alan C. Leland | | 56 | | Senior Vice President | | 2005 | | Treasurer and Chief Financial Officer, MetLife Advisers, LLC; Treasurer (since 2005), Met Investors Advisory, LLC; Vice President (since 2004), Met Investors Advisory, LLC; Vice President (since 2003), MetLife, Inc.; Vice President, MetLife; Senior Vice President, NELICO. |
| | | | |
| Peter Duffy | | 53 | | Vice President
and Treasurer | | 2000 | | Senior Vice President, MetLife Advisers; Second Vice President (since 2003), NELICO; Vice President, MetLife (since 2004); Vice President (since 2004), MetLife, Inc.; formerly, Vice President and Treasurer, Zenith Fund**. |
| | | | |
| Jeffrey P. Halperin | | 41 | | Chief
Compliance Officer | | 2007 | | Vice President (since 2006), MetLife, Inc.; Vice President (since 2006), MetLife; Chief Compliance Officer (since 2006), Met Investors Series Trust, MetLife Advisers, Met Investors Advisory, LLC and MetLife Investment Advisors Company, LLC. |
| * | Indicates a directorship with a registered investment company or a company subject to the reporting requirements of the Securities Exchange Act of 1934, as amended. |
| ** | The Zenith Fund deregistered with the Securities and Exchange Commission (“SEC”) in 2004. |
| (†) | Served as a trustee, director and/or officer of one or more of the following companies, each of which had a direct or indirect advisory relationship with MetLife Advisers or its affiliates prior to January 31, 2005: State Street Research Financial Trust, State Street Research Income Trust, State Street Research Money Market Trust, State Street Research Institutional Funds, State Street Research Capital Trust, State Street Research Master Investment Trust, State Street Research Equity Trust, State Street Research Securities Trust and State Street Research Exchange Trust (collectively, the “State Street Research Funds”). |
| (1) | During the period shown, each Director of the Fund served as a Trustee of Metropolitan Series Fund II, a registered investment company that ceased investment operations in June of 2008 and has applied for deregistration under the Investment Company Act of 1940. During this period, each officer of the Fund served in the same position with Metropolitan Series Fund II. |
| (2) | Previous positions during the past five years with the Fund; Met Investors Series Trust; MetLife; MetLife, Inc.; MetLife Advisers; Met Investors Advisory, LLC; Zenith Fund; NELICO; or New England Securities Corporation are omitted if not materially different. |
| (3) | The Fund Complex includes the Fund (38 portfolios) and Met Investors Series Trust (49 portfolios). |
MSF-20
Metropolitan Series Fund, Inc.
FI Value Leaders Portfolio
Board Approval of Advisory and Subadvisory Agreements
The Fund’s Contract Review Committees of the Board of Directors (the “Board” or the “Directors”) typically meet in early fall to review the Portfolios’ advisory agreements (the “Advisory Agreements”) and subadvisory agreements (the “Subadvisory Agreements,” and, together with the Advisory Agreements, the “Agreements”) and determine whether to recommend that the full Board approve the continuation of the Agreements for an additional one-year period. (Following the initial approval of an Agreement for a new Portfolio or with a new adviser or subadviser, such annual reviews are not required until 2 years following the execution of such Agreement.) After each Committee has made its recommendations, the full Board, including the Independent Directors, determines whether to approve the continuation of each of the Agreements. In addition, the Board, including the Independent Directors, considers matters bearing on the Agreements at most of its other meetings throughout the year and regularly interviews various individuals at MetLife Advisers responsible for the management of the Portfolios. The Directors also interview selected investment managers and other professionals at the subadvisers at various times throughout the year.
The Directors receive all materials that they or MetLife Advisers, the Fund’s investment adviser, and the subadvisers believe to be reasonably necessary for the Directors to evaluate the Agreements and determine whether to approve the continuation of the Agreements. These materials generally include, among other items, (i) information on the investment performance of the Portfolios and the performance of peer groups of funds and the Portfolios’ performance benchmarks, (ii) information on the Portfolios’ advisory and subadvisory fees and other expenses, including information comparing the Portfolios’ expenses to those of peer groups of funds and information about any applicable expense caps and fee “breakpoints,” (iii) sales and redemption data, (iv) information related to the profitability of the Agreements to MetLife Advisers and certain of the subadvisers, and potential “fall-out” or ancillary benefits that MetLife Advisers, the subadvisers or their affiliates may receive as a result of their relationships with the Fund and (v) information obtained through the subadvisers’ responses to certain requests from MetLife Advisers and the Directors and MetLife Advisers’ responses to requests from the Directors. The Directors may also consider other information such as (vi) MetLife Advisers’ and the subadvisers’ financial results and condition, (vii) each Portfolio’s investment objectives and strategies and the size, education and experience of the investment staffs of MetLife Advisers and the relevant subadvisers and their use of technology and external research, (viii) the allocation of the Portfolios’ brokerage, if any, including allocations to brokers affiliated with the subadvisers and the use of “soft” commission dollars to pay Portfolio expenses and to pay for research and other similar services, (ix) the resources devoted to, and the record of compliance with, the Portfolios’ investment policies and restrictions, policies on personal securities transactions and other compliance policies, (x) the responses of MetLife Advisers, the subadvisers and/or their affiliates to certain legal and regulatory proceedings and (xi) the economic outlook generally and for the mutual fund industry in particular. Throughout the process, the Directors have the opportunity to ask questions of and request additional materials from MetLife Advisers and the subadvisers.
Following meetings of each Contract Review Committee on September 10, 2008, the Board, including the Independent Directors, at its November 6-7, 2008 meeting, approved the continuation through December 31, 2009 of the Advisory Agreements for each Portfolio of the Fund and the Subadvisory Agreements for each Portfolio other than the Zenith Equity Portfolio and Asset Allocation Portfolios (which do not have subadvisers) and the Van Eck Global Natural Resources Portfolio, Met/Dimensional International Small Cap Portfolio and Loomis Sayles Small Cap Growth Portfolio (formerly known as the Franklin Templeton Small Cap Growth Portfolio). The Agreements approved for continuation are referred to below as the “Continued Agreements.”
In considering whether to approve the continuation of the Continued Agreements, the Directors, including the Independent Directors, did not identify any single factor as determinative, and each weighed the various factors as he or she deemed appropriate. The Directors considered the following matters in connection with their approval of the Continued Agreements:
The nature, extent and quality of the services provided to the relevant Portfolios under the Continued Agreements. The Directors considered the nature, extent and quality of the services provided by MetLife Advisers, the relevant subadvisers (if any) and their affiliates (each, an “Adviser,” and, collectively, the “Advisers”) to the relevant Portfolios pursuant to the Continued Agreements and the resources dedicated to these Portfolios by the Advisers. In particular, the Directors considered the Advisers’ abilities to attract and retain highly qualified investment professionals. With respect to MetLife Advisers, the Directors considered (for each Portfolio other than the Zenith Equity and Asset Allocation Portfolios) that MetLife Advisers is (i) ultimately responsible for the performance of such Portfolios; (ii) ultimately responsible for the establishment of the investment strategies of each such Portfolio, primarily through its recommendations to the Board regarding the hiring and selection of subadvisers; (iii) responsible for the hiring and selection, subject to Board approval, of subadvisers; and (iv) responsible for maintaining a program of Subadviser oversight reasonably designed to ensure that the subadvisers have reasonable compliance policies and procedures in place. The Directors also considered that MetLife Advisers provides a full range of day-to-day administrative services for the Portfolios involving all aspects of such Portfolios’ day-to-day operations (other than portfolio management). With respect to the Zenith Equity and Asset Allocation Portfolios, the Directors considered both the portfolio management services and the administrative services provided by MetLife Advisers. After reviewing
MSF-21
Metropolitan Series Fund, Inc.
FI Value Leaders Portfolio
Board Approval of Advisory and Subadvisory Agreements—(Continued)
these and related factors, the Directors concluded, within the context of their overall conclusions regarding each of the Continued Agreements, that the nature, extent and quality of services provided supported the renewal of these Agreements.
Investment performance of the relevant Portfolios. The Directors reviewed information about the performance of the relevant Portfolios over various time periods, including information prepared by an independent third party that compared the performance of the Portfolios to the performance of peer groups of funds and performance benchmarks. The Directors also reviewed a description of the third party’s methodology for identifying a Portfolio’s peer group(s) for purposes of performance and expense comparisons.
In the case of each relevant Portfolio that had performance that lagged its peer group(s) for certain periods, the Directors concluded that other factors relevant to performance were sufficient, in light of other considerations, to warrant renewal of the Continued Agreements relating to such Portfolio. These factors varied from Portfolio to Portfolio, but included one or more of the following: (i) that such Portfolio’s performance, although lagging in certain recent periods, was stronger over the longer term; (ii) that the underperformance was attributable, to a significant extent, to investment decisions that were reasonable and consistent with the Portfolio’s investment objective(s) and policies and that the Portfolio was performing within the range of reasonable expectations, given market conditions and the Portfolio’s investment objective(s) and policies; (iii) that the Portfolio’s performance was competitive when compared to other relevant performance benchmarks or peer groups; and (iv) that MetLife Advisers and/or the relevant subadviser (if any) had taken or was taking steps designed to help improve the Portfolio’s investment performance (including, in the case of certain Portfolios, that MetLife Advisers was formulating possible proposals, for presentation to the Board in November 2008, to replace the Portfolio’s subadviser or to merge the Portfolio into another Portfolio with a similar investment objective and better investment performance).
The Directors also considered the investment performance of the Advisers and their reputations generally, the historical responsiveness of the Advisers to Director concerns about performance and the willingness of the Advisers to take steps intended to improve performance.
After reviewing these and related factors, the Directors concluded, within the context of their overall conclusions regarding each of the Continued Agreements, that the investment performance of each relevant Portfolio and Adviser was sufficient, in light of other considerations, to warrant the renewal of the Continued Agreements.
The costs of the services to be provided and profits to be realized by the Advisers and their affiliates from their relationships with the Portfolios. The Directors considered the fees charged by MetLife Advisers to the Portfolios for advisory services and, with respect to the subadvised Portfolios, by such subadvisers to MetLife Advisers for subadvisory services (such advisory and subadvisory fees (if any), collectively, “Fees”), as well as the total expense levels of the Portfolios. This information included comparisons (provided by an independent third party) of the Portfolios’ advisory fees and total expense levels to those of their peer groups. In evaluating Fees for the relevant Portfolios, the Directors also took into account the demands, complexity and quality of the investment management services provided to each Portfolio. The Directors considered MetLife Advisers’ recommendations regarding reductions in Fee rates, implementation of Fee breakpoints and institution of Fee waivers and expense caps.
The Directors also considered the compensation directly or indirectly received by the Advisers and their affiliates from their relationships with the relevant Portfolios. The Directors reviewed information relating to the profits received by MetLife Advisers, certain of the subadvisers and their affiliates as a result of their relationships with the relevant Portfolios, and information about the allocation of expenses used to calculate profitability. When reviewing profitability, the Directors also considered the performance of the relevant Portfolios, the expense levels of such Portfolios and whether the relevant Advisers had implemented breakpoints, fee waivers and/or expense caps with respect to such Portfolios.
After reviewing these and related factors, the Directors concluded, within the context of their overall conclusions regarding each of the Continued Agreements, that the Fees charged to each of the relevant Portfolios were fair and reasonable, and that the information provided regarding costs of these services generally, and the related profitability (if known) to the relevant Advisers of their relationships with the relevant Portfolios, supported the renewal of the Continued Agreements.
Economies of Scale. The Directors considered the existence of any economies of scale in the provision of services by the Advisers and whether those economies were shared with the relevant Portfolios through breakpoints in their advisory fees or other means, such as expense caps, fee waivers or relatively low levels of fees. The Directors noted that most of the relevant Portfolios benefited or will benefit from breakpoints, expense caps and/or fee waivers with respect to their advisory fees. In considering these issues, the Directors also took into consideration information relating to the costs of the services provided and the profitability to MetLife Advisers, the relevant subadvisers (if any) and each of their affiliates of their relationships with the relevant Portfolios, as discussed above.
MSF-22
Metropolitan Series Fund, Inc.
FI Value Leaders Portfolio
Board Approval of Advisory and Subadvisory Agreements—(Continued)
After reviewing these and related factors, the Directors concluded, within the context of their overall conclusions regarding each of the Continued Agreements, that the extent to which economies of scale were shared with the relevant Portfolios supported the renewal of such Agreements.
Other Factors. The Directors also considered other factors, which included but were not limited to the following:
| | • | | the extent to which each relevant Portfolio operated in accordance with its investment objective, and its record of compliance with its investment restrictions and the compliance programs of the Fund and the Advisers. They also considered the compliance-related resources the Advisers and their affiliates provide to the relevant Portfolios; |
| | • | | the nature, quality, cost and extent of administrative and shareholder services performed by MetLife Advisers and its affiliates under the Advisory Agreements; and |
| | • | | so-called “fall-out benefits” to the Advisers, such as the engagement of their affiliates to provide distribution, brokerage and transfer agency services to the Portfolios, and the benefits of research made available to the relevant Advisers by reason of brokerage commissions generated by the relevant Portfolios’ securities transactions. The Directors also considered the possible conflicts of interest associated with these fall-out and other benefits, and the reporting and other processes in place to disclose and monitor these possible conflicts of interest. |
Based on their evaluation of all factors that they deemed to be material, including those factors described above, and assisted by the advice of independent counsel, the Directors, including the Independent Directors, concluded that each of the Continued Agreements should be continued through December 31, 2009.
MSF-23
A description of the policies and procedures that the Fund uses to determine how to vote proxies relating to portfolio securities is available (i) without charge, upon request, by calling (800) 638-7732 and (ii) on the Securities and Exchange Commission’s (the “SEC”) website at http://www.sec.gov.
Information regarding how the Fund voted proxies relating to portfolio securities during the most recent twelve-month period ended December 31, 2008 is available (i) without charge, upon request, by calling (800) 638-7732 and (ii) on the SEC’s website at http://www.sec.gov.
The Fund’s Statement of Additional Information includes additional information about the Directors of the Fund and is available (i) without charge, upon request, by calling (800) 638-7732 and (ii) on the SEC’s website at http://www.sec.gov.
The Fund files with the SEC a complete schedule of its portfolio holdings, as of the close of the first and third quarters of its fiscal year, on “Form N-Q”. These filings are available on the SEC’s website at www.sec.gov and may be reviewed and copied at the SEC’s Public Reference Room in Washington, DC. (Call 1-800-SEC-0330 for information on the operation of the Public Reference Room.)
MSF-24
Simplify your life…
with MetLife eDelivery® while helping MetLife preserve the planet’s natural resources.
(see details on inside cover)
| | |
Metropolitan Series Fund, Inc. Loomis Sayles Small Cap Growth Portfolio (formerly Franklin Templeton Small Cap Growth Portfolio) Annual Report | | December 31, 2008 |
NOT PART OF THE ANNUAL REPORT
Letter from the President
February 1, 2009
Letter to Policy Holders:
2008 was an extraordinary year in the capital markets around the world and for the global economy. Energy prices rose to record levels early in the year before falling by two-thirds by year-end. A credit crisis that began with concerns about sub-prime mortgages led to massive changes in the financial landscape with government takeovers, forced sales, and outright failures of a number of large, once venerable firms.
While bonds as measured by the Barclays Capital U.S. Aggregate Bond Index (formerly known as, Lehman Brothers U.S. Aggregate Bond Index) were up 5.2% for the year in response to declining interest rates, there were large differences in the total returns of the various sectors of the bond market. U.S. treasury securities were up over 13% as frightened investors sought refuge in what they perceived to be the safest and most liquid investments. In contrast, investment grade corporate securities lost nearly 5% as credit spreads widened and below investment grade or high yield bonds fell over 26%.
In response to the growing credit crisis and the weakening economy, common stocks fell sharply across all regions, styles, and capitalizations. As measured by the Standard and Poor’s 500, U.S. common stocks fell 37% for the year, the worst calendar year decline since the 1930s. Foreign stocks were down even more with the MSCI EAFE Index down 43% for the year.
On the following pages, you will find a complete review of your Portfolio and its investment performance.
MetLife is committed to building your financial freedom. We appreciate your trust and will continue to focus our efforts on meeting your investment needs.
Sincerely,
Elizabeth M. Forget
President, Metropolitan Series Fund, Inc.
Metropolitan Series Fund, Inc.
Loomis Sayles Small Cap Growth Portfolio (formerly Franklin Templeton Small Cap Growth Portfolio)
Managed by Loomis Sayles & Co., L.P.
Portfolio Manager Commentary*
PORTFOLIO PERFORMANCE
Franklin Advisers, Inc. (“Franklin”), the Portfolio’s subadviser prior to January 5, 2009, prepared this commentary, which addresses the Portfolio’s performance for the one year period ended December 31, 2008. On January 5, 2009, Loomis Sayles & Co., L.P. (“Loomis Sayles”) succeeded Franklin as the subadviser to the Portfolio and the name of the Portfolio was changed from the Franklin Templeton Small Cap Growth Portfolio to the Loomis Sayles Small Cap Growth Portfolio. This commentary and performance does not reflect the management of Loomis Sayles.
For the twelve-month period ended December 31, 2008, the Class A shares of the Loomis Sayles Small Cap Growth Portfolio returned -41.2%, compared to its benchmark, the Russell 2000 Growth Index1, which returned -38.5%. The average return of its peer group, the Lipper Variable Insurance Products2 Small-Cap Growth Funds Universe, was -41.1% over the same period.
PORTFOLIO REVIEW
In 2008, the U.S. economy faltered and The Conference Board’s Consumer Confidence Index fell to an all-time low since it began in 1967. The government’s abrupt conservatorship of Fannie Mae and Freddie Mac and the failure of several blue-chip banks and financial institutions roiled the equity markets. Despite government interventions and massive emergency funding, rapidly weakening manufacturing activity and falling home prices exacerbated the nation’s economic troubles. Jobless claims mounted and the unemployment rate rose to 7.2% by period-end. In early December, the National Bureau of Economic Research officially declared the U.S. economy has been in recession since December 2007. Volatility remained high throughout the reporting period but intensified in the latter half of the year as stocks fluctuated wildly and Treasury prices soared. The year was among the worst in history for U.S. stock market performance, with all major indexes recording double-digit losses. All sectors lost value, and the financials, materials and information technology sectors had the largest declines.
From a sector perspective, the health care, financials and energy sectors weighed on the Portfolio’s performance relative to the Russell 2000 Growth Index for the year under review. In the health care sector, stock selection and an underweighted allocation hurt relative returns, and significant detractors included pharmaceuticals companies K-V Pharmaceutical and Angiotech Pharmaceuticals. Stock selection in the financials and energy sectors also negatively impacted relative returns. In the financials sector, real estate investment trusts FelCor Lodging Trust and iStar Financial, and in the energy sector, oil and gas companies Helix Energy Solutions Group and Mariner Energy, hurt performance. Other key detractors outside of these sectors included aircraft cabin components maker BE Aerospace in the industrials sector and casino gaming operator Penn National Gaming in the consumer discretionary sector.
On a more positive note, stock selection in the industrials, information technology and materials sectors helped relative performance during the reporting period. In the industrials sector, significant performers were charter flight operator Allegiant Travel and automotive technician training school Universal Technical Institute. Key contributors in the information technology sector included digital satellite, networking and signal processing equipment manufacturer ViaSat and specialized imaging systems manufacturer FLIR Systems, and in the materials sector, industrial chemicals producer FMC helped results. Elsewhere in the portfolio, educational services company Strayer Education and eye glasses maker FGX International Holdings in the consumer discretionary sector, and Sequenom and Myriad Genetics in the health care sector were also major contributors. Sequenom makes a sequencing system to analyze DNA variations, while Myriad Genetics produces drugs and diagnostic testing systems aimed at finding and treating specific cancers and AIDS.
Our sector and industry weightings changed incrementally throughout the period, and in line with our investment strategy we invested in companies we believed provided the best trade-off between growth opportunity, business and financial risk, and valuation.
* The views expressed above are those of the subadvisory firm as of December 31, 2008 and are subject to change based on market and other conditions. Information about the Portfolio’s holdings, asset allocation, industry allocation, or country diversification is historical and is not an indication of future Portfolio composition, which will vary. The performance of any index mentioned in this commentary has not been adjusted for ongoing management, distribution and operating expenses, and sales charges applicable to mutual fund investments. Direct investment in any index is not possible.
1 The Russell 2000® Growth Index is an unmanaged measure of performance of those Russell 2000® companies (small capitalization companies) that have higher price-to book ratios and higher forecasted growth values.
2 The Lipper Variable Products Fund Average is an average of the total return performance (calculated on the basis of net asset value) of variable product funds with similar investment objectives to those of the subject Portfolio as calculated by Lipper Analytical Services, an independent mutual fund ranking service.
MSF-2
Metropolitan Series Fund, Inc.
Loomis Sayles Small Cap Growth Portfolio (formerly Franklin Templeton Small Cap Growth Portfolio)
A $10,000 INVESTMENT COMPARED TO THE RUSSELL 2000 GROWTH INDEX
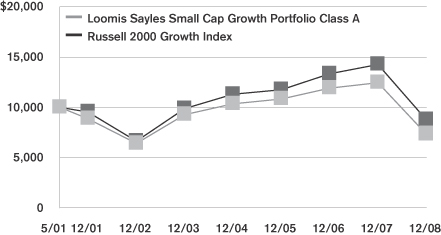
Average Annual Returns as of December 31, 2008
| | | | | | | | | | | | |
| | | Loomis Sayles Small Cap Growth Portfolio | | | Russell 2000
Growth Index | |
| | | Class A | | | Class B | | | Class E | | |
| 1 Year | | -41.2 | % | | -41.3 | % | | -41.3 | % | | -38.5 | % |
| 5 Year | | -4.6 | | | -4.9 | | | -4.8 | | | -2.4 | |
| Since Inception | | -4.0 | | | -4.2 | | | -4.1 | | | -1.7 | |
Performance numbers are net of all Portfolio expenses but do not include any insurance, sales, or administrative charges of variable annuity or life insurance contracts or any additional expenses that participants in certain eligible qualified plans may bear relating to the operations of their plans. If these charges were included, the returns would be lower.
Inception date of the Class A, Class B and Class E shares is 5/1/01. Index since inception return is based on the Class A inception date.
This information represents past performance and is not indicative of future results. Investment return and principal value may fluctuate so that shares, upon redemption, may be worth more or less than the original cost.
PORTFOLIO COMPOSITION
as of December 31, 2008
Top Holdings
| | |
| | | % of Total
Net Assets |
ViaSat, Inc. | | 3.0% |
Quest Software, Inc. | | 2.6% |
Psychiatric Solutions, Inc. | | 2.4% |
FGX International Holdings, Ltd. | | 2.0% |
Sequenom, Inc. | | 1.9% |
Hansen Natural Corp. | | 1.9% |
Power Integrations, Inc. | | 1.9% |
SBA Communications Corp. | | 1.8% |
Huron Consulting Group, Inc. | | 1.8% |
Flir Systems, Inc. | | 1.8% |
Top Sectors
| | |
| | | % of Equity
Market Value |
Information Technology | | 41.7% |
Health Care | | 13.4% |
Consumer Discretionary | | 12.5% |
Industrials | | 11.7% |
Energy | | 7.1% |
Financials | | 5.2% |
Consumer Staples | | 5.1% |
Telecommunication Services | | 1.9% |
Materials | | 1.4% |
MSF-3
Metropolitan Series Fund, Inc.
Shareholder Expense Example
As a shareholder of the Portfolio, you incur ongoing costs, including management fees; distribution and service (12b-1) fees; and other Portfolio expenses. This example is intended to help you understand your ongoing costs (in dollars) (referred to as “expenses”) of investing in the Portfolio and compare these costs with the ongoing costs of investing in other mutual funds. The example is based on an investment of $1,000 invested at the beginning of the period and held for the entire period, July 1, 2008 through December 31, 2008.
Actual Expenses
The first line for each share class of the Portfolio in the table below provides information about actual account values and actual expenses. You may use the information in this line, together with the amount you invested in the particular share class of the Portfolio, to estimate the expenses that you paid over the period. Simply divide your account value by $1,000 (for example, an $8,600 account value divided by $1,000=8.6), then multiply the result by the number in the first line under the heading entitled “Expenses Paid During Period” to estimate the expenses you paid on your account during this period.
Hypothetical Example for Comparison Purposes
The second line for each share class of the Portfolio in the table below provides information about hypothetical account values and hypothetical expenses based on the Portfolio’s actual expense ratio and an assumed rate of return of 5% per year before expenses, which is not the Portfolio’s actual return. The hypothetical account values and expenses may not be used to estimate the actual ending account balance or expenses you paid for the period. You may use this information to compare the ongoing costs of investing in the Portfolio and other funds. To do so, compare this 5% hypothetical example with the 5% hypothetical examples that appear in the shareholder reports of the other funds.
Please note that the expenses shown in the table are meant to highlight your ongoing costs only and do not reflect any fees or charges of your variable insurance product or any additional expenses that participants in certain eligible qualified plans may bear relating to the operations of their plan. Therefore, the second line for each share class in the table is useful in comparing ongoing costs only, and will not help you determine the relative total costs of owning different funds. In addition, if these other costs were included, your costs would have been higher.
| | | | | | | | | | | | | | |
Portfolio | | | | Annualized
Expense
Ratio | | | Beginning
Account Value
July 1,
2008 | | Ending
Account Value
December 31,
2008 | | Expenses Paid
During Period*
July 1, 2008
to
December 31,
2008 |
Loomis Sayles Small Cap Growth (formerly Franklin Templeton Small Cap Growth)—Class A | | Actual | | 1.03 | % | | $ | 1,000.00 | | $ | 681.87 | | $ | 4.35 |
| | Hypothetical | | 1.03 | % | | $ | 1,000.00 | | $ | 1,019.90 | | $ | 5.23 |
| | | | | |
Loomis Sayles Small Cap Growth (formerly Franklin Templeton Small Cap Growth)—Class B | | Actual | | 1.28 | % | | $ | 1,000.00 | | $ | 681.37 | | $ | 5.41 |
| | Hypothetical | | 1.28 | % | | $ | 1,000.00 | | $ | 1,018.62 | | $ | 6.49 |
| | | | | |
Loomis Sayles Small Cap Growth (formerly Franklin Templeton Small Cap Growth)—Class E | | Actual | | 1.18 | % | | $ | 1,000.00 | | $ | 680.83 | | $ | 4.99 |
| | Hypothetical | | 1.18 | % | | $ | 1,000.00 | | $ | 1,019.13 | | $ | 5.99 |
* Expenses paid are equal to the Portfolio’s annualized expense ratio for the most recent six month period, as shown above, multiplied by the average account value over the period, multiplied by the number of days in the most recent fiscal half-year, divided by 366 (to reflect the one-half year period).
MSF-4
Metropolitan Series Fund, Inc.
Loomis Sayles Small Cap Growth Portfolio (formerly Franklin Templeton Small Cap Growth Portfolio)
Schedule of Investments as of December 31, 2008
Common Stock—95.0% of Total Net Assets
| | | | | |
| Security Description | | Shares | | Value* |
| | | | | |
| | |
Aerospace & Defense—3.6% | | | | | |
Applied Signal Technology, Inc. | | 16,245 | | $ | 291,435 |
BE Aerospace, Inc. (a) | | 83,100 | | | 639,039 |
Orbital Sciences Corp. (a) | | 26,500 | | | 517,545 |
Stanley, Inc. (a) | | 24,693 | | | 894,381 |
| | | | | |
| | | | | 2,342,400 |
| | | | | |
| | |
Air Freight & Logistics—0.4% | | | | | |
Pacer International, Inc. | | 22,000 | | | 229,460 |
| | | | | |
| | |
Airlines—1.5% | | | | | |
Allegiant Travel Co. (a) | | 19,600 | | | 951,972 |
| | | | | |
| | |
Auto Components—1.2% | | | | | |
Drew Industries, Inc. (a) | | 52,000 | | | 624,000 |
Tenneco, Inc. (a) | | 46,100 | | | 135,995 |
| | | | | |
| | | | | 759,995 |
| | | | | |
| | |
Beverages—1.9% | | | | | |
Hansen Natural Corp. (a) | | 37,200 | | | 1,247,316 |
| | | | | |
| | |
Biotechnology—1.7% | | | | | |
Myriad Genetics, Inc. (a) | | 16,700 | | | 1,106,542 |
| | | | | |
| | |
Capital Markets—3.0% | | | | | |
Affiliated Managers Group, Inc. (a) | | 18,900 | | | 792,288 |
optionsXpress Holdings, Inc. | | 41,300 | | | 551,768 |
Waddell & Reed Financial, Inc. (Class A) | | 37,800 | | | 584,388 |
| | | | | |
| | | | | 1,928,444 |
| | | | | |
| | |
Chemicals—1.4% | | | | | |
FMC Corp. | | 20,100 | | | 899,073 |
| | | | | |
| | |
Commercial & Professional Services—1.4% | | | | | |
Mobile Mini, Inc. (a) | | 62,700 | | | 904,134 |
| | | | | |
| | |
Communications Equipment—5.9% | | | | | |
Ixia (a) | | 167,000 | | | 965,260 |
Riverbed Technology, Inc. (a) | | 78,300 | | | 891,837 |
ViaSat, Inc. (a) | | 79,600 | | | 1,916,768 |
| | | | | |
| | | | | 3,773,865 |
| | | | | |
| | |
Computers & Peripherals—1.2% | | | | | |
Compellent Technologies, Inc. (a) | | 66,800 | | | 649,964 |
Xyratex, Ltd. (a) | | 49,300 | | | 145,435 |
| | | | | |
| | | | | 795,399 |
| | | | | |
| | |
Diversified Consumer Services—3.6% | | | | | |
Capella Education Co. (a) | | 5,300 | | | 311,428 |
K12, Inc. (a) | | 28,000 | | | 533,960 |
Strayer Education, Inc. | | 3,500 | | | 750,435 |
Universal Technical Institute, Inc. (a) | | 40,400 | | | 693,668 |
| | | | | |
| | | | | 2,289,491 |
| | | | | |
| | | | | |
| Security Description | | Shares | | Value* |
| | | | | |
| | |
Diversified Financial Services—0.9% | | | | | |
MSCI, Inc. (a) | | 34,000 | | $ | 603,840 |
| | | | | |
|
Electronic Equipment, Instruments & Components—6.9% |
Coherent, Inc. (a) | | 44,000 | | | 944,240 |
FARO Technologies, Inc. (a) | | 55,000 | | | 927,300 |
FLIR Systems, Inc. (a) | | 38,000 | | | 1,165,840 |
National Instruments Corp. | | 14,600 | | | 355,656 |
Trimble Navigation, Ltd. (a) | | 49,600 | | | 1,071,856 |
| | | | | |
| | | | | 4,464,892 |
| | | | | |
| | |
Energy Equipment & Services—2.1% | | | | | |
Dril-Quip, Inc. (a) | | 26,800 | | | 549,668 |
Helix Energy Solutions Group, Inc. (a) | | 43,900 | | | 317,836 |
Superior Energy Services, Inc. (a) | | 30,800 | | | 490,644 |
| | | | | |
| | | | | 1,358,148 |
| | | | | |
| | |
Food Products—2.9% | | | | | |
Hain Celestial Group, Inc. (a) | | 60,700 | | | 1,158,763 |
TreeHouse Foods, Inc. (a) | | 26,400 | | | 719,136 |
| | | | | |
| | | | | 1,877,899 |
| | | | | |
| | |
Health Care Equipment & Supplies—1.9% | | | | | |
American Medical Systems Holdings, Inc. (a) | | 110,800 | | | 996,092 |
DexCom, Inc. (a) | | 78,600 | | | 216,936 |
| | | | | |
| | | | | 1,213,028 |
| | | | | |
| | |
Health Care Providers & Services—4.6% | | | | | |
MWI Veterinary Supply, Inc. (a) | | 20,500 | | | 552,680 |
Psychiatric Solutions, Inc. (a) | | 56,000 | | | 1,559,600 |
VCA Antech, Inc. (a) | | 44,100 | | | 876,708 |
| | | | | |
| | | | | 2,988,988 |
| | | | | |
| | |
Hotels, Restaurants & Leisure—2.5% | | | | | |
Panera Bread Co. (a) | | 8,200 | | | 428,368 |
Shuffle Master, Inc. (a) | | 234,600 | | | 1,163,616 |
| | | | | |
| | | | | 1,591,984 |
| | | | | |
| | |
Insurance—0.6% | | | | | |
Assured Guaranty, Ltd. | | 30,800 | | | 351,120 |
| | | | | |
| | |
Internet & Catalog Retail—0.7% | | | | | |
Gaiam, Inc. (a) | | 89,600 | | | 413,952 |
| | | | | |
| | |
Internet Software & Services—2.1% | | | | | |
DealerTrack Holdings, Inc. (a) | | 52,200 | | | 620,658 |
DivX, Inc. (a) | | 34,200 | | | 178,866 |
Omniture, Inc. (a) | | 48,400 | | | 514,976 |
| | | | | |
| | | | | 1,314,500 |
| | | | | |
| | |
IT Services—3.9% | | | | | |
Cybersource Corp. (a) | | 56,500 | | | 677,435 |
Global Payments, Inc. | | 9,000 | | | 295,110 |
Heartland Payment Systems, Inc. | | 16,900 | | | 295,750 |
*See accompanying notes to financial statements.
MSF-5
Metropolitan Series Fund, Inc.
Loomis Sayles Small Cap Growth Portfolio (formerly Franklin Templeton Small Cap Growth Portfolio)
Schedule of Investments as of December 31, 2008
Common Stock—(Continued)
| | | | | |
| Security Description | | Shares | | Value* |
| | | | | |
| | |
IT Services—(Continued) | | | | | |
Sapient Corp. (a) | | 231,064 | | $ | 1,025,924 |
VeriFone Holdings, Inc. (a) | | 43,100 | | | 211,190 |
| | | | | |
| | | | | 2,505,409 |
| | | | | |
| | |
Life Sciences Tools & Services—2.9% | | | | | |
Parexel International Corp. | | 61,700 | | | 599,107 |
Sequenom, Inc. (a) | | 63,059 | | | 1,251,091 |
| | | | | |
| | | | | 1,850,198 |
| | | | | |
| | |
Machinery—1.2% | | | | | |
Force Protection, Inc. (a) | | 128,700 | | | 769,626 |
| | | | | |
| | |
Media—1.3% | | | | | |
Lions Gate Entertainment Corp. (a) | | 155,500 | | | 855,250 |
| | | | | |
| | |
Oil, Gas & Consumable Fuels—4.6% | | | | | |
Bill Barrett Corp. (a) | | 30,500 | | | 644,465 |
Carrizo Oil & Gas, Inc. (a) | | 42,100 | | | 677,810 |
Mariner Energy, Inc. (a) | | 82,700 | | | 843,540 |
McMoRan Exploration Co. (a) | | 81,600 | | | 799,680 |
| | | | | |
| | | | | 2,965,495 |
| | | | | |
| | |
Pharmaceuticals—1.6% | | | | | |
Cadence Pharmaceuticals, Inc. (a) | | 68,994 | | | 498,826 |
Impax Laboratories, Inc. (a) (b) | | 35,400 | | | 251,765 |
KV Pharmaceutical Co. (a) | | 55,900 | | | 160,992 |
Penwest Pharmaceuticals Co. (a) | | 76,400 | | | 119,948 |
| | | | | |
| | | | | 1,031,531 |
| | | | | |
| | |
Professional Services—3.0% | | | | | |
FTI Consulting, Inc. (a) | | 17,500 | | | 781,900 |
Huron Consulting Group, Inc. (a) | | 20,500 | | | 1,174,035 |
| | | | | |
| | | | | 1,955,935 |
| | | | | |
| | |
Real Estate Investment Trusts—0.5% | | | | | |
FelCor Lodging Trust, Inc. | | 85,700 | | | 157,688 |
iStar Financial, Inc. | | 74,300 | | | 165,689 |
| | | | | |
| | | | | 323,377 |
| | | | | |
| |
Semiconductors & Semiconductor Equipment—11.2% | | | |
Advanced Analogic Technologies, Inc. (a) | | 46,400 | | | 140,128 |
Atheros Communications, Inc. (a) | | 58,900 | | | 842,859 |
FormFactor, Inc. (a) | | 64,700 | | | 944,620 |
Microsemi Corp. (a) | | 64,620 | | | 816,797 |
Microtune, Inc. (a) | | 169,000 | | | 344,760 |
NetLogic Microsystems, Inc. (a) | | 50,800 | | | 1,118,108 |
Power Integrations, Inc. | | 61,500 | | | 1,222,620 |
Silicon Laboratories, Inc. (a) | | 41,000 | | | 1,015,980 |
Varian Semiconductor Equipment Associates, Inc. (a) | | 42,400 | | | 768,288 |
| | | | | |
| | | | | 7,214,160 |
| | | | | |
| | |
Software—8.4% | | | | | |
Ansys, Inc. (a) | | 35,800 | | | 998,462 |
Bottomline Technologies, Inc. (a) | | 150,300 | | | 1,067,130 |
| | | | | | |
| Security Description | | Shares | | Value* |
| | | | | | |
| | |
Software—(Continued) | | | | | | |
EPIQ Systems, Inc. (a) | | | 38,300 | | $ | 639,993 |
Nuance Communications, Inc. (a) | | | 101,500 | | | 1,051,540 |
Quest Software, Inc. (a) | | | 132,000 | | | 1,661,880 |
| | | | | | |
| | | | | | 5,419,005 |
| | | | | | |
| | |
Specialty Retail—0.6% | | | | | | |
Tractor Supply Co. (a) | | | 11,100 | | | 401,154 |
| | | | | | |
|
Textiles, Apparel & Luxury Goods—2.0% |
FGX International Holdings, Ltd. (a) | | | 95,265 | | | 1,308,941 |
| | | | | | |
|
Wireless Telecommunication Services—1.8% |
SBA Communications Corp. (a) | | | 72,400 | | | 1,181,568 |
| | | | | | |
Total Common Stock
(Identified Cost $89,699,925) | | | | | | 61,188,091 |
| | | | | | |
|
| Short Term Investments—4.9% |
| Security Description | | Face
Amount/Shares | | Value* |
| | |
Discount Notes—4.9% | | | | | | |
Federal Home Loan Bank
0.020%, 01/02/09 | | $ | 3,135,000 | | | 3,135,000 |
| | | | | | |
| | |
Mutual Funds—0.0% | | | | | | |
State Street Navigator Securities Lending
Prime Portfolio (c) | | | 6,656 | | | 6,656 |
| | | | | | |
Total Short Term Investments
(Identified Cost $3,141,656) | | | | | | 3,141,656 |
| | | | | | |
Total Investments—99.9%
(Identified Cost $92,841,581) (d) | | | | | | 64,329,747 |
Other assets less liabilities | | | | | | 79,148 |
| | | | | | |
| Total Net Assets—100% | | | | | $ | 64,408,895 |
| | | | | | |
| (b) | Security was valued in good faith under procedures established by the Board of Directors. |
| (c) | Represents investment of cash collateral received from securities lending transactions. |
| (d) | The aggregate cost of investments for federal income tax purposes as of December 31, 2008 was $96,419,417 and the composition of unrealized appreciation and depreciation of investment securities was $2,237,211 and $(34,326,881), respectively. |
*See accompanying notes to financial statements.
MSF-6
Metropolitan Series Fund, Inc.
Loomis Sayles Small Cap Growth Portfolio (formerly Franklin Templeton Small Cap Growth Portfolio)
The Portfolio adopted the provisions of Statement of Financial Accounting Standards No. 157, “Fair Value Measurements” (FAS 157), effective with the beginning of the Portfolio’s fiscal year. FAS 157 establishes a framework for measuring fair value and expands disclosures about fair value measurements in financial statements. The three levels of the hierarchy under FAS 157 are described below:
Level 1 - quoted prices in active markets for identical securities
Level 2 - other significant observable inputs (including quoted prices for similar securities, interest rates, credit risk, etc.)
Level 3 - significant unobservable inputs (including the Portfolio’s own assumptions in determining the fair value of investments)
The inputs or methodology used for valuing securities are not necessarily an indication of the risk associated with investing in those securities.
The following is a summary of the inputs used to value the Portfolio’s net assets as of December 31, 2008:
| | | | | | |
| Valuation Inputs | | Investments In
Securities | | Other Financial
Instruments* |
Level 1 - Quoted Prices | | $ | 60,942,982 | | $ | 0 |
Level 2 - Other Significant Observable Inputs | | | 3,135,000 | | | 0 |
Level 3 - Significant Unobservable Inputs | | | 251,765 | | | 0 |
Total | | $ | 64,329,747 | | $ | 0 |
* Other financial instruments are derivative instruments not reflected in the Schedule of Investments, such as futures, forwards, swap contracts and written options, which are valued based on the unrealized appreciation/depreciation on the instrument.
Following is a reconciliation of Level 3 assets for which significant unobservable inputs were used to determine fair value:
| | | | | | | |
| | | Investments In
Securities | | | Other Financial
Instruments |
Balance as of January 1, 2008 | | $ | 0 | | | $ | 0 |
Transfers in (Out) of Level 3 | | | 392,940 | | | | 0 |
Accrued discounts/premiums | | | 0 | | | | 0 |
Realized Gain (Loss) | | | 0 | | | | 0 |
Change in unrealized appreciation (depreciation) | | | (141,175 | ) | | | 0 |
Net Purchases (Sales) | | | 0 | | | | 0 |
Balance as of December 31, 2008 | | $ | 251,765 | | | $ | 0 |
MSF-7
Metropolitan Series Fund, Inc.
Loomis Sayles Small Cap Growth Portfolio (formerly Franklin Templeton Small Cap Growth Portfolio)
Statement of Assets & Liabilities
December 31, 2008
| | | | | | | |
Assets | | | | | | | |
Investments at value (a) (b) | | | | | $ | 64,329,747 | |
Cash | | | | | | 1,287,527 | |
Receivable for: | | | | | | | |
Securities sold | | | | | | 133,282 | |
Fund shares sold | | | | | | 248,847 | |
Accrued interest and dividends | | | | | | 12,802 | |
| | | | | | | |
Total Assets | | | | | | 66,012,205 | |
Liabilities | | | | | | | |
Payable for: | | | | | | | |
Securities purchased | | $ | 1,477,688 | | | | |
Fund shares redeemed | | | 31,594 | | | | |
Collateral for securities loaned | | | 6,656 | | | | |
Accrued expenses: | | | | | | | |
Management fees | | | 45,795 | | | | |
Service and distribution fees | | | 8,783 | | | | |
Other expenses | | | 32,794 | | | | |
| | | | | | | |
Total Liabilities | | | | | | 1,603,310 | |
| | | | | | | |
Net Assets | | | | | $ | 64,408,895 | |
| | | | | | | |
Net assets consists of: | | | | | | | |
Capital paid in | | | | | $ | 109,474,365 | |
Accumulated net realized losses | | | | | | (16,553,636 | ) |
Unrealized depreciation on investments | | | | | | (28,511,834 | ) |
| | | | | | | |
Net Assets | | | | | $ | 64,408,895 | |
| | | | | | | |
| Computation of offering price: | | | | | | | |
Class A | | | | | | | |
Net asset value and redemption price per share ($17,472,537 divided by 3,077,456 shares outstanding) | | | | | $ | 5.68 | |
| | | | | | | |
Class B | | | | | | | |
Net asset value and redemption price per share ($41,041,132 divided by 7,384,623 shares outstanding) | | | | | $ | 5.56 | |
| | | | | | | |
Class E | | | | | | | |
Net asset value and redemption price per share ($5,895,226 divided by 1,050,147 shares outstanding) | | | | | $ | 5.61 | |
| | | | | | | |
(a) Identified cost of investments | | | | | $ | 92,841,581 | |
| | | | | | | |
(b) Includes cash collateral for securities loaned of | | | | | $ | 6,656 | |
| | | | | | | |
Statement of Operations
For the Year Ended December 31, 2008
| | | | | | | | |
Investment Income | | | | | | | | |
Dividends | | | | | | $ | 349,009 | |
Interest | | | | | | | 460,372 | (a) |
| | | | | | | | |
| | | | | | | 809,381 | |
Expenses | | | | | | | | |
Management fees | | $ | 1,025,579 | | | | | |
Service and distribution fees—Class B | | | 135,638 | | | | | |
Service and distribution fees—Class E | | | 13,329 | | | | | |
Directors’ fees and expenses | | | 31,907 | | | | | |
Custodian | | | 32,006 | | | | | |
Audit and tax services | | | 36,941 | | | | | |
Legal | | | 1,831 | | | | | |
Printing | | | 37,885 | | | | | |
Insurance | | | 1,817 | | | | | |
Miscellaneous | | | 10,720 | | | | | |
| | | | | | | | |
Total expenses | | | 1,327,653 | | | | | |
Expense reductions | | | (6,539 | ) | | | 1,321,114 | |
| | | | | | | | |
Net Investment Loss | | | | | | | (511,733 | ) |
| | | | | | | | |
Realized and Unrealized Loss | | | | | | | | |
| Realized loss on: | | | | | | | | |
Investments—net | | | | | | | (16,414,620 | ) |
| Change in unrealized depreciation on: | | | | | | | | |
Investments—net | | | | | | | (35,087,043 | ) |
| | | | | | | | |
Net loss | | | | | | | (51,501,663 | ) |
| | | | | | | | |
Net Decrease in Net Assets From Operations | | | | | | $ | (52,013,396 | ) |
| | | | | | | | |
| (a) | Includes income on securities loaned of $399,219. |
See accompanying notes to financial statements.
MSF-8
Metropolitan Series Fund, Inc.
Loomis Sayles Small Cap Growth Portfolio (formerly Franklin Templeton Small Cap Growth Portfolio)
Statements of Changes in Net Assets
| | | | | | | | |
| | | Year ended
December 31,
2008 | | | Year ended
December 31,
2007 | |
From Operations | | | | | | | | |
Net investment loss | | $ | (511,733 | ) | | $ | (731,560 | ) |
Net realized gain (loss) | | | (16,414,620 | ) | | | 14,137,156 | |
Unrealized depreciation | | | (35,087,043 | ) | | | (6,937,321 | ) |
| | | | | | | | |
Increase (decrease) in net assets from operations | | | (52,013,396 | ) | | | 6,468,275 | |
| | | | | | | | |
From Distributions to Shareholders | | | | | | | | |
Net realized gain | | | | | | | | |
Class A | | | (6,691,563 | ) | | | (5,293,797 | ) |
Class B | | | (5,721,495 | ) | | | (4,633,068 | ) |
Class E | | | (955,207 | ) | | | (1,001,053 | ) |
| | | | | | | | |
| | | (13,368,265 | ) | | | (10,927,918 | ) |
| | | | | | | | |
Tax return of capital | | | | | | | | |
Class A | | | (15,093 | ) | | | 0 | |
Class B | | | (12,905 | ) | | | 0 | |
Class E | | | (2,155 | ) | | | 0 | |
| | | | | | | | |
| | | (30,153 | ) | | | 0 | |
| | | | | | | | |
| | |
Total distributions | | | (13,398,418 | ) | | | (10,927,918 | ) |
| | | | | | | | |
Increase (decrease) in net assets from capital share transactions | | | (28,453,118 | ) | | | 22,309,401 | |
| | | | | | | | |
Net increase (decrease) in net assets | | | (93,864,932 | ) | | | 17,849,758 | |
| | |
Net Assets | | | | | | | | |
Beginning of the period | | | 158,273,827 | | | | 140,424,069 | |
| | | | | | | | |
End of the period | | $ | 64,408,895 | | | $ | 158,273,827 | |
| | | | | | | | |
Undistributed Net Investment Income (Loss) | | | | | | | | |
End of the period | | $ | — | | | $ | 80,296 | |
| | | | | | | | |
Other Information:
Capital Shares
Transactions in capital shares were as follows:
| | | | | | | | | | | | | | |
| | | Year ended
December 31, 2008 | | | Year ended
December 31, 2007 | |
| | | Shares | | | $ | | | Shares | | | $ | |
Class A | | | | | | | | | | | | | | |
Sales | | 1,351,423 | | | $ | 11,485,843 | | | 3,263,897 | | | $ | 36,568,942 | |
Reinvestments | | 791,813 | | | | 6,706,656 | | | 482,131 | | | | 5,293,797 | |
Redemptions | | (6,374,207 | ) | | | (52,548,377 | ) | | (1,330,391 | ) | | | (14,836,222 | ) |
| | | | | | | | | | | | | | |
Net increase (decrease) | | (4,230,971 | ) | | $ | (34,355,878 | ) | | 2,415,637 | | | $ | 27,026,517 | |
| | | | | | | | | | | | | | |
Class B | | | | | | | | | | | | | | |
Sales | | 1,618,617 | | | $ | 12,117,806 | | | 1,530,985 | | | $ | 16,749,341 | |
Reinvestments | | 690,892 | | | | 5,734,400 | | | 428,591 | | | | 4,633,068 | |
Redemptions | | (1,356,426 | ) | | | (10,635,792 | ) | | (2,318,672 | ) | | | (25,544,811 | ) |
| | | | | | | | | | | | | | |
Net increase (decrease) | | 953,083 | | | $ | 7,216,414 | | | (359,096 | ) | | $ | (4,162,402 | ) |
| | | | | | | | | | | | | | |
Class E | | | | | | | | | | | | | | |
Sales | | 69,302 | | | $ | 499,063 | | | 192,468 | | | $ | 2,141,471 | |
Reinvestments | | 114,244 | | | | 957,362 | | | 91,924 | | | | 1,001,053 | |
Redemptions | | (339,372 | ) | | | (2,770,079 | ) | | (334,403 | ) | | | (3,697,238 | ) |
| | | | | | | | | | | | | | |
Net decrease | | (155,826 | ) | | $ | (1,313,654 | ) | | (50,011 | ) | | $ | (554,714 | ) |
| | | | | | | | | | | | | | |
Increase (decrease) derived from capital share transactions | | | | | $ | (28,453,118 | ) | | | | | $ | 22,309,401 | |
| | | | | | | | | | | | | | |
See accompanying notes to financial statements.
MSF-9
Metropolitan Series Fund, Inc.
Loomis Sayles Small Cap Growth Portfolio (formerly Franklin Templeton Small Cap Growth Portfolio)
Financial Highlights
| | | | | | | | | | | | | | | | | | | | |
| | | Class A | |
| | | Year ended December 31, | |
| | | 2008 | | | 2007 | | | 2006 | | | 2005 | | | 2004 | |
Net Asset Value, Beginning of Period | | $ | 10.68 | | | $ | 10.94 | | | $ | 10.43 | | | $ | 10.35 | | | $ | 9.29 | |
| | | | | | | | | | | | | | | | | | | | |
Income From Investment Operations | | | | | | | | | | | | | | | | | | | | |
Net investment loss | | | (0.03 | )(a) | | | (0.04 | )(a) | | | (0.05 | ) | | | (0.05 | ) | | | (0.08 | ) |
Net realized and unrealized gain (loss) of investments | | | (4.08 | ) | | | 0.57 | | | | 1.11 | | | | 0.48 | | | | 1.14 | |
| | | | | | | | | | | | | | | | | | | | |
Total from investment operations | | | (4.11 | ) | | | 0.53 | | | | 1.06 | | | | 0.43 | | | | 1.06 | |
| | | | | | | | | | | | | | | | | | | | |
Less Distributions | | | | | | | | | | | | | | | | | | | | |
Distributions from net realized capital gains | | | (0.89 | )(d) | | | (0.79 | ) | | | (0.55 | ) | | | (0.35 | ) | | | 0.00 | |
| | | | | | | | | | | | | | | | | | | | |
Total distributions | | | (0.89 | ) | | | (0.79 | ) | | | (0.55 | ) | | | (0.35 | ) | | | 0.00 | |
| | | | | | | | | | | | | | | | | | | | |
Net Asset Value, End of Period | | $ | 5.68 | | | $ | 10.68 | | | $ | 10.94 | | | $ | 10.43 | | | $ | 10.35 | |
| | | | | | | | | | | | | | | | | | | | |
Total Return (%) | | | (41.2 | ) | | | 4.5 | | | | 10.0 | | | | 4.7 | | | | 11.4 | |
Ratio of operating expenses to average net assets before expense reductions (%) | | | 1.03 | | | | 1.01 | | | | 1.09 | | | | 1.13 | | | | 1.15 | |
Ratio of operating expenses to average net assets after expense reductions (%) (b) | | | 1.03 | | | | 1.01 | | | | 1.07 | | | | 1.11 | | | | 1.15 | |
Ratio of operating expenses to average net assets without giving effect to the contractual expense agreement would have been (%) (c) | | | N/A | | | | N/A | | | | 1.09 | | | | 1.13 | | | | 1.15 | |
Ratio of net investment loss to average net assets (%) | | | (0.31 | ) | | | (0.33 | ) | | | (0.45 | ) | | | (0.52 | ) | | | (0.80 | ) |
Portfolio turnover rate (%) | | | 68 | | | | 60 | | | | 68 | | | | 52 | | | | 50 | |
Net assets, end of period (000) | | $ | 17,473 | | | $ | 78,029 | | | $ | 53,521 | | | $ | 33,042 | | | $ | 31,892 | |
| | | | | | | | | | | | | | | | | | | | |
| | | Class B | |
| | | Year ended December 31, | |
| | | 2008 | | | 2007 | | | 2006 | | | 2005 | | | 2004 | |
Net Asset Value, Beginning of Period | | $ | 10.49 | | | $ | 10.79 | | | $ | 10.32 | | | $ | 10.27 | | | $ | 9.24 | |
| | | | | | | | | | | | | | | | | | | | |
Income From Investment Operations | | | | | | | | | | | | | | | | | | | | |
Net investment loss | | | (0.05 | )(a) | | | (0.07 | )(a) | | | (0.08 | ) | | | (0.05 | ) | | | (0.08 | ) |
Net realized and unrealized gain (loss) of investments | | | (3.99 | ) | | | 0.56 | | | | 1.10 | | | | 0.45 | | | | 1.11 | |
| | | | | | | | | | | | | | | | | | | | |
Total from investment operations | | | (4.04 | ) | | | 0.49 | | | | 1.02 | | | | 0.40 | | | | 1.03 | |
| | | | | | | | | | | | | | | | | | | | |
Less Distributions | | | | | | | | | | | | | | | | | | | | |
Distributions from net realized capital gains | | | (0.89 | )(d) | | | (0.79 | ) | | | (0.55 | ) | | | (0.35 | ) | | | 0.00 | |
| | | | | | | | | | | | | | | | | | | | |
Total distributions | | | (0.89 | ) | | | (0.79 | ) | | | (0.55 | ) | | | (0.35 | ) | | | 0.00 | |
| | | | | | | | | | | | | | | | | | | | |
Net Asset Value, End of Period | | $ | 5.56 | | | $ | 10.49 | | | $ | 10.79 | | | $ | 10.32 | | | $ | 10.27 | |
| | | | | | | | | | | | | | | | | | | | |
Total Return (%) | | | (41.3 | ) | | | 4.3 | | | | 9.7 | | | | 4.4 | | | | 11.1 | |
Ratio of operating expenses to average net assets before expense reductions (%) | | | 1.28 | | | | 1.26 | | | | 1.34 | | | | 1.38 | | | | 1.40 | |
Ratio of operating expenses to average net assets after expense reductions (%) (b) | | | 1.28 | | | | 1.26 | | | | 1.32 | | | | 1.36 | | | | 1.40 | |
Ratio of operating expenses to average net assets without giving effect to the contractual expense agreement would have been (%) (c) | | | N/A | | | | N/A | | | | 1.34 | | | | 1.38 | | | | 1.40 | |
Ratio of net investment loss to average net assets (%) | | | (0.58 | ) | | | (0.59 | ) | | | (0.72 | ) | | | (0.73 | ) | | | (1.05 | ) |
Portfolio turnover rate (%) | | | 68 | | | | 60 | | | | 68 | | | | 52 | | | | 50 | |
Net assets, end of period (000) | | $ | 41,041 | | | $ | 67,487 | | | $ | 73,262 | | | $ | 61,746 | | | $ | 34,664 | |
| Please | see following page for Financial Highlights footnote legend. |
See accompanying notes to financial statements.
MSF-10
Metropolitan Series Fund, Inc.
Loomis Sayles Small Cap Growth Portfolio (formerly Franklin Templeton Small Cap Growth Portfolio)
Financial Highlights
| | | | | | | | | | | | | | | | | | | | |
| | | Class E | |
| | | Year ended December 31, | |
| | | 2008 | | | 2007 | | | 2006 | | | 2005 | | | 2004 | |
Net Asset Value, Beginning of Period | | $ | 10.58 | | | $ | 10.86 | | | $ | 10.37 | | | $ | 10.31 | | | $ | 9.27 | |
| | | | | | | | | | | | | | | | | | | | |
Income From Investment Operations | | | | | | | | | | | | | | | | | | | | |
Net investment loss | | | (0.04 | )(a) | | | (0.05 | )(a) | | | (0.07 | ) | | | (0.07 | ) | | | (0.09 | ) |
Net realized and unrealized gain (loss) of investments | | | (4.04 | ) | | | 0.56 | | | | 1.11 | | | | 0.48 | | | | 1.13 | |
| | | | | | | | | | | | | | | | | | | | |
Total from investment operations | | | (4.08 | ) | | | 0.51 | | | | 1.04 | | | | 0.41 | | | | 1.04 | |
| | | | | | | | | | | | | | | | | | | | |
Less Distributions | | | | | | | | | | | | | | | | | | | | |
Distributions from net realized capital gains | | | (0.89 | )(d) | | | (0.79 | ) | | | (0.55 | ) | | | (0.35 | ) | | | 0.00 | |
| | | | | | | | | | | | | | | | | | | | |
Total distributions | | | (0.89 | ) | | | (0.79 | ) | | | (0.55 | ) | | | (0.35 | ) | | | 0.00 | |
| | | | | | | | | | | | | | | | | | | | |
Net Asset Value, End of Period | | $ | 5.61 | | | $ | 10.58 | | | $ | 10.86 | | | $ | 10.37 | | | $ | 10.31 | |
| | | | | | | | | | | | | | | | | | | | |
Total Return (%) | | | (41.3 | ) | | | 4.5 | | | | 9.9 | | | | 4.5 | | | | 11.2 | |
Ratio of operating expenses to average net assets before expense reductions (%) | | | 1.18 | | | | 1.16 | | | | 1.24 | | | | 1.28 | | | | 1.30 | |
Ratio of operating expenses to average net assets after expense reductions (%) (b) | | | 1.18 | | | | 1.16 | | | | 1.22 | | | | 1.26 | | | | 1.30 | |
Ratio of operating expenses to average net assets without giving effect to the contractual expense agreement would have been (%) (c) | | | N/A | | | | N/A | | | | 1.24 | | | | 1.28 | | | | 1.30 | |
Ratio of net investment loss to average net assets (%) | | | (0.48 | ) | | | (0.50 | ) | | | (0.62 | ) | | | (0.67 | ) | | | (0.95 | ) |
Portfolio turnover rate (%) | | | 68 | | | | 60 | | | | 68 | | | | 52 | | | | 50 | |
Net assets, end of period (000) | | $ | 5,895 | | | $ | 12,758 | | | $ | 13,641 | | | $ | 14,051 | | | $ | 14,545 | |
| (a) | Per share amount is based on average shares outstanding during the period. |
| (b) | The Portfolio has entered into arrangements with certain brokers who paid a portion of the Portfolio’s expenses. |
| (c) | The Portfolio had previously entered into a contractual agreement to limit Portfolio expenses. This agreement expired in 2006. |
| (d) | Includes tax return of capital distribution that was less than $(0.01). |
See accompanying notes to financial statements.
MSF-11
Metropolitan Series Fund, Inc.
Loomis Sayles Small Cap Growth Portfolio (formerly Franklin Templeton Small Cap Growth Portfolio)
Notes to Financial Statements—December 31, 2008
Metropolitan Series Fund, Inc. (the “Fund”) is organized as a corporation under the laws of Maryland pursuant to Articles of Incorporation filed on November 23, 1982, as amended, and registered under the Investment Company Act of 1940, as amended (the “1940 Act”), as an open-end investment company. The Fund is a “series” type of mutual fund, which issues separate series of stock. Each series represents an interest in a separate portfolio of Fund investments. The Loomis Sayles Small Cap Growth Portfolio (formerly Franklin Templeton Small Cap Growth) (the “Portfolio”) is a diversified series of the Fund. Shares in the Fund are not offered directly to the general public and are currently available only to separate accounts established by Metropolitan Life Insurance Company (“MetLife”), New England Life Insurance Company, General American Life Insurance Company (“General American”), The MetLife Investors Group of Insurance Companies, MetLife Insurance Company of Connecticut and other affiliated insurance companies (collectively, the “Insurance Companies”) and to certain eligible qualified retirement plans (“Qualified Plans”), as an investment vehicle for variable life insurance, group annuity or variable annuity products of these insurance companies or Qualified Plans, although the Portfolio is not available to all such separate accounts and Qualified Plans. The Portfolio’s shares may be divided into different classes. Currently, the classes being offered by the Portfolio are named Class A, Class B and Class E. The classes of the Portfolio’s shares are identical, except that certain additional charges (Rule 12b-1 fees) are made against Class B and Class E shares. Investment income, realized and unrealized capital gains and losses, the common expenses of the Portfolio and certain Portfolio-level expense reductions, if any, are allocated daily, on a pro rata basis, to each class based on the relative net assets of each class to the total net assets of the Portfolio.
| 2. | SIGNIFICANT ACCOUNTING POLICIES: |
The preparation of financial statements in conformity with accounting principles generally accepted in the United States of America (“GAAP”) requires management to make estimates and assumptions that affect the reported amounts of assets and liabilities and disclosure of contingent assets and liabilities as of the date of the financial statements and the reported amounts of income and expenses during the reporting period. Actual results could differ from those estimates.
The following is a summary of significant accounting policies consistently followed by the Portfolio in the preparation of its financial statements. The policies are in conformity with GAAP.
Investment Valuation:
Debt securities (other than short term obligations with a remaining maturity of sixty days or less) are generally valued on the basis of evaluated or composite bid quotations obtained by independent pricing services and/or brokers and dealers selected by the relevant subadviser pursuant to authorization of the Board of Directors of the Fund (the “Board” or “Directors”). Such quotations take into account appropriate factors such as institutional-sized trading in similar groups of securities, yield, quality, coupon rate, maturity, type of issue, trading characteristics and other data. Short term obligations with a remaining maturity of sixty days or less are valued at amortized cost which approximates fair market value.
Equity securities traded on a national securities exchange or other exchanges are valued at their last sale price on the principal trading market. Equity securities traded on the NASDAQ National Market System are valued at the NASDAQ Official Closing Price (the “NOCP”). The NOCP is the last reported sale price if the last reported sale price falls between the spread of the last reported bid and asked prices. If the last reported bid and asked prices are above the last reported sale price, the NOCP will be the last reported bid price. If the last reported bid and asked prices are below the last reported sale price, the NOCP will be the last reported asked price. Equity securities traded on a national securities exchange or other exchanges or on the NASDAQ National Market System for which there is no reported sale during the day are valued at the last reported bid price. A security that is listed or traded on more than one exchange is valued at the quotation on the exchange determined to be the primary market for that security by the Board or its delegates. If no closing price is available, then such securities are valued by using the last reported bid price. Equity securities traded over-the-counter are valued at the last reported sales price.
If no current market value quotation is readily available or reliable for a portfolio security, fair value will be determined in accordance with procedures established by and under the general supervision of the Board. When the Portfolio uses fair value pricing, it may take into account any factors it deems appropriate. The value of securities used by the Portfolio to calculate its net asset value may differ from quoted or published prices for the same securities. Fair value pricing involves subjective judgments and the fair value determined for a security may be materially different than the value that could be realized upon the sale of that security.
MSF-12
Metropolitan Series Fund, Inc.
Loomis Sayles Small Cap Growth Portfolio (formerly Franklin Templeton Small Cap Growth Portfolio)
Notes to Financial Statements—December 31, 2008—(Continued)
The Portfolio expects to use fair value pricing for securities primarily traded on U.S. exchanges only under very limited circumstances. For example, the Portfolio may use fair value pricing if the exchange on which a security is traded closes early or trading in the security is suspended.
Securities traded primarily on an exchange outside of the United States which closes before the close of the New York Stock Exchange will be valued at the last sales price on that non-U.S. exchange. Securities traded primarily on an exchange outside of the United States for which there is no reported sale during the day are valued at the mean between the last reported bid and asked prices. However, because most foreign markets close well before the Portfolio values its securities (typically at 4 p.m. Eastern Time), the earlier close of these foreign markets gives rise to the possibility that significant events, including broad market moves, may have occurred after these foreign markets close but before the Portfolio values its securities. To account for this, the Portfolio may frequently value many of its foreign equity securities using fair value prices based on third party vendor modeling tools.
Forward foreign currency exchange contracts are valued based on the mean between closing bid and asked prices of the forward currency contract rates in the London foreign exchange markets on a daily basis as provided by a reliable bank or dealer.
Options, whether on securities, indices, futures contracts, or otherwise, are valued at the last sales price available as of the close of business on the day of valuation or, if there is no such sale price available, at the mean between the bid and asked prices. Options on currencies are valued at the spot price each day.
The value of futures contracts will be the sum of the margin deposit plus or minus the difference between the value of the futures contract on each day the net asset value is calculated and the value on the date the futures contract originated, value being that established on a recognized commodity exchange, or by reference to other customary sources, with gain or loss being realized when the futures contract closes or expires.
Subject to the Board’s oversight, the Board has delegated the day-to-day oversight of pricing matters, including determinations in good faith under the Fund’s procedures the fair value of securities for which current market quotations are not readily available to the subadviser of the Portfolio.
Investment Transactions and Related Investment Income:
Portfolio security transactions are recorded on the trade date. Dividend income is recorded on the ex-dividend date or, for certain foreign securities, when notified. Interest income, which includes amortization of premium and accretion of discount on debt securities, is recorded on the accrual basis. Realized gains and losses on investments and unrealized appreciation and depreciation are determined on the identified cost basis, which is the same basis used for federal income tax purposes.
Repurchase Agreements:
The Portfolio, through the custodian or a subcustodian, receives delivery of the underlying securities collateralizing repurchase agreements. The Portfolio requires the custodian to take possession, to have legally segregated in the Federal Reserve Book Entry System, or to have segregated within the custodian’s vault, all securities held as collateral for repurchase agreements. It is the Portfolio’s policy that the market value of the collateral be at least equal to 100% of the repurchase price in the case of a repurchase agreement of one-day duration and 102% on all other repurchase agreements. The Portfolio’s subadviser is responsible for determining that the value of the collateral is at all times at least equal to the repurchase price. In connection with transactions in repurchase agreements, if the seller defaults and the value of the collateral declines or if the seller enters an insolvency proceeding, realization of the collateral by the Portfolio may be delayed, limited or wholly denied.
Foreign Currency Translation:
The books and records of the Portfolio are maintained in U.S. dollars. The values of securities, currencies and other assets and liabilities denominated in currencies other than U.S. dollars are translated into U.S. dollars based upon foreign exchange rates prevailing at the end of the period. Purchases and sales of investment securities, income and expenses are translated on the respective dates of such transactions. Since the values of investment securities are presented at the foreign exchange rates prevailing at the end of the period, it is not practical to isolate that portion of the results of operations arising from changes in exchange rates from that portion of the results of operations reflecting fluctuations arising from changes in market prices of the investment securities. Such fluctuations are included in the net realized and unrealized gain or loss on investments.
Net realized foreign exchange gains or losses arise from sales of foreign currency, currency gains or losses realized between the trade and settlement dates on securities transactions, and the difference between the amounts of dividends, interest, and foreign
MSF-13
Metropolitan Series Fund, Inc.
Loomis Sayles Small Cap Growth Portfolio (formerly Franklin Templeton Small Cap Growth Portfolio)
Notes to Financial Statements—December 31, 2008—(Continued)
withholding taxes recorded by the Portfolio and the U.S. dollar equivalent of the amounts actually received or paid by the Portfolio. Net unrealized foreign exchange gains and losses arise from changes in the value of assets and liabilities, other than investment securities, resulting from changes in the exchange rate.
Forward Foreign Currency Exchange Contracts:
The Portfolio may enter into forward foreign currency exchange contracts primarily to hedge against foreign currency exchange rate risks on its non-U.S. dollar denominated investment securities. When entering into a forward currency contract, the Portfolio agrees to receive or deliver a fixed quantity of foreign currency for an agreed-upon price on an agreed future date. These contracts are valued daily and the Portfolio’s net equity therein, representing unrealized gain or loss on the contracts as measured by the difference between the foreign exchange rates at the dates of entry into the contracts and the forward rates at the settlement date, is included in the Statement of Assets and Liabilities. Realized and unrealized gains and losses are included in the Statement of Operations. These instruments involve market and/or credit risk in excess of the amount recognized in the Statement of Assets and Liabilities. Risks arise from the possible inability of counterparties to meet the terms of their contracts and from movement in currency and securities values and interest rates.
Futures Contracts:
The Portfolio may buy and sell futures contracts (on recognized exchanges) as a hedge or to enhance return. Futures contracts are agreements to buy or sell a security, or deliver a final cash settlement price in connection with an index, interest rate, currency, or other contracts not calling for physical delivery, for a set price in the future. The Portfolio must post an amount equal to a portion of the total market value of the futures contract as futures variation margin, which is returned when the Portfolio’s obligations under the contract have been satisfied. From time to time thereafter, the Portfolio may have to post variation margin to maintain this amount as the market value of the contract fluctuates. Risks of entering into futures contracts (and related options) include the possibility that there may be an illiquid market and that a change in the value of the contract or option may not correlate with changes in the value of the underlying securities.
Options:
The Portfolio may use options to enhance returns or to hedge against changes in values of securities the Portfolio owns or expects to purchase. Writing puts or buying calls tends to increase the Portfolio’s exposure to the underlying instrument and writing calls or buying puts tends to decrease the Portfolio’s exposure to the underlying instrument, and can be used to hedge other Portfolio investments. For options purchased to hedge the Portfolio’s investments, the potential risk to the Portfolio is that the change in value of options contracts may not correspond to the change in value of the hedged instruments. In addition, losses may arise from changes in the value of the underlying instruments, if there is an illiquid secondary market, or if the counterparty is unable to perform. The maximum loss for purchased options is limited to the premium initially paid for the option. For options written by the Portfolio, the maximum loss is not limited to the premium initially received for the option.
The main risk associated with purchasing an option is that the option expires without being exercised. In this case, the option expires worthless and the premium paid for the option is considered the loss. The risk associated with writing a call option is that the Portfolio may forgo the opportunity for a profit if the market value of the underlying position increases and the option is exercised. The risk in writing a put option is that the Portfolio may incur a loss if the market value of the underlying position decreases and the option is exercised. In addition, the Portfolio risks not being able to enter into a closing transaction for the written option as the result of an illiquid market.
“When-Issued” Securities:
Purchasing securities “when-issued” is a forward commitment by the Portfolio to buy a security. The estimated amount of the Portfolio’s payment obligation and the security’s interest rate are determined when the commitment is made, even though no interest accrues until the security is issued, which is generally 15 to 120 days later. The Portfolio will segregate liquid assets with its custodian sufficient at all times to satisfy these commitments. If the value of the security is less when delivered than when the commitment was made, the Portfolio will suffer a loss.
Federal Income Taxes:
It is the Portfolio’s policy to comply with the requirements of the Internal Revenue Code of 1986, as amended (the “Code”), and regulations thereunder, applicable to regulated investment companies and to distribute, with respect to each taxable year, all of
MSF-14
Metropolitan Series Fund, Inc.
Loomis Sayles Small Cap Growth Portfolio (formerly Franklin Templeton Small Cap Growth Portfolio)
Notes to Financial Statements—December 31, 2008—(Continued)
its taxable income to shareholders. Therefore, no federal income tax provision is required. The Portfolio is subject to the provisions of the Financial Accounting Standards Board Interpretation (“FASB”) No. 48, Accounting for Uncertainties in Income Taxes (FIN 48). FIN 48 sets forth a minimum threshold for financial statement recognition of the benefit of a tax position taken or expected to be taken in a tax return. The implementation of FIN 48 did not result in any unrecognized tax benefits in the accompanying financial statements. Each of the Portfolio’s federal tax returns for the prior three fiscal years remains subject to examination by the Internal Revenue Service.
As of December 31, 2008, the Portfolio had $11,523,447 in capital loss carryforwards expiring on December 31, 2016.
Pursuant to Section 852 of the Code, the Portfolio designated the amount shown below under Long Term Gain as capital gain dividends for its taxable year ended December 31, 2008. The tax character of distributions paid for the periods ended December 31, 2008 and 2007 was as follows:
| | | | | | | | | | | | | | | | | | | | | | |
| Ordinary Income | | Long Term Gain | | Return of Capital | | Total |
| 2008 | | 2007 | | 2008 | | 2007 | | 2008 | | 2007 | | 2008 | | 2007 |
| $ | 1,957,737 | | $ | 2,576,163 | | $ | 11,410,528 | | $ | 8,351,755 | | $ | 30,153 | | $ | — | | $ | 13,398,418 | | $ | 10,927,918 |
As of December 31, 2008, the components of distributable earnings (accumulated losses) on a federal income tax basis were as follows:
| | | | | | | | | | | | | | | | |
Undistributed
Ordinary
Income | | Undistributed
Long Term
Gain | | Unrealized
Depreciation | | | Loss
Carryforwards | | | Total | |
| $ | — | | $ | — | | $ | (32,089,670 | ) | | $ | (11,523,447 | ) | | $ | (43,613,117 | ) |
Pursuant to Federal income tax regulations applicable to investment companies, the Portfolio has elected to treat net capital losses realized between November 1 and December 31 of each year as occurring on the first day of the following tax year. For the year ended December 31, 2008, the following amounts of realized capital and currency losses reflected in the accompanying financial statements will not be recognized for Federal income tax purposes until January 1, 2009:
| | | | |
Currency | | Capital | |
$— | | $ | (1,452,353 | ) |
Dividends and Distributions to Shareholders:
The Portfolio records dividends and distributions on the ex-dividend date. Net realized gains from security transactions (if any) are generally distributed annually to shareholders. The timing and characterization of certain income and capital gains distributions are determined in accordance with federal tax regulations that may differ from GAAP. Permanent book and tax basis differences relating to shareholder distributions will result in reclassification between under/over distributed net investment income, accumulated net realized gains/losses and paid in capital.
Expense Reductions:
Certain Portfolio trades are directed to brokers who paid a portion of the Portfolio’s expenses. Amounts paid for the Portfolio are shown as expense reductions in the Statement of Operations.
| 3. | INVESTMENT TRANSACTIONS: |
For the year ended December 31, 2008, purchases and sales of securities (excluding short term investments) for the Portfolio were as follows:
| | | | | | | | | | |
| Purchases | | Sales |
| U.S. Government | | Other | | U.S. Government | | Other |
| $ | 0 | | $ | 76,779,781 | | $ | 0 | | $ | 119,726,297 |
MSF-15
Metropolitan Series Fund, Inc.
Loomis Sayles Small Cap Growth Portfolio (formerly Franklin Templeton Small Cap Growth Portfolio)
Notes to Financial Statements—December 31, 2008—(Continued)
| 4. | INVESTMENT MANAGEMENT FEES AND OTHER TRANSACTIONS WITH AFFILIATES: |
Investment Management Agreement:
MetLife Advisers, LLC (“MetLife Advisers”) is the investment adviser to the Portfolio. The Fund has entered into an investment management agreement with MetLife Advisers with respect to the Portfolio. For providing investment management services to the Portfolio, MetLife Advisers receives monthly compensation at the following annual rates:
| | | | |
Management
Fees earned by
MetLife Advisers
for the year ended
December 31, 2008 | | Annual
percentage
rates paid to
MetLife Advisers | | Based on Portfolios
average daily net asset
levels |
| $1,025,579 | | 0.900% | | Of the first $500 million |
| | 0.850% | | On amounts in excess of $500 million |
Certain officers and directors of the Fund may also be officers of MetLife Advisers; however, such officers and directors receive no compensation from the Fund.
MetLife Advisers has entered into an investment subadvisory agreement with respect to the Portfolio. Franklin Advisors, Inc. was compensated by MetLife Advisers to provide subadvisory services for the Portfolio during the year ended December 31, 2008.
Service and Distribution Fees:
The Fund has adopted a Distribution and Service Plan under Rule 12b-1 of the 1940 Act for the Portfolio’s Class B and E shares. Under the Distribution and Service Plan, the Class B and E shares of the Portfolio pay a fee to compensate the Insurance Companies (or their affiliates) and other broker-dealers and financial intermediaries involved in the offer and sale of Portfolio shares for promoting or selling and servicing the Class B and E shares. The fees under the Distribution and Service Plan for each class of the Portfolio’s shares are calculated as a percentage of the Portfolio’s average daily net assets that are attributable to that Class. Currently, the fee is 0.25% per year for Class B shares and 0.15% per year for Class E shares. Amounts paid by the Portfolio for the year ended December 31, 2008 are shown as Service and Distribution fees in the Statement of Operations.
The Fund has entered into a securities lending arrangement with the Fund’s custodian, State Street Bank and Trust Company (the “custodian”). Under the agreement, the custodian is authorized to loan securities on the Portfolios’ behalf. In exchange, the Portfolio receives either cash or securities as collateral against the loaned securities. The Portfolio receives collateral at least equal to 102% of the market value of the loaned securities (105% for foreign securities), at each loan’s inception. Collateral must be maintained at least at 100% of the market value of the loaned securities for the duration of the loan. The cash collateral is invested in the Navigator Securities Lending Prime Portfolio, an affiliate of the custodian, which invests in a variety of high quality U.S. dollar-denominated instruments. If the market value of the collateral at the close of trading on a business day is less than 100% of the market value of the loaned securities at the close of trading on that day, the borrower shall be required to deliver, by the close of business on the following business day, an additional amount of collateral, equal to at least 100% of the market value of all the loaned securities as of such preceding day. The Portfolio receives 80% of the annual net income from securities lending transactions, which is included in interest income of the Portfolio. The remaining 20% is paid to the custodian as compensation for its securities lending services. Interest income received by the Portfolio via lending transactions during the year ended December 31, 2008 is footnoted in the Statement of Operations. The Portfolio bears the risk of any deficiency in the amount of collateral available for return to a borrower due to a loss in an approved investment purchased with such collateral. Any outstanding loans by the Portfolio at December 31, 2008 are footnoted in the Schedule of Investments.
| 6. | MARKET AND CREDIT RISK: |
In the normal course of business, the Portfolio invests in securities and enters into transactions where risks exist due to fluctuations in the market (market risk) or failure of the other party to a transaction to perform (credit risk). The value of securities held by the Portfolio may decline in response to certain events, including those directly involving the companies whose securities are owned by the Portfolio; conditions affecting the general economy; overall market changes; local, regional or global political, social or economic instability; and currency and interest rate and price fluctuations. Similar to credit risk, the Portfolio may be exposed to counterparty risk, or the risk that an entity with which the Portfolio has unsettled or open transactions may
MSF-16
Metropolitan Series Fund, Inc.
Loomis Sayles Small Cap Growth Portfolio (formerly Franklin Templeton Small Cap Growth Portfolio)
Notes to Financial Statements—December 31, 2008—(Continued)
default. Financial assets, which potentially expose the Portfolio to credit and counterparty risks, consist principally of investments and cash due from counterparties. The extent of the Portfolio’s exposure to credit and counterparty risks in respect to these financial assets approximates their value as recorded in the Portfolio’s Statements of Assets and Liabilities.
On November 7, 2008, the Board of Directors of the Fund approved a new Subadvisory Agreement (the “Agreement”) with respect to the Portfolio between MetLife Advisers and Loomis, Sayles & Company, L.P. (“Loomis Sayles”). The Agreement is not subject to shareholder approval and became effective January 5, 2009. The Advisory Agreement between the Fund, with respect to the Portfolio, and MetLife Advisers will remain in effect and fees payable thereunder to MetLife Advisers will not change. MetLife Advisers has voluntarily agreed, for the period January 5, 2009 through April 30, 2009, to reduce its advisory fee to the effective annual rate of 0.85% for the first $100 million of the Portfolio’s average daily net assets and to the effective annual rate of 0.80% for amounts over $100 million. Under the Agreement, Loomis Sayles became subadviser to the Portfolio, succeeding Franklin Advisers, Inc., and became responsible for the day-to-day management of the Portfolio’s investment operations under the oversight of MetLife Advisers and the Board. The name of the Franklin Templeton Small Cap Growth Portfolio changed to the “Loomis Sayles Small Cap Growth Portfolio” at the time the Agreement took effect.
| 8. | RECENT ACCOUNTING PRONOUNCEMENTS: |
In March 2008, the FASB issued Statement of Financial Accounting Standards No. 161, Disclosures about Derivative Instruments and Hedging Activities (“FAS 161”), an amendment of FASB Statement No. 133. FAS 161 requires enhanced disclosures about (a) how and why an entity uses derivative instruments, (b) how derivative instruments and hedging activities are accounted for, and (c) how derivative instruments and related hedging activities affect a fund’s financial position, financial performance, and cash flows. Management does not believe the adoption of FAS 161 will materially impact the financial statement amounts, but will require additional disclosures. This will include qualitative and quantitative disclosures on derivative positions existing at period end and the effect of using derivatives during the reporting period. FAS 161 is effective for financial statements issued for fiscal years and interim periods beginning after November 15, 2008. Management is currently evaluating the impact the adoption of FAS 161 will have on the Portfolio’s financial statement disclosures.
MSF-17
Metropolitan Series Fund, Inc.
Loomis Sayles Small Cap Growth Portfolio (formerly Franklin Templeton Small Cap Growth Portfolio)
Report of Independent Registered Public Accounting Firm
To the Shareholders and Board of Directors of Metropolitan Series Fund, Inc.:
We have audited the accompanying statement of assets and liabilities, including the schedule of investments, of the Loomis Sayles Small Cap Growth Portfolio (formerly, Franklin Templeton Small Cap Growth Portfolio) (one of the portfolios constituting the Metropolitan Series Fund, Inc.) (the “Fund”) as of December 31, 2008, and the related statement of operations for the year then ended, the statements of changes in net assets for each of the two years in the period then ended, and the financial highlights for each of the five years in the period then ended. These financial statements and financial highlights are the responsibility of the Fund’s management. Our responsibility is to express an opinion on these financial statements and financial highlights based on our audits.
We conducted our audits in accordance with the standards of the Public Company Accounting Oversight Board (United States). Those standards require that we plan and perform the audit to obtain reasonable assurance about whether the financial statements and financial highlights are free of material misstatement. The Fund is not required to have, nor were we engaged to perform, an audit of its internal control over financial reporting. Our audit included consideration of internal control over financial reporting as a basis for designing audit procedures that are appropriate in the circumstances, but not for the purpose of expressing an opinion on the effectiveness of the Fund’s internal control over financial reporting. Accordingly, we express no such opinion. An audit also includes examining, on a test basis, evidence supporting the amounts and disclosures in the financial statements, assessing the accounting principles used and significant estimates made by management, as well as evaluating the overall financial statement presentation. Our procedures included confirmation of securities owned as of December 31, 2008, by correspondence with the custodian and brokers; where replies were not received from brokers, we performed other auditing procedures. We believe that our audits provide a reasonable basis for our opinion.
In our opinion, the financial statements and financial highlights referred to above present fairly, in all material respects, the financial position of the Loomis Sayles Small Cap Growth Fund of the Metropolitan Series Fund, Inc. as of December 31, 2008, the results of its operations for the year then ended, the changes in its net assets for each of the two years in the period then ended, and the financial highlights for each of the five years in the period then ended, in conformity with accounting principles generally accepted in the United States of America.
Deloitte & Touche LLP
Boston, Massachusetts
February 24, 2009
MSF-18
Metropolitan Series Fund, Inc.
Directors and Officers
The Fund’s Directors review actions of the Fund’s investment adviser and subadvisers, and decide upon matters of general policy. The Fund’s officers supervise the daily business operations of the Fund. The Board of Directors and the Fund’s officers are listed below. Each Director is responsible for overseeing all 38 Portfolios of the Fund. There is no limit to the term a Director may serve. Directors serve until their resignation, retirement or removal in accordance with the Fund’s organizational documents and policies adopted by the Board from time to time. Officers hold office at the pleasure of the Board or until the election or appointment and the qualification of a successor. The address of the Directors and officers is c/o Metropolitan Series Fund, Inc., 501 Boylston Street, Boston, MA 02116.
Interested Directors(1)
Each Director below is an “interested person” (as defined by the 1940 Act) with respect to the Fund in that Ms. Forget is an employee of MetLife and Mr. Typermass is a former employee of MetLife and owns securities issued by MetLife, Inc., the ultimate parent company of MetLife Advisers.
| | | | | | | | |
Name, Address and Age | | Current
position(s)
with Fund | | Position(s)
held since | | Principal occupations
over past five years, including other directorships(2) | | Number of
Portfolios in
Fund Complex
Overseen by
Director(3) |
Elizabeth M. Forget Age: 42 | | Director, Chairman of the Board, President and Chief Executive Officer | | 2006 | | Senior Vice President (since 2007), MetLife, Inc.; President, Met Investors Advisory, LLC; Trustee and President, Met Investors Series Trust; Executive Vice President, MetLife Investors Group, Inc.; President, Chief Executive Officer and Chair of the Board of Managers (since 2006), MetLife Advisers; President, Met Investors Advisory, LLC. | | 87 |
| | | | |
Arthur G. Typermass Age: 71 | | Director | | 1998 | | Formerly, Senior Vice President and Treasurer, MetLife. | | 38 |
Non-Interested Directors(1)
Each Director below is not an “interested person” (as defined by the 1940 Act) with respect to the Fund (collectively, the “Independent Directors”).
| | | | | | | | |
Name, Address and Age | | Current
position(s)
with Fund | | Position(s)
held since | | Principal occupations
over past five years, including other directorships(2) | | Number of
Portfolios in
Fund Complex
Overseen by
Director(3) |
Steve A. Garban† Age: 71 | | Director | | 1985 | | Formerly, Chief Financial Officer, Senior Vice President Finance and Operations and Treasurer (Emeritus), The Pennsylvania State University. | | 38 |
| | | | |
Linda B. Strumpf Age: 61 | | Director | | 2000 | | Vice President and Chief Investment Officer, Ford Foundation. | | 38 |
| | | | |
Michael S. Scott Morton† Age: 71 | | Director | | 1993 | | Jay W. Forrester Professor of Management (Emeritus) at Sloan School of Management, MIT. | | 38 |
| | | | |
H. Jesse Arnelle Age: 75 | | Director | | 2001 | | Formerly, Counsel, Womble Carlyle Sandrie & Rice; Director, Textron Inc. (global multi- industry company)*; formerly, Director, Gannet Co. Inc. (diversified news and information company)*; formerly, Director, Eastman Chemical Company (global chemical company)*; formerly, Director, Waste Management, Inc.*; formerly, Director, Armstrong Holdings Inc. (parent company of floor and ceiling products business)*; formerly, Director, FPL Group Inc. (public utility holding company)*; Director, URS Corporation (engineering design services firm)*. | | 38 |
MSF-19
Metropolitan Series Fund, Inc.
Directors and Officers—(Continued)
| | | | | | | | |
Name, Address and Age | | Current
position(s)
with Fund | | Position(s)
held since | | Principal occupations
over past five years, including other directorships(2) | | Number of
Portfolios in
Fund Complex
Overseen by
Director(3) |
Nancy Hawthorne Age: 57 | | Director | | 2003 | | Chief Executive Officer, Clerestory LLC (corporate financial advisor); Director, Avid Technologies (computer software company)*; formerly, Chairman of the Board of Avid Technologies; formerly, Board of Advisors, L. Knife & Sons, Inc. (beverage distributor); formerly, Trustee, New England Zenith Fund (“Zenith Fund”)**; formerly, Chief Executive Officer and Managing Partner, Hawthorne, Krauss and Associates (corporate financial advisor); formerly, Chief Financial Officer and Executive Vice President, Continental Cablevision, subsequently renamed MediaOne (cable television company); formerly, Director, Life F/X, Inc.; formerly, Chairman of the Board, WorldClinic (distance medicine company); formerly, Director, Perini Corporation (construction company)*; formerly, Director, CGU (property and casualty insurance company); formerly, Director, Beacon Power Corporation (energy company)*. | | 38 |
| | | | |
John T. Ludes Age: 72 | | Director | | 2003 | | President, LFP Properties (consulting firm); Formerly, Trustee, Zenith Fund**; formerly, Vice Chairman, President and Chief Operating Officer, Fortune Brands/American Brands (global conglomerate); formerly, President and CEO, Acushnet Company (athletic equipment company). | | 38 |
Officers(1)
| | | | | | | | |
Name and address | | Age | | Current
position(s)
with Fund | | Position(s)
held since | | Principal occupations over past five years(2) |
| Jeffrey L. Bernier | | 37 | | Senior Vice President | | 2008 | | Vice President (since 2008), MetLife, Inc.; Vice President (since 2008), MetLife; Senior Vice President (since 2008), MetLife Advisers; formerly, Director and Senior Investment Analyst (2004 to 2007), John Hancock Financial Services; formerly, Assistant Vice President (2000 to 2001), Wachovia Securities. |
| | | | |
| Alan C. Leland | | 56 | | Senior Vice President | | 2005 | | Treasurer and Chief Financial Officer, MetLife Advisers, LLC; Treasurer (since 2005), Met Investors Advisory, LLC; Vice President (since 2004), Met Investors Advisory, LLC; Vice President (since 2003), MetLife, Inc.; Vice President, MetLife; Senior Vice President, NELICO. |
| | | | |
| Peter Duffy | | 53 | | Vice President
and Treasurer | | 2000 | | Senior Vice President, MetLife Advisers; Second Vice President (since 2003), NELICO; Vice President, MetLife (since 2004); Vice President (since 2004), MetLife, Inc.; formerly, Vice President and Treasurer, Zenith Fund**. |
| | | | |
| Jeffrey P. Halperin | | 41 | | Chief
Compliance Officer | | 2007 | | Vice President (since 2006), MetLife, Inc.; Vice President (since 2006), MetLife; Chief Compliance Officer (since 2006), Met Investors Series Trust, MetLife Advisers, Met Investors Advisory, LLC and MetLife Investment Advisors Company, LLC. |
| * | Indicates a directorship with a registered investment company or a company subject to the reporting requirements of the Securities Exchange Act of 1934, as amended. |
| ** | The Zenith Fund deregistered with the Securities and Exchange Commission (“SEC”) in 2004. |
| (†) | Served as a trustee, director and/or officer of one or more of the following companies, each of which had a direct or indirect advisory relationship with MetLife Advisers or its affiliates prior to January 31, 2005: State Street Research Financial Trust, State Street Research Income Trust, State Street Research Money Market Trust, State Street Research Institutional Funds, State Street Research Capital Trust, State Street Research Master Investment Trust, State Street Research Equity Trust, State Street Research Securities Trust and State Street Research Exchange Trust (collectively, the “State Street Research Funds”). |
| (1) | During the period shown, each Director of the Fund served as a Trustee of Metropolitan Series Fund II, a registered investment company that ceased investment operations in June of 2008 and has applied for deregistration under the Investment Company Act of 1940. During this period, each officer of the Fund served in the same position with Metropolitan Series Fund II. |
| (2) | Previous positions during the past five years with the Fund; Met Investors Series Trust; MetLife; MetLife, Inc.; MetLife Advisers; Met Investors Advisory, LLC; Zenith Fund; NELICO; or New England Securities Corporation are omitted if not materially different. |
| (3) | The Fund Complex includes the Fund (38 portfolios) and Met Investors Series Trust (49 portfolios). |
MSF-20
Metropolitan Series Fund, Inc.
Loomis Sayles Small Cap Growth Portfolio (formerly Franklin Templeton Small Cap Growth Portfolio)
Board Approval of Advisory and Subadvisory Agreements
The Fund’s Contract Review Committees of the Board of Directors (the “Board” or the “Directors”) typically meet in early fall to review the Portfolios’ advisory agreements (the “Advisory Agreements”) and subadvisory agreements (the “Subadvisory Agreements,” and, together with the Advisory Agreements, the “Agreements”) and determine whether to recommend that the full Board approve the continuation of the Agreements for an additional one-year period. (Following the initial approval of an Agreement for a new Portfolio or with a new adviser or subadviser, such annual reviews are not required until 2 years following the execution of such Agreement.) After each Committee has made its recommendations, the full Board, including the Independent Directors, determines whether to approve the continuation of each of the Agreements. In addition, the Board, including the Independent Directors, considers matters bearing on the Agreements at most of its other meetings throughout the year and regularly interviews various individuals at MetLife Advisers responsible for the management of the Portfolios. The Directors also interview selected investment managers and other professionals at the subadvisers at various times throughout the year.
The Directors receive all materials that they or MetLife Advisers, the Fund’s investment adviser, and the subadvisers believe to be reasonably necessary for the Directors to evaluate the Agreements and determine whether to approve the continuation of the Agreements. These materials generally include, among other items, (i) information on the investment performance of the Portfolios and the performance of peer groups of funds and the Portfolios’ performance benchmarks, (ii) information on the Portfolios’ advisory and subadvisory fees and other expenses, including information comparing the Portfolios’ expenses to those of peer groups of funds and information about any applicable expense caps and fee “breakpoints,” (iii) sales and redemption data, (iv) information related to the profitability of the Agreements to MetLife Advisers and certain of the subadvisers, and potential “fall-out” or ancillary benefits that MetLife Advisers, the subadvisers or their affiliates may receive as a result of their relationships with the Fund and (v) information obtained through the subadvisers’ responses to certain requests from MetLife Advisers and the Directors and MetLife Advisers’ responses to requests from the Directors. The Directors may also consider other information such as (vi) MetLife Advisers’ and the subadvisers’ financial results and condition, (vii) each Portfolio’s investment objectives and strategies and the size, education and experience of the investment staffs of MetLife Advisers and the relevant subadvisers and their use of technology and external research, (viii) the allocation of the Portfolios’ brokerage, if any, including allocations to brokers affiliated with the subadvisers and the use of “soft” commission dollars to pay Portfolio expenses and to pay for research and other similar services, (ix) the resources devoted to, and the record of compliance with, the Portfolios’ investment policies and restrictions, policies on personal securities transactions and other compliance policies, (x) the responses of MetLife Advisers, the subadvisers and/or their affiliates to certain legal and regulatory proceedings and (xi) the economic outlook generally and for the mutual fund industry in particular. Throughout the process, the Directors have the opportunity to ask questions of and request additional materials from MetLife Advisers and the subadvisers.
Following meetings of each Contract Review Committee on September 10, 2008, the Board, including the Independent Directors, at its November 6-7, 2008 meeting, approved the continuation through December 31, 2009 of the Advisory Agreements for each Portfolio of the Fund and the Subadvisory Agreements for each Portfolio other than the Zenith Equity Portfolio and Asset Allocation Portfolios (which do not have subadvisers) and the Van Eck Global Natural Resources Portfolio, Met/Dimensional International Small Cap Portfolio and Loomis Sayles Small Cap Growth Portfolio (formerly known as the Franklin Templeton Small Cap Growth Portfolio). The Agreements approved for continuation are referred to below as the “Continued Agreements.”
In considering whether to approve the continuation of the Continued Agreements, the Directors, including the Independent Directors, did not identify any single factor as determinative, and each weighed the various factors as he or she deemed appropriate. The Directors considered the following matters in connection with their approval of the Continued Agreements:
The nature, extent and quality of the services provided to the relevant Portfolios under the Continued Agreements. The Directors considered the nature, extent and quality of the services provided by MetLife Advisers, the relevant subadvisers (if any) and their affiliates (each, an “Adviser,” and, collectively, the “Advisers”) to the relevant Portfolios pursuant to the Continued Agreements and the resources dedicated to these Portfolios by the Advisers. In particular, the Directors considered the Advisers’ abilities to attract and retain highly qualified investment professionals. With respect to MetLife Advisers, the Directors considered (for each Portfolio other than the Zenith Equity and Asset Allocation Portfolios) that MetLife Advisers is (i) ultimately responsible for the performance of such Portfolios; (ii) ultimately responsible for the establishment of the investment strategies of each such Portfolio, primarily through its recommendations to the Board regarding the hiring and selection of subadvisers; (iii) responsible for the hiring and selection, subject to Board approval, of subadvisers; and (iv) responsible for maintaining a program of Subadviser oversight reasonably designed to ensure that the subadvisers have reasonable compliance policies and procedures in place. The Directors also considered that MetLife Advisers provides a full range of day-to-day administrative services for the Portfolios involving all aspects of such Portfolios’ day-to-day operations (other than portfolio management). With respect to the Zenith Equity and Asset Allocation Portfolios, the Directors considered both the portfolio management services and the administrative services provided by MetLife Advisers. After reviewing
MSF-21
Metropolitan Series Fund, Inc.
Loomis Sayles Small Cap Growth Portfolio (formerly Franklin Templeton Small Cap Growth Portfolio)
Board Approval of Advisory and Subadvisory Agreements—(Continued)
these and related factors, the Directors concluded, within the context of their overall conclusions regarding each of the Continued Agreements, that the nature, extent and quality of services provided supported the renewal of these Agreements.
Investment performance of the relevant Portfolios. The Directors reviewed information about the performance of the relevant Portfolios over various time periods, including information prepared by an independent third party that compared the performance of the Portfolios to the performance of peer groups of funds and performance benchmarks. The Directors also reviewed a description of the third party’s methodology for identifying a Portfolio’s peer group(s) for purposes of performance and expense comparisons.
In the case of each relevant Portfolio that had performance that lagged its peer group(s) for certain periods, the Directors concluded that other factors relevant to performance were sufficient, in light of other considerations, to warrant renewal of the Continued Agreements relating to such Portfolio. These factors varied from Portfolio to Portfolio, but included one or more of the following: (i) that such Portfolio’s performance, although lagging in certain recent periods, was stronger over the longer term; (ii) that the underperformance was attributable, to a significant extent, to investment decisions that were reasonable and consistent with the Portfolio’s investment objective(s) and policies and that the Portfolio was performing within the range of reasonable expectations, given market conditions and the Portfolio’s investment objective(s) and policies; (iii) that the Portfolio’s performance was competitive when compared to other relevant performance benchmarks or peer groups; and (iv) that MetLife Advisers and/or the relevant subadviser (if any) had taken or was taking steps designed to help improve the Portfolio’s investment performance (including, in the case of certain Portfolios, that MetLife Advisers was formulating possible proposals, for presentation to the Board in November 2008, to replace the Portfolio’s subadviser or to merge the Portfolio into another Portfolio with a similar investment objective and better investment performance).
The Directors also considered the investment performance of the Advisers and their reputations generally, the historical responsiveness of the Advisers to Director concerns about performance and the willingness of the Advisers to take steps intended to improve performance.
After reviewing these and related factors, the Directors concluded, within the context of their overall conclusions regarding each of the Continued Agreements, that the investment performance of each relevant Portfolio and Adviser was sufficient, in light of other considerations, to warrant the renewal of the Continued Agreements.
The costs of the services to be provided and profits to be realized by the Advisers and their affiliates from their relationships with the Portfolios. The Directors considered the fees charged by MetLife Advisers to the Portfolios for advisory services and, with respect to the subadvised Portfolios, by such subadvisers to MetLife Advisers for subadvisory services (such advisory and subadvisory fees (if any), collectively, “Fees”), as well as the total expense levels of the Portfolios. This information included comparisons (provided by an independent third party) of the Portfolios’ advisory fees and total expense levels to those of their peer groups. In evaluating Fees for the relevant Portfolios, the Directors also took into account the demands, complexity and quality of the investment management services provided to each Portfolio. The Directors considered MetLife Advisers’ recommendations regarding reductions in Fee rates, implementation of Fee breakpoints and institution of Fee waivers and expense caps.
The Directors also considered the compensation directly or indirectly received by the Advisers and their affiliates from their relationships with the relevant Portfolios. The Directors reviewed information relating to the profits received by MetLife Advisers, certain of the subadvisers and their affiliates as a result of their relationships with the relevant Portfolios, and information about the allocation of expenses used to calculate profitability. When reviewing profitability, the Directors also considered the performance of the relevant Portfolios, the expense levels of such Portfolios and whether the relevant Advisers had implemented breakpoints, fee waivers and/or expense caps with respect to such Portfolios.
After reviewing these and related factors, the Directors concluded, within the context of their overall conclusions regarding each of the Continued Agreements, that the Fees charged to each of the relevant Portfolios were fair and reasonable, and that the information provided regarding costs of these services generally, and the related profitability (if known) to the relevant Advisers of their relationships with the relevant Portfolios, supported the renewal of the Continued Agreements.
Economies of Scale. The Directors considered the existence of any economies of scale in the provision of services by the Advisers and whether those economies were shared with the relevant Portfolios through breakpoints in their advisory fees or other means, such as expense caps, fee waivers or relatively low levels of fees. The Directors noted that most of the relevant Portfolios benefited or will benefit from breakpoints, expense caps and/or fee waivers with respect to their advisory fees. In considering these issues, the Directors also took into consideration information relating to the costs of the services provided and the profitability to MetLife Advisers, the relevant subadvisers (if any) and each of their affiliates of their relationships with the relevant Portfolios, as discussed above.
MSF-22
Metropolitan Series Fund, Inc.
Loomis Sayles Small Cap Growth Portfolio (formerly Franklin Templeton Small Cap Growth Portfolio)
Board Approval of Advisory and Subadvisory Agreements—(Continued)
After reviewing these and related factors, the Directors concluded, within the context of their overall conclusions regarding each of the Continued Agreements, that the extent to which economies of scale were shared with the relevant Portfolios supported the renewal of such Agreements.
Other Factors. The Directors also considered other factors, which included but were not limited to the following:
| | • | | the extent to which each relevant Portfolio operated in accordance with its investment objective, and its record of compliance with its investment restrictions and the compliance programs of the Fund and the Advisers. They also considered the compliance-related resources the Advisers and their affiliates provide to the relevant Portfolios; |
| | • | | the nature, quality, cost and extent of administrative and shareholder services performed by MetLife Advisers and its affiliates under the Advisory Agreements; and |
| | • | | so-called “fall-out benefits” to the Advisers, such as the engagement of their affiliates to provide distribution, brokerage and transfer agency services to the Portfolios, and the benefits of research made available to the relevant Advisers by reason of brokerage commissions generated by the relevant Portfolios’ securities transactions. The Directors also considered the possible conflicts of interest associated with these fall-out and other benefits, and the reporting and other processes in place to disclose and monitor these possible conflicts of interest. |
Based on their evaluation of all factors that they deemed to be material, including those factors described above, and assisted by the advice of independent counsel, the Directors, including the Independent Directors, concluded that each of the Continued Agreements should be continued through December 31, 2009.
Certain Matters Relating to Loomis Sayles Small Cap Growth Portfolio (formerly known as the Franklin Templeton Small Cap Growth Portfolio) (the “Small Cap Growth Portfolio”). At the November 6-7, 2008 Board meeting, the Board approved a change of subadviser for the Small Cap Growth Portfolio from Franklin Advisers, Inc. (“Franklin Advisers”) to Loomis, Sayles & Company, L.P. (“Loomis Sayles”).
In making the determination to approve the change in subadviser for the Small Cap Growth Portfolio, the Board carefully considered those factors described above with respect to the continuation of the Continued Agreements, as relevant to both the existing Subadvisory Agreement with Franklin Advisers and the proposed Subadvisory Agreement with Loomis Sayles. In addition to these factors, the Board also considered as relevant:
| | • | | the experience, investment style and investment performance history of Loomis Sayles as portfolio manager; |
| | • | | that the terms of the proposed Subadvisory Agreement with Loomis Sayles was substantially similar to the Small Cap Growth Portfolio’s existing Subadvisory Agreement with Franklin Advisers; |
| | • | | that the subadvisory fee schedule for Loomis Sayles set forth in the proposed Subadvisory Agreement was lower than the fee schedule in the existing Subadvisory Agreement and that MetLife Advisers had agreed to waive a portion of its advisory fee in light of the lower subadvisory fee schedule. |
| | • | | the expected transition costs of the change of subadviser; and |
| | • | | that the preferred date of the change of subadviser was January 5, 2009 and the desirability, in order to facilitate an orderly transition of subadvising functions, of extending the existing Subadvisory Agreement with Franklin Advisers from its scheduled expiration date of December 31, 2008 until January 5, 2009. |
Following such consideration, and assisted by the advice of independent counsel, the Directors, including the Independent Directors, unanimously voted to approve the continuation of the existing Subadvisory Agreement relating to the Small Cap Growth Portfolio through January 5, 2009 and to approve the proposed Subadvisory Agreement relating to such Portfolio with Loomis Sayles, effective January 5, 2009 through January 4, 2011.
MSF-23
A description of the policies and procedures that the Fund uses to determine how to vote proxies relating to portfolio securities is available (i) without charge, upon request, by calling (800) 638-7732 and (ii) on the Securities and Exchange Commission’s (the “SEC”) website at http://www.sec.gov.
Information regarding how the Fund voted proxies relating to portfolio securities during the most recent twelve-month period ended December 31, 2008 is available (i) without charge, upon request, by calling (800) 638-7732 and (ii) on the SEC’s website at http://www.sec.gov.
The Fund’s Statement of Additional Information includes additional information about the Directors of the Fund and is available (i) without charge, upon request, by calling (800) 638-7732 and (ii) on the SEC’s website at http://www.sec.gov.
The Fund files with the SEC a complete schedule of its portfolio holdings, as of the close of the first and third quarters of its fiscal year, on “Form N-Q”. These filings are available on the SEC’s website at www.sec.gov and may be reviewed and copied at the SEC’s Public Reference Room in Washington, DC. (Call 1-800-SEC-0330 for information on the operation of the Public Reference Room.)
MSF-24
Simplify your life…
with MetLife eDelivery® while helping MetLife preserve the planet’s natural resources.
(see details on inside cover)
| | |
Metropolitan Series Fund, Inc. Harris Oakmark Focused Value Portfolio Annual Report | | December 31, 2008 |
NOT PART OF THE ANNUAL REPORT
Letter from the President
February 1, 2009
Letter to Policy Holders:
2008 was an extraordinary year in the capital markets around the world and for the global economy. Energy prices rose to record levels early in the year before falling by two-thirds by year-end. A credit crisis that began with concerns about sub-prime mortgages led to massive changes in the financial landscape with government takeovers, forced sales, and outright failures of a number of large, once venerable firms.
While bonds as measured by the Barclays Capital U.S. Aggregate Bond Index (formerly known as, Lehman Brothers U.S. Aggregate Bond Index) were up 5.2% for the year in response to declining interest rates, there were large differences in the total returns of the various sectors of the bond market. U.S. treasury securities were up over 13% as frightened investors sought refuge in what they perceived to be the safest and most liquid investments. In contrast, investment grade corporate securities lost nearly 5% as credit spreads widened and below investment grade or high yield bonds fell over 26%.
In response to the growing credit crisis and the weakening economy, common stocks fell sharply across all regions, styles, and capitalizations. As measured by the Standard and Poor’s 500, U.S. common stocks fell 37% for the year, the worst calendar year decline since the 1930s. Foreign stocks were down even more with the MSCI EAFE Index down 43% for the year.
On the following pages, you will find a complete review of your Portfolio and its investment performance.
MetLife is committed to building your financial freedom. We appreciate your trust and will continue to focus our efforts on meeting your investment needs.
Sincerely,
Elizabeth M. Forget
President, Metropolitan Series Fund, Inc.
Metropolitan Series Fund, Inc.
Harris Oakmark Focused Value Portfolio
Managed by Harris Associates, L.P.
Portfolio Manager Commentary*
PORTFOLIO PERFORMANCE
For the twelve-month period ended December 31, 2008, the Class A shares of the Harris Oakmark Focused Value Portfolio returned -46.0%, compared to its benchmark, the Russell Midcap Index1, which returned -41.5%. The average return of its peer group, the Lipper Variable Insurance Products2 Mid-Cap Value Funds Universe, was -38.7% over the same period.
PORTFOLIO REVIEW
The extraordinary market volatility throughout the year greatly impacted stocks across the board in the Portfolio. We now know the recession started over a year ago. Every statistic released in recent months confirms significant economic weakness, and the reported GDP decline of this cycle may surpass that of every economic downturn since the Great Depression. Stock selection in the industrials, energy, and materials sectors had the most positive impact on performance for the year relative to both the Russell Midcap Value and Russell Midcap indices. However, performance was pulled back primarily by financial holdings. Health care holdings also weighed on relative results for the year.
As of December 31, 2008, the Portfolio held 25 securities across a variety of industries. During the year, there were a number of changes to the composition of the Portfolio. We initiated positions in Advance Auto Parts, CarMax, Cintas, Dr. Pepper Snapple Group, Franklin Resources, ITT Corporation, Legg Mason, National Oilwell Varco, Snap-on, Starwood Hotels & Resorts, Waters Corporation, and XTO Energy. We eliminated our positions in Cablevision Systems, International Rectifier, International Flavors and Fragrances, Liberty Capital, Liberty Interactive, McDonald’s, MDS, Micron Technology, Sovereign Bancorp, Tenet Healthcare, Timerberland, Time Warner, and Virgin Media during the period.
Franklin Resources, XTO Energy, and National Oilwell Varco—all new to the Portfolio—had the most positive impact on performance during the period. Franklin Resources has weathered the storm better than its asset management peers thanks in part to a significant percentage of assets under management in fixed income investments. Despite tough conditions for asset managers the company should, in our view, maintain stability due to a large net cash position and improved performance at its Templeton and Mutual Series Fund groups.
XTO’s stock performed well after being added to the Portfolio in the fourth quarter, even with continued declines in spot oil and gas prices. The company recently projected 2009 production growth of 18% and announced it has hedged over 90% of 2009 production and over 40% of 2010 production. With these hedges and a reduced capital spending budget, we believe that XTO should generate free cash flow of $2 billion next year, which can be used to pay down debt.
National Oilwell Varco was added during the fourth quarter following the stock’s significant price decline. The company’s industry leading technology will allow it to benefit from any increase in rig construction, drilling activity, and shale exploration.
Merrill Lynch, National Semiconductor, and Legg Mason had the most negative impact on performance during the period. Merrill Lynch’s shares were down most of the year and continued to suffer ahead of its acquisition by Bank of America at year-end. Upon completion of this transaction our Merrill shares will be exchanged for shares of the bank. We believe that Bank of America was attractively valued with a very strong balance sheet and we elected to retain those shares in the Portfolio.
National Semiconductor’s shares were down during the last half of the year as the company reported weak sales and earnings. The global economic downturn has significantly decreased demand for electronic equipment, and the company’s capacity utilization could fall near 40% in 2009. In spite of these macroeconomic factors, we are confident in management’s ability to continue shifting the business to high margin products, and we find the stock quite attractive at this discounted level.
Legg Mason’s stock price also dropped significantly starting mid-year as the firm has had a challenging time due to declining assets under management, poor investment performance and losses from its exposure to Structured Investment Vehicles (SIVs). Legg Mason has made progress in reducing its SIV exposure and has improved performance and client communication at its asset management subsidiaries.
* The views expressed above are those of the subadvisory firm as of December 31, 2008 and are subject to change based on market and other conditions. Information about the Portfolio’s holdings, asset allocation, industry allocation, or country diversification is historical and is not an indication of future Portfolio composition, which will vary. The performance of any index mentioned in this commentary has not been adjusted for ongoing management, distribution and operating expenses, and sales charges applicable to mutual fund investments. Direct investment in any index is not possible.
1 The Russell Midcap® Index is an unmanaged measure of performance of the 800 smallest companies in the Russell 1000 Index.
2 The Lipper Variable Products Fund Average is an average of the total return performance (calculated on the basis of net asset value) of variable product funds with similar investment objectives to those of the subject Portfolio as calculated by Lipper Analytical Services, an independent mutual fund ranking service.
MSF-2
Metropolitan Series Fund, Inc.
Harris Oakmark Focused Value Portfolio
A $10,000 INVESTMENT COMPARED TO THE RUSSELL MIDCAP INDEX
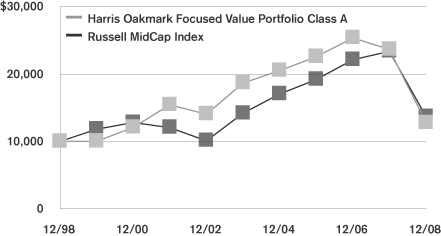
Average Annual Returns as of December 31, 2008
| | | | | | | | | | | | |
| | | Harris Oakmark
Focused Value Portfolio | | | Russell
MidCap Index | |
| | | Class A | | | Class B | | | Class E | | |
| 1 Year | | -46.0 | % | | -46.1 | % | | -46.1 | % | | -41.5 | % |
| 5 Year | | -7.3 | | | -7.6 | | | -7.5 | | | -0.7 | |
| 10 Year | | 2.5 | | | — | | | — | | | 3.2 | |
| Since Inception | | — | | | -0.8 | | | -1.1 | | | — | |
Performance numbers are net of all Portfolio expenses but do not include any insurance, sales, or administrative charges of variable annuity or life insurance contracts or any additional expenses that participants in certain eligible qualified plans may bear relating to the operations of their plans. If these charges were included, the returns would be lower.
Inception dates of the Class A, Class B and Class E shares are: 4/30/93, 2/20/01 and 5/1/01, respectively.
This information represents past performance and is not indicative of future results. Investment return and principal value may fluctuate so that shares, upon redemption, may be worth more or less than the original cost.
PORTFOLIO COMPOSITION
as of December 31, 2008
Top Holdings
| | |
| | | % of Total
Net Assets |
Intel Corp. | | 7.4% |
Robert Half International, Inc. | | 6.6% |
Teradata Corp. | | 5.2% |
Legg Mason, Inc. | | 4.9% |
National Semiconductor Corp. | | 4.6% |
Tiffany & Co. | | 4.4% |
Starwood Hotels & Resorts Worldwide, Inc. | | 4.4% |
Advance Auto Parts, Inc. | | 4.3% |
Dr. Pepper Snapple Group, Inc. | | 4.2% |
Avon Products, Inc. | | 4.2% |
Top Sectors
| | |
| | | % of Equity
Market Value |
Consumer Discretionary | | 23.4% |
Financials | | 20.5% |
Information Technology | | 19.9% |
Industrials | | 13.2% |
Health Care | | 9.9% |
Consumer Staples | | 9.0% |
Energy | | 4.1% |
MSF-3
Metropolitan Series Fund, Inc.
Shareholder Expense Example
As a shareholder of the Portfolio, you incur ongoing costs, including management fees; distribution and service (12b-1) fees; and other Portfolio expenses. This example is intended to help you understand your ongoing costs (in dollars) (referred to as “expenses”) of investing in the Portfolio and compare these costs with the ongoing costs of investing in other mutual funds. The example is based on an investment of $1,000 invested at the beginning of the period and held for the entire period, July 1, 2008 through December 31, 2008.
Actual Expenses
The first line for each share class of the Portfolio in the table below provides information about actual account values and actual expenses. You may use the information in this line, together with the amount you invested in the particular share class of the Portfolio, to estimate the expenses that you paid over the period. Simply divide your account value by $1,000 (for example, an $8,600 account value divided by $1,000=8.6), then multiply the result by the number in the first line under the heading entitled “Expenses Paid During Period” to estimate the expenses you paid on your account during this period.
Hypothetical Example for Comparison Purposes
The second line for each share class of the Portfolio in the table below provides information about hypothetical account values and hypothetical expenses based on the Portfolio’s actual expense ratio and an assumed rate of return of 5% per year before expenses, which is not the Portfolio’s actual return. The hypothetical account values and expenses may not be used to estimate the actual ending account balance or expenses you paid for the period. You may use this information to compare the ongoing costs of investing in the Portfolio and other funds. To do so, compare this 5% hypothetical example with the 5% hypothetical examples that appear in the shareholder reports of the other funds.
Please note that the expenses shown in the table are meant to highlight your ongoing costs only and do not reflect any fees or charges of your variable insurance product or any additional expenses that participants in certain eligible qualified plans may bear relating to the operations of their plan. Therefore, the second line for each share class in the table is useful in comparing ongoing costs only, and will not help you determine the relative total costs of owning different funds. In addition, if these other costs were included, your costs would have been higher.
| | | | | | | | | | | | | | |
Portfolio | | | | Annualized
Expense
Ratio | | | Beginning
Account Value
July 1,
2008 | | Ending
Account Value
December 31,
2008 | | Expenses Paid
During Period*
July 1, 2008
to
December 31,
2008 |
Harris Oakmark Focused Value—Class A(a) | | Actual | | 0.77 | % | | $ | 1,000.00 | | $ | 634.43 | | $ | 3.16 |
| | Hypothetical | | 0.77 | % | | $ | 1,000.00 | | $ | 1,021.22 | | $ | 3.91 |
| | | | | |
Harris Oakmark Focused Value—Class B(a) | | Actual | | 1.02 | % | | $ | 1,000.00 | | $ | 633.68 | | $ | 4.19 |
| | Hypothetical | | 1.02 | % | | $ | 1,000.00 | | $ | 1,019.95 | | $ | 5.18 |
| | | | | |
Harris Oakmark Focused Value—Class E(a) | | Actual | | 0.92 | % | | $ | 1,000.00 | | $ | 634.00 | | $ | 3.78 |
| | Hypothetical | | 0.92 | % | | $ | 1,000.00 | | $ | 1,020.46 | | $ | 4.67 |
* Expenses paid are equal to the Portfolio’s annualized expense ratio for the most recent six month period, as shown above, multiplied by the average account value over the period, multiplied by the number of days in the most recent fiscal half-year, divided by 366 (to reflect the the one-half year period).
(a) The annualized expense ratio shown reflects the impact of the management fee waiver as described in Note 4 to the Financial Statements.
MSF-4
Metropolitan Series Fund, Inc.
Harris Oakmark Focused Value Portfolio
Schedule of Investments as of December 31, 2008
Common Stock—94.3% of Total Net Assets
| | | | | |
| Security Description | | Shares | | Value* |
| | | | | |
| | |
Beverages—4.2% | | | | | |
Dr. Pepper Snapple Group, Inc. (a) | | 2,219,600 | | $ | 36,068,500 |
| | | | | |
| | |
Capital Markets—15.1% | | | | | |
Franklin Resources, Inc. | | 500,000 | | | 31,890,000 |
Legg Mason, Inc. (b) | | 1,900,000 | | | 41,629,000 |
Merrill Lynch & Co., Inc. | | 2,600,000 | | | 30,264,000 |
Morgan Stanley | | 1,600,000 | | | 25,664,000 |
| | | | | |
| | | | | 129,447,000 |
| | | | | |
|
Commercial & Professional Services—1.7% |
Cintas Corp. | | 620,100 | | | 14,404,923 |
| | | | | |
| | |
Computers & Peripherals—6.8% | | | | | |
Dell, Inc. (a) | | 1,293,326 | | | 13,243,658 |
Teradata Corp. (a) | | 3,000,000 | | | 44,490,000 |
| | | | | |
| | | | | 57,733,658 |
| | | | | |
| | |
Consumer Finance—4.2% | | | | | |
Discover Financial Services | | 3,762,401 | | | 35,855,682 |
| | | | | |
| | |
Energy Equipment & Services—1.9% | | | | | |
National Oilwell Varco, Inc. (a) | | 650,000 | | | 15,886,000 |
| | | | | |
|
Health Care Equipment & Supplies—3.4% |
Hospira, Inc. (a) | | 1,100,000 | | | 29,502,000 |
| | | | | |
| | |
Hotels, Restaurants & Leisure—7.7% | | | | | |
Starwood Hotels & Resorts Worldwide, Inc. (b) | | 2,100,000 | | | 37,590,000 |
Yum! Brands, Inc. | | 900,000 | | | 28,350,000 |
| | | | | |
| | | | | 65,940,000 |
| | | | | |
| | |
Household Durables—3.4% | | | | | |
Snap-on, Inc. | | 731,300 | | | 28,798,594 |
| | | | | |
| | |
Life Sciences Tools & Services—5.8% | | | | | |
PerkinElmer, Inc. | | 2,581,855 | | | 35,913,603 |
Waters Corp. (a) | | 382,200 | | | 14,007,630 |
| | | | | |
| | | | | 49,921,233 |
| | | | | |
| | |
Machinery—4.2% | | | | | |
ITT Corp. | | 780,000 | | | 35,872,200 |
| | | | | |
| | |
Oil, Gas & Consumable Fuels—2.0% | | | | | |
XTO Energy, Inc. | | 494,400 | | | 17,437,488 |
| | | | | |
| | |
Personal Products—4.2% | | | | | |
Avon Products, Inc. | | 1,500,000 | | | 36,045,000 |
| | | | | |
| | |
Professional Services—6.6% | | | | | |
Robert Half International, Inc. (b) | | 2,700,000 | | | 56,214,000 |
| | | | | |
| | | | | | | |
| Security Description | | Shares | | Value* | |
| | | | | | | |
|
Semiconductors & Semiconductor Equipment—12.0% | |
Intel Corp. (b) | | | 4,300,000 | | $ | 63,038,000 | |
National Semiconductor Corp. | | | 3,900,000 | | | 39,273,000 | |
| | | | | | | |
| | | | | | 102,311,000 | |
| | | | | | | |
| | |
Specialty Retail—11.1% | | | | | | | |
Advance Auto Parts, Inc. | | | 1,100,000 | | | 37,015,000 | |
Carmax, Inc. (a) (b) | | | 2,523,900 | | | 19,888,332 | |
Tiffany & Co. (b) | | | 1,600,000 | | | 37,808,000 | |
| | | | | | | |
| | | | | | 94,711,332 | |
| | | | | | | |
Total Common Stock
(Identified Cost $1,288,377,002) | | | | | | 806,148,610 | |
| | | | | | | |
|
| Short Term Investments—14.7% | |
| Security Description | | Shares/Face
Amount | | Value* | |
| | |
Mutual Funds—9.7% | | | | | | | |
State Street Navigator Securities Lending Prime Portfolio (c) | | | 82,698,343 | | | 82,698,343 | |
| | | | | | | |
| | |
Repurchase Agreement—5.0% | | | | | | | |
State Street Repurchase Agreement dated 12/31/08 at 0.010% to be repurchased at $42,712,024 on 01/02/09, collateralized by $43,080,000 Federal Home Loan Bank at 2.730% due 06/10/09 with a value of $43,566,804. | | $ | 42,712,000 | | | 42,712,000 | |
| | | | | | | |
Total Short Term Investments
(Identified Cost $125,410,343) | | | | | | 125,410,343 | |
| | | | | | | |
Total Investments—109.0%
(Identified Cost $1,413,787,345) (d) | | | | | | 931,558,953 | |
Liabilities in excess of other assets | | | | | | (76,845,544 | ) |
| | | | | | | |
| Total Net Assets—100% | | | | | $ | 854,713,409 | |
| | | | | | | |
| (b) | A portion or all of the security was on loan. As of December 31, 2008, the market value of securities loaned was $82,907,111 and the collateral received consisted of cash in the amount of $82,698,343. The cash collateral is invested in a money market fund managed by an affiliate of the custodian. |
| (c) | Represents investment of cash collateral received from securities lending transactions. |
| (d) | The aggregate cost of investments for federal income tax purposes as of December 31, 2008 was $1,416,445,910 and the composition of unrealized appreciation and depreciation of investment securities was $24,832,902 and $(509,719,859), respectively. |
*See accompanying notes to financial statements.
MSF-5
Metropolitan Series Fund, Inc.
Harris Oakmark Focused Value Portfolio
The Portfolio adopted the provisions of Statement of Financial Accounting Standards No. 157, “Fair Value Measurements” (FAS 157), effective with the beginning of the Portfolio’s fiscal year. FAS 157 establishes a framework for measuring fair value and expands disclosures about fair value measurements in financial statements. The three levels of the hierarchy under FAS 157 are described below:
Level 1 - quoted prices in active markets for identical securities
Level 2 - other significant observable inputs (including quoted prices for similar securities, interest rates, credit risk, etc.)
Level 3 - significant unobservable inputs (including the Portfolio’s own assumptions in determining the fair value of investments)
The inputs or methodology used for valuing securities are not necessarily an indication of the risk associated with investing in those securities.
The following is a summary of the inputs used to value the Portfolio’s net assets as of December 31, 2008:
| | | | | | |
| Valuation Inputs | | Investments In
Securities | | Other Financial
Instruments* |
Level 1 - Quoted Prices | | $ | 888,846,953 | | $ | 0 |
Level 2 - Other Significant Observable Inputs | | | 42,712,000 | | | 0 |
Level 3 - Significant Unobservable Inputs | | | 0 | | | 0 |
Total | | $ | 931,558,953 | | $ | 0 |
* Other financial instruments are derivative instruments not reflected in the Schedule of Investments, such as futures, forwards, swap contracts and written options, which are valued based on the unrealized appreciation/depreciation on the instrument.
MSF-6
Metropolitan Series Fund, Inc.
Harris Oakmark Focused Value Portfolio
Statement of Assets & Liabilities
December 31, 2008
| | | | | | | |
Assets | | | | | | | |
Investments at value (a) (b) | | | | | $ | 931,558,953 | |
Cash | | | | | | 131 | |
Receivable for: | | | | | | | |
Securities sold | | | | | | 1,667,344 | |
Fund shares sold | | | | | | 4,427,771 | |
Accrued interest and dividends | | | | | | 3,565,579 | |
| | | | | | | |
Total Assets | | | | | | 941,219,778 | |
Liabilities | | | | | | | |
Payable for: | | | | | | | |
Securities purchased | | $ | 3,038,565 | | | | |
Fund shares redeemed | | | 248,701 | | | | |
Collateral for securities loaned | | | 82,698,343 | | | | |
Accrued expenses: | | | | | | | |
Management fees | | | 411,026 | | | | |
Service and distribution fees | | | 64,804 | | | | |
Deferred directors’ fees | | | 10,705 | | | | |
Other expenses | | | 34,225 | | | | |
| | | | | | | |
Total Liabilities | | | | | | 86,506,369 | |
| | | | | | | |
Net Assets | | | | | $ | 854,713,409 | |
| | | | | | | |
Net assets consists of: | | | | | | | |
Capital paid in | | | | | $ | 1,606,274,777 | |
Undistributed net investment income | | | | | | 9,703,696 | |
Accumulated net realized losses | | | | | | (279,036,672 | ) |
Unrealized depreciation on investments | | | | | | (482,228,392 | ) |
| | | | | | | |
Net Assets | | | | | $ | 854,713,409 | |
| | | | | | | |
| Computation of offering price: | | | | | | | |
Class A | | | | | | | |
Net asset value and redemption price per share ($493,389,738 divided by 4,656,940 shares outstanding) | | | | | $ | 105.95 | |
| | | | | | | |
Class B | | | | | | | |
Net asset value and redemption price per share ($261,948,059 divided by 2,535,824 shares outstanding) | | | | | $ | 103.30 | |
| | | | | | | |
Class E | | | | | | | |
Net asset value and redemption price per share ($99,375,612 divided by 950,519 shares outstanding) | | | | | $ | 104.55 | |
| | | | | | | |
(a) Identified cost of investments | | | | | $ | 1,413,787,345 | |
| | | | | | | |
(b) Includes cash collateral for securities loaned of | | | | | $ | 82,698,343 | |
| | | | | | | |
Statement of Operations
For the Year Ended December 31, 2008
| | | | | | | | |
Investment Income | | | | | | | | |
Dividends | | | | | | $ | 19,639,322 | |
Interest | | | | | | | 2,204,558 | (a) |
| | | | | | | | |
| | | | | | | 21,843,880 | |
Expenses | | | | | | | | |
Management fees | | $ | 10,228,259 | | | | | |
Service and distribution fees—Class B | | | 1,023,634 | | | | | |
Service and distribution fees—Class E | | | 236,343 | | | | | |
Directors’ fees and expenses | | | 22,787 | | | | | |
Custodian | | | 102,738 | | | | | |
Audit and tax services | | | 36,941 | | | | | |
Legal | | | 23,418 | | | | | |
Printing | | | 293,938 | | | | | |
Insurance | | | 22,007 | | | | | |
Miscellaneous | | | 27,837 | | | | | |
| | | | | | | | |
Total expenses | | | 12,017,902 | | | | | |
Management fee waivers | | | (3,853 | ) | | | 12,014,049 | |
| | | | | | | | |
Net Investment Income | | | | | | | 9,829,831 | |
| | | | | | | | |
Realized and Unrealized Loss | | | | | | | | |
| Realized gain (loss) on: | | | | | | | | |
Investments—net | | | (280,925,905 | ) | | | | |
Futures contracts—net | | | 1,889,233 | | | | | |
Foreign currency transactions—net | | | 2,124 | | | | (279,034,548 | ) |
| | | | | | | | |
| Change in unrealized depreciation on: | | | | | | | | |
Investments—net | | | | | | | (474,093,714 | ) |
| | | | | | | | |
Net loss | | | | | | | (753,128,262 | ) |
| | | | | | | | |
Net Decrease in Net Assets From Operations | | | | | | $ | (743,298,431 | ) |
| | | | | | | | |
| (a) | Includes income on securities loaned of $1,374,286. |
See accompanying notes to financial statements.
MSF-7
Metropolitan Series Fund, Inc.
Harris Oakmark Focused Value Portfolio
Statements of Changes in Net Assets
| | | | | | | | |
| | | Year ended
December 31,
2008 | | | Year ended
December 31,
2007 | |
From Operations | | | | | | | | |
Net investment income | | $ | 9,829,831 | | | $ | 4,409,984 | |
Net realized gain (loss) | | | (279,034,548 | ) | | | 187,656,215 | |
Change in unrealized depreciation | | | (474,093,714 | ) | | | (339,762,441 | ) |
| | | | | | | | |
Decrease in net assets from operations | | | (743,298,431 | ) | | | (147,696,242 | ) |
| | | | | | | | |
From Distributions to Shareholders | | | | | | | | |
Net investment income | | | | | | | | |
Class A | | | (3,843,469 | ) | | | (6,924,948 | ) |
Class B | | | (163,747 | ) | | | (2,104,620 | ) |
Class E | | | (283,999 | ) | | | (1,101,719 | ) |
| | | | | | | | |
| | | (4,291,215 | ) | | | (10,131,287 | ) |
| | | | | | | | |
Net realized gain | | | | | | | | |
Class A | | | (118,433,659 | ) | | | (152,693,942 | ) |
Class B | | | (49,938,152 | ) | | | (81,495,708 | ) |
Class E | | | (19,246,959 | ) | | | (32,760,337 | ) |
| | | | | | | | |
| | | (187,618,770 | ) | | | (266,949,987 | ) |
| | | | | | | | |
Total distributions | | | (191,909,985 | ) | | | (277,081,274 | ) |
| | | | | | | | |
Increase (decrease) in net assets from capital share transactions | | | (226,948,280 | ) | | | 271,078,146 | |
| | | | | | | | |
Net decrease in net assets | | | (1,162,156,696 | ) | | | (153,699,370 | ) |
| | |
Net Assets | | | | | | | | |
Beginning of the period | | | 2,016,870,105 | | | | 2,170,569,475 | |
| | | | | | | | |
End of the period | | $ | 854,713,409 | | | $ | 2,016,870,105 | |
| | | | | | | | |
Undistributed Net Investment Income | | | | | | | | |
End of the period | | $ | 9,703,696 | | | $ | 4,251,884 | |
| | | | | | | | |
Other Information:
Capital Shares
Transactions in capital shares were as follows:
| | | | | | | | | | | | | | |
| | | Year ended
December 31, 2008 | | | Year ended
December 31, 2007 | |
| | | Shares | | | $ | | | Shares | | | $ | |
Class A | | | | | | | | | | | | | | |
Sales | | 1,066,502 | | | $ | 164,423,922 | | | 1,469,045 | | | $ | 360,559,728 | |
Reinvestments | | 677,023 | | | | 122,277,128 | | | 658,195 | | | | 159,618,890 | |
Redemptions | | (2,779,087 | ) | | | (497,467,176 | ) | | (1,004,853 | ) | | | (251,059,673 | ) |
| | | | | | | | | | | | | | |
Net increase (decrease) | | (1,035,562 | ) | | $ | (210,766,126 | ) | | 1,122,387 | | | $ | 269,118,945 | |
| | | | | | | | | | | | | | |
Class B | | | | | | | | | | | | | | |
Sales | | 245,342 | | | $ | 36,268,149 | | | 353,452 | | | $ | 86,105,779 | |
Reinvestments | | 284,041 | | | | 50,101,899 | | | 352,283 | | | | 83,600,328 | |
Redemptions | | (558,388 | ) | | | (92,348,517 | ) | | (663,348 | ) | | | (160,295,991 | ) |
| | | | | | | | | | | | | | |
Net increase (decrease) | | (29,005 | ) | | $ | (5,978,469 | ) | | 42,387 | | | $ | 9,410,116 | |
| | | | | | | | | | | | | | |
Class E | | | | | | | | | | | | | | |
Sales | | 89,986 | | | $ | 11,844,253 | | | 78,053 | | | $ | 18,644,557 | |
Reinvestments | | 109,478 | | | | 19,530,958 | | | 141,221 | | | | 33,862,056 | |
Redemptions | | (254,653 | ) | | | (41,578,896 | ) | | (245,487 | ) | | | (59,957,528 | ) |
| | | | | | | | | | | | | | |
Net decrease | | (55,189 | ) | | $ | (10,203,685 | ) | | (26,213 | ) | | $ | (7,450,915 | ) |
| | | | | | | | | | | | | | |
Increase (decrease) derived from capital share transactions | | | | | $ | (226,948,280 | ) | | | | | $ | 271,078,146 | |
| | | | | | | | | | | | | | |
See accompanying notes to financial statements.
MSF-8
Metropolitan Series Fund, Inc.
Harris Oakmark Focused Value Portfolio
Financial Highlights
| | | | | | | | | | | | | | | | | | | | |
| | | Class A | |
| | | Year ended December 31, | |
| | | 2008 | | | 2007 | | | 2006 | | | 2005 | | | 2004 | |
Net Asset Value, Beginning of Period | | $ | 219.43 | | | $ | 269.23 | | | $ | 265.37 | | | $ | 243.86 | | | $ | 224.26 | |
| | | | | | | | | | | | | | | | | | | | |
Income From Investment Operations | | | | | | | | | | | | | | | | | | | | |
Net investment income | | | 1.29 | (a) | | | 0.73 | (a) | | | 1.41 | | | | 0.78 | | | | 0.23 | |
Net realized and unrealized gain (loss) of investments | | | (93.36 | ) | | | (15.83 | ) | | | 28.89 | | | | 23.48 | | | | 21.85 | |
| | | | | | | | | | | | | | | | | | | | |
Total from investment operations | | | (92.07 | ) | | | (15.10 | ) | | | 30.30 | | | | 24.26 | | | | 22.08 | |
| | | | | | | | | | | | | | | | | | | | |
Less Distributions | | | | | | | | | | | | | | | | | | | | |
Distributions from net investment income | | | (0.67 | ) | | | (1.51 | ) | | | (0.83 | ) | | | (0.11 | ) | | | (0.10 | ) |
Distributions from net realized capital gains | | | (20.74 | ) | | | (33.19 | ) | | | (25.61 | ) | | | (2.64 | ) | | | (2.38 | ) |
| | | | | | | | | | | | | | | | | | | | |
Total distributions | | | (21.41 | ) | | | (34.70 | ) | | | (26.44 | ) | | | (2.75 | ) | | | (2.48 | ) |
| | | | | | | | | | | | | | | | | | | | |
Net Asset Value, End of Period | | $ | 105.95 | | | $ | 219.43 | | | $ | 269.23 | | | $ | 265.37 | | | $ | 243.86 | |
| | | | | | | | | | | | | | | | | | | | |
Total Return (%) | | | (46.0 | ) | | | (6.8 | ) | | | 12.5 | | | | 10.0 | | | | 9.9 | |
Ratio of operating expenses to average net assets before expense reductions (%) | | | 0.78 | | | | 0.75 | | | | 0.78 | | | | 0.77 | | | | 0.78 | |
Ratio of operating expenses to average net assets after expense reductions (%) (b) | | | N/A | | | | 0.75 | | | | 0.78 | | | | 0.77 | | | | 0.78 | |
Ratio of operating expenses to average net assets without giving effect to the contractual expense agreement would have been (%) (c) | | | 0.78 | | | | 0.76 | | | | N/A | | | | N/A | | | | N/A | |
Ratio of net investment income to average net assets (%) | | | 0.77 | | | | 0.30 | | | | 0.60 | | | | 0.35 | | | | 0.15 | |
Portfolio turnover rate (%) | | | 58 | | | | 68 | | | | 50 | | | | 25 | | | | 16 | |
Net assets, end of period (000) | | $ | 493,390 | | | $ | 1,249,122 | | | $ | 1,230,429 | | | $ | 1,024,615 | | | $ | 809,906 | |
| | | | | | | | | | | | | | | | | | | | |
| | | Class B | |
| | | Year ended December 31, | |
| | | 2008 | | | 2007 | | | 2006 | | | 2005 | | | 2004 | |
Net Asset Value, Beginning of Period | | $ | 214.35 | | | $ | 263.76 | | | $ | 260.34 | | | $ | 239.96 | | | $ | 221.17 | |
| | | | | | | | | | | | | | | | | | | | |
Income From Investment Operations | | | | | | | | | | | | | | | | | | | | |
Net investment income (loss) | | | 0.92 | (a) | | | 0.10 | (a) | | | 0.91 | | | | 0.22 | | | | (0.24 | ) |
Net realized and unrealized gain (loss) of investments | | | (91.16 | ) | | | (15.46 | ) | | | 28.36 | | | | 22.80 | | | | 21.41 | |
| | | | | | | | | | | | | | | | | | | | |
Total from investment operations | | | (90.24 | ) | | | (15.36 | ) | | | 29.27 | | | | 23.02 | | | | 21.17 | |
| | | | | | | | | | | | | | | | | | | | |
Less Distributions | | | | | | | | | | | | | | | | | | | | |
Distributions from net investment income | | | (0.07 | ) | | | (0.86 | ) | | | (0.24 | ) | | | 0.00 | | | | 0.00 | |
Distributions from net realized capital gains | | | (20.74 | ) | | | (33.19 | ) | | | (25.61 | ) | | | (2.64 | ) | | | (2.38 | ) |
| | | | | | | | | | | | | | | | | | | | |
Total distributions | | | (20.81 | ) | | | (34.05 | ) | | | (25.85 | ) | | | (2.64 | ) | | | (2.38 | ) |
| | | | | | | | | | | | | | | | | | | | |
Net Asset Value, End of Period | | $ | 103.30 | | | $ | 214.35 | | | $ | 263.76 | | | $ | 260.34 | | | $ | 239.96 | |
| | | | | | | | | | | | | | | | | | | | |
Total Return (%) | | | (46.1 | ) | | | (7.1 | ) | | | 12.2 | | | | 9.7 | | | | 9.7 | |
Ratio of operating expenses to average net assets before expense reductions (%) | | | 1.03 | | | | 1.00 | | | | 1.03 | | | | 1.02 | | | | 1.03 | |
Ratio of operating expenses to average net assets after expense reductions (%) (b) | | | N/A | | | | 1.00 | | | | 1.03 | | | | 1.02 | | | | 1.03 | |
Ratio of operating expenses to average net assets without giving effect to the contractual expense agreement would have been (%) (c) | | | 1.03 | | | | 1.01 | | | | N/A | | | | N/A | | | | N/A | |
Ratio of net investment income (loss) to average net assets (%) | | | 0.57 | | | | 0.04 | | | | 0.35 | | | | 0.10 | | | | (0.09 | ) |
Portfolio turnover rate (%) | | | 58 | | | | 68 | | | | 50 | | | | 25 | | | | 16 | |
Net assets, end of period (000) | | $ | 261,948 | | | $ | 549,779 | | | $ | 665,313 | | | $ | 613,215 | | | $ | 578,991 | |
| Please | see following page for Financial Highlights footnote legend. |
See accompanying notes to financial statements.
MSF-9
Metropolitan Series Fund, Inc.
Harris Oakmark Focused Value Portfolio
Financial Highlights
| | | | | | | | | | | | | | | | | | | | |
| | | Class E | |
| | | Year ended December 31, | |
| | | 2008 | | | 2007 | | | 2006 | | | 2005 | | | 2004 | |
Net Asset Value, Beginning of Period | | $ | 216.73 | | | $ | 266.33 | | | $ | 262.59 | | | $ | 241.77 | | | $ | 222.60 | |
| | | | | | | | | | | | | | | | | | | | |
Income From Investment Operations | | | | | | | | | | | | | | | | | | | | |
Net investment income | | | 1.07 | (a) | | | 0.34 | (a) | | | 1.21 | | | | 0.49 | | | | 0.04 | |
Net realized and unrealized gain (loss) of investments | | | (92.21 | ) | | | (15.63 | ) | | | 28.59 | | | | 22.97 | | | | 21.51 | |
| | | | | | | | | | | | | | | | | | | | |
Total from investment operations | | | (91.14 | ) | | | (15.29 | ) | | | 29.80 | | | | 23.46 | | | | 21.55 | |
| | | | | | | | | | | | | | | | | | | | |
Less Distributions | | | | | | | | | | | | | | | | | | | | |
Distributions from net investment income | | | (0.30 | ) | | | (1.12 | ) | | | (0.45 | ) | | | 0.00 | | | | 0.00 | |
Distributions from net realized capital gains | | | (20.74 | ) | | | (33.19 | ) | | | (25.61 | ) | | | (2.64 | ) | | | (2.38 | ) |
| | | | | | | | | | | | | | | | | | | | |
Total distributions | | | (21.04 | ) | | | (34.31 | ) | | | (26.06 | ) | | | (2.64 | ) | | | (2.38 | ) |
| | | | | | | | | | | | | | | | | | | | |
Net Asset Value, End of Period | | $ | 104.55 | | | $ | 216.73 | | | $ | 266.33 | | | $ | 262.59 | | | $ | 241.77 | |
| | | | | | | | | | | | | | | | | | | | |
Total Return (%) | | | (46.1 | ) | | | (7.0 | ) | | | 12.3 | | | | 9.8 | | | | 9.8 | |
Ratio of operating expenses to average net assets before expense reductions (%) | | | 0.93 | | | | 0.90 | | | | 0.93 | | | | 0.92 | | | | 0.93 | |
Ratio of operating expenses to average net assets after expense reductions (%) (b) | | | N/A | | | | 0.90 | | | | 0.93 | | | | 0.92 | | | | 0.93 | |
Ratio of operating expenses to average net assets without giving effect to the contractual expense agreement would have been (%) (c) | | | 0.93 | | | | 0.91 | | | | N/A | | | | N/A | | | | N/A | |
Ratio of net investment income to average net assets (%) | | | 0.66 | | | | 0.14 | | | | 0.44 | | | | 0.19 | | | | 0.00 | |
Portfolio turnover rate (%) | | | 58 | | | | 68 | | | | 50 | | | | 25 | | | | 16 | |
Net assets, end of period (000) | | $ | 99,376 | | | $ | 217,969 | | | $ | 274,828 | | | $ | 290,264 | | | $ | 280,856 | |
| (a) | Per share amount is based on average shares outstanding during the period. |
| (b) | The Portfolio has entered into arrangements with certain brokers who paid a portion of the Portfolio’s expenses. |
| (c) | See Note 4 of the Notes to Financial Statements. |
See accompanying notes to financial statements.
MSF-10
Metropolitan Series Fund, Inc.
Harris Oakmark Focused Value Portfolio
Notes to Financial Statements—December 31, 2008
Metropolitan Series Fund, Inc. (the “Fund”) is organized as a corporation under the laws of Maryland pursuant to Articles of Incorporation filed on November 23, 1982, as amended, and registered under the Investment Company Act of 1940, as amended (the “1940 Act”), as an open-end investment company. The Fund is a “series” type of mutual fund, which issues separate series of stock. Each series represents an interest in a separate portfolio of Fund investments. The Harris Oakmark Focused Value Portfolio (the “Portfolio”) is a non-diversified series of the Fund. Shares in the Fund are not offered directly to the general public and are currently available only to separate accounts established by Metropolitan Life Insurance Company (“MetLife”), New England Life Insurance Company, General American Life Insurance Company (“General American”), The MetLife Investors Group of Insurance Companies, MetLife Insurance Company of Connecticut and other affiliated insurance companies (collectively, the “Insurance Companies”) and to certain eligible qualified retirement plans (“Qualified Plans”), as an investment vehicle for variable life insurance, group annuity or variable annuity products of these insurance companies or Qualified Plans, although the Portfolio is not available to all such separate accounts and Qualified Plans. The Portfolio’s shares may be divided into different classes. Currently, the classes being offered by the Portfolio are named Class A, Class B and Class E. The classes of the Portfolio’s shares are identical, except that certain additional charges (Rule 12b-1 fees) are made against Class B and Class E shares. Investment income, realized and unrealized capital gains and losses, the common expenses of the Portfolio and certain Portfolio-level expense reductions, if any, are allocated daily, on a pro rata basis, to each class based on the relative net assets of each class to the total net assets of the Portfolio.
| 2. | SIGNIFICANT ACCOUNTING POLICIES: |
The preparation of financial statements in conformity with accounting principles generally accepted in the United States of America (“GAAP”) requires management to make estimates and assumptions that affect the reported amounts of assets and liabilities and disclosure of contingent assets and liabilities as of the date of the financial statements and the reported amounts of income and expenses during the reporting period. Actual results could differ from those estimates.
The following is a summary of significant accounting policies consistently followed by the Portfolio in the preparation of its financial statements. The policies are in conformity with GAAP.
Investment Valuation:
Debt securities (other than short term obligations with a remaining maturity of sixty days or less) are generally valued on the basis of evaluated or composite bid quotations obtained by independent pricing services and/or brokers and dealers selected by the relevant subadviser pursuant to authorization of the Board of Directors of the Fund (the “Board” or “Directors”). Such quotations take into account appropriate factors such as institutional-sized trading in similar groups of securities, yield, quality, coupon rate, maturity, type of issue, trading characteristics and other data. Short term obligations with a remaining maturity of sixty days or less are valued at amortized cost which approximates fair market value.
Equity securities traded on a national securities exchange or other exchanges are valued at their last sale price on the principal trading market. Equity securities traded on the NASDAQ National Market System are valued at the NASDAQ Official Closing Price (the “NOCP”). The NOCP is the last reported sale price if the last reported sale price falls between the spread of the last reported bid and asked prices. If the last reported bid and asked prices are above the last reported sale price, the NOCP will be the last reported bid price. If the last reported bid and asked prices are below the last reported sale price, the NOCP will be the last reported asked price. Equity securities traded on a national securities exchange or other exchanges or on the NASDAQ National Market System for which there is no reported sale during the day are valued at the last reported bid price. A security that is listed or traded on more than one exchange is valued at the quotation on the exchange determined to be the primary market for that security by the Board or its delegates. If no closing price is available, then such securities are valued by using the last reported bid price. Equity securities traded over-the-counter are valued at the last reported sales price.
If no current market value quotation is readily available or reliable for a portfolio security, fair value will be determined in accordance with procedures established by and under the general supervision of the Board. When the Portfolio uses fair value pricing, it may take into account any factors it deems appropriate. The value of securities used by the Portfolio to calculate its net asset value may differ from quoted or published prices for the same securities. Fair value pricing involves subjective judgments and the fair value determined for a security may be materially different than the value that could be realized upon the sale of that security.
MSF-11
Metropolitan Series Fund, Inc.
Harris Oakmark Focused Value Portfolio
Notes to Financial Statements—December 31, 2008—(Continued)
The Portfolio expects to use fair value pricing for securities primarily traded on U.S. exchanges only under very limited circumstances. For example, the Portfolio may use fair value pricing if the exchange on which a security is traded closes early or trading in the security is suspended.
Securities traded primarily on an exchange outside of the United States which closes before the close of the New York Stock Exchange will be valued at the last sales price on that non-U.S. exchange. Securities traded primarily on an exchange outside of the United States for which there is no reported sale during the day are valued at the mean between the last reported bid and asked prices. However, because most foreign markets close well before the Portfolio values its securities (typically at 4 p.m. Eastern Time), the earlier close of these foreign markets gives rise to the possibility that significant events, including broad market moves, may have occurred after these foreign markets close but before the Portfolio values its securities. To account for this, the Portfolio may frequently value many of its foreign equity securities using fair value prices based on third party vendor modeling tools.
Forward foreign currency exchange contracts are valued based on the mean between closing bid and asked prices of the forward currency contract rates in the London foreign exchange markets on a daily basis as provided by a reliable bank or dealer.
Options, whether on securities, indices, futures contracts, or otherwise, are valued at the last sales price available as of the close of business on the day of valuation or, if there is no such sale price available, at the mean between the bid and asked prices. Options on currencies are valued at the spot price each day.
Subject to the Board’s oversight, the Board has delegated the day-to-day oversight of pricing matters, including determinations in good faith under the Fund’s procedures the fair value of securities for which current market quotations are not readily available to the subadviser of the Portfolio.
Investment Transactions and Related Investment Income:
Portfolio security transactions are recorded on the trade date. Dividend income is recorded on the ex-dividend date or, for certain foreign securities, when notified. Interest income, which includes amortization of premium and accretion of discount on debt securities, is recorded on the accrual basis. Realized gains and losses on investments and unrealized appreciation and depreciation are determined on the identified cost basis, which is the same basis used for federal income tax purposes.
Repurchase Agreements:
The Portfolio, through the custodian or a subcustodian, receives delivery of the underlying securities collateralizing repurchase agreements. The Portfolio requires the custodian to take possession, to have legally segregated in the Federal Reserve Book Entry System, or to have segregated within the custodian’s vault, all securities held as collateral for repurchase agreements. It is the Portfolio’s policy that the market value of the collateral be at least equal to 100% of the repurchase price in the case of a repurchase agreement of one-day duration and 102% on all other repurchase agreements. The Portfolio’s subadviser is responsible for determining that the value of the collateral is at all times at least equal to the repurchase price. In connection with transactions in repurchase agreements, if the seller defaults and the value of the collateral declines or if the seller enters an insolvency proceeding, realization of the collateral by the Portfolio may be delayed, limited or wholly denied.
Foreign Currency Translation:
The books and records of the Portfolio are maintained in U.S. dollars. The values of securities, currencies and other assets and liabilities denominated in currencies other than U.S. dollars are translated into U.S. dollars based upon foreign exchange rates prevailing at the end of the period. Purchases and sales of investment securities, income and expenses are translated on the respective dates of such transactions. Since the values of investment securities are presented at the foreign exchange rates prevailing at the end of the period, it is not practical to isolate that portion of the results of operations arising from changes in exchange rates from that portion of the results of operations reflecting fluctuations arising from changes in market prices of the investment securities. Such fluctuations are included in the net realized and unrealized gain or loss on investments.
Net realized foreign exchange gains or losses arise from sales of foreign currency, currency gains or losses realized between the trade and settlement dates on securities transactions, and the difference between the amounts of dividends, interest, and foreign withholding taxes recorded by the Portfolio and the U.S. dollar equivalent of the amounts actually received or paid by the Portfolio. Net unrealized foreign exchange gains and losses arise from changes in the value of assets and liabilities, other than investment securities, resulting from changes in the exchange rate.
MSF-12
Metropolitan Series Fund, Inc.
Harris Oakmark Focused Value Portfolio
Notes to Financial Statements—December 31, 2008—(Continued)
Forward Foreign Currency Exchange Contracts:
The Portfolio may enter into forward foreign currency exchange contracts primarily to hedge against foreign currency exchange rate risks on its non-U.S. dollar denominated investment securities. When entering into a forward currency contract, the Portfolio agrees to receive or deliver a fixed quantity of foreign currency for an agreed-upon price on an agreed future date. These contracts are valued daily and the Portfolio’s net equity therein, representing unrealized gain or loss on the contracts as measured by the difference between the foreign exchange rates at the dates of entry into the contracts and the forward rates at the settlement date, is included in the Statement of Assets and Liabilities. Realized and unrealized gains and losses are included in the Statement of Operations. These instruments involve market and/or credit risk in excess of the amount recognized in the Statement of Assets and Liabilities. Risks arise from the possible inability of counterparties to meet the terms of their contracts and from movement in currency and securities values and interest rates.
Futures Contracts:
The Portfolio may buy and sell futures contracts (on recognized exchanges) as a hedge or to enhance return. Futures contracts are agreements to buy or sell a security, or deliver a final cash settlement price in connection with an index, interest rate, currency, or other contracts not calling for physical delivery, for a set price in the future. The Portfolio must post an amount equal to a portion of the total market value of the futures contract as futures variation margin, which is returned when the Portfolio’s obligations under the contract have been satisfied. From time to time thereafter, the Portfolio may have to post variation margin to maintain this amount as the market value of the contract fluctuates. Risks of entering into futures contracts (and related options) include the possibility that there may be an illiquid market and that a change in the value of the contract or option may not correlate with changes in the value of the underlying securities.
Options:
The Portfolio may use options to enhance returns or to hedge against changes in values of securities the Portfolio owns or expects to purchase. Writing puts or buying calls tends to increase the Portfolio’s exposure to the underlying instrument and writing calls or buying puts tends to decrease the Portfolio’s exposure to the underlying instrument, and can be used to hedge other Portfolio investments. For options purchased to hedge the Portfolio’s investments, the potential risk to the Portfolio is that the change in value of options contracts may not correspond to the change in value of the hedged instruments. In addition, losses may arise from changes in the value of the underlying instruments, if there is an illiquid secondary market, or if the counterparty is unable to perform. The maximum loss for purchased options is limited to the premium initially paid for the option. For options written by the Portfolio, the maximum loss is not limited to the premium initially received for the option.
The main risk associated with purchasing an option is that the option expires without being exercised. In this case, the option expires worthless and the premium paid for the option is considered the loss. The risk associated with writing a call option is that the Portfolio may forgo the opportunity for a profit if the market value of the underlying position increases and the option is exercised. The risk in writing a put option is that the Portfolio may incur a loss if the market value of the underlying position decreases and the option is exercised. In addition, the Portfolio risks not being able to enter into a closing transaction for the written option as the result of an illiquid market.
“When-Issued” Securities:
Purchasing securities “when-issued” is a forward commitment by the Portfolio to buy a security. The estimated amount of the Portfolio’s payment obligation and the security’s interest rate are determined when the commitment is made, even though no interest accrues until the security is issued, which is generally 15 to 120 days later. The Portfolio will segregate liquid assets with its custodian sufficient at all times to satisfy these commitments. If the value of the security is less when delivered than when the commitment was made, the Portfolio will suffer a loss.
Federal Income Taxes:
It is the Portfolio’s policy to comply with the requirements of the Internal Revenue Code of 1986, as amended (the “Code”), and regulations thereunder, applicable to regulated investment companies and to distribute, with respect to each taxable year, all of its taxable income to shareholders. Therefore, no federal income tax provision is required. The Portfolio is subject to the provisions of the Financial Accounting Standards Board Interpretation (“FASB”) No. 48, Accounting for Uncertainties in Income Taxes (FIN 48). FIN 48 sets forth a minimum threshold for financial statement recognition of the benefit of a tax position taken
MSF-13
Metropolitan Series Fund, Inc.
Harris Oakmark Focused Value Portfolio
Notes to Financial Statements—December 31, 2008—(Continued)
or expected to be taken in a tax return. The implementation of FIN 48 did not result in any unrecognized tax benefits in the accompanying financial statements. Each of the Portfolio’s federal tax returns for the prior three fiscal years remains subject to examination by the Internal Revenue Service.
As of December 31, 2008, the Portfolio had $202,228,604 in capital loss carryforwards expiring on December 31, 2016.
Pursuant to Section 852 of the Code, the Portfolio designated the amount shown below under Long Term Gain as capital gain dividends for its taxable year ended December 31, 2008. The tax character of distributions paid for the periods ended December 31, 2008 and 2007 was as follows:
| | | | | | | | | | | | | | | | | | | | | |
Ordinary Income | | Long Term Gain | | Return of Capital | | Total |
2008 | | 2007 | | 2008 | | 2007 | | 2008 | | 2007 | | 2008 | | 2007 |
$57,371,161 | | $ | 10,227,819 | | $ | 134,538,824 | | $ | 266,853,455 | | $ | — | | $ | — | | $ | 191,909,985 | | $ | 277,081,274 |
As of December 31, 2008, the components of distributable earnings (accumulated losses) on a federal income tax basis were as follows:
| | | | | | | | | | | | | | | |
Undistributed
Ordinary
Income | | Undistributed
Long Term
Gain | | Unrealized
Depreciation | | | Loss
Carryforwards | | | Total | |
$9,716,064 | | $ | — | | $ | (484,886,957 | ) | | $ | (202,228,604 | ) | | $ | (677,399,497 | ) |
Pursuant to Federal income tax regulations applicable to investment companies, the Portfolio has elected to treat net capital losses realized between November 1 and December 31 of each year as occurring on the first day of the following tax year. For the year ended December 31, 2008, the following amounts of realized capital and currency losses reflected in the accompanying financial statements will not be recognized for Federal income tax purposes until January 1, 2009:
| | | | |
Currency | | Capital | |
$— | | $ | (74,149,503 | ) |
Dividends and Distributions to Shareholders:
The Portfolio records dividends and distributions on the ex-dividend date. Net realized gains from security transactions (if any) are generally distributed annually to shareholders. The timing and characterization of certain income and capital gains distributions are determined in accordance with federal tax regulations that may differ from GAAP. Permanent book and tax basis differences relating to shareholder distributions will result in reclassification between under/over distributed net investment income, accumulated net realized gains/losses and paid in capital.
| 3. | INVESTMENT TRANSACTIONS: |
For the year ended December 31, 2008, purchases and sales of securities (excluding short term investments) for the Portfolio were as follows:
| | | | | | | | | |
Purchases | | Sales |
U.S. Government | | Other | | U.S. Government | | Other |
$0 | | $ | 771,110,088 | | $ | 0 | | $ | 1,085,587,139 |
| 4. | INVESTMENT MANAGEMENT FEES AND OTHER TRANSACTIONS WITH AFFILIATES: |
Investment Management Agreement:
MetLife Advisers, LLC (“MetLife Advisers”) is the investment adviser to the Portfolio. The Fund has entered into an investment management agreement with MetLife Advisers with respect to the Portfolio. For providing investment management services to the Portfolio, MetLife Advisers receives monthly compensation at the following annual rates:
| | | | |
Management
Fees earned by
MetLife Advisers
for the year ended
December 31, 2008 | | Annual
percentage
rates paid to
MetLife Advisers | | Based on Portfolios
average daily net asset
levels |
| $10,228,259 | | 0.750% | | Of the first $1 billion |
| | 0.700% | | Of the next $1.5 billion |
| | 0.675% | | Of the next $2.5 billion |
| | 0.650% | | On amounts in excess of $5 billion |
MSF-14
Metropolitan Series Fund, Inc.
Harris Oakmark Focused Value Portfolio
Notes to Financial Statements—December 31, 2008—(Continued)
Certain officers and directors of the Fund may also be officers of MetLife Advisers; however, such officers and directors receive no compensation from the Fund.
Management Fee Waivers:
Effective January 1, 2007 to January 6, 2008, a new subadvisory fee schedule was adopted for the Portfolio, under which the subadvisory fee for the Portfolio was calculated based on the combined average daily net assets for the Portfolio and the Harris Oakmark Large Cap Value Portfolio (collectively, the “Harris Portfolios”). In connection with this change in the subadvisory fee schedule, MetLife Advisers has agreed, pursuant to an expense agreement effective January 1, 2007 to January 6, 2008, to reduce its advisory fees set out above under “Investment Management Agreement” for each class of the Portfolio by the following amount: the difference between (i) the subadvisory fee that MetLife Advisers actually pays Harris Associates, L.P. with respect to such class of the Portfolio; and (ii) the subadvisory fee that MetLife Advisers would pay Harris Associates, L.P. with respect to such class of the Portfolio after applying the new subadvisory fee schedule for the Portfolio that took effect January 1, 2007 but without combining the assets of the Harris Portfolios for purposes of calculating such fee. This combined subadvisory fee schedule and corresponding fee waiver was discontinued effective January 7, 2008.
Amounts waived for the year ended December 31, 2008 are shown as management fee waivers in the Statement of Operations.
Service and Distribution Fees:
The Fund has adopted a Distribution and Service Plan under Rule 12b-1 of the 1940 Act for the Portfolio’s Class B and E shares. Under the Distribution and Service Plan, the Class B and E shares of the Portfolio pay a fee to compensate the Insurance Companies (or their affiliates) and other broker-dealers and financial intermediaries involved in the offer and sale of Portfolio shares for promoting or selling and servicing the Class B and E shares. The fees under the Distribution and Service Plan for each class of the Portfolio’s shares are calculated as a percentage of the Portfolio’s average daily net assets that are attributable to that Class. Currently, the fee is 0.25% per year for Class B shares and 0.15% per year for Class E shares. Amounts paid by the Portfolio for the year ended December 31, 2008 are shown as Service and Distribution fees in the Statement of Operations.
The Fund has entered into a securities lending arrangement with the Fund’s custodian, State Street Bank and Trust Company (the “custodian”). Under the agreement, the custodian is authorized to loan securities on the Portfolios’ behalf. In exchange, the Portfolio receives either cash or securities as collateral against the loaned securities. The Portfolio receives collateral at least equal to 102% of the market value of the loaned securities (105% for foreign securities), at each loan’s inception. Collateral must be maintained at least at 100% of the market value of the loaned securities for the duration of the loan. The cash collateral is invested in the Navigator Securities Lending Prime Portfolio, an affiliate of the custodian, which invests in a variety of high quality U.S. dollar-denominated instruments. If the market value of the collateral at the close of trading on a business day is less than 100% of the market value of the loaned securities at the close of trading on that day, the borrower shall be required to deliver, by the close of business on the following business day, an additional amount of collateral, equal to at least 100% of the market value of all the loaned securities as of such preceding day. The Portfolio receives 80% of the annual net income from securities lending transactions, which is included in interest income of the Portfolio. The remaining 20% is paid to the custodian as compensation for its securities lending services. Interest income received by the Portfolio via lending transactions during the year ended December 31, 2008 is footnoted in the Statement of Operations. The Portfolio bears the risk of any deficiency in the amount of collateral available for return to a borrower due to a loss in an approved investment purchased with such collateral. Any outstanding loans by the Portfolio at December 31, 2008 are footnoted in the Schedule of Investments.
| 6. | MARKET AND CREDIT RISK: |
In the normal course of business, the Portfolio invests in securities and enters into transactions where risks exist due to fluctuations in the market (market risk) or failure of the other party to a transaction to perform (credit risk). The value of securities held by the Portfolio may decline in response to certain events, including those directly involving the companies whose securities are owned by the Portfolio; conditions affecting the general economy; overall market changes; local, regional or global political, social or economic instability; and currency and interest rate and price fluctuations. Similar to credit risk, the Portfolio may be exposed to counterparty risk, or the risk that an entity with which the Portfolio has unsettled or open transactions may default. Financial assets, which potentially expose the Portfolio to credit and counterparty risks, consist principally of
MSF-15
Metropolitan Series Fund, Inc.
Harris Oakmark Focused Value Portfolio
Notes to Financial Statements—December 31, 2008—(Continued)
investments and cash due from counterparties. The extent of the Portfolio’s exposure to credit and counterparty risks in respect to these financial assets approximates their value as recorded in the Portfolio’s Statements of Assets and Liabilities.
On January 27, 2009, the Board of Directors of the Fund determined that is was appropriate to solicit shareholders of the Portfolio regarding the approval of a new subadvisory agreement (the “New Subadvisory Agreement”) with respect to the Portfolio between MetLife Advisers and Artisan Partners Limited Partnership, and an amended and restated advisory agreement (the “Amended Advisory Agreement”, and together with the New Subadvisory Agreement, the “Agreements”) between the Fund, on behalf of the Portfolio, and MetLife Advisers. On or about April 30, 2009, the shareholders of the Portfolio will consider the approval of the Agreements. If approved by shareholders, the Agreements will go into effect on or about May 1, 2009.
| 8. | RECENT ACCOUNTING PRONOUNCEMENTS: |
In March 2008, the FASB issued Statement of Financial Accounting Standards No. 161, Disclosures about Derivative Instruments and Hedging Activities (“FAS 161”), an amendment of FASB Statement No. 133. FAS 161 requires enhanced disclosures about (a) how and why an entity uses derivative instruments, (b) how derivative instruments and hedging activities are accounted for, and (c) how derivative instruments and related hedging activities affect a fund’s financial position, financial performance, and cash flows. Management does not believe the adoption of FAS 161 will materially impact the financial statement amounts, but will require additional disclosures. This will include qualitative and quantitative disclosures on derivative positions existing at period end and the effect of using derivatives during the reporting period. FAS 161 is effective for financial statements issued for fiscal years and interim periods beginning after November 15, 2008. Management is currently evaluating the impact the adoption of FAS 161 will have on the Portfolio’s financial statement disclosures.
MSF-16
Metropolitan Series Fund, Inc.
Harris Oakmark Focused Value Portfolio
Report of Independent Registered Public Accounting Firm
To the Shareholders and Board of Directors of Metropolitan Series Fund, Inc.:
We have audited the accompanying statement of assets and liabilities, including the schedule of investments, of the Harris Oakmark Focused Value Portfolio (one of the portfolios constituting the Metropolitan Series Fund, Inc.) (the “Fund”) as of December 31, 2008, and the related statement of operations for the year then ended, the statements of changes in net assets for each of the two years in the period then ended, and the financial highlights for each of the five years in the period then ended. These financial statements and financial highlights are the responsibility of the Fund’s management. Our responsibility is to express an opinion on these financial statements and financial highlights based on our audits.
We conducted our audits in accordance with the standards of the Public Company Accounting Oversight Board (United States). Those standards require that we plan and perform the audit to obtain reasonable assurance about whether the financial statements and financial highlights are free of material misstatement. The Fund is not required to have, nor were we engaged to perform, an audit of its internal control over financial reporting. Our audits included consideration of internal control over financial reporting as a basis for designing audit procedures that are appropriate in the circumstances, but not for the purpose of expressing an opinion on the effectiveness of the Fund’s internal control over financial reporting. Accordingly, we express no such opinion. An audit also includes examining, on a test basis, evidence supporting the amounts and disclosures in the financial statements, assessing the accounting principles used and significant estimates made by management, as well as evaluating the overall financial statement presentation. Our procedures included confirmation of securities owned as of December 31, 2008, by correspondence with the custodian and brokers; where replies were not received from brokers, we performed other auditing procedures. We believe that our audits provide a reasonable basis for our opinion.
In our opinion, the financial statements and financial highlights referred to above present fairly, in all material respects, the financial position of the Harris Oakmark Focused Value Portfolio of the Metropolitan Series Fund, Inc. as of December 31, 2008, the results of its operations for the year then ended, the changes in its net assets for each of the two years in the period then ended, and the financial highlights for each of the five years in the period then ended, in conformity with accounting principles generally accepted in the United States of America.
Deloitte & Touche LLP
Boston, Massachusetts
February 20, 2009
MSF-17
Metropolitan Series Fund, Inc.
Directors and Officers
The Fund’s Directors review actions of the Fund’s investment adviser and subadvisers, and decide upon matters of general policy. The Fund’s officers supervise the daily business operations of the Fund. The Board of Directors and the Fund’s officers are listed below. Each Director is responsible for overseeing all 38 Portfolios of the Fund. There is no limit to the term a Director may serve. Directors serve until their resignation, retirement or removal in accordance with the Fund’s organizational documents and policies adopted by the Board from time to time. Officers hold office at the pleasure of the Board or until the election or appointment and the qualification of a successor. The address of the Directors and officers is c/o Metropolitan Series Fund, Inc., 501 Boylston Street, Boston, MA 02116.
Interested Directors(1)
Each Director below is an “interested person” (as defined by the 1940 Act) with respect to the Fund in that Ms. Forget is an employee of MetLife and Mr. Typermass is a former employee of MetLife and owns securities issued by MetLife, Inc., the ultimate parent company of MetLife Advisers.
| | | | | | | | |
Name, Address and Age | | Current
position(s)
with Fund | | Position(s)
held since | | Principal occupations
over past five years, including other directorships(2) | | Number of
Portfolios in
Fund Complex
Overseen by
Director(3) |
Elizabeth M. Forget Age: 42 | | Director, Chairman of the Board, President and Chief Executive Officer | | 2006 | | Senior Vice President (since 2007), MetLife, Inc.; President, Met Investors Advisory, LLC; Trustee and President, Met Investors Series Trust; Executive Vice President, MetLife Investors Group, Inc.; President, Chief Executive Officer and Chair of the Board of Managers (since 2006), MetLife Advisers; President, Met Investors Advisory, LLC. | | 87 |
| | | | |
Arthur G. Typermass Age: 71 | | Director | | 1998 | | Formerly, Senior Vice President and Treasurer, MetLife. | | 38 |
Non-Interested Directors(1)
Each Director below is not an “interested person” (as defined by the 1940 Act) with respect to the Fund (collectively, the “Independent Directors”).
| | | | | | | | |
Name, Address and Age | | Current
position(s)
with Fund | | Position(s)
held since | | Principal occupations
over past five years, including other directorships(2) | | Number of
Portfolios in
Fund Complex
Overseen by
Director(3) |
Steve A. Garban† Age: 71 | | Director | | 1985 | | Formerly, Chief Financial Officer, Senior Vice President Finance and Operations and Treasurer (Emeritus), The Pennsylvania State University. | | 38 |
| | | | |
Linda B. Strumpf Age: 61 | | Director | | 2000 | | Vice President and Chief Investment Officer, Ford Foundation. | | 38 |
| | | | |
Michael S. Scott Morton† Age: 71 | | Director | | 1993 | | Jay W. Forrester Professor of Management (Emeritus) at Sloan School of Management, MIT. | | 38 |
| | | | |
H. Jesse Arnelle Age: 75 | | Director | | 2001 | | Formerly, Counsel, Womble Carlyle Sandrie & Rice; Director, Textron Inc. (global multi- industry company)*; formerly, Director, Gannet Co. Inc. (diversified news and information company)*; formerly, Director, Eastman Chemical Company (global chemical company)*; formerly, Director, Waste Management, Inc.*; formerly, Director, Armstrong Holdings Inc. (parent company of floor and ceiling products business)*; formerly, Director, FPL Group Inc. (public utility holding company)*; Director, URS Corporation (engineering design services firm)*. | | 38 |
MSF-18
Metropolitan Series Fund, Inc.
Directors and Officers—(Continued)
| | | | | | | | |
Name, Address and Age | | Current
position(s)
with Fund | | Position(s)
held since | | Principal occupations
over past five years, including other directorships(2) | | Number of
Portfolios in
Fund Complex
Overseen by
Director(3) |
Nancy Hawthorne Age: 57 | | Director | | 2003 | | Chief Executive Officer, Clerestory LLC (corporate financial advisor); Director, Avid Technologies (computer software company)*; formerly, Chairman of the Board of Avid Technologies; formerly, Board of Advisors, L. Knife & Sons, Inc. (beverage distributor); formerly, Trustee, New England Zenith Fund (“Zenith Fund”)**; formerly, Chief Executive Officer and Managing Partner, Hawthorne, Krauss and Associates (corporate financial advisor); formerly, Chief Financial Officer and Executive Vice President, Continental Cablevision, subsequently renamed MediaOne (cable television company); formerly, Director, Life F/X, Inc.; formerly, Chairman of the Board, WorldClinic (distance medicine company); formerly, Director, Perini Corporation (construction company)*; formerly, Director, CGU (property and casualty insurance company); formerly, Director, Beacon Power Corporation (energy company)*. | | 38 |
| | | | |
John T. Ludes Age: 72 | | Director | | 2003 | | President, LFP Properties (consulting firm); Formerly, Trustee, Zenith Fund**; formerly, Vice Chairman, President and Chief Operating Officer, Fortune Brands/American Brands (global conglomerate); formerly, President and CEO, Acushnet Company (athletic equipment company). | | 38 |
Officers(1)
| | | | | | | | |
Name and address | | Age | | Current
position(s)
with Fund | | Position(s)
held since | | Principal occupations over past five years(2) |
| Jeffrey L. Bernier | | 37 | | Senior Vice President | | 2008 | | Vice President (since 2008), MetLife, Inc.; Vice President (since 2008), MetLife; Senior Vice President (since 2008), MetLife Advisers; formerly, Director and Senior Investment Analyst (2004 to 2007), John Hancock Financial Services; formerly, Assistant Vice President (2000 to 2001), Wachovia Securities. |
| | | | |
| Alan C. Leland | | 56 | | Senior Vice President | | 2005 | | Treasurer and Chief Financial Officer, MetLife Advisers, LLC; Treasurer (since 2005), Met Investors Advisory, LLC; Vice President (since 2004), Met Investors Advisory, LLC; Vice President (since 2003), MetLife, Inc.; Vice President, MetLife; Senior Vice President, NELICO. |
| | | | |
| Peter Duffy | | 53 | | Vice President
and Treasurer | | 2000 | | Senior Vice President, MetLife Advisers; Second Vice President (since 2003), NELICO; Vice President, MetLife (since 2004); Vice President (since 2004), MetLife, Inc.; formerly, Vice President and Treasurer, Zenith Fund**. |
| | | | |
| Jeffrey P. Halperin | | 41 | | Chief
Compliance Officer | | 2007 | | Vice President (since 2006), MetLife, Inc.; Vice President (since 2006), MetLife; Chief Compliance Officer (since 2006), Met Investors Series Trust, MetLife Advisers, Met Investors Advisory, LLC and MetLife Investment Advisors Company, LLC. |
| * | Indicates a directorship with a registered investment company or a company subject to the reporting requirements of the Securities Exchange Act of 1934, as amended. |
| ** | The Zenith Fund deregistered with the Securities and Exchange Commission (“SEC”) in 2004. |
| (†) | Served as a trustee, director and/or officer of one or more of the following companies, each of which had a direct or indirect advisory relationship with MetLife Advisers or its affiliates prior to January 31, 2005: State Street Research Financial Trust, State Street Research Income Trust, State Street Research Money Market Trust, State Street Research Institutional Funds, State Street Research Capital Trust, State Street Research Master Investment Trust, State Street Research Equity Trust, State Street Research Securities Trust and State Street Research Exchange Trust (collectively, the “State Street Research Funds”). |
| (1) | During the period shown, each Director of the Fund served as a Trustee of Metropolitan Series Fund II, a registered investment company that ceased investment operations in June of 2008 and has applied for deregistration under the Investment Company Act of 1940. During this period, each officer of the Fund served in the same position with Metropolitan Series Fund II. |
| (2) | Previous positions during the past five years with the Fund; Met Investors Series Trust; MetLife; MetLife, Inc.; MetLife Advisers; Met Investors Advisory, LLC; Zenith Fund; NELICO; or New England Securities Corporation are omitted if not materially different. |
| (3) | The Fund Complex includes the Fund (38 portfolios) and Met Investors Series Trust (49 portfolios). |
MSF-19
Metropolitan Series Fund, Inc.
Harris Oakmark Focused Value Portfolio
Board Approval of Advisory and Subadvisory Agreements
The Fund’s Contract Review Committees of the Board of Directors (the “Board” or the “Directors”) typically meet in early fall to review the Portfolios’ advisory agreements (the “Advisory Agreements”) and subadvisory agreements (the “Subadvisory Agreements,” and, together with the Advisory Agreements, the “Agreements”) and determine whether to recommend that the full Board approve the continuation of the Agreements for an additional one-year period. (Following the initial approval of an Agreement for a new Portfolio or with a new adviser or subadviser, such annual reviews are not required until 2 years following the execution of such Agreement.) After each Committee has made its recommendations, the full Board, including the Independent Directors, determines whether to approve the continuation of each of the Agreements. In addition, the Board, including the Independent Directors, considers matters bearing on the Agreements at most of its other meetings throughout the year and regularly interviews various individuals at MetLife Advisers responsible for the management of the Portfolios. The Directors also interview selected investment managers and other professionals at the subadvisers at various times throughout the year.
The Directors receive all materials that they or MetLife Advisers, the Fund’s investment adviser, and the subadvisers believe to be reasonably necessary for the Directors to evaluate the Agreements and determine whether to approve the continuation of the Agreements. These materials generally include, among other items, (i) information on the investment performance of the Portfolios and the performance of peer groups of funds and the Portfolios’ performance benchmarks, (ii) information on the Portfolios’ advisory and subadvisory fees and other expenses, including information comparing the Portfolios’ expenses to those of peer groups of funds and information about any applicable expense caps and fee “breakpoints,” (iii) sales and redemption data, (iv) information related to the profitability of the Agreements to MetLife Advisers and certain of the subadvisers, and potential “fall-out” or ancillary benefits that MetLife Advisers, the subadvisers or their affiliates may receive as a result of their relationships with the Fund and (v) information obtained through the subadvisers’ responses to certain requests from MetLife Advisers and the Directors and MetLife Advisers’ responses to requests from the Directors. The Directors may also consider other information such as (vi) MetLife Advisers’ and the subadvisers’ financial results and condition, (vii) each Portfolio’s investment objectives and strategies and the size, education and experience of the investment staffs of MetLife Advisers and the relevant subadvisers and their use of technology and external research, (viii) the allocation of the Portfolios’ brokerage, if any, including allocations to brokers affiliated with the subadvisers and the use of “soft” commission dollars to pay Portfolio expenses and to pay for research and other similar services, (ix) the resources devoted to, and the record of compliance with, the Portfolios’ investment policies and restrictions, policies on personal securities transactions and other compliance policies, (x) the responses of MetLife Advisers, the subadvisers and/or their affiliates to certain legal and regulatory proceedings and (xi) the economic outlook generally and for the mutual fund industry in particular. Throughout the process, the Directors have the opportunity to ask questions of and request additional materials from MetLife Advisers and the subadvisers.
Following meetings of each Contract Review Committee on September 10, 2008, the Board, including the Independent Directors, at its November 6-7, 2008 meeting, approved the continuation through December 31, 2009 of the Advisory Agreements for each Portfolio of the Fund and the Subadvisory Agreements for each Portfolio other than the Zenith Equity Portfolio and Asset Allocation Portfolios (which do not have subadvisers) and the Van Eck Global Natural Resources Portfolio, Met/Dimensional International Small Cap Portfolio and Loomis Sayles Small Cap Growth Portfolio (formerly known as the Franklin Templeton Small Cap Growth Portfolio). The Agreements approved for continuation are referred to below as the “Continued Agreements.”
In considering whether to approve the continuation of the Continued Agreements, the Directors, including the Independent Directors, did not identify any single factor as determinative, and each weighed the various factors as he or she deemed appropriate. The Directors considered the following matters in connection with their approval of the Continued Agreements:
The nature, extent and quality of the services provided to the relevant Portfolios under the Continued Agreements. The Directors considered the nature, extent and quality of the services provided by MetLife Advisers, the relevant subadvisers (if any) and their affiliates (each, an “Adviser,” and, collectively, the “Advisers”) to the relevant Portfolios pursuant to the Continued Agreements and the resources dedicated to these Portfolios by the Advisers. In particular, the Directors considered the Advisers’ abilities to attract and retain highly qualified investment professionals. With respect to MetLife Advisers, the Directors considered (for each Portfolio other than the Zenith Equity and Asset Allocation Portfolios) that MetLife Advisers is (i) ultimately responsible for the performance of such Portfolios; (ii) ultimately responsible for the establishment of the investment strategies of each such Portfolio, primarily through its recommendations to the Board regarding the hiring and selection of subadvisers; (iii) responsible for the hiring and selection, subject to Board approval, of subadvisers; and (iv) responsible for maintaining a program of Subadviser oversight reasonably designed to ensure that the subadvisers have reasonable compliance policies and procedures in place. The Directors also considered that MetLife Advisers provides a full range of day-to-day administrative services for the Portfolios involving all aspects of such Portfolios’ day-to-day operations (other than portfolio management). With respect to the Zenith Equity and Asset Allocation Portfolios, the Directors considered both the portfolio management services and the administrative services provided by MetLife Advisers. After reviewing
MSF-20
Metropolitan Series Fund, Inc.
Harris Oakmark Focused Value Portfolio
Board Approval of Advisory and Subadvisory Agreements—(Continued)
these and related factors, the Directors concluded, within the context of their overall conclusions regarding each of the Continued Agreements, that the nature, extent and quality of services provided supported the renewal of these Agreements.
Investment performance of the relevant Portfolios. The Directors reviewed information about the performance of the relevant Portfolios over various time periods, including information prepared by an independent third party that compared the performance of the Portfolios to the performance of peer groups of funds and performance benchmarks. The Directors also reviewed a description of the third party’s methodology for identifying a Portfolio’s peer group(s) for purposes of performance and expense comparisons.
In the case of each relevant Portfolio that had performance that lagged its peer group(s) for certain periods, the Directors concluded that other factors relevant to performance were sufficient, in light of other considerations, to warrant renewal of the Continued Agreements relating to such Portfolio. These factors varied from Portfolio to Portfolio, but included one or more of the following: (i) that such Portfolio’s performance, although lagging in certain recent periods, was stronger over the longer term; (ii) that the underperformance was attributable, to a significant extent, to investment decisions that were reasonable and consistent with the Portfolio’s investment objective(s) and policies and that the Portfolio was performing within the range of reasonable expectations, given market conditions and the Portfolio’s investment objective(s) and policies; (iii) that the Portfolio’s performance was competitive when compared to other relevant performance benchmarks or peer groups; and (iv) that MetLife Advisers and/or the relevant subadviser (if any) had taken or was taking steps designed to help improve the Portfolio’s investment performance (including, in the case of certain Portfolios, that MetLife Advisers was formulating possible proposals, for presentation to the Board in November 2008, to replace the Portfolio’s subadviser or to merge the Portfolio into another Portfolio with a similar investment objective and better investment performance).
The Directors also considered the investment performance of the Advisers and their reputations generally, the historical responsiveness of the Advisers to Director concerns about performance and the willingness of the Advisers to take steps intended to improve performance.
After reviewing these and related factors, the Directors concluded, within the context of their overall conclusions regarding each of the Continued Agreements, that the investment performance of each relevant Portfolio and Adviser was sufficient, in light of other considerations, to warrant the renewal of the Continued Agreements.
The costs of the services to be provided and profits to be realized by the Advisers and their affiliates from their relationships with the Portfolios. The Directors considered the fees charged by MetLife Advisers to the Portfolios for advisory services and, with respect to the subadvised Portfolios, by such subadvisers to MetLife Advisers for subadvisory services (such advisory and subadvisory fees (if any), collectively, “Fees”), as well as the total expense levels of the Portfolios. This information included comparisons (provided by an independent third party) of the Portfolios’ advisory fees and total expense levels to those of their peer groups. In evaluating Fees for the relevant Portfolios, the Directors also took into account the demands, complexity and quality of the investment management services provided to each Portfolio. The Directors considered MetLife Advisers’ recommendations regarding reductions in Fee rates, implementation of Fee breakpoints and institution of Fee waivers and expense caps.
The Directors also considered the compensation directly or indirectly received by the Advisers and their affiliates from their relationships with the relevant Portfolios. The Directors reviewed information relating to the profits received by MetLife Advisers, certain of the subadvisers and their affiliates as a result of their relationships with the relevant Portfolios, and information about the allocation of expenses used to calculate profitability. When reviewing profitability, the Directors also considered the performance of the relevant Portfolios, the expense levels of such Portfolios and whether the relevant Advisers had implemented breakpoints, fee waivers and/or expense caps with respect to such Portfolios.
After reviewing these and related factors, the Directors concluded, within the context of their overall conclusions regarding each of the Continued Agreements, that the Fees charged to each of the relevant Portfolios were fair and reasonable, and that the information provided regarding costs of these services generally, and the related profitability (if known) to the relevant Advisers of their relationships with the relevant Portfolios, supported the renewal of the Continued Agreements.
Economies of Scale. The Directors considered the existence of any economies of scale in the provision of services by the Advisers and whether those economies were shared with the relevant Portfolios through breakpoints in their advisory fees or other means, such as expense caps, fee waivers or relatively low levels of fees. The Directors noted that most of the relevant Portfolios benefited or will benefit from breakpoints, expense caps and/or fee waivers with respect to their advisory fees. In considering these issues, the Directors also took into consideration information relating to the costs of the services provided and the profitability to MetLife Advisers, the relevant subadvisers (if any) and each of their affiliates of their relationships with the relevant Portfolios, as discussed above.
MSF-21
Metropolitan Series Fund, Inc.
Harris Oakmark Focused Value Portfolio
Board Approval of Advisory and Subadvisory Agreements—(Continued)
After reviewing these and related factors, the Directors concluded, within the context of their overall conclusions regarding each of the Continued Agreements, that the extent to which economies of scale were shared with the relevant Portfolios supported the renewal of such Agreements.
Other Factors. The Directors also considered other factors, which included but were not limited to the following:
| | • | | the extent to which each relevant Portfolio operated in accordance with its investment objective, and its record of compliance with its investment restrictions and the compliance programs of the Fund and the Advisers. They also considered the compliance-related resources the Advisers and their affiliates provide to the relevant Portfolios; |
| | • | | the nature, quality, cost and extent of administrative and shareholder services performed by MetLife Advisers and its affiliates under the Advisory Agreements; and |
| | • | | so-called “fall-out benefits” to the Advisers, such as the engagement of their affiliates to provide distribution, brokerage and transfer agency services to the Portfolios, and the benefits of research made available to the relevant Advisers by reason of brokerage commissions generated by the relevant Portfolios’ securities transactions. The Directors also considered the possible conflicts of interest associated with these fall-out and other benefits, and the reporting and other processes in place to disclose and monitor these possible conflicts of interest. |
Based on their evaluation of all factors that they deemed to be material, including those factors described above, and assisted by the advice of independent counsel, the Directors, including the Independent Directors, concluded that each of the Continued Agreements should be continued through December 31, 2009.
MSF-22
A description of the policies and procedures that the Fund uses to determine how to vote proxies relating to portfolio securities is available (i) without charge, upon request, by calling (800) 638-7732 and (ii) on the Securities and Exchange Commission’s (the “SEC”) website at http://www.sec.gov.
Information regarding how the Fund voted proxies relating to portfolio securities during the most recent twelve-month period ended December 31, 2008 is available (i) without charge, upon request, by calling (800) 638-7732 and (ii) on the SEC’s website at http://www.sec.gov.
The Fund’s Statement of Additional Information includes additional information about the Directors of the Fund and is available (i) without charge, upon request, by calling (800) 638-7732 and (ii) on the SEC’s website at http://www.sec.gov.
The Fund files with the SEC a complete schedule of its portfolio holdings, as of the close of the first and third quarters of its fiscal year, on “Form N-Q”. These filings are available on the SEC’s website at www.sec.gov and may be reviewed and copied at the SEC’s Public Reference Room in Washington, DC. (Call 1-800-SEC-0330 for information on the operation of the Public Reference Room.)
MSF-23
Simplify your life…
with MetLife eDelivery® while helping MetLife preserve the planet’s natural resources.
(see details on inside cover)
| | |
Metropolitan Series Fund, Inc. Jennison Growth Portfolio Annual Report | | December 31, 2008 |
NOT PART OF THE ANNUAL REPORT
Letter from the President
February 1, 2009
Letter to Policy Holders:
2008 was an extraordinary year in the capital markets around the world and for the global economy. Energy prices rose to record levels early in the year before falling by two-thirds by year-end. A credit crisis that began with concerns about sub-prime mortgages led to massive changes in the financial landscape with government takeovers, forced sales, and outright failures of a number of large, once venerable firms.
While bonds as measured by the Barclays Capital U.S. Aggregate Bond Index (formerly known as, Lehman Brothers U.S. Aggregate Bond Index) were up 5.2% for the year in response to declining interest rates, there were large differences in the total returns of the various sectors of the bond market. U.S. treasury securities were up over 13% as frightened investors sought refuge in what they perceived to be the safest and most liquid investments. In contrast, investment grade corporate securities lost nearly 5% as credit spreads widened and below investment grade or high yield bonds fell over 26%.
In response to the growing credit crisis and the weakening economy, common stocks fell sharply across all regions, styles, and capitalizations. As measured by the Standard and Poor’s 500, U.S. common stocks fell 37% for the year, the worst calendar year decline since the 1930s. Foreign stocks were down even more with the MSCI EAFE Index down 43% for the year.
On the following pages, you will find a complete review of your Portfolio and its investment performance.
MetLife is committed to building your financial freedom. We appreciate your trust and will continue to focus our efforts on meeting your investment needs.
Sincerely,
Elizabeth M. Forget
President, Metropolitan Series Fund, Inc.
Metropolitan Series Fund, Inc.
Jennison Growth Portfolio
Managed by Jennison Associates, LLC
Portfolio Manager Commentary*
PORTFOLIO PERFORMANCE
For the twelve-month period ended December 31, 2008, the Class A shares of the Jennison Growth Portfolio returned -36.4%, compared to its benchmark, the Russell 1000 Growth Index1, which returned -38.4%. The average return of its peer group, the Lipper Variable Insurance Products2 Large-Cap Growth Funds Universe, was -41.7% over the same period.
PORTFOLIO REVIEW
The fiscal year ended December 31, 2008, was a difficult time for virtually all equity styles and sectors. Problems in the subprime mortgage market spread throughout the financial system, creating a full-blown liquidity/credit crisis that roiled global markets. The third quarter of the year proved exceptionally tumultuous, culminating in an alarming series of events: the US government’s providing of credit assistance to Fannie Mae, Freddie Mac, and AIG; the failure of Lehman Brothers; the distressed sales of the commercial banking franchises of Washington Mutual and Wachovia; Bank of America’s acquisition of Merrill Lynch; and the conversion of investment banks, Goldman Sachs and Morgan Stanley, to commercial banks.
With an unprecedented level of coordination and cooperation, the U.S. Treasury Department and the Federal Reserve presided over efforts to resuscitate credit markets and stabilize the financial system, culminating in the creation of the $700 billion Troubled Asset Relief Program (TARP). Toward the end of the year, financial market liquidity conditions showed some improvement from the panicked conditions of the fall, but this did little to rekindle either borrowers’ demand for funds or lenders’ willingness to lend.
The ongoing correction in the housing market, debt deflation, rising unemployment, and sluggish production and consumption patterns increasingly pointed to the most severe recession in recent history, as the effects of the credit crisis worked through the real economy. Inflation worries dissipated, as commodity prices fell sharply. Crude oil closed the year at just under $45 per barrel, leading to a five-year low in U.S. gasoline prices. In an effort to stimulate growth, the Federal Open Market Committee lowered the fed funds rate over the year, from 4.25% to a record low 0.25%.
Corporations across the globe offered cautious outlooks for 2009. Significant cost-savings plans were announced, including both workforce reductions and capital-expenditure cuts. Completing the worst year since 1937, stock markets fell along with corporate bond prices, reflecting the difficult outlook and expectations of reduced solvency.
Growth stocks, as reflected by the Russell 1000 Growth benchmark’s 38.4% decline, underperformed the S&P 500, which fell 37.0%. Returns were negative in every sector of both indices, with declines in the growth benchmark exceeding 40% in financials, energy, materials, utilities, information technology, and telecommunication services. Losses in consumer staples, although substantial, were comparatively modest.
The Portfolio is built from the bottom up, with stocks selected one at a time, based on fundamental analysis of individual companies. An overweight position and stock selection in the health care sector contributed to positive relative performance, as Genentech, Gilead Sciences, and Roche posted gains. Genentech’s best-selling drug Avastin was approved by the Food and Drug Administration to treat breast cancer. Shares of the biotechnology leader got an additional boost when its majority shareholder, Roche, offered to acquire the remaining interest in the company it doesn’t already own at a premium to the prevailing market price. Biopharmaceutical company Gilead’s strong franchise in AIDS therapeutics and its Tamiflu royalty stream are funding the development of early pipeline products.
Security selection also contributed positively to relative return in materials, financials, and consumer discretionary.
Security selection detracted from return in the information technology sector, where Google, Apple, and Research in Motion declined. Google fell on worries that a slowing economy would curtail spending on online advertising. Apple came under pressure on signs that personal computer sales are slowing and on concerns that the market’s upper-end, which Apple’s Mac franchise dominates, is not immune. Research in Motion’s sales growth remained robust, but declining margins reflected increased concessions to carriers, start-up costs associated with new phone models, currency exchange headwinds, and higher component costs.
Stock-picking was also detrimental in industrials, where ABB and McDermott International fell. ABB, which provides power and automation technologies, had been benefiting from booming global end markets, technology-derived product differentiation, and leading market share. However, the financial crisis and global slowdown raised concerns that significant infrastructure investments would be curtailed and that falling commodity prices would weaken ABB’s pricing power. Global engineering and construction company McDermott International fell on weak oil and gas drilling results. We eliminated our positions in both companies in October.
* The views expressed above are those of the subadvisory firm as of December 31, 2008 and are subject to change based on market and other conditions. Information about the Portfolio’s holdings, asset allocation, industry allocation, or country diversification is historical and is not an indication of future Portfolio composition, which will vary. The performance of any index mentioned in this commentary has not been adjusted for ongoing management, distribution and operating expenses, and sales charges applicable to mutual fund investments. Direct investment in any index is not possible.
1 The Russell 1000® Growth Index is an unmanaged measure of performance of the largest capitalized U.S. companies, within the Russell 1000 companies, that have higher price-to-book ratios and forecasted growth values.
2 The Lipper Variable Products Fund Average is an average of the total return performance (calculated on the basis of net asset value) of variable product funds with similar investment objectives to those of the subject Portfolio as calculated by Lipper Analytical Services, an independent mutual fund ranking service.
MSF-2
Metropolitan Series Fund, Inc.
Jennison Growth Portfolio
A $10,000 INVESTMENT COMPARED TO THE
RUSSELL 1000 GROWTH INDEX
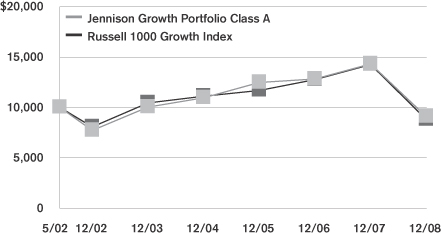
Average Annual Returns as of December 31, 2008
| | | | | | | | | | | | |
| | | Jennison Growth Portfolio | | | Russell 1000 Growth Index | |
| | | Class A | | | Class B | | | Class E | | |
| 1 Year | | -36.4 | % | | -36.5 | % | | -36.6 | % | | -38.4 | % |
| 5 Year | | -1.9 | | | -2.2 | | | — | | | -3.4 | |
| Since Inception | | -1.4 | | | -1.7 | | | -3.3 | | | -1.9 | |
Performance numbers are net of all Portfolio expenses but do not include any insurance, sales, or administrative charges of variable
annuity or life insurance contracts or any additional expenses that participants in certain eligible qualified plans may bear relating to the operations of their plans. If these charges were included, the returns would be lower.
Inception dates of the Class A, Class B and Class E shares are: 5/1/02, 5/1/02 and 4/27/05, respectively. Index since inception return is based on the Class A inception date.
This information represents past performance and is not indicative of future results. Investment return and principal value may fluctuate so that shares, upon redemption, may be worth more or less than the original cost.
PORTFOLIO COMPOSITION
as of December 31, 2008
Top Holdings
| | |
| | | % of Total
Net Assets |
Gilead Sciences, Inc. | | 6.6% |
Google, Inc. (Class A) | | 4.3% |
Genentech, Inc. | | 4.2% |
Wal-Mart Stores, Inc. | | 3.8% |
Abbott Laboratories | | 3.6% |
QUALCOMM, Inc. | | 3.6% |
Cisco Systems, Inc. | | 3.3% |
Baxter International, Inc. | | 3.3% |
Colgate-Palmolive Co. | | 3.2% |
Hewlett-Packard Co. | | 3.0% |
Top Sectors
| | |
| | | % of Equity
Market Value |
Health Care | | 35.3% |
Information Technology | | 27.7% |
Consumer Staples | | 16.1% |
Consumer Discretionary | | 6.8% |
Energy | | 4.9% |
Industrials | | 3.7% |
Financials | | 3.0% |
Materials | | 2.5% |
MSF-3
Metropolitan Series Fund, Inc.
Shareholder Expense Example
As a shareholder of the Portfolio, you incur ongoing costs, including management fees; distribution and service (12b-1) fees; and other Portfolio expenses. This example is intended to help you understand your ongoing costs (in dollars) (referred to as “expenses”) of investing in the Portfolio and compare these costs with the ongoing costs of investing in other mutual funds. The example is based on an investment of $1,000 invested at the beginning of the period and held for the entire period, July 1, 2008 through December 31, 2008.
Actual Expenses
The first line for each share class of the Portfolio in the table below provides information about actual account values and actual expenses. You may use the information in this line, together with the amount you invested in the particular share class of the Portfolio, to estimate the expenses that you paid over the period. Simply divide your account value by $1,000 (for example, an $8,600 account value divided by $1,000=8.6), then multiply the result by the number in the first line under the heading entitled “Expenses Paid During Period” to estimate the expenses you paid on your account during this period.
Hypothetical Example for Comparison Purposes
The second line for each share class of the Portfolio in the table below provides information about hypothetical account values and hypothetical expenses based on the Portfolio’s actual expense ratio and an assumed rate of return of 5% per year before expenses, which is not the Portfolio’s actual return. The hypothetical account values and expenses may not be used to estimate the actual ending account balance or expenses you paid for the period. You may use this information to compare the ongoing costs of investing in the Portfolio and other funds. To do so, compare this 5% hypothetical example with the 5% hypothetical examples that appear in the shareholder reports of the other funds.
Please note that the expenses shown in the table are meant to highlight your ongoing costs only and do not reflect any fees or charges of your variable insurance product or any additional expenses that participants in certain eligible qualified plans may bear relating to the operations of their plan. Therefore, the second line for each share class in the table is useful in comparing ongoing costs only, and will not help you determine the relative total costs of owning different funds. In addition, if these other costs were included, your costs would have been higher.
| | | | | | | | | | | | | | |
Portfolio | | | | Annualized
Expense
Ratio | | | Beginning
Account Value
July 1,
2008 | | Ending
Account Value
December 31,
2008 | | Expenses Paid
During Period*
July 1, 2008
to
December 31,
2008 |
Jennison Growth—Class A | | Actual | | 0.68 | % | | $ | 1,000.00 | | $ | 694.84 | | $ | 2.90 |
| | Hypothetical | | 0.68 | % | | $ | 1,000.00 | | $ | 1,021.68 | | $ | 3.46 |
| | | | | |
Jennison Growth—Class B | | Actual | | 0.93 | % | | $ | 1,000.00 | | $ | 694.10 | | $ | 3.96 |
| | Hypothetical | | 0.93 | % | | $ | 1,000.00 | | $ | 1,020.41 | | $ | 4.72 |
| | | | | |
Jennison Growth—Class E | | Actual | | 0.83 | % | | $ | 1,000.00 | | $ | 694.02 | | $ | 3.53 |
| | Hypothetical | | 0.83 | % | | $ | 1,000.00 | | $ | 1,020.91 | | $ | 4.22 |
* Expenses paid are equal to the Portfolio's annualized expense ratio for the most recent six month period, as shown above, multiplied by the average account value over the period, multiplied by the number of days in the most recent fiscal half-year, divided by 366 (to reflect the the one-half year period).
MSF-4
Metropolitan Series Fund, Inc.
Jennison Growth Portfolio
Schedule of Investments as of December 31, 2008
Common Stock—97.1% of Total Net Assets
| | | | | |
| Security Description | | Shares | | Value* |
| | | | | |
| | |
Aerospace & Defense—3.2% | | | | | |
Lockheed Martin Corp. | | 178,900 | | $ | 15,041,912 |
Raytheon Co. | | 272,300 | | | 13,898,192 |
| | | | | |
| | | | | 28,940,104 |
| | | | | |
| | |
Beverages—3.8% | | | | | |
PepsiCo, Inc. | | 328,600 | | | 17,997,422 |
The Coca-Cola Co. | | 353,500 | | | 16,002,945 |
| | | | | |
| | | | | 34,000,367 |
| | | | | |
| | |
Biotechnology—13.8% | | | | | |
Celgene Corp. (a) | | 382,300 | | | 21,133,544 |
Genentech, Inc. (a) | | 460,900 | | | 38,213,219 |
Genzyme Corp. (a) | | 92,700 | | | 6,152,499 |
Gilead Sciences, Inc. (a) (b) | | 1,160,000 | | | 59,322,400 |
| | | | | |
| | | | | 124,821,662 |
| | | | | |
| | |
Capital Markets—3.0% | | | | | |
Lazard, Ltd. | | 26,750 | | | 795,545 |
The Charles Schwab Corp. (b) | | 1,273,000 | | | 20,584,410 |
The Goldman Sachs Group, Inc. | | 64,400 | | | 5,434,716 |
| | | | | |
| | | | | 26,814,671 |
| | | | | |
| | |
Chemicals—2.4% | | | | | |
Monsanto Co. | | 310,300 | | | 21,829,605 |
| | | | | |
| | |
Communications Equipment—8.7% | | | | | |
Cisco Systems, Inc. (a) | | 1,829,800 | | | 29,825,740 |
QUALCOMM, Inc. | | 898,000 | | | 32,175,340 |
Research In Motion, Ltd. (a) | | 411,100 | | | 16,682,438 |
| | | | | |
| | | | | 78,683,518 |
| | | | | |
| | |
Computers & Peripherals—6.5% | | | | | |
Apple, Inc. (a) | | 236,935 | | | 20,222,402 |
Hewlett-Packard Co. | | 758,400 | | | 27,522,336 |
International Business Machines Corp. | | 127,000 | | | 10,688,320 |
| | | | | |
| | | | | 58,433,058 |
| | | | | |
| | |
Energy Equipment & Services—2.3% | | | | | |
Schlumberger, Ltd. | | 484,900 | | | 20,525,817 |
| | | | | |
| | |
Food & Staples Retailing—8.1% | | | | | |
Costco Wholesale Corp. | | 481,500 | | | 25,278,750 |
CVS Caremark Corp. | | 498,400 | | | 14,324,016 |
Wal-Mart Stores, Inc. | | 604,800 | | | 33,905,088 |
| | | | | |
| | | | | 73,507,854 |
| | | | | |
| | |
Food Products—0.5% | | | | | |
Cadbury, Plc. (ADR) | | 120,100 | | | 4,283,967 |
| | | | | |
| | |
Health Care Equipment & Supplies—5.8% | | | | | |
Alcon, Inc. | | 256,100 | | | 22,841,559 |
Baxter International, Inc. | | 549,500 | | | 29,447,705 |
| | | | | |
| | | | | 52,289,264 |
| | | | | |
| | | | | |
| Security Description | | Shares | | Value* |
| | | | | |
| | |
Health Care Providers & Services—2.1% | | | | | |
Medco Health Solutions, Inc. (a) | | 454,900 | | $ | 19,064,859 |
| | | | | |
| | |
Hotels, Restaurants & Leisure—0.4% | | | | | |
Marriott International, Inc. (b) | | 178,800 | | | 3,477,660 |
| | | | | |
| | |
Household Products—3.2% | | | | | |
Colgate-Palmolive Co. | | 427,400 | | | 29,293,996 |
| | | | | |
| | |
Internet & Catalog Retail—2.8% | | | | | |
Amazon.com, Inc. (a) (b) | | 486,900 | | | 24,968,232 |
| | | | | |
| | |
Internet Software & Services—4.3% | | | | | |
Google, Inc. (Class A) (a) | | 125,100 | | | 38,487,015 |
| | | | | |
| | |
IT Services—2.6% | | | | | |
Visa, Inc. (b) | | 452,800 | | | 23,749,360 |
| | | | | |
| | |
Life Sciences Tools & Services—1.8% | | | | | |
Thermo Fisher Scientific, Inc. (a) | | 474,600 | | | 16,169,622 |
| | | | | |
| | |
Media—1.9% | | | | | |
The Walt Disney Co. | | 742,200 | | | 16,840,518 |
| | | | | |
| | |
Oil, Gas & Consumable Fuels—2.5% | | | | | |
Occidental Petroleum Corp. | | 93,700 | | | 5,621,063 |
Southwestern Energy Co. (a) | | 349,600 | | | 10,127,912 |
XTO Energy, Inc. | | 193,100 | | | 6,810,637 |
| | | | | |
| | | | | 22,559,612 |
| | | | | |
| | |
Pharmaceuticals—10.7% | | | | | |
Abbott Laboratories | | 605,400 | | | 32,310,198 |
Mylan, Inc. (a) (b) | | 521,000 | | | 5,152,690 |
Roche Holding AG (ADR) | | 75,100 | | | 5,748,905 |
Shire, Plc. (ADR) | | 210,730 | | | 9,436,490 |
Teva Pharmaceutical Industries, Ltd. (ADR) (b) | | 619,800 | | | 26,384,886 |
Wyeth | | 483,600 | | | 18,139,836 |
| | | | | |
| | | | | 97,173,005 |
| | | | | |
| | |
Road & Rail—0.4% | | | | | |
Union Pacific Corp. (b) | | 74,600 | | | 3,565,880 |
| | | | | |
|
Semiconductors & Semiconductor Equipment—0.3% |
NVIDIA Corp. (a) | | 364,400 | | | 2,940,708 |
| | | | | |
| | |
Software—4.5% | | | | | |
Adobe Systems, Inc. (a) | | 758,800 | | | 16,154,852 |
Microsoft Corp. | | 782,400 | | | 15,209,856 |
Oracle Corp. (a) (b) | | 517,600 | | | 9,177,048 |
| | | | | |
| | | | | 40,541,756 |
| | | | | |
|
Textiles, Apparel & Luxury Goods—1.5% |
Nike, Inc. (b) | | 276,200 | | | 14,086,200 |
| | | | | |
Total Common Stock
(Identified Cost $1,061,313,947) | | | | | 877,048,310 |
| | | | | |
*See accompanying notes to financial statements.
MSF-5
Metropolitan Series Fund, Inc.
Jennison Growth Portfolio
Schedule of Investments as of December 31, 2008
Short Term Investments—7.9%
| | | | | | | |
| Security Description | | Shares/Face
Amount | | Value* | |
| | |
Mutual Funds—4.5% | | | | | | | |
State Street Navigator Securities Lending Prime Portfolio Prime Portfolio (c) | | | 41,230,327 | | $ | 41,230,327 | |
| | | | | | | |
| | |
Repurchase Agreement—3.4% | | | | | | | |
State Street Repurchase Agreement dated 12/31/08 at 0.010% to be repurchased at $30,517,017 on 01/02/09, collateralized by $31,130,000 U.S. Treasury Bill due 02/12/09 with a value of
$31,130,000. | | $ | 30,517,000 | | | 30,517,000 | |
| | | | | | | |
Total Short Term Investments
(Identified Cost $71,747,327) | | | | | | 71,747,327 | |
| | | | | | | |
Total Investments—105.0%
(Identified Cost $1,133,061,274) (d) | | | | | | 948,795,637 | |
Liabilities in excess of other assets | | | | | | (45,104,173 | ) |
| | | | | | | |
| Total Net Assets—100% | | | | | $ | 903,691,464 | |
| | | | | | | |
| (b) | A portion or all of the security was on loan. As of December 31, 2008, the market value of securities loaned was $40,790,653 and the collateral received consisted of cash in the amount of $41,230,327. The cash collateral is invested in a money market fund managed by an affiliate of the custodian. |
| (c) | Represents investment of cash collateral received from securities lending transactions. |
| (d) | The aggregate cost of investments for federal income tax purposes as of December 31, 2008 was $1,143,566,513 and the composition of unrealized appreciation and depreciation of investment securities was $24,846,536 and $(219,617,412), respectively. |
| (ADR)— | An American Depositary Receipt is a certificate issued by a custodian bank representing the right to receive securities of the foreign issuer described. Trading on exchanges not located in the United States or Canada significantly influences the value of ADRs. |
The Portfolio adopted the provisions of Statement of Financial Accounting Standards No. 157, “Fair Value Measurements” (FAS 157), effective with the beginning of the Portfolio’s fiscal year. FAS 157 establishes a framework for measuring fair value and expands disclosures about fair value measurements in financial statements. The three levels of the hierarchy under FAS 157 are described below:
Level 1 - quoted prices in active markets for identical securities
Level 2 - other significant observable inputs (including quoted prices for similar securities, interest rates, credit risk, etc.)
Level 3 - significant unobservable inputs (including the Portfolio’s own assumptions in determining the fair value of investments)
The inputs or methodology used for valuing securities are not necessarily an indication of the risk associated with investing in those securities.
The following is a summary of the inputs used to value the Portfolio’s net assets as of December 31, 2008:
| | | | | | |
| Valuation Inputs | | Investments In
Securities | | Other Financial
Instruments* |
Level 1 - Quoted Prices | | $ | 918,278,637 | | $ | 0 |
Level 2 - Other Significant Observable Inputs | | | 30,517,000 | | | 0 |
Level 3 - Significant Unobservable Inputs | | | 0 | | | 0 |
Total | | $ | 948,795,637 | | $ | 0 |
* Other financial instruments are derivative instruments not reflected in the Schedule of Investments, such as futures, forwards, swap contracts and written options, which are valued based on the unrealized appreciation/depreciation on the instrument.
*See accompanying notes to financial statements.
MSF-6
Metropolitan Series Fund, Inc.
Jennison Growth Portfolio
Statement of Assets & Liabilities
December 31, 2008
| | | | | | | |
Assets | | | | | | | |
Investments at value (a) (b) | | | | | $ | 948,795,637 | |
Cash | | | | | | 786 | |
Receivable for: | | | | | | | |
Securities sold | | | | | | 1,500 | |
Fund shares sold | | | | | | 434,798 | |
Accrued interest and dividends | | | | | | 1,225,510 | |
Foreign taxes | | | | | | 7,569 | |
| | | | | | | |
Total Assets | | | | | | 950,465,800 | |
Liabilities | | | | | | | |
Payable for: | | | | | | | |
Securities purchased | | $ | 4,631,380 | | | | |
Fund shares redeemed | | | 353,732 | | | | |
Collateral for securities loaned | | | 41,230,327 | | | | |
Accrued expenses: | | | | | | | |
Management fees | | | 475,974 | | | | |
Service and distribution fees | | | 46,923 | | | | |
Deferred directors' fees | | | 2,126 | | | | |
Other expenses | | | 33,874 | | | | |
| | | | | | | |
Total Liabilities | | | | | | 46,774,336 | |
| | | | | | | |
Net Assets | | | | | $ | 903,691,464 | |
| | | | | | | |
Net assets consists of: | | | | | | | |
Capital paid in | | | | | $ | 1,223,195,631 | |
Undistributed net investment income | | | | | | 1,309,831 | |
Accumulated net realized losses | | | | | | (136,548,361 | ) |
Unrealized depreciation on investments | | | | | | (184,265,637 | ) |
| | | | | | | |
Net Assets | | | | | $ | 903,691,464 | |
| | | | | | | |
| Computation of offering price: | | | | | | | |
Class A | | | | | | | |
Net asset value and redemption price per share ($673,249,159 divided by 86,207,176 shares outstanding) | | | | | $ | 7.81 | |
| | | | | | | |
Class B | | | | | | | |
Net asset value and redemption price per share ($224,096,383 divided by 28,896,219 shares outstanding) | | | | | $ | 7.76 | |
| | | | | | | |
Class E | | | | | | | |
Net asset value and redemption price per share ($6,345,922 divided by 815,262 shares outstanding) | | | | | $ | 7.78 | |
| | | | | | | |
(a) Identified cost of investments | | | | | $ | 1,133,061,274 | |
| | | | | | | |
(b) Includes cash collateral for securities loaned of | | | | | $ | 41,230,327 | |
| | | | | | | |
Statement of Operations
For the Year Ended December 31, 2008
| | | | | | | | |
Investment Income | | | | | | | | |
Dividends | | | | | | $ | 12,572,679 | (a) |
Interest | | | | | | | 837,212 | (b) |
| | | | | | | | |
| | | | | | | 13,409,891 | |
Expenses | | | | | | | | |
Management fees | | $ | 7,527,936 | | | | | |
Service and distribution fees—Class B | | | 718,976 | | | | | |
Service and distribution fees—Class E | | | 14,104 | | | | | |
Directors' fees and expenses | | | 30,689 | | | | | |
Custodian | | | 93,029 | | | | | |
Audit and tax services | | | 36,941 | | | | | |
Legal | | | 20,654 | | | | | |
Printing | | | 309,472 | | | | | |
Insurance | | | 15,484 | | | | | |
Miscellaneous | | | 20,565 | | | | | |
| | | | | | | | |
Total expenses | | | 8,787,850 | | | | | |
Expense reductions | | | (220,718 | ) | | | 8,567,132 | |
| | | | | | | | |
Net Investment Income | | | | | | | 4,842,759 | |
| | | | | | | | |
Realized and Unrealized Loss | | | | | | | | |
| Realized loss on: | | | | | | | | |
Investments—net | | | (119,363,182 | ) | | | | |
Futures contracts—net | | | (219,722 | ) | | | (119,582,904 | ) |
| | | | | | | | |
| Change in unrealized depreciation on: | | | | | | | | |
Investments—net | | | | | | | (398,261,690 | ) |
| | | | | | | | |
Net loss | | | | | | | (517,844,594 | ) |
| | | | | | | | |
Net Decrease in Net Assets From Operations | | | | | | $ | (513,001,835 | ) |
| | | | | | | | |
| (a) | Net of foreign taxes of $299,666. |
| (b) | Includes income on securities loaned of $511,887. |
See accompanying notes to financial statements.
MSF-7
Metropolitan Series Fund, Inc.
Jennison Growth Portfolio
Statements of Changes in Net Assets
| | | | | | | | |
| | | Year ended
December 31,
2008 | | | Year ended
December 31,
2007 | |
From Operations | | | | | | | | |
Net investment income | | $ | 4,842,759 | | | $ | 4,835,468 | |
Net realized gain (loss) | | | (119,582,904 | ) | | | 104,561,146 | |
Change in unrealized appreciation (depreciation) | | | (398,261,690 | ) | | | 31,562,822 | |
| | | | | | | | |
Increase (decrease) in net assets from operations | | | (513,001,835 | ) | | | 140,959,436 | |
| | | | | | | | |
From Distributions to Shareholders | | | | | | | | |
Net investment income | | | | | | | | |
Class A | | | (22,004,028 | ) | | | (4,884,260 | ) |
Class B | | | (5,331,361 | ) | | | (553,650 | ) |
Class E | | | (219,575 | ) | | | (36,590 | ) |
| | | | | | | | |
| | | (27,554,964 | ) | | | (5,474,500 | ) |
| | | | | | | | |
Net realized gain | | | | | | | | |
Class A | | | (75,878,659 | ) | | | (40,959,234 | ) |
Class B | | | (20,831,004 | ) | | | (10,585,783 | ) |
Class E | | | (815,204 | ) | | | (460,264 | ) |
| | | | | | | | |
| | | (97,524,867 | ) | | | (52,005,281 | ) |
| | | | | | | | |
Total distributions | | | (125,079,831 | ) | | | (57,479,781 | ) |
| | | | | | | | |
Increase (decrease) in net assets from capital share transactions | | | 219,445,501 | | | | (86,492,553 | ) |
| | | | | | | | |
Net decrease in net assets | | | (418,636,165 | ) | | | (3,012,898 | ) |
| | |
Net Assets | | | | | | | | |
Beginning of the period | | | 1,322,327,629 | | | | 1,325,340,527 | |
| | | | | | | | |
End of the period | | $ | 903,691,464 | | | $ | 1,322,327,629 | |
| | | | | | | | |
Undistributed Net Investment Income | | | | | | | | |
End of the period | | $ | 1,309,831 | | | $ | 7,671,258 | |
| | | | | | | | |
Other Information:
Capital Shares
Transactions in capital shares were as follows:
| | | | | | | | | | | | | | |
| | | Year ended
December 31, 2008 | | | Year ended
December 31, 2007 | |
| | | Shares | | | $ | | | Shares | | | $ | |
Class A | | | | | | | | | | | | | | |
Sales | | 19,940,873 | | | $ | 218,338,782 | | | 24,553,315 | | | $ | 320,738,335 | |
Reinvestments | | 8,511,538 | | | | 97,882,687 | | | 3,609,724 | | | | 45,843,494 | |
Redemptions | | (16,865,960 | ) | | | (181,772,692 | ) | | (33,189,050 | ) | | | (425,024,047 | ) |
| | | | | | | | | | | | | | |
Net increase (decrease) | | 11,586,451 | | | $ | 134,448,777 | | | (5,026,011 | ) | | $ | (58,442,218 | ) |
| | | | | | | | | | | | | | |
Class B | | | | | | | | | | | | | | |
Sales | | 11,665,165 | | | $ | 131,101,797 | | | 3,811,957 | | | $ | 49,898,866 | |
Reinvestments | | 2,286,920 | | | | 26,162,365 | | | 881,284 | | | | 11,139,433 | |
Redemptions | | (6,772,010 | ) | | | (71,383,763 | ) | | (6,734,065 | ) | | | (87,424,644 | ) |
| | | | | | | | | | | | | | |
Net increase (decrease) | | 7,180,075 | | | $ | 85,880,399 | | | (2,040,824 | ) | | $ | (26,386,345 | ) |
| | | | | | | | | | | | | | |
Class E | | | | | | | | | | | | | | |
Sales | | 138,957 | | | $ | 1,438,235 | | | 138,345 | | | $ | 1,794,703 | |
Reinvestments | | 90,137 | | | | 1,034,779 | | | 39,184 | | | | 496,854 | |
Redemptions | | (320,418 | ) | | | (3,356,689 | ) | | (304,173 | ) | | | (3,955,547 | ) |
| | | | | | | | | | | | | | |
Net decrease | | (91,324 | ) | | $ | (883,675 | ) | | (126,644 | ) | | $ | (1,663,990 | ) |
| | | | | | | | | | | | | | |
Increase (decrease) derived from capital share transactions | | | | | $ | 219,445,501 | | | | | | $ | (86,492,553 | ) |
| | | | | | | | | | | | | | |
See accompanying notes to financial statements.
MSF-8
Metropolitan Series Fund, Inc.
Jennison Growth Portfolio
Financial Highlights
| | | | | | | | | | | | | | | | | | | | |
| | | Class A | |
| | | Year ended December 31, | |
| | | 2008 | | | 2007 | | | 2006 | | | 2005 | | | 2004 | |
Net Asset Value, Beginning of Period | | $ | 13.62 | | | $ | 12.71 | | | $ | 12.38 | | | $ | 10.92 | | | $ | 10.01 | |
| | | | | | | | | | | | | | | | | | | | |
Income From Investment Operations | | | | | | | | | | | | | | | | | | | | |
Net investment income | | | 0.05 | (a) | | | 0.06 | (a) | | | 0.03 | | | | 0.00 | | | | 0.03 | |
Net realized and unrealized gain (loss) of investments | | | (4.61 | ) | | | 1.39 | | | | 0.31 | | | | 1.51 | | | | 0.89 | |
| | | | | | | | | | | | | | | | | | | | |
Total from investment operations | | | (4.56 | ) | | | 1.45 | | | | 0.34 | | | | 1.51 | | | | 0.92 | |
| | | | | | | | | | | | | | | | | | | | |
Less Distributions | | | | | | | | | | | | | | | | | | | | |
Distributions from net investment income | | | (0.28 | ) | | | (0.06 | ) | | | 0.00 | | | | (0.05 | ) | | | (0.01 | ) |
Distributions from net realized capital gains | | | (0.97 | ) | | | (0.48 | ) | | | (0.01 | ) | | | 0.00 | | | | 0.00 | |
| | | | | | | | | | | | | | | | | | | | |
Total distributions | | | (1.25 | ) | | | (0.54 | ) | | | (0.01 | ) | | | (0.05 | ) | | | (0.01 | ) |
| | | | | | | | | | | | | | | | | | | | |
Net Asset Value, End of Period | | $ | 7.81 | | | $ | 13.62 | | | $ | 12.71 | | | $ | 12.38 | | | $ | 10.92 | |
| | | | | | | | | | | | | | | | | | | | |
Total Return (%) | | | (36.4 | ) | | | 11.7 | | | | 2.8 | | | | 13.9 | | | | 9.2 | |
Ratio of operating expenses to average net assets before expense reductions (%) | | | 0.67 | | | | 0.67 | | | | 0.69 | | | | 0.69 | | | | 0.71 | |
Ratio of operating expenses to average net assets after expense reductions (%) (b) | | | 0.65 | | | | 0.66 | | | | 0.67 | | | | 0.68 | | | | 0.69 | |
Ratio of net investment income to average net assets (%) | | | 0.47 | | | | 0.44 | | | | 0.31 | | | | 0.04 | | | | 0.41 | |
Portfolio turnover rate (%) | | | 78 | | | | 71 | | | | 66 | | | | 60 | | | | 68 | |
Net assets, end of period (000) | | $ | 673,249 | | | $ | 1,016,212 | | | $ | 1,012,196 | | | $ | 758,316 | | | $ | 504,940 | |
| | | | | | | | | | | | | | | | | | | |
| | | Class B |
| | | Year ended December 31, |
| | | 2008 | | | 2007 | | | 2006 | | | 2005 | | | 2004 |
Net Asset Value, Beginning of Period | | $ | 13.53 | | | $ | 12.63 | | | $ | 12.33 | | | $ | 10.86 | | | $ | 9.97 |
| | | | | | | | | | | | | | | | | | | |
Income From Investment Operations | | | | | | | | | | | | | | | | | | | |
Net investment income (loss) | | | 0.02 | (a) | | | 0.02 | (a) | | | 0.01 | | | | (0.02 | ) | | | 0.04 |
Net realized and unrealized gain (loss) of investments | | | (4.57 | ) | | | 1.39 | | | | 0.30 | | | | 1.49 | | | | 0.85 |
| | | | | | | | | | | | | | | | | | | |
Total from investment operations | | | (4.55 | ) | | | 1.41 | | | | 0.31 | | | | 1.47 | | | | 0.89 |
| | | | | | | | | | | | | | | | | | | |
Less Distributions | | | | | | | | | | | | | | | | | | | |
Distributions from net investment income | | | (0.25 | ) | | | (0.03 | ) | | | 0.00 | | | | 0.00 | | | | 0.00 |
Distributions from net realized capital gains | | | (0.97 | ) | | | (0.48 | ) | | | (0.01 | ) | | | 0.00 | | | | 0.00 |
| | | | | | | | | | | | | | | | | | | |
Total distributions | | | (1.22 | ) | | | (0.51 | ) | | | (0.01 | ) | | | 0.00 | | | | 0.00 |
| | | | | | | | | | | | | | | | | | | |
Net Asset Value, End of Period | | $ | 7.76 | | | $ | 13.53 | | | $ | 12.63 | | | $ | 12.33 | | | $ | 10.86 |
| | | | | | | | | | | | | | | | | | | |
Total Return (%) | | | (36.5 | ) | | | 11.4 | | | | 2.5 | | | | 13.5 | | | | 8.9 |
Ratio of operating expenses to average net assets before expense reductions (%) | | | 0.92 | | | | 0.92 | | | | 0.94 | | | | 0.94 | | | | 0.96 |
Ratio of operating expenses to average net assets after expense reductions (%) (b) | | | 0.90 | | | | 0.91 | | | | 0.92 | | | | 0.93 | | | | 0.94 |
Ratio of net investment income (loss) to average net assets (%) | | | 0.22 | | | | 0.18 | | | | 0.06 | | | | (0.21 | ) | | | 0.29 |
Portfolio turnover rate (%) | | | 78 | | | | 71 | | | | 66 | | | | 60 | | | | 68 |
Net assets, end of period (000) | | $ | 224,096 | | | $ | 293,808 | | | $ | 300,052 | | | $ | 296,178 | | | $ | 330,349 |
| Please | see following page for Financial Highlights footnote legend. |
See accompanying notes to financial statements.
MSF-9
Metropolitan Series Fund, Inc.
Jennison Growth Portfolio
Financial Highlights
| | | | | | | | | | | | | | | | |
| | | Class E | |
| | | Year ended December 31, | |
| | | 2008 | | | 2007 | | | 2006 | | | 2005(C) | |
Net Asset Value, Beginning of Period | | $ | 13.58 | | | $ | 12.67 | | | $ | 12.36 | | | $ | 10.16 | |
| | | | | | | | | | | | | | | | |
Income From Investment Operations | | | | | | | | | | | | | | | | |
Net investment income (loss) | | | 0.03 | (a) | | | 0.04 | (a) | | | 0.02 | | | | (0.01 | ) |
Net realized and unrealized gain (loss) of investments | | | (4.60 | ) | | | 1.39 | | | | 0.30 | | | | 2.21 | |
| | | | | | | | | | | | | | | | |
Total from investment operations | | | (4.57 | ) | | | 1.43 | | | | 0.32 | | | | 2.20 | |
| | | | | | | | | | | | | | | | |
Less Distributions | | | | | | | | | | | | | | | | |
Distributions from net investment income | | | (0.26 | ) | | | (0.04 | ) | | | 0.00 | | | | 0.00 | |
Distributions from net realized capital gains | | | (0.97 | ) | | | (0.48 | ) | | | (0.01 | ) | | | 0.00 | |
| | | | | | | | | | | | | | | | |
Total distributions | | | (1.23 | ) | | | (0.52 | ) | | | (0.01 | ) | | | 0.00 | |
| | | | | | | | | | | | | | | | |
Net Asset Value, End of Period | | $ | 7.78 | | | $ | 13.58 | | | $ | 12.67 | | | $ | 12.36 | |
| | | | | | | | | | | | | | | | |
Total Return (%) | | | (36.6 | ) | | | 11.5 | | | | 2.6 | | | | 3.0 | (d) |
Ratio of operating expenses to average net assets before expense reductions (%) | | | 0.82 | | | | 0.82 | | | | 0.84 | | | | 0.84 | (e) |
Ratio of operating expenses to average net assets after expense reductions (%) (b) | | | 0.80 | | | | 0.81 | | | | 0.82 | | | | 0.82 | (e) |
Ratio of net investment income (loss) to average net assets (%) | | | 0.31 | | | | 0.28 | | | | 0.24 | | | | (0.15 | )(e) |
Portfolio turnover rate (%) | | | 78 | | | | 71 | | | | 66 | | | | 60 | |
Net assets, end of period (000) | | $ | 6,346 | | | $ | 12,308 | | | $ | 13,093 | | | $ | 12,758 | |
| (a) | Per share amount is based on average shares outstanding during the period. |
| (b) | The Portfolio has entered into arrangements with certain brokers who paid a portion of the Portfolio's expenses. |
| (c) | Commencement of operations was April 27, 2005. |
| (d) | Periods less than one year are not computed on an annualized basis. |
| (e) | Computed on an annualized basis. |
See accompanying notes to financial statements.
MSF-10
Metropolitan Series Fund, Inc.
Jennison Growth Portfolio
Notes to Financial Statements—December 31, 2008
Metropolitan Series Fund, Inc. (the “Fund”) is organized as a corporation under the laws of Maryland pursuant to Articles of Incorporation filed on November 23, 1982, as amended, and registered under the Investment Company Act of 1940, as amended (the “1940 Act”), as an open-end investment company. The Fund is a “series” type of mutual fund, which issues separate series of stock. Each series represents an interest in a separate portfolio of Fund investments. The Jennison Growth Portfolio (the “Portfolio”) is a diversified series of the Fund. Shares in the Fund are not offered directly to the general public and are currently available only to separate accounts established by Metropolitan Life Insurance Company (“MetLife”), New England Life Insurance Company, General American Life Insurance Company (“General American”), The MetLife Investors Group of Insurance Companies, MetLife Insurance Company of Connecticut and other affiliated insurance companies (collectively, the “Insurance Companies”) and to certain eligible qualified retirement plans (“Qualified Plans”), as an investment vehicle for variable life insurance, group annuity or variable annuity products of these insurance companies or Qualified Plans, although the Portfolio is not available to all such separate accounts and Qualified Plans. The Portfolio’s shares may be divided into different classes. Currently, the classes being offered by the Portfolio are named Class A, Class B and Class E. The classes of the Portfolio’s shares are identical, except that certain additional charges (Rule 12b-1 fees) are made against Class B and Class E shares. Investment income, realized and unrealized capital gains and losses, the common expenses of the Portfolio and certain Portfolio-level expense reductions, if any, are allocated daily, on a pro rata basis, to each class based on the relative net assets of each class to the total net assets of the Portfolio.
| 2. | SIGNIFICANT ACCOUNTING POLICIES: |
The preparation of financial statements in conformity with accounting principles generally accepted in the United States of America (“GAAP”) requires management to make estimates and assumptions that affect the reported amounts of assets and liabilities and disclosure of contingent assets and liabilities as of the date of the financial statements and the reported amounts of income and expenses during the reporting period. Actual results could differ from those estimates.
The following is a summary of significant accounting policies consistently followed by the Portfolio in the preparation of its financial statements. The policies are in conformity with GAAP.
Investment Valuation:
Debt securities (other than short term obligations with a remaining maturity of sixty days or less) are generally valued on the basis of evaluated or composite bid quotations obtained by independent pricing services and/or brokers and dealers selected by the relevant subadviser pursuant to authorization of the Board of Directors of the Fund (the “Board” or “Directors”). Such quotations take into account appropriate factors such as institutional-sized trading in similar groups of securities, yield, quality, coupon rate, maturity, type of issue, trading characteristics and other data. Short term obligations with a remaining maturity of sixty days or less are valued at amortized cost which approximates fair market value.
Equity securities traded on a national securities exchange or other exchanges are valued at their last sale price on the principal trading market. Equity securities traded on the NASDAQ National Market System are valued at the NASDAQ Official Closing Price (the “NOCP”). The NOCP is the last reported sale price if the last reported sale price falls between the spread of the last reported bid and asked prices. If the last reported bid and asked prices are above the last reported sale price, the NOCP will be the last reported bid price. If the last reported bid and asked prices are below the last reported sale price, the NOCP will be the last reported asked price. Equity securities traded on a national securities exchange or other exchanges or on the NASDAQ National Market System for which there is no reported sale during the day are valued at the last reported bid price. A security that is listed or traded on more than one exchange is valued at the quotation on the exchange determined to be the primary market for that security by the Board or its delegates. If no closing price is available, then such securities are valued by using the last reported bid price. Equity securities traded over-the-counter are valued at the last reported sales price.
If no current market value quotation is readily available or reliable for a portfolio security, fair value will be determined in accordance with procedures established by and under the general supervision of the Board. When the Portfolio uses fair value pricing, it may take into account any factors it deems appropriate. The value of securities used by the Portfolio to calculate its net asset value may differ from quoted or published prices for the same securities. Fair value pricing involves subjective judgments and the fair value determined for a security may be materially different than the value that could be realized upon the sale of that security.
The Portfolio expects to use fair value pricing for securities primarily traded on U.S. exchanges only under very limited circumstances. For example, the Portfolio may use fair value pricing if the exchange on which a security is traded closes early or trading in the security is suspended.
MSF-11
Metropolitan Series Fund, Inc.
Jennison Growth Portfolio
Notes to Financial Statements—December 31, 2008—(Continued)
Securities traded primarily on an exchange outside of the United States which closes before the close of the New York Stock Exchange will be valued at the last sales price on that non-U.S. exchange. Securities traded primarily on an exchange outside of the United States for which there is no reported sale during the day are valued at the mean between the last reported bid and asked prices. However, because most foreign markets close well before the Portfolio values its securities (typically at 4 p.m. Eastern Time), the earlier close of these foreign markets gives rise to the possibility that significant events, including broad market moves, may have occurred after these foreign markets close but before the Portfolio values its securities. To account for this, the Portfolio may frequently value many of its foreign equity securities using fair value prices based on third party vendor modeling tools.
Forward foreign currency exchange contracts are valued based on the mean between closing bid and asked prices of the forward currency contract rates in the London foreign exchange markets on a daily basis as provided by a reliable bank or dealer.
Options, whether on securities, indices, futures contracts, or otherwise, are valued at the last sales price available as of the close of business on the day of valuation or, if there is no such sale price available, at the mean between the bid and asked prices. Options on currencies are valued at the spot price each day.
The value of futures contracts will be the sum of the margin deposit plus or minus the difference between the value of the futures contract on each day the net asset value is calculated and the value on the date the futures contract originated, value being that established on a recognized commodity exchange, or by reference to other customary sources, with gain or loss being realized when the futures contract closes or expires.
Subject to the Board’s oversight, the Board has delegated the day-to-day oversight of pricing matters, including determinations in good faith under the Fund’s procedures the fair value of securities for which current market quotations are not readily available to the subadviser of the Portfolio.
Investment Transactions and Related Investment Income:
Portfolio security transactions are recorded on the trade date. Dividend income is recorded on the ex-dividend date or, for certain foreign securities, when notified. Interest income, which includes amortization of premium and accretion of discount on debt securities, is recorded on the accrual basis. Realized gains and losses on investments and unrealized appreciation and depreciation are determined on the identified cost basis, which is the same basis used for federal income tax purposes.
Repurchase Agreements:
The Portfolio, through the custodian or a subcustodian, receives delivery of the underlying securities collateralizing repurchase agreements. The Portfolio requires the custodian to take possession, to have legally segregated in the Federal Reserve Book Entry System, or to have segregated within the custodian’s vault, all securities held as collateral for repurchase agreements. It is the Portfolio’s policy that the market value of the collateral be at least equal to 100% of the repurchase price in the case of a repurchase agreement of one-day duration and 102% on all other repurchase agreements. The Portfolio’s subadviser is responsible for determining that the value of the collateral is at all times at least equal to the repurchase price. In connection with transactions in repurchase agreements, if the seller defaults and the value of the collateral declines or if the seller enters an insolvency proceeding, realization of the collateral by the Portfolio may be delayed, limited or wholly denied.
Foreign Currency Translation:
The books and records of the Portfolio are maintained in U.S. dollars. The values of securities, currencies and other assets and liabilities denominated in currencies other than U.S. dollars are translated into U.S. dollars based upon foreign exchange rates prevailing at the end of the period. Purchases and sales of investment securities, income and expenses are translated on the respective dates of such transactions. Since the values of investment securities are presented at the foreign exchange rates prevailing at the end of the period, it is not practical to isolate that portion of the results of operations arising from changes in exchange rates from that portion of the results of operations reflecting fluctuations arising from changes in market prices of the investment securities. Such fluctuations are included in the net realized and unrealized gain or loss on investments.
Net realized foreign exchange gains or losses arise from sales of foreign currency, currency gains or losses realized between the trade and settlement dates on securities transactions, and the difference between the amounts of dividends, interest, and foreign withholding taxes recorded by the Portfolio and the U.S. dollar equivalent of the amounts actually received or paid by the Portfolio. Net unrealized foreign exchange gains and losses arise from changes in the value of assets and liabilities, other than investment securities, resulting from changes in the exchange rate.
MSF-12
Metropolitan Series Fund, Inc.
Jennison Growth Portfolio
Notes to Financial Statements—December 31, 2008—(Continued)
Forward Foreign Currency Exchange Contracts:
The Portfolio may enter into forward foreign currency exchange contracts primarily to hedge against foreign currency exchange rate risks on its non-U.S. dollar denominated investment securities. When entering into a forward currency contract, the Portfolio agrees to receive or deliver a fixed quantity of foreign currency for an agreed-upon price on an agreed future date. These contracts are valued daily and the Portfolio’s net equity therein, representing unrealized gain or loss on the contracts as measured by the difference between the foreign exchange rates at the dates of entry into the contracts and the forward rates at the settlement date, is included in the Statement of Assets and Liabilities. Realized and unrealized gains and losses are included in the Statement of Operations. These instruments involve market and/or credit risk in excess of the amount recognized in the Statement of Assets and Liabilities. Risks arise from the possible inability of counterparties to meet the terms of their contracts and from movement in currency and securities values and interest rates.
Futures Contracts:
The Portfolio may buy and sell futures contracts (on recognized exchanges) as a hedge, to maintain exposure to the broad equity markets or to enhance return. Futures contracts are agreements to buy or sell a security, or deliver a final cash settlement price in connection with an index, interest rate, currency, or other contracts not calling for physical delivery, for a set price in the future. The Portfolio must post an amount equal to a portion of the total market value of the futures contract as futures variation margin, which is returned when the Portfolio’s obligations under the contract have been satisfied. From time to time thereafter, the Portfolio may have to post variation margin to maintain this amount as the market value of the contract fluctuates. Risks of entering into futures contracts (and related options) include the possibility that there may be an illiquid market and that a change in the value of the contract or option may not correlate with changes in the value of the underlying securities.
Options:
The Portfolio may use options to hedge against changes in values of securities the Portfolio owns or expects to purchase, to maintain exposure to the broad equity markets or to enhance return. Writing puts or buying calls tends to increase the Portfolio’s exposure to the underlying instrument and writing calls or buying puts tends to decrease the Portfolio’s exposure to the underlying instrument, and can be used to hedge other Portfolio investments. For options purchased to hedge the Portfolio’s investments, the potential risk to the Portfolio is that the change in value of options contracts may not correspond to the change in value of the hedged instruments. In addition, losses may arise from changes in the value of the underlying instruments, if there is an illiquid secondary market, or if the counterparty is unable to perform. The maximum loss for purchased options is limited to the premium initially paid for the option. For options written by the Portfolio, the maximum loss is not limited to the premium initially received for the option.
The main risk associated with purchasing an option is that the option expires without being exercised. In this case, the option expires worthless and the premium paid for the option is considered the loss. The risk associated with writing a call option is that the Portfolio may forgo the opportunity for a profit if the market value of the underlying position increases and the option is exercised. The risk in writing a put option is that the Portfolio may incur a loss if the market value of the underlying position decreases and the option is exercised. In addition, the Portfolio risks not being able to enter into a closing transaction for the written option as the result of an illiquid market.
“When-Issued” Securities:
Purchasing securities “when-issued” is a forward commitment by the Portfolio to buy a security. The estimated amount of the Portfolio’s payment obligation and the security’s interest rate are determined when the commitment is made, even though no interest accrues until the security is issued, which is generally 15 to 120 days later. The Portfolio will segregate liquid assets with its custodian sufficient at all times to satisfy these commitments. If the value of the security is less when delivered than when the commitment was made, the Portfolio will suffer a loss.
Federal Income Taxes:
It is the Portfolio’s policy to comply with the requirements of the Internal Revenue Code of 1986, as amended (the “Code”), and regulations thereunder, applicable to regulated investment companies and to distribute, with respect to each taxable year, all of its taxable income to shareholders. Therefore, no federal income tax provision is required. The Portfolio is subject to the provisions of the Financial Accounting Standards Board Interpretation (“FASB”) No. 48, Accounting for Uncertainties in Income
MSF-13
Metropolitan Series Fund, Inc.
Jennison Growth Portfolio
Notes to Financial Statements—December 31, 2008—(Continued)
Taxes (FIN 48). FIN 48 sets forth a minimum threshold for financial statement recognition of the benefit of a tax position taken or expected to be taken in a tax return. The implementation of FIN 48 did not result in any unrecognized tax benefits in the accompanying financial statements. Each of the Portfolio's federal tax returns for the prior three fiscal years remains subject to examination by the Internal Revenue Service.
As of December 31, 2008, the Portfolio had $104,367,717 in capital loss carryforwards expiring on December 31, 2016.
Pursuant to Section 852 of the Code, the Portfolio designated the amount shown below under Long Term Gain as capital gain dividends for its taxable year ended December 31, 2008. The tax character of distributions paid for the periods ended December 31, 2008 and 2007 was as follows:
| | | | | | | | | | | | | | | | | | | | | |
Ordinary Income | | Long Term Gain | | Return of Capital | | Total |
2008 | | 2007 | | 2008 | | 2007 | | 2008 | | 2007 | | 2008 | | 2007 |
$27,645,961 | | $ | 6,018,488 | | $ | 97,433,870 | | $ | 51,461,293 | | $ | — | | $ | — | | $ | 125,079,831 | | $ | 57,479,781 |
As of December 31, 2008, the components of distributable earnings (accumulated losses) on a federal income tax basis were as follows:
| | | | | | | | | | | | | | | |
Undistributed
Ordinary
Income | | Undistributed
Long Term
Gain | | Unrealized
Depreciation | | | Loss
Carryforwards | | | Total | |
$1,336,152 | | $ | — | | $ | (194,770,876 | ) | | $ | (104,367,717 | ) | | $ | (297,802,441 | ) |
Pursuant to Federal income tax regulations applicable to investment companies, the Portfolio has elected to treat net capital losses realized between November 1 and December 31 of each year as occurring on the first day of the following tax year. For the year ended December 31, 2008, the following amounts of realized capital and currency losses reflected in the accompanying financial statements will not be recognized for Federal income tax purposes until January 1, 2009:
| | | | |
Currency | | Capital | |
$— | | $ | (21,698,688 | ) |
Dividends and Distributions to Shareholders:
The Portfolio records dividends and distributions on the ex-dividend date. Net realized gains from security transactions (if any) are generally distributed annually to shareholders. The timing and characterization of certain income and capital gains distributions are determined in accordance with federal tax regulations that may differ from GAAP. Permanent book and tax basis differences relating to shareholder distributions will result in reclassification between under/over distributed net investment income, accumulated net realized gains/losses and paid in capital.
Expense Reductions:
Certain Portfolio trades are directed to brokers who paid a portion of the Portfolio’s expenses. Amounts paid for the Portfolio are shown as expense reductions in the Statement of Operations.
| 3. | INVESTMENT TRANSACTIONS: |
For the year ended December 31, 2008, purchases and sales of securities (excluding short term investments) for the Portfolio were as follows:
| | | | | | | | | |
Purchases | | Sales |
U.S. Government | | Other | | U.S. Government | | Other |
$0 | | $ | 1,004,439,509 | | $ | 0 | | $ | 916,636,627 |
MSF-14
Metropolitan Series Fund, Inc.
Jennison Growth Portfolio
Notes to Financial Statements—December 31, 2008—(Continued)
| 4. | INVESTMENT MANAGEMENT FEES AND OTHER TRANSACTIONS WITH AFFILIATES: |
Investment Management Agreement:
MetLife Advisers, LLC (“MetLife Advisers”) is the investment adviser to the Portfolio. The Fund has entered into an investment management agreement with MetLife Advisers with respect to the Portfolio. For providing investment management services to the Portfolio, MetLife Advisers receives monthly compensation at the following annual rates:
| | | | |
Management
Fees earned by
MetLife Advisers
for the year ended
December 31, 2008 | | Annual
percentage
rates paid to
MetLife Advisers | | Based on Portfolios
average daily net asset
levels |
| $7,527,936 | | 0.700% | | Of the first $200 million |
| | 0.650% | | Of the next $300 million |
| | 0.600% | | Of the next $1.5 billion |
| | 0.550% | | On amounts in excess of $2 billion |
Certain officers and directors of the Fund may also be officers of MetLife Advisers; however, such officers and directors receive no compensation from the Fund.
MetLife Advisers has entered into an investment subadvisory agreement with respect to the Portfolio. Jennison Associates, LLC is compensated by MetLife Advisers to provide subadvisory services for the Portfolio.
Service and Distribution Fees:
The Fund has adopted a Distribution and Service Plan under Rule 12b-1 of the 1940 Act for the Portfolio’s Class B and E shares. Under the Distribution and Service Plan, the Class B and E shares of the Portfolio pay a fee to compensate the Insurance Companies (or their affiliates) and other broker-dealers and financial intermediaries involved in the offer and sale of Portfolio shares for promoting or selling and servicing the Class B and E shares. The fees under the Distribution and Service Plan for each class of the Portfolio’s shares are calculated as a percentage of the Portfolio’s average daily net assets that are attributable to that Class. Currently, the fee is 0.25% per year for Class B shares and 0.15% per year for Class E shares. Amounts paid by the Portfolio for the year ended December 31, 2008 are shown as Service and Distribution fees in the Statement of Operations.
The Fund has entered into a securities lending arrangement with the Fund’s custodian, State Street Bank and Trust Company (the “custodian”). Under the agreement, the custodian is authorized to loan securities on the Portfolios’ behalf. In exchange, the Portfolio receives either cash or securities as collateral against the loaned securities. The Portfolio receives collateral at least equal to 102% of the market value of the loaned securities (105% for foreign securities), at each loan’s inception. Collateral must be maintained at least at 100% of the market value of the loaned securities for the duration of the loan. The cash collateral is invested in the Navigator Securities Lending Prime Portfolio, an affiliate of the custodian, which invests in a variety of high quality U.S. dollar-denominated instruments. If the market value of the collateral at the close of trading on a business day is less than 100% of the market value of the loaned securities at the close of trading on that day, the borrower shall be required to deliver, by the close of business on the following business day, an additional amount of collateral, equal to at least 100% of the market value of all the loaned securities as of such preceding day. The Portfolio receives 80% of the annual net income from securities lending transactions, which is included in interest income of the Portfolio. The remaining 20% is paid to the custodian as compensation for its securities lending services. Interest income received by the Portfolio via lending transactions during the year ended December 31, 2008 is footnoted in the Statement of Operations. The Portfolio bears the risk of any deficiency in the amount of collateral available for return to a borrower due to a loss in an approved investment purchased with such collateral. Any outstanding loans by the Portfolio at December 31, 2008 are footnoted in the Schedule of Investments.
| 6. | MARKET AND CREDIT RISK: |
In the normal course of business, the Portfolio invests in securities and enters into transactions where risks exist due to fluctuations in the market (market risk) or failure of the other party to a transaction to perform (credit risk). The value of securities held by the Portfolio may decline in response to certain events, including those directly involving the companies whose securities are owned by the Portfolio; conditions affecting the general economy; overall market changes; local, regional or global political, social or economic instability; and currency and interest rate and price fluctuations. Similar to credit risk, the Portfolio
MSF-15
Metropolitan Series Fund, Inc.
Jennison Growth Portfolio
Notes to Financial Statements—December 31, 2008—(Continued)
may be exposed to counterparty risk, or the risk that an entity with which the Portfolio has unsettled or open transactions may default. Financial assets, which potentially expose the Portfolio to credit and counterparty risks, consist principally of investments and cash due from counterparties. The extent of the Portfolio’s exposure to credit and counterparty risks in respect to these financial assets approximates their value as recorded in the Portfolio’s Statements of Assets and Liabilities.
| 7. | RECENT ACCOUNTING PRONOUNCEMENTS: |
In March 2008, the FASB issued Statement of Financial Accounting Standards No. 161, Disclosures about Derivative Instruments and Hedging Activities (“FAS 161”), an amendment of FASB Statement No. 133. FAS 161 requires enhanced disclosures about (a) how and why an entity uses derivative instruments, (b) how derivative instruments and hedging activities are accounted for, and (c) how derivative instruments and related hedging activities affect a fund’s financial position, financial performance, and cash flows. Management does not believe the adoption of FAS 161 will materially impact the financial statement amounts, but will require additional disclosures. This will include qualitative and quantitative disclosures on derivative positions existing at period end and the effect of using derivatives during the reporting period. FAS 161 is effective for financial statements issued for fiscal years and interim periods beginning after November 15, 2008. Management is currently evaluating the impact the adoption of FAS 161 will have on the Portfolio’s financial statement disclosures.
MSF-16
Metropolitan Series Fund, Inc.
Jennison Growth Portfolio
Report of Independent Registered Public Accounting Firm
To the Shareholders and Board of Directors of Metropolitan Series Fund, Inc.:
We have audited the accompanying statement of assets and liabilities, including the schedule of investments, of the Jennison Growth Portfolio (one of the portfolios constituting the Metropolitan Series Fund, Inc.) (the “Fund”) as of December 31, 2008, and the related statement of operations for the year then ended, the statements of changes in net assets for each of the two years in the period then ended, and the financial highlights for each of the five years in the period then ended. These financial statements and financial highlights are the responsibility of the Fund’s management. Our responsibility is to express an opinion on these financial statements and financial highlights based on our audits.
We conducted our audits in accordance with the standards of the Public Company Accounting Oversight Board (United States). Those standards require that we plan and perform the audit to obtain reasonable assurance about whether the financial statements and financial highlights are free of material misstatement. The Fund is not required to have, nor were we engaged to perform, an audit of its internal control over financial reporting. Our audits included consideration of internal control over financial reporting as a basis for designing audit procedures that are appropriate in the circumstances, but not for the purpose of expressing an opinion on the effectiveness of the Fund’s internal control over financial reporting. Accordingly, we express no such opinion. An audit also includes examining, on a test basis, evidence supporting the amounts and disclosures in the financial statements, assessing the accounting principles used and significant estimates made by management, as well as evaluating the overall financial statement presentation. Our procedures included confirmation of securities owned as of December 31, 2008, by correspondence with the custodian and brokers; where replies were not received from brokers, we performed other auditing procedures. We believe that our audits provide a reasonable basis for our opinion.
In our opinion, the financial statements and financial highlights referred to above present fairly, in all material respects, the financial position of the Jennison Growth Portfolio of the Metropolitan Series Fund, Inc. as of December 31, 2008, the results of its operations for the year then ended, the changes in its net assets for each of the two years in the period then ended, and the financial highlights for each of the five years in the period then ended, in conformity with accounting principles generally accepted in the United States of America.
Deloitte & Touche LLP
Boston, Massachusetts
February 20, 2009
MSF-17
Metropolitan Series Fund, Inc.
Directors and Officers
The Fund’s Directors review actions of the Fund’s investment adviser and subadvisers, and decide upon matters of general policy. The Fund’s officers supervise the daily business operations of the Fund. The Board of Directors and the Fund’s officers are listed below. Each Director is responsible for overseeing all 38 Portfolios of the Fund. There is no limit to the term a Director may serve. Directors serve until their resignation, retirement or removal in accordance with the Fund’s organizational documents and policies adopted by the Board from time to time. Officers hold office at the pleasure of the Board or until the election or appointment and the qualification of a successor. The address of the Directors and officers is c/o Metropolitan Series Fund, Inc., 501 Boylston Street, Boston, MA 02116.
Interested Directors(1)
Each Director below is an “interested person” (as defined by the 1940 Act) with respect to the Fund in that Ms. Forget is an employee of MetLife and Mr. Typermass is a former employee of MetLife and owns securities issued by MetLife, Inc., the ultimate parent company of MetLife Advisers.
| | | | | | | | |
Name, Address and Age | | Current
position(s)
with Fund | | Position(s)
held since | | Principal occupations
over past five years, including other directorships(2) | | Number of
Portfolios in
Fund Complex
Overseen by
Director(3) |
Elizabeth M. Forget Age: 42 | | Director, Chairman of the Board, President and Chief Executive Officer | | 2006 | | Senior Vice President (since 2007), MetLife, Inc.; President, Met Investors Advisory, LLC; Trustee and President, Met Investors Series Trust; Executive Vice President, MetLife Investors Group, Inc.; President, Chief Executive Officer and Chair of the Board of Managers (since 2006), MetLife Advisers; President, Met Investors Advisory, LLC. | | 87 |
| | | | |
Arthur G. Typermass Age: 71 | | Director | | 1998 | | Formerly, Senior Vice President and Treasurer, MetLife. | | 38 |
Non-Interested Directors(1)
Each Director below is not an “interested person” (as defined by the 1940 Act) with respect to the Fund (collectively, the “Independent Directors”).
| | | | | | | | |
Name, Address and Age | | Current
position(s)
with Fund | | Position(s)
held since | | Principal occupations
over past five years, including other directorships(2) | | Number of
Portfolios in
Fund Complex
Overseen by
Director(3) |
Steve A. Garban† Age: 71 | | Director | | 1985 | | Formerly, Chief Financial Officer, Senior Vice President Finance and Operations and Treasurer (Emeritus), The Pennsylvania State University. | | 38 |
| | | | |
Linda B. Strumpf Age: 61 | | Director | | 2000 | | Vice President and Chief Investment Officer, Ford Foundation. | | 38 |
| | | | |
Michael S. Scott Morton† Age: 71 | | Director | | 1993 | | Jay W. Forrester Professor of Management (Emeritus) at Sloan School of Management, MIT. | | 38 |
| | | | |
H. Jesse Arnelle Age: 75 | | Director | | 2001 | | Formerly, Counsel, Womble Carlyle Sandrie & Rice; Director, Textron Inc. (global multi- industry company)*; formerly, Director, Gannet Co. Inc. (diversified news and information company)*; formerly, Director, Eastman Chemical Company (global chemical company)*; formerly, Director, Waste Management, Inc.*; formerly, Director, Armstrong Holdings Inc. (parent company of floor and ceiling products business)*; formerly, Director, FPL Group Inc. (public utility holding company)*; Director, URS Corporation (engineering design services firm)*. | | 38 |
MSF-18
Metropolitan Series Fund, Inc.
Directors and Officers—(Continued)
| | | | | | | | |
Name, Address and Age | | Current
position(s)
with Fund | | Position(s)
held since | | Principal occupations
over past five years, including other directorships(2) | | Number of
Portfolios in
Fund Complex
Overseen by
Director(3) |
Nancy Hawthorne Age: 57 | | Director | | 2003 | | Chief Executive Officer, Clerestory LLC (corporate financial advisor); Director, Avid Technologies (computer software company)*; formerly, Chairman of the Board of Avid Technologies; formerly, Board of Advisors, L. Knife & Sons, Inc. (beverage distributor); formerly, Trustee, New England Zenith Fund (“Zenith Fund”)**; formerly, Chief Executive Officer and Managing Partner, Hawthorne, Krauss and Associates (corporate financial advisor); formerly, Chief Financial Officer and Executive Vice President, Continental Cablevision, subsequently renamed MediaOne (cable television company); formerly, Director, Life F/X, Inc.; formerly, Chairman of the Board, WorldClinic (distance medicine company); formerly, Director, Perini Corporation (construction company)*; formerly, Director, CGU (property and casualty insurance company); formerly, Director, Beacon Power Corporation (energy company)*. | | 38 |
| | | | |
John T. Ludes Age: 72 | | Director | | 2003 | | President, LFP Properties (consulting firm); Formerly, Trustee, Zenith Fund**; formerly, Vice Chairman, President and Chief Operating Officer, Fortune Brands/American Brands (global conglomerate); formerly, President and CEO, Acushnet Company (athletic equipment company). | | 38 |
Officers(1)
| | | | | | | | |
Name and address | | Age | | Current
position(s)
with Fund | | Position(s)
held since | | Principal occupations over past five years(2) |
| Jeffrey L. Bernier | | 37 | | Senior Vice President | | 2008 | | Vice President (since 2008), MetLife, Inc.; Vice President (since 2008), MetLife; Senior Vice President (since 2008), MetLife Advisers; formerly, Director and Senior Investment Analyst (2004 to 2007), John Hancock Financial Services; formerly, Assistant Vice President (2000 to 2001), Wachovia Securities. |
| | | | |
| Alan C. Leland | | 56 | | Senior Vice President | | 2005 | | Treasurer and Chief Financial Officer, MetLife Advisers, LLC; Treasurer (since 2005), Met Investors Advisory, LLC; Vice President (since 2004), Met Investors Advisory, LLC; Vice President (since 2003), MetLife, Inc.; Vice President, MetLife; Senior Vice President, NELICO. |
| | | | |
| Peter Duffy | | 53 | | Vice President
and Treasurer | | 2000 | | Senior Vice President, MetLife Advisers; Second Vice President (since 2003), NELICO; Vice President, MetLife (since 2004); Vice President (since 2004), MetLife, Inc.; formerly, Vice President and Treasurer, Zenith Fund**. |
| | | | |
| Jeffrey P. Halperin | | 41 | | Chief
Compliance Officer | | 2007 | | Vice President (since 2006), MetLife, Inc.; Vice President (since 2006), MetLife; Chief Compliance Officer (since 2006), Met Investors Series Trust, MetLife Advisers, Met Investors Advisory, LLC and MetLife Investment Advisors Company, LLC. |
| * | Indicates a directorship with a registered investment company or a company subject to the reporting requirements of the Securities Exchange Act of 1934, as amended. |
| ** | The Zenith Fund deregistered with the Securities and Exchange Commission (“SEC”) in 2004. |
| (†) | Served as a trustee, director and/or officer of one or more of the following companies, each of which had a direct or indirect advisory relationship with MetLife Advisers or its affiliates prior to January 31, 2005: State Street Research Financial Trust, State Street Research Income Trust, State Street Research Money Market Trust, State Street Research Institutional Funds, State Street Research Capital Trust, State Street Research Master Investment Trust, State Street Research Equity Trust, State Street Research Securities Trust and State Street Research Exchange Trust (collectively, the “State Street Research Funds”). |
| (1) | During the period shown, each Director of the Fund served as a Trustee of Metropolitan Series Fund II, a registered investment company that ceased investment operations in June of 2008 and has applied for deregistration under the Investment Company Act of 1940. During this period, each officer of the Fund served in the same position with Metropolitan Series Fund II. |
| (2) | Previous positions during the past five years with the Fund; Met Investors Series Trust; MetLife; MetLife, Inc.; MetLife Advisers; Met Investors Advisory, LLC; Zenith Fund; NELICO; or New England Securities Corporation are omitted if not materially different. |
| (3) | The Fund Complex includes the Fund (38 portfolios) and Met Investors Series Trust (49 portfolios). |
MSF-19
Metropolitan Series Fund, Inc.
Jennison Growth Portfolio
Board Approval of Advisory and Subadvisory Agreements
The Fund’s Contract Review Committees of the Board of Directors (the “Board” or the “Directors”) typically meet in early fall to review the Portfolios’ advisory agreements (the “Advisory Agreements”) and subadvisory agreements (the “Subadvisory Agreements,” and, together with the Advisory Agreements, the “Agreements”) and determine whether to recommend that the full Board approve the continuation of the Agreements for an additional one-year period. (Following the initial approval of an Agreement for a new Portfolio or with a new adviser or subadviser, such annual reviews are not required until 2 years following the execution of such Agreement.) After each Committee has made its recommendations, the full Board, including the Independent Directors, determines whether to approve the continuation of each of the Agreements. In addition, the Board, including the Independent Directors, considers matters bearing on the Agreements at most of its other meetings throughout the year and regularly interviews various individuals at MetLife Advisers responsible for the management of the Portfolios. The Directors also interview selected investment managers and other professionals at the subadvisers at various times throughout the year.
The Directors receive all materials that they or MetLife Advisers, the Fund’s investment adviser, and the subadvisers believe to be reasonably necessary for the Directors to evaluate the Agreements and determine whether to approve the continuation of the Agreements. These materials generally include, among other items, (i) information on the investment performance of the Portfolios and the performance of peer groups of funds and the Portfolios’ performance benchmarks, (ii) information on the Portfolios’ advisory and subadvisory fees and other expenses, including information comparing the Portfolios’ expenses to those of peer groups of funds and information about any applicable expense caps and fee “breakpoints,” (iii) sales and redemption data, (iv) information related to the profitability of the Agreements to MetLife Advisers and certain of the subadvisers, and potential “fall-out” or ancillary benefits that MetLife Advisers, the subadvisers or their affiliates may receive as a result of their relationships with the Fund and (v) information obtained through the subadvisers’ responses to certain requests from MetLife Advisers and the Directors and MetLife Advisers’ responses to requests from the Directors. The Directors may also consider other information such as (vi) MetLife Advisers’ and the subadvisers’ financial results and condition, (vii) each Portfolio’s investment objectives and strategies and the size, education and experience of the investment staffs of MetLife Advisers and the relevant subadvisers and their use of technology and external research, (viii) the allocation of the Portfolios’ brokerage, if any, including allocations to brokers affiliated with the subadvisers and the use of “soft” commission dollars to pay Portfolio expenses and to pay for research and other similar services, (ix) the resources devoted to, and the record of compliance with, the Portfolios’ investment policies and restrictions, policies on personal securities transactions and other compliance policies, (x) the responses of MetLife Advisers, the subadvisers and/or their affiliates to certain legal and regulatory proceedings and (xi) the economic outlook generally and for the mutual fund industry in particular. Throughout the process, the Directors have the opportunity to ask questions of and request additional materials from MetLife Advisers and the subadvisers.
Following meetings of each Contract Review Committee on September 10, 2008, the Board, including the Independent Directors, at its November 6-7, 2008 meeting, approved the continuation through December 31, 2009 of the Advisory Agreements for each Portfolio of the Fund and the Subadvisory Agreements for each Portfolio other than the Zenith Equity Portfolio and Asset Allocation Portfolios (which do not have subadvisers) and the Van Eck Global Natural Resources Portfolio, Met/Dimensional International Small Cap Portfolio and Loomis Sayles Small Cap Growth Portfolio (formerly known as the Franklin Templeton Small Cap Growth Portfolio). The Agreements approved for continuation are referred to below as the “Continued Agreements.”
In considering whether to approve the continuation of the Continued Agreements, the Directors, including the Independent Directors, did not identify any single factor as determinative, and each weighed the various factors as he or she deemed appropriate. The Directors considered the following matters in connection with their approval of the Continued Agreements:
The nature, extent and quality of the services provided to the relevant Portfolios under the Continued Agreements. The Directors considered the nature, extent and quality of the services provided by MetLife Advisers, the relevant subadvisers (if any) and their affiliates (each, an “Adviser,” and, collectively, the “Advisers”) to the relevant Portfolios pursuant to the Continued Agreements and the resources dedicated to these Portfolios by the Advisers. In particular, the Directors considered the Advisers’ abilities to attract and retain highly qualified investment professionals. With respect to MetLife Advisers, the Directors considered (for each Portfolio other than the Zenith Equity and Asset Allocation Portfolios) that MetLife Advisers is (i) ultimately responsible for the performance of such Portfolios; (ii) ultimately responsible for the establishment of the investment strategies of each such Portfolio, primarily through its recommendations to the Board regarding the hiring and selection of subadvisers; (iii) responsible for the hiring and selection, subject to Board approval, of subadvisers; and (iv) responsible for maintaining a program of Subadviser oversight reasonably designed to ensure that the subadvisers have reasonable compliance policies and procedures in place. The Directors also considered that MetLife Advisers provides a full range of day-to-day administrative services for the Portfolios involving all aspects of such Portfolios’ day-to-day operations (other than portfolio management). With respect to the Zenith Equity and Asset Allocation Portfolios, the Directors considered both the portfolio management services and the administrative services provided by MetLife Advisers. After reviewing
MSF-20
Metropolitan Series Fund, Inc.
Jennison Growth Portfolio
Board Approval of Advisory and Subadvisory Agreements—(Continued)
these and related factors, the Directors concluded, within the context of their overall conclusions regarding each of the Continued Agreements, that the nature, extent and quality of services provided supported the renewal of these Agreements.
Investment performance of the relevant Portfolios. The Directors reviewed information about the performance of the relevant Portfolios over various time periods, including information prepared by an independent third party that compared the performance of the Portfolios to the performance of peer groups of funds and performance benchmarks. The Directors also reviewed a description of the third party’s methodology for identifying a Portfolio’s peer group(s) for purposes of performance and expense comparisons.
In the case of each relevant Portfolio that had performance that lagged its peer group(s) for certain periods, the Directors concluded that other factors relevant to performance were sufficient, in light of other considerations, to warrant renewal of the Continued Agreements relating to such Portfolio. These factors varied from Portfolio to Portfolio, but included one or more of the following: (i) that such Portfolio’s performance, although lagging in certain recent periods, was stronger over the longer term; (ii) that the underperformance was attributable, to a significant extent, to investment decisions that were reasonable and consistent with the Portfolio’s investment objective(s) and policies and that the Portfolio was performing within the range of reasonable expectations, given market conditions and the Portfolio’s investment objective(s) and policies; (iii) that the Portfolio’s performance was competitive when compared to other relevant performance benchmarks or peer groups; and (iv) that MetLife Advisers and/or the relevant subadviser (if any) had taken or was taking steps designed to help improve the Portfolio’s investment performance (including, in the case of certain Portfolios, that MetLife Advisers was formulating possible proposals, for presentation to the Board in November 2008, to replace the Portfolio’s subadviser or to merge the Portfolio into another Portfolio with a similar investment objective and better investment performance).
The Directors also considered the investment performance of the Advisers and their reputations generally, the historical responsiveness of the Advisers to Director concerns about performance and the willingness of the Advisers to take steps intended to improve performance.
After reviewing these and related factors, the Directors concluded, within the context of their overall conclusions regarding each of the Continued Agreements, that the investment performance of each relevant Portfolio and Adviser was sufficient, in light of other considerations, to warrant the renewal of the Continued Agreements.
The costs of the services to be provided and profits to be realized by the Advisers and their affiliates from their relationships with the Portfolios. The Directors considered the fees charged by MetLife Advisers to the Portfolios for advisory services and, with respect to the subadvised Portfolios, by such subadvisers to MetLife Advisers for subadvisory services (such advisory and subadvisory fees (if any), collectively, “Fees”), as well as the total expense levels of the Portfolios. This information included comparisons (provided by an independent third party) of the Portfolios’ advisory fees and total expense levels to those of their peer groups. In evaluating Fees for the relevant Portfolios, the Directors also took into account the demands, complexity and quality of the investment management services provided to each Portfolio. The Directors considered MetLife Advisers’ recommendations regarding reductions in Fee rates, implementation of Fee breakpoints and institution of Fee waivers and expense caps.
The Directors also considered the compensation directly or indirectly received by the Advisers and their affiliates from their relationships with the relevant Portfolios. The Directors reviewed information relating to the profits received by MetLife Advisers, certain of the subadvisers and their affiliates as a result of their relationships with the relevant Portfolios, and information about the allocation of expenses used to calculate profitability. When reviewing profitability, the Directors also considered the performance of the relevant Portfolios, the expense levels of such Portfolios and whether the relevant Advisers had implemented breakpoints, fee waivers and/or expense caps with respect to such Portfolios.
After reviewing these and related factors, the Directors concluded, within the context of their overall conclusions regarding each of the Continued Agreements, that the Fees charged to each of the relevant Portfolios were fair and reasonable, and that the information provided regarding costs of these services generally, and the related profitability (if known) to the relevant Advisers of their relationships with the relevant Portfolios, supported the renewal of the Continued Agreements.
Economies of Scale. The Directors considered the existence of any economies of scale in the provision of services by the Advisers and whether those economies were shared with the relevant Portfolios through breakpoints in their advisory fees or other means, such as expense caps, fee waivers or relatively low levels of fees. The Directors noted that most of the relevant Portfolios benefited or will benefit from breakpoints, expense caps and/or fee waivers with respect to their advisory fees. In considering these issues, the Directors also took into consideration information relating to the costs of the services provided and the profitability to MetLife Advisers, the relevant subadvisers (if any) and each of their affiliates of their relationships with the relevant Portfolios, as discussed above.
MSF-21
Metropolitan Series Fund, Inc.
Jennison Growth Portfolio
Board Approval of Advisory and Subadvisory Agreements—(Continued)
After reviewing these and related factors, the Directors concluded, within the context of their overall conclusions regarding each of the Continued Agreements, that the extent to which economies of scale were shared with the relevant Portfolios supported the renewal of such Agreements.
Other Factors. The Directors also considered other factors, which included but were not limited to the following:
| | • | | the extent to which each relevant Portfolio operated in accordance with its investment objective, and its record of compliance with its investment restrictions and the compliance programs of the Fund and the Advisers. They also considered the compliance-related resources the Advisers and their affiliates provide to the relevant Portfolios; |
| | • | | the nature, quality, cost and extent of administrative and shareholder services performed by MetLife Advisers and its affiliates under the Advisory Agreements; and |
| | • | | so-called “fall-out benefits” to the Advisers, such as the engagement of their affiliates to provide distribution, brokerage and transfer agency services to the Portfolios, and the benefits of research made available to the relevant Advisers by reason of brokerage commissions generated by the relevant Portfolios’ securities transactions. The Directors also considered the possible conflicts of interest associated with these fall-out and other benefits, and the reporting and other processes in place to disclose and monitor these possible conflicts of interest. |
Based on their evaluation of all factors that they deemed to be material, including those factors described above, and assisted by the advice of independent counsel, the Directors, including the Independent Directors, concluded that each of the Continued Agreements should be continued through December 31, 2009.
MSF-22
A description of the policies and procedures that the Fund uses to determine how to vote proxies relating to portfolio securities is available (i) without charge, upon request, by calling (800) 638-7732 and (ii) on the Securities and Exchange Commission’s (the “SEC”) website at http://www.sec.gov.
Information regarding how the Fund voted proxies relating to portfolio securities during the most recent twelve-month period ended December 31, 2008 is available (i) without charge, upon request, by calling (800) 638-7732 and (ii) on the SEC’s website at http://www.sec.gov.
The Fund’s Statement of Additional Information includes additional information about the Directors of the Fund and is available (i) without charge, upon request, by calling (800) 638-7732 and (ii) on the SEC’s website at http://www.sec.gov.
The Fund files with the SEC a complete schedule of its portfolio holdings, as of the close of the first and third quarters of its fiscal year, on “Form N-Q”. These filings are available on the SEC’s website at www.sec.gov and may be reviewed and copied at the SEC’s Public Reference Room in Washington, DC. (Call 1-800-SEC-0330 for information on the operation of the Public Reference Room.)
MSF-23
Simplify your life…
with MetLife eDelivery® while helping MetLife preserve the planet’s natural resources.
(see details on inside cover)
| | |
Metropolitan Series Fund, Inc. Julius Baer International Stock Portfolio Annual Report | | December 31, 2008 |
NOT PART OF THE ANNUAL REPORT
Letter from the President
February 1, 2009
Letter to Policy Holders:
2008 was an extraordinary year in the capital markets around the world and for the global economy. Energy prices rose to record levels early in the year before falling by two-thirds by year-end. A credit crisis that began with concerns about sub-prime mortgages led to massive changes in the financial landscape with government takeovers, forced sales, and outright failures of a number of large, once venerable firms.
While bonds as measured by the Barclays Capital U.S. Aggregate Bond Index (formerly known as, Lehman Brothers U.S. Aggregate Bond Index) were up 5.2% for the year in response to declining interest rates, there were large differences in the total returns of the various sectors of the bond market. U.S. treasury securities were up over 13% as frightened investors sought refuge in what they perceived to be the safest and most liquid investments. In contrast, investment grade corporate securities lost nearly 5% as credit spreads widened and below investment grade or high yield bonds fell over 26%.
In response to the growing credit crisis and the weakening economy, common stocks fell sharply across all regions, styles, and capitalizations. As measured by the Standard and Poor’s 500, U.S. common stocks fell 37% for the year, the worst calendar year decline since the 1930s. Foreign stocks were down even more with the MSCI EAFE Index down 43% for the year.
On the following pages, you will find a complete review of your Portfolio and its investment performance.
MetLife is committed to building your financial freedom. We appreciate your trust and will continue to focus our efforts on meeting your investment needs.
Sincerely,
Elizabeth M. Forget
President, Metropolitan Series Fund, Inc.
Metropolitan Series Fund, Inc.
Julius Baer International Stock Portfolio
Managed by Julius Baer Investment Management
Portfolio Manager Commentary*
PORTFOLIO PERFORMANCE
For the twelve-month period ended December 31, 2008, the Class A shares of the Julius Baer International Stock Portfolio return -44.1%, compared to its benchmark, Morgan Stanley Capital International (MSCI) All Country World ex U.S. Index1, which returned -45.5%. The Morgan Stanley Capital International (MSCI) EAFE Index2, returned -43.4%. The average return of its peer group, the Lipper Variable Insurance Products3 International Core Funds Universe was -42.6% over the same period.
PORTFOLIO REVIEW
Calendar year 2008 marked the end to what was one of the most difficult years in equity market history thus far. The correction was global, indiscriminate and spontaneous. No region, sector, or style was spared. Governments continued to take steps towards stimulating national economies to foster growth. For example, in December the European Central Bank, the U.S. Federal Reserve and the Bank of Canada all cut their benchmark rates (in the case of the U.S., it was lowered to near zero percent and Canada dropped to a 50 year low). This came on top of earlier steps that included efforts to bail out beleaguered banks and spur growth through additional spending.
During the course of 2008, we decreased our exposure to emerging markets and began emphasizing (as with other regions of the world) companies we felt were more liquid and of higher quality. Looking back on the year, we substantially reduced our exposure to mining stocks and commodity-dependent countries such as Russia. The rally in commodity prices between September 2007 and July 2008 created a bubble that deflated in the second half of the year.
At the end of the year, we were overweight developed Europe on the belief that the region has some of the best valuations globally.
Given the tumultuous nature of equity markets, which continue to appear to be driven more on fear than fundamentals, our cash and cash equivalents positions had the largest positive impact on returns. Near the end of the year, the dollar reversed its upward trajectory as investors began to focus on mounting U.S. deficits. We also saw the Japanese yen strengthen and the euro weaken. Given our underweight exposure to the yen and overweight exposure to the euro, we hedged a portion of each (into the yen and out of the euro). This positioning helped returns.
We benefited from our positions in developed Europe. One reason was our avoidance of the large banks that were severely impacted by deteriorating liquidity and credit market problems. Also proving helpful was our exposure to the healthcare sector (a traditionally defensive area). Stock selection within the energy sector was also a positive contributor.
From a geographic standpoint, the largest detractor to performance was our exposure to emerging markets. Much of the negative effect occurred in October, when several Eastern European countries, which comprise the bulk of our emerging markets holdings, suffered significant declines. This area of the world sees a higher level of net inbound investments (longer term foreign direct investment) than a region such as emerging Asia which is comprised of more export driven economies. However, during the quarter, foreign money was pulled out of Eastern European countries, creating liquidity problems. While both the European Central Bank and the International Monetary Fund were quick to respond, the speed of the withdrawal pushed the markets lower.
Japan was one of the year’s best performing developed markets when measured in U.S. dollar terms. While our underweight position to the equity market hurt, our hedge into the yen helped. The decision to underweight the UK equity market, particularly the financial sector, had a positive impact on results. However, this was reduced as the overvalued pound sterling lost value in the fourth quarter causing our cash position to detract. In the “Dollar Bloc” group of countries (Canada, Australia and New Zealand), our underweight positioning and stock selection helped yearly returns. Notably, our decision to make investments in some commodity-related issues, primarily those linked with gold mining, had a positive impact.
* The views expressed above are those of the subadvisory firm as of December 31, 2008 and are subject to change based on market and other conditions. Information about the Portfolio’s holdings, asset allocation, industry allocation, or country diversification is historical and is not an indication of future Portfolio composition, which will vary. The performance of any index mentioned in this commentary has not been adjusted for ongoing management, distribution and operating expenses, and sales charges applicable to mutual fund investments. Direct investment in any index is not possible.
1 The Morgan Stanley Capital International AC World Index ex-US Index (“MSCI ACWI ex-US Index”) is an unmanaged free float-adjusted market capitalization index that is designed to measure equity market performance in the global developed and emerging markets, excluding the U.S.
2 The Morgan Stanley Capital International Europe, Australasia and Far East Index (“MSCI EAFE Index”) is an unmanaged free float-adjusted market capitalization index that is designed to measure developed market equity performance, excluding the U.S. & Canada.
3 The Lipper Variable Products Fund Average is an average of the total return performance (calculated on the basis of net asset value) of variable product funds with similar investment objectives to those of the subject Portfolio as calculated by Lipper Analytical Services, an independent mutual fund ranking service.
MSF-2
Metropolitan Series Fund, Inc.
Julius Baer International Stock Portfolio
A $10,000 INVESTMENT COMPARED TO
THE MSCI EAFE INDEX AND THE MSCI ALL COUNTRY WORLD INDEX (EX-U.S.)
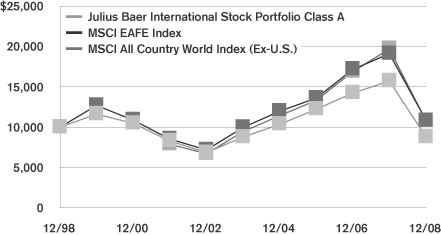
Average Annual Returns as of December 31, 2008
| | | | | | | | | | | | | | | |
| | | Julius Baer International Stock Portfolio | | | MSCI EAFE | | | MSCI All Country World Index (Ex-U.S.) | |
| | | Class A | | | Class B | | | Class E | | | Index | | |
| 1 Year | | -44.1 | % | | -44.2 | % | | -44.2 | % | | -43.4 | % | | -45.5 | % |
| 5 Year | | 0.0 | | | -0.2 | | | -0.1 | | | 1.7 | | | 2.6 | |
| 10 Year | | -1.3 | | | — | | | — | | | 0.8 | | | — | |
| Since Inception | | — | | | 0.5 | | | -1.3 | | | — | | | — | |
Performance numbers are net of all Portfolio expenses but do not include any insurance, sales, or administrative charges of variable annuity or life insurance contracts or any additional expenses that participants in certain eligible qualified plans may bear relating to the operations of their plans. If these charges were included, the returns would be lower.
Inception dates of the Class A, Class B and Class E shares are: 5/1/91, 5/1/02 and 5/1/01, respectively.
This information represents past performance and is not indicative of future results. Investment return and principal value may fluctuate so that shares, upon redemption, may be worth more or less than the original cost.
PORTFOLIO COMPOSITION
as of December 31, 2008
Top Holdings
| | |
| | | % of Total
Net Assets |
Total S.A. | | 4.3% |
TOPIX Exchange Traded Fund | | 4.0% |
E.ON AG | | 2.6% |
Nestle S.A. | | 2.6% |
Telefonica S.A. | | 2.6% |
France Telecom S.A. | | 2.5% |
Eni S.p.A. | | 2.2% |
Deutsche Telekom AG | | 2.1% |
Gaz de France S.A. | | 2.1% |
Royal Dutch Shell, Plc. | | 2.0% |
Top Countries
| | |
| | | % of Equity
Market Value |
France | | 22.0% |
Germany | | 16.2% |
United Kingdom | | 13.6% |
Japan | | 10.3% |
Switzerland | | 7.8% |
Spain | | 4.7% |
Italy | | 4.2% |
Netherlands | | 3.6% |
Czech Republic | | 2.9% |
Poland | | 2.6% |
MSF-3
Metropolitan Series Fund, Inc.
Shareholder Expense Example
As a shareholder of the Portfolio, you incur ongoing costs, including management fees; distribution and service (12b-1) fees; and other Portfolio expenses. This example is intended to help you understand your ongoing costs (in dollars) (referred to as “expenses”) of investing in the Portfolio and compare these costs with the ongoing costs of investing in other mutual funds. The example is based on an investment of $1,000 invested at the beginning of the period and held for the entire period, July 1, 2008 through December 31, 2008.
Actual Expenses
The first line for each share class of the Portfolio in the table below provides information about actual account values and actual expenses. You may use the information in this line, together with the amount you invested in the particular share class of the Portfolio, to estimate the expenses that you paid over the period. Simply divide your account value by $1,000 (for example, an $8,600 account value divided by $1,000=8.6), then multiply the result by the number in the first line under the heading entitled “Expenses Paid During Period” to estimate the expenses you paid on your account during this period.
Hypothetical Example for Comparison Purposes
The second line for each share class of the Portfolio in the table below provides information about hypothetical account values and hypothetical expenses based on the Portfolio’s actual expense ratio and an assumed rate of return of 5% per year before expenses, which is not the Portfolio’s actual return. The hypothetical account values and expenses may not be used to estimate the actual ending account balance or expenses you paid for the period. You may use this information to compare the ongoing costs of investing in the Portfolio and other funds. To do so, compare this 5% hypothetical example with the 5% hypothetical examples that appear in the shareholder reports of the other funds.
Please note that the expenses shown in the table are meant to highlight your ongoing costs only and do not reflect any fees or charges of your variable insurance product or any additional expenses that participants in certain eligible qualified plans may bear relating to the operations of their plan. Therefore, the second line for each share class in the table is useful in comparing ongoing costs only, and will not help you determine the relative total costs of owning different funds. In addition, if these other costs were included, your costs would have been higher.
| | | | | | | | | | | | | | |
Portfolio | | | | Annualized
Expense
Ratio | | | Beginning
Account Value
July 1,
2008 | | Ending
Account Value
December 31,
2008 | | Expenses Paid
During Period*
July 1, 2008
to
December 31,
2008 |
Julius Baer International Stock—Class A(a) | | Actual | | 0.94 | % | | $ | 1,000.00 | | $ | 634.15 | | $ | 3.86 |
| | Hypothetical | | 0.94 | % | | $ | 1,000.00 | | $ | 1,020.35 | | $ | 4.77 |
| | | | | |
Julius Baer International Stock—Class B(a) | | Actual | | 1.19 | % | | $ | 1,000.00 | | $ | 633.97 | | $ | 4.89 |
| | Hypothetical | | 1.19 | % | | $ | 1,000.00 | | $ | 1,019.08 | | $ | 6.04 |
| | | | | |
Julius Baer International Stock—Class E(a) | | Actual | | 1.09 | % | | $ | 1,000.00 | | $ | 633.83 | | $ | 4.48 |
| | Hypothetical | | 1.09 | % | | $ | 1,000.00 | | $ | 1,019.59 | | $ | 5.53 |
* Expenses paid are equal to the Portfolio’s annualized expense ratio for the most recent six month period, as shown above, multiplied by the average account value over the period, multiplied by the number of days in the most recent fiscal half-year, divided by 366 (to reflect the the one-half year period).
(a) The annualized expense ratio shown reflects the impact of the management fee waiver as described in Note 4 to the Financial Statements.
MSF-4
Metropolitan Series Fund, Inc.
Julius Baer International Stock Portfolio
Schedule of Investments as of December 31, 2008
Common Stock—82.8% of Total Net Assets
| | | | | |
| Security Description | | Shares | | Value* |
| | | | | |
|
Australia—1.3% |
BHP Billiton, Ltd. | | 251,624 | | $ | 5,299,534 |
Macquarie Airports | | 1,757,521 | | | 2,960,033 |
Newcrest Mining, Ltd. | | 56,957 | | | 1,350,854 |
Rio Tinto, Ltd. (a) | | 64,798 | | | 1,735,612 |
| | | | | |
| | | | | 11,346,033 |
| | | | | |
|
Austria—0.5% |
Flughafen Wien AG | | 41,030 | | | 1,834,560 |
OMV AG | | 54,404 | | | 1,450,342 |
Telekom Austria AG | | 58,732 | | | 848,916 |
| | | | | |
| | | | | 4,133,818 |
| | | | | |
|
Bermuda—0.1% |
Central European Media Enterprises, Ltd. (a) | | 15,826 | | | 343,741 |
GOME Electrical Appliances Holdings,
Ltd. (HKD) (a) | | 1,380,406 | | | 199,486 |
| | | | | |
| | | | | 543,227 |
| | | | | |
|
Canada—2.1% |
Barrick Gold Corp. | | 221,742 | | | 8,030,850 |
Eldorado Gold Corp. (a) | | 207,847 | | | 1,624,726 |
Ivanhoe Mines, Ltd. (b) | | 136,868 | | | 362,542 |
Kinross Gold Corp. | | 199,866 | | | 3,642,758 |
Potash Corp. of Saskatchewan, Inc. | | 42,263 | | | 3,065,394 |
Research In Motion, Ltd. (b) | | 17,499 | | | 710,110 |
Talisman Energy, Inc. | | 76,703 | | | 756,778 |
| | | | | |
| | | | | 18,193,158 |
| | | | | |
|
China—0.1% |
Beijing Capital International Airport Co.,
Ltd. (HKD) (a) | | 1,332,642 | | | 675,039 |
| | | | | |
|
Cyprus—0.0% |
Bank of Cyprus Public Co., Ltd. | | 41,350 | | | 154,878 |
| | | | | |
|
Czech Republic—2.5% |
Komercni Banka AS (GDR) | | 238,735 | | | 12,832,937 |
Komercni Banka AS (GDR)(U.S. OTC-Traded) | | 162,464 | | | 8,733,074 |
| | | | | |
| | | | | 21,566,011 |
| | | | | |
|
Denmark—0.4% |
Novo Nordisk A/S | | 69,013 | | | 3,512,029 |
| | | | | |
|
Finland—1.0% |
Nokia Oyj | | 382,530 | | | 5,930,335 |
Orion Oyj (Series B) | | 56,157 | | | 950,681 |
Stora Enso Oyj (a) | | 177,517 | | | 1,385,740 |
| | | | | |
| | | | | 8,266,756 |
| | | | | |
|
France—19.2% |
Accor S.A. (a) | | 8,853 | | | 435,654 |
Aeroports de Paris | | 70,727 | | | 4,786,430 |
Air Liquide S.A. | | 13,757 | | | 1,258,692 |
Air Liquide S.A. (Prime de Fidelite 02) | | 25,396 | | | 2,310,496 |
Air Liquide S.A. (Prime de Fidelite 09) | | 5,324 | | | 484,371 |
| | | | | |
| Security Description | | Shares | | Value* |
| | | | | |
|
France—(Continued) |
Alstom (a) | | 71,328 | | $ | 4,212,120 |
Bouygues | | 55,901 | | | 2,366,154 |
Carrefour S.A. (a) | | 122,243 | | | 4,694,507 |
Casino Guichard-Perrachon S.A. (a) | | 19,326 | | | 1,469,595 |
Cie de Saint-Gobain (a) | | 90,360 | | | 4,261,837 |
Electricite de France (a) | | 35,520 | | | 2,064,455 |
France Telecom S.A. (a) | | 754,609 | | | 21,107,299 |
Gaz de France S.A. | | 360,663 | | | 17,862,558 |
Groupe Danone (a) | | 122,686 | | | 7,404,709 |
L’Oreal S.A. | | 29,635 | | | 2,575,173 |
Lafarge S.A. (a) | | 64,594 | | | 3,927,346 |
LVMH Moet Hennessy Louis Vuitton S.A. (a) | | 69,329 | | | 4,657,948 |
Remy Cointreau S.A. | | 9,651 | | | 399,869 |
Sanofi-Aventis S.A. (a) | | 261,331 | | | 16,598,149 |
Schneider Electric S.A. | | 60,004 | | | 4,482,080 |
Suez Environment S.A. (a) (b) | | 44,320 | | | 747,317 |
Total S.A. (a) | | 674,443 | | | 36,769,061 |
Vinci S.A. | | 153,981 | | | 6,484,593 |
Vivendi (a) | | 397,801 | | | 12,951,468 |
| | | | | |
| | | | | 164,311,881 |
| | | | | |
|
Germany—14.2% |
Adidas AG | | 8,012 | | | 308,143 |
BASF AG | | 137,410 | | | 5,429,692 |
Bayer AG | | 97,494 | | | 5,727,261 |
Bayerische Motoren Werke AG | | 25,970 | | | 798,288 |
Continetal AG | | 7,122 | | | 721,408 |
Daimler AG | | 238,944 | | | 9,078,979 |
Deutsche Post AG | | 91,073 | | | 1,540,773 |
Deutsche Telekom AG | | 1,202,406 | | | 18,268,831 |
E.ON AG | | 556,330 | | | 22,496,404 |
Fraport AG Frankfurt Airport Services (a) | | 260,416 | | | 11,372,791 |
Fresenius Medical Care AG | | 127,541 | | | 5,980,796 |
Fresenius SE (a) | | 56,818 | | | 2,879,042 |
Merck KGaA | | 10,912 | | | 992,092 |
Metro AG | | 26,255 | | | 1,064,198 |
Rhoen Klinikum AG | | 87,312 | | | 2,098,435 |
RWE AG | | 149,742 | | | 13,461,303 |
SAP AG | | 104,661 | | | 3,750,959 |
Siemens AG | | 199,846 | | | 14,968,557 |
| | | | | |
| | | | | 120,937,952 |
| | | | | |
|
Greece—0.1% |
Hellenic Telecommunications Organization S.A. | | 61,468 | | | 1,022,547 |
| | | | | |
|
Hong Kong—0.3% |
China Merchants Holdings International Co., Ltd. (a) | | 650,468 | | | 1,281,787 |
Shun Tak Holdings, Ltd. (a) | | 3,477,968 | | | 964,262 |
| | | | | |
| | | | | 2,246,049 |
| | | | | |
|
Hungary—1.6% |
OTP Bank Nyrt | | 897,479 | | | 13,635,331 |
Richter Gedeon Nyrt | | 2,452 | | | 365,161 |
| | | | | |
| | | | | 14,000,492 |
| | | | | |
*See accompanying notes to financial statements.
MSF-5
Metropolitan Series Fund, Inc.
Julius Baer International Stock Portfolio
Schedule of Investments as of December 31, 2008
Common Stock—(Continued)
| | | | | |
| Security Description | | Shares | | Value* |
| | | | | |
|
Ireland—1.0% |
CHR, Plc. | | 301,727 | | $ | 7,635,297 |
Dragon Oil, Plc. (a) (b) | | 370,769 | | | 855,284 |
| | | | | |
| | | | | 8,490,581 |
| | | | | |
|
Italy—3.7% |
Buzzi Unicem S.p.A. | | 142,783 | | | 2,333,643 |
Credito Emiliano S.p.A. | | 184,654 | | | 963,583 |
Enel S.p.A. | | 670,670 | | | 4,289,003 |
Eni S.p.A. | | 802,780 | | | 19,022,579 |
Italcementi S.p.A. (a) | | 31,082 | | | 393,517 |
Telecom Italia S.p.A. | | 2,732,419 | | | 4,444,418 |
| | | | | |
| | | | | 31,446,743 |
| | | | | |
|
Japan—5.1% |
Aisin Seiki Co., Ltd. | | 17,101 | | | 242,694 |
Canon, Inc. | | 48,667 | | | 1,527,732 |
Central Japan Railway Co. | | 366 | | | 3,163,291 |
Daikin Industries, Ltd. (a) | | 12,108 | | | 319,324 |
Denso Corp. | | 37,890 | | | 630,329 |
East Japan Railway Co. | | 648 | | | 5,060,766 |
Eisai Co., Ltd. | | 16,480 | | | 682,922 |
Fanuc, Ltd. | | 12,263 | | | 872,133 |
Fuji Television Network, Inc. | | 147 | | | 210,354 |
Honda Motor Co., Ltd. | | 120,683 | | | 2,617,288 |
Itochu Corp. | | 18,957 | | | 95,110 |
Japan Tobacco, Inc. | | 388 | | | 1,284,825 |
KDDI Corp. | | 374 | | | 2,663,773 |
Komatsu, Ltd. | | 44,425 | | | 562,733 |
Kubota Corp. | | 20,731 | | | 149,018 |
Kyocera Corp. | | 6,943 | | | 500,868 |
Matsushita Electric Industrial Co., Ltd. | | 85,060 | | | 1,065,833 |
Mitsubishi Corp. | | 22,419 | | | 314,728 |
Mitsubishi Electric Corp. | | 106,607 | | | 667,115 |
Mitsui & Co., Ltd. | | 29,762 | | | 304,445 |
Nidec Corp. (a) | | 5,600 | | | 217,771 |
Nintendo Co., Ltd. | | 9,302 | | | 3,573,781 |
Nippon Telephone & Telegraph Corp. | | 115 | | | 618,067 |
NTT DoCoMo, Inc. | | 2,107 | | | 4,153,512 |
Olympus Corp. | | 4,248 | | | 85,303 |
Ricoh Co., Ltd. | | 23,762 | | | 302,618 |
Seven & I Holdings Co., Ltd. | | 73,604 | | | 2,521,653 |
Shin-Etsu Chemical Co., Ltd. | | 12,582 | | | 577,084 |
Sony Corp. | | 19,113 | | | 415,498 |
Suzuki Motor Corp. | | 31,695 | | | 438,190 |
Takeda Pharmaceutical Co., Ltd. | | 16,575 | | | 859,786 |
Toyota Motor Corp. | | 194,070 | | | 6,352,460 |
Yamada Denki Co., Ltd. | | 7,940 | | | 551,209 |
| | | | | |
| | | | | 43,602,213 |
| | | | | |
|
Jersey—0.1% |
WPP, Plc. | | 97,978 | | | 571,137 |
| | | | | |
|
Luxembourg—0.4% |
ArcelorMittal (a) | | 134,913 | | | 3,251,836 |
| | | | | |
| | | | | |
| Security Description | | Shares | | Value* |
| | | | | |
|
Netherlands—3.1% |
Heineken NV | | 86,481 | | $ | 2,657,005 |
Koninklijke Philips Electronics NV | | 167,348 | | | 3,254,747 |
Reed Elsevier NV | | 38,508 | | | 453,704 |
Royal KPN NV | | 321,350 | | | 4,659,850 |
TNT NV | | 18,101 | | | 347,652 |
Unilever NV (a) | | 635,566 | | | 15,399,838 |
| | | | | |
| | | | | 26,772,796 |
| | | | | |
|
New Zealand—0.1% |
Auckland International Airport, Ltd. (a) | | 806,681 | | | 766,281 |
| | | | | |
|
Poland—2.2% |
Bank Handlowy w Warszawie S.A. | | 75,311 | | | 1,223,296 |
Bank Pekao S.A. | | 198,272 | | | 8,484,494 |
Powszechna Kasa Oszczednosci Bank Polski S.A. | | 796,038 | | | 9,536,676 |
| | | | | |
| | | | | 19,244,466 |
| | | | | |
|
Portugal—0.1% |
Energias de Portugal S.A. | | 140,366 | | | 529,032 |
| | | | | |
|
Russia—0.1% |
Federal Grid Co. (Unified Energy System JSC) (GDR) (144A) | | 65,893 | | | 141,670 |
InterRao Ues OAO (GDR) (144A) | | 13,649 | | | 40,947 |
Kuzbassenergo OJSC (GDR) (144A) (b) | | 4,558 | | | 5,470 |
Mosenergo OAO (GDR) (144A) (b) | | 14,760 | | | 22,944 |
OGK-1 OAO (GDR) (144A) (b) | | 278,217 | | | 166,930 |
OGK-2 OAO (GDR) (144A) (b) | | 72,327 | | | 51,280 |
OGK-3 OJSC (GDR) (144A) (b) | | 118,980 | | | 71,329 |
OGK-4 OJSC (GDR) (144A) (b) | | 66,991 | | | 56,942 |
OGK-6 OAO (GDR) (144A) (b) | | 84,324 | | | 73,193 |
Open Investments (GDR) (b) | | 5,897 | | | 44,965 |
ROA Energy Systems (GDR) (c) (d) | | 32,603 | | | 0 |
TGK-1 OAO (GDR) (144A) (b) | | 110,498 | | | 60,774 |
TGK-11 OAO (GDR) (144A) (b) | | 4,033 | | | 4,033 |
TGK-14 (GDR) (144A) (b) | | 1,055 | | | 18,990 |
TGK-2 (GDR) (144A) (b) | | 4,232 | | | 4,232 |
TGK-4 (GDR) (144A) (b) | | 10,345 | | | 11,897 |
TGK-9 OAO (GDR) (144A) (b) | | 10,976 | | | 10,976 |
Volga Territorial Generating Co. (GDR) (144A) (b) | | 48,310 | | | 39,228 |
Yenisei Territorial Generating Co. OJSC (GDR) (144A) (b) | | 11,236 | | | 10,112 |
| | | | | |
| | | | | 835,912 |
| | | | | |
|
Spain—4.1% |
EDP Renovaveis S.A. | | 190,638 | | | 1,335,024 |
Iberdrola Renovables (b) | | 123,852 | | | 535,470 |
Iberdrola S.A. | | 1,016,294 | | | 9,436,486 |
Inditex S.A. (a) | | 43,572 | | | 1,925,940 |
Telefonica S.A. | | 979,088 | | | 21,946,713 |
| | | | | |
| | | | | 35,179,633 |
| | | | | |
*See accompanying notes to financial statements.
MSF-6
Metropolitan Series Fund, Inc.
Julius Baer International Stock Portfolio
Schedule of Investments as of December 31, 2008
Common Stock—(Continued)
| | | | | |
| Security Description | | Shares | | Value* |
| | | | | |
|
Sweden—0.6% |
Getinge AB (Class B) (a) | | 73,113 | | $ | 876,199 |
Hennes & Mauritz AB (Series B) (a) | | 55,431 | | | 2,166,024 |
Svenska Cellulosa AB | | 151,332 | | | 1,294,117 |
TeliaSonera AB | | 96,233 | | | 478,979 |
| | | | | |
| | | | | 4,815,319 |
| | | | | |
|
Switzerland—6.8% |
ABB, Ltd. (a) | | 81,236 | | | 1,224,569 |
BKW FMB Energie AG | | 14,048 | | | 1,365,719 |
Compagnie Financiere Richemont S.A. (a) | | 41,584 | | | 807,335 |
Flughafen Zuerich AG | | 8,209 | | | 1,927,129 |
Holcim, Ltd. (a) | | 61,381 | | | 3,534,274 |
Nestle S.A. | | 562,452 | | | 22,167,681 |
Nobel Biocare Holding AG (a) | | 16,826 | | | 344,666 |
Novartis AG | | 268,537 | | | 13,454,909 |
Roche Holding AG | | 79,826 | | | 12,287,911 |
Swatch Group AG (Class B) (a) | | 6,698 | | | 935,614 |
| | | | | |
| | | | | 58,049,807 |
| | | | | |
|
Ukraine—0.0% |
UkrTelecom (GDR) | | 32,890 | | | 54,863 |
| | | | | |
|
United Kingdom—11.9% |
Anglo American, Plc. | | 105,029 | | | 2,399,025 |
BHP Billiton, Plc. | | 140,173 | | | 2,640,422 |
BP, Plc. | | 1,785,518 | | | 13,681,151 |
British American Tobacco, Plc. | | 153,315 | | | 3,983,639 |
Cadbury, Plc. | | 393,478 | | | 3,444,537 |
Diageo, Plc. | | 534,188 | | | 7,430,837 |
GlaxoSmithKline, Plc. | | 561,884 | | | 10,431,039 |
Imperial Tobacco Group, Plc. | | 149,099 | | | 3,982,901 |
National Grid, Plc. | | 182,326 | | | 1,801,867 |
Rio Tinto, Plc. | | 110,318 | | | 2,390,241 |
Rolls-Royce Group, Plc. | | 189,471 | | | 928,198 |
Royal Dutch Shell, Plc. (EUR) | | 661,648 | | | 17,244,811 |
Scottish & Southern Energy, Plc. | | 84,972 | | | 1,496,171 |
Smith & Nephew, Plc. | | 680,402 | | | 4,316,939 |
Tesco, Plc. | | 2,211,473 | | | 11,521,579 |
Vodafone Group, Plc. | | 5,878,858 | | | 11,834,809 |
WM Morrison Supermarkets, Plc. | | 484,844 | | | 1,966,416 |
| | | | | |
| | | | | 101,494,582 |
| | | | | |
|
United States—0.1% |
Dr. Pepper Snapple Group, Inc. (b) | | 12,961 | | | 210,616 |
Synthes, Inc. (CHF) | | 5,141 | | | 649,855 |
| | | | | |
| | | | | 860,471 |
| | | | | |
Total Common Stock
(Identified Cost $879,847,532) | | | | | 706,875,542 |
| | | | | |
| | | | | | | |
| | |
| Mutual Funds—4.7% | | | | | | | |
| Security Description | | Shares | | Value* | |
| | | | | | | |
| | |
Japan—3.9% | | | | | | | |
TOPIX Exchange Traded Fund | | | 3,392,129 | | $ | 33,718,551 | |
| | | | | | | |
| | |
South Korea—0.8% | | | | | | | |
iShares MSCI South Korea Index Fund
(USD) (a) | | | 241,637 | | | 6,739,256 | |
| | | | | | | |
Total Mutual Funds
(Identified Cost $39,299,295) | | | | | | 40,457,807 | |
| | | | | | | |
| | |
| Warrants—0.2% | | | | | | | |
| | |
Romania—0.2% | | | | | | | |
BRD-Groupe | | | 408,718 | | | 1,160,759 | |
| | | | | | | |
| | |
Russia—0.0% | | | | | | | |
Unified Energy System of Russia (144A) | | | 112 | | | 140,495 | |
| | | | | | | |
Total Warrants
(Identified Cost $5,530,518) | | | | | | 1,301,254 | |
| | | | | | | |
|
| Short Term Investments—12.7% | |
| Security Description | | Shares/
Face Amount | | Value* | |
| | |
United States—12.7% | | | | | | | |
State Street Navigator Securities Lending Prime Portfolio (e) | | | 27,877,019 | | | 27,877,019 | |
State Street Repurchase Agreement dated 12/31/08 at 0.010% to be repurchased at $80,684,045 on 01/02/09, collateralized by $115,000 Federal Home Loan Bank 4.375% due 09/17/10 with a value of $122,406; by $53,710,000 Federal Home Loan Bank 2.730% due 06/10/09 with a value of $54,316,923; and by $27,865,000 U.S. Treasury Bill due 2/26/09 with a value of $27,862,214. | | $ | 80,684,000 | | | 80,684,000 | |
| | | | | | | |
Total Short Term Investments
(Identified Cost $108,561,019) | | | | | | 108,561,019 | |
| | | | | | | |
Total Investments—100.4%
(Identified Cost $1,033,238,364) (f) | | | | | | 857,195,622 | |
Liabilities in excess of other assets | | | | | | (3,801,051 | ) |
| | | | | | | |
| Total Net Assets—100% | | | | | $ | 853,394,571 | |
| | | | | | | |
*See accompanying notes to financial statements.
MSF-7
Metropolitan Series Fund, Inc.
Julius Baer International Stock Portfolio
Schedule of Investments as of December 31, 2008
| (a) | A portion or all of the security was on loan. As of December 31, 2008, the market value of securities loaned was $26,326,772 and the collateral received consisted of cash in the amount of $27,877,019. The cash collateral is invested in a money market fund managed by an affiliate of the custodian. |
| (d) | Security was valued in good faith under procedures established by the Board of Directors. |
| (e) | Represents investment of cash collateral received from securities lending transactions. |
| (f) | The aggregate cost of investments for federal income tax purposes as of December 31, 2008 was $1,083,574,465 and the composition of unrealized appreciation and depreciation of investment securities was $17,272,214 and $(243,651,057), respectively. |
| (144A)— | Securities exempt from registration under Rule 144A of the Securities Act of 1933. These securities may be resold in transactions exempt from registration, normally to qualified institutional buyers. As of December 31, 2008, the market value of 144A securities was $931,442, which is 0.1% of total net assets. |
| (GDR)— | Global Depository Receipt. |
| (USD)— | United States Dollar |
| | |
Ten Largest Industries as of
December 31, 2008 (Unaudited) | | Percentage of
Total Net Assets |
Oil, Gas & Consumable Fuels | | 13.3% |
Diversified Telecommunication Services | | 9.3% |
Mutual Funds | | 6.3% |
Food Products | | 5.3% |
Commercial Banks | | 5.1% |
Electric Utilities | | 5.0% |
Semiconductors & Semiconductor Equipment | | 3.9% |
Metals & Mining | | 3.8% |
Transportation Infrastructure | | 3.2% |
Pharmaceuticals | | 3.2% |
Forward Contracts
| | | | | | | | | | | | | | |
Forward Currency Contracts | | Delivery Date | | Local
Currency
Amount | | Aggregate
Face
Value | | Valuation as of
12/31/2008 | | Unrealized
Appreciation/
(Depreciation) | |
Australian Dollar (bought) | | 1/29/2009 | | 8,891,540 | | $ | 5,456,560 | | $ | 6,185,149 | | $ | 728,589 | |
Australian Dollar (sold) | | 1/29/2009 | | 8,891,540 | | | 5,843,253 | | | 6,185,149 | | | (341,896 | ) |
Canadian Dollar (bought) | | 1/12/2009 | | 33,751,979 | | | 26,838,405 | | | 27,563,976 | | | 725,571 | |
Czech Koruna (bought) | | 10/27/2009 | | 27,751,209 | | | 1,501,689 | | | 1,429,132 | | | (72,557 | ) |
Czech Koruna (sold) | | 1/14/2009 | | 32,234,169 | | | 1,757,972 | | | 1,671,760 | | | 86,212 | |
Czech Koruna (sold) | | 1/14/2009 | | 32,431,062 | | | 1,757,972 | | | 1,681,972 | | | 76,000 | |
Czech Koruna (sold) | | 1/21/2009 | | 8,669,188 | | | 461,434 | | | 449,434 | | | 12,000 | |
Czech Koruna (sold) | | 4/20/2009 | | 10,040,276 | | | 536,511 | | | 518,874 | | | 17,637 | |
Czech Koruna (sold) | | 5/21/2009 | | 25,986,555 | | | 1,291,257 | | | 1,341,251 | | | (49,994 | ) |
Czech Koruna (sold) | | 7/14/2009 | | 6,451,756 | | | 351,594 | | | 332,437 | | | 19,157 | |
Czech Koruna (sold) | | 10/14/2009 | | 6,476,368 | | | 351,594 | | | 333,543 | | | 18,051 | |
Czech Koruna (sold) | | 10/27/2009 | | 12,779,621 | | | 650,362 | | | 658,125 | | | (7,763 | ) |
Czech Koruna (sold) | | 10/27/2009 | | 51,261,563 | | | 2,601,450 | | | 2,639,868 | | | (38,418 | ) |
Czech Koruna (sold) | | 10/27/2009 | | 64,888,685 | | | 3,237,474 | | | 3,341,637 | | | (104,163 | ) |
Hungarian Forint (bought) | | 5/12/2009 | | 450,439,162 | | | 2,191,065 | | | 2,314,593 | | | 123,528 | |
Hungarian Forint (sold) | | 5/12/2009 | | 1,088,288,539 | | | 5,034,024 | | | 5,592,199 | | | (558,175 | ) |
Hungarian Forint (sold) | | 5/12/2009 | | 1,697,970,023 | | | 7,930,733 | | | 8,725,063 | | | (794,330 | ) |
Japanese Yen (bought) | | 1/16/2009 | | 227,797,909 | | | 2,487,012 | | | 2,509,309 | | | 22,297 | |
Japanese Yen (bought) | | 1/16/2009 | | 511,944,912 | | | 5,724,340 | | | 5,639,331 | | | (85,009 | ) |
Japanese Yen (bought) | | 1/16/2009 | | 646,107,524 | | | 7,137,732 | | | 7,117,199 | | | (20,533 | ) |
Japanese Yen (bought) | | 1/16/2009 | | 827,586,334 | | | 9,236,455 | | | 9,116,280 | | | (120,175 | ) |
Polish Zloty (bought) | | 10/20/2009 | | 7,813,597 | | | 2,814,190 | | | 2,582,348 | | | (231,842 | ) |
Polish Zloty (bought) | | 10/20/2009 | | 11,337,990 | | | 4,241,373 | | | 3,747,139 | | | (494,234 | ) |
Polish Zloty (bought) | | 11/19/2009 | | 30,799,561 | | | 11,394,221 | | | 10,170,952 | | | (1,223,269 | ) |
Polish Zloty (sold) | | 5/7/2009 | | 5,452,875 | | | 2,003,850 | | | 1,812,345 | | | 191,505 | |
Polish Zloty (sold) | | 5/7/2009 | | 11,174,267 | | | 4,007,699 | | | 3,713,934 | | | 293,765 | |
Polish Zloty (sold) | | 5/11/2009 | | 11,413,226 | | | 4,007,699 | | | 3,792,594 | | | 215,105 | |
Polish Zloty (sold) | | 5/11/2009 | | 11,798,930 | | | 4,096,623 | | | 3,920,763 | | | 175,860 | |
Polish Zloty (sold) | | 5/21/2009 | | 913,789 | | | 296,974 | | | 303,498 | | | (6,524 | ) |
Polish Zloty (sold) | | 5/21/2009 | | 5,045,260 | | | 1,639,669 | | | 1,675,689 | | | (36,020 | ) |
Polish Zloty (sold) | | 10/20/2009 | | 19,151,588 | | | 6,107,985 | | | 6,329,488 | | | (221,503 | ) |
Polish Zloty (sold) | | 11/19/2009 | | 7,419,978 | | | 2,353,494 | | | 2,450,302 | | | (96,808 | ) |
Polish Zloty (sold) | | 11/19/2009 | | 23,379,583 | | | 7,458,078 | | | 7,720,649 | | | (262,571 | ) |
| | | | | | | | | | | | | | |
Net Unrealized Depreciation | | $ | (2,060,507 | ) |
| | | | |
*See accompanying notes to financial statements.
MSF-8
Metropolitan Series Fund, Inc.
Julius Baer International Stock Portfolio
Schedule of Investments as of December 31, 2008
Futures Contracts
| | | | | | | | | | | | | |
Futures Contracts—Long | | Expiration Date | | Number of
Contracts | | Contract
Amount | | Valuation as of
12/31/2008 | | Unrealized
Appreciation |
DJ Euro Stoxx 50 Index Futures | | 3/20/2009 | | 1,133 | | $ | 38,180,224 | | $ | 38,585,681 | | $ | 405,457 |
Hang Seng Index Futures | | 1/29/2009 | | 149 | | | 13,705,040 | | | 13,847,030 | | | 141,990 |
| | | | | | | | | | | | | |
Net Unrealized Appreciation | | | | | | | | | | | | $ | 547,447 |
| | | | | | | | | | | | | |
The Portfolio adopted the provisions of Statement of Financial Accounting Standards No. 157, “Fair Value Measurements” (FAS 157), effective with the beginning of the Portfolio’s fiscal year. FAS 157 establishes a framework for measuring fair value and expands disclosures about fair value measurements in financial statements. The three levels of the hierarchy under FAS 157 are described below:
Level 1 - quoted prices in active markets for identical securities
Level 2 - other significant observable inputs (including quoted prices for similar securities, interest rates, credit risk, etc.)
Level 3 - significant unobservable inputs (including the Portfolio’s own assumptions in determining the fair value of investments)
The inputs or methodology used for valuing securities are not necessarily an indication of the risk associated with investing in those securities.
The following is a summary of the inputs used to value the Portfolio’s net assets as of December 31, 2008:
| | | | | | | |
| Valuation Inputs | | Investments In
Securities | | Other Financial
Instruments* | |
Level 1 - Quoted Prices | | $ | 57,446,752 | | $ | 547,447 | |
Level 2 - Other Significant Observable Inputs | | | 799,748,870 | | | (2,060,507 | ) |
Level 3 - Significant Unobservable Inputs | | | 0 | | | 0 | |
Total | | $ | 857,195,622 | | $ | (1,513,060 | ) |
* Other financial instruments are derivative instruments not reflected in the Schedule of Investments, such as futures, forwards, swap contracts and written options, which are valued based on the unrealized appreciation/depreciation on the instrument.
Following is a reconciliation of Level 3 assets for which significant unobservable inputs were used to determine fair value:
| | | | |
| | | Investments in
Securities | | Other Financial
Instruments |
| Balance as of January 1, 2008 | | $0 | | $0 |
Transfers in (Out) of Level 3 | | 3,260,300 | | 0 |
Accrued discounts/premiums | | 0 | | 0 |
Realized Gain (Loss) | | 0 | | 0 |
Change in unrealized appreciation (depreciation) | | (2,431,658) | | 0 |
| Net Purchases (Sales) | | (828,642) | | 0 |
| Balance as of December 31, 2008 | | $0 | | $0 |
See accompanying notes to financial statements.
MSF-9
Metropolitan Series Fund, Inc.
Julius Baer International Stock Portfolio
Statement of Assets & Liabilities
December 31, 2008
| | | | | | | |
Assets | | | | | | | |
Investments at value (a) (b) | | | | | $ | 857,195,622 | |
Cash | | | | | | 408 | |
Restricted cash pledged as collateral against futures | | | | | | 8,601,090 | |
Foreign cash at value (c) | | | | | | 16,717,847 | |
Receivable for: | | | | | | | |
Securities sold | | | | | | 626,331 | |
Fund shares sold | | | | | | 1,245,372 | |
Open forward currency contracts—net | | | | | | 1,553,696 | |
Accrued interest and dividends | | | | | | 632,955 | |
Foreign taxes | | | | | | 172,333 | |
Futures variation margin | | | | | | 111,297 | |
| | | | | | | |
Total Assets | | | | | | 886,856,951 | |
Liabilities | | | | | | | |
Payable for: | | | | | | | |
Securities purchased | | $ | 967,342 | | | | |
Fund shares redeemed | | | 266,189 | | | | |
Open forward currency contracts-net | | | 3,614,203 | | | | |
Withholding taxes | | | 46,034 | | | | |
Collateral for securities loaned | | | 27,877,019 | | | | |
Accrued expenses: | | | | | | | |
Management fees | | | 551,678 | | | | |
Service and distribution fees | | | 20,517 | | | | |
Other expenses | | | 119,398 | | | | |
| | | | | | | |
Total Liabilities | | | | | | 33,462,380 | |
| | | | | | | |
Net Assets | | | | | $ | 853,394,571 | |
| | | | | | | |
Net assets consists of: | | | | | | | |
Capital paid in | | | | | $ | 1,440,006,010 | |
Undistributed net investment income | | | | | | 5,994,426 | |
Accumulated net realized losses | | | | | | (415,486,195 | ) |
Unrealized depreciation on investments, futures contracts and foreign currency | | | | | | (177,119,670 | ) |
| | | | | | | |
Net Assets | | | | | $ | 853,394,571 | |
| | | | | | | |
| Computation of offering price: | | | | | | | |
Class A | | | | | | | |
Net asset value and redemption price per share ($736,560,676 divided by 94,423,689 shares outstanding) | | | | | $ | 7.80 | |
| | | | | | | |
Class B | | | | | | | |
Net asset value and redemption price per share ($79,531,829 divided by 10,346,641 shares outstanding) | | | | | $ | 7.69 | |
| | | | | | | |
Class E | | | | | | | |
Net asset value and redemption price per share ($37,302,066 divided by 4,832,192 shares outstanding) | | | | | $ | 7.72 | |
| | | | | | | |
(a) Identified cost of investments | | | | | $ | 1,033,238,364 | |
| | | | | | | |
(b) Includes cash collateral for securities loaned of | | | | | $ | 27,877,019 | |
| | | | | | | |
(c) Identified cost of foreign cash | | | | | $ | 16,013,843 | |
| | | | | | | |
Statement of Operations
For the Year Ended December 31, 2008
| | | | | | | | |
Investment Income | | | | | | | | |
Dividends | | | | | | $ | 27,435,229 | (a) |
Interest | | | | | | | 2,181,418 | (b) |
| | | | | | | | |
| | | | | | | 29,616,647 | |
Expenses | | | | | | | | |
Management fees | | $ | 8,555,559 | | | | | |
Service and distribution fees—Class B | | | 254,895 | | | | | |
Service and distribution fees—Class E | | | 81,138 | | | | | |
Directors’ fees and expenses | | | 31,907 | | | | | |
Custodian | | | 909,743 | | | | | |
Audit and tax services | | | 42,591 | | | | | |
Legal | | | 25,256 | | | | | |
Printing | | | 343,728 | | | | | |
Insurance | | | 12,672 | | | | | |
Miscellaneous | | | 23,676 | | | | | |
| | | | | | | | |
Total expenses | | | 10,281,165 | | | | | |
Expense reductions | | | (72,648 | ) | | | | |
Management fee waivers | | | (327,445 | ) | | | 9,881,072 | |
| | | | | | | | |
Net Investment Income | | | | | | | 19,735,575 | |
| | | | | | | | |
Realized and Unrealized Loss | | | | | | | | |
| Realized loss on: | | | | | | | | |
Investments—net | | | (354,850,086 | ) | | | | |
Futures contracts—net | | | (56,721,447 | ) | | | | |
Foreign currency transactions—net | | | (15,381,915 | ) | | | (426,953,448 | ) |
| | | | | | | | |
Change in unrealized appreciation (depreciation) on: | | | | | | | | |
Investments—net | | | (243,915,448 | ) | | | | |
Futures contracts—net | | | 327,836 | | | | | |
Foreign currency transactions—net | | | (1,433,264 | ) | | | (245,020,876 | ) |
| | | | | | | | |
Net loss | | | | | | | (671,974,324 | ) |
| | | | | | | | |
Net Decrease in Net Assets From Operations | | | | | | $ | (652,238,749 | ) |
| | | | | | | | |
| (a) | Net of foreign taxes of $3,022,682. |
| (b) | Includes income on securities loaned of $1,514,473. |
See accompanying notes to financial statements.
MSF-10
Metropolitan Series Fund, Inc.
Julius Baer International Stock Portfolio
Statements of Changes in Net Assets
| | | | | | | | |
| | | Year ended
December 31,
2008 | | | Year ended
December 31,
2007 | |
From Operations | | | | | | | | |
Net investment income | | $ | 19,735,575 | | | $ | 9,503,561 | |
Net realized gain (loss) | | | (426,953,448 | ) | | | 110,952,075 | |
Unrealized depreciation | | | (245,020,876 | ) | | | (46,120,730 | ) |
| | | | | | | | |
Increase (decrease) in net assets from operations | | | (652,238,749 | ) | | | 74,334,906 | |
| | | | | | | | |
From Distributions to Shareholders | | | | | | | | |
Net investment income | | | | | | | | |
Class A | | | (19,438,119 | ) | | | (6,573,819 | ) |
Class B | | | (2,840,662 | ) | | | (868,894 | ) |
Class E | | | (1,636,280 | ) | | | (684,687 | ) |
| | | | | | | | |
| | | (23,915,061 | ) | | | (8,127,400 | ) |
| | | | | | | | |
Net realized gain | | | | | | | | |
Class A | | | (74,892,503 | ) | | | (31,935,315 | ) |
Class B | | | (12,123,822 | ) | | | (5,344,633 | ) |
Class E | | | (6,705,711 | ) | | | (3,801,346 | ) |
| | | | | | | | |
| | | (93,722,036 | ) | | | (41,081,294 | ) |
| | | | | | | | |
Total distributions | | | (117,637,097 | ) | | | (49,208,694 | ) |
| | | | | | | | |
Increase in net assets from capital share transactions | | | 700,649,792 | | | | 181,504,573 | |
| | | | | | | | |
Net increase (decrease) in net assets | | | (69,226,054 | ) | | | 206,630,785 | |
| | |
Net Assets | | | | | | | | |
Beginning of the period | | | 922,620,625 | | | | 715,989,840 | |
| | | | | | | | |
End of the period | | $ | 853,394,571 | | | $ | 922,620,625 | |
| | | | | | | | |
Undistributed Net Investment Income | | | | | | | | |
End of the period | | $ | 5,994,426 | | | $ | 23,850,095 | |
| | | | | | | | |
Other Information:
Capital Shares
Transactions in capital shares were as follows:
| | | | | | | | | | | | | | |
| | | Year ended
December 31, 2008 | | | Year ended
December 31, 2007 | |
| | | Shares | | | $ | | | Shares | | | $ | |
Class A | | | | | | | | | | | | | | |
Sales | | 60,821,205 | | | $ | 759,191,170 | | | 16,846,288 | | | $ | 270,473,730 | |
Reinvestments | | 7,222,865 | | | | 94,330,622 | | | 2,445,024 | | | | 38,509,134 | |
Redemptions | | (19,302,404 | ) | | | (191,337,365 | ) | | (8,950,622 | ) | | | (142,801,144 | ) |
| | | | | | | | | | | | | | |
Net increase | | 48,741,666 | | | $ | 662,184,427 | | | 10,340,690 | | | $ | 166,181,720 | |
| | | | | | | | | | | | | | |
Class B | | | | | | | | | | | | | | |
Sales | | 3,101,609 | | | $ | 34,489,498 | | | 2,842,370 | | | $ | 44,791,023 | |
Reinvestments | | 1,160,038 | | | | 14,964,484 | | | 399,070 | | | | 6,213,527 | |
Redemptions | | (1,437,703 | ) | | | (15,862,167 | ) | | (1,958,960 | ) | | | (30,811,895 | ) |
| | | | | | | | | | | | | | |
Net increase | | 2,823,944 | | | $ | 33,591,815 | | | 1,282,480 | | | $ | 20,192,655 | |
| | | | | | | | | | | | | | |
Class E | | | | | | | | | | | | | | |
Sales | | 866,362 | | | $ | 9,350,386 | | | 557,684 | | | $ | 8,839,481 | |
Reinvestments | | 644,667 | | | | 8,341,991 | | | 287,198 | | | | 4,486,033 | |
Redemptions | | (1,141,165 | ) | | | (12,818,827 | ) | | (1,148,836 | ) | | | (18,195,316 | ) |
| | | | | | | | | | | | | | |
Net increase (decrease) | | 369,864 | | | $ | 4,873,550 | | | (303,954 | ) | | $ | (4,869,802 | ) |
| | | | | | | | | | | | | | |
Increase derived from capital share transactions | | | | | $ | 700,649,792 | | | | | | $ | 181,504,573 | |
| | | | | | | | | | | | | | |
See accompanying notes to financial statements.
MSF-11
Metropolitan Series Fund, Inc.
Julius Baer International Stock Portfolio
Financial Highlights
| | | | | | | | | | | | | | | | | | | | |
| | | Class A | |
| | | Year ended December 31, | |
| | | 2008 | | | 2007 | | | 2006 | | | 2005 | | | 2004 | |
Net Asset Value, Beginning of Period | | $ | 16.04 | | | $ | 15.49 | | | $ | 13.48 | | | $ | 11.50 | | | $ | 9.86 | |
| | | | | | | | | | | | | | | | | | | | |
Income From Investment Operations | | | | | | | | | | | | | | | | | | | | |
Net investment income | | | 0.22 | (a) | | | 0.20 | (a) | | | 0.13 | | | | 0.14 | | | | 0.10 | |
Net realized and unrealized gain (loss) of investments | | | (6.51 | ) | | | 1.38 | | | | 2.09 | | | | 1.92 | | | | 1.68 | |
| | | | | | | | | | | | | | | | | | | | |
Total from investment operations | | | (6.29 | ) | | | 1.58 | | | | 2.22 | | | | 2.06 | | | | 1.78 | |
| | | | | | | | | | | | | | | | | | | | |
Less Distributions | | | | | | | | | | | | | | | | | | | | |
Distributions from net investment income | | | (0.40 | ) | | | (0.17 | ) | | | (0.21 | ) | | | (0.08 | ) | | | (0.14 | ) |
Distributions from net realized capital gains | | | (1.55 | ) | | | (0.86 | ) | | | 0.00 | | | | 0.00 | | | | 0.00 | |
| | | | | | | | | | | | | | | | | | | | |
Total distributions | | | (1.95 | ) | | | (1.03 | ) | | | (0.21 | ) | | | (0.08 | ) | | | (0.14 | ) |
| | | | | | | | | | | | | | | | | | | | |
Net Asset Value, End of Period | | $ | 7.80 | | | $ | 16.04 | | | $ | 15.49 | | | $ | 13.48 | | | $ | 11.50 | |
| | | | | | | | | | | | | | | | | | | | |
Total Return (%) | | | (44.1 | ) | | | 10.3 | | | | 16.5 | | | | 18.0 | | | | 18.2 | |
Ratio of operating expenses to average net assets before expense reductions (%) | | | 0.92 | | | | 0.96 | | | | 1.05 | | | | 1.06 | | | | 1.08 | |
Ratio of operating expenses to average net assets after expense reductions (%) (b) | | | 0.92 | | | | 0.92 | | | | 1.00 | | | | 1.01 | | | | 1.06 | |
Ratio of operating expenses to average net assets without giving effect to the contractual expense agreement would have been (%) (c) | | | 0.95 | | | | N/A | | | | N/A | | | | N/A | | | | N/A | |
Ratio of net investment income to average net assets (%) | | | 1.96 | | | | 1.22 | | | | 1.00 | | | | 1.23 | | | | 0.85 | |
Portfolio turnover rate (%) | | | 195 | | | | 100 | | | | 86 | | | | 69 | | | | 90 | |
Net assets, end of period (000) | | $ | 736,561 | | | $ | 732,643 | | | $ | 547,335 | | | $ | 413,322 | | | $ | 344,340 | |
| | | | | | | | | | | | | | | | | | | | |
| | | Class B | |
| | | Year ended December 31, | |
| | | 2008 | | | 2007 | | | 2006 | | | 2005 | | | 2004 | |
Net Asset Value, Beginning of Period | | $ | 15.83 | | | $ | 15.30 | | | $ | 13.33 | | | $ | 11.38 | | | $ | 9.76 | |
| | | | | | | | | | | | | | | | | | | | |
Income From Investment Operations | | | | | | | | | | | | | | | | | | | | |
Net investment income | | | 0.17 | (a) | | | 0.15 | (a) | | | 0.12 | | | | 0.12 | | | | 0.07 | |
Net realized and unrealized gain (loss) of investments | | | (6.40 | ) | | | 1.37 | | | | 2.03 | | | | 1.88 | | | | 1.67 | |
| | | | | | | | | | | | | | | | | | | | |
Total from investment operations | | | (6.23 | ) | | | 1.52 | | | | 2.15 | | | | 2.00 | | | | 1.74 | |
| | | | | | | | | | | | | | | | | | | | |
Less Distributions | | | | | | | | | | | | | | | | | | | | |
Distributions from net investment income | | | (0.36 | ) | | | (0.13 | ) | | | (0.18 | ) | | | (0.05 | ) | | | (0.12 | ) |
Distributions from net realized capital gains | | | (1.55 | ) | | | (0.86 | ) | | | 0.00 | | | | 0.00 | | | | 0.00 | |
| | | | | | | | | | | | | | | | | | | | |
Total distributions | | | (1.91 | ) | | | (0.99 | ) | | | (0.18 | ) | | | (0.05 | ) | | | (0.12 | ) |
| | | | | | | | | | | | | | | | | | | | |
Net Asset Value, End of Period | | $ | 7.69 | | | $ | 15.83 | | | $ | 15.30 | | | $ | 13.33 | | | $ | 11.38 | |
| | | | | | | | | | | | | | | | | | | | |
Total Return (%) | | | (44.2 | ) | | | 10.1 | | | | 16.2 | | | | 17.6 | | | | 18.0 | |
Ratio of operating expenses to average net assets before expense reductions (%) | | | 1.17 | | | | 1.21 | | | | 1.30 | | | | 1.31 | | | | 1.33 | |
Ratio of operating expenses to average net assets after expense reductions (%) (b) | | | 1.17 | | | | 1.17 | | | | 1.25 | | | | 1.26 | | | | 1.31 | |
Ratio of operating expenses to average net assets without giving effect to the contractual expense agreement would have been (%) (c) | | | 1.20 | | | | N/A | | | | N/A | | | | N/A | | | | N/A | |
Ratio of net investment income to average net assets (%) | | | 1.52 | | | | 0.96 | | | | 0.72 | | | | 0.89 | | | | 0.56 | |
Portfolio turnover rate (%) | | | 195 | | | | 100 | | | | 86 | | | | 69 | | | | 90 | |
Net assets, end of period (000) | | $ | 79,532 | | | $ | 119,073 | | | $ | 95,473 | | | $ | 54,530 | | | $ | 24,612 | |
| Please | see following page for Financial Highlights footnote legend. |
See accompanying notes to financial statements.
MSF-12
Metropolitan Series Fund, Inc.
Julius Baer International Stock Portfolio
Financial Highlights
| | | | | | | | | | | | | | | | | | | | |
| | | Class E | |
| | | Year ended December 31, | |
| | | 2008 | | | 2007 | | | 2006 | | | 2005 | | | 2004 | |
Net Asset Value, Beginning of Period | | $ | 15.89 | | | $ | 15.35 | | | $ | 13.37 | | | $ | 11.41 | | | $ | 9.79 | |
Income From Investment Operations | | | | | | | | | | | | | | | | | | | | |
Net investment income | | | 0.19 | (a) | | | 0.18 | (a) | | | 0.12 | | | | 0.13 | | | | 0.07 | |
Net realized and unrealized gain (loss) of investments | | | (6.43 | ) | | | 1.37 | | | | 2.05 | | | | 1.89 | | | | 1.68 | |
| | | | | | | | | | | | | | | | | | | | |
Total from investment operations | | | (6.24 | ) | | | 1.55 | | | | 2.17 | | | | 2.02 | | | | 1.75 | |
| | | | | | | | | | | | | | | | | | | | |
Less Distributions | | | | | | | | | | | | | | | | | | | | |
Distributions from net investment income | | | (0.38 | ) | | | (0.15 | ) | | | (0.19 | ) | | | (0.06 | ) | | | (0.13 | ) |
Distributions from net realized capital gains | | | (1.55 | ) | | | (0.86 | ) | | | 0.00 | | | | 0.00 | | | | 0.00 | |
| | | | | | | | | | | | | | | | | | | | |
Total distributions | | | (1.93 | ) | | | (1.01 | ) | | | (0.19 | ) | | | (0.06 | ) | | | (0.13 | ) |
| | | | | | | | | | | | | | | | | | | | |
Net Asset Value, End of Period | | $ | 7.72 | | | $ | 15.89 | | | $ | 15.35 | | | $ | 13.37 | | | $ | 11.41 | |
| | | | | | | | | | | | | | | | | | | | |
Total Return (%) | | | (44.2 | ) | | | 10.2 | | | | 16.3 | | | | 17.8 | | | | 18.0 | |
Ratio of operating expenses to average net assets before expense reductions (%) | | | 1.07 | | | | 1.11 | | | | 1.20 | | | | 1.21 | | | | 1.23 | |
Ratio of operating expenses to average net assets after expense reductions (%) (b) | | | 1.07 | | | | 1.07 | | | | 1.15 | | | | 1.16 | | | | 1.21 | |
Ratio of operating expenses to average net assets without giving effect to the contractual expense agreement would have been (%) (c) | | | 1.10 | | | | N/A | | | | N/A | | | | N/A | | | | N/A | |
Ratio of net investment income to average net assets (%) | | | 1.64 | | | | 1.10 | | | | 0.89 | | | | 1.08 | | | | 0.70 | |
Portfolio turnover rate (%) | | | 195 | | | | 100 | | | | 86 | | | | 69 | | | | 90 | |
Net assets, end of period (000) | | $ | 37,302 | | | $ | 70,905 | | | $ | 73,182 | | | $ | 66,569 | | | $ | 58,712 | |
| (a) | Per share amount is based on average shares outstanding during the period. |
| (b) | The Portfolio has entered into arrangements with certain brokers who paid a portion of the Portfolio’s expenses. |
| (c) | See Note 4 of the Notes to Financial Statements. |
See accompanying notes to financial statements.
MSF-13
Metropolitan Series Fund, Inc.
Julius Baer International Stock Portfolio
Notes to Financial Statements—December 31, 2008
Metropolitan Series Fund, Inc. (the “Fund”) is organized as a corporation under the laws of Maryland pursuant to Articles of Incorporation filed on November 23, 1982, as amended, and registered under the Investment Company Act of 1940, as amended (the “1940 Act”), as an open-end investment company. The Fund is a “series” type of mutual fund, which issues separate series of stock. Each series represents an interest in a separate portfolio of Fund investments. The Julius Baer International Stock Portfolio (the “Portfolio”) is a diversified series of the Fund. Shares in the Fund are not offered directly to the general public and are currently available only to separate accounts established by Metropolitan Life Insurance Company (“MetLife”), New England Life Insurance Company, General American Life Insurance Company (“General American”), The MetLife Investors Group of Insurance Companies, MetLife Insurance Company of Connecticut and other affiliated insurance companies (collectively, the “Insurance Companies”) and to certain eligible qualified retirement plans (“Qualified Plans”), as an investment vehicle for variable life insurance, group annuity or variable annuity products of these insurance companies or Qualified Plans, although the Portfolio is not available to all such separate accounts and Qualified Plans. The Portfolio’s shares may be divided into different classes. Currently, the classes being offered by the Portfolio are named Class A, Class B and Class E. The classes of the Portfolio’s shares are identical, except that certain additional charges (Rule 12b-1 fees) are made against Class B and Class E shares. Investment income, realized and unrealized capital gains and losses, the common expenses of the Portfolio and certain Portfolio-level expense reductions, if any, are allocated daily, on a pro rata basis, to each class based on the relative net assets of each class to the total net assets of the Portfolio.
| 2. | SIGNIFICANT ACCOUNTING POLICIES: |
The preparation of financial statements in conformity with accounting principles generally accepted in the United States of America (“GAAP”) requires management to make estimates and assumptions that affect the reported amounts of assets and liabilities and disclosure of contingent assets and liabilities as of the date of the financial statements and the reported amounts of income and expenses during the reporting period. Actual results could differ from those estimates.
The following is a summary of significant accounting policies consistently followed by the Portfolio in the preparation of its financial statements. The policies are in conformity with GAAP.
Investment Valuation:
Debt securities (other than short term obligations with a remaining maturity of sixty days or less) are generally valued on the basis of evaluated or composite bid quotations obtained by independent pricing services and/or brokers and dealers selected by the relevant subadviser pursuant to authorization of the Board of Directors of the Fund (the “Board” or “Directors”). Such quotations take into account appropriate factors such as institutional-sized trading in similar groups of securities, yield, quality, coupon rate, maturity, type of issue, trading characteristics and other data. Short term obligations with a remaining maturity of sixty days or less are valued at amortized cost which approximates fair market value.
Equity securities traded on a national securities exchange or other exchanges are valued at their last sale price on the principal trading market. Equity securities traded on the NASDAQ National Market System are valued at the NASDAQ Official Closing Price (the “NOCP”). The NOCP is the last reported sale price if the last reported sale price falls between the spread of the last reported bid and asked prices. If the last reported bid and asked prices are above the last reported sale price, the NOCP will be the last reported bid price. If the last reported bid and asked prices are below the last reported sale price, the NOCP will be the last reported asked price. Equity securities traded on a national securities exchange or other exchanges or on the NASDAQ National Market System for which there is no reported sale during the day are valued at the last reported bid price. A security that is listed or traded on more than one exchange is valued at the quotation on the exchange determined to be the primary market for that security by the Board or its delegates. If no closing price is available, then such securities are valued by using the last reported bid price. Equity securities traded over-the-counter are valued at the last reported sales price.
If no current market value quotation is readily available or reliable for a portfolio security, fair value will be determined in accordance with procedures established by and under the general supervision of the Board. When the Portfolio uses fair value pricing, it may take into account any factors it deems appropriate. The value of securities used by the Portfolio to calculate its net asset value may differ from quoted or published prices for the same securities. Fair value pricing involves subjective judgments and the fair value determined for a security may be materially different than the value that could be realized upon the sale of that security.
MSF-14
Metropolitan Series Fund, Inc.
Julius Baer International Stock Portfolio
Notes to Financial Statements—December 31, 2008—(Continued)
The Portfolio expects to use fair value pricing for securities primarily traded on U.S. exchanges only under very limited circumstances. For example, the Portfolio may use fair value pricing if the exchange on which a security is traded closes early or trading in the security is suspended.
Securities traded primarily on an exchange outside of the United States which closes before the close of the New York Stock Exchange will be valued at the last sales price on that non-U.S. exchange. Securities traded primarily on an exchange outside of the United States for which there is no reported sale during the day are valued at the mean between the last reported bid and asked prices. However, because most foreign markets close well before the Portfolio values its securities (typically at 4 p.m. Eastern Time), the earlier close of these foreign markets gives rise to the possibility that significant events, including broad market moves, may have occurred after these foreign markets close but before the Portfolio values its securities. To account for this, the Portfolio may frequently value many of its foreign equity securities using fair value prices based on third party vendor modeling tools.
Forward foreign currency exchange contracts are valued based on the mean between closing bid and asked prices of the forward currency contract rates in the London foreign exchange markets on a daily basis as provided by a reliable bank or dealer.
Options, whether on securities, indices, futures contracts, or otherwise, are valued at the last sales price available as of the close of business on the day of valuation or, if there is no such sale price available, at the mean between the bid and asked prices. Options on currencies are valued at the spot price each day.
The value of futures contracts will be the sum of the margin deposit plus or minus the difference between the value of the futures contract on each day the net asset value is calculated and the value on the date the futures contract originated, value being that established on a recognized commodity exchange, or by reference to other customary sources, with gain or loss being realized when the futures contract closes or expires.
Subject to the Board’s oversight, the Board has delegated the day-to-day oversight of pricing matters, including determinations in good faith under the Fund’s procedures the fair value of securities for which current market quotations are not readily available to MetLife Advisers, LLC (“MetLife Advisers” or the “Adviser”).
Investment Transactions and Related Investment Income:
Portfolio security transactions are recorded on the trade date. Dividend income is recorded on the ex-dividend date or, for certain foreign securities, when notified. Interest income, which includes amortization of premium and accretion of discount on debt securities, is recorded on the accrual basis. Realized gains and losses on investments and unrealized appreciation and depreciation are determined on the identified cost basis, which is the same basis used for federal income tax purposes.
Repurchase Agreements:
The Portfolio, through the custodian or a subcustodian, receives delivery of the underlying securities collateralizing repurchase agreements. The Portfolio requires the custodian to take possession, to have legally segregated in the Federal Reserve Book Entry System, or to have segregated within the custodian’s vault, all securities held as collateral for repurchase agreements. It is the Portfolio’s policy that the market value of the collateral be at least equal to 100% of the repurchase price in the case of a repurchase agreement of one-day duration and 102% on all other repurchase agreements. The Portfolio’s subadviser is responsible for determining that the value of the collateral is at all times at least equal to the repurchase price. In connection with transactions in repurchase agreements, if the seller defaults and the value of the collateral declines or if the seller enters an insolvency proceeding, realization of the collateral by the Portfolio may be delayed, limited or wholly denied.
Foreign Currency Translation:
The books and records of the Portfolio are maintained in U.S. dollars. The values of securities, currencies and other assets and liabilities denominated in currencies other than U.S. dollars are translated into U.S. dollars based upon foreign exchange rates prevailing at the end of the period. Purchases and sales of investment securities, income and expenses are translated on the respective dates of such transactions. Since the values of investment securities are presented at the foreign exchange rates prevailing at the end of the period, it is not practical to isolate that portion of the results of operations arising from changes in exchange rates from that portion of the results of operations reflecting fluctuations arising from changes in market prices of the investment securities. Such fluctuations are included in the net realized and unrealized gain or loss on investments.
MSF-15
Metropolitan Series Fund, Inc.
Julius Baer International Stock Portfolio
Notes to Financial Statements—December 31, 2008—(Continued)
Net realized foreign exchange gains or losses arise from sales of foreign currency, currency gains or losses realized between the trade and settlement dates on securities transactions, and the difference between the amounts of dividends, interest, and foreign withholding taxes recorded by the Portfolio and the U.S. dollar equivalent of the amounts actually received or paid by the Portfolio. Net unrealized foreign exchange gains and losses arise from changes in the value of assets and liabilities, other than investment securities, resulting from changes in the exchange rate.
Forward Foreign Currency Exchange Contracts:
The Portfolio may enter into forward foreign currency exchange contracts primarily to hedge against foreign currency exchange rate risks on its non-U.S. dollar denominated investment securities. When entering into a forward currency contract, the Portfolio agrees to receive or deliver a fixed quantity of foreign currency for an agreed-upon price on an agreed future date. These contracts are valued daily and the Portfolio’s net equity therein, representing unrealized gain or loss on the contracts as measured by the difference between the foreign exchange rates at the dates of entry into the contracts and the forward rates at the settlement date, is included in the Statement of Assets and Liabilities. Realized and unrealized gains and losses are included in the Statement of Operations. These instruments involve market and/or credit risk in excess of the amount recognized in the Statement of Assets and Liabilities. Risks arise from the possible inability of counterparties to meet the terms of their contracts and from movement in currency and securities values and interest rates.
Futures Contracts:
The Portfolio may buy and sell futures contracts (on recognized exchanges) as a hedge, to maintain exposure to the broad equity markets or to enhance return. Futures contracts are agreements to buy or sell a security, or deliver a final cash settlement price in connection with an index, interest rate, currency, or other contracts not calling for physical delivery, for a set price in the future. The Portfolio must post an amount equal to a portion of the total market value of the futures contract as futures variation margin, which is returned when the Portfolio’s obligations under the contract have been satisfied. From time to time thereafter, the Portfolio may have to post variation margin to maintain this amount as the market value of the contract fluctuates. Risks of entering into futures contracts (and related options) include the possibility that there may be an illiquid market and that a change in the value of the contract or option may not correlate with changes in the value of the underlying securities.
Options:
The Portfolio may use options to hedge against changes in values of securities the Portfolio owns or expects to purchase, to maintain exposure to the broad equity markets or to enhance return. Writing puts or buying calls tends to increase the Portfolio’s exposure to the underlying instrument and writing calls or buying puts tends to decrease the Portfolio’s exposure to the underlying instrument, and can be used to hedge other Portfolio investments. For options purchased to hedge the Portfolio’s investments, the potential risk to the Portfolio is that the change in value of options contracts may not correspond to the change in value of the hedged instruments. In addition, losses may arise from changes in the value of the underlying instruments, if there is an illiquid secondary market, or if the counterparty is unable to perform. The maximum loss for purchased options is limited to the premium initially paid for the option. For options written by the Portfolio, the maximum loss is not limited to the premium initially received for the option.
The main risk associated with purchasing an option is that the option expires without being exercised. In this case, the option expires worthless and the premium paid for the option is considered the loss. The risk associated with writing a call option is that the Portfolio may forgo the opportunity for a profit if the market value of the underlying position increases and the option is exercised. The risk in writing a put option is that the Portfolio may incur a loss if the market value of the underlying position decreases and the option is exercised. In addition, the Portfolio risks not being able to enter into a closing transaction for the written option as the result of an illiquid market.
“When-Issued” Securities:
Purchasing securities “when-issued” is a forward commitment by the Portfolio to buy a security. The estimated amount of the Portfolio’s payment obligation and the security’s interest rate are determined when the commitment is made, even though no interest accrues until the security is issued, which is generally 15 to 120 days later. The Portfolio will segregate liquid assets with its custodian sufficient at all times to satisfy these commitments. If the value of the security is less when delivered than when the commitment was made, the Portfolio will suffer a loss.
MSF-16
Metropolitan Series Fund, Inc.
Julius Baer International Stock Portfolio
Notes to Financial Statements—December 31, 2008—(Continued)
Fund Concentration:
The investments by the Portfolio in foreign securities may involve risks not present in domestic investments. Since securities may be denominated in foreign currencies and may require settlement in foreign currencies and pay interest or dividends in foreign currencies, changes in the relationship of these foreign currencies to the U.S. dollar can significantly affect the value of the investments and earnings of the Portfolio. Foreign investments may also subject the Portfolio to foreign government exchange restrictions, expropriation, taxation or other political, social or economic developments, all of which could affect the market and/or credit risk of the investments. In addition to the risks described above, risks may arise from forward foreign currency contracts with respect to the potential inability of counterparties to meet the terms of their contracts.
Federal Income Taxes:
It is the Portfolio’s policy to comply with the requirements of the Internal Revenue Code of 1986, as amended (the “Code”), and regulations thereunder, applicable to regulated investment companies and to distribute, with respect to each taxable year, all of its taxable income to shareholders. Therefore, no federal income tax provision is required. The Portfolio is subject to the provisions of the Financial Accounting Standards Board Interpretation (“FASB”) No. 48, Accounting for Uncertainties in Income Taxes (FIN 48). FIN 48 sets forth a minimum threshold for financial statement recognition of the benefit of a tax position taken or expected to be taken in a tax return. The implementation of FIN 48 did not result in any unrecognized tax benefits in the accompanying financial statements. Each of the Portfolio’s federal tax returns for the prior three fiscal years remains subject to examination by the Internal Revenue Service.
As of December 31, 2008, the Portfolio had $329,201,990 in capital loss carryforwards expiring on December 31, 2016.
Pursuant to Section 852 of the Code, the Portfolio designated the amount shown below under Long Term Gain as capital gain dividends for its taxable year ended December 31, 2008. The tax character of distributions paid for the periods ended December 31, 2008 and 2007 was as follows:
| | | | | | | | | | | | | | | | | | | | | |
Ordinary Income | | Long Term Gain | | Return of Capital | | Total |
2008 | | 2007 | | 2008 | | 2007 | | 2008 | | 2007 | | 2008 | | 2007 |
$43,295,109 | | $ | 8,127,400 | | $ | 74,341,988 | | $ | 41,081,294 | | $ | — | | $ | — | | $ | 117,637,097 | | $ | 49,208,694 |
As of December 31, 2008, the components of distributable earnings (accumulated losses) on a federal income tax basis were as follows:
| | | | | | | | | | | | | | | |
Undistributed
Ordinary
Income | | Undistributed
Long Term
Gain | | Unrealized
Depreciation | | | Loss
Carryforwards | | | Total | |
$5,994,386 | | $ | — | | $ | (227,455,732 | ) | | $ | (329,201,990 | ) | | $ | (550,663,336 | ) |
Pursuant to Federal income tax regulations applicable to investment companies, the Portfolio has elected to treat net capital losses realized between November 1 and December 31 of each year as occurring on the first day of the following tax year. For the year ended December 31, 2008, the following amounts of realized capital and currency losses reflected in the accompanying financial statements will not be recognized for Federal income tax purposes until January 1, 2009:
| | | | |
Currency | | Capital | |
$— | | $ | (35,948,103 | ) |
Dividends and Distributions to Shareholders:
The Portfolio records dividends and distributions on the ex-dividend date. Net realized gains from security transactions (if any) are generally distributed annually to shareholders. The timing and characterization of certain income and capital gains distributions are determined in accordance with federal tax regulations that may differ from GAAP. Permanent book and tax basis differences relating to shareholder distributions will result in reclassification between under/over distributed net investment income, accumulated net realized gains/losses and paid in capital.
Expense Reductions:
Certain Portfolio trades are directed to brokers who paid a portion of the Portfolio’s expenses. Amounts paid for the Portfolio are shown as expense reductions in the Statement of Operations.
MSF-17
Metropolitan Series Fund, Inc.
Julius Baer International Stock Portfolio
Notes to Financial Statements—December 31, 2008—(Continued)
| 3. | INVESTMENT TRANSACTIONS: |
For the year ended December 31, 2008, purchases and sales of securities (excluding short term investments) for the Portfolio were as follows:
| | | | | | | | | |
Purchases | | Sales |
U.S. Government | | Other | | U.S. Government | | Other |
$0 | | $ | 2,381,722,859 | | $ | 0 | | $ | 1,883,909,797 |
| 4. | INVESTMENT MANAGEMENT FEES AND OTHER TRANSACTIONS WITH AFFILIATES: |
Investment Management Agreement:
MetLife Advisers is the investment adviser to the Portfolio. The Fund has entered into an investment management agreement with MetLife Advisers with respect to the Portfolio. For providing investment management services to the Portfolio, MetLife Advisers receives monthly compensation at the following annual rates:
| | | | |
Management
Fees earned by
MetLife Advisers
for the year ended
December 31, 2008 | | Annual
percentage
rates paid to
MetLife Advisers | | Based on Portfolios
average daily net asset
levels |
| $8,555,559 | | 0.860% | | Of the first $500 million |
| | 0.800% | | Of the next $500 million |
| | 0.750% | | On amounts in excess of $1 billion |
Certain officers and directors of the Fund may also be officers of MetLife Advisers; however, such officers and directors receive no compensation from the Fund.
MetLife Advisers has entered into an investment subadvisory agreement with respect to the Portfolio. Julius Baer Investment Management, LLC (“Julius Baer”) is compensated by MetLife Advisers to provide subadvisory services for the Portfolio. Prior to January 6, 2008, Fidelity Research & Management Company (“FMR”) was compensated by MetLife Advisers to provide subadvisory services for the Portfolio.
Management Fee Waivers:
MetLife Advisers contractually agreed for the period January 7, 2008 through April 30, 2008, to reduce its advisory fee by the annual rate of 0.050% for the first $500 million of the Portfolio’s average daily net assets and 0.020% for the next $500 million. MetLife Advisers has contractually agreed to continue this fee waiver for the period May 1, 2008 through April 30, 2009.
Service and Distribution Fees:
The Fund has adopted a Distribution and Service Plan under Rule 12b-1 of the 1940 Act for the Portfolio’s Class B and E shares. Under the Distribution and Service Plan, the Class B and E shares of the Portfolio pay a fee to compensate the Insurance Companies (or their affiliates) and other broker-dealers and financial intermediaries involved in the offer and sale of Portfolio shares for promoting or selling and servicing the Class B and E shares. The fees under the Distribution and Service Plan for each class of the Portfolio’s shares are calculated as a percentage of the Portfolio’s average daily net assets that are attributable to that Class. Currently, the fee is 0.25% per year for Class B shares and 0.15% per year for Class E shares. Amounts paid by the Portfolio for the year ended December 31, 2008 are shown as Service and Distribution fees in the Statement of Operations.
The Fund has entered into a securities lending arrangement with the Fund’s custodian, State Street Bank and Trust Company (the “custodian”). Under the agreement, the custodian is authorized to loan securities on the Portfolios’ behalf. In exchange, the Portfolio receives either cash or securities as collateral against the loaned securities. The Portfolio receives collateral at least equal to 102% of the market value of the loaned securities (105% for foreign securities), at each loan’s inception. Collateral must be maintained at least at 100% of the market value of the loaned securities for the duration of the loan. The cash collateral is invested in the Navigator Securities Lending Prime Portfolio, an affiliate of the custodian, which invests in a variety of high quality U.S. dollar-denominated instruments. If the market value of the collateral at the close of trading on a business day is less
MSF-18
Metropolitan Series Fund, Inc.
Julius Baer International Stock Portfolio
Notes to Financial Statements—December 31, 2008—(Continued)
than 100% of the market value of the loaned securities at the close of trading on that day, the borrower shall be required to deliver, by the close of business on the following business day, an additional amount of collateral, equal to at least 100% of the market value of all the loaned securities as of such preceding day. The Portfolio receives 80% of the annual net income from securities lending transactions, which is included in interest income of the Portfolio. The remaining 20% is paid to the custodian as compensation for its securities lending services. Interest income received by the Portfolio via lending transactions during the year ended December 31, 2008 is footnoted in the Statement of Operations. The Portfolio bears the risk of any deficiency in the amount of collateral available for return to a borrower due to a loss in an approved investment purchased with such collateral. Any outstanding loans by the Portfolio at December 31, 2008 are footnoted in the Schedule of Investments.
| 6. | MARKET AND CREDIT RISK: |
In the normal course of business, the Portfolio invests in securities and enters into transactions where risks exist due to fluctuations in the market (market risk) or failure of the other party to a transaction to perform (credit risk). The value of securities held by the Portfolio may decline in response to certain events, including those directly involving the companies whose securities are owned by the Portfolio; conditions affecting the general economy; overall market changes; local, regional or global political, social or economic instability; and currency and interest rate and price fluctuations. Similar to credit risk, the Portfolio may be exposed to counterparty risk, or the risk that an entity with which the Portfolio has unsettled or open transactions may default. Financial assets, which potentially expose the Portfolio to credit and counterparty risks, consist principally of investments and cash due from counterparties. The extent of the Portfolio’s exposure to credit and counterparty risks in respect to these financial assets approximates their value as recorded in the Portfolio’s Statements of Assets and Liabilities.
| 7. | RECENT ACCOUNTING PRONOUNCEMENTS: |
In March 2008, the FASB issued Statement of Financial Accounting Standards No. 161, Disclosures about Derivative Instruments and Hedging Activities (“FAS 161”), an amendment of FASB Statement No. 133. FAS 161 requires enhanced disclosures about (a) how and why an entity uses derivative instruments, (b) how derivative instruments and hedging activities are accounted for, and (c) how derivative instruments and related hedging activities affect a fund’s financial position, financial performance, and cash flows. Management does not believe the adoption of FAS 161 will materially impact the financial statement amounts, but will require additional disclosures. This will include qualitative and quantitative disclosures on derivative positions existing at period end and the effect of using derivatives during the reporting period. FAS 161 is effective for financial statements issued for fiscal years and interim periods beginning after November 15, 2008. Management is currently evaluating the impact the adoption of FAS 161 will have on the Portfolio’s financial statement disclosures.
MSF-19
Metropolitan Series Fund, Inc.
Julius Baer International Stock Portfolio
Report of Independent Registered Public Accounting Firm
To the Shareholders and Board of Directors of Metropolitan Series Fund, Inc.:
We have audited the accompanying statement of assets and liabilities, including the schedule of investments, of the Julius Baer International Stock Portfolio (one of the portfolios constituting the Metropolitan Series Fund, Inc.) (the “Fund”) as of December 31, 2008, and the related statement of operations for the year then ended, the statements of changes in net assets for each of the two years in the period then ended, and the financial highlights for each of the five years in the period then ended. These financial statements and financial highlights are the responsibility of the Fund’s management. Our responsibility is to express an opinion on these financial statements and financial highlights based on our audits.
We conducted our audits in accordance with the standards of the Public Company Accounting Oversight Board (United States). Those standards require that we plan and perform the audit to obtain reasonable assurance about whether the financial statements and financial highlights are free of material misstatement. The Fund is not required to have, nor were we engaged to perform, an audit of its internal control over financial reporting. Our audits included consideration of internal control over financial reporting as a basis for designing audit procedures that are appropriate in the circumstances, but not for the purpose of expressing an opinion on the effectiveness of the Fund’s internal control over financial reporting. Accordingly, we express no such opinion. An audit also includes examining, on a test basis, evidence supporting the amounts and disclosures in the financial statements, assessing the accounting principles used and significant estimates made by management, as well as evaluating the overall financial statement presentation. Our procedures included confirmation of securities owned as of December 31, 2008, by correspondence with the custodian and brokers; where replies were not received from brokers, we performed other auditing procedures. We believe that our audits provide a reasonable basis for our opinion.
In our opinion, the financial statements and financial highlights referred to above present fairly, in all material respects, the financial position of the Julius Baer International Stock Portfolio of the Metropolitan Series Fund, Inc. as of December 31, 2008, the results of its operations for the year then ended, the changes in its net assets for each of the two years in the period then ended, and the financial highlights for each of the five years in the period then ended, in conformity with accounting principles generally accepted in the United States of America.
Deloitte & Touche LLP
Boston, Massachusetts
February 24, 2009
MSF-20
Metropolitan Series Fund, Inc.
Directors and Officers
The Fund’s Directors review actions of the Fund’s investment adviser and subadvisers, and decide upon matters of general policy. The Fund’s officers supervise the daily business operations of the Fund. The Board of Directors and the Fund’s officers are listed below. Each Director is responsible for overseeing all 38 Portfolios of the Fund. There is no limit to the term a Director may serve. Directors serve until their resignation, retirement or removal in accordance with the Fund’s organizational documents and policies adopted by the Board from time to time. Officers hold office at the pleasure of the Board or until the election or appointment and the qualification of a successor. The address of the Directors and officers is c/o Metropolitan Series Fund, Inc., 501 Boylston Street, Boston, MA 02116.
Interested Directors(1)
Each Director below is an “interested person” (as defined by the 1940 Act) with respect to the Fund in that Ms. Forget is an employee of MetLife and Mr. Typermass is a former employee of MetLife and owns securities issued by MetLife, Inc., the ultimate parent company of MetLife Advisers.
| | | | | | | | |
Name, Address and Age | | Current
position(s)
with Fund | | Position(s)
held since | | Principal occupations
over past five years, including other directorships(2) | | Number of
Portfolios in
Fund Complex
Overseen by
Director(3) |
Elizabeth M. Forget Age: 42 | | Director, Chairman of the Board, President and Chief Executive Officer | | 2006 | | Senior Vice President (since 2007), MetLife, Inc.; President, Met Investors Advisory, LLC; Trustee and President, Met Investors Series Trust; Executive Vice President, MetLife Investors Group, Inc.; President, Chief Executive Officer and Chair of the Board of Managers (since 2006), MetLife Advisers; President, Met Investors Advisory, LLC. | | 87 |
| | | | |
Arthur G. Typermass Age: 71 | | Director | | 1998 | | Formerly, Senior Vice President and Treasurer, MetLife. | | 38 |
Non-Interested Directors(1)
Each Director below is not an “interested person” (as defined by the 1940 Act) with respect to the Fund (collectively, the “Independent Directors”).
| | | | | | | | |
Name, Address and Age | | Current
position(s)
with Fund | | Position(s)
held since | | Principal occupations
over past five years, including other directorships(2) | | Number of
Portfolios in
Fund Complex
Overseen by
Director(3) |
Steve A. Garban† Age: 71 | | Director | | 1985 | | Formerly, Chief Financial Officer, Senior Vice President Finance and Operations and Treasurer (Emeritus), The Pennsylvania State University. | | 38 |
| | | | |
Linda B. Strumpf Age: 61 | | Director | | 2000 | | Vice President and Chief Investment Officer, Ford Foundation. | | 38 |
| | | | |
Michael S. Scott Morton† Age: 71 | | Director | | 1993 | | Jay W. Forrester Professor of Management (Emeritus) at Sloan School of Management, MIT. | | 38 |
| | | | |
H. Jesse Arnelle Age: 75 | | Director | | 2001 | | Formerly, Counsel, Womble Carlyle Sandrie & Rice; Director, Textron Inc. (global multi- industry company)*; formerly, Director, Gannet Co. Inc. (diversified news and information company)*; formerly, Director, Eastman Chemical Company (global chemical company)*; formerly, Director, Waste Management, Inc.*; formerly, Director, Armstrong Holdings Inc. (parent company of floor and ceiling products business)*; formerly, Director, FPL Group Inc. (public utility holding company)*; Director, URS Corporation (engineering design services firm)*. | | 38 |
MSF-21
Metropolitan Series Fund, Inc.
Directors and Officers—(Continued)
| | | | | | | | |
Name, Address and Age | | Current
position(s)
with Fund | | Position(s)
held since | | Principal occupations
over past five years, including other directorships(2) | | Number of
Portfolios in
Fund Complex
Overseen by
Director(3) |
Nancy Hawthorne Age: 57 | | Director | | 2003 | | Chief Executive Officer, Clerestory LLC (corporate financial advisor); Director, Avid Technologies (computer software company)*; formerly, Chairman of the Board of Avid Technologies; formerly, Board of Advisors, L. Knife & Sons, Inc. (beverage distributor); formerly, Trustee, New England Zenith Fund (“Zenith Fund”)**; formerly, Chief Executive Officer and Managing Partner, Hawthorne, Krauss and Associates (corporate financial advisor); formerly, Chief Financial Officer and Executive Vice President, Continental Cablevision, subsequently renamed MediaOne (cable television company); formerly, Director, Life F/X, Inc.; formerly, Chairman of the Board, WorldClinic (distance medicine company); formerly, Director, Perini Corporation (construction company)*; formerly, Director, CGU (property and casualty insurance company); formerly, Director, Beacon Power Corporation (energy company)*. | | 38 |
| | | | |
John T. Ludes Age: 72 | | Director | | 2003 | | President, LFP Properties (consulting firm); Formerly, Trustee, Zenith Fund**; formerly, Vice Chairman, President and Chief Operating Officer, Fortune Brands/American Brands (global conglomerate); formerly, President and CEO, Acushnet Company (athletic equipment company). | | 38 |
Officers(1)
| | | | | | | | |
Name and address | | Age | | Current
position(s)
with Fund | | Position(s)
held since | | Principal occupations over past five years(2) |
| Jeffrey L. Bernier | | 37 | | Senior Vice President | | 2008 | | Vice President (since 2008), MetLife, Inc.; Vice President (since 2008), MetLife; Senior Vice President (since 2008), MetLife Advisers; formerly, Director and Senior Investment Analyst (2004 to 2007), John Hancock Financial Services; formerly, Assistant Vice President (2000 to 2001), Wachovia Securities. |
| | | | |
| Alan C. Leland | | 56 | | Senior Vice President | | 2005 | | Treasurer and Chief Financial Officer, MetLife Advisers, LLC; Treasurer (since 2005), Met Investors Advisory, LLC; Vice President (since 2004), Met Investors Advisory, LLC; Vice President (since 2003), MetLife, Inc.; Vice President, MetLife; Senior Vice President, NELICO. |
| | | | |
| Peter Duffy | | 53 | | Vice President
and Treasurer | | 2000 | | Senior Vice President, MetLife Advisers; Second Vice President (since 2003), NELICO; Vice President, MetLife (since 2004); Vice President (since 2004), MetLife, Inc.; formerly, Vice President and Treasurer, Zenith Fund**. |
| | | | |
| Jeffrey P. Halperin | | 41 | | Chief
Compliance Officer | | 2007 | | Vice President (since 2006), MetLife, Inc.; Vice President (since 2006), MetLife; Chief Compliance Officer (since 2006), Met Investors Series Trust, MetLife Advisers, Met Investors Advisory, LLC and MetLife Investment Advisors Company, LLC. |
| * | Indicates a directorship with a registered investment company or a company subject to the reporting requirements of the Securities Exchange Act of 1934, as amended. |
| ** | The Zenith Fund deregistered with the Securities and Exchange Commission (“SEC”) in 2004. |
| (†) | Served as a trustee, director and/or officer of one or more of the following companies, each of which had a direct or indirect advisory relationship with MetLife Advisers or its affiliates prior to January 31, 2005: State Street Research Financial Trust, State Street Research Income Trust, State Street Research Money Market Trust, State Street Research Institutional Funds, State Street Research Capital Trust, State Street Research Master Investment Trust, State Street Research Equity Trust, State Street Research Securities Trust and State Street Research Exchange Trust (collectively, the “State Street Research Funds”). |
| (1) | During the period shown, each Director of the Fund served as a Trustee of Metropolitan Series Fund II, a registered investment company that ceased investment operations in June of 2008 and has applied for deregistration under the Investment Company Act of 1940. During this period, each officer of the Fund served in the same position with Metropolitan Series Fund II. |
| (2) | Previous positions during the past five years with the Fund; Met Investors Series Trust; MetLife; MetLife, Inc.; MetLife Advisers; Met Investors Advisory, LLC; Zenith Fund; NELICO; or New England Securities Corporation are omitted if not materially different. |
| (3) | The Fund Complex includes the Fund (38 portfolios) and Met Investors Series Trust (49 portfolios). |
MSF-22
Metropolitan Series Fund, Inc.
Julius Baer International Stock Portfolio
Board Approval of Advisory and Subadvisory Agreements
The Fund’s Contract Review Committees of the Board of Directors (the “Board” or the “Directors”) typically meet in early fall to review the Portfolios’ advisory agreements (the “Advisory Agreements”) and subadvisory agreements (the “Subadvisory Agreements,” and, together with the Advisory Agreements, the “Agreements”) and determine whether to recommend that the full Board approve the continuation of the Agreements for an additional one-year period. (Following the initial approval of an Agreement for a new Portfolio or with a new adviser or subadviser, such annual reviews are not required until 2 years following the execution of such Agreement.) After each Committee has made its recommendations, the full Board, including the Independent Directors, determines whether to approve the continuation of each of the Agreements. In addition, the Board, including the Independent Directors, considers matters bearing on the Agreements at most of its other meetings throughout the year and regularly interviews various individuals at MetLife Advisers responsible for the management of the Portfolios. The Directors also interview selected investment managers and other professionals at the subadvisers at various times throughout the year.
The Directors receive all materials that they or MetLife Advisers, the Fund’s investment adviser, and the subadvisers believe to be reasonably necessary for the Directors to evaluate the Agreements and determine whether to approve the continuation of the Agreements. These materials generally include, among other items, (i) information on the investment performance of the Portfolios and the performance of peer groups of funds and the Portfolios’ performance benchmarks, (ii) information on the Portfolios’ advisory and subadvisory fees and other expenses, including information comparing the Portfolios’ expenses to those of peer groups of funds and information about any applicable expense caps and fee “breakpoints,” (iii) sales and redemption data, (iv) information related to the profitability of the Agreements to MetLife Advisers and certain of the subadvisers, and potential “fall-out” or ancillary benefits that MetLife Advisers, the subadvisers or their affiliates may receive as a result of their relationships with the Fund and (v) information obtained through the subadvisers’ responses to certain requests from MetLife Advisers and the Directors and MetLife Advisers’ responses to requests from the Directors. The Directors may also consider other information such as (vi) MetLife Advisers’ and the subadvisers’ financial results and condition, (vii) each Portfolio’s investment objectives and strategies and the size, education and experience of the investment staffs of MetLife Advisers and the relevant subadvisers and their use of technology and external research, (viii) the allocation of the Portfolios’ brokerage, if any, including allocations to brokers affiliated with the subadvisers and the use of “soft” commission dollars to pay Portfolio expenses and to pay for research and other similar services, (ix) the resources devoted to, and the record of compliance with, the Portfolios’ investment policies and restrictions, policies on personal securities transactions and other compliance policies, (x) the responses of MetLife Advisers, the subadvisers and/or their affiliates to certain legal and regulatory proceedings and (xi) the economic outlook generally and for the mutual fund industry in particular. Throughout the process, the Directors have the opportunity to ask questions of and request additional materials from MetLife Advisers and the subadvisers.
Following meetings of each Contract Review Committee on September 10, 2008, the Board, including the Independent Directors, at its November 6-7, 2008 meeting, approved the continuation through December 31, 2009 of the Advisory Agreements for each Portfolio of the Fund and the Subadvisory Agreements for each Portfolio other than the Zenith Equity Portfolio and Asset Allocation Portfolios (which do not have subadvisers) and the Van Eck Global Natural Resources Portfolio, Met/Dimensional International Small Cap Portfolio and Loomis Sayles Small Cap Growth Portfolio (formerly known as the Franklin Templeton Small Cap Growth Portfolio). The Agreements approved for continuation are referred to below as the “Continued Agreements.”
In considering whether to approve the continuation of the Continued Agreements, the Directors, including the Independent Directors, did not identify any single factor as determinative, and each weighed the various factors as he or she deemed appropriate. The Directors considered the following matters in connection with their approval of the Continued Agreements:
The nature, extent and quality of the services provided to the relevant Portfolios under the Continued Agreements. The Directors considered the nature, extent and quality of the services provided by MetLife Advisers, the relevant subadvisers (if any) and their affiliates (each, an “Adviser,” and, collectively, the “Advisers”) to the relevant Portfolios pursuant to the Continued Agreements and the resources dedicated to these Portfolios by the Advisers. In particular, the Directors considered the Advisers’ abilities to attract and retain highly qualified investment professionals. With respect to MetLife Advisers, the Directors considered (for each Portfolio other than the Zenith Equity and Asset Allocation Portfolios) that MetLife Advisers is (i) ultimately responsible for the performance of such Portfolios; (ii) ultimately responsible for the establishment of the investment strategies of each such Portfolio, primarily through its recommendations to the Board regarding the hiring and selection of subadvisers; (iii) responsible for the hiring and selection, subject to Board approval, of subadvisers; and (iv) responsible for maintaining a program of Subadviser oversight reasonably designed to ensure that the subadvisers have reasonable compliance policies and procedures in place. The Directors also considered that MetLife Advisers provides a full range of day-to-day administrative services for the Portfolios involving all aspects of such Portfolios’ day-to-day operations (other than portfolio management). With respect to the Zenith Equity and Asset Allocation Portfolios, the Directors considered both the portfolio management services and the administrative services provided by MetLife Advisers. After reviewing
MSF-23
Metropolitan Series Fund, Inc.
Julius Baer International Stock Portfolio
Board Approval of Advisory and Subadvisory Agreements—(Continued)
these and related factors, the Directors concluded, within the context of their overall conclusions regarding each of the Continued Agreements, that the nature, extent and quality of services provided supported the renewal of these Agreements.
Investment performance of the relevant Portfolios. The Directors reviewed information about the performance of the relevant Portfolios over various time periods, including information prepared by an independent third party that compared the performance of the Portfolios to the performance of peer groups of funds and performance benchmarks. The Directors also reviewed a description of the third party’s methodology for identifying a Portfolio’s peer group(s) for purposes of performance and expense comparisons.
In the case of each relevant Portfolio that had performance that lagged its peer group(s) for certain periods, the Directors concluded that other factors relevant to performance were sufficient, in light of other considerations, to warrant renewal of the Continued Agreements relating to such Portfolio. These factors varied from Portfolio to Portfolio, but included one or more of the following: (i) that such Portfolio’s performance, although lagging in certain recent periods, was stronger over the longer term; (ii) that the underperformance was attributable, to a significant extent, to investment decisions that were reasonable and consistent with the Portfolio’s investment objective(s) and policies and that the Portfolio was performing within the range of reasonable expectations, given market conditions and the Portfolio’s investment objective(s) and policies; (iii) that the Portfolio’s performance was competitive when compared to other relevant performance benchmarks or peer groups; and (iv) that MetLife Advisers and/or the relevant subadviser (if any) had taken or was taking steps designed to help improve the Portfolio’s investment performance (including, in the case of certain Portfolios, that MetLife Advisers was formulating possible proposals, for presentation to the Board in November 2008, to replace the Portfolio’s subadviser or to merge the Portfolio into another Portfolio with a similar investment objective and better investment performance).
The Directors also considered the investment performance of the Advisers and their reputations generally, the historical responsiveness of the Advisers to Director concerns about performance and the willingness of the Advisers to take steps intended to improve performance.
After reviewing these and related factors, the Directors concluded, within the context of their overall conclusions regarding each of the Continued Agreements, that the investment performance of each relevant Portfolio and Adviser was sufficient, in light of other considerations, to warrant the renewal of the Continued Agreements.
The costs of the services to be provided and profits to be realized by the Advisers and their affiliates from their relationships with the Portfolios. The Directors considered the fees charged by MetLife Advisers to the Portfolios for advisory services and, with respect to the subadvised Portfolios, by such subadvisers to MetLife Advisers for subadvisory services (such advisory and subadvisory fees (if any), collectively, “Fees”), as well as the total expense levels of the Portfolios. This information included comparisons (provided by an independent third party) of the Portfolios’ advisory fees and total expense levels to those of their peer groups. In evaluating Fees for the relevant Portfolios, the Directors also took into account the demands, complexity and quality of the investment management services provided to each Portfolio. The Directors considered MetLife Advisers’ recommendations regarding reductions in Fee rates, implementation of Fee breakpoints and institution of Fee waivers and expense caps.
The Directors also considered the compensation directly or indirectly received by the Advisers and their affiliates from their relationships with the relevant Portfolios. The Directors reviewed information relating to the profits received by MetLife Advisers, certain of the subadvisers and their affiliates as a result of their relationships with the relevant Portfolios, and information about the allocation of expenses used to calculate profitability. When reviewing profitability, the Directors also considered the performance of the relevant Portfolios, the expense levels of such Portfolios and whether the relevant Advisers had implemented breakpoints, fee waivers and/or expense caps with respect to such Portfolios.
After reviewing these and related factors, the Directors concluded, within the context of their overall conclusions regarding each of the Continued Agreements, that the Fees charged to each of the relevant Portfolios were fair and reasonable, and that the information provided regarding costs of these services generally, and the related profitability (if known) to the relevant Advisers of their relationships with the relevant Portfolios, supported the renewal of the Continued Agreements.
Economies of Scale. The Directors considered the existence of any economies of scale in the provision of services by the Advisers and whether those economies were shared with the relevant Portfolios through breakpoints in their advisory fees or other means, such as expense caps, fee waivers or relatively low levels of fees. The Directors noted that most of the relevant Portfolios benefited or will benefit from breakpoints, expense caps and/or fee waivers with respect to their advisory fees. In considering these issues, the Directors also took into consideration information relating to the costs of the services provided and the profitability to MetLife Advisers, the relevant subadvisers (if any) and each of their affiliates of their relationships with the relevant Portfolios, as discussed above.
MSF-24
Metropolitan Series Fund, Inc.
Julius Baer International Stock Portfolio
Board Approval of Advisory and Subadvisory Agreements—(Continued)
After reviewing these and related factors, the Directors concluded, within the context of their overall conclusions regarding each of the Continued Agreements, that the extent to which economies of scale were shared with the relevant Portfolios supported the renewal of such Agreements.
Other Factors. The Directors also considered other factors, which included but were not limited to the following:
| | • | | the extent to which each relevant Portfolio operated in accordance with its investment objective, and its record of compliance with its investment restrictions and the compliance programs of the Fund and the Advisers. They also considered the compliance-related resources the Advisers and their affiliates provide to the relevant Portfolios; |
| | • | | the nature, quality, cost and extent of administrative and shareholder services performed by MetLife Advisers and its affiliates under the Advisory Agreements; and |
| | • | | so-called “fall-out benefits” to the Advisers, such as the engagement of their affiliates to provide distribution, brokerage and transfer agency services to the Portfolios, and the benefits of research made available to the relevant Advisers by reason of brokerage commissions generated by the relevant Portfolios’ securities transactions. The Directors also considered the possible conflicts of interest associated with these fall-out and other benefits, and the reporting and other processes in place to disclose and monitor these possible conflicts of interest. |
Based on their evaluation of all factors that they deemed to be material, including those factors described above, and assisted by the advice of independent counsel, the Directors, including the Independent Directors, concluded that each of the Continued Agreements should be continued through December 31, 2009.
MSF-25
A description of the policies and procedures that the Fund uses to determine how to vote proxies relating to portfolio securities is available (i) without charge, upon request, by calling (800) 638-7732 and (ii) on the Securities and Exchange Commission’s (the “SEC”) website at http://www.sec.gov.
Information regarding how the Fund voted proxies relating to portfolio securities during the most recent twelve-month period ended December 31, 2008 is available (i) without charge, upon request, by calling (800) 638-7732 and (ii) on the SEC’s website at http://www.sec.gov.
The Fund’s Statement of Additional Information includes additional information about the Directors of the Fund and is available (i) without charge, upon request, by calling (800) 638-7732 and (ii) on the SEC’s website at http://www.sec.gov.
The Fund files with the SEC a complete schedule of its portfolio holdings, as of the close of the first and third quarters of its fiscal year, on “Form N-Q”. These filings are available on the SEC’s website at www.sec.gov and may be reviewed and copied at the SEC’s Public Reference Room in Washington, DC. (Call 1-800-SEC-0330 for information on the operation of the Public Reference Room.)
MSF-26
Simplify your life…
with MetLife eDelivery® while helping MetLife preserve the planet’s natural resources.
(see details on inside cover)
| | |
Metropolitan Series Fund, Inc. Lehman Brothers Aggregate Bond Index Portfolio Annual Report | | December 31, 2008 |
NOT PART OF THE ANNUAL REPORT
Letter from the President
February 1, 2009
Letter to Policy Holders:
2008 was an extraordinary year in the capital markets around the world and for the global economy. Energy prices rose to record levels early in the year before falling by two-thirds by year-end. A credit crisis that began with concerns about sub-prime mortgages led to massive changes in the financial landscape with government takeovers, forced sales, and outright failures of a number of large, once venerable firms.
While bonds as measured by the Barclays Capital U.S. Aggregate Bond Index (formerly known as, Lehman Brothers U.S. Aggregate Bond Index) were up 5.2% for the year in response to declining interest rates, there were large differences in the total returns of the various sectors of the bond market. U.S. treasury securities were up over 13% as frightened investors sought refuge in what they perceived to be the safest and most liquid investments. In contrast, investment grade corporate securities lost nearly 5% as credit spreads widened and below investment grade or high yield bonds fell over 26%.
In response to the growing credit crisis and the weakening economy, common stocks fell sharply across all regions, styles, and capitalizations. As measured by the Standard and Poor’s 500, U.S. common stocks fell 37% for the year, the worst calendar year decline since the 1930s. Foreign stocks were down even more with the MSCI EAFE Index down 43% for the year.
On the following pages, you will find a complete review of your Portfolio and its investment performance.
MetLife is committed to building your financial freedom. We appreciate your trust and will continue to focus our efforts on meeting your investment needs.
Sincerely,
Elizabeth M. Forget
President, Metropolitan Series Fund, Inc.
Metropolitan Series Fund, Inc.
Lehman Brothers Aggregate Bond Index Portfolio
Managed by MetLife Investment Advisors Company, LLC
Portfolio Manager Commentary*
PORTFOLIO PERFORMANCE
For the twelve-month period ended December 31, 2008, the Class A shares of the Lehman Brothers Aggregate Bond Index Portfolio returned 6.0%, compared to its benchmark, the Barclays Capital U.S. Aggregate Bond Index 1, which returned 5.2% over the same period. On November 3, 2008, Barclays Capital rebranded the Lehman Brothers U.S. Aggregate Bond Index as the Barclays Capital U.S. Aggregate Bond Index. The only change to the index is its name.
PORTFOLIO REVIEW
Historic market-breaking events, government intervention, credit concerns and recession fears dominated the 2008 financial markets. The year began badly, with sustained economic weakness, deteriorating financial markets and further credit tightening; then ended to chart the worst financial crisis in recent history. Liquidity concerns, inadequate capital, questionable asset valuations and derivative usage forced some firms to close their doors permanently; other companies to merge; several investment banks to reclassify themselves as bank holding companies; the U.S. Government to takeover failing institutions; and the first money market fund in 14 years to fall below $1 per share.
The U.S. Government’s efforts to calm the turbulent financial markets were unprecedented. In early September, the U.S. Treasury placed Fannie Mae and Freddie Mac under the conservatorship of the Federal Housing Finance Agency (FHFA). Additionally, the Treasury, Federal Reserve and Federal Deposit Insurance Corporation (FDIC) offered a host of programs to address the liquidity and housing crises. Key among the programs was the Treasury and Federal Reserve-sponsored Emergency Economic Stabilization Act of 2008, with the Troubled Assets Relief Program (TARP) at the core of the bill. Another noteworthy initiative was the FDIC-sponsored Temporary Liquidity Guarantee Program (TLGP), which would provide an FDIC guarantee for criteria met, newly issued, senior unsecured debt of certain financial institutions. The Fed also announced intentions to purchase debt and mortgage-backed securities (MBS), implement the Term Asset-Backed Securities (ABS) Lending Facility and purchase longer term Treasury securities.
There were seven Fed Funds interest rate cuts during 2008, with the final ease specified as a range between 0% and 0.25% (from 4.25% on 12/31/07). By year-end, the yield curve steepened from 1.41% to 1.91% between 2-year and 30-year Treasuries. The 2-year Treasury closed at 0.76% (down from 3.05% on 12/31/07), and the 30-year Treasury closed at 2.68% (down from 4.45% on 12/31/07). Yields plummeted during the year: the 2-year and 30-year Treasury yields fell to the lowest levels since the mid-1970s and the 10-year Treasury yield fell to the lowest level since 1953. 2008 also saw the return of the 1-year and 3-year Treasury notes.
The U.S. dollar’s results were mixed on speculation that the reduced Fed Funds interest rate would undermine the currency’s demand. It closed the year by declining versus the Japanese Yen to the lowest level in 20 years and advancing versus the Euro for the first time in three years. Speculation surrounding increased U.S. crude oil stockpiles and recession-related reductions in demand pushed crude oil prices lower during the year. Crude oil finished the term at approximately $45 per barrel, after posting a high of approximately $145 and a low of $34.
All spread sectors posted negative excess returns for the one-year period. Excess return is defined as a return in excess of a comparable duration Treasury. Excess returns for the sectors were: -2.32% for MBS, -2.93% for Government-related, -19.88% for Corporate, -22.23% for ABS and -32.74% for Commercial Mortgage-Backed Securities (CMBS).
The MBS and Government-related sectors were the strongest relative performers for the period, buoyed by the flight-to-quality that endured in the fixed income markets. Within the Corporate sector, Financial Institutions had the weakest relative performance for the period on both total and excess return bases, hurt by asset write-offs and issuer insolvency concerns. Weakness in the commercial real estate market and investor risk aversion distressed the CMBS sector.
The Portfolio experienced greater than expected tracking error for 2008 driven primarily by security selection. The Portfolio is managed utilizing a “Stratified Sampling” approach where the objective is to replicate the performance of the index by holding a subset of index constituents and neutralizing exposures across key characteristics (i.e., duration, term structure, high sector, sub-sector, quality). By design, therefore, with Stratified Sampling, the Portfolio is typically overweight/underweight any given name. Because of the depth and magnitude of the corporations impacted by the 2008 crisis, idiosyncratic (issue specific) risk within the Corporate and CMBS sectors was significant and the primary driver of the Portfolio’s outperformance relative to the target index.
* The views expressed above are those of the subadvisory firm as of December 31, 2008 and are subject to change based on market and other conditions. Information about the Portfolio’s holdings, asset allocation, industry allocation, or country diversification is historical and is not an indication of future Portfolio composition, which will vary. The performance of any index mentioned in this commentary has not been adjusted for ongoing management, distribution and operating expenses, and sales charges applicable to mutual fund investments. Direct investment in any index is not possible.
1 Barclays Capital U.S. Aggregate Bond Index (formerly, Lehman Brothers U.S. Aggregate Bond Index) includes most obligations of the U.S. Treasury, agencies and quasi-federal corporations, most publicly issued investment grade corporate bonds and most bonds backed by mortgage pools of GNMA, FNMA and FHLMC. The index itself remains unchanged since Barclays assumed responsibility for the index from Lehman.
MSF-2
Metropolitan Series Fund, Inc.
Lehman Brothers Aggregate Bond Index Portfolio
A $10,000 INVESTMENT COMPARED TO THE
BARCLAYS CAPITAL U.S. AGGREGATE BOND INDEX
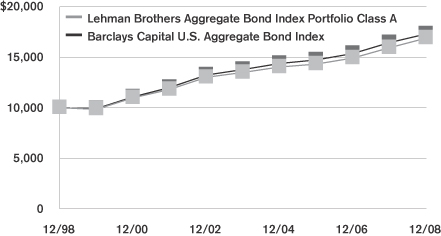
Average Annual Returns as of December 31, 2008
| | | | | | | | | | | | |
| | | Lehman Brothers Aggregate
Bond Index Portfolio | | | Barclays Capital U.S.
Aggregate Bond Index | |
| | | Class A | | | Class B | | | Class E | | |
| 1 Year | | 6.0 | % | | 5.6 | % | | 5.8 | % | | 5.2 | % |
| 5 Year | | 4.6 | | | 4.4 | | | 4.5 | | | 4.7 | |
| 10 Year | | 5.4 | | | — | | | — | | | 5.6 | |
| Since Inception | | — | | | 5.1 | | | 5.3 | | | — | |
Performance numbers are net of all Portfolio expenses but do not include any insurance, sales, or administrative charges of variable annuity or life insurance contracts or any additional expenses that participants in certain eligible qualified plans may bear relating to the operations of their plans. If these charges were included, the returns would be lower.
Inception dates of the Class A, Class B and Class E shares are: 11/9/98, 1/2/01 and 5/1/01, respectively.
This information represents past performance and is not indicative of future results. Investment return and principal value may fluctuate so that shares, upon redemption, may be worth more or less than the original cost.
PORTFOLIO COMPOSITION as of December 31, 2008
Top Holdings
| | |
| | | % of Total
Net Assets |
Federal National Mortgage Association | | 23.4% |
Federal Home Loan Mortgage Corp. | | 17.7% |
U.S. Treasury Notes | | 14.6% |
U.S. Treasury Bonds | | 8.6% |
Government National Mortgage Association | | 4.6% |
Federal Home Loan Bank | | 2.8% |
General Electric Capital Corp. | | 0.9% |
Bank of America Corp. | | 0.8% |
Italian Republic | | 0.6% |
Citigroup Deutsche Bank Commercial Mortgage Trust | | 0.6% |
Top Sectors
| | |
| | | % of Total
Market Value |
Mortgage-Backed | | 40.1% |
U.S. Treasury | | 23.5% |
Agency Issues | | 13.1% |
Industrial | | 8.8% |
Finance | | 7.2% |
Commercial Mortgage-Backed | | 3.9% |
Utilities | | 2.4% |
Other/Cash | | 0.6% |
Asset-Backed | | 0.4% |
MSF-3
Metropolitan Series Fund, Inc.
Shareholder Expense Example
As a shareholder of the Portfolio, you incur ongoing costs, including management fees; distribution and service (12b-1) fees; and other Portfolio expenses. This example is intended to help you understand your ongoing costs (in dollars) (referred to as “expenses”) of investing in the Portfolio and compare these costs with the ongoing costs of investing in other mutual funds. The example is based on an investment of $1,000 invested at the beginning of the period and held for the entire period, July 1, 2008 through December 31, 2008.
Actual Expenses
The first line for each share class of the Portfolio in the table below provides information about actual account values and actual expenses. You may use the information in this line, together with the amount you invested in the particular share class of the Portfolio, to estimate the expenses that you paid over the period. Simply divide your account value by $1,000 (for example, an $8,600 account value divided by $1,000=8.6), then multiply the result by the number in the first line under the heading entitled “Expenses Paid During Period” to estimate the expenses you paid on your account during this period.
Hypothetical Example for Comparison Purposes
The second line for each share class of the Portfolio in the table below provides information about hypothetical account values and hypothetical expenses based on the Portfolio’s actual expense ratio and an assumed rate of return of 5% per year before expenses, which is not the Portfolio’s actual return. The hypothetical account values and expenses may not be used to estimate the actual ending account balance or expenses you paid for the period. You may use this information to compare the ongoing costs of investing in the Portfolio and other funds. To do so, compare this 5% hypothetical example with the 5% hypothetical examples that appear in the shareholder reports of the other funds.
Please note that the expenses shown in the table are meant to highlight your ongoing costs only and do not reflect any fees or charges of your variable insurance product or any additional expenses that participants in certain eligible qualified plans may bear relating to the operations of their plan. Therefore, the second line for each share class in the table is useful in comparing ongoing costs only, and will not help you determine the relative total costs of owning different funds. In addition, if these other costs were included, your costs would have been higher.
| | | | | | | | | | | | | | |
Portfolio | | | | Annualized
Expense
Ratio | | | Beginning
Account Value
July 1,
2008 | | Ending
Account Value
December 31,
2008 | | Expenses Paid
During Period*
July 1, 2008
to
December 31,
2008 |
Lehman Brothers Aggregate Bond Index—Class A(a) | | Actual | | 0.28 | % | | $ | 1,000.00 | | $ | 1,047.17 | | $ | 1.44 |
| | Hypothetical | | 0.28 | % | | $ | 1,000.00 | | $ | 1,023.71 | | $ | 1.42 |
| | | | | |
Lehman Brothers Aggregate Bond Index—Class B(a) | | Actual | | 0.53 | % | | $ | 1,000.00 | | $ | 1,044.98 | | $ | 2.72 |
| | Hypothetical | | 0.53 | % | | $ | 1,000.00 | | $ | 1,022.44 | | $ | 2.69 |
| | | | | |
Lehman Brothers Aggregate Bond Index—Class E(a) | | Actual | | 0.43 | % | | $ | 1,000.00 | | $ | 1,045.45 | | $ | 2.21 |
| | Hypothetical | | 0.43 | % | | $ | 1,000.00 | | $ | 1,022.95 | | $ | 2.19 |
* Expenses paid are equal to the Portfolio’s annualized expense ratio for the most recent six month period, as shown above, multiplied by the average account value over the period, multiplied by the number of days in the most recent fiscal half-year, divided by 366 (to reflect the one-half year period).
(a) The annualized expense ratio shown reflects the impact of the management fee waiver as described in Note 4 to the Financial Statements.
MSF-4
Metropolitan Series Fund, Inc.
Lehman Brothers Aggregate Bond Index Portfolio
Schedule of Investments as of December 31, 2008
Fixed Income—98.5% of Total Net Assets
| | | | | | |
| Security Description | | Face
Amount | | Value* |
| | | | | | |
| | |
Aerospace & Defense—0.2% | | | | | | |
Honeywell International, Inc.
7.500%, 03/01/10 (a) | | $ | 300,000 | | $ | 313,304 |
Lockheed Martin Corp.
8.200%, 12/01/09 | | | 700,000 | | | 727,356 |
The Boeing Co.
7.250%, 06/15/25 | | | 460,000 | | | 511,859 |
United Technologies Corp.
7.500%, 09/15/29 | | | 200,000 | | | 245,180 |
| | | | | | |
| | | | | | 1,797,699 |
| | | | | | |
| | |
Asset Backed—0.4% | | | | | | |
Capital One Multi-Asset Execution Trust
4.850%, 11/15/13 | | | 3,000,000 | | | 2,782,110 |
CenterPoint Energy Transition Bond Co., LLC
5.160%, 09/15/11 | | | 244,005 | | | 245,489 |
Centex Home Equity
3.750%, 12/25/31 (b) | | | 60,968 | | | 39,481 |
Chase Funding Mortgage Loan Asset-Backed Certificates
3.303%, 11/25/29 | | | 30,338 | | | 29,864 |
4.585%, 05/25/15 | | | 1,760,994 | | | 1,743,595 |
Detroit Edison Securitization Funding, LLC
6.190%, 03/01/13 | | | 371,768 | | | 374,854 |
| | | | | | |
| | | | | | 5,215,393 |
| | | | | | |
| | |
Beverages—0.2% | | | | | | |
Anheuser-Busch Cos., Inc.
5.000%, 01/15/15 (a) | | | 1,950,000 | | | 1,782,916 |
Coca-Cola Enterprises, Inc.
6.950%, 11/15/26 | | | 300,000 | | | 301,908 |
Pepsi Bottling Group, Inc.
7.000%, 03/01/29 | | | 300,000 | | | 341,026 |
| | | | | | |
| | | | | | 2,425,850 |
| | | | | | |
| | |
Building Products—0.2% | | | | | | |
Masco Corp.
6.125%, 10/03/16 (a) | | | 2,950,000 | | | 2,206,712 |
| | | | | | |
| | |
Capital Markets—1.6% | | | | | | |
Credit Suisse USA, Inc.
5.375%, 03/02/16 (a) | | | 3,550,000 | | | 3,275,679 |
Merrill Lynch & Co., Inc.
6.050%, 05/16/16 | | | 3,000,000 | | | 2,796,728 |
6.150%, 04/25/13 | | | 1,950,000 | | | 1,938,008 |
6.500%, 07/15/18 | | | 200,000 | | | 199,985 |
Morgan Stanley
4.750%, 04/01/14 (a) | | | 1,515,000 | | | 1,136,250 |
7.250%, 04/01/32 | | | 3,850,000 | | | 3,349,500 |
The Bear Stearns Cos., LLC
5.700%, 11/15/14 | | | 900,000 | | | 884,029 |
The Goldman Sachs Group, Inc.
5.700%, 09/01/12 | | | 1,000,000 | | | 955,629 |
6.125%, 02/15/33 (a) | | | 2,075,000 | | | 1,936,211 |
6.250%, 09/01/17 | | | 760,000 | | | 711,601 |
| | | | | | |
| Security Description | | Face
Amount | | Value* |
| | | | | | |
| | |
Capital Markets—(Continued) | | | | | | |
The Goldman Sachs Group, Inc.
6.450%, 05/01/36 | | $ | 2,000,000 | | $ | 1,535,150 |
6.650%, 05/15/09 | | | 750,000 | | | 752,538 |
| | | | | | |
| | | | | | 19,471,308 |
| | | | | | |
| | |
Chemicals—0.1% | | | | | | |
E. I. du Pont de Nemours & Co.
5.600%, 12/15/36 (a) | | | 1,000,000 | | | 954,328 |
6.875%, 10/15/09 (a) | | | 300,000 | | | 307,424 |
| | | | | | |
| | | | | | 1,261,752 |
| | | | | | |
| |
Commercial & Professional Services—0.1% | | | |
Waste Management, Inc.
7.000%, 07/15/28 (a) | | | 1,265,000 | | | 1,045,499 |
| | | | | | |
| | |
Commercial Banks—2.7% | | | | | | |
ABN-AMRO Bank NV (New York Branch)
7.125%, 10/15/93 | | | 500,000 | | | 410,399 |
7.750%, 05/15/23 (a) | | | 230,000 | | | 212,473 |
American Express Centurion Bank
5.550%, 10/17/12 (c) | | | 300,000 | | | 287,492 |
BB&T Corp.
5.200%, 12/23/15 (a) | | | 4,100,000 | | | 3,915,028 |
Fleet National Bank
5.750%, 01/15/09 | | | 500,000 | | | 500,485 |
HSBC Holdings, Plc.
5.250%, 12/12/12 | | | 5,050,000 | | | 4,950,986 |
Kreditanstalt fuer Wiederaufbau
3.500%, 05/16/13 (a) | | | 7,000,000 | | | 7,261,730 |
4.875%, 01/17/17 (a) | | | 2,900,000 | | | 3,279,465 |
8.000%, 02/15/10 | | | 1,000,000 | | | 1,064,530 |
Wachovia Bank, N.A.
4.875%, 02/01/15 (a) | | | 3,000,000 | | | 2,793,652 |
Wachovia Corp.
5.750%, 06/15/17 | | | 700,000 | | | 699,951 |
Wells Fargo & Co.
4.950%, 10/16/13 (a) | | | 1,450,000 | | | 1,443,057 |
5.000%, 11/15/14 (a) | | | 2,000,000 | | | 1,974,834 |
5.125%, 09/01/12 (a) | | | 500,000 | | | 505,170 |
Wells Fargo Bank, N.A.
4.750%, 02/09/15 (a) | | | 3,065,000 | | | 2,977,795 |
| | | | | | |
| | | | | | 32,277,047 |
| | | | | | |
| |
Commercial Mortgage-Backed Securities—3.9% | | | |
Bear Stearns Commercial Mortgage Securities
5.540%, 09/11/41 | | | 3,000,000 | | | 2,298,922 |
5.610%, 11/15/33 | | | 500,000 | | | 462,704 |
6.480%, 02/15/35 | | | 500,000 | | | 477,533 |
7.080%, 06/15/09 | | | 413,522 | | | 411,937 |
7.780%, 02/15/32 | | | 181,671 | | | 181,785 |
Citigroup Commercial Mortgage Trust
5.358%, 04/15/40 (b) | | | 1,000,000 | | | 857,184 |
5.724%, 03/15/49 (b) | | | 3,800,000 | | | 2,981,435 |
*See accompanying notes to financial statements.
MSF-5
Metropolitan Series Fund, Inc.
Lehman Brothers Aggregate Bond Index Portfolio
Schedule of Investments as of December 31, 2008
Fixed Income—(Continued)
| | | | | | |
| Security Description | | Face
Amount | | Value* |
| | | | | | |
|
Commercial Mortgage-Backed Securities—(Continued) |
Citigroup/Deutsche Bank Commercial Mortgage Trust
5.225%, 07/15/44 (b) | | $ | 2,000,000 | | $ | 1,622,278 |
5.322%, 12/11/49 | | | 7,000,000 | | | 5,145,890 |
Credit Suisse Mortgage Capital Certificates
5.467%, 09/15/39 | | | 3,500,000 | | | 2,652,322 |
CS First Boston Mortgage Securities Corp.
3.382%, 05/15/38 | | | 1,981,893 | | | 1,843,403 |
5.100%, 08/15/15 (b) | | | 3,000,000 | | | 2,401,787 |
GMAC Commercial Mortgage Securities, Inc.
6.700%, 04/15/34 | | | 3,000,000 | | | 2,863,617 |
Greenwich Capital Commercial Funding Corp.
4.022%, 01/05/36 | | | 863,378 | | | 837,013 |
4.305%, 08/10/42 | | | 1,999,433 | | | 1,891,991 |
5.317%, 06/10/36 (b) | | | 1,000,000 | | | 892,720 |
JPMorgan Chase Commercial Mortgage Securities Corp.
3.972%, 05/12/35 | | | 1,697,300 | | | 1,513,372 |
4.275%, 01/12/37 | | | 674,204 | | | 611,495 |
4.393%, 07/12/37 | | | 2,743,066 | | | 2,488,989 |
6.044%, 11/15/35 | | | 356,557 | | | 343,159 |
LB-UBS Commercial Mortgage Trust
4.254%, 07/15/27 (b) | | | 1,650,000 | | | 1,509,612 |
4.367%, 03/15/36 | | | 3,000,000 | | | 2,446,839 |
6.462%, 03/15/31 | | | 500,000 | | | 467,542 |
6.653%, 11/15/27 | | | 2,000,000 | | | 1,918,458 |
Morgan Stanley Capital I
4.989%, 08/13/42 | | | 1,000,000 | | | 799,790 |
Morgan Stanley Dean Witter Capital I
4.800%, 09/15/37 | | | 252,401 | | | 237,270 |
7.200%, 10/15/33 | | | 538,614 | | | 523,898 |
Salomon Brothers Mortgage Securities VII, Inc.
5.045%, 03/18/36 | | | 500,000 | | | 452,437 |
6.428%, 12/18/35 | | | 930,776 | | | 889,355 |
Wachovia Bank Commercial Mortgage Trust
5.083%, 03/15/42 (b) | | | 3,000,000 | | | 2,428,665 |
6.287%, 04/15/34 | | | 1,445,000 | | | 1,361,815 |
| | | | | | |
| | | | | | 45,815,217 |
| | | | | | |
| | |
Communications Equipment—0.1% | | | | | | |
Motorola, Inc.
6.500%, 11/15/28 (a) | | | 900,000 | | | 468,000 |
7.625%, 11/15/10 (a) | | | 135,000 | | | 119,933 |
| | | | | | |
| | | | | | 587,933 |
| | | | | | |
| | |
Computers & Peripherals—0.4% | | | | | | |
Hewlett-Packard Co.
5.500%, 03/01/18 (a) | | | 1,950,000 | | | 2,013,529 |
International Business Machines Corp.
4.750%, 11/29/12 (a) | | | 1,000,000 | | | 1,033,752 |
7.500%, 06/15/13 | | | 1,000,000 | | | 1,117,222 |
8.375%, 11/01/19 | | | 425,000 | | | 515,879 |
| | | | | | |
| | | | | | 4,680,382 |
| | | | | | |
| | | | | | |
| Security Description | | Face
Amount | | Value* |
| | | | | | |
| | |
Consumer Finance—0.0% | | | | | | |
American Express Co.
6.800%, 09/01/66 (b) | | $ | 330,000 | | $ | 170,825 |
| | | | | | |
| | |
Diversified Financial Services—4.8% | | | | | | |
American General Capital II
8.500%, 07/01/30 | | | 250,000 | | | 105,000 |
American General Finance Corp.
5.375%, 10/01/12 | | | 6,500,000 | | | 2,730,000 |
5.400%, 12/01/15 | | | 1,340,000 | | | 549,400 |
Asian Development Bank
5.500%, 06/27/16 | | | 3,850,000 | | | 4,578,227 |
Associates Corp. of North America
6.950%, 11/01/18 | | | 1,700,000 | | | 1,742,263 |
Bank of America Corp.
3.125%, 06/15/12 | | | 3,900,000 | | | 4,071,767 |
4.750%, 08/15/13 (a) | | | 1,000,000 | | | 947,728 |
5.125%, 11/15/14 | | | 1,000,000 | | | 963,756 |
5.420%, 03/15/17 | | | 900,000 | | | 812,235 |
5.750%, 08/15/16 | | | 2,850,000 | | | 2,649,903 |
7.400%, 01/15/11 | | | 300,000 | | | 307,579 |
7.800%, 02/15/10 | | | 150,000 | | | 153,234 |
BellSouth Capital Funding Corp.
7.750%, 02/15/10 | | | 750,000 | | | 774,840 |
7.875%, 02/15/30 | | | 250,000 | | | 271,395 |
Berkshire Hathaway Finance Corp.
4.600%, 05/15/13 | | | 3,900,000 | | | 3,944,142 |
Citigroup, Inc.
5.500%, 08/27/12 (a) | | | 840,000 | | | 816,633 |
5.850%, 08/02/16 | | | 500,000 | | | 488,014 |
6.200%, 03/15/09 (a) | | | 750,000 | | | 746,794 |
7.250%, 10/01/10 | | | 250,000 | | | 250,858 |
Conoco Funding Co.
6.350%, 10/15/11 | | | 500,000 | | | 523,121 |
Daimler Finance North America, LLC
7.750%, 01/18/11 | | | 2,600,000 | | | 2,301,000 |
8.000%, 06/15/10 | | | 350,000 | | | 315,000 |
Deutsche Telekom International Finance BV
5.750%, 03/23/16 (a) | | | 460,000 | | | 441,563 |
8.750%, 06/15/30 (b) | | | 1,000,000 | | | 1,226,699 |
Devon Financing Corp.
6.875%, 09/30/11 (a) | | | 1,900,000 | | | 1,923,961 |
European Investment Bank
3.375%, 03/16/09 | | | 4,200,000 | | | 4,215,120 |
FIA Card Services, N.A. (144A)
7.125%, 11/15/12 | | | 1,000,000 | | | 1,036,123 |
General Electric Capital Corp.
5.000%, 11/15/11 | | | 4,000,000 | | | 4,046,453 |
5.400%, 02/15/17 | | | 2,000,000 | | | 1,973,971 |
5.450%, 01/15/13 (a) | | | 1,800,000 | | | 1,825,180 |
6.000%, 06/15/12 (a) | | | 1,000,000 | | | 1,029,367 |
6.750%, 03/15/32 (a) | | | 1,250,000 | | | 1,328,012 |
General Electric Capital Services, Inc.
7.500%, 08/21/35 | | | 100,000 | | | 114,865 |
Heller Financial, Inc.
7.375%, 11/01/09 | | | 350,000 | | | 369,592 |
*See accompanying notes to financial statements.
MSF-6
Metropolitan Series Fund, Inc.
Lehman Brothers Aggregate Bond Index Portfolio
Schedule of Investments as of December 31, 2008
Fixed Income—(Continued)
| | | | | | |
| Security Description | | Face
Amount | | Value* |
| | | | | | |
| |
Diversified Financial Services—(Continued) | | | |
JPMorgan Chase & Co.
5.125%, 09/15/14 (a) | | $ | 850,000 | | $ | 802,200 |
6.750%, 02/01/11 (a) | | | 250,000 | | | 254,523 |
Mellon Funding Corp.
6.400%, 05/14/11 | | | 250,000 | | | 257,362 |
National Rural Utilities Cooperative Finance Corp.
8.000%, 03/01/32 | | | 300,000 | | | 288,180 |
Petrobras International Finance Co.
6.125%, 10/06/16 (a) | | | 600,000 | | | 581,544 |
RBS Capital Trust II
6.425%, 12/29/49 (b) | | | 1,375,000 | | | 660,000 |
SunTrust Capital VIII
6.100%, 12/15/36 (b) | | | 820,000 | | | 516,600 |
Telecom Italia Capital S.A.
6.200%, 07/18/11 (a) | | | 1,020,000 | | | 897,600 |
Unilever Capital Corp.
7.125%, 11/01/10 | | | 300,000 | | | 318,972 |
Verizon Global Funding Corp.
7.750%, 12/01/30 | | | 2,390,000 | | | 2,694,913 |
| | | | | | |
| | | | | | 56,845,689 |
| | | | | | |
|
Diversified Telecommunication Services—0.9% |
AT&T, Inc.
5.875%, 02/01/12 (a) | | | 2,400,000 | | | 2,438,256 |
BellSouth Corp.
6.550%, 06/15/34 | | | 1,850,000 | | | 1,852,996 |
British Telecommunications, Plc.
9.125%, 12/15/30 (b) | | | 1,000,000 | | | 1,052,734 |
Telefonica Emisiones SAU
6.221%, 07/03/17 (a) | | | 2,900,000 | | | 2,847,649 |
Telefonica Europe BV
8.250%, 09/15/30 | | | 1,000,000 | | | 1,152,283 |
Verizon New England, Inc.
6.500%, 09/15/11 (a) | | | 400,000 | | | 389,721 |
Verizon New York, Inc.
7.375%, 04/01/32 | | | 500,000 | | | 493,816 |
| | | | | | |
| | | | | | 10,227,455 |
| | | | | | |
|
Electric Utilities—0.9% |
Duke Energy Carolinas, LLC
6.250%, 01/15/12 (a) | | | 500,000 | | | 515,106 |
Exelon Corp.
4.900%, 06/15/15 (a) | | | 2,060,000 | | | 1,674,921 |
5.625%, 06/15/35 | | | 1,500,000 | | | 972,417 |
Exelon Generation Co., LLC
6.950%, 06/15/11 | | | 300,000 | | | 289,473 |
Oncor Electric Delivery Co.
7.000%, 05/01/32 | | | 950,000 | | | 860,636 |
Progress Energy, Inc.
5.625%, 01/15/16 | | | 3,900,000 | | | 3,555,119 |
7.100%, 03/01/11 (a) | | | 1,221,000 | | | 1,209,739 |
PSEG Power, LLC
7.750%, 04/15/11 (a) | | | 500,000 | | | 496,705 |
8.625%, 04/15/31 (a) | | | 1,000,000 | | | 946,897 |
| | | | | | |
| | | | | | 10,521,013 |
| | | | | | |
| | | | | | |
| Security Description | | Face
Amount | | Value* |
| | | | | | |
| | |
Energy Equipment & Services—0.6% | | | | | | |
Halliburton Co.
5.500%, 10/15/10 | | $ | 4,700,000 | | $ | 4,797,537 |
Kinder Morgan Energy Partners, L.P.
6.500%, 02/01/37 | | | 2,000,000 | | | 1,542,603 |
6.750%, 03/15/11 (a) | | | 750,000 | | | 726,703 |
Transocean, Ltd.
7.500%, 04/15/31 | | | 300,000 | | | 281,904 |
| | | | | | |
| | | | | | 7,348,747 |
| | | | | | |
| | |
Federal Agencies—48.4% | | | | | | |
Federal Home Loan Bank
3.625%, 07/01/11 | | | 5,000,000 | | | 5,242,117 |
4.625%, 02/18/11 | | | 6,070,000 | | | 6,473,647 |
5.000%, 10/13/11 | | | 1,000,000 | | | 1,080,243 |
5.250%, 06/18/14 | | | 9,500,000 | | | 10,770,660 |
5.375%, 08/19/11 | | | 5,800,000 | | | 6,357,438 |
5.375%, 05/18/16 | | | 2,900,000 | | | 3,304,810 |
Federal Home Loan Mortgage Corp.
3.500%, 05/29/13 (a) | | | 7,120,000 | | | 7,514,041 |
4.000%, 12/15/09 | | | 2,000,000 | | | 2,059,089 |
4.000%, 06/01/19 | | | 1,667,554 | | | 1,701,471 |
4.395%, 02/01/36 (b) | | | 2,313,940 | | | 2,307,121 |
4.500%, 09/01/18 | | | 2,279,509 | | | 2,348,270 |
4.500%, 10/01/18 | | | 3,386,298 | | | 3,488,445 |
4.500%, 04/01/19 | | | 5,037,208 | | | 5,179,971 |
4.500%, 06/01/19 | | | 2,872,153 | | | 2,953,554 |
4.500%, 08/01/19 | | | 754,484 | | | 775,867 |
4.500%, 10/01/35 | | | 5,120,667 | | | 5,191,224 |
4.500%, 11/01/35 (b) | | | 2,451,269 | | | 2,485,044 |
4.750%, 03/05/12 (a) | | | 12,000,000 | | | 13,092,774 |
5.000%, 05/01/18 | | | 5,953,010 | | | 6,157,831 |
5.000%, 12/01/18 | | | 1,059,089 | | | 1,095,528 |
5.000%, 06/01/19 | | | 2,159,736 | | | 2,230,143 |
5.000%, 03/01/27 | | | 2,540,654 | | | 2,596,456 |
5.000%, 10/01/33 | | | 3,374,734 | | | 3,453,732 |
5.000%, 03/01/34 | | | 1,605,530 | | | 1,641,872 |
5.000%, 08/01/35 | | | 6,839,377 | | | 6,990,947 |
5.000%, 09/01/35 | | | 3,938,261 | | | 4,025,539 |
5.000%, 10/01/35 | | | 2,824,005 | | | 2,886,589 |
5.000%, 01/01/36 | | | 6,352,419 | | | 6,493,198 |
5.000%, 04/01/38 | | | 5,895,051 | | | 6,024,243 |
5.101%, 08/01/36 (b) | | | 2,279,506 | | | 2,313,313 |
5.135%, 01/01/36 (b) | | | 3,997,120 | | | 4,009,647 |
5.153%, 09/01/35 (b) | | | 3,864,364 | | | 3,888,604 |
5.300%, 05/12/20 | | | 710,000 | | | 724,159 |
5.397%, 01/01/37 (b) | | | 9,818,207 | | | 9,974,949 |
5.450%, 02/01/37 (b) | | | 1,364,643 | | | 1,366,416 |
5.500%, 11/01/17 | | | 877,848 | | | 910,382 |
5.500%, 05/01/29 | | | 756,937 | | | 777,231 |
5.500%, 06/01/34 | | | 3,532,703 | | | 3,627,417 |
5.500%, 10/01/35 | | | 3,496,727 | | | 3,588,849 |
5.500%, 12/01/35 | | | 6,122,791 | | | 6,284,096 |
5.500%, 01/01/36 | | | 10,550,244 | | | 10,828,192 |
5.625%, 11/23/35 | | | 1,040,000 | | | 1,131,061 |
5.643%, 02/01/37 (b) | | | 6,229,404 | | | 6,333,659 |
*See accompanying notes to financial statements.
MSF-7
Metropolitan Series Fund, Inc.
Lehman Brothers Aggregate Bond Index Portfolio
Schedule of Investments as of December 31, 2008
Fixed Income—(Continued)
| | | | | | |
| Security Description | | Face
Amount | | Value* |
| | | | | | |
| |
Federal Agencies—(Continued) | | | |
Federal Home Loan Mortgage Corp.
6.000%, 04/01/16 | | $ | 51,028 | | $ | 53,255 |
6.000%, 05/01/17 | | | 755,995 | | | 788,599 |
6.000%, 11/01/28 | | | 80,643 | | | 83,787 |
6.000%, 12/01/28 | | | 52,677 | | | 54,730 |
6.000%, 02/01/29 | | | 145,476 | | | 151,058 |
6.000%, 04/01/29 | | | 41,640 | | | 43,237 |
6.000%, 05/01/29 | | | 16,176 | | | 16,796 |
6.000%, 06/01/31 | | | 21,836 | | | 22,651 |
6.000%, 07/01/31 | | | 8,195 | | | 8,501 |
6.000%, 08/01/31 | | | 164,554 | | | 170,696 |
6.000%, 09/01/31 | | | 517,875 | | | 537,204 |
6.000%, 04/01/32 | | | 972,387 | | | 1,007,937 |
6.000%, 11/01/32 | | | 329,710 | | | 341,764 |
6.000%, 06/01/34 | | | 1,070,842 | | | 1,107,838 |
6.000%, 11/01/35 | | | 1,171,888 | | | 1,210,347 |
6.000%, 02/01/36 | | | 2,341,914 | | | 2,418,738 |
6.000%, 08/01/36 | | | 3,279,938 | | | 3,387,533 |
6.000%, 10/01/36 | | | 4,872,488 | | | 5,032,324 |
6.000%, 11/01/36 | | | 4,656,489 | | | 4,809,240 |
6.000%, 01/01/37 | | | 6,422,467 | | | 6,633,149 |
6.000%, 02/01/38 | | | 4,735,433 | | | 4,891,104 |
6.036%, 04/01/36 (b) | | | 1,591,250 | | | 1,620,805 |
6.250%, 07/15/32 | | | 2,600,000 | | | 3,707,773 |
6.500%, 10/01/29 | | | 36,757 | | | 38,554 |
6.500%, 02/01/30 | | | 44,720 | | | 46,906 |
6.500%, 08/01/31 | | | 74,298 | | | 77,794 |
6.500%, 10/01/31 | | | 25,097 | | | 26,278 |
6.500%, 11/01/31 | | | 171,336 | | | 179,399 |
6.500%, 03/01/32 | | | 1,831,802 | | | 1,915,724 |
6.500%, 04/01/32 | | | 1,661,868 | | | 1,738,004 |
6.500%, 09/01/36 | | | 4,055,448 | | | 4,223,963 |
6.500%, 11/01/37 | | | 8,442,610 | | | 8,791,495 |
6.750%, 03/15/31 | | | 965,000 | | | 1,421,558 |
7.000%, 03/15/10 (a) | | | 2,875,000 | | | 3,072,845 |
7.000%, 06/01/11 | | | 13,815 | | | 14,313 |
7.000%, 12/01/15 | | | 28,202 | | | 29,583 |
7.000%, 12/01/27 | | | 7,335 | | | 7,685 |
7.000%, 11/01/28 | | | 21,307 | | | 22,321 |
7.000%, 04/01/29 | | | 17,734 | | | 18,568 |
7.000%, 05/01/29 | | | 5,619 | | | 5,883 |
7.000%, 06/01/29 | | | 40,868 | | | 42,790 |
7.000%, 07/01/29 | | | 11,240 | | | 11,769 |
7.000%, 01/01/31 | | | 237,728 | | | 248,314 |
7.000%, 12/01/31 | | | 50,484 | | | 52,732 |
7.500%, 03/01/16 | | | 56,472 | | | 59,298 |
7.500%, 08/01/24 | | | 82,337 | | | 87,050 |
7.500%, 10/01/27 | | | 47,915 | | | 51,314 |
7.500%, 10/01/29 | | | 65,665 | | | 69,107 |
7.500%, 05/01/30 | | | 34,124 | | | 35,913 |
8.000%, 02/01/27 | | | 14,290 | | | 14,994 |
8.000%, 10/01/28 | | | 26,234 | | | 27,526 |
Federal National Mortgage Association
4.000%, 04/01/19 | | | 1,669,155 | | | 1,703,455 |
4.000%, 05/01/19 | | | 3,142,080 | | | 3,206,648 |
| | | | | | |
| Security Description | | Face
Amount | | Value* |
| | | | | | |
| |
Federal Agencies—(Continued) | | | |
Federal National Mortgage Association
4.000%, 01/01/20 | | $ | 1,908,938 | | $ | 1,934,017 |
4.125%, 04/15/14 (a) | | | 2,350,000 | | | 2,542,669 |
4.500%, 07/01/18 | | | 3,742,622 | | | 3,855,587 |
4.500%, 05/01/19 | | | 945,581 | | | 972,403 |
4.500%, 08/01/33 | | | 1,436,980 | | | 1,462,135 |
4.500%, 10/01/33 | | | 2,581,778 | | | 2,626,974 |
4.500%, 04/01/34 | | | 2,005,628 | | | 2,039,500 |
4.610%, 10/10/13 | | | 2,370,000 | | | 2,389,997 |
4.837%, 09/01/35 (b) | | | 2,412,369 | | | 2,437,587 |
5.000%, 06/01/18 | | | 902,320 | | | 933,384 |
5.000%, 01/01/19 | | | 1,354,320 | | | 1,398,487 |
5.000%, 02/01/20 | | | 2,220,409 | | | 2,288,761 |
5.000%, 01/01/22 | | | 4,707,537 | | | 4,848,794 |
5.000%, 02/01/24 | | | 2,223,315 | | | 2,275,542 |
5.000%, 09/01/25 | | | 2,113,331 | | | 2,163,050 |
5.000%, 07/01/33 | | | 1,825,251 | | | 1,871,391 |
5.000%, 08/01/33 | | | 2,673,535 | | | 2,741,119 |
5.000%, 09/01/33 | | | 2,305,941 | | | 2,364,232 |
5.000%, 10/01/33 | | | 8,325,350 | | | 8,535,806 |
5.000%, 03/01/34 | | | 2,603,984 | | | 2,669,809 |
5.000%, 04/01/34 | | | 6,116,929 | | | 6,268,619 |
5.000%, 05/01/34 | | | 2,105,613 | | | 2,156,896 |
5.000%, 09/01/34 | | | 4,291,603 | | | 4,396,128 |
5.000%, 02/01/35 | | | 4,086,487 | | | 4,186,016 |
5.000%, 04/01/35 | | | 2,238,478 | | | 2,291,959 |
5.000%, 05/01/35 | | | 1,411,315 | | | 1,445,033 |
5.000%, 11/01/35 | | | 2,298,477 | | | 2,353,391 |
5.125%, 04/15/11 (a) | | | 7,200,000 | | | 7,779,295 |
5.169%, 11/01/36 (b) | | | 1,484,934 | | | 1,517,287 |
5.375%, 06/12/17 (a) | | | 12,250,000 | | | 14,343,790 |
5.406%, 03/01/36 (b) | | | 3,913,545 | | | 3,994,866 |
5.500%, 03/15/11 (a) | | | 950,000 | | | 1,032,071 |
5.500%, 11/01/17 | | | 1,170,348 | | | 1,213,766 |
5.500%, 02/01/18 | | | 460,995 | | | 477,562 |
5.500%, 04/01/18 | | | 2,321,481 | | | 2,404,912 |
5.500%, 07/01/23 | | | 1,201,798 | | | 1,235,074 |
5.500%, 01/01/24 | | | 614,696 | | | 631,715 |
5.500%, 07/01/24 | | | 1,967,068 | | | 2,021,510 |
5.500%, 10/01/32 | | | 732,194 | | | 754,323 |
5.500%, 02/01/33 | | | 1,894,608 | | | 1,950,435 |
5.500%, 03/01/33 | | | 3,248,673 | | | 3,344,398 |
5.500%, 05/01/33 | | | 5,585,285 | | | 5,749,861 |
5.500%, 08/01/33 | | | 4,826,731 | | | 4,968,955 |
5.500%, 10/01/33 | | | 693,194 | | | 713,620 |
5.500%, 12/01/33 | | | 5,586,370 | | | 5,750,978 |
5.500%, 02/01/34 | | | 3,400,974 | | | 3,498,052 |
5.500%, 03/01/34 | | | 1,769,823 | | | 1,820,341 |
5.500%, 04/01/34 | | | 1,319,438 | | | 1,357,100 |
5.500%, 05/01/34 | | | 1,915,539 | | | 1,970,216 |
5.500%, 09/01/34 | | | 2,372,138 | | | 2,439,848 |
5.500%, 12/01/34 | | | 6,655,715 | | | 6,845,696 |
5.500%, 01/01/35 | | | 1,826,945 | | | 1,879,093 |
5.500%, 02/01/35 | | | 4,033,068 | | | 4,148,188 |
5.500%, 04/01/35 | | | 2,432,888 | | | 2,501,197 |
*See accompanying notes to financial statements.
MSF-8
Metropolitan Series Fund, Inc.
Lehman Brothers Aggregate Bond Index Portfolio
Schedule of Investments as of December 31, 2008
Fixed Income—(Continued)
| | | | | | |
| Security Description | | Face
Amount | | Value* |
| | | | | | |
| |
Federal Agencies—(Continued) | | | |
Federal National Mortgage Association
5.500%, 06/01/35 | | $ | 7,466,218 | | $ | 7,675,847 |
5.500%, 06/13/35 (b) | | | 1,751,205 | | | 1,799,700 |
5.500%, 01/01/37 | | | 7,725,175 | | | 7,939,910 |
5.500%, 05/01/37 | | | 4,616,423 | | | 4,744,744 |
5.500%, 05/01/38 | | | 3,838,285 | | | 3,945,120 |
5.500%, 07/01/38 | | | 4,940,011 | | | 5,077,511 |
6.000%, 09/01/13 | | | 700,780 | | | 730,679 |
6.000%, 10/01/13 | | | 358,739 | | | 374,045 |
6.000%, 03/01/14 | | | 84,687 | | | 88,307 |
6.000%, 06/01/14 | | | 11,245 | | | 11,726 |
6.000%, 07/01/14 | | | 61,928 | | | 64,573 |
6.000%, 09/01/14 | | | 27,738 | | | 28,923 |
6.000%, 09/01/17 | | | 910,609 | | | 948,818 |
6.000%, 08/01/28 | | | 21,097 | | | 21,893 |
6.000%, 11/01/28 | | | 8,366 | | | 8,682 |
6.000%, 12/01/28 | | | 9,764 | | | 10,132 |
6.000%, 06/01/31 | | | 146,508 | | | 151,861 |
6.000%, 09/01/32 | | | 943,396 | | | 977,317 |
6.000%, 01/01/33 | | | 381,262 | | | 394,970 |
6.000%, 02/01/33 | | | 783,716 | | | 811,181 |
6.000%, 03/01/33 | | | 1,120,569 | | | 1,159,838 |
6.000%, 04/01/33 | | | 685,241 | | | 709,254 |
6.000%, 05/01/33 | | | 1,849,904 | | | 1,914,732 |
6.000%, 05/01/34 | | | 2,180,743 | | | 2,254,795 |
6.000%, 09/01/34 | | | 2,599,341 | | | 2,687,607 |
6.000%, 11/01/34 | | | 4,258,768 | | | 4,403,384 |
6.000%, 01/01/35 | | | 1,260,216 | | | 1,300,847 |
6.000%, 07/01/36 | | | 3,308,784 | | | 3,415,478 |
6.000%, 09/01/36 | | | 3,621,070 | | | 3,737,834 |
6.000%, 07/01/37 | | | 3,619,738 | | | 3,736,490 |
6.000%, 08/01/37 | | | 6,204,545 | | | 6,404,668 |
6.000%, 09/01/37 | | | 14,290,523 | | | 14,751,454 |
6.210%, 08/06/38 | | | 300,000 | | | 413,700 |
6.500%, 01/01/13 | | | 6,605 | | | 6,882 |
6.500%, 04/01/13 | | | 1,135 | | | 1,182 |
6.500%, 06/01/13 | | | 54,894 | | | 57,196 |
6.500%, 07/01/13 | | | 310 | | | 323 |
6.500%, 06/01/14 | | | 23,813 | | | 24,833 |
6.500%, 04/01/17 | | | 2,488,051 | | | 2,597,021 |
6.500%, 05/01/28 | | | 349,254 | | | 367,472 |
6.500%, 12/01/28 | | | 756,729 | | | 796,200 |
6.500%, 03/01/29 | | | 26,255 | | | 27,593 |
6.500%, 04/01/29 | | | 160,424 | | | 168,599 |
6.500%, 05/01/29 | | | 16,950 | | | 17,814 |
6.500%, 08/01/29 | | | 3,913 | | | 4,112 |
6.500%, 05/01/30 | | | 236,210 | | | 248,246 |
6.500%, 09/01/31 | | | 50,294 | | | 52,637 |
6.500%, 02/01/32 | | | 8,982 | | | 9,473 |
6.500%, 06/01/32 | | | 266,229 | | | 278,144 |
6.500%, 09/01/33 | | | 728,530 | | | 760,694 |
6.500%, 10/01/33 | | | 616,492 | | | 643,709 |
6.500%, 10/01/34 | | | 1,886,877 | | | 1,970,180 |
6.500%, 10/01/37 | | | 5,970,037 | | | 6,207,569 |
6.625%, 11/15/10 (a) | | | 3,400,000 | | | 3,732,162 |
6.625%, 11/15/30 (a) | | | 2,450,000 | | | 3,554,716 |
| | | | | | |
| Security Description | | Face
Amount | | Value* |
| | | | | | |
| |
Federal Agencies—(Continued) | | | |
Federal National Mortgage Association
7.000%, 04/01/12 | | $ | 17,222 | | $ | 17,822 |
7.000%, 02/01/14 | | | 15,747 | | | 16,296 |
7.000%, 10/01/21 | | | 73,251 | | | 77,517 |
7.000%, 06/01/26 | | | 2,112 | | | 2,230 |
7.000%, 06/01/28 | | | 87,384 | | | 92,282 |
7.000%, 09/01/29 | | | 45,431 | | | 47,980 |
7.000%, 10/01/29 | | | 55,195 | | | 58,291 |
7.000%, 12/01/29 | | | 4,693 | | | 4,956 |
7.000%, 01/01/32 | | | 450,269 | | | 474,402 |
7.000%, 04/01/32 | | | 86,459 | | | 91,044 |
7.000%, 06/01/32 | | | 254,758 | | | 268,268 |
7.000%, 10/01/37 | | | 3,631,026 | | | 3,804,493 |
7.500%, 08/01/15 | | | 20,468 | | | 21,449 |
7.500%, 09/01/25 | | | 20,203 | | | 21,308 |
7.500%, 06/01/26 | | | 21,059 | | | 22,201 |
7.500%, 09/01/27 | | | 4,187 | | | 4,419 |
7.500%, 11/01/27 | | | 548 | | | 579 |
7.500%, 08/01/28 | | | 1,224 | | | 1,298 |
7.500%, 07/01/29 | | | 52,977 | | | 56,194 |
7.500%, 10/01/29 | | | 23,753 | | | 25,104 |
7.500%, 07/01/30 | | | 6,841 | | | 7,230 |
8.000%, 10/01/26 | | | 1,694 | | | 1,795 |
8.000%, 11/01/29 | | | 752 | | | 796 |
8.000%, 05/01/30 | | | 37,835 | | | 39,664 |
8.000%, 11/01/30 | | | 11,922 | | | 12,499 |
8.000%, 01/01/31 | | | 16,095 | | | 17,095 |
8.000%, 02/01/31 | | | 26,507 | | | 27,789 |
Government National Mortgage Association
5.000%, 10/15/20 | | | 2,096,934 | | | 2,165,421 |
5.000%, 01/15/21 | | | 1,833,136 | | | 1,893,006 |
5.000%, 12/15/35 | | | 2,309,841 | | | 2,377,944 |
5.000%, 12/15/36 | | | 4,359,649 | | | 4,484,814 |
5.500%, 03/15/36 | | | 3,312,347 | | | 3,424,292 |
5.500%, 01/15/37 | | | 4,829,361 | | | 4,992,865 |
5.500%, 11/15/37 | | | 8,904,361 | | | 9,205,828 |
5.500%, 09/15/38 | | | 4,982,381 | | | 5,151,534 |
6.000%, 01/15/29 | | | 38,921 | | | 40,597 |
6.000%, 01/15/33 | | | 1,122,324 | | | 1,166,448 |
6.000%, 03/15/35 | | | 1,751,742 | | | 1,813,812 |
6.000%, 12/15/35 | | | 2,110,477 | | | 2,185,257 |
6.000%, 06/15/36 | | | 3,421,251 | | | 3,542,233 |
6.000%, 09/15/36 | | | 4,064,978 | | | 4,208,724 |
6.000%, 07/15/38 | | | 2,816,937 | | | 2,916,997 |
6.500%, 05/15/23 | | | 9,594 | | | 10,100 |
6.500%, 02/15/27 | | | 149,084 | | | 157,441 |
6.500%, 07/15/28 | | | 27,540 | | | 29,109 |
6.500%, 08/15/28 | | | 51,737 | | | 54,685 |
6.500%, 11/15/28 | | | 34,643 | | | 36,616 |
6.500%, 12/15/28 | | | 13,677 | | | 14,456 |
6.500%, 07/15/29 | | | 15,910 | | | 16,812 |
6.500%, 06/20/31 | | | 109,592 | | | 115,532 |
6.500%, 07/15/32 | | | 150,528 | | | 157,967 |
6.500%, 05/15/36 | | | 1,522,455 | | | 1,589,739 |
7.000%, 01/15/28 | | | 8,660 | | | 9,093 |
7.000%, 04/15/28 | | | 4,269 | | | 4,482 |
*See accompanying notes to financial statements.
MSF-9
Metropolitan Series Fund, Inc.
Lehman Brothers Aggregate Bond Index Portfolio
Schedule of Investments as of December 31, 2008
Fixed Income—(Continued)
| | | | | | |
| Security Description | | Face
Amount | | Value* |
| | | | | | |
| |
Federal Agencies—(Continued) | | | |
Government National Mortgage Association
7.000%, 05/15/28 | | $ | 35,317 | | $ | 37,080 |
7.000%, 06/15/28 | | | 20,996 | | | 22,044 |
7.000%, 10/15/28 | | | 19,704 | | | 20,689 |
7.000%, 06/15/29 | | | 6,769 | | | 7,106 |
7.000%, 09/15/29 | | | 38,034 | | | 39,927 |
7.000%, 01/15/31 | | | 1,619 | | | 1,699 |
7.000%, 03/15/31 | | | 41,884 | | | 43,973 |
7.000%, 07/15/31 | | | 1,691,586 | | | 1,776,012 |
7.000%, 08/15/31 | | | 222,303 | | | 233,398 |
7.000%, 02/15/32 | | | 183,838 | | | 190,637 |
7.000%, 07/15/32 | | | 116,517 | | | 120,826 |
7.500%, 02/20/28 | | | 11,387 | | | 12,021 |
7.500%, 08/15/29 | | | 32,914 | | | 34,956 |
7.500%, 04/15/30 | | | 10,125 | | | 10,730 |
8.000%, 09/15/16 | | | 1,482 | | | 1,583 |
8.000%, 08/15/26 | | | 6,656 | | | 7,030 |
8.000%, 09/15/26 | | | 10,438 | | | 11,024 |
8.000%, 05/15/27 | | | 5,393 | | | 5,758 |
8.000%, 06/15/29 | | | 55,554 | | | 59,270 |
9.000%, 11/15/24 | | | 42,674 | | | 45,641 |
| | | | | | |
| | | | | | 572,699,109 |
| | | | | | |
| | |
Food & Staples Retailing—0.3% | | | | | | |
The Kroger Co.
5.500%, 02/01/13 | | | 950,000 | | | 939,310 |
Wal-Mart Stores, Inc.
4.550%, 05/01/13 | | | 2,075,000 | | | 2,173,548 |
6.875%, 08/10/09 (a) | | | 500,000 | | | 512,774 |
| | | | | | |
| | | | | | 3,625,632 |
| | | | | | |
| | |
Food Products—0.7% | | | | | | |
ConAgra Foods, Inc.
5.819%, 06/15/17 | | | 2,000,000 | | | 1,869,151 |
General Mills, Inc.
6.000%, 02/15/12 | | | 2,000,000 | | | 2,047,622 |
Kellogg Co.
6.600%, 04/01/11 (a) | | | 2,700,000 | | | 2,816,159 |
Kraft Foods, Inc.
6.250%, 06/01/12 (a) | | | 900,000 | | | 918,974 |
| | | | | | |
| | | | | | 7,651,906 |
| | | | | | |
| | |
Foreign Government—1.9% | | | | | | |
Brazilian Government International Bond
6.000%, 01/17/17 (a) | | | 3,755,000 | | | 3,858,262 |
Italian Republic
4.500%, 01/21/15 (a) | | | 2,975,000 | | | 3,064,250 |
5.625%, 06/15/12 | | | 3,650,000 | | | 3,977,807 |
Mexico Government International Bond
6.750%, 09/27/34 | | | 1,050,000 | | | 1,097,250 |
8.000%, 09/24/22 | | | 2,200,000 | | | 2,585,000 |
8.375%, 01/14/11 | | | 250,000 | | | 270,000 |
9.875%, 02/01/10 (a) | | | 500,000 | | | 536,250 |
| | | | | | |
| Security Description | | Face
Amount | | Value* |
| | | | | | |
| | |
Foreign Government—(Continued) | | | | | | |
Province of Ontario Canada
5.125%, 07/17/12 | | $ | 2,000,000 | | $ | 2,137,560 |
Province of Quebec Canada
4.875%, 05/05/14 | | | 1,925,000 | | | 2,066,309 |
6.125%, 01/22/11 | | | 2,700,000 | | | 2,869,256 |
| | | | | | |
| | | | | | 22,461,944 |
| | | | | | |
| | |
Gas Utilities—0.1% | | | | | | |
El Paso Natural Gas Co.
8.375%, 06/15/32 | | | 220,000 | | | 193,435 |
Southern California Gas Co.
4.800%, 10/01/12 | | | 1,000,000 | | | 1,013,680 |
| | | | | | |
| | | | | | 1,207,115 |
| | | | | | |
| | |
Government Agency—0.1% | | | | | | |
Tennessee Valley Authority
6.000%, 03/15/13 | | | 1,000,000 | | | 1,134,420 |
| | | | | | |
| |
Health Care Providers & Services—0.2% | | | |
WellPoint, Inc.
6.800%, 08/01/12 | | | 2,200,000 | | | 2,154,744 |
| | | | | | |
| | |
Household Products—0.2% | | | | | | |
Procter & Gamble Co.
4.950%, 08/15/14 | | | 2,000,000 | | | 2,069,211 |
6.450%, 01/15/26 | | | 200,000 | | | 234,599 |
| | | | | | |
| | | | | | 2,303,810 |
| | | | | | |
| | |
Industrial Conglomerates—0.2% | | | | | | |
General Electric Co.
5.000%, 02/01/13 (a) | | | 930,000 | | | 939,806 |
Tyco International, Ltd.
6.875%, 01/15/21 | | | 1,275,000 | | | 1,018,432 |
| | | | | | |
| | | | | | 1,958,238 |
| | | | | | |
| | |
Insurance—0.5% | | | | | | |
AXA Financial, Inc.
7.750%, 08/01/10 | | | 500,000 | | | 496,098 |
AXA S.A.
8.600%, 12/15/30 (a) | | | 1,165,000 | | | 699,000 |
Chubb Corp.
6.000%, 11/15/11 | | | 350,000 | | | 349,406 |
Hartford Financial Services Group, Inc.
6.100%, 10/01/41 | | | 780,000 | | | 478,548 |
Prudential Financial, Inc.
5.700%, 12/14/36 | | | 1,525,000 | | | 979,373 |
The Allstate Corp.
6.125%, 02/15/12 | | | 2,750,000 | | | 2,697,398 |
6.900%, 05/15/38 | | | 150,000 | | | 146,545 |
| | | | | | |
| | | | | | 5,846,368 |
| | | | | | |
| | |
Machinery—0.1% | | | | | | |
Caterpillar, Inc.
7.250%, 09/15/09 | | | 250,000 | | | 254,549 |
*See accompanying notes to financial statements.
MSF-10
Metropolitan Series Fund, Inc.
Lehman Brothers Aggregate Bond Index Portfolio
Schedule of Investments as of December 31, 2008
Fixed Income—(Continued)
| | | | | | |
| Security Description | | Face
Amount | | Value* |
| | | | | | |
| | |
Machinery—(Continued) | | | | | | |
Deere & Co.
6.950%, 04/25/14 (a) | | $ | 850,000 | | $ | 916,173 |
7.850%, 05/15/10 | | | 300,000 | | | 311,062 |
| | | | | | |
| | | | | | 1,481,784 |
| | | | | | |
| | |
Media—1.1% | | | | | | |
Comcast Cable Communications Holdings, Inc.
8.375%, 03/15/13 | | | 1,700,000 | | | 1,757,923 |
Comcast Corp.
5.300%, 01/15/14 (a) | | | 1,445,000 | | | 1,356,669 |
5.650%, 06/15/35 (a) | | | 1,500,000 | | | 1,368,633 |
COX Communications, Inc.
7.750%, 11/01/10 | | | 250,000 | | | 244,948 |
News America, Inc.
6.550%, 03/15/33 (a) | | | 1,950,000 | | | 1,818,824 |
The Walt Disney Co.
6.375%, 03/01/12 (a) | | | 200,000 | | | 213,602 |
Thomson Reuters Corp.
6.200%, 01/05/12 | | | 3,700,000 | | | 3,614,785 |
Time Warner Cable, Inc.
5.850%, 05/01/17 | | | 100,000 | | | 90,471 |
6.550%, 05/01/37 (a) | | | 100,000 | | | 94,048 |
Time Warner Entertainment Co., L.P.
8.375%, 03/15/23 | | | 380,000 | | | 378,006 |
Time Warner, Inc.
7.700%, 05/01/32 | | | 685,000 | | | 693,335 |
9.125%, 01/15/13 | | | 418,000 | | | 415,386 |
Turner Broadcasting System, Inc.
8.375%, 07/01/13 | | | 660,000 | | | 635,587 |
Viacom, Inc.
6.250%, 04/30/16 | | | 770,000 | | | 645,216 |
| | | | | | |
| | | | | | 13,327,433 |
| | | | | | |
| | |
Metals & Mining—0.3% | | | | | | |
Alcoa, Inc.
5.375%, 01/15/13 (a) | | | 1,000,000 | | | 854,874 |
5.720%, 02/23/19 (a) | | | 523,000 | | | 370,413 |
5.870%, 02/23/22 | | | 101,000 | | | 64,461 |
Rio Tinto Alcan, Inc.
5.000%, 06/01/15 | | | 1,050,000 | | | 802,675 |
Vale Overseas, Ltd.
6.875%, 11/21/36 | | | 1,100,000 | | | 1,014,750 |
| | | | | | |
| | | | | | 3,107,173 |
| | | | | | |
| | |
Multi-Utilities—0.7% | | | | | | |
Dominion Resources, Inc.
5.150%, 07/15/15 (a) | | | 3,600,000 | | | 3,299,292 |
Pacific Gas & Electric Co.
4.800%, 03/01/14 (a) | | | 3,125,000 | | | 3,060,205 |
6.050%, 03/01/34 | | | 2,195,000 | | | 2,241,591 |
| | | | | | |
| | | | | | 8,601,088 |
| | | | | | |
| | | | | | |
| Security Description | | Face
Amount | | Value* |
| | | | | | |
| | |
Multiline Retail—0.2% | | | | | | |
Macy’s Retail Holdings, Inc.
5.875%, 01/15/13 | | $ | 1,030,000 | | $ | 721,000 |
Target Corp.
6.350%, 11/01/32 | | | 2,300,000 | | | 1,988,381 |
| | | | | | |
| | | | | | 2,709,381 |
| | | | | | |
| | |
Oil, Gas & Consumable Fuels—0.5% | | | | | | |
ConocoPhillips Holding Co.
6.950%, 04/15/29 | | | 700,000 | | | 761,202 |
Enterprise Products Operating, LLC
5.000%, 03/01/15 | | | 2,000,000 | | | 1,690,421 |
6.300%, 09/15/17 | | | 3,400,000 | | | 2,945,698 |
XTO Energy, Inc.
7.500%, 04/15/12 | | | 715,000 | | | 723,936 |
| | | | | | |
| | | | | | 6,121,257 |
| | | | | | |
| | |
Paper & Forest Products—0.0% | | | | | | |
Weyerhaeuser Co.
7.375%, 03/15/32 | | | 500,000 | | | 328,070 |
| | | | | | |
| | |
Pharmaceuticals—0.7% | | | | | | |
Bristol-Myers Squibb Co.
5.875%, 11/15/36 | | | 2,000,000 | | | 2,139,999 |
Johnson & Johnson
5.950%, 08/15/37 | | | 910,000 | | | 1,090,127 |
6.950%, 09/01/29 | | | 250,000 | | | 320,463 |
Merck & Co., Inc.
5.950%, 12/01/28 | | | 300,000 | | | 316,703 |
Schering-Plough Corp.
6.550%, 09/15/37 | | | 1,000,000 | | | 1,021,262 |
Wyeth
5.500%, 02/01/14 (a) | | | 3,000,000 | | | 3,046,219 |
| | | | | | |
| | | | | | 7,934,773 |
| | | | | | |
| | |
Real Estate Investment Trusts—0.3% | | | | | | |
Brandywine Operating Partnership, L.P.
5.750%, 04/01/12 | | | 680,000 | | | 398,663 |
Developers Diversified Realty Corp.
5.375%, 10/15/12 | | | 520,000 | | | 258,402 |
Regency Centers, L.P.
5.250%, 08/01/15 (a) | | | 850,000 | | | 593,157 |
Simon Property Group, L.P.
5.250%, 12/01/16 | | | 3,000,000 | | | 1,915,880 |
| | | | | | |
| | | | | | 3,166,102 |
| | | | | | |
| | |
Road & Rail—0.2% | | | | | | |
Burlington Northern Santa Fe Corp.
5.900%, 07/01/12 | | | 1,000,000 | | | 1,007,461 |
CSX Corp.
6.750%, 03/15/11 (a) | | | 200,000 | | | 198,317 |
7.900%, 05/01/17 | | | 500,000 | | | 513,687 |
Norfolk Southern Corp.
5.590%, 05/17/25 | | | 144,000 | | | 129,075 |
6.200%, 04/15/09 | | | 350,000 | | | 350,447 |
*See accompanying notes to financial statements.
MSF-11
Metropolitan Series Fund, Inc.
Lehman Brothers Aggregate Bond Index Portfolio
Schedule of Investments as of December 31, 2008
Fixed Income—(Continued)
| | | | | | |
| Security Description | | Face
Amount | | Value* |
| | | | | | |
| | |
Road & Rail—(Continued) | | | | | | |
Norfolk Southern Corp.
7.250%, 02/15/31 | | $ | 156,000 | | $ | 167,002 |
| | | | | | |
| | | | | | 2,365,989 |
| | | | | | |
| | |
Software—0.2% | | | | | | |
Oracle Corp.
5.250%, 01/15/16 (a) | | | 2,000,000 | | | 2,011,571 |
| | | | | | |
| | |
Specialty Retail—0.1% | | | | | | |
Lowe’s Cos., Inc.
6.875%, 02/15/28 (a) | | | 1,000,000 | | | 993,431 |
| | | | | | |
| | |
U.S. Treasury—23.1% | | | | | | |
U.S. Treasury Bonds
4.500%, 02/15/36 (a) | | | 5,675,000 | | | 7,537,705 |
5.250%, 11/15/28 (a) | | | 2,700,000 | | | 3,562,326 |
5.250%, 02/15/29 | | | 750,000 | | | 993,578 |
5.375%, 02/15/31 (a) | | | 5,255,000 | | | 7,229,198 |
5.500%, 08/15/28 (a) | | | 2,420,000 | | | 3,267,073 |
6.250%, 08/15/23 (a) | | | 8,450,000 | | | 11,515,998 |
6.375%, 08/15/27 | | | 2,800,000 | | | 4,094,720 |
6.500%, 11/15/26 | | | 1,000,000 | | | 1,471,980 |
6.875%, 08/15/25 (a) | | | 2,450,000 | | | 3,722,946 |
7.250%, 08/15/22 (a) | | | 6,120,000 | | | 8,894,012 |
7.875%, 02/15/21 (a) | | | 4,450,000 | | | 6,596,102 |
8.000%, 11/15/21 | | | 2,920,000 | | | 4,424,004 |
8.125%, 08/15/19 (a) | | | 2,645,000 | | | 3,902,539 |
8.125%, 08/15/21 (a) | | | 1,250,000 | | | 1,899,275 |
8.500%, 02/15/20 (a) | | | 6,700,000 | | | 10,191,772 |
8.750%, 08/15/20 (a) | | | 1,000,000 | | | 1,559,010 |
8.875%, 02/15/19 (a) | | | 10,215,000 | | | 15,673,079 |
9.125%, 05/15/18 (a) | | | 1,600,000 | | | 2,477,632 |
9.250%, 02/15/16 (a) | | | 1,375,000 | | | 2,007,184 |
U.S. Treasury Notes
1.750%, 03/31/10 | | | 21,500,000 | | | 21,851,311 |
2.875%, 01/31/13 (a) | | | 6,000,000 | | | 6,438,420 |
3.375%, 11/30/12 (a) | | | 7,010,000 | | | 7,635,502 |
3.625%, 01/15/10 (a) | | | 4,000,000 | | | 4,138,680 |
3.625%, 06/15/10 (a) | | | 16,200,000 | | | 16,929,970 |
4.000%, 04/15/10 (a) | | | 6,000,000 | | | 6,290,160 |
4.000%, 11/15/12 (a) | | | 7,250,000 | | | 8,046,775 |
4.000%, 02/15/14 (a) | | | 600,000 | | | 679,944 |
4.125%, 08/15/10 | | | 1,000,000 | | | 1,059,060 |
4.125%, 05/15/15 (a) | | | 7,640,000 | | | 8,758,726 |
4.250%, 10/15/10 (a) | | | 5,000,000 | | | 5,340,400 |
4.250%, 01/15/11 | | | 9,100,000 | | | 9,778,405 |
4.250%, 09/30/12 (a) | | | 5,000,000 | | | 5,578,050 |
4.250%, 08/15/13 (a) | | | 14,980,000 | | | 17,030,013 |
4.250%, 08/15/14 (a) | | | 4,430,000 | | | 5,086,969 |
4.375%, 08/15/12 (a) | | | 5,000,000 | | | 5,614,100 |
4.500%, 11/15/15 (a) | | | 8,950,000 | | | 10,608,883 |
4.750%, 08/15/17 (a) | | | 5,000,000 | | | 5,977,600 |
4.875%, 02/15/12 (a) | | | 4,500,000 | | | 5,034,195 |
5.000%, 02/15/11 | | | 1,000,000 | | | 1,091,800 |
5.000%, 08/15/11 (a) | | | 3,500,000 | | | 3,893,925 |
| | | | | | |
| Security Description | | Face
Amount | | Value* |
| | | | | | |
| | |
U.S. Treasury—(Continued) | | | | | | |
U.S. Treasury Notes
5.125%, 05/15/16 (a) | | $ | 4,830,000 | | $ | 5,845,169 |
5.750%, 08/15/10 | | | 7,120,000 | | | 7,735,310 |
6.500%, 02/15/10 (a) | | | 1,710,000 | | | 1,823,749 |
| | | | | | |
| | | | | | 273,287,249 |
| | | | | | |
| |
Wireless Telecommunication Services—0.3% | | | |
AT&T Mobility, LLC
7.125%, 12/15/31 | | | 100,000 | | | 109,467 |
New Cingular Wireless Services, Inc.
7.875%, 03/01/11 | | | 890,000 | | | 927,685 |
8.125%, 05/01/12 | | | 500,000 | | | 530,647 |
8.750%, 03/01/31 | | | 300,000 | | | 370,988 |
Vodafone Group, Plc.
6.150%, 02/27/37 | | | 1,000,000 | | | 981,984 |
7.750%, 02/15/10 (a) | | | 1,150,000 | | | 1,174,181 |
| | | | | | |
| | | | | | 4,094,952 |
| | | | | | |
| | |
Yankee—1.0% | | | | | | |
Apache Finance Canada Corp.
7.750%, 12/15/29 | | | 300,000 | | | 343,085 |
ConocoPhillips Canada Funding Co. I
5.950%, 10/15/36 | | | 3,050,000 | | | 2,994,188 |
EnCana Corp.
4.750%, 10/15/13 (a) | | | 2,000,000 | | | 1,795,861 |
Hydro-Quebec
7.500%, 04/01/16 | | | 1,350,000 | | | 1,717,793 |
8.400%, 01/15/22 | | | 1,000,000 | | | 1,484,457 |
Inter-American Development Bank
6.800%, 10/15/25 | | | 500,000 | | | 695,616 |
7.000%, 06/15/25 | | | 200,000 | | | 278,604 |
8.875%, 06/01/09 (a) | | | 400,000 | | | 410,805 |
International Bank for Reconstruction & Development
8.875%, 03/01/26 | | | 535,000 | | | 872,523 |
Province of Nova Scotia Canada
9.250%, 03/01/20 | | | 250,000 | | | 389,496 |
Province of Quebec Canada
7.500%, 07/15/23 | | | 350,000 | | | 494,284 |
StatoilHydro ASA
6.700%, 01/15/18 | | | 300,000 | | | 317,683 |
| | | | | | |
| | | | | | 11,794,395 |
| | | | | | |
Total Fixed Income
(Identified Cost $1,137,497,964) | | | | | | 1,164,266,455 |
| | | | | | |
| |
| Short Term Investments—17.1% | | | |
| | |
Discount Notes—1.7% | | | | | | |
Federal Home Loan Bank
0.008%, 04/08/09 | | | 18,400,000 | | | 18,396,034 |
0.036%, 01/08/09 | | | 500,000 | | | 499,998 |
0.050%, 01/23/09 | | | 1,000,000 | | | 999,994 |
Federal Home Loan Mortgage Corp.
1.700%, 02/27/09 | | | 700,000 | | | 699,867 |
| | | | | | |
| | | | | | 20,595,893 |
| | | | | | |
*See accompanying notes to financial statements.
MSF-12
Metropolitan Series Fund, Inc.
Lehman Brothers Aggregate Bond Index Portfolio
Schedule of Investments as of December 31, 2008
Short Term Investments—(Continued)
| | | | | | | |
| Security Description | | Face
Amount | | Value* | |
| | | | | | | |
| | |
Mutual Funds—15.4% | | | | | | | |
State Street Navigator Securities Lending
Prime Portfolio (c) | | $ | 181,643,880 | | $ | 181,643,880 | |
| | | | | | | |
Total Short Term Investments
(Identified Cost $202,239,773) | | | | | | 202,239,773 | |
| | | | | | | |
Total Investments—115.6%
(Identified Cost $1,339,737,737) (d) | | | | | | 1,366,506,228 | |
Liabilities in excess of other assets | | | | | | (184,350,472 | ) |
| | | | | | | |
| Total Net Assets—100% | | | | | $ | 1,182,155,756 | |
| | | | | | | |
| (a) | A portion or all of the security was on loan. As of December 31, 2008, the market value of securities loaned was $182,605,666 and the collateral received consisted of cash in the amount of $181,643,880 and non-cash collateral with a value of $6,017,366. The cash collateral is invested in a money market fund managed by an affiliate of the custodian. The non-cash collateral received consists primarily of government securities and bank letters of credit, and are held for the benefit of the Portfolio at the Portfolio’s custodian. The Portfolio cannot repledge or resell this collateral. As such, these are excluded from the Statement of Assets and Liabilities. |
| (b) | Variable or Floating Rate Security. Rate disclosed is as of December 31, 2008. |
| (c) | Represents investment of cash collateral received from securities lending transactions. |
| (d) | The aggregate cost of investments for federal income tax purposes as of December 31, 2008 was $1,347,677,773 and the composition of unrealized appreciation and depreciation of investment securities was $61,943,635 and $(43,115,180), respectively. |
| (144A)— | Securities exempt from registration under Rule 144A of the Securities Act of 1933. These securities may be resold in transactions exempt from registration, normally to qualified institutional buyers. As of December 31, 2008, the market value of 144A securities was $1,036,123, which is 0.1% of total net assets. |
The Portfolio adopted the provisions of Statement of Financial Accounting Standards No. 157, “Fair Value Measurements” (FAS 157), effective with the beginning of the Portfolio’s fiscal year. FAS 157 establishes a framework for measuring fair value and expands disclosures about fair value measurements in financial statements. The three levels of the hierarchy under FAS 157 are described below:
Level 1 - quoted prices in active markets for identical securities
Level 2 - other significant observable inputs (including quoted prices for similar securities, interest rates, credit risk, etc.)
Level 3 - significant unobservable inputs (including the Portfolio’s own assumptions in determining the fair value of investments)
The inputs or methodology used for valuing securities are not necessarily an indication of the risk associated with investing in those securities.
The following is a summary of the inputs used to value the Portfolio’s net assets as of December 31, 2008:
| | | | | | |
| Valuation Inputs | | Investments In
Securities | | Other Financial
Instruments* |
Level 1 - Quoted Prices | | $ | 557,806,166 | | $ | 0 |
Level 2 - Other Significant Observable Inputs | | | 808,700,062 | | | 0 |
Level 3 - Significant Unobservable Inputs | | | 0 | | | 0 |
Total | | $ | 1,366,506,228 | | $ | 0 |
* Other financial instruments are derivative instruments not reflected in the Schedule of Investments, such as futures, forwards, swap contracts and written options, which are valued based on the unrealized appreciation/depreciation on the instrument.
*See accompanying notes to financial statements.
MSF-13
Metropolitan Series Fund, Inc.
Lehman Brothers Aggregate Bond Index Portfolio
Statement of Assets & Liabilities
December 31, 2008
| | | | | | | |
Assets | | | | | | | |
Investments at value (a) (b) | | | | | $ | 1,366,506,228 | |
Cash | | | | | | 164,386 | |
Receivable for: | | | | | | | |
Securities sold | | | | | | 21,374,097 | |
Fund shares sold | | | | | | 215,807 | |
Accrued interest | | | | | | 11,700,517 | |
| | | | | | | |
Total Assets | | | | | | 1,399,961,035 | |
Liabilities | | | | | | | |
Payable for: | | | | | | | |
Securities purchased | | $ | 26,063,023 | | | | |
Fund shares redeemed | | | 9,680,492 | | | | |
Collateral for securities loaned | | | 181,643,880 | | | | |
Accrued expenses: | | | | | | | |
Management fees | | | 252,395 | | | | |
Service and distribution fees | | | 122,507 | | | | |
Other expenses | | | 42,982 | | | | |
| | | | | | | |
Total Liabilities | | | | | | 217,805,279 | |
| | | | | | | |
Net Assets | | | | | $ | 1,182,155,756 | |
| | | | | | | |
Net assets consists of: | | | | | | | |
Capital paid in | | | | | $ | 1,116,108,967 | |
Undistributed net investment income | | | | | | 68,918,722 | |
Accumulated net realized losses | | | | | | (29,640,424 | ) |
Unrealized appreciation on investments | | | | | | 26,768,491 | |
| | | | | | | |
Net Assets | | | | | $ | 1,182,155,756 | |
| | | | | | | |
| Computation of offering price: | | | | | | | |
Class A | | | | | | | |
Net asset value and redemption price per share ($564,528,263 divided by 50,876,132 shares outstanding) | | | | | $ | 11.10 | |
| | | | | | | |
Class B | | | | | | | |
Net asset value and redemption price per share ($491,545,575 divided by 45,003,478 shares outstanding) | | | | | $ | 10.92 | |
| | | | | | | |
Class E | | | | | | | |
Net asset value and redemption price per share ($126,081,918 divided by 11,416,090 shares outstanding) | | | | | $ | 11.04 | |
| | | | | | | |
(a) Identified cost of investments | | | | | $ | 1,339,737,737 | |
| | | | | | | |
(b) Includes cash collateral for securities loaned of | | | | | $ | 181,643,880 | |
| | | | | | | |
Statement of Operations
For the Year Ended December 31, 2008
| | | | | | | | |
Investment Income | | | | | | | | |
Interest | | | | | | $ | 70,893,591 | (a) |
| | | | | | | | |
Expenses | | | | | | | | |
Management fees | | $ | 3,345,897 | | | | | |
Service and distribution fees—Class B | | | 1,384,799 | | | | | |
Service and distribution fees—Class E | | | 229,399 | | | | | |
Directors’ fees and expenses | | | 31,907 | | | | | |
Custodian | | | 158,937 | | | | | |
Audit and tax services | | | 39,141 | | | | | |
Legal | | | 24,189 | | | | | |
Printing | | | 241,078 | | | | | |
Insurance | | | 15,565 | | | | | |
Miscellaneous | | | 20,289 | | | | | |
| | | | | | | | |
Total expenses | | | 5,491,201 | | | | | |
Management fee waivers | | | (80,302 | ) | | | 5,410,899 | |
| | | | | | | | |
Net Investment Income | | | | | | | 65,482,692 | |
| | | | | | | | |
Realized and Unrealized Gain (Loss) | | | | | | | | |
| Realized loss on: | | | | | | | | |
Investments—net | | | | | | | (4,343,529 | ) |
| Change in unrealized appreciation on: | | | | | | | | |
Investments—net | | | | | | | 10,349,538 | |
| | | | | | | | |
Net gain | | | | | | | 6,006,009 | |
| | | | | | | | |
Net Increase in Net Assets From Operations | | | | | | $ | 71,488,701 | |
| | | | | | | | |
| (a) | Includes income on securities loaned of $2,910,564. |
See accompanying notes to financial statements.
MSF-14
Metropolitan Series Fund, Inc.
Lehman Brothers Aggregate Bond Index Portfolio
Statements of Changes in Net Assets
| | | | | | | | |
| | | Year ended
December 31,
2008 | | | Year ended
December 31,
2007 | |
From Operations | | | | | | | | |
Net investment income | | $ | 65,482,692 | | | $ | 58,295,278 | |
Net realized loss | | | (4,343,529 | ) | | | (586,292 | ) |
Change in unrealized appreciation | | | 10,349,538 | | | | 24,687,327 | |
| | | | | | | | |
Increase in net assets from operations | | | 71,488,701 | | | | 82,396,313 | |
| | | | | | | | |
From Distributions to Shareholders | | | | | | | | |
Net investment income | | | | | | | | |
Class A | | | (29,529,866 | ) | | | (23,636,498 | ) |
Class B | | | (24,494,600 | ) | | | (22,205,073 | ) |
Class E | | | (7,019,399 | ) | | | (7,821,668 | ) |
| | | | | | | | |
Total distributions | | | (61,043,865 | ) | | | (53,663,239 | ) |
| | | | | | | | |
Increase (decrease) in net assets from capital share transactions | | | (248,196,357 | ) | | | 234,272,891 | |
| | | | | | | | |
Net increase (decrease) in net assets | | | (237,751,521 | ) | | | 263,005,965 | |
| | |
Net Assets | | | | | | | | |
Beginning of the period | | | 1,419,907,277 | | | | 1,156,901,312 | |
| | | | | | | | |
End of the period | | $ | 1,182,155,756 | | | $ | 1,419,907,277 | |
| | | | | | | | |
Undistributed Net Investment Income | | | | | | | | |
End of the period | | $ | 68,918,722 | | | $ | 60,944,314 | |
| | | | | | | | |
Other Information:
Capital Shares
Transactions in capital shares were as follows:
| | | | | | | | | | | | | | |
| | | Year ended
December 31, 2008 | | | Year ended
December 31, 2007 | |
| | | Shares | | | $ | | | Shares | | | $ | |
Class A | | | | | | | | | | | | | | |
Sales | | 7,257,786 | | | $ | 78,190,985 | | | 24,762,938 | | | $ | 265,871,474 | |
Reinvestments | | 2,775,363 | | | | 29,529,866 | | | 2,259,703 | | | | 23,636,498 | |
Redemptions | | (20,975,670 | ) | | | (227,457,992 | ) | | (12,750,873 | ) | | | (135,946,003 | ) |
| | | | | | | | | | | | | | |
Net increase (decrease) | | (10,942,521 | ) | | $ | (119,737,141 | ) | | 14,271,768 | | | $ | 153,561,969 | |
| | | | | | | | | | | | | | |
Class B | | | | | | | | | | | | | | |
Sales | | 6,244,297 | | | $ | 66,535,833 | | | 15,528,857 | | | $ | 162,731,989 | |
Reinvestments | | 2,335,043 | | | | 24,494,600 | | | 2,149,571 | | | | 22,205,073 | |
Redemptions | | (16,204,892 | ) | | | (172,016,970 | ) | | (9,310,951 | ) | | | (97,531,567 | ) |
| | | | | | | | | | | | | | |
Net increase (decrease) | | (7,625,552 | ) | | $ | (80,986,537 | ) | | 8,367,477 | | | $ | 87,405,495 | |
| | | | | | | | | | | | | | |
Class E | | | | | | | | | | | | | | |
Sales | | 984,656 | | | $ | 10,566,589 | | | 1,900,274 | | | $ | 19,994,422 | |
Reinvestments | | 662,207 | | | | 7,019,399 | | | 749,920 | | | | 7,821,668 | |
Redemptions | | (6,063,130 | ) | | | (65,058,667 | ) | | (3,264,496 | ) | | | (34,510,663 | ) |
| | | | | | | | | | | | | | |
Net decrease | | (4,416,267 | ) | | $ | (47,472,679 | ) | | (614,302 | ) | | $ | (6,694,573 | ) |
| | | | | | | | | | | | | | |
Increase (decrease) derived from capital share transactions | | | | | $ | (248,196,357 | ) | | | | | $ | 234,272,891 | |
| | | | | | | | | | | | | | |
See accompanying notes to financial statements.
MSF-15
Metropolitan Series Fund, Inc.
Lehman Brothers Aggregate Bond Index Portfolio
Financial Highlights
| | | | | | | | | | | | | | | | | | | | |
| | | Class A | |
| | | Year ended December 31, | |
| | | 2008 | | | 2007 | | | 2006 | | | 2005 | | | 2004 | |
Net Asset Value, Beginning of Period | | $ | 10.97 | | | $ | 10.76 | | | $ | 10.81 | | | $ | 11.02 | | | $ | 10.93 | |
| | | | | | | | | | | | | | | | | | | | |
Income From Investment Operations | | | | | | | | | | | | | | | | | | | | |
Net investment income | | | 0.54 | (a) | | | 0.52 | (a) | | | 0.49 | (a) | | | 0.49 | | | | 0.46 | |
Net realized and unrealized gain (loss) of investments | | | 0.10 | | | | 0.20 | | | | (0.07 | ) | | | (0.27 | ) | | | (0.02 | ) |
| | | | | | | | | | | | | | | | | | | | |
Total from investment operations | | | 0.64 | | | | 0.72 | | | | 0.42 | | | | 0.22 | | | | 0.44 | |
| | | | | | | | | | | | | | | | | | | | |
Less Distributions | | | | | | | | | | | | | | | | | | | | |
Distributions from net investment income | | | (0.51 | ) | | | (0.51 | ) | | | (0.47 | ) | | | (0.43 | ) | | | (0.35 | ) |
| | | | | | | | | | | | | | | | | | | | |
Total distributions | | | (0.51 | ) | | | (0.51 | ) | | | (0.47 | ) | | | (0.43 | ) | | | (0.35 | ) |
| | | | | | | | | | | | | | | | | | | | |
Net Asset Value, End of Period | | $ | 11.10 | | | $ | 10.97 | | | $ | 10.76 | | | $ | 10.81 | | | $ | 11.02 | |
| | | | | | | | | | | | | | | | | | | | |
Total Return (%) | | | 6.0 | | | | 6.9 | | | | 4.1 | | | | 2.1 | | | | 4.1 | |
Ratio of operating expenses to average net assets (%) | | | 0.28 | | | | 0.29 | | | | 0.31 | | | | 0.31 | | | | 0.32 | |
Ratio of operating expenses to average net assets without giving effect to the contractual expense agreement would have been (%) (b) | | | 0.29 | | | | 0.30 | | | | 0.32 | | | | 0.31 | | | | N/A | |
Ratio of net investment income to average net assets (%) | | | 5.01 | | | | 4.86 | | | | 4.64 | | | | 4.30 | | | | 4.42 | |
Portfolio turnover rate (%) | | | 14 | | | | 15 | | | | 18 | | | | 23 | | | | 27 | |
Net assets, end of period (000) | | $ | 564,528 | | | $ | 678,193 | | | $ | 511,541 | | | $ | 524,878 | | | $ | 550,456 | |
| | | | | | | | | | | | | | | | | | | | |
| | | Class B | |
| | | Year ended December 31, | |
| | | 2008 | | | 2007 | | | 2006 | | | 2005 | | | 2004 | |
Net Asset Value, Beginning of Period | | $ | 10.81 | | | $ | 10.60 | | | $ | 10.66 | | | $ | 10.87 | | | $ | 10.79 | |
| | | | | | | | | | | | | | | | | | | | |
Income From Investment Operations | | | | | | | | | | | | | | | | | | | | |
Net investment income | | | 0.51 | (a) | | | 0.48 | (a) | | | 0.46 | (a) | | | 0.36 | | | | 0.36 | |
Net realized and unrealized gain (loss) of investments | | | 0.08 | | | | 0.20 | | | | (0.08 | ) | | | (0.16 | ) | | | 0.04 | |
| | | | | | | | | | | | | | | | | | | | |
Total from investment operations | | | 0.59 | | | | 0.68 | | | | 0.38 | | | | 0.20 | | | | 0.40 | |
| | | | | | | | | | | | | | | | | | | | |
Less Distributions | | | | | | | | | | | | | | | | | | | | |
Distributions from net investment income | | | (0.48 | ) | | | (0.47 | ) | | | (0.44 | ) | | | (0.41 | ) | | | (0.32 | ) |
| | | | | | | | | | | | | | | | | | | | |
Total distributions | | | (0.48 | ) | | | (0.47 | ) | | | (0.44 | ) | | | (0.41 | ) | | | (0.32 | ) |
| | | | | | | | | | | | | | | | | | | | |
Net Asset Value, End of Period | | $ | 10.92 | | | $ | 10.81 | | | $ | 10.60 | | | $ | 10.66 | | | $ | 10.87 | |
| | | | | | | | | | | | | | | | | | | | |
Total Return (%) | | | 5.6 | | | | 6.7 | | | | 3.8 | | | | 1.9 | | | | 3.8 | |
Ratio of operating expenses to average net assets (%) | | | 0.53 | | | | 0.54 | | | | 0.56 | | | | 0.56 | | | | 0.57 | |
Ratio of operating expenses to average net assets without giving effect to the contractual expense agreement would have been (%) (b) | | | 0.54 | | | | 0.55 | | | | 0.57 | | | | 0.56 | | | | N/A | |
Ratio of net investment income to average net assets (%) | | | 4.76 | | | | 4.60 | | | | 4.40 | | | | 4.06 | | | | 4.16 | |
Portfolio turnover rate (%) | | | 14 | | | | 15 | | | | 18 | | | | 23 | | | | 27 | |
Net assets, end of period (000) | | $ | 491,546 | | | $ | 568,790 | | | $ | 469,212 | | | $ | 354,652 | | | $ | 170,958 | |
| Please | see following page for Financial Highlights footnote legend. |
See accompanying notes to financial statements.
MSF-16
Metropolitan Series Fund, Inc.
Lehman Brothers Aggregate Bond Index Portfolio
Financial Highlights
| | | | | | | | | | | | | | | | | | | | |
| | | Class E | |
| | | Year ended December 31, | |
| | | 2008 | | | 2007 | | | 2006 | | | 2005 | | | 2004 | |
Net Asset Value, Beginning of Period | | $ | 10.92 | | | $ | 10.71 | | | $ | 10.77 | | | $ | 10.97 | | | $ | 10.89 | |
| | | | | | | | | | | | | | | | | | | | |
Income From Investment Operations | | | | | | | | | | | | | | | | | | | | |
Net investment income | | | 0.52 | (a) | | | 0.50 | (a) | | | 0.47 | (a) | | | 0.46 | | | | 0.44 | |
Net realized and unrealized gain (loss) of investments | | | 0.09 | | | | 0.20 | | | | (0.07 | ) | | | (0.25 | ) | | | (0.02 | ) |
| | | | | | | | | | | | | | | | | | | | |
Total from investment operations | | | 0.61 | | | | 0.70 | | | | 0.40 | | | | 0.21 | | | | 0.42 | |
| | | | | | | | | | | | | | | | | | | | |
Less Distributions | | | | | | | | | | | | | | | | | | | | |
Distributions from net investment income | | | (0.49 | ) | | | (0.49 | ) | | | (0.46 | ) | | | (0.41 | ) | | | (0.34 | ) |
| | | | | | | | | | | | | | | | | | | | |
Total distributions | | | (0.49 | ) | | | (0.49 | ) | | | (0.46 | ) | | | (0.41 | ) | | | (0.34 | ) |
| | | | | | | | | | | | | | | | | | | | |
Net Asset Value, End of Period | | $ | 11.04 | | | $ | 10.92 | | | $ | 10.71 | | | $ | 10.77 | | | $ | 10.97 | |
| | | | | | | | | | | | | | | | | | | | |
Total Return (%) | | | 5.8 | | | | 6.7 | | | | 3.9 | | | | 2.0 | | | | 3.9 | |
Ratio of operating expenses to average net assets (%) | | | 0.43 | | | | 0.44 | | | | 0.46 | | | | 0.46 | | | | 0.47 | |
Ratio of operating expenses to average net assets without giving effect to the contractual expense agreement would have been (%) (b) | | | 0.44 | | | | 0.45 | | | | 0.47 | | | | 0.46 | | | | N/A | |
Ratio of net investment income to average net assets (%) | | | 4.86 | | | | 4.70 | | | | 4.49 | | | | 4.15 | | | | 4.26 | |
Portfolio turnover rate (%) | | | 14 | | | | 15 | | | | 18 | | | | 23 | | | | 27 | |
Net assets, end of period (000) | | $ | 126,082 | | | $ | 172,925 | | | $ | 176,149 | | | $ | 190,840 | | | $ | 200,270 | |
| (a) | Per share amount is based on average shares outstanding during the period. |
| (b) | See Note 4 of the Notes to Financial Statements. |
See accompanying notes to financial statements.
MSF-17
Metropolitan Series Fund, Inc.
Lehman Brothers Aggregate Bond Index Portfolio
Notes to Financial Statements—December 31, 2008
Metropolitan Series Fund, Inc. (the “Fund”) is organized as a corporation under the laws of Maryland pursuant to Articles of Incorporation filed on November 23, 1982, as amended, and registered under the Investment Company Act of 1940, as amended (the “1940 Act”), as an open-end investment company. The Fund is a “series” type of mutual fund, which issues separate series of stock. Each series represents an interest in a separate portfolio of Fund investments. The Lehman Brothers Aggregate Bond Index Portfolio (the “Portfolio”) is a diversified series of the Fund. Shares in the Fund are not offered directly to the general public and are currently available only to separate accounts established by Metropolitan Life Insurance Company (“MetLife”), New England Life Insurance Company, General American Life Insurance Company (“General American”), The MetLife Investors Group of Insurance Companies, MetLife Insurance Company of Connecticut and other affiliated insurance companies (collectively, the “Insurance Companies”) and to certain eligible qualified retirement plans (“Qualified Plans”), as an investment vehicle for variable life insurance, group annuity or variable annuity products of these insurance companies or Qualified Plans, although the Portfolio is not available to all such separate accounts and Qualified Plans. The Portfolio’s shares may be divided into different classes. Currently, the classes being offered by the Portfolio are named Class A, Class B and Class E. The classes of the Portfolio’s shares are identical, except that certain additional charges (Rule 12b-1 fees) are made against Class B and Class E shares. Investment income, realized and unrealized capital gains and losses, the common expenses of the Portfolio and certain Portfolio-level expense reductions, if any, are allocated daily, on a pro rata basis, to each class based on the relative net assets of each class to the total net assets of the Portfolio.
| 2. | SIGNIFICANT ACCOUNTING POLICIES: |
The preparation of financial statements in conformity with accounting principles generally accepted in the United States of America (“GAAP”) requires management to make estimates and assumptions that affect the reported amounts of assets and liabilities and disclosure of contingent assets and liabilities as of the date of the financial statements and the reported amounts of income and expenses during the reporting period. Actual results could differ from those estimates.
The following is a summary of significant accounting policies consistently followed by the Portfolio in the preparation of its financial statements. The policies are in conformity with GAAP.
Investment Valuation:
Debt securities (other than short term obligations with a remaining maturity of sixty days or less) are generally valued on the basis of evaluated or composite bid quotations obtained by independent pricing services and/or brokers and dealers selected by the relevant subadviser pursuant to authorization of the Board of Directors of the Fund (the “Board” or “Directors”). Such quotations take into account appropriate factors such as institutional-sized trading in similar groups of securities, yield, quality, coupon rate, maturity, type of issue, trading characteristics and other data. Short term obligations with a remaining maturity of sixty days or less are valued at amortized cost which approximates fair market value.
Forward foreign currency exchange contracts are valued based on the mean between closing bid and asked prices of the forward currency contract rates in the London foreign exchange markets on a daily basis as provided by a reliable bank or dealer.
Options, whether on securities, indices, futures contracts, or otherwise, are valued at the last sales price available as of the close of business on the day of valuation or, if there is no such sale price available, at the mean between the bid and asked prices. Options on currencies are valued at the spot price each day.
The value of futures contracts will be the sum of the margin deposit plus or minus the difference between the value of the futures contract on each day the net asset value is calculated and the value on the date the futures contract originated, value being that established on a recognized commodity exchange, or by reference to other customary sources, with gain or loss being realized when the futures contract closes or expires.
Subject to the Board’s oversight, the Board has delegated the day-to-day oversight of pricing matters, including determinations in good faith under the Fund’s procedures the fair value of securities for which current market quotations are not readily available to the subadviser of the Portfolio.
Investment Transactions and Related Investment Income:
Portfolio security transactions are recorded on the trade date. Dividend income is recorded on the ex-dividend date or, for certain foreign securities, when notified. Interest income, which includes amortization of premium and accretion of discount on debt
MSF-18
Metropolitan Series Fund, Inc.
Lehman Brothers Aggregate Bond Index Portfolio
Notes to Financial Statements—December 31, 2008—(Continued)
securities, is recorded on the accrual basis. Realized gains and losses on investments and unrealized appreciation and depreciation are determined on the identified cost basis, which is the same basis used for federal income tax purposes.
Repurchase Agreements:
The Portfolio, through the custodian or a subcustodian, receives delivery of the underlying securities collateralizing repurchase agreements. The Portfolio requires the custodian to take possession, to have legally segregated in the Federal Reserve Book Entry System, or to have segregated within the custodian’s vault, all securities held as collateral for repurchase agreements. It is the Portfolio’s policy that the market value of the collateral be at least equal to 100% of the repurchase price in the case of a repurchase agreement of one-day duration and 102% on all other repurchase agreements. The Portfolio’s subadviser is responsible for determining that the value of the collateral is at all times at least equal to the repurchase price. In connection with transactions in repurchase agreements, if the seller defaults and the value of the collateral declines or if the seller enters an insolvency proceeding, realization of the collateral by the Portfolio may be delayed, limited or wholly denied.
Foreign Currency Translation:
The books and records of the Portfolio are maintained in U.S. dollars. The values of securities, currencies and other assets and liabilities denominated in currencies other than U.S. dollars are translated into U.S. dollars based upon foreign exchange rates prevailing at the end of the period. Purchases and sales of investment securities, income and expenses are translated on the respective dates of such transactions. Since the values of investment securities are presented at the foreign exchange rates prevailing at the end of the period, it is not practical to isolate that portion of the results of operations arising from changes in exchange rates from that portion of the results of operations reflecting fluctuations arising from changes in market prices of the investment securities. Such fluctuations are included in the net realized and unrealized gain or loss on investments.
Net realized foreign exchange gains or losses arise from sales of foreign currency, currency gains or losses realized between the trade and settlement dates on securities transactions, and the difference between the amounts of dividends, interest, and foreign withholding taxes recorded by the Portfolio and the U.S. dollar equivalent of the amounts actually received or paid by the Portfolio. Net unrealized foreign exchange gains and losses arise from changes in the value of assets and liabilities, other than investment securities, resulting from changes in the exchange rate.
Forward Foreign Currency Exchange Contracts:
The Portfolio may enter into forward foreign currency exchange contracts primarily to hedge against foreign currency exchange rate risks on its non-U.S. dollar denominated investment securities. When entering into a forward currency contract, the Portfolio agrees to receive or deliver a fixed quantity of foreign currency for an agreed-upon price on an agreed future date. These contracts are valued daily and the Portfolio’s net equity therein, representing unrealized gain or loss on the contracts as measured by the difference between the foreign exchange rates at the dates of entry into the contracts and the forward rates at the settlement date, is included in the Statement of Assets and Liabilities. Realized and unrealized gains and losses are included in the Statement of Operations. These instruments involve market and/or credit risk in excess of the amount recognized in the Statement of Assets and Liabilities. Risks arise from the possible inability of counterparties to meet the terms of their contracts and from movement in currency and securities values and interest rates.
Futures Contracts:
The Portfolio may buy and sell futures contracts (on recognized exchanges) as a hedge or to enhance return. Futures contracts are agreements to buy or sell a security, or deliver a final cash settlement price in connection with an index, interest rate, currency, or other contracts not calling for physical delivery, for a set price in the future. The Portfolio must post an amount equal to a portion of the total market value of the futures contract as futures variation margin, which is returned when the Portfolio’s obligations under the contract have been satisfied. From time to time thereafter, the Portfolio may have to post variation margin to maintain this amount as the market value of the contract fluctuates. Risks of entering into futures contracts (and related options) include the possibility that there may be an illiquid market and that a change in the value of the contract or option may not correlate with changes in the value of the underlying securities.
MSF-19
Metropolitan Series Fund, Inc.
Lehman Brothers Aggregate Bond Index Portfolio
Notes to Financial Statements—December 31, 2008—(Continued)
Options:
The Portfolio may use options to enhance returns or to hedge against changes in values of securities the Portfolio owns or expects to purchase. Writing puts or buying calls tends to increase the Portfolio’s exposure to the underlying instrument and writing calls or buying puts tends to decrease the Portfolio’s exposure to the underlying instrument, and can be used to hedge other Portfolio investments. For options purchased to hedge the Portfolio’s investments, the potential risk to the Portfolio is that the change in value of options contracts may not correspond to the change in value of the hedged instruments. In addition, losses may arise from changes in the value of the underlying instruments, if there is an illiquid secondary market, or if the counterparty is unable to perform. The maximum loss for purchased options is limited to the premium initially paid for the option. For options written by the Portfolio, the maximum loss is not limited to the premium initially received for the option.
The main risk associated with purchasing an option is that the option expires without being exercised. In this case, the option expires worthless and the premium paid for the option is considered the loss. The risk associated with writing a call option is that the Portfolio may forgo the opportunity for a profit if the market value of the underlying position increases and the option is exercised. The risk in writing a put option is that the Portfolio may incur a loss if the market value of the underlying position decreases and the option is exercised. In addition, the Portfolio risks not being able to enter into a closing transaction for the written option as the result of an illiquid market.
“When-Issued” Securities:
Purchasing securities “when-issued” is a forward commitment by the Portfolio to buy a security. The estimated amount of the Portfolio’s payment obligation and the security’s interest rate are determined when the commitment is made, even though no interest accrues until the security is issued, which is generally 15 to 120 days later. The Portfolio will segregate liquid assets with its custodian sufficient at all times to satisfy these commitments. If the value of the security is less when delivered than when the commitment was made, the Portfolio will suffer a loss.
Mortgage-Backed Securities:
The Portfolio invests a portion of its assets in securities of issuers that hold mortgage and asset backed securities and direct investments in securities backed by commercial and residential mortgage loans and other financial assets. The value and related income of these securities are sensitive to changes in economic conditions, including delinquencies and/or defaults. Continuing shifts in the market’s perception of credit quality on securities backed by commercial and residential mortgage loans and other financial assets may result in increased volatility of market price and periods of illiquidity that can negatively impact the valuation of certain issuers held by the Portfolio. At December 31, 2008, the Portfolio held securities of issuers that hold mortgage and asset backed securities and direct investments in mortgage and asset backed securities (excluding federal agencies) with an aggregate value of $51,030,610 (representing 4.3% of the Portfolio’s total net assets).
Federal Income Taxes:
It is the Portfolio’s policy to comply with the requirements of the Internal Revenue Code of 1986, as amended (the “Code”), and regulations thereunder, applicable to regulated investment companies and to distribute, with respect to each taxable year, all of its taxable income to shareholders. Therefore, no federal income tax provision is required. The Portfolio is subject to the provisions of the Financial Accounting Standards Board Interpretation (“FASB”) No. 48, Accounting for Uncertainties in Income Taxes (FIN 48). FIN 48 sets forth a minimum threshold for financial statement recognition of the benefit of a tax position taken or expected to be taken in a tax return. The implementation of FIN 48 did not result in any unrecognized tax benefits in the accompanying financial statements. Each of the Portfolio’s federal tax returns for the prior three fiscal years remains subject to examination by the Internal Revenue Service.
As of December 31, 2008, the Portfolio had capital loss carryforwards as follows:
| | | | | | | | | | | | | | | | | | | | | | |
Expiring
12/31/16 | | Expiring
12/31/15 | | Expiring
12/31/14 | | Expiring
12/31/13 | | Expiring
12/31/12 | | Expiring
12/31/10 | | Expiring
12/31/09 | | Total |
| $ | 6,670,752 | | $ | 4,015,637 | | $ | 4,808,149 | | $ | 3,790,866 | | $ | 499,465 | | $ | 449,093 | | $ | 612,878 | | $ | 20,846,840 |
MSF-20
Metropolitan Series Fund, Inc.
Lehman Brothers Aggregate Bond Index Portfolio
Notes to Financial Statements—December 31, 2008—(Continued)
Pursuant to Section 852 of the Code, the Portfolio designated the amount shown below under Long Term Gain as capital gain dividends for its taxable year ended December 31, 2008. The tax character of distributions paid for the periods ended December 31, 2008 and 2007 was as follows:
| | | | | | | | | | | | | | | | | | | | | | |
| Ordinary Income | | Long Term Gain | | Return of Capital | | Total |
| 2008 | | 2007 | | 2008 | | 2007 | | 2008 | | 2007 | | 2008 | | 2007 |
| $ | 61,043,865 | | $ | 53,663,239 | | $ | — | | $ | — | | $ | — | | $ | — | | $ | 61,043,865 | | $ | 53,663,239 |
As of December 31, 2008, the components of distributable earnings (accumulated losses) on a federal income tax basis were as follows:
| | | | | | | | | | | | | | |
Undistributed
Ordinary
Income | | Undistributed
Long Term
Gain | | Unrealized
Appreciation | | Loss
Carryforwards | | | Total |
| $ | 68,918,722 | | $ | — | | $ | 18,828,455 | | $ | (20,846,840 | ) | | $ | 66,900,337 |
Pursuant to Federal income tax regulations applicable to investment companies, the Portfolio has elected to treat net capital losses realized between November 1 and December 31 of each year as occurring on the first day of the following tax year. For the year ended December 31, 2008, the following amounts of realized capital and currency losses reflected in the accompanying financial statements will not be recognized for Federal income tax purposes until January 1, 2009:
| | | | |
Currency | | Capital | |
$— | | $ | (853,547 | ) |
Dividends and Distributions to Shareholders:
The Portfolio records dividends and distributions on the ex-dividend date. Net realized gains from security transactions (if any) are generally distributed annually to shareholders. The timing and characterization of certain income and capital gains distributions are determined in accordance with federal tax regulations that may differ from GAAP. Permanent book and tax basis differences relating to shareholder distributions will result in reclassification between under/over distributed net investment income, accumulated net realized gains/losses and paid in capital.
| 3. | INVESTMENT TRANSACTIONS: |
For the year ended December 31, 2008, purchases and sales of securities (excluding short term investments) for the Portfolio were as follows:
| | | | | | | | | | |
| Purchases | | Sales |
| U.S. Government | | Other | | U.S. Government | | Other |
| $ | 122,838,829 | | $ | 59,003,804 | | $ | 245,903,693 | | $ | 103,449,174 |
| 4. | INVESTMENT MANAGEMENT FEES AND OTHER TRANSACTIONS WITH AFFILIATES: |
Investment Management Agreement:
MetLife Advisers, LLC (“MetLife Advisers”) is the investment adviser to the Portfolio. The Fund has entered into an investment management agreement with MetLife Advisers with respect to the Portfolio. For providing investment management services to the Portfolio, MetLife Advisers receives monthly compensation at the annual rate of 0.25% of average daily net assets. Fees earned by MetLife Advisers with respect to the Portfolio for the year ended December 31, 2008 were $3,345,897.
Certain officers and directors of the Fund may also be officers of MetLife Advisers; however, such officers and directors receive no compensation from the Fund.
MetLife Advisers has entered into an investment subadvisory agreement with MetLife Investment Advisors, LLC (“MLIAC”) with respect to the Portfolio. MetLife Advisers pays MLIAC an investment subadvisory fee for the Portfolio equal to the costs incurred by MLIAC in providing subadvisory services to the Portfolio. Fees earned by MLIAC with respect to the Portfolio for the year ended December 31, 2008 were $307,823.
MSF-21
Metropolitan Series Fund, Inc.
Lehman Brothers Aggregate Bond Index Portfolio
Notes to Financial Statements—December 31, 2008—(Continued)
Management Fee Waivers:
Pursuant to an expense agreement, MetLife Advisers has agreed, for the period May 1, 2008 to April 30, 2009, to reduce its advisory fees set out above under “Investment Management Agreement” for each class of the Portfolio at the annual rate of 0.006% of average daily net assets. A similar expense agreement was in place for the period May 1, 2007 through April 30, 2008. Amounts waived for the year ended December 31, 2008 are shown as management fee waivers in the Statement of Operations.
Service and Distribution Fees:
The Fund has adopted a Distribution and Service Plan under Rule 12b-1 of the 1940 Act for the Portfolio’s Class B and E shares. Under the Distribution and Service Plan, the Class B and E shares of the Portfolio pay a fee to compensate the Insurance Companies (or their affiliates) and other broker-dealers and financial intermediaries involved in the offer and sale of Portfolio shares for promoting or selling and servicing the Class B and E shares. The fees under the Distribution and Service Plan for each class of the Portfolio’s shares are calculated as a percentage of the Portfolio’s average daily net assets that are attributable to that Class. Currently, the fee is 0.25% per year for Class B shares and 0.15% per year for Class E shares. Amounts paid by the Portfolio for the year ended December 31, 2008 are shown as Service and Distribution fees in the Statement of Operations.
The Fund has entered into a securities lending arrangement with the Fund’s custodian, State Street Bank and Trust Company (the “custodian”). Under the agreement, the custodian is authorized to loan securities on the Portfolios’ behalf. In exchange, the Portfolio receives either cash or securities as collateral against the loaned securities. The Portfolio receives collateral at least equal to 102% of the market value of the loaned securities (105% for foreign securities), at each loan’s inception. Collateral must be maintained at least at 100% of the market value of the loaned securities for the duration of the loan. The cash collateral is invested in the Navigator Securities Lending Prime Portfolio, an affiliate of the custodian, which invests in a variety of high quality U.S. dollar-denominated instruments. If the market value of the collateral at the close of trading on a business day is less than 100% of the market value of the loaned securities at the close of trading on that day, the borrower shall be required to deliver, by the close of business on the following business day, an additional amount of collateral, equal to at least 100% of the market value of all the loaned securities as of such preceding day. The Portfolio receives 80% of the annual net income from securities lending transactions, which is included in interest income of the Portfolio. The remaining 20% is paid to the custodian as compensation for its securities lending services. Interest income received by the Portfolio via lending transactions during the year ended December 31, 2008 is footnoted in the Statement of Operations. The Portfolio bears the risk of any deficiency in the amount of collateral available for return to a borrower due to a loss in an approved investment purchased with such collateral. Any outstanding loans by the Portfolio at December 31, 2008 are footnoted in the Schedule of Investments.
| 6. | MARKET AND CREDIT RISK: |
In the normal course of business, the Portfolio invests in securities and enters into transactions where risks exist due to fluctuations in the market (market risk) or failure of the other party to a transaction to perform (credit risk). The value of securities held by the Portfolio may decline in response to certain events, including those directly involving the companies whose securities are owned by the Portfolio; conditions affecting the general economy; overall market changes; local, regional or global political, social or economic instability; and currency and interest rate and price fluctuations. Similar to credit risk, the Portfolio may be exposed to counterparty risk, or the risk that an entity with which the Portfolio has unsettled or open transactions may default. Financial assets, which potentially expose the Portfolio to credit and counterparty risks, consist principally of investments and cash due from counterparties. The extent of the Portfolio’s exposure to credit and counterparty risks in respect to these financial assets approximates their value as recorded in the Portfolio’s Statements of Assets and Liabilities.
| 7. | RECENT ACCOUNTING PRONOUNCEMENTS: |
In March 2008, the FASB issued Statement of Financial Accounting Standards No. 161, Disclosures about Derivative Instruments and Hedging Activities (“FAS 161”), an amendment of FASB Statement No. 133. FAS 161 requires enhanced disclosures about (a) how and why an entity uses derivative instruments, (b) how derivative instruments and hedging activities are accounted for, and (c) how derivative instruments and related hedging activities affect a fund’s financial position, financial performance, and cash flows. Management does not believe the adoption of FAS 161 will materially impact the financial statement amounts, but will require additional disclosures. This will include qualitative and quantitative disclosures on derivative positions existing at period end and the effect of using derivatives during the reporting period. FAS 161 is effective for financial statements issued for fiscal years and interim periods beginning after November 15, 2008. Management is currently evaluating the impact the adoption of FAS 161 will have on the Portfolio’s financial statement disclosures.
MSF-22
Metropolitan Series Fund, Inc.
Lehman Brothers Aggregate Bond Index Portfolio
Report of Independent Registered Public Accounting Firm
To the Shareholders and Board of Directors of Metropolitan Series Fund, Inc.:
We have audited the accompanying statement of assets and liabilities, including the schedule of investments, of the Lehman Brothers Aggregate Bond Index Portfolio (one of the portfolios constituting the Metropolitan Series Fund, Inc.) (the “Fund”) as of December 31, 2008, and the related statement of operations for the year then ended, the statements of changes in net assets for each of the two years in the period then ended, and the financial highlights for each of the five years in the period then ended. These financial statements and financial highlights are the responsibility of the Fund’s management. Our responsibility is to express an opinion on these financial statements and financial highlights based on our audits.
We conducted our audits in accordance with the standards of the Public Company Accounting Oversight Board (United States). Those standards require that we plan and perform the audit to obtain reasonable assurance about whether the financial statements and financial highlights are free of material misstatement. The Fund is not required to have, nor were we engaged to perform, an audit of its internal control over financial reporting. Our audits included consideration of internal control over financial reporting as a basis for designing audit procedures that are appropriate in the circumstances, but not for the purpose of expressing an opinion on the effectiveness of the Fund’s internal control over financial reporting. Accordingly, we express no such opinion. An audit also includes examining, on a test basis, evidence supporting the amounts and disclosures in the financial statements, assessing the accounting principles used and significant estimates made by management, as well as evaluating the overall financial statement presentation. Our procedures included confirmation of securities owned as of December 31, 2008, by correspondence with the custodian and brokers; where replies were not received from brokers, we performed other auditing procedures. We believe that our audits provide a reasonable basis for our opinion.
In our opinion, the financial statements and financial highlights referred to above present fairly, in all material respects, the financial position of the Lehman Brothers Aggregate Bond Index Portfolio of the Metropolitan Series Fund, Inc. as of December 31, 2008, the results of its operations for the year then ended, the changes in its net assets for each of the two years in the period then ended, and the financial highlights for each of the five years in the period then ended, in conformity with accounting principles generally accepted in the United States of America.
Deloitte & Touche LLP
Boston, Massachusetts
February 25, 2009
MSF-23
Metropolitan Series Fund, Inc.
Directors and Officers
The Fund’s Directors review actions of the Fund’s investment adviser and subadvisers, and decide upon matters of general policy. The Fund’s officers supervise the daily business operations of the Fund. The Board of Directors and the Fund’s officers are listed below. Each Director is responsible for overseeing all 38 Portfolios of the Fund. There is no limit to the term a Director may serve. Directors serve until their resignation, retirement or removal in accordance with the Fund’s organizational documents and policies adopted by the Board from time to time. Officers hold office at the pleasure of the Board or until the election or appointment and the qualification of a successor. The address of the Directors and officers is c/o Metropolitan Series Fund, Inc., 501 Boylston Street, Boston, MA 02116.
Interested Directors(1)
Each Director below is an “interested person” (as defined by the 1940 Act) with respect to the Fund in that Ms. Forget is an employee of MetLife and Mr. Typermass is a former employee of MetLife and owns securities issued by MetLife, Inc., the ultimate parent company of MetLife Advisers.
| | | | | | | | |
Name, Address and Age | | Current
position(s)
with Fund | | Position(s)
held since | | Principal occupations
over past five years, including other directorships(2) | | Number of
Portfolios in
Fund Complex
Overseen by
Director(3) |
Elizabeth M. Forget Age: 42 | | Director, Chairman of the Board, President and Chief Executive Officer | | 2006 | | Senior Vice President (since 2007), MetLife, Inc.; President, Met Investors Advisory, LLC; Trustee and President, Met Investors Series Trust; Executive Vice President, MetLife Investors Group, Inc.; President, Chief Executive Officer and Chair of the Board of Managers (since 2006), MetLife Advisers; President, Met Investors Advisory, LLC. | | 87 |
| | | | |
Arthur G. Typermass Age: 71 | | Director | | 1998 | | Formerly, Senior Vice President and Treasurer, MetLife. | | 38 |
Non-Interested Directors(1)
Each Director below is not an “interested person” (as defined by the 1940 Act) with respect to the Fund (collectively, the “Independent Directors”).
| | | | | | | | |
Name, Address and Age | | Current
position(s)
with Fund | | Position(s)
held since | | Principal occupations
over past five years, including other directorships(2) | | Number of
Portfolios in
Fund Complex
Overseen by
Director(3) |
Steve A. Garban† Age: 71 | | Director | | 1985 | | Formerly, Chief Financial Officer, Senior Vice President Finance and Operations and Treasurer (Emeritus), The Pennsylvania State University. | | 38 |
| | | | |
Linda B. Strumpf Age: 61 | | Director | | 2000 | | Vice President and Chief Investment Officer, Ford Foundation. | | 38 |
| | | | |
Michael S. Scott Morton† Age: 71 | | Director | | 1993 | | Jay W. Forrester Professor of Management (Emeritus) at Sloan School of Management, MIT. | | 38 |
| | | | |
H. Jesse Arnelle Age: 75 | | Director | | 2001 | | Formerly, Counsel, Womble Carlyle Sandrie & Rice; Director, Textron Inc. (global multi- industry company)*; formerly, Director, Gannet Co. Inc. (diversified news and information company)*; formerly, Director, Eastman Chemical Company (global chemical company)*; formerly, Director, Waste Management, Inc.*; formerly, Director, Armstrong Holdings Inc. (parent company of floor and ceiling products business)*; formerly, Director, FPL Group Inc. (public utility holding company)*; Director, URS Corporation (engineering design services firm)*. | | 38 |
MSF-24
Metropolitan Series Fund, Inc.
Directors and Officers—(Continued)
| | | | | | | | |
Name, Address and Age | | Current
position(s)
with Fund | | Position(s)
held since | | Principal occupations
over past five years, including other directorships(2) | | Number of
Portfolios in
Fund Complex
Overseen by
Director(3) |
Nancy Hawthorne Age: 57 | | Director | | 2003 | | Chief Executive Officer, Clerestory LLC (corporate financial advisor); Director, Avid Technologies (computer software company)*; formerly, Chairman of the Board of Avid Technologies; formerly, Board of Advisors, L. Knife & Sons, Inc. (beverage distributor); formerly, Trustee, New England Zenith Fund (“Zenith Fund”)**; formerly, Chief Executive Officer and Managing Partner, Hawthorne, Krauss and Associates (corporate financial advisor); formerly, Chief Financial Officer and Executive Vice President, Continental Cablevision, subsequently renamed MediaOne (cable television company); formerly, Director, Life F/X, Inc.; formerly, Chairman of the Board, WorldClinic (distance medicine company); formerly, Director, Perini Corporation (construction company)*; formerly, Director, CGU (property and casualty insurance company); formerly, Director, Beacon Power Corporation (energy company)*. | | 38 |
| | | | |
John T. Ludes Age: 72 | | Director | | 2003 | | President, LFP Properties (consulting firm); Formerly, Trustee, Zenith Fund**; formerly, Vice Chairman, President and Chief Operating Officer, Fortune Brands/American Brands (global conglomerate); formerly, President and CEO, Acushnet Company (athletic equipment company). | | 38 |
Officers(1)
| | | | | | | | |
Name and address | | Age | | Current
position(s)
with Fund | | Position(s)
held since | | Principal occupations over past five years(2) |
| Jeffrey L. Bernier | | 37 | | Senior Vice President | | 2008 | | Vice President (since 2008), MetLife, Inc.; Vice President (since 2008), MetLife; Senior Vice President (since 2008), MetLife Advisers; formerly, Director and Senior Investment Analyst (2004 to 2007), John Hancock Financial Services; formerly, Assistant Vice President (2000 to 2001), Wachovia Securities. |
| | | | |
| Alan C. Leland | | 56 | | Senior Vice President | | 2005 | | Treasurer and Chief Financial Officer, MetLife Advisers, LLC; Treasurer (since 2005), Met Investors Advisory, LLC; Vice President (since 2004), Met Investors Advisory, LLC; Vice President (since 2003), MetLife, Inc.; Vice President, MetLife; Senior Vice President, NELICO. |
| | | | |
| Peter Duffy | | 53 | | Vice President
and Treasurer | | 2000 | | Senior Vice President, MetLife Advisers; Second Vice President (since 2003), NELICO; Vice President, MetLife (since 2004); Vice President (since 2004), MetLife, Inc.; formerly, Vice President and Treasurer, Zenith Fund**. |
| | | | |
| Jeffrey P. Halperin | | 41 | | Chief
Compliance Officer | | 2007 | | Vice President (since 2006), MetLife, Inc.; Vice President (since 2006), MetLife; Chief Compliance Officer (since 2006), Met Investors Series Trust, MetLife Advisers, Met Investors Advisory, LLC and MetLife Investment Advisors Company, LLC. |
| * | Indicates a directorship with a registered investment company or a company subject to the reporting requirements of the Securities Exchange Act of 1934, as amended. |
| ** | The Zenith Fund deregistered with the Securities and Exchange Commission (“SEC”) in 2004. |
| (†) | Served as a trustee, director and/or officer of one or more of the following companies, each of which had a direct or indirect advisory relationship with MetLife Advisers or its affiliates prior to January 31, 2005: State Street Research Financial Trust, State Street Research Income Trust, State Street Research Money Market Trust, State Street Research Institutional Funds, State Street Research Capital Trust, State Street Research Master Investment Trust, State Street Research Equity Trust, State Street Research Securities Trust and State Street Research Exchange Trust (collectively, the “State Street Research Funds”). |
| (1) | During the period shown, each Director of the Fund served as a Trustee of Metropolitan Series Fund II, a registered investment company that ceased investment operations in June of 2008 and has applied for deregistration under the Investment Company Act of 1940. During this period, each officer of the Fund served in the same position with Metropolitan Series Fund II. |
| (2) | Previous positions during the past five years with the Fund; Met Investors Series Trust; MetLife; MetLife, Inc.; MetLife Advisers; Met Investors Advisory, LLC; Zenith Fund; NELICO; or New England Securities Corporation are omitted if not materially different. |
| (3) | The Fund Complex includes the Fund (38 portfolios) and Met Investors Series Trust (49 portfolios). |
MSF-25
Metropolitan Series Fund, Inc.
Lehman Brothers Aggregate Bond Index Portfolio
Board Approval of Advisory and Subadvisory Agreements
The Fund’s Contract Review Committees of the Board of Directors (the “Board” or the “Directors”) typically meet in early fall to review the Portfolios’ advisory agreements (the “Advisory Agreements”) and subadvisory agreements (the “Subadvisory Agreements,” and, together with the Advisory Agreements, the “Agreements”) and determine whether to recommend that the full Board approve the continuation of the Agreements for an additional one-year period. (Following the initial approval of an Agreement for a new Portfolio or with a new adviser or subadviser, such annual reviews are not required until 2 years following the execution of such Agreement.) After each Committee has made its recommendations, the full Board, including the Independent Directors, determines whether to approve the continuation of each of the Agreements. In addition, the Board, including the Independent Directors, considers matters bearing on the Agreements at most of its other meetings throughout the year and regularly interviews various individuals at MetLife Advisers responsible for the management of the Portfolios. The Directors also interview selected investment managers and other professionals at the subadvisers at various times throughout the year.
The Directors receive all materials that they or MetLife Advisers, the Fund’s investment adviser, and the subadvisers believe to be reasonably necessary for the Directors to evaluate the Agreements and determine whether to approve the continuation of the Agreements. These materials generally include, among other items, (i) information on the investment performance of the Portfolios and the performance of peer groups of funds and the Portfolios’ performance benchmarks, (ii) information on the Portfolios’ advisory and subadvisory fees and other expenses, including information comparing the Portfolios’ expenses to those of peer groups of funds and information about any applicable expense caps and fee “breakpoints,” (iii) sales and redemption data, (iv) information related to the profitability of the Agreements to MetLife Advisers and certain of the subadvisers, and potential “fall-out” or ancillary benefits that MetLife Advisers, the subadvisers or their affiliates may receive as a result of their relationships with the Fund and (v) information obtained through the subadvisers’ responses to certain requests from MetLife Advisers and the Directors and MetLife Advisers’ responses to requests from the Directors. The Directors may also consider other information such as (vi) MetLife Advisers’ and the subadvisers’ financial results and condition, (vii) each Portfolio’s investment objectives and strategies and the size, education and experience of the investment staffs of MetLife Advisers and the relevant subadvisers and their use of technology and external research, (viii) the allocation of the Portfolios’ brokerage, if any, including allocations to brokers affiliated with the subadvisers and the use of “soft” commission dollars to pay Portfolio expenses and to pay for research and other similar services, (ix) the resources devoted to, and the record of compliance with, the Portfolios’ investment policies and restrictions, policies on personal securities transactions and other compliance policies, (x) the responses of MetLife Advisers, the subadvisers and/or their affiliates to certain legal and regulatory proceedings and (xi) the economic outlook generally and for the mutual fund industry in particular. Throughout the process, the Directors have the opportunity to ask questions of and request additional materials from MetLife Advisers and the subadvisers.
Following meetings of each Contract Review Committee on September 10, 2008, the Board, including the Independent Directors, at its November 6-7, 2008 meeting, approved the continuation through December 31, 2009 of the Advisory Agreements for each Portfolio of the Fund and the Subadvisory Agreements for each Portfolio other than the Zenith Equity Portfolio and Asset Allocation Portfolios (which do not have subadvisers) and the Van Eck Global Natural Resources Portfolio, Met/Dimensional International Small Cap Portfolio and Loomis Sayles Small Cap Growth Portfolio (formerly known as the Franklin Templeton Small Cap Growth Portfolio). The Agreements approved for continuation are referred to below as the “Continued Agreements.”
In considering whether to approve the continuation of the Continued Agreements, the Directors, including the Independent Directors, did not identify any single factor as determinative, and each weighed the various factors as he or she deemed appropriate. The Directors considered the following matters in connection with their approval of the Continued Agreements:
The nature, extent and quality of the services provided to the relevant Portfolios under the Continued Agreements. The Directors considered the nature, extent and quality of the services provided by MetLife Advisers, the relevant subadvisers (if any) and their affiliates (each, an “Adviser,” and, collectively, the “Advisers”) to the relevant Portfolios pursuant to the Continued Agreements and the resources dedicated to these Portfolios by the Advisers. In particular, the Directors considered the Advisers’ abilities to attract and retain highly qualified investment professionals. With respect to MetLife Advisers, the Directors considered (for each Portfolio other than the Zenith Equity and Asset Allocation Portfolios) that MetLife Advisers is (i) ultimately responsible for the performance of such Portfolios; (ii) ultimately responsible for the establishment of the investment strategies of each such Portfolio, primarily through its recommendations to the Board regarding the hiring and selection of subadvisers; (iii) responsible for the hiring and selection, subject to Board approval, of subadvisers; and (iv) responsible for maintaining a program of Subadviser oversight reasonably designed to ensure that the subadvisers have reasonable compliance policies and procedures in place. The Directors also considered that MetLife Advisers provides a full range of day-to-day administrative services for the Portfolios involving all aspects of such Portfolios’ day-to-day operations (other than portfolio management). With respect to the Zenith Equity and Asset Allocation Portfolios, the Directors considered both the portfolio management services and the administrative services provided by MetLife Advisers. After reviewing
MSF-26
Metropolitan Series Fund, Inc.
Lehman Brothers Aggregate Bond Index Portfolio
Board Approval of Advisory and Subadvisory Agreements—(Continued)
these and related factors, the Directors concluded, within the context of their overall conclusions regarding each of the Continued Agreements, that the nature, extent and quality of services provided supported the renewal of these Agreements.
Investment performance of the relevant Portfolios. The Directors reviewed information about the performance of the relevant Portfolios over various time periods, including information prepared by an independent third party that compared the performance of the Portfolios to the performance of peer groups of funds and performance benchmarks. The Directors also reviewed a description of the third party’s methodology for identifying a Portfolio’s peer group(s) for purposes of performance and expense comparisons.
In the case of each relevant Portfolio that had performance that lagged its peer group(s) for certain periods, the Directors concluded that other factors relevant to performance were sufficient, in light of other considerations, to warrant renewal of the Continued Agreements relating to such Portfolio. These factors varied from Portfolio to Portfolio, but included one or more of the following: (i) that such Portfolio’s performance, although lagging in certain recent periods, was stronger over the longer term; (ii) that the underperformance was attributable, to a significant extent, to investment decisions that were reasonable and consistent with the Portfolio’s investment objective(s) and policies and that the Portfolio was performing within the range of reasonable expectations, given market conditions and the Portfolio’s investment objective(s) and policies; (iii) that the Portfolio’s performance was competitive when compared to other relevant performance benchmarks or peer groups; and (iv) that MetLife Advisers and/or the relevant subadviser (if any) had taken or was taking steps designed to help improve the Portfolio’s investment performance (including, in the case of certain Portfolios, that MetLife Advisers was formulating possible proposals, for presentation to the Board in November 2008, to replace the Portfolio’s subadviser or to merge the Portfolio into another Portfolio with a similar investment objective and better investment performance).
The Directors also considered the investment performance of the Advisers and their reputations generally, the historical responsiveness of the Advisers to Director concerns about performance and the willingness of the Advisers to take steps intended to improve performance.
After reviewing these and related factors, the Directors concluded, within the context of their overall conclusions regarding each of the Continued Agreements, that the investment performance of each relevant Portfolio and Adviser was sufficient, in light of other considerations, to warrant the renewal of the Continued Agreements.
The costs of the services to be provided and profits to be realized by the Advisers and their affiliates from their relationships with the Portfolios. The Directors considered the fees charged by MetLife Advisers to the Portfolios for advisory services and, with respect to the subadvised Portfolios, by such subadvisers to MetLife Advisers for subadvisory services (such advisory and subadvisory fees (if any), collectively, “Fees”), as well as the total expense levels of the Portfolios. This information included comparisons (provided by an independent third party) of the Portfolios’ advisory fees and total expense levels to those of their peer groups. In evaluating Fees for the relevant Portfolios, the Directors also took into account the demands, complexity and quality of the investment management services provided to each Portfolio. The Directors considered MetLife Advisers’ recommendations regarding reductions in Fee rates, implementation of Fee breakpoints and institution of Fee waivers and expense caps.
The Directors also considered the compensation directly or indirectly received by the Advisers and their affiliates from their relationships with the relevant Portfolios. The Directors reviewed information relating to the profits received by MetLife Advisers, certain of the subadvisers and their affiliates as a result of their relationships with the relevant Portfolios, and information about the allocation of expenses used to calculate profitability. When reviewing profitability, the Directors also considered the performance of the relevant Portfolios, the expense levels of such Portfolios and whether the relevant Advisers had implemented breakpoints, fee waivers and/or expense caps with respect to such Portfolios.
After reviewing these and related factors, the Directors concluded, within the context of their overall conclusions regarding each of the Continued Agreements, that the Fees charged to each of the relevant Portfolios were fair and reasonable, and that the information provided regarding costs of these services generally, and the related profitability (if known) to the relevant Advisers of their relationships with the relevant Portfolios, supported the renewal of the Continued Agreements.
Economies of Scale. The Directors considered the existence of any economies of scale in the provision of services by the Advisers and whether those economies were shared with the relevant Portfolios through breakpoints in their advisory fees or other means, such as expense caps, fee waivers or relatively low levels of fees. The Directors noted that most of the relevant Portfolios benefited or will benefit from breakpoints, expense caps and/or fee waivers with respect to their advisory fees. In considering these issues, the Directors also took into consideration information relating to the costs of the services provided and the profitability to MetLife Advisers, the relevant subadvisers (if any) and each of their affiliates of their relationships with the relevant Portfolios, as discussed above.
MSF-27
Metropolitan Series Fund, Inc.
Lehman Brothers Aggregate Bond Index Portfolio
Board Approval of Advisory and Subadvisory Agreements—(Continued)
After reviewing these and related factors, the Directors concluded, within the context of their overall conclusions regarding each of the Continued Agreements, that the extent to which economies of scale were shared with the relevant Portfolios supported the renewal of such Agreements.
Other Factors. The Directors also considered other factors, which included but were not limited to the following:
| | • | | the extent to which each relevant Portfolio operated in accordance with its investment objective, and its record of compliance with its investment restrictions and the compliance programs of the Fund and the Advisers. They also considered the compliance-related resources the Advisers and their affiliates provide to the relevant Portfolios; |
| | • | | the nature, quality, cost and extent of administrative and shareholder services performed by MetLife Advisers and its affiliates under the Advisory Agreements; and |
| | • | | so-called “fall-out benefits” to the Advisers, such as the engagement of their affiliates to provide distribution, brokerage and transfer agency services to the Portfolios, and the benefits of research made available to the relevant Advisers by reason of brokerage commissions generated by the relevant Portfolios’ securities transactions. The Directors also considered the possible conflicts of interest associated with these fall-out and other benefits, and the reporting and other processes in place to disclose and monitor these possible conflicts of interest. |
Based on their evaluation of all factors that they deemed to be material, including those factors described above, and assisted by the advice of independent counsel, the Directors, including the Independent Directors, concluded that each of the Continued Agreements should be continued through December 31, 2009.
MSF-28
A description of the policies and procedures that the Fund uses to determine how to vote proxies relating to portfolio securities is available (i) without charge, upon request, by calling (800) 638-7732 and (ii) on the Securities and Exchange Commission’s (the “SEC”) website at http://www.sec.gov.
Information regarding how the Fund voted proxies relating to portfolio securities during the most recent twelve-month period ended December 31, 2008 is available (i) without charge, upon request, by calling (800) 638-7732 and (ii) on the SEC’s website at http://www.sec.gov.
The Fund’s Statement of Additional Information includes additional information about the Directors of the Fund and is available (i) without charge, upon request, by calling (800) 638-7732 and (ii) on the SEC’s website at http://www.sec.gov.
The Fund files with the SEC a complete schedule of its portfolio holdings, as of the close of the first and third quarters of its fiscal year, on “Form N-Q”. These filings are available on the SEC’s website at www.sec.gov and may be reviewed and copied at the SEC’s Public Reference Room in Washington, DC. (Call 1-800-SEC-0330 for information on the operation of the Public Reference Room.)
MSF-29
Simplify your life…
with MetLife eDelivery® while helping MetLife preserve the planet’s natural resources.
(see details on inside cover)
| | |
Metropolitan Series Fund, Inc. Loomis Sayles Small Cap Portfolio Annual Report | | December 31, 2008 |
NOT PART OF THE ANNUAL REPORT
Letter from the President
February 1, 2009
Letter to Policy Holders:
2008 was an extraordinary year in the capital markets around the world and for the global economy. Energy prices rose to record levels early in the year before falling by two-thirds by year-end. A credit crisis that began with concerns about sub-prime mortgages led to massive changes in the financial landscape with government takeovers, forced sales, and outright failures of a number of large, once venerable firms.
While bonds as measured by the Barclays Capital U.S. Aggregate Bond Index (formerly known as, Lehman Brothers U.S. Aggregate Bond Index) were up 5.2% for the year in response to declining interest rates, there were large differences in the total returns of the various sectors of the bond market. U.S. treasury securities were up over 13% as frightened investors sought refuge in what they perceived to be the safest and most liquid investments. In contrast, investment grade corporate securities lost nearly 5% as credit spreads widened and below investment grade or high yield bonds fell over 26%.
In response to the growing credit crisis and the weakening economy, common stocks fell sharply across all regions, styles, and capitalizations. As measured by the Standard and Poor’s 500, U.S. common stocks fell 37% for the year, the worst calendar year decline since the 1930s. Foreign stocks were down even more with the MSCI EAFE Index down 43% for the year.
On the following pages, you will find a complete review of your Portfolio and its investment performance.
MetLife is committed to building your financial freedom. We appreciate your trust and will continue to focus our efforts on meeting your investment needs.
Sincerely,
Elizabeth M. Forget
President, Metropolitan Series Fund, Inc.
Metropolitan Series Fund, Inc.
Loomis Sayles Small Cap Portfolio
Managed by Loomis, Sayles & Company, L.P.
Portfolio Manager Commentary*
PORTFOLIO PERFORMANCE
For the twelve-month period ended December 31, 2008, the Class A shares of the Loomis Sayles Small Cap Portfolio returned -35.9%, compared to its benchmark, the Russell 2000 Index1, which returned -33.8%. The average return of its peer group, the Lipper Variable Insurance Products2 Small-Cap Core Funds Universe, was -35.5% over the same period.
PORTFOLIO REVIEW
Equity markets were under severe pressure during the fourth quarter of 2008, capping off one of the worst years for stocks in decades. The challenges the market faced have been well documented: the bursting of the housing bubble, the subsequent credit crisis and dislocations in the capital markets, high profile corporate bankruptcies, fiscal and monetary policy changes of epic proportions and finally a global economic recession which may persist for some time. Within that context, virtually all capital markets posted severe declines, including domestic equities and small-cap stocks. The high level of correlation of all assets during 2008, including individual stocks, presented a difficult environment for a stock picking strategy, which caused the
Portfolio to trail the Benchmark modestly.
From an attribution standpoint, the modest underperformance was driven from stock selection. While the Portfolio performed well on a stock basis within consumer discretionary and staples, it lagged in financials and energy. The strength in consumer discretionary was largely driven by counter cyclical companies, such as those in the for profit education industry including Devry, Grand Canyon Education, and Dollar Tree.
Financials and energy were difficult sectors to navigate in 2008. In financial services, we were surprised by the relative resilience of several small-cap banks and consumer finance companies during the calendar year. The Portfolio was underweight the sector for the calendar year and our higher quality stock picks simply failed to keep up in a sector that measurably outperformed. Energy went from being by far the best sector in the market during the first half of the year to being the worst in the second. While stock selection in energy was neutral in the second half of the year, the Portfolio did not own some of the better performing energy stocks in the first half due to market cap parameters.
* The views expressed above are those of the subadvisory firm as of December 31, 2008 and are subject to change based on market and other conditions. Information about the Portfolio’s holdings, asset allocation, industry allocation, or country diversification is historical and is not an indication of future Portfolio composition, which will vary. The performance of any index mentioned in this commentary has not been adjusted for ongoing management, distribution and operating expenses, and sales charges applicable to mutual fund investments. Direct investment in any index is not possible.
1 The Russell 2000® Index is an unmanaged measure of performance of the 2,000 smallest companies in the Russell 3000® Index.
2 The Lipper Variable Products Fund Average is an average of the total return performance (calculated on the basis of net asset value) of variable product funds with similar investment objectives to those of the subject Portfolio as calculated by Lipper Analytical Services, an independent mutual fund ranking service.
MSF-2
Metropolitan Series Fund, Inc.
Loomis Sayles Small Cap Portfolio
A $10,000 INVESTMENT COMPARED TO THE RUSSELL 2000 INDEX
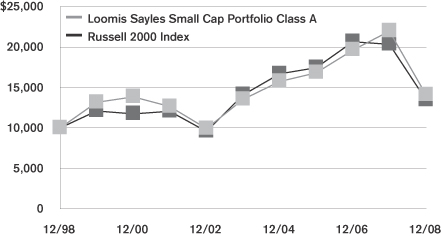
Average Annual Returns as of December 31, 2008
| | | | | | | | | | | | |
| | | Loomis Sayles Small Cap Portfolio | | | Russell 2000
Index | |
| | | Class A | | | Class B | | | Class E | | |
| 1 Year | | -35.9 | % | | -36.1 | % | | -36.0 | % | | -33.8 | % |
| 5 Year | | 0.8 | | | 0.6 | | | 0.7 | | | -0.9 | |
| 10 Year | | 3.5 | | | — | | | — | | | 3.0 | |
| Since Inception | | — | | | 4.7 | | | 1.1 | | | — | |
Performance numbers are net of all Portfolio expenses but do not include any insurance, sales, or administrative charges of variable annuity or life insurance contracts or any additional expenses that participants in certain eligible qualified plans may bear relating to the operations of their plans. If these charges were included, the returns would be lower.
Inception dates of the Class A, Class B and Class E shares are: 5/2/94, 7/30/02 and 5/1/01, respectively.
This information represents past performance and is not indicative of future results. Investment return and principal value may fluctuate so that shares, upon redemption, may be worth more or less than the original cost.
PORTFOLIO COMPOSITION
as of December 31, 2008
Top Holdings
| | |
| | | % of Total
Net Assets |
Rollins, Inc. | | 1.3% |
Stifel Financial Corp. | | 1.2% |
Waste Connections, Inc. | | 1.1% |
ITC Holdings Corp. | | 1.1% |
UGI Corp. | | 1.1% |
John Wiley & Sons, Inc. | | 1.0% |
Signature Bank | | 0.9% |
Standard Parking Corp. | | 0.8% |
IBERIABANK Corp. | | 0.8% |
ICF International, Inc. | | 0.8% |
Top Sectors
| | |
| | | % of Total
Market Value |
Financials | | 20.1% |
Industrials | | 18.2% |
Information Technology | | 17.3% |
Health Care | | 15.0% |
Consumer Discretionary | | 10.1% |
Utilities | | 4.7% |
Energy | | 4.5% |
Consumer Staples | | 4.1% |
Materials | | 2.1% |
Telecommunication Services | | 0.9% |
MSF-3
Metropolitan Series Fund, Inc.
Shareholder Expense Example
As a shareholder of the Portfolio, you incur ongoing costs, including management fees; distribution and service (12b-1) fees; and other Portfolio expenses. This example is intended to help you understand your ongoing costs (in dollars) (referred to as “expenses”) of investing in the Portfolio and compare these costs with the ongoing costs of investing in other mutual funds. The example is based on an investment of $1,000 invested at the beginning of the period and held for the entire period, July 1, 2008 through December 31, 2008.
Actual Expenses
The first line for each share class of the Portfolio in the table below provides information about actual account values and actual expenses. You may use the information in this line, together with the amount you invested in the particular share class of the Portfolio, to estimate the expenses that you paid over the period. Simply divide your account value by $1,000 (for example, an $8,600 account value divided by $1,000=8.6), then multiply the result by the number in the first line under the heading entitled “Expenses Paid During Period” to estimate the expenses you paid on your account during this period.
Hypothetical Example for Comparison Purposes
The second line for each share class of the Portfolio in the table below provides information about hypothetical account values and hypothetical expenses based on the Portfolio’s actual expense ratio and an assumed rate of return of 5% per year before expenses, which is not the Portfolio’s actual return. The hypothetical account values and expenses may not be used to estimate the actual ending account balance or expenses you paid for the period. You may use this information to compare the ongoing costs of investing in the Portfolio and other funds. To do so, compare this 5% hypothetical example with the 5% hypothetical examples that appear in the shareholder reports of the other funds.
Please note that the expenses shown in the table are meant to highlight your ongoing costs only and do not reflect any fees or charges of your variable insurance product or any additional expenses that participants in certain eligible qualified plans may bear relating to the operations of their plan. Therefore, the second line for each share class in the table is useful in comparing ongoing costs only, and will not help you determine the relative total costs of owning different funds. In addition, if these other costs were included, your costs would have been higher.
| | | | | | | | | | | | | | |
Portfolio | | | | Annualized
Expense
Ratio | | | Beginning
Account Value
July 1,
2008 | | Ending
Account Value
December 31,
2008 | | Expenses Paid
During Period*
July 1, 2008
to
December 31,
2008 |
Loomis Sayles Small Cap—Class A(a) | | Actual | | 0.90 | % | | $ | 1,000.00 | | $ | 725.87 | | $ | 3.90 |
| | Hypothetical | | 0.90 | % | | $ | 1,000.00 | | $ | 1,020.56 | | $ | 4.57 |
| | | | | |
Loomis Sayles Small Cap—Class B(a) | | Actual | | 1.15 | % | | $ | 1,000.00 | | $ | 724.95 | | $ | 4.99 |
| | Hypothetical | | 1.15 | % | | $ | 1,000.00 | | $ | 1,019.29 | | $ | 5.84 |
| | | | | |
Loomis Sayles Small Cap—Class E(a) | | Actual | | 1.05 | % | | $ | 1,000.00 | | $ | 725.32 | | $ | 4.55 |
| | Hypothetical | | 1.05 | % | | $ | 1,000.00 | | $ | 1,019.79 | | $ | 5.33 |
* Expenses paid are equal to the Portfolio’s annualized expense ratio for the most recent six month period, as shown above, multiplied by the average account value over the period, multiplied by the number of days in the most recent fiscal half-year, divided by 366 (to reflect the one-half year period).
(a) The annualized expense ratio shown reflects the impact of the management fee waiver as described in Note 4 to the Financial Statements.
MSF-4
Metropolitan Series Fund, Inc.
Loomis Sayles Small Cap Portfolio
Schedule of Investments as of December 31, 2008
Common Stock—96.8% of Total Net Assets
| | | | | |
| Security Description | | Shares | | Value* |
| | | | | |
| | |
Aerospace & Defense—2.9% | | | | | |
AeroVironment, Inc. (a) (b) | | 35,030 | | $ | 1,289,454 |
Curtiss-Wright Corp. (a) | | 39,482 | | | 1,318,304 |
Ducommun, Inc. | | 38,560 | | | 643,952 |
Moog, Inc. (a) (b) | | 58,519 | | | 2,140,040 |
Orbital Sciences Corp. (a) (b) | | 79,529 | | | 1,553,202 |
Teledyne Technologies, Inc. (b) | | 42,615 | | | 1,898,498 |
| | | | | |
| | | | | 8,843,450 |
| | | | | |
| | |
Air Freight & Logistics—0.7% | | | | | |
Atlas Air Worldwide Holdings, Inc. (b) | | 52,001 | | | 982,819 |
HUB Group, Inc. (Class A) (b) | | 38,345 | | | 1,017,293 |
| | | | | |
| | | | | 2,000,112 |
| | | | | |
| | |
Auto Components—0.3% | | | | | |
Gentex Corp. (a) | | 90,074 | | | 795,353 |
| | | | | |
| | |
Beverages—0.3% | | | | | |
Heckmann Corp. (a) (b) | | 148,876 | | | 841,149 |
| | | | | |
| | |
Biotechnology—2.4% | | | | | |
Alexion Pharmaceuticals, Inc. (a) (b) | | 25,024 | | | 905,618 |
BioMarin Pharmaceutical, Inc. (a) (b) | | 48,742 | | | 867,608 |
Cubist Pharmaceuticals, Inc. (a) (b) | | 35,198 | | | 850,384 |
Genomic Health, Inc. (b) | | 44,264 | | | 862,263 |
Isis Pharmaceuticals, Inc. (a) (b) | | 67,026 | | | 950,429 |
Onyx Pharmaceuticals, Inc. (a) (b) | | 29,046 | | | 992,211 |
Osiris Therapeutics, Inc. (a) (b) | | 41,346 | | | 792,189 |
Regeneron Pharmaceuticals, Inc. (b) | | 49,412 | | | 907,204 |
| | | | | |
| | | | | 7,127,906 |
| | | | | |
| | |
Building Products—0.3% | | | | | |
Armstrong World Industries, Inc. (a) (b) | | 48,918 | | | 1,057,607 |
| | | | | |
| | |
Capital Markets—2.6% | | | | | |
Greenhill & Co., Inc. | | 17,062 | | | 1,190,416 |
Investment Technology Group, Inc. (b) | | 36,149 | | | 821,305 |
JMP Group, Inc. | | 37,846 | | | 210,046 |
KBW, Inc. (b) | | 46,050 | | | 1,059,150 |
RiskMetrics Group, Inc. (a) (b) | | 60,152 | | | 895,663 |
Stifel Financial Corp. (b) | | 78,272 | | | 3,588,771 |
| | | | | |
| | | | | 7,765,351 |
| | | | | |
| | |
Chemicals—0.9% | | | | | |
Koppers Holdings, Inc. | | 21,106 | | | 456,312 |
LSB Industries, Inc. (a) (b) | | 46,551 | | | 387,304 |
Minerals Technologies, Inc. | | 9,430 | | | 385,687 |
Solutia, Inc. (a) (b) | | 67,433 | | | 303,449 |
Zep, Inc. | | 66,427 | | | 1,282,705 |
| | | | | |
| | | | | 2,815,457 |
| | | | | |
| | |
Commercial & Professional Services—6.6% | | | | | |
ABM Industries, Inc. | | 90,348 | | | 1,721,130 |
American Ecology Corp. (a) | | 46,228 | | | 935,193 |
Clean Harbors, Inc. (b) | | 23,086 | | | 1,464,576 |
McGrath Rentcorp | | 57,403 | | | 1,226,128 |
| | | | | |
| Security Description | | Shares | | Value* |
| | | | | |
| |
Commercial & Professional Services—(Continued) | | | |
Rollins, Inc. (a) | | 212,965 | | $ | 3,850,407 |
Standard Parking Corp. (a) (b) | | 128,009 | | | 2,475,694 |
Sykes Enterprises, Inc. (b) | | 47,807 | | | 914,070 |
Team, Inc. (a) (b) | | 56,832 | | | 1,574,246 |
The Brink’s Co. | | 34,639 | | | 931,096 |
The GEO Group, Inc. (a) (b) | | 81,239 | | | 1,464,739 |
Waste Connections, Inc. (b) | | 105,932 | | | 3,344,273 |
| | | | | |
| | | | | 19,901,552 |
| | | | | |
| | |
Commercial Banks—6.7% | | | | | |
Bank of the Ozarks, Inc. (a) | | 67,662 | | | 2,005,502 |
Comerica, Inc. | | 45,024 | | | 893,726 |
CVB Financial Corp. (a) | | 90,793 | | | 1,080,437 |
First Horizon National Corp. (b) | | 68,685 | | | 726,000 |
Glacier Bancorp, Inc. | | 50,857 | | | 967,300 |
Hancock Holding Co. | | 36,119 | | | 1,641,970 |
IBERIABANK Corp. (a) | | 50,771 | | | 2,437,008 |
Old National Bancorp (a) | | 42,228 | | | 766,861 |
Pennsylvania Commerce Bancorp, Inc. (a) (b) | | 32,794 | | | 874,288 |
PrivateBancorp, Inc. (a) | | 34,722 | | | 1,127,076 |
Prosperity Bancshares, Inc. | | 67,483 | | | 1,996,822 |
Signature Bank (b) | | 98,302 | | | 2,820,284 |
Sterling Bancshares, Inc. | | 202,833 | | | 1,233,225 |
SVB Financial Group (b) | | 30,999 | | | 813,104 |
Texas Capital Bancshares, Inc. (b) | | 55,326 | | | 739,155 |
| | | | | |
| | | | | 20,122,758 |
| | | | | |
| | |
Communications Equipment—3.2% | | | | | |
ADC Telecommunications, Inc. (a) (b) | | 95,956 | | | 524,879 |
Adtran, Inc. | | 61,214 | | | 910,864 |
Anaren, Inc. (b) | | 38,072 | | | 454,960 |
Brocade Communications Systems, Inc. (b) | | 269,881 | | | 755,667 |
CommScope, Inc. (a) (b) | | 54,596 | | | 848,422 |
DG FastChannel, Inc. (a) (b) | | 101,954 | | | 1,272,386 |
F5 Networks, Inc. (a) (b) | | 43,382 | | | 991,713 |
Neutral Tandem, Inc. (b) | | 76,854 | | | 1,246,572 |
Riverbed Technology, Inc. (a) (b) | | 102,057 | | | 1,162,429 |
Tekelec, Inc. (a) (b) | | 104,312 | | | 1,391,522 |
| | | | | |
| | | | | 9,559,414 |
| | | | | |
| | |
Computers & Peripherals—0.7% | | | | | |
Intevac, Inc. (a) (b) | | 68,362 | | | 346,595 |
NCR Corp. (b) | | 50,720 | | | 717,181 |
Teradata Corp. (b) | | 64,538 | | | 957,099 |
| | | | | |
| | | | | 2,020,875 |
| | | | | |
| | |
Construction & Engineering—1.6% | | | | | |
Granite Construction, Inc. (a) | | 14,751 | | | 648,011 |
MasTec, Inc. (b) | | 141,139 | | | 1,634,390 |
MYR Group, Inc. (b) | | 75,129 | | | 751,290 |
Northwest Pipe Co. (a) (b) | | 39,828 | | | 1,697,071 |
| | | | | |
| | | | | 4,730,762 |
| | | | | |
| | |
Construction Materials—0.1% | | | | | |
Eagle Materials, Inc. (a) | | 21,119 | | | 388,801 |
| | | | | |
*See accompanying notes to financial statements.
MSF-5
Metropolitan Series Fund, Inc.
Loomis Sayles Small Cap Portfolio
Schedule of Investments as of December 31, 2008
Common Stock—(Continued)
| | | | | |
| Security Description | | Shares | | Value* |
| | | | | |
| | |
Consumer Finance—0.5% | | | | | |
Dollar Financial Corp. (b) | | 102,065 | | $ | 1,051,270 |
World Acceptance Corp. (a) (b) | | 24,557 | | | 485,246 |
| | | | | |
| | | | | 1,536,516 |
| | | | | |
| | |
Containers & Packaging—0.6% | | | | | |
Myers Industries, Inc. | | 70,775 | | | 566,200 |
Rock-Tenn Co. | | 40,699 | | | 1,391,092 |
| | | | | |
| | | | | 1,957,292 |
| | | | | |
| | |
Distributors—0.1% | | | | | |
Core-Mark Holding Co., Inc. (b) | | 15,580 | | | 335,282 |
| | | | | |
| | |
Diversified Consumer Services—2.0% | | | | | |
American Public Education, Inc. (a) (b) | | 33,111 | | | 1,231,398 |
Capella Education Co. (a) (b) | | 19,048 | | | 1,119,261 |
DeVry, Inc. | | 23,269 | | | 1,335,873 |
Grand Canyon Education, Inc. (a) (b) | | 54,439 | | | 1,022,365 |
Hillenbrand, Inc. | | 74,705 | | | 1,246,079 |
| | | | | |
| | | | | 5,954,976 |
| | | | | |
| | |
Diversified Financial Services—0.6% | | | | | |
PHH Corp. (b) | | 134,405 | | | 1,710,976 |
| | | | | |
|
Diversified Telecommunication Services—0.9% |
Cbeyond, Inc. (a) (b) | | 78,389 | | | 1,252,656 |
NTELOS Holdings Corp. | | 63,754 | | | 1,572,174 |
| | | | | |
| | | | | 2,824,830 |
| | | | | |
| | |
Electric Utilities—2.3% | | | | | |
Allete, Inc. (a) | | 51,623 | | | 1,665,874 |
ITC Holdings Corp. | | 75,623 | | | 3,303,213 |
Portland General Electric Co. | | 95,141 | | | 1,852,395 |
| | | | | |
| | | | | 6,821,482 |
| | | | | |
| | |
Electrical Equipment—0.5% | | | | | |
Energy Conversion Devices, Inc. (a) (b) | | 31,799 | | | 801,653 |
II-VI, Inc. (a) (b) | | 18,686 | | | 356,716 |
LaBarge, Inc. (b) | | 17,435 | | | 250,192 |
Polypore International, Inc. (b) | | 30,514 | | | 230,686 |
| | | | | |
| | | | | 1,639,247 |
| | | | | |
|
Electronic Equipment, Instruments & Components—1.6% |
Amphenol Corp. (Class A) (a) | | 30,236 | | | 725,059 |
Daktronics, Inc. (a) | | 51,071 | | | 478,024 |
IPG Photonics Corp. (a) (b) | | 106,787 | | | 1,407,453 |
Littelfuse, Inc. (b) | | 70,658 | | | 1,172,923 |
Scansource, Inc. (a) (b) | | 36,388 | | | 701,197 |
Vishay Intertechnology, Inc. (b) | | 113,434 | | | 387,944 |
| | | | | |
| | | | | 4,872,600 |
| | | | | |
| | |
Energy Equipment & Services—2.0% | | | | | |
Dresser-Rand Group, Inc. (b) | | 39,435 | | | 680,254 |
Hornbeck Offshore Services, Inc. (a) (b) | | 89,631 | | | 1,464,571 |
IHS, Inc. (b) | | 34,732 | | | 1,299,671 |
| | | | | |
| Security Description | | Shares | | Value* |
| | | | | |
| | |
Energy Equipment & Services—(Continued) | | | | | |
Newpark Resources, Inc. (b) | | 4,910 | | $ | 18,167 |
Oceaneering International, Inc. (b) | | 61,086 | | | 1,780,046 |
Tesco Corp. (b) | | 134,387 | | | 959,523 |
| | | | | |
| | | | | 6,202,232 |
| | | | | |
| | |
Food & Staples Retailing—0.5% | | | | | |
Spartan Stores, Inc. (a) | | 68,791 | | | 1,599,391 |
| | | | | |
| | |
Food Products—2.1% | | | | | |
Flowers Foods, Inc. (a) | | 41,897 | | | 1,020,611 |
Green Mountain Coffee Roasters, Inc. (a) (b) | | 36,780 | | | 1,423,386 |
J&J Snack Foods Corp. | | 44,615 | | | 1,600,786 |
Ralcorp Holdings, Inc. (b) | | 24,321 | | | 1,420,346 |
The J. M. Smucker Co. | | 21,864 | | | 948,023 |
| | | | | |
| | | | | 6,413,152 |
| | | | | |
| | |
Gas Utilities—1.4% | | | | | |
ONEOK, Inc. | | 30,466 | | | 887,170 |
UGI Corp. | | 134,216 | | | 3,277,555 |
| | | | | |
| | | | | 4,164,725 |
| | | | | |
| | |
Health Care Equipment & Supplies—3.4% | | | | | |
Hill-Rom Holdings, Inc. (a) | | 42,302 | | | 696,291 |
Masimo Corp. (b) | | 33,636 | | | 1,003,362 |
Medical Action Industries, Inc. (b) | | 58,977 | | | 589,770 |
Merit Medical Systems, Inc. (a) (b) | | 66,856 | | | 1,198,728 |
Natus Medical, Inc. (b) | | 90,112 | | | 1,166,950 |
NuVasive, Inc. (a) (b) | | 27,044 | | | 937,075 |
SonoSite, Inc. (b) | | 59,065 | | | 1,126,960 |
Teleflex, Inc. | | 35,032 | | | 1,755,103 |
West Pharmaceutical Services, Inc. (a) | | 49,456 | | | 1,867,953 |
| | | | | |
| | | | | 10,342,192 |
| | | | | |
| | |
Health Care Providers & Services—4.8% | | | | | |
Amedisys, Inc. (a) (b) | | 22,673 | | | 937,302 |
BIO-Reference Labs, Inc. (b) | | 37,960 | | | 995,691 |
CardioNet, Inc. (b) | | 72,947 | | | 1,798,143 |
Catalyst Health Solutions, Inc. (b) | | 75,730 | | | 1,844,025 |
Corvel Corp. (b) | | 30,831 | | | 677,665 |
Gentiva Health Services, Inc. (b) | | 62,675 | | | 1,833,870 |
Healthspring, Inc. (b) | | 51,675 | | | 1,031,950 |
Mednax, Inc. (b) | | 23,892 | | | 757,376 |
MWI Veterinary Supply, Inc. (a) (b) | | 54,236 | | | 1,462,203 |
Psychiatric Solutions, Inc. (a) (b) | | 38,436 | | | 1,070,443 |
Skilled Healthcare Group, Inc. (a) (b) | | 98,609 | | | 832,260 |
Sun Healthcare Group, Inc. (b) | | 134,983 | | | 1,194,600 |
| | | | | |
| | | | | 14,435,528 |
| | | | | |
| | |
Health Care Technology—0.8% | | | | | |
MedAssets, Inc. (a) (b) | | 80,926 | | | 1,181,519 |
Phase Forward, Inc. (b) | | 107,515 | | | 1,346,088 |
| | | | | |
| | | | | 2,527,607 |
| | | | | |
*See accompanying notes to financial statements.
MSF-6
Metropolitan Series Fund, Inc.
Loomis Sayles Small Cap Portfolio
Schedule of Investments as of December 31, 2008
Common Stock—(Continued)
| | | | | |
| Security Description | | Shares | | Value* |
| | | | | |
| | |
Hotels, Restaurants & Leisure—1.1% | | | | | |
Bob Evans Farms, Inc. (a) | | 40,001 | | $ | 817,220 |
Buffalo Wild Wings, Inc. (a) (b) | | 34,615 | | | 887,875 |
Dover Downs Gaming & Entertainment, Inc. (a) | | 72,962 | | | 232,019 |
Morgans Hotel Group Co. (a) (b) | | 116,006 | | | 540,588 |
Penn National Gaming, Inc. (a) (b) | | 43,757 | | | 935,525 |
| | | | | |
| | | | | 3,413,227 |
| | | | | |
| | |
Household Products—0.5% | | | | | |
Church & Dwight Co., Inc. (a) | | 25,343 | | | 1,422,249 |
| | | | | |
| | |
Insurance—6.2% | | | | | |
American Physicians Capital, Inc. | | 24,847 | | | 1,195,141 |
Amtrust Financial Services, Inc. | | 86,138 | | | 999,201 |
Arch Capital Group, Ltd. (b) | | 13,420 | | | 940,742 |
Aspen Insurance Holdings, Ltd. | | 41,922 | | | 1,016,608 |
Employers Holdings, Inc. | | 33,211 | | | 547,981 |
Fidelity National Financial, Inc. | | 48,392 | | | 858,958 |
HCC Insurance Holdings, Inc. | | 67,565 | | | 1,807,364 |
Markel Corp. (b) | | 2,750 | | | 822,250 |
Navigators Group, Inc. (b) | | 28,044 | | | 1,539,896 |
PartnerRe, Ltd. | | 17,081 | | | 1,217,363 |
ProAssurance Corp. (b) | | 17,188 | | | 907,183 |
Protective Life Corp. | | 65,338 | | | 937,600 |
Reinsurance Group of America Inc | | 24,843 | | | 1,063,777 |
RLI Corp. (a) | | 35,120 | | | 2,147,939 |
The Hanover Insurance Group, Inc. | | 29,940 | | | 1,286,522 |
W.R. Berkley Corp. | | 26,338 | | | 816,478 |
Zenith National Insurance Corp. | | 22,940 | | | 724,216 |
| | | | | |
| | | | | 18,829,219 |
| | | | | |
| | |
Internet & Catalog Retail—0.4% | | | | | |
HSN, Inc. (a) (b) | | 160,981 | | | 1,170,332 |
| | | | | |
| | |
Internet Software & Services—1.9% | | | | | |
Ariba, Inc. (b) | | 191,590 | | | 1,381,364 |
Constant Contact, Inc. (a) (b) | | 92,806 | | | 1,229,680 |
SkillSoft, Plc. (ADR) (a) (b) | | 184,937 | | | 1,320,450 |
United Online, Inc. | | 120,232 | | | 729,808 |
Vocus, Inc. (b) | | 60,158 | | | 1,095,477 |
| | | | | |
| | | | | 5,756,779 |
| | | | | |
| | |
IT Services—3.0% | | | | | |
Alliance Data Systems Corp. (b) | | 27,743 | | | 1,290,882 |
Broadridge Financial Solutions, Inc. | | 150,072 | | | 1,881,903 |
Cybersource Corp. (b) | | 79,131 | | | 948,780 |
Lender Processing Services, Inc. | | 55,702 | | | 1,640,424 |
Perot Systems Corp. (b) | | 95,600 | | | 1,306,852 |
Syntel, Inc. (a) | | 52,509 | | | 1,214,008 |
Wright Express Corp. (b) | | 70,783 | | | 891,866 |
| | | | | |
| | | | | 9,174,715 |
| | | | | |
| | |
Leisure Equipment & Products—0.2% | | | | | |
Steinway Musical Instruments, Inc. (a) (b) | | 41,469 | | | 726,122 |
| | | | | |
| | | | | |
| Security Description | | Shares | | Value* |
| | | | | |
| | |
Life Sciences Tools & Services—0.8% | | | | | |
Icon, Plc. (ADR) (b) | | 46,650 | | $ | 918,538 |
Luminex Corp. (a) (b) | | 38,726 | | | 827,187 |
PerkinElmer, Inc. | | 49,950 | | | 694,805 |
| | | | | |
| | | | | 2,440,530 |
| | | | | |
| | |
Machinery—2.7% | | | | | |
Actuant Corp. (a) | | 48,240 | | | 917,525 |
Altra Holdings, Inc. (b) | | 77,566 | | | 613,547 |
Badger Meter, Inc. (a) | | 12,106 | | | 351,316 |
CLARCOR, Inc. | | 18,300 | | | 607,194 |
Energy Recovery, Inc. (a) (b) | | 118,525 | | | 898,419 |
ESCO Technologies, Inc. (b) | | 25,946 | | | 1,062,489 |
FreightCar America, Inc. (a) | | 45,719 | | | 835,286 |
John Bean Technologies Corp. (a) (b) | | 106,418 | | | 869,435 |
Valmont Industries, Inc. (a) | | 20,152 | | | 1,236,527 |
Wabtec Corp. | | 16,040 | | | 637,590 |
| | | | | |
| | | | | 8,029,328 |
| | | | | |
| | |
Media—1.8% | | | | | |
Alloy, Inc. (b) | | 64,685 | | | 273,618 |
Interactive Data Corp. | | 88,391 | | | 2,179,722 |
John Wiley & Sons, Inc. | | 84,721 | | | 3,014,373 |
| | | | | |
| | | | | 5,467,713 |
| | | | | |
| | |
Metals & Mining—0.3% | | | | | |
Reliance Steel & Aluminum Co. (a) | | 40,325 | | | 804,080 |
| | | | | |
| | |
Multi-Utilities—0.4% | | | | | |
NorthWestern Corp. (a) | | 48,516 | | | 1,138,670 |
| | | | | |
| | |
Multiline Retail—0.6% | | | | | |
Dollar Tree, Inc. (a) (b) | | 41,394 | | | 1,730,269 |
| | | | | |
| | |
Oil, Gas & Consumable Fuels—2.4% | | | | | |
Arena Resources, Inc. (a) (b) | | 39,998 | | | 1,123,544 |
Comstock Resources, Inc. (b) | | 29,320 | | | 1,385,370 |
Concho Resources, Inc. (b) | | 52,538 | | | 1,198,917 |
Goodrich Petroleum Corp. (a) (b) | | 37,533 | | | 1,124,114 |
Mariner Energy, Inc. (b) | | 76,960 | | | 784,992 |
Penn Virginia Corp. | | 49,297 | | | 1,280,736 |
St. Mary Land & Exploration Co. (a) | | 25,633 | | | 520,606 |
| | | | | |
| | | | | 7,418,279 |
| | | | | |
| | |
Paper & Forest Products—0.1% | | | | | |
Clearwater Paper Corp. (b) | | 38,130 | | | 319,911 |
| | | | | |
| | |
Personal Products—0.6% | | | | | |
Alberto-Culver Co. | | 80,480 | | | 1,972,565 |
| | | | | |
| | |
Pharmaceuticals—2.8% | | | | | |
Auxilium Pharmaceuticals, Inc. (a) (b) | | 35,514 | | | 1,010,018 |
Endo Pharmaceuticals Holdings, Inc. (b) | | 71,522 | | | 1,850,989 |
Eurand NV (a) (b) | | 95,423 | | | 821,592 |
Obagi Medical Products, Inc. (b) | | 97,014 | | | 723,725 |
Perrigo Co. (a) | | 66,167 | | | 2,137,856 |
*See accompanying notes to financial statements.
MSF-7
Metropolitan Series Fund, Inc.
Loomis Sayles Small Cap Portfolio
Schedule of Investments as of December 31, 2008
Common Stock—(Continued)
| | | | | |
| Security Description | | Shares | | Value* |
| | | | | |
| | |
Pharmaceuticals—(Continued) | | | | | |
Questcor Pharmaceuticals, Inc. (a) (b) | | 72,986 | | $ | 679,500 |
ViroPharma, Inc. (b) | | 94,160 | | | 1,225,963 |
| | | | | |
| | | | | 8,449,643 |
| | | | | |
| | |
Professional Services—2.2% | | | | | |
Duff & Phelps Corp. (b) | | 29,188 | | | 558,075 |
FTI Consulting, Inc. (a) (b) | | 21,121 | | | 943,686 |
Hill International, Inc. (a) (b) | | 195,752 | | | 1,378,094 |
Huron Consulting Group, Inc. (a) (b) | | 24,143 | | | 1,382,670 |
ICF International, Inc. (a) (b) | | 93,734 | | | 2,303,044 |
| | | | | |
| | | | | 6,565,569 |
| | | | | |
| | |
Real Estate Investment Trusts—2.5% | | | | | |
American Campus Communities, Inc. (a) | | 52,706 | | | 1,079,419 |
Capstead Mortgage Corp. | | 143,979 | | | 1,550,654 |
Digital Realty Trust, Inc. (a) | | 38,849 | | | 1,276,190 |
Health Care REIT, Inc. | | 47,658 | | | 2,011,167 |
Potlatch Corp. | | 61,497 | | | 1,599,537 |
| | | | | |
| | | | | 7,516,967 |
| | | | | |
| |
Real Estate Management & Development—0.3% | | | |
Forestar Group, Inc. (a) (b) | | 97,223 | | | 925,563 |
| | | | | |
| | |
Road & Rail—0.7% | | | | | |
Genesee & Wyoming, Inc. (a) (b) | | 36,553 | | | 1,114,867 |
Ryder System, Inc. | | 25,240 | | | 978,807 |
| | | | | |
| | | | | 2,093,674 |
| | | | | |
| |
Semiconductors & Semiconductor Equipment—3.1% | | | |
Cavium Networks, Inc. (a) (b) | | 90,773 | | | 954,024 |
Cohu, Inc. (a) | | 50,336 | | | 611,582 |
Lam Research Corp. (a) (b) | | 47,996 | | | 1,021,355 |
NetLogic Microsystems, Inc. (a) (b) | | 55,874 | | | 1,229,787 |
ON Semiconductor Corp. (a) (b) | | 140,241 | | | 476,819 |
Power Integrations, Inc. (a) | | 42,178 | | | 838,499 |
Semtech Corp. (b) | | 42,832 | | | 482,717 |
Silicon Laboratories, Inc. (a) (b) | | 42,870 | | | 1,062,318 |
TriQuint Semiconductor, Inc. (b) | | 175,111 | | | 602,382 |
Varian Semiconductor Equipment Associates, Inc. (a) (b) | | 56,766 | | | 1,028,600 |
Verigy, Ltd. (b) | | 111,274 | | | 1,070,456 |
| | | | | |
| | | | | 9,378,539 |
| | | | | |
| | |
Software—3.8% | | | | | |
Blackboard, Inc. (a) (b) | | 54,716 | | | 1,435,201 |
Concur Technologies, Inc. (a) (b) | | 29,843 | | | 979,447 |
Informatica Corp. (a) (b) | | 143,349 | | | 1,968,182 |
Mentor Graphics Corp. (a) (b) | | 111,416 | | | 576,021 |
NetScout Systems, Inc. (b) | | 76,732 | | | 661,430 |
Progress Software Corp. (b) | | 61,111 | | | 1,176,998 |
Quest Software, Inc. (b) | | 68,740 | | | 865,436 |
Solera Holdings, Inc. (a) (b) | | 62,795 | | | 1,513,359 |
Sybase, Inc. (a) (b) | | 38,401 | | | 951,193 |
Tyler Technologies, Inc. (a) (b) | | 102,157 | | | 1,223,841 |
| | | | | |
| | | | | 11,351,108 |
| | | | | |
| | | | | | | |
| Security Description | | Shares | | Value* | |
| | | | | | | |
| | |
Specialty Retail—2.1% | | | | | | | |
Genesco, Inc. (b) | | | 37,039 | | $ | 626,700 | |
Gymboree Corp. (b) | | | 39,281 | | | 1,024,841 | |
Hibbett Sports, Inc. (a) (b) | | | 58,961 | | | 926,277 | |
Jo-Ann Stores, Inc. (a) (b) | | | 45,464 | | | 704,237 | |
RadioShack Corp. (a) | | | 66,918 | | | 799,001 | |
Sally Beauty Holdings, Inc. (a) (b) | | | 261,746 | | | 1,489,335 | |
Ulta Salon Cosmetics & Fragrance,
Inc. (a) (b) | | | 105,178 | | | 870,874 | |
| | | | | | | |
| | | | | | 6,441,265 | |
| | | | | | | |
|
Textiles, Apparel & Luxury Goods—1.5% | |
Carter’s, Inc. (a) (b) | | | 85,457 | | | 1,645,902 | |
FGX International Holdings, Ltd. (b) | | | 64,154 | | | 881,476 | |
Fossil, Inc. (a) (b) | | | 45,160 | | | 754,172 | |
Hanesbrands, Inc. (a) (b) | | | 39,236 | | | 500,259 | |
True Religion Apparel, Inc. (a) (b) | | | 57,057 | | | 709,789 | |
| | | | | | | |
| | | | | | 4,491,598 | |
| | | | | | | |
| | |
Thrifts & Mortgage Finance—0.7% | | | | | | | |
Beneficial Mutual Bancorp, Inc. (a) (b) | | | 108,826 | | | 1,224,292 | |
Westfield Financial, Inc. | | | 89,755 | | | 926,272 | |
| | | | | | | |
| | | | | | 2,150,564 | |
| | | | | | | |
| | |
Water Utilities—0.7% | | | | | | | |
American State Water Co. (a) | | | 30,450 | | | 1,004,241 | |
Middlesex Water Co. (a) | | | 61,079 | | | 1,052,391 | |
| | | | | | | |
| | | | | | 2,056,632 | |
| | | | | | | |
Total Common Stock
(Identified Cost $341,448,321) | | | | | | 292,543,685 | |
| | | | | | | |
|
| Short Term Investments—18.6% | |
| Security Description | | Shares/Face
Amount | | Value* | |
| | |
Mutual Funds—15.5% | | | | | | | |
State Street Navigator Securities Lending Prime Portfolio (c) | | | 46,795,421 | | | 46,795,421 | |
| | | | | | | |
| | |
Repurchase Agreement—3.1% | | | | | | | |
State Street Repurchase Agreement dated 12/31/08 at 0.010% to be repurchased at $9,335,005 on 01/02/09, collateralized by $9,530,000 Federal National Mortgage Association due 01/23/09 with a value of $9,525,235. | | $ | 9,335,000 | | | 9,335,000 | |
| | | | | | | |
Total Short Term Investments
(Identified Cost $56,130,421) | | | | | | 56,130,421 | |
| | | | | | | |
Total Investments—115.4%
(Identified Cost $397,578,742) (d) | | | | | | 348,674,106 | |
Liabilities in excess of other assets | | | | | | (46,550,063 | ) |
| | | | | | | |
| Total Net Assets—100% | | | | | $ | 302,124,043 | |
| | | | | | | |
*See accompanying notes to financial statements.
MSF-8
Metropolitan Series Fund, Inc.
Loomis Sayles Small Cap Portfolio
Schedule of Investments as of December 31, 2008
| (a) | A portion or all of the security was on loan. As of December 31, 2008, the market value of securities loaned was $46,730,692 and the collateral received consisted of cash in the amount of $46,795,421. The cash collateral is invested in a money market fund managed by an affiliate of the custodian. |
| (c) | Represents investment of cash collateral received from securities lending transactions. |
| (d) | The aggregate cost of investments for federal income tax purposes as of December 31, 2008 was $398,984,087 and the composition of unrealized appreciation and depreciation of investment securities was $17,659,123 and $(67,969,104), respectively. |
| (ADR)— | An American Depositary Receipt is a certificate issued by a custodian bank representing the right to receive securities of the foreign issuer described. Trading on exchanges not located in the United States or Canada significantly influences the value of ADRs. |
The Portfolio adopted the provisions of Statement of Financial Accounting Standards No. 157, “Fair Value Measurements” (FAS 157), effective with the beginning of the Portfolio’s fiscal year. FAS 157 establishes a framework for measuring fair value and expands disclosures about fair value measurements in financial statements. The three levels of the hierarchy under FAS 157 are described below:
Level 1 - quoted prices in active markets for identical securities
Level 2 - other significant observable inputs (including quoted prices for similar securities, interest rates, credit risk, etc.)
Level 3 - significant unobservable inputs (including the Portfolio’s own assumptions in determining the fair value of investments)
The inputs or methodology used for valuing securities are not necessarily an indication of the risk associated with investing in those securities.
The following is a summary of the inputs used to value the Portfolio’s net assets as of December 31, 2008:
| | | | | | |
| Valuation Inputs | | Investments In
Securities | | Other Financial
Instruments* |
Level 1 - Quoted Prices | | $ | 339,339,106 | | $ | 0 |
Level 2 - Other Significant Observable Inputs | | | 9,335,000 | | | 0 |
Level 3 - Significant Unobservable Inputs | | | 0 | | | 0 |
Total | | $ | 348,674,106 | | $ | 0 |
* Other financial instruments are derivative instruments not reflected in the Schedule of Investments, such as futures, forwards, swap contracts and written options, which are valued based on the unrealized appreciation/depreciation on the instrument.
*See accompanying notes to financial statements.
MSF-9
Metropolitan Series Fund, Inc.
Loomis Sayles Small Cap Portfolio
Statement of Assets & Liabilities
December 31, 2008
| | | | | | | |
Assets | | | | | | | |
Investments at value (a) (b) | | | | | $ | 348,674,106 | |
Cash | | | | | | 695 | |
Receivable for: | | | | | | | |
Securities sold | | | | | | 1,307,953 | |
Fund shares sold | | | | | | 497,201 | |
Accrued interest and dividends | | | | | | 251,585 | |
| | | | | | | |
Total Assets | | | | | | 350,731,540 | |
Liabilities | | | | | | | |
Payable for: | | | | | | | |
Securities purchased | | $ | 1,295,221 | | | | |
Fund shares redeemed | | | 245,114 | | | | |
Collateral for securities loaned | | | 46,795,421 | | | | |
Accrued expenses: | | | | | | | |
Management fees | | | 203,751 | | | | |
Service and distribution fees | | | 18,826 | | | | |
Deferred directors’ fees | | | 13,946 | | | | |
Other expenses | | | 35,218 | | | | |
| | | | | | | |
Total Liabilities | | | | | | 48,607,497 | |
| | | | | | | |
Net Assets | | | | | $ | 302,124,043 | |
| | | | | | | |
Net assets consists of: | | | | | | | |
Capital paid in | | | | | $ | 404,506,343 | |
Undistributed net investment income | | | | | | 586,918 | |
Accumulated net realized losses | | | | | | (54,064,582 | ) |
Unrealized depreciation on investments | | | | | | (48,904,636 | ) |
| | | | | | | |
Net Assets | | | | | $ | 302,124,043 | |
| | | | | | | |
| Computation of offering price: | | | | | | | |
Class A | | | | | | | |
Net asset value and redemption price per share ($192,119,613 divided by 1,425,304 shares outstanding) | | | | | $ | 134.79 | |
| | | | | | | |
Class B | | | | | | | |
Net asset value and redemption price per share ($74,957,051 divided by 567,721 shares outstanding) | | | | | $ | 132.03 | |
| | | | | | | |
Class E | | | | | | | |
Net asset value and redemption price per share ($35,047,379 divided by 263,529 shares outstanding) | | | | | $ | 132.99 | |
| | | | | | | |
(a) Identified cost of investments | | | | | $ | 397,578,742 | |
| | | | | | | |
(b) Includes cash collateral for securities loaned of | | | | | $ | 46,795,421 | |
| | | | | | | |
Statement of Operations
For the Year Ended December 31, 2008
| | | | | | | | |
Investment Income | | | | | | | | |
Dividends | | | | | | $ | 3,880,137 | |
Interest | | | | | | | 1,101,376 | (a) |
| | | | | | | | |
| | | | | | | 4,981,513 | |
Expenses | | | | | | | | |
Management fees | | $ | 3,730,751 | | | | | |
Service and distribution fees—Class B | | | 235,464 | | | | | |
Service and distribution fees—Class E | | | 73,909 | | | | | |
Directors’ fees and expenses | | | 24,099 | | | | | |
Custodian | | | 62,578 | | | | | |
Audit and tax services | | | 36,941 | | | | | |
Legal | | | 7,085 | | | | | |
Printing | | | 94,757 | | | | | |
Insurance | | | 6,000 | | | | | |
Miscellaneous | | | 12,629 | | | | | |
| | | | | | | | |
Total expenses | | | 4,284,213 | | | | | |
Expense reductions | | | (62,070 | ) | | | | |
Management fee waivers | | | (207,276 | ) | | | 4,014,867 | |
| | | | | | | | |
Net Investment Income | | | | | | | 966,646 | |
| | | | | | | | |
Realized and Unrealized Loss | | | | | | | | |
| Realized loss on: | | | | | | | | |
Investments—net | | | | | | | (54,329,681 | ) |
| Change in unrealized depreciation on: | | | | | | | | |
Investments—net | | | | | | | (124,183,050 | ) |
| | | | | | | | |
Net loss | | | | | | | (178,512,731 | ) |
| | | | | | | | |
Net Decrease in Net Assets From Operations | | | | | | $ | (177,546,085 | ) |
| | | | | | | | |
| (a) | Includes income on securities loaned of $980,430. |
See accompanying notes to financial statements.
MSF-10
Metropolitan Series Fund, Inc.
Loomis Sayles Small Cap Portfolio
Statements of Changes in Net Assets
| | | | | | | | |
| | | Year ended
December 31,
2008 | | | Year ended
December 31,
2007 | |
From Operations | | | | | | | | |
Net investment income (loss) | | $ | 966,646 | | | $ | (485,494 | ) |
Net realized gain (loss) | | | (54,329,681 | ) | | | 70,495,073 | |
Unrealized depreciation | | | (124,183,050 | ) | | | (12,514,559 | ) |
| | | | | | | | |
Increase (decrease) in net assets from operations | | | (177,546,085 | ) | | | 57,495,020 | |
| | | | | | | | |
From Distributions to Shareholders | | | | | | | | |
Net investment income | | | | | | | | |
Class A | | | 0 | | | | (315,188 | ) |
| | | | | | | | |
| | | 0 | | | | (315,188 | ) |
| | | | | | | | |
Net realized gain | | | | | | | | |
Class A | | | (45,487,804 | ) | | | (43,303,902 | ) |
Class B | | | (15,874,319 | ) | | | (9,064,930 | ) |
Class E | | | (8,378,460 | ) | | | (7,088,373 | ) |
| | | | | | | | |
| | | (69,740,583 | ) | | | (59,457,205 | ) |
| | | | | | | | |
Total distributions | | | (69,740,583 | ) | | | (59,772,393 | ) |
| | | | | | | | |
Increase in net assets from capital share transactions | | | 12,399,461 | | | | 40,143,772 | |
| | | | | | | | |
Net increase (decrease) in net assets | | | (234,887,207 | ) | | | 37,866,399 | |
| | |
Net Assets | | | | | | | | |
Beginning of the period | | | 537,011,250 | | | | 499,144,851 | |
| | | | | | | | |
End of the period | | $ | 302,124,043 | | | $ | 537,011,250 | |
| | | | | | | | |
Undistributed (Overdistributed) Net Investment Income (Loss) | | | | | | | | |
End of the period | | $ | 586,918 | | | $ | (28,803 | ) |
| | | | | | | | |
Other Information:
Capital Shares
Transactions in capital shares were as follows:
| | | | | | | | | | | | | | |
| | | Year ended
December 31, 2008 | | | Year ended
December 31, 2007 | |
| | | Shares | | | $ | | | Shares | | | $ | |
Class A | | | | | | | | | | | | | | |
Sales | | 216,694 | | | $ | 34,220,966 | | | 359,286 | | | $ | 91,646,470 | |
Reinvestments | | 239,120 | | | | 45,487,804 | | | 181,587 | | | | 43,619,090 | |
Redemptions | | (506,056 | ) | | | (90,931,412 | ) | | (556,927 | ) | | | (140,977,220 | ) |
| | | | | | | | | | | | | | |
Net decrease | | (50,242 | ) | | $ | (11,222,642 | ) | | (16,054 | ) | | $ | (5,711,660 | ) |
| | | | | | | | | | | | | | |
Class B | | | | | | | | | | | | | | |
Sales | | 148,629 | | | $ | 26,654,280 | | | 211,111 | | | $ | 52,345,787 | |
Reinvestments | | 85,044 | | | | 15,874,319 | | | 38,255 | | | | 9,064,930 | |
Redemptions | | (109,345 | ) | | | (19,841,634 | ) | | (79,387 | ) | | | (19,520,838 | ) |
| | | | | | | | | | | | | | |
Net increase | | 124,328 | | | $ | 22,686,965 | | | 169,979 | | | $ | 41,889,879 | |
| | | | | | | | | | | | | | |
Class E | | | | | | | | | | | | | | |
Sales | | 33,364 | | | $ | 5,972,538 | | | 58,013 | | | $ | 14,543,308 | |
Reinvestments | | 44,592 | | | | 8,378,460 | | | 29,777 | | | | 7,088,373 | |
Redemptions | | (73,150 | ) | | | (13,415,860 | ) | | (70,970 | ) | | | (17,666,128 | ) |
| | | | | | | | | | | | | | |
Net increase | | 4,806 | | | $ | 935,138 | | | 16,820 | | | $ | 3,965,553 | |
| | | | | | | | | | | | | | |
Increase derived from capital share transactions | | | | | $ | 12,399,461 | | | | | | $ | 40,143,772 | |
| | | | | | | | | | | | | | |
See accompanying notes to financial statements.
MSF-11
Metropolitan Series Fund, Inc.
Loomis Sayles Small Cap Portfolio
Financial Highlights
| | | | | | | | | | | | | | | | | | | | |
| | | Class A | |
| | | Year ended December 31, | |
| | | 2008 | | | 2007 | | | 2006 | | | 2005 | | | 2004 | |
Net Asset Value, Beginning of Period | | $ | 247.66 | | | $ | 249.37 | | | $ | 232.80 | | | $ | 220.60 | | | $ | 189.55 | |
| | | | | | | | | | | | | | | | | | | | |
Income From Investment Operations | | | | | | | | | | | | | | | | | | | | |
Net investment income (loss) | | | 0.56 | (a) | | | (0.08 | )(a) | | | 0.45 | | | | 0.11 | | | | (0.27 | ) |
Net realized and unrealized gain (loss) of investments | | | (79.58 | ) | | | 28.82 | | | | 37.97 | | | | 14.79 | | | | 31.32 | |
| | | | | | | | | | | | | | | | | | | | |
Total from investment operations | | | (79.02 | ) | | | 28.74 | | | | 38.42 | | | | 14.90 | | | | 31.05 | |
| | | | | | | | | | | | | | | | | | | | |
Less Distributions | | | | | | | | | | | | | | | | | | | | |
Distributions from net investment income | | | 0.00 | | | | (0.22 | ) | | | 0.00 | | | | 0.00 | | | | 0.00 | |
Distributions from net realized capital gains | | | (33.85 | ) | | | (30.23 | ) | | | (21.85 | ) | | | (2.70 | ) | | | 0.00 | |
| | | | | | | | | | | | | | | | | | | | |
Total distributions | | | (33.85 | ) | | | (30.45 | ) | | | (21.85 | ) | | | (2.70 | ) | | | 0.00 | |
| | | | | | | | | | | | | | | | | | | | |
Net Asset Value, End of Period | | $ | 134.79 | | | $ | 247.66 | | | $ | 249.37 | | | $ | 232.80 | | | $ | 220.60 | |
| | | | | | | | | | | | | | | | | | | | |
Total Return (%) | | | (35.9 | ) | | | 11.9 | | | | 16.7 | | | | 6.9 | | | | 16.4 | |
Ratio of operating expenses to average net assets before expense reductions (%) | | | 0.91 | | | | 0.90 | | | | 0.93 | | | | 0.94 | | | | 0.98 | |
Ratio of operating expenses to average net assets after expense reductions (%) (b) | | | 0.89 | | | | 0.89 | | | | 0.92 | | | | 0.91 | | | | 0.95 | |
Ratio of operating expenses to average net assets without giving effect to the contractual expense agreement would have been (%) (c) | | | 0.96 | | | | 0.95 | | | | 0.98 | | | | 0.94 | | | | 0.98 | |
Ratio of net investment income (loss) to average net assets (%) | | | 0.31 | | | | (0.03 | ) | | | 0.18 | | | | 0.05 | | | | (0.13 | ) |
Portfolio turnover rate (%) | | | 76 | | | | 64 | | | | 76 | | | | 101 | | | | 135 | |
Net assets, end of period (000) | | $ | 192,120 | | | $ | 365,435 | | | $ | 371,963 | | | $ | 351,279 | | | $ | 368,666 | |
| | | | | | | | | | | | | | | | | | | | |
| | | Class B | |
| | | Year ended December 31, | |
| | | 2008 | | | 2007 | | | 2006 | | | 2005 | | | 2004 | |
Net Asset Value, Beginning of Period | | $ | 243.90 | | | $ | 246.37 | | | $ | 230.75 | | | $ | 219.20 | | | $ | 188.59 | |
| | | | | | | | | | | | | | | | | | | | |
Income From Investment Operations | | | | | | | | | | | | | | | | | | | | |
Net investment income (loss) | | | 0.12 | (a) | | | (0.67 | )(a) | | | 0.12 | | | | (0.25 | ) | | | 0.08 | |
Net realized and unrealized gain (loss) of investments | | | (78.14 | ) | | | 28.43 | | | | 37.35 | | | | 14.50 | | | | 30.53 | |
| | | | | | | | | | | | | | | | | | | | |
Total from investment operations | | | (78.02 | ) | | | 27.76 | | | | 37.47 | | | | 14.25 | | | | 30.61 | |
| | | | | | | | | | | | | | | | | | | | |
Less Distributions | | | | | | | | | | | | | | | | | | | | |
Distributions from net realized capital gains | | | (33.85 | ) | | | (30.23 | ) | | | (21.85 | ) | | | (2.70 | ) | | | 0.00 | |
| | | | | | | | | | | | | | | | | | | | |
Total distributions | | | (33.85 | ) | | | (30.23 | ) | | | (21.85 | ) | | | (2.70 | ) | | | 0.00 | |
| | | | | | | | | | | | | | | | | | | | |
Net Asset Value, End of Period | | $ | 132.03 | | | $ | 243.90 | | | $ | 246.37 | | | $ | 230.75 | | | $ | 219.20 | |
| | | | | | | | | | | | | | | | | | | | |
Total Return (%) | | | (36.1 | ) | | | 11.6 | | | | 16.4 | | | | 6.7 | | | | 16.2 | |
Ratio of operating expenses to average net assets before expense reductions (%) | | | 1.16 | | | | 1.15 | | | | 1.18 | | | | 1.19 | | | | 1.23 | |
Ratio of operating expenses to average net assets after expense reductions (%) (b) | | | 1.14 | | | | 1.14 | | | | 1.17 | | | | 1.17 | | | | 1.20 | |
Ratio of operating expenses to average net assets without giving effect to the contractual expense agreement would have been (%) (c) | | | 1.21 | | | | 1.20 | | | | 1.23 | | | | 1.19 | | | | 1.23 | |
Ratio of net investment income (loss) to average net assets (%) | | | 0.07 | | | | (0.27 | ) | | | (0.02 | ) | | | (0.16 | ) | | | (0.07 | ) |
Portfolio turnover rate (%) | | | 76 | | | | 64 | | | | 76 | | | | 101 | | | | 135 | |
Net assets, end of period (000) | | $ | 74,957 | | | $ | 108,142 | | | $ | 67,360 | | | $ | 25,364 | | | $ | 6,440 | |
| Please | see following page for Financial Highlights footnote legend. |
See accompanying notes to financial statements.
MSF-12
Metropolitan Series Fund, Inc.
Loomis Sayles Small Cap Portfolio
Financial Highlights
| | | | | | | | | | | | | | | | | | | | |
| | | Class E | |
| | | Year ended December 31, | |
| | | 2008 | | | 2007 | | | 2006 | | | 2005 | | | 2004 | |
Net Asset Value, Beginning of Period | | $ | 245.18 | | | $ | 247.29 | | | $ | 231.34 | | | $ | 219.57 | | | $ | 188.95 | |
| | | | | | | | | | | | | | | | | | | | |
Income From Investment Operations | | | | | | | | | | | | | | | | | | | | |
Net investment income (loss) | | | 0.28 | (a) | | | (0.45 | )(a) | | | 0.14 | | | | (0.21 | ) | | | (0.45 | ) |
Net realized and unrealized gain (loss) of investments | | | (78.62 | ) | | | 28.57 | | | | 37.66 | | | | 14.68 | | | | 31.07 | |
| | | | | | | | | | | | | | | | | | | | |
Total from investment operations | | | (78.34 | ) | | | 28.12 | | | | 37.80 | | | | 14.47 | | | | 30.62 | |
| | | | | | | | | | | | | | | | | | | | |
Less Distributions | | | | | | | | | | | | | | | | | | | | |
Distributions from net realized capital gains | | | (33.85 | ) | | | (30.23 | ) | | | (21.85 | ) | | | (2.70 | ) | | | 0.00 | |
| | | | | | | | | | | | | | | | | | | | |
Total distributions | | | (33.85 | ) | | | (30.23 | ) | | | (21.85 | ) | | | (2.70 | ) | | | 0.00 | |
| | | | | | | | | | | | | | | | | | | | |
Net Asset Value, End of Period | | $ | 132.99 | | | $ | 245.18 | | | $ | 247.29 | | | $ | 231.34 | | | $ | 219.57 | |
| | | | | | | | | | | | | | | | | | | | |
Total Return (%) | | | (36.0 | ) | | | 11.7 | | | | 16.5 | | | | 6.8 | | | | 16.2 | |
Ratio of operating expenses to average net assets before expense reductions (%) | | | 1.06 | | | | 1.05 | | | | 1.08 | | | | 1.09 | | | | 1.13 | |
Ratio of operating expenses to average net assets after expense reductions (%) (b) | | | 1.04 | | | | 1.04 | | | | 1.07 | | | | 1.06 | | | | 1.10 | |
Ratio of operating expenses to average net assets without giving effect to the contractual expense agreement would have been (%) (c) | | | 1.11 | | | | 1.10 | | | | 1.13 | | | | 1.09 | | | | 1.13 | |
Ratio of net investment income (loss) to average net assets (%) | | | 0.15 | | | | (0.18 | ) | | | 0.03 | | | | (0.10 | ) | | | (0.26 | ) |
Portfolio turnover rate (%) | | | 76 | | | | 64 | | | | 76 | | | | 101 | | | | 135 | |
Net assets, end of period (000) | | $ | 35,047 | | | $ | 63,434 | | | $ | 59,821 | | | $ | 50,554 | | | $ | 47,131 | |
| (a) | Per share amount is based on average shares outstanding during the period. |
| (b) | The Portfolio has entered into arrangements with certain brokers who paid a portion of the Portfolio’s expenses. |
| (c) | See Note 4 of the Notes to Financial Statements. |
See accompanying notes to financial statements.
MSF-13
Metropolitan Series Fund, Inc.
Loomis Sayles Small Cap Portfolio
Notes to Financial Statements—December 31, 2008
Metropolitan Series Fund, Inc. (the “Fund”) is organized as a corporation under the laws of Maryland pursuant to Articles of Incorporation filed on November 23, 1982, as amended, and registered under the Investment Company Act of 1940, as amended (the “1940 Act”), as an open-end investment company. The Fund is a “series” type of mutual fund, which issues separate series of stock. Each series represents an interest in a separate portfolio of Fund investments. The Loomis Sayles Small Cap Portfolio (the “Portfolio”) is a diversified series of the Fund. Shares in the Fund are not offered directly to the general public and are currently available only to separate accounts established by Metropolitan Life Insurance Company (“MetLife”), New England Life Insurance Company, General American Life Insurance Company (“General American”), The MetLife Investors Group of Insurance Companies, MetLife Insurance Company of Connecticut and other affiliated insurance companies (collectively, the “Insurance Companies”) and to certain eligible qualified retirement plans (“Qualified Plans”), as an investment vehicle for variable life insurance, group annuity or variable annuity products of these insurance companies or Qualified Plans, although the Portfolio is not available to all such separate accounts and Qualified Plans. The Portfolio’s shares may be divided into different classes. Currently, the classes being offered by the Portfolio are named Class A, Class B and Class E. The classes of the Portfolio’s shares are identical, except that certain additional charges (Rule 12b-1 fees) are made against Class B and Class E shares. Investment income, realized and unrealized capital gains and losses, the common expenses of the Portfolio and certain Portfolio-level expense reductions, if any, are allocated daily, on a pro rata basis, to each class based on the relative net assets of each class to the total net assets of the Portfolio.
| 2. | SIGNIFICANT ACCOUNTING POLICIES: |
The preparation of financial statements in conformity with accounting principles generally accepted in the United States of America (“GAAP”) requires management to make estimates and assumptions that affect the reported amounts of assets and liabilities and disclosure of contingent assets and liabilities as of the date of the financial statements and the reported amounts of income and expenses during the reporting period. Actual results could differ from those estimates.
The following is a summary of significant accounting policies consistently followed by the Portfolio in the preparation of its financial statements. The policies are in conformity with GAAP.
Investment Valuation:
Debt securities (other than short term obligations with a remaining maturity of sixty days or less) are generally valued on the basis of evaluated or composite bid quotations obtained by independent pricing services and/or brokers and dealers selected by the relevant subadviser pursuant to authorization of the Board of Directors of the Fund (the “Board” or “Directors”). Such quotations take into account appropriate factors such as institutional-sized trading in similar groups of securities, yield, quality, coupon rate, maturity, type of issue, trading characteristics and other data. Short term obligations with a remaining maturity of sixty days or less are valued at amortized cost which approximates fair market value.
Equity securities traded on a national securities exchange or other exchanges are valued at their last sale price on the principal trading market. Equity securities traded on the NASDAQ National Market System are valued at the NASDAQ Official Closing Price (the “NOCP”). The NOCP is the last reported sale price if the last reported sale price falls between the spread of the last reported bid and asked prices. If the last reported bid and asked prices are above the last reported sale price, the NOCP will be the last reported bid price. If the last reported bid and asked prices are below the last reported sale price, the NOCP will be the last reported asked price. Equity securities traded on a national securities exchange or other exchanges or on the NASDAQ National Market System for which there is no reported sale during the day are valued at the last reported bid price. A security that is listed or traded on more than one exchange is valued at the quotation on the exchange determined to be the primary market for that security by the Board or its delegates. If no closing price is available, then such securities are valued by using the last reported bid price. Equity securities traded over-the-counter are valued at the last reported sales price.
If no current market value quotation is readily available or reliable for a portfolio security, fair value will be determined in accordance with procedures established by and under the general supervision of the Board. When the Portfolio uses fair value pricing, it may take into account any factors it deems appropriate. The value of securities used by the Portfolio to calculate its net asset value may differ from quoted or published prices for the same securities. Fair value pricing involves subjective judgments and the fair value determined for a security may be materially different than the value that could be realized upon the sale of that security.
The Portfolio expects to use fair value pricing for securities primarily traded on U.S. exchanges only under very limited circumstances. For example, the Portfolio may use fair value pricing if the exchange on which a security is traded closes early or trading in the security is suspended.
MSF-14
Metropolitan Series Fund, Inc.
Loomis Sayles Small Cap Portfolio
Notes to Financial Statements—December 31, 2008—(Continued)
Securities traded primarily on an exchange outside of the United States which closes before the close of the New York Stock Exchange will be valued at the last sales price on that non-U.S. exchange. Securities traded primarily on an exchange outside of the United States for which there is no reported sale during the day are valued at the mean between the last reported bid and asked prices. However, because most foreign markets close well before the Portfolio values its securities (typically at 4 p.m. Eastern Time), the earlier close of these foreign markets gives rise to the possibility that significant events, including broad market moves, may have occurred after these foreign markets close but before the Portfolio values its securities. To account for this, the Portfolio may frequently value many of its foreign equity securities using fair value prices based on third party vendor modeling tools.
Forward foreign currency exchange contracts are valued based on the mean between closing bid and asked prices of the forward currency contract rates in the London foreign exchange markets on a daily basis as provided by a reliable bank or dealer.
Options, whether on securities, indices, futures contracts, or otherwise, are valued at the last sales price available as of the close of business on the day of valuation or, if there is no such sale price available, at the mean between the bid and asked prices. Options on currencies are valued at the spot price each day.
The value of futures contracts will be the sum of the margin deposit plus or minus the difference between the value of the futures contract on each day the net asset value is calculated and the value on the date the futures contract originated, value being that established on a recognized commodity exchange, or by reference to other customary sources, with gain or loss being realized when the futures contract closes or expires.
Subject to the Board’s oversight, the Board has delegated the day-to-day oversight of pricing matters, including determinations in good faith under the Fund’s procedures the fair value of securities for which current market quotations are not readily available to the subadviser of the Portfolio.
Investment Transactions and Related Investment Income:
Portfolio security transactions are recorded on the trade date. Dividend income is recorded on the ex-dividend date or, for certain foreign securities, when notified. Interest income, which includes amortization of premium and accretion of discount on debt securities, is recorded on the accrual basis. Realized gains and losses on investments and unrealized appreciation and depreciation are determined on the identified cost basis, which is the same basis used for federal income tax purposes.
Repurchase Agreements:
The Portfolio, through the custodian or a subcustodian, receives delivery of the underlying securities collateralizing repurchase agreements. The Portfolio requires the custodian to take possession, to have legally segregated in the Federal Reserve Book Entry System, or to have segregated within the custodian’s vault, all securities held as collateral for repurchase agreements. It is the Portfolio’s policy that the market value of the collateral be at least equal to 100% of the repurchase price in the case of a repurchase agreement of one-day duration and 102% on all other repurchase agreements. The Portfolio’s subadviser is responsible for determining that the value of the collateral is at all times at least equal to the repurchase price. In connection with transactions in repurchase agreements, if the seller defaults and the value of the collateral declines or if the seller enters an insolvency proceeding, realization of the collateral by the Portfolio may be delayed, limited or wholly denied.
Foreign Currency Translation:
The books and records of the Portfolio are maintained in U.S. dollars. The values of securities, currencies and other assets and liabilities denominated in currencies other than U.S. dollars are translated into U.S. dollars based upon foreign exchange rates prevailing at the end of the period. Purchases and sales of investment securities, income and expenses are translated on the respective dates of such transactions. Since the values of investment securities are presented at the foreign exchange rates prevailing at the end of the period, it is not practical to isolate that portion of the results of operations arising from changes in exchange rates from that portion of the results of operations reflecting fluctuations arising from changes in market prices of the investment securities. Such fluctuations are included in the net realized and unrealized gain or loss on investments.
Net realized foreign exchange gains or losses arise from sales of foreign currency, currency gains or losses realized between the trade and settlement dates on securities transactions, and the difference between the amounts of dividends, interest, and foreign withholding taxes recorded by the Portfolio and the U.S. dollar equivalent of the amounts actually received or paid by the Portfolio. Net unrealized foreign exchange gains and losses arise from changes in the value of assets and liabilities, other than investment securities, resulting from changes in the exchange rate.
MSF-15
Metropolitan Series Fund, Inc.
Loomis Sayles Small Cap Portfolio
Notes to Financial Statements—December 31, 2008—(Continued)
Forward Foreign Currency Exchange Contracts:
The Portfolio may enter into forward foreign currency exchange contracts primarily to hedge against foreign currency exchange rate risks on its non-U.S. dollar denominated investment securities. When entering into a forward currency contract, the Portfolio agrees to receive or deliver a fixed quantity of foreign currency for an agreed-upon price on an agreed future date. These contracts are valued daily and the Portfolio’s net equity therein, representing unrealized gain or loss on the contracts as measured by the difference between the foreign exchange rates at the dates of entry into the contracts and the forward rates at the settlement date, is included in the Statement of Assets and Liabilities. Realized and unrealized gains and losses are included in the Statement of Operations. These instruments involve market and/or credit risk in excess of the amount recognized in the Statement of Assets and Liabilities. Risks arise from the possible inability of counterparties to meet the terms of their contracts and from movement in currency and securities values and interest rates.
Futures Contracts:
The Portfolio may buy and sell futures contracts (on recognized exchanges) as a hedge or to enhance return. Futures contracts are agreements to buy or sell a security, or deliver a final cash settlement price in connection with an index, interest rate, currency, or other contracts not calling for physical delivery, for a set price in the future. The Portfolio must post an amount equal to a portion of the total market value of the futures contract as futures variation margin, which is returned when the Portfolio’s obligations under the contract have been satisfied. From time to time thereafter, the Portfolio may have to post variation margin to maintain this amount as the market value of the contract fluctuates. Risks of entering into futures contracts (and related options) include the possibility that there may be an illiquid market and that a change in the value of the contract or option may not correlate with changes in the value of the underlying securities.
Options:
The Portfolio may use options to enhance returns or to hedge against changes in values of securities the Portfolio owns or expects to purchase. Writing puts or buying calls tends to increase the Portfolio’s exposure to the underlying instrument and writing calls or buying puts tends to decrease the Portfolio’s exposure to the underlying instrument, and can be used to hedge other Portfolio investments. For options purchased to hedge the Portfolio’s investments, the potential risk to the Portfolio is that the change in value of options contracts may not correspond to the change in value of the hedged instruments. In addition, losses may arise from changes in the value of the underlying instruments, if there is an illiquid secondary market, or if the counterparty is unable to perform. The maximum loss for purchased options is limited to the premium initially paid for the option. For options written by the Portfolio, the maximum loss is not limited to the premium initially received for the option.
The main risk associated with purchasing an option is that the option expires without being exercised. In this case, the option expires worthless and the premium paid for the option is considered the loss. The risk associated with writing a call option is that the Portfolio may forgo the opportunity for a profit if the market value of the underlying position increases and the option is exercised. The risk in writing a put option is that the Portfolio may incur a loss if the market value of the underlying position decreases and the option is exercised. In addition, the Portfolio risks not being able to enter into a closing transaction for the written option as the result of an illiquid market.
“When-Issued” Securities:
Purchasing securities “when-issued” is a forward commitment by the Portfolio to buy a security. The estimated amount of the Portfolio’s payment obligation and the security’s interest rate are determined when the commitment is made, even though no interest accrues until the security is issued, which is generally 15 to 120 days later. The Portfolio will segregate liquid assets with its custodian sufficient at all times to satisfy these commitments. If the value of the security is less when delivered than when the commitment was made, the Portfolio will suffer a loss.
Federal Income Taxes:
It is the Portfolio’s policy to comply with the requirements of the Internal Revenue Code of 1986, as amended (the “Code”), and regulations thereunder, applicable to regulated investment companies and to distribute, with respect to each taxable year, all of its taxable income to shareholders. Therefore, no federal income tax provision is required. The Portfolio is subject to the provisions of the Financial Accounting Standards Board Interpretation (“FASB”) No. 48, Accounting for Uncertainties in Income Taxes (FIN 48). FIN 48 sets forth a minimum threshold for financial statement recognition of the benefit of a tax position taken
MSF-16
Metropolitan Series Fund, Inc.
Loomis Sayles Small Cap Portfolio
Notes to Financial Statements—December 31, 2008—(Continued)
or expected to be taken in a tax return. The implementation of FIN 48 did not result in any unrecognized tax benefits in the accompanying financial statements. Each of the Portfolio’s federal tax returns for the prior three fiscal years remains subject to examination by the Internal Revenue Service.
As of December 31, 2008, the Portfolio had $33,638,006 in capital loss carryforwards expiring on December 31, 2016.
Pursuant to Section 852 of the Code, the Portfolio designated the amount shown below under Long Term Gain as capital gain dividends for its taxable year ended December 31, 2008. The tax character of distributions paid for the periods ended December 31, 2008 and 2007 was as follows:
| | | | | | | | | | | | | | | | | | | | | |
Ordinary Income | | Long Term Gain | | Return of Capital | | Total |
2008 | | 2007 | | 2008 | | 2007 | | 2008 | | 2007 | | 2008 | | 2007 |
$19,284,191 | | $ | 10,856,813 | | $ | 50,456,392 | | $ | 48,915,580 | | $ | — | | $ | — | | $ | 69,740,583 | | $ | 59,772,393 |
As of December 31, 2008, the components of distributable earnings (accumulated losses) on a federal income tax basis were as follows:
| | | | | | | | | | | | | | | |
Undistributed
Ordinary
Income | | Undistributed
Long Term
Gain | | Unrealized
Depreciation | | | Loss
Carryforwards | | | Total | |
$601,042 | | $ | — | | $ | (50,309,981 | ) | | $ | (33,638,006 | ) | | $ | (83,346,945 | ) |
Pursuant to Federal income tax regulations applicable to investment companies, the Portfolio has elected to treat net capital losses realized between November 1 and December 31 of each year as occurring on the first day of the following tax year. For the year ended December 31, 2008, the following amounts of realized capital and currency losses reflected in the accompanying financial statements will not be recognized for Federal income tax purposes until January 1, 2009:
| | | | |
Currency | | Capital | |
$— | | $ | (19,021,230 | ) |
Dividends and Distributions to Shareholders:
The Portfolio records dividends and distributions on the ex-dividend date. Net realized gains from security transactions (if any) are generally distributed annually to shareholders. The timing and characterization of certain income and capital gains distributions are determined in accordance with federal tax regulations that may differ from GAAP. Permanent book and tax basis differences relating to shareholder distributions will result in reclassification between under/over distributed net investment income, accumulated net realized gains/losses and paid in capital.
Expense Reductions:
Certain Portfolio trades are directed to brokers who paid a portion of the Portfolio’s expenses. Amounts paid for the Portfolio are shown as expense reductions in the Statement of Operations.
| 3. | INVESTMENT TRANSACTIONS: |
For the year ended December 31, 2008, purchases and sales of securities (excluding short term investments) for the Portfolio were as follows:
| | | | | | | | | |
Purchases | | Sales |
U.S. Government | | Other | | U.S. Government | | Other |
$0 | | $ | 310,514,367 | | $ | 0 | | $ | 360,965,135 |
MSF-17
Metropolitan Series Fund, Inc.
Loomis Sayles Small Cap Portfolio
Notes to Financial Statements—December 31, 2008—(Continued)
| 4. | INVESTMENT MANAGEMENT FEES AND OTHER TRANSACTIONS WITH AFFILIATES: |
Investment Management Agreement:
MetLife Advisers, LLC (“MetLife Advisers”) is the investment adviser to the Portfolio. The Fund has entered into an investment management agreement with MetLife Advisers with respect to the Portfolio. For providing investment management services to the Portfolio, MetLife Advisers receives monthly compensation at the following annual rates:
| | | | |
Management
Fees earned by
MetLife Advisers
for the year ended
December 31, 2008 | | Annual
percentage
rates paid to
MetLife Advisers | | Based on Portfolios
average daily net asset
levels |
| $3,730,751 | | 0.900% | | Of the first $500 million |
| | 0.850% | | On amounts in excess of $500 million |
Certain officers and directors of the Fund may also be officers of MetLife Advisers; however, such officers and directors receive no compensation from the Fund.
MetLife Advisers has entered into an investment subadvisory agreement with respect to the Portfolio. Loomis, Sayles & Co., L.P. is compensated by MetLife Advisers to provide subadvisory services for the Portfolio.
Management Fee Waivers:
Pursuant to an expense agreement, MetLife Advisers has agreed, for the period May 1, 2008 to April 30, 2009, to reduce its advisory fees set out above under “Investment Management Agreement” for each class of the Portfolio at the annual rate of 0.05% of average daily net assets. A similar expense agreement was in place for the period May 1, 2007 through April 30, 2008. Amounts waived for the year ended December 31, 2008 are shown as management fee waivers in the Statement of Operations.
Service and Distribution Fees:
The Fund has adopted a Distribution and Service Plan under Rule 12b-1 of the 1940 Act for the Portfolio’s Class B and E shares. Under the Distribution and Service Plan, the Class B and E shares of the Portfolio pay a fee to compensate the Insurance Companies (or their affiliates) and other broker-dealers and financial intermediaries involved in the offer and sale of Portfolio shares for promoting or selling and servicing the Class B and E shares. The fees under the Distribution and Service Plan for each class of the Portfolio’s shares are calculated as a percentage of the Portfolio’s average daily net assets that are attributable to that Class. Currently, the fee is 0.25% per year for Class B shares and 0.15% per year for Class E shares. Amounts paid by the Portfolio for the year ended December 31, 2008 are shown as Service and Distribution fees in the Statement of Operations.
The Fund has entered into a securities lending arrangement with the Fund’s custodian, State Street Bank and Trust Company (the “custodian”). Under the agreement, the custodian is authorized to loan securities on the Portfolios’ behalf. In exchange, the Portfolio receives either cash or securities as collateral against the loaned securities. The Portfolio receives collateral at least equal to 102% of the market value of the loaned securities (105% for foreign securities), at each loan’s inception. Collateral must be maintained at least at 100% of the market value of the loaned securities for the duration of the loan. The cash collateral is invested in the Navigator Securities Lending Prime Portfolio, an affiliate of the custodian, which invests in a variety of high quality U.S. dollar-denominated instruments. If the market value of the collateral at the close of trading on a business day is less than 100% of the market value of the loaned securities at the close of trading on that day, the borrower shall be required to deliver, by the close of business on the following business day, an additional amount of collateral, equal to at least 100% of the market value of all the loaned securities as of such preceding day. The Portfolio receives 80% of the annual net income from securities lending transactions, which is included in interest income of the Portfolio. The remaining 20% is paid to the custodian as compensation for its securities lending services. Interest income received by the Portfolio via lending transactions during the year ended December 31, 2008 is footnoted in the Statement of Operations. The Portfolio bears the risk of any deficiency in the amount of collateral available for return to a borrower due to a loss in an approved investment purchased with such collateral. Any outstanding loans by the Portfolio at December 31, 2008 are footnoted in the Schedule of Investments.
| 6. | MARKET AND CREDIT RISK: |
In the normal course of business, the Portfolio invests in securities and enters into transactions where risks exist due to fluctuations in the market (market risk) or failure of the other party to a transaction to perform (credit risk). The value of
MSF-18
Metropolitan Series Fund, Inc.
Loomis Sayles Small Cap Portfolio
Notes to Financial Statements—December 31, 2008—(Continued)
securities held by the Portfolio may decline in response to certain events, including those directly involving the companies whose securities are owned by the Portfolio; conditions affecting the general economy; overall market changes; local, regional or global political, social or economic instability; and currency and interest rate and price fluctuations. Similar to credit risk, the Portfolio may be exposed to counterparty risk, or the risk that an entity with which the Portfolio has unsettled or open transactions may default. Financial assets, which potentially expose the Portfolio to credit and counterparty risks, consist principally of investments and cash due from counterparties. The extent of the Portfolio’s exposure to credit and counterparty risks in respect to these financial assets approximates their value as recorded in the Portfolio’s Statements of Assets and Liabilities.
| 7. | RECENT ACCOUNTING PRONOUNCEMENTS: |
In March 2008, the FASB issued Statement of Financial Accounting Standards No. 161, Disclosures about Derivative Instruments and Hedging Activities (“FAS 161”), an amendment of FASB Statement No. 133. FAS 161 requires enhanced disclosures about (a) how and why an entity uses derivative instruments, (b) how derivative instruments and hedging activities are accounted for, and (c) how derivative instruments and related hedging activities affect a fund’s financial position, financial performance, and cash flows. Management does not believe the adoption of FAS 161 will materially impact the financial statement amounts, but will require additional disclosures. This will include qualitative and quantitative disclosures on derivative positions existing at period end and the effect of using derivatives during the reporting period. FAS 161 is effective for financial statements issued for fiscal years and interim periods beginning after November 15, 2008. Management is currently evaluating the impact the adoption of FAS 161 will have on the Portfolio’s financial statement disclosures.
MSF-19
Metropolitan Series Fund, Inc.
Loomis Sayles Small Cap Portfolio
Report of Independent Registered Public Accounting Firm
To the Shareholders and Board of Directors of Metropolitan Series Fund, Inc.:
We have audited the accompanying statement of assets and liabilities, including the schedule of investments, of the Loomis Sayles Small Cap Portfolio (one of the portfolios constituting the Metropolitan Series Fund, Inc.) (the “Fund”) as of December 31, 2008, and the related statement of operations for the year then ended, the statements of changes in net assets for each of the two years in the period then ended, and the financial highlights for each of the five years in the period then ended. These financial statements and financial highlights are the responsibility of the Company’s management. Our responsibility is to express an opinion on these financial statements and financial highlights based on our audits.
We conducted our audits in accordance with the standards of the Public Company Accounting Oversight Board (United States). Those standards require that we plan and perform the audit to obtain reasonable assurance about whether the financial statements and financial highlights are free of material misstatement. The Fund is not required to have, nor were we engaged to perform, an audit of its internal control over financial reporting. Our audit included consideration of internal control over financial reporting as a basis for designing audit procedures that are appropriate in the circumstances, but not for the purpose of expressing an opinion on the effectiveness of the Fund’s internal control over financial reporting. Accordingly, we express no such opinion. An audit also includes examining, on a test basis, evidence supporting the amounts and disclosures in the financial statements, assessing the accounting principles used and significant estimates made by management, as well as evaluating the overall financial statement presentation. Our procedures included confirmation of securities owned as of December 31, 2008, by correspondence with the custodian and brokers; where replies were not received from brokers, we performed other auditing procedures. We believe that our audits provide a reasonable basis for our opinion.
In our opinion, the financial statements and financial highlights referred to above present fairly, in all material respects, the financial position of the Loomis Sayles Small Cap Portfolio of the Metropolitan Series Fund, Inc. as of December 31, 2008, the results of its operations for the year then ended, the changes in its net assets for each of the two years in the period then ended, and the financial highlights for each of the five years in the period then ended, in conformity with accounting principles generally accepted in the United States of America.
Deloitte & Touche LLP
Boston, Massachusetts
February 20, 2009
MSF-20
Metropolitan Series Fund, Inc.
Directors and Officers
The Fund’s Directors review actions of the Fund’s investment adviser and subadvisers, and decide upon matters of general policy. The Fund’s officers supervise the daily business operations of the Fund. The Board of Directors and the Fund’s officers are listed below. Each Director is responsible for overseeing all 38 Portfolios of the Fund. There is no limit to the term a Director may serve. Directors serve until their resignation, retirement or removal in accordance with the Fund’s organizational documents and policies adopted by the Board from time to time. Officers hold office at the pleasure of the Board or until the election or appointment and the qualification of a successor. The address of the Directors and officers is c/o Metropolitan Series Fund, Inc., 501 Boylston Street, Boston, MA 02116.
Interested Directors(1)
Each Director below is an “interested person” (as defined by the 1940 Act) with respect to the Fund in that Ms. Forget is an employee of MetLife and Mr. Typermass is a former employee of MetLife and owns securities issued by MetLife, Inc., the ultimate parent company of MetLife Advisers.
| | | | | | | | |
Name, Address and Age | | Current
position(s)
with Fund | | Position(s)
held since | | Principal occupations
over past five years, including other directorships(2) | | Number of
Portfolios in
Fund Complex
Overseen by
Director(3) |
Elizabeth M. Forget Age: 42 | | Director, Chairman of the Board, President and Chief Executive Officer | | 2006 | | Senior Vice President (since 2007), MetLife, Inc.; President, Met Investors Advisory, LLC; Trustee and President, Met Investors Series Trust; Executive Vice President, MetLife Investors Group, Inc.; President, Chief Executive Officer and Chair of the Board of Managers (since 2006), MetLife Advisers; President, Met Investors Advisory, LLC. | | 87 |
| | | | |
Arthur G. Typermass Age: 71 | | Director | | 1998 | | Formerly, Senior Vice President and Treasurer, MetLife. | | 38 |
Non-Interested Directors(1)
Each Director below is not an “interested person” (as defined by the 1940 Act) with respect to the Fund (collectively, the “Independent Directors”).
| | | | | | | | |
Name, Address and Age | | Current
position(s)
with Fund | | Position(s)
held since | | Principal occupations
over past five years, including other directorships(2) | | Number of
Portfolios in
Fund Complex
Overseen by
Director(3) |
Steve A. Garban† Age: 71 | | Director | | 1985 | | Formerly, Chief Financial Officer, Senior Vice President Finance and Operations and Treasurer (Emeritus), The Pennsylvania State University. | | 38 |
| | | | |
Linda B. Strumpf Age: 61 | | Director | | 2000 | | Vice President and Chief Investment Officer, Ford Foundation. | | 38 |
| | | | |
Michael S. Scott Morton† Age: 71 | | Director | | 1993 | | Jay W. Forrester Professor of Management (Emeritus) at Sloan School of Management, MIT. | | 38 |
| | | | |
H. Jesse Arnelle Age: 75 | | Director | | 2001 | | Formerly, Counsel, Womble Carlyle Sandrie & Rice; Director, Textron Inc. (global multi- industry company)*; formerly, Director, Gannet Co. Inc. (diversified news and information company)*; formerly, Director, Eastman Chemical Company (global chemical company)*; formerly, Director, Waste Management, Inc.*; formerly, Director, Armstrong Holdings Inc. (parent company of floor and ceiling products business)*; formerly, Director, FPL Group Inc. (public utility holding company)*; Director, URS Corporation (engineering design services firm)*. | | 38 |
MSF-21
Metropolitan Series Fund, Inc.
Directors and Officers—(Continued)
| | | | | | | | |
Name, Address and Age | | Current
position(s)
with Fund | | Position(s)
held since | | Principal occupations
over past five years, including other directorships(2) | | Number of
Portfolios in
Fund Complex
Overseen by
Director(3) |
Nancy Hawthorne Age: 57 | | Director | | 2003 | | Chief Executive Officer, Clerestory LLC (corporate financial advisor); Director, Avid Technologies (computer software company)*; formerly, Chairman of the Board of Avid Technologies; formerly, Board of Advisors, L. Knife & Sons, Inc. (beverage distributor); formerly, Trustee, New England Zenith Fund (“Zenith Fund”)**; formerly, Chief Executive Officer and Managing Partner, Hawthorne, Krauss and Associates (corporate financial advisor); formerly, Chief Financial Officer and Executive Vice President, Continental Cablevision, subsequently renamed MediaOne (cable television company); formerly, Director, Life F/X, Inc.; formerly, Chairman of the Board, WorldClinic (distance medicine company); formerly, Director, Perini Corporation (construction company)*; formerly, Director, CGU (property and casualty insurance company); formerly, Director, Beacon Power Corporation (energy company)*. | | 38 |
| | | | |
John T. Ludes Age: 72 | | Director | | 2003 | | President, LFP Properties (consulting firm); Formerly, Trustee, Zenith Fund**; formerly, Vice Chairman, President and Chief Operating Officer, Fortune Brands/American Brands (global conglomerate); formerly, President and CEO, Acushnet Company (athletic equipment company). | | 38 |
Officers(1)
| | | | | | | | |
Name and address | | Age | | Current
position(s)
with Fund | | Position(s)
held since | | Principal occupations over past five years(2) |
| Jeffrey L. Bernier | | 37 | | Senior Vice President | | 2008 | | Vice President (since 2008), MetLife, Inc.; Vice President (since 2008), MetLife; Senior Vice President (since 2008), MetLife Advisers; formerly, Director and Senior Investment Analyst (2004 to 2007), John Hancock Financial Services; formerly, Assistant Vice President (2000 to 2001), Wachovia Securities. |
| | | | |
| Alan C. Leland | | 56 | | Senior Vice President | | 2005 | | Treasurer and Chief Financial Officer, MetLife Advisers, LLC; Treasurer (since 2005), Met Investors Advisory, LLC; Vice President (since 2004), Met Investors Advisory, LLC; Vice President (since 2003), MetLife, Inc.; Vice President, MetLife; Senior Vice President, NELICO. |
| | | | |
| Peter Duffy | | 53 | | Vice President
and Treasurer | | 2000 | | Senior Vice President, MetLife Advisers; Second Vice President (since 2003), NELICO; Vice President, MetLife (since 2004); Vice President (since 2004), MetLife, Inc.; formerly, Vice President and Treasurer, Zenith Fund**. |
| | | | |
| Jeffrey P. Halperin | | 41 | | Chief
Compliance Officer | | 2007 | | Vice President (since 2006), MetLife, Inc.; Vice President (since 2006), MetLife; Chief Compliance Officer (since 2006), Met Investors Series Trust, MetLife Advisers, Met Investors Advisory, LLC and MetLife Investment Advisors Company, LLC. |
| * | Indicates a directorship with a registered investment company or a company subject to the reporting requirements of the Securities Exchange Act of 1934, as amended. |
| ** | The Zenith Fund deregistered with the Securities and Exchange Commission (“SEC”) in 2004. |
| (†) | Served as a trustee, director and/or officer of one or more of the following companies, each of which had a direct or indirect advisory relationship with MetLife Advisers or its affiliates prior to January 31, 2005: State Street Research Financial Trust, State Street Research Income Trust, State Street Research Money Market Trust, State Street Research Institutional Funds, State Street Research Capital Trust, State Street Research Master Investment Trust, State Street Research Equity Trust, State Street Research Securities Trust and State Street Research Exchange Trust (collectively, the “State Street Research Funds”). |
| (1) | During the period shown, each Director of the Fund served as a Trustee of Metropolitan Series Fund II, a registered investment company that ceased investment operations in June of 2008 and has applied for deregistration under the Investment Company Act of 1940. During this period, each officer of the Fund served in the same position with Metropolitan Series Fund II. |
| (2) | Previous positions during the past five years with the Fund; Met Investors Series Trust; MetLife; MetLife, Inc.; MetLife Advisers; Met Investors Advisory, LLC; Zenith Fund; NELICO; or New England Securities Corporation are omitted if not materially different. |
| (3) | The Fund Complex includes the Fund (38 portfolios) and Met Investors Series Trust (49 portfolios). |
MSF-22
Metropolitan Series Fund, Inc.
Loomis Sayles Small Cap Portfolio
Board Approval of Advisory and Subadvisory Agreements
The Fund’s Contract Review Committees of the Board of Directors (the “Board” or the “Directors”) typically meet in early fall to review the Portfolios’ advisory agreements (the “Advisory Agreements”) and subadvisory agreements (the “Subadvisory Agreements,” and, together with the Advisory Agreements, the “Agreements”) and determine whether to recommend that the full Board approve the continuation of the Agreements for an additional one-year period. (Following the initial approval of an Agreement for a new Portfolio or with a new adviser or subadviser, such annual reviews are not required until 2 years following the execution of such Agreement.) After each Committee has made its recommendations, the full Board, including the Independent Directors, determines whether to approve the continuation of each of the Agreements. In addition, the Board, including the Independent Directors, considers matters bearing on the Agreements at most of its other meetings throughout the year and regularly interviews various individuals at MetLife Advisers responsible for the management of the Portfolios. The Directors also interview selected investment managers and other professionals at the subadvisers at various times throughout the year.
The Directors receive all materials that they or MetLife Advisers, the Fund’s investment adviser, and the subadvisers believe to be reasonably necessary for the Directors to evaluate the Agreements and determine whether to approve the continuation of the Agreements. These materials generally include, among other items, (i) information on the investment performance of the Portfolios and the performance of peer groups of funds and the Portfolios’ performance benchmarks, (ii) information on the Portfolios’ advisory and subadvisory fees and other expenses, including information comparing the Portfolios’ expenses to those of peer groups of funds and information about any applicable expense caps and fee “breakpoints,” (iii) sales and redemption data, (iv) information related to the profitability of the Agreements to MetLife Advisers and certain of the subadvisers, and potential “fall-out” or ancillary benefits that MetLife Advisers, the subadvisers or their affiliates may receive as a result of their relationships with the Fund and (v) information obtained through the subadvisers’ responses to certain requests from MetLife Advisers and the Directors and MetLife Advisers’ responses to requests from the Directors. The Directors may also consider other information such as (vi) MetLife Advisers’ and the subadvisers’ financial results and condition, (vii) each Portfolio’s investment objectives and strategies and the size, education and experience of the investment staffs of MetLife Advisers and the relevant subadvisers and their use of technology and external research, (viii) the allocation of the Portfolios’ brokerage, if any, including allocations to brokers affiliated with the subadvisers and the use of “soft” commission dollars to pay Portfolio expenses and to pay for research and other similar services, (ix) the resources devoted to, and the record of compliance with, the Portfolios’ investment policies and restrictions, policies on personal securities transactions and other compliance policies, (x) the responses of MetLife Advisers, the subadvisers and/or their affiliates to certain legal and regulatory proceedings and (xi) the economic outlook generally and for the mutual fund industry in particular. Throughout the process, the Directors have the opportunity to ask questions of and request additional materials from MetLife Advisers and the subadvisers.
Following meetings of each Contract Review Committee on September 10, 2008, the Board, including the Independent Directors, at its November 6-7, 2008 meeting, approved the continuation through December 31, 2009 of the Advisory Agreements for each Portfolio of the Fund and the Subadvisory Agreements for each Portfolio other than the Zenith Equity Portfolio and Asset Allocation Portfolios (which do not have subadvisers) and the Van Eck Global Natural Resources Portfolio, Met/Dimensional International Small Cap Portfolio and Loomis Sayles Small Cap Growth Portfolio (formerly known as the Franklin Templeton Small Cap Growth Portfolio). The Agreements approved for continuation are referred to below as the “Continued Agreements.”
In considering whether to approve the continuation of the Continued Agreements, the Directors, including the Independent Directors, did not identify any single factor as determinative, and each weighed the various factors as he or she deemed appropriate. The Directors considered the following matters in connection with their approval of the Continued Agreements:
The nature, extent and quality of the services provided to the relevant Portfolios under the Continued Agreements. The Directors considered the nature, extent and quality of the services provided by MetLife Advisers, the relevant subadvisers (if any) and their affiliates (each, an “Adviser,” and, collectively, the “Advisers”) to the relevant Portfolios pursuant to the Continued Agreements and the resources dedicated to these Portfolios by the Advisers. In particular, the Directors considered the Advisers’ abilities to attract and retain highly qualified investment professionals. With respect to MetLife Advisers, the Directors considered (for each Portfolio other than the Zenith Equity and Asset Allocation Portfolios) that MetLife Advisers is (i) ultimately responsible for the performance of such Portfolios; (ii) ultimately responsible for the establishment of the investment strategies of each such Portfolio, primarily through its recommendations to the Board regarding the hiring and selection of subadvisers; (iii) responsible for the hiring and selection, subject to Board approval, of subadvisers; and (iv) responsible for maintaining a program of Subadviser oversight reasonably designed to ensure that the subadvisers have reasonable compliance policies and procedures in place. The Directors also considered that MetLife Advisers provides a full range of day-to-day administrative services for the Portfolios involving all aspects of such Portfolios’ day-to-day operations (other than portfolio management). With respect to the Zenith Equity and Asset Allocation Portfolios, the Directors considered both the portfolio management services and the administrative services provided by MetLife Advisers. After reviewing
MSF-23
Metropolitan Series Fund, Inc.
Loomis Sayles Small Cap Portfolio
Board Approval of Advisory and Subadvisory Agreements—(Continued)
these and related factors, the Directors concluded, within the context of their overall conclusions regarding each of the Continued Agreements, that the nature, extent and quality of services provided supported the renewal of these Agreements.
Investment performance of the relevant Portfolios. The Directors reviewed information about the performance of the relevant Portfolios over various time periods, including information prepared by an independent third party that compared the performance of the Portfolios to the performance of peer groups of funds and performance benchmarks. The Directors also reviewed a description of the third party’s methodology for identifying a Portfolio’s peer group(s) for purposes of performance and expense comparisons.
In the case of each relevant Portfolio that had performance that lagged its peer group(s) for certain periods, the Directors concluded that other factors relevant to performance were sufficient, in light of other considerations, to warrant renewal of the Continued Agreements relating to such Portfolio. These factors varied from Portfolio to Portfolio, but included one or more of the following: (i) that such Portfolio’s performance, although lagging in certain recent periods, was stronger over the longer term; (ii) that the underperformance was attributable, to a significant extent, to investment decisions that were reasonable and consistent with the Portfolio’s investment objective(s) and policies and that the Portfolio was performing within the range of reasonable expectations, given market conditions and the Portfolio’s investment objective(s) and policies; (iii) that the Portfolio’s performance was competitive when compared to other relevant performance benchmarks or peer groups; and (iv) that MetLife Advisers and/or the relevant subadviser (if any) had taken or was taking steps designed to help improve the Portfolio’s investment performance (including, in the case of certain Portfolios, that MetLife Advisers was formulating possible proposals, for presentation to the Board in November 2008, to replace the Portfolio’s subadviser or to merge the Portfolio into another Portfolio with a similar investment objective and better investment performance).
The Directors also considered the investment performance of the Advisers and their reputations generally, the historical responsiveness of the Advisers to Director concerns about performance and the willingness of the Advisers to take steps intended to improve performance.
After reviewing these and related factors, the Directors concluded, within the context of their overall conclusions regarding each of the Continued Agreements, that the investment performance of each relevant Portfolio and Adviser was sufficient, in light of other considerations, to warrant the renewal of the Continued Agreements.
The costs of the services to be provided and profits to be realized by the Advisers and their affiliates from their relationships with the Portfolios. The Directors considered the fees charged by MetLife Advisers to the Portfolios for advisory services and, with respect to the subadvised Portfolios, by such subadvisers to MetLife Advisers for subadvisory services (such advisory and subadvisory fees (if any), collectively, “Fees”), as well as the total expense levels of the Portfolios. This information included comparisons (provided by an independent third party) of the Portfolios’ advisory fees and total expense levels to those of their peer groups. In evaluating Fees for the relevant Portfolios, the Directors also took into account the demands, complexity and quality of the investment management services provided to each Portfolio. The Directors considered MetLife Advisers’ recommendations regarding reductions in Fee rates, implementation of Fee breakpoints and institution of Fee waivers and expense caps.
The Directors also considered the compensation directly or indirectly received by the Advisers and their affiliates from their relationships with the relevant Portfolios. The Directors reviewed information relating to the profits received by MetLife Advisers, certain of the subadvisers and their affiliates as a result of their relationships with the relevant Portfolios, and information about the allocation of expenses used to calculate profitability. When reviewing profitability, the Directors also considered the performance of the relevant Portfolios, the expense levels of such Portfolios and whether the relevant Advisers had implemented breakpoints, fee waivers and/or expense caps with respect to such Portfolios.
After reviewing these and related factors, the Directors concluded, within the context of their overall conclusions regarding each of the Continued Agreements, that the Fees charged to each of the relevant Portfolios were fair and reasonable, and that the information provided regarding costs of these services generally, and the related profitability (if known) to the relevant Advisers of their relationships with the relevant Portfolios, supported the renewal of the Continued Agreements.
Economies of Scale. The Directors considered the existence of any economies of scale in the provision of services by the Advisers and whether those economies were shared with the relevant Portfolios through breakpoints in their advisory fees or other means, such as expense caps, fee waivers or relatively low levels of fees. The Directors noted that most of the relevant Portfolios benefited or will benefit from breakpoints, expense caps and/or fee waivers with respect to their advisory fees. In considering these issues, the Directors also took into consideration information relating to the costs of the services provided and the profitability to MetLife Advisers, the relevant subadvisers (if any) and each of their affiliates of their relationships with the relevant Portfolios, as discussed above.
MSF-24
Metropolitan Series Fund, Inc.
Loomis Sayles Small Cap Portfolio
Board Approval of Advisory and Subadvisory Agreements—(Continued)
After reviewing these and related factors, the Directors concluded, within the context of their overall conclusions regarding each of the Continued Agreements, that the extent to which economies of scale were shared with the relevant Portfolios supported the renewal of such Agreements.
Other Factors. The Directors also considered other factors, which included but were not limited to the following:
| | • | | the extent to which each relevant Portfolio operated in accordance with its investment objective, and its record of compliance with its investment restrictions and the compliance programs of the Fund and the Advisers. They also considered the compliance-related resources the Advisers and their affiliates provide to the relevant Portfolios; |
| | • | | the nature, quality, cost and extent of administrative and shareholder services performed by MetLife Advisers and its affiliates under the Advisory Agreements; and |
| | • | | so-called “fall-out benefits” to the Advisers, such as the engagement of their affiliates to provide distribution, brokerage and transfer agency services to the Portfolios, and the benefits of research made available to the relevant Advisers by reason of brokerage commissions generated by the relevant Portfolios’ securities transactions. The Directors also considered the possible conflicts of interest associated with these fall-out and other benefits, and the reporting and other processes in place to disclose and monitor these possible conflicts of interest. |
Based on their evaluation of all factors that they deemed to be material, including those factors described above, and assisted by the advice of independent counsel, the Directors, including the Independent Directors, concluded that each of the Continued Agreements should be continued through December 31, 2009.
MSF-25
A description of the policies and procedures that the Fund uses to determine how to vote proxies relating to portfolio securities is available (i) without charge, upon request, by calling (800) 638-7732 and (ii) on the Securities and Exchange Commission’s (the “SEC”) website at http://www.sec.gov.
Information regarding how the Fund voted proxies relating to portfolio securities during the most recent twelve-month period ended December 31, 2008 is available (i) without charge, upon request, by calling (800) 638-7732 and (ii) on the SEC’s website at http://www.sec.gov.
The Fund’s Statement of Additional Information includes additional information about the Directors of the Fund and is available (i) without charge, upon request, by calling (800) 638-7732 and (ii) on the SEC’s website at http://www.sec.gov.
The Fund files with the SEC a complete schedule of its portfolio holdings, as of the close of the first and third quarters of its fiscal year, on “Form N-Q”. These filings are available on the SEC’s website at www.sec.gov and may be reviewed and copied at the SEC’s Public Reference Room in Washington, DC. (Call 1-800-SEC-0330 for information on the operation of the Public Reference Room.)
MSF-26
Simplify your life…
with MetLife eDelivery® while helping MetLife preserve the planet’s natural resources.
(see details on inside cover)
| | |
Metropolitan Series Fund, Inc. Met/Dimensional International Small Company Portfolio Annual Report | | December 31, 2008 |
NOT PART OF THE ANNUAL REPORT
Letter from the President
February 1, 2009
Letter to Policy Holders:
2008 was an extraordinary year in the capital markets around the world and for the global economy. Energy prices rose to record levels early in the year before falling by two-thirds by year-end. A credit crisis that began with concerns about sub-prime mortgages led to massive changes in the financial landscape with government takeovers, forced sales, and outright failures of a number of large, once venerable firms.
While bonds as measured by the Barclays Capital U.S. Aggregate Bond Index (formerly known as, Lehman Brothers U.S. Aggregate Bond Index) were up 5.2% for the year in response to declining interest rates, there were large differences in the total returns of the various sectors of the bond market. U.S. treasury securities were up over 13% as frightened investors sought refuge in what they perceived to be the safest and most liquid investments. In contrast, investment grade corporate securities lost nearly 5% as credit spreads widened and below investment grade or high yield bonds fell over 26%.
In response to the growing credit crisis and the weakening economy, common stocks fell sharply across all regions, styles, and capitalizations. As measured by the Standard and Poor’s 500, U.S. common stocks fell 37% for the year, the worst calendar year decline since the 1930s. Foreign stocks were down even more with the MSCI EAFE Index down 43% for the year.
On the following pages, you will find a complete review of your Portfolio and its investment performance.
MetLife is committed to building your financial freedom. We appreciate your trust and will continue to focus our efforts on meeting your investment needs.
Sincerely,
Elizabeth M. Forget
President, Metropolitan Series Fund, Inc.
Metropolitan Series Fund, Inc.
Met/Dimensional International Small Company Portfolio
Managed by Dimensional Fund Advisors
Portfolio Manager Commentary*
PORTFOLIO PERFORMANCE
Since its inception on October 31, 2008, the Class A shares of the Met/Dimensional International Small Company Portfolio returned 1.6%, compared to its benchmark, the MSCI World ex US Small Cap Index1, which returned 1.7%.
PORTFOLIO REVIEW
Developed markets equities suffered losses in excess of 20% again in the fourth quarter, as the global financial crisis intensified and many of the world’s leading economies were officially declared to be in recession. Those losses, combined with the poor performance of the first nine months of the year, turned 2008 into the worst year on record for developed markets, as measured by the MSCI indices, which go back to 1970. Developed market equity returns for US investors were also hurt by the strength of the US dollar, which benefited from the pronounced flight to quality. The US dollar appreciated 1.3% against the euro, 12.5% against the Canadian dollar, and 19.1% against the British pound in the fourth quarter. Against the yen, however, the US dollar depreciated by 17.3% in the quarter. The overall impact of currency fluctuations between the US dollar and developed country currencies was to decrease the dollar-denominated returns of developed market equities by approximately 2.3% in the fourth quarter and by about 4.0% in 2008.
Intraday and daily volatility in developed markets were well above the historical levels in the last quarter of 2008. Cross-sectional dispersion was also well above its historical average during the fourth quarter. As a result, small differences in portfolio weights between different strategies or between strategies and benchmarks resulted in large differences in performance. Dollar-denominated asset class returns in developed non-US markets ranged from -20.4% for large cap growth stocks to -25.1% for small cap growth stocks. Using the MSCI World ex US indices (Net Dividends) as proxies, small caps (World ex US Small) underperformed large caps (World ex US Large) by 2.5% in the fourth quarter of 2008. Along the style dimension, deep value stocks underperformed relative to their growth counterparts and to the rest of the value universe. However, small cap value stocks (World ex US Small Cap Value) outperformed small cap growth stocks (World ex US Small Cap Growth) by 3.2% in the quarter, while large cap value stocks (World ex US Large Cap Value) underperformed large cap growth stocks (World ex US Large Cap Growth) by 1.4%.
The Portfolio’s smaller exposure than the Index to Scandinavia, which performed poorly relative to other developed markets, and other differences in allocation across regions had a positive impact on relative performance. Within the different regions, the Portfolio’s baskets of securities generally outperformed those of the Index, especially in the UK/Ireland. The Portfolio’s greater exposure than the Index to the smallest stocks in the small cap universe, including stocks that were too small to be included in the Index, and other differences in allocation across the market capitalization segments had a small negative impact on relative performance. On the other hand, differences in portfolio composition within the different market capitalization segments, especially among the larger stocks in the small cap universe, had a positive and stronger impact on the Portfolio’s performance relative to the Index. The Portfolio’s smaller exposure than the Index to the Energy sector, the worst-performing sector in the quarter, and other differences in allocation across industry sectors had a small positive impact on relative performance. Differences in composition within industries, especially in the Industrials sector, had a positive, and stronger, impact on relative performance as well.
* The views expressed above are those of the subadvisory firm as of December 31, 2008 and are subject to change based on market and other conditions. Information about the Portfolio’s holdings, asset allocation, industry allocation, or country diversification is historical and is not an indication of future Portfolio composition, which will vary. The performance of any index mentioned in this commentary has not been adjusted for ongoing management, distribution and operating expenses, and sales charges applicable to mutual fund investments. Direct investment in any index is not possible.
1 The MSCI World Ex-U.S.A. Small Cap Index is an unmanaged index that measures the performance of stocks with market capitalizations between US $7.3 million and $3.4 billion across 22 developed markets, excluding the United States. You cannot invest directly in this index.
MSF-2
Metropolitan Series Fund, Inc.
Met/Dimensional International Small Company Portfolio
A $10,000 INVESTMENT COMPARED TO THE MSCI WORLD (EX-U.S.) SMALL CAP INDEX
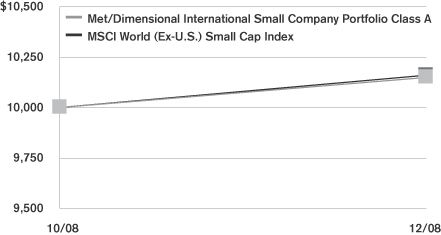
Returns as of December 31, 2008
| | | | | | | | | |
| | | Met/Dimensional International
Small Company Portfolio | | | MSCI World (Ex-U.S.)
Small Cap Index | |
| | | Class A | | | Class B | | |
| Since Inception | | 1.6 | % | | 1.6 | % | | 1.7 | % |
Performance numbers are net of all Portfolio expenses but do not include any insurance, sales, or administrative charges of variable annuity or life insurance contracts or any additional expenses that participants in certain eligible qualified plans may bear relating to the operations of their plans. If these charges were included, the returns would be lower.
Inception dates of the Class A and Class B shares are 10/31/08. Index since inception return is based on the Portfolio’s inception date. Returns shown are not computed on an annualized basis.
This information represents past performance and is not indicative of future results. Investment return and principal value may fluctuate so that shares, upon redemption, may be worth more or less than the original cost.
PORTFOLIO COMPOSITION
as of December 31, 2008
Top Holdings
| | |
| | | % of Total
Net Assets |
Baloise Holdings AG | | 0.8% |
GEA Group AG | | 0.6% |
Banca Popolare di Milano Scarl | | 0.5% |
Logitech International S.A. | | 0.5% |
Elisa Oyj | | 0.5% |
ITV, Plc. | | 0.5% |
Umicore S.A. | | 0.4% |
Bilfinger Berger AG | | 0.4% |
Hiscox, Ltd. | | 0.4% |
Kesko Oyj | | 0.4% |
Top Countries
| | |
| | | % of Equity
Market Value |
Japan | | 33.0% |
United Kingdom | | 14.6% |
Germany | | 6.4% |
Canada | | 6.1% |
Switzerland | | 6.1% |
France | | 5.5% |
Australia | | 4.3% |
Italy | | 3.7% |
Netherlands | | 2.8% |
Finland | | 2.7% |
MSF-3
Metropolitan Series Fund, Inc.
Shareholder Expense Example
As a shareholder of the Portfolio, you incur ongoing costs, including management fees; distribution and service (12b-1) fees; and other Portfolio expenses. This example is intended to help you understand your ongoing costs (in dollars) (referred to as “expenses”) of investing in the Portfolio and compare these costs with the ongoing costs of investing in other mutual funds. The example is based on an investment of $1,000 invested at the inception of the Portfolio and held for the entire period, October 31, 2008 through December 31, 2008.
Actual Expenses
The first line for each share class of the Portfolio in the table below provides information about actual account values and actual expenses. You may use the information in this line, together with the amount you invested in the particular share class of the Portfolio, to estimate the expenses that you paid over the period. Simply divide your account value by $1,000 (for example, an $8,600 account value divided by $1,000=8.6), then multiply the result by the number in the first line under the heading entitled “Expenses Paid During Period” to estimate the expenses you paid on your account during this period.
Hypothetical Example for Comparison Purposes
The second line for each share class of the Portfolio in the table below provides information about hypothetical account values and hypothetical expenses based on the Portfolio’s actual expense ratio and an assumed rate of return of 5% per year before expenses, which is not the Portfolio’s actual return. The hypothetical account values and expenses may not be used to estimate the actual ending account balance or expenses you paid for the period. You may use this information to compare the ongoing costs of investing in the Portfolio and other funds. To do so, compare this 5% hypothetical example with the 5% hypothetical examples that appear in the shareholder reports of the other funds.
Please note that the expenses shown in the table are meant to highlight your ongoing costs only and do not reflect any fees or charges of your variable insurance product or any additional expenses that participants in certain eligible qualified plans may bear relating to the operations of their plan. Therefore, the second line for each share class in the table is useful in comparing ongoing costs only, and will not help you determine the relative total costs of owning different funds. In addition, if these other costs were included, your costs would have been higher.
| | | | | | | | | | | | | | |
Portfolio | | | | Annualized
Expense
Ratio | | | Beginning
Account Value
October 31,
2008 | | Ending
Account Value
December 31,
2008 | | Expenses Paid
During Period*
October 31, 2008
to
December 31,
2008 |
Met/Dimensional International Small Company—Class A | | Actual | | 1.15 | % | | $ | 1,000.00 | | $ | 1,016.00 | | $ | 5.83 |
| | Hypothetical | | 1.15 | % | | $ | 1,000.00 | | $ | 1,019.29 | | $ | 5.84 |
| | | | | |
Met/Dimensional International Small Company—Class B | | Actual | | 1.40 | % | | $ | 1,000.00 | | $ | 1,016.00 | | $ | 7.09 |
| | Hypothetical | | 1.40 | % | | $ | 1,000.00 | | $ | 1,018.01 | | $ | 7.10 |
* Expenses paid are equal to the Portfolio’s annualized expense ratio for the period from inception, as shown above, multiplied by the average account value over the period, multiplied by the number of days since inception, divided by 366 (to reflect the period since inception).
MSF-4
Metropolitan Series Fund, Inc.
Met/Dimensional International Small Company Portfolio
Schedule of Investments as of December 31, 2008
Common Stock—98.8% of Total Net Assets
| | | | | |
| Security Description | | Shares | | Value* |
| | | | | |
| | |
Australia—4.1% | | | | | |
Acrux, Ltd. (a) | | 13,225 | | $ | 4,399 |
Adelaide Brighton, Ltd. | | 108,179 | | | 159,458 |
AED Oil, Ltd. (a) | | 61,261 | | | 44,957 |
Aevum, Ltd. | | 10,024 | | | 7,074 |
AJ Lucas Group, Ltd. | | 26,227 | | | 86,193 |
AlesCo.Corp, Ltd. | | 69,259 | | | 135,203 |
Alliance Resources, Ltd. (a) | | 71,570 | | | 20,165 |
Amalgamated Holdings, Ltd. | | 2,640 | | | 8,395 |
Andean Resources, Ltd. (a) | | 19,517 | | | 15,037 |
Apex Minerals NL (a) | | 167,652 | | | 50,576 |
APN News & Media, Ltd. | | 100,468 | | | 174,755 |
Aquila Resources, Ltd. (a) | | 115,649 | | | 274,863 |
Arana Therapeutics, Ltd. (a) | | 101,595 | | | 59,258 |
ARB Corp., Ltd. | | 19,111 | | | 38,125 |
Ausenco., Ltd. | | 24,714 | | | 38,022 |
Austar United Communications, Ltd. (a) | | 306,790 | | | 159,258 |
Austbrokers Holdings, Ltd. | | 3,413 | | | 9,000 |
Austereo Group, Ltd. | | 25,222 | | | 22,178 |
Australian Agricultural Co., Ltd. | | 103,470 | | | 135,920 |
Australian Pharmaceutical Industries, Ltd. | | 84,742 | | | 24,907 |
Australian Wealth Management, Ltd. | | 321,135 | | | 248,523 |
Australian Worldwide Exploration, Ltd. (a) | | 349,673 | | | 633,497 |
Avoca Resources, Ltd. (a) | | 88,015 | | | 101,937 |
AWB, Ltd. | | 257,567 | | | 459,472 |
Babcock & Brown Wind Partners | | 518,937 | | | 330,070 |
Blackmores, Ltd. | | 844 | | | 7,774 |
Cabcharge Australia, Ltd. | | 51,760 | | | 231,551 |
Campbell Brothers, Ltd. | | 21,502 | | | 265,353 |
Carnarvon Petroleum, Ltd. (a) | | 261,557 | | | 59,821 |
Cellestis, Ltd. (a) | | 11,202 | | | 13,717 |
Centamin Egypt, Ltd. (a) | | 2,375 | | | 1,549 |
Centennial Coal Co., Ltd. | | 209,270 | | | 489,631 |
Challenger Financial Services Group, Ltd. | | 282,888 | | | 388,221 |
Citadel Resource Group, Ltd. (a) | | 140,843 | | | 13,543 |
Clough, Ltd. | | 89,000 | | | 16,211 |
Corporate Express Australia, Ltd. | | 31,332 | | | 92,140 |
Count Financial, Ltd. | | 64,404 | | | 45,073 |
Crane Group, Ltd. | | 42,957 | | | 280,852 |
Cudeco, Ltd. (a) | | 51,210 | | | 65,195 |
Customers, Ltd. (a) | | 16,659 | | | 12,508 |
Deep Yellow, Ltd. (a) | | 170,978 | | | 13,837 |
Devine, Ltd. | | 31,760 | | | 12,771 |
Dominion Mining, Ltd. | | 35,671 | | | 89,722 |
Domino’s Pizza Enterprises, Ltd. | | 4,811 | | | 9,114 |
Eastern Star Gas, Ltd. (a) | | 322,414 | | | 131,031 |
Energy Developments, Ltd. | | 61,443 | | | 101,326 |
Entertainment Media & Telecoms Corp., Ltd. (a) | | 76,189 | | | 13,666 |
Envestra, Ltd. | | 298,799 | | | 76,259 |
Fantastic Holdings, Ltd. | | 250 | | | 318 |
FKP Property Group | | 142,410 | | | 50,478 |
Fleetwood Corp., Ltd. | | 36,664 | | | 93,835 |
Futuris Corp., Ltd. | | 360,798 | | | 163,370 |
Geodynamics, Ltd. (a) | | 53,609 | | | 42,185 |
GrainCorp., Ltd. | | 14,803 | | | 60,054 |
GUD Holdings, Ltd. | | 32,749 | | | 137,412 |
Gunns, Ltd. | | 449,171 | | | 362,454 |
GWA International, Ltd. | | 138,736 | | | 282,325 |
| | | | | |
| Security Description | | Shares | | Value* |
| | | | | |
| | |
Australia—(Continued) | | | | | |
Healthscope, Ltd. | | 109,450 | | $ | 339,281 |
Hills Industries, Ltd. | | 27,970 | | | 60,815 |
Horizon Oil, Ltd. | | 168,963 | | | 15,443 |
IBA Health Group, Ltd. | | 285,608 | | | 123,193 |
iiNET, Ltd. | | 8,220 | | | 6,972 |
Industrea, Ltd. | | 339,366 | | | 43,105 |
Infomedia, Ltd. | | 27,603 | | | 5,541 |
Invocare, Ltd. | | 60,720 | | | 219,022 |
IOOF Holdings, Ltd. | | 12,815 | | | 34,184 |
Iress Market Technology, Ltd. | | 51,660 | | | 186,832 |
JB Hi-Fi, Ltd. | | 61,610 | | | 419,409 |
Karoon Gas Australia, Ltd. (a) | | 46,666 | | | 119,468 |
Linc Energy, Ltd. (a) | | 185,849 | | | 261,424 |
MAC Services Group | | 62,712 | | | 36,431 |
MacArthur Coal, Ltd. | | 75,041 | | | 160,408 |
Macmahon Holdings, Ltd. | | 363,435 | | | 97,157 |
Macquarie Media Group, Ltd. | | 88,418 | | | 61,600 |
McMillan Shakespeare, Ltd. | | 4,491 | | | 5,876 |
Melbourne IT, Ltd. | | 21,114 | | | 27,759 |
Mermaid Marine Australia, Ltd. | | 78,298 | | | 58,578 |
Mineral Resources, Ltd. | | 53,299 | | | 82,273 |
Monadelphous Group, Ltd. | | 27,997 | | | 132,396 |
Mortgage Choice, Ltd. | | 27,374 | | | 14,539 |
MYOB, Ltd. | | 94,717 | | | 73,318 |
Navitas, Ltd. | | 125,279 | | | 210,231 |
Nexus Energy, Ltd. (a) | | 303,061 | | | 113,541 |
Nido Petroleum, Ltd. (a) | | 455,291 | | | 29,849 |
Oakton, Ltd. | | 32,057 | | | 28,426 |
Pacific Brands, Ltd. | | 421,998 | | | 127,299 |
PanAust, Ltd. (a) | | 674,969 | | | 66,687 |
PaperlinX, Ltd. | | 340,846 | | | 170,485 |
Peet, Ltd. | | 8,464 | | | 9,205 |
Pharmaxis, Ltd. (a) | | 90,115 | | | 76,374 |
Photon Group, Ltd. | | 28,817 | | | 26,193 |
Prime Media Group, Ltd. | | 459 | | | 428 |
Pure Energy Resources, Ltd. (a) | | 20,739 | | | 77,553 |
Realestate.com.au, Ltd. (a) | | 9,362 | | | 23,939 |
Reckon, Ltd. | | 1,250 | | | 917 |
Redflex Holdings, Ltd. | | 4,736 | | | 10,659 |
Reverse Corp., Ltd. | | 4,030 | | | 3,102 |
Ridley Corp., Ltd. | | 17,845 | | | 10,008 |
S.A.I. Global, Ltd. | | 59,394 | | | 97,718 |
Salmat, Ltd. | | 36,428 | | | 82,253 |
Sedgman, Ltd. | | 31,139 | | | 12,430 |
Seek, Ltd. | | 92,860 | | | 206,126 |
Select Harvests, Ltd. | | 613 | | | 1,244 |
Servcorp, Ltd. | | 500 | | | 1,005 |
Seven Network, Ltd. | | 103,291 | | | 513,810 |
Sigma Pharmaceuticals, Ltd. | | 599,674 | | | 460,458 |
Silex Systems, Ltd. (a) | | 34,936 | | | 71,618 |
Sino Gold Mining, Ltd. (a) | | 149,849 | | | 525,086 |
SMS Management & Technology, Ltd. | | 27,181 | | | 34,060 |
Spotless Group, Ltd. | | 124,612 | | | 246,116 |
St. Barbara, Ltd. (a) | | 577,055 | | | 127,864 |
Sunland Group, Ltd. | | 119,382 | | | 62,513 |
Super Cheap Auto Group, Ltd. | | 5,683 | | | 10,648 |
Tap Oil, Ltd. | | 38,500 | | | 20,641 |
*See accompanying notes to financial statements.
MSF-5
Metropolitan Series Fund, Inc.
Met/Dimensional International Small Company Portfolio
Schedule of Investments as of December 31, 2008
Common Stock—(Continued)
| | | | | |
| Security Description | | Shares | | Value* |
| | | | | |
| | |
Australia—(Continued) | | | | | |
Tassal Group, Ltd. | | 58,122 | | $ | 82,551 |
Technology One, Ltd. | | 31,491 | | | 17,524 |
Ten Network Holdings, Ltd. | | 56,093 | | | 45,974 |
Thakral Holdings Group (REIT) | | 143,461 | | | 42,416 |
The Reject Shop, Ltd. | | 12,719 | | | 89,352 |
Timbercorp, Ltd. | | 175,921 | | | 15,429 |
Tower Australia Group, Ltd. | | 150,120 | | | 267,471 |
Tox Free Solutions, Ltd. (a) | | 3,740 | | | 3,006 |
Transfield Services Infrastructure Fund | | 78,626 | | | 62,785 |
Transfield Services, Ltd. | | 93,084 | | | 119,091 |
Transpacific Industries Group, Ltd. | | 110,525 | | | 253,315 |
UXC, Ltd. | | 42,310 | | | 14,960 |
WDS, Ltd. | | 44,893 | | | 21,347 |
Western Areas NL | | 38,309 | | | 89,132 |
White Energy Co., Ltd. (a) | | 24,864 | | | 34,728 |
Whitehaven Coal, Ltd. | | 67,049 | | | 67,504 |
WHK Group, Ltd. | | 45,615 | | | 28,359 |
Wide Bay Australia, Ltd. | | 4,474 | | | 22,187 |
Wotif.com Holdings, Ltd. | | 56,700 | | | 147,959 |
| | | | | |
| | | | | 14,333,138 |
| | | | | |
| | |
Austria—1.4% | | | | | |
A-TEC Industries AG | | 1,749 | | | 16,436 |
Agrana Beteiligungs AG | | 1,493 | | | 77,019 |
Andritz AG | | 17,975 | | | 459,439 |
Austrian Airlines AG (a) | | 29,181 | | | 163,489 |
bwin Interactive Entertainment AG (a) | | 12,484 | | | 232,987 |
BWT AG | | 1,528 | | | 23,596 |
Constantia Packaging AG | | 834 | | | 25,875 |
EVN AG | | 14,942 | | | 231,172 |
Flughafen Wien AG | | 6,704 | | | 299,754 |
Intercell AG (a) | | 15,606 | | | 478,490 |
Lenzing AG | | 164 | | | 38,170 |
Mayr Melnhof Karton AG | | 5,541 | | | 391,892 |
Oberbank AG | | 164 | | | 10,091 |
Oesterreichische Post AG | | 25,181 | | | 845,679 |
Palfinger AG | | 6,603 | | | 105,365 |
RHI AG (a) | | 11,236 | | | 177,878 |
Rosenbauer International AG | | 555 | | | 17,187 |
Schoeller-Bleckmann Oilfield Equipment AG | | 4,650 | | | 144,159 |
Wienerberger AG | | 55,587 | | | 928,307 |
Wolford AG | | 856 | | | 14,451 |
Zumtobel AG | | 19,980 | | | 156,971 |
| | | | | |
| | | | | 4,838,407 |
| | | | | |
| | |
Belgium—1.4% | | | | | |
Ackermans & van Haaren NV | | 10,960 | | | 560,474 |
AGFA-Gevaert NV | | 84,703 | | | 221,231 |
Banque Nationale de Belgique | | 55 | | | 188,590 |
Bekaert S.A. | | 7,259 | | | 490,797 |
Compagnie d’Entreprises CFE | | 3,390 | | | 138,751 |
Compagnie Immobiliere de Belgique S.A. | | 623 | | | 13,036 |
Deceuninck NV | | 4,353 | | | 16,020 |
Econocom Group | | 3,742 | | | 33,552 |
Elia System Operator S.A. | | 1,534 | | | 52,480 |
Euronav NV | | 13,893 | | | 190,623 |
| | | | | |
| Security Description | | Shares | | Value* |
| | | | | |
| | |
Belgium—(Continued) | | | | | |
EVS Broadcast Equipment S.A. | | 4,586 | | $ | 163,504 |
Exmar NV | | 1,750 | | | 17,578 |
IRIS | | 560 | | | 28,293 |
Kinepolis | | 1,629 | | | 37,367 |
Melexis NV | | 5,734 | | | 40,024 |
Omega Pharma S.A. | | 9,000 | | | 340,008 |
RealDolmen Str VV | | 7,042 | | | 1,471 |
Recticel S.A. | | 2,600 | | | 14,768 |
Sipef S.A. | | 1,740 | | | 45,205 |
Telenet Group Holding NV (a) | | 31,400 | | | 539,505 |
Umicore S.A. | | 79,282 | | | 1,564,358 |
Van de Velde | | 2,138 | | | 71,510 |
| | | | | |
| | | | | 4,769,145 |
| | | | | |
| | |
Bermuda—1.3% | | | | | |
BW GAS, Ltd. (NOK) (a) | | 24,037 | | | 37,268 |
BW Offshore, Ltd. (NOK) (a) | | 37,000 | | | 22,976 |
C C Land Holdings, Ltd. (HKD) | | 821,000 | | | 208,761 |
Catlin Group, Ltd. (GBP) | | 214,309 | | | 1,340,987 |
Chevalier International Holdings, Ltd. (HKD) | | 2,000 | | | 1,046 |
China WindPower Group, Ltd. (HKD) (a) | | 1,800,000 | | | 48,327 |
Chow Sang Sang Holding (HKD) | | 108,000 | | | 56,063 |
Coslight Technology International (HKD) | | 112,000 | | | 49,298 |
Fong’s Industries Co., Ltd. (HKD) | | 2,000 | | | 323 |
Giordano International, Ltd. (HKD) | | 798,000 | | | 201,748 |
Glorious Sun Enterprises, Ltd. (HKD) | | 134,000 | | | 33,816 |
Great Eagle Holdings, Ltd. (HKD) | | 206,000 | | | 230,319 |
Hi Sun Technology China, Ltd. (HKD) (a) | | 276,000 | | | 24,511 |
Hiscox, Ltd. (GBP) | | 285,011 | | | 1,399,420 |
Hongkong Chinese, Ltd. (HKD) | | 204,000 | | | 18,871 |
Huscoke Resources Holdings, Ltd. (HKD) (a) | | 50,000 | | | 3,688 |
Hutchison Harbour Ring, Ltd. (HKD) | | 2,020,000 | | | 141,127 |
Integrated Distribution Services Group (HKD) | | 55,000 | | | 60,658 |
Johnson Electric Holdings, Ltd. (HKD) | | 356,000 | | | 60,380 |
K Wah International Holdings, Ltd. (HKD) | | 624,000 | | | 101,978 |
Luk Fook Holdings International, Ltd. (HKD) | | 82,000 | | | 21,498 |
Midland Holdings, Ltd. (HKD) | | 306,000 | | | 109,993 |
Pacific Century Premium Development, Ltd. (HKD) | | 40,000 | | | 9,119 |
Public Financial Holdings, Ltd. (HKD) | | 166,000 | | | 62,361 |
Road King Infrastructure (HKD) | | 176,000 | | | 65,990 |
Shanghai Zendai Property, Ltd. (HKD) (a) | | 510,000 | | | 7,666 |
SmarTone Telecommunications Holding, Ltd. (HKD) | | 134,500 | | | 100,150 |
TAI Cheung Holdings (HKD) | | 250,000 | | | 94,011 |
Texwinca Holdings, Ltd. (HKD) | | 294,000 | | | 125,712 |
Victory City International Holdings (HKD) | | 50,000 | | | 3,294 |
| | | | | |
| | | | | 4,641,359 |
| | | | | |
| | |
Canada—6.0% | | | | | |
Aastra Technologies, Ltd. (a) | | 8,200 | | | 78,978 |
Absolute Software Corp. (a) | | 19,254 | | | 51,625 |
Aecon Group, Inc. | | 30,500 | | | 271,770 |
AGF Management, Ltd. | | 46,400 | | | 357,068 |
Akita Drilling, Ltd. | | 2,003 | | | 10,303 |
Alamos Gold, Inc. | | 5,700 | | | 40,401 |
Altius Minerals Corp. | | 7,200 | | | 26,945 |
Anderson Energy, Ltd. (a) | | 13,693 | | | 12,756 |
*See accompanying notes to financial statements.
MSF-6
Metropolitan Series Fund, Inc.
Met/Dimensional International Small Company Portfolio
Schedule of Investments as of December 31, 2008
Common Stock—(Continued)
| | | | | |
| Security Description | | Shares | | Value* |
| | | | | |
| | |
Canada—(Continued) | | | | | |
Andrew Peller, Ltd. | | 300 | | $ | 1,762 |
Antrim Energy, Inc. (a) | | 81,000 | | | 28,542 |
Anvil Mining, Ltd. | | 18,700 | | | 16,360 |
Aquiline Resources, Inc. | | 1,300 | | | 1,822 |
Atrium Innovations, Inc. | | 15,700 | | | 164,313 |
ATS Automation Tooling Systems, Inc. | | 7,300 | | | 29,567 |
Augusta Resource Corp. (a) | | 30,800 | | | 13,473 |
Aurizon Mines, Ltd. | | 1,200 | | | 3,878 |
Aurora Energy Resources, Inc. (a) | | 3,200 | | | 4,666 |
Axia NetMedia Corp. (a) | | 16,400 | | | 23,248 |
Ballard Power Systems, Inc. (a) | | 57,149 | | | 62,033 |
Bankers Petroleum, Ltd. (a) | | 96,200 | | | 57,665 |
Bioms Medical Corp. (a) | | 11,443 | | | 32,443 |
BioteQ Environmental Tech, Inc. (a) | | 800 | | | 253 |
Birchcliff Energy, Ltd. | | 52,400 | | | 214,354 |
BMTC Group, Inc. | | 700 | | | 9,929 |
Boralex, Inc. (a) | | 2,889 | | | 17,669 |
Breaker Energy, Ltd. (a) | | 8,464 | | | 34,967 |
Calfrac Well Services, Ltd. | | 10,400 | | | 73,293 |
Calvalley Petroleums, Inc. (a) | | 17,253 | | | 18,867 |
Canaccord Capital, Inc. | | 27,230 | | | 89,112 |
Canada Bread Co., Ltd. | | 100 | | | 3,755 |
Canadian Hydro Developers, Inc. (a) | | 71,200 | | | 171,872 |
Canadian Superior Energy, Inc. (a) | | 38,649 | | | 37,569 |
Canadian Western Bank | | 30,200 | | | 302,856 |
Canam Group, Inc. | | 12,798 | | | 68,940 |
Canfor Corp. (a) | | 62,500 | | | 384,771 |
Cangene Corp. (a) | | 5,569 | | | 26,616 |
Capstone Mining Corp. (a) | | 26,700 | | | 19,682 |
Cardiome Pharma Corp. (a) | | 28,600 | | | 129,505 |
Cascades, Inc. | | 13,500 | | | 37,618 |
Catalyst Paper Corp. | | 2,500 | | | 608 |
CCL Industries | | 4,000 | | | 81,004 |
CE Franklin, Ltd. (a) | | 1,700 | | | 6,066 |
Celtic Exploration, Ltd. | | 12,900 | | | 131,769 |
Clairvest Group, Inc. | | 200 | | | 2,106 |
Coalcorp Mining, Inc. (a) | | 17,000 | | | 2,685 |
COM DEV International, Ltd. (a) | | 24,331 | | | 62,281 |
Comaplex Minerals Corp. | | 3,200 | | | 8,010 |
Compton Petroleum Corp. (a) | | 54,500 | | | 41,057 |
Computer Modelling Group, Ltd. | | 5,000 | | | 27,744 |
Connacher Oil & Gas, Ltd. (a) | | 126,000 | | | 75,529 |
Constellation Software, Inc. | | 313 | | | 6,529 |
Corby Distilleries, Ltd. | | 641 | | | 7,975 |
Corridor Resources, Inc. (a) | | 31,992 | | | 57,531 |
Corus Entertainment, Inc. (a) | | 45,500 | | | 514,893 |
Cott Corp. (a) | | 27,052 | | | 33,746 |
Crew Energy, Inc. | | 37,600 | | | 161,426 |
Crystallex International Corp. | | 2,000 | | | 308 |
Dalsa Corp. | | 4,390 | | | 24,893 |
Delphi Energy Corp. | | 1,100 | | | 882 |
Denison Mines Corp. (a) | | 107,800 | | | 127,491 |
Dorel Industries, Inc. | | 18,000 | | | 408,262 |
Dundee Precious Metals, Inc. | | 1,500 | | | 1,810 |
Eastern Platinum, Ltd. (a) | | 117,500 | | | 31,885 |
easyhome, Ltd. | | 1,900 | | | 14,621 |
EGI Financial Holdings, Inc. | | 900 | | | 4,921 |
| | | | | |
| Security Description | | Shares | | Value* |
| | | | | |
| | |
Canada—(Continued) | | | | | |
Enghouse Systems, Ltd. | | 1,309 | | $ | 4,666 |
Equinox Minerals, Inc. | | 29,600 | | | 32,609 |
Equitable Group, Inc. | | 5,801 | | | 55,214 |
Etruscan Resources, Inc. | | 3,000 | | | 1,264 |
Evertz Technologies, Ltd. | | 9,079 | | | 101,123 |
Exco Technologies, Ltd. | | 4,100 | | | 3,753 |
Exfo Electro Optical Engineering, Inc. (a) | | 1,263 | | | 3,980 |
Fairborne Energy, Ltd. | | 29,900 | | | 141,689 |
FirstService Corp. (a) | | 10,500 | | | 136,002 |
Flint Energy Services, Ltd. (a) | | 21,500 | | | 122,608 |
Galleon Energy, Inc. | | 41,400 | | | 171,033 |
Gennum Corp. | | 5,450 | | | 16,335 |
Glacier Media, Inc. (a) | | 9,600 | | | 16,719 |
Glentel, Inc. | | 1,465 | | | 8,900 |
Gluskin Sheff & Associates, Inc. | | 3,985 | | | 23,726 |
Grande Cache Coal Corp. (a) | | 38,400 | | | 26,751 |
Great Basin Gold, Ltd. (a) | | 96,700 | | | 122,980 |
Great Canadian Gaming Corp. (a) | | 44,800 | | | 131,007 |
Hanfeng Evergreen, Inc. (a) | | 20,000 | | | 91,211 |
Harry Winston Diamond Corp. | | 26,500 | | | 120,640 |
Hemisphere GPS, Inc. (a) | | 26,200 | | | 29,712 |
Heroux-Devtek, Inc. (a) | | 15,800 | | | 35,708 |
Highpine Oil & Gas, Ltd. (a) | | 34,500 | | | 146,719 |
Home Capital Group, Inc. | | 15,600 | | | 250,207 |
HudBay Minerals, Inc. (a) | | 115,200 | | | 285,550 |
IAMGOLD Corp. | | 192,600 | | | 1,185,711 |
Imax Corp. (a) | | 6,740 | | | 30,083 |
Inmet Mining Corp. | | 28,900 | | | 458,373 |
Intermap Technologies Corp. (a) | | 10,468 | | | 16,196 |
International Forest Products, Ltd. | | 5,500 | | | 7,574 |
International Royalty Corp. | | 2,000 | | | 2,722 |
Intertape Polymer Group, Inc. | | 1,800 | | | 1,589 |
Iteration Energy, Ltd. (a) | | 84,100 | | | 93,331 |
Ivanhoe Energy, Inc. (a) | | 47,689 | | | 22,405 |
Ivanhoe Mines, Ltd. (a) | | 129,100 | | | 341,966 |
Kaboose, Inc. (a) | | 5,500 | | | 1,559 |
Kingsway Financial Services, Inc. | | 32,000 | | | 166,934 |
Kirkland Lake Gold, Inc. | | 100 | | | 360 |
Lake Shore Gold Corp. | | 2,000 | | | 2,301 |
Laurentian Bank of Canada | | 12,800 | | | 357,716 |
Le Chateau, Inc. | | 1,102 | | | 6,650 |
Leon’s Furniture, Ltd. | | 5,766 | | | 42,036 |
Linamar Corp. | | 30,800 | | | 92,313 |
Logibec Groupe Informatique, Ltd. (a) | | 3,700 | | | 40,312 |
MacDonald Dettwiler & Associates, Ltd. (a) | | 18,500 | | | 326,691 |
Major Drilling Group International | | 12,900 | | | 130,620 |
Maple Leaf Foods, Inc. | | 33,500 | | | 300,401 |
Martinrea International, Inc. (a) | | 19,700 | | | 36,065 |
Maxim Power Corp. (a) | | 1,800 | | | 3,499 |
MDC Partners, Inc. | | 1,800 | | | 5,541 |
MDS, Inc. | | 31,400 | | | 192,037 |
Mega Uranium, Ltd. (a) | | 92,800 | | | 57,883 |
Methanex Corp. | | 62,400 | | | 692,491 |
Migao Corp. (a) | | 21,800 | | | 100,656 |
Miranda Technologies, Inc. (a) | | 9,673 | | | 51,950 |
Mosaid Technologies, Inc. | | 3,690 | | | 25,407 |
Neo Material Technologies, Inc. (a) | | 50,900 | | | 52,364 |
*See accompanying notes to financial statements.
MSF-7
Metropolitan Series Fund, Inc.
Met/Dimensional International Small Company Portfolio
Schedule of Investments as of December 31, 2008
Common Stock—(Continued)
| | | | | |
| Security Description | | Shares | | Value* |
| | | | | |
| | |
Canada—(Continued) | | | | | |
Norbord, Inc. | | 48,400 | | $ | 27,444 |
North American Palladium, Ltd. | | 10,400 | | | 18,618 |
Nova Chemicals Corp. | | 47,400 | | | 224,617 |
NuVista Energy, Ltd. (a) | | 41,500 | | | 290,113 |
Oilexco, Inc. (a) | | 115,200 | | | 26,595 |
OPTI Canada, Inc. | | 49,200 | | | 71,738 |
Paladin Labs, Inc. (a) | | 1,098 | | | 10,602 |
PAN American Silver Corp. (a) | | 40,600 | | | 690,973 |
Paramount Resources, Ltd. | | 18,900 | | | 105,179 |
Parkbridge Lifestyles Communities, Inc. (a) | | 2,527 | | | 5,424 |
Pason Systems, Inc. | | 21,400 | | | 243,556 |
Patheon, Inc. (a) | | 22,085 | | | 39,536 |
Petrolifera Petroleum, Ltd. (a) | | 13,385 | | | 11,385 |
Platinum Group Metals, Ltd. | | 8,100 | | | 12,204 |
Points International, Ltd. | | 2,000 | | | 721 |
ProEx Energy, Ltd. (a) | | 28,500 | | | 258,566 |
Pulse Data, Inc. | | 7,964 | | | 9,483 |
QLT, Inc. (a) | | 26,200 | | | 61,972 |
Quadra Mining, Ltd. | | 20,400 | | | 46,104 |
Quebecor, Inc. | | 22,800 | | | 362,547 |
Quest Capital Corp. | | 36,768 | | | 25,614 |
Questerre Energy Corp. (a) | | 63,900 | | | 104,559 |
Reitmans Canada, Ltd. | | 31,000 | | | 292,548 |
Richelieu Hardware, Ltd. | | 1,900 | | | 26,903 |
Samuel Manu-Tech, Inc. | | 100 | | | 486 |
Savanna Energy Services Corp. | | 35,500 | | | 230,053 |
Sceptre Investment Counsel, Ltd. | | 1,403 | | | 6,080 |
SEMAFO, Inc. (a) | | 31,000 | | | 30,134 |
ShawCor, Ltd. | | 12,500 | | | 186,411 |
Sherritt International Corp. | | 213,000 | | | 545,225 |
Shore Gold, Inc. | | 28,000 | | | 10,207 |
Sierra Wireless, Inc. (a) | | 17,600 | | | 100,795 |
Silver Standard Resources, Inc. (a) | | 33,900 | | | 534,107 |
Silvercorp Metals, Inc. | | 66,200 | | | 139,961 |
Softchoice Corp. (a) | | 5,900 | | | 11,518 |
Stantec, Inc. (a) | | 22,400 | | | 547,072 |
Stella-Jones, Inc. | | 1,000 | | | 13,285 |
Storm Exploration, Inc. (a) | | 8,054 | | | 90,163 |
SunOpta, Inc. (a) | | 24,071 | | | 37,632 |
SXC Health Solutions Corp. (a) | | 8,632 | | | 159,005 |
Tanzanian Royalty Exploration Corp. | | 15,000 | | | 63,791 |
The Cash Store Financial Services, Inc. | | 3,238 | | | 14,098 |
The Churchill Corp. (a) | | 9,000 | | | 52,418 |
The Descartes Systems Group, Inc. (a) | | 19,100 | | | 55,080 |
The Forzani Group, Ltd. | | 11,600 | | | 67,467 |
Theratechnologies, Inc. (a) | | 18,794 | | | 30,448 |
Thompson Creek Metals Co., Inc. (a) | | 82,900 | | | 329,048 |
Timminco, Ltd. | | 45,700 | | | 130,677 |
Torstar Corp. | | 21,500 | | | 145,772 |
Transcontinental, Inc. | | 42,400 | | | 341,742 |
Transglobe Energy Corp. (a) | | 18,755 | | | 44,514 |
Transition Therapeutics, Inc. | | 800 | | | 3,072 |
Trican Well Service, Ltd. | | 64,600 | | | 416,538 |
Trinidad Drilling, Ltd. | | 41,100 | | | 148,819 |
TriStar Oil & Gas, Ltd. (a) | | 65,500 | | | 623,431 |
TUSK Energy Corp. (a) | | 41,679 | | | 31,061 |
Uex Corp. (a) | | 80,900 | | | 43,251 |
| | | | | |
| Security Description | | Shares | | Value* |
| | | | | |
| | |
Canada—(Continued) | | | | | |
Uni-Select, Inc. | | 1,024 | | $ | 19,020 |
Uranium One, Inc. (a) | | 279,600 | | | 405,414 |
UTS Energy Corp. (a) | | 283,100 | | | 183,459 |
Vecima Networks, Inc. (a) | | 2,500 | | | 13,771 |
Vector Aerospace Corp. | | 400 | | | 1,060 |
Verenex Energy, Inc. (a) | | 10,029 | | | 55,649 |
Vero Energy, Inc. (a) | | 12,500 | | | 55,083 |
Virginia Mines, Inc. (a) | | 2,335 | | | 7,566 |
Webtech Wireless, Inc. | | 1,800 | | | 1,385 |
West Energy, Ltd. (a) | | 21,947 | | | 33,067 |
West Fraser Timber Co., Ltd. | | 13,000 | | | 334,872 |
Western Financial Group, Inc. | | 13,359 | | | 19,587 |
Westport Innovations, Inc. (a) | | 13,195 | | | 66,803 |
Wi-Lan, Inc. (a) | | 38,724 | | | 50,189 |
Winpak, Ltd. | | 2,900 | | | 17,407 |
Xtreme Coil Drilling Corp. (a) | | 5,600 | | | 6,986 |
ZCL Composites, Inc. | | 6,881 | | | 25,473 |
| | | | | |
| | | | | 21,140,273 |
| | | | | |
| | |
Cayman Islands—0.3% | | | | | |
China Metal International Holdings, Inc. (HKD) | | 258,000 | | | 29,036 |
Daphne International Holdings, Ltd. (HKD) | | 516,000 | | | 84,408 |
Far East Consortium (HKD) | | 609,000 | | | 83,769 |
HKR International, Ltd. (HKD) | | 488,000 | | | 106,976 |
Lee & Man Paper Manufacturing, Ltd. (HKD) | | 389,600 | | | 192,911 |
New World China Land, Ltd. (HKD) | | 853,600 | | | 261,995 |
Norstar Founders Group, Ltd. (HKD) | | 120,000 | | | 14,761 |
Sa Sa International Holdings, Ltd. (HKD) | | 260,000 | | | 65,005 |
The Ming An Holdings Co., Ltd. (HKD) | | 312,000 | | | 31,567 |
Truly International Holdings (HKD) | | 84,000 | | | 45,055 |
Xinyi Glass Holdings Co., Ltd. (HKD) | | 426,000 | | | 115,183 |
Yip’s Chemical Holdings, Ltd. (HKD) | | 116,000 | | | 31,431 |
| | | | | |
| | | | | 1,062,097 |
| | | | | |
| | |
Cyprus—0.1% | | | | | |
Prosafe Production Public, Ltd. (NOK) (a) | | 137,500 | | | 220,239 |
| | | | | |
| | |
Denmark—0.6% | | | | | |
Alm Brand A/S (a) | | 6,225 | | | 81,199 |
Amagerbanken A/S | | 8,900 | | | 33,221 |
Auriga Industries | | 11,400 | | | 196,638 |
Bang & Olufsen A/S | | 5,400 | | | 60,824 |
Bavarian Nordic A/S (a) | | 2,907 | | | 73,231 |
BoConcept Holding A/S | | 228 | | | 4,229 |
Capinordic AS (a) | | 51,241 | | | 29,111 |
Dalhoff, Larsen & Horneman A/S | | 4,113 | | | 20,368 |
East Asiatic Co., Ltd. A/S | | 2,971 | | | 100,991 |
Fionia Bank A/S | | 6,891 | | | 27,483 |
GN Store Nord | | 150,500 | | | 293,797 |
Harboes Bryggeri A/S | | 1,454 | | | 26,343 |
IC Companys A/S | | 4,584 | | | 36,480 |
NeuroSearch A/S | | 5,847 | | | 151,275 |
Parken Sport & Entertainment A/S | | 218 | | | 16,542 |
PER Aarsleff A/S | | 822 | | | 56,105 |
Ringkjoebing Landbobank A/S | | 850 | | | 50,205 |
Royal UNIBREW A/S | | 507 | | | 11,376 |
*See accompanying notes to financial statements.
MSF-8
Metropolitan Series Fund, Inc.
Met/Dimensional International Small Company Portfolio
Schedule of Investments as of December 31, 2008
Common Stock—(Continued)
| | | | | |
| Security Description | | Shares | | Value* |
| | | | | |
| | |
Denmark—(Continued) | | | | | |
Satair A/S | | 933 | | $ | 19,713 |
Schouw & Co. | | 7,163 | | | 109,139 |
SimCorp A/S | | 2,760 | | | 311,845 |
Solar Holdings A/S | | 1,561 | | | 57,673 |
Spar Nord Bank A/S | | 6,292 | | | 50,993 |
Thrane & Thrane A/S | | 1,621 | | | 47,634 |
TK Development (a) | | 17,200 | | | 66,471 |
TopoTarget A/S | | 24,670 | | | 17,053 |
Vestjysk Bank A/S | | 3,112 | | | 26,819 |
| | | | | |
| | | | | 1,976,758 |
| | | | | |
| | |
Finland—2.6% | | | | | |
Alma Media | | 28,417 | | | 196,171 |
Amer Sports Oyj | | 7,654 | | | 57,768 |
Aspo Oyj | | 6,767 | | | 38,110 |
Atria, Plc. | | 2,465 | | | 40,109 |
BasWare Oyj | | 2,480 | | | 22,838 |
Comptel, Plc. | | 40,187 | | | 38,862 |
Elcoteq SE | | 17,212 | | | 29,242 |
Elisa Oyj | | 96,558 | | | 1,671,357 |
F-Secure Oyj | | 51,681 | | | 136,146 |
Finnlines Oyj | | 8,374 | | | 75,365 |
Fiskars Oyj | | 14,230 | | | 138,839 |
HKScan Oyj | | 7,897 | | | 48,893 |
Ilkka-Yhtyma Oyj | | 1,544 | | | 15,485 |
Kesko Oyj | | 54,055 | | | 1,354,620 |
Lemminkainen Oyj | | 2,897 | | | 52,584 |
Olvi Oyj | | 3,420 | | | 74,484 |
Oriola-KD Oyj | | 43,612 | | | 79,760 |
Orion Oyj (Series A) | | 13,393 | | | 226,195 |
Orion Oyj (Series B) | | 61,106 | | | 1,034,463 |
Outokumpu Oyj | | 17,621 | | | 207,050 |
PKC Group Oyj | | 12,102 | | | 55,033 |
Pohjola Bank, Plc. | | 83,114 | | | 1,151,038 |
Poyry Oyj | | 21,608 | | | 238,534 |
Raisio, Plc. | | 52,300 | | | 107,680 |
Ramirent Oyj | | 63,927 | | | 292,507 |
Rapala VMC Oyj | | 7,700 | | | 37,682 |
Rautaruukki Oyj | | 12,570 | | | 216,634 |
Ruukki Group Oyj | | 134,022 | | | 215,196 |
Sanoma Oyj | | 7,185 | | | 93,211 |
Scanfil Oyj | | 10,528 | | | 29,910 |
Talentum Oyj | | 17,316 | | | 45,148 |
Tecnomen Oyj (a) | | 46,505 | | | 54,716 |
Tietoenator Oyj | | 45,067 | | | 491,398 |
Uponor Oyj | | 28,470 | | | 308,882 |
Vaisala Oyj | | 3,399 | | | 105,333 |
Wartsila Oyj | | 11,156 | | | 331,971 |
| | | | | |
| | | | | 9,313,214 |
| | | | | |
| | |
France—5.5% | | | | | |
Alten, Ltd. (a) | | 8,989 | | | 191,246 |
Altran Technologies S.A. (a) | | 59,861 | | | 228,078 |
April Group | | 5,915 | | | 149,294 |
Assystem | | 9,046 | | | 70,364 |
Atos Origin S.A. | | 9,623 | | | 241,524 |
| | | | | |
| Security Description | | Shares | | Value* |
| | | | | |
| | |
France—(Continued) | | | | | |
Audika | | 2,239 | | $ | 49,325 |
Beneteau S.A. | | 21,876 | | | 206,974 |
Boiron S.A. | | 3,639 | | | 87,751 |
Bonduelle S.C.A. | | 1,948 | | | 159,523 |
Bongrain S.A. | | 1,234 | | | 82,088 |
Bourbon S.A. | | 15,850 | | | 401,245 |
Bull S.A. (a) | | 38,888 | | | 62,568 |
Canal Plus | | 35,005 | | | 201,517 |
Carbone Lorraine | | 9,076 | | | 226,536 |
Cegedim S.A. | | 575 | | | 28,398 |
Cegid Group | | 1,784 | | | 19,708 |
Cie Generale de Geophysique-Veritas (a) | | 79,946 | | | 1,193,766 |
Ciments Francais S.A. | | 6,230 | | | 525,696 |
Club Mediterranee (a) | | 10,058 | | | 168,839 |
Delachaux S.A. | | 1,552 | | | 95,869 |
Derichebourg | | 85,897 | | | 194,795 |
EDF Energies Nouvelles S.A. | | 11,670 | | | 412,966 |
Electricite de Strasbourg | | 88 | | | 10,270 |
Entrepose Contracting | | 219 | | | 12,026 |
Etablissements Maurel et Prom | | 56,627 | | | 649,583 |
Euler Hermes S.A. | | 9,804 | | | 480,181 |
Euro Disney S.C.A. (a) | | 12,177 | | | 61,265 |
Fimalac | | 5,514 | | | 171,991 |
Fleury Michon S.A. | | 55 | | | 1,913 |
GFI Informatique | | 25,757 | | | 92,484 |
GIFI | | 328 | | | 15,960 |
GL Events | | 3,491 | | | 63,157 |
Groupe Eurotunnel S.A. | | 80,399 | | | 433,862 |
Groupe Steria S.C.A. | | 17,405 | | | 194,735 |
Guerbet | | 570 | | | 85,187 |
Guyenne et Gascogne S.A. | | 1,147 | | | 98,250 |
IMS-International Metal Service | | 9,743 | | | 125,817 |
Infogrames Entertainment S.A. (a) | | 8,773 | | | 49,663 |
Ingenico | | 15,941 | | | 248,384 |
Inter Parfums S.A. | | 234 | | | 5,881 |
IPSOS | | 13,758 | | | 370,190 |
Kaufman & Broad S.A. | | 2,689 | | | 29,849 |
Korian | | 1,552 | | | 39,832 |
Laurent-Perrier | | 1,269 | | | 104,256 |
Lectra | | 6,736 | | | 30,434 |
LISI | | 2,049 | | | 70,165 |
LVL Medical Groupe S.A. (a) | | 3,308 | | | 40,021 |
M6-Metropole Television | | 39,087 | | | 756,303 |
Manitou BF S.A. | | 5,232 | | | 59,386 |
Meetic (a) | | 5,080 | | | 74,534 |
Naturex | | 239 | | | 8,680 |
Neopost S.A. | | 9,432 | | | 853,722 |
Nexans S.A. | | 6,440 | | | 384,630 |
Norbert Dentressangle | | 1,639 | | | 62,774 |
NRJ Groupe | | 19,172 | | | 140,771 |
Orpea (a) | | 8,696 | | | 314,279 |
Pierre & Vacances | | 3,267 | | | 173,563 |
Rallye S.A. | | 10,003 | | | 226,032 |
Recylex S.A. (a) | | 9,886 | | | 34,632 |
Remy Cointreau S.A. | | 13,939 | | | 577,533 |
Rexel S.A. | | 52,688 | | | 350,965 |
Rhodia S.A. | | 12,820 | | | 81,251 |
*See accompanying notes to financial statements.
MSF-9
Metropolitan Series Fund, Inc.
Met/Dimensional International Small Company Portfolio
Schedule of Investments as of December 31, 2008
Common Stock—(Continued)
| | | | | |
| Security Description | | Shares | | Value* |
| | | | | |
| | |
France—(Continued) | | | | | |
Robertet S.A. | | 14 | | $ | 1,403 |
Rubis | | 3,574 | | | 225,142 |
S.O.I.T.E.C. (a) | | 51,917 | | | 231,989 |
Saft Groupe S.A. (a) | | 13,935 | | | 376,475 |
Samse S.A. | | 24 | | | 1,835 |
SEB S.A. | | 17,139 | | | 514,384 |
Sechilienne-Sidec | | 8,474 | | | 379,332 |
SeLoger.com (a) | | 7,313 | | | 106,920 |
SMTPC | | 219 | | | 6,119 |
Societe Manutan | | 64 | | | 2,765 |
Société BIC S.A. | | 9,569 | | | 549,798 |
Somfy S.A. | | 75 | | | 11,919 |
Sopra Group S.A. | | 2,210 | | | 76,962 |
Stallergenes | | 3,373 | | | 179,844 |
STEF-TFE | | 599 | | | 27,656 |
Sucriere de Pithiviers-Le-Vieil | | 2 | | | 1,282 |
Synergie S.A. | | 400 | | | 5,188 |
Teleperformance | | 31,699 | | | 883,920 |
UBISOFT Entertainment | | 28,822 | | | 563,512 |
Union Financiere de France BQE S.A. | | 1,243 | | | 35,271 |
Viel et Compagnie | | 2,379 | | | 6,944 |
Vilmorin & Cie | | 1,904 | | | 194,195 |
Virbac S.A. | | 1,074 | | | 86,543 |
VM Materiaux S.A. | | 92 | | | 4,295 |
Wendel | | 22,705 | | | 1,128,010 |
Zodiac S.A. | | 28,587 | | | 1,040,419 |
| | | | | |
| | | | | 19,224,603 |
| | | | | |
| | |
Germany—6.4% | | | | | |
Aixtron AG | | 45,746 | | | 310,365 |
Augusta Technologie AG | | 4,492 | | | 58,854 |
Bauer AG | | 5,470 | | | 229,132 |
Bechtle AG | | 7,455 | | | 143,697 |
Bertrandt AG | | 2,364 | | | 58,127 |
Bilfinger Berger AG | | 28,716 | | | 1,519,206 |
Biotest AG | | 1,790 | | | 136,971 |
Borussia Dortmund GmbH & Co. KGaA (a) | | 20,822 | | | 34,962 |
Business Media China AG (a) | | 1,426 | | | 8,165 |
Carl Zeiss Meditec AG | | 18,224 | | | 221,495 |
CENTROTEC Sustainable AG (a) | | 1,227 | | | 18,218 |
Cewe Color Holding AG | | 2,667 | | | 52,412 |
Comdirect Bank AG | | 17,161 | | | 150,751 |
CropEnergies AG (a) | | 2,615 | | | 10,748 |
CTS Eventim AG | | 4,715 | | | 159,110 |
Curanum AG | | 16,470 | | | 89,152 |
DAB Bank AG | | 8,986 | | | 32,714 |
Demag Cranes AG | | 758 | | | 20,250 |
Deutsche Wohnen AG | | 17,124 | | | 230,058 |
Douglas Holding AG | | 19,641 | | | 886,620 |
Drillisch AG | | 29,175 | | | 71,612 |
Elexis AG | | 1,232 | | | 13,424 |
ElringKlinger AG | | 14,732 | | | 142,757 |
Evotec AG (a) | | 61,225 | | | 65,650 |
Fielmann AG | | 7,885 | | | 513,295 |
Freenet AG | | 46,549 | | | 272,890 |
Fuchs Petrolub AG | | 1,119 | | | 61,199 |
| | | | | |
| Security Description | | Shares | | Value* |
| | | | | |
| | |
Germany—(Continued) | | | | | |
GEA Group AG | | 113,627 | | $ | 1,948,325 |
Gerresheimer AG | | 15,488 | | | 424,617 |
Gerry Weber International AG | | 7,095 | | | 204,274 |
Gesco AG | | 257 | | | 15,170 |
GFK AG | | 9,067 | | | 279,421 |
Grenkeleasing AG | | 1,637 | | | 41,077 |
Hawesko Holding AG | | 570 | | | 15,605 |
Hochtief AG | | 3,487 | | | 176,902 |
IDS Scheer AG | | 12,439 | | | 105,963 |
Indus Holding AG | | 727 | | | 13,665 |
Infineon Technologies AG (a) | | 46,231 | | | 63,633 |
Interseroh SE | | 398 | | | 20,018 |
IVG Immobilen AG | | 65,030 | | | 525,672 |
Jenoptik AG (a) | | 26,072 | | | 184,163 |
Kizoo AG | | 3,469 | | | 24,942 |
Kontron AG | | 31,808 | | | 329,238 |
Krones AG | | 9,170 | | | 404,134 |
KWS Saat AG | | 1,221 | | | 192,544 |
Loewe AG | | 2,325 | | | 28,476 |
Manz Automation AG (a) | | 1,003 | | | 59,954 |
Medigene AG (a) | | 16,786 | | | 102,351 |
Medion AG | | 20,340 | | | 180,649 |
MLP AG | | 28,825 | | | 400,163 |
Morphosys AG (a) | | 9,393 | | | 248,791 |
MTU Aero Engines Holding AG (a) | | 28,674 | | | 790,204 |
MVV Energie AG | | 473 | | | 21,374 |
Norddeutsche Affinerie AG | | 686 | | | 27,260 |
Nordex AG | | 9,267 | | | 133,408 |
PC-Ware Information Technologies AG | | 2,227 | | | 50,903 |
Pfeiffer Vacuum Technology AG | | 733 | | | 48,536 |
QSC AG (a) | | 47,186 | | | 83,372 |
R Stahl AG | | 196 | | | 5,027 |
Rational AG | | 2,110 | | | 250,335 |
REpower Systems AG | | 680 | | | 106,964 |
Rhoen Klinikum AG | | 51,231 | | | 1,231,273 |
Roth & Rau AG (a) | | 639 | | | 13,729 |
SGL Carbon AG (a) | | 37,547 | | | 1,282,881 |
Software AG | | 13,227 | | | 746,732 |
Solar Millennium AG (a) | | 7,256 | | | 124,037 |
Stada Arzneimittel AG | | 44,179 | | | 1,292,146 |
Stratec Biomedical Systems | | 3,381 | | | 63,952 |
Suedzucker AG | | 54,275 | | | 829,287 |
Symrise AG | | 65,164 | | | 920,363 |
Takkt AG | | 4,447 | | | 49,797 |
Telegate AG | | 1,956 | | | 16,816 |
Tognum AG | | 28,330 | | | 361,872 |
United Internet AG | | 77,509 | | | 693,712 |
Versatel AG (a) | | 2,108 | | | 31,037 |
Vivacon AG | | 11,822 | | | 65,104 |
Vossloh AG | | 6,013 | | | 677,049 |
Washtec AG (a) | | 1,665 | | | 13,760 |
Wincor Nixdorf AG | | 20,399 | | | 972,584 |
| | | | | |
| | | | | 22,405,095 |
| | | | | |
| | |
Greece—1.4% | | | | | |
Agricultural Bank of Greece | | 143,570 | | | 281,234 |
Alapis Holding Industrial & Commercial S.A. | | 417,691 | | | 314,900 |
*See accompanying notes to financial statements.
MSF-10
Metropolitan Series Fund, Inc.
Met/Dimensional International Small Company Portfolio
Schedule of Investments as of December 31, 2008
Common Stock—(Continued)
| | | | | |
| Security Description | | Shares | | Value* |
| | | | | |
| | |
Greece—(Continued) | | | | | |
Alfa-Beta Vassilopoulos S.A. | | 533 | | $ | 18,876 |
Anek Lines S.A. | | 53,117 | | | 60,597 |
Bank of Attica | | 9,879 | | | 40,558 |
Bank of Greece | | 6,673 | | | 356,535 |
Diagnostic & Therapeutic Center of Athens Hygeia S.A. | | 45,280 | | | 120,691 |
Ellaktor S.A. | | 85,556 | | | 513,623 |
Emporiki Bank S.A. | | 6,781 | | | 53,879 |
Forthnet S.A. (a) | | 56,130 | | | 57,389 |
Fourlis Holdings S.A. | | 22,201 | | | 155,106 |
Frigoglass S.A. | | 12,958 | | | 61,855 |
GEK Terna S.A. | | 13,518 | | | 63,282 |
Hellenic Duty Free Shops S.A. | | 6,376 | | | 51,451 |
Hellenic Exchanges S.A. Holding Clearing Settlement & Registry | | 29,646 | | | 233,405 |
Hellenic Petroleum S.A. | | 55,854 | | | 413,412 |
Iaso S.A. | | 6,163 | | | 38,429 |
Intracom Holdings S.A. (a) | | 56,166 | | | 56,719 |
Lambrakis Press S.A. | | 7,345 | | | 21,476 |
Metka S.A. | | 7,886 | | | 72,764 |
Motor Oil Hellas Corinth Refineries S.A. | | 20,217 | | | 216,934 |
Mytilineos Holdings S.A. | | 53,011 | | | 294,738 |
Piraeus Port Authority | | 4,532 | | | 62,048 |
S&B Industrial Minerals S.A. | | 3,052 | | | 34,153 |
Sarantis S.A. | | 16,104 | | | 95,389 |
Singularlogic S.A. | | 14,779 | | | 42,180 |
Teletypos S.A. Mega Channel | | 3,647 | | | 26,518 |
The Athens Water Supply & Sewage Co. S.A. | | 18,775 | | | 133,955 |
Titan Cement Co. S.A. | | 42,064 | | | 815,993 |
TT Hellenic Postbank S.A. | | 39,882 | | | 311,728 |
Viohalco | | 14,474 | | | 82,981 |
| | | | | |
| | | | | 5,102,798 |
| | | | | |
| | |
Hong Kong—0.6% | | | | | |
Allied Group, Ltd. | | 22,000 | | | 37,473 |
Asia Financial Holdings, Ltd. | | 300,000 | | | 81,899 |
Chong Hing Bank, Ltd. | | 52,000 | | | 62,386 |
Cross-Harbour Holdings, Ltd. | | 63,000 | | | 52,036 |
Dah Sing Banking Group, Ltd. | | 185,200 | | | 133,796 |
Dah Sing Financial Holdings, Ltd. | | 48,000 | | | 123,931 |
Emperor International Holdings | | 206,000 | | | 17,892 |
Fubon Bank Hong Kong, Ltd. | | 176,000 | | | 57,063 |
Galaxy Entertainment Group, Ltd. (a) | | 1,722,000 | | | 236,873 |
Hung Hing Printing Group, Ltd. | | 22,000 | | | 4,033 |
Kowloon Development Co., Ltd. | | 285,000 | | | 108,178 |
Lippo, Ltd. | | 122,000 | | | 23,979 |
Liu Chong Hing Investment | | 48,000 | | | 20,286 |
Melco International Development | | 491,000 | | | 163,859 |
Natural Beauty Bio-Technology, Ltd. | | 240,000 | | | 37,634 |
Next Media, Ltd. | | 62,000 | | | 7,226 |
Oriental Press Group | | 568,000 | | | 53,696 |
Ports Design, Ltd. | | 229,500 | | | 279,527 |
Shaw Brothers | | 76,000 | | | 126,049 |
Shui On Construction & Materials, Ltd. | | 48,000 | | | 37,653 |
Shun Tak Holdings, Ltd. | | 794,000 | | | 220,135 |
Sino-I Technology, Ltd. (a) | | 1,090,000 | | | 6,082 |
| | | | | |
| Security Description | | Shares | | Value* |
| | | | | |
| | |
Hong Kong—(Continued) | | | | | |
Techtronic Industries Co., Ltd. | | 144,500 | | $ | 29,048 |
Vitasoy International Holdings, Ltd. | | 294,000 | | | 131,911 |
Wheelock Properties, Ltd. | | 35,000 | | | 13,701 |
Wing On Co. International, Ltd. | | 37,000 | | | 39,244 |
Wonson International Holdings, Ltd. (a) | | 5,000,000 | | | 12,324 |
| | | | | |
| | | | | 2,117,914 |
| | | | | |
| | |
Ireland—0.8% | | | | | |
C&C Group, Plc. | | 198,258 | | | 401,337 |
DCC, Plc. | | 33,107 | | | 475,028 |
Dragon Oil, Plc. (a) | | 121,262 | | | 276,189 |
FBD Holdings, Plc. | | 11,997 | | | 83,382 |
Glanbia, Plc. | | 33,852 | | | 98,847 |
Greencore Group, Plc. | | 89,512 | | | 117,268 |
IFG Group, Plc. | | 25,945 | | | 16,999 |
Independent News & Media, Plc. | | 276,650 | | | 159,055 |
Kingspan Group, Plc. | | 73,077 | | | 309,990 |
McInerney Holdings, Plc. | | 128,570 | | | 42,454 |
Paddy Power, Plc. | | 22,887 | | | 428,357 |
Smurfit Kappa Group, Plc. | | 10,531 | | | 26,229 |
The Governor & Co. of the Bank of Ireland | | 62,012 | | | 74,181 |
United Drug, Plc. | | 115,662 | | | 358,426 |
| | | | | |
| | | | | 2,867,742 |
| | | | | |
| | |
Isle of Man—0.0% | | | | | |
Hansard Global, Plc. | | 5,368 | | | 12,217 |
| | | | | |
| | |
Italy—3.7% | | | | | |
AcegasAps S.p.A. | | 4,880 | | | 33,589 |
Amplifon S.p.A. | | 40,752 | | | 47,639 |
Ansaldo STS S.p.A. (a) | | 28,182 | | | 397,068 |
Antichi Pellettieri S.p.A. | | 9,305 | | | 36,575 |
Arnoldo Mondadori Editore S.p.A. | | 53,051 | | | 260,162 |
Astaldi S.p.A. | | 26,266 | | | 146,246 |
Autogrill S.p.A. | | 58,900 | | | 446,037 |
Azimut Holding S.p.A. | | 54,152 | | | 291,680 |
Banca Finnat Euramerica S.p.A. | | 40,945 | | | 29,072 |
Banca Generali S.p.A. | | 17,097 | | | 66,676 |
Banca IFIS S.p.A. | | 3,121 | | | 26,967 |
Banca Intermobiliare S.p.A. | | 3,806 | | | 14,869 |
Banca Popolare di Milano Scarl | | 301,595 | | | 1,786,260 |
Banco di Desio e della Brianza S.p.A. | | 19,360 | | | 125,301 |
Benetton Group S.p.A. | | 17,138 | | | 147,350 |
Bonifica Ferraresi e Imprese Agricole S.p.A. | | 604 | | | 24,465 |
Brembo S.p.A. | | 15,672 | | | 83,303 |
Bulgari S.p.A. | | 86,907 | | | 542,602 |
Buzzi Unicem S.p.A. | | 2,688 | | | 43,933 |
Carraro S.p.A. | | 5,504 | | | 18,711 |
Cementir Holding S.p.A. | | 25,410 | | | 88,815 |
CIR-Compagnie Industriali Riunite S.p.A. | | 272,712 | | | 280,832 |
Credito Artigiano S.p.A. | | 4,685 | | | 13,033 |
Credito Bergamasco S.p.A. | | 749 | | | 24,931 |
Credito Emiliano S.p.A. | | 41,867 | | | 218,475 |
Davide Campari-Milano S.p.A. | | 82,878 | | | 560,182 |
Digital Multimedia Technologies S.p.A. (a) | | 3,021 | | | 52,575 |
ERG S.p.A. | | 37,420 | | | 449,439 |
*See accompanying notes to financial statements.
MSF-11
Metropolitan Series Fund, Inc.
Met/Dimensional International Small Company Portfolio
Schedule of Investments as of December 31, 2008
Common Stock—(Continued)
| | | | | |
| Security Description | | Shares | | Value* |
| | | | | |
| | |
Italy—(Continued) | | | | | |
Esprinet S.p.A. | | 13,663 | | $ | 63,394 |
Eurotech S.p.A. (a) | | 15,434 | | | 55,168 |
Fastweb (a) | | 10,127 | | | 297,675 |
Fiera Milano S.p.A. | | 4,744 | | | 28,295 |
Gemina S.p.A. | | 405,139 | | | 210,603 |
Geox S.p.A. | | 45,002 | | | 276,073 |
Gewiss S.p.A. | | 3,256 | | | 11,902 |
Gruppo Editoriale L’Espresso S.p.A. | | 21,633 | | | 35,329 |
Hera S.p.A. | | 304,228 | | | 654,785 |
Impregilo S.p.A. | | 73,310 | | | 209,036 |
Indesit Co. S.p.A. | | 17,777 | | | 107,364 |
Industria Macchine Automatiche S.p.A. | | 3,204 | | | 59,618 |
Interpump Group S.p.A. | | 25,267 | | | 154,118 |
Iride S.p.A. | | 150,774 | | | 197,863 |
Italmobiliare S.p.A. | | 951 | | | 38,062 |
Juventus Football Club S.p.A. (a) | | 9,266 | | | 9,891 |
KME Group S.p.A. | | 46,746 | | | 29,052 |
Mariella Burani S.p.A. | | 6,116 | | | 86,850 |
MARR S.p.A. | | 6,587 | | | 49,689 |
Milano Assicurazioni S.p.A. | | 155,714 | | | 485,044 |
Mirato S.p.A. | | 2,670 | | | 17,048 |
Nice S.p.A. (a) | | 7,301 | | | 17,914 |
Permasteelisa S.p.A. | | 6,995 | | | 95,646 |
Piaggio & C S.p.A. | | 71,987 | | | 127,560 |
Pirelli & Co. S.p.A. | | 2,040,940 | | | 756,800 |
Poltrona Frau S.p.A. | | 22,268 | | | 23,740 |
Prysmian S.p.A. (a) | | 64,009 | | | 1,005,332 |
Recordati S.p.A. | | 43,040 | | | 233,489 |
Reno de Medici S.p.A. | | 38,858 | | | 8,179 |
Sabaf S.p.A. | | 947 | | | 19,852 |
Societa Cattolica di Assicurazioni Scrl | | 15,901 | | | 561,247 |
Societa Iniziative Autostradali e Servizi S.p.A. | | 29,017 | | | 180,765 |
Sogefi S.p.A. | | 12,454 | | | 21,717 |
Telecom Italia Media S.p.A. | | 247,261 | | | 30,846 |
Tod’s S.p.A. | | 6,175 | | | 260,071 |
Trevi Finanziaria S.p.A. | | 13,527 | | | 140,667 |
Vianini Lavori S.p.A. | | 1,530 | | | 8,606 |
Vittoria Assicurazioni S.p.A. | | 5,773 | | | 30,952 |
| | | | | |
| | | | | 12,857,029 |
| | | | | |
| | |
Japan—32.7% | | | | | |
Achilles Corp. | | 66,000 | | | 96,381 |
ADEKA Corp. | | 52,100 | | | 383,859 |
Aderans Holdings Co., Ltd. | | 15,300 | | | 160,310 |
Advan Co., Ltd. | | 11,300 | | | 45,828 |
Aeon Fantasy Co., Ltd. | | 4,300 | | | 37,984 |
Aeon Hokkaido Corp. | | 4,500 | | | 16,703 |
Ahresty Corp. | | 5,800 | | | 18,559 |
Ai Holdings Corp. | | 15,400 | | | 50,327 |
Aica Kogyo Co., Ltd. | | 23,900 | | | 266,369 |
Aichi Corp. | | 12,500 | | | 48,551 |
Aichi Machine Industry Co., Ltd. | | 37,000 | | | 65,759 |
Aichi Maruwa Co., Ltd. | | 4,200 | | | 44,592 |
Aichi Steel Corp. | | 57,000 | | | 185,759 |
Aichi Tokei Denki Co., Ltd. | | 3,000 | | | 7,864 |
Aida Engineering, Ltd. | | 30,900 | | | 113,445 |
| | | | | |
| Security Description | | Shares | | Value* |
| | | | | |
| | |
Japan—(Continued) | | | | | |
Aigan Co., Ltd. | | 8,000 | | $ | 44,920 |
Aiphone Co., Ltd. | | 5,300 | | | 99,293 |
Airport Facilities Co., Ltd. | | 8,800 | | | 55,019 |
Aisan Industry Co., Ltd. | | 10,300 | | | 50,666 |
Akebono Brake Industry Co., Ltd. | | 13,800 | | | 79,305 |
Aloka Co., Ltd. | | 8,200 | | | 73,240 |
Alpha Systems, Inc. | | 1,600 | | | 41,880 |
Alpine Electronics, Inc. | | 23,700 | | | 190,061 |
Alps Electric Co., Ltd. | | 105,900 | | | 518,186 |
Altech Corp. | | 2,600 | | | 22,862 |
Amano Corp. | | 23,900 | | | 187,611 |
Amiyaki Tei Co., Ltd. | | 10 | | | 13,904 |
Amuse, Inc. | | 2,200 | | | 28,736 |
Ando Corp. | | 37,000 | | | 60,495 |
Anest Iwata Corp. | | 12,000 | | | 40,677 |
Anritsu Corp. | | 36,000 | | | 84,948 |
AOC Holdings, Inc. | | 17,300 | | | 96,167 |
Aohata Corp. | | 500 | | | 7,553 |
AOKI Holdings, Inc. | | 11,800 | | | 121,670 |
Aoyama Trading Co., Ltd. | | 35,300 | | | 561,048 |
Arakawa Chemical Industries, Ltd. | | 6,500 | | | 74,546 |
Araya Industrial Co., Ltd. | | 25,000 | | | 43,882 |
Ariake Japan Co., Ltd. | | 7,100 | | | 133,721 |
Arisawa Manufacturing Co., Ltd. | | 14,700 | | | 51,576 |
Aronkasei Co., Ltd. | | 4,000 | | | 13,532 |
Art Corp. | | 4,600 | | | 69,329 |
As One Corp. | | 4,200 | | | 81,332 |
Asahi Diamond Industrial Co., Ltd. | | 20,000 | | | 112,098 |
Asahi Organic Chemicals Industry Co., Ltd. | | 30,000 | | | 99,937 |
Asahi Pretec Corp. | | 7,400 | | | 86,455 |
Asahi TEC Corp. (a) | | 85,000 | | | 28,673 |
Asatsu-DK, Inc. | | 11,800 | | | 264,551 |
Ashimori Industry Co., Ltd. | | 25,000 | | | 27,108 |
ASICS Trading Co., Ltd. | | 800 | | | 9,044 |
ASKA Pharmaceutical Co., Ltd. | | 3,000 | | | 28,040 |
Asunaro Aoki Construction Co., Ltd. | | 2,000 | | | 9,803 |
Atom Corp. | | 4,600 | | | 15,423 |
Atsugi Co., Ltd. | | 88,000 | | | 124,597 |
Autobacs Seven Co., Ltd. | | 18,200 | | | 421,597 |
Avex Group Holdings, Inc. | | 10,000 | | | 111,299 |
Bando Chemical Industries, Ltd. | | 37,000 | | | 89,450 |
Bank of the Ryukyus, Ltd. | | 17,900 | | | 176,921 |
Belluna Co., Ltd. | | 11,950 | | | 31,849 |
Best Denki Co., Ltd. | | 29,000 | | | 93,471 |
Bookoff Corp. | | 4,500 | | | 38,824 |
Bunka Shutter Co., Ltd. | | 21,000 | | | 91,543 |
CAC Corp. | | 4,600 | | | 39,774 |
Calsonic Kansei Corp. | | 73,000 | | | 103,932 |
Canon Electronics, Inc. | | 5,600 | | | 79,656 |
Canon Finetech, Inc. | | 7,300 | | | 79,232 |
Carchs Co., Ltd. (a) | | 54,500 | | | 18,220 |
Catena Corp. | | 11,500 | | | 25,687 |
Cawachi, Ltd. | | 7,900 | | | 178,853 |
Central Glass Co., Ltd. | | 109,000 | | | 440,632 |
Central Security Patrols Co., Ltd. | | 2,000 | | | 20,005 |
Century Leasing System, Inc. | | 10,700 | | | 95,305 |
CFS Corp. | | 1,500 | | | 10,356 |
*See accompanying notes to financial statements.
MSF-12
Metropolitan Series Fund, Inc.
Met/Dimensional International Small Company Portfolio
Schedule of Investments as of December 31, 2008
Common Stock—(Continued)
| | | | | |
| Security Description | | Shares | | Value* |
| | | | | |
| | |
Japan—(Continued) | | | | | |
Chino Corp. | | 14,000 | | $ | 32,614 |
Chiyoda Co., Ltd. | | 12,100 | | | 227,388 |
Chofu Seisakusho Co., Ltd. | | 8,800 | | | 216,656 |
Chori Co., Ltd. | | 52,000 | | | 55,481 |
Chubu Shiryo Co., Ltd. | | 12,000 | | | 94,787 |
Chudenko Corp. | | 16,400 | | | 278,492 |
Chuetsu Pulp & Paper Co., Ltd. | | 50,000 | | | 120,245 |
Chugai Mining Co., Ltd. | | 67,700 | | | 23,398 |
Chugai Ro Co., Ltd. | | 24,000 | | | 75,773 |
Chugoku Marine Paints, Ltd. | | 22,000 | | | 161,659 |
Chuo Denki Kogyo Co., Ltd. | | 8,000 | | | 52,853 |
Chuo Spring Co., Ltd. | | 5,000 | | | 16,379 |
CKD Corp. | | 33,000 | | | 127,705 |
Clarion Co., Ltd. | | 51,000 | | | 35,110 |
Cleanup Corp. | | 9,100 | | | 37,361 |
CMK Corp. | | 20,100 | | | 60,120 |
Co-Op Chemical Co., Ltd. (a) | | 14,000 | | | 34,851 |
Coca-Cola Central Japan Co., Ltd. | | 19 | | | 137,927 |
Colowide Co., Ltd. | | 14,500 | | | 86,798 |
Commuture Corp. | | 10,000 | | | 62,833 |
Computer Engineering & Consulting, Ltd. | | 4,500 | | | 41,740 |
COMSYS Holdings | | 66,000 | | | 613,408 |
Core Corp. | | 3,000 | | | 18,348 |
Corona Corp. | | 6,700 | | | 67,624 |
Cosel Co., Ltd. | | 6,700 | | | 54,014 |
Create Medic Co., Ltd. | | 1,800 | | | 16,228 |
Cross Plus, Inc. | | 1,100 | | | 13,998 |
CSK Holdings Corp. | | 43,900 | | | 239,230 |
CTI Engineering Co., Ltd. | | 4,700 | | | 36,553 |
Cybozu, Inc. | | 119 | | | 23,152 |
Dai Nippon Toryo Co., Ltd. | | 35,000 | | | 39,269 |
Dai-Dan Co., Ltd. | | 7,000 | | | 38,053 |
Daido Kogyo Co., Ltd. | | 9,000 | | | 16,528 |
Daido Metal Co., Ltd. | | 19,000 | | | 51,238 |
Daidoh, Ltd. | | 7,100 | | | 54,524 |
Daifuku Co., Ltd. | | 38,500 | | | 224,335 |
Daihen Corp. | | 46,000 | | | 178,548 |
Daiichi Chuo Kisen Kaisha | | 57,000 | | | 160,754 |
Daiichi Jitsugyo Co., Ltd. | | 20,000 | | | 58,998 |
Daiken Corp. | | 33,000 | | | 75,747 |
Daiki Aluminium Industry Co., Ltd. | | 19,000 | | | 38,238 |
Daiko Clearing Services Corp. | | 5,200 | | | 42,135 |
Daikoku Denki Co., Ltd. | | 4,200 | | | 65,258 |
Daikyo, Inc. | | 101,000 | | | 88,343 |
Daimei Telecom Engineering Corp. | | 15,000 | | | 140,264 |
Dainichi Co., Ltd. | | 2,500 | | | 17,089 |
Dainichiseika Color & Chemicals Manufacturing Co., Ltd. | | 28,000 | | | 78,218 |
Dainippon Screen Manufacturing Co., Ltd. | | 106,000 | | | 205,308 |
Daio Paper Corp. | | 43,000 | | | 534,228 |
Daiseki Co., Ltd. | | 12,600 | | | 238,779 |
Daiso Co., Ltd. | | 27,000 | | | 78,178 |
Daisyo Corp. | | 2,100 | | | 31,047 |
Daiwa Industries, Ltd. | | 18,000 | | | 61,838 |
Daiwa Seiko, Inc. | | 28,000 | | | 40,352 |
Daiwabo Co., Ltd. | | 41,000 | | | 188,442 |
DC Co., Ltd. | | 5,600 | | | 19,925 |
| | | | | |
| Security Description | | Shares | | Value* |
| | | | | |
| | |
Japan—(Continued) | | | | | |
DCM Japan Holdings Co., Ltd. | | 34,600 | | $ | 245,761 |
Denki Kagaku Kogyo K.K. | | 271,000 | | | 662,976 |
Denki Kogyo Co., Ltd. | | 15,000 | | | 94,068 |
Denyo Co., Ltd. | | 10,700 | | | 77,203 |
Descente, Ltd. | | 18,000 | | | 86,003 |
Disco Corp. | | 9,000 | | | 185,538 |
DMW Corp. | | 700 | | | 10,024 |
Doshisha Co., Ltd. | | 4,600 | | | 62,961 |
Dowa Holdings Co., Ltd. | | 154,000 | | | 566,489 |
DTS Corp. | | 7,400 | | | 69,726 |
Dwango Co., Ltd. | | 26 | | | 48,979 |
Dydo Drinco, Inc. | | 4,300 | | | 136,572 |
eAccess, Ltd. | | 489 | | | 307,779 |
Eagle Industry Co., Ltd. | | 13,000 | | | 45,963 |
Earth Chemical Co., Ltd. | | 3,600 | | | 106,011 |
EBARA Corp. | | 226,000 | | | 522,390 |
EDION Corp. | | 45,600 | | | 224,968 |
Eiken Chemical Co., Ltd. | | 7,500 | | | 57,784 |
Eizo Nanao Corp. | | 6,800 | | | 110,800 |
Elpida Memory, Inc. (a) | | 67,000 | | | 410,786 |
Enplas Corp. | | 6,700 | | | 75,416 |
Epson Toyocom Corp. | | 32,000 | | | 60,138 |
ESPEC Corp. | | 8,800 | | | 55,192 |
Exedy Corp. | | 17,400 | | | 173,859 |
Falco Biosystems, Ltd. | | 1,700 | | | 14,865 |
Fancl Corp. | | 15,700 | | | 209,245 |
FDK Corp. (a) | | 42,000 | | | 51,913 |
Foster Electric Co., Ltd. | | 7,200 | | | 55,864 |
FP Corp. | | 5,200 | | | 258,770 |
France Bed Holdings Co., Ltd. | | 53,000 | | | 84,592 |
Fudo Tetra Corp. | | 61,400 | | | 36,569 |
Fuji Co., Ltd./Ehime | | 4,400 | | | 89,377 |
Fuji Corp., Ltd. | | 12,200 | | | 33,455 |
Fuji Kiko Co., Ltd. | | 12,000 | | | 9,631 |
Fuji Kyuko Co., Ltd. | | 18,000 | | | 86,089 |
Fuji Oil Co., Ltd. | | 27,300 | | | 385,839 |
Fuji Soft, Inc. | | 12,700 | | | 269,490 |
Fujibo Holdings, Inc. | | 30,000 | | | 30,805 |
Fujico Co., Ltd. | | 8,000 | | | 104,647 |
Fujikura Kasei Co., Ltd. | | 9,600 | | | 49,881 |
Fujikura, Ltd. | | 216,000 | | | 711,768 |
Fujita Kanko, Inc. | | 30,000 | | | 158,867 |
Fujitec Co., Ltd. | | 37,000 | | | 133,760 |
Fujitsu Business Systems, Ltd. | | 6,400 | | | 100,263 |
Fujitsu Frontech, Ltd. | | 7,400 | | | 60,006 |
Fujitsu General, Ltd. | | 18,000 | | | 32,920 |
Fujiya Co., Ltd. (a) | | 33,000 | | | 44,306 |
Fukuda Corp. | | 20,000 | | | 35,425 |
Fukushima Industries Corp. | | 1,700 | | | 14,560 |
Fumakilla, Ltd. | | 8,000 | | | 29,931 |
Funai Consulting Co., Ltd. | | 6,200 | | | 32,968 |
Funai Electric Co., Ltd. | | 10,500 | | | 217,221 |
Furukawa Battery Co., Ltd. (a) | | 8,000 | | | 87,308 |
Furukawa Co., Ltd. | | 111,000 | | | 114,428 |
Furukawa-Sky Aluminum Corp. | | 39,000 | | | 94,180 |
Furusato Industries, Ltd. | | 3,900 | | | 41,884 |
Fuso Pharmaceutical Industries, Ltd. | | 24,000 | | | 77,845 |
*See accompanying notes to financial statements.
MSF-13
Metropolitan Series Fund, Inc.
Met/Dimensional International Small Company Portfolio
Schedule of Investments as of December 31, 2008
Common Stock—(Continued)
| | | | | |
| Security Description | | Shares | | Value* |
| | | | | |
| | |
Japan—(Continued) | | | | | |
Futaba Corp. | | 20,900 | | $ | 264,856 |
Futaba Industrial Co., Ltd. | | 27,800 | | | 108,434 |
Future Architect, Inc. | | 68 | | | 26,705 |
Fuyo General Lease Co., Ltd. | | 8,100 | | | 157,830 |
Gakken Co., Ltd. | | 43,000 | | | 63,830 |
Gecoss Corp. | | 4,000 | | | 22,053 |
Genki Sushi Co., Ltd. | | 2,200 | | | 30,230 |
Geo Corp. | | 118 | | | 97,216 |
GMO internet, Inc. | | 14,200 | | | 73,387 |
Godo Steel, Ltd. | | 68,000 | | | 190,495 |
Goldcrest Co., Ltd. | | 9,430 | | | 235,715 |
Goldwin, Inc. (a) | | 20,000 | | | 35,706 |
Gourmet Kineya Co., Ltd. | | 1,000 | | | 7,831 |
Green Hospital Supply, Inc. | | 107 | | | 47,387 |
GS Yuasa Corp. | | 134,000 | | | 807,428 |
Gulliver International Co., Ltd. | | 1,770 | | | 30,440 |
Gun-Ei Chemical Industry Co., Ltd. | | 20,000 | | | 47,779 |
Gunze, Ltd. | | 113,000 | | | 372,146 |
Hakuto Co., Ltd. | | 7,800 | | | 69,936 |
Hakuyosha Co., Ltd. | | 2,000 | | | 6,093 |
Hanwa Co., Ltd. | | 113,000 | | | 358,433 |
Happinet Corp. | | 3,400 | | | 55,246 |
Harashin Narus Holdings Co., Ltd. | | 2,200 | | | 24,859 |
Harima Chemicals, Inc. | | 2,000 | | | 9,548 |
Haseko Corp. | | 562,000 | | | 597,065 |
Hazama Corp. | | 41,900 | | | 37,808 |
Heiwa Corp. | | 24,500 | | | 246,790 |
Heiwa Real Estate Co., Ltd. | | 71,500 | | | 186,312 |
Heiwado Co., Ltd. | | 15,400 | | | 248,565 |
Hibiya Engineering, Ltd. | | 9,000 | | | 79,045 |
Hikari Tsushin, Inc. | | 12,700 | | | 244,103 |
HIS Co., Ltd. | | 6,400 | | | 132,947 |
Hitachi Business Solution Co., Ltd. | | 900 | | | 5,797 |
Hitachi Cable, Ltd. | | 107,000 | | | 241,078 |
Hitachi Information Systems, Ltd. | | 9,300 | | | 192,907 |
Hitachi Koki Co., Ltd. | | 29,700 | | | 249,532 |
Hitachi Kokusai Electric, Inc. | | 32,000 | | | 169,461 |
Hitachi Maxell, Ltd. | | 27,200 | | | 253,895 |
Hitachi Medical Corp. | | 2,000 | | | 20,360 |
Hitachi Metals Techno, Ltd. | | 2,000 | | | 8,926 |
Hitachi Plant Technologies, Ltd. | | 34,000 | | | 127,795 |
Hitachi Software Engineering Co., Ltd. | | 11,800 | | | 182,492 |
Hitachi Systems & Services, Ltd. | | 3,700 | | | 38,569 |
Hitachi Tool Engineering, Ltd. | | 8,100 | | | 60,355 |
Hitachi Zosen Corp. (a) | | 323,000 | | | 294,973 |
Hochiki Corp. | | 8,000 | | | 66,149 |
Hodogaya Chemical Co., Ltd. | | 35,000 | | | 67,671 |
Hogy Medical Co., Ltd. | | 4,400 | | | 303,147 |
Hohsui Corp. | | 12,000 | | | 11,234 |
Hokkaido Gas Co., Ltd. | | 12,000 | | | 35,235 |
Hokkan Holdings, Ltd. | | 9,000 | | | 27,826 |
Hokko Chemical Industry Co., Ltd. | | 4,000 | | | 13,005 |
Hokuetsu Paper Mills, Ltd. | | 60,500 | | | 370,126 |
Hokuriku Electric Industry Co., Ltd. | | 22,000 | | | 42,937 |
Hokuriku Electrical Construction Co., Ltd. | | 1,000 | | | 3,796 |
Hokuto Corp. | | 9,000 | | | 255,527 |
Honshu Chemical Industry Co., Ltd. | | 2,000 | | | 13,172 |
| | | | | |
| Security Description | | Shares | | Value* |
| | | | | |
| | |
Japan—(Continued) | | | | | |
Horiba, Ltd. | | 14,100 | | $ | 195,920 |
Horipro, Inc. | | 3,500 | | | 38,857 |
Hosiden Corp. | | 28,000 | | | 442,606 |
Hosokawa Micron Corp. | | 14,000 | | | 55,401 |
Howa Machinery, Ltd. | | 36,000 | | | 25,922 |
I-Net Corp. | | 3,200 | | | 17,783 |
IBJ Leasing Co., Ltd. | | 6,400 | | | 116,155 |
Ichikawa Co., Ltd. | | 2,000 | | | 6,788 |
Ichikoh Industries, Ltd. | | 18,000 | | | 26,134 |
Ichinen Holdings Co., Ltd. | | 7,000 | | | 40,787 |
Ichiyoshi Securities Co., Ltd. | | 10,300 | | | 82,452 |
Icom, Inc. | | 4,200 | | | 89,456 |
Idec Corp. | | 8,400 | | | 86,333 |
Ihara Chemical Industry Co., Ltd. | | 11,000 | | | 35,317 |
Iino Kaiun Kaisha, Ltd. | | 26,000 | | | 168,969 |
Imasen Electric Industrial | | 7,100 | | | 40,834 |
Imperial Hotel, Ltd. | | 650 | | | 15,161 |
Inaba Denki Sangyo Co., Ltd. | | 6,000 | | | 162,524 |
Inaba Seisakusho Co., Ltd. | | 4,000 | | | 44,750 |
Inabata & Co., Ltd. | | 23,700 | | | 74,685 |
Ines Corp. | | 14,100 | | | 71,595 |
Information Services International-Dentsu, Ltd. | | 4,900 | | | 31,742 |
Inui Steamship Co., Ltd. | | 6,500 | | | 49,069 |
Invoice, Inc. | | 4,571 | | | 20,695 |
Ise Chemical Corp. | | 1,000 | | | 4,139 |
Iseki & Co., Ltd. | | 77,000 | | | 239,377 |
Ishihara Sangyo Kaisha, Ltd. (a) | | 154,000 | | | 130,930 |
Ishii Hyoki Co., Ltd. | | 1,800 | | | 34,304 |
Itochu Enex Co., Ltd. | | 23,600 | | | 166,526 |
Itochu-Shokuhin Co., Ltd. | | 1,800 | | | 69,647 |
Itoham Foods, Inc. | | 74,000 | | | 268,069 |
Itoki Corp. | | 16,300 | | | 51,857 |
Iwasaki Electric Co., Ltd. | | 34,000 | | | 60,163 |
IWATANI Corp. | | 76,000 | | | 189,676 |
Iwatsu Electric Co., Ltd. | | 37,000 | | | 42,831 |
Izumiya Co., Ltd. | | 44,000 | | | 287,355 |
J-Oil Mills, Inc. | | 38,000 | | | 157,843 |
Jalux, Inc. | | 2,000 | | | 31,355 |
Janome Sewing Machine Co., Ltd. | | 88,000 | | | 38,641 |
Japan Airport Terminal Co., Ltd. | | 27,900 | | | 375,155 |
Japan Aviation Electronics Industry, Ltd. | | 27,000 | | | 113,044 |
Japan Carlit Co., Ltd. | | 7,000 | | | 29,918 |
Japan Cash Machine Co., Ltd. | | 6,400 | | | 60,130 |
Japan Digital Laboratory Co., Ltd. | | 9,200 | | | 98,669 |
Japan Pulp & Paper Co., Ltd. | | 33,000 | | | 108,616 |
Japan Radio Co., Ltd. | | 36,000 | | | 54,890 |
Japan Transcity Corp. | | 23,000 | | | 101,901 |
Japan Vilene Co., Ltd. | | 15,000 | | | 70,039 |
Jastec Co., Ltd. | | 5,100 | | | 30,812 |
JBCC Holdings, Inc. | | 5,700 | | | 50,079 |
JBIS Holdings, Inc. | | 5,100 | | | 23,263 |
Jeol, Ltd. | | 25,000 | | | 77,311 |
JFE Shoji Holdings, Inc. | | 53,000 | | | 162,952 |
JK Holdings Co., Ltd. | | 5,600 | | | 36,587 |
JMS Co., Ltd. | | 13,000 | | | 57,106 |
Joban Kosan Co., Ltd. | | 19,000 | | | 31,230 |
Joint Corp. | | 27,600 | | | 46,384 |
*See accompanying notes to financial statements.
MSF-14
Metropolitan Series Fund, Inc.
Met/Dimensional International Small Company Portfolio
Schedule of Investments as of December 31, 2008
Common Stock—(Continued)
| | | | | |
| Security Description | | Shares | | Value* |
| | | | | |
| | |
Japan—(Continued) | | | | | |
Joshin Denki Co., Ltd. | | 15,000 | | $ | 129,440 |
JSP Corp. | | 13,200 | | | 93,416 |
Juki Corp. | | 55,000 | | | 57,668 |
K’s Holdings Corp. | | 17,700 | | | 298,906 |
Kadokawa Group Holdings, Inc. | | 7,900 | | | 184,738 |
Kaga Electronics Co., Ltd. | | 8,500 | | | 102,599 |
Kagawa Bank, Ltd. | | 31,000 | | | 168,070 |
Kakaku.com, Inc. | | 65 | | | 252,111 |
Kaken Pharmaceutical Co., Ltd. | | 37,000 | | | 407,519 |
Kamei Corp. | | 3,000 | | | 16,222 |
Kanaden Corp. | | 4,000 | | | 23,095 |
Kanagawa Chuo Kotsu Co., Ltd. | | 10,000 | | | 60,725 |
Kanamoto Co., Ltd. | | 15,000 | | | 54,327 |
Kandenko Co., Ltd. | | 52,000 | | | 412,472 |
Kanematsu Corp. (a) | | 149,000 | | | 148,278 |
Kanematsu Electronics, Ltd. | | 6,900 | | | 60,011 |
Kanto Auto Works, Ltd. | | 15,200 | | | 174,485 |
Kanto Denka Kogyo Co., Ltd. | | 18,000 | | | 69,113 |
Kanto Natural Gas Development, Ltd. | | 12,000 | | | 76,015 |
Kanto Tsukuba Bank, Ltd. | | 25,500 | | | 88,039 |
Kasai Kogyo Co., Ltd. | | 10,000 | | | 18,646 |
Kasumi Co., Ltd. | | 13,000 | | | 71,982 |
Katakura Chikkarin Co., Ltd. | | 8,000 | | | 30,019 |
Katakura Industries Co., Ltd. | | 9,000 | | | 107,819 |
Kato Sangyo Co., Ltd. | | 7,100 | | | 121,501 |
Kato Works Co., Ltd. | | 27,000 | | | 66,674 |
Kawai Musical Instruments Manufacturing Co., Ltd. | | 30,000 | | | 28,279 |
Kawasaki Kinkai Kisen Kaisha | | 2,000 | | | 6,934 |
Kawasumi Laboratories, Inc. | | 9,000 | | | 42,018 |
Kayaba Industry Co., Ltd. | | 83,000 | | | 160,464 |
Keihin Corp. | | 25,100 | | | 182,488 |
Keiyo Co., Ltd. | | 11,000 | | | 77,846 |
Kenedix, Inc. | | 289 | | | 83,469 |
Kentucky Fried Chicken Japan, Ltd. | | 2,000 | | | 34,683 |
KEY Coffee, Inc. | | 4,900 | | | 85,982 |
Kimura Chemical Plants Co., Ltd. | | 4,900 | | | 41,608 |
Kinki Nippon Tourist Co., Ltd. | | 23,000 | | | 41,266 |
Kinki Sharyo Co., Ltd. | | 12,000 | | | 62,364 |
Kintetsu World Express, Inc. | | 7,100 | | | 139,955 |
Kinugawa Rubber Industrial Co., Ltd. | | 16,000 | | | 19,957 |
Kishu Paper Co., Ltd. | | 37,000 | | | 47,458 |
Kisoji Co., Ltd. | | 5,600 | | | 115,502 |
Kitagawa Iron Works Co., Ltd. | | 33,000 | | | 41,407 |
Kitano Construction Corp. | | 24,000 | | | 56,791 |
Kitz Corp. | | 37,000 | | | 114,577 |
Koa Corp. | | 16,100 | | | 91,701 |
Koatsu Gas Kogyo Co., Ltd. | | 17,000 | | | 94,426 |
Koei Co., Ltd. | | 8,600 | | | 90,511 |
Kohnan Shoji Co., Ltd. | | 10,300 | | | 138,851 |
Kohsoku Corp. | | 5,000 | | | 33,400 |
Koike Sanso Kogyo Co., Ltd. | | 13,000 | | | 35,852 |
Kojima Co., Ltd. | | 11,300 | | | 34,668 |
Kokuyo Co., Ltd. | | 47,000 | | | 341,834 |
Komatsu Seiren Co., Ltd. | | 3,000 | | | 14,726 |
Komatsu Wall Industry Co., Ltd. | | 2,400 | | | 30,201 |
Komori Corp. | | 36,500 | | | 399,837 |
Konaka Co., Ltd. | | 12,400 | | | 34,850 |
| | | | | |
| Security Description | | Shares | | Value* |
| | | | | |
| | |
Japan—(Continued) | | | | | |
Konishi Co., Ltd. | | 5,900 | | $ | 56,498 |
Kosaido Co., Ltd. | | 3,700 | | | 11,000 |
Kosei Securities Co., Ltd. | | 14,000 | | | 11,831 |
Krosaki Harima Corp. | | 26,000 | | | 69,443 |
KRS Corp. | | 2,700 | | | 27,460 |
Kumagai Gumi Co., Ltd. | | 81,000 | | | 40,950 |
Kumiai Chemical Industry Co., Ltd. | | 30,000 | | | 91,898 |
Kura Corp. | | 25 | | | 45,698 |
Kurabo Industries, Ltd. | | 87,000 | | | 145,505 |
KUREHA Corp. | | 65,000 | | | 324,766 |
Kurimoto, Ltd. | | 53,000 | | | 35,208 |
Kuroda Electric Co., Ltd. | | 11,800 | | | 110,741 |
Kyodo Printing Co., Ltd. | | 41,000 | | | 102,584 |
Kyodo Shiryo Co., Ltd. | | 30,000 | | | 39,065 |
Kyoei Tanker Co., Ltd. | | 13,000 | | | 37,352 |
Kyokuto Kaihatsu Kogyo Co., Ltd. | | 17,900 | | | 65,616 |
Kyokuyo Co., Ltd. | | 28,000 | | | 65,396 |
Kyorin Co., Ltd. | | 22,000 | | | 314,737 |
Kyoritsu Maintenance Co., Ltd. | | 4,000 | | | 66,634 |
Kyosan Electric Manufacturing Co., Ltd. | | 22,000 | | | 83,699 |
Kyoto Kimono Yuzen Co., Ltd. | | 44 | | | 29,205 |
Kyowa Electronics Instruments Co., Ltd. | | 6,000 | | | 20,720 |
Kyowa Leather Cloth Co., Ltd. | | 3,300 | | | 19,099 |
Kyudenko Corp. | | 20,000 | | | 164,092 |
Life Corp. | | 2,300 | | | 46,617 |
Lintec Corp. | | 22,800 | | | 316,300 |
Macnica, Inc. | | 4,500 | | | 61,400 |
Maeda Corp. | | 74,000 | | | 300,466 |
Maeda Road Construction Co., Ltd. | | 35,000 | | | 352,190 |
Maezawa Kasei Industries Co., Ltd. | | 2,500 | | | 25,245 |
Maezawa Kyuso Industries Co., Ltd. | | 5,300 | | | 85,690 |
Makino Milling Machine Co., Ltd. | | 61,000 | | | 165,848 |
Mandom Corp. | | 8,700 | | | 247,431 |
Mars Engineering Corp. | | 3,200 | | | 108,147 |
Marubun Corp. | | 10,300 | | | 44,125 |
Marudai Food Co., Ltd. | | 49,000 | | | 138,351 |
Maruei Department Store Co., Ltd. | | 20,000 | | | 45,189 |
Maruha Nichiro Holdings, Inc. | | 182,000 | | | 309,019 |
Maruka Machinery Co., Ltd. | | 3,000 | | | 18,945 |
Marusan Securities Co., Ltd. | | 22,000 | | | 111,803 |
Maruwn Corp. | | 2,200 | | | 7,130 |
Maruyama Manufacturing Co. Inc | | 18,000 | | | 35,989 |
Maruzen Co., Ltd. (a) | | 57,000 | | | 41,373 |
Maruzen Showa Unyu Co., Ltd. | | 28,000 | | | 91,709 |
Maspro Denkoh Corp. | | 6,200 | | | 61,308 |
Matsuda Sangyo Co., Ltd. | | 4,100 | | | 40,627 |
Matsui Construction Co., Ltd. | | 10,000 | | | 37,930 |
Matsuya Co., Ltd. | | 11,700 | | | 263,565 |
Matsuya Foods Co., Ltd. | | 3,700 | | | 53,213 |
Max Co., Ltd. | | 14,000 | | | 168,311 |
Maxvalu Tokai Co., Ltd. | | 4,600 | | | 79,205 |
MEC Co., Ltd. | | 4,800 | | | 15,315 |
Megachips Corp. | | 4,300 | | | 77,741 |
Meidensha Corp. | | 73,000 | | | 232,464 |
Meiji Shipping Co., Ltd. | | 8,500 | | | 40,150 |
Meitec Corp. | | 14,000 | | | 243,036 |
Meito Sangyo Co., Ltd. | | 4,900 | | | 97,719 |
*See accompanying notes to financial statements.
MSF-15
Metropolitan Series Fund, Inc.
Met/Dimensional International Small Company Portfolio
Schedule of Investments as of December 31, 2008
Common Stock—(Continued)
| | | | | |
| Security Description | | Shares | | Value* |
| | | | | |
| | |
Japan—(Continued) | | | | | |
Meito Transportation Co., Ltd. | | 1,400 | | $ | 12,850 |
Meiwa Estate Co., Ltd. | | 10,300 | | | 51,737 |
Melco Holdings, Inc. | | 4,300 | | | 44,297 |
Mercian Corp. | | 31,000 | | | 61,540 |
Mikuni Coca-Cola Bottling Co., Ltd. | | 11,100 | | | 107,424 |
Milbon Co., Ltd. | | 3,000 | | | 84,053 |
Mimasu Semiconductor Industry Co., Ltd. | | 6,800 | | | 64,449 |
Minebea Co., Ltd. | | 178,000 | | | 611,670 |
Ministop Co., Ltd. | | 4,400 | | | 91,966 |
Miraca Holdings, Inc. | | 24,500 | | | 533,093 |
Misawa Homes Co., Ltd. (a) | | 13,200 | | | 37,181 |
Mito Securities Co., Ltd. | | 21,000 | | | 64,562 |
Mitsuba Corp. | | 18,000 | | | 65,830 |
Mitsubishi Cable Industries, Ltd. | | 47,000 | | | 42,711 |
Mitsubishi Kakoki Kaisha, Ltd. | | 22,000 | | | 59,924 |
Mitsubishi Paper Mills, Ltd. | | 124,000 | | | 293,276 |
Mitsubishi Pencil Co., Ltd. | | 6,500 | | | 78,967 |
Mitsubishi Steel Manufacturing Co., Ltd. | | 43,000 | | | 112,364 |
Mitsuboshi Belting Co., Ltd. | | 30,000 | | | 160,524 |
Mitsui Engineering & Shipbuilding Co., Ltd. | | 350,000 | | | 587,951 |
Mitsui High-Tec, Inc. | | 12,500 | | | 67,873 |
Mitsui Home Co., Ltd. | | 22,000 | | | 110,206 |
Mitsui Knowledge Industry Co., Ltd. | | 322 | | | 57,139 |
Mitsui Matsushima Co., Ltd. | | 25,000 | | | 35,648 |
Mitsui Mining & Smelting Co., Ltd. | | 322,000 | | | 680,464 |
Mitsui Mining Co., Ltd. | | 47,000 | | | 70,469 |
Mitsui Sugar Co., Ltd. | | 29,000 | | | 111,076 |
Mitsui-Soko Co., Ltd. | | 33,000 | | | 184,958 |
Mitsumi Electric Co., Ltd. | | 39,300 | | | 694,648 |
Mitsumura Printing Co., Ltd. | | 1,000 | | | 3,718 |
Mitsuuroko Co., Ltd. | | 11,000 | | | 74,716 |
Miura Co., Ltd. | | 12,500 | | | 309,337 |
Miyoshi Oil & Fat Co., Ltd. | | 30,000 | | | 43,861 |
Miyuki Holdings Co., Ltd. | | 5,000 | | | 11,150 |
Mizuho Investors Securities Co., Ltd. | | 173,000 | | | 140,839 |
Mizuno Corp. | | 32,000 | | | 153,451 |
Modec, Inc. | | 5,100 | | | 99,072 |
Monex Beans Holdings, Inc. | | 469 | | | 152,885 |
Mori Seiki Co., Ltd. | | 43,300 | | | 335,491 |
Morinaga & Co., Ltd. | | 64,000 | | | 141,684 |
Morinaga Milk Industry Co., Ltd. | | 85,000 | | | 331,004 |
Morita Holdings Corp. | | 8,000 | | | 41,178 |
Morozoff, Ltd. | | 4,000 | | | 13,915 |
Mory Industries, Inc. | | 20,000 | | | 47,968 |
MOS Food Services, Inc. | | 8,000 | | | 118,330 |
Moshi Moshi Hotline, Inc. | | 8,900 | | | 238,967 |
Mr Max Corp. | | 15,700 | | | 88,732 |
Mutoh Holdings Co., Ltd. (a) | | 21,000 | | | 49,879 |
Mutow Co., Ltd. | | 9,500 | | | 58,185 |
Nabtesco Corp. | | 44,000 | | | 294,489 |
Nachi-Fujikoshi Corp. | | 69,000 | | | 130,239 |
Nagatanien Co., Ltd. | | 6,000 | | | 55,983 |
Nakabayashi Co., Ltd. | | 17,000 | | | 36,076 |
Nakamuraya Co., Ltd. | | 9,000 | | | 51,111 |
Nakayama Steel Works, Ltd. | | 52,000 | | | 128,171 |
NEC Fielding, Ltd. | | 6,000 | | | 81,475 |
NEC Leasing, Ltd. | | 9,100 | | | 80,902 |
| | | | | |
| Security Description | | Shares | | Value* |
| | | | | |
| | |
Japan—(Continued) | | | | | |
NEC Mobiling, Ltd. | | 2,100 | | $ | 33,383 |
NEC Networks & System Integration Corp. | | 9,600 | | | 117,089 |
NEC Tokin Corp. | | 16,000 | | | 63,825 |
NET One Systems Co., Ltd. | | 191 | | | 383,666 |
Neturen Co., Ltd. | | 13,200 | | | 91,634 |
New Japan Radio Co., Ltd. | | 15,000 | | | 28,650 |
NHK Spring Co., Ltd. | | 88,000 | | | 322,843 |
Nice Holdings, Inc. | | 31,000 | | | 53,717 |
Nichia Steel Works, Ltd. | | 18,000 | | | 44,734 |
Nichias Corp. | | 37,000 | | | 92,950 |
Nichiban Co., Ltd. | | 14,000 | | | 49,951 |
Nichicon Corp. | | 28,700 | | | 183,484 |
Nichiha Corp. | | 10,500 | | | 61,892 |
Nichii Gakkan Co. | | 8,300 | | | 121,175 |
Nichireki Co., Ltd. | | 1,000 | | | 3,423 |
Nidec Copal Corp. | | 5,900 | | | 41,220 |
Nidec Sankyo Corp. | | 24,000 | | | 89,794 |
Nidec Servo Corp. | | 8,000 | | | 27,441 |
Nidec-Tosok Corp. | | 1,800 | | | 12,794 |
Nifco, Inc. | | 19,600 | | | 199,640 |
Nihon Chouzai Co., Ltd. | | 1,990 | | | 28,053 |
Nihon Dempa Kogyo Co., Ltd. | | 7,700 | | | 91,303 |
Nihon Kohden Corp. | | 15,400 | | | 366,317 |
Nihon Nohyaku Co., Ltd. | | 15,000 | | | 100,858 |
Nihon Parkerizing Co., Ltd. | | 22,000 | | | 190,793 |
Nihon Spindle Manufacturing Co., Ltd. | | 15,000 | | | 27,142 |
Nihon Yamamura Glass Co., Ltd. | | 51,000 | | | 112,102 |
Nikkiso Co., Ltd. | | 15,000 | | | 85,420 |
Nikko Co., Ltd. | | 5,000 | | | 15,467 |
Nippo Corp. | | 35,000 | | | 297,597 |
Nippon Beet Sugar Manufacturing Co., Ltd. | | 53,000 | | | 143,277 |
Nippon Carbon Co., Ltd. | | 34,000 | | | 102,244 |
Nippon Ceramic Co., Ltd. | | 6,400 | | | 62,785 |
Nippon Chemi-Con Corp. | | 57,000 | | | 121,558 |
Nippon Chemical Industrial Co., Ltd. | | 38,000 | | | 97,963 |
Nippon Chemiphar Co., Ltd. | | 10,000 | | | 31,374 |
Nippon Denko Co., Ltd. | | 27,000 | | | 139,361 |
Nippon Densetsu Kogyo Co., Ltd. | | 14,000 | | | 165,300 |
Nippon Denwa Shisetsu Co., Ltd. | | 5,000 | | | 14,863 |
Nippon Felt Co., Ltd. | | 1,500 | | | 6,966 |
Nippon Filcon Co., Ltd. | | 6,600 | | | 35,788 |
Nippon Fine Chemical Co., Ltd. | | 7,400 | | | 54,066 |
Nippon Flour Mills Co., Ltd. | | 52,000 | | | 285,545 |
Nippon Formula Feed Manufacturing Co., Ltd. | | 25,000 | | | 34,578 |
Nippon Gas Co., Ltd. | | 8,300 | | | 128,583 |
Nippon Hume Corp. | | 6,000 | | | 19,720 |
Nippon Kanzai Co., Ltd. | | 3,600 | | | 72,268 |
Nippon Kasei Chemical Co., Ltd. | | 14,000 | | | 25,634 |
Nippon Kayaku Co., Ltd. | | 88,000 | | | 458,957 |
Nippon Kinzoku Co., Ltd. | | 29,000 | | | 41,620 |
Nippon Koei Co., Ltd. | | 37,000 | | | 88,256 |
Nippon Konpo Unyu Soko Co., Ltd. | | 32,000 | | | 354,746 |
Nippon Koshuha Steel Co., Ltd. | | 34,000 | | | 32,765 |
Nippon Light Metal Co., Ltd. | | 274,000 | | | 278,558 |
Nippon Metal Industry Co., Ltd. | | 57,000 | | | 79,119 |
Nippon Paint Co., Ltd. | | 93,000 | | | 372,087 |
Nippon Parking Development Co., Ltd. | | 803 | | | 32,139 |
*See accompanying notes to financial statements.
MSF-16
Metropolitan Series Fund, Inc.
Met/Dimensional International Small Company Portfolio
Schedule of Investments as of December 31, 2008
Common Stock—(Continued)
| | | | | |
| Security Description | | Shares | | Value* |
| | | | | |
| | |
Japan—(Continued) | | | | | |
Nippon Pillar Packing Co., Ltd. | | 11,000 | | $ | 38,863 |
Nippon Piston Ring Co., Ltd. | | 28,000 | | | 27,926 |
Nippon Seiki Co., Ltd. | | 20,000 | | | 118,030 |
Nippon Seisen Co., Ltd. | | 15,000 | | | 39,768 |
Nippon Shinyaku Co., Ltd. | | 24,000 | | | 286,146 |
Nippon Shokubai Co., Ltd. | | 64,000 | | | 495,457 |
Nippon Signal Co., Ltd. | | 21,100 | | | 142,702 |
Nippon Soda Co., Ltd. | | 59,000 | | | 236,530 |
Nippon Steel Trading Co., Ltd. | | 22,000 | | | 35,311 |
Nippon Suisan Kaisha, Ltd. | | 127,400 | | | 329,296 |
Nippon Thompson Co., Ltd. | | 30,000 | | | 125,959 |
Nippon Valqua Industries, Ltd. | | 32,000 | | | 83,971 |
Nippon Yakin Kogyo Co., Ltd. | | 62,500 | | | 178,082 |
Nippon Yusoki Co., Ltd. | | 2,000 | | | 5,155 |
Nipro Corp. | | 22,000 | | | 388,097 |
Nishimatsu Construction Co., Ltd. | | 148,000 | | | 222,421 |
Nishimatsuya Chain Co., Ltd. | | 24,200 | | | 221,222 |
Nissan Shatai Co., Ltd. | | 43,000 | | | 264,115 |
Nissei Corp. | | 3,200 | | | 23,593 |
Nissen Holdings Co., Ltd. | | 14,000 | | | 76,130 |
Nissho Electronics Corp. | | 10,100 | | | 60,742 |
Nissin Corp. | | 30,000 | | | 83,275 |
Nissin Electric Co., Ltd. | | 28,000 | | | 125,269 |
Nissin Kogyo Co., Ltd. | | 17,400 | | | 129,670 |
Nissin Sugar Manufacturing Co., Ltd. | | 7,000 | | | 16,599 |
Nissui Pharmaceutical Co., Ltd. | | 2,200 | | | 18,124 |
Nitta Corp. | | 11,900 | | | 157,935 |
Nittan Valve Co., Ltd. | | 10,500 | | | 26,850 |
Nittetsu Mining Co., Ltd. | | 31,000 | | | 95,578 |
Nitto Boseki Co., Ltd. | | 132,000 | | | 263,030 |
Nitto Fuji Flour Milling Co., Ltd. | | 4,000 | | | 12,674 |
Nitto Kogyo Corp. | | 11,900 | | | 108,121 |
Nitto Kohki Co., Ltd. | | 3,800 | | | 67,443 |
Nitto Seiko Co., Ltd. | | 11,000 | | | 37,759 |
NOF Corp. | | 74,000 | | | 293,552 |
Nohmi Bosai, Ltd. | | 9,000 | | | 118,507 |
Nomura Co., Ltd. | | 19,000 | | | 54,092 |
Noritake Co., Ltd. | | 47,000 | | | 171,232 |
Noritsu Koki Co., Ltd. | | 8,700 | | | 62,922 |
Nosan Corp. | | 18,000 | | | 40,379 |
NS Solutions Corp. | | 8,800 | | | 115,140 |
NSD Co., Ltd. | | 10,900 | | | 85,744 |
O-M, Ltd. | | 8,000 | | | 28,838 |
Oenon Holdings, Inc. | | 17,000 | | | 56,047 |
Ohara, Inc. | | 4,400 | | | 35,642 |
Oiles Corp. | | 10,400 | | | 149,650 |
Okabe Co., Ltd. | | 18,600 | | | 85,198 |
Okamoto Industries, Inc. | | 29,000 | | | 115,770 |
Okamura Corp. | | 31,000 | | | 174,024 |
Okasan Securities Group, Inc. | | 88,000 | | | 385,521 |
Oki Electric Industry Co., Ltd. | | 308,000 | | | 197,313 |
OKK Corp. | | 32,000 | | | 37,343 |
Okuma Holdings, Inc. | | 81,000 | | | 304,025 |
Okumura Corp. | | 84,000 | | | 424,848 |
Okura Industrial Co., Ltd. | | 24,000 | | | 56,068 |
Okuwa Co., Ltd. | | 10,000 | | | 151,420 |
Olympic Corp. | | 9,300 | | | 69,391 |
| | | | | |
| Security Description | | Shares | | Value* |
| | | | | |
| | |
Japan—(Continued) | | | | | |
OMC Card, Inc. | | 43,900 | | $ | 85,785 |
ONO Sokki Co., Ltd. | | 9,000 | | | 39,499 |
Onoken Co., Ltd. | | 7,000 | | | 68,046 |
Organo Corp. | | 11,000 | | | 71,375 |
Oriental Yeast Co., Ltd. | | 4,000 | | | 21,180 |
Origin Electric Co., Ltd. | | 11,000 | | | 30,316 |
Osaka Organic Chemical Industry, Ltd. | | 100 | | | 469 |
Osaka Steel Co., Ltd. | | 8,300 | | | 107,827 |
OSAKA Titanium Technologies Co., Ltd. | | 8,000 | | | 201,830 |
Osaki Electric Co., Ltd. | | 11,000 | | | 71,125 |
OSG Corp. | | 33,800 | | | 288,188 |
Oyo Corp. | | 7,600 | | | 99,636 |
Pacific Industrial Co., Ltd. | | 16,000 | | | 44,633 |
Pacific Metals Co., Ltd. | | 74,000 | | | 370,477 |
PanaHome Corp. | | 37,000 | | | 220,350 |
Paramount Bed Co., Ltd. | | 7,400 | | | 100,824 |
Parco Co., Ltd. | | 32,300 | | | 295,510 |
Paris Miki, Inc. | | 8,700 | | | 81,073 |
Park24 Co., Ltd. | | 41,100 | | | 309,912 |
Pasco Corp. (a) | | 17,000 | | | 26,951 |
Pasona Group, Inc. | | 50 | | | 26,633 |
Penta-Ocean Construction Co., Ltd. | | 130,500 | | | 188,711 |
PIA Corp. (a) | | 2,000 | | | 20,987 |
Pigeon Corp. | | 6,800 | | | 203,368 |
Pilot Corp. | | 44 | | | 70,980 |
Piolax, Inc. | | 3,000 | | | 40,506 |
Pioneer Corp. | | 97,000 | | | 178,830 |
Press Kogyo Co., Ltd. | | 44,000 | | | 60,684 |
Prima Meat Packers, Ltd. | | 57,000 | | | 112,519 |
Pronexus, Inc. | | 8,100 | | | 75,263 |
Raito Kogyo Co., Ltd. | | 24,200 | | | 44,003 |
Rasa Industries, Ltd. | | 33,000 | | | 51,141 |
Renown, Inc. (a) | | 23,900 | | | 31,918 |
Resort Solution Co., Ltd. | | 1,000 | | | 2,406 |
Resort Trust, Inc. | | 11,200 | | | 125,567 |
Rheon Automatic Machinery Co., Ltd. | | 5,000 | | | 15,085 |
Rhythm Watch Co., Ltd. | | 57,000 | | | 53,309 |
Ricoh Leasing Co., Ltd. | | 6,800 | | | 123,830 |
Right On Co., Ltd. | | 4,600 | | | 74,746 |
Riken Corp. | | 38,000 | | | 90,380 |
Riken Keiki Co., Ltd. | | 7,500 | | | 50,145 |
Riken Technos Corp. | | 8,000 | | | 17,351 |
Riken Vitamin Co., Ltd. | | 100 | | | 2,893 |
Ringer Hut Co., Ltd. | | 5,200 | | | 68,321 |
Risa Partners, Inc. | | 106 | | | 50,153 |
Rock Field Co., Ltd. | | 3,800 | | | 49,976 |
Roland Corp. | | 10,200 | | | 136,528 |
Roland DG Corp. | | 3,700 | | | 55,386 |
Round One Corp. | | 200 | | | 155,250 |
Royal Holdings Co., Ltd. | | 9,000 | | | 93,994 |
Ryobi, Ltd. | | 73,000 | | | 149,008 |
Ryoden Trading Co., Ltd. | | 9,000 | | | 51,840 |
Ryosan Co., Ltd. | | 17,800 | | | 426,850 |
Ryoshoku, Ltd. | | 5,000 | | | 125,360 |
Ryoyo Electro Corp. | | 11,000 | | | 97,078 |
S&B Foods, Inc. | | 2,000 | | | 17,648 |
S. Foods, Inc. | | 2,500 | | | 22,358 |
*See accompanying notes to financial statements.
MSF-17
Metropolitan Series Fund, Inc.
Met/Dimensional International Small Company Portfolio
Schedule of Investments as of December 31, 2008
Common Stock—(Continued)
| | | | | |
| Security Description | | Shares | | Value* |
| | | | | |
| | |
Japan—(Continued) | | | | | |
Sagami Chain Co., Ltd. | | 3,000 | | $ | 31,633 |
Saibu Gas Co., Ltd. | | 82,000 | | | 230,432 |
Saizeriya Co., Ltd. | | 12,500 | | | 175,892 |
Sakai Chemical Industry Co., Ltd. | | 48,000 | | | 129,951 |
Sakata INX Corp. | | 20,000 | | | 70,900 |
Sakata Seed Corp. | | 14,600 | | | 215,313 |
Sala Corp. | | 11,000 | | | 68,115 |
San Holdings, Inc. | | 600 | | | 12,588 |
San-Ai Oil Co., Ltd. | | 22,000 | | | 97,923 |
Sanden Corp. | | 56,000 | | | 126,881 |
Sanei-International Co., Ltd. | | 5,700 | | | 56,266 |
Sanken Electric Co., Ltd. | | 53,000 | | | 208,239 |
Sanki Engineering Co., Ltd. | | 23,000 | | | 162,030 |
Sankyo Seiko Co., Ltd. | | 23,700 | | | 43,294 |
Sankyo-Tateyama Holdings, Inc. | | 127,000 | | | 119,242 |
Sankyu, Inc. | | 112,000 | | | 412,561 |
Sanoh Industrial Co., Ltd. | | 10,100 | | | 40,409 |
Sanrio Co., Ltd. | | 19,200 | | | 183,690 |
Sanshin Electronics Co., Ltd. | | 12,600 | | | 113,343 |
Sansui Electric Co., Ltd. (a) | | 316,000 | | | 21,167 |
Sanwa Holdings Corp. | | 103,000 | | | 397,529 |
Sanyo Chemical Industries, Ltd. | | 30,000 | | | 177,178 |
Sanyo Denki Co., Ltd. | | 15,000 | | | 36,499 |
Sanyo Housing Nagoya Co., Ltd. | | 25 | | | 23,353 |
Sanyo Shokai, Ltd. | | 45,000 | | | 178,734 |
Sanyo Special Steel Co., Ltd. | | 61,000 | | | 180,683 |
Sasebo Heavy Industries Co., Ltd. | | 37,000 | | | 73,377 |
Sato Corp. | | 7,500 | | | 84,840 |
Sato Shoji Corp. | | 4,600 | | | 30,018 |
Satori Electric Co., Ltd. | | 6,600 | | | 28,587 |
Secom Joshinetsu Co., Ltd. | | 900 | | | 15,955 |
Secom Techno Service Co., Ltd. | | 2,500 | | | 65,724 |
Seibu Electric Industry Co., Ltd. | | 2,000 | | | 9,352 |
Seika Corp. | | 28,000 | | | 67,625 |
Seikagaku Corp. | | 10,700 | | | 116,464 |
Seiko Holdings Corp. | | 31,000 | | | 70,113 |
Seino Holdings Corp. | | 92,000 | | | 511,830 |
Seiren Co., Ltd. | | 17,800 | | | 81,240 |
Sekisui Jushi Corp. | | 15,000 | | | 129,278 |
Sekisui Plastics Co., Ltd. | | 34,000 | | | 116,063 |
Senko Co., Ltd. | | 23,000 | | | 101,523 |
Senshu Electric Co., Ltd. | | 3,000 | | | 36,638 |
Senshukai Co., Ltd. | | 14,700 | | | 115,335 |
Shibaura Mechatronics Corp. | | 9,000 | | | 35,738 |
Shibuya Kogyo Co., Ltd. | | 1,600 | | | 14,483 |
Shikibo, Ltd. | | 49,000 | | | 70,545 |
Shikoku Chemicals Corp. | | 12,000 | | | 50,662 |
Shikoku Coca-Cola Bottling Co., Ltd. | | 6,700 | | | 63,933 |
Shima Seiki Manufacturing, Ltd. | | 10,800 | | | 213,360 |
Shin Nippon Air Technologies Co., Ltd. | | 8,100 | | | 71,769 |
Shin-Etsu Polymer Co., Ltd. | | 23,100 | | | 111,426 |
Shin-Keisei Electric Railway Co., Ltd. | | 4,000 | | | 16,346 |
Shin-Kobe Electric Machinery Co., Ltd. | | 13,000 | | | 118,137 |
Shinagawa Refractories Co., Ltd. | | 29,000 | | | 56,934 |
Shindengen Electric Manufacturing Co., Ltd. | | 35,000 | | | 63,739 |
Shinkawa, Ltd. | | 8,000 | | | 94,850 |
Shinki Co., Ltd. | | 54,100 | | | 41,492 |
| | | | | |
| Security Description | | Shares | | Value* |
| | | | | |
| | |
Japan—(Continued) | | | | | |
Shinko Electric Co., Ltd. | | 33,000 | | $ | 112,742 |
Shinko Electric Industries Co., Ltd. | | 36,600 | | | 298,648 |
Shinko Plantech Co., Ltd. | | 11,700 | | | 99,036 |
Shinko Shoji Co., Ltd. | | 9,200 | | | 87,816 |
Shinko Wire Co., Ltd. | | 10,000 | | | 18,000 |
Shinmaywa Industries, Ltd. | | 48,000 | | | 130,328 |
Shinsho Corp. | | 18,000 | | | 35,397 |
Shinwa Kaiun Kaisha, Ltd. | | 32,000 | | | 87,200 |
Shiroki Corp. | | 25,000 | | | 55,661 |
Shizuoka Gas Co., Ltd. | | 15,000 | | | 96,041 |
Shochiku Co., Ltd. | | 34,000 | | | 239,243 |
Shoko Co., Ltd. | | 27,000 | | | 32,434 |
Showa Aircraft Industry Co., Ltd. | | 1,000 | | | 4,559 |
Showa Corp. | | 26,100 | | | 92,815 |
Showa Sangyo Co., Ltd. | | 30,000 | | | 101,587 |
Siix Corp. | | 9,300 | | | 29,602 |
Sinanen Co., Ltd. | | 17,000 | | | 78,485 |
Sintokogio, Ltd. | | 25,300 | | | 173,088 |
SKY Perfect JSAT Holdings, Inc. | | 849 | | | 413,281 |
SMK Corp. | | 30,000 | | | 88,869 |
SNT Corp. | | 8,200 | | | 33,155 |
Soda Nikka Co., Ltd. | | 3,000 | | | 10,678 |
Sodick Co., Ltd. | | 26,900 | | | 42,904 |
Soft99 Corp. | | 300 | | | 1,647 |
Sogo Medical Co., Ltd. | | 2,000 | | | 69,786 |
Sohgo Security Services Co., Ltd. | | 27,000 | | | 281,364 |
Sorun Corp. | | 8,100 | | | 46,969 |
Sotoh Co., Ltd. | | 400 | | | 4,809 |
Space Co., Ltd. | | 200 | | | 1,297 |
SRA Holdings | | 4,200 | | | 31,962 |
SSP Co., Ltd. | | 20,000 | | | 133,041 |
ST Corp. | | 3,700 | | | 50,662 |
St. Marc Holdings Co., Ltd. | | 2,200 | | | 65,854 |
Star Micronics Co., Ltd. | | 14,800 | | | 156,744 |
Starzen Co., Ltd. | | 15,000 | | | 39,494 |
Stella Chemifa Corp. | | 2,400 | | | 37,558 |
Subaru Enterprise Co., Ltd. | | 1,000 | | | 3,391 |
Sugimoto & Co., Ltd. | | 1,800 | | | 18,741 |
Sumida Corp. | | 7,400 | | | 41,167 |
Suminoe Textile Co., Ltd. | | 7,000 | | | 10,137 |
Sumisho Computer Systems Corp. | | 10,300 | | | 171,373 |
Sumitomo Bakelite Co., Ltd. | | 112,000 | | | 452,541 |
Sumitomo Densetsu Co., Ltd. | | 10,500 | | | 63,601 |
Sumitomo Light Metal Industries, Ltd. | | 125,000 | | | 114,858 |
Sumitomo Mitsui Construction Co., Ltd. (a) | | 102,300 | | | 74,043 |
Sumitomo Osaka Cement Co., Ltd. | | 242,000 | | | 619,608 |
Sumitomo Pipe & Tube Co., Ltd. | | 11,100 | | | 77,407 |
Sumitomo Precision Products Co., Ltd. | | 12,000 | | | 50,264 |
Sumitomo Real Estate Sales Co., Ltd. | | 2,530 | | | 77,033 |
Sumitomo Seika Chemicals Co., Ltd. | | 20,000 | | | 60,638 |
Sunx, Ltd. | | 12,600 | | | 40,666 |
SWCC Showa Holdings Co., Ltd. | | 127,000 | | | 82,923 |
SxL Corp. (a) | | 40,000 | | | 17,546 |
SystemPro Co., Ltd. | | 50 | | | 27,077 |
T Hasegawa Co., Ltd. | | 9,100 | | | 122,590 |
T RAD Co., Ltd. | | 29,000 | | | 49,117 |
T-GAIA Corp. | | 52 | | | 71,131 |
*See accompanying notes to financial statements.
MSF-18
Metropolitan Series Fund, Inc.
Met/Dimensional International Small Company Portfolio
Schedule of Investments as of December 31, 2008
Common Stock—(Continued)
| | | | | |
| Security Description | | Shares | | Value* |
| | | | | |
| | |
Japan—(Continued) | | | | | |
Tachi-S Co., Ltd. | | 12,100 | | $ | 65,554 |
Tachibana Eletech Co., Ltd. | | 6,700 | | | 65,474 |
Tadano, Ltd. | | 47,000 | | | 249,009 |
Taihei Dengyo Kaisha, Ltd. | | 14,000 | | | 158,087 |
Taihei Kogyo Co., Ltd. | | 22,000 | | | 68,003 |
Taiheiyo Cement Corp. | | 567,000 | | | 1,092,718 |
Taiho Kogyo Co., Ltd. | | 11,900 | | | 56,293 |
Taikisha, Ltd. | | 10,900 | | | 156,843 |
Taisei Lamick Co., Ltd. | | 1,300 | | | 29,664 |
Taisei Rotec Corp. | | 38,000 | | | 52,840 |
Taiyo Yuden Co., Ltd. | | 54,000 | | | 305,230 |
Takamatsu Construction Group Co., Ltd. | | 6,000 | | | 98,639 |
Takano Co., Ltd. | | 6,600 | | | 33,262 |
Takaoka Electric Manufacturing Co., Ltd. | | 37,000 | | | 72,408 |
Takara Holdings, Inc. | | 83,000 | | | 491,665 |
Takara Printing Co., Ltd. | | 3,100 | | | 27,462 |
Takara Standard Co., Ltd. | | 51,000 | | | 328,196 |
Takasago International Corp. | | 29,000 | | | 202,660 |
Takasago Thermal Engineering Co., Ltd. | | 30,000 | | | 251,993 |
Takata Corp. | | 20,300 | | | 143,333 |
Takiron Co., Ltd. | | 19,000 | | | 64,128 |
Takuma Co., Ltd. | | 35,000 | | | 60,720 |
Tamura Corp. | | 32,000 | | | 54,627 |
Tatsuta Electric Wire and Cable Co., Ltd. | | 30,000 | | | 66,463 |
Tayca Corp. | | 4,000 | | | 9,597 |
TCM Corp. | | 37,000 | | | 55,474 |
Teac Corp. (a) | | 62,000 | | | 24,423 |
TECHNO ASSOCIE Co., Ltd. | | 300 | | | 2,626 |
Techno Ryowa, Ltd. | | 100 | | | 596 |
Tecmo, Ltd. | | 5,700 | | | 51,889 |
Teikoku Electric Manufacturing Co., Ltd. | | 3,700 | | | 48,297 |
Teikoku Piston Ring Co., Ltd. | | 7,900 | | | 32,742 |
Teikoku Sen-I Co., Ltd. | | 3,000 | | | 12,345 |
Teikoku Tsushin Kogyo Co., Ltd. | | 20,000 | | | 42,723 |
Tekken Corp. | | 59,000 | | | 65,052 |
Ten Allied Co., Ltd. | | 2,600 | | | 8,791 |
Tenma Corp. | | 10,500 | | | 159,266 |
Teraoka Seisakusho Co., Ltd. | | 100 | | | 514 |
The Aichi Bank, Ltd. | | 2,400 | | | 182,944 |
The Akita Bank, Ltd. | | 94,000 | | | 407,093 |
The Aomori Bank, Ltd. | | 54,000 | | | 243,688 |
The Bank of Okinawa, Ltd. | | 10,000 | | | 410,601 |
The Bank of Saga, Ltd. | | 54,000 | | | 200,664 |
The Chiba Kogyo Bank, Ltd. (a) | | 17,000 | | | 242,407 |
The Chukyo Bank, Ltd. | | 57,000 | | | 219,086 |
The Daiei, Inc. (a) | | 41,550 | | | 266,072 |
The Daisan Bank, Ltd. | | 56,000 | | | 196,226 |
The Daito Bank, Ltd. | | 46,000 | | | 33,129 |
The Ehime Bank, Ltd. | | 50,000 | | | 174,014 |
The Eighteenth Bank, Ltd. | | 60,000 | | | 225,270 |
The Fuji Fire & Marine Insurance Co., Ltd. | | 78,000 | | | 117,013 |
The Fukui Bank, Ltd. | | 83,000 | | | 308,387 |
The Fukushima Bank, Ltd. | | 68,000 | | | 38,813 |
The Higashi-Nippon Bank, Ltd. | | 62,000 | | | 215,899 |
The Hokuetsu Bank, Ltd. | | 66,000 | | | 149,712 |
The Japan General Estate Co., Ltd. | | 15,800 | | | 24,730 |
The Japan Wool Textile Co., Ltd. | | 30,000 | | | 207,210 |
| | | | | |
| Security Description | | Shares | | Value* |
| | | | | |
| | |
Japan—(Continued) | | | | | |
The Keihin Co., Ltd. | | 22,000 | | $ | 27,800 |
The Kita-Nippon Bank, Ltd. | | 3,200 | | | 97,070 |
The Maruetsu, Inc. (a) | | 32,000 | | | 200,385 |
The Michinoku Bank, Ltd. | | 39,000 | | | 93,251 |
The Minato Bank, Ltd. | | 76,000 | | | 118,493 |
The Miyazaki Bank, Ltd. | | 49,000 | | | 186,494 |
The Musashino Bank, Ltd. | | 15,700 | | | 616,577 |
The Nagano Bank, Ltd. | | 12,000 | | | 32,284 |
The Nippon Road Co., Ltd. | | 42,000 | | | 76,850 |
The Nippon Synthetic Chemical Industry Co., Ltd. | | 31,000 | | | 86,921 |
The Nisshin Oillio Group, Ltd. | | 54,000 | | | 314,038 |
The Oita Bank, Ltd. | | 66,000 | | | 450,866 |
The Okinawa Electric Power Co., Inc. | | 8,000 | | | 596,046 |
The Pack Corp. | | 4,600 | | | 72,140 |
The Sankei Building Co., Ltd. | | 13,100 | | | 72,553 |
The Shibusawa Warehouse Co., Ltd. | | 17,000 | | | 98,405 |
The Shikoku Bank, Ltd. | | 82,000 | | | 444,383 |
The Shimizu Bank, Ltd. | | 3,200 | | | 150,687 |
The Sumitomo Warehouse Co., Ltd. | | 83,000 | | | 427,280 |
The Tochigi Bank, Ltd. | | 50,000 | | | 306,995 |
The Toho Bank, Ltd. | | 83,000 | | | 365,911 |
The Tohoku Bank, Ltd. | | 25,000 | | | 45,502 |
The Tokushima Bank, Ltd. | | 34,000 | | | 178,982 |
The Tokyo Tomin Bank, Ltd. | | 13,200 | | | 213,555 |
The Torigoe Co., Ltd. | | 6,600 | | | 56,371 |
The Tottori Bank, Ltd. | | 25,000 | | | 81,948 |
The Towa Bank, Ltd. | | 73,000 | | | 57,382 |
The Yachiyo Bank, Ltd. | | 73 | | | 234,665 |
The Yamanashi Chuo Bank, Ltd. | | 72,000 | | | 424,060 |
The Yasuda Warehouse Co., Ltd. | | 4,100 | | | 42,552 |
Tigers Polymer Corp. | | 2,200 | | | 8,472 |
TKC | | 4,800 | | | 99,603 |
Toa Corp. | | 95,000 | | | 136,635 |
Toa Oil Co., Ltd. | | 21,000 | | | 21,968 |
Toagosei Co., Ltd. | | 118,000 | | | 355,587 |
Tobishima Corp. (a) | | 182,000 | | | 32,329 |
Tobu Store Co., Ltd. | | 3,000 | | | 11,485 |
TOC Co., Ltd. | | 39,500 | | | 203,059 |
Tocalo Co., Ltd. | | 5,300 | | | 46,920 |
Toda Kogyo Corp. | | 20,000 | | | 49,115 |
Toenec Corp. | | 16,000 | | | 94,451 |
Tohcello Co., Ltd. | | 12,000 | | | 54,436 |
Toho Co., Ltd. | | 4,000 | | | 14,605 |
Toho Real Estate Co., Ltd. | | 5,400 | | | 37,628 |
Toho Titanium Co., Ltd. | | 13,100 | | | 144,109 |
Toho Zinc Co., Ltd. | | 69,000 | | | 167,985 |
Tokai Carbon Co., Ltd. | | 82,000 | | | 344,161 |
Tokai Corp. | | 11,000 | | | 57,687 |
Tokai Rika Co., Ltd. | | 32,000 | | | 280,608 |
Tokai Rubber Industries, Inc. | | 20,000 | | | 164,961 |
Tokai Tokyo Securities Co., Ltd. | | 101,000 | | | 279,104 |
Toko, Inc. | | 37,000 | | | 42,907 |
Tokushu Tokai Holdings Co., Ltd. | | 56,000 | | | 165,778 |
Tokyo Dome Corp. | | 76,000 | | | 284,873 |
Tokyo Electron Device, Ltd. | | 8 | | | 10,455 |
Tokyo Energy & Systems, Inc. | | 12,000 | | | 90,896 |
Tokyo Kaikan Co., Ltd. | | 3,000 | | | 10,038 |
*See accompanying notes to financial statements.
MSF-19
Metropolitan Series Fund, Inc.
Met/Dimensional International Small Company Portfolio
Schedule of Investments as of December 31, 2008
Common Stock—(Continued)
| | | | | |
| Security Description | | Shares | | Value* |
| | | | | |
| | |
Japan—(Continued) | | | | | |
Tokyo Keiki, Inc. | | 30,000 | | $ | 35,423 |
Tokyo Kikai Seisakusho, Ltd. | | 19,000 | | | 36,878 |
Tokyo Ohka Kogyo Co., Ltd. | | 25,500 | | | 358,531 |
Tokyo Rakutenchi Co., Ltd. | | 15,000 | | | 65,585 |
Tokyo Rope Manufacturing Co., Ltd. | | 69,000 | | | 199,673 |
Tokyo Sangyo Co., Ltd. | | 3,500 | | | 9,401 |
Tokyo Seimitsu Co. | | 13,200 | | | 110,664 |
Tokyo Style Co., Ltd. | | 39,000 | | | 282,836 |
Tokyo Tekko Co., Ltd. | | 23,000 | | | 54,747 |
Tokyo Theatres Co., Inc. | | 17,000 | | | 37,754 |
Tokyotokeiba Co., Ltd. | | 53,000 | | | 79,686 |
Tokyu Community Corp. | | 4,300 | | | 89,823 |
Tokyu Construction Co., Ltd. | | 31,280 | | | 87,951 |
Tokyu Livable, Inc. | | 5,100 | | | 24,769 |
Toli Corp. | | 7,000 | | | 13,917 |
Tomato Bank, Ltd. | | 24,000 | | | 62,881 |
Tomen Electronics Corp. | | 3,900 | | | 47,433 |
Tomoku Co., Ltd. | | 17,000 | | | 34,812 |
Tomy Co., Ltd. | | 19,300 | | | 126,612 |
TONAMI HOLDINGS Co., Ltd. | | 14,000 | | | 36,334 |
Topcon Corp. | | 15,800 | | | 69,106 |
Topre Corp. | | 16,700 | | | 122,854 |
Topy Industries, Ltd. | | 99,000 | | | 177,250 |
Torii Pharmaceutical Co., Ltd. | | 6,000 | | | 95,471 |
Torishima Pump Manufacturing Co., Ltd. | | 5,200 | | | 54,522 |
Toshiba Machine Co., Ltd. | | 53,000 | | | 157,231 |
Toshiba Plant Systems & Services Corp. | | 17,000 | | | 174,373 |
Toshiba TEC Corp. | | 71,000 | | | 213,881 |
Tosho Printing Co., Ltd. | | 12,000 | | | 29,841 |
Totetsu Kogyo Co., Ltd. | | 3,000 | | | 20,089 |
Toukei Computer Co., Ltd. | | 1,000 | | | 12,287 |
Towa Pharmaceutical Co., Ltd. | | 3,200 | | | 143,043 |
Towa Real Estate Development Co., Ltd. | | 48,000 | | | 32,038 |
Toyo Construction Co., Ltd. (a) | | 93,000 | | | 44,186 |
Toyo Corp. | | 7,900 | | | 106,086 |
Toyo Electric Manufacturing Co., Ltd. | | 12,000 | | | 34,385 |
Toyo Engineering Corp. | | 37,000 | | | 115,225 |
Toyo Ink Manufacturing Co., Ltd. | | 115,000 | | | 326,010 |
Toyo Kanetsu K K | | 59,000 | | | 117,202 |
Toyo Kohan Co., Ltd. | | 29,000 | | | 123,227 |
Toyo Securities Co., Ltd. | | 31,000 | | | 61,696 |
Toyo Tanso Co., Ltd. | | 5,000 | | | 192,637 |
Toyo Tire & Rubber Co., Ltd. | | 60,000 | | | 109,696 |
Toyo Wharf & Warehouse Co., Ltd. | | 18,000 | | | 28,216 |
Toyobo Co., Ltd. | | 304,000 | | | 462,729 |
Trans Cosmos, Inc. | | 9,800 | | | 70,451 |
Trinity Industrial Corp. | | 1,000 | | | 3,635 |
Trusco Nakayama Corp. | | 7,500 | | | 96,623 |
Tsubakimoto Chain Co | | 61,000 | | | 188,765 |
Tsugami Corp. | | 23,000 | | | 39,324 |
Tsukishima Kikai Co., Ltd. | | 11,000 | | | 75,342 |
Tsurumi Manufacturing Co., Ltd. | | 5,000 | | | 37,817 |
Tsutsumi Jewelry Co., Ltd. | | 4,900 | | | 104,252 |
TYK Corp. | | 6,000 | | | 14,662 |
U-Shin, Ltd. | | 12,700 | | | 40,106 |
Ube Material Industries, Ltd. | | 15,000 | | | 31,396 |
Uchida Yoko Co., Ltd. | | 28,000 | | | 99,523 |
Ulvac, Inc. | | 13,200 | | | 202,974 |
| | | | | |
| Security Description | | Shares | | Value* |
| | | | | |
| | |
Japan—(Continued) | | | | | |
Unicafe, Inc. | | 700 | | $ | 8,919 |
Unicharm Petcare Corp. | | 5,900 | | | 218,866 |
Uniden Corp. | | 29,000 | | | 45,422 |
Unimat Life Corp. | | 7,600 | | | 67,736 |
Union Tool Co. | | 3,700 | | | 84,476 |
Unitika, Ltd. | | 132,000 | | | 98,188 |
Utoc Corp. | | 8,600 | | | 29,949 |
Valor Co., Ltd. | | 12,900 | | | 143,069 |
Vital-net, Inc. | | 16,200 | | | 128,322 |
Wakamoto Pharmaceutical Co., Ltd. | | 6,000 | | | 23,971 |
Warabeya Nichiyo Co., Ltd. | | 4,200 | | | 76,269 |
Watabe Wedding Corp. | | 2,600 | | | 40,397 |
WATAMI Co., Ltd. | | 9,100 | | | 234,643 |
Weathernews, Inc. | | 2,700 | | | 44,077 |
Wood One Co., Ltd. | | 20,000 | | | 72,420 |
Xebio Co., Ltd. | | 10,500 | | | 203,425 |
Yahagi Construction Co., Ltd. | | 16,000 | | | 92,834 |
Yaizu Suisankagaku Industry Co., Ltd. | | 3,000 | | | 34,727 |
YAMABIKO Corp. | | 3,690 | | | 36,025 |
Yamatane Corp. | | 38,000 | | | 45,437 |
Yamato Corp. | | 12,000 | | | 39,320 |
Yamazen Corp. | | 20,200 | | | 76,731 |
Yaoko Co., Ltd. | | 3,200 | | | 108,991 |
Yaskawa Electric Corp. | | 100,000 | | | 402,381 |
Yellow Hat, Ltd. | | 7,000 | | | 24,842 |
Yodogawa Steel Works, Ltd. | | 81,000 | | | 337,497 |
Yokogawa Bridge Holdings Corp. | | 16,000 | | | 144,334 |
Yokohama Reito Co., Ltd. | | 15,000 | | | 104,534 |
Yokowo Co., Ltd. | | 7,700 | | | 38,070 |
Yomeishu Seizo Co., Ltd. | | 2,000 | | | 18,868 |
Yomiuri Land Co., Ltd. | | 13,000 | | | 40,440 |
Yondenko Corp. | | 3,000 | | | 17,653 |
Yonekyu Corp. | | 7,500 | | | 88,752 |
Yonex Co., Ltd. | | 5,900 | | | 39,403 |
Yorozu Corp. | | 8,600 | | | 70,238 |
Yoshimoto Kogyo Co., Ltd. | | 10,100 | | | 134,642 |
Yoshinoya Holdings Co., Ltd. | | 170 | | | 203,321 |
Yuasa Trading Co., Ltd. | | 74,000 | | | 69,785 |
Yuken Kogyo Co., Ltd. | | 16,000 | | | 31,778 |
Yuki Gosei Kogyo Co., Ltd. | | 6,000 | | | 32,137 |
Yukiguni Maitake Co., Ltd. | | 6,900 | | | 26,225 |
Yurtec Corp. | | 13,000 | | | 80,184 |
Yushin Precision Equipment Co., Ltd. | | 3,100 | | | 28,246 |
Yushiro Chemical Industry Co., Ltd. | | 2,400 | | | 32,001 |
Zenrin Co., Ltd. | | 6,600 | | | 80,739 |
Zensho Co., Ltd. | | 20,200 | | | 118,756 |
Zeon Corp. | | 103,000 | | | 352,824 |
ZERIA Pharmaceutical Co., Ltd. | | 8,000 | | | 91,721 |
Zuken, Inc. | | 7,800 | | | 51,392 |
| | | | | |
| | | | | 115,170,850 |
| | | | | |
| | |
Jersey—0.1% | | | | | |
Charter International, Plc. | | 6,357 | | | 30,110 |
Henderson Group, Plc. | | 436,102 | | | 369,757 |
Regus, Plc. | | 17,407 | | | 12,935 |
| | | | | |
| | | | | 412,802 |
| | | | | |
*See accompanying notes to financial statements.
MSF-20
Metropolitan Series Fund, Inc.
Met/Dimensional International Small Company Portfolio
Schedule of Investments as of December 31, 2008
Common Stock—(Continued)
| | | | | |
| Security Description | | Shares | | Value* |
| | | | | |
| | |
Liechtenstein—0.1% | | | | | |
Verwalt & Privat-Bank AG | | 2,595 | | $ | 344,123 |
| | | | | |
| | |
Luxembourg—0.1% | | | | | |
Colt Telecom Group S.A. (GBP) (a) | | 208,005 | | | 201,348 |
| | | | | |
| | |
Netherlands—2.8% | | | | | |
Accell Group | | 3,834 | | | 96,180 |
Arcadis NV | | 21,457 | | | 282,876 |
ASM International NV | | 23,464 | | | 202,186 |
Beter BED Holding NV | | 7,862 | | | 93,590 |
Brunel International | | 5,017 | | | 59,689 |
Crucell NV (a) | | 37,985 | | | 573,080 |
Draka Holding | | 8,139 | | | 74,560 |
Exact Holding NV | | 6,600 | | | 121,292 |
Fugro NV | | 39,425 | | | 1,131,868 |
Gemalto NV (a) | | 46,766 | | | 1,172,571 |
Grontmij | | 6,770 | | | 165,564 |
ICT Automatisering NV | | 3,033 | | | 19,917 |
Imtech NV | | 25,946 | | | 439,029 |
Innoconcepts | | 12,600 | | | 58,201 |
KAS Bank NV | | 6,827 | | | 94,141 |
Kendrion NV | | 2,301 | | | 23,115 |
Koninklijke BAM Groep NV | | 58,419 | | | 525,306 |
Koninklijke Boskalis Westminster NV | | 11,364 | | | 263,966 |
Koninklijke Vopak NV | | 17,404 | | | 660,366 |
Macintosh Retail Group NV | | 1,117 | | | 10,133 |
Nederland Apparatenfabriek | | 697 | | | 17,270 |
Nutreco Holdings NV | | 16,060 | | | 527,652 |
OPG Groep NV | | 25,264 | | | 328,142 |
Pharming Group NV (a) | | 42,017 | | | 37,780 |
Punch Graphix NV | | 10,815 | | | 27,089 |
SBM Offshore NV | | 88,128 | | | 1,154,842 |
Sligro Food Group NV | | 9,470 | | | 196,586 |
SNS Reaal | | 4,862 | | | 26,754 |
Super De Boer (a) | | 32,671 | | | 124,553 |
Telegraaf Media Groep NV | | 4,939 | | | 85,778 |
Ten Cate NV | | 13,180 | | | 297,787 |
TKH Group NV | | 13,266 | | | 148,616 |
Unit 4 Agresso NV | | 11,050 | | | 122,103 |
USG People NV | | 37,686 | | | 489,962 |
Van der Moolen Holding NV | | 23,998 | | | 72,718 |
Wavin NV | | 9,752 | | | 31,866 |
| | | | | |
| | | | | 9,757,128 |
| | | | | |
| | |
New Zealand—0.5% | | | | | |
Air New Zealand, Ltd. | | 99,124 | | | 55,762 |
Ebos Group, Ltd. | | 8,254 | | | 21,116 |
Fisher & Paykel Healthcare Corp., Ltd. | | 268,005 | | | 496,468 |
Freightways, Ltd. | | 54,891 | | | 102,943 |
Infratil, Ltd. | | 252,780 | | | 241,380 |
Mainfreight, Ltd. | | 39,750 | | | 112,278 |
Michael Hill International, Ltd. | | 13,427 | | | 4,019 |
New Zealand Oil & Gas, Ltd. (a) | | 109,940 | | | 82,025 |
Nuplex Industries, Ltd. | | 36,734 | | | 64,576 |
NZX, Ltd. | | 6,833 | | | 21,725 |
PGG Wrightson, Ltd. | | 56,067 | | | 42,373 |
| | | | | |
| Security Description | | Shares | | Value* |
| | | | | |
| | |
New Zealand—(Continued) | | | | | |
Port of Tauranga, Ltd. | | 17,641 | | $ | 67,319 |
Rubicon, Ltd. (a) | | 1,637 | | | 576 |
Ryman Healthcare, Ltd. | | 146,713 | | | 118,909 |
Sanford, Ltd. | | 314 | | | 985 |
Sky City Entertainment, Ltd. | | 159,048 | | | 291,298 |
The New Zealand Refining Co., Ltd. | | 14,759 | | | 50,565 |
The Warehouse Group, Ltd. | | 42,287 | | | 87,231 |
Tower, Ltd. (a) | | 26,984 | | | 24,391 |
| | | | | |
| | | | | 1,885,939 |
| | | | | |
| | |
Norway—0.7% | | | | | |
Aktiv Kapital ASA | | 4,667 | | | 24,670 |
Austevoll Seafood ASA | | 11,630 | | | 18,479 |
Blom AS (a) | | 19,000 | | | 38,802 |
Camillo Eitzen & Co. ASA | | 4,200 | | | 7,961 |
Cermaq ASA | | 33,976 | | | 130,395 |
Copeinca ASA (a) | | 12,800 | | | 15,676 |
DNO International ASA | | 462,000 | | | 305,573 |
DOF ASA | | 18,020 | | | 89,180 |
Eitzen Chemical ASA (a) | | 24,583 | | | 30,624 |
Ekornes ASA | | 3,531 | | | 34,157 |
Ementor ASA (a) | | 33,800 | | | 81,130 |
Farstad Shipping ASA | | 2,200 | | | 21,581 |
Ganger Rolf ASA | | 10,700 | | | 216,558 |
Marine Harvest (a) | | 1,984,000 | | | 302,826 |
Norske Skogindustrier ASA | | 126,500 | | | 250,271 |
Norwegian Air Shuttle AS (a) | | 8,200 | | | 43,684 |
ODIM ASA (a) | | 12,900 | | | 54,839 |
Petrolia Drilling ASA (a) | | 330,000 | | | 26,305 |
Scana Industrier | | 51,000 | | | 60,806 |
Sevan Marine ASA (a) | | 119,800 | | | 132,133 |
Solstad Offshore ASA | | 4,500 | | | 38,271 |
SpareBank 1 SMN | | 23,716 | | | 104,034 |
TGS Nopec Geophysical Co. ASA (a) | | 66,000 | | | 335,791 |
Veidekke ASA | | 69,000 | | | 223,688 |
| | | | | |
| | | | | 2,587,434 |
| | | | | |
| | |
Portugal—0.6% | | | | | |
Altri SGPS S.A. | | 32,303 | | | 94,910 |
Banco BPI S.A. | | 193,341 | | | 476,365 |
Finibanco Holding SGPS S.A. | | 10,622 | | | 34,730 |
Inapa-Invest Particip Gesta | | 63,187 | | | 30,003 |
Mota Engil SGPS S.A. | | 39,660 | | | 130,595 |
Novabase SGPS S.A. (a) | | 7,827 | | | 50,006 |
Portucel Empresa Produtora de Pasta e Papel S.A. | | 171,112 | | | 369,919 |
S.A.G GEST-Solucoes Automovel Globais SGPS S.A. | | 14,436 | | | 19,121 |
Semapa-Sociedade de Investimento e Gestao | | 32,944 | | | 294,189 |
Sonae Industria SGPS S.A. (a) | | 43,507 | | | 93,094 |
Sonae SGPS S.A. | | 621,500 | | | 381,096 |
Sonaecom SGPS S.A. (a) | | 42,420 | | | 59,582 |
Teixeira Duarte-Engenharia Construcoes S.A. | | 101,510 | | | 84,570 |
| | | | | |
| | | | | 2,118,180 |
| | | | | |
*See accompanying notes to financial statements.
MSF-21
Metropolitan Series Fund, Inc.
Met/Dimensional International Small Company Portfolio
Schedule of Investments as of December 31, 2008
Common Stock—(Continued)
| | | | | |
| Security Description | | Shares | | Value* |
| | | | | |
| | |
Singapore—1.0% | | | | | |
Allgreen Properties, Ltd. | | 540,000 | | $ | 162,327 |
Bukit Sembawang Estates, Ltd. | | 23,000 | | | 64,489 |
Cerebos Pacific, Ltd. | | 16,000 | | | 33,922 |
Chartered Semiconductor Manufacturing, Ltd. (a) | | 759,000 | | | 95,615 |
Chuan Hup Holdings, Ltd. | | 125,000 | | | 16,637 |
Creative Technology, Ltd. | | 28,450 | | | 85,230 |
CSE Global, Ltd. | | 194,000 | | | 50,706 |
Ezra Holdings, Ltd. | | 214,000 | | | 101,903 |
Food Empire Holdings, Ltd. | | 43,000 | | | 10,169 |
Gallant Venture, Ltd. (a) | | 507,000 | | | 42,539 |
Goodpack, Ltd. | | 145,000 | | | 83,894 |
Guocoland, Ltd. | | 37,000 | | | 29,379 |
Hi-P International, Ltd. | | 332,000 | | | 69,588 |
Ho Bee Investment, Ltd. | | 186,000 | | | 49,370 |
Hong Leong Asia, Ltd. | | 6,000 | | | 2,594 |
Hotel Plaza, Ltd. | | 84,000 | | | 67,231 |
Hotel Properties, Ltd. | | 115,000 | | | 89,638 |
Hyflux, Ltd. | | 160,000 | | | 200,448 |
Jaya Holdings, Ltd. | | 154,000 | | | 30,597 |
K1 Ventures, Ltd. (a) | | 483,000 | | | 47,111 |
Keppel Land, Ltd. | | 304,000 | | | 361,916 |
Keppel Telecommunications & Transportation, Ltd. | | 124,000 | | | 68,507 |
Kim Eng Holdings, Ltd. | | 203,000 | | | 153,364 |
KS Energy Services, Ltd. | | 94,000 | | | 65,434 |
Metro Holdings, Ltd. | | 195,000 | | | 49,454 |
Midas Holdings, Ltd. | | 187,000 | | | 63,465 |
MobileOne, Ltd. | | 142,000 | | | 146,179 |
Orchard Parade Holdings, Ltd. | | 35,000 | | | 14,355 |
Petra Foods, Ltd. | | 75,000 | | | 19,815 |
Raffles Education Corp., Ltd. | | 644,000 | | | 254,400 |
SC Global Developments, Ltd. | | 125,000 | | | 47,341 |
Singapore Food Industries, Ltd. | | 82,000 | | | 50,712 |
Singapore Petroleum Co., Ltd. | | 196,000 | | | 312,918 |
Stamford Land Corp., Ltd. | | 86,000 | | | 15,600 |
Straits Asia Resources, Ltd. | | 242,000 | | | 132,456 |
Tat Hong Holdings, Ltd. | | 176,000 | | | 83,518 |
United Engineers, Ltd. | | 82,000 | | | 67,087 |
UOB-Kay Hian Holdings, Ltd. | | 99,000 | | | 65,771 |
Wheelock Properties S, Ltd. | | 226,000 | | | 163,935 |
Wing Tai Holdings, Ltd. | | 300,000 | | | 173,645 |
| | | | | |
| | | | | 3,643,259 |
| | | | | |
| | |
Spain—2.5% | | | | | |
Abengoa S.A. | | 12,588 | | | 210,389 |
Antena 3 de Television S.A. | | 36,795 | | | 222,434 |
Azkoyen S.A. (a) | | 1,608 | | | 5,409 |
Banco Guipuzcoano S.A. | | 31,479 | | | 246,675 |
Banco Pastor S.A. | | 71,822 | | | 502,763 |
Baron de Ley (a) | | 1,446 | | | 72,386 |
Bolsas y Mercados Espanoles | | 43,161 | | | 1,130,112 |
Campofrio Alimentacion S.A. | | 13,637 | | | 142,673 |
Cementos Portland Valderrivas S.A. | | 5,084 | | | 175,681 |
Construcciones y Auxiliar de Ferrocarriles S.A. | | 806 | | | 282,779 |
Corp. Dermoestetica (a) | | 11,030 | | | 53,960 |
Duro Felguera S.A. | | 27,918 | | | 146,075 |
Ebro Puleva S.A. | | 57,671 | | | 791,034 |
| | | | | |
| Security Description | | Shares | | Value* |
| | | | | |
| | |
Spain—(Continued) | | | | | |
Elecnor S.A. | | 1,881 | | $ | 18,669 |
Ercros S.A. (a) | | 676,302 | | | 151,749 |
Faes Farma S.A. | | 42,632 | | | 178,952 |
General de Alquiler de Maquinaria (a) | | 2,424 | | | 18,755 |
Gestevision Telecino S.A. | | 69,072 | | | 735,912 |
Grupo Catalana Occidente S.A. | | 33,959 | | | 691,482 |
Grupo Empresarial Ence S.A. | | 66,126 | | | 233,114 |
La Seda de Barcelona S.A. | | 328,744 | | | 158,253 |
Laboratorios Almirall S.A. (a) | | 35,719 | | | 278,309 |
Miquel y Costas & Miquel S.A. | | 3,963 | | | 63,931 |
Natra S.A. | | 5,022 | | | 28,323 |
Natraceutical S.A. (a) | | 73,246 | | | 51,261 |
NH Hoteles S.A. | | 36,213 | | | 186,755 |
Obrascon Huarte Lain S.A. | | 1,877 | | | 26,454 |
Papeles y Cartones de Europa S.A. | | 15,251 | | | 63,126 |
Pescanova S.A. | | 2,724 | | | 102,990 |
Prosegur Cia de Seguridad S.A. | | 7,813 | | | 258,904 |
Realia Business S.A. | | 72,411 | | | 157,005 |
Sociedad Nacional de Industrias Apicaciones Celulosa Espanola S.A. (a) | | 34,412 | | | 39,710 |
Sol Melia S.A. | | 32,301 | | | 193,882 |
SOS Cuetara S.A. | | 21,112 | | | 334,994 |
Telecomunicaciones y Energia (a) | | 8,642 | | | 42,242 |
Tubacex S.A. | | 6,426 | | | 21,304 |
Tubos Reunidos S.A. | | 6,961 | | | 20,368 |
Unipapel S.A. | | 558 | | | 7,096 |
Vidrala S.A. | | 7,759 | | | 167,884 |
Viscofan S.A. | | 13,278 | | | 260,849 |
Zeltia S.A. | | 47,346 | | | 223,268 |
| | | | | |
| | | | | 8,697,911 |
| | | | | |
| | |
Sweden—1.2% | | | | | |
AarhusKarlshamn AB | | 12,245 | | | 166,222 |
Acando AB | | 35,170 | | | 46,489 |
Active Biotech AB (a) | | 14,901 | | | 58,833 |
AddTech AB | | 2,452 | | | 24,973 |
AF AB | | 8,600 | | | 131,250 |
Axfood AB | | 13,316 | | | 284,450 |
Axis Communications AB | | 24,950 | | | 185,118 |
B&B Tools AB | | 6,454 | | | 41,115 |
Beijer AB G&L | | 2,929 | | | 40,638 |
Beijer Alma AB | | 9,174 | | | 63,859 |
Billerud AB | | 26,100 | | | 70,807 |
BioGaia AB (a) | | 5,910 | | | 25,016 |
Biovitrum AB (a) | | 13,716 | | | 75,771 |
Cardo AB | | 7,973 | | | 116,433 |
Clas Ohlson AB | | 12,321 | | | 89,294 |
Elekta AB | | 53,800 | | | 532,706 |
Haldex AB | | 2,586 | | | 8,815 |
Hemtex AB | | 13,800 | | | 25,505 |
HIQ International AB | | 18,611 | | | 50,355 |
Hoganas AB | | 11,748 | | | 104,631 |
Industrial & Financial Systems | | 6,695 | | | 28,060 |
Indutrade AB | | 4,282 | | | 36,426 |
Intrum Justitia AB | | 36,100 | | | 363,361 |
JM AB | | 1,392 | | | 7,569 |
*See accompanying notes to financial statements.
MSF-22
Metropolitan Series Fund, Inc.
Met/Dimensional International Small Company Portfolio
Schedule of Investments as of December 31, 2008
Common Stock—(Continued)
| | | | | |
| Security Description | | Shares | | Value* |
| | | | | |
| | |
Sweden—(Continued) | | | | | |
KappAhl Holding AB | | 25,400 | | $ | 75,438 |
Lindab International AB | | 25,745 | | | 160,741 |
Lundin Petroleum AB (a) | | 11,400 | | | 60,645 |
Medivir AB (a) | | 4,728 | | | 28,259 |
Mekonomen AB | | 6,461 | | | 57,544 |
Munters AB | | 22,041 | | | 107,918 |
NCC AB | | 37,386 | | | 239,281 |
Nibe Industrier AB | | 33,200 | | | 187,871 |
Nolato AB | | 7,298 | | | 29,810 |
Peab AB | | 47,521 | | | 132,581 |
Proffice AB (a) | | 32,500 | | | 33,137 |
Q-Med AB | | 29,800 | | | 92,697 |
Rederi AB Transatlantic | | 2,512 | | | 10,213 |
Rezidor Hotel Group AB | | 48,455 | | | 117,174 |
SAS AB (a) | | 56,000 | | | 272,661 |
SkiStar AB | | 8,016 | | | 65,610 |
Studsvik AB | | 3,095 | | | 21,776 |
Sweco AB | | 15,485 | | | 69,128 |
Trelleborg AB | | 3,158 | | | 19,681 |
| | | | | |
| | | | | 4,359,861 |
| | | | | |
| | |
Switzerland—6.0% | | | | | |
Acino Holding AG | | 1,088 | | | 236,130 |
Advanced Digital Broadcast Holdings S.A. (a) | | 1,435 | | | 39,250 |
Affichage Holding Genf | | 134 | | | 17,755 |
Allreal Holding AG | | 3,914 | | | 393,790 |
Aryzta AG | | 35,592 | | | 1,155,486 |
Ascom Holding AG | | 5,888 | | | 45,873 |
Bachem Holding AG | | 1,216 | | | 92,057 |
Baloise Holdings AG | | 39,640 | | | 2,979,397 |
Bank Coop AG | | 1,165 | | | 81,544 |
Bank Sarasin & Cie AG | | 23,960 | | | 715,770 |
Banque Cantonale de Geneve | | 98 | | | 20,333 |
Banque Cantonale Vaudoise | | 2,515 | | | 754,778 |
Banque Privee Edmond de Rothschild S.A. | | 3 | | | 74,952 |
Barry Callebaut AG | | 781 | | | 510,055 |
Basilea Pharmaceutica (a) | | 3,755 | | | 529,831 |
Bell Holding AG | | 30 | | | 36,958 |
Bellevue Group AG | | 2,312 | | | 82,850 |
Berner Kantonalbank AG | | 1,449 | | | 305,238 |
Bobst group AG | | 4,586 | | | 138,005 |
Bossard Holding AG | | 312 | | | 13,455 |
Card Guard AG (a) | | 4,907 | | | 39,432 |
Centralschweizerische Kraftwerke AG | | 104 | | | 38,192 |
Clariant AG | | 193,371 | | | 1,322,887 |
Conzzeta AG | | 29 | | | 42,138 |
Cytos Biotechnology AG (a) | | 2,344 | | | 55,718 |
Daetwyler Holding AG | | 1,786 | | | 72,770 |
Edipresse S.A. | | 41 | | | 8,331 |
EFG International AG | | 21,443 | | | 383,989 |
Elektrizitaets-Gesellschaft Laufenburg AG | | 98 | | | 87,366 |
Emmi AG | | 306 | | | 28,627 |
EMS-Chemie Holding AG | | 6,620 | | | 555,060 |
Energiedienst Holding AG | | 2,147 | | | 105,293 |
Forbo Holding AG | | 1,357 | | | 250,219 |
Galenica AG | | 2,555 | | | 828,550 |
| | | | | |
| Security Description | | Shares | | Value* |
| | | | | |
| | |
Switzerland—(Continued) | | | | | |
Georg Fischer AG (a) | | 3,447 | | $ | 791,805 |
Gurit Holding AG | | 296 | | | 125,945 |
Helvetia Holding AG | | 2,670 | | | 580,030 |
Industrieholding Cham AG | | 202 | | | 42,723 |
Komax Holding AG | | 688 | | | 35,229 |
Kudelski S.A. | | 24,724 | | | 263,988 |
Kuoni Reisen Holding AG | | 1,794 | | | 609,025 |
LEM Holding S.A. | | 133 | | | 16,529 |
Logitech International S.A. (a) | | 110,236 | | | 1,720,957 |
Luzerner Kantonalbank AG | | 639 | | | 148,913 |
Metall Zug AG | | 19 | | | 36,802 |
Mikron Holding AG (a) | | 474 | | | 2,593 |
Mobilezone Holding AG | | 2,961 | | | 18,764 |
Mobimo Holding AG (a) | | 1,420 | | | 189,320 |
Nobel Biocare Holding AG | | 50,446 | | | 1,033,344 |
OC Oerlikon Corp. AG (a) | | 5,941 | | | 394,661 |
Partners Group Holding AG | | 7,688 | | | 546,592 |
Phoenix Mecano AG | | 179 | | | 53,310 |
Precious Woods Holding AG (a) | | 752 | | | 25,689 |
Quadrant AG (a) | | 2,085 | | | 117,904 |
Romande Energie Holding S.A. | | 69 | | | 129,130 |
Schaffner Holding AG | | 238 | | | 32,585 |
Schulthess Group | | 4,176 | | | 165,526 |
Schweizerische National-Versicherungs-Gesellschaft | | 213 | | | 122,502 |
Siegfried Holding AG | | 826 | | | 70,567 |
St. Galler Kantonalbank | | 839 | | | 304,009 |
Straumann Holding AG | | 572 | | | 100,752 |
Swisslog Holding AG (a) | | 159,223 | | | 66,953 |
Swissquote Group Holding S.A. | | 7,380 | | | 259,089 |
Tamedia AG | | 242 | | | 11,386 |
Tecan Group AG | | 3,856 | | | 142,582 |
Temenos Group AG (a) | | 30,376 | | | 405,413 |
Vaudoise Assurances Holding S.A. | | 57 | | | 8,243 |
Vontobel Holding AG | | 19,853 | | | 417,113 |
VZ Holding AG | | 171 | | | 6,467 |
Walliser Kantonalbank | | 96 | | | 42,022 |
Ypsomed Holding AG (a) | | 273 | | | 20,585 |
Zehnder Group AG | | 73 | | | 59,248 |
Zuger Kantonalbank AG | | 1 | | | 3,482 |
| | | | | |
| | | | | 21,163,856 |
| | | | | |
| | |
United Kingdom—14.3% | | | | | |
Aberdeen Asset Management, Plc. | | 482,394 | | | 839,084 |
Aggreko, Plc. | | 169,004 | | | 1,088,792 |
Air Partner, Plc. | | 992 | | | 6,514 |
Alterian, Plc. (a) | | 16,484 | | | 13,756 |
Anite, Plc. | | 99,772 | | | 38,923 |
Antisoma, Plc. (a) | | 417,909 | | | 141,537 |
Arena Leisure, Plc. | | 56,506 | | | 20,108 |
Ark Therapeutics Group, Plc. (a) | | 62,448 | | | 35,290 |
Ashmore Group, Plc. | | 158,978 | | | 306,377 |
Atkins WS, Plc. | | 76,087 | | | 739,160 |
Aveva Group, Plc. | | 36,046 | | | 296,716 |
Axis-Shield, Plc. (a) | | 9,780 | | | 42,976 |
Babcock International Group | | 150,101 | | | 1,032,547 |
Barr (A.G.), Plc. | | 219 | | | 4,083 |
*See accompanying notes to financial statements.
MSF-23
Metropolitan Series Fund, Inc.
Met/Dimensional International Small Company Portfolio
Schedule of Investments as of December 31, 2008
Common Stock—(Continued)
| | | | | |
| Security Description | | Shares | | Value* |
| | | | | |
| | |
United Kingdom—(Continued) | | | | | |
Beazley Group, Plc. | | 262,392 | | $ | 514,093 |
Bioquell, Plc. (a) | | 5,000 | | | 7,696 |
Bloomsbury Publishing, Plc. | | 32,198 | | | 74,039 |
BlueBay Asset Management, Plc. (a) | | 30,165 | | | 30,577 |
BPP Holdings, Plc. | | 3,858 | | | 18,188 |
Braemar Shipping Services, Plc. | | 1,225 | | | 4,309 |
Brammer, Plc. | | 16,875 | | | 25,331 |
Brewin Dolphin Holdings, Plc. | | 32,352 | | | 48,647 |
Brit Insurance Holdings, Plc. | | 236,057 | | | 750,503 |
Britvic, Plc. | | 107,339 | | | 409,563 |
BTG, Plc. (a) | | 68,329 | | | 138,010 |
Burberry Group, Plc. | | 312,968 | | | 1,003,754 |
Business Post Group, Plc. | | 1,868 | | | 6,092 |
Care UK, Plc. | | 4,120 | | | 16,461 |
Carillion, Plc. | | 238,276 | | | 854,531 |
Carpetright, Plc. | | 22,006 | | | 111,203 |
Carphone Warehouse Group, Plc. | | 26,801 | | | 36,101 |
Centaur Media, Plc. | | 92,526 | | | 47,876 |
Charles Stanley Group, Plc. | | 548 | | | 1,407 |
Charles Taylor Consulting, Plc. | | 428 | | | 1,562 |
Chemring Group, Plc. | | 19,679 | | | 554,083 |
Chesnara, Plc. | | 14,733 | | | 28,207 |
Chloride Group | | 145,380 | | | 302,810 |
Close Brothers Group, Plc. | | 98,159 | | | 752,819 |
Computacenter, Plc. | | 42,354 | | | 55,055 |
Connaught, Plc. | | 68,406 | | | 343,824 |
Consort Medical, Plc. | | 18,608 | | | 106,785 |
Corin Group, Plc. | | 16,154 | | | 11,747 |
Costain Group, Plc. (a) | | 63,612 | | | 18,147 |
Cranswick, Plc. | | 1,476 | | | 12,417 |
Croda International | | 78,047 | | | 586,149 |
CSR, Plc. (a) | | 92,553 | | | 226,641 |
Daily Mail & General Trust | | 205,019 | | | 800,048 |
Dairy Crest Group, Plc. | | 95,400 | | | 293,262 |
Dana Petroleum, Plc. (a) | | 39,556 | | | 567,719 |
Debenhams, Plc. | | 598,241 | | | 212,277 |
Dechra Pharmaceuticals, Plc. | | 9,506 | | | 50,356 |
Devro, Plc. | | 25,818 | | | 29,573 |
Dignity, Plc. | | 34,648 | | | 300,003 |
Dimension Data Holdings, Plc. | | 1,102,265 | | | 610,411 |
Diploma, Plc. | | 25,948 | | | 46,746 |
Domino Printing Sciences | | 70,471 | | | 206,361 |
Dunelm Group, Plc. | | 8,929 | | | 16,079 |
E2V Technologies, Plc. | | 5,594 | | | 16,915 |
Electrocomponents, Plc. | | 283,259 | | | 579,105 |
Emerald Energy, Plc. | | 16,500 | | | 81,008 |
Euromoney Institutional Investor, Plc. | | 15,106 | | | 48,002 |
Evolution Group, Plc. | | 143,415 | | | 178,131 |
Fidessa Group, Plc. | | 14,827 | | | 105,418 |
Filtrona, Plc. | | 129,023 | | | 255,077 |
Forth Ports, Plc. | | 22,910 | | | 303,484 |
Galiform, Plc. | | 345,962 | | | 76,324 |
Genus, Plc. | | 36,981 | | | 354,519 |
GKN, Plc. | | 592,697 | | | 839,182 |
Go-Ahead Group, Plc. | | 21,570 | | | 323,625 |
Goldshield Group, Plc. | | 2,518 | | | 8,696 |
Greggs, Plc. | | 5,168 | | | 250,325 |
| | | | | |
| Security Description | | Shares | | Value* |
| | | | | |
| | |
United Kingdom—(Continued) | | | | | |
Halma, Plc. | | 198,998 | | $ | 583,164 |
Hampson Industries, Plc. | | 16,692 | | | 24,724 |
Hardy Oil & Gas, Plc. | | 562 | | | 1,398 |
Hardy Underwriting Bermuda, Ltd. | | 4,477 | | | 17,017 |
Hargreaves Lansdown, Plc. | | 121,563 | | | 283,887 |
Hays, Plc. | | 900,038 | | | 907,364 |
Headlam Group, Plc. | | 56,842 | | | 172,738 |
Heritage Oil, Ltd. | | 50,948 | | | 151,129 |
Hikma Pharmaceuticals, Plc. | | 82,141 | | | 415,174 |
HMV Group, Plc. | | 209,159 | | | 326,487 |
Hogg Robinson Group, Plc. | | 20,946 | | | 1,500 |
Homeserve, Plc. | | 34,128 | | | 483,069 |
Hornby, Plc. | | 1,884 | | | 2,749 |
Hunting, Plc. | | 38,110 | | | 230,529 |
Hyder Consulting, Plc. | | 15,837 | | | 28,573 |
IG Group Holdings, Plc. | | 216,305 | | | 800,403 |
Imagination Technologies Group, Plc. (a) | | 17,117 | | | 15,420 |
IMI, Plc. | | 128,598 | | | 505,324 |
Intermediate Capital Group, Plc. | | 72,434 | | | 675,947 |
International Personal Finance, Plc. | | 167,310 | | | 335,907 |
Interserve, Plc. | | 78,421 | | | 257,329 |
Intertek Group, Plc. | | 103,219 | | | 1,169,184 |
IP Group, Plc. (a) | | 67,003 | | | 52,066 |
ITE Group, Plc. | | 11,205 | | | 9,812 |
ITV, Plc. | | 2,777,361 | | | 1,592,409 |
Jardine Lloyd Thompson Group, Plc. | | 95,216 | | | 601,423 |
JKX Oil & Gas, Plc. | | 4,866 | | | 13,016 |
John Menzies, Plc. | | 6,010 | | | 9,300 |
Kcom Group, Plc. | | 394,746 | | | 76,823 |
Kofax, Plc. | | 6,198 | | | 12,415 |
Ladbrokes, Plc. | | 336,398 | | | 899,672 |
Latchways, Plc. | | 918 | | | 5,288 |
Logica, Plc. | | 1,142,370 | | | 1,140,918 |
Mcbride, Plc. | | 112,043 | | | 196,961 |
Meggitt, Plc. | | 558,568 | | | 1,295,726 |
Michael Page International, Plc. | | 93,722 | | | 291,695 |
Micro Focus International, Plc. | | 69,300 | | | 282,304 |
Misys, Plc. | | 241,100 | | | 346,380 |
Mitie Group | | 176,827 | | | 525,128 |
Mondi, Plc. | | 308,541 | | | 909,293 |
Morgan Crucible Co. | | 169,517 | | | 273,320 |
Mothercare, Plc. | | 53,760 | | | 258,146 |
Mouchel Group, Plc. | | 32,678 | | | 161,348 |
National Express Group, Plc. | | 95,515 | | | 681,383 |
NCC Group, Plc. | | 6,751 | | | 29,647 |
Northern Foods, Plc. | | 336,015 | | | 275,351 |
Novae Group, Plc. | | 9,363 | | | 42,203 |
Optos, Plc. (a) | | 15,883 | | | 16,601 |
Oxford Instruments, Plc. | | 10,252 | | | 21,945 |
PayPoint, Plc. | | 16,746 | | | 121,324 |
Persimmon, Plc. | | 10,825 | | | 36,891 |
Phoenix IT Group, Ltd. | | 17,631 | | | 43,776 |
Premier Farnell, Plc. | | 194,041 | | | 389,518 |
Premier Oil, Plc. | | 29,575 | | | 421,419 |
Prostrakan Group, Plc. (a) | | 21,679 | | | 27,581 |
Provident Financial, Plc. | | 84,106 | | | 1,045,831 |
Psion, Plc. | | 46,835 | | | 34,300 |
*See accompanying notes to financial statements.
MSF-24
Metropolitan Series Fund, Inc.
Met/Dimensional International Small Company Portfolio
Schedule of Investments as of December 31, 2008
Common Stock—(Continued)
| | | | | |
| Security Description | | Shares | | Value* |
| | | | | |
| | |
United Kingdom—(Continued) | | | | | |
PV Crystalox Solar, Plc. (a) | | 147,211 | | $ | 212,610 |
PZ Cussons, Plc. | | 133,219 | | | 312,070 |
QinetiQ, Plc. | | 197,897 | | | 454,220 |
Rank Group, Plc. | | 256,906 | | | 251,404 |
Rathbone Brothers | | 24,973 | | | 300,937 |
REA Holdings, Plc. | | 1,120 | | | 3,282 |
Renishaw, Plc. | | 21,312 | | | 151,884 |
Renovo Group, Plc. | | 13,825 | | | 3,992 |
Rensburg Sheppards, Plc. | | 6,176 | | | 36,078 |
Rentokil Initial, Plc. | | 83,666 | | | 53,541 |
Restaurant Group, Plc. | | 107,334 | | | 164,580 |
Rightmove, Plc. | | 51,550 | | | 131,054 |
RM, Plc. | | 49,467 | | | 120,917 |
Robert Walters, Plc. | | 8,764 | | | 12,874 |
Robert Wiseman Dairies, Plc. | | 5,551 | | | 23,797 |
ROK, Plc. | | 91,430 | | | 26,700 |
Rotork, Plc. | | 45,982 | | | 525,491 |
Savills, Plc. | | 4,451 | | | 14,366 |
SDL, Plc. (a) | | 17,220 | | | 56,818 |
Shanks Group, Plc. | | 33,696 | | | 53,337 |
Smiths News, Plc. | | 30,398 | | | 31,070 |
Soco International, Plc. (a) | | 30,876 | | | 489,336 |
Spectris, Plc. | | 75,025 | | | 580,774 |
Spirax-Sarco Engineering, Plc. | | 42,679 | | | 559,232 |
Spirent Communications, Plc. | | 237,554 | | | 124,268 |
SSL International, Plc. | | 124,284 | | | 888,671 |
St. James’s Place, Plc. | | 86,208 | | | 222,171 |
Sthree, Plc. | | 36,383 | | | 76,089 |
T&F Informa, Plc. | | 226,162 | | | 802,439 |
T. Clarke, Plc. | | 1,419 | | | 2,283 |
Ted Baker, Plc. | | 2,338 | | | 11,195 |
Telecom Plus, Plc. | | 6,811 | | | 30,006 |
Thorntons, Plc. | | 42,472 | | | 61,168 |
Tomkins, Plc. | | 739,996 | | | 1,325,863 |
Topps Tiles, Plc. | | 106,295 | | | 31,838 |
Tribal Group, Plc. | | 14,405 | | | 16,060 |
TT electronics, Plc. | | 52,537 | | | 26,497 |
Tullett Prebon, Plc. | | 112,046 | | | 220,779 |
United Business Media, Ltd. | | 152,069 | | | 1,119,523 |
UTV Media, Plc. | | 54,341 | | | 86,142 |
Venture Production, Plc. | | 37,037 | | | 227,957 |
Victrex, Plc. | | 43,917 | | | 304,728 |
Vislink, Plc. | | 79,800 | | | 18,366 |
VT Group, Plc. | | 71,633 | | | 576,987 |
WH Smith, Plc. | | 85,603 | | | 443,296 |
William Hill, Plc. | | 189,786 | | | 590,291 |
Wincanton, Plc. | | 67,693 | | | 174,875 |
Wolfson Microelectronics, Plc. (a) | | 84,440 | | | 98,084 |
Xaar, Plc. | | 12,846 | | | 8,637 |
Xchanging, Plc. | | 127,657 | | | 433,949 |
Yule Catto & Co., Plc. | | 46,758 | | | 37,143 |
| | | | | |
| | | | | 50,317,034 |
| | | | | |
Total Common Stock
(Identified Cost $337,193,447) | | | | | 347,541,753 |
| | | | | |
| | | | | | |
| | |
| Units—0.4% | | | | | | |
| Security Description | | Shares | | Value* |
| | | | | | |
| | |
Australia—0.1% | | | | | | |
ConnectEast Group | | | 1,029,727 | | $ | 397,563 |
| | | | | | |
| | |
Ireland—0.1% | | | | | | |
Grafton Group, Plc. | | | 49,143 | | | 158,128 |
Irish Continental Group, Plc. | | | 2,602 | | | 65,177 |
| | | | | | |
| | | | | | 223,305 |
| | | | | | |
| | |
United Kingdom—0.2% | | | | | | |
Berkeley Group Holdings, Plc. | | | 66,819 | | | 844,905 |
| | | | | | |
Total Units
(Identified Cost $1,501,299) | | | | | | 1,465,773 |
| | | | | | |
| | |
| Investment Companies—0.1% | | | | | | |
| | |
Australia—0.1% | | | | | | |
Australian Infrastructure Fund | | | 260,935 | | | 347,678 |
| | | | | | |
Total Investment Companies
(Identified Cost $289,606) | | | | | | 347,678 |
| | | | | | |
| | |
| Rights—0.0% | | | | | | |
| | |
Australia—0.0% | | | | | | |
Envestra, Ltd. | | | 119,519 | | | 5,416 |
| | | | | | |
| | |
Bermuda—0.0% | | | | | | |
Victory City International Holdings, Ltd. (HKD) | | | 25,000 | | | 229 |
| | | | | | |
| | |
France—0.0% | | | | | | |
Infogrames Entertainment S.A. (b) (c) | | | 8,773 | | | 0 |
| | | | | | |
Total Rights
(Identified Cost $0) | | | | | | 5,645 |
| | | | | | |
| | |
| Short Term Investments—0.7% | | | | | | |
| Security Description | | Face
Amount | | Value* |
| | |
United States—0.7% | | | | | | |
State Street Repurchase Agreement dated
12/31/08 at 0.010% to be repurchased at
$2,303,001 on 01/02/09, collateralized
by $2,350,000 U.S. Treasury Bill due 02/12/09 with a value of $2,350,000. | | $ | 2,303,000 | | | 2,303,000 |
| | | | | | |
Total Short Term Investments
(Identified Cost $2,303,000) | | | | | | 2,303,000 |
| | | | | | |
Total Investments—100.0%
(Identified Cost $341,287,352) (d) | | | | | | 351,663,849 |
Other assets less liabilities | | | | | | 29,542 |
| | | | | | |
| Total Net Assets—100% | | | | | $ | 351,693,391 |
| | | | | | |
*See accompanying notes to financial statements.
MSF-25
Metropolitan Series Fund, Inc.
Met/Dimensional International Small Company Portfolio
Schedule of Investments as of December 31, 2008
| (c) | Security was valued in good faith under procedures established by the Board of Directors. |
| (d) | The aggregate cost of investments for federal income tax purposes as of December 31, 2008 was $341,456,706 and the composition of unrealized appreciation and depreciation of investment securities was $35,547,359 and $(25,340,216), respectively. |
| (REIT)— | A Real Estate Investment Trust is a pooled investment vehicle that invests primarily in income-producing real estate or real estate related loans or interest. |
| | |
Ten Largest Industries as of
December 31, 2008 (Unaudited) | | Percentage of
Total Net Assets |
Diversified Financial Services | | 5.5% |
Machinery | | 5.1% |
Chemicals | | 5.1% |
Metals & Mining | | 4.7% |
Commercial Banks | | 4.5% |
Construction & Engineering | | 4.3% |
Food Products | | 3.9% |
Commercial & Professional Services | | 3.9% |
Media | | 3.8% |
Insurance | | 3.6% |
The Portfolio adopted the provisions of Statement of Financial Accounting Standards No. 157, “Fair Value Measurements” (FAS 157), effective with the beginning of the Portfolio’s fiscal year. FAS 157 establishes a framework for measuring fair value and expands disclosures about fair value measurements in financial statements. The three levels of the hierarchy under FAS 157 are described below:
Level 1 - quoted prices in active markets for identical securities
Level 2 - other significant observable inputs (including quoted prices for similar securities, interest rates, credit risk, etc.)
Level 3 - significant unobservable inputs (including the Portfolio’s own assumptions in determining the fair value of investments)
The inputs or methodology used for valuing securities are not necessarily an indication of the risk associated with investing in those securities.
The following is a summary of the inputs used to value the Portfolio’s net assets as of December 31, 2008:
| | | | | | |
| Valuation Inputs | | Investments In
Securities | | Other Financial
Instruments* |
Level 1 - Quoted Prices | | $ | 0 | | $ | 0 |
Level 2 - Other Significant Observable Inputs | | | 351,663,849 | | | 0 |
Level 3 - Significant Unobservable Inputs | | | 0 | | | 0 |
Total | | $ | 351,663,849 | | $ | 0 |
* Other financial instruments are derivative instruments not reflected in the Schedule of Investments, such as futures, forwards, swap contracts and written options, which are valued based on the unrealized appreciation/depreciation on the instrument.
See accompanying notes to financial statements.
MSF-26
Metropolitan Series Fund, Inc.
Met/Dimensional International Small Company Portfolio
Statement of Assets & Liabilities
December 31, 2008
| | | | | | | |
Assets | | | | | | | |
Investments at value (a) | | | | | $ | 351,663,849 | |
Cash | | | | | | 358 | |
Foreign cash at value (b) | | | | | | 344,562 | |
Receivable for: | | | | | | | |
Fund shares sold | | | | | | 169,814 | |
Accrued interest and dividends | | | | | | 539,131 | |
Foreign taxes | | | | | | 10,326 | |
Due from investment adviser | | | | | | 60,648 | |
| | | | | | | |
Total Assets | | | | | | 352,788,688 | |
Liabilities | | | | | | | |
Payable for: | | | | | | | |
Securities purchased | | $ | 742,213 | | | | |
Fund shares redeemed | | | 3,357 | | | | |
Withholding taxes | | | 27,490 | | | | |
Accrued expenses: | | | | | | | |
Management fees | | | 217,431 | | | | |
Service and distribution fees | | | 18 | | | | |
Other expenses | | | 104,788 | | | | |
| | | | | | | |
Total Liabilities | | | | | | 1,095,297 | |
| | | | | | | |
Net Assets | | | | | $ | 351,693,391 | |
| | | | | | | |
Net assets consists of: | | | | | | | |
Capital paid in | | | | | $ | 346,004,942 | |
Net operating loss | | | | | | (2,318,772 | ) |
Accumulated net realized losses | | | | | | (2,367,967 | ) |
Unrealized appreciation on
investments and foreign currency | | | | | | 10,375,188 | |
| | | | | | | |
Net Assets | | | | | $ | 351,693,391 | |
| | | | | | | |
| Computation of offering price: | | | | | | | |
Class A | | | | | | | |
Net asset value and redemption price per
share ($351,472,422 divided by 34,594,961 shares outstanding) | | | | | $ | 10.16 | |
| | | | | | | |
Class B | | | | | | | |
Net asset value and redemption price per
share ($220,969 divided by 21,755 shares outstanding) | | | | | $ | 10.16 | |
| | | | | | | |
(a) Identified cost of investments | | | | | $ | 341,287,352 | |
| | | | | | | |
(b) Identified cost of foreign cash | | | | | $ | 350,922 | |
| | | | | | | |
Statement of Operations
For the Period October 31, 2008(a) to December 31, 2008
| | | | | | | | |
Investment Income | | | | | | | | |
Dividends | | | | | | $ | 785,302 | (b) |
Interest | | | | | | | 3,627 | |
| | | | | | | | |
| | | | | | | 788,929 | |
Expenses | | | | | | | | |
Management fees | | $ | 444,071 | | | | | |
Service and distribution fees—Class B | | | 20 | | | | | |
Directors’ fees and expenses | | | 7,154 | | | | | |
Custodian | | | 168,524 | | | | | |
Audit and tax services | | | 35,800 | | | | | |
Legal | | | 26,984 | | | | | |
Miscellaneous | | | 4,488 | | | | | |
| | | | | | | | |
Total expenses | | | 687,041 | | | | | |
Expense reimbursements | | | (60,648 | ) | | | 626,393 | |
| | | | | | | | |
Net Investment Income | | | | | | | 162,536 | |
| | | | | | | | |
Realized and Unrealized Gain (Loss) | | | | | | | | |
| Realized gain (loss) on: | | | | | | | | |
Investments—net | | | 118,387 | | | | | |
Futures contracts—net | | | (2,486,354 | ) | | | | |
Foreign currency transactions—net | | | (2,481,308 | ) | | | (4,849,275 | ) |
| | | | | | | | |
Change in unrealized appreciation (depreciation) on: | | | | | | | | |
Investments—net | | | 10,376,497 | | | | | |
Foreign currency transactions—net | | | (1,309 | ) | | | 10,375,188 | |
| | | | | | | | |
Net gain | | | | | | | 5,525,913 | |
| | | | | | | | |
Net Increase in Net Assets From Operations | | | | | | $ | 5,688,449 | |
| | | | | | | | |
| (a) | Commencement of operations. |
| (b) | Net of foreign taxes of $44,754. |
See accompanying notes to financial statements.
MSF-27
Metropolitan Series Fund, Inc.
Met/Dimensional International Small Company Portfolio
Statements of Changes in Net Assets
| | | | |
| | | Period ended
December 31,
2008(a) | |
From Operations | | | | |
Net investment income | | $ | 162,536 | |
Net realized loss | | | (4,849,275 | ) |
Change in unrealized appreciation | | | 10,375,188 | |
| | | | |
Increase in net assets from operations | | | 5,688,449 | |
| | | | |
Increase in net assets from capital share transactions | | | 346,004,942 | |
| | | | |
Net increase in net assets | | | 351,693,391 | |
| |
Net Assets | | | | |
End of the period | | $ | 351,693,391 | |
| | | | |
Net Operating Loss | | | | |
End of the period | | $ | (2,318,772 | ) |
| | | | |
Other Information:
Capital Shares
Transactions in capital shares were as follows:
| | | | | | | |
| | | Period ended
December 31, 2008(a) | |
| | | Shares | | | $ | |
Class A | | | | | | | |
Sales | | 34,757,465 | | | $ | 347,308,256 | |
Redemptions | | (162,504 | ) | | | (1,511,630 | ) |
| | | | | | | |
Net increase | | 34,594,961 | | | $ | 345,796,626 | |
| | | | | | | |
Class B | | | | | | | |
Sales | | 22,742 | | | $ | 217,336 | |
Redemptions | | (987 | ) | | | (9,020 | ) |
| | | | | | | |
Net increase | | 21,755 | | | $ | 208,316 | |
| | | | | | | |
Increase derived from capital share transactions | | | | | $ | 346,004,942 | |
| | | | | | | |
| (a) | Commencement of operations was October 31, 2008. |
See accompanying notes to financial statements.
MSF-28
Metropolitan Series Fund, Inc.
Met/Dimensional International Small Company Portfolio
Financial Highlights
| | | | |
| | | Class A | |
| | | Period ended
December 31,
2008(a) | |
Net Asset Value, Beginning of Period | | $ | 10.00 | |
| | | | |
Income From Investment Operations | | | | |
Net investment income | | | 0.00 | (b) (f) |
Net realized and unrealized gain on investments | | | 0.16 | |
| | | | |
Total from investment operations | | | 0.16 | |
| | | | |
Net Asset Value, End of Period | | $ | 10.16 | |
| | | | |
Total Return (%) | | | 1.6 | (c) |
Ratio of operating expenses to average net assets (%) | | | 1.15 | (d) |
Ratio of operating expenses to average net assets without giving effect to the contractual expense agreement would have been (%) (e) | | | 1.26 | (d) |
Ratio of net investment income to average net assets (%) | | | 0.30 | (d) |
Portfolio turnover rate (%) | | | 4 | (d) |
Net assets, end of period (000) | | $ | 351,472 | |
| | | | |
| | | Class B | |
| | | Period ended
December 31,
2008(a) | |
Net Asset Value, Beginning of Period | | $ | 10.00 | |
| | | | |
Income from Investment Operations | | | | |
Net investment income | | | 0.00 | (b) (f) |
Net realized and unrealized gain on investments | | | 0.16 | |
| | | | |
Total from investment operations | | | 0.16 | |
| | | | |
Net Asset Value, End of Period | | $ | 10.16 | |
| | | | |
Total Return (%) | | | 1.6 | (c) |
Ratio of operating expenses to average net assets (%) | | | 1.40 | (d) |
Ratio of operating expenses to average net assets without giving effect to the contractual expense agreement would have been (%) (e) | | | 1.51 | (d) |
Ratio of net investment income to average net assets (%) | | | 0.52 | (d) |
Portfolio turnover rate (%) | | | 4 | (d) |
Net assets, end of period (000) | | $ | 221 | |
| (a) | Commencement of operations was October 31, 2008. |
| (b) | Per share amount is based on average shares outstanding during the period. |
| (c) | Periods less than one year are not computed on an annualized basis. |
| (d) | Computed on an annualized basis. |
| (e) | See Note 4 of the Notes to Financial Statements. |
| (f) | Net investment income for the period was less than $0.01. |
See accompanying notes to financial statements.
MSF-29
Metropolitan Series Fund, Inc.
Met/Dimensional International Small Company Portfolio
Notes to Financial Statements—December 31, 2008
Metropolitan Series Fund, Inc. (the “Fund”) is organized as a corporation under the laws of Maryland pursuant to Articles of Incorporation filed on November 23, 1982, as amended, and registered under the Investment Company Act of 1940, as amended (the “1940 Act”), as an open-end investment company. The Fund is a “series” type of mutual fund, which issues separate series of stock. Each series represents an interest in a separate portfolio of Fund investments. The Met/Dimensional International Small Company Portfolio (the “Portfolio”) is a diversified series of the Fund. Shares in the Fund are not offered directly to the general public and are currently available only to separate accounts established by Metropolitan Life Insurance Company (“MetLife”), New England Life Insurance Company, General American Life Insurance Company (“General American”), The MetLife Investors Group of Insurance Companies, MetLife Insurance Company of Connecticut and other affiliated insurance companies (collectively, the “Insurance Companies”) and to certain eligible qualified retirement plans (“Qualified Plans”), as an investment vehicle for variable life insurance, group annuity or variable annuity products of these insurance companies or Qualified Plans, although the Portfolio is not available to all such separate accounts and Qualified Plans. The Portfolio’s shares may be divided into different classes. Currently, the classes being offered by the Portfolio are named Class A and Class B. The classes of the Portfolio’s shares are identical, except that certain additional charges (Rule 12b-1 fees) are made against Class B shares. Investment income, realized and unrealized capital gains and losses, the common expenses of the Portfolio and certain Portfolio-level expense reductions, if any, are allocated daily, on a pro rata basis, to each class based on the relative net assets of each class to the total net assets of the Portfolio.
| 2. | SIGNIFICANT ACCOUNTING POLICIES: |
The preparation of financial statements in conformity with accounting principles generally accepted in the United States of America (“GAAP”) requires management to make estimates and assumptions that affect the reported amounts of assets and liabilities and disclosure of contingent assets and liabilities as of the date of the financial statements and the reported amounts of income and expenses during the reporting period. Actual results could differ from those estimates.
The following is a summary of significant accounting policies consistently followed by the Portfolio in the preparation of its financial statements. The policies are in conformity with GAAP.
Investment Valuation:
Debt securities (other than short term obligations with a remaining maturity of sixty days or less) are generally valued on the basis of evaluated or composite bid quotations obtained by independent pricing services and/or brokers and dealers selected by the relevant subadviser pursuant to authorization of the Board of Directors of the Fund (the “Board” or “Directors”). Such quotations take into account appropriate factors such as institutional-sized trading in similar groups of securities, yield, quality, coupon rate, maturity, type of issue, trading characteristics and other data. Short term obligations with a remaining maturity of sixty days or less are valued at amortized cost which approximates fair market value.
Equity securities traded on a national securities exchange or other exchanges are valued at their last sale price on the principal trading market. Equity securities traded on the NASDAQ National Market System are valued at the NASDAQ Official Closing Price (the “NOCP”). The NOCP is the last reported sale price if the last reported sale price falls between the spread of the last reported bid and asked prices. If the last reported bid and asked prices are above the last reported sale price, the NOCP will be the last reported bid price. If the last reported bid and asked prices are below the last reported sale price, the NOCP will be the last reported asked price. Equity securities traded on a national securities exchange or other exchanges or on the NASDAQ National Market System for which there is no reported sale during the day are valued at the last reported bid price. A security that is listed or traded on more than one exchange is valued at the quotation on the exchange determined to be the primary market for that security by the Board or its delegates. If no closing price is available, then such securities are valued by using the last reported bid price. Equity securities traded over-the-counter are valued at the last reported sales price.
If no current market value quotation is readily available or reliable for a portfolio security, fair value will be determined in accordance with procedures established by and under the general supervision of the Board. When the Portfolio uses fair value pricing, it may take into account any factors it deems appropriate. The value of securities used by the Portfolio to calculate its net asset value may differ from quoted or published prices for the same securities. Fair value pricing involves subjective judgments and the fair value determined for a security may be materially different than the value that could be realized upon the sale of that security.
MSF-30
Metropolitan Series Fund, Inc.
Met/Dimensional International Small Company Portfolio
Notes to Financial Statements—December 31, 2008—(Continued)
The Portfolio expects to use fair value pricing for securities primarily traded on U.S. exchanges only under very limited circumstances. For example, the Portfolio may use fair value pricing if the exchange on which a security is traded closes early or trading in the security is suspended.
Securities traded primarily on an exchange outside of the United States which closes before the close of the New York Stock Exchange will be valued at the last sales price on that non-U.S. exchange. Securities traded primarily on an exchange outside of the United States for which there is no reported sale during the day are valued at the mean between the last reported bid and asked prices. However, because most foreign markets close well before the Portfolio values its securities (typically at 4 p.m. Eastern Time), the earlier close of these foreign markets gives rise to the possibility that significant events, including broad market moves, may have occurred after these foreign markets close but before the Portfolio values its securities. To account for this, the Portfolio may frequently value many of its foreign equity securities using fair value prices based on third party vendor modeling tools.
Forward foreign currency exchange contracts are valued based on the mean between closing bid and asked prices of the forward currency contract rates in the London foreign exchange markets on a daily basis as provided by a reliable bank or dealer.
Options, whether on securities, indices, futures contracts, or otherwise, are valued at the last sales price available as of the close of business on the day of valuation or, if there is no such sale price available, at the mean between the bid and asked prices. Options on currencies are valued at the spot price each day.
The value of futures contracts will be the sum of the margin deposit plus or minus the difference between the value of the futures contract on each day the net asset value is calculated and the value on the date the futures contract originated, value being that established on a recognized commodity exchange, or by reference to other customary sources, with gain or loss being realized when the futures contract closes or expires.
Subject to the Board’s oversight, the Board has delegated the day-to-day oversight of pricing matters, including determinations in good faith under the Fund’s procedures the fair value of securities for which current market quotations are not readily available to the subadviser of the Portfolio.
Investment Transactions and Related Investment Income:
Portfolio security transactions are recorded on the trade date. Dividend income is recorded on the ex-dividend date or, for certain foreign securities, when notified. Interest income, which includes amortization of premium and accretion of discount on debt securities, is recorded on the accrual basis. Realized gains and losses on investments and unrealized appreciation and depreciation are determined on the identified cost basis, which is the same basis used for federal income tax purposes.
Repurchase Agreements:
The Portfolio, through the custodian or a subcustodian, receives delivery of the underlying securities collateralizing repurchase agreements. The Portfolio requires the custodian to take possession, to have legally segregated in the Federal Reserve Book Entry System, or to have segregated within the custodian’s vault, all securities held as collateral for repurchase agreements. It is the Portfolio’s policy that the market value of the collateral be at least equal to 100% of the repurchase price in the case of a repurchase agreement of one-day duration and 102% on all other repurchase agreements. The Portfolio’s subadviser is responsible for determining that the value of the collateral is at all times at least equal to the repurchase price. In connection with transactions in repurchase agreements, if the seller defaults and the value of the collateral declines or if the seller enters an insolvency proceeding, realization of the collateral by the Portfolio may be delayed, limited or wholly denied.
Foreign Currency Translation:
The books and records of the Portfolio are maintained in U.S. dollars. The values of securities, currencies and other assets and liabilities denominated in currencies other than U.S. dollars are translated into U.S. dollars based upon foreign exchange rates prevailing at the end of the period. Purchases and sales of investment securities, income and expenses are translated on the respective dates of such transactions. Since the values of investment securities are presented at the foreign exchange rates prevailing at the end of the period, it is not practical to isolate that portion of the results of operations arising from changes in exchange rates from that portion of the results of operations reflecting fluctuations arising from changes in market prices of the investment securities. Such fluctuations are included in the net realized and unrealized gain or loss on investments.
Net realized foreign exchange gains or losses arise from sales of foreign currency, currency gains or losses realized between the trade and settlement dates on securities transactions, and the difference between the amounts of dividends, interest, and foreign
MSF-31
Metropolitan Series Fund, Inc.
Met/Dimensional International Small Company Portfolio
Notes to Financial Statements—December 31, 2008—(Continued)
withholding taxes recorded by the Portfolio and the U.S. dollar equivalent of the amounts actually received or paid by the Portfolio. Net unrealized foreign exchange gains and losses arise from changes in the value of assets and liabilities, other than investment securities, resulting from changes in the exchange rate.
Forward Foreign Currency Exchange Contracts:
The Portfolio may enter into forward foreign currency exchange contracts primarily to hedge against foreign currency exchange rate risks on its non-U.S. dollar denominated investment securities. When entering into a forward currency contract, the Portfolio agrees to receive or deliver a fixed quantity of foreign currency for an agreed-upon price on an agreed future date. These contracts are valued daily and the Portfolio’s net equity therein, representing unrealized gain or loss on the contracts as measured by the difference between the foreign exchange rates at the dates of entry into the contracts and the forward rates at the settlement date, is included in the Statement of Assets and Liabilities. Realized and unrealized gains and losses are included in the Statement of Operations. These instruments involve market and/or credit risk in excess of the amount recognized in the Statement of Assets and Liabilities. Risks arise from the possible inability of counterparties to meet the terms of their contracts and from movement in currency and securities values and interest rates.
Futures Contracts:
The Portfolio may buy and sell futures contracts (on recognized exchanges) as a hedge, to maintain exposure to the broad equity markets or to enhance return. Futures contracts are agreements to buy or sell a security, or deliver a final cash settlement price in connection with an index, interest rate, currency, or other contracts not calling for physical delivery, for a set price in the future. The Portfolio must post an amount equal to a portion of the total market value of the futures contract as futures variation margin, which is returned when the Portfolio’s obligations under the contract have been satisfied. From time to time thereafter, the Portfolio may have to post variation margin to maintain this amount as the market value of the contract fluctuates. Risks of entering into futures contracts (and related options) include the possibility that there may be an illiquid market and that a change in the value of the contract or option may not correlate with changes in the value of the underlying securities.
Options:
The Portfolio may use options to hedge against changes in values of securities the Portfolio owns or expects to purchase, to maintain exposure to the broad equity markets or to enhance return. Writing puts or buying calls tends to increase the Portfolio’s exposure to the underlying instrument and writing calls or buying puts tends to decrease the Portfolio’s exposure to the underlying instrument, and can be used to hedge other Portfolio investments. For options purchased to hedge the Portfolio’s investments, the potential risk to the Portfolio is that the change in value of options contracts may not correspond to the change in value of the hedged instruments. In addition, losses may arise from changes in the value of the underlying instruments, if there is an illiquid secondary market, or if the counterparty is unable to perform. The maximum loss for purchased options is limited to the premium initially paid for the option. For options written by the Portfolio, the maximum loss is not limited to the premium initially received for the option.
The main risk associated with purchasing an option is that the option expires without being exercised. In this case, the option expires worthless and the premium paid for the option is considered the loss. The risk associated with writing a call option is that the Portfolio may forgo the opportunity for a profit if the market value of the underlying position increases and the option is exercised. The risk in writing a put option is that the Portfolio may incur a loss if the market value of the underlying position decreases and the option is exercised. In addition, the Portfolio risks not being able to enter into a closing transaction for the written option as the result of an illiquid market.
“When-Issued” Securities:
Purchasing securities “when-issued” is a forward commitment by the Portfolio to buy a security. The estimated amount of the Portfolio’s payment obligation and the security’s interest rate are determined when the commitment is made, even though no interest accrues until the security is issued, which is generally 15 to 120 days later. The Portfolio will segregate liquid assets with its custodian sufficient at all times to satisfy these commitments. If the value of the security is less when delivered than when the commitment was made, the Portfolio will suffer a loss.
MSF-32
Metropolitan Series Fund, Inc.
Met/Dimensional International Small Company Portfolio
Notes to Financial Statements—December 31, 2008—(Continued)
Fund Concentration:
The investments by the Portfolio in foreign securities may involve risks not present in domestic investments. Since securities may be denominated in foreign currencies and may require settlement in foreign currencies and pay interest or dividends in foreign currencies, changes in the relationship of these foreign currencies to the U.S. dollar can significantly affect the value of the investments and earnings of the Portfolio. Foreign investments may also subject the Portfolio to foreign government exchange restrictions, expropriation, taxation or other political, social or economic developments, all of which could affect the market and/or credit risk of the investments. In addition to the risks described above, risks may arise from forward foreign currency contracts with respect to the potential inability of counterparties to meet the terms of their contracts.
Federal Income Taxes:
It is the Portfolio’s policy to comply with the requirements of the Internal Revenue Code of 1986, as amended (the “Code”), and regulations thereunder, applicable to regulated investment companies and to distribute, with respect to each taxable year, all of its taxable income to shareholders. Therefore, no federal income tax provision is required. The Portfolio is subject to the provisions of the Financial Accounting Standards Board Interpretation (“FASB”) No. 48, Accounting for Uncertainties in Income Taxes (FIN 48). FIN 48 sets forth a minimum threshold for financial statement recognition of the benefit of a tax position taken or expected to be taken in a tax return. The implementation of FIN 48 did not result in any unrecognized tax benefits in the accompanying financial statements. Each of the Portfolio’s federal tax returns for the prior three fiscal years remains subject to examination by the Internal Revenue Service.
As of December 31, 2008, the Portfolio had no capital loss carryforwards.
As of December 31, 2008, the components of distributable earnings (accumulated losses) on a federal income tax basis were as follows:
| | | | | | | | | | | | |
Undistributed
Ordinary
Income | | Undistributed
Long Term
Gain | | Unrealized
Appreciation | | Loss
Carryforwards | | Total |
$— | | $ | — | | $ | 10,212,066 | | $ | — | | $ | 10,212,066 |
Pursuant to Federal income tax regulations applicable to investment companies, the Portfolio has elected to treat net capital losses realized between November 1 and December 31 of each year as occurring on the first day of the following tax year. For the year ended December 31, 2008, the following amounts of realized capital and currency losses reflected in the accompanying financial statements will not be recognized for Federal income tax purposes until January 1, 2009:
| | | | |
Currency | | Capital | |
$(2,155,650) | | $ | (2,367,967 | ) |
Dividends and Distributions to Shareholders:
The Portfolio records dividends and distributions on the ex-dividend date. Net realized gains from security transactions (if any) are generally distributed annually to shareholders. The timing and characterization of certain income and capital gains distributions are determined in accordance with federal tax regulations that may differ from GAAP. Permanent book and tax basis differences relating to shareholder distributions will result in reclassification between under/over distributed net investment income, accumulated net realized gains/losses and paid in capital.
| 3. | INVESTMENT TRANSACTIONS: |
For the period ended December 31, 2008, purchases and sales of securities (excluding short term investments) for the Portfolio were as follows:
| | | | | | | | | |
Purchases | | Sales |
U.S. Government | | Other | | U.S. Government | | Other |
$0 | | $ | 340,599,559 | | $ | 0 | | $ | 1,791,919 |
MSF-33
Metropolitan Series Fund, Inc.
Met/Dimensional International Small Company Portfolio
Notes to Financial Statements—December 31, 2008—(Continued)
| 4. | INVESTMENT MANAGEMENT FEES AND OTHER TRANSACTIONS WITH AFFILIATES: |
Investment Management Agreement:
MetLife Advisers is the investment adviser to the Portfolio. The Fund has entered into an investment management agreement with MetLife Advisers with respect to the Portfolio. For providing investment management services to the Portfolio, MetLife Advisers receives monthly compensation at the following annual rates:
| | | | | |
Management
Fees earned by
MetLife Advisers
for the period ended
December 31, 2008 | | Annual
percentage
rates paid to
MetLife Advisers | | | Based on Portfolios
average daily net asset
levels |
| $444,071 | | 0.850 | % | | Of the first $100 million |
| | 0.800 | % | | On amounts in excess of $100 million |
Certain officers and directors of the Fund may also be officers of MetLife Advisers; however, such officers and directors receive no compensation from the Fund.
MetLife Advisers has entered into an investment subadvisory agreement with respect to the Portfolio. Dimensional Fund Advisors, L.P. is compensated by MetLife Advisers to provide subadvisory services for the Portfolio.
Service and Distribution Fees:
The Fund has adopted a Distribution and Service Plan under Rule 12b-1 of the 1940 Act for the Portfolio’s Class B shares. Under the Distribution and Service Plan, the Class B shares of the Portfolio pay a fee to compensate the Insurance Companies (or their affiliates) and other broker-dealers and financial intermediaries involved in the offer and sale of Portfolio shares for promoting or selling and servicing the Class B shares. The fees under the Distribution and Service Plan for each class of the Portfolio’s shares are calculated as a percentage of the Portfolio’s average daily net assets that are attributable to that Class. Currently, the fee is 0.25% per year for Class B shares. Amounts paid by the Portfolio for the period ended December 31, 2008 are shown as Service and Distribution fees in the Statement of Operations.
Expense Agreement:
Pursuant to an expense agreement relating to each class of the Portfolio, MetLife Advisers has agreed, from October 31, 2008 to April 30, 2009, to waive a portion of its advisory fees or pay a portion of the other operating expenses (not including brokerage costs, interest, taxes, or extraordinary expenses) to the extent total operating expenses exceed stated annual expense limits (based on the Portfolio’s then current fiscal year). For the Portfolio, this subsidy, is subject to the obligation of each class of the Portfolio to repay MetLife Advisers in future years, if any, when a class’ expenses fall below the stated expense limit pertaining to that class that was in effect at the time of the subsidy in question. Such deferred expenses may be charged to a class in a subsequent year to the extent that the charge does not cause the total expenses in such subsequent year to exceed the class’ stated expense limit that was in effect at the time of the subsidy in question; provided, however, that no class of the Portfolio is obligated to repay any expense paid by MetLife Advisers more than five years after the end of the fiscal year in which such expense was incurred.
The expense limits (annual rates as a percentage of each class of the Portfolio’s net average daily net assets) in effect from October 31, 2008 to April 30, 2009 are 1.15% and 1.40% for Class A and B, respectively.
As of December 31, 2008, the amount of expenses deferred in 2008 subject to repayment until December 31, 2013 was $60,648.
| 5. | MARKET AND CREDIT RISK: |
In the normal course of business, the Portfolio invests in securities and enters into transactions where risks exist due to fluctuations in the market (market risk) or failure of the other party to a transaction to perform (credit risk). The value of securities held by the Portfolio may decline in response to certain events, including those directly involving the companies whose securities are owned by the Portfolio; conditions affecting the general economy; overall market changes; local, regional or global political, social or economic instability; and currency and interest rate and price fluctuations. Similar to credit risk, the Portfolio may be exposed to counterparty risk, or the risk that an entity with which the Portfolio has unsettled or open transactions may default. Financial assets, which potentially expose the Portfolio to credit and counterparty risks, consist principally of
MSF-34
Metropolitan Series Fund, Inc.
Met/Dimensional International Small Company Portfolio
Notes to Financial Statements—December 31, 2008—(Continued)
investments and cash due from counterparties. The extent of the Portfolio’s exposure to credit and counterparty risks in respect to these financial assets approximates their value as recorded in the Portfolio’s Statements of Assets and Liabilities.
| 6. | RECENT ACCOUNTING PRONOUNCEMENTS: |
In March 2008, the FASB issued Statement of Financial Accounting Standards No. 161, Disclosures about Derivative Instruments and Hedging Activities (“FAS 161”), an amendment of FASB Statement No. 133. FAS 161 requires enhanced disclosures about (a) how and why an entity uses derivative instruments, (b) how derivative instruments and hedging activities are accounted for, and (c) how derivative instruments and related hedging activities affect a fund’s financial position, financial performance, and cash flows. Management does not believe the adoption of FAS 161 will materially impact the financial statement amounts, but will require additional disclosures. This will include qualitative and quantitative disclosures on derivative positions existing at period end and the effect of using derivatives during the reporting period. FAS 161 is effective for financial statements issued for fiscal years and interim periods beginning after November 15, 2008. Management is currently evaluating the impact the adoption of FAS 161 will have on the Portfolio’s financial statement disclosures.
MSF-35
Metropolitan Series Fund, Inc.
Met/Dimensional International Small Company Portfolio
Report of Independent Registered Public Accounting Firm
To the Shareholders and Board of Directors of Metropolitan Series Fund, Inc.:
We have audited the accompanying statement of assets and liabilities, including the schedule of investments, of the Met/Dimensional International Small Company Portfolio (one of the portfolios constituting the Metropolitan Series Fund, Inc.) (the “Fund”) as of December 31, 2008, and the related statement of operations, statement of changes in net assets and financial highlights for the period from October 31, 2008 (commencement of operations) through December 31, 2008. These financial statements and financial highlights are the responsibility of the Fund’s management. Our responsibility is to express an opinion on these financial statements and financial highlights based on our audit.
We conducted our audit in accordance with the standards of the Public Company Accounting Oversight Board (United States). Those standards require that we plan and perform the audit to obtain reasonable assurance about whether the financial statements and financial highlights are free of material misstatement. The Fund is not required to have, nor were we engaged to perform, an audit of its internal control over financial reporting. Our audit included consideration of internal control over financial reporting as a basis for designing audit procedures that are appropriate in the circumstances, but not for the purpose of expressing an opinion on the effectiveness of the Fund’s internal control over financial reporting. Accordingly, we express no such opinion. An audit also includes examining, on a test basis, evidence supporting the amounts and disclosures in the financial statements, assessing the accounting principles used and significant estimates made by management, as well as evaluating the overall financial statement presentation. Our procedures included confirmation of securities owned as of December 31, 2008, by correspondence with the custodian and brokers; where replies were not received from brokers, we performed other auditing procedures. We believe that our audit provides a reasonable basis for our opinion.
In our opinion, the financial statements and financial highlights referred to above present fairly, in all material respects, the financial position of the Met/Dimensional International Small Company Portfolio of the Metropolitan Series Fund, Inc. as of December 31, 2008, the results of its operations, the changes in its net assets and the financial highlights for the period from October 31, 2008 (commencement of operations) through December 31, 2008, in conformity with accounting principles generally accepted in the United States of America.
Deloitte & Touche LLP
Boston, Massachusetts
February 24, 2009
MSF-36
Metropolitan Series Fund, Inc.
Directors and Officers
The Fund’s Directors review actions of the Fund’s investment adviser and subadvisers, and decide upon matters of general policy. The Fund’s officers supervise the daily business operations of the Fund. The Board of Directors and the Fund’s officers are listed below. Each Director is responsible for overseeing all 38 Portfolios of the Fund. There is no limit to the term a Director may serve. Directors serve until their resignation, retirement or removal in accordance with the Fund’s organizational documents and policies adopted by the Board from time to time. Officers hold office at the pleasure of the Board or until the election or appointment and the qualification of a successor. The address of the Directors and officers is c/o Metropolitan Series Fund, Inc., 501 Boylston Street, Boston, MA 02116.
Interested Directors(1)
Each Director below is an “interested person” (as defined by the 1940 Act) with respect to the Fund in that Ms. Forget is an employee of MetLife and Mr. Typermass is a former employee of MetLife and owns securities issued by MetLife, Inc., the ultimate parent company of MetLife Advisers.
| | | | | | | | |
Name, Address and Age | | Current
position(s)
with Fund | | Position(s)
held since | | Principal occupations
over past five years, including other directorships(2) | | Number of
Portfolios in
Fund Complex
Overseen by
Director(3) |
Elizabeth M. Forget Age: 42 | | Director, Chairman of the Board, President and Chief Executive Officer | | 2006 | | Senior Vice President (since 2007), MetLife, Inc.; President, Met Investors Advisory, LLC; Trustee and President, Met Investors Series Trust; Executive Vice President, MetLife Investors Group, Inc.; President, Chief Executive Officer and Chair of the Board of Managers (since 2006), MetLife Advisers; President, Met Investors Advisory, LLC. | | 87 |
| | | | |
Arthur G. Typermass Age: 71 | | Director | | 1998 | | Formerly, Senior Vice President and Treasurer, MetLife. | | 38 |
Non-Interested Directors(1)
Each Director below is not an “interested person” (as defined by the 1940 Act) with respect to the Fund (collectively, the “Independent Directors”).
| | | | | | | | |
Name, Address and Age | | Current
position(s)
with Fund | | Position(s)
held since | | Principal occupations
over past five years, including other directorships(2) | | Number of
Portfolios in
Fund Complex
Overseen by
Director(3) |
Steve A. Garban† Age: 71 | | Director | | 1985 | | Formerly, Chief Financial Officer, Senior Vice President Finance and Operations and Treasurer (Emeritus), The Pennsylvania State University. | | 38 |
| | | | |
Linda B. Strumpf Age: 61 | | Director | | 2000 | | Vice President and Chief Investment Officer, Ford Foundation. | | 38 |
| | | | |
Michael S. Scott Morton† Age: 71 | | Director | | 1993 | | Jay W. Forrester Professor of Management (Emeritus) at Sloan School of Management, MIT. | | 38 |
| | | | |
H. Jesse Arnelle Age: 75 | | Director | | 2001 | | Formerly, Counsel, Womble Carlyle Sandrie & Rice; Director, Textron Inc. (global multi- industry company)*; formerly, Director, Gannet Co. Inc. (diversified news and information company)*; formerly, Director, Eastman Chemical Company (global chemical company)*; formerly, Director, Waste Management, Inc.*; formerly, Director, Armstrong Holdings Inc. (parent company of floor and ceiling products business)*; formerly, Director, FPL Group Inc. (public utility holding company)*; Director, URS Corporation (engineering design services firm)*. | | 38 |
MSF-37
Metropolitan Series Fund, Inc.
Directors and Officers—(Continued)
| | | | | | | | |
Name, Address and Age | | Current
position(s)
with Fund | | Position(s)
held since | | Principal occupations
over past five years, including other directorships(2) | | Number of
Portfolios in
Fund Complex
Overseen by
Director(3) |
Nancy Hawthorne Age: 57 | | Director | | 2003 | | Chief Executive Officer, Clerestory LLC (corporate financial advisor); Director, Avid Technologies (computer software company)*; formerly, Chairman of the Board of Avid Technologies; formerly, Board of Advisors, L. Knife & Sons, Inc. (beverage distributor); formerly, Trustee, New England Zenith Fund (“Zenith Fund”)**; formerly, Chief Executive Officer and Managing Partner, Hawthorne, Krauss and Associates (corporate financial advisor); formerly, Chief Financial Officer and Executive Vice President, Continental Cablevision, subsequently renamed MediaOne (cable television company); formerly, Director, Life F/X, Inc.; formerly, Chairman of the Board, WorldClinic (distance medicine company); formerly, Director, Perini Corporation (construction company)*; formerly, Director, CGU (property and casualty insurance company); formerly, Director, Beacon Power Corporation (energy company)*. | | 38 |
| | | | |
John T. Ludes Age: 72 | | Director | | 2003 | | President, LFP Properties (consulting firm); Formerly, Trustee, Zenith Fund**; formerly, Vice Chairman, President and Chief Operating Officer, Fortune Brands/American Brands (global conglomerate); formerly, President and CEO, Acushnet Company (athletic equipment company). | | 38 |
Officers(1)
| | | | | | | | |
Name and address | | Age | | Current
position(s)
with Fund | | Position(s)
held since | | Principal occupations over past five years(2) |
| Jeffrey L. Bernier | | 37 | | Senior Vice President | | 2008 | | Vice President (since 2008), MetLife, Inc.; Vice President (since 2008), MetLife; Senior Vice President (since 2008), MetLife Advisers; formerly, Director and Senior Investment Analyst (2004 to 2007), John Hancock Financial Services; formerly, Assistant Vice President (2000 to 2001), Wachovia Securities. |
| | | | |
| Alan C. Leland | | 56 | | Senior Vice President | | 2005 | | Treasurer and Chief Financial Officer, MetLife Advisers, LLC; Treasurer (since 2005), Met Investors Advisory, LLC; Vice President (since 2004), Met Investors Advisory, LLC; Vice President (since 2003), MetLife, Inc.; Vice President, MetLife; Senior Vice President, NELICO. |
| | | | |
| Peter Duffy | | 53 | | Vice President
and Treasurer | | 2000 | | Senior Vice President, MetLife Advisers; Second Vice President (since 2003), NELICO; Vice President, MetLife (since 2004); Vice President (since 2004), MetLife, Inc.; formerly, Vice President and Treasurer, Zenith Fund**. |
| | | | |
| Jeffrey P. Halperin | | 41 | | Chief
Compliance Officer | | 2007 | | Vice President (since 2006), MetLife, Inc.; Vice President (since 2006), MetLife; Chief Compliance Officer (since 2006), Met Investors Series Trust, MetLife Advisers, Met Investors Advisory, LLC and MetLife Investment Advisors Company, LLC. |
| * | Indicates a directorship with a registered investment company or a company subject to the reporting requirements of the Securities Exchange Act of 1934, as amended. |
| ** | The Zenith Fund deregistered with the Securities and Exchange Commission (“SEC”) in 2004. |
| (†) | Served as a trustee, director and/or officer of one or more of the following companies, each of which had a direct or indirect advisory relationship with MetLife Advisers or its affiliates prior to January 31, 2005: State Street Research Financial Trust, State Street Research Income Trust, State Street Research Money Market Trust, State Street Research Institutional Funds, State Street Research Capital Trust, State Street Research Master Investment Trust, State Street Research Equity Trust, State Street Research Securities Trust and State Street Research Exchange Trust (collectively, the “State Street Research Funds”). |
| (1) | During the period shown, each Director of the Fund served as a Trustee of Metropolitan Series Fund II, a registered investment company that ceased investment operations in June of 2008 and has applied for deregistration under the Investment Company Act of 1940. During this period, each officer of the Fund served in the same position with Metropolitan Series Fund II. |
| (2) | Previous positions during the past five years with the Fund; Met Investors Series Trust; MetLife; MetLife, Inc.; MetLife Advisers; Met Investors Advisory, LLC; Zenith Fund; NELICO; or New England Securities Corporation are omitted if not materially different. |
| (3) | The Fund Complex includes the Fund (38 portfolios) and Met Investors Series Trust (49 portfolios). |
MSF-38
Metropolitan Series Fund, Inc.
Met/Dimensional International Small Company Portfolio
Board Approval of Advisory and Subadvisory Agreements
The Fund’s Contract Review Committees of the Board of Directors (the “Board” or the “Directors”) typically meet in early fall to review the Portfolios’ advisory agreements (the “Advisory Agreements”) and subadvisory agreements (the “Subadvisory Agreements,” and, together with the Advisory Agreements, the “Agreements”) and determine whether to recommend that the full Board approve the continuation of the Agreements for an additional one-year period. (Following the initial approval of an Agreement for a new Portfolio or with a new adviser or subadviser, such annual reviews are not required until 2 years following the execution of such Agreement.) After each Committee has made its recommendations, the full Board, including the Independent Directors, determines whether to approve the continuation of each of the Agreements. In addition, the Board, including the Independent Directors, considers matters bearing on the Agreements at most of its other meetings throughout the year and regularly interviews various individuals at MetLife Advisers responsible for the management of the Portfolios. The Directors also interview selected investment managers and other professionals at the subadvisers at various times throughout the year.
The Directors receive all materials that they or MetLife Advisers, the Fund’s investment adviser, and the subadvisers believe to be reasonably necessary for the Directors to evaluate the Agreements and determine whether to approve the continuation of the Agreements. These materials generally include, among other items, (i) information on the investment performance of the Portfolios and the performance of peer groups of funds and the Portfolios’ performance benchmarks, (ii) information on the Portfolios’ advisory and subadvisory fees and other expenses, including information comparing the Portfolios’ expenses to those of peer groups of funds and information about any applicable expense caps and fee “breakpoints,” (iii) sales and redemption data, (iv) information related to the profitability of the Agreements to MetLife Advisers and certain of the subadvisers, and potential “fall-out” or ancillary benefits that MetLife Advisers, the subadvisers or their affiliates may receive as a result of their relationships with the Fund and (v) information obtained through the subadvisers’ responses to certain requests from MetLife Advisers and the Directors and MetLife Advisers’ responses to requests from the Directors. The Directors may also consider other information such as (vi) MetLife Advisers’ and the subadvisers’ financial results and condition, (vii) each Portfolio’s investment objectives and strategies and the size, education and experience of the investment staffs of MetLife Advisers and the relevant subadvisers and their use of technology and external research, (viii) the allocation of the Portfolios’ brokerage, if any, including allocations to brokers affiliated with the subadvisers and the use of “soft” commission dollars to pay Portfolio expenses and to pay for research and other similar services, (ix) the resources devoted to, and the record of compliance with, the Portfolios’ investment policies and restrictions, policies on personal securities transactions and other compliance policies, (x) the responses of MetLife Advisers, the subadvisers and/or their affiliates to certain legal and regulatory proceedings and (xi) the economic outlook generally and for the mutual fund industry in particular. Throughout the process, the Directors have the opportunity to ask questions of and request additional materials from MetLife Advisers and the subadvisers.
Following meetings of each Contract Review Committee on September 10, 2008, the Board, including the Independent Directors, at its November 6-7, 2008 meeting, approved the continuation through December 31, 2009 of the Advisory Agreements for each Portfolio of the Fund and the Subadvisory Agreements for each Portfolio other than the Zenith Equity Portfolio and Asset Allocation Portfolios (which do not have subadvisers) and the Van Eck Global Natural Resources Portfolio, Met/Dimensional International Small Cap Portfolio and Loomis Sayles Small Cap Growth Portfolio (formerly known as the Franklin Templeton Small Cap Growth Portfolio). The Agreements approved for continuation are referred to below as the “Continued Agreements.”
In considering whether to approve the continuation of the Continued Agreements, the Directors, including the Independent Directors, did not identify any single factor as determinative, and each weighed the various factors as he or she deemed appropriate. The Directors considered the following matters in connection with their approval of the Continued Agreements:
The nature, extent and quality of the services provided to the relevant Portfolios under the Continued Agreements. The Directors considered the nature, extent and quality of the services provided by MetLife Advisers, the relevant subadvisers (if any) and their affiliates (each, an “Adviser,” and, collectively, the “Advisers”) to the relevant Portfolios pursuant to the Continued Agreements and the resources dedicated to these Portfolios by the Advisers. In particular, the Directors considered the Advisers’ abilities to attract and retain highly qualified investment professionals. With respect to MetLife Advisers, the Directors considered (for each Portfolio other than the Zenith Equity and Asset Allocation Portfolios) that MetLife Advisers is (i) ultimately responsible for the performance of such Portfolios; (ii) ultimately responsible for the establishment of the investment strategies of each such Portfolio, primarily through its recommendations to the Board regarding the hiring and selection of subadvisers; (iii) responsible for the hiring and selection, subject to Board approval, of subadvisers; and (iv) responsible for maintaining a program of Subadviser oversight reasonably designed to ensure that the subadvisers have reasonable compliance policies and procedures in place. The Directors also considered that MetLife Advisers provides a full range of day-to-day administrative services for the Portfolios involving all aspects of such Portfolios’ day-to-day operations (other than portfolio management). With respect to the Zenith Equity and Asset Allocation Portfolios, the Directors considered both the portfolio management services and the administrative services provided by MetLife Advisers. After reviewing
MSF-39
Metropolitan Series Fund, Inc.
Met/Dimensional International Small Company Portfolio
Board Approval of Advisory and Subadvisory Agreements—(Continued)
these and related factors, the Directors concluded, within the context of their overall conclusions regarding each of the Continued Agreements, that the nature, extent and quality of services provided supported the renewal of these Agreements.
Investment performance of the relevant Portfolios. The Directors reviewed information about the performance of the relevant Portfolios over various time periods, including information prepared by an independent third party that compared the performance of the Portfolios to the performance of peer groups of funds and performance benchmarks. The Directors also reviewed a description of the third party’s methodology for identifying a Portfolio’s peer group(s) for purposes of performance and expense comparisons.
In the case of each relevant Portfolio that had performance that lagged its peer group(s) for certain periods, the Directors concluded that other factors relevant to performance were sufficient, in light of other considerations, to warrant renewal of the Continued Agreements relating to such Portfolio. These factors varied from Portfolio to Portfolio, but included one or more of the following: (i) that such Portfolio’s performance, although lagging in certain recent periods, was stronger over the longer term; (ii) that the underperformance was attributable, to a significant extent, to investment decisions that were reasonable and consistent with the Portfolio’s investment objective(s) and policies and that the Portfolio was performing within the range of reasonable expectations, given market conditions and the Portfolio’s investment objective(s) and policies; (iii) that the Portfolio’s performance was competitive when compared to other relevant performance benchmarks or peer groups; and (iv) that MetLife Advisers and/or the relevant subadviser (if any) had taken or was taking steps designed to help improve the Portfolio’s investment performance (including, in the case of certain Portfolios, that MetLife Advisers was formulating possible proposals, for presentation to the Board in November 2008, to replace the Portfolio’s subadviser or to merge the Portfolio into another Portfolio with a similar investment objective and better investment performance).
The Directors also considered the investment performance of the Advisers and their reputations generally, the historical responsiveness of the Advisers to Director concerns about performance and the willingness of the Advisers to take steps intended to improve performance.
After reviewing these and related factors, the Directors concluded, within the context of their overall conclusions regarding each of the Continued Agreements, that the investment performance of each relevant Portfolio and Adviser was sufficient, in light of other considerations, to warrant the renewal of the Continued Agreements.
The costs of the services to be provided and profits to be realized by the Advisers and their affiliates from their relationships with the Portfolios. The Directors considered the fees charged by MetLife Advisers to the Portfolios for advisory services and, with respect to the subadvised Portfolios, by such subadvisers to MetLife Advisers for subadvisory services (such advisory and subadvisory fees (if any), collectively, “Fees”), as well as the total expense levels of the Portfolios. This information included comparisons (provided by an independent third party) of the Portfolios’ advisory fees and total expense levels to those of their peer groups. In evaluating Fees for the relevant Portfolios, the Directors also took into account the demands, complexity and quality of the investment management services provided to each Portfolio. The Directors considered MetLife Advisers’ recommendations regarding reductions in Fee rates, implementation of Fee breakpoints and institution of Fee waivers and expense caps.
The Directors also considered the compensation directly or indirectly received by the Advisers and their affiliates from their relationships with the relevant Portfolios. The Directors reviewed information relating to the profits received by MetLife Advisers, certain of the subadvisers and their affiliates as a result of their relationships with the relevant Portfolios, and information about the allocation of expenses used to calculate profitability. When reviewing profitability, the Directors also considered the performance of the relevant Portfolios, the expense levels of such Portfolios and whether the relevant Advisers had implemented breakpoints, fee waivers and/or expense caps with respect to such Portfolios.
After reviewing these and related factors, the Directors concluded, within the context of their overall conclusions regarding each of the Continued Agreements, that the Fees charged to each of the relevant Portfolios were fair and reasonable, and that the information provided regarding costs of these services generally, and the related profitability (if known) to the relevant Advisers of their relationships with the relevant Portfolios, supported the renewal of the Continued Agreements.
Economies of Scale. The Directors considered the existence of any economies of scale in the provision of services by the Advisers and whether those economies were shared with the relevant Portfolios through breakpoints in their advisory fees or other means, such as expense caps, fee waivers or relatively low levels of fees. The Directors noted that most of the relevant Portfolios benefited or will benefit from breakpoints, expense caps and/or fee waivers with respect to their advisory fees. In considering these issues, the Directors also took into consideration information relating to the costs of the services provided and the profitability to MetLife Advisers, the relevant subadvisers (if any) and each of their affiliates of their relationships with the relevant Portfolios, as discussed above.
MSF-40
Metropolitan Series Fund, Inc.
Met/Dimensional International Small Company Portfolio
Board Approval of Advisory and Subadvisory Agreements—(Continued)
After reviewing these and related factors, the Directors concluded, within the context of their overall conclusions regarding each of the Continued Agreements, that the extent to which economies of scale were shared with the relevant Portfolios supported the renewal of such Agreements.
Other Factors. The Directors also considered other factors, which included but were not limited to the following:
| | • | | the extent to which each relevant Portfolio operated in accordance with its investment objective, and its record of compliance with its investment restrictions and the compliance programs of the Fund and the Advisers. They also considered the compliance-related resources the Advisers and their affiliates provide to the relevant Portfolios; |
| | • | | the nature, quality, cost and extent of administrative and shareholder services performed by MetLife Advisers and its affiliates under the Advisory Agreements; and |
| | • | | so-called “fall-out benefits” to the Advisers, such as the engagement of their affiliates to provide distribution, brokerage and transfer agency services to the Portfolios, and the benefits of research made available to the relevant Advisers by reason of brokerage commissions generated by the relevant Portfolios’ securities transactions. The Directors also considered the possible conflicts of interest associated with these fall-out and other benefits, and the reporting and other processes in place to disclose and monitor these possible conflicts of interest. |
Based on their evaluation of all factors that they deemed to be material, including those factors described above, and assisted by the advice of independent counsel, the Directors, including the Independent Directors, concluded that each of the Continued Agreements should be continued through December 31, 2009.
Certain Matters Relating to Met/Dimensional International Small Cap Portfolio (the “Dimensional Portfolio”). At the August 13-14, 2008 Board meeting, the Board established the Dimensional Portfolio. The Board also approved the Dimensional Portfolio’s advisory agreement between the Fund, on behalf of the Dimensional Portfolio, and MetLife Advisers (the “Dimensional Advisory Agreement”) and the subadvisory agreement between MetLife Advisers and Dimensional Fund Advisers, L.P. (“Dimensional”) (the “Dimensional Subadvisory Agreement,” and, together with the Dimensional Advisory Agreement, the “Dimensional Agreements”).
The Board met with representatives from Dimensional and received information regarding Dimensional’s future plans for the management of the Dimensional Portfolio. In making the determination to approve the Dimensional Agreements, the Board carefully considered those factors described above with respect to the continuation of the Continued Agreements, as relevant to both the Dimensional Advisory Agreement and Dimensional Subadvisory Agreement. In addition to these factors, the Board also considered as relevant the experience, investment style and investment performance history of Dimensional as portfolio manager.
Following such consideration, and assisted by the advice of independent counsel, the Directors, including the Independent Directors, unanimously voted to approve the Dimensional Agreements, effective October 30, 2008 through October 29, 2010.
MSF-41
A description of the policies and procedures that the Fund uses to determine how to vote proxies relating to portfolio securities is available (i) without charge, upon request, by calling (800) 638-7732 and (ii) on the Securities and Exchange Commission’s (the “SEC”) website at http://www.sec.gov.
Information regarding how the Fund voted proxies relating to portfolio securities during the most recent twelve-month period ended December 31, 2008 is available (i) without charge, upon request, by calling (800) 638-7732 and (ii) on the SEC’s website at http://www.sec.gov.
The Fund’s Statement of Additional Information includes additional information about the Directors of the Fund and is available (i) without charge, upon request, by calling (800) 638-7732 and (ii) on the SEC’s website at http://www.sec.gov.
The Fund files with the SEC a complete schedule of its portfolio holdings, as of the close of the first and third quarters of its fiscal year, on “Form N-Q”. These filings are available on the SEC’s website at www.sec.gov and may be reviewed and copied at the SEC’s Public Reference Room in Washington, DC. (Call 1-800-SEC-0330 for information on the operation of the Public Reference Room.)
MSF-42
Simplify your life…
with MetLife eDelivery® while helping MetLife preserve the planet’s natural resources.
(see details on inside cover)
| | |
Metropolitan Series Fund, Inc. MetLife Aggressive Allocation Portfolio Annual Report | | December 31, 2008 |
NOT PART OF THE ANNUAL REPORT
Letter from the President
February 1, 2009
Letter to Policy Holders:
2008 was an extraordinary year in the capital markets around the world and for the global economy. Energy prices rose to record levels early in the year before falling by two-thirds by year-end. A credit crisis that began with concerns about sub-prime mortgages led to massive changes in the financial landscape with government takeovers, forced sales, and outright failures of a number of large, once venerable firms.
While bonds as measured by the Barclays Capital U.S. Aggregate Bond Index (formerly known as, Lehman Brothers U.S. Aggregate Bond Index) were up 5.2% for the year in response to declining interest rates, there were large differences in the total returns of the various sectors of the bond market. U.S. treasury securities were up over 13% as frightened investors sought refuge in what they perceived to be the safest and most liquid investments. In contrast, investment grade corporate securities lost nearly 5% as credit spreads widened and below investment grade or high yield bonds fell over 26%.
In response to the growing credit crisis and the weakening economy, common stocks fell sharply across all regions, styles, and capitalizations. As measured by the Standard and Poor’s 500, U.S. common stocks fell 37% for the year, the worst calendar year decline since the 1930s. Foreign stocks were down even more with the MSCI EAFE Index down 43% for the year.
On the following pages, you will find a complete review of your Portfolio and its investment performance.
MetLife is committed to building your financial freedom. We appreciate your trust and will continue to focus our efforts on meeting your investment needs.
Sincerely,
Elizabeth M. Forget
President, Metropolitan Series Fund, Inc.
Metropolitan Series Fund, Inc.
MetLife Aggressive Allocation Portfolio
Managed by MetLife Advisers, LLC
Portfolio Manager Commentary*
PORTFOLIO PERFORMANCE
For the twelve-month period ended December 31, 2008, the Class A shares of the MetLife Aggressive Allocation Portfolio returned -40.3% compared to the -37.3% return of the Wilshire 5000 Stock Index 1. Considering that no single index or benchmark can accurately capture the multiple asset class design of the Portfolio, we have created a blended benchmark comprised of several indices for use in portfolio design and evaluation purposes. Specifically, the blended benchmark for the MetLife Aggressive Allocation Portfolio currently consists of an 75% allocation to the Wilshire 5000 Stock Index and a 25% allocation to the Morgan Stanley Capital International EAFE Index2. During the twelve-month period ended December 31, 2008, the blended benchmark returned -38.8%.
ECONOMIC AND MARKET REVIEW
The first half of 2008 was highlighted by growing concerns about the economy due to the emerging credit crisis, rising unemployment, falling consumer confidence, a struggling housing sector, and skyrocketing food and energy prices. The forced sale of Bear Stearns in March to JP Morgan at first appeared to be an isolated event, but would prove to be a harbinger of things to come. The Federal Reserve was aggressive early in the year to revive the economy when they cut their target rate several times to bring it down from 4.25% to 2.00% by early May. They held rates steady in subsequent meetings through the summer as they tried to balance the danger of the economy falling into a recession against their desire to control growing inflation pressures.
However, the evidence of a weakening economy (especially falling real estate prices and the impact of the sub-prime mortgage crisis) gained momentum during the summer, climaxing in the extraordinary events of September and October that saw the government’s provision of credit assistance to Fannie Mae and Freddie Mac, the bankruptcy of Lehman Brothers, and the failure of Washington Mutual. The U.S. government and governments around the world took massive fiscal and monetary actions to stabilize the capital markets, restore liquidity to the clogged credit pipeline, and to stimulate the economy. These efforts continue as we move into 2009. Although we now know that the recession began a year ago in December 2007, the recession intensified during the last months of 2008: unemployment rose sharply as companies made massive layoffs, housing prices and sales continued to fall, retail sales fell, and, in a bit of good news / bad news, oil prices fell nearly $100 per barrel in response in expectation of lower global demand. The incoming administration of Barack Obama faces what most pundits call the largest economic crisis since the Great Depression.
U.S. common stocks suffered their worst calendar year decline in over seventy years during 2008 as measured by the -37.0% return of the Standard & Poor’s 500 Index4. Growing expectations for a deep and long recession and a sharp drop in corporate earnings drove stock prices lower. The total collapse of several high profile financial firms pulled the indices down further. While there was very little difference in the return by style within large cap stocks, growth fell more than value at the mid cap and small cap segments. There was little difference in return by capitalization. By sector, Financials and Materials were down the most, while Consumer Staples held up better on a relative basis. Energy, which was up nearly 9% in the first half of the year, fell 40% in the second half to finish the year down almost 35%. Foreign stocks were also down sharply for the year, falling over 43% as measured by the MSCI EAFE Index. Emerging markets were down 53.3% as measured by the MSCI Emerging Markets Index5.
PORTFOLIO REVIEW
The MetLife Aggressive Allocation Portfolio is a “fund of funds” consisting of other portfolios of the Met Investors Series Trust and the Metropolitan Series Fund with a broad allocation goal of 100% in equities and 0% in fixed income, although we do expect there will be a small fixed income position through the cash holdings of the underlying equity funds. The most significant change in strategy during the first half of 2008 was an increase in the asset class goal for foreign stocks from 20% of total equities to 25% of total equities. For this Portfolio, this resulted in a change in the goal for foreign stocks from 20% to 25%. There were also several small adjustments to the underlying portfolio targets that were part of the annual review and restructuring. We initiated positions in two new portfolios during the fourth quarter to add further diversification: a 3% position in the Met/Dimensional International Small Company Portfolio and a 2% position in the Van Eck Global Natural Resources Portfolio.
The Portfolio was structured to be diversified across a wide variety of equity asset classes to add value over the long term. However, for most of 2008, investors shunned risk and rewarded only what they perceived to be the safest investments.
Within the equity sector, a cumulative overweight in the weak Financials and Materials sectors and an underweight to the relatively better performing Consumer Staples sector detracted from relative performance during the full year. Although all equity portfolios were down sharply for the year, several held up better than the market and helped relative performance. Dreman Small Cap Value Portfolio, although down over 25% for the year, held up better than the broad equity indices due to an overweight in the Consumer Staples sector and good overall stock selection, especially in the Health Care sector. BlackRock Large Cap Value Portfolio added to relative performance mostly due to good stock selection in the Financials sector by avoiding many of the high profile blowups. MFS Value Portfolio also had good relative performance for the year. It was helped by an underweight and good stock selection in the generally struggling Information Technology sector. They avoided poorer performing stocks such as Apple, Google, and Mircosoft and owned better performing alternatives such as Accenture, Oracle, and IBM.
The Legg Mason Value Equity Portfolio was hurt in the first half of the year by its lack of exposure to the strong energy sector, but it continued to struggle in the second half even though the portfolio managers’ concerns about the sustainability of the high energy prices
MSF-2
Metropolitan Series Fund, Inc.
MetLife Aggressive Allocation Portfolio
Managed by MetLife Advisers, LLC
Portfolio Manager Commentary*
proved to be correct. The portfolio was also hurt by its exposure to several of the high profile financial stocks. Neuberger Berman Mid Cap Value Portfolio, one of the strongest performing portfolios in the first half of the year due to its energy exposure, struggled in the second half of the year for the same reason. It also was hurt by its exposure to Bear Stearns and poor overall stock selection in the Industrial sector. For example Chicago Bridge & Iron, Terex Corp., and McDermott International were all large positions that each fell over 70% for the year. FI Mid Cap Opportunities Portfolio was also hurt by its energy exposure in the second half and by overall poor stock selection, especially in the Financials (holding Brazilian brokerage firm BM&F Bovespa) and Industrials (holding engineering firm Flowserve) sectors.
Despite the recent poor performance of the Portfolio, we will continue to take a long term view to provide a well diversified portfolio to meet long term objectives.
* The views expressed above are those of the advisory firm as of December 31, 2008 and are subject to change based on market and other conditions. Information about the Portfolio’s holdings, asset allocation, industry allocation, or country diversification is historical and is not an indication of future Portfolio composition, which will vary. The performance of any index mentioned in this commentary has not been adjusted for ongoing management, distribution and operating expenses, and sales charges applicable to mutual fund investments. Direct investment in any index is not possible.
1 The Wilshire 5000 Equity Index measures the performance of all U.S. headquartered equity securities with readily available price data.
2 The Morgan Stanley Capital International Europe, Australasia and Far East Index (“MSCI EAFE Index”) is an unmanaged free float-adjusted market capitalization index that is designed to measure developed market equity performance, excluding the U.S. & Canada.
3 Barclays Capital Aggregate Bond Index (formerly, Lehman Brothers U.S. Aggregate Bond Index) includes most obligations of the U.S. Treasury, agencies and quasi-federal corporations, most publicly issued investment grade corporate bonds and most bonds backed by mortgage pools of GNMA, FNMA and FHLMC. The index itself remains unchanged since Barclays assumed responsibility for the index from Lehman.
4 The Standard & Poor’s (S&P) 500® Composite Stock Price Index is an unmanaged index representing the performance of 500 major companies, most of which are listed on the New York Stock Exchange.
5 The MSCI Emerging Markets Index is a free float-adjusted market capitalization index that is designed to measure equity market performance of emerging markets. As of January 2009 the MSCI Emerging Markets Index consisted of the following 23 emerging market country indices: Argentina, Brazil, Chile, China, Colombia, Czech Republic, Egypt, Hungry, India, Indonesia, Israel, Korea, Malaysia, Mexico, Morocco, Peru, Philippines, Poland, Russia, South Africa, Taiwan, Thailand, and Turkey.
MSF-3
Metropolitan Series Fund, Inc.
MetLife Aggressive Allocation Portfolio
A $10,000 INVESTMENT COMPARED TO
THE WILSHIRE 5000 STOCK INDEX
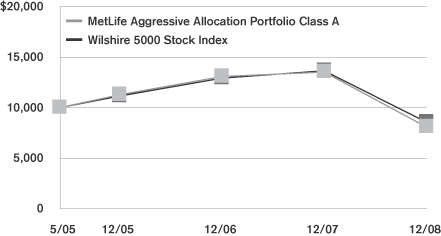
Average Annual Returns as of December 31, 2008
| | | | | | | | | |
| | | MetLife Aggressive Allocation Portfolio | | | Wilshire 5000 Stock Index | |
| | | Class A | | | Class B | | |
| 1 Year | | -40.3 | % | | -40.4 | % | | -37.3 | % |
| Since Inception | | -5.6 | | | -5.9 | | | -4.2 | |
Performance numbers are net of all Portfolio expenses but do not include any insurance, sales, or administrative charges of variable annuity or life insurance contracts or any additional expenses that participants in certain eligible qualified plans may bear relating to the operations of their plans. If these charges were included, the returns would be lower.
Inception date of the Class A and Class B shares is 5/2/05. Index since inception return is based on the Portfolio’s inception date.
This information represents past performance and is not indicative of future results. Investment return and principal value may fluctuate so that shares, upon redemption, may be worth more or less than the original cost.
PORTFOLIO COMPOSITION
as of December 31, 2008
Top Holdings
| | |
| | | % of Total
Net Assets |
Metropolitan Series Fund, Inc.—Davis Venture Value Portfolio, (Class A) | | 11.7% |
Metropolitan Series Fund, Inc.—BlackRock Large Cap Value Portfolio, (Class A) | | 7.2% |
Metropolitan Series Fund, Inc.—MetLife Stock Index Portfolio, (Class A) | | 6.9% |
Metropolitan Series Fund, Inc.—Jennison Growth Portfolio, (Class A) | | 6.9% |
Metropolitan Series Fund, Inc.—T. Rowe Price Large Cap Growth Portfolio, (Class A) | | 6.9% |
Metropolitan Series Fund, Inc.—MFS Value Portfolio, (Class A) | | 6.1% |
Met Investors Series Trust—MFS Research International Portfolio, (Class A) | | 5.6% |
Metropolitan Series Fund, Inc.—Julius Baer International Stock Portfolio, (Class A) | | 5.2% |
Met Investors Series Trust—Harris Oakmark International Portfolio, (Class A) | | 5.1% |
Met Investors Series Trust—BlackRock Large Cap Core Portfolio, (Class A) | | 5.1% |
MSF-4
Metropolitan Series Fund, Inc.
Shareholder Expense Example
As a shareholder of the Fund, you incur ongoing costs, including management fees; distribution and service (12b-1) fees; and other fund expenses. This example is intended to help you understand your ongoing costs (in dollars) (referred to as “expenses”) of investing in the Portfolio and compare these costs with the ongoing costs of investing in other mutual funds. The example is based on an investment of $1,000 invested at the beginning of the period and held for the entire period, July 1, 2008 through December 31, 2008.
Actual Expenses
The first line for each share class of the Portfolio in the table below provides information about actual account values and actual expenses. You may use the information in this line, together with the amount you invested in the particular share class of the Portfolio, to estimate the expenses that you paid over the period. Simply divide your account value by $1,000 (for example, an $8,600 account value divided by $1,000=8.6), then multiply the result by the number in the first line under the heading entitled “Expenses Paid During Period” to estimate the expenses you paid on your account during this period.
Hypothetical Example for Comparison Purposes
The second line for each share class of the Portfolio in the table below provides information about hypothetical account values and hypothetical expenses based on the Portfolio’s actual expense ratio and an assumed rate of return of 5% per year before expenses, which is not the Portfolio’s actual return. The hypothetical account values and expenses may not be used to estimate the actual ending account balance or expenses you paid for the period. You may use this information to compare the ongoing costs of investing in the Portfolio and other funds. To do so, compare this 5% hypothetical example with the 5% hypothetical examples that appear in the shareholder reports of the other funds.
Please note that the expenses shown in the table are meant to highlight your ongoing costs only and do not reflect any fees or charges of your variable insurance product or any additional expenses that participants in certain eligible qualified plans may bear relating to the operations of their plan. Therefore, the second line for each share class in the table is useful in comparing ongoing costs only, and will not help you determine the relative total costs of owning different funds. In addition, if these other costs were included, your costs would have been higher.
| | | | | | | | | | | | | | |
Portfolio | | | | Annualized
Expense
Ratio | | | Beginning
Account Value
July 1,
2008 | | Ending
Account Value
December 31,
2008 | | Expenses Paid
During Period*
July 1, 2008
to
December 31,
2008 |
MetLife Aggressive Allocation—Class A(a)(b) | | Actual | | 0.84 | % | | $ | 1,000.00 | | $ | 674.98 | | $ | 3.54 |
| | Hypothetical | | 0.84 | % | | $ | 1,000.00 | | $ | 1,020.86 | | $ | 4.27 |
| | | | | |
MetLife Aggressive Allocation—Class B(a)(b) | | Actual | | 1.09 | % | | $ | 1,000.00 | | $ | 674.07 | | $ | 4.59 |
| | Hypothetical | | 1.09 | % | | $ | 1,000.00 | | $ | 1,019.59 | | $ | 5.53 |
* Expenses paid are equal to the Portfolio’s annualized expense ratio for the most recent six month period, as shown above, multiplied by the average account value over the period, multiplied by the number of days in the most recent fiscal half-year, divided by 366 (to reflect the the one-half year period).
(a) The annualized expense ratio shown reflects an expense agreement between MetLife Advisers, LLC and the Portfolio as described under Expense Agreement in Note 4 to the Financial Statements.
(b) The annualized expense ratio reflects the expenses of both the Portfolio and the underlying Portfolios in which it invests.
MSF-5
Metropolitan Series Fund, Inc.
MetLife Aggressive Allocation Portfolio
Schedule of Investments as of December 31, 2008
Mutual Funds—100.0% of Total Net Assets
| | | | | | |
| Security Description | | Shares | | Value* | |
| |
Affiliated Investment Companies—100.0% | | | | |
Met Investors Series Trust—BlackRock Large Cap Core Portfolio, (Class A) | | 1,158,786 | | $ | 7,729,102 | |
Met Investors Series Trust—Clarion Global Real Estate Portfolio, (Class A) | | 405,841 | | | 3,003,221 | |
Met Investors Series Trust—Dreman Small Cap Value Portfolio, (Class A) | | 643,491 | | | 6,306,209 | |
Met Investors Series Trust—Harris Oakmark International Portfolio, (Class A) | | 909,345 | | | 7,793,087 | |
Met Investors Series Trust—Lazard Mid-Cap Portfolio, (Class A) | | 866,295 | | | 6,003,424 | |
Met Investors Series Trust—Legg Mason Value Equity Portfolio, (Class A) | | 1,520,230 | | | 6,977,855 | |
Met Investors Series Trust—Met/AIM Small Cap Growth Portfolio, (Class A) | | 721,330 | | | 6,030,322 | |
Met Investors Series Trust—MFS Research International Portfolio, (Class A) | | 1,141,513 | | | 8,458,615 | |
Metropolitan Series Fund, Inc.—BlackRock Large Cap Value Portfolio, (Class A) | | 1,252,349 | | | 10,845,341 | |
Metropolitan Series Fund, Inc.—Davis Venture Value Portfolio, (Class A) | | 817,294 | | | 17,759,806 | |
Metropolitan Series Fund, Inc.—FI Mid Cap Opportunities Portfolio, (Class A) | | 603,810 | | | 5,687,891 | |
Metropolitan Series Fund, Inc.—Jennison Growth Portfolio, (Class A) | | 1,334,574 | | | 10,423,025 | |
Metropolitan Series Fund, Inc.—Julius Baer International Stock Portfolio, (Class A) | | 1,009,429 | | | 7,873,544 | |
Metropolitan Series Fund, Inc.—Met/Dimensional International Small Co. Portfolio, (Class A) | | 433,783 | | | 4,407,233 | |
Metropolitan Series Fund, Inc.—MetLife Stock Index Portfolio, (Class A) | | 478,550 | | | 10,532,893 | |
Metropolitan Series Fund, Inc.—MFS Value Portfolio, (Class A) | | 1,002,010 | | | 9,288,631 | |
Metropolitan Series Fund, Inc.—Neuberger Berman Mid Cap Value Portfolio, (Class A) | | 555,065 | | | 6,105,716 | |
Metropolitan Series Fund, Inc.—Russell 2000 Index Portfolio, (Class A) | | 346,967 | | | 3,084,539 | |
Metropolitan Series Fund, Inc.—T. Rowe Price Large Cap Growth Portfolio, (Class A) | | 1,148,111 | | | 10,390,408 | |
Metropolitan Series Fund, Inc.—Van Eck Global Natural Resources Portfolio, (Class A) | | 289,302 | | | 2,809,118 | |
| | | | | | |
Total Mutual Funds
(Identified Cost $245,538,747) | | | | | 151,509,980 | |
| | | | | | |
Total Investments—100.0%
(Identified Cost $245,538,747) (a) | | | | | 151,509,980 | |
Liabilities in excess of other assets | | | | | (19,277 | ) |
| | | | | | |
| Total Net Assets—100% | | | | $ | 151,490,703 | |
| | | | | | |
| (a) | The aggregate cost of investments for federal income tax purposes as of December 31, 2008 was $255,138,193 and the composition of unrealized appreciation and depreciation of investment securities was $78,089 and $(103,706,302), respectively. |
*See accompanying notes to financial statements.
MSF-6
Metropolitan Series Fund, Inc.
MetLife Aggressive Allocation Portfolio
The Portfolio adopted the provisions of Statement of Financial Accounting Standards No. 157, “Fair Value Measurements” (FAS 157), effective with the beginning of the Portfolio’s fiscal year. FAS 157 establishes a framework for measuring fair value and expands disclosures about fair value measurements in financial statements. The three levels of the hierarchy under FAS 157 are described below:
Level 1 - quoted prices in active markets for identical securities
Level 2 - other significant observable inputs (including quoted prices for similar securities, interest rates, credit risk, etc.)
Level 3 - significant unobservable inputs (including the Portfolio’s own assumptions in determining the fair value of investments)
The inputs or methodology used for valuing securities are not necessarily an indication of the risk associated with investing in those securities.
The following is a summary of the inputs used to value the Portfolio’s net assets as of December 31, 2008:
| | | | | | |
| Valuation Inputs | | Investments In
Securities | | Other Financial
Instruments* |
Level 1 - Quoted Prices | | $ | 151,509,980 | | $ | 0 |
Level 2 - Other Significant Observable Inputs | | | 0 | | | 0 |
Level 3 - Significant Unobservable Inputs | | | 0 | | | 0 |
Total | | $ | 151,509,980 | | $ | 0 |
* Other financial instruments are derivative instruments not reflected in the Schedule of Investments, such as futures, forwards, swap contracts and written options, which are valued based on the unrealized appreciation/depreciation on the instrument.
MSF-7
Metropolitan Series Fund, Inc.
MetLife Aggressive Allocation Portfolio
Statement of Assets & Liabilities
December 31, 2008
| | | | | | | |
Assets | | | | | | | |
Investments at value (a) | | | | | $ | 151,509,980 | |
Receivable for: | | | | | | | |
Securities sold | | | | | | 46,603 | |
Fund shares sold | | | | | | 229,651 | |
Due from investment adviser | | | | | | 26,824 | |
| | | | | | | |
Total Assets | | | | | | 151,813,058 | |
Liabilities | | | | | | | |
Payable for: | | | | | | | |
Fund shares redeemed | | $ | 276,254 | | | | |
Accrued expenses: | | | | | | | |
Service and distribution fees | | | 25,206 | | | | |
Other expenses | | | 20,895 | | | | |
| | | | | | | |
Total Liabilities | | | | | | 322,355 | |
| | | | | | | |
Net Assets | | | | | $ | 151,490,703 | |
| | | | | | | |
Net assets consists of: | | | | | | | |
Capital paid in | | | | | $ | 251,310,606 | |
Undistributed net investment income | | | | | | 3,657,228 | |
Accumulated net realized losses | | | | | | (9,448,364 | ) |
Unrealized depreciation on investments | | | | | | (94,028,767 | ) |
| | | | | | | |
Net Assets | | | | | $ | 151,490,703 | |
| | | | | | | |
| Computation of offering price: | | | | | | | |
Class A | | | | | | | |
Net asset value and redemption price per share ($27,524,835 divided by 3,763,620 shares outstanding) | | | | | $ | 7.31 | |
| | | | | | | |
Class B | | | | | | | |
Net asset value and redemption price per share ($123,965,868 divided by 17,017,780 shares outstanding) | | | | | $ | 7.28 | |
| | | | | | | |
(a) Identified cost of investments | | | | | $ | 245,538,747 | |
| | | | | | | |
Statement of Operations
For the Year Ended December 31, 2008
| | | | | | | | |
Investment Income | | | | | | | | |
Dividends from Underlying Portfolios | | | | | | $ | 2,572,217 | |
| | | | | | | | |
Expenses | | | | | | | | |
Management fees | | $ | 201,425 | | | | | |
Service and distribution fees—Class B | | | 419,067 | | | | | |
Directors’ fees and expenses | | | 627 | | | | | |
Custodian | | | 29,124 | | | | | |
Audit and tax services | | | 16,419 | | | | | |
Legal | | | 3,509 | | | | | |
Miscellaneous | | | 6,707 | | | | | |
| | | | | | | | |
Total expenses | | | 676,878 | | | | | |
Expense reimbursements | | | (56,386 | ) | | | 620,492 | |
| | | | | | | | |
Net Investment Income | | | | | | | 1,951,725 | |
| | | | | | | | |
Realized and Unrealized Loss | | | | | | | | |
| Realized gain (loss) on: | | | | | | | | |
Investments—net | | | (18,907,932 | ) | | | | |
Capital gains distributions from Underlying Portfolios | | | 11,532,874 | | | | (7,375,058 | ) |
| | | | | | | | |
| Change in unrealized depreciation on: | | | | | | | | |
Investments—net | | | | | | | (94,728,560 | ) |
| | | | | | | | |
Net loss | | | | | | | (102,103,618 | ) |
| | | | | | | | |
Net Decrease in Net Assets From Operations | | | | | | $ | (100,151,893 | ) |
| | | | | | | | |
See accompanying notes to financial statements.
MSF-8
Metropolitan Series Fund, Inc.
MetLife Aggressive Allocation Portfolio
Statements of Changes in Net Assets
| | | | | | | | |
| | | Year ended
December 31,
2008 | | | Year ended
December 31,
2007 | |
From Operations | | | | | | | | |
Net investment income | | $ | 1,951,725 | | | $ | 336,881 | |
Net realized gain (loss) | | | (7,375,058 | ) | | | 6,583,322 | |
Change in unrealized depreciation | | | (94,728,560 | ) | | | (5,112,445 | ) |
| | | | | | | | |
Increase (decrease) in net assets from operations | | | (100,151,893 | ) | | | 1,807,758 | |
| | | | | | | | |
From Distributions to Shareholders | | | | | | | | |
Net investment income | | | | | | | | |
Class A | | | (267,407 | ) | | | (77,815 | ) |
Class B | | | (846,075 | ) | | | (60,916 | ) |
| | | | | | | | |
| | | (1,113,482 | ) | | | (138,731 | ) |
| | | | | | | | |
Net realized gain | | | | | | | | |
Class A | | | (978,396 | ) | | | (49,715 | ) |
Class B | | | (4,964,703 | ) | | | (175,134 | ) |
| | | | | | | | |
| | | (5,943,099 | ) | | | (224,849 | ) |
| | | | | | | | |
Total distributions | | | (7,056,581 | ) | | | (363,580 | ) |
| | | | | | | | |
Increase in net assets from capital share transactions | | | 21,719,725 | | | | 148,801,089 | |
| | | | | | | | |
Net increase (decrease) in net assets | | | (85,488,749 | ) | | | 150,245,267 | |
| | |
Net Assets | | | | | | | | |
Beginning of the period | | | 236,979,452 | | | | 86,734,185 | |
| | | | | | | | |
End of the period | | $ | 151,490,703 | | | $ | 236,979,452 | |
| | | | | | | | |
Undistributed Net Investment Income | | | | | | | | |
End of the period | | $ | 3,657,228 | | | $ | 1,099,563 | |
| | | | | | | | |
Other Information:
Capital Shares
Transactions in capital shares were as follows:
| | | | | | | | | | | | | | |
| | | Year ended
December 31, 2008 | | | Year ended
December 31, 2007 | |
| | | Shares | | | $ | | | Shares | | | $ | |
Class A | | | | | | | | | | | | | | |
Sales | | 1,622,289 | | | $ | 16,098,849 | | | 2,177,073 | | | $ | 28,039,123 | |
Reinvestments | | 107,768 | | | | 1,245,803 | | | 9,818 | | | | 127,530 | |
Redemptions | | (944,447 | ) | | | (9,479,394 | ) | | (790,860 | ) | | | (10,188,504 | ) |
| | | | | | | | | | | | | | |
Net increase | | 785,610 | | | $ | 7,865,258 | | | 1,396,031 | | | $ | 17,978,149 | |
| | | | | | | | | | | | | | |
Class B | | | | | | | | | | | | | | |
Sales | | 4,569,946 | | | $ | 45,631,228 | | | 13,383,674 | | | $ | 170,207,545 | |
Reinvestments | | 503,534 | | | | 5,810,778 | | | 18,214 | | | | 236,050 | |
Redemptions | | (3,854,433 | ) | | | (37,587,539 | ) | | (3,098,906 | ) | | | (39,620,655 | ) |
| | | | | | | | | | | | | | |
Net increase | | 1,219,047 | | | $ | 13,854,467 | | | 10,302,982 | | | $ | 130,822,940 | |
| | | | | | | | | | | | | | |
Increase derived from capital share transactions | | | | | $ | 21,719,725 | | | | | | $ | 148,801,089 | |
| | | | | | | | | | | | | | |
See accompanying notes to financial statements.
MSF-9
Metropolitan Series Fund, Inc.
MetLife Aggressive Allocation Portfolio
Financial Highlights
| | | | | | | | | | | | | | | | |
| | | Class A | |
| | | Year ended December 31, | |
| | | 2008 | | | 2007 | | | 2006 | | | 2005(a) | |
Net Asset Value, Beginning of Period | | $ | 12.66 | | | $ | 12.29 | | | $ | 11.21 | | | $ | 10.00 | |
| | | | | | | | | | | | | | | | |
Income From Investment Operations | | | | | | | | | | | | | | | | |
Net investment income | | | 0.12 | (b) | | | 0.06 | (b) | | | 0.12 | | | | 0.04 | |
Net realized and unrealized gain (loss) of investments | | | (5.07 | ) | | | 0.37 | | | | 1.62 | | | | 1.24 | |
| | | | | | | | | | | | | | | | |
Total from investment operations | | | (4.95 | ) | | | 0.43 | | | | 1.74 | | | | 1.28 | |
| | | | | | | | | | | | | | | | |
Less Distributions | | | | | | | | | | | | | | | | |
Distributions from net investment income | | | (0.09 | ) | | | (0.04 | ) | | | (0.13 | ) | | | (0.04 | ) |
Distributions from net realized capital gains | | | (0.31 | ) | | | (0.02 | ) | | | (0.53 | ) | | | (0.03 | ) |
| | | | | | | | | | | | | | | | |
Total distributions | | | (0.40 | ) | | | (0.06 | ) | | | (0.66 | ) | | | (0.07 | ) |
| | | | | | | | | | | | | | | | |
Net Asset Value, End of Period | | $ | 7.31 | | | $ | 12.66 | | | $ | 12.29 | | | $ | 11.21 | |
| | | | | | | | | | | | | | | | |
Total Return (%) | | | (40.3 | ) | | | 3.5 | | | | 16.1 | | | | 12.7 | (c) |
Ratio of operating expenses to average net assets (%) (e) | | | 0.10 | | | | 0.10 | | | | 0.10 | | | | 0.10 | (d) |
Ratio of operating expenses to average net assets without giving effect to the contractual expense agreement would have been (%) (e)(f) | | | 0.13 | | | | 0.14 | | | | 0.17 | | | | 1.76 | (d) |
Ratio of net investment income to average net assets (%) (g) | | | 1.16 | | | | 0.47 | | | | 0.83 | | | | 1.53 | (d) |
Portfolio turnover rate (%) | | | 39 | | | | 25 | | | | 37 | | | | 57 | (d) |
Net assets, end of period (000) | | $ | 27,525 | | | $ | 37,715 | | | $ | 19,444 | | | $ | 2,867 | |
| | | | | | | | | | | | | | | | |
| | | Class B | |
| | | Year ended December 31, | |
| | | 2008 | | | 2007 | | | 2006 | | | 2005(a) | |
Net Asset Value, Beginning of Period | | $ | 12.61 | | | $ | 12.24 | | | $ | 11.19 | | | $ | 10.00 | |
| | | | | | | | | | | | | | | | |
Income From Investment Operations | | | | | | | | | | | | | | | | |
Net investment income | | | 0.09 | (b) | | | 0.02 | (b) | | | 0.10 | | | | 0.03 | |
Net realized and unrealized gain (loss) of investments | | | (5.06 | ) | | | 0.38 | | | | 1.60 | | | | 1.23 | |
| | | | | | | | | | | | | | | | |
Total from investment operations | | | (4.97 | ) | | | 0.40 | | | | 1.70 | | | | 1.26 | |
| | | | | | | | | | | | | | | | |
Less Distributions | | | | | | | | | | | | | | | | |
Distributions from net investment income | | | (0.05 | ) | | | (0.01 | ) | | | (0.12 | ) | | | (0.04 | ) |
Distributions from net realized capital gains | | | (0.31 | ) | | | (0.02 | ) | | | (0.53 | ) | | | (0.03 | ) |
| | | | | | | | | | | | | | | | |
Total distributions | | | (0.36 | ) | | | (0.03 | ) | | | (0.65 | ) | | | (0.07 | ) |
| | | | | | | | | | | | | | | | |
Net Asset Value, End of Period | | $ | 7.28 | | | $ | 12.61 | | | $ | 12.24 | | | $ | 11.19 | |
| | | | | | | | | | | | | | | | |
Total Return (%) | | | (40.4 | ) | | | 3.3 | | | | 15.7 | | | | 12.6 | (c) |
Ratio of operating expenses to average net assets (%) (e) | | | 0.35 | | | | 0.35 | | | | 0.35 | | | | 0.35 | (d) |
Ratio of operating expenses to average net assets without giving effect to the contractual expense agreement would have been (%) (e)(f) | | | 0.38 | | | | 0.39 | | | | 0.42 | | | | 2.01 | (d) |
Ratio of net investment income to average net assets (%) (g) | | | 0.93 | | | | 0.16 | | | | 0.31 | | | | 1.29 | (d) |
Portfolio turnover rate (%) | | | 39 | | | | 25 | | | | 37 | | | | 57 | (d) |
Net assets, end of period (000) | | $ | 123,966 | | | $ | 199,265 | | | $ | 67,290 | | | $ | 7,384 | |
| (a) | Commencement of operations was May 2, 2005. |
| (b) | Per share amount is based on average shares outstanding during the period. |
| (c) | Periods less than one year are not computed on an annualized basis. |
| (d) | Computed on an annualized basis. |
| (e) | The ratio of operating expenses to average net assets does not include expenses of investment companies in which the Portfolio invests. |
| (f) | See Note 4 of the Notes to Financial Statements. |
| (g) | Recognition of net investment income by the Portfolio is affected by the timing of the declaration of dividends by the Underlying Portfolios in which it invests. |
See accompanying notes to financial statements.
MSF-10
Metropolitan Series Fund, Inc.
MetLife Aggressive Allocation Portfolio
Notes to Financial Statements—December 31, 2008
Metropolitan Series Fund, Inc. (the “Fund”) is organized as a corporation under the laws of Maryland pursuant to Articles of Incorporation filed on November 23, 1982, as amended, and registered under the Investment Company Act of 1940, as amended (the “1940 Act”), as an open-end investment company. The Fund is a “series” type of mutual fund, which issues separate series of stock. Each series represents an interest in a separate portfolio of Fund investments. The MetLife Aggressive Allocation Portfolio (the “Asset Allocation Portfolio”) is a non-diversified series of the fund. The Asset Allocation Portfolio operates under a “fund of funds” structure, investing substantially all of its assets in other Portfolios advised by MetLife Advisers, LLC (“MetLife Advisers”) or its affiliates (each, an “Underlying Portfolio,” and, collectively, the “Underlying Portfolios”). Shares in the Fund are not offered directly to the general public and are currently available only to separate accounts established by Metropolitan Life Insurance Company (“MetLife”), New England Life Insurance Company, General American Life Insurance Company (“General American”), The MetLife Investors Group of Insurance Companies, MetLife Insurance Company of Connecticut and other affiliated insurance companies (collectively, the “Insurance Companies”) and to certain eligible qualified retirement plans (“Qualified Plans”), as an investment vehicle for variable life insurance, group annuity or variable annuity products of these insurance companies or Qualified Plans, although not all Portfolios are available to all such separate accounts and Qualified Plans. The Asset Allocation Portfolio’s shares may be divided into different classes. Currently, the classes being offered by the Asset Allocation Portfolio are named Class A and Class B. The classes of the Asset Allocation Portfolio’s shares are identical, except that certain additional charges (Rule 12b-1 fees) are made against Class B shares. Investment income, realized and unrealized capital gains and losses, the common expenses of the Asset Allocation Portfolio and certain Portfolio-level expense reductions, if any, are allocated daily, on a pro rata basis, to each class based on the relative net assets of each class to the total net assets of the Asset Allocation Portfolio.
| 2. | SIGNIFICANT ACCOUNTING POLICIES: |
The preparation of financial statements in conformity with accounting principles generally accepted in the United States of America (“GAAP”) requires management to make estimates and assumptions that affect the reported amounts of assets and liabilities and disclosure of contingent assets and liabilities as of the date of the financial statements and the reported amounts of income and expenses during the reporting period. Actual results could differ from those estimates.
The following is a summary of significant accounting policies consistently followed by the Asset Allocation Portfolio in the preparation of its financial statements. The policies are in conformity with GAAP.
Investment Valuation:
The net asset value of the Asset Allocation Portfolio is calculated based on the net asset values of the Underlying Portfolios in which the Asset Allocation Portfolio invests. The Underlying Portfolios that are series of the Fund will use fair value pricing in the circumstances and manner described below. For more information about the use of fair value pricing by the Underlying Portfolios that are series of Met Investors Series Trust (“MIST”), please refer to the prospectus for such Underlying Portfolios.
The Underlying Portfolios that are series of the Fund are valued as follows:
Debt securities (other than short term obligations with a remaining maturity of sixty days or less) are generally valued on the basis of evaluated or composite bid quotations obtained by independent pricing services and/or brokers and dealers selected by the relevant subadviser pursuant to authorization of the Board of Directors of the Fund (the “Board” or “Directors”). Such quotations take into account appropriate factors such as institutional-sized trading in similar groups of securities, yield, quality, coupon rate, maturity, type of issue, trading characteristics and other data. Short term obligations with a remaining maturity of sixty days or less are valued at amortized cost which approximates fair market value.
Equity securities traded on a national securities exchange or other exchanges are valued at their last sale price on the principal trading market. Equity securities traded on the NASDAQ National Market System are valued at the NASDAQ Official Closing Price (the “NOCP”). The NOCP is the last reported sale price if the last reported sale price falls between the spread of the last reported bid and asked prices. If the last reported bid and asked prices are above the last reported sale price, the NOCP will be the last reported bid price. If the last reported bid and asked prices are below the last reported sale price, the NOCP will be the last reported asked price. Equity securities traded on a national securities exchange or other exchanges or on the NASDAQ National Market System for which there is no reported sale during the day are valued at the last reported bid price. A security that is listed or traded on more than one exchange is valued at the quotation on the exchange determined to be the primary market for that security by the Board or its delegates. If no closing price is available, then such securities are valued by using the last reported bid price. Equity securities traded over-the-counter are valued at the last reported sales price.
MSF-11
Metropolitan Series Fund, Inc.
MetLife Aggressive Allocation Portfolio
Notes to Financial Statements—December 31, 2008—(Continued)
If no current market value quotation is readily available or reliable for a portfolio security, fair value will be determined in accordance with procedures established by and under the general supervision of the Board. When an Underlying Portfolio uses fair value pricing, it may take into account any factors it deems appropriate. The value of securities used by the Underlying Portfolio to calculate its net asset value may differ from quoted or published prices for the same securities. Fair value pricing involves subjective judgments and the fair value determined for a security may be materially different than the value that could be realized upon the sale of that security.
The Underlying Portfolios expect to use fair value pricing for securities primarily traded on U.S. exchanges only under very limited circumstances. For example, the Underlying Portfolio may use fair value pricing if the exchange on which a security is traded closes early or trading in the security is suspended.
Securities traded primarily on an exchange outside of the United States which closes before the close of the New York Stock Exchange will be valued at the last sales price on that non-U.S. exchange. Securities traded primarily on an exchange outside of the United States for which there is no reported sale during the day are valued at the mean between the last reported bid and asked prices. However, because most foreign markets close well before the Underlying Portfolio values its securities (typically at 4 p.m. Eastern Time), the earlier close of these foreign markets gives rise to the possibility that significant events, including broad market moves, may have occurred after these foreign markets close but before the Underlying Portfolio values its securities. For example, foreign security values may be affected by activity that occurs after the close of foreign securities markets. To account for this, the Underlying Portfolio may frequently value many of its foreign equity securities using fair value prices based on third party vendor modeling tools.
Forward foreign currency exchange contracts are valued based on the mean between closing bid and asked prices of the forward currency contract rates in the London foreign exchange markets on a daily basis as provided by a reliable bank or dealer.
Options, whether on securities, indices, futures contracts, or otherwise, are valued at the last sales price available as of the close of business on the day of valuation or, if there is no such sale price available, at the mean between the bid and asked prices. Options on currencies are valued at the spot price each day.
The value of futures contracts will be the sum of the margin deposit plus or minus the difference between the value of the futures contract on each day the net asset value is calculated and the value on the date the futures contract originated, value being that established on a recognized commodity exchange, or by reference to other customary sources, with gain or loss being realized when the futures contract closes or expires.
Subject to the Board’s oversight, the Board has delegated the day-to-day oversight of pricing matters, including determinations in good faith under the Fund’s procedures the fair value of securities for which current market quotations are not readily available to MetLife Advisers, LLC (“MetLife Advisers” or the “Adviser”) or the subadviser of the Underlying Portfolio, as applicable.
Investment Transactions and Related Investment Income:
Portfolio security transactions are recorded on the trade date. Dividend income is recorded on the ex-dividend date. Interest income is recorded on the accrual basis. Realized gains and losses on investments and unrealized appreciation and depreciation are determined on the identified cost basis, which is the same basis used for federal income tax purposes.
Federal Income Taxes:
It is the Portfolio’s policy to comply with the requirements of the Internal Revenue Code of 1986, as amended (the “Code”), and regulations thereunder, applicable to regulated investment companies and to distribute, with respect to each taxable year, all of its taxable income to shareholders. Therefore, no federal income tax provision is required. The Portfolio is subject to the provisions of the Financial Accounting Standards Board Interpretation (“FASB”) No. 48, Accounting for Uncertainties in Income Taxes (FIN 48). FIN 48 sets forth a minimum threshold for financial statement recognition of the benefit of a tax position taken or expected to be taken in a tax return. The implementation of FIN 48 did not result in any unrecognized tax benefits in the accompanying financial statements. Each of the Portfolio’s federal tax returns for the prior three fiscal years remains subject to examination by the Internal Revenue Service.
As of December 31, 2008, the Asset Allocation Portfolio had no capital loss carryforwards.
MSF-12
Metropolitan Series Fund, Inc.
MetLife Aggressive Allocation Portfolio
Notes to Financial Statements—December 31, 2008—(Continued)
Pursuant to Section 852 of the Code, the Portfolio designated the amount shown below under Long Term Gain as capital gain dividends for its taxable year ended December 31, 2008. The tax character of distributions paid for the periods ended December 31, 2008 and 2007 was as follows:
| | | | | | | | | | | | | | | | | | | | | |
| Ordinary Income | | Long Term Gain | | Return of Capital | | Total |
| 2008 | | 2007 | | 2008 | | 2007 | | 2008 | | 2007 | | 2008 | | 2007 |
| $2,183,622 | | $ | 363,580 | | $ | 4,872,959 | | $ | — | | $ | — | | $ | — | | $ | 7,056,581 | | $ | 363,580 |
As of December 31, 2008, the components of distributable earnings (accumulated losses) on a federal income tax basis were as follows:
| | | | | | | | | | | | | | |
Undistributed
Ordinary
Income | | Undistributed
Long Term
Gain | | Unrealized
Depreciation | | | Loss
Carryforwards | | Total | |
$3,657,228 | | $ | 281,073 | | $ | (103,628,213 | ) | | $ | — | | $ | (99,689,912 | ) |
Pursuant to Federal income tax regulations applicable to investment companies, the Portfolio has elected to treat net capital losses realized between November 1 and December 31 of each year as occurring on the first day of the following tax year. For the year ended December 31, 2008, the following amounts of realized capital and currency losses reflected in the accompanying financial statements will not be recognized for Federal income tax purposes until January 1, 2009:
| | | | |
Currency | | Capital | |
$— | | $ | (129,989 | ) |
Dividends and Distributions to Shareholders:
The Asset Allocation Portfolio records dividends and distributions on the ex-dividend date. Net realized gains from security transactions (if any) are generally distributed annually to shareholders. The timing and characterization of certain income and capital gains distributions are determined in accordance with federal tax regulations that may differ from GAAP. Permanent book and tax basis differences relating to shareholder distributions will result in reclassification between under/over distributed net investment income, accumulated net realized gains/losses and paid in capital.
| 3. | INVESTMENT TRANSACTIONS: |
For the year ended December 31, 2008, purchases and sales of Underlying Portfolios by the Asset Allocation Portfolio were $106,795,377 and $78,677,570, respectively.
| 4. | INVESTMENT MANAGEMENT FEES AND OTHER TRANSACTIONS WITH AFFILIATES: |
Investment Management Agreement:
MetLife Advisers is the investment adviser to the Asset Allocation Portfolio. The Fund has entered into an investment management agreement with MetLife Advisers with respect to the Portfolio. For providing investment management services to the Portfolio, MetLife Advisers receives monthly compensation at the following annual rates:
| | | | |
Management
Fees earned by
MetLife Advisers
for the year ended
December 31, 2008 | | Annual
percentage
rates paid to
MetLife Advisers | | Based on Portfolios
average daily net asset
levels |
| $201,425 | | 0.100% | | Of the first $500 million |
| | 0.075% | | Of the next $500 million |
| | 0.050% | | On amounts in excess of $1 billion |
In addition to the above Management Fee paid to MetLife Advisers, the Portfolio indirectly pays MetLife Advisers an investment advisory fee through its investments in certain Underlying Portfolios.
Certain officers and directors of the Fund may also be officers of MetLife Advisers; however, such officers and directors receive no compensation from the Fund.
MSF-13
Metropolitan Series Fund, Inc.
MetLife Aggressive Allocation Portfolio
Notes to Financial Statements—December 31, 2008—(Continued)
Service and Distribution Fees:
The Fund has adopted a Distribution and Service Plan under Rule 12b-1 of the 1940 Act for the Asset Allocation Portfolio’s Class B shares. Under the Distribution and Service Plan, the Class B shares of the Asset Allocation Portfolio pay a fee to compensate the Insurance Companies (or their affiliates) and other broker-dealers and financial intermediaries involved in the offer and sale of Asset Allocation Portfolio shares for promoting or selling and servicing the Class B shares of the Asset Allocation Portfolio. The fees under the Distribution and Service Plan for each class of the Asset Allocation Portfolio’s shares are calculated as a percentage of the Asset Allocation Portfolio’s average daily net assets that are attributable to that Class. Currently, the fee is 0.25% per year for Class B shares. Amounts paid by the Asset Allocation Portfolio for the year ended December 31, 2008 are shown as Service and Distribution fees in the Statement of Operations.
Expense Agreement:
Pursuant to an expense agreement relating to each class of the Asset Allocation Portfolio, MetLife Advisers has agreed, from May 1, 2008 to April 30, 2009, to waive a portion of its advisory fees or pay a portion of the other operating expenses (not including brokerage costs, interest, taxes, or extraordinary expenses) to the extent total operating expenses exceed stated annual expense limits (based on the Asset Allocation Portfolio’s then current fiscal year). For the Asset Allocation Portfolio, this subsidy, and similar subsidies in effect in earlier periods, are subject to the obligation of each class of the Asset Allocation Portfolio to repay MetLife Advisers in future years, if any, when a class’s expenses fall below the stated expense limit pertaining to that class that was in effect at the time of the subsidy in question. Such deferred expenses may be charged to a class in a subsequent year to the extent that the charge does not cause the total expenses in such subsequent year to exceed the class’ stated expense limit that was in effect at the time of the subsidy in question; provided, however, that no class of the Asset Allocation Portfolio is obligated to repay any expense paid by MetLife Advisers more than five years after the end of the fiscal year in which such expense was incurred.
The expense limits (annual rates as a percentage of each class of the Asset Allocation Portfolio’s net average daily net assets) in effect from May 1, 2008 to April 30, 2009 are 0.10% and 0.35% for Class A and B, respectively.
As of December 31, 2008, the amount of expenses deferred in 2005 subject to repayment until December 31, 2010 was $38,508 for the Asset Allocation Portfolio. The amount of expenses deferred in 2006 subject to repayment until December 31, 2011 was $33,960. The amount of expenses deferred in 2007 subject to repayment until December 31, 2012 was $59,166. The amount of expenses deferred in 2008 subject to repayment until December 31, 2013 was $56,386.
| 5. | TRANSACTIONS IN SECURITIES OF AFFILIATED ISSUERS: |
The Asset Allocation Portfolio does not invest in the Underlying Portfolios for the purpose of exercising management or control; however, investments by the Asset Allocation Portfolio within its principal investment strategies may represent a significant portion of the Underlying Portfolio’s net assets. Transactions in Underlying Portfolios during the year ended December 31, 2008 are as follows:
| | | | | | | | |
Underlying Portfolio (Class A) | | Beginning Shares
as of 12/31/2007 | | Shares Purchased
during Period | | Shares Sold
during Period | | Ending Shares
as of 12/31/2008 |
MIST—BlackRock Large Cap Core | | 654,715 | | 667,421 | | 163,350 | | 1,158,786 |
MIST—Clarion Global Real Estate | | 322,079 | | 139,869 | | 56,107 | | 405,841 |
MIST—Dreman Small Cap Value | | 849,706 | | 144,391 | | 350,606 | | 643,491 |
MIST—Harris Oakmark International | | 1,223,694 | | 472,819 | | 787,168 | | 909,345 |
MIST—Lazard Mid-Cap | | 1,127,095 | | 254,276 | | 515,076 | | 866,295 |
MIST—Legg Mason Value Equity | | 1,552,046 | | 465,037 | | 496,853 | | 1,520,230 |
MIST—Met/AIM Small Cap Growth | | 631,867 | | 190,747 | | 101,284 | | 721,330 |
MIST—MFS Research International | | 0 | | 1,452,095 | | 310,582 | | 1,141,513 |
MSF—BlackRock Large Cap Value | | 1,597,668 | | 253,388 | | 598,707 | | 1,252,349 |
MSF—Davis Venture Value | | 784,911 | | 162,085 | | 129,702 | | 817,294 |
MSF—FI Mid Cap Opportunities | | 439,400 | | 240,349 | | 75,939 | | 603,810 |
MSF—Jennison Growth | | 892,547 | | 657,215 | | 215,188 | | 1,334,574 |
MSF—Julius Baer International Stock | | 1,315,667 | | 495,413 | | 801,651 | | 1,009,429 |
MSF—Met/Dimensional International Small Company | | 0 | | 448,327 | | 14,544 | | 433,783 |
MSF—MetLife Stock Index | | 258,550 | | 285,673 | | 65,673 | | 478,550 |
MSF—MFS Value | | 0 | | 1,148,942 | | 146,932 | | 1,002,010 |
MSF—Neuberger Berman Mid Cap Value | | 1,033,563 | | 209,872 | | 688,370 | | 555,065 |
MSF—Russell 2000 Index | | 495,720 | | 95,320 | | 244,073 | | 346,967 |
MSF—T. Rowe Price Large Cap Growth | | 1,314,893 | | 313,671 | | 480,453 | | 1,148,111 |
MSF—Van Eck Global Natural Resources | | 0 | | 299,243 | | 9,941 | | 289,302 |
MSF-14
Metropolitan Series Fund, Inc.
MetLife Aggressive Allocation Portfolio
Notes to Financial Statements—December 31, 2008—(Continued)
| | | | | | | | | | | | | |
Underlying Portfolio (Class A) | | Realized Gain/(Loss)
during Period | | | Capital Gains
Distributions
during Period | | Dividend Income
during Period | | Ending Value
as of 12/31/2008 |
MIST—BlackRock Large Cap Core | | $ | (536,678 | ) | | $ | 277,781 | | $ | 42,524 | | $ | 7,729,102 |
MIST—Clarion Global Real Estate | | | (247,580 | ) | | | 391,439 | | | 80,798 | | | 3,003,221 |
MIST—Dreman Small Cap Value | | | (200,886 | ) | | | 316,632 | | | 84,291 | | | 6,306,209 |
MIST—Harris Oakmark International | | | (4,642,578 | ) | | | 2,964,625 | | | 346,271 | | | 7,793,087 |
MIST—Lazard Mid-Cap | | | (1,430,809 | ) | | | 912,864 | | | 149,840 | | | 6,003,424 |
MIST—Legg Mason Value Equity | | | (1,124,569 | ) | | | 546,726 | | | 40,110 | | | 6,977,855 |
MIST—Met/AIM Small Cap Growth | | | (340,758 | ) | | | 735,815 | | | 0 | | | 6,030,322 |
MIST—MFS Research International | | | (1,557,759 | ) | | | 0 | | | 0 | | | 8,458,615 |
MSF—BlackRock Large Cap Value | | | (1,399,928 | ) | | | 306,183 | | | 157,876 | | | 10,845,341 |
MSF—Davis Venture Value | | | (491,552 | ) | | | 135,007 | | | 324,326 | | | 17,759,806 |
MSF—FI Mid Cap Opportunities | | | (222,485 | ) | | | 0 | | | 32,883 | | | 5,687,891 |
MSF—Jennison Growth | | | (504,985 | ) | | | 883,566 | | | 256,225 | | | 10,423,025 |
MSF—Julius Baer International Stock | | | (3,553,615 | ) | | | 2,162,103 | | | 561,167 | | | 7,873,544 |
MSF—Met/Dimensional International Small Company | | | (5,275 | ) | | | 0 | | | 0 | | | 4,407,233 |
MSF—MetLife Stock Index | | | (666,093 | ) | | | 337,680 | | | 157,446 | | | 10,532,893 |
MSF—MFS Value | | | (522,835 | ) | | | 0 | | | 0 | | | 9,288,631 |
MSF—Neuberger Berman Mid Cap Value | | | (695,075 | ) | | | 217,355 | | | 151,336 | | | 6,105,716 |
MSF—Russell 2000 Index | | | (668,451 | ) | | | 309,066 | | | 78,781 | | | 3,084,539 |
MSF—T. Rowe Price Large Cap Growth | | | (90,043 | ) | | | 1,036,032 | | | 108,343 | | | 10,390,408 |
MSF—Van Eck Global Natural Resources | | | (5,963 | ) | | | 0 | | | 0 | | | 2,809,118 |
MSF-15
Metropolitan Series Fund, Inc.
MetLife Aggressive Allocation Portfolio
Report of Independent Registered Public Accounting Firm
To the Shareholders and Board of Directors of Metropolitan Series Fund, Inc.:
We have audited the accompanying statement of assets and liabilities, including the schedule of investments, of the MetLife Aggressive Allocation Portfolio (one of the portfolios constituting the Metropolitan Series Fund, Inc.) (the “Fund”) as of December 31, 2008, and the related statement of operations for the year then ended, the statements of changes in net assets for each of the two years in the period then ended, and the financial highlights for each of the three years in the period then ended and for the period from May 2, 2005 (commencement of operations) through December 31, 2005. These financial statements and financial highlights are the responsibility of the Fund’s management. Our responsibility is to express an opinion on these financial statements and financial highlights based on our audits.
We conducted our audits in accordance with the standards of the Public Company Accounting Oversight Board (United States). Those standards require that we plan and perform the audit to obtain reasonable assurance about whether the financial statements and financial highlights are free of material misstatement. The Fund is not required to have, nor were we engaged to perform, an audit of its internal control over financial reporting. Our audits included consideration of internal control over financial reporting as a basis for designing audit procedures that are appropriate in the circumstances, but not for the purpose of expressing an opinion on the effectiveness of the Fund’s internal control over financial reporting. Accordingly, we express no such opinion. An audit also includes examining, on a test basis, evidence supporting the amounts and disclosures in the financial statements, assessing the accounting principles used and significant estimates made by management, as well as evaluating the overall financial statement presentation. Our procedures included confirmation of securities owned as of December 31, 2008, by correspondence with the transfer agent. We believe that our audits provide a reasonable basis for our opinion.
In our opinion, the financial statements and financial highlights referred to above present fairly, in all material respects, the financial position of the MetLife Aggressive Allocation Portfolio of the Metropolitan Series Fund, Inc. as of December 31, 2008, the results of its operations for the year then ended, the changes in its net assets for each of the two years in the period then ended, and the financial highlights for each of the three years in the period then ended, and for the period from May 2, 2005 (commencement of operations) through December 31, 2005, in conformity with accounting principles generally accepted in the United States of America.
Deloitte & Touche LLP
Boston, Massachusetts
February 26, 2009
MSF-16
Metropolitan Series Fund, Inc.
Directors and Officers
The Fund’s Directors review actions of the Fund’s investment adviser and subadvisers, and decide upon matters of general policy. The Fund’s officers supervise the daily business operations of the Fund. The Board of Directors and the Fund’s officers are listed below. Each Director is responsible for overseeing all 38 Portfolios of the Fund. There is no limit to the term a Director may serve. Directors serve until their resignation, retirement or removal in accordance with the Fund’s organizational documents and policies adopted by the Board from time to time. Officers hold office at the pleasure of the Board or until the election or appointment and the qualification of a successor. The address of the Directors and officers is c/o Metropolitan Series Fund, Inc., 501 Boylston Street, Boston, MA 02116.
Interested Directors(1)
Each Director below is an “interested person” (as defined by the 1940 Act) with respect to the Fund in that Ms. Forget is an employee of MetLife and Mr. Typermass is a former employee of MetLife and owns securities issued by MetLife, Inc., the ultimate parent company of MetLife Advisers.
| | | | | | | | |
Name, Address and Age | | Current
position(s)
with Fund | | Position(s)
held since | | Principal occupations
over past five years, including other directorships(2) | | Number of
Portfolios in
Fund Complex
Overseen by
Director(3) |
Elizabeth M. Forget Age: 42 | | Director, Chairman of the Board, President and Chief Executive Officer | | 2006 | | Senior Vice President (since 2007), MetLife, Inc.; President, Met Investors Advisory, LLC; Trustee and President, Met Investors Series Trust; Executive Vice President, MetLife Investors Group, Inc.; President, Chief Executive Officer and Chair of the Board of Managers (since 2006), MetLife Advisers; President, Met Investors Advisory, LLC. | | 87 |
| | | | |
Arthur G. Typermass Age: 71 | | Director | | 1998 | | Formerly, Senior Vice President and Treasurer, MetLife. | | 38 |
Non-Interested Directors(1)
Each Director below is not an “interested person” (as defined by the 1940 Act) with respect to the Fund (collectively, the “Independent Directors”).
| | | | | | | | |
Name, Address and Age | | Current
position(s)
with Fund | | Position(s)
held since | | Principal occupations
over past five years, including other directorships(2) | | Number of
Portfolios in
Fund Complex
Overseen by
Director(3) |
Steve A. Garban† Age: 71 | | Director | | 1985 | | Formerly, Chief Financial Officer, Senior Vice President Finance and Operations and Treasurer (Emeritus), The Pennsylvania State University. | | 38 |
| | | | |
Linda B. Strumpf Age: 61 | | Director | | 2000 | | Vice President and Chief Investment Officer, Ford Foundation. | | 38 |
| | | | |
Michael S. Scott Morton† Age: 71 | | Director | | 1993 | | Jay W. Forrester Professor of Management (Emeritus) at Sloan School of Management, MIT. | | 38 |
| | | | |
H. Jesse Arnelle Age: 75 | | Director | | 2001 | | Formerly, Counsel, Womble Carlyle Sandrie & Rice; Director, Textron Inc. (global multi- industry company)*; formerly, Director, Gannet Co. Inc. (diversified news and information company)*; formerly, Director, Eastman Chemical Company (global chemical company)*; formerly, Director, Waste Management, Inc.*; formerly, Director, Armstrong Holdings Inc. (parent company of floor and ceiling products business)*; formerly, Director, FPL Group Inc. (public utility holding company)*; Director, URS Corporation (engineering design services firm)*. | | 38 |
MSF-17
Metropolitan Series Fund, Inc.
Directors and Officers—(Continued)
| | | | | | | | |
Name, Address and Age | | Current
position(s)
with Fund | | Position(s)
held since | | Principal occupations
over past five years, including other directorships(2) | | Number of
Portfolios in
Fund Complex
Overseen by
Director(3) |
Nancy Hawthorne Age: 57 | | Director | | 2003 | | Chief Executive Officer, Clerestory LLC (corporate financial advisor); Director, Avid Technologies (computer software company)*; formerly, Chairman of the Board of Avid Technologies; formerly, Board of Advisors, L. Knife & Sons, Inc. (beverage distributor); formerly, Trustee, New England Zenith Fund (“Zenith Fund”)**; formerly, Chief Executive Officer and Managing Partner, Hawthorne, Krauss and Associates (corporate financial advisor); formerly, Chief Financial Officer and Executive Vice President, Continental Cablevision, subsequently renamed MediaOne (cable television company); formerly, Director, Life F/X, Inc.; formerly, Chairman of the Board, WorldClinic (distance medicine company); formerly, Director, Perini Corporation (construction company)*; formerly, Director, CGU (property and casualty insurance company); formerly, Director, Beacon Power Corporation (energy company)*. | | 38 |
| | | | |
John T. Ludes Age: 72 | | Director | | 2003 | | President, LFP Properties (consulting firm); Formerly, Trustee, Zenith Fund**; formerly, Vice Chairman, President and Chief Operating Officer, Fortune Brands/American Brands (global conglomerate); formerly, President and CEO, Acushnet Company (athletic equipment company). | | 38 |
Officers(1)
| | | | | | | | |
Name and address | | Age | | Current
position(s)
with Fund | | Position(s)
held since | | Principal occupations over past five years(2) |
| Jeffrey L. Bernier | | 37 | | Senior Vice President | | 2008 | | Vice President (since 2008), MetLife, Inc.; Vice President (since 2008), MetLife; Senior Vice President (since 2008), MetLife Advisers; formerly, Director and Senior Investment Analyst (2004 to 2007), John Hancock Financial Services; formerly, Assistant Vice President (2000 to 2001), Wachovia Securities. |
| | | | |
| Alan C. Leland | | 56 | | Senior Vice President | | 2005 | | Treasurer and Chief Financial Officer, MetLife Advisers, LLC; Treasurer (since 2005), Met Investors Advisory, LLC; Vice President (since 2004), Met Investors Advisory, LLC; Vice President (since 2003), MetLife, Inc.; Vice President, MetLife; Senior Vice President, NELICO. |
| | | | |
| Peter Duffy | | 53 | | Vice President
and Treasurer | | 2000 | | Senior Vice President, MetLife Advisers; Second Vice President (since 2003), NELICO; Vice President, MetLife (since 2004); Vice President (since 2004), MetLife, Inc.; formerly, Vice President and Treasurer, Zenith Fund**. |
| | | | |
| Jeffrey P. Halperin | | 41 | | Chief
Compliance Officer | | 2007 | | Vice President (since 2006), MetLife, Inc.; Vice President (since 2006), MetLife; Chief Compliance Officer (since 2006), Met Investors Series Trust, MetLife Advisers, Met Investors Advisory, LLC and MetLife Investment Advisors Company, LLC. |
| * | Indicates a directorship with a registered investment company or a company subject to the reporting requirements of the Securities Exchange Act of 1934, as amended. |
| ** | The Zenith Fund deregistered with the Securities and Exchange Commission (“SEC”) in 2004. |
| (†) | Served as a trustee, director and/or officer of one or more of the following companies, each of which had a direct or indirect advisory relationship with MetLife Advisers or its affiliates prior to January 31, 2005: State Street Research Financial Trust, State Street Research Income Trust, State Street Research Money Market Trust, State Street Research Institutional Funds, State Street Research Capital Trust, State Street Research Master Investment Trust, State Street Research Equity Trust, State Street Research Securities Trust and State Street Research Exchange Trust (collectively, the “State Street Research Funds”). |
| (1) | During the period shown, each Director of the Fund served as a Trustee of Metropolitan Series Fund II, a registered investment company that ceased investment operations in June of 2008 and has applied for deregistration under the Investment Company Act of 1940. During this period, each officer of the Fund served in the same position with Metropolitan Series Fund II. |
| (2) | Previous positions during the past five years with the Fund; Met Investors Series Trust; MetLife; MetLife, Inc.; MetLife Advisers; Met Investors Advisory, LLC; Zenith Fund; NELICO; or New England Securities Corporation are omitted if not materially different. |
| (3) | The Fund Complex includes the Fund (38 portfolios) and Met Investors Series Trust (49 portfolios). |
MSF-18
Metropolitan Series Fund, Inc.
MetLife Aggressive Allocation Portfolio
Board Approval of Advisory and Subadvisory Agreements
The Fund’s Contract Review Committees of the Board of Directors (the “Board” or the “Directors”) typically meet in early fall to review the Portfolios’ advisory agreements (the “Advisory Agreements”) and subadvisory agreements (the “Subadvisory Agreements,” and, together with the Advisory Agreements, the “Agreements”) and determine whether to recommend that the full Board approve the continuation of the Agreements for an additional one-year period. (Following the initial approval of an Agreement for a new Portfolio or with a new adviser or subadviser, such annual reviews are not required until 2 years following the execution of such Agreement.) After each Committee has made its recommendations, the full Board, including the Independent Directors, determines whether to approve the continuation of each of the Agreements. In addition, the Board, including the Independent Directors, considers matters bearing on the Agreements at most of its other meetings throughout the year and regularly interviews various individuals at MetLife Advisers responsible for the management of the Portfolios. The Directors also interview selected investment managers and other professionals at the subadvisers at various times throughout the year.
The Directors receive all materials that they or MetLife Advisers, the Fund’s investment adviser, and the subadvisers believe to be reasonably necessary for the Directors to evaluate the Agreements and determine whether to approve the continuation of the Agreements. These materials generally include, among other items, (i) information on the investment performance of the Portfolios and the performance of peer groups of funds and the Portfolios’ performance benchmarks, (ii) information on the Portfolios’ advisory and subadvisory fees and other expenses, including information comparing the Portfolios’ expenses to those of peer groups of funds and information about any applicable expense caps and fee “breakpoints,” (iii) sales and redemption data, (iv) information related to the profitability of the Agreements to MetLife Advisers and certain of the subadvisers, and potential “fall-out” or ancillary benefits that MetLife Advisers, the subadvisers or their affiliates may receive as a result of their relationships with the Fund and (v) information obtained through the subadvisers’ responses to certain requests from MetLife Advisers and the Directors and MetLife Advisers’ responses to requests from the Directors. The Directors may also consider other information such as (vi) MetLife Advisers’ and the subadvisers’ financial results and condition, (vii) each Portfolio’s investment objectives and strategies and the size, education and experience of the investment staffs of MetLife Advisers and the relevant subadvisers and their use of technology and external research, (viii) the allocation of the Portfolios’ brokerage, if any, including allocations to brokers affiliated with the subadvisers and the use of “soft” commission dollars to pay Portfolio expenses and to pay for research and other similar services, (ix) the resources devoted to, and the record of compliance with, the Portfolios’ investment policies and restrictions, policies on personal securities transactions and other compliance policies, (x) the responses of MetLife Advisers, the subadvisers and/or their affiliates to certain legal and regulatory proceedings and (xi) the economic outlook generally and for the mutual fund industry in particular. Throughout the process, the Directors have the opportunity to ask questions of and request additional materials from MetLife Advisers and the subadvisers.
Following meetings of each Contract Review Committee on September 10, 2008, the Board, including the Independent Directors, at its November 6-7, 2008 meeting, approved the continuation through December 31, 2009 of the Advisory Agreements for each Portfolio of the Fund and the Subadvisory Agreements for each Portfolio other than the Zenith Equity Portfolio and Asset Allocation Portfolios (which do not have subadvisers) and the Van Eck Global Natural Resources Portfolio, Met/Dimensional International Small Cap Portfolio and Loomis Sayles Small Cap Growth Portfolio (formerly known as the Franklin Templeton Small Cap Growth Portfolio). The Agreements approved for continuation are referred to below as the “Continued Agreements.”
In considering whether to approve the continuation of the Continued Agreements, the Directors, including the Independent Directors, did not identify any single factor as determinative, and each weighed the various factors as he or she deemed appropriate. The Directors considered the following matters in connection with their approval of the Continued Agreements:
The nature, extent and quality of the services provided to the relevant Portfolios under the Continued Agreements. The Directors considered the nature, extent and quality of the services provided by MetLife Advisers, the relevant subadvisers (if any) and their affiliates (each, an “Adviser,” and, collectively, the “Advisers”) to the relevant Portfolios pursuant to the Continued Agreements and the resources dedicated to these Portfolios by the Advisers. In particular, the Directors considered the Advisers’ abilities to attract and retain highly qualified investment professionals. With respect to MetLife Advisers, the Directors considered (for each Portfolio other than the Zenith Equity and Asset Allocation Portfolios) that MetLife Advisers is (i) ultimately responsible for the performance of such Portfolios; (ii) ultimately responsible for the establishment of the investment strategies of each such Portfolio, primarily through its recommendations to the Board regarding the hiring and selection of subadvisers; (iii) responsible for the hiring and selection, subject to Board approval, of subadvisers; and (iv) responsible for maintaining a program of Subadviser oversight reasonably designed to ensure that the subadvisers have reasonable compliance policies and procedures in place. The Directors also considered that MetLife Advisers provides a full range of day-to-day administrative services for the Portfolios involving all aspects of such Portfolios’ day-to-day operations (other than portfolio management). With respect to the Zenith Equity and Asset Allocation Portfolios, the Directors considered both the portfolio management services and the administrative services provided by MetLife Advisers. After reviewing
MSF-19
Metropolitan Series Fund, Inc.
MetLife Aggressive Allocation Portfolio
Board Approval of Advisory and Subadvisory Agreements—(Continued)
these and related factors, the Directors concluded, within the context of their overall conclusions regarding each of the Continued Agreements, that the nature, extent and quality of services provided supported the renewal of these Agreements.
Investment performance of the relevant Portfolios. The Directors reviewed information about the performance of the relevant Portfolios over various time periods, including information prepared by an independent third party that compared the performance of the Portfolios to the performance of peer groups of funds and performance benchmarks. The Directors also reviewed a description of the third party’s methodology for identifying a Portfolio’s peer group(s) for purposes of performance and expense comparisons.
In the case of each relevant Portfolio that had performance that lagged its peer group(s) for certain periods, the Directors concluded that other factors relevant to performance were sufficient, in light of other considerations, to warrant renewal of the Continued Agreements relating to such Portfolio. These factors varied from Portfolio to Portfolio, but included one or more of the following: (i) that such Portfolio’s performance, although lagging in certain recent periods, was stronger over the longer term; (ii) that the underperformance was attributable, to a significant extent, to investment decisions that were reasonable and consistent with the Portfolio’s investment objective(s) and policies and that the Portfolio was performing within the range of reasonable expectations, given market conditions and the Portfolio’s investment objective(s) and policies; (iii) that the Portfolio’s performance was competitive when compared to other relevant performance benchmarks or peer groups; and (iv) that MetLife Advisers and/or the relevant subadviser (if any) had taken or was taking steps designed to help improve the Portfolio’s investment performance (including, in the case of certain Portfolios, that MetLife Advisers was formulating possible proposals, for presentation to the Board in November 2008, to replace the Portfolio’s subadviser or to merge the Portfolio into another Portfolio with a similar investment objective and better investment performance).
The Directors also considered the investment performance of the Advisers and their reputations generally, the historical responsiveness of the Advisers to Director concerns about performance and the willingness of the Advisers to take steps intended to improve performance.
After reviewing these and related factors, the Directors concluded, within the context of their overall conclusions regarding each of the Continued Agreements, that the investment performance of each relevant Portfolio and Adviser was sufficient, in light of other considerations, to warrant the renewal of the Continued Agreements.
The costs of the services to be provided and profits to be realized by the Advisers and their affiliates from their relationships with the Portfolios. The Directors considered the fees charged by MetLife Advisers to the Portfolios for advisory services and, with respect to the subadvised Portfolios, by such subadvisers to MetLife Advisers for subadvisory services (such advisory and subadvisory fees (if any), collectively, “Fees”), as well as the total expense levels of the Portfolios. This information included comparisons (provided by an independent third party) of the Portfolios’ advisory fees and total expense levels to those of their peer groups. In evaluating Fees for the relevant Portfolios, the Directors also took into account the demands, complexity and quality of the investment management services provided to each Portfolio. The Directors considered MetLife Advisers’ recommendations regarding reductions in Fee rates, implementation of Fee breakpoints and institution of Fee waivers and expense caps.
The Directors also considered the compensation directly or indirectly received by the Advisers and their affiliates from their relationships with the relevant Portfolios. The Directors reviewed information relating to the profits received by MetLife Advisers, certain of the subadvisers and their affiliates as a result of their relationships with the relevant Portfolios, and information about the allocation of expenses used to calculate profitability. When reviewing profitability, the Directors also considered the performance of the relevant Portfolios, the expense levels of such Portfolios and whether the relevant Advisers had implemented breakpoints, fee waivers and/or expense caps with respect to such Portfolios.
After reviewing these and related factors, the Directors concluded, within the context of their overall conclusions regarding each of the Continued Agreements, that the Fees charged to each of the relevant Portfolios were fair and reasonable, and that the information provided regarding costs of these services generally, and the related profitability (if known) to the relevant Advisers of their relationships with the relevant Portfolios, supported the renewal of the Continued Agreements.
Economies of Scale. The Directors considered the existence of any economies of scale in the provision of services by the Advisers and whether those economies were shared with the relevant Portfolios through breakpoints in their advisory fees or other means, such as expense caps, fee waivers or relatively low levels of fees. The Directors noted that most of the relevant Portfolios benefited or will benefit from breakpoints, expense caps and/or fee waivers with respect to their advisory fees. In considering these issues, the Directors also took into consideration information relating to the costs of the services provided and the profitability to MetLife Advisers, the relevant subadvisers (if any) and each of their affiliates of their relationships with the relevant Portfolios, as discussed above.
MSF-20
Metropolitan Series Fund, Inc.
MetLife Aggressive Allocation Portfolio
Board Approval of Advisory and Subadvisory Agreements—(Continued)
After reviewing these and related factors, the Directors concluded, within the context of their overall conclusions regarding each of the Continued Agreements, that the extent to which economies of scale were shared with the relevant Portfolios supported the renewal of such Agreements.
Other Factors. The Directors also considered other factors, which included but were not limited to the following:
| | • | | the extent to which each relevant Portfolio operated in accordance with its investment objective, and its record of compliance with its investment restrictions and the compliance programs of the Fund and the Advisers. They also considered the compliance-related resources the Advisers and their affiliates provide to the relevant Portfolios; |
| | • | | the nature, quality, cost and extent of administrative and shareholder services performed by MetLife Advisers and its affiliates under the Advisory Agreements; and |
| | • | | so-called “fall-out benefits” to the Advisers, such as the engagement of their affiliates to provide distribution, brokerage and transfer agency services to the Portfolios, and the benefits of research made available to the relevant Advisers by reason of brokerage commissions generated by the relevant Portfolios’ securities transactions. The Directors also considered the possible conflicts of interest associated with these fall-out and other benefits, and the reporting and other processes in place to disclose and monitor these possible conflicts of interest. |
Based on their evaluation of all factors that they deemed to be material, including those factors described above, and assisted by the advice of independent counsel, the Directors, including the Independent Directors, concluded that each of the Continued Agreements should be continued through December 31, 2009.
MSF-21
A description of the policies and procedures that the Fund uses to determine how to vote proxies relating to portfolio securities is available (i) without charge, upon request, by calling (800) 638-7732 and (ii) on the Securities and Exchange Commission’s (the “SEC”) website at http://www.sec.gov.
Information regarding how the Fund voted proxies relating to portfolio securities during the most recent twelve-month period ended December 31, 2008 is available (i) without charge, upon request, by calling (800) 638-7732 and (ii) on the SEC’s website at http://www.sec.gov.
The Fund’s Statement of Additional Information includes additional information about the Directors of the Fund and is available (i) without charge, upon request, by calling (800) 638-7732 and (ii) on the SEC’s website at http://www.sec.gov.
The Fund files with the SEC a complete schedule of its portfolio holdings, as of the close of the first and third quarters of its fiscal year, on “Form N-Q”. These filings are available on the SEC’s website at www.sec.gov and may be reviewed and copied at the SEC’s Public Reference Room in Washington, DC. (Call 1-800-SEC-0330 for information on the operation of the Public Reference Room.)
MSF-22
Simplify your life…
with MetLife eDelivery® while helping MetLife preserve the planet’s natural resources.
(see details on inside cover)
| | |
Metropolitan Series Fund, Inc. MetLife Conservative Allocation Portfolio Annual Report | | December 31, 2008 |
NOT PART OF THE ANNUAL REPORT
Letter from the President
February 1, 2009
Letter to Policy Holders:
2008 was an extraordinary year in the capital markets around the world and for the global economy. Energy prices rose to record levels early in the year before falling by two-thirds by year-end. A credit crisis that began with concerns about sub-prime mortgages led to massive changes in the financial landscape with government takeovers, forced sales, and outright failures of a number of large, once venerable firms.
While bonds as measured by the Barclays Capital U.S. Aggregate Bond Index (formerly known as, Lehman Brothers U.S. Aggregate Bond Index) were up 5.2% for the year in response to declining interest rates, there were large differences in the total returns of the various sectors of the bond market. U.S. treasury securities were up over 13% as frightened investors sought refuge in what they perceived to be the safest and most liquid investments. In contrast, investment grade corporate securities lost nearly 5% as credit spreads widened and below investment grade or high yield bonds fell over 26%.
In response to the growing credit crisis and the weakening economy, common stocks fell sharply across all regions, styles, and capitalizations. As measured by the Standard and Poor’s 500, U.S. common stocks fell 37% for the year, the worst calendar year decline since the 1930s. Foreign stocks were down even more with the MSCI EAFE Index down 43% for the year.
On the following pages, you will find a complete review of your Portfolio and its investment performance.
MetLife is committed to building your financial freedom. We appreciate your trust and will continue to focus our efforts on meeting your investment needs.
Sincerely,
Elizabeth M. Forget
President, Metropolitan Series Fund, Inc.
Metropolitan Series Fund, Inc.
MetLife Conservative Allocation Portfolio
Managed by MetLife Advisers, LLC
Portfolio Manager Commentary*
PORTFOLIO PERFORMANCE
For the twelve-month period ended December 31, 2008, the Class A shares of the MetLife Conservative Allocation Portfolio returned -14.1% compared to the -37.3% return of the Wilshire 5000 Stock Index1 and the 2.4% return of the Barclays Capital U.S. Universal Bond Index2. Considering that no single index or benchmark can accurately capture the multiple asset class design of the Portfolio, we have created a blended benchmark comprised of several indices for use in portfolio design and evaluation purposes. Specifically, the blended benchmark for the MetLife Conservative Allocation Portfolio currently consists of a 16% allocation to the Barclays Capital 1 to 3 Year Government Bond Index3, a 64% allocation to the Barclays Capital U.S. Universal Bond Index, a 15% allocation to the Wilshire 5000 Stock Index, and a 5% allocation to the Morgan Stanley Capital International EAFE Index4. During the twelve-month period ended December 31, 2008, the blended benchmark returned -6.5%.
ECONOMIC AND MARKET REVIEW
The first half of 2008 was highlighted by growing concerns about the economy due to the emerging credit crisis, rising unemployment, falling consumer confidence, a struggling housing sector, and skyrocketing food and energy prices. The forced sale of Bear Stearns in March to JP Morgan at first appeared to be an isolated event, but would prove to be a harbinger of things to come. The Federal Reserve was aggressive early in the year to revive the economy when they cut their target rate several times to bring it down from 4.25% to 2.00% by early May. They held rates steady in subsequent meetings through the summer as they tried to balance the danger of the economy falling into a recession against their desire to control growing inflation pressures.
However, the evidence of a weakening economy (especially falling real estate prices and the impact of the sub-prime mortgage crisis) gained momentum during the summer, climaxing in the extraordinary events of September and October that saw the government’s provision of credit assistance to Fannie Mae and Freddie Mac, the bankruptcy of Lehman Brothers, and the failure of Washington Mutual. The U.S. government and governments around the world took massive fiscal and monetary actions to stabilize the capital markets, restore liquidity to the clogged credit pipeline, and to stimulate the economy. These efforts continue as we move into 2009. Although we now know that the recession began a year ago in December 2007, the recession intensified during the last months of 2008: unemployment rose sharply as companies made massive layoffs, housing prices and sales continued to fall, retail sales fell, and, in a bit of good news/bad news, oil prices fell nearly $100 per barrel in response in expectation of lower global demand. The incoming administration of Barack Obama faces what most pundits call the largest economic crisis since the Great Depression.
During the first half of 2008, bond returns fluctuated as investors’ concerns changed from a weakening economy to inflation pressures fueled by soaring energy prices. Bonds eked out modestly positive total return of 1.1% for the January to June period as measured by the Barclays Capital U.S. Aggregate Bond Index5. During the second half of the year, the weak economy drove yields down and credit spreads wider as investors sought refuge in the safety of treasury securities. This resulted in mixed returns for bonds. Treasury bonds returned over 13% for the full year, while investment grade corporate bonds were down nearly 5%. High yield bonds were down over 26% for the year with most of the decline occurring in the second half of the year. While most credit based bonds recovered somewhat in December, it was not enough to reverse the earlier losses.
U.S. common stocks suffered their worst calendar year decline in over seventy years during 2008 as measured by the -37.0% return of the Standard & Poor’s 500 Index6. Growing expectations for a deep and long recession and a sharp drop in corporate earnings drove stock prices lower. The total collapse of several high profile financial firms pulled the indices down further. While there was very little difference in the return by style within large cap stocks, growth fell more than value at the mid cap and small cap segments. There was little difference in return by capitalization. By sector, Financials and Materials were down the most, while Consumer Staples held up better on a relative basis. Energy, which was up nearly 9% in the first half of the year, fell 40% in the second half to finish the year down almost 35%. Foreign stocks were also down sharply for the year, falling over 43% as measured by the MSCI EAFE Index. Emerging markets were down 53.3% as measured by the MSCI Emerging Markets Index7.
PORTFOLIO REVIEW
The MetLife Conservative Allocation Portfolio is a “fund of funds” consisting of other portfolios of the Met Investors Series Trust and the Metropolitan Series Fund with a broad allocation goal of 20% in equities and 80% in fixed income. The most significant change in strategy during the first half of 2008 was an increase in the asset class goal for foreign stocks from 20% of total equities to 25% of total equities. For this Portfolio, this resulted in a change in the goal for foreign stocks from 4% to 5%. There were also several small adjustments to the underlying portfolio targets that were part of the annual review and restructuring. We added a 1% position in the Van Eck Global Natural Resources Portfolio to add further diversification.
The Portfolio was structured to be diversified across a wide variety of asset classes to add value over the long term. However, for most of 2008, investors shunned risk and rewarded only what they perceived to be the safest investments.
The Portfolio’s fixed income portfolios had the biggest negative impact on relative performance as the Portfolio’s underlying bond portfolios held higher positions in credit based bonds (and less in Treasury securities) than is held in the broad bond indices. In particular, the Lord Abbett Bond Debenture Portfolio, the Western Asset Management Strategic Bond Opportunities Portfolio, and the BlackRock High Yield Portfolio were down sharply relative to the broad index because of their high yield bond and other credit exposure. Overall high yield exposure was about 10% of the portfolio,
MSF-2
Metropolitan Series Fund, Inc.
MetLife Conservative Allocation Portfolio
Managed by MetLife Advisers, LLC
Portfolio Manager Commentary*
which was in line with our target. WAM Strategic was also adversely impacted by its significant exposure to Non-Agency Mortgage Backed Securities, which were down sharply in response to the credit crisis. The PIMCO Inflation Protected Bond Portfolio, which did well in the first half when inflation expectations were still prevalent, had a large negative impact in the second half of the year as inflation expectations lessened because of the weak economy and falling oil prices. In fact, during 2008 inflation grew at its lowest rate in over fifty years.
Within the equity sector, a cumulative overweight in the Financials and Materials sectors and an underweight to the Consumer Staples sector detracted from relative performance during the full year. Certain Portfolios led a positive impact on relative performance. Dreman Small Cap Value Portfolio, although down over 25% for the year, outperformed its index due to an overweight in the relatively better performing Consumer Staples sector and overall stock selection, especially in the Health Care sector. BlackRock Large Cap Value Portfolio added to relative performance mostly due to favorable stock selection in the Financials sector.
The Legg Mason Value Equity Portfolio was hurt in the first half of the year by its lack of exposure to the strong energy sector, but it continued to struggle in the second half even though the portfolio managers’ concerns about the sustainability of the high energy prices proved to be correct. The portfolio was also hurt by its exposure to several of the high profile financial stocks. Neuberger Berman Mid Cap Value Portfolio, one of the strongest performing portfolios in the first half of the year due to its energy exposure, struggled in the second half of the year for the same reason. It also was hurt by its exposure to Bear Stearns and poor overall stock selection in the Industrial sector. For example Chicago Bridge & Iron, Terex Corp., and McDermott International were all large positions that each fell over 70% for the year. FI Mid Cap Opportunities Portfolio was also hurt by its energy exposure in the second half and by overall poor stock selection, especially in the Financials (holding Brazilian brokerage firm BM&F Bovespa) and Industrials (holding engineering firm Flowserve) sectors.
Despite the recent poor performance of the Portfolio, we will continue to take a long term view to provide a well diversified portfolio to meet long term objectives.
* The views expressed above are those of the advisory firm as of December 31, 2008 and are subject to change based on market and other conditions. Information about the Portfolio’s holdings, asset allocation, industry allocation, or country diversification is historical and is not an indication of future Portfolio composition, which will vary. The performance of any index mentioned in this commentary has not been adjusted for ongoing management, distribution and operating expenses, and sales charges applicable to mutual fund investments. Direct investment in any index is not possible.
1 The Wilshire 5000 Equity Index measures the performance of all U.S. headquartered equity securities with readily available price data.
2 The Barclays Capital U.S. Universal Bond Index (formerly, Lehman Brothers U.S. Universal Bond Index) represents the union of the U.S. Aggregate Index, the U.S. High-Yield Corporate Index, the 144A Index, the Eurodollar Index, the Emerging Markets Index, the non-EIRSA portion of the Commercial Mortgage Backed Securities Index and the Commercial Mortgage Backed Securities High Yield Index. The index itself remains unchanged since Barclays assumed responsibility for the index from Lehman.
3 The Barclays Capital 1 to 3 Year Government Bond Index (formerly, Lehman Brothers 1 to 3 Year Government Bond Index) includes most obligations of the U.S Treasury, agencies and quasi-federal corporations having maturities between one to three years. The index itself remains unchanged since Barclays assumed responsibility for the index from Lehman.
4 The Morgan Stanley Capital International Europe, Australasia and Far East Index (“MSCI EAFE Index”) is an unmanaged free float-adjusted market capitalization index that is designed to measure developed market equity performance, excluding the U.S. & Canada.
5 Barclays Capital U.S. Aggregate Bond Index (formerly, Lehman Brothers U.S. Aggregate Bond Index) includes most obligations of the U.S. Treasury, agencies and quasi-federal corporations, most publicly issued investment grade corporate bonds and most bonds backed by mortgage pools of GNMA, FNMA and FHLMC. The index itself remains unchanged since Barclays assumed responsibility for the index from Lehman.
6 The Standard & Poor’s (S&P) 500® Composite Stock Price Index is an unmanaged index representing the performance of 500 major companies, most of which are listed on the New York Stock Exchange.
7 The MSCI Emerging Markets Index is a free float-adjusted market capitalization index that is designed to measure equity market performance of emerging markets. As of January 2009 the MSCI Emerging Markets Index consisted of the following 23 emerging market country indices: Argentina, Brazil, Chile, China, Colombia, Czech Republic, Egypt, Hungary, India, Indonesia, Israel, Korea, Malaysia, Mexico, Morocco, Peru, Philippines, Poland, Russia, South Africa, Taiwan, Thailand, and Turkey.
MSF-3
Metropolitan Series Fund, Inc.
MetLife Conservative Allocation Portfolio
A $10,000 INVESTMENT COMPARED TO THE WILSHIRE 5000 STOCK INDEX AND THE BARCLAYS CAPITAL U.S. UNIVERSAL BOND INDEX
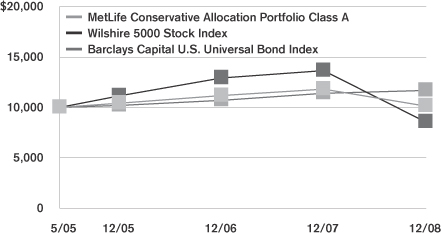
Average Annual Returns as of December 31, 2008
| | | | | | | | | | | | |
| | | MetLife Conservative Allocation Portfolio | | | Wilshire 5000 Stock Index | | | Barclays Capital U.S. Universal Bond Index | |
| | | Class A | | | Class B | | | |
| 1 Year | | -14.1 | % | | -14.4 | % | | -37.3 | % | | 2.4 | % |
| Since Inception | | 0.4 | | | 0.1 | | | -4.2 | | | 4.3 | |
Performance numbers are net of all Portfolio expenses but do not include any insurance, sales, or administrative charges of variable annuity or life insurance contracts or any additional expenses that participants in certain eligible qualified plans may bear relating to the operations of their plans. If these charges were included, the returns would be lower.
Inception date of the Class A and Class B shares is 5/2/05. Index since inception return is based on the Portfolio’s inception date.
This information represents past performance and is not indicative of future results. Investment return and principal value may fluctuate so that shares, upon redemption, may be worth more or less than the original cost.
PORTFOLIO COMPOSITION as of December 31, 2008
Top Holdings
| | |
| | | % of Total
Net Assets |
Met Investors Series Trust—PIMCO Total Return Portfolio, (Class A) | | 24.5% |
Metropolitan Series Fund, Inc.—BlackRock Bond Income Portfolio, (Class A) | | 19.9% |
Metropolitan Series Fund, Inc.—Western Asset Mgt. Strategic Bond Opportunities Portfolio, (Class A) | | 18.0% |
Met Investors Series Trust—PIMCO Inflation Protected Bond Portfolio, (Class A) | | 6.0% |
Metropolitan Series Fund, Inc.—Western Asset Mgt. U.S. Government Portfolio, (Class A) | | 5.9% |
Met Investors Series Trust—Lord Abbett Bond Debenture Portfolio, (Class A) | | 3.0% |
Metropolitan Series Fund, Inc.—Davis Venture Value Portfolio, (Class A) | | 2.9% |
Metropolitan Series Fund, Inc.—BlackRock Large Cap Value Portfolio, (Class A) | | 2.0% |
Metropolitan Series Fund, Inc.—T. Rowe Price Large Cap Growth Portfolio, (Class A) | | 2.0% |
Met Investors Series Trust—BlackRock High Yield Portfolio, (Class A) | | 1.9% |
MSF-4
Metropolitan Series Fund, Inc.
Shareholder Expense Example
As a shareholder of the Fund, you incur ongoing costs, including management fees; distribution and service (12b-1) fees; and other fund expenses. This example is intended to help you understand your ongoing costs (in dollars) (referred to as “expenses”) of investing in the Portfolio and compare these costs with the ongoing costs of investing in other mutual funds. The example is based on an investment of $1,000 invested at the beginning of the period and held for the entire period, July 1, 2008 through December 31, 2008.
Actual Expenses
The first line for each share class of the Portfolio in the table below provides information about actual account values and actual expenses. You may use the information in this line, together with the amount you invested in the particular share class of the Portfolio, to estimate the expenses that you paid over the period. Simply divide your account value by $1,000 (for example, an $8,600 account value divided by $1,000=8.6), then multiply the result by the number in the first line under the heading entitled “Expenses Paid During Period” to estimate the expenses you paid on your account during this period.
Hypothetical Example for Comparison Purposes
The second line for each share class of the Portfolio in the table below provides information about hypothetical account values and hypothetical expenses based on the Portfolio’s actual expense ratio and an assumed rate of return of 5% per year before expenses, which is not the Portfolio’s actual return. The hypothetical account values and expenses may not be used to estimate the actual ending account balance or expenses you paid for the period. You may use this information to compare the ongoing costs of investing in the Portfolio and other funds. To do so, compare this 5% hypothetical example with the 5% hypothetical examples that appear in the shareholder reports of the other funds.
Please note that the expenses shown in the table are meant to highlight your ongoing costs only and do not reflect any fees or charges of your variable insurance product or any additional expenses that participants in certain eligible qualified plans may bear relating to the operations of their plan. Therefore, the second line for each share class in the table is useful in comparing ongoing costs only, and will not help you determine the relative total costs of owning different funds. In addition, if these other costs were included, your costs would have been higher.
| | | | | | | | | | | | | | |
Portfolio | | | | Annualized
Expense
Ratio | | | Beginning
Account Value
July 1,
2008 | | Ending
Account Value
December 31,
2008 | | Expenses Paid
During Period*
July 1, 2008
to
December 31,
2008 |
MetLife Conservative Allocation—Class A(a)(b) | | Actual | | 0.67 | % | | $ | 1,000.00 | | $ | 882.85 | | $ | 3.17 |
| | Hypothetical | | 0.67 | % | | $ | 1,000.00 | | $ | 1,021.73 | | $ | 3.40 |
| | | | | |
MetLife Conservative Allocation—Class B(a)(b) | | Actual | | 0.92 | % | | $ | 1,000.00 | | $ | 880.53 | | $ | 4.35 |
| | Hypothetical | | 0.92 | % | | $ | 1,000.00 | | $ | 1,020.46 | | $ | 4.67 |
* Expenses paid are equal to the Portfolio’s annualized expense ratio for the most recent six month period, as shown above, multiplied by the average account value over the period, multiplied by the number of days in the most recent fiscal half-year, divided by 366 (to reflect the the one-half year period).
(a) The annualized expense ratio shown reflects an expense agreement between MetLife Advisers, LLC and the Portfolio as described under Expense Agreement in Note 4 to the Financial Statements.
(b) The annualized expense ratio reflects the expenses of both the Portfolio and the underlying Portfolios in which it invests.
MSF-5
Metropolitan Series Fund, Inc.
MetLife Conservative Allocation Portfolio
Schedule of Investments as of December 31, 2008
Mutual Funds—100.0% of Total Net Assets
| | | | | | |
| Security Description | | Shares | | Value* | |
| | | | | | |
| |
Affiliated Investment Companies—100.0% | | | | |
Met Investors Series Trust—BlackRock High Yield Portfolio, (Class A) | | 812,245 | | $ | 4,719,144 | |
Met Investors Series Trust—BlackRock Large Cap Core Portfolio, (Class A) | | 382,904 | | | 2,553,971 | |
Met Investors Series Trust—Dreman Small Cap Value Portfolio, (Class A) | | 266,097 | | | 2,607,747 | |
Met Investors Series Trust—Harris Oakmark International Portfolio, (Class A) | | 295,423 | | | 2,531,771 | |
Met Investors Series Trust—Lazard Mid-Cap Portfolio, (Class A) | | 358,154 | | | 2,482,005 | |
Met Investors Series Trust—Legg Mason Value Equity Portfolio, (Class A) | | 504,313 | | | 2,314,797 | |
Met Investors Series Trust—Lord Abbett Bond Debenture Portfolio, (Class A) | | 769,111 | | | 7,491,145 | |
Met Investors Series Trust—Met/AIM Small Cap Growth Portfolio, (Class A) | | 298,484 | | | 2,495,329 | |
Met Investors Series Trust—MFS Research International Portfolio, (Class A) | | 389,618 | | | 2,887,067 | |
Met Investors Series Trust—PIMCO Inflation Protected Bond Portfolio, (Class A) | | 1,520,575 | | | 14,947,253 | |
Met Investors Series Trust—PIMCO Total Return Portfolio, (Class A) | | 5,302,929 | | | 61,513,977 | |
Metropolitan Series Fund, Inc.—BlackRock Bond Income Portfolio, (Class A) | | 488,139 | | | 50,034,289 | |
Metropolitan Series Fund, Inc.—BlackRock Large Cap Value Portfolio, (Class A) | | 593,241 | | | 5,137,466 | |
Metropolitan Series Fund, Inc.—Davis Venture Value Portfolio, (Class A) | | 337,907 | | | 7,342,722 | |
Metropolitan Series Fund, Inc.—FI Mid Cap Opportunities Portfolio, (Class A) | | 248,607 | | | 2,341,880 | |
Metropolitan Series Fund, Inc.—Jennison Growth Portfolio, (Class A) | | 315,122 | | | 2,461,100 | |
Metropolitan Series Fund, Inc.—Julius Baer International Stock Portfolio, (Class A) | | 326,742 | | | 2,548,586 | |
Metropolitan Series Fund, Inc.—Met/Dimensional International Small Co. Portfolio, (Class A) | | 243,835 | | | 2,477,360 | |
Metropolitan Series Fund, Inc.—MetLife Stock Index Portfolio, (Class A) | | 112,916 | | | 2,485,282 | |
Metropolitan Series Fund, Inc.—Neuberger Berman Mid Cap Value Portfolio, (Class A) | | 229,245 | | | 2,521,696 | |
Metropolitan Series Fund, Inc.—Russell 2000 Index Portfolio, (Class A) | | 286,577 | | | 2,547,667 | |
Metropolitan Series Fund, Inc.—T. Rowe Price Large Cap Growth Portfolio, (Class A) | | 542,651 | | | 4,910,992 | |
Metropolitan Series Fund, Inc.—Western Asset Mgt. Strategic Bond Opportunities Portfolio, (Class A) | | 4,366,084 | | | 45,101,645 | |
Metropolitan Series Fund, Inc.—Western Asset Mgt. U.S. Government Portfolio, (Class A) | | 1,233,206 | | | 14,699,812 | |
| | | | | | |
Total Mutual Funds
(Identified Cost $292,931,516) | | | | | 251,154,703 | |
| | | | | | |
Total Investments—100.0%
(Identified Cost $292,931,516) (a) | | | | | 251,154,703 | |
Liabilities in excess of other assets | | | | | (57,738 | ) |
| | | | | | |
| Total Net Assets—100% | | | | $ | 251,096,965 | |
| | | | | | |
| (a) | The aggregate cost of investments for federal income tax purposes as of December 31, 2008 was $298,015,540 and the composition of unrealized appreciation and depreciation of investment securities was $43,174 and $(46,904,011), respectively. |
*See accompanying notes to financial statements.
MSF-6
Metropolitan Series Fund, Inc.
MetLife Conservative Allocation Portfolio
The Portfolio adopted the provisions of Statement of Financial Accounting Standards No. 157, “Fair Value Measurements” (FAS 157), effective with the beginning of the Portfolio’s fiscal year. FAS 157 establishes a framework for measuring fair value and expands disclosures about fair value measurements in financial statements. The three levels of the hierarchy under FAS 157 are described below:
Level 1 - quoted prices in active markets for identical securities
Level 2 - other significant observable inputs (including quoted prices for similar securities, interest rates, credit risk, etc.)
Level 3 - significant unobservable inputs (including the Portfolio’s own assumptions in determining the fair value of investments)
The inputs or methodology used for valuing securities are not necessarily an indication of the risk associated with investing in those securities.
The following is a summary of the inputs used to value the Portfolio’s net assets as of December 31, 2008:
| | | | | | |
| Valuation Inputs | | Investments In
Securities | | Other Financial
Instruments* |
Level 1 - Quoted Prices | | $ | 251,154,703 | | $ | 0 |
Level 2 - Other Significant Observable Inputs | | | 0 | | | 0 |
Level 3 - Significant Unobservable Inputs | | | 0 | | | 0 |
Total | | $ | 251,154,703 | | $ | 0 |
* Other financial instruments are derivative instruments not reflected in the Schedule of Investments, such as futures, forwards, swap contracts and written options, which are valued based on the unrealized appreciation/depreciation on the instrument.
MSF-7
Metropolitan Series Fund, Inc.
MetLife Conservative Allocation Portfolio
Statement of Assets & Liabilities
December 31, 2008
| | | | | | | |
Assets | | | | | | | |
Investments at value (a) | | | | | $ | 251,154,703 | |
Receivable for: | | | | | | | |
Securities sold | | | | | | 13,109 | |
Fund shares sold | | | | | | 221,269 | |
Due from investment adviser | | | | | | 9,460 | |
| | | | | | | |
Total Assets | | | | | | 251,398,541 | |
Liabilities | | | | | | | |
Payable for: | | | | | | | |
Fund shares redeemed | | $ | 234,378 | | | | |
Accrued expenses: | | | | | | | |
Service and distribution fees | | | 45,993 | | | | |
Other expenses | | | 21,205 | | | | |
| | | | | | | |
Total Liabilities | | | | | | 301,576 | |
| | | | | | | |
Net Assets | | | | | $ | 251,096,965 | |
| | | | | | | |
Net assets consists of: | | | | | | | |
Capital paid in | | | | | $ | 286,346,239 | |
Undistributed net investment income | | | | | | 9,691,380 | |
Accumulated net realized losses | | | | | | (3,163,841 | ) |
Unrealized depreciation on investments | | | | | | (41,776,813 | ) |
| | | | | | | |
Net Assets | | | | | $ | 251,096,965 | |
| | | | | | | |
| Computation of offering price: | | | | | | | |
Class A | | | | | | | |
Net asset value and redemption price per share ($26,030,051 divided by 2,764,628 shares outstanding) | | | | | $ | 9.42 | |
| | | | | | | |
Class B | | | | | | | |
Net asset value and redemption price per share ($225,066,914 divided by 24,040,601 shares outstanding) | | | | | $ | 9.36 | |
| | | | | | | |
(a) Identified cost of investments | | | | | $ | 292,931,516 | |
| | | | | | | |
Statement of Operations
For the Year Ended December 31, 2008
| | | | | | | | |
Investment Income | | | | | | | | |
Dividends from Underlying Portfolios | | | | | | $ | 8,807,572 | |
Expenses | | | | | | | | |
Management fees | | $ | 244,121 | | | | | |
Service and distribution fees—Class B | | | 537,207 | | | | | |
Directors’ fees and expenses | | | 627 | | | | | |
Custodian | | | 29,124 | | | | | |
Audit and tax services | | | 16,423 | | | | | |
Legal | | | 4,555 | | | | | |
Miscellaneous | | | 7,209 | | | | | |
| | | | | | | | |
Total expenses | | | 839,266 | | | | | |
Expense reimbursements | | | (57,938 | ) | | | 781,328 | |
| | | | | | | | |
Net Investment Income | | | | | | | 8,026,244 | |
| | | | | | | | |
Realized and Unrealized Loss | | | | | | | | |
Realized gain (loss) on: | | | | | | | | |
Investments—net | | | (5,379,629 | ) | | | | |
Capital gains distributions from Underlying Portfolios | | | 4,416,269 | | | | (963,360 | ) |
| | | | | | | | |
| Change in unrealized depreciation on: | | | | | | | | |
Investments—net | | | | | | | (46,516,237 | ) |
| | | | | | | | |
Net loss | | | | | | | (47,479,597 | ) |
| | | | | | | | |
Net Decrease in Net Assets From Operations | | | | | | $ | (39,453,353 | ) |
| | | | | | | | |
See accompanying notes to financial statements.
MSF-8
Metropolitan Series Fund, Inc.
MetLife Conservative Allocation Portfolio
Statements of Changes in Net Assets
| | | | | | | | |
| | | Year ended
December 31,
2008 | | | Year ended
December 31,
2007 | |
From Operations | | | | | | | | |
Net investment income | | $ | 8,026,244 | | | $ | 2,113,610 | |
Net realized gain (loss) | | | (963,360 | ) | | | 1,786,038 | |
Change in unrealized appreciation (depreciation) | | | (46,516,237 | ) | | | 2,731,609 | |
| | | | | | | | |
Increase (decrease) in net assets from operations | | | (39,453,353 | ) | | | 6,631,257 | |
| | | | | | | | |
From Distributions to Shareholders | | | | | | | | |
Net investment income | | | | | | | | |
Class A | | | (356,833 | ) | | | 0 | |
Class B | | | (1,900,226 | ) | | | 0 | |
| | | | | | | | |
| | | (2,257,059 | ) | | | 0 | |
| | | | | | | | |
Net realized gain | | | | | | | | |
Class A | | | (256,114 | ) | | | (9,649 | ) |
Class B | | | (1,743,507 | ) | | | (49,328 | ) |
| | | | | | | | |
| | | (1,999,621 | ) | | | (58,977 | ) |
| | | | | | | | |
Total distributions | | | (4,256,680 | ) | | | (58,977 | ) |
| | | | | | | | |
Increase in net assets from capital share transactions | | | 122,703,422 | | | | 98,254,027 | |
| | | | | | | | |
Net increase in net assets | | | 78,993,389 | | | | 104,826,307 | |
| | |
Net Assets | | | | | | | | |
Beginning of the period | | | 172,103,576 | | | | 67,277,269 | |
| | | | | | | | |
End of the period | | $ | 251,096,965 | | | $ | 172,103,576 | |
| | | | | | | | |
Undistributed Net Investment Income | | | | | | | | |
End of the period | | $ | 9,691,380 | | | $ | 2,225,429 | |
| | | | | | | | |
Other Information:
Capital Shares
Transactions in capital shares were as follows:
| | | | | | | | | | | | | | |
| | | Year ended
December 31, 2008 | | | Year ended
December 31, 2007 | |
| | | Shares | | | $ | | | Shares | | | $ | |
Class A | | | | | | | | | | | | | | |
Sales | | 1,973,449 | | | $ | 20,744,919 | | | 2,039,673 | | | $ | 22,155,271 | |
Reinvestments | | 56,131 | | | | 612,947 | | | 886 | | | | 9,649 | |
Redemptions | | (1,540,353 | ) | | | (15,792,398 | ) | | (808,139 | ) | | | (8,800,183 | ) |
| | | | | | | | | | | | | | |
Net increase | | 489,227 | | | $ | 5,565,468 | | | 1,232,420 | | | $ | 13,364,737 | |
| | | | | | | | | | | | | | |
Class B | | | | | | | | | | | | | | |
Sales | | 17,949,128 | | | $ | 188,689,371 | | | 13,942,100 | | | $ | 150,674,842 | |
Reinvestments | | 335,210 | | | | 3,643,733 | | | 4,551 | | | | 49,328 | |
Redemptions | | (7,429,924 | ) | | | (75,195,150 | ) | | (6,096,389 | ) | | | (65,834,880 | ) |
| | | | | | | | | | | | | | |
Net increase | | 10,854,414 | | | $ | 117,137,954 | | | 7,850,262 | | | $ | 84,889,290 | |
| | | | | | | | | | | | | | |
Increase derived from capital share transactions | | | | | $ | 122,703,422 | | | | | | $ | 98,254,027 | |
| | | | | | | | | | | | | | |
See accompanying notes to financial statements.
MSF-9
Metropolitan Series Fund, Inc.
MetLife Conservative Allocation Portfolio
Financial Highlights
| | | | | | | | | | | | | | | | |
| | | Class A | |
| | | Year ended December 31, | |
| | | 2008 | | | 2007 | | | 2006 | | | 2005(a) | |
Net Asset Value, Beginning of Period | | $ | 11.18 | | | $ | 10.58 | | | $ | 10.37 | | | $ | 10.00 | |
| | | | | | | | | | | | | | | | |
Income From Investment Operations | | | | | | | | | | | | | | | | |
Net investment income | | | 0.39 | (b) | | | 0.22 | (b) | | | 0.36 | | | | 0.03 | |
Net realized and unrealized gain (loss) of investments | | | (1.94 | ) | | | 0.39 | | | | 0.36 | | | | 0.38 | |
| | | | | | | | | | | | | | | | |
Total from investment operations | | | (1.55 | ) | | | 0.61 | | | | 0.72 | | | | 0.41 | |
| | | | | | | | | | | | | | | | |
Less Distributions | | | | | | | | | | | | | | | | |
Distributions from net investment income | | | (0.12 | ) | | | 0.00 | | | | (0.37 | ) | | | (0.03 | ) |
Distributions from net realized capital gains | | | (0.09 | ) | | | (0.01 | ) | | | (0.14 | ) | | | (0.01 | ) |
| | | | | | | | | | | | | | | | |
Total distributions | | | (0.21 | ) | | | (0.01 | ) | | | (0.51 | ) | | | (0.04 | ) |
| | | | | | | | | | | | | | | | |
Net Asset Value, End of Period | | $ | 9.42 | | | $ | 11.18 | | | $ | 10.58 | | | $ | 10.37 | |
| | | | | | | | | | | | | | | | |
Total Return (%) | | | (14.1 | ) | | | 5.7 | | | | 7.3 | | | | 4.1 | (c) |
Ratio of operating expenses to average net assets (%) (d) | | | 0.10 | | | | 0.10 | | | | 0.10 | | | | 0.10 | (e) |
Ratio of operating expenses to average net assets without giving effect to the contractual expense agreement would have been (%) (d)(f) | | | 0.12 | | | | 0.15 | | | | 0.19 | | | | 1.05 | (e) |
Ratio of net investment income to average net assets (%) (g) | | | 3.77 | | | | 2.05 | | | | 2.75 | | | | 0.96 | (e) |
Portfolio turnover rate (%) | | | 25 | | | | 40 | | | | 24 | | | | 32 | (e) |
Net assets, end of period (000) | | $ | 26,030 | | | $ | 25,447 | | | $ | 11,030 | | | $ | 2,785 | |
| | | | | | | | | | | | | | | | |
| | | Class B | |
| | | Year ended December 31, | |
| | | 2008 | | | 2007 | | | 2006 | | | 2005(a) | |
Net Asset Value, Beginning of Period | | $ | 11.12 | | | $ | 10.54 | | | $ | 10.36 | | | $ | 10.00 | |
| | | | | | | | | | | | | | | | |
Income From Investment Operations | | | | | | | | | | | | | | | | |
Net investment income | | | 0.33 | (b) | | | 0.19 | (b) | | | 0.34 | | | | 0.03 | |
Net realized and unrealized gain (loss) of investments | | | (1.90 | ) | | | 0.40 | | | | 0.34 | | | | 0.37 | |
| | | | | | | | | | | | | | | | |
Total from investment operations | | | (1.57 | ) | | | 0.59 | | | | 0.68 | | | | 0.40 | |
| | | | | | | | | | | | | | | | |
Less Distributions | | | | | | | | | | | | | | | | |
Distributions from net investment income | | | (0.10 | ) | | | 0.00 | | | | (0.36 | ) | | | (0.03 | ) |
Distributions from net realized capital gains | | | (0.09 | ) | | | (0.01 | ) | | | (0.14 | ) | | | (0.01 | ) |
| | | | | | | | | | | | | | | | |
Total distributions | | | (0.19 | ) | | | (0.01 | ) | | | (0.50 | ) | | | (0.04 | ) |
| | | | | | | | | | | | | | | | |
Net Asset Value, End of Period | | $ | 9.36 | | | $ | 11.12 | | | $ | 10.54 | | | $ | 10.36 | |
| | | | | | | | | | | | | | | | |
Total Return (%) | | | (14.4 | ) | | | 5.6 | | | | 6.9 | | | | 4.0 | (c) |
Ratio of operating expenses to average net assets (%) (d) | | | 0.35 | | | | 0.35 | | | | 0.35 | | | | 0.35 | (e) |
Ratio of operating expenses to average net assets without giving effect to the contractual expense agreement would have been (%) (d)(f) | | | 0.37 | | | | 0.40 | | | | 0.44 | | | | 1.30 | (e) |
Ratio of net investment income to average net assets (%) (g) | | | 3.22 | | | | 1.77 | | | | 1.89 | | | | 1.00 | (e) |
Portfolio turnover rate (%) | | | 25 | | | | 40 | | | | 24 | | | | 32 | (e) |
Net assets, end of period (000) | | $ | 225,067 | | | $ | 146,651 | | | $ | 56,247 | | | $ | 12,638 | |
| (a) | Commencement of operations was May 2, 2005. |
| (b) | Per share amount is based on average shares outstanding during the period. |
| (c) | Periods less than one year are not computed on an annualized basis. |
| (d) | The ratio of operating expenses to average net assets does not include expenses of investment companies in which the Portfolio invests. |
| (e) | Computed on an annualized basis. |
| (f) | See Note 4 of the Notes to Financial Statements. |
| (g) | Recognition of net investment income by the Portfolio is affected by the timing of the declaration of dividends by the Underlying Portfolios in which it invests. |
See accompanying notes to financial statements.
MSF-10
Metropolitan Series Fund, Inc.
MetLife Conservative Allocation Portfolio
Notes to Financial Statements—December 31, 2008
Metropolitan Series Fund, Inc. (the “Fund”) is organized as a corporation under the laws of Maryland pursuant to Articles of Incorporation filed on November 23, 1982, as amended, and registered under the Investment Company Act of 1940, as amended (the “1940 Act”), as an open-end investment company. The Fund is a “series” type of mutual fund, which issues separate series of stock. Each series represents an interest in a separate portfolio of Fund investments. The MetLife Conservative Allocation Portfolio (the “Asset Allocation Portfolio”) is a non-diversified series of the fund. The Asset Allocation Portfolio operates under a “fund of funds” structure, investing substantially all of its assets in other Portfolios advised by MetLife Advisers, LLC (“MetLife Advisers”) or its affiliates (each, an “Underlying Portfolio,” and, collectively, the “Underlying Portfolios”). Shares in the Fund are not offered directly to the general public and are currently available only to separate accounts established by Metropolitan Life Insurance Company (“MetLife”), New England Life Insurance Company, General American Life Insurance Company (“General American”), The MetLife Investors Group of Insurance Companies, MetLife Insurance Company of Connecticut and other affiliated insurance companies (collectively, the “Insurance Companies”) and to certain eligible qualified retirement plans (“Qualified Plans”), as an investment vehicle for variable life insurance, group annuity or variable annuity products of these insurance companies or Qualified Plans, although not all Portfolios are available to all such separate accounts and Qualified Plans. The Asset Allocation Portfolio’s shares may be divided into different classes. Currently, the classes being offered by the Asset Allocation Portfolio are named Class A and Class B. The classes of the Asset Allocation Portfolio’s shares are identical, except that certain additional charges (Rule 12b-1 fees) are made against Class B shares. Investment income, realized and unrealized capital gains and losses, the common expenses of the Asset Allocation Portfolio and certain Portfolio-level expense reductions, if any, are allocated daily, on a pro rata basis, to each class based on the relative net assets of each class to the total net assets of the Asset Allocation Portfolio.
| 2. | SIGNIFICANT ACCOUNTING POLICIES: |
The preparation of financial statements in conformity with accounting principles generally accepted in the United States of America (“GAAP”) requires management to make estimates and assumptions that affect the reported amounts of assets and liabilities and disclosure of contingent assets and liabilities as of the date of the financial statements and the reported amounts of income and expenses during the reporting period. Actual results could differ from those estimates.
The following is a summary of significant accounting policies consistently followed by the Asset Allocation Portfolio in the preparation of its financial statements. The policies are in conformity with GAAP.
Investment Valuation:
The net asset value of the Asset Allocation Portfolio is calculated based on the net asset values of the Underlying Portfolios in which the Asset Allocation Portfolio invests. The Underlying Portfolios that are series of the Fund will use fair value pricing in the circumstances and manner described below. For more information about the use of fair value pricing by the Underlying Portfolios that are series of Met Investors Series Trust (“MIST”), please refer to the prospectus for such Underlying Portfolios.
The Underlying Portfolios that are series of the Fund are valued as follows:
Debt securities (other than short term obligations with a remaining maturity of sixty days or less) are generally valued on the basis of evaluated or composite bid quotations obtained by independent pricing services and/or brokers and dealers selected by the relevant subadviser pursuant to authorization of the Board of Directors of the Fund (the “Board” or “Directors”). Such quotations take into account appropriate factors such as institutional-sized trading in similar groups of securities, yield, quality, coupon rate, maturity, type of issue, trading characteristics and other data. Short term obligations with a remaining maturity of sixty days or less are valued at amortized cost which approximates fair market value.
Equity securities traded on a national securities exchange or other exchanges are valued at their last sale price on the principal trading market. Equity securities traded on the NASDAQ National Market System are valued at the NASDAQ Official Closing Price (the “NOCP”). The NOCP is the last reported sale price if the last reported sale price falls between the spread of the last reported bid and asked prices. If the last reported bid and asked prices are above the last reported sale price, the NOCP will be the last reported bid price. If the last reported bid and asked prices are below the last reported sale price, the NOCP will be the last reported asked price. Equity securities traded on a national securities exchange or other exchanges or on the NASDAQ National Market System for which there is no reported sale during the day are valued at the last reported bid price. A security that is listed or traded on more than one exchange is valued at the quotation on the exchange determined to be the primary market for that
MSF-11
Metropolitan Series Fund, Inc.
MetLife Conservative Allocation Portfolio
Notes to Financial Statements—December 31, 2008—(Continued)
security by the Board or its delegates. If no closing price is available, then such securities are valued by using the last reported bid price. Equity securities traded over-the-counter are valued at the last reported sales price.
If no current market value quotation is readily available or reliable for a portfolio security, fair value will be determined in accordance with procedures established by and under the general supervision of the Board. When an Underlying Portfolio uses fair value pricing, it may take into account any factors it deems appropriate. The value of securities used by the Underlying Portfolio to calculate its net asset value may differ from quoted or published prices for the same securities. Fair value pricing involves subjective judgments and the fair value determined for a security may be materially different than the value that could be realized upon the sale of that security.
The Underlying Portfolio expects to use fair value pricing for securities primarily traded on U.S. exchanges only under very limited circumstances. For example, the Underlying Portfolio may use fair value pricing if the exchange on which a security is traded closes early or trading in the security is suspended.
Securities traded primarily on an exchange outside of the United States which closes before the close of the New York Stock Exchange will be valued at the last sales price on that non-U.S. exchange. Securities traded primarily on an exchange outside of the United States for which there is no reported sale during the day are valued at the mean between the last reported bid and asked prices. However, because most foreign markets close well before the Underlying Portfolio values its securities (typically at 4 p.m. Eastern Time), the earlier close of these foreign markets gives rise to the possibility that significant events, including broad market moves, may have occurred after these foreign markets close but before the Underlying Portfolio values its securities. For example, foreign security values may be affected by activity that occurs after the close of foreign securities markets. To account for this, the Underlying Portfolio may frequently value many of its foreign equity securities using fair value prices based on third party vendor modeling tools.
Forward foreign currency exchange contracts are valued based on the mean between closing bid and asked prices of the forward currency contract rates in the London foreign exchange markets on a daily basis as provided by a reliable bank or dealer.
Options, whether on securities, indices, futures contracts, or otherwise, are valued at the last sales price available as of the close of business on the day of valuation or, if there is no such sale price available, at the mean between the bid and asked prices. Options on currencies are valued at the spot price each day.
The value of futures contracts will be the sum of the margin deposit plus or minus the difference between the value of the futures contract on each day the net asset value is calculated and the value on the date the futures contract originated, value being that established on a recognized commodity exchange, or by reference to other customary sources, with gain or loss being realized when the futures contract closes or expires.
Subject to the Board’s oversight, the Board has delegated the day-to-day oversight of pricing matters, including determinations in good faith under the Fund’s procedures the fair value of securities for which current market quotations are not readily available to MetLife Advisers, LLC (“MetLife Advisers” or the “Adviser”) or the subadviser of the Underlying Portfolio, as applicable.
Investment Transactions and Related Investment Income:
Portfolio security transactions are recorded on the trade date. Dividend income is recorded on the ex-dividend date. Interest income is recorded on the accrual basis. Realized gains and losses on investments and unrealized appreciation and depreciation are determined on the identified cost basis, which is the same basis used for federal income tax purpose.
Federal Income Taxes:
It is the Portfolio’s policy to comply with the requirements of the Internal Revenue Code of 1986, as amended (the “Code”), and regulations thereunder, applicable to regulated investment companies and to distribute, with respect to each taxable year, all of its taxable income to shareholders. Therefore, no federal income tax provision is required. The Portfolio is subject to the provisions of the Financial Accounting Standards Board Interpretation (“FASB”) No. 48, Accounting for Uncertainties in Income Taxes (FIN 48). FIN 48 sets forth a minimum threshold for financial statement recognition of the benefit of a tax position taken or expected to be taken in a tax return. The implementation of FIN 48 did not result in any unrecognized tax benefits in the accompanying financial statements. Each of the Portfolio’s federal tax returns for the prior three fiscal years remains subject to examination by the Internal Revenue Service.
As of December 31, 2008, the Asset Allocation Portfolio had no capital loss carryforwards.
MSF-12
Metropolitan Series Fund, Inc.
MetLife Conservative Allocation Portfolio
Notes to Financial Statements—December 31, 2008—(Continued)
Pursuant to Section 852 of the Code, the Portfolio designated the amount shown below under Long Term Gain as capital gain dividends for its taxable year ended December 31, 2008. The tax character of distributions paid for the periods ended December 31, 2008 and 2007 was as follows:
| | | | | | | | | | | | | | | | | | | | | |
| Ordinary Income | | Long Term Gain | | Return of Capital | | Total |
| 2008 | | 2007 | | 2008 | | 2007 | | 2008 | | 2007 | | 2008 | | 2007 |
| $2,773,815 | | $ | 58,977 | | $ | 1,482,865 | | $ | — | | $ | — | | $ | — | | $ | 4,256,680 | | $ | 58,977 |
As of December 31, 2008, the components of distributable earnings (accumulated losses) on a federal income tax basis were as follows:
| | | | | | | | | | | | | | |
Undistributed
Ordinary
Income | | Undistributed
Long Term
Gain | | Unrealized
Depreciation | | | Loss
Carryforwards | | Total | |
| $9,691,380 | | $ | 1,960,265 | | $ | (46,860,837 | ) | | $ | — | | $ | (35,209,192 | ) |
Pursuant to Federal income tax regulations applicable to investment companies, the Portfolio has elected to treat net capital losses realized between November 1 and December 31 of each year as occurring on the first day of the following tax year. For the year ended December 31, 2008, the following amounts of realized capital and currency losses reflected in the accompanying financial statements will not be recognized for Federal income tax purposes until January 1, 2009:
| | | | |
Currency | | Capital | |
$— | | $ | (40,084 | ) |
Dividends and Distributions to Shareholders:
The Asset Allocation Portfolio records dividends and distributions on the ex-dividend date. Net realized gains from security transactions (if any) are generally distributed annually to shareholders. The timing and characterization of certain income and capital gains distributions are determined in accordance with federal tax regulations that may differ from GAAP. Permanent book and tax basis differences relating to shareholder distributions will result in reclassification between under/over distributed net investment income, accumulated net realized gains/losses and paid in capital.
| 3. | INVESTMENT TRANSACTIONS: |
For the year ended December 31, 2008, purchases and sales of Underlying Portfolios by the Asset Allocation Portfolio were $190,545,149 and $59,647,971, respectively.
| 4. | INVESTMENT MANAGEMENT FEES AND OTHER TRANSACTIONS WITH AFFILIATES: |
Investment Management Agreement:
MetLife Advisers is the investment adviser to the Asset Allocation Portfolio. The Fund has entered into an investment management agreement with MetLife Advisers with respect to the Portfolio. For providing investment management services to the Portfolio, MetLife Advisers receives monthly compensation at the following annual rates:
| | | | |
Management
Fees earned by
MetLife Advisers
for the year ended
December 31, 2008 | | Annual
percentage
rates paid to
MetLife Advisers | | Based on Portfolios
average daily net asset
levels |
$244,121 | | 0.100% | | Of the first $500 million |
| | 0.075% | | Of the next $500 million |
| | 0.050% | | On amounts in excess of $1 billion |
In addition to the above Management Fee paid to MetLife Advisers, the Portfolio indirectly pays MetLife Advisers an investment advisory fee through its investments in certain Underlying Portfolios.
Certain officers and directors of the Fund may also be officers of MetLife Advisers; however, such officers and directors receive no compensation from the Fund.
MSF-13
Metropolitan Series Fund, Inc.
MetLife Conservative Allocation Portfolio
Notes to Financial Statements—December 31, 2008—(Continued)
Service and Distribution Fees:
The Fund has adopted a Distribution and Service Plan under Rule 12b-1 of the 1940 Act for the Asset Allocation Portfolio’s Class B shares. Under the Distribution and Service Plan, the Class B shares of the Asset Allocation Portfolio pay a fee to compensate the Insurance Companies (or their affiliates) and other broker-dealers and financial intermediaries involved in the offer and sale of Asset Allocation Portfolio shares for promoting or selling and servicing the Class B shares. The fees under the Distribution and Service Plan for each class of the Asset Allocation Portfolio’s shares are calculated as a percentage of the Asset Allocation Portfolio’s average daily net assets that are attributable to that Class. Currently, the fee is 0.25% per year for Class B shares. Amounts paid by the Asset Allocation Portfolio for the year ended December 31, 2008 are shown as Service and Distribution fees in the Statement of Operations.
Expense Agreement:
Pursuant to an expense agreement relating to each class of the Asset Allocation Portfolio, MetLife Advisers has agreed, from May 1, 2008 to April 30, 2009, to waive a portion of its advisory fees or pay a portion of the other operating expenses (not including brokerage costs, interest, taxes, or extraordinary expenses) to the extent total operating expenses exceed stated annual expense limits (based on the Asset Allocation Portfolio’s then current fiscal year). For the Asset Allocation Portfolio, this subsidy, and similar subsidies in effect in earlier periods, are subject to the obligation of each class of the Asset Allocation Portfolio to repay MetLife Advisers in future years, if any, when a class’s expenses fall below the stated expense limit pertaining to that class that was in effect at the time of the subsidy in question. Such deferred expenses may be charged to a class in a subsequent year to the extent that the charge does not cause the total expenses in such subsequent year to exceed the class’ stated expense limit that was in effect at the time of the subsidy in question; provided, however, that no class of the Asset Allocation Portfolio is obligated to repay any expense paid by MetLife Advisers more than five years after the end of the fiscal year in which such expense was incurred.
The expense limits (annual rates as a percentage of each class of the Asset Allocation Portfolio’s net average daily net assets) in effect from May 1, 2008 to April 30, 2009 are 0.10% and 0.35% for Class A and B, respectively.
As of December 31, 2008, the amount of expenses deferred in 2005 subject to repayment until December 31, 2010 was $39,997. The amount of expenses deferred in 2006 subject to repayment until December 31, 2011 was $32,823. The amount of expenses deferred in 2007 subject to repayment until December 31, 2012 was $52,647. The amount of expenses deferred in 2008 subject to repayment until December 31, 2013 was $57,938.
| 5. | TRANSACTIONS IN SECURITIES OF AFFILIATED ISSUERS: |
The Asset Allocation Portfolio does not invest in the Underlying Portfolios for the purpose of exercising management or control; however, investments by the Asset Allocation Portfolio within its principal investment strategies may represent a significant portion of the Underlying Portfolio’s net assets. Transactions in the Underlying Portfolios during the year ended December 31, 2008 are as follows:
| | | | | | | | |
Underlying Portfolio (Class A) | | Beginning Shares
as of 12/31/2007 | | Shares Purchased
during Period | | Shares Sold
during Period | | Ending Shares
as of 12/31/2008 |
MIST—BlackRock High Yield | | 410,861 | | 511,841 | | 110,457 | | 812,245 |
MIST—BlackRock Large Cap Core | | 158,599 | | 259,954 | | 35,649 | | 382,904 |
MIST—Dreman Small Cap Value | | 123,597 | | 175,276 | | 32,776 | | 266,097 |
MIST—Harris Oakmark International | | 197,648 | | 311,003 | | 213,228 | | 295,423 |
MIST—Lazard Mid-Cap | | 136,617 | | 252,661 | | 31,124 | | 358,154 |
MIST—Legg Mason Value Equity | | 161,189 | | 387,084 | | 43,960 | | 504,313 |
MIST—Lord Abbett Bond Debenture | | 405,786 | | 460,595 | | 97,270 | | 769,111 |
MIST—Met/AIM Small Cap Growth | | 114,853 | | 209,967 | | 26,336 | | 298,484 |
MIST—MFS Research International | | 0 | | 546,168 | | 156,550 | | 389,618 |
MIST—PIMCO Inflation Protected | | 942,090 | | 840,477 | | 261,992 | | 1,520,575 |
MIST—PIMCO Total Return | | 3,800,462 | | 3,418,281 | | 1,915,814 | | 5,302,929 |
MSF—BlackRock Bond Income | | 262,646 | | 331,961 | | 106,468 | | 488,139 |
MSF—BlackRock Large Cap Value | | 258,056 | | 391,962 | | 56,777 | | 593,241 |
MSF—Davis Venture Value | | 142,630 | | 229,004 | | 33,727 | | 337,907 |
MSF—FI Mid Cap Opportunities | | 79,881 | | 192,630 | | 23,904 | | 248,607 |
MSF—Jennison Growth | | 129,696 | | 222,912 | | 37,486 | | 315,122 |
MSF—Julius Baer International Stock | | 106,265 | | 254,665 | | 34,188 | | 326,742 |
MSF-14
Metropolitan Series Fund, Inc.
MetLife Conservative Allocation Portfolio
Notes to Financial Statements—December 31, 2008—(Continued)
| | | | | | | | |
Underlying Portfolio (Class A) | | Beginning Shares
as of 12/31/2007 | | Shares Purchased
during Period | | Shares Sold
during Period | | Ending Shares
as of 12/31/2008 |
MSF—Met/Dimensional International Small Company | | 0 | | 251,022 | | 7,187 | | 243,835 |
MSF—MetLife Stock Index | | 46,978 | | 77,239 | | 11,301 | | 112,916 |
MSF—Neuberger Berman Mid Cap Value | | 166,962 | | 218,284 | | 156,001 | | 229,245 |
MSF—Russell 2000 Index | | 120,163 | | 199,413 | | 32,999 | | 286,577 |
MSF—T. Rowe Price Large Cap Growth | | 212,331 | | 389,608 | | 59,288 | | 542,651 |
MSF—Western Asset Mgt. Strategic Bond Opportunities | | 2,414,482 | | 2,391,294 | | 439,692 | | 4,366,084 |
MSF—Western Asset Mgt. U.S. Government | | 822,904 | | 769,199 | | 358,897 | | 1,233,206 |
| | | | | | | | | | | | | |
Underlying Portfolio (Class A) | | Realized Gain/(Loss)
during Period | | | Capital Gains
Distributions
during Period | | Dividend Income
during Period | | Ending Value
as of 12/31/2008 |
MIST—BlackRock High Yield | | $ | (141,115 | ) | | $ | 0 | | $ | 354,189 | | $ | 4,719,144 |
MIST—BlackRock Large Cap Core | | | (106,477 | ) | | | 102,486 | | | 15,689 | | | 2,553,971 |
MIST—Dreman Small Cap Value | | | (41,584 | ) | | | 69,985 | | | 18,631 | | | 2,607,747 |
MIST—Harris Oakmark International | | | (960,573 | ) | | | 730,546 | | | 85,328 | | | 2,531,771 |
MIST—Lazard Mid-Cap | | | (142,440 | ) | | | 168,725 | | | 27,695 | | | 2,482,005 |
MIST—Legg Mason Value Equity | | | (196,042 | ) | | | 87,030 | | | 6,385 | | | 2,314,797 |
MIST—Lord Abbett Bond Debenture | | | (152,188 | ) | | | 107,843 | | | 310,928 | | | 7,491,145 |
MIST—Met/AIM Small Cap Growth | | | (109,308 | ) | | | 204,159 | | | 0 | | | 2,495,329 |
MIST—MFS Research International | | | (786,824 | ) | | | 0 | | | 0 | | | 2,887,067 |
MIST—PIMCO Inflation Protected | | | 142,949 | | | | 29,677 | | | 562,077 | | | 14,947,253 |
MIST—PIMCO Total Return | | | (246,215 | ) | | | 1,575,138 | | | 2,589,027 | | | 61,513,977 |
MSF—BlackRock Bond Income | | | (615,434 | ) | | | 0 | | | 2,109,037 | | | 50,034,289 |
MSF—BlackRock Large Cap Value | | | (211,021 | ) | | | 75,273 | | | 38,812 | | | 5,137,466 |
MSF—Davis Venture Value | | | (174,088 | ) | | | 37,378 | | | 89,793 | | | 7,342,722 |
MSF—FI Mid Cap Opportunities | | | (100,952 | ) | | | 0 | | | 9,092 | | | 2,341,880 |
MSF—Jennison Growth | | | (74,822 | ) | | | 195,282 | | | 56,630 | | | 2,461,100 |
MSF—Julius Baer International Stock | | | (185,493 | ) | | | 265,511 | | | 68,913 | | | 2,548,586 |
MSF—Met/Dimensional International Small Company | | | (2,530 | ) | | | 0 | | | 0 | | | 2,477,360 |
MSF—MetLife Stock Index | | | (97,741 | ) | | | 93,407 | | | 43,552 | | | 2,485,282 |
MSF—Neuberger Berman Mid Cap Value | | | (222,370 | ) | | | 53,459 | | | 37,221 | | | 2,521,696 |
MSF—Russell 2000 Index | | | (131,061 | ) | | | 114,121 | | | 29,090 | | | 2,547,667 |
MSF—T. Rowe Price Large Cap Growth | | | (138,361 | ) | | | 254,630 | | | 26,628 | | | 4,910,992 |
MSF—Western Asset Mgt. Strategic Bond Opportunities | | | (491,278 | ) | | | 251,619 | | | 1,705,416 | | | 45,101,645 |
MSF—Western Asset Mgt. U.S. Government | | | (194,656 | ) | | | 0 | | | 623,439 | | | 14,699,812 |
MSF-15
Metropolitan Series Fund, Inc.
MetLife Conservative Allocation Portfolio
Report of Independent Registered Public Accounting Firm
To the Shareholders and Board of Directors of Metropolitan Series Fund, Inc.:
We have audited the accompanying statement of assets and liabilities, including the schedule of investments, of the MetLife Conservative Allocation Portfolio (one of the portfolios constituting the Metropolitan Series Fund, Inc.) (the “Fund”) as of December 31, 2008, and the related statement of operations for the year then ended, the statements of changes in net assets for each of the two years in the period then ended, and the financial highlights for each of the three years in the period then ended and for the period from May 2, 2005 (commencement of operations) through December 31, 2005. These financial statements and financial highlights are the responsibility of the Fund’s management. Our responsibility is to express an opinion on these financial statements and financial highlights based on our audits.
We conducted our audits in accordance with the standards of the Public Company Accounting Oversight Board (United States). Those standards require that we plan and perform the audit to obtain reasonable assurance about whether the financial statements and financial highlights are free of material misstatement. The Fund is not required to have, nor were we engaged to perform, an audit of its internal control over financial reporting. Our audits included consideration of internal control over financial reporting as a basis for designing audit procedures that are appropriate in the circumstances, but not for the purpose of expressing an opinion on the effectiveness of the Fund’s internal control over financial reporting. Accordingly, we express no such opinion. An audit also includes examining, on a test basis, evidence supporting the amounts and disclosures in the financial statements, assessing the accounting principles used and significant estimates made by management, as well as evaluating the overall financial statement presentation. Our procedures included confirmation of securities owned as of December 31, 2008, by correspondence with the transfer agent. We believe that our audits provide a reasonable basis for our opinion.
In our opinion, the financial statements and financial highlights referred to above present fairly, in all material respects, the financial position of the MetLife Conservative Allocation Portfolio of the Metropolitan Series Fund, Inc. as of December 31, 2008, the results of its operations for the year then ended, the changes in its net assets for each of the two years in the period then ended, and the financial highlights for each of the three years in the period then ended and for the period from May 2, 2005 (commencement of operations) through December 31, 2005, in conformity with accounting principles generally accepted in the United States of America.
Deloitte & Touche LLP
Boston, Massachusetts
February 26, 2009
MSF-16
Metropolitan Series Fund, Inc.
Directors and Officers
The Fund’s Directors review actions of the Fund’s investment adviser and subadvisers, and decide upon matters of general policy. The Fund’s officers supervise the daily business operations of the Fund. The Board of Directors and the Fund’s officers are listed below. Each Director is responsible for overseeing all 38 Portfolios of the Fund. There is no limit to the term a Director may serve. Directors serve until their resignation, retirement or removal in accordance with the Fund’s organizational documents and policies adopted by the Board from time to time. Officers hold office at the pleasure of the Board or until the election or appointment and the qualification of a successor. The address of the Directors and officers is c/o Metropolitan Series Fund, Inc., 501 Boylston Street, Boston, MA 02116.
Interested Directors(1)
Each Director below is an “interested person” (as defined by the 1940 Act) with respect to the Fund in that Ms. Forget is an employee of MetLife and Mr. Typermass is a former employee of MetLife and owns securities issued by MetLife, Inc., the ultimate parent company of MetLife Advisers.
| | | | | | | | |
Name, Address and Age | | Current
position(s)
with Fund | | Position(s)
held since | | Principal occupations
over past five years, including other directorships(2) | | Number of
Portfolios in
Fund Complex
Overseen by
Director(3) |
Elizabeth M. Forget Age: 42 | | Director, Chairman of the Board, President and Chief Executive Officer | | 2006 | | Senior Vice President (since 2007), MetLife, Inc.; President, Met Investors Advisory, LLC; Trustee and President, Met Investors Series Trust; Executive Vice President, MetLife Investors Group, Inc.; President, Chief Executive Officer and Chair of the Board of Managers (since 2006), MetLife Advisers; President, Met Investors Advisory, LLC. | | 87 |
| | | | |
Arthur G. Typermass Age: 71 | | Director | | 1998 | | Formerly, Senior Vice President and Treasurer, MetLife. | | 38 |
Non-Interested Directors(1)
Each Director below is not an “interested person” (as defined by the 1940 Act) with respect to the Fund (collectively, the “Independent Directors”).
| | | | | | | | |
Name, Address and Age | | Current
position(s)
with Fund | | Position(s)
held since | | Principal occupations
over past five years, including other directorships(2) | | Number of
Portfolios in
Fund Complex
Overseen by
Director(3) |
Steve A. Garban† Age: 71 | | Director | | 1985 | | Formerly, Chief Financial Officer, Senior Vice President Finance and Operations and Treasurer (Emeritus), The Pennsylvania State University. | | 38 |
| | | | |
Linda B. Strumpf Age: 61 | | Director | | 2000 | | Vice President and Chief Investment Officer, Ford Foundation. | | 38 |
| | | | |
Michael S. Scott Morton† Age: 71 | | Director | | 1993 | | Jay W. Forrester Professor of Management (Emeritus) at Sloan School of Management, MIT. | | 38 |
| | | | |
H. Jesse Arnelle Age: 75 | | Director | | 2001 | | Formerly, Counsel, Womble Carlyle Sandrie & Rice; Director, Textron Inc. (global multi- industry company)*; formerly, Director, Gannet Co. Inc. (diversified news and information company)*; formerly, Director, Eastman Chemical Company (global chemical company)*; formerly, Director, Waste Management, Inc.*; formerly, Director, Armstrong Holdings Inc. (parent company of floor and ceiling products business)*; formerly, Director, FPL Group Inc. (public utility holding company)*; Director, URS Corporation (engineering design services firm)*. | | 38 |
MSF-17
Metropolitan Series Fund, Inc.
Directors and Officers—(Continued)
| | | | | | | | |
Name, Address and Age | | Current
position(s)
with Fund | | Position(s)
held since | | Principal occupations
over past five years, including other directorships(2) | | Number of
Portfolios in
Fund Complex
Overseen by
Director(3) |
Nancy Hawthorne Age: 57 | | Director | | 2003 | | Chief Executive Officer, Clerestory LLC (corporate financial advisor); Director, Avid Technologies (computer software company)*; formerly, Chairman of the Board of Avid Technologies; formerly, Board of Advisors, L. Knife & Sons, Inc. (beverage distributor); formerly, Trustee, New England Zenith Fund (“Zenith Fund”)**; formerly, Chief Executive Officer and Managing Partner, Hawthorne, Krauss and Associates (corporate financial advisor); formerly, Chief Financial Officer and Executive Vice President, Continental Cablevision, subsequently renamed MediaOne (cable television company); formerly, Director, Life F/X, Inc.; formerly, Chairman of the Board, WorldClinic (distance medicine company); formerly, Director, Perini Corporation (construction company)*; formerly, Director, CGU (property and casualty insurance company); formerly, Director, Beacon Power Corporation (energy company)*. | | 38 |
| | | | |
John T. Ludes Age: 72 | | Director | | 2003 | | President, LFP Properties (consulting firm); Formerly, Trustee, Zenith Fund**; formerly, Vice Chairman, President and Chief Operating Officer, Fortune Brands/American Brands (global conglomerate); formerly, President and CEO, Acushnet Company (athletic equipment company). | | 38 |
Officers(1)
| | | | | | | | |
Name and address | | Age | | Current
position(s)
with Fund | | Position(s)
held since | | Principal occupations over past five years(2) |
| Jeffrey L. Bernier | | 37 | | Senior Vice President | | 2008 | | Vice President (since 2008), MetLife, Inc.; Vice President (since 2008), MetLife; Senior Vice President (since 2008), MetLife Advisers; formerly, Director and Senior Investment Analyst (2004 to 2007), John Hancock Financial Services; formerly, Assistant Vice President (2000 to 2001), Wachovia Securities. |
| | | | |
| Alan C. Leland | | 56 | | Senior Vice President | | 2005 | | Treasurer and Chief Financial Officer, MetLife Advisers, LLC; Treasurer (since 2005), Met Investors Advisory, LLC; Vice President (since 2004), Met Investors Advisory, LLC; Vice President (since 2003), MetLife, Inc.; Vice President, MetLife; Senior Vice President, NELICO. |
| | | | |
| Peter Duffy | | 53 | | Vice President
and Treasurer | | 2000 | | Senior Vice President, MetLife Advisers; Second Vice President (since 2003), NELICO; Vice President, MetLife (since 2004); Vice President (since 2004), MetLife, Inc.; formerly, Vice President and Treasurer, Zenith Fund**. |
| | | | |
| Jeffrey P. Halperin | | 41 | | Chief
Compliance Officer | | 2007 | | Vice President (since 2006), MetLife, Inc.; Vice President (since 2006), MetLife; Chief Compliance Officer (since 2006), Met Investors Series Trust, MetLife Advisers, Met Investors Advisory, LLC and MetLife Investment Advisors Company, LLC. |
| * | Indicates a directorship with a registered investment company or a company subject to the reporting requirements of the Securities Exchange Act of 1934, as amended. |
| ** | The Zenith Fund deregistered with the Securities and Exchange Commission (“SEC”) in 2004. |
| (†) | Served as a trustee, director and/or officer of one or more of the following companies, each of which had a direct or indirect advisory relationship with MetLife Advisers or its affiliates prior to January 31, 2005: State Street Research Financial Trust, State Street Research Income Trust, State Street Research Money Market Trust, State Street Research Institutional Funds, State Street Research Capital Trust, State Street Research Master Investment Trust, State Street Research Equity Trust, State Street Research Securities Trust and State Street Research Exchange Trust (collectively, the “State Street Research Funds”). |
| (1) | During the period shown, each Director of the Fund served as a Trustee of Metropolitan Series Fund II, a registered investment company that ceased investment operations in June of 2008 and has applied for deregistration under the Investment Company Act of 1940. During this period, each officer of the Fund served in the same position with Metropolitan Series Fund II. |
| (2) | Previous positions during the past five years with the Fund; Met Investors Series Trust; MetLife; MetLife, Inc.; MetLife Advisers; Met Investors Advisory, LLC; Zenith Fund; NELICO; or New England Securities Corporation are omitted if not materially different. |
| (3) | The Fund Complex includes the Fund (38 portfolios) and Met Investors Series Trust (49 portfolios). |
MSF-18
Metropolitan Series Fund, Inc.
MetLife Conservative Allocation Portfolio
Board Approval of Advisory and Subadvisory Agreements
The Fund’s Contract Review Committees of the Board of Directors (the “Board” or the “Directors”) typically meet in early fall to review the Portfolios’ advisory agreements (the “Advisory Agreements”) and subadvisory agreements (the “Subadvisory Agreements,” and, together with the Advisory Agreements, the “Agreements”) and determine whether to recommend that the full Board approve the continuation of the Agreements for an additional one-year period. (Following the initial approval of an Agreement for a new Portfolio or with a new adviser or subadviser, such annual reviews are not required until 2 years following the execution of such Agreement.) After each Committee has made its recommendations, the full Board, including the Independent Directors, determines whether to approve the continuation of each of the Agreements. In addition, the Board, including the Independent Directors, considers matters bearing on the Agreements at most of its other meetings throughout the year and regularly interviews various individuals at MetLife Advisers responsible for the management of the Portfolios. The Directors also interview selected investment managers and other professionals at the subadvisers at various times throughout the year.
The Directors receive all materials that they or MetLife Advisers, the Fund’s investment adviser, and the subadvisers believe to be reasonably necessary for the Directors to evaluate the Agreements and determine whether to approve the continuation of the Agreements. These materials generally include, among other items, (i) information on the investment performance of the Portfolios and the performance of peer groups of funds and the Portfolios’ performance benchmarks, (ii) information on the Portfolios’ advisory and subadvisory fees and other expenses, including information comparing the Portfolios’ expenses to those of peer groups of funds and information about any applicable expense caps and fee “breakpoints,” (iii) sales and redemption data, (iv) information related to the profitability of the Agreements to MetLife Advisers and certain of the subadvisers, and potential “fall-out” or ancillary benefits that MetLife Advisers, the subadvisers or their affiliates may receive as a result of their relationships with the Fund and (v) information obtained through the subadvisers’ responses to certain requests from MetLife Advisers and the Directors and MetLife Advisers’ responses to requests from the Directors. The Directors may also consider other information such as (vi) MetLife Advisers’ and the subadvisers’ financial results and condition, (vii) each Portfolio’s investment objectives and strategies and the size, education and experience of the investment staffs of MetLife Advisers and the relevant subadvisers and their use of technology and external research, (viii) the allocation of the Portfolios’ brokerage, if any, including allocations to brokers affiliated with the subadvisers and the use of “soft” commission dollars to pay Portfolio expenses and to pay for research and other similar services, (ix) the resources devoted to, and the record of compliance with, the Portfolios’ investment policies and restrictions, policies on personal securities transactions and other compliance policies, (x) the responses of MetLife Advisers, the subadvisers and/or their affiliates to certain legal and regulatory proceedings and (xi) the economic outlook generally and for the mutual fund industry in particular. Throughout the process, the Directors have the opportunity to ask questions of and request additional materials from MetLife Advisers and the subadvisers.
Following meetings of each Contract Review Committee on September 10, 2008, the Board, including the Independent Directors, at its November 6-7, 2008 meeting, approved the continuation through December 31, 2009 of the Advisory Agreements for each Portfolio of the Fund and the Subadvisory Agreements for each Portfolio other than the Zenith Equity Portfolio and Asset Allocation Portfolios (which do not have subadvisers) and the Van Eck Global Natural Resources Portfolio, Met/Dimensional International Small Cap Portfolio and Loomis Sayles Small Cap Growth Portfolio (formerly known as the Franklin Templeton Small Cap Growth Portfolio). The Agreements approved for continuation are referred to below as the “Continued Agreements.”
In considering whether to approve the continuation of the Continued Agreements, the Directors, including the Independent Directors, did not identify any single factor as determinative, and each weighed the various factors as he or she deemed appropriate. The Directors considered the following matters in connection with their approval of the Continued Agreements:
The nature, extent and quality of the services provided to the relevant Portfolios under the Continued Agreements. The Directors considered the nature, extent and quality of the services provided by MetLife Advisers, the relevant subadvisers (if any) and their affiliates (each, an “Adviser,” and, collectively, the “Advisers”) to the relevant Portfolios pursuant to the Continued Agreements and the resources dedicated to these Portfolios by the Advisers. In particular, the Directors considered the Advisers’ abilities to attract and retain highly qualified investment professionals. With respect to MetLife Advisers, the Directors considered (for each Portfolio other than the Zenith Equity and Asset Allocation Portfolios) that MetLife Advisers is (i) ultimately responsible for the performance of such Portfolios; (ii) ultimately responsible for the establishment of the investment strategies of each such Portfolio, primarily through its recommendations to the Board regarding the hiring and selection of subadvisers; (iii) responsible for the hiring and selection, subject to Board approval, of subadvisers; and (iv) responsible for maintaining a program of Subadviser oversight reasonably designed to ensure that the subadvisers have reasonable compliance policies and procedures in place. The Directors also considered that MetLife Advisers provides a full range of day-to-day administrative services for the Portfolios involving all aspects of such Portfolios’ day-to-day operations (other than portfolio management). With respect to the Zenith Equity and Asset Allocation Portfolios, the Directors considered both the portfolio management services and the administrative services provided by MetLife Advisers. After reviewing
MSF-19
Metropolitan Series Fund, Inc.
MetLife Conservative Allocation Portfolio
Board Approval of Advisory and Subadvisory Agreements—(Continued)
these and related factors, the Directors concluded, within the context of their overall conclusions regarding each of the Continued Agreements, that the nature, extent and quality of services provided supported the renewal of these Agreements.
Investment performance of the relevant Portfolios. The Directors reviewed information about the performance of the relevant Portfolios over various time periods, including information prepared by an independent third party that compared the performance of the Portfolios to the performance of peer groups of funds and performance benchmarks. The Directors also reviewed a description of the third party’s methodology for identifying a Portfolio’s peer group(s) for purposes of performance and expense comparisons.
In the case of each relevant Portfolio that had performance that lagged its peer group(s) for certain periods, the Directors concluded that other factors relevant to performance were sufficient, in light of other considerations, to warrant renewal of the Continued Agreements relating to such Portfolio. These factors varied from Portfolio to Portfolio, but included one or more of the following: (i) that such Portfolio’s performance, although lagging in certain recent periods, was stronger over the longer term; (ii) that the underperformance was attributable, to a significant extent, to investment decisions that were reasonable and consistent with the Portfolio’s investment objective(s) and policies and that the Portfolio was performing within the range of reasonable expectations, given market conditions and the Portfolio’s investment objective(s) and policies; (iii) that the Portfolio’s performance was competitive when compared to other relevant performance benchmarks or peer groups; and (iv) that MetLife Advisers and/or the relevant subadviser (if any) had taken or was taking steps designed to help improve the Portfolio’s investment performance (including, in the case of certain Portfolios, that MetLife Advisers was formulating possible proposals, for presentation to the Board in November 2008, to replace the Portfolio’s subadviser or to merge the Portfolio into another Portfolio with a similar investment objective and better investment performance).
The Directors also considered the investment performance of the Advisers and their reputations generally, the historical responsiveness of the Advisers to Director concerns about performance and the willingness of the Advisers to take steps intended to improve performance.
After reviewing these and related factors, the Directors concluded, within the context of their overall conclusions regarding each of the Continued Agreements, that the investment performance of each relevant Portfolio and Adviser was sufficient, in light of other considerations, to warrant the renewal of the Continued Agreements.
The costs of the services to be provided and profits to be realized by the Advisers and their affiliates from their relationships with the Portfolios. The Directors considered the fees charged by MetLife Advisers to the Portfolios for advisory services and, with respect to the subadvised Portfolios, by such subadvisers to MetLife Advisers for subadvisory services (such advisory and subadvisory fees (if any), collectively, “Fees”), as well as the total expense levels of the Portfolios. This information included comparisons (provided by an independent third party) of the Portfolios’ advisory fees and total expense levels to those of their peer groups. In evaluating Fees for the relevant Portfolios, the Directors also took into account the demands, complexity and quality of the investment management services provided to each Portfolio. The Directors considered MetLife Advisers’ recommendations regarding reductions in Fee rates, implementation of Fee breakpoints and institution of Fee waivers and expense caps.
The Directors also considered the compensation directly or indirectly received by the Advisers and their affiliates from their relationships with the relevant Portfolios. The Directors reviewed information relating to the profits received by MetLife Advisers, certain of the subadvisers and their affiliates as a result of their relationships with the relevant Portfolios, and information about the allocation of expenses used to calculate profitability. When reviewing profitability, the Directors also considered the performance of the relevant Portfolios, the expense levels of such Portfolios and whether the relevant Advisers had implemented breakpoints, fee waivers and/or expense caps with respect to such Portfolios.
After reviewing these and related factors, the Directors concluded, within the context of their overall conclusions regarding each of the Continued Agreements, that the Fees charged to each of the relevant Portfolios were fair and reasonable, and that the information provided regarding costs of these services generally, and the related profitability (if known) to the relevant Advisers of their relationships with the relevant Portfolios, supported the renewal of the Continued Agreements.
Economies of Scale. The Directors considered the existence of any economies of scale in the provision of services by the Advisers and whether those economies were shared with the relevant Portfolios through breakpoints in their advisory fees or other means, such as expense caps, fee waivers or relatively low levels of fees. The Directors noted that most of the relevant Portfolios benefited or will benefit from breakpoints, expense caps and/or fee waivers with respect to their advisory fees. In considering these issues, the Directors also took into consideration information relating to the costs of the services provided and the profitability to MetLife Advisers, the relevant subadvisers (if any) and each of their affiliates of their relationships with the relevant Portfolios, as discussed above.
MSF-20
Metropolitan Series Fund, Inc.
MetLife Conservative Allocation Portfolio
Board Approval of Advisory and Subadvisory Agreements—(Continued)
After reviewing these and related factors, the Directors concluded, within the context of their overall conclusions regarding each of the Continued Agreements, that the extent to which economies of scale were shared with the relevant Portfolios supported the renewal of such Agreements.
Other Factors. The Directors also considered other factors, which included but were not limited to the following:
| | • | | the extent to which each relevant Portfolio operated in accordance with its investment objective, and its record of compliance with its investment restrictions and the compliance programs of the Fund and the Advisers. They also considered the compliance-related resources the Advisers and their affiliates provide to the relevant Portfolios; |
| | • | | the nature, quality, cost and extent of administrative and shareholder services performed by MetLife Advisers and its affiliates under the Advisory Agreements; and |
| | • | | so-called “fall-out benefits” to the Advisers, such as the engagement of their affiliates to provide distribution, brokerage and transfer agency services to the Portfolios, and the benefits of research made available to the relevant Advisers by reason of brokerage commissions generated by the relevant Portfolios’ securities transactions. The Directors also considered the possible conflicts of interest associated with these fall-out and other benefits, and the reporting and other processes in place to disclose and monitor these possible conflicts of interest. |
Based on their evaluation of all factors that they deemed to be material, including those factors described above, and assisted by the advice of independent counsel, the Directors, including the Independent Directors, concluded that each of the Continued Agreements should be continued through December 31, 2009.
MSF-21
A description of the policies and procedures that the Fund uses to determine how to vote proxies relating to portfolio securities is available (i) without charge, upon request, by calling (800) 638-7732 and (ii) on the Securities and Exchange Commission’s (the “SEC”) website at http://www.sec.gov.
Information regarding how the Fund voted proxies relating to portfolio securities during the most recent twelve-month period ended December 31, 2008 is available (i) without charge, upon request, by calling (800) 638-7732 and (ii) on the SEC’s website at http://www.sec.gov.
The Fund’s Statement of Additional Information includes additional information about the Directors of the Fund and is available (i) without charge, upon request, by calling (800) 638-7732 and (ii) on the SEC’s website at http://www.sec.gov.
The Fund files with the SEC a complete schedule of its portfolio holdings, as of the close of the first and third quarters of its fiscal year, on “Form N-Q”. These filings are available on the SEC’s website at www.sec.gov and may be reviewed and copied at the SEC’s Public Reference Room in Washington, DC. (Call 1-800-SEC-0330 for information on the operation of the Public Reference Room.)
MSF-22
Simplify your life…
with MetLife eDelivery® while helping MetLife preserve the planet’s natural resources.
(see details on inside cover)
| | |
Metropolitan Series Fund, Inc. MetLife Conservative to Moderate Allocation Portfolio Annual Report | | December 31, 2008 |
NOT PART OF THE ANNUAL REPORT
Letter from the President
February 1, 2009
Letter to Policy Holders:
2008 was an extraordinary year in the capital markets around the world and for the global economy. Energy prices rose to record levels early in the year before falling by two-thirds by year-end. A credit crisis that began with concerns about sub-prime mortgages led to massive changes in the financial landscape with government takeovers, forced sales, and outright failures of a number of large, once venerable firms.
While bonds as measured by the Barclays Capital U.S. Aggregate Bond Index (formerly known as, Lehman Brothers U.S. Aggregate Bond Index) were up 5.2% for the year in response to declining interest rates, there were large differences in the total returns of the various sectors of the bond market. U.S. treasury securities were up over 13% as frightened investors sought refuge in what they perceived to be the safest and most liquid investments. In contrast, investment grade corporate securities lost nearly 5% as credit spreads widened and below investment grade or high yield bonds fell over 26%.
In response to the growing credit crisis and the weakening economy, common stocks fell sharply across all regions, styles, and capitalizations. As measured by the Standard and Poor’s 500, U.S. common stocks fell 37% for the year, the worst calendar year decline since the 1930s. Foreign stocks were down even more with the MSCI EAFE Index down 43% for the year.
On the following pages, you will find a complete review of your Portfolio and its investment performance.
MetLife is committed to building your financial freedom. We appreciate your trust and will continue to focus our efforts on meeting your investment needs.
Sincerely,
Elizabeth M. Forget
President, Metropolitan Series Fund, Inc.
Metropolitan Series Fund, Inc.
MetLife Conservative to Moderate Allocation Portfolio
Managed by MetLife Advisers, LLC
Portfolio Manager Commentary*
PORTFOLIO PERFORMANCE
For the twelve-month period ended December 31, 2008, the Class A shares of the MetLife Conservative to Moderate Allocation Portfolio returned -21.4% compared to the -37.3% return of the Wilshire 5000 Stock Index1 and the 2.4% return of the Barclays Capital U.S. Universal Bond Index2 . Considering that no single index or benchmark can accurately capture the multiple asset class design of the Portfolio, we have created a blended benchmark comprised of several indices for use in portfolio design and evaluation purposes. Specifically, the blended benchmark for the MetLife Conservative to Moderate Allocation Portfolio currently consists of a 12% allocation to the Barclays Capital 1 to 3 Year Government Bond Index3, a 48% allocation to the Barclays Capital U.S. Universal Bond Index, a 30% allocation to the Wilshire 5000 Stock Index, and a 10% location to the Morgan Stanley Capital International EAFE Index4. During the twelve-month period ended December 31, 2008, the blended benchmark returned -15.6%.
ECONOMIC AND MARKET REVIEW
The first half of 2008 was highlighted by growing concerns about the economy due to the emerging credit crisis, rising unemployment, falling consumer confidence, a struggling housing sector, and skyrocketing food and energy prices. The forced sale of Bear Stearns in March to JP Morgan at first appeared to be an isolated event, but would prove to be a harbinger of things to come. The Federal Reserve was aggressive early in the year to revive the economy when they cut their target rate several times to bring it down from 4.25% to 2.00% by early May. They held rates steady in subsequent meetings through the summer as they tried to balance the danger of the economy falling into a recession against their desire to control growing inflation pressures.
However, the evidence of a weakening economy (especially falling real estate prices and the impact of the sub-prime mortgage crisis) gained momentum during the summer, climaxing in the extraordinary events of September and October that saw the government’s provision of credit assistance to Fannie Mae and Freddie Mac, the bankruptcy of Lehman Brothers, and the failure of Washington Mutual. The U.S. government and governments around the world took massive fiscal and monetary actions to stabilize the capital markets, restore liquidity to the clogged credit pipeline, and to stimulate the economy. These efforts continue as we move into 2009. Although we now know that the recession began a year ago in December 2007, the recession intensified during the last months of 2008: unemployment rose sharply as companies made massive layoffs, housing prices and sales continued to fall, retail sales fell, and, in a bit of good news / bad news, oil prices fell nearly $100 per barrel in response in expectation of lower global demand. The incoming administration of Barack Obama faces what most pundits call the largest economic crisis since the Great Depression.
During the first half of 2008, bond returns fluctuated as investors’ concerns changed from a weakening economy to inflation pressures fueled by soaring energy prices. Bonds eked out modestly positive total return of 1.1% for the January to June period as measured by the Barclays Capital U.S. Aggregate Bond Index5. During the second half of the year, the weak economy drove yields down and credit spreads wider as investors sought refuge in the safety of treasury securities. This resulted in mixed returns for bonds. Treasury bonds returned over 13% for the full year, while investment grade corporate bonds were down nearly 5%. High yield bonds were down over 26% for the year with most of the decline occurring in the second half of the year. While most credit based bonds recovered somewhat in December, it was not enough to reverse the earlier losses.
U.S. common stocks suffered their worst calendar year decline in over seventy years during 2008 as measured by the -37.0% return of the Standard & Poor’s 500 Index6. Growing expectations for a deep and long recession and a sharp drop in corporate earnings drove stock prices lower. The total collapse of several high profile financial firms pulled the indices down further. While there was very little difference in the return by style within large cap stocks, growth fell more than value at the mid cap and small cap segments. There was little difference in return by capitalization. By sector, Financials and Materials were down the most, while Consumer Staples held up better on a relative basis. Energy, which was up nearly 9% in the first half of the year, fell 40% in the second half to finish the year down almost 35%. Foreign stocks were also down sharply for the year, falling over 43% as measured by the MSCI EAFE Index. Emerging markets were down 53.3% as measured by the MSCI Emerging Markets Index7.
PORTFOLIO REVIEW
The MetLife Conservative to Moderate Allocation Portfolio is a “fund of funds” consisting of other portfolios of the Met Investors Series Trust and the Metropolitan Series Fund with a broad allocation goal of 40% in equities and 60% in fixed income. The most significant change in strategy during the first half of 2008 was an increase in the asset class goal for foreign stocks from 20% of total equities to 25% of total equities. For this Portfolio, this resulted in a change in the goal for foreign stocks from 8% to 10%. There were also several small adjustments to the underlying portfolio targets that were part of the annual review and restructuring. We initiated positions in two new portfolios during the fourth quarter to add further diversification: a 1% position in the Met/Dimensional International Small Company Portfolio and a 1% position in the Van Eck Global Natural Resources Portfolio.
The Portfolio was structured to be diversified across a wide variety of asset classes to add value over the long term. However, for most of 2008, investors shunned risk and rewarded only what they perceived to be the safest investments.
The Portfolio’s fixed income portfolios had a significant negative impact on relative performance as the Portfolio’s underlying bond portfolios held higher positions in credit based bonds (and less in Treasury securities) than is held in the broad bond indices. In partic-
MSF-2
Metropolitan Series Fund, Inc.
MetLife Conservative to Moderate Allocation Portfolio
Managed by MetLife Advisers, LLC
Portfolio Manager Commentary*
ular, the Lord Abbett Bond Debenture Portfolio, the Western Asset Management Strategic Bond Opportunities Portfolio, and the BlackRock High Yield Portfolio were down sharply relative to the broad index because of their high yield bond and other credit exposure. Overall high yield exposure was about 8% of the portfolio, which slightly higher than our target of 7%. WAM Strategic was also adversely impacted by its significant exposure to Non-Agency Mortgage Backed Securities, which were down sharply in response to the credit crisis. The PIMCO Inflation Protected Bond Portfolio, which did well in the first half when inflation expectations were still prevalent, had a large negative impact in the second half of the year as inflation expectations lessened because of the weak economy and falling oil prices. In fact, during 2008 inflation grew at its lowest rate in over fifty years.
Within the equity sector, a cumulative overweight in the Financials and Materials sectors and an underweight to the Consumer Staples sector detracted from relative performance during the full year. Certain Portfolios led a positive impact on relative performance. Dreman Small Cap Value Portfolio, although down over 25% for the year, held up better due to an overweight in the Consumer Staples sector and good overall stock selection, especially in the Health Care sector. BlackRock Large Cap Value Portfolio added to relative good performance mostly due to good stock selection in the Financials sector by avoiding many of the high profile blowups. MFS Value Portfolio outperformed, helped by an underweight and good stock selection in the generally struggling Information Technology sector. They avoided poorer performing Apple, Google, and Mircosoft and owned better performing alternatives such as Accenture, Oracle, and IBM.
The Legg Mason Value Equity Portfolio was hurt in the first half of the year by its lack of exposure to the strong energy sector, but it continued to struggle in the second half even though the portfolio managers’ concerns about the sustainability of the high energy prices proved to be correct. The portfolio was also hurt by its exposure to several of the high profile financial stocks. Neuberger Berman Mid Cap Value Portfolio, one of the strongest performing portfolios in the first half of the year due to its energy exposure, struggled in the second half of the year for the same reason. It also was hurt by its exposure to Bear Stearns and poor overall stock selection in the Industrial sector. For example Chicago Bridge & Iron, Terex Corp., and McDermott International were all large positions that each fell over 70% for the year. FI Mid Cap Opportunities Portfolio was also hurt by its energy exposure in the second half and by overall poor stock selection, especially in the Financials (holding Brazilian brokerage firm BM&F Bovespa) and Industrials (holding engineering firm Flowserve) sectors.
Despite the recent poor performance of the Portfolio, we will continue to take a long term view to provide a well diversified portfolio to meet long term objectives.
* The views expressed above are those of the advisory firm as of December 31, 2008 and are subject to change based on market and other conditions. Information about the Portfolio’s holdings, asset allocation, industry allocation, or country diversification is historical and is not an indication of future Portfolio composition, which will vary. The performance of any index mentioned in this commentary has not been adjusted for ongoing management, distribution and operating expenses, and sales charges applicable to mutual fund investments. Direct investment in any index is not possible.
1 The Wilshire 5000 Equity Index measures the performance of all U.S. headquartered equity securities with readily available price data.
2 The Barclays Capital U.S. Universal Bond Index (formerly, Lehman Brothers U.S. Universal Bond Index) represents the union of the U.S. Aggregate Index, the U.S. High-Yield Corporate Index, the 144A Index, the Eurodollar Index, the Emerging Markets Index, the non-EIRSA portion of the Commercial Mortgage Backed Securities Index and the Commercial Mortgage Backed Securities High Yield Index. The index itself remains unchanged since Barclays assumed responsibility for the index from Lehman.
3 The Barclays Capital 1 to 3 Year Government Bond Index (formerly, Lehman Brothers 1 to 3 Year Government Bond Index) includes most obligations of the U.S Treasury, agencies and quasi-federal corporations having maturities between one to three years. The index itself remains unchanged since Barclays assumed responsibility for the index from Lehman.
4 The Morgan Stanley Capital International Europe, Australasia and Far East Index (“MSCI EAFE Index”) is an unmanaged free float-adjusted market capitalization index that is designed to measure developed market equity performance, excluding the U.S. & Canada.
5 Barclays Capital U.S. Aggregate Bond Index (formerly, Lehman Brothers U.S Aggregate Bond Index) includes most obligations of the U.S. Treasury, agencies and quasi-federal corporations, most publicly issued investment grade corporate bonds and most bonds backed by mortgage pools of GNMA, FNMA and FHLMC. The index itself remains unchanged since Barclays assumed responsibility for the index from Lehman.
6 The Standard & Poor’s (S&P) 500® Composite Stock Price Index is an unmanaged index representing the performance of 500 major companies, most of which are listed on the New York Stock Exchange.
7 The MSCI Emerging Markets Index is a free float-adjusted market capitalization index that is designed to measure equity market performance of emerging markets. As of January 2009 the MSCI Emerging Markets Index consisted of the following 23 emerging market country indices: Argentina, Brazil, Chile, China, Colombia, Czech Republic, Egypt, Hungary, India, Indonesia, Israel, Korea, Malaysia, Mexico, Morocco, Peru, Philippines, Poland, Russia, South Africa, Taiwan, Thailand, and Turkey.
MSF-3
Metropolitan Series Fund, Inc.
MetLife Conservative to Moderate Allocation Portfolio
A $10,000 INVESTMENT COMPARED TO
THE WILSHIRE 5000 STOCK INDEX AND THE BARCLAYS CAPITAL U.S. UNIVERSAL BOND INDEX

Average Annual Returns as of December 31, 2008
| | | | | | | | | | | | |
| | | MetLife Conservative to Moderate
Allocation Portfolio | | | Wilshire 5000
Stock Index | | | Barclays Capital U.S.
Universal Bond Index | |
| | | Class A | | | Class B | | | |
| 1 Year | | -21.4 | % | | -21.6 | % | | -37.3 | % | | 2.4 | % |
| Since Inception | | -1.0 | | | -1.3 | | | -4.2 | | | 4.3 | |
Performance numbers are net of all Portfolio expenses but do not include any insurance, sales, or administrative charges of variable annuity or life insurance contracts or any additional expenses that participants in certain eligible qualified plans may bear relating to the operations of their plans. If these charges were included, the returns would be lower.
Inception date of the Class A and Class B shares is 5/2/05. Index since inception return is based on the Portfolio’s inception date.
This information represents past performance and is not indicative of future results. Investment return and principal value may fluctuate so that shares, upon redemption, may be worth more or less than the original cost.
PORTFOLIO COMPOSITION
as of December 31, 2008
Top Holdings
| | |
| | | % of Total
Net Assets |
Met Investors Series Trust—PIMCO Total Return Portfolio, (Class A) | | 22.4% |
Metropolitan Series Fund, Inc.—Western Asset Mgt. Strategic Bond Opportunities Portfolio, (Class A) | | 14.9% |
Metropolitan Series Fund, Inc.—BlackRock Bond Income Portfolio, (Class A) | | 10.9% |
Metropolitan Series Fund, Inc.—Davis Venture Value Portfolio, (Class A) | | 4.9% |
Metropolitan Series Fund, Inc.—BlackRock Large Cap Value Portfolio, (Class A) | | 4.1% |
Metropolitan Series Fund, Inc.—Western Asset Mgt. U.S. Government Portfolio, (Class A) | | 3.9% |
Met Investors Series Trust—MFS Research International Portfolio, (Class A) | | 3.2% |
Metropolitan Series Fund, Inc.—Met Life Stock Index Portfolio, (Class A) | | 3.0% |
Met Investors Series Trust—PIMCO Inflation Protected Bond Portfolio, (Class A) | | 3.0% |
Metropolitan Series Fund, Inc.—T. Rowe Price Large Cap Growth Portfolio, (Class A) | | 2.9% |
MSF-4
Metropolitan Series Fund, Inc.
Shareholder Expense Example
As a shareholder of the Fund, you incur ongoing costs, including management fees; distribution and service (12b-1) fees; and other fund expenses. This example is intended to help you understand your ongoing costs (in dollars) (referred to as “expenses”) of investing in the Portfolio and compare these costs with the ongoing costs of investing in other mutual funds. The example is based on an investment of $1,000 invested at the beginning of the period and held for the entire period, July 1, 2008 through December 31, 2008.
Actual Expenses
The first line for each share class of the Portfolio in the table below provides information about actual account values and actual expenses. You may use the information in this line, together with the amount you invested in the particular share class of the Portfolio, to estimate the expenses that you paid over the period. Simply divide your account value by $1,000 (for example, an $8,600 account value divided by $1,000=8.6), then multiply the result by the number in the first line under the heading entitled “Expenses Paid During Period” to estimate the expenses you paid on your account during this period.
Hypothetical Example for Comparison Purposes
The second line for each share class of the Portfolio in the table below provides information about hypothetical account values and hypothetical expenses based on the Portfolio’s actual expense ratio and an assumed rate of return of 5% per year before expenses, which is not the Portfolio’s actual return. The hypothetical account values and expenses may not be used to estimate the actual ending account balance or expenses you paid for the period. You may use this information to compare the ongoing costs of investing in the Portfolio and other funds. To do so, compare this 5% hypothetical example with the 5% hypothetical examples that appear in the shareholder reports of the other funds.
Please note that the expenses shown in the table are meant to highlight your ongoing costs only and do not reflect any fees or charges of your variable insurance product or any additional expenses that participants in certain eligible qualified plans may bear relating to the operations of their plan. Therefore, the second line for each share class in the table is useful in comparing ongoing costs only, and will not help you determine the relative total costs of owning different funds. In addition, if these other costs were included, your costs would have been higher.
| | | | | | | | | | | | | | |
Portfolio | | | | Annualized
Expense
Ratio | | | Beginning
Account Value
July 1,
2008 | | Ending
Account Value
December 31,
2008 | | Expenses Paid
During Period*
July 1, 2008
to
December 31,
2008 |
MetLife Conservative to Moderate Allocation—Class A(a)(b) | | Actual | | 0.72 | % | | $ | 1,000.00 | | $ | 829.61 | | $ | 3.31 |
| | Hypothetical | | 0.72 | % | | $ | 1,000.00 | | $ | 1,021.47 | | $ | 3.66 |
| | | | | |
MetLife Conservative to Moderate Allocation—Class B(a)(b) | | Actual | | 0.97 | % | | $ | 1,000.00 | | $ | 828.65 | | $ | 4.46 |
| | Hypothetical | | 0.97 | % | | $ | 1,000.00 | | $ | 1,020.20 | | $ | 4.93 |
* Expenses paid are equal to the Portfolio’s annualized expense ratio for the most recent six month period, as shown above, multiplied by the average account value over the period, multiplied by the number of days in the most recent fiscal half-year, divided by 366 (to reflect the the one-half year period).
(a) The annualized expense ratio shown reflects an expense agreement between MetLife Advisers, LLC and the Portfolio as described under Expense Agreement in Note 4 to the Financial Statements.
(b) The annualized expense ratio reflects the expenses of both the Portfolio and the underlying Portfolios in which it invests.
MSF-5
Metropolitan Series Fund, Inc.
MetLife Conservative To Moderate Allocation Portfolio
Schedule of Investments as of December 31, 2008
Mutual Funds—100.0%
| | | | | |
| Security Description | | Shares | | Value* |
| | | | | |
| |
Affiliated Investment Companies—100.0% | | | |
Met Investors Series Trust—BlackRock High Yield Portfolio, (Class A) | | 2,314,365 | | $ | 13,446,459 |
Met Investors Series Trust—BlackRock Large Cap Core Portfolio, (Class A) | | 2,189,515 | | | 14,604,066 |
Met Investors Series Trust—Clarion Global Real Estate Portfolio, (Class A) | | 961,582 | | | 7,115,708 |
Met Investors Series Trust—Dreman Small Cap Value Portfolio, (Class A) | | 1,520,936 | | | 14,905,175 |
Met Investors Series Trust—Harris Oakmark International Portfolio, (Class A) | | 1,746,723 | | | 14,969,419 |
Met Investors Series Trust—Lazard Mid-Cap Portfolio, (Class A) | | 1,024,154 | | | 7,097,390 |
Met Investors Series Trust—Legg Mason Value Equity Portfolio, (Class A) | | 2,885,569 | | | 13,244,761 |
Met Investors Series Trust—Lord Abbett Bond Debenture Portfolio, (Class A) | | 1,460,443 | | | 14,224,716 |
Met Investors Series Trust—Met/AIM Small Cap Growth Portfolio, (Class A) | | 1,706,809 | | | 14,268,922 |
Met Investors Series Trust—MFS Research International Portfolio, (Class A) | | 3,105,348 | | | 23,010,632 |
Met Investors Series Trust—PIMCO Inflation Protected Bond Portfolio, (Class A) | | 2,162,525 | | | 21,257,626 |
Met Investors Series Trust—PIMCO Total Return Portfolio, (Class A) | | 13,827,348 | | | 160,397,240 |
Metropolitan Series Fund, Inc.—BlackRock Bond Income Portfolio, (Class A) | | 763,786 | | | 78,288,115 |
Metropolitan Series Fund, Inc.—BlackRock Large Cap Value Portfolio, (Class A) | | 3,389,683 | | | 29,354,653 |
Metropolitan Series Fund, Inc.—Davis Venture Value Portfolio, (Class A) | | 1,610,462 | | | 34,995,340 |
Metropolitan Series Fund, Inc.—FI Mid Cap Opportunities Portfolio, (Class A) | | 711,718 | | | 6,704,379 |
Metropolitan Series Fund, Inc.—Jennison Growth Portfolio, (Class A) | | 1,802,088 | | | 14,074,307 |
Metropolitan Series Fund, Inc.—Julius Baer International Stock Portfolio, (Class A) | | 1,914,806 | | | 14,935,487 |
Metropolitan Series Fund, Inc.—Met/Dimensional International Small Co. Portfolio, (Class A) | | 694,395 | | | 7,055,049 |
Metropolitan Series Fund, Inc.—MetLife Stock Index Portfolio, (Class A) | | 968,795 | | | 21,323,183 |
Metropolitan Series Fund, Inc.—MFS Value Portfolio, (Class A) | | 789,186 | | | 7,315,757 |
Metropolitan Series Fund, Inc.—Neuberger Berman Mid Cap Value Portfolio, (Class A) | | 1,311,422 | | | 14,425,645 |
Metropolitan Series Fund, Inc.—Russell 2000 Index Portfolio, (Class A) | | 819,609 | | | 7,286,325 |
Metropolitan Series Fund, Inc.—T. Rowe Price Large Cap Growth Portfolio, (Class A) | | 2,327,032 | | | 21,059,637 |
Metropolitan Series Fund, Inc.—Van Eck Global Natural Resources Portfolio, (Class A) | | 695,227 | | | 6,750,655 |
Metropolitan Series Fund, Inc.—Western Asset Mgt. Strategic Bond Opportunities Portfolio, (Class A) | | 10,355,859 | | | 106,976,028 |
| | | | | | |
| Security Description | | Shares | | Value* | |
| | | | | | |
| |
Affiliated Investment Companies—(Continued) | | | | |
Metropolitan Series Fund, Inc.—Western Asset Mgt. U.S. Government Portfolio, (Class A) | | 2,337,978 | | $ | 27,868,700 | |
| | | | | | |
Total Mutual Funds
(Identified Cost $908,621,174) | | | | | 716,955,374 | |
| | | | | | |
Total Investments—100.0%
(Identified Cost $908,621,174) (a) | | | | | 716,955,374 | |
Liabilities in excess of other assets | | | | | (211,048 | ) |
| | | | | | |
| Total Net Assets—100% | | | | $ | 716,744,326 | |
| | | | | | |
| (a) | The aggregate cost of investments for federal income tax purposes as of December 31, 2008 was $920,766,752 and the composition of unrealized appreciation and depreciation of investment securities was $120,305 and $(203,931,683), respectively. |
*See accompanying notes to financial statements.
MSF-6
Metropolitan Series Fund, Inc.
MetLife Conservative To Moderate Allocation Portfolio
The Portfolio adopted the provisions of Statement of Financial Accounting Standards No. 157, “Fair Value Measurements” (FAS 157), effective with the beginning of the Portfolio’s fiscal year. FAS 157 establishes a framework for measuring fair value and expands disclosures about fair value measurements in financial statements. The three levels of the hierarchy under FAS 157 are described below:
Level 1 - quoted prices in active markets for identical securities
Level 2 - other significant observable inputs (including quoted prices for similar securities, interest rates, credit risk, etc.)
Level 3 - significant unobservable inputs (including the Portfolio’s own assumptions in determining the fair value of investments)
The inputs or methodology used for valuing securities are not necessarily an indication of the risk associated with investing in those securities.
The following is a summary of the inputs used to value the Portfolio’s net assets as of December 31, 2008:
| | | | | | |
| Valuation Inputs | | Investments In
Securities | | Other Financial
Instruments* |
Level 1 - Quoted Prices | | $ | 716,955,374 | | $ | 0 |
Level 2 - Other Significant Observable Inputs | | | 0 | | | 0 |
Level 3 - Significant Unobservable Inputs | | | 0 | | | 0 |
Total | | $ | 716,955,374 | | $ | 0 |
* Other financial instruments are derivative instruments not reflected in the Schedule of Investments, such as futures, forwards, swap contracts and written options, which are valued based on the unrealized appreciation/depreciation on the instrument.
MSF-7
Metropolitan Series Fund, Inc.
MetLife Conservative To Moderate Allocation Portfolio
Statement of Assets & Liabilities
December 31, 2008
| | | | | | | |
Assets | | | | | | | |
Investments at value (a) | | | | | $ | 716,955,374 | |
Receivable for: | | | | | | | |
Fund shares sold | | | | | | 769,635 | |
| | | | | | | |
Total Assets | | | | | | 717,725,009 | |
Liabilities | | | | | | | |
Payable for: | | | | | | | |
Securities purchased | | $ | 452,376 | | | | |
Fund shares redeemed | | | 317,259 | | | | |
Accrued expenses: | | | | | | | |
Management fees | | | 54,062 | | | | |
Service and distribution fees | | | 134,503 | | | | |
Other expenses | | | 22,483 | | | | |
| | | | | | | |
Total Liabilities | | | | | | 980,683 | |
| | | | | | | |
Net Assets | | | | | $ | 716,744,326 | |
| | | | | | | |
Net assets consists of: | | | | | | | |
Capital paid in | | | | | $ | 888,118,243 | |
Undistributed net investment income | | | | | | 26,578,082 | |
Accumulated net realized losses | | | | | | (6,286,199 | ) |
Unrealized depreciation on investments | | | | | | (191,665,800 | ) |
| | | | | | | |
Net Assets | | | | | $ | 716,744,326 | |
| | | | | | | |
| Computation of offering price: | | | | | | | |
Class A | | | | | | | |
Net asset value and redemption price per share ($50,716,574 divided by 5,692,287 shares outstanding) | | | | | $ | 8.91 | |
| | | | | | | |
Class B | | | | | | | |
Net asset value and redemption price per share ($666,027,752 divided by 75,244,519 shares outstanding) | | | | | $ | 8.85 | |
| | | | | | | |
(a) Identified cost of investments | | | | | $ | 908,621,174 | |
| | | | | | | |
Statement of Operations
For the Year Ended December 31, 2008
| | | | | | | | |
Investment Income | | | | | | | | |
Dividends from Underlying Portfolios | | | | | | $ | 23,405,055 | |
| | | | | | | | |
Expenses | | | | | | | | |
Management fees | | $ | 697,015 | | | | | |
Service and distribution fees—Class B | | | 1,752,544 | | | | | |
Directors’ fees and expenses | | | 627 | | | | | |
Custodian | | | 29,124 | | | | | |
Audit and tax services | | | 16,423 | | | | | |
Legal | | | 13,741 | | | | | |
Miscellaneous | | | 7,107 | | | | | |
| | | | | | | | |
Total expenses | | | | | | | 2,516,581 | |
| | | | | | | | |
Net Investment Income | | | | | | | 20,888,474 | |
| | | | | | | | |
Realized and Unrealized Gain (Loss) | | | | | | | | |
| Realized gain (loss) on: | | | | | | | | |
Investments—net | | | (21,268,131 | ) | | | | |
Capital gains distributions from Underlying Portfolios | | | 21,464,024 | | | | 195,893 | |
| | | | | | | | |
| Change in unrealized depreciation on: | | | | | | | | |
Investments—net | | | | | | | (206,268,257 | ) |
| | | | | | | | |
Net loss | | | | | | | (206,072,364 | ) |
| | | | | | | | |
Net Decrease in Net Assets From Operations | | | | | | $ | (185,183,890 | ) |
| | | | | | | | |
See accompanying notes to financial statements.
MSF-8
Metropolitan Series Fund, Inc.
MetLife Conservative To Moderate Allocation Portfolio
Statements of Changes in Net Assets
| | | | | | | | |
| | | Year ended
December 31,
2008 | | | Year ended
December 31,
2007 | |
From Operations | | | | | | | | |
Net investment income | | $ | 20,888,474 | | | $ | 7,229,686 | |
Net realized gain | | | 195,893 | | | | 9,349,580 | |
Change in unrealized appreciation (depreciation) | | | (206,268,257 | ) | | | 2,755,959 | |
| | | | | | | | |
Increase (decrease) in net assets from operations | | | (185,183,890 | ) | | | 19,335,225 | |
| | | | | | | | |
From Distributions to Shareholders | | | | | | | | |
Net investment income | | | | | | | | |
Class A | | | (848,467 | ) | | | 0 | |
Class B | | | (7,444,740 | ) | | | 0 | |
| | | | | | | | |
| | | (8,293,207 | ) | | | 0 | |
| | | | | | | | |
Net realized gain | | | | | | | | |
Class A | | | (729,800 | ) | | | (80,079 | ) |
Class B | | | (7,962,635 | ) | | | (623,334 | ) |
| | | | | | | | |
| | | (8,692,435 | ) | | | (703,413 | ) |
| | | | | | | | |
Total distributions | | | (16,985,642 | ) | | | (703,413 | ) |
| | | | | | | | |
Increase in net assets from capital share transactions | | | 202,443,710 | | | | 406,953,460 | |
| | | | | | | | |
Net increase in net assets | | | 274,178 | | | | 425,585,272 | |
| | |
Net Assets | | | | | | | | |
Beginning of the period | | | 716,470,148 | | | | 290,884,876 | |
| | | | | | | | |
End of the period | | $ | 716,744,326 | | | $ | 716,470,148 | |
| | | | | | | | |
Undistributed Net Investment Income | | | | | | | | |
End of the period | | $ | 26,578,082 | | | $ | 8,234,157 | |
| | | | | | | | |
Other Information:
Capital Shares
Transactions in capital shares were as follows:
| | | | | | | | | | | | | | |
| | | Year ended
December 31, 2008 | | | Year ended
December 31, 2007 | |
| | | Shares | | | $ | | | Shares | | | $ | |
Class A | | | | | | | | | | | | | | |
Sales | | 2,257,659 | | | $ | 23,761,944 | | | 3,514,656 | | | $ | 40,139,033 | |
Reinvestments | | 141,803 | | | | 1,578,267 | | | 6,982 | | | | 80,079 | |
Redemptions | | (2,140,004 | ) | | | (21,592,298 | ) | | (1,330,474 | ) | | | (15,161,664 | ) |
| | | | | | | | | | | | | | |
Net increase | | 259,458 | | | $ | 3,747,913 | | | 2,191,164 | | | $ | 25,057,448 | |
| | | | | | | | | | | | | | |
Class B | | | | | | | | | | | | | | |
Sales | | 28,769,749 | | | $ | 299,371,426 | | | 41,920,624 | | | $ | 476,801,515 | |
Reinvestments | | 1,390,557 | | | | 15,407,375 | | | 54,583 | | | | 623,334 | |
Redemptions | | (11,576,607 | ) | | | (116,083,004 | ) | | (8,448,865 | ) | | | (95,528,837 | ) |
| | | | | | | | | | | | | | |
Net increase | | 18,583,699 | | | $ | 198,695,797 | | | 33,526,342 | | | $ | 381,896,012 | |
| | | | | | | | | | | | | | |
Increase derived from capital share transactions | | | | | $ | 202,443,710 | | | | | | $ | 406,953,460 | |
| | | | | | | | | | | | | | |
See accompanying notes to financial statements.
MSF-9
Metropolitan Series Fund, Inc.
MetLife Conservative To Moderate Allocation Portfolio
Financial Highlights
| | | | | | | | | | | | | | | | |
| | | Class A | |
| | | Year ended December 31, | |
| | | 2008 | | | 2007 | | | 2006 | | | 2005(a) | |
Net Asset Value, Beginning of Period | | $ | 11.61 | | | $ | 11.07 | | | $ | 10.60 | | | $ | 10.00 | |
| | | | | | | | | | | | | | | | |
Income From Investment Operations | | | | | | | | | | | | | | | | |
Net investment income | | | 0.33 | (b) | | | 0.21 | (b) | | | 0.31 | | | | 0.04 | |
Net realized and unrealized gain (loss) of investments | | | (2.77 | ) | | | 0.35 | | | | 0.70 | | | | 0.60 | |
| | | | | | | | | | | | | | | | |
Total from investment operations | | | (2.44 | ) | | | 0.56 | | | | 1.01 | | | | 0.64 | |
| | | | | | | | | | | | | | | | |
Less Distributions | | | | | | | | | | | | | | | | |
Distributions from net investment income | | | (0.14 | ) | | | 0.00 | | | | (0.32 | ) | | | (0.04 | ) |
Distributions from net realized capital gains | | | (0.12 | ) | | | (0.02 | ) | | | (0.22 | ) | | | 0.00 | |
| | | | | | | | | | | | | | | | |
Total distributions | | | (0.26 | ) | | | (0.02 | ) | | | (0.54 | ) | | | (0.04 | ) |
| | | | | | | | | | | | | | | | |
Net Asset Value, End of Period | | $ | 8.91 | | | $ | 11.61 | | | $ | 11.07 | | | $ | 10.60 | |
| | | | | | | | | | | | | | | | |
Total Return (%) | | | (21.4 | ) | | | 5.1 | | | | 9.8 | | | | 6.4 | (c) |
Ratio of operating expenses to average net assets (%) (d) | | | 0.10 | | | | 0.10 | | | | 0.10 | | | | 0.10 | (e) |
Ratio of operating expenses to average net assets without giving effect to the contractual expense agreement would have been (%) (d)(f) | | | N/A | | | | 0.11 | | | | 0.12 | | | | 0.41 | (e) |
Ratio of net investment income to average net assets (%) (g) | | | 3.12 | | | | 1.86 | | | | 2.45 | | | | 1.28 | (e) |
Portfolio turnover rate (%) | | | 23 | | | | 19 | | | | 18 | | | | 3 | (e) |
Net assets, end of period (000) | | $ | 50,717 | | | $ | 63,055 | | | $ | 35,874 | | | $ | 10,457 | |
| | | | | | | | | | | | | | | | |
| | | Class B | |
| | | Year ended December 31, | |
| | | 2008 | | | 2007 | | | 2006 | | | 2005(a) | |
Net Asset Value, Beginning of Period | | $ | 11.53 | | | $ | 11.02 | | | $ | 10.58 | | | $ | 10.00 | |
| | | | | | | | | | | | | | | | |
Income From Investment Operations | | | | | | | | | | | | | | | | |
Net investment income | | | 0.28 | (b) | | | 0.17 | (b) | | | 0.29 | | | | 0.03 | |
Net realized and unrealized gain (loss) of investments | | | (2.72 | ) | | | 0.36 | | | | 0.68 | | | | 0.59 | |
| | | | | | | | | | | | | | | | |
Total from investment operations | | | (2.44 | ) | | | 0.53 | | | | 0.97 | | | | 0.62 | |
| | | | | | | | | | | | | | | | |
Less Distributions | | | | | | | | | | | | | | | | |
Distributions from net investment income | | | (0.12 | ) | | | 0.00 | | | | (0.31 | ) | | | (0.04 | ) |
Distributions from net realized capital gains | | | (0.12 | ) | | | (0.02 | ) | | | (0.22 | ) | | | 0.00 | |
| | | | | | | | | | | | | | | | |
Total distributions | | | (0.24 | ) | | | (0.02 | ) | | | (0.53 | ) | | | (0.04 | ) |
| | | | | | | | | | | | | | | | |
Net Asset Value, End of Period | | $ | 8.85 | | | $ | 11.53 | | | $ | 11.02 | | | $ | 10.58 | |
| | | | | | | | | | | | | | | | |
Total Return (%) | | | (21.6 | ) | | | 4.8 | | | | 9.4 | | | | 6.2 | (c) |
Ratio of operating expenses to average net assets (%) (d) | | | 0.35 | | | | 0.35 | | | | 0.35 | | | | 0.35 | (e) |
Ratio of operating expenses to average net assets without giving effect to the contractual expense agreement would have been (%) (d)(f) | | | N/A | | | | 0.36 | | | | 0.37 | | | | 0.66 | (e) |
Ratio of net investment income to average net assets (%) (g) | | | 2.71 | | | | 1.48 | | | | 1.64 | | | | 1.27 | (e) |
Portfolio turnover rate (%) | | | 23 | | | | 19 | | | | 18 | | | | 3 | (e) |
Net assets, end of period (000) | | $ | 666,028 | | | $ | 653,415 | | | $ | 255,011 | | | $ | 48,388 | |
| (a) | Commencement of operations was May 2, 2005. |
| (b) | Per share amount is based on average shares outstanding during the period. |
| (c) | Periods less than one year are not computed on an annualized basis. |
| (d) | The ratio of operating expenses to average net assets does not include expenses of investment companies in which the Portfolio invests. |
| (e) | Computed on an annualized basis. |
| (f) | See Note 4 of the Notes to Financial Statements. |
| (g) | Recognition of net investment income by the Portfolio is affected by the timing of the declaration of dividends by the Underlying Portfolios in which it invests. |
See accompanying notes to financial statements.
MSF-10
Metropolitan Series Fund, Inc.
MetLife Conservative to Moderate Allocation Portfolio
Notes to Financial Statements—December 31, 2008
Metropolitan Series Fund, Inc. (the “Fund”) is organized as a corporation under the laws of Maryland pursuant to Articles of Incorporation filed on November 23, 1982, as amended, and registered under the Investment Company Act of 1940, as amended (the “1940 Act”), as an open-end investment company. The Fund is a “series” type of mutual fund, which issues separate series of stock. Each series represents an interest in a separate portfolio of Fund investments. The MetLife Conservative to Moderate Allocation Portfolio (the “Asset Allocation Portfolio”) is a non-diversified series of the fund. The Asset Allocation Portfolio operates under a “fund of funds” structure, investing substantially all of its assets in other Portfolios advised by MetLife Advisers, LLC (“MetLife Advisers”) or its affiliates (each, an “Underlying Portfolio,” and, collectively, the “Underlying Portfolios”). Shares in the Fund are not offered directly to the general public and are currently available only to separate accounts established by Metropolitan Life Insurance Company (“MetLife”), New England Life Insurance Company, General American Life Insurance Company (“General American”), The MetLife Investors Group of Insurance Companies, MetLife Insurance Company of Connecticut and other affiliated insurance companies (collectively, the “Insurance Companies”) and to certain eligible qualified retirement plans (“Qualified Plans”), as an investment vehicle for variable life insurance, group annuity or variable annuity products of these insurance companies or Qualified Plans, although not all Portfolios are available to all such separate accounts and Qualified Plans. The Asset Allocation Portfolio’s shares may be divided into different classes. Currently, the classes being offered by the Asset Allocation Portfolio are named Class A and Class B. The classes of the Asset Allocation Portfolio’s shares are identical, except that certain additional charges (Rule 12b-1 fees) are made against Class B shares. Investment income, realized and unrealized capital gains and losses, the common expenses of the Asset Allocation Portfolio and certain Portfolio-level expense reductions, if any, are allocated daily, on a pro rata basis, to each class based on the relative net assets of each class to the total net assets of the Asset Allocation Portfolio.
| 2. | SIGNIFICANT ACCOUNTING POLICIES: |
The preparation of financial statements in conformity with accounting principles generally accepted in the United States of America (“GAAP”) requires management to make estimates and assumptions that affect the reported amounts of assets and liabilities and disclosure of contingent assets and liabilities as of the date of the financial statements and the reported amounts of income and expenses during the reporting period. Actual results could differ from those estimates.
The following is a summary of significant accounting policies consistently followed by the Asset Allocation Portfolio in the preparation of its financial statements. The policies are in conformity with GAAP.
Investment Valuation:
The net asset value of the Asset Allocation Portfolio is calculated based on the net asset values of the Underlying Portfolios in which the Asset Allocation Portfolio invests. The Underlying Portfolios that are series of the Fund will use fair value pricing in the circumstances and manner described below. For more information about the use of fair value pricing by the Underlying Portfolios that are series of Met Investors Series Trust (“MIST”), please refer to the prospectus for such Underlying Portfolios.
The Underlying Portfolios that are series of the Fund are valued as follows:
Debt securities (other than short term obligations with a remaining maturity of sixty days or less) are generally valued on the basis of evaluated or composite bid quotations obtained by independent pricing services and/or brokers and dealers selected by the relevant subadviser pursuant to authorization of the Board of Directors of the Fund (the “Board” or “Directors”). Such quotations take into account appropriate factors such as institutional-sized trading in similar groups of securities, yield, quality, coupon rate, maturity, type of issue, trading characteristics and other data. Short term obligations with a remaining maturity of sixty days or less are valued at amortized cost which approximates fair market value.
Equity securities traded on a national securities exchange or other exchanges are valued at their last sale price on the principal trading market. Equity securities traded on the NASDAQ National Market System are valued at the NASDAQ Official Closing Price (the “NOCP”). The NOCP is the last reported sale price if the last reported sale price falls between the spread of the last reported bid and asked prices. If the last reported bid and asked prices are above the last reported sale price, the NOCP will be the last reported bid price. If the last reported bid and asked prices are below the last reported sale price, the NOCP will be the last reported asked price. Equity securities traded on a national securities exchange or other exchanges or on the NASDAQ National Market System for which there is no reported sale during the day are valued at the last reported bid price. A security that is listed or traded on more than one exchange is valued at the quotation on the exchange determined to be the primary market for that security by the Board or its delegates. If no closing price is available, then such securities are valued by using the last reported bid price. Equity securities traded over-the-counter are valued at the last reported sales price.
MSF-11
Metropolitan Series Fund, Inc.
MetLife Conservative to Moderate Allocation Portfolio
Notes to Financial Statements—December 31, 2008—(Continued)
If no current market value quotation is readily available or reliable for a portfolio security, fair value will be determined in accordance with procedures established by and under the general supervision of the Board. When an Underlying Portfolio uses fair value pricing, it may take into account any factors it deems appropriate. The value of securities used by the Underlying Portfolio to calculate its net asset value may differ from quoted or published prices for the same securities. Fair value pricing involves subjective judgments and the fair value determined for a security may be materially different than the value that could be realized upon the sale of that security.
The Underlying Portfolios expect to use fair value pricing for securities primarily traded on U.S. exchanges only under very limited circumstances. For example, the Underlying Portfolio may use fair value pricing if the exchange on which a security is traded closes early or trading in the security is suspended.
Securities traded primarily on an exchange outside of the United States which closes before the close of the New York Stock Exchange will be valued at the last sales price on that non-U.S. exchange. Securities traded primarily on an exchange outside of the United States for which there is no reported sale during the day are valued at the mean between the last reported bid and asked prices. However, because most foreign markets close well before the Underlying Portfolio values its securities (typically at 4 p.m. Eastern Time), the earlier close of these foreign markets gives rise to the possibility that significant events, including broad market moves, may have occurred after these foreign markets close but before the Underlying Portfolio values its securities. For example, foreign security values may be affected by activity that occurs after the close of foreign securities markets. To account for this, the Underlying Portfolio may frequently value many of its foreign equity securities using fair value prices based on third party vendor modeling tools.
Forward foreign currency exchange contracts are valued based on the mean between closing bid and asked prices of the forward currency contract rates in the London foreign exchange markets on a daily basis as provided by a reliable bank or dealer.
Options, whether on securities, indices, futures contracts, or otherwise, are valued at the last sales price available as of the close of business on the day of valuation or, if there is no such sale price available, at the mean between the bid and asked prices. Options on currencies are valued at the spot price each day.
The value of futures contracts will be the sum of the margin deposit plus or minus the difference between the value of the futures contract on each day the net asset value is calculated and the value on the date the futures contract originated, value being that established on a recognized commodity exchange, or by reference to other customary sources, with gain or loss being realized when the futures contract closes or expires.
Subject to the Board’s oversight, the Board has delegated the day-to-day oversight of pricing matters, including determinations in good faith under the Fund’s procedures the fair value of securities for which current market quotations are not readily available to MetLife Advisers, LLC (“MetLife Advisers” or the “Adviser”) or the subadviser of the Underlying Portfolio, as applicable.
Investment Transactions and Related Investment Income:
Portfolio security transactions are recorded on the trade date. Dividend income is recorded on the ex-dividend date. Interest income is recorded on the accrual basis. Realized gains and losses on investments and unrealized appreciation and depreciation are determined on the identified cost basis, which is the same basis used for federal income tax purposes.
Federal Income Taxes:
It is the Portfolio’s policy to comply with the requirements of the Internal Revenue Code of 1986, as amended (the “Code”), and regulations thereunder, applicable to regulated investment companies and to distribute, with respect to each taxable year, all of its taxable income to shareholders. Therefore, no federal income tax provision is required. The Portfolio is subject to the provisions of the Financial Accounting Standards Board Interpretation (“FASB”) No. 48, Accounting for Uncertainties in Income Taxes (FIN 48). FIN 48 sets forth a minimum threshold for financial statement recognition of the benefit of a tax position taken or expected to be taken in a tax return. The implementation of FIN 48 did not result in any unrecognized tax benefits in the accompanying financial statements. Each of the Portfolio’s federal tax returns for the prior three fiscal years remains subject to examination by the Internal Revenue Service.
As of December 31, 2008, the Asset Allocation Portfolio had no capital loss carryforwards.
MSF-12
Metropolitan Series Fund, Inc.
MetLife Conservative to Moderate Allocation Portfolio
Notes to Financial Statements—December 31, 2008—(Continued)
Pursuant to Section 852 of the Code, the Portfolio designated the amount shown below under Long Term Gain as capital gain dividends for its taxable year ended December 31, 2008. The tax character of distributions paid for the periods ended December 31, 2008 and 2007 was as follows:
| | | | | | | | | | | | | | | | | | | | | |
| Ordinary Income | | Long Term Gain | | Return of
Capital | | Total |
| 2008 | | 2007 | | 2008 | | 2007 | | 2008 | | 2007 | | 2008 | | 2007 |
| $10,130,632 | | $ | 527,560 | | $ | 6,855,010 | | $ | 175,853 | | $ | — | | $ | — | | $ | 16,985,642 | | $ | 703,413 |
As of December 31, 2008, the components of distributable earnings (accumulated losses) on a federal income tax basis were as follows:
| | | | | | | | | | | | | | |
Undistributed
Ordinary
Income | | Undistributed
Long Term
Gain | | Unrealized
Depreciation | | | Loss
Carryforwards | | Total | |
$26,578,445 | | $ | 5,859,016 | | $ | (203,811,378 | ) | | $ | — | | $ | (171,373,917 | ) |
Dividends and Distributions to Shareholders:
The Asset Allocation Portfolios record dividends and distributions on the ex-dividend date. Net realized gains from security transactions (if any) are generally distributed annually to shareholders. The timing and characterization of certain income and capital gains distributions are determined in accordance with federal tax regulations that may differ from GAAP. Permanent book and tax basis differences relating to shareholder distributions will result in reclassification between under/over distributed net investment income, accumulated net realized gains/losses and paid in capital.
| 3. | INVESTMENT TRANSACTIONS: |
For the year ended December 31, 2008, purchases and sales of Underlying Portfolios by the Asset Allocation Portfolio were $400,237,160 and $172,445,663, respectively.
| 4. | INVESTMENT MANAGEMENT FEES AND OTHER TRANSACTIONS WITH AFFILIATES: |
Investment Management Agreement:
MetLife Advisers is the investment adviser to the Asset Allocation Portfolio. The Fund has entered into an investment management agreement with MetLife Advisers with respect to the Portfolio. For providing investment management services to the Portfolio, MetLife Advisers receives monthly compensation at the following annual rates:
| | | | |
Management
Fees earned by
MetLife Advisers
for the year ended
December 31, 2008 | | Annual
percentage
rates paid to
MetLife Advisers | | Based on Portfolios
average daily net asset
levels |
| $697,015 | | 0.100% | | Of the first $500 million |
| | 0.075% | | Of the next $500 million |
| | 0.050% | | On amounts in excess of $1 billion |
In addition to the above Management Fee paid to MetLife Advisers, the Asset Allocation Portfolio indirectly pays MetLife Advisers an investment advisory fee through its investments in certain Underlying Portfolios.
Certain officers and directors of the Fund may also be officers of MetLife Advisers; however, such officers and directors receive no compensation from the Fund.
Service and Distribution Fees:
The Fund has adopted a Distribution and Service Plan under Rule 12b-1 of the 1940 Act for the Asset Allocation Portfolio’s Class B shares. Under the Distribution and Service Plan, the Class B shares of the Asset Allocation Portfolio pay a fee to compensate the Insurance Companies (or their affiliates) and other broker-dealers and financial intermediaries involved in the offer and sale of Asset Allocation Portfolio shares for promoting or selling and servicing the Class B shares of the Asset Allocation Portfolio. The fees under the Distribution and Service Plan for each class of the Asset Allocation Portfolio’s shares are calculated
MSF-13
Metropolitan Series Fund, Inc.
MetLife Conservative to Moderate Allocation Portfolio
Notes to Financial Statements—December 31, 2008—(Continued)
as a percentage of the Asset Allocation Portfolio’s average daily net assets that are attributable to that Class. Currently, the fee is 0.25% per year for Class B shares. Amounts paid by the Asset Allocation Portfolio for the year ended December 31, 2008 are shown as Service and Distribution fees in the Statement of Operations.
Expense Agreement:
Pursuant to an expense agreement relating to each class of the Asset Allocation Portfolio, MetLife Advisers has agreed, from May 1, 2008 to April 30, 2009, to waive a portion of its advisory fees or pay a portion of the other operating expenses (not including brokerage costs, interest, taxes, or extraordinary expenses) to the extent total operating expenses exceed stated annual expense limits (based on the Asset Allocation Portfolio’s then current fiscal year). For the Asset Allocation Portfolio, this subsidy, and similar subsidies in effect in earlier periods, are subject to the obligation of each class of the Asset Allocation Portfolio to repay MetLife Advisers in future years, if any, when a class’s expenses fall below the stated expense limit pertaining to that class that was in effect at the time of the subsidy in question. Such deferred expenses may be charged to a class in a subsequent year to the extent that the charge does not cause the total expenses in such subsequent year to exceed the class’ stated expense limit that was in effect at the time of the subsidy in question; provided, however, that no class of the Asset Allocation Portfolio is obligated to repay any expense paid by MetLife Advisers more than five years after the end of the fiscal year in which such expense was incurred.
The expense limits (annual rates as a percentage of each class of the Asset Allocation Portfolio’s net average daily net assets) in effect from May 1, 2008 to April 30, 2009 are 0.10% and 0.35% for Class A and B, respectively.
As of December 31, 2008, the amount of expenses deferred in 2005 subject to repayment until December 31, 2010 was $47,344 for the Asset Allocation Portfolio. The amount of expenses deferred in 2006 subject to repayment until December 31, 2011 was $35,780. The amount of expenses deferred in 2007 subject to repayment until December 31, 2012 was $53,497. No expenses were deferred in 2008.
| 5. | TRANSACTIONS IN SECURITIES OF AFFILIATED ISSUERS: |
The Asset Allocation Portfolio does not invest in the Underlying Portfolios for the purpose of exercising management or control; however, investments by the Asset Allocation Portfolio within its principal investment strategies may represent a significant portion of the Underlying Portfolio’s net assets. Transactions in the Underlying Portfolios during the year ended December 31, 2008 are as follows:
| | | | | | | | |
Underlying Portfolio (Class A) | | Beginning Shares
as of 12/31/2007 | | Shares Purchased
during Period | | Shares Sold
during Period | | Ending Shares
as of 12/31/2008 |
MIST—BlackRock High Yield | | 1,711,246 | | 826,942 | | 223,823 | | 2,314,365 |
MIST—BlackRock Large Cap Core | | 659,957 | | 1,611,189 | | 81,631 | | 2,189,515 |
MIST—Clarion Global Real Estate | | 487,437 | | 543,878 | | 69,733 | | 961,582 |
MIST—Dreman Small Cap Value | | 1,028,616 | | 619,120 | | 126,800 | | 1,520,936 |
MIST—Harris Oakmark International | | 1,645,537 | | 1,203,377 | | 1,102,191 | | 1,746,723 |
MIST—Lazard Mid-Cap | | 1,137,339 | | 647,331 | | 760,516 | | 1,024,154 |
MIST—Legg Mason Value Equity | | 2,012,467 | | 1,686,597 | | 813,495 | | 2,885,569 |
MIST—Lord Abbett Bond Debenture | | 1,126,717 | | 459,632 | | 125,906 | | 1,460,443 |
MIST—Met/AIM Small Cap Growth | | 955,965 | | 822,032 | | 71,188 | | 1,706,809 |
MIST—MFS Research International | | 0 | | 3,207,341 | | 101,993 | | 3,105,348 |
MIST—PIMCO Inflation Protected | | 1,962,792 | | 687,176 | | 487,443 | | 2,162,525 |
MIST—PIMCO Total Return | | 12,900,522 | | 4,981,922 | | 4,055,096 | | 13,827,348 |
MSF—BlackRock Bond Income | | 708,054 | | 262,824 | | 207,092 | | 763,786 |
MSF—BlackRock Large Cap Value | | 2,147,573 | | 1,381,553 | | 139,443 | | 3,389,683 |
MSF—Davis Venture Value | | 989,296 | | 695,844 | | 74,678 | | 1,610,462 |
MSF—FI Mid Cap Opportunities | | 664,957 | | 512,249 | | 465,488 | | 711,718 |
MSF—Jennison Growth | | 1,079,609 | | 845,038 | | 122,559 | | 1,802,088 |
MSF—Julius Baer International Stock | | 1,327,190 | | 1,026,147 | | 438,531 | | 1,914,806 |
MSF—Met/Dimensional International Small Company | | 0 | | 699,704 | | 5,309 | | 694,395 |
MSF—MetLife Stock Index | | 391,017 | | 614,575 | | 36,797 | | 968,795 |
MSF—MFS Value | | 0 | | 817,662 | | 28,476 | | 789,186 |
MSF—Neuberger Berman Mid Cap Value | | 1,389,087 | | 830,377 | | 908,042 | | 1,311,422 |
MSF—Russell 2000 Index | | 499,994 | | 380,057 | | 60,442 | | 819,609 |
MSF-14
Metropolitan Series Fund, Inc.
MetLife Conservative to Moderate Allocation Portfolio
Notes to Financial Statements—December 31, 2008—(Continued)
| | | | | | | | |
Underlying Portfolio (Class A) | | Beginning Shares
as of 12/31/2007 | | Shares Purchased
during Period | | Shares Sold
during Period | | Ending Shares
as of 12/31/2008 |
MSF—T. Rowe Price Large Cap Growth | | 1,325,671 | | 1,137,539 | | 136,178 | | 2,327,032 |
MSF—Van Eck Global Natural Resources | | 0 | | 700,685 | | 5,458 | | 695,227 |
MSF—Western Asset Mgt. Strategic Bond Opportunities | | 8,383,014 | | 3,337,159 | | 1,364,314 | | 10,355,859 |
MSF—Western Asset Mgt. U.S. Government | | 2,285,551 | | 856,353 | | 803,926 | | 2,337,978 |
| | | | | | | | | | | | | |
Underlying Portfolio (Class A) | | Realized
Gain/(Loss)
during Period | | | Capital Gains
Distributions
during Period | | Dividend Income
during Period | | Ending Value
as of 12/31/2008 |
MIST—BlackRock High Yield | | $ | (240,300 | ) | | $ | 0 | | $ | 1,136,655 | | $ | 13,446,459 |
MIST—BlackRock Large Cap Core | | | (256,565 | ) | | | 328,475 | | | 50,285 | | | 14,604,066 |
MIST—Clarion Global Real Estate | | | (253,033 | ) | | | 694,108 | | | 143,273 | | | 7,115,708 |
MIST—Dreman Small Cap Value | | | (111,196 | ) | | | 448,830 | | | 119,483 | | | 14,905,175 |
MIST—Harris Oakmark International | | | (7,150,958 | ) | | | 4,677,167 | | | 546,297 | | | 14,969,419 |
MIST—Lazard Mid-Cap | | | (1,991,867 | ) | | | 1,080,845 | | | 177,412 | | | 7,097,390 |
MIST—Legg Mason Value Equity | | | (1,678,015 | ) | | | 835,392 | | | 61,287 | | | 13,244,761 |
MIST—Lord Abbett Bond Debenture | | | (119,094 | ) | | | 230,753 | | | 665,297 | | | 14,224,716 |
MIST—Met/AIM Small Cap Growth | | | (275,433 | ) | | | 1,307,665 | | | 0 | | | 14,268,922 |
MIST—MFS Research International | | | (378,454 | ) | | | 0 | | | 0 | | | 23,010,632 |
MIST—PIMCO Inflation Protected | | | 183,683 | | | | 47,662 | | | 902,708 | | | 21,257,626 |
MIST—PIMCO Total Return | | | (589,241 | ) | | | 4,121,374 | | | 6,774,229 | | | 160,397,240 |
MSF—BlackRock Bond Income | | | (806,032 | ) | | | 0 | | | 4,380,560 | | | 78,288,115 |
MSF—BlackRock Large Cap Value | | | (518,859 | ) | | | 482,517 | | | 248,798 | | | 29,354,653 |
MSF—Davis Venture Value | | | (205,489 | ) | | | 199,611 | | | 479,524 | | | 34,995,340 |
MSF—FI Mid Cap Opportunities | | | (226,700 | ) | | | 0 | | | 58,272 | | | 6,704,379 |
MSF—Jennison Growth | | | (219,692 | ) | | | 1,252,447 | | | 363,197 | | | 14,074,307 |
MSF—Julius Baer International Stock | | | (2,428,191 | ) | | | 2,552,630 | | | 662,527 | | | 14,935,487 |
MSF—Met/Dimensional International Small Company | | | (2,655 | ) | | | 0 | | | 0 | | | 7,055,049 |
MSF—MetLife Stock Index | | | (201,113 | ) | | | 598,875 | | | 279,230 | | | 21,323,183 |
MSF—MFS Value | | | (74,826 | ) | | | 0 | | | 0 | | | 7,315,757 |
MSF—Neuberger Berman Mid Cap Value | | | (803,430 | ) | | | 342,499 | | | 238,469 | | | 14,425,645 |
MSF—Russell 2000 Index | | | (224,311 | ) | | | 365,718 | | | 93,222 | | | 7,286,325 |
MSF—T. Rowe Price Large Cap Growth | | | (182,563 | ) | | | 1,224,401 | | | 128,042 | | | 21,059,637 |
MSF—Van Eck Global Natural Resources | | | (4,147 | ) | | | 0 | | | 0 | | | 6,750,655 |
MSF—Western Asset Mgt. Strategic Bond Opportunities | | | (2,124,695 | ) | | | 673,055 | | | 4,561,814 | | | 106,976,028 |
MSF—Western Asset Mgt. U.S. Government | | | (384,949 | ) | | | 0 | | | 1,334,474 | | | 27,868,700 |
MSF-15
Metropolitan Series Fund, Inc.
MetLife Conservative To Moderate Allocation Portfolio
Report of Independent Registered Public Accounting Firm
To the Shareholders and Board of Directors of Metropolitan Series Fund, Inc.:
We have audited the accompanying statement of assets and liabilities, including the schedule of investments, of the MetLife Conservative to Moderate Allocation Portfolio (one of the portfolios constituting the Metropolitan Series Fund, Inc.) (the “Fund”) as of December 31, 2008, and the related statement of operations for the year then ended, the statements of changes in net assets for each of the two years in the period then ended, and the financial highlights for each of the three years in the period then ended and the period from May 2, 2005 (commencement of operations ) through December 31, 2005. These financial statements and financial highlights are the responsibility of the Fund’s management. Our responsibility is to express an opinion on these financial statements and financial highlights based on our audits.
We conducted our audits in accordance with the standards of the Public Company Accounting Oversight Board (United States). Those standards require that we plan and perform the audit to obtain reasonable assurance about whether the financial statements and financial highlights are free of material misstatement. The Fund is not required to have, nor were we engaged to perform, an audit of its internal control over financial reporting. Our audits included consideration of internal control over financial reporting as a basis for designing audit procedures that are appropriate in the circumstances, but not for the purpose of expressing an opinion on the effectiveness of the Fund’s internal control over financial reporting. Accordingly, we express no such opinion. An audit also includes examining, on a test basis, evidence supporting the amounts and disclosures in the financial statements, assessing the accounting principles used and significant estimates made by management, as well as evaluating the overall financial statement presentation. Our procedures included confirmation of securities owned as of December 31, 2008, by correspondence with the transfer agent. We believe that our audits provide a reasonable basis for our opinion.
In our opinion, the financial statements and financial highlights referred to above present fairly, in all material respects, the financial position of the MetLife Conservative to Moderate Allocation Portfolio of the Metropolitan Series Fund, Inc. as of December 31, 2008, the results of its operations for the year then ended, the changes in its net assets for each of the two years in the period then ended, and the financial highlights for each of the three years in the period then ended and the period from May 2, 2005 (commencement of operations) through December 31, 2005, in conformity with accounting principles generally accepted in the United States of America.
Deloitte & Touche LLP
Boston, Massachusetts
February 26, 2009
MSF-16
Metropolitan Series Fund, Inc.
Directors and Officers
The Fund’s Directors review actions of the Fund’s investment adviser and subadvisers, and decide upon matters of general policy. The Fund’s officers supervise the daily business operations of the Fund. The Board of Directors and the Fund’s officers are listed below. Each Director is responsible for overseeing all 38 Portfolios of the Fund. There is no limit to the term a Director may serve. Directors serve until their resignation, retirement or removal in accordance with the Fund’s organizational documents and policies adopted by the Board from time to time. Officers hold office at the pleasure of the Board or until the election or appointment and the qualification of a successor. The address of the Directors and officers is c/o Metropolitan Series Fund, Inc., 501 Boylston Street, Boston, MA 02116.
Interested Directors(1)
Each Director below is an “interested person” (as defined by the 1940 Act) with respect to the Fund in that Ms. Forget is an employee of MetLife and Mr. Typermass is a former employee of MetLife and owns securities issued by MetLife, Inc., the ultimate parent company of MetLife Advisers.
| | | | | | | | |
Name, Address and Age | | Current
position(s)
with Fund | | Position(s)
held since | | Principal occupations
over past five years, including other directorships(2) | | Number of
Portfolios in
Fund Complex
Overseen by
Director(3) |
Elizabeth M. Forget Age: 42 | | Director, Chairman of the Board, President and Chief Executive Officer | | 2006 | | Senior Vice President (since 2007), MetLife, Inc.; President, Met Investors Advisory, LLC; Trustee and President, Met Investors Series Trust; Executive Vice President, MetLife Investors Group, Inc.; President, Chief Executive Officer and Chair of the Board of Managers (since 2006), MetLife Advisers; President, Met Investors Advisory, LLC. | | 87 |
| | | | |
Arthur G. Typermass Age: 71 | | Director | | 1998 | | Formerly, Senior Vice President and Treasurer, MetLife. | | 38 |
Non-Interested Directors(1)
Each Director below is not an “interested person” (as defined by the 1940 Act) with respect to the Fund (collectively, the “Independent Directors”).
| | | | | | | | |
Name, Address and Age | | Current
position(s)
with Fund | | Position(s)
held since | | Principal occupations
over past five years, including other directorships(2) | | Number of
Portfolios in
Fund Complex
Overseen by
Director(3) |
Steve A. Garban† Age: 71 | | Director | | 1985 | | Formerly, Chief Financial Officer, Senior Vice President Finance and Operations and Treasurer (Emeritus), The Pennsylvania State University. | | 38 |
| | | | |
Linda B. Strumpf Age: 61 | | Director | | 2000 | | Vice President and Chief Investment Officer, Ford Foundation. | | 38 |
| | | | |
Michael S. Scott Morton† Age: 71 | | Director | | 1993 | | Jay W. Forrester Professor of Management (Emeritus) at Sloan School of Management, MIT. | | 38 |
| | | | |
H. Jesse Arnelle Age: 75 | | Director | | 2001 | | Formerly, Counsel, Womble Carlyle Sandrie & Rice; Director, Textron Inc. (global multi- industry company)*; formerly, Director, Gannet Co. Inc. (diversified news and information company)*; formerly, Director, Eastman Chemical Company (global chemical company)*; formerly, Director, Waste Management, Inc.*; formerly, Director, Armstrong Holdings Inc. (parent company of floor and ceiling products business)*; formerly, Director, FPL Group Inc. (public utility holding company)*; Director, URS Corporation (engineering design services firm)*. | | 38 |
MSF-17
Metropolitan Series Fund, Inc.
Directors and Officers—(Continued)
| | | | | | | | |
Name, Address and Age | | Current
position(s)
with Fund | | Position(s)
held since | | Principal occupations
over past five years, including other directorships(2) | | Number of
Portfolios in
Fund Complex
Overseen by
Director(3) |
Nancy Hawthorne Age: 57 | | Director | | 2003 | | Chief Executive Officer, Clerestory LLC (corporate financial advisor); Director, Avid Technologies (computer software company)*; formerly, Chairman of the Board of Avid Technologies; formerly, Board of Advisors, L. Knife & Sons, Inc. (beverage distributor); formerly, Trustee, New England Zenith Fund (“Zenith Fund”)**; formerly, Chief Executive Officer and Managing Partner, Hawthorne, Krauss and Associates (corporate financial advisor); formerly, Chief Financial Officer and Executive Vice President, Continental Cablevision, subsequently renamed MediaOne (cable television company); formerly, Director, Life F/X, Inc.; formerly, Chairman of the Board, WorldClinic (distance medicine company); formerly, Director, Perini Corporation (construction company)*; formerly, Director, CGU (property and casualty insurance company); formerly, Director, Beacon Power Corporation (energy company)*. | | 38 |
| | | | |
John T. Ludes Age: 72 | | Director | | 2003 | | President, LFP Properties (consulting firm); Formerly, Trustee, Zenith Fund**; formerly, Vice Chairman, President and Chief Operating Officer, Fortune Brands/American Brands (global conglomerate); formerly, President and CEO, Acushnet Company (athletic equipment company). | | 38 |
Officers(1)
| | | | | | | | |
Name and address | | Age | | Current
position(s)
with Fund | | Position(s)
held since | | Principal occupations over past five years(2) |
| Jeffrey L. Bernier | | 37 | | Senior Vice President | | 2008 | | Vice President (since 2008), MetLife, Inc.; Vice President (since 2008), MetLife; Senior Vice President (since 2008), MetLife Advisers; formerly, Director and Senior Investment Analyst (2004 to 2007), John Hancock Financial Services; formerly, Assistant Vice President (2000 to 2001), Wachovia Securities. |
| | | | |
| Alan C. Leland | | 56 | | Senior Vice President | | 2005 | | Treasurer and Chief Financial Officer, MetLife Advisers, LLC; Treasurer (since 2005), Met Investors Advisory, LLC; Vice President (since 2004), Met Investors Advisory, LLC; Vice President (since 2003), MetLife, Inc.; Vice President, MetLife; Senior Vice President, NELICO. |
| | | | |
| Peter Duffy | | 53 | | Vice President
and Treasurer | | 2000 | | Senior Vice President, MetLife Advisers; Second Vice President (since 2003), NELICO; Vice President, MetLife (since 2004); Vice President (since 2004), MetLife, Inc.; formerly, Vice President and Treasurer, Zenith Fund**. |
| | | | |
| Jeffrey P. Halperin | | 41 | | Chief
Compliance Officer | | 2007 | | Vice President (since 2006), MetLife, Inc.; Vice President (since 2006), MetLife; Chief Compliance Officer (since 2006), Met Investors Series Trust, MetLife Advisers, Met Investors Advisory, LLC and MetLife Investment Advisors Company, LLC. |
| * | Indicates a directorship with a registered investment company or a company subject to the reporting requirements of the Securities Exchange Act of 1934, as amended. |
| ** | The Zenith Fund deregistered with the Securities and Exchange Commission (“SEC”) in 2004. |
| (†) | Served as a trustee, director and/or officer of one or more of the following companies, each of which had a direct or indirect advisory relationship with MetLife Advisers or its affiliates prior to January 31, 2005: State Street Research Financial Trust, State Street Research Income Trust, State Street Research Money Market Trust, State Street Research Institutional Funds, State Street Research Capital Trust, State Street Research Master Investment Trust, State Street Research Equity Trust, State Street Research Securities Trust and State Street Research Exchange Trust (collectively, the “State Street Research Funds”). |
| (1) | During the period shown, each Director of the Fund served as a Trustee of Metropolitan Series Fund II, a registered investment company that ceased investment operations in June of 2008 and has applied for deregistration under the Investment Company Act of 1940. During this period, each officer of the Fund served in the same position with Metropolitan Series Fund II. |
| (2) | Previous positions during the past five years with the Fund; Met Investors Series Trust; MetLife; MetLife, Inc.; MetLife Advisers; Met Investors Advisory, LLC; Zenith Fund; NELICO; or New England Securities Corporation are omitted if not materially different. |
| (3) | The Fund Complex includes the Fund (38 portfolios) and Met Investors Series Trust (49 portfolios). |
MSF-18
Metropolitan Series Fund, Inc.
MetLife Conservative To Moderate Allocation Portfolio
Board Approval of Advisory and Subadvisory Agreements
The Fund’s Contract Review Committees of the Board of Directors (the “Board” or the “Directors”) typically meet in early fall to review the Portfolios’ advisory agreements (the “Advisory Agreements”) and subadvisory agreements (the “Subadvisory Agreements,” and, together with the Advisory Agreements, the “Agreements”) and determine whether to recommend that the full Board approve the continuation of the Agreements for an additional one-year period. (Following the initial approval of an Agreement for a new Portfolio or with a new adviser or subadviser, such annual reviews are not required until 2 years following the execution of such Agreement.) After each Committee has made its recommendations, the full Board, including the Independent Directors, determines whether to approve the continuation of each of the Agreements. In addition, the Board, including the Independent Directors, considers matters bearing on the Agreements at most of its other meetings throughout the year and regularly interviews various individuals at MetLife Advisers responsible for the management of the Portfolios. The Directors also interview selected investment managers and other professionals at the subadvisers at various times throughout the year.
The Directors receive all materials that they or MetLife Advisers, the Fund’s investment adviser, and the subadvisers believe to be reasonably necessary for the Directors to evaluate the Agreements and determine whether to approve the continuation of the Agreements. These materials generally include, among other items, (i) information on the investment performance of the Portfolios and the performance of peer groups of funds and the Portfolios’ performance benchmarks, (ii) information on the Portfolios’ advisory and subadvisory fees and other expenses, including information comparing the Portfolios’ expenses to those of peer groups of funds and information about any applicable expense caps and fee “breakpoints,” (iii) sales and redemption data, (iv) information related to the profitability of the Agreements to MetLife Advisers and certain of the subadvisers, and potential “fall-out” or ancillary benefits that MetLife Advisers, the subadvisers or their affiliates may receive as a result of their relationships with the Fund and (v) information obtained through the subadvisers’ responses to certain requests from MetLife Advisers and the Directors and MetLife Advisers’ responses to requests from the Directors. The Directors may also consider other information such as (vi) MetLife Advisers’ and the subadvisers’ financial results and condition, (vii) each Portfolio’s investment objectives and strategies and the size, education and experience of the investment staffs of MetLife Advisers and the relevant subadvisers and their use of technology and external research, (viii) the allocation of the Portfolios’ brokerage, if any, including allocations to brokers affiliated with the subadvisers and the use of “soft” commission dollars to pay Portfolio expenses and to pay for research and other similar services, (ix) the resources devoted to, and the record of compliance with, the Portfolios’ investment policies and restrictions, policies on personal securities transactions and other compliance policies, (x) the responses of MetLife Advisers, the subadvisers and/or their affiliates to certain legal and regulatory proceedings and (xi) the economic outlook generally and for the mutual fund industry in particular. Throughout the process, the Directors have the opportunity to ask questions of and request additional materials from MetLife Advisers and the subadvisers.
Following meetings of each Contract Review Committee on September 10, 2008, the Board, including the Independent Directors, at its November 6-7, 2008 meeting, approved the continuation through December 31, 2009 of the Advisory Agreements for each Portfolio of the Fund and the Subadvisory Agreements for each Portfolio other than the Zenith Equity Portfolio and Asset Allocation Portfolios (which do not have subadvisers) and the Van Eck Global Natural Resources Portfolio, Met/Dimensional International Small Cap Portfolio and Loomis Sayles Small Cap Growth Portfolio (formerly known as the Franklin Templeton Small Cap Growth Portfolio). The Agreements approved for continuation are referred to below as the “Continued Agreements.”
In considering whether to approve the continuation of the Continued Agreements, the Directors, including the Independent Directors, did not identify any single factor as determinative, and each weighed the various factors as he or she deemed appropriate. The Directors considered the following matters in connection with their approval of the Continued Agreements:
The nature, extent and quality of the services provided to the relevant Portfolios under the Continued Agreements. The Directors considered the nature, extent and quality of the services provided by MetLife Advisers, the relevant subadvisers (if any) and their affiliates (each, an “Adviser,” and, collectively, the “Advisers”) to the relevant Portfolios pursuant to the Continued Agreements and the resources dedicated to these Portfolios by the Advisers. In particular, the Directors considered the Advisers’ abilities to attract and retain highly qualified investment professionals. With respect to MetLife Advisers, the Directors considered (for each Portfolio other than the Zenith Equity and Asset Allocation Portfolios) that MetLife Advisers is (i) ultimately responsible for the performance of such Portfolios; (ii) ultimately responsible for the establishment of the investment strategies of each such Portfolio, primarily through its recommendations to the Board regarding the hiring and selection of subadvisers; (iii) responsible for the hiring and selection, subject to Board approval, of subadvisers; and (iv) responsible for maintaining a program of Subadviser oversight reasonably designed to ensure that the subadvisers have reasonable compliance policies and procedures in place. The Directors also considered that MetLife Advisers provides a full range of day-to-day administrative services for the Portfolios involving all aspects of such Portfolios’ day-to-day operations (other than portfolio management). With respect to the Zenith Equity and Asset Allocation Portfolios, the Directors considered both the portfolio management services and the administrative services provided by MetLife Advisers. After reviewing
MSF-19
Metropolitan Series Fund, Inc.
MetLife Conservative To Moderate Allocation Portfolio
Board Approval of Advisory and Subadvisory Agreements—(Continued)
these and related factors, the Directors concluded, within the context of their overall conclusions regarding each of the Continued Agreements, that the nature, extent and quality of services provided supported the renewal of these Agreements.
Investment performance of the relevant Portfolios. The Directors reviewed information about the performance of the relevant Portfolios over various time periods, including information prepared by an independent third party that compared the performance of the Portfolios to the performance of peer groups of funds and performance benchmarks. The Directors also reviewed a description of the third party’s methodology for identifying a Portfolio’s peer group(s) for purposes of performance and expense comparisons.
In the case of each relevant Portfolio that had performance that lagged its peer group(s) for certain periods, the Directors concluded that other factors relevant to performance were sufficient, in light of other considerations, to warrant renewal of the Continued Agreements relating to such Portfolio. These factors varied from Portfolio to Portfolio, but included one or more of the following: (i) that such Portfolio’s performance, although lagging in certain recent periods, was stronger over the longer term; (ii) that the underperformance was attributable, to a significant extent, to investment decisions that were reasonable and consistent with the Portfolio’s investment objective(s) and policies and that the Portfolio was performing within the range of reasonable expectations, given market conditions and the Portfolio’s investment objective(s) and policies; (iii) that the Portfolio’s performance was competitive when compared to other relevant performance benchmarks or peer groups; and (iv) that MetLife Advisers and/or the relevant subadviser (if any) had taken or was taking steps designed to help improve the Portfolio’s investment performance (including, in the case of certain Portfolios, that MetLife Advisers was formulating possible proposals, for presentation to the Board in November 2008, to replace the Portfolio’s subadviser or to merge the Portfolio into another Portfolio with a similar investment objective and better investment performance).
The Directors also considered the investment performance of the Advisers and their reputations generally, the historical responsiveness of the Advisers to Director concerns about performance and the willingness of the Advisers to take steps intended to improve performance.
After reviewing these and related factors, the Directors concluded, within the context of their overall conclusions regarding each of the Continued Agreements, that the investment performance of each relevant Portfolio and Adviser was sufficient, in light of other considerations, to warrant the renewal of the Continued Agreements.
The costs of the services to be provided and profits to be realized by the Advisers and their affiliates from their relationships with the Portfolios. The Directors considered the fees charged by MetLife Advisers to the Portfolios for advisory services and, with respect to the subadvised Portfolios, by such subadvisers to MetLife Advisers for subadvisory services (such advisory and subadvisory fees (if any), collectively, “Fees”), as well as the total expense levels of the Portfolios. This information included comparisons (provided by an independent third party) of the Portfolios’ advisory fees and total expense levels to those of their peer groups. In evaluating Fees for the relevant Portfolios, the Directors also took into account the demands, complexity and quality of the investment management services provided to each Portfolio. The Directors considered MetLife Advisers’ recommendations regarding reductions in Fee rates, implementation of Fee breakpoints and institution of Fee waivers and expense caps.
The Directors also considered the compensation directly or indirectly received by the Advisers and their affiliates from their relationships with the relevant Portfolios. The Directors reviewed information relating to the profits received by MetLife Advisers, certain of the subadvisers and their affiliates as a result of their relationships with the relevant Portfolios, and information about the allocation of expenses used to calculate profitability. When reviewing profitability, the Directors also considered the performance of the relevant Portfolios, the expense levels of such Portfolios and whether the relevant Advisers had implemented breakpoints, fee waivers and/or expense caps with respect to such Portfolios.
After reviewing these and related factors, the Directors concluded, within the context of their overall conclusions regarding each of the Continued Agreements, that the Fees charged to each of the relevant Portfolios were fair and reasonable, and that the information provided regarding costs of these services generally, and the related profitability (if known) to the relevant Advisers of their relationships with the relevant Portfolios, supported the renewal of the Continued Agreements.
Economies of Scale. The Directors considered the existence of any economies of scale in the provision of services by the Advisers and whether those economies were shared with the relevant Portfolios through breakpoints in their advisory fees or other means, such as expense caps, fee waivers or relatively low levels of fees. The Directors noted that most of the relevant Portfolios benefited or will benefit from breakpoints, expense caps and/or fee waivers with respect to their advisory fees. In considering these issues, the Directors also took into consideration information relating to the costs of the services provided and the profitability to MetLife Advisers, the relevant subadvisers (if any) and each of their affiliates of their relationships with the relevant Portfolios, as discussed above.
MSF-20
Metropolitan Series Fund, Inc.
MetLife Conservative To Moderate Allocation Portfolio
Board Approval of Advisory and Subadvisory Agreements—(Continued)
After reviewing these and related factors, the Directors concluded, within the context of their overall conclusions regarding each of the Continued Agreements, that the extent to which economies of scale were shared with the relevant Portfolios supported the renewal of such Agreements.
Other Factors. The Directors also considered other factors, which included but were not limited to the following:
| | • | | the extent to which each relevant Portfolio operated in accordance with its investment objective, and its record of compliance with its investment restrictions and the compliance programs of the Fund and the Advisers. They also considered the compliance-related resources the Advisers and their affiliates provide to the relevant Portfolios; |
| | • | | the nature, quality, cost and extent of administrative and shareholder services performed by MetLife Advisers and its affiliates under the Advisory Agreements; and |
| | • | | so-called “fall-out benefits” to the Advisers, such as the engagement of their affiliates to provide distribution, brokerage and transfer agency services to the Portfolios, and the benefits of research made available to the relevant Advisers by reason of brokerage commissions generated by the relevant Portfolios’ securities transactions. The Directors also considered the possible conflicts of interest associated with these fall-out and other benefits, and the reporting and other processes in place to disclose and monitor these possible conflicts of interest. |
Based on their evaluation of all factors that they deemed to be material, including those factors described above, and assisted by the advice of independent counsel, the Directors, including the Independent Directors, concluded that each of the Continued Agreements should be continued through December 31, 2009.
MSF-21
A description of the policies and procedures that the Fund uses to determine how to vote proxies relating to portfolio securities is available (i) without charge, upon request, by calling (800) 638-7732 and (ii) on the Securities and Exchange Commission’s (the “SEC”) website at http://www.sec.gov.
Information regarding how the Fund voted proxies relating to portfolio securities during the most recent twelve-month period ended December 31, 2008 is available (i) without charge, upon request, by calling (800) 638-7732 and (ii) on the SEC’s website at http://www.sec.gov.
The Fund’s Statement of Additional Information includes additional information about the Directors of the Fund and is available (i) without charge, upon request, by calling (800) 638-7732 and (ii) on the SEC’s website at http://www.sec.gov.
The Fund files with the SEC a complete schedule of its portfolio holdings, as of the close of the first and third quarters of its fiscal year, on “Form N-Q”. These filings are available on the SEC’s website at www.sec.gov and may be reviewed and copied at the SEC’s Public Reference Room in Washington, DC. (Call 1-800-SEC-0330 for information on the operation of the Public Reference Room.)
MSF-22
Simplify your life…
with MetLife eDelivery® while helping MetLife preserve the planet’s natural resources.
(see details on inside cover)
| | |
Metropolitan Series Fund, Inc. MetLife Mid Cap Stock Index Portfolio Annual Report | | December 31, 2008 |
NOT PART OF THE ANNUAL REPORT
Letter from the President
February 1, 2009
Letter to Policy Holders:
2008 was an extraordinary year in the capital markets around the world and for the global economy. Energy prices rose to record levels early in the year before falling by two-thirds by year-end. A credit crisis that began with concerns about sub-prime mortgages led to massive changes in the financial landscape with government takeovers, forced sales, and outright failures of a number of large, once venerable firms.
While bonds as measured by the Barclays Capital U.S. Aggregate Bond Index (formerly known as, Lehman Brothers U.S. Aggregate Bond Index) were up 5.2% for the year in response to declining interest rates, there were large differences in the total returns of the various sectors of the bond market. U.S. treasury securities were up over 13% as frightened investors sought refuge in what they perceived to be the safest and most liquid investments. In contrast, investment grade corporate securities lost nearly 5% as credit spreads widened and below investment grade or high yield bonds fell over 26%.
In response to the growing credit crisis and the weakening economy, common stocks fell sharply across all regions, styles, and capitalizations. As measured by the Standard and Poor’s 500, U.S. common stocks fell 37% for the year, the worst calendar year decline since the 1930s. Foreign stocks were down even more with the MSCI EAFE Index down 43% for the year.
On the following pages, you will find a complete review of your Portfolio and its investment performance.
MetLife is committed to building your financial freedom. We appreciate your trust and will continue to focus our efforts on meeting your investment needs.
Sincerely,
Elizabeth M. Forget
President, Metropolitan Series Fund, Inc.
Metropolitan Series Fund, Inc.
MetLife Mid Cap Stock Index Portfolio
Managed by MetLife Investment Advisors Company, LLC
Portfolio Manager Commentary*
PORTFOLIO PERFORMANCE
For the twelve-month period ended December 31, 2008, the Class A shares of the MetLife Mid Cap Stock Index Portfolio returned -36.2%, compared to its benchmark, the Standard & Poor’s MidCap 400 Index1, which returned -36.2%.
PORTFOLIO REVIEW
The S&P MidCap 400 Index had its first negative annual return in six years. During the first half of 2008, the S&P MidCap 400 Index returned -3.9%, primarily due to continued weakness in the economy, deteriorating financial market conditions and further credit tightening. The subprime mortgage crisis continued to weaken the housing market, and the ensuing liquidity crisis resulted in one of the worst financial crises in recent history. A few of the consequences included the collapse of Bear Stearns, the bankruptcy of Lehman Brothers, the sale of Merrill Lynch to Bank of America, and the government’s provision of credit assistance to Fannie Mae and Freddie Mac. Other major financial institutions that required rescues included AIG, Washington Mutual, and Wachovia.
During the second half of 2008, the S&P MidCap 400 Index returned -33.6%, primarily due to concerns that the financial crisis continued to exacerbate. In an effort to support the functioning of the financial markets, a $700 billion financial-rescue plan, also known as the Troubled Asset Relief Program (TARP), was initiated which included bailout loans and the purchasing of large quantities of agency debt and mortgage-backed securities by the Treasury Department. In addition, during the year, the Federal Open Market Committee (FOMC) lowered the Fed Funds Rate seven times from 4.25% to a target range of zero to 0.25%.
During the year, the price of oil rose from approximately $96 to a high of $145 per barrel in July, before plummeting to $45 per barrel by the end of the year, down approximately 54% from prior year-end. Oil prices fell from its highs due to decreased global oil demand and reduced investment speculation on oil futures by large financial institutions and hedge funds. Some of the factors driving the equity markets included geopolitical concerns, energy prices, Federal Reserve interest rate policy, corporate earnings, and unemployment rates.
All ten sectors comprising the S&P MidCap 400 Index experienced negative returns for the year. Utilities (7.9% beginning-of-year weight), down 20.3%, was the best relative performing sector. The next best relative performing sectors were Consumer Staples (3.2% beginning-of-year weight), down 24.4%; and Financials (15.4% beginning weight), down 26.8%. The Energy sector (9.9% beginning weight), down 57.1%, was the worst-performing sector. The next worst-performing sectors were Telecomm Services (0.7% beginning weight), down 50.2%; and Materials (7.1% beginning weight), down 44.6%. Information Technology (14.8% beginning weight), down 41.0%, provided the largest negative impact to the benchmark’s one-year return.
The stocks with the largest positive impact on the benchmark return for the year were Millennium Pharmaceuticals, up 66.2%; Southwestern Energy, up 65.3%; and CF Industries Holdings, up 35.9%. The stocks with the largest negative impact were Joy Global, down 64.7%; Denbury Resources, down 63.3%; and Hologic, down 61.9%. There were fifty-five additions and fifty-five deletions to the benchmark in 2008.
* The views expressed above are those of the subadvisory firm as of December 31, 2008 and are subject to change based on market and other conditions. Information about the Portfolio’s holdings, asset allocation, industry allocation, or country diversification is historical and is not an indication of future Portfolio composition, which will vary. The performance of any index mentioned in this commentary has not been adjusted for ongoing management, distribution and operating expenses, and sales charges applicable to mutual fund investments. Direct investment in any index is not possible.
1 The Standard & Poor’s (S&P) MidCap 400® Index is an unmanaged index measuring the performance of the mid-size company segment of the U.S. market. The Index consists of 400 domestic stocks chosen for market size, liquidity, and industry group representation.
MSF-2
Metropolitan Series Fund, Inc.
MetLife Mid Cap Stock Index Portfolio
A $10,000 INVESTMENT COMPARED TO THE S&P MIDCAP 400 INDEX
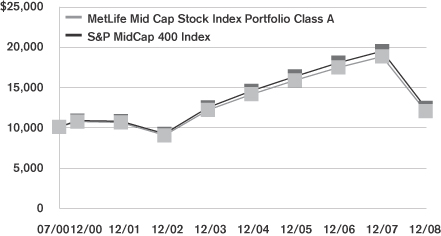
Average Annual Returns as of December 31, 2008
| | | | | | | | | | | | |
| | | MetLife Mid Cap Stock Index Portfolio | | | S&P MidCap
400 Index | |
| | | Class A | | | Class B | | | Class E | | |
| 1 Year | | -36.2 | % | | -36.4 | % | | -36.3 | % | | -36.2 | % |
| 5 Year | | -0.3 | | | -0.5 | | | -0.4 | | | -0.1 | |
| Since Inception | | 2.1 | | | 1.7 | | | 1.4 | | | 2.5 | |
Performance numbers are net of all Portfolio expenses but do not include any insurance, sales, or administrative charges of variable annuity or life insurance contracts or any additional expenses that participants in certain eligible qualified plans may bear relating to the operations of their plans. If these charges were included, the returns would be lower.
Inception dates of the Class A, Class B and Class E shares are: 7/5/00, 1/2/01 and 5/1/01, respectively. Index since inception return is based on the Class A inception date.
This information represents past performance and is not indicative of future results. Investment return and principal value may fluctuate so that shares, upon redemption, may be worth more or less than the original cost.
PORTFOLIO COMPOSITION
as of December 31, 2008
Top Holdings
| | |
| | | % of Total
Net Assets |
MidCap SPDR Trust, Series 1 | | 2.5% |
Everest Re Group, Ltd. | | 0.7% |
Vertex Pharmaceuticals, Inc. | | 0.7% |
Health Care REIT, Inc. | | 0.6% |
W.R. Berkley Corp. | | 0.6% |
O’Reilly Automative, Inc. | | 0.6% |
New York Community Bancorp, Inc. | | 0.6% |
Martin Marietta Materials, Inc. | | 0.6% |
MDU Resources Group, Inc. | | 0.6% |
SAIC, Inc. | | 0.6% |
Top Sectors
| | |
| | | % of Equity
Market Value |
Financials | | 21.1% |
Industrials | | 14.4% |
Consumer Discretionary | | 14.1% |
Information Technology | | 12.5% |
Health Care | | 11.4% |
Utilities | | 8.2% |
Materials | | 6.8% |
Energy | | 6.4% |
Consumer Staples | | 4.5% |
Telecommunication Services | | 0.6% |
MSF-3
Metropolitan Series Fund, Inc.
Shareholder Expense Example
As a shareholder of the Portfolio, you incur ongoing costs, including management fees; distribution and service (12b-1) fees; and other Portfolio expenses. This example is intended to help you understand your ongoing costs (in dollars) (referred to as “expenses”) of investing in the Portfolio and compare these costs with the ongoing costs of investing in other mutual funds. The example is based on an investment of $1,000 invested at the beginning of the period and held for the entire period, July 1, 2008 through December 31, 2008.
Actual Expenses
The first line for each share class of the Portfolio in the table below provides information about actual account values and actual expenses. You may use the information in this line, together with the amount you invested in the particular share class of the Portfolio, to estimate the expenses that you paid over the period. Simply divide your account value by $1,000 (for example, an $8,600 account value divided by $1,000=8.6), then multiply the result by the number in the first line under the heading entitled “Expenses Paid During Period” to estimate the expenses you paid on your account during this period.
Hypothetical Example for Comparison Purposes
The second line for each share class of the Portfolio in the table below provides information about hypothetical account values and hypothetical expenses based on the Portfolio’s actual expense ratio and an assumed rate of return of 5% per year before expenses, which is not the Portfolio’s actual return. The hypothetical account values and expenses may not be used to estimate the actual ending account balance or expenses you paid for the period. You may use this information to compare the ongoing costs of investing in the Portfolio and other funds. To do so, compare this 5% hypothetical example with the 5% hypothetical examples that appear in the shareholder reports of the other funds.
Please note that the expenses shown in the table are meant to highlight your ongoing costs only and do not reflect any fees or charges of your variable insurance product or any additional expenses that participants in certain eligible qualified plans may bear relating to the operations of their plan. Therefore, the second line for each share class in the table is useful in comparing ongoing costs only, and will not help you determine the relative total costs of owning different funds. In addition, if these other costs were included, your costs would have been higher.
| | | | | | | | | | | | | | |
Portfolio | | | | Annualized
Expense
Ratio | | | Beginning
Account Value
July 1,
2008 | | Ending
Account Value
December 31,
2008 | | Expenses Paid
During Period*
July 1, 2008
to
December 31,
2008 |
MetLife Mid Cap Stock Index—Class A(a) | | Actual | | 0.32 | % | | $ | 1,000.00 | | $ | 664.62 | | $ | 1.34 |
| | Hypothetical | | 0.32 | % | | $ | 1,000.00 | | $ | 1,023.51 | | $ | 1.63 |
| | | | | |
MetLife Mid Cap Stock Index—Class B(a) | | Actual | | 0.57 | % | | $ | 1,000.00 | | $ | 663.57 | | $ | 2.38 |
| | Hypothetical | | 0.57 | % | | $ | 1,000.00 | | $ | 1,022.24 | | $ | 2.90 |
| | | | | |
MetLife Mid Cap Stock Index—Class E(a) | | Actual | | 0.47 | % | | $ | 1,000.00 | | $ | 663.84 | | $ | 1.97 |
| | Hypothetical | | 0.47 | % | | $ | 1,000.00 | | $ | 1,022.75 | | $ | 2.39 |
* Expenses paid are equal to the Portfolio’s annualized expense ratio for the most recent six month period, as shown above, multiplied by the average account value over the period, multiplied by the number of days in the most recent fiscal half-year, divided by 366 (to reflect the the one-half year period).
(a) The annualized expense ratio shown reflects the impact of the management fee waiver as described in Note 4 to the Financial Statements.
MSF-4
Metropolitan Series Fund, Inc.
MetLife Mid Cap Stock Index Portfolio
Schedule of Investments as of December 31, 2008
Common Stock—94.9% of Total Net Assets
| | | | | |
| Security Description | | Shares | | Value* |
| | | | | |
| | |
Aerospace & Defense—0.5% | | | | | |
Alliant Techsystems, Inc. (a) (b) | | 15,826 | | $ | 1,357,238 |
BE Aerospace, Inc. (b) | | 48,118 | | | 370,027 |
| | | | | |
| | | | | 1,727,265 |
| | | | | |
| | |
Airlines—0.4% | | | | | |
Airtran Holdings, Inc. (a) (b) | | 56,710 | | | 251,793 |
Alaska Air Group, Inc. (b) | | 17,516 | | | 512,343 |
JetBlue Airways Corp. (a) (b) | | 88,641 | | | 629,351 |
| | | | | |
| | | | | 1,393,487 |
| | | | | |
| | |
Auto Components—0.6% | | | | | |
ArvinMeritor, Inc. (a) | | 35,704 | | | 101,756 |
BorgWarner, Inc. | | 56,017 | | | 1,219,490 |
Gentex Corp. (a) | | 67,574 | | | 596,679 |
Modine Manufacturing Co. | | 15,868 | | | 77,277 |
| | | | | |
| | | | | 1,995,202 |
| | | | | |
| | |
Automobiles—0.1% | | | | | |
Thor Industries, Inc. | | 17,164 | | | 226,222 |
| | | | | |
| | |
Beverages—0.5% | | | | | |
Hansen Natural Corp. (b) | | 35,772 | | | 1,199,435 |
PepsiAmericas, Inc. | | 27,717 | | | 564,318 |
| | | | | |
| | | | | 1,763,753 |
| | | | | |
| | |
Biotechnology—0.9% | | | | | |
United Therapeutics Corp. (a) (b) | | 11,237 | | | 702,874 |
Vertex Pharmaceuticals, Inc. (b) | | 72,789 | | | 2,211,330 |
| | | | | |
| | | | | 2,914,204 |
| | | | | |
| | |
Capital Markets—1.7% | | | | | |
Affiliated Managers Group, Inc. (b) | | 19,871 | | | 832,992 |
Apollo Investment Corp. (a) | | 68,800 | | | 640,528 |
Eaton Vance Corp. | | 56,133 | | | 1,179,354 |
Jefferies Group, Inc. | | 58,519 | | | 822,777 |
Raymond James Financial, Inc. (a) | | 46,661 | | | 799,303 |
SEI Investments Co. | | 64,539 | | | 1,013,908 |
Waddell & Reed Financial, Inc. (Class A) | | 41,021 | | | 634,185 |
| | | | | |
| | | | | 5,923,047 |
| | | | | |
| | |
Chemicals—3.5% | | | | | |
Airgas, Inc. | | 39,162 | | | 1,526,926 |
Albemarle Corp. | | 44,125 | | | 983,988 |
Ashland Inc. | | 32,002 | | | 336,341 |
Cabot Corp. | | 31,648 | | | 484,214 |
Chemtura Corp. (b) | | 117,305 | | | 164,227 |
Cytec Industries, Inc. | | 22,791 | | | 483,625 |
Ferro Corp. (a) | | 21,160 | | | 149,178 |
FMC Corp. | | 35,808 | | | 1,601,692 |
Lubrizol Corp. (a) | | 32,536 | | | 1,183,985 |
Minerals Technologies, Inc. | | 9,066 | | | 370,799 |
Olin Corp. | | 37,193 | | | 672,450 |
RPM International, Inc. | | 62,268 | | | 827,542 |
Sensient Technologies Corp. (a) | | 23,388 | | | 558,505 |
| | | | | |
| Security Description | | Shares | | Value* |
| | | | | |
| | |
Chemicals—(Continued) | | | | | |
Terra Industries, Inc. | | 49,406 | | $ | 823,598 |
The Scotts Miracle-Gro Co. | | 21,189 | | | 629,737 |
Valspar Corp. | | 48,273 | | | 873,259 |
| | | | | |
| | | | | 11,670,066 |
| | | | | |
| |
Commercial & Professional Services—1.8% | | | |
Clean Harbors, Inc. (b) | | 9,756 | | | 618,921 |
Copart, Inc. (a) (b) | | 30,641 | | | 833,129 |
Corrections Corp. of America (b) | | 60,809 | | | 994,835 |
Deluxe Corp. | | 24,737 | | | 370,066 |
Herman Miller, Inc. (a) | | 25,945 | | | 338,063 |
HNI Corp. (a) | | 21,409 | | | 339,119 |
Mine Safety Appliances Co. (a) | | 14,369 | | | 343,563 |
Rollins, Inc. | | 20,005 | | | 361,690 |
The Brink’s Co. | | 19,705 | | | 529,670 |
Waste Connections, Inc. (b) | | 38,563 | | | 1,217,434 |
| | | | | |
| | | | | 5,946,490 |
| | | | | |
| | |
Commercial Banks—4.5% | | | | | |
Associated Banc-Corp (a) | | 61,781 | | | 1,293,076 |
BancorpSouth, Inc. | | 34,976 | | | 817,039 |
Bank Hawaii Corp. | | 23,081 | | | 1,042,569 |
Cathay General Bancorp (a) | | 23,949 | | | 568,789 |
City National Corp. | | 19,575 | | | 953,302 |
Commerce Bancshares, Inc. | | 31,908 | | | 1,402,357 |
Cullen/Frost Bankers, Inc. | | 28,698 | | | 1,454,415 |
FirstMerit Corp. | | 39,171 | | | 806,531 |
Fulton Financial Corp. | | 84,648 | | | 814,314 |
PacWest Bancorp (a) | | 11,842 | | | 318,550 |
SVB Financial Group (a) (b) | | 15,862 | | | 416,060 |
Synovus Financial Corp. (a) | | 135,825 | | | 1,127,347 |
TCF Financial Corp. (a) | | 55,741 | | | 761,422 |
The Colonial BancGroup, Inc. (a) (b) | | 97,928 | | | 202,711 |
Valley National Bancorp | | 65,279 | | | 1,321,900 |
Webster Finanical Corp. | | 25,505 | | | 351,459 |
Westamerica Bancorp (a) | | 13,974 | | | 714,770 |
Wilmington Trust Corp. (a) | | 32,936 | | | 732,497 |
| | | | | |
| | | | | 15,099,108 |
| | | | | |
| | |
Communications Equipment—1.1% | | | | | |
3Com Corp. (a) (b) | | 196,525 | | | 448,077 |
ADC Telecommunications, Inc. (a) (b) | | 56,957 | | | 311,555 |
Adtran, Inc. | | 26,500 | | | 394,320 |
Avocent Corp. (a) (b) | | 21,670 | | | 388,110 |
CommScope, Inc. (a) (b) | | 34,041 | | | 528,997 |
F5 Networks, Inc. (a) (b) | | 38,532 | | | 880,841 |
Plantronics, Inc. (a) | | 23,639 | | | 312,035 |
Polycom, Inc. (a) (b) | | 40,260 | | | 543,913 |
| | | | | |
| | | | | 3,807,848 |
| | | | | |
| | |
Computers & Peripherals—1.1% | | | | | |
Diebold, Inc. | | 31,977 | | | 898,234 |
Imation Corp. (a) | | 14,583 | | | 197,891 |
NCR Corp. (b) | | 76,336 | | | 1,079,391 |
Palm, Inc. (a) (b) | | 53,098 | | | 163,011 |
*See accompanying notes to financial statements.
MSF-5
Metropolitan Series Fund, Inc.
MetLife Mid Cap Stock Index Portfolio
Schedule of Investments as of December 31, 2008
Common Stock—(Continued)
| | | | | |
| Security Description | | Shares | | Value* |
| | | | | |
| | |
Computers & Peripherals—(Continued) | | | | | |
Western Digital Corp. (b) | | 107,181 | | $ | 1,227,223 |
| | | | | |
| | | | | 3,565,750 |
| | | | | |
| | |
Construction & Engineering—1.9% | | | | | |
Dycom Industries, Inc. (b) | | 19,045 | | | 156,550 |
Granite Construction, Inc. (a) | | 15,918 | | | 699,278 |
KBR, Inc. | | 78,147 | | | 1,187,834 |
Quanta Services, Inc. (b) | | 95,447 | | | 1,889,851 |
The Shaw Group, Inc. (a) (b) | | 40,405 | | | 827,090 |
URS Corp. (b) | | 40,392 | | | 1,646,782 |
| | | | | |
| | | | | 6,407,385 |
| | | | | |
| | |
Construction Materials—0.6% | | | | | |
Martin Marietta Materials, Inc. (a) | | 20,040 | | | 1,945,483 |
| | | | | |
| | |
Consumer Finance—0.1% | | | | | |
AmeriCredit Corp. (a) (b) | | 56,253 | | | 429,773 |
| | | | | |
| | |
Containers & Packaging—1.1% | | | | | |
AptarGroup, Inc. (a) | | 32,659 | | | 1,150,903 |
Greif, Inc. | | 16,492 | | | 551,328 |
Packaging Corp. of America | | 49,535 | | | 666,741 |
Sonoco Products Co. | | 48,244 | | | 1,117,331 |
Temple-Inland, Inc. (a) | | 51,524 | | | 247,315 |
| | | | | |
| | | | | 3,733,618 |
| | | | | |
| | |
Distributors—0.2% | | | | | |
LKQ Corp. (a) (b) | | 67,624 | | | 788,496 |
| | | | | |
| | |
Diversified Consumer Services—2.4% | | | | | |
Brink’s Home Security Holdings, Inc. (b) | | 19,705 | | | 431,934 |
Career Education Corp. (b) | | 35,588 | | | 638,449 |
Corinthian Colleges, Inc. (a) (b) | | 41,405 | | | 677,800 |
DeVry, Inc. (a) | | 29,801 | | | 1,710,875 |
ITT Educational Services, Inc. (a) (b) | | 15,162 | | | 1,440,087 |
Matthews International Corp. | | 14,787 | | | 542,387 |
Regis Corp. | | 20,898 | | | 303,648 |
Service Corp. International (a) | | 123,649 | | | 614,535 |
Sotheby’s (a) | | 32,552 | | | 289,387 |
Strayer Education, Inc. (a) | | 6,883 | | | 1,475,784 |
| | | | | |
| | | | | 8,124,886 |
| | | | | |
| |
Diversified Telecommunication Services—0.1% | | | |
Cincinnati Bell, Inc. (a) (b) | | 111,457 | | | 215,112 |
| | | | | |
| | |
Electric Utilities—2.4% | | | | | |
DPL, Inc. (a) | | 56,097 | | | 1,281,256 |
Great Plains Energy, Inc. | | 57,528 | | | 1,112,016 |
Hawaiian Electric Industries, Inc. (a) | | 43,601 | | | 965,326 |
IDACORP, Inc. (a) | | 22,043 | | | 649,166 |
Northeast Utilities | | 75,320 | | | 1,812,199 |
NV Energy, Inc. | | 113,271 | | | 1,120,250 |
Westar Energy, Inc. | | 52,386 | | | 1,074,437 |
| | | | | |
| | | | | 8,014,650 |
| | | | | |
| | | | | |
| Security Description | | Shares | | Value* |
| | | | | |
| | |
Electrical Equipment—1.7% | | | | | |
Ametek, Inc. | | 51,628 | | $ | 1,559,682 |
Hubbell, Inc. (Class B) | | 27,150 | | | 887,262 |
Roper Industries, Inc. (a) | | 43,399 | | | 1,883,950 |
Thomas & Betts Corp. (b) | | 27,045 | | | 649,621 |
Woodward Governor Co. | | 26,385 | | | 607,383 |
| | | | | |
| | | | | 5,587,898 |
| | | | | |
|
Electronic Equipment, Instruments & Components—2.1% |
Arrow Electronics, Inc. | | 57,711 | | | 1,087,275 |
Avnet, Inc. (b) | | 72,878 | | | 1,327,108 |
Ingram Micro, Inc. (b) | | 79,745 | | | 1,067,786 |
Mettler Toledo International, Inc. (b) | | 16,217 | | | 1,093,026 |
National Instruments Corp. (a) | | 27,583 | | | 671,922 |
Tech Data Corp. (b) | | 24,196 | | | 431,657 |
Trimble Navigation, Ltd. (b) | | 57,832 | | | 1,249,749 |
Vishay Intertechnology, Inc. (b) | | 90,246 | | | 308,641 |
| | | | | |
| | | | | 7,237,164 |
| | | | | |
| | |
Energy Equipment & Services—2.6% | | | | | |
Exterran Holdings, Inc. (a) (b) | | 31,303 | | | 666,754 |
FMC Technologies, Inc. (b) | | 60,489 | | | 1,441,453 |
Helix Energy Solutions Group, Inc. (a) (b) | | 44,433 | | | 321,695 |
Helmerich & Payne, Inc. | | 50,903 | | | 1,158,043 |
Oceaneering International, Inc. (b) | | 26,353 | | | 767,926 |
Patterson-UTI Energy, Inc. | | 74,797 | | | 860,913 |
Pride International, Inc. (b) | | 83,723 | | | 1,337,893 |
Superior Energy Services, Inc. (b) | | 37,504 | | | 597,439 |
Tidewater, Inc. | | 24,932 | | | 1,004,012 |
Unit Corp. (b) | | 22,862 | | | 610,873 |
| | | | | |
| | | | | 8,767,001 |
| | | | | |
| | |
Food & Staples Retailing—0.4% | | | | | |
BJ’s Wholesale Club, Inc. (a) (b) | | 28,448 | | | 974,628 |
Ruddick Corp. (a) | | 18,932 | | | 523,470 |
| | | | | |
| | | | | 1,498,098 |
| | | | | |
| | |
Food Products—1.8% | | | | | |
Corn Products International, Inc. | | 36,033 | | | 1,039,552 |
Flowers Foods, Inc. | | 38,137 | | | 929,017 |
Hormel Foods Corp. | | 33,914 | | | 1,054,047 |
Lancaster Colony Corp. | | 9,602 | | | 329,349 |
Ralcorp Holdings, Inc. (b) | | 27,256 | | | 1,591,750 |
Smithfield Foods, Inc. (a) (b) | | 57,480 | | | 808,744 |
Tootsie Roll Industries, Inc. (a) | | 12,528 | | | 320,842 |
| | | | | |
| | | | | 6,073,301 |
| | | | | |
| | |
Gas Utilities—2.0% | | | | | |
AGL Resources, Inc. | | 37,143 | | | 1,164,433 |
Energen Corp. | | 34,690 | | | 1,017,458 |
National Fuel Gas Co. | | 38,277 | | | 1,199,218 |
ONEOK, Inc. | | 50,552 | | | 1,472,074 |
UGI Corp. | | 52,192 | | | 1,274,529 |
WGL Holdings, Inc. (a) | | 24,174 | | | 790,248 |
| | | | | |
| | | | | 6,917,960 |
| | | | | |
*See accompanying notes to financial statements.
MSF-6
Metropolitan Series Fund, Inc.
MetLife Mid Cap Stock Index Portfolio
Schedule of Investments as of December 31, 2008
Common Stock—(Continued)
| | | | | |
| Security Description | | Shares | | Value* |
| | | | | |
| | |
Health Care Equipment & Supplies—3.7% | | | | | |
Advanced Medical Optics, Inc. (a) (b) | | 25,198 | | $ | 166,559 |
Beckman Coulter, Inc. (a) | | 30,317 | | | 1,332,129 |
Edwards Lifesciences Corp. (b) | | 26,928 | | | 1,479,694 |
Gen-Probe, Inc. (b) | | 26,304 | | | 1,126,863 |
Hill-Rom Holdings, Inc. (a) | | 30,239 | | | 497,734 |
Hologic, Inc. (a) (b) | | 123,950 | | | 1,620,026 |
IDEXX Laboratories, Inc. (a) (b) | | 28,813 | | | 1,039,573 |
Kinetic Concepts, Inc. (a) (b) | | 27,098 | | | 519,740 |
Masimo Corp. (b) | | 23,168 | | | 691,101 |
ResMed, Inc. (b) | | 36,615 | | | 1,372,330 |
STERIS Corp. | | 28,482 | | | 680,435 |
Teleflex, Inc. | | 19,212 | | | 962,521 |
Thoratec Corp. (a) (b) | | 27,126 | | | 881,324 |
| | | | | |
| | | | | 12,370,029 |
| | | | | |
| | |
Health Care Providers & Services—2.6% | | | | | |
Community Health Systems, Inc. (b) | | 45,118 | | | 657,820 |
Health Management Associates, Inc. (Class A) (a) (b) | | 118,050 | | | 211,310 |
Health Net, Inc. (b) | | 50,160 | | | 546,242 |
Henry Schein, Inc. (b) | | 43,226 | | | 1,585,962 |
Kindred Healthcare, Inc. (b) | | 14,495 | | | 188,725 |
LifePoint Hospitals, Inc. (a) (b) | | 25,846 | | | 590,323 |
Lincare Holdings, Inc. (a) (b) | | 35,981 | | | 968,968 |
Omnicare, Inc. (a) | | 50,383 | | | 1,398,632 |
Psychiatric Solutions, Inc. (a) (b) | | 27,056 | | | 753,510 |
Universal Health Services, Inc. (Class B) (a) | | 24,508 | | | 920,766 |
VCA Antech, Inc. (a) (b) | | 40,941 | | | 813,907 |
Wellcare Group, Inc. (b) | | 20,175 | | | 259,450 |
| | | | | |
| | | | | 8,895,615 |
| | | | | |
| | |
Health Care Technology—0.4% | | | | | |
Cerner Corp. (a) (b) | | 32,915 | | | 1,265,582 |
| | | | | |
| | |
Hotels, Restaurants & Leisure—1.3% | | | | | |
Bob Evans Farms, Inc. (a) | | 14,851 | | | 303,406 |
Boyd Gaming Corp. (a) (b) | | 27,612 | | | 130,605 |
Brinker International, Inc. | | 49,265 | | | 519,253 |
Chipotle Mexican Grill, Inc. (Class A) (a) (b) | | 15,957 | | | 989,015 |
International Speedway Corp. (Class A) (a) | | 13,437 | | | 386,045 |
Life Time Fitness, Inc. (a) (b) | | 16,905 | | | 218,920 |
Scientific Games Corp. (a) (b) | | 31,451 | | | 551,650 |
The Cheesecake Factory (a) (b) | | 28,887 | | | 291,759 |
Wendy’s/Arby’s Group, Inc. | | 202,256 | | | 999,144 |
| | | | | |
| | | | | 4,389,797 |
| | | | | |
| | |
Household Durables—1.7% | | | | | |
American Greetings Corp. (Class A) (a) | | 21,968 | | | 166,298 |
Blyth, Inc. | | 11,698 | | | 91,712 |
Furniture Brands International, Inc. (a) (b) | | 20,064 | | | 44,341 |
Hovnanian Enterprises, Inc. (Class A) (a) (b) | | 24,503 | | | 42,145 |
M.D.C. Holdings, Inc. (a) | | 17,790 | | | 539,037 |
Mohawk Industries, Inc. (a) (b) | | 27,139 | | | 1,166,163 |
NVR, Inc. (b) | | 2,639 | | | 1,204,044 |
Ryland Group, Inc. (a) | | 20,668 | | | 365,204 |
| | | | | |
| Security Description | | Shares | | Value* |
| | | | | |
| | |
Household Durables—(Continued) | | | | | |
Toll Brothers, Inc. (b) | | 63,025 | | $ | 1,350,626 |
Tupperware Brands Corp. | | 29,989 | | | 680,750 |
| | | | | |
| | | | | 5,650,320 |
| | | | | |
| | |
Household Products—1.0% | | | | | |
Church & Dwight Co., Inc. (a) | | 33,878 | | | 1,901,234 |
Energizer Holdings, Inc. (a) (b) | | 28,208 | | | 1,527,181 |
| | | | | |
| | | | | 3,428,415 |
| | | | | |
| | |
Industrial Conglomerates—0.2% | | | | | |
Carisle Cos., Inc. (a) | | 29,511 | | | 610,878 |
| | | | | |
| | |
Insurance—5.6% | | | | | |
American Financial Group, Inc. | | 36,329 | | | 831,208 |
Arthur J. Gallagher & Co. | | 45,957 | | | 1,190,746 |
Brown & Brown, Inc. | | 56,126 | | | 1,173,033 |
Everest Re Group, Ltd. | | 29,710 | | | 2,262,119 |
Fidelity National Financial, Inc. (a) | | 102,463 | | | 1,818,718 |
First American Corp. | | 44,925 | | | 1,297,883 |
HCC Insurance Holdings, Inc. | | 55,487 | | | 1,484,277 |
Horace Mann Educators Corp. | | 18,896 | | | 173,654 |
Mercury General Corp. (a) | | 17,220 | | | 791,948 |
Old Republic International Corp. | | 111,628 | | | 1,330,606 |
Protective Life Corp. | | 33,817 | | | 485,274 |
Reinsurance Group of America Inc | | 35,102 | | | 1,503,068 |
StanCorp Financial Group, Inc. | | 23,668 | | | 988,612 |
The Hanover Insurance Group, Inc. | | 24,711 | | | 1,061,832 |
Unitrin, Inc. | | 23,815 | | | 379,611 |
W.R. Berkley Corp. | | 67,083 | | | 2,079,573 |
| | | | | |
| | | | | 18,852,162 |
| | | | | |
| | |
Internet & Catalog Retail—0.6% | | | | | |
Netflix, Inc. (a) (b) | | 20,151 | | | 602,313 |
priceline.com, Inc. (a) (b) | | 19,635 | | | 1,446,118 |
| | | | | |
| | | | | 2,048,431 |
| | | | | |
| | |
Internet Software & Services—0.2% | | | | | |
Digital River, Inc. (b) | | 17,943 | | | 444,986 |
ValueClick, Inc. (b) | | 41,965 | | | 287,041 |
| | | | | |
| | | | | 732,027 |
| | | | | |
| | |
IT Services—3.1% | | | | | |
Acxiom Corp. (b) | | 32,859 | | | 266,487 |
Alliance Data Systems Corp. (a) (b) | | 31,222 | | | 1,452,760 |
Broadridge Financial Solutions, Inc. | | 68,402 | | | 857,761 |
DST Systems, Inc. (a) (b) (c) | | 19,681 | | | 747,484 |
Gartner, Inc. (Class A) (b) | | 28,668 | | | 511,150 |
Global Payments, Inc. (a) | | 38,795 | | | 1,272,088 |
Lender Processing Services, Inc. | | 40,557 | | | 1,194,404 |
Mantech International Corp. (b) | | 10,107 | | | 547,698 |
Metavante Technologies, Inc. (a) (b) | | 43,420 | | | 699,496 |
NeuStar, Inc. (a) (b) | | 38,147 | | | 729,752 |
SAIC, Inc. (b) | | 98,070 | | | 1,910,404 |
SRA International, Inc. (b) | | 20,364 | | | 351,279 |
| | | | | |
| | | | | 10,540,763 |
| | | | | |
*See accompanying notes to financial statements.
MSF-7
Metropolitan Series Fund, Inc.
MetLife Mid Cap Stock Index Portfolio
Schedule of Investments as of December 31, 2008
Common Stock—(Continued)
| | | | | |
| Security Description | | Shares | | Value* |
| | | | | |
| | |
Leisure Equipment & Products—0.1% | | | | | |
Callaway Golf Co. (a) | | 31,241 | | $ | 290,229 |
| | | | | |
| | |
Life Sciences Tools & Services—1.9% | | | | | |
Affymetrix, Inc. (b) | | 33,961 | | | 101,543 |
Bio-Rad Laboratories, Inc. (b) | | 9,242 | | | 696,015 |
Charles River Laboratories International, Inc. (b) | | 32,741 | | | 857,814 |
Covance, Inc. (a) (b) (c) | | 30,615 | | | 1,409,209 |
Pharmaceutical Product Development, Inc. | | 57,035 | | | 1,654,585 |
Techne Corp. (b) | | 18,394 | | | 1,186,781 |
Varian, Inc. (b) | | 14,009 | | | 469,442 |
| | | | | |
| | | | | 6,375,389 |
| | | | | |
| | |
Machinery—4.6% | | | | | |
AGCO Corp. (b) | | 44,382 | | | 1,046,971 |
Bucyrus International, Inc. | | 36,213 | | | 670,665 |
Crane Co. | | 23,442 | | | 404,140 |
Donaldson Co., Inc. | | 37,218 | | | 1,252,386 |
Federal Signal Corp. | | 22,929 | | | 188,247 |
Graco, Inc. (a) | | 28,790 | | | 683,187 |
Harsco Corp. | | 40,401 | | | 1,118,300 |
IDEX Corp. (a) | | 39,979 | | | 965,493 |
Joy Global, Inc. | | 52,141 | | | 1,193,507 |
Kennametal, Inc. | | 35,369 | | | 784,838 |
Lincoln Electric Holdings, Inc. | | 20,714 | | | 1,054,964 |
Nordson Corp. (a) | | 16,499 | | | 532,753 |
Oshkosh Corp. | | 36,005 | | | 320,084 |
Pentair, Inc. | | 47,712 | | | 1,129,343 |
SPX Corp. | | 26,328 | | | 1,067,600 |
Terex Corp. | | 45,908 | | | 795,127 |
Timkin Co. | | 41,102 | | | 806,832 |
Trinity Industries, Inc. (a) | | 38,475 | | | 606,366 |
Wabtec Corp. | | 23,456 | | | 932,376 |
| | | | | |
| | | | | 15,553,179 |
| | | | | |
| | |
Marine—0.1% | | | | | |
Alexander & Baldwin, Inc. | | 20,005 | | | 501,325 |
| | | | | |
| | |
Media—1.0% | | | | | |
Belo Corp. (Class A) | | 42,521 | | | 66,333 |
DreamWorks Animation SKG, Inc. (b) | | 37,278 | | | 941,642 |
Harte-Hanks, Inc. (a) | | 18,374 | | | 114,654 |
John Wiley & Sons, Inc. (a) | | 20,713 | | | 736,969 |
Lamar Advertising Co. (Class A) (a) (b) | | 36,744 | | | 461,505 |
Marvel Entertainment, Inc. (a) (b) | | 23,726 | | | 729,574 |
Scholastic Corp. | | 12,790 | | | 173,688 |
| | | | | |
| | | | | 3,224,365 |
| | | | | |
| | |
Metals & Mining—1.3% | | | | | |
Carpenter Technology Corp. | | 21,326 | | | 438,036 |
Cliffs Natural Resources, Inc. | | 54,907 | | | 1,406,168 |
Commercial Metals Co. | | 55,050 | | | 653,443 |
Reliance Steel & Aluminum Co. (a) | | 30,849 | | | 615,129 |
Steel Dynamics, Inc. | | 78,226 | | | 874,567 |
Worthington Industries, Inc. (a) | | 28,979 | | | 319,349 |
| | | | | |
| | | | | 4,306,692 |
| | | | | |
| | | | | |
| Security Description | | Shares | | Value* |
| | | | | |
| | |
Multi-Utilities—3.0% | | | | | |
Alliant Energy Corp. | | 53,430 | | $ | 1,559,087 |
Black Hills Corp. | | 18,600 | | | 501,456 |
MDU Resources Group, Inc. | | 88,847 | | | 1,917,318 |
NSTAR | | 51,669 | | | 1,885,402 |
OGE Energy Corp. | | 44,884 | | | 1,157,109 |
PNM Resources, Inc. (a) | | 41,832 | | | 421,667 |
Puget Energy, Inc. | | 62,732 | | | 1,710,702 |
Vectren Corp. | | 39,174 | | | 979,742 |
| | | | | |
| | | | | 10,132,483 |
| | | | | |
| | |
Multiline Retail—0.7% | | | | | |
99 Cents Only Stores (a) (b) | | 22,669 | | | 247,772 |
Dollar Tree, Inc. (a) (b) (c) | | 43,839 | | | 1,832,470 |
Saks, Inc. (a) (b) | | 68,728 | | | 301,029 |
| | | | | |
| | | | | 2,381,271 |
| | | | | |
| | |
Office Electronics—0.2% | | | | | |
Zebra Technologies Corp. (Class A) (b) | | 30,665 | | | 621,273 |
| | | | | |
| | |
Oil, Gas & Consumable Fuels—3.5% | | | | | |
Arch Coal, Inc. | | 69,110 | | | 1,125,802 |
Bill Barrett Corp. (b) | | 17,903 | | | 378,290 |
Cimarex Energy Co. (a) | | 40,283 | | | 1,078,779 |
Comstock Resources, Inc. (b) | | 22,261 | | | 1,051,832 |
Denbury Resources, Inc. (a) (b) (c) | | 119,508 | | | 1,305,027 |
Encore Aquisition Co. (b) | | 25,525 | | | 651,398 |
Forest Oil Corp. (a) (b) | | 46,982 | | | 774,733 |
Frontier Oil Corp. | | 50,263 | | | 634,822 |
Mariner Energy, Inc. (b) | | 42,984 | | | 438,437 |
Newfield Exploration Co. (b) | | 63,974 | | | 1,263,487 |
Overseas Shipholding Group, Inc. | | 12,200 | | | 513,742 |
Patriot Coal Corp. (a) (b) | | 30,696 | | | 191,850 |
Plains Exploration & Production Co. (b) | | 52,052 | | | 1,209,689 |
Quicksilver Resources, Inc. (a) (b) | | 54,085 | | | 301,253 |
Southern Union Co. | | 59,977 | | | 782,100 |
| | | | | |
| | | | | 11,701,241 |
| | | | | |
| | |
Paper & Forest Products—0.0% | | | | | |
Louisiana-Pacific Corp. (a) (b) | | 43,972 | | | 68,596 |
| | | | | |
| | |
Personal Products—0.4% | | | | | |
Alberto-Culver Co. | | 41,231 | | | 1,010,572 |
NBTY, Inc. (b) | | 26,521 | | | 415,053 |
| | | | | |
| | | | | 1,425,625 |
| | | | | |
| | |
Pharmaceuticals—1.3% | | | | | |
Endo Pharmaceuticals Holdings, Inc. (b) | | 56,634 | | | 1,465,688 |
Medicis Pharmaceutical Corp. (a) | | 27,437 | | | 381,374 |
Perrigo Co. (a) | | 37,561 | | | 1,213,596 |
Sepracor, Inc. (a) (b) | | 52,667 | | | 578,284 |
Valeant Pharmaceuticals International (a) (b) | | 39,425 | | | 902,832 |
| | | | | |
| | | | | 4,541,774 |
| | | | | |
*See accompanying notes to financial statements.
MSF-8
Metropolitan Series Fund, Inc.
MetLife Mid Cap Stock Index Portfolio
Schedule of Investments as of December 31, 2008
Common Stock—(Continued)
| | | | | |
| Security Description | | Shares | | Value* |
| | | | | |
| | |
Professional Services—1.1% | | | | | |
FTI Consulting, Inc. (a) (b) | | 24,583 | | $ | 1,098,368 |
Kelly Services, Inc. (Class A) | | 13,284 | | | 172,825 |
Korn/Ferry International (b) | | 21,647 | | | 247,209 |
Manpower, Inc. | | 37,715 | | | 1,281,933 |
MPS Group, Inc. (b) | | 44,659 | | | 336,282 |
Navigant Consulting, Inc. (b) | | 22,639 | | | 359,281 |
The Corporate Executive Board Co. | | 16,463 | | | 363,174 |
| | | | | |
| | | | | 3,859,072 |
| | | | | |
| | |
Real Estate Investment Trusts—6.7% | | | | | |
Alexandria Real Estate Equities, Inc. (a) | | 15,591 | | | 940,761 |
AMB Property Corp. | | 47,645 | | | 1,115,846 |
BRE Properties, Inc. (a) | | 24,717 | | | 691,582 |
Camden Property Trust (a) | | 25,765 | | | 807,475 |
Cousins Properties, Inc. (a) | | 21,128 | | | 292,623 |
Duke Realty Corp. (a) | | 71,288 | | | 781,316 |
Equity One, Inc. (a) | | 15,948 | | | 282,280 |
Essex Property Trust, Inc. (a) | | 12,963 | | | 994,910 |
Federal Realty Investment Trust (a) | | 28,529 | | | 1,771,080 |
Health Care REIT, Inc. (a) | | 50,047 | | | 2,111,983 |
Highwoods Properties, Inc. | | 30,751 | | | 841,347 |
Hospitality Properties Trust (a) | | 45,464 | | | 676,050 |
Liberty Property Trust | | 47,484 | | | 1,084,060 |
Mack-Cali Realty Corp. | | 31,869 | | | 780,790 |
Nationwide Health Properties, Inc. | | 48,061 | | | 1,380,312 |
Omega Healthcare Investors, Inc. | | 39,822 | | | 635,957 |
Potlatch Corp. | | 19,118 | | | 497,259 |
Rayonier, Inc. | | 38,132 | | | 1,195,438 |
Realty Income Corp. (a) | | 50,440 | | | 1,167,686 |
Regency Centers Corp. (a) | | 33,864 | | | 1,581,449 |
SL Green Realty Corp | | 27,595 | | | 714,711 |
The Macerich Co. (a) | | 36,819 | | | 668,633 |
UDR, Inc. (a) | | 65,878 | | | 908,458 |
Weingarten Realty Investors (a) | | 37,484 | | | 775,544 |
| | | | | |
| | | | | 22,697,550 |
| | | | | |
| |
Real Estate Management & Development—0.1% | | | |
Jones Lang LaSalle, Inc. (a) | | 16,691 | | | 462,341 |
| | | | | |
| | |
Road & Rail—0.9% | | | | | |
Con-Way, Inc. (a) | | 22,168 | | | 589,669 |
J.B. Hunt Transport Services, Inc. (a) | | 39,623 | | | 1,040,896 |
Kansas City Southern (a) (b) | | 44,163 | | | 841,305 |
Werner Enterprises, Inc. (a) | | 20,615 | | | 357,464 |
YRC Worldwide, Inc. (a) (b) | | 28,664 | | | 82,266 |
| | | | | |
| | | | | 2,911,600 |
| | | | | |
| |
Semiconductors & Semiconductor Equipment—1.6% | | | |
Atmel Corp. (b) (c) | | 216,705 | | | 678,287 |
Cree, Inc. (a) (b) | | 42,729 | | | 678,109 |
Fairchild Semiconductor International, Inc. (b) | | 60,049 | | | 293,639 |
Integrated Device Technology, Inc. (b) | | 81,770 | | | 458,730 |
International Rectifier Corp. (b) | | 35,256 | | | 475,956 |
Intersil Corp. | | 59,420 | | | 546,070 |
Lam Research Corp. (b) | | 60,445 | | | 1,286,269 |
| | | | | |
| Security Description | | Shares | | Value* |
| | | | | |
|
Semiconductors & Semiconductor Equipment—(Continued) |
RF Micro Devices, Inc. (a) (b) | | 127,287 | | $ | 99,284 |
Semtech Corp. (b) | | 29,225 | | | 329,366 |
Silicon Laboratories, Inc. (a) (b) | | 22,378 | | | 554,527 |
| | | | | |
| | | | | 5,400,237 |
| | | | | |
| | |
Software—2.4% | | | | | |
ACI Worldwide, Inc. (a) (b) | | 16,887 | | | 268,503 |
Advent Software, Inc. (a) (b) | | 8,076 | | | 161,278 |
Ansys, Inc. (b) | | 43,393 | | | 1,210,231 |
Cadence Design Systems, Inc. (b) | | 125,900 | | | 460,794 |
FactSet Research Systems, Inc. (a) | | 20,394 | | | 902,231 |
Fair Isaac Corp. (a) | | 23,451 | | | 395,384 |
Jack Henry & Associates, Inc. | | 40,884 | | | 793,558 |
Macrovision Solutions Corp. (b) | | 40,359 | | | 510,541 |
Mentor Graphics Corp. (b) | | 44,679 | | | 230,990 |
Parametric Technology Corp. (b) | | 56,211 | | | 711,069 |
Sybase, Inc. (a) (b) | | 39,210 | | | 971,232 |
Synopsys, Inc. (b) | | 69,705 | | | 1,290,937 |
Wind River Systems, Inc. (b) | | 32,827 | | | 296,428 |
| | | | | |
| | | | | 8,203,176 |
| | | | | |
| | |
Specialty Retail—4.1% | | | | | |
Advance Auto Parts, Inc. | | 45,807 | | | 1,541,406 |
Aeropostale, Inc. (a) (b) | | 32,323 | | | 520,400 |
American Eagle Outfitters, Inc. | | 99,732 | | | 933,492 |
AnnTaylor Stores Corp. (a) (b) | | 27,639 | | | 159,477 |
Barnes & Noble, Inc. | | 17,829 | | | 267,435 |
Carmax, Inc. (a) (b) | | 106,634 | | | 840,276 |
Chico’s FAS, Inc. (a) (b) | | 85,766 | | | 358,502 |
Coldwater Creek, Inc. (a) (b) | | 22,938 | | | 65,373 |
Collective Brands, Inc. (b) | | 30,844 | | | 361,492 |
Dick’s Sporting Goods, Inc. (a) (b) | | 41,159 | | | 580,753 |
Foot Locker, Inc. (a) | | 74,942 | | | 550,074 |
Guess?, Inc. | | 29,135 | | | 447,222 |
J. Crew Group, Inc. (a) (b) | | 25,087 | | | 306,061 |
O’Reilly Automotive, Inc. (a) (b) | | 65,075 | | | 2,000,406 |
Pacific Sunwear of California, Inc. (b) | | 31,776 | | | 50,524 |
PetSmart, Inc. | | 61,494 | | | 1,134,564 |
Rent-A-Center, Inc. (b) | | 32,297 | | | 570,042 |
Ross Stores, Inc. (a) | | 62,589 | | | 1,860,771 |
Urban Outfitters, Inc. (b) | | 55,168 | | | 826,417 |
Williams-Sonoma, Inc. | | 41,902 | | | 329,350 |
| | | | | |
| | | | | 13,704,037 |
| | | | | |
| | |
Textiles, Apparel & Luxury Goods—0.6% | | | | | |
Hanesbrands, Inc. (a) (b) | | 45,221 | | | 576,568 |
Phillips-Van Heusen Corp. | | 24,894 | | | 501,116 |
The Warnaco Group, Inc. (b) | | 22,555 | | | 442,754 |
Timberland Co. (Class A) (b) | | 22,260 | | | 257,103 |
Under Armour, Inc. (a) (b) | | 17,645 | | | 420,657 |
| | | | | |
| | | | | 2,198,198 |
| | | | | |
| | |
Thrifts & Mortgage Finance—1.3% | | | | | |
Astoria Financial Corp. | | 38,954 | | | 641,962 |
First Niagara Financial Group, Inc. | | 57,345 | | | 927,269 |
*See accompanying notes to financial statements.
MSF-9
Metropolitan Series Fund, Inc.
MetLife Mid Cap Stock Index Portfolio
Schedule of Investments as of December 31, 2008
Common Stock—(Continued)
| | | | | |
| Security Description | |
Shares | | Value* |
| | | | | |
| | |
Thrifts & Mortgage Finance—(Continued) | | | | | |
New York Community Bancorp, Inc. (a) | | 166,501 | | $ | 1,991,352 |
The PMI Group, Inc. (a) | | 33,563 | | | 65,448 |
Washington Federal, Inc. | | 42,560 | | | 636,697 |
| | | | | |
| | | | | 4,262,728 |
| | | | | |
| | |
Tobacco—0.1% | | | | | |
Universal Corp. | | 12,088 | | | 361,069 |
| | | | | |
| |
Trading Companies & Distributors—0.5% | | | |
GATX Corp. (a) | | 23,559 | | | 729,622 |
MSC Industrial Direct Co. (a) | | 21,680 | | | 798,474 |
United Rentals, Inc. (a) (b) | | 28,973 | | | 264,234 |
| | | | | |
| | | | | 1,792,330 |
| | | | | |
| | |
Water Utilities—0.4% | | | | | |
Aqua America, Inc. (a) | | 65,386 | | | 1,346,298 |
| | | | | |
| |
Wireless Telecommunication Services—0.5% | | | |
Telephone & Data Systems, Inc. | | 51,496 | | | 1,634,998 |
| | | | | |
Total Common Stock
(Identified Cost $446,652,221) | | | | | 320,514,362 |
| | | | | |
| | |
| Mutual Funds—2.5% | | | | | |
| | |
Exchange Traded Funds—2.5% | | | | | |
MidCap SPDR Trust, Series 1 (a) | | 85,800 | | | 8,336,328 |
| | | | | |
Total Mutual Funds
(Identified Cost $8,143,519) | | | | | 8,336,328 |
| | | | | |
| | | | | | | |
| |
| Short Term Investments—19.5% | | | | |
| Security Description | | Face
Amount/Shares | | Value* | |
| | | | | | | |
| | |
Discount Notes—2.2% | | | | | | | |
Federal Home Loan Bank
0.120%, 03/25/09 | | $ | 6,525,000 | | $ | 6,523,797 | |
2.400%, 01/27/09 | | | 575,000 | | | 574,950 | |
Federal Home Loan Mortgage Corp.
1.100%, 02/27/09 | | | 450,000 | | | 449,929 | |
| | | | | | | |
| | | | | | 7,548,676 | |
| | | | | | | |
| | |
Mutual Funds—17.3% | | | | | | | |
State Street Navigator Securities Lending Prime Portfolio (d) | | | 58,387,185 | | | 58,387,185 | |
| | | | | | | |
Total Short Term Investments
(Identified Cost $65,935,861) | | | | | | 65,935,861 | |
| | | | | | | |
Total Investments—116.9%
(Identified Cost $520,731,601) (e) | | | | | | 394,786,551 | |
Liabilities in excess of other assets | | | | | | (57,083,075 | ) |
| | | | | | | |
| Total Net Assets—100% | | | | | $ | 337,703,476 | |
| | | | | | | |
| (a) | A portion or all of the security was on loan. As of December 31, 2008, the market value of securities loaned was $58,635,014 and the collateral received consisted of cash in the amount of $58,387,185 and non-cash collateral with a value of $160,090. The cash collateral is invested in a money market fund managed by an affiliate of the custodian. The non-cash collateral received consists primarily of government securities and bank letters of credit, and are held for the benefit of the Portfolio at the Portfolio’s custodian. The Portfolio cannot repledge or resell this collateral. As such, these are excluded from the Statement of Assets and Liabilities. |
| (c) | A portion or all of the security was pledged as collateral against open futures contracts. |
| (d) | Represents investment of cash collateral received from securities lending transactions. |
| (e) | The aggregate cost of investments for federal income tax purposes as of December 31, 2008 was $531,813,089 and the composition of unrealized appreciation and depreciation of investment securities was $16,418,496 and $(153,445,034), respectively. |
Futures Contracts
| | | | | | | | | | | | | |
Futures Contracts—Long | | Expiration Date | | Number of
Contracts | | Contract
Amount | | Valuation as of
12/31/2008 | | Net Unrealized
Appreciation |
S&P MidCap 400 Index Futures | | 3/19/2009 | | 27 | | $ | 6,647,535 | | $ | 7,252,200 | | $ | 604,665 |
| | | | | | | | | | | | | |
*See accompanying notes to financial statements.
MSF-10
Metropolitan Series Fund, Inc.
MetLife Mid Cap Stock Index Portfolio
The Portfolio adopted the provisions of Statement of Financial Accounting Standards No. 157, “Fair Value Measurements” (FAS 157), effective with the beginning of the Portfolio’s fiscal year. FAS 157 establishes a framework for measuring fair value and expands disclosures about fair value measurements in financial statements. The three levels of the hierarchy under FAS 157 are described below:
Level 1 - quoted prices in active markets for identical securities
Level 2 - other significant observable inputs (including quoted prices for similar securities, interest rates, credit risk, etc.)
Level 3 - significant unobservable inputs (including the Portfolio’s own assumptions in determining the fair value of investments)
The inputs or methodology used for valuing securities are not necessarily an indication of the risk associated with investing in those securities.
The following is a summary of the inputs used to value the Portfolio’s net assets as of December 31, 2008:
| | | | | | |
| Valuation Inputs | | Investments In
Securities | | Other Financial
Instruments* |
Level 1 - Quoted Prices | | $ | 387,237,875 | | $ | 604,665 |
Level 2 - Other Significant Observable Inputs | | | 7,548,676 | | | 0 |
Level 3 - Significant Unobservable Inputs | | | 0 | | | 0 |
Total | | $ | 394,786,551 | | $ | 604,665 |
* Other financial instruments are derivative instruments not reflected in the Schedule of Investments, such as futures, forwards, swap contracts and written options, which are valued based on the unrealized appreciation/depreciation on the instrument.
MSF-11
Metropolitan Series Fund, Inc.
MetLife Mid Cap Stock Index Portfolio
Statement of Assets & Liabilities
December 31, 2008
| | | | | | | |
Assets | | | | | | | |
Investments at value (a) (b) | | | | | $ | 394,786,551 | |
Cash | | | | | | 56,936 | |
Receivable for: | | | | | | | |
Securities sold | | | | | | 4,127,150 | |
Fund shares sold | | | | | | 1,244,794 | |
Accrued interest and dividends | | | | | | 528,621 | |
Futures variation margin | | | | | | 159,300 | |
| | | | | | | |
Total Assets | | | | | | 400,903,352 | |
Liabilities | | | | | | | |
Payable for: | | | | | | | |
Securities purchased | | $ | 4,531,945 | | | | |
Fund shares redeemed | | | 150,321 | | | | |
Collateral for securities loaned | | | 58,387,185 | | | | |
Accrued expenses: | | | | | | | |
Management fees | | | 64,163 | | | | |
Service and distribution fees | | | 30,542 | | | | |
Other expenses | | | 35,720 | | | | |
| | | | | | | |
Total Liabilities | | | | | | 63,199,876 | |
| | | | | | | |
Net Assets | | | | | $ | 337,703,476 | |
| | | | | | | |
Net assets consists of: | | | | | | | |
Capital paid in | | | | | $ | 455,115,680 | |
Undistributed net investment income | | | | | | 6,345,944 | |
Accumulated net realized gains | | | | | | 1,582,237 | |
Unrealized depreciation on investments and futures contracts | | | | | | (125,340,385 | ) |
| | | | | | | |
Net Assets | | | | | $ | 337,703,476 | |
| | | | | | | |
| Computation of offering price: | | | | | | | |
Class A | | | | | | | |
Net asset value and redemption price per share ($166,318,707 divided by 19,216,422 shares outstanding) | | | | | $ | 8.66 | |
| | | | | | | |
Class B | | | | | | | |
Net asset value and redemption price per share ($133,389,911 divided by 15,544,490 shares outstanding) | | | | | $ | 8.58 | |
| | | | | | | |
Class E | | | | | | | |
Net asset value and redemption price per share ($37,994,858 divided by 4,411,798 shares outstanding) | | | | | $ | 8.61 | |
| | | | | | | |
(a) Identified cost of investments | | | | | $ | 520,731,601 | |
| | | | | | | |
(b) Includes cash collateral for securities loaned of | | | | | $ | 58,387,185 | |
| | | | | | | |
Statement of Operations
For the Year Ended December 31, 2008
| | | | | | | | |
Investment Income | | | | | | | | |
Dividends | | | | | | $ | 6,798,936 | |
Interest | | | | | | | 1,508,872 | (a) |
| | | | | | | | |
| | | | | | | 8,307,808 | |
| | | | | | | | |
Expenses | | | | | | | | |
Management fees | | $ | 1,126,832 | | | | | |
Service and distribution fees—Class B | | | 418,607 | | | | | |
Service and distribution fees—Class E | | | 83,142 | | | | | |
Directors’ fees and expenses | | | 31,901 | | | | | |
Custodian | | | 59,372 | | | | | |
Audit and tax services | | | 36,941 | | | | | |
Legal | | | 7,730 | | | | | |
Printing | | | 154,405 | | | | | |
Insurance | | | 6,326 | | | | | |
Miscellaneous | | | 37,758 | | | | | |
| | | | | | | | |
Total expenses | | | 1,963,014 | | | | | |
Management fee waivers | | | (31,551 | ) | | | 1,931,463 | |
| | | | | | | | |
Net Investment Income | | | | | | | 6,376,345 | |
| | | | | | | | |
Realized and Unrealized Gain (Loss) | | | | | | | | |
| Realized gain (loss) on: | | | | | | | | |
Investments—net | | | 10,379,246 | | | | | |
Futures contracts—net | | | (5,959,365 | ) | | | 4,419,881 | |
| | | | | | | | |
Change in unrealized appreciation (depreciation) on: | | | | | | | | |
Investments—net | | | (198,697,141 | ) | | | | |
Futures contracts—net | | | 1,351,070 | | | | (197,346,071 | ) |
| | | | | | | | |
Net loss | | | | | | | (192,926,190 | ) |
| | | | | | | | |
Net Decrease in Net Assets From Operations | | | | | | $ | (186,549,845 | ) |
| | | | | | | | |
| (a) | Includes income on securities loaned of $1,274,182. |
See accompanying notes to financial statements.
MSF-12
Metropolitan Series Fund, Inc.
MetLife Mid Cap Stock Index Portfolio
Statements of Changes in Net Assets
| | | | | | | | |
| | | Year ended
December 31,
2008 | | | Year ended
December 31,
2007 | |
From Operations | | | | | | | | |
Net investment income | | $ | 6,376,345 | | | $ | 6,587,026 | |
Net realized gain | | | 4,419,881 | | | | 43,367,240 | |
Unrealized depreciation | | | (197,346,071 | ) | | | (12,744,287 | ) |
| | | | | | | | |
Increase (decrease) in net assets from operations | | | (186,549,845 | ) | | | 37,209,979 | |
| | | | | | | | |
From Distributions to Shareholders | | | | | | | | |
Net investment income | | | | | | | | |
Class A | | | (3,331,452 | ) | | | (2,158,318 | ) |
Class B | | | (1,939,614 | ) | | | (960,456 | ) |
Class E | | | (718,470 | ) | | | (460,789 | ) |
| | | | | | | | |
| | | (5,989,536 | ) | | | (3,579,563 | ) |
| | | | | | | | |
Net realized gain | | | | | | | | |
Class A | | | (21,955,683 | ) | | | (11,564,986 | ) |
Class B | | | (16,021,212 | ) | | | (7,352,063 | ) |
Class E | | | (5,395,059 | ) | | | (3,023,339 | ) |
| | | | | | | | |
| | | (43,371,954 | ) | | | (21,940,388 | ) |
| | | | | | | | |
Total distributions | | | (49,361,490 | ) | | | (25,519,951 | ) |
| | | | | | | | |
Increase in net assets from capital share transactions | | | 33,833,678 | | | | 38,567,976 | |
| | | | | | | | |
Net increase (decrease) in net assets | | | (202,077,657 | ) | | | 50,258,004 | |
| | |
Net Assets | | | | | | | | |
Beginning of the period | | | 539,781,133 | | | | 489,523,129 | |
| | | | | | | | |
End of the period | | $ | 337,703,476 | | | $ | 539,781,133 | |
| | | | | | | | |
Undistributed Net Investment Income | | | | | | | | |
End of the period | | $ | 6,345,944 | | | $ | 6,173,508 | |
| | | | | | | | |
Other Information:
Capital Shares
Transactions in capital shares were as follows:
| | | | | | | | | | | | | | |
| | | Year ended
December 31, 2008 | | | Year ended
December 31, 2007 | |
| | | Shares | | | $ | | | Shares | | | $ | |
Class A | | | | | | | | | | | | | | |
Sales | | 3,116,329 | | | $ | 34,566,629 | | | 4,340,847 | | | $ | 66,856,252 | |
Reinvestments | | 1,909,904 | | | | 25,287,135 | | | 896,362 | | | | 13,723,304 | |
Redemptions | | (4,299,649 | ) | | | (51,736,068 | ) | | (4,618,014 | ) | | | (70,812,369 | ) |
| | | | | | | | | | | | | | |
Net increase | | 726,584 | | | $ | 8,117,696 | | | 619,195 | | | $ | 9,767,187 | |
| | | | | | | | | | | | | | |
Class B | | | | | | | | | | | | | | |
Sales | | 3,550,445 | | | $ | 38,773,209 | | | 3,748,247 | | | $ | 57,206,524 | |
Reinvestments | | 1,365,842 | | | | 17,960,826 | | | 546,158 | | | | 8,312,519 | |
Redemptions | | (2,254,985 | ) | | | (27,817,619 | ) | | (2,270,652 | ) | | | (34,591,355 | ) |
| | | | | | | | | | | | | | |
Net increase | | 2,661,302 | | | $ | 28,916,416 | | | 2,023,753 | | | $ | 30,927,688 | |
| | | | | | | | | | | | | | |
Class E | | | | | | | | | | | | | | |
Sales | | 471,315 | | | $ | 5,014,481 | | | 632,527 | | | $ | 9,674,075 | |
Reinvestments | | 463,497 | | | | 6,113,529 | | | 228,318 | | | | 3,484,128 | |
Redemptions | | (1,196,453 | ) | | | (14,328,444 | ) | | (1,001,707 | ) | | | (15,285,102 | ) |
| | | | | | | | | | | | | | |
Net decrease | | (261,641 | ) | | $ | (3,200,434 | ) | | (140,862 | ) | | $ | (2,126,899 | ) |
| | | | | | | | | | | | | | |
Increase derived from capital share transactions | | | | | $ | 33,833,678 | | | | | | $ | 38,567,976 | |
| | | | | | | | | | | | | | |
See accompanying notes to financial statements.
MSF-13
Metropolitan Series Fund, Inc.
MetLife Mid Cap Stock Index Portfolio
Financial Highlights
| | | | | | | | | | | | | | | | | | | | |
| | | Class A | |
| | | Year ended December 31, | |
| | | 2008 | | | 2007 | | | 2006 | | | 2005 | | | 2004 | |
Net Asset Value, Beginning of Period | | $ | 15.03 | | | $ | 14.64 | | | $ | 14.43 | | | $ | 13.71 | | | $ | 11.90 | |
| | | | | | | | | | | | | | | | | | | | |
Income From Investment Operations | | | | | | | | | | | | | | | | | | | | |
Net investment income | | | 0.18 | (a) | | | 0.20 | (a) | | | 0.18 | | | | 0.15 | | | | 0.11 | |
Net realized and unrealized gain (loss) of investments | | | (5.12 | ) | | | 0.95 | | | | 1.27 | | | | 1.40 | | | | 1.79 | |
| | | | | | | | | | | | | | | | | | | | |
Total from investment operations | | | (4.94 | ) | | | 1.15 | | | | 1.45 | | | | 1.55 | | | | 1.90 | |
| | | | | | | | | | | | | | | | | | | | |
Less Distributions | | | | | | | | | | | | | | | | | | | | |
Distributions from net investment income | | | (0.19 | ) | | | (0.12 | ) | | | (0.19 | ) | | | (0.10 | ) | | | (0.06 | ) |
Distributions from net realized capital gains | | | (1.24 | ) | | | (0.64 | ) | | | (1.05 | ) | | | (0.73 | ) | | | (0.03 | ) |
| | | | | | | | | | | | | | | | | | | | |
Total distributions | | | (1.43 | ) | | | (0.76 | ) | | | (1.24 | ) | | | (0.83 | ) | | | (0.09 | ) |
| | | | | | | | | | | | | | | | | | | | |
Net Asset Value, End of Period | | $ | 8.66 | | | $ | 15.03 | | | $ | 14.64 | | | $ | 14.43 | | | $ | 13.71 | |
| | | | | | | | | | | | | | | | | | | | |
Total Return (%) | | | (36.2 | ) | | | 7.8 | | | | 10.1 | | | | 12.3 | | | | 16.0 | |
Ratio of operating expenses to average net assets (%) | | | 0.32 | | | | 0.31 | | | | 0.33 | | | | 0.34 | | | | 0.35 | |
Ratio of operating expenses to average net assets without giving effect to the contractual expense agreement would have been (%) (b) | | | 0.33 | | | | 0.32 | | | | 0.34 | | | | 0.34 | | | | N/A | |
Ratio of net investment income to average net assets (%) | | | 1.52 | | | | 1.33 | | | | 1.28 | | | | 1.18 | | | | 0.85 | |
Portfolio turnover rate (%) | | | 33 | | | | 37 | | | | 34 | | | | 33 | | | | 42 | |
Net assets, end of period (000) | | $ | 166,319 | | | $ | 277,839 | | | $ | 261,588 | | | $ | 232,461 | | | $ | 197,642 | |
| | | | | | | | | | | | | | | | | | | | |
| | | Class B | |
| | | Year ended December 31, | |
| | | 2008 | | | 2007 | | | 2006 | | | 2005 | | | 2004 | |
Net Asset Value, Beginning of Period | | $ | 14.91 | | | $ | 14.53 | | | $ | 14.32 | | | $ | 13.61 | | | $ | 11.83 | |
| | | | | | | | | | | | | | | | | | | | |
Income From Investment Operations | | | | | | | | | | | | | | | | | | | | |
Net investment income | | | 0.15 | (a) | | | 0.16 | (a) | | | 0.14 | | | | 0.11 | | | | 0.06 | |
Net realized and unrealized gain (loss) of investments | | | (5.09 | ) | | | 0.94 | | | | 1.26 | | | | 1.40 | | | | 1.79 | |
| | | | | | | | | | | | | | | | | | | | |
Total from investment operations | | | (4.94 | ) | | | 1.10 | | | | 1.40 | | | | 1.51 | | | | 1.85 | |
| | | | | | | | | | | | | | | | | | | | |
Less Distributions | | | | | | | | | | | | | | | | | | | | |
Distributions from net investment income | | | (0.15 | ) | | | (0.08 | ) | | | (0.14 | ) | | | (0.07 | ) | | | (0.04 | ) |
Distributions from net realized capital gains | | | (1.24 | ) | | | (0.64 | ) | | | (1.05 | ) | | | (0.73 | ) | | | (0.03 | ) |
| | | | | | | | | | | | | | | | | | | | |
Total distributions | | | (1.39 | ) | | | (0.72 | ) | | | (1.19 | ) | | | (0.80 | ) | | | (0.07 | ) |
| | | | | | | | | | | | | | | | | | | | |
Net Asset Value, End of Period | | $ | 8.58 | | | $ | 14.91 | | | $ | 14.53 | | | $ | 14.32 | | | $ | 13.61 | |
| | | | | | | | | | | | | | | | | | | | |
Total Return (%) | | | (36.4 | ) | | | 7.5 | | | | 9.8 | | | | 12.0 | | | | 15.7 | |
Ratio of operating expenses to average net assets (%) | | | 0.57 | | | | 0.56 | | | | 0.58 | | | | 0.59 | | | | 0.60 | |
Ratio of operating expenses to average net assets without giving effect to the contractual expense agreement would have been (%) (b) | | | 0.58 | | | | 0.57 | | | | 0.59 | | | | 0.59 | | | | N/A | |
Ratio of net investment income to average net assets (%) | | | 1.29 | | | | 1.07 | | | | 1.03 | | | | 0.94 | | | | 0.61 | |
Portfolio turnover rate (%) | | | 33 | | | | 37 | | | | 34 | | | | 33 | | | | 42 | |
Net assets, end of period (000) | | $ | 133,390 | | | $ | 192,044 | | | $ | 157,773 | | | $ | 111,361 | | | $ | 64,207 | |
| Please | see following page for Financial Highlights footnote legend. |
See accompanying notes to financial statements.
MSF-14
Metropolitan Series Fund, Inc.
MetLife Mid Cap Stock Index Portfolio
Financial Highlights
| | | | | | | | | | | | | | | | | | | | |
| | | Class E | |
| | | Year ended December 31, | |
| | | 2008 | | | 2007 | | | 2006 | | | 2005 | | | 2004 | |
Net Asset Value, Beginning of Period | | $ | 14.96 | | | $ | 14.57 | | | $ | 14.37 | | | $ | 13.65 | | | $ | 11.86 | |
| | | | | | | | | | | | | | | | | | | | |
Income From Investment Operations | | | | | | | | | | | | | | | | | | | | |
Net investment income | | | 0.17 | (a) | | | 0.18 | (a) | | | 0.17 | | | | 0.14 | | | | 0.08 | |
Net realized and unrealized gain (loss) of investments | | | (5.12 | ) | | | 0.95 | | | | 1.24 | | | | 1.39 | | | | 1.79 | |
| | | | | | | | | | | | | | | | | | | | |
Total from investment operations | | | (4.95 | ) | | | 1.13 | | | | 1.41 | | | | 1.53 | | | | 1.87 | |
| | | | | | | | | | | | | | | | | | | | |
Less Distributions | | | | | | | | | | | | | | | | | | | | |
Distributions from net investment income | | | (0.16 | ) | | | (0.10 | ) | | | (0.16 | ) | | | (0.08 | ) | | | (0.05 | ) |
Distributions from net realized capital gains | | | (1.24 | ) | | | (0.64 | ) | | | (1.05 | ) | | | (0.73 | ) | | | (0.03 | ) |
| | | | | | | | | | | | | | | | | | | | |
Total distributions | | | (1.40 | ) | | | (0.74 | ) | | | (1.21 | ) | | | (0.81 | ) | | | (0.08 | ) |
| | | | | | | | | | | | | | | | | | | | |
Net Asset Value, End of Period | | $ | 8.61 | | | $ | 14.96 | | | $ | 14.57 | | | $ | 14.37 | | | $ | 13.65 | |
| | | | | | | | | | | | | | | | | | | | |
Total Return (%) | | | (36.3 | ) | | | 7.7 | | | | 9.9 | | | | 12.2 | | | | 15.9 | |
Ratio of operating expenses to average net assets (%) | | | 0.47 | | | | 0.46 | | | | 0.48 | | | | 0.49 | | | | 0.50 | |
Ratio of operating expenses to average net assets without giving effect to the contractual expense agreement would have been (%) (b) | | | 0.48 | | | | 0.47 | | | | 0.49 | | | | 0.49 | | | | N/A | |
Ratio of net investment income to average net assets (%) | | | 1.36 | | | | 1.18 | | | | 1.12 | | | | 1.03 | | | | 0.71 | |
Portfolio turnover rate (%) | | | 33 | | | | 37 | | | | 34 | | | | 33 | | | | 42 | |
Net assets, end of period (000) | | $ | 37,995 | | | $ | 69,898 | | | $ | 70,162 | | | $ | 66,712 | | | $ | 62,530 | |
| (a) | Per share amount is based on average shares outstanding during the period. |
| (b) | See Note 4 of the Notes to Financial Statements. |
See accompanying notes to financial statements.
MSF-15
Metropolitan Series Fund, Inc.
MetLife Mid Cap Stock Index Portfolio
Notes to Financial Statements—December 31, 2008
Metropolitan Series Fund, Inc. (the “Fund”) is organized as a corporation under the laws of Maryland pursuant to Articles of Incorporation filed on November 23, 1982, as amended, and registered under the Investment Company Act of 1940, as amended (the “1940 Act”), as an open-end investment company. The Fund is a “series” type of mutual fund, which issues separate series of stock. Each series represents an interest in a separate portfolio of Fund investments. The MetLife Mid Cap Stock Index Portfolio (the “Portfolio”) is a diversified series of the Fund. Shares in the Fund are not offered directly to the general public and are currently available only to separate accounts established by Metropolitan Life Insurance Company (“MetLife”), New England Life Insurance Company, General American Life Insurance Company (“General American”), The MetLife Investors Group of Insurance Companies, MetLife Insurance Company of Connecticut and other affiliated insurance companies (collectively, the “Insurance Companies”) and to certain eligible qualified retirement plans (“Qualified Plans”), as an investment vehicle for variable life insurance, group annuity or variable annuity products of these insurance companies or Qualified Plans, although the Portfolio is not available to all such separate accounts and Qualified Plans. The Portfolio’s shares may be divided into different classes. Currently, the classes being offered by the Portfolio are named Class A, Class B and Class E. The classes of the Portfolio’s shares are identical, except that certain additional charges (Rule 12b-1 fees) are made against Class B and Class E shares. Investment income, realized and unrealized capital gains and losses, the common expenses of the Portfolio and certain Portfolio-level expense reductions, if any, are allocated daily, on a pro rata basis, to each class based on the relative net assets of each class to the total net assets of the Portfolio.
| 2. | SIGNIFICANT ACCOUNTING POLICIES: |
The preparation of financial statements in conformity with accounting principles generally accepted in the United States of America (“GAAP”) requires management to make estimates and assumptions that affect the reported amounts of assets and liabilities and disclosure of contingent assets and liabilities as of the date of the financial statements and the reported amounts of income and expenses during the reporting period. Actual results could differ from those estimates.
The following is a summary of significant accounting policies consistently followed by the Portfolio in the preparation of its financial statements. The policies are in conformity with GAAP.
Investment Valuation:
Debt securities (other than short term obligations with a remaining maturity of sixty days or less) are generally valued on the basis of evaluated or composite bid quotations obtained by independent pricing services and/or brokers and dealers selected by the relevant subadviser pursuant to authorization of the Board of Directors of the Fund (the “Board” or “Directors”). Such quotations take into account appropriate factors such as institutional-sized trading in similar groups of securities, yield, quality, coupon rate, maturity, type of issue, trading characteristics and other data. Short term obligations with a remaining maturity of sixty days or less are valued at amortized cost which approximates fair market value.
Equity securities traded on a national securities exchange or other exchanges are valued at their last sale price on the principal trading market. Equity securities traded on the NASDAQ National Market System are valued at the NASDAQ Official Closing Price (the “NOCP”). The NOCP is the last reported sale price if the last reported sale price falls between the spread of the last reported bid and asked prices. If the last reported bid and asked prices are above the last reported sale price, the NOCP will be the last reported bid price. If the last reported bid and asked prices are below the last reported sale price, the NOCP will be the last reported asked price. Equity securities traded on a national securities exchange or other exchanges or on the NASDAQ National Market System for which there is no reported sale during the day are valued at the last reported bid price. A security that is listed or traded on more than one exchange is valued at the quotation on the exchange determined to be the primary market for that security by the Board or its delegates. If no closing price is available, then such securities are valued by using the last reported bid price. Equity securities traded over-the-counter are valued at the last reported sales price.
If no current market value quotation is readily available or reliable for a portfolio security, fair value will be determined in accordance with procedures established by and under the general supervision of the Board. When the Portfolio uses fair value pricing, it may take into account any factors it deems appropriate. The value of securities used by the Portfolio to calculate its net asset value may differ from quoted or published prices for the same securities. Fair value pricing involves subjective judgments and the fair value determined for a security may be materially different than the value that could be realized upon the sale of that security.
MSF-16
Metropolitan Series Fund, Inc.
MetLife Mid Cap Stock Index Portfolio
Notes to Financial Statements—December 31, 2008—(Continued)
The Portfolio expects to use fair value pricing for securities primarily traded on U.S. exchanges only under very limited circumstances. For example, the Portfolio may use fair value pricing if the exchange on which a security is traded closes early or trading in the security is suspended.
Securities traded primarily on an exchange outside of the United States which closes before the close of the New York Stock Exchange will be valued at the last sales price on that non-U.S. exchange. Securities traded primarily on an exchange outside of the United States for which there is no reported sale during the day are valued at the mean between the last reported bid and asked prices. However, because most foreign markets close well before the Portfolio values its securities (typically at 4 p.m. Eastern Time), the earlier close of these foreign markets gives rise to the possibility that significant events, including broad market moves, may have occurred after these foreign markets close but before the Portfolio values its securities. To account for this, the Portfolio may frequently value many of its foreign equity securities using fair value prices based on third party vendor modeling tools.
Options, whether on securities, indices, futures contracts, or otherwise, are valued at the last sales price available as of the close of business on the day of valuation or, if there is no such sale price available, at the mean between the bid and asked prices. Options on currencies are valued at the spot price each day.
The value of futures contracts will be the sum of the margin deposit plus or minus the difference between the value of the futures contract on each day the net asset value is calculated and the value on the date the futures contract originated, value being that established on a recognized commodity exchange, or by reference to other customary sources, with gain or loss being realized when the futures contract closes or expires.
Subject to the Board’s oversight, the Board has delegated the day-to-day oversight of pricing matters, including determinations in good faith under the Fund’s procedures the fair value of securities for which current market quotations are not readily available to the subadviser of the Portfolio.
Investment Transactions and Related Investment Income:
Portfolio security transactions are recorded on the trade date. Dividend income is recorded on the ex-dividend date or, for certain foreign securities, when notified. Interest income, which includes amortization of premium and accretion of discount on debt securities, is recorded on the accrual basis. Realized gains and losses on investments and unrealized appreciation and depreciation are determined on the identified cost basis, which is the same basis used for federal income tax purposes.
Repurchase Agreements:
The Portfolio, through the custodian or a subcustodian, receives delivery of the underlying securities collateralizing repurchase agreements. The Portfolio requires the custodian to take possession, to have legally segregated in the Federal Reserve Book Entry System, or to have segregated within the custodian’s vault, all securities held as collateral for repurchase agreements. It is the Portfolio’s policy that the market value of the collateral be at least equal to 100% of the repurchase price in the case of a repurchase agreement of one-day duration and 102% on all other repurchase agreements. The Portfolio’s subadviser is responsible for determining that the value of the collateral is at all times at least equal to the repurchase price. In connection with transactions in repurchase agreements, if the seller defaults and the value of the collateral declines or if the seller enters an insolvency proceeding, realization of the collateral by the Portfolio may be delayed, limited or wholly denied.
Futures Contracts:
The Portfolio may buy and sell futures contracts (on recognized exchanges) as a hedge or to enhance return. Futures contracts are agreements to buy or sell a security, or deliver a final cash settlement price in connection with an index, interest rate, currency, or other contracts not calling for physical delivery, for a set price in the future. The Portfolio must post an amount equal to a portion of the total market value of the futures contract as futures variation margin, which is returned when the Portfolio’s obligations under the contract have been satisfied. From time to time thereafter, the Portfolio may have to post variation margin to maintain this amount as the market value of the contract fluctuates. Risks of entering into futures contracts (and related options) include the possibility that there may be an illiquid market and that a change in the value of the contract or option may not correlate with changes in the value of the underlying securities.
Options:
The Portfolio may use options to enhance returns or to hedge against changes in values of securities the Portfolio owns or expects to purchase. Writing puts or buying calls tends to increase the Portfolio’s exposure to the underlying instrument and writing calls
MSF-17
Metropolitan Series Fund, Inc.
MetLife Mid Cap Stock Index Portfolio
Notes to Financial Statements—December 31, 2008—(Continued)
or buying puts tends to decrease the Portfolio’s exposure to the underlying instrument, and can be used to hedge other Portfolio investments. For options purchased to hedge the Portfolio’s investments, the potential risk to the Portfolio is that the change in value of options contracts may not correspond to the change in value of the hedged instruments. In addition, losses may arise from changes in the value of the underlying instruments, if there is an illiquid secondary market, or if the counterparty is unable to perform. The maximum loss for purchased options is limited to the premium initially paid for the option. For options written by the Portfolio, the maximum loss is not limited to the premium initially received for the option.
The main risk associated with purchasing an option is that the option expires without being exercised. In this case, the option expires worthless and the premium paid for the option is considered the loss. The risk associated with writing a call option is that the Portfolio may forgo the opportunity for a profit if the market value of the underlying position increases and the option is exercised. The risk in writing a put option is that the Portfolio may incur a loss if the market value of the underlying position decreases and the option is exercised. In addition, the Portfolio risks not being able to enter into a closing transaction for the written option as the result of an illiquid market.
“When-Issued” Securities:
Purchasing securities “when-issued” is a forward commitment by the Portfolio to buy a security. The estimated amount of the Portfolio’s payment obligation and the security’s interest rate are determined when the commitment is made, even though no interest accrues until the security is issued, which is generally 15 to 120 days later. The Portfolio will segregate liquid assets with its custodian sufficient at all times to satisfy these commitments. If the value of the security is less when delivered than when the commitment was made, the Portfolio will suffer a loss.
Federal Income Taxes:
It is the Portfolio’s policy to comply with the requirements of the Internal Revenue Code of 1986, as amended (the “Code”), and regulations thereunder, applicable to regulated investment companies and to distribute, with respect to each taxable year, all of its taxable income to shareholders. Therefore, no federal income tax provision is required. The Portfolio is subject to the provisions of the Financial Accounting Standards Board Interpretation (“FASB”) No. 48, Accounting for Uncertainties in Income Taxes (FIN 48). FIN 48 sets forth a minimum threshold for financial statement recognition of the benefit of a tax position taken or expected to be taken in a tax return. The implementation of FIN 48 did not result in any unrecognized tax benefits in the accompanying financial statements. Each of the Portfolio’s federal tax returns for the prior three fiscal years remains subject to examination by the Internal Revenue Service.
As of December 31, 2008, the Portfolio had no capital loss carryforwards.
Pursuant to Section 852 of the Code, the Portfolio designated the amount shown below under Long Term Gain as capital gain dividends for its taxable year ended December 31, 2008. The tax character of distributions paid for the periods ended December 31, 2008 and 2007 was as follows:
| | | | | | | | | | | | | | | | | | | | | | |
| Ordinary Income | | Long Term Gain | | Return of Capital | | Total |
| 2008 | | 2007 | | 2008 | | 2007 | | 2008 | | 2007 | | 2008 | | 2007 |
| $ | 9,455,092 | | $ | 5,524,511 | | $ | 39,906,398 | | $ | 19,995,440 | | $ | — | | $ | — | | $ | 49,361,490 | | $ | 25,519,951 |
As of December 31, 2008, the components of distributable earnings (accumulated losses) on a federal income tax basis were as follows:
| | | | | | | | | | | | | | |
Undistributed
Ordinary
Income | | Undistributed
Long Term
Gain | | Unrealized
Depreciation | | | Loss
Carryforwards | | Total | |
$6,345,944 | | $ | 15,083,089 | | $ | (137,026,538 | ) | | $ | — | | $ | (115,597,505 | ) |
Pursuant to Federal income tax regulations applicable to investment companies, the Portfolio has elected to treat net capital losses realized between November 1 and December 31 of each year as occurring on the first day of the following tax year. For the year ended December 31, 2008, the following amounts of realized capital and currency losses reflected in the accompanying financial statements will not be recognized for Federal income tax purposes until January 1, 2009:
| | | | |
Currency | | Capital | |
$— | | $ | (1,814,699 | ) |
MSF-18
Metropolitan Series Fund, Inc.
MetLife Mid Cap Stock Index Portfolio
Notes to Financial Statements—December 31, 2008—(Continued)
Dividends and Distributions to Shareholders:
The Portfolio records dividends and distributions on the ex-dividend date. Net realized gains from security transactions (if any) are generally distributed annually to shareholders. The timing and characterization of certain income and capital gains distributions are determined in accordance with federal tax regulations that may differ from GAAP. Permanent book and tax basis differences relating to shareholder distributions will result in reclassification between under/over distributed net investment income, accumulated net realized gains/losses and paid in capital.
| 3. | INVESTMENT TRANSACTIONS: |
For the year ended December 31, 2008, purchases and sales of securities (excluding short term investments) for the Portfolio were as follows:
| | | | | | | | | |
Purchases | | Sales |
U.S. Government | | Other | | U.S. Government | | Other |
$0 | | $ | 148,392,845 | | $ | 0 | | $ | 152,342,140 |
| 4. | INVESTMENT MANAGEMENT FEES AND OTHER TRANSACTIONS WITH AFFILIATES: |
Investment Management Agreement:
MetLife Advisers, LLC (“MetLife Advisers”) is the investment adviser to the Portfolio. The Fund has entered into an investment management agreement with MetLife Advisers with respect to the Portfolio. For providing investment management services to the Portfolio, MetLife Advisers receives monthly compensation at the annual rate of 0.25% of average daily net assets. Fees earned by MetLife Advisers with respect to the Portfolio for the year ended December 31, 2008 were $1,126,832.
Certain officers and directors of the Fund may also be officers of MetLife Advisers; however, such officers and directors receive no compensation from the Fund.
MetLife Advisers has entered into an investment subadvisory agreement with MetLife Investment Advisors, LLC (“MLIAC”) with respect to the Portfolio. MetLife Advisers pays MLIAC an investment subadvisory fee for the Portfolio equal to the costs incurred by MLIAC in providing subadvisory services to the Portfolio. Fees earned by MLIAC with respect to the Portfolio for the year ended December 31, 2008 were $103,669.
Management Fee Waivers:
Pursuant to an expense agreement, MetLife Advisers has agreed, for the period May 1, 2008 to April 30, 2009, to reduce its advisory fees set out above under “Investment Management Agreement” for each class of the Portfolio at the annual rate of 0.007% of average daily net assets. A similar expense agreement was in place for the period May 1, 2007 through April 30, 2008. Amounts waived for the year ended December 31, 2008 are shown as management fee waivers in the Statement of Operations.
Service and Distribution Fees:
The Fund has adopted a Distribution and Service Plan under Rule 12b-1 of the 1940 Act for the Portfolio’s Class B and E shares. Under the Distribution and Service Plan, the Class B and E shares of the Portfolio pay a fee to compensate the Insurance Companies (or their affiliates) and other broker-dealers and financial intermediaries involved in the offer and sale of Portfolio shares for promoting or selling and servicing the Class B and E shares. The fees under the Distribution and Service Plan for each class of the Portfolio’s shares are calculated as a percentage of the Portfolio’s average daily net assets that are attributable to that Class. Currently, the fee is 0.25% per year for Class B shares and 0.15% per year for Class E shares. Amounts paid by the Portfolio for the year ended December 31, 2008 are shown as Service and Distribution fees in the Statement of Operations.
The Fund has entered into a securities lending arrangement with the Fund’s custodian, State Street Bank and Trust Company (the “custodian”). Under the agreement, the custodian is authorized to loan securities on the Portfolios’ behalf. In exchange, the Portfolio receives either cash or securities as collateral against the loaned securities. The Portfolio receives collateral at least equal to 102% of the market value of the loaned securities (105% for foreign securities), at each loan’s inception. Collateral must be maintained at least at 100% of the market value of the loaned securities for the duration of the loan. The cash collateral is
MSF-19
Metropolitan Series Fund, Inc.
MetLife Mid Cap Stock Index Portfolio
Notes to Financial Statements—December 31, 2008—(Continued)
invested in the Navigator Securities Lending Prime Portfolio, an affiliate of the custodian, which invests in a variety of high quality U.S. dollar-denominated instruments. If the market value of the collateral at the close of trading on a business day is less than 100% of the market value of the loaned securities at the close of trading on that day, the borrower shall be required to deliver, by the close of business on the following business day, an additional amount of collateral, equal to at least 100% of the market value of all the loaned securities as of such preceding day. The Portfolio receives 80% of the annual net income from securities lending transactions, which is included in interest income of the Portfolio. The remaining 20% is paid to the custodian as compensation for its securities lending services. Interest income received by the Portfolio via lending transactions during the year ended December 31, 2008 is footnoted in the Statement of Operations. The Portfolio bears the risk of any deficiency in the amount of collateral available for return to a borrower due to a loss in an approved investment purchased with such collateral. Any outstanding loans by the Portfolio at December 31, 2008 are footnoted in the Schedule of Investments.
| 6. | MARKET AND CREDIT RISK: |
In the normal course of business, the Portfolio invests in securities and enters into transactions where risks exist due to fluctuations in the market (market risk) or failure of the other party to a transaction to perform (credit risk). The value of securities held by the Portfolio may decline in response to certain events, including those directly involving the companies whose securities are owned by the Portfolio; conditions affecting the general economy; overall market changes; local, regional or global political, social or economic instability; and currency and interest rate and price fluctuations. Similar to credit risk, the Portfolio may be exposed to counterparty risk, or the risk that an entity with which the Portfolio has unsettled or open transactions may default. Financial assets, which potentially expose the Portfolio to credit and counterparty risks, consist principally of investments and cash due from counterparties. The extent of the Portfolio’s exposure to credit and counterparty risks in respect to these financial assets approximates their value as recorded in the Portfolio’s Statements of Assets and Liabilities.
| 7. | RECENT ACCOUNTING PRONOUNCEMENTS: |
In March 2008, the FASB issued Statement of Financial Accounting Standards No. 161, Disclosures about Derivative Instruments and Hedging Activities (“FAS 161”), an amendment of FASB Statement No. 133. FAS 161 requires enhanced disclosures about (a) how and why an entity uses derivative instruments, (b) how derivative instruments and hedging activities are accounted for, and (c) how derivative instruments and related hedging activities affect a fund’s financial position, financial performance, and cash flows. Management does not believe the adoption of FAS 161 will materially impact the financial statement amounts, but will require additional disclosures. This will include qualitative and quantitative disclosures on derivative positions existing at period end and the effect of using derivatives during the reporting period. FAS 161 is effective for financial statements issued for fiscal years and interim periods beginning after November 15, 2008. Management is currently evaluating the impact the adoption of FAS 161 will have on the Portfolio’s financial statement disclosures.
MSF-20
Metropolitan Series Fund, Inc.
MetLife Mid Cap Stock Index Portfolio
Report of Independent Registered Public Accounting Firm
To the Shareholders and Board of Directors of Metropolitan Series Fund, Inc.:
We have audited the accompanying statement of assets and liabilities, including the schedule of investments, of the MetLife Mid Cap Stock Index Portfolio (one of the portfolios constituting the Metropolitan Series Fund, Inc.) (the “Fund”) as of December 31, 2008, and the related statement of operations for the year then ended, the statements of changes in net assets for each of the two years in the period then ended, and the financial highlights for each of the five years in the period then ended. These financial statements and financial highlights are the responsibility of the Fund’s management. Our responsibility is to express an opinion on these financial statements and financial highlights based on our audits.
We conducted our audits in accordance with the standards of the Public Company Accounting Oversight Board (United States). Those standards require that we plan and perform the audit to obtain reasonable assurance about whether the financial statements and financial highlights are free of material misstatement. The Fund is not required to have, nor were we engaged to perform, an audit of its internal control over financial reporting. Our audits included consideration of internal control over financial reporting as a basis for designing audit procedures that are appropriate in the circumstances, but not for the purpose of expressing an opinion on the effectiveness of the Fund’s internal control over financial reporting. Accordingly, we express no such opinion. An audit also includes examining, on a test basis, evidence supporting the amounts and disclosures in the financial statements, assessing the accounting principles used and significant estimates made by management, as well as evaluating the overall financial statement presentation. Our procedures included confirmation of securities owned as of December 31, 2008, by correspondence with the custodian and brokers; where replies were not received from brokers, we performed other auditing procedures. We believe that our audits provide a reasonable basis for our opinion.
In our opinion, the financial statements and financial highlights referred to above present fairly, in all material respects, the financial position of the MetLife Mid Cap Stock Index Portfolio of the Metropolitan Series Fund, Inc. as of December 31, 2008, the results of its operations for the year then ended, the changes in its net assets for each of the two years in the period then ended, and the financial highlights for each of the five years in the period then ended, in conformity with accounting principles generally accepted in the United States of America.
Deloitte & Touche LLP
Boston, Massachusetts
February 24, 2009
MSF-21
Metropolitan Series Fund, Inc.
Directors and Officers
The Fund’s Directors review actions of the Fund’s investment adviser and subadvisers, and decide upon matters of general policy. The Fund’s officers supervise the daily business operations of the Fund. The Board of Directors and the Fund’s officers are listed below. Each Director is responsible for overseeing all 38 Portfolios of the Fund. There is no limit to the term a Director may serve. Directors serve until their resignation, retirement or removal in accordance with the Fund’s organizational documents and policies adopted by the Board from time to time. Officers hold office at the pleasure of the Board or until the election or appointment and the qualification of a successor. The address of the Directors and officers is c/o Metropolitan Series Fund, Inc., 501 Boylston Street, Boston, MA 02116.
Interested Directors(1)
Each Director below is an “interested person” (as defined by the 1940 Act) with respect to the Fund in that Ms. Forget is an employee of MetLife and Mr. Typermass is a former employee of MetLife and owns securities issued by MetLife, Inc., the ultimate parent company of MetLife Advisers.
| | | | | | | | |
Name, Address and Age | | Current
position(s)
with Fund | | Position(s)
held since | | Principal occupations
over past five years, including other directorships(2) | | Number of
Portfolios in
Fund Complex
Overseen by
Director(3) |
Elizabeth M. Forget Age: 42 | | Director, Chairman of the Board, President and Chief Executive Officer | | 2006 | | Senior Vice President (since 2007), MetLife, Inc.; President, Met Investors Advisory, LLC; Trustee and President, Met Investors Series Trust; Executive Vice President, MetLife Investors Group, Inc.; President, Chief Executive Officer and Chair of the Board of Managers (since 2006), MetLife Advisers; President, Met Investors Advisory, LLC. | | 87 |
| | | | |
Arthur G. Typermass Age: 71 | | Director | | 1998 | | Formerly, Senior Vice President and Treasurer, MetLife. | | 38 |
Non-Interested Directors(1)
Each Director below is not an “interested person” (as defined by the 1940 Act) with respect to the Fund (collectively, the “Independent Directors”).
| | | | | | | | |
Name, Address and Age | | Current
position(s)
with Fund | | Position(s)
held since | | Principal occupations
over past five years, including other directorships(2) | | Number of
Portfolios in
Fund Complex
Overseen by
Director(3) |
Steve A. Garban† Age: 71 | | Director | | 1985 | | Formerly, Chief Financial Officer, Senior Vice President Finance and Operations and Treasurer (Emeritus), The Pennsylvania State University. | | 38 |
| | | | |
Linda B. Strumpf Age: 61 | | Director | | 2000 | | Vice President and Chief Investment Officer, Ford Foundation. | | 38 |
| | | | |
Michael S. Scott Morton† Age: 71 | | Director | | 1993 | | Jay W. Forrester Professor of Management (Emeritus) at Sloan School of Management, MIT. | | 38 |
| | | | |
H. Jesse Arnelle Age: 75 | | Director | | 2001 | | Formerly, Counsel, Womble Carlyle Sandrie & Rice; Director, Textron Inc. (global multi- industry company)*; formerly, Director, Gannet Co. Inc. (diversified news and information company)*; formerly, Director, Eastman Chemical Company (global chemical company)*; formerly, Director, Waste Management, Inc.*; formerly, Director, Armstrong Holdings Inc. (parent company of floor and ceiling products business)*; formerly, Director, FPL Group Inc. (public utility holding company)*; Director, URS Corporation (engineering design services firm)*. | | 38 |
MSF-22
Metropolitan Series Fund, Inc.
Directors and Officers—(Continued)
| | | | | | | | |
Name, Address and Age | | Current
position(s)
with Fund | | Position(s)
held since | | Principal occupations
over past five years, including other directorships(2) | | Number of
Portfolios in
Fund Complex
Overseen by
Director(3) |
Nancy Hawthorne Age: 57 | | Director | | 2003 | | Chief Executive Officer, Clerestory LLC (corporate financial advisor); Director, Avid Technologies (computer software company)*; formerly, Chairman of the Board of Avid Technologies; formerly, Board of Advisors, L. Knife & Sons, Inc. (beverage distributor); formerly, Trustee, New England Zenith Fund (“Zenith Fund”)**; formerly, Chief Executive Officer and Managing Partner, Hawthorne, Krauss and Associates (corporate financial advisor); formerly, Chief Financial Officer and Executive Vice President, Continental Cablevision, subsequently renamed MediaOne (cable television company); formerly, Director, Life F/X, Inc.; formerly, Chairman of the Board, WorldClinic (distance medicine company); formerly, Director, Perini Corporation (construction company)*; formerly, Director, CGU (property and casualty insurance company); formerly, Director, Beacon Power Corporation (energy company)*. | | 38 |
| | | | |
John T. Ludes Age: 72 | | Director | | 2003 | | President, LFP Properties (consulting firm); Formerly, Trustee, Zenith Fund**; formerly, Vice Chairman, President and Chief Operating Officer, Fortune Brands/American Brands (global conglomerate); formerly, President and CEO, Acushnet Company (athletic equipment company). | | 38 |
Officers(1)
| | | | | | | | |
Name and address | | Age | | Current
position(s)
with Fund | | Position(s)
held since | | Principal occupations over past five years(2) |
| Jeffrey L. Bernier | | 37 | | Senior Vice President | | 2008 | | Vice President (since 2008), MetLife, Inc.; Vice President (since 2008), MetLife; Senior Vice President (since 2008), MetLife Advisers; formerly, Director and Senior Investment Analyst (2004 to 2007), John Hancock Financial Services; formerly, Assistant Vice President (2000 to 2001), Wachovia Securities. |
| | | | |
| Alan C. Leland | | 56 | | Senior Vice President | | 2005 | | Treasurer and Chief Financial Officer, MetLife Advisers, LLC; Treasurer (since 2005), Met Investors Advisory, LLC; Vice President (since 2004), Met Investors Advisory, LLC; Vice President (since 2003), MetLife, Inc.; Vice President, MetLife; Senior Vice President, NELICO. |
| | | | |
| Peter Duffy | | 53 | | Vice President
and Treasurer | | 2000 | | Senior Vice President, MetLife Advisers; Second Vice President (since 2003), NELICO; Vice President, MetLife (since 2004); Vice President (since 2004), MetLife, Inc.; formerly, Vice President and Treasurer, Zenith Fund**. |
| | | | |
| Jeffrey P. Halperin | | 41 | | Chief
Compliance Officer | | 2007 | | Vice President (since 2006), MetLife, Inc.; Vice President (since 2006), MetLife; Chief Compliance Officer (since 2006), Met Investors Series Trust, MetLife Advisers, Met Investors Advisory, LLC and MetLife Investment Advisors Company, LLC. |
| * | Indicates a directorship with a registered investment company or a company subject to the reporting requirements of the Securities Exchange Act of 1934, as amended. |
| ** | The Zenith Fund deregistered with the Securities and Exchange Commission (“SEC”) in 2004. |
| (†) | Served as a trustee, director and/or officer of one or more of the following companies, each of which had a direct or indirect advisory relationship with MetLife Advisers or its affiliates prior to January 31, 2005: State Street Research Financial Trust, State Street Research Income Trust, State Street Research Money Market Trust, State Street Research Institutional Funds, State Street Research Capital Trust, State Street Research Master Investment Trust, State Street Research Equity Trust, State Street Research Securities Trust and State Street Research Exchange Trust (collectively, the “State Street Research Funds”). |
| (1) | During the period shown, each Director of the Fund served as a Trustee of Metropolitan Series Fund II, a registered investment company that ceased investment operations in June of 2008 and has applied for deregistration under the Investment Company Act of 1940. During this period, each officer of the Fund served in the same position with Metropolitan Series Fund II. |
| (2) | Previous positions during the past five years with the Fund; Met Investors Series Trust; MetLife; MetLife, Inc.; MetLife Advisers; Met Investors Advisory, LLC; Zenith Fund; NELICO; or New England Securities Corporation are omitted if not materially different. |
| (3) | The Fund Complex includes the Fund (38 portfolios) and Met Investors Series Trust (49 portfolios). |
MSF-23
Metropolitan Series Fund, Inc.
MetLife Mid Cap Stock Index Portfolio
Board Approval of Advisory and Subadvisory Agreements
The Fund’s Contract Review Committees of the Board of Directors (the “Board” or the “Directors”) typically meet in early fall to review the Portfolios’ advisory agreements (the “Advisory Agreements”) and subadvisory agreements (the “Subadvisory Agreements,” and, together with the Advisory Agreements, the “Agreements”) and determine whether to recommend that the full Board approve the continuation of the Agreements for an additional one-year period. (Following the initial approval of an Agreement for a new Portfolio or with a new adviser or subadviser, such annual reviews are not required until 2 years following the execution of such Agreement.) After each Committee has made its recommendations, the full Board, including the Independent Directors, determines whether to approve the continuation of each of the Agreements. In addition, the Board, including the Independent Directors, considers matters bearing on the Agreements at most of its other meetings throughout the year and regularly interviews various individuals at MetLife Advisers responsible for the management of the Portfolios. The Directors also interview selected investment managers and other professionals at the subadvisers at various times throughout the year.
The Directors receive all materials that they or MetLife Advisers, the Fund’s investment adviser, and the subadvisers believe to be reasonably necessary for the Directors to evaluate the Agreements and determine whether to approve the continuation of the Agreements. These materials generally include, among other items, (i) information on the investment performance of the Portfolios and the performance of peer groups of funds and the Portfolios’ performance benchmarks, (ii) information on the Portfolios’ advisory and subadvisory fees and other expenses, including information comparing the Portfolios’ expenses to those of peer groups of funds and information about any applicable expense caps and fee “breakpoints,” (iii) sales and redemption data, (iv) information related to the profitability of the Agreements to MetLife Advisers and certain of the subadvisers, and potential “fall-out” or ancillary benefits that MetLife Advisers, the subadvisers or their affiliates may receive as a result of their relationships with the Fund and (v) information obtained through the subadvisers’ responses to certain requests from MetLife Advisers and the Directors and MetLife Advisers’ responses to requests from the Directors. The Directors may also consider other information such as (vi) MetLife Advisers’ and the subadvisers’ financial results and condition, (vii) each Portfolio’s investment objectives and strategies and the size, education and experience of the investment staffs of MetLife Advisers and the relevant subadvisers and their use of technology and external research, (viii) the allocation of the Portfolios’ brokerage, if any, including allocations to brokers affiliated with the subadvisers and the use of “soft” commission dollars to pay Portfolio expenses and to pay for research and other similar services, (ix) the resources devoted to, and the record of compliance with, the Portfolios’ investment policies and restrictions, policies on personal securities transactions and other compliance policies, (x) the responses of MetLife Advisers, the subadvisers and/or their affiliates to certain legal and regulatory proceedings and (xi) the economic outlook generally and for the mutual fund industry in particular. Throughout the process, the Directors have the opportunity to ask questions of and request additional materials from MetLife Advisers and the subadvisers.
Following meetings of each Contract Review Committee on September 10, 2008, the Board, including the Independent Directors, at its November 6-7, 2008 meeting, approved the continuation through December 31, 2009 of the Advisory Agreements for each Portfolio of the Fund and the Subadvisory Agreements for each Portfolio other than the Zenith Equity Portfolio and Asset Allocation Portfolios (which do not have subadvisers) and the Van Eck Global Natural Resources Portfolio, Met/Dimensional International Small Cap Portfolio and Loomis Sayles Small Cap Growth Portfolio (formerly known as the Franklin Templeton Small Cap Growth Portfolio). The Agreements approved for continuation are referred to below as the “Continued Agreements.”
In considering whether to approve the continuation of the Continued Agreements, the Directors, including the Independent Directors, did not identify any single factor as determinative, and each weighed the various factors as he or she deemed appropriate. The Directors considered the following matters in connection with their approval of the Continued Agreements:
The nature, extent and quality of the services provided to the relevant Portfolios under the Continued Agreements. The Directors considered the nature, extent and quality of the services provided by MetLife Advisers, the relevant subadvisers (if any) and their affiliates (each, an “Adviser,” and, collectively, the “Advisers”) to the relevant Portfolios pursuant to the Continued Agreements and the resources dedicated to these Portfolios by the Advisers. In particular, the Directors considered the Advisers’ abilities to attract and retain highly qualified investment professionals. With respect to MetLife Advisers, the Directors considered (for each Portfolio other than the Zenith Equity and Asset Allocation Portfolios) that MetLife Advisers is (i) ultimately responsible for the performance of such Portfolios; (ii) ultimately responsible for the establishment of the investment strategies of each such Portfolio, primarily through its recommendations to the Board regarding the hiring and selection of subadvisers; (iii) responsible for the hiring and selection, subject to Board approval, of subadvisers; and (iv) responsible for maintaining a program of Subadviser oversight reasonably designed to ensure that the subadvisers have reasonable compliance policies and procedures in place. The Directors also considered that MetLife Advisers provides a full range of day-to-day administrative services for the Portfolios involving all aspects of such Portfolios’ day-to-day operations (other than portfolio management). With respect to the Zenith Equity and Asset Allocation Portfolios, the Directors considered both the portfolio management services and the administrative services provided by MetLife Advisers. After reviewing
MSF-24
Metropolitan Series Fund, Inc.
MetLife Mid Cap Stock Index Portfolio
Board Approval of Advisory and Subadvisory Agreements—(Continued)
these and related factors, the Directors concluded, within the context of their overall conclusions regarding each of the Continued Agreements, that the nature, extent and quality of services provided supported the renewal of these Agreements.
Investment performance of the relevant Portfolios. The Directors reviewed information about the performance of the relevant Portfolios over various time periods, including information prepared by an independent third party that compared the performance of the Portfolios to the performance of peer groups of funds and performance benchmarks. The Directors also reviewed a description of the third party’s methodology for identifying a Portfolio’s peer group(s) for purposes of performance and expense comparisons.
In the case of each relevant Portfolio that had performance that lagged its peer group(s) for certain periods, the Directors concluded that other factors relevant to performance were sufficient, in light of other considerations, to warrant renewal of the Continued Agreements relating to such Portfolio. These factors varied from Portfolio to Portfolio, but included one or more of the following: (i) that such Portfolio’s performance, although lagging in certain recent periods, was stronger over the longer term; (ii) that the underperformance was attributable, to a significant extent, to investment decisions that were reasonable and consistent with the Portfolio’s investment objective(s) and policies and that the Portfolio was performing within the range of reasonable expectations, given market conditions and the Portfolio’s investment objective(s) and policies; (iii) that the Portfolio’s performance was competitive when compared to other relevant performance benchmarks or peer groups; and (iv) that MetLife Advisers and/or the relevant subadviser (if any) had taken or was taking steps designed to help improve the Portfolio’s investment performance (including, in the case of certain Portfolios, that MetLife Advisers was formulating possible proposals, for presentation to the Board in November 2008, to replace the Portfolio’s subadviser or to merge the Portfolio into another Portfolio with a similar investment objective and better investment performance).
The Directors also considered the investment performance of the Advisers and their reputations generally, the historical responsiveness of the Advisers to Director concerns about performance and the willingness of the Advisers to take steps intended to improve performance.
After reviewing these and related factors, the Directors concluded, within the context of their overall conclusions regarding each of the Continued Agreements, that the investment performance of each relevant Portfolio and Adviser was sufficient, in light of other considerations, to warrant the renewal of the Continued Agreements.
The costs of the services to be provided and profits to be realized by the Advisers and their affiliates from their relationships with the Portfolios. The Directors considered the fees charged by MetLife Advisers to the Portfolios for advisory services and, with respect to the subadvised Portfolios, by such subadvisers to MetLife Advisers for subadvisory services (such advisory and subadvisory fees (if any), collectively, “Fees”), as well as the total expense levels of the Portfolios. This information included comparisons (provided by an independent third party) of the Portfolios’ advisory fees and total expense levels to those of their peer groups. In evaluating Fees for the relevant Portfolios, the Directors also took into account the demands, complexity and quality of the investment management services provided to each Portfolio. The Directors considered MetLife Advisers’ recommendations regarding reductions in Fee rates, implementation of Fee breakpoints and institution of Fee waivers and expense caps.
The Directors also considered the compensation directly or indirectly received by the Advisers and their affiliates from their relationships with the relevant Portfolios. The Directors reviewed information relating to the profits received by MetLife Advisers, certain of the subadvisers and their affiliates as a result of their relationships with the relevant Portfolios, and information about the allocation of expenses used to calculate profitability. When reviewing profitability, the Directors also considered the performance of the relevant Portfolios, the expense levels of such Portfolios and whether the relevant Advisers had implemented breakpoints, fee waivers and/or expense caps with respect to such Portfolios.
After reviewing these and related factors, the Directors concluded, within the context of their overall conclusions regarding each of the Continued Agreements, that the Fees charged to each of the relevant Portfolios were fair and reasonable, and that the information provided regarding costs of these services generally, and the related profitability (if known) to the relevant Advisers of their relationships with the relevant Portfolios, supported the renewal of the Continued Agreements.
Economies of Scale. The Directors considered the existence of any economies of scale in the provision of services by the Advisers and whether those economies were shared with the relevant Portfolios through breakpoints in their advisory fees or other means, such as expense caps, fee waivers or relatively low levels of fees. The Directors noted that most of the relevant Portfolios benefited or will benefit from breakpoints, expense caps and/or fee waivers with respect to their advisory fees. In considering these issues, the Directors also took into consideration information relating to the costs of the services provided and the profitability to MetLife Advisers, the relevant subadvisers (if any) and each of their affiliates of their relationships with the relevant Portfolios, as discussed above.
MSF-25
Metropolitan Series Fund, Inc.
MetLife Mid Cap Stock Index Portfolio
Board Approval of Advisory and Subadvisory Agreements—(Continued)
After reviewing these and related factors, the Directors concluded, within the context of their overall conclusions regarding each of the Continued Agreements, that the extent to which economies of scale were shared with the relevant Portfolios supported the renewal of such Agreements.
Other Factors. The Directors also considered other factors, which included but were not limited to the following:
| | • | | the extent to which each relevant Portfolio operated in accordance with its investment objective, and its record of compliance with its investment restrictions and the compliance programs of the Fund and the Advisers. They also considered the compliance-related resources the Advisers and their affiliates provide to the relevant Portfolios; |
| | • | | the nature, quality, cost and extent of administrative and shareholder services performed by MetLife Advisers and its affiliates under the Advisory Agreements; and |
| | • | | so-called “fall-out benefits” to the Advisers, such as the engagement of their affiliates to provide distribution, brokerage and transfer agency services to the Portfolios, and the benefits of research made available to the relevant Advisers by reason of brokerage commissions generated by the relevant Portfolios’ securities transactions. The Directors also considered the possible conflicts of interest associated with these fall-out and other benefits, and the reporting and other processes in place to disclose and monitor these possible conflicts of interest. |
Based on their evaluation of all factors that they deemed to be material, including those factors described above, and assisted by the advice of independent counsel, the Directors, including the Independent Directors, concluded that each of the Continued Agreements should be continued through December 31, 2009.
MSF-26
A description of the policies and procedures that the Fund uses to determine how to vote proxies relating to portfolio securities is available (i) without charge, upon request, by calling (800) 638-7732 and (ii) on the Securities and Exchange Commission’s (the “SEC”) website at http://www.sec.gov.
Information regarding how the Fund voted proxies relating to portfolio securities during the most recent twelve-month period ended December 31, 2008 is available (i) without charge, upon request, by calling (800) 638-7732 and (ii) on the SEC’s website at http://www.sec.gov.
The Fund’s Statement of Additional Information includes additional information about the Directors of the Fund and is available (i) without charge, upon request, by calling (800) 638-7732 and (ii) on the SEC’s website at http://www.sec.gov.
The Fund files with the SEC a complete schedule of its portfolio holdings, as of the close of the first and third quarters of its fiscal year, on “Form N-Q”. These filings are available on the SEC’s website at www.sec.gov and may be reviewed and copied at the SEC’s Public Reference Room in Washington, DC. (Call 1-800-SEC-0330 for information on the operation of the Public Reference Room.)
MSF-27
Simplify your life…
with MetLife eDelivery® while helping MetLife preserve the planet’s natural resources.
(see details on inside cover)
| | |
Metropolitan Series Fund, Inc. MetLife Moderate Allocation Portfolio Annual Report | | December 31, 2008 |
NOT PART OF THE ANNUAL REPORT
Letter from the President
February 1, 2009
Letter to Policy Holders:
2008 was an extraordinary year in the capital markets around the world and for the global economy. Energy prices rose to record levels early in the year before falling by two-thirds by year-end. A credit crisis that began with concerns about sub-prime mortgages led to massive changes in the financial landscape with government takeovers, forced sales, and outright failures of a number of large, once venerable firms.
While bonds as measured by the Barclays Capital U.S. Aggregate Bond Index (formerly known as, Lehman Brothers U.S. Aggregate Bond Index) were up 5.2% for the year in response to declining interest rates, there were large differences in the total returns of the various sectors of the bond market. U.S. treasury securities were up over 13% as frightened investors sought refuge in what they perceived to be the safest and most liquid investments. In contrast, investment grade corporate securities lost nearly 5% as credit spreads widened and below investment grade or high yield bonds fell over 26%.
In response to the growing credit crisis and the weakening economy, common stocks fell sharply across all regions, styles, and capitalizations. As measured by the Standard and Poor’s 500, U.S. common stocks fell 37% for the year, the worst calendar year decline since the 1930s. Foreign stocks were down even more with the MSCI EAFE Index down 43% for the year.
On the following pages, you will find a complete review of your Portfolio and its investment performance.
MetLife is committed to building your financial freedom. We appreciate your trust and will continue to focus our efforts on meeting your investment needs.
Sincerely,
Elizabeth M. Forget
President, Metropolitan Series Fund, Inc.
Metropolitan Series Fund, Inc.
MetLife Moderate Allocation Portfolio
Managed by MetLife Advisers, LLC
Portfolio Manager Commentary*
PORTFOLIO PERFORMANCE
For the twelve-month period ended December 31, 2008, the Class A shares of the MetLife Moderate Allocation Portfolio returned -28.4% compared to the -37.3% return of the Wilshire 5000 Stock Index 1 and the 2.4% return of the Barclays Capital U.S. Universal Bond Index2. Considering that no single index or benchmark can accurately capture the multiple asset class design of the Portfolio, we have created a blended benchmark comprised of several indices for use in portfolio design and evaluation purposes. Specifically, the blended benchmark for the MetLife Moderate Allocation Portfolio currently consists of an 8% allocation to the Barclays Capital 1 to 3 Year Government Bond Index3, a 32% allocation to the Barclays Capital U.S. Universal Bond Index, a 45% allocation to the Wilshire 5000 Stock Index, and a 15% allocation to the Morgan Stanley Capital International EAFE Index4. During the twelve-month period ended December 31, 2008, the blended benchmark returned -23.9%.
ECONOMIC AND MARKET REVIEW
The first half of 2008 was highlighted by growing concerns about the economy due to the emerging credit crisis, rising unemployment, falling consumer confidence, a struggling housing sector, and skyrocketing food and energy prices. The forced sale of Bear Stearns in March to JP Morgan at first appeared to be an isolated event, but would prove to be a harbinger of things to come. The Federal Reserve was aggressive early in the year to revive the economy when they cut their target rate several times to bring it down from 4.25% to 2.00% by early May. They held rates steady in subsequent meetings through the summer as they tried to balance the danger of the economy falling into a recession against their desire to control growing inflation pressures.
However, the evidence of a weakening economy (especially falling real estate prices and the impact of the sub-prime mortgage crisis) gained momentum during the summer, climaxing in the extraordinary events of September and October that saw the government’s provision of credit assistance to Fannie Mae and Freddie Mac, the bankruptcy of Lehman Brothers, and the failure of Washington Mutual. The U.S. government and governments around the world took massive fiscal and monetary actions to stabilize the capital markets, restore liquidity to the clogged credit pipeline, and to stimulate the economy. These efforts continue as we move into 2009. Although we now know that the recession began a year ago in December 2007, the recession intensified during the last months of 2008: unemployment rose sharply as companies made massive layoffs, housing prices and sales continued to fall, retail sales fell, and, in a bit of good news / bad news, oil prices fell nearly $100 per barrel in response in expectation of lower global demand. The incoming administration of Barack Obama faces what most pundits call the largest economic crisis since the Great Depression.
During the first half of 2008, bond returns fluctuated as investors’ concerns changed from a weakening economy to inflation pressures fueled by soaring energy prices. Bonds eked out modestly positive total return of 1.1% for the January to June period as measured by the Barclays Capital U.S. Aggregate Bond Index5. During the second half of the year, the weak economy drove yields down and credit spreads wider as investors sought refuge in the safety of treasury securities. This resulted in mixed returns for bonds. Treasury bonds returned over 13% for the full year, while investment grade corporate bonds were down nearly 5%. High yield bonds were down over 26% for the year with most of the decline occurring in the second half of the year. While most credit based bonds recovered somewhat in December, it was not enough to reverse the earlier losses.
U.S. common stocks suffered their worst calendar year decline in over seventy years during 2008 as measured by the -37.0% return of the Standard & Poor’s 500 Index6. Growing expectations for a deep and long recession and a sharp drop in corporate earnings drove stock prices lower. The total collapse of several high profile financial firms pulled the indices down further. While there was very little difference in the return by style within large cap stocks, growth fell more than value at the mid cap and small cap segments. There was little difference in return by capitalization. By sector, Financials and Materials were down the most, while Consumer Staples held up better on a relative basis. Energy, which was up nearly 9% in the first half of the year, fell 40% in the second half to finish the year down almost 35%. Foreign stocks were also down sharply for the year, falling over 43% as measured by the MSCI EAFE Index. Emerging markets were down 53.3% as measured by the MSCI Emerging Markets Index7.
PORTFOLIO REVIEW
The MetLife Moderate Allocation Portfolio is a “fund of funds” consisting of other portfolios of the Met Investors Series Trust and the Metropolitan Series Fund with a broad allocation goal of 60% in equities and 40% in fixed income. The most significant change in strategy during the first half of 2008 was an increase in the asset class goal for foreign stocks from 20% of total equities to 25% of total equities. For this Portfolio, this resulted in a change in the goal for foreign stocks from 12% to 15%. There were also several small adjustments to the underlying portfolio targets that were part of the annual review and restructuring. We initiated positions in two new portfolios during the fourth quarter to add further diversification: a 2% position in the Met/Dimensional International Small Company Portfolio and a 1% position in the Van Eck Global Natural Resources Portfolio.
The Portfolio was structured to be diversified across a wide variety of asset classes to add value over the long term. However, for most of 2008, investors shunned risk and rewarded only what they perceived to be the safest investments.
The Portfolio’s fixed income portfolios had a large negative impact on relative performance as the Portfolio’s underlying bond portfolios held higher positions in credit based bonds (and less in Treasury securities) than is held in the broad bond indices. In particular, the Lord Abbett Bond Debenture Portfolio, the Western Asset Management Strategic Bond Opportunities Portfolio, and the
MSF-2
Metropolitan Series Fund, Inc.
MetLife Moderate Allocation Portfolio
Managed by MetLife Advisers, LLC
Portfolio Manager Commentary*
BlackRock High Yield Portfolio were down sharply relative to the broad index because of their high yield bond and other credit exposure. Overall high yield exposure was about 5% of the portfolio, which was in line with our target of 5%. WAM Strategic was also adversely impacted by its significant exposure to Non-Agency Mortgage Backed Securities, which were down sharply in response to the credit crisis. The PIMCO Inflation Protected Bond Portfolio, which did well in the first half when inflation expectations were still prevalent, had a large negative impact in the second half of the year as inflation expectations lessened because of the weak economy and falling oil prices. In fact, during 2008 inflation grew at its lowest rate in over fifty years.
Within the equity sector, a cumulative overweight in the Financials and Materials sectors and an underweight to the Consumer Staples sector detracted from relative performance during the full year. Certain Portfolios led a positive impact on relative performance. Dreman Small Cap Value Portfolio, although down over 25% for the year, held up better due to an overweight in the Consumer Staples sector and good overall stock selection, especially in the Health Care sector. BlackRock Large Cap Value Portfolio added to relative performance mostly due to stock selection in the Financials sector by avoiding many of the high profile blowups. MFS Value Portfolio also outperformed for the year, helped by an underweight and good stock selection in the generally struggling Information Technology sector. They avoided poorer performing stocks such as Apple, Google, and Mircosoft and owned better performing alternatives such as Accenture, Oracle, and IBM.
The Legg Mason Value Equity Portfolio was hurt in the first half of the year by its lack of exposure to the strong energy sector, but it continued to struggle in the second half even though the portfolio managers’ concerns about the sustainability of the high energy prices proved to be correct. The portfolio was also hurt by its exposure to several of the high profile financial stocks. Neuberger Berman Mid Cap Value Portfolio, one of the strongest performing portfolios in the first half of the year due to its energy exposure, struggled in the second half of the year for the same reason. It also was hurt by its exposure to Bear Stearns and poor overall stock selection in the Industrial sector. For example Chicago Bridge & Iron, Terex Corp., and McDermott International were all large positions that each fell over 70% for the year. FI Mid Cap Opportunities Portfolio was also hurt by its energy exposure in the second half and by overall poor stock selection, especially in the Financials (holding Brazilian brokerage firm BM&F Bovespa) and Industrials (holding engineering firm Flowserve) sectors.
Despite the recent poor performance of the Portfolio, we will continue to take a long term view to provide a well diversified portfolio to meet long term objectives.
* The views expressed above are those of the advisory firm as of December 31, 2008 and are subject to change based on market and other conditions. Information about the Portfolio’s holdings, asset allocation, industry allocation, or country diversification is historical and is not an indication of future Portfolio composition, which will vary. The performance of any index mentioned in this commentary has not been adjusted for ongoing management, distribution and operating expenses, and sales charges applicable to mutual fund investments. Direct investment in any index is not possible.
1 The Wilshire 5000 Equity Index measures the performance of all U.S. headquartered equity securities with readily available price data.
2 The Barclays Capital U.S. Universal Bond Index (formerly, Lehman Brothers U.S. Universal Bond Index) represents the union of the U.S. Aggregate Index, the U.S. High-Yield Corporate Index, the 144A Index, the Eurodollar Index, the Emerging Markets Index, the non-EIRSA portion of the Commercial Mortgage Backed Securities Index and the Commercial Mortgage Backed Securities High Yield Index. The index itself remains unchanged since Barclays assumed responsibility for the index from Lehman.
3 The Barclays Capital 1 to 3 Year Government Bond Index (formerly, Lehman Brothers 1 to 3 Year Government Bond Index) includes most obligations of the U.S Treasury, agencies and quasi-federal corporations having maturities between one to three years. The index itself remains unchanged since Barclays assumed responsibility for the index from Lehman.
4 The Morgan Stanley Capital International Europe, Australasia and Far East Index (“MSCI EAFE Index”) is an unmanaged free float-adjusted market capitalization index that is designed to measure developed market equity performance, excluding the U.S. & Canada.
5 Barclays Capital U.S. Aggregate Bond Index (formerly, Lehman Brothers U.S. Aggregate Bond Index) includes most obligations of the U.S. Treasury, agencies and quasi-federal corporations, most publicly issued investment grade corporate bonds and most bonds backed by mortgage pools of GNMA, FNMA and FHLMC. The index itself remains unchanged since Barclays assumed responsibility for the index from Lehman.
6 The Standard & Poor’s (S&P) 500® Composite Stock Price Index is an unmanaged index representing the performance of 500 major companies, most of which are listed on the New York Stock Exchange.
7 The MSCI Emerging Markets Index is a free float-adjusted market capitalization index that is designed to measure equity market performance of emerging markets. As of January 2009 the MSCI Emerging Markets Index consisted of the following 23 emerging market country indices: Argentina, Brazil, Chile, China, Colombia, Czech Republic, Egypt, Hungary, India, Indonesia, Israel, Korea, Malaysia, Mexico, Morocco, Peru, Philippines, Poland, Russia, South Africa, Taiwan, Thailand, and Turkey.
MSF-3
Metropolitan Series Fund, Inc.
MetLife Moderate Allocation Portfolio
A $10,000 INVESTMENT COMPARED TO
THE WILSHIRE 5000 STOCK INDEX AND THE BARCLAYS
CAPITAL U.S. UNIVERSAL BOND INDEX
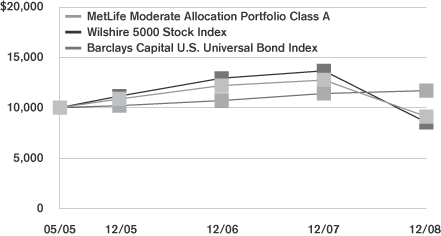
Average Annual Returns as of December 31, 2008
| | | | | | | | | | | | |
| | | MetLife Moderate Allocation Portfolio | | | Wilshire 5000 Stock Index | | | Barclays Capital U.S.
Universal Bond Index | |
| | | Class A | | | Class B | | | |
| 1 Year | | -28.4 | % | | -28.6 | % | | -37.3 | % | | 2.4 | % |
| Since Inception | | -2.5 | | | -2.7 | | | -4.2 | | | 4.3 | |
Performance numbers are net of all Portfolio expenses but do not include any insurance, sales, or administrative charges of variable annuity or life insurance contracts or any additional expenses that participants in certain eligible qualified plans may bear relating to the operations of their plans. If these charges were included, the returns would be lower.
Inception date of the Class A and Class B shares is 5/2/05. Index since inception return is based on the Portfolio’s inception date.
This information represents past performance and is not indicative of future results. Investment return and principal value may fluctuate so that shares, upon redemption, may be worth more or less than the original cost.
PORTFOLIO COMPOSITION
as of December 31, 2008
Top Holdings
| | |
| | | % of Total
Net Assets |
Met Investors Series Trust —PIMCO Total Return Portfolio, (Class A) | | 21.3% |
Metropolitan Series Fund, Inc.—Western Asset Mgt. Strategic Bond Opportunities Portfolio, (Class A) | | 9.9% |
Metropolitan Series Fund, Inc.—Davis Venture Value Portfolio, (Class A) | | 6.8% |
Metropolitan Series Fund, Inc.—BlackRock Large Cap Value Portfolio, (Class A) | | 6.1% |
Metropolitan Series Fund, Inc.—MetLife Stock Index Portfolio, (Class A) | | 5.0% |
Metropolitan Series Fund, Inc.—Julius Baer International Stock Portfolio, (Class A) | | 4.1% |
Metropolitan Series Fund, Inc.—Jennison Growth Portfolio, (Class A) | | 3.9% |
Metropolitan Series Fund, Inc.—T. Rowe Price Large Cap Growth Portfolio, (Class A) | | 3.9% |
Met Investors Series Trust —MFS Research International Portfolio, (Class A) | | 3.3% |
Met Investors Series Trust—Dreman Small Cap Value Portfolio, (Class A) | | 3.1% |
MSF-4
Metropolitan Series Fund, Inc.
Shareholder Expense Example
As a shareholder of the Fund, you incur ongoing costs, including management fees; distribution and service (12b-1) fees; and other fund expenses. This example is intended to help you understand your ongoing costs (in dollars) (referred to as “expenses”) of investing in the Portfolio and compare these costs with the ongoing costs of investing in other mutual funds. The example is based on an investment of $1,000 invested at the beginning of the period and held for the entire period, July 1, 2008 through December 31, 2008.
Actual Expenses
The first line for each share class of the Portfolio in the table below provides information about actual account values and actual expenses. You may use the information in this line, together with the amount you invested in the particular share class of the Portfolio, to estimate the expenses that you paid over the period. Simply divide your account value by $1,000 (for example, an $8,600 account value divided by $1,000=8.6), then multiply the result by the number in the first line under the heading entitled “Expenses Paid During Period” to estimate the expenses you paid on your account during this period.
Hypothetical Example for Comparison Purposes
The second line for each share class of the Portfolio in the table below provides information about hypothetical account values and hypothetical expenses based on the Portfolio’s actual expense ratio and an assumed rate of return of 5% per year before expenses, which is not the Portfolio’s actual return. The hypothetical account values and expenses may not be used to estimate the actual ending account balance or expenses you paid for the period. You may use this information to compare the ongoing costs of investing in the Portfolio and other funds. To do so, compare this 5% hypothetical example with the 5% hypothetical examples that appear in the shareholder reports of the other funds.
Please note that the expenses shown in the table are meant to highlight your ongoing costs only and do not reflect any fees or charges of your variable insurance product or any additional expenses that participants in certain eligible qualified plans may bear relating to the operations of their plan. Therefore, the second line for each share class in the table is useful in comparing ongoing costs only, and will not help you determine the relative total costs of owning different funds. In addition, if these other costs were included, your costs would have been higher.
| | | | | | | | | | | | | | |
Portfolio | | | | Annualized
Expense
Ratio | | | Beginning
Account Value
July 1,
2008 | | Ending
Account Value
December 31,
2008 | | Expenses paid
During Period*
July 1, 2008
to
December 31,
2008 |
MetLife Moderate Allocation—Class A(a)(b) | | Actual | | 0.74 | % | | $ | 1,000.00 | | $ | 773.48 | | $ | 3.30 |
| | Hypothetical | | 0.74 | % | | $ | 1,000.00 | | $ | 1,021.37 | | $ | 3.76 |
| | | | | |
MetLife Moderate Allocation—Class B(a)(b) | | Actual | | 0.99 | % | | $ | 1,000.00 | | $ | 772.14 | | $ | 4.41 |
| | Hypothetical | | 0.99 | % | | $ | 1,000.00 | | $ | 1,020.10 | | $ | 5.03 |
* Expenses paid are equal to the Portfolio’s annualized expense ratio for the most recent six month period, as shown above, multiplied by the average account value over the period, multiplied by the number of days in the most recent fiscal half-year, divided by 366 (to reflect the the one-half year period).
(a) The annualized expense ratio shown reflects an expense agreement between MetLife Advisers, LLC and the Portfolio as described under Expense Agreement in Note 4 to the Financial Statements.
(b) The annualized expense ratio reflects the expenses of both the Portfolio and the underlying Portfolios in which it invests.
MSF-5
Metropolitan Series Fund, Inc.
MetLife Moderate Allocation Portfolio
Schedule of Investments as of December 31, 2008
Mutual Funds—100.0% of Total Net Assets
| | | | | |
| Security Description | | Shares | | Value* |
| | | | | |
| |
Affiliated Investment Companies—100.0% | | | |
Met Investors Series Trust—BlackRock High Yield Portfolio, (Class A) | | 3,300,112 | | $ | 19,173,650 |
Met Investors Series Trust—BlackRock Large Cap Core Portfolio, (Class A) | | 9,404,294 | | | 62,726,640 |
Met Investors Series Trust—Clarion Global Real Estate Portfolio, (Class A) | | 2,751,332 | | | 20,359,859 |
Met Investors Series Trust—Dreman Small Cap Value Portfolio, (Class A) | | 6,531,052 | | | 64,004,305 |
Met Investors Series Trust—Harris Oakmark International Portfolio, (Class A) | | 7,430,284 | | | 63,677,533 |
Met Investors Series Trust—Lazard Mid-Cap Portfolio, (Class A) | | 8,796,587 | | | 60,960,345 |
Met Investors Series Trust—Legg Mason Value Equity Portfolio, (Class A) | | 12,383,809 | | | 56,841,683 |
Met Investors Series Trust—Lord Abbett Bond Debenture Portfolio, (Class A) | | 4,165,267 | | | 40,569,700 |
Met Investors Series Trust—Met/AIM Small Cap Growth Portfolio, (Class A) | | 4,885,359 | | | 40,841,598 |
Met Investors Series Trust—MFS Research International Portfolio, (Class A) | | 9,145,240 | | | 67,766,229 |
Met Investors Series Trust—PIMCO Inflation Protected Bond Portfolio, (Class A) | | 2,053,173 | | | 20,182,695 |
Met Investors Series Trust—PIMCO Total Return Portfolio, (Class A) | | 37,601,754 | | | 436,180,352 |
Metropolitan Series Fund, Inc.—BlackRock Large Cap Value Portfolio, (Class A) | | 14,545,906 | | | 125,967,547 |
Metropolitan Series Fund, Inc.—Davis Venture Value Portfolio, (Class A) | | 6,454,444 | | | 140,255,075 |
Metropolitan Series Fund, Inc.—FI Mid Cap Opportunities Portfolio, (Class A) | | 4,081,201 | | | 38,444,916 |
Metropolitan Series Fund, Inc.—Jennison Growth Portfolio, (Class A) | | 10,320,648 | | | 80,604,265 |
Metropolitan Series Fund, Inc.—Julius Baer International Stock Portfolio, (Class A) | | 10,821,987 | | | 84,411,498 |
Metropolitan Series Fund, Inc.—Met/Dimensional International Small Co. Portfolio, (Class A) | | 3,957,683 | | | 40,210,058 |
Metropolitan Series Fund, Inc.—MetLife Stock Index Portfolio, (Class A) | | 4,623,753 | | | 101,768,813 |
Metropolitan Series Fund, Inc.—MFS Value Portfolio, (Class A) | | 4,519,203 | | | 41,893,015 |
Metropolitan Series Fund, Inc.—Neuberger Berman Mid Cap Value Portfolio, (Class A) | | 5,633,793 | | | 61,971,725 |
Metropolitan Series Fund, Inc.—Russell 2000 Index Portfolio, (Class A) | | 4,694,143 | | | 41,730,932 |
Metropolitan Series Fund, Inc.—T. Rowe Price Large Cap Growth Portfolio, (Class A) | | 8,883,274 | | | 80,393,625 |
Metropolitan Series Fund, Inc.—Van Eck Global Natural Resources Portfolio, (Class A) | | 1,981,360 | | | 19,239,009 |
Metropolitan Series Fund, Inc.—Western Asset Mgt. Strategic Bond Opportunities Portfolio, (Class A) | | 19,671,763 | | | 203,209,308 |
| | | | | | |
| Security Description | | Shares | | Value* | |
| | | | | | |
|
Affiliated Investment Companies—(Continued) | |
Metropolitan Series Fund, Inc.—Western Asset Mgt. U.S. Government Portfolio, (Class A) | | 3,326,178 | | $ | 39,648,042 | |
| | | | | | |
Total Mutual Funds
(Identified Cost $2,866,123,272) | | | | | 2,053,032,417 | |
| | | | | | |
Total Investments—100.0%
(Identified Cost $2,866,123,272) (a) | | | | | 2,053,032,417 | |
Liabilities in excess of other assets | | | | | (527,507 | ) |
| | | | | | |
| Total Net Assets—100% | | | | $ | 2,052,504,910 | |
| | | | | | |
| (a) | The aggregate cost of investments for federal income tax purposes as of December 31, 2008 was $2,901,251,357 and the composition of unrealized appreciation and depreciation of investment securities was $686,507 and $(848,905,447), respectively. |
*See accompanying notes to financial statements.
MSF-6
Metropolitan Series Fund, Inc.
MetLife Moderate Allocation Portfolio
The Portfolio adopted the provisions of Statement of Financial Accounting Standards No. 157, “Fair Value Measurements” (FAS 157), effective with the beginning of the Portfolio’s fiscal year. FAS 157 establishes a framework for measuring fair value and expands disclosures about fair value measurements in financial statements. The three levels of the hierarchy under FAS 157 are described below:
Level 1 - quoted prices in active markets for identical securities
Level 2 - other significant observable inputs (including quoted prices for similar securities, interest rates, credit risk, etc.)
Level 3 - significant unobservable inputs (including the Portfolio’s own assumptions in determining the fair value of investments)
The inputs or methodology used for valuing securities are not necessarily an indication of the risk associated with investing in those securities.
The following is a summary of the inputs used to value the Portfolio’s net assets as of December 31, 2008:
| | | | | | |
| Valuation Inputs | | Investments In
Securities | | Other Financial
Instruments* |
Level 1 - Quoted Prices | | $ | 2,053,032,417 | | $ | 0 |
Level 2 - Other Significant Observable Inputs | | | 0 | | | 0 |
Level 3 - Significant Unobservable Inputs | | | 0 | | | 0 |
Total | | $ | 2,053,032,417 | | $ | 0 |
* Other financial instruments are derivative instruments not reflected in the Schedule of Investments, such as futures, forwards, swap contracts and written options, which are valued based on the unrealized appreciation/depreciation on the instrument.
MSF-7
Metropolitan Series Fund, Inc.
MetLife Moderate Allocation Portfolio
Statement of Assets & Liabilities
December 31, 2008
| | | | | | | |
Assets | | | | | | | |
Investments at value (a) | | | | | $ | 2,053,032,417 | |
Receivable for: | | | | | | | |
Fund shares sold | | | | | | 1,653,077 | |
| | | | | | | |
Total Assets | | | | | | 2,054,685,494 | |
Liabilities | | | | | | | |
Payable for: | | | | | | | |
Securities purchased | | $ | 504,050 | | | | |
Fund shares redeemed | | | 1,149,027 | | | | |
Accrued expenses: | | | | | | | |
Management fees | | | 114,440 | | | | |
Service and distribution fees | | | 386,054 | | | | |
Other expenses | | | 27,013 | | | | |
| | | | | | | |
Total Liabilities | | | | | | 2,180,584 | |
| | | | | | | |
Net Assets | | | | | $ | 2,052,504,910 | |
| | | | | | | |
Net assets consists of: | | | | | | | |
Capital paid in | | | | | $ | 2,794,421,000 | |
Undistributed net investment income | | | | | | 69,743,832 | |
Accumulated net realized gains | | | | | | 1,430,933 | |
Unrealized depreciation on investments | | | | | | (813,090,855 | ) |
| | | | | | | |
Net Assets | | | | | $ | 2,052,504,910 | |
| | | | | | | |
| Computation of offering price: | | | | | | | |
Class A | | | | | | | |
Net asset value and redemption price per share ($135,501,225 divided by 16,137,348 shares outstanding) | | | | | $ | 8.40 | |
| | | | | | | |
Class B | | | | | | | |
Net asset value and redemption price per share ($1,917,003,685 divided by 229,090,225 shares outstanding) | | | | | $ | 8.37 | |
| | | | | | | |
(a) Identified cost of investments | | | | | $ | 2,866,123,272 | |
| | | | | | | |
Statement of Operations
For the Year Ended December 31, 2008
| | | | | | | | |
Investment Income | | | | | | | | |
Dividends from Underlying Portfolios | | | | | | $ | 55,404,245 | |
| | | | | | | | |
Expenses | | | | | | | | |
Management fees | | $ | 1,526,885 | | | | | |
Service and distribution fees—Class B | | | 5,364,206 | | | | | |
Directors’ fees and expenses | | | 627 | | | | | |
Custodian | | | 29,124 | | | | | |
Audit and tax services | | | 16,423 | | | | | |
Legal | | | 41,235 | | | | | |
Miscellaneous | | | 7,806 | | | | | |
| | | | | | | | |
Total expenses | | | | | | | 6,986,306 | |
| | | | | | | | |
Net Investment Income | | | | | | | 48,417,939 | |
| | | | | | | | |
Realized and Unrealized Gain (Loss) | | | | | | | | |
| Realized loss on: | | | | | | | | |
Investments—net | | | (67,899,871 | ) | | | | |
Capital gains distributions from Underlying Portfolios | | | 91,815,861 | | | | 23,915,990 | |
| | | | | | | | |
| Change in unrealized depreciation on: | | | | | | | | |
Investments—net | | | | | | | (840,802,629 | ) |
| | | | | | | | |
Net loss | | | | | | | (816,886,639 | ) |
| | | | | | | | |
Net Decrease in Net Assets From Operations | | | | | | $ | (768,468,700 | ) |
| | | | | | | | |
See accompanying notes to financial statements.
MSF-8
Metropolitan Series Fund, Inc.
MetLife Moderate Allocation Portfolio
Statements of Changes in Net Assets
| | | | | | | | |
| | | Year ended
December 31,
2008 | | | Year ended
December 31,
2007 | |
From Operations | | | | | | | | |
Net investment income | | $ | 48,417,939 | | | $ | 14,011,159 | |
Net realized gain | | | 23,915,990 | | | | 33,713,558 | |
Change in unrealized depreciation | | | (840,802,629 | ) | | | (8,525,018 | ) |
| | | | | | | | |
Increase (decrease) in net assets from operations | | | (768,468,700 | ) | | | 39,199,699 | |
| | | | | | | | |
From Distributions to Shareholders | | | | | | | | |
Net investment income | | | | | | | | |
Class A | | | (1,707,777 | ) | | | (269,562 | ) |
Class B | | | (16,837,058 | ) | | | (80,033 | ) |
| | | | | | | | |
| | | (18,544,835 | ) | | | (349,595 | ) |
| | | | | | | | |
Net realized gain | | | | | | | | |
Class A | | | (2,079,033 | ) | | | (186,620 | ) |
Class B | | | (27,731,626 | ) | | | (1,440,592 | ) |
| | | | | | | | |
| | | (29,810,659 | ) | | | (1,627,212 | ) |
| | | | | | | | |
Total distributions | | | (48,355,494 | ) | | | (1,976,807 | ) |
| | | | | | | | |
Increase in net assets from capital share transactions | | | 569,780,663 | | | | 1,521,410,561 | |
| | | | | | | | |
Net increase (decrease) in net assets | | | (247,043,531 | ) | | | 1,558,633,453 | |
| | |
Net Assets | | | | | | | | |
Beginning of the period | | | 2,299,548,441 | | | | 740,914,988 | |
| | | | | | | | |
End of the period | | $ | 2,052,504,910 | | | $ | 2,299,548,441 | |
| | | | | | | | |
Undistributed Net Investment Income | | | | | | | | |
End of the period | | $ | 69,743,832 | | | $ | 18,365,862 | |
| | | | | | | | |
Other Information:
Capital Shares
Transactions in capital shares were as follows:
| | | | | | | | | | | | | | |
| | | Year ended
December 31, 2008 | | | Year ended
December 31, 2007 | |
| | | Shares | | | $ | | | Shares | | | $ | |
Class A | | | | | | | | | | | | | | |
Sales | | 5,929,445 | | | $ | 60,103,528 | | | 9,488,879 | | | $ | 113,112,140 | |
Reinvestments | | 332,468 | | | | 3,786,810 | | | 37,983 | | | | 456,182 | |
Redemptions | | (4,450,258 | ) | | | (45,069,747 | ) | | (3,027,315 | ) | | | (36,051,074 | ) |
| | | | | | | | | | | | | | |
Net increase | | 1,811,655 | | | $ | 18,820,591 | | | 6,499,547 | | | $ | 77,517,248 | |
| | | | | | | | | | | | | | |
Class B | | | | | | | | | | | | | | |
Sales | | 67,701,797 | | | $ | 711,917,005 | | | 132,914,022 | | | $ | 1,582,814,963 | |
Reinvestments | | 3,919,849 | | | | 44,568,684 | | | 126,824 | | | | 1,520,625 | |
Redemptions | | (20,422,997 | ) | | | (205,525,617 | ) | | (11,830,433 | ) | | | (140,442,275 | ) |
| | | | | | | | | | | | | | |
Net increase | | 51,198,649 | | | $ | 550,960,072 | | | 121,210,413 | | | $ | 1,443,893,313 | |
| | | | | | | | | | | | | | |
Increase derived from capital share transactions | | | | | $ | 569,780,663 | | | | | | $ | 1,521,410,561 | |
| | | | | | | | | | | | | | |
See accompanying notes to financial statements.
MSF-9
Metropolitan Series Fund, Inc.
MetLife Moderate Allocation Portfolio
Financial Highlights
| | | | | | | | | | | | | | | | |
| | | Class A | |
| | | Year ended December 31, | |
| | | 2008 | | | 2007 | | | 2006 | | | 2005(a) | |
Net Asset Value, Beginning of Period | | $ | 12.00 | | | $ | 11.52 | | | $ | 10.82 | | | $ | 10.00 | |
| | | | | | | | | | | | | | | | |
Income From Investment Operations | | | | | | | | | | | | | | | | |
Net investment income | | | 0.25 | (b) | | | 0.17 | (b) | | | 0.24 | | | | 0.04 | |
Net realized and unrealized gain (loss) of investments | | | (3.59 | ) | | | 0.36 | | | | 1.04 | | | | 0.83 | |
| | | | | | | | | | | | | | | | |
Total from investment operations | | | (3.34 | ) | | | 0.53 | | | | 1.28 | | | | 0.87 | |
| | | | | | | | | | | | | | | | |
Less Distributions | | | | | | | | | | | | | | | | |
Distributions from net investment income | | | (0.12 | ) | | | (0.03 | ) | | | (0.24 | ) | | | (0.05 | ) |
Distributions from net realized capital gains | | | (0.14 | ) | | | (0.02 | ) | | | (0.34 | ) | | | 0.00 | |
| | | | | | | | | | | | | | | | |
Total distributions | | | (0.26 | ) | | | (0.05 | ) | | | (0.58 | ) | | | (0.05 | ) |
| | | | | | | | | | | | | | | | |
Net Asset Value, End of Period | | $ | 8.40 | | | $ | 12.00 | | | $ | 11.52 | | | $ | 10.82 | |
| | | | | | | | | | | | | | | | |
Total Return (%) | | | (28.4 | ) | | | 4.5 | | | | 12.2 | | | | 8.7 | (c) |
Ratio of operating expenses to average net assets (%) (d) | | | 0.07 | | | | 0.09 | | | | 0.10 | | | | 0.10 | (e) |
Ratio of operating expenses to average net assets without giving effect to the contractual expense agreement would have been (%) (d)(f) | | | N/A | | | | N/A | | | | 0.11 | | | | 0.29 | (e) |
Ratio of net investment income to average net assets (%) (g) | | | 2.38 | | | | 1.44 | | | | 1.67 | | | | 1.57 | (e) |
Portfolio turnover rate (%) | | | 24 | | | | 14 | | | | 19 | | | | 1 | (e) |
Net assets, end of period (000) | | $ | 135,501 | | | $ | 171,934 | | | $ | 90,126 | | | $ | 21,245 | |
| | | | | | | | | | | | | | | | |
| | | Class B | |
| | | Year ended December 31, | |
| | | 2008 | | | 2007 | | | 2006 | | | 2005(a) | |
Net Asset Value, Beginning of Period | | $ | 11.96 | | | $ | 11.48 | | | $ | 10.81 | | | $ | 10.00 | |
| | | | | | | | | | | | | | | | |
Income From Investment Operations | | | | | | | | | | | | | | | | |
Net investment income | | | 0.21 | (b) | | | 0.12 | (b) | | | 0.22 | | | | 0.04 | |
Net realized and unrealized gain (loss) of investments | | | (3.57 | ) | | | 0.38 | | | | 1.02 | | | | 0.81 | |
| | | | | | | | | | | | | | | | |
Total from investment operations | | | (3.36 | ) | | | 0.50 | | | | 1.24 | | | | 0.85 | |
| | | | | | | | | | | | | | | | |
Less Distributions | | | | | | | | | | | | | | | | |
Distributions from net investment income | | | (0.09 | ) | | | (0.00 | )(h) | | | (0.23 | ) | | | (0.04 | ) |
Distributions from net realized capital gains | | | (0.14 | ) | | | (0.02 | ) | | | (0.34 | ) | | | 0.00 | |
| | | | | | | | | | | | | | | | |
Total distributions | | | (0.23 | ) | | | (0.02 | ) | | | (0.57 | ) | | | (0.04 | ) |
| | | | | | | | | | | | | | | | |
Net Asset Value, End of Period | | $ | 8.37 | | | $ | 11.96 | | | $ | 11.48 | | | $ | 10.81 | |
| | | | | | | | | | | | | | | | |
Total Return (%) | | | (28.6 | ) | | | 4.4 | | | | 11.8 | | | | 8.5 | (c) |
Ratio of operating expenses to average net assets (%) (d) | | | 0.32 | | | | 0.34 | | | | 0.35 | | | | 0.35 | (e) |
Ratio of operating expenses to average net assets without giving effect to the contractual expense agreement would have been (%) (d)(f) | | | N/A | | | | N/A | | | | 0.36 | | | | 0.54 | (e) |
Ratio of net investment income to average net assets (%) (g) | | | 2.08 | | | | 0.98 | | | | 0.98 | | | | 1.45 | (e) |
Portfolio turnover rate (%) | | | 24 | | | | 14 | | | | 19 | | | | 1 | (e) |
Net assets, end of period (000) | | $ | 1,917,004 | | | $ | 2,127,614 | | | $ | 650,789 | | | $ | 101,018 | |
| (a) | Commencement of operations was May 2, 2005. |
| (b) | Per share amount is based on average shares outstanding during the period. |
| (c) | Periods less than one year are not computed on an annualized basis. |
| (d) | The ratio of operating expenses to average net assets does not include expenses of investment companies in which the Portfolio invests. |
| (e) | Computed on an annualized basis. |
| (f) | See Note 4 of the Notes to Financial Statements. |
| (g) | Recognition of net investment income by the Portfolio is affected by the timing of the declaration of dividends by the Underlying Portfolios in which it invests. |
| (h) | Distributions for the period were less than $0.01. |
See accompanying notes to financial statements.
MSF-10
Metropolitan Series Fund, Inc.
MetLife Moderate Allocation Portfolio
Notes to Financial Statements—December 31, 2008
Metropolitan Series Fund, Inc. (the “Fund”) is organized as a corporation under the laws of Maryland pursuant to Articles of Incorporation filed on November 23, 1982, as amended, and registered under the Investment Company Act of 1940, as amended (the “1940 Act”), as an open-end investment company. The Fund is a “series” type of mutual fund, which issues separate series of stock. Each series represents an interest in a separate portfolio of Fund investments. The MetLife Moderate Allocation Portfolio (the “Asset Allocation Portfolio”) is a non-diversified series of the fund. The Asset Allocation Portfolio operates under a “fund of funds” structure, investing substantially all of its assets in other Portfolios advised by MetLife Advisers, LLC (“MetLife Advisers”) or its affiliates (each, an “Underlying Portfolio,” and, collectively, the “Underlying Portfolios”). Shares in the Fund are not offered directly to the general public and are currently available only to separate accounts established by Metropolitan Life Insurance Company (“MetLife”), New England Life Insurance Company, General American Life Insurance Company (“General American”), The MetLife Investors Group of Insurance Companies, MetLife Insurance Company of Connecticut and other affiliated insurance companies (collectively, the “Insurance Companies”) and to certain eligible qualified retirement plans (“Qualified Plans”), as an investment vehicle for variable life insurance, group annuity or variable annuity products of these insurance companies or Qualified Plans, although not all Asset Allocation Portfolios are available to all such separate accounts and Qualified Plans. The Asset Allocation Portfolio’s shares may be divided into different classes. Currently, the classes being offered by the Asset Allocation Portfolio are named Class A and Class B. The classes of the Asset Allocation Portfolio’s shares are identical, except that certain additional charges (Rule 12b-1 fees) are made against Class B shares. Investment income, realized and unrealized capital gains and losses, the common expenses of the Asset Allocation Portfolio and certain Portfolio-level expense reductions, if any, are allocated daily, on a pro rata basis, to each class based on the relative net assets of each class to the total net assets of the Portfolio.
| 2. | SIGNIFICANT ACCOUNTING POLICIES: |
The preparation of financial statements in conformity with accounting principles generally accepted in the United States of America (“GAAP”) requires management to make estimates and assumptions that affect the reported amounts of assets and liabilities and disclosure of contingent assets and liabilities as of the date of the financial statements and the reported amounts of income and expenses during the reporting period. Actual results could differ from those estimates.
The following is a summary of significant accounting policies consistently followed by the Asset Allocation Portfolio in the preparation of its financial statements. The policies are in conformity with GAAP.
Investment Valuation:
The net asset value of the Asset Allocation Portfolio is calculated based on the net asset values of the Underlying Portfolios in which the Asset Allocation Portfolio invests. The Underlying Portfolios that are series of the Fund will use fair value pricing in the circumstances and manner described below. For more information about the use of fair value pricing by the Underlying Portfolios that are series of Met Investors Series Trust (“MIST”), please refer to the prospectus for such Underlying Portfolios.
The Underlying Portfolios that are series of the Fund are valued as follows:
Debt securities (other than short term obligations with a remaining maturity of sixty days or less) are generally valued on the basis of evaluated or composite bid quotations obtained by independent pricing services and/or brokers and dealers selected by the relevant subadviser pursuant to authorization of the Board of Directors of the Fund (the “Board” or “Directors”). Such quotations take into account appropriate factors such as institutional-sized trading in similar groups of securities, yield, quality, coupon rate, maturity, type of issue, trading characteristics and other data. Short term obligations with a remaining maturity of sixty days or less are valued at amortized cost which approximates fair market value.
Equity securities traded on a national securities exchange or other exchanges are valued at their last sale price on the principal trading market. Equity securities traded on the NASDAQ National Market System are valued at the NASDAQ Official Closing Price (the “NOCP”). The NOCP is the last reported sale price if the last reported sale price falls between the spread of the last reported bid and asked prices. If the last reported bid and asked prices are above the last reported sale price, the NOCP will be the last reported bid price. If the last reported bid and asked prices are below the last reported sale price, the NOCP will be the last reported asked price. Equity securities traded on a national securities exchange or other exchanges or on the NASDAQ National Market System for which there is no reported sale during the day are valued at the last reported bid price. A security that is listed or traded on more than one exchange is valued at the quotation on the exchange determined to be the primary market for that
MSF-11
Metropolitan Series Fund, Inc.
MetLife Moderate Allocation Portfolio
Notes to Financial Statements—December 31, 2008—(Continued)
security by the Board or its delegates. If no closing price is available, then such securities are valued by using the last reported bid price. Equity securities traded over-the-counter are valued at the last reported sales price.
If no current market value quotation is readily available or reliable for a portfolio security, fair value will be determined in accordance with procedures established by and under the general supervision of the Board. When an Underlying Portfolio uses fair value pricing, it may take into account any factors it deems appropriate. The value of securities used by the Underlying Portfolio to calculate its net asset value may differ from quoted or published prices for the same securities. Fair value pricing involves subjective judgments and the fair value determined for a security may be materially different than the value that could be realized upon the sale of that security.
The Underlying Portfolios expect to use fair value pricing for securities primarily traded on U.S. exchanges only under very limited circumstances. For example, the Underlying Portfolios may use fair value pricing if the exchange on which a security is traded closes early or trading in the security is suspended.
Securities traded primarily on an exchange outside of the United States which closes before the close of the New York Stock Exchange will be valued at the last sales price on that non-U.S. exchange. Securities traded primarily on an exchange outside of the United States for which there is no reported sale during the day are valued at the mean between the last reported bid and asked prices. However, because most foreign markets close well before the Underlying Portfolio values its securities (typically at 4 p.m. Eastern Time), the earlier close of these foreign markets gives rise to the possibility that significant events, including broad market moves, may have occurred after these foreign markets close but before the Underlying Portfolio values its securities. For example, foreign security values may be affected by activity that occurs after the close of foreign securities markets. To account for this, the Underlying Portfolio may frequently value many of its foreign equity securities using fair value prices based on third party vendor modeling tools.
Forward foreign currency exchange contracts are valued based on the mean between closing bid and asked prices of the forward currency contract rates in the London foreign exchange markets on a daily basis as provided by a reliable bank or dealer.
Options, whether on securities, indices, futures contracts, or otherwise, are valued at the last sales price available as of the close of business on the day of valuation or, if there is no such sale price available, at the mean between the bid and asked prices. Options on currencies are valued at the spot price each day.
The value of futures contracts will be the sum of the margin deposit plus or minus the difference between the value of the futures contract on each day the net asset value is calculated and the value on the date the futures contract originated, value being that established on a recognized commodity exchange, or by reference to other customary sources, with gain or loss being realized when the futures contract closes or expires.
Subject to the Board’s oversight, the Board has delegated the day-to-day oversight of pricing matters, including determinations in good faith under the Fund’s procedures the fair value of securities for which current market quotations are not readily available to MetLife Advisers, LLC (“MetLife Advisers” or the “Adviser”) or the subadviser of the Underlying Portfolio, as applicable.
Investment Transactions and Related Investment Income:
Portfolio security transactions are recorded on the trade date. Dividend income is recorded on the ex-dividend date. Interest income is recorded on the accrual basis. Realized gains and losses on investments and unrealized appreciation and depreciation are determined on the identified cost basis, which is the same basis used for federal income tax purposes.
Federal Income Taxes:
It is the Portfolio’s policy to comply with the requirements of the Internal Revenue Code of 1986, as amended (the “Code”), and regulations thereunder, applicable to regulated investment companies and to distribute, with respect to each taxable year, all of its taxable income to shareholders. Therefore, no federal income tax provision is required. The Portfolio is subject to the provisions of the Financial Accounting Standards Board Interpretation (“FASB”) No. 48, Accounting for Uncertainties in Income Taxes (FIN 48). FIN 48 sets forth a minimum threshold for financial statement recognition of the benefit of a tax position taken or expected to be taken in a tax return. The implementation of FIN 48 did not result in any unrecognized tax benefits in the accompanying financial statements. Each of the Portfolio’s federal tax returns for the prior three fiscal years remains subject to examination by the Internal Revenue Service.
As of December 31, 2008, the Asset Allocation Portfolio had no capital loss carryforwards.
MSF-12
Metropolitan Series Fund, Inc.
MetLife Moderate Allocation Portfolio
Notes to Financial Statements—December 31, 2008—(Continued)
Pursuant to Section 852 of the Code, the Portfolio designated the amount shown below under Long Term Gain as capital gain dividends for its taxable year ended December 31, 2008. The tax character of distributions paid for the periods ended December 31, 2008 and 2007 was as follows:
| | | | | | | | | | | | | | | | | | | | | |
Ordinary Income | | Long Term Gain | | Return of Capital | | Total |
2008 | | 2007 | | 2008 | | 2007 | | 2008 | | 2007 | | 2008 | | 2007 |
$23,229,367 | | $ | 1,253,602 | | $ | 25,126,127 | | $ | 723,205 | | $ | — | | $ | — | | $ | 48,355,494 | | $ | 1,976,807 |
As of December 31, 2008, the components of distributable earnings (accumulated losses) on a federal income tax basis were as follows:
| | | | | | | | | | | | | | |
Undistributed
Ordinary
Income | | Undistributed
Long Term
Gain | | Unrealized
Depreciation | | | Loss
Carryforwards | | Total | |
$69,743,832 | | $ | 36,559,018 | | $ | (848,218,940 | ) | | $ | — | | $ | (741,916,090 | ) |
Dividends and Distributions to Shareholders:
The Asset Allocation Portfolio records dividends and distributions on the ex-dividend date. Net realized gains from security transactions (if any) are generally distributed annually to shareholders. The timing and characterization of certain income and capital gains distributions are determined in accordance with federal tax regulations that may differ from GAAP. Permanent book and tax basis differences relating to shareholder distributions will result in reclassification between under/over distributed net investment income, accumulated net realized gains/losses and paid in capital.
| 3. | INVESTMENT TRANSACTIONS: |
For the year ended December 31, 2008, purchases and sales of Underlying Portfolios by the Asset Allocation Portfolio were $1,208,909,444 and $547,415,139, respectively.
| 4. | INVESTMENT MANAGEMENT FEES AND OTHER TRANSACTIONS WITH AFFILIATES: |
Investment Management Agreement:
MetLife Advisers is the investment adviser to the Asset Allocation Portfolio. The Fund has entered into an investment management agreement with MetLife Advisers with respect to the Portfolio. For providing investment management services to the Portfolio, MetLife Advisers receives monthly compensation at the following annual rates:
| | | | |
Management
Fees earned by
MetLife Advisers
for the year ended
December 31, 2008 | | Annual
percentage
rates paid to
MetLife Advisers | | Based on Portfolios
average daily net asset
levels |
| $1,526,885 | | 0.100% | | Of the first $500 million |
| | 0.075% | | Of the next $500 million |
| | 0.050% | | On amounts in excess of $1 billion |
In addition to the above Management Fee paid to MetLife Advisers, the Asset Allocation Portfolio indirectly pays MetLife Advisers an investment advisory fee through its investments in certain Underlying Portfolios.
Certain officers and directors of the Fund may also be officers of MetLife Advisers; however, such officers and directors receive no compensation from the Fund.
Service and Distribution Fees:
The Fund has adopted a Distribution and Service Plan under Rule 12b-1 of the 1940 Act for the Asset Allocation Portfolio’s Class B shares. Under the Distribution and Service Plan, the Class B shares of the Asset Allocation Portfolio pay a fee to compensate the Insurance Companies (or their affiliates) and other broker-dealers and financial intermediaries involved in the offer and sale of Asset Allocation Portfolio shares for promoting or selling and servicing the Class B shares of the Asset Allocation Portfolio. The fees under the Distribution and Service Plan for each class of the Asset Allocation Portfolio’s shares are calculated as a percentage of the Asset Allocation Portfolio’s average daily net assets that are attributable to that Class. Currently, the fee is 0.25% per year for Class B shares. Amounts paid by the Asset Allocation Portfolio for the year ended December 31, 2008 are shown as Service and Distribution fees in the Statement of Operations.
MSF-13
Metropolitan Series Fund, Inc.
MetLife Moderate Allocation Portfolio
Notes to Financial Statements—December 31, 2008—(Continued)
Expense Agreement:
Pursuant to an expense agreement relating to each class of the Asset Allocation Portfolio, MetLife Advisers has agreed, from May 1, 2008 to April 30, 2009, to waive a portion of its advisory fees or pay a portion of the other operating expenses (not including brokerage costs, interest, taxes, or extraordinary expenses) to the extent total operating expenses exceed stated annual expense limits (based on the Asset Allocation Portfolio’s then current fiscal year). For the Asset Allocation Portfolio, this subsidy, and similar subsidies in effect in earlier periods, are subject to the obligation of each class of the Asset Allocation Portfolio to repay MetLife Advisers in future years, if any, when a class’s expenses fall below the stated expense limit pertaining to that class that was in effect at the time of the subsidy in question. Such deferred expenses may be charged to a class in a subsequent year to the extent that the charge does not cause the total expenses in such subsequent year to exceed the class’ stated expense limit that was in effect at the time of the subsidy in question; provided, however, that no class of the Asset Allocation Portfolio is obligated to repay any expense paid by MetLife Advisers more than five years after the end of the fiscal year in which such expense was incurred.
The expense limits (annual rates as a percentage of each class of the Asset Allocation Portfolio’s net average daily net assets) in effect from May 1, 2008 to April 30, 2009 are 0.10% and 0.35% for Class A and B, respectively.
| 5. | TRANSACTIONS IN SECURITIES OF AFFILIATED ISSUERS: |
The Asset Allocation Portfolio does not invest in the Underlying Portfolios for the purpose of exercising management or control; however, investments by the Asset Allocation Portfolio within its principal investment strategies may represent a significant portion of the Underlying Portfolio’s net assets. Transactions in the Underlying Portfolios during the year ended December 31, 2008 are as follows:
| | | | | | | | |
Underlying Portfolio (Class A) | | Beginning Shares
as of 12/30/2007 | | Shares Purchased
during Period | | Shares Sold
during Period | | Ending Shares
as of 12/31/2008 |
MIST—BlackRock High Yield | | 2,744,823 | | 1,000,496 | | 445,207 | | 3,300,112 |
MIST—BlackRock Large Cap Core | | 4,234,803 | | 5,321,523 | | 152,032 | | 9,404,294 |
MIST—Clarion Global Real Estate | | 1,564,032 | | 1,331,912 | | 144,612 | | 2,751,332 |
MIST—Dreman Small Cap Value | | 4,950,321 | | 2,073,299 | | 492,568 | | 6,531,052 |
MIST—Harris Oakmark International | | 7,918,887 | | 4,666,944 | | 5,155,547 | | 7,430,284 |
MIST—Lazard Mid-Cap | | 7,297,891 | | 3,781,867 | | 2,283,171 | | 8,796,587 |
MIST—Legg Mason Value Equity | | 8,608,838 | | 5,861,011 | | 2,086,040 | | 12,383,809 |
MIST—Lord Abbett Bond Debenture | | 3,614,492 | | 1,162,217 | | 611,442 | | 4,165,267 |
MIST—Met/AIM Small Cap Growth | | 3,067,174 | | 1,981,941 | | 163,756 | | 4,885,359 |
MIST—MFS Research International | | 0 | | 9,552,135 | | 406,895 | | 9,145,240 |
MIST—PIMCO Inflation Protected | | 2,098,809 | | 604,376 | | 650,012 | | 2,053,173 |
MIST—PIMCO Total Return | | 39,502,717 | | 12,719,945 | | 14,620,908 | | 37,601,754 |
MSF—BlackRock Large Cap Value | | 8,612,871 | | 6,174,012 | | 240,977 | | 14,545,906 |
MSF—Davis Venture Value | | 4,443,725 | | 2,153,552 | | 142,833 | | 6,454,444 |
MSF—FI Mid Cap Opportunities | | 2,133,360 | | 2,084,135 | | 136,294 | | 4,081,201 |
MSF—Julius Baer International Stock | | 7,096,552 | | 4,611,398 | | 885,963 | | 10,821,987 |
MSF—Jennison Growth | | 5,195,685 | | 5,292,968 | | 168,005 | | 10,320,648 |
MSF—Met/Dimensional International Small Company | | 0 | | 3,973,448 | | 15,765 | | 3,957,683 |
MSF – MetLife Stock Index | | 2,509,050 | | 2,190,592 | | 75,889 | | 4,623,753 |
MSF – MFS Value | | 0 | | 4,589,662 | | 70,459 | | 4,519,203 |
MSF—Neuberger Berman Mid Cap Value | | 6,685,247 | | 2,980,499 | | 4,031,953 | | 5,633,793 |
MSF—Russell 2000 Index | | 3,208,555 | | 1,793,695 | | 308,107 | | 4,694,143 |
MSF—T. Rowe Price Large Cap Growth | | 7,088,764 | | 3,851,343 | | 2,056,833 | | 8,883,274 |
MSF—Van Eck Global Natural Resources | | 0 | | 1,989,421 | | 8,061 | | 1,981,360 |
MSF—Western Asset Mgmt. Strategic Bond Opportunities | | 21,513,247 | | 6,023,523 | | 7,865,007 | | 19,671,763 |
MSF—Western Asset Mgmt. U.S. Government | | 3,665,866 | | 1,139,409 | | 1,479,097 | | 3,326,178 |
MSF-14
Metropolitan Series Fund, Inc.
MetLife Moderate Allocation Portfolio
Notes to Financial Statements—December 31, 2008—(Continued)
| | | | | | | | | | | | | |
Underlying Portfolio (Class A) | | Realized Gain/(Loss)
during Period | | | Capital Gains
Distributions
during Period | | Dividend Income
During Period | | Ending Value
as of 12/31/2008 |
MIST—BlackRock High Yield | | $ | (638,460 | ) | | $ | 0 | | $ | 1,749,290 | | $ | 19,173,650 |
MIST—BlackRock Large Cap Core | | | (536,779 | ) | | | 2,021,201 | | | 309,416 | | | 62,726,640 |
MIST—Clarion Global Real Estate | | | (440,435 | ) | | | 2,136,017 | | | 440,902 | | | 20,359,859 |
MIST—Dreman Small Cap Value | | | (335,445 | ) | | | 2,071,561 | | | 551,471 | | | 64,004,305 |
MIST—Harris Oakmark International | | | (30,069,319 | ) | | | 21,581,676 | | | 2,520,757 | | | 63,677,533 |
MIST—Lazard Mid-Cap | | | (5,727,880 | ) | | | 6,650,085 | | | 1,091,561 | | | 60,960,345 |
MIST—Legg Mason Value Equity | | | (3,653,417 | ) | | | 3,424,158 | | | 251,207 | | | 56,841,683 |
MIST—Lord Abbett Bond Debenture | | | (927,528 | ) | | | 710,250 | | | 2,047,764 | | | 40,569,700 |
MIST—Met/AIM Small Cap Growth | | | (573,316 | ) | | | 4,022,065 | | | 0 | | | 40,841,598 |
MIST—MFS Research International | | | (1,989,610 | ) | | | 0 | | | 0 | | | 67,766,229 |
MIST—PIMCO Inflation Protected | | | 134,910 | | | | 48,913 | | | 926,386 | | | 20,182,695 |
MIST—PIMCO Total Return | | | (3,737,067 | ) | | | 12,109,593 | | | 19,904,325 | | | 436,180,352 |
MSF—BlackRock Large Cap Value | | | (1,063,592 | ) | | | 1,855,787 | | | 956,890 | | | 125,967,547 |
MSF—Davis Venture Value | | | (306,007 | ) | | | 859,743 | | | 2,065,359 | | | 140,255,075 |
MSF—FI Mid Cap Opportunities | | | (436,079 | ) | | | 0 | | | 179,289 | | | 38,444,916 |
MSF—Julius Baer International Stock | | | (3,970,550 | ) | | | 13,092,019 | | | 3,397,991 | | | 84,411,498 |
MSF—Jennison Growth | | | (538,638 | ) | | | 5,780,709 | | | 1,676,346 | | | 80,604,265 |
MSF—Met/Dimensional International Small Company | | | (7,604 | ) | | | 0 | | | 0 | | | 40,210,058 |
MSF – MetLife Stock Index | | | (488,267 | ) | | | 3,685,274 | | | 1,718,287 | | | 101,768,813 |
MSF – MFS Value | | | (225,475 | ) | | | 0 | | | 0 | | | 41,893,015 |
MSF—Neuberger Berman Mid Cap Value | | | (3,457,234 | ) | | | 1,580,612 | | | 1,100,520 | | | 61,971,725 |
MSF—Russell 2000 Index | | | (1,036,724 | ) | | | 2,250,190 | | | 573,578 | | | 41,730,932 |
MSF—T. Rowe Price Large Cap Growth | | | 1,031,056 | | | | 6,278,755 | | | 656,602 | | | 80,393,625 |
MSF—Van Eck Global Natural Resources | | | (5,588 | ) | | | 0 | | | 0 | | | 19,239,009 |
MSF—Western Asset Mgmt. Strategic Bond Opportunities | | | (8,156,568 | ) | | | 1,657,253 | | | 11,232,494 | | | 203,209,308 |
MSF—Western Asset Mgmt. U.S. Government | | | (744,230 | ) | | | 0 | | | 2,053,810 | | | 39,648,042 |
MSF-15
Metropolitan Series Fund, Inc.
MetLife Moderate Allocation Portfolio
Report of Independent Registered Public Accounting Firm
To the Shareholders and Board of Directors of Metropolitan Series Fund, Inc.:
We have audited the accompanying statement of assets and liabilities, including the schedule of investments, of the MetLife Moderate Allocation Portfolio (one of the portfolios constituting the Metropolitan Series Fund, Inc.) (the “Fund”) as of December 31, 2008, and the related statement of operations for the year then ended, the statements of changes in net assets for each of the two years in the period then ended, and the financial highlights for each of the three years in the period then ended and the period from May 2, 2005 (commencement of operations ) through December 31, 2005. These financial statements and financial highlights are the responsibility of the Fund’s management. Our responsibility is to express an opinion on these financial statements and financial highlights based on our audits.
We conducted our audits in accordance with the standards of the Public Company Accounting Oversight Board (United States). Those standards require that we plan and perform the audit to obtain reasonable assurance about whether the financial statements and financial highlights are free of material misstatement. The Fund is not required to have, nor were we engaged to perform, an audit of its internal control over financial reporting. Our audits included consideration of internal control over financial reporting as a basis for designing audit procedures that are appropriate in the circumstances, but not for the purpose of expressing an opinion on the effectiveness of the Fund’s internal control over financial reporting. Accordingly, we express no such opinion. An audit also includes examining, on a test basis, evidence supporting the amounts and disclosures in the financial statements, assessing the accounting principles used and significant estimates made by management, as well as evaluating the overall financial statement presentation. Our procedures included confirmation of securities owned as of December 31, 2008, by correspondence with the transfer agent. We believe that our audits provide a reasonable basis for our opinion.
In our opinion, the financial statements and financial highlights referred to above present fairly, in all material respects, the financial position of the MetLife Moderate Allocation Portfolio of the Metropolitan Series Fund, Inc. as of December 31, 2008, the results of its operations for the year then ended, the changes in its net assets for each of the two years in the period then ended, and the financial highlights for each of the three years in the period then ended and the period from May 2, 2005 (commencement of operations) through December 31, 2005, in conformity with accounting principles generally accepted in the United States of America.
Deloitte & Touche LLP
Boston, Massachusetts
February 26, 2009
MSF-16
Metropolitan Series Fund, Inc.
Directors and Officers
The Fund’s Directors review actions of the Fund’s investment adviser and subadvisers, and decide upon matters of general policy. The Fund’s officers supervise the daily business operations of the Fund. The Board of Directors and the Fund’s officers are listed below. Each Director is responsible for overseeing all 38 Portfolios of the Fund. There is no limit to the term a Director may serve. Directors serve until their resignation, retirement or removal in accordance with the Fund’s organizational documents and policies adopted by the Board from time to time. Officers hold office at the pleasure of the Board or until the election or appointment and the qualification of a successor. The address of the Directors and officers is c/o Metropolitan Series Fund, Inc., 501 Boylston Street, Boston, MA 02116.
Interested Directors(1)
Each Director below is an “interested person” (as defined by the 1940 Act) with respect to the Fund in that Ms. Forget is an employee of MetLife and Mr. Typermass is a former employee of MetLife and owns securities issued by MetLife, Inc., the ultimate parent company of MetLife Advisers.
| | | | | | | | |
Name, Address and Age | | Current
position(s)
with Fund | | Position(s)
held since | | Principal occupations
over past five years, including other directorships(2) | | Number of
Portfolios in
Fund Complex
Overseen by
Director(3) |
Elizabeth M. Forget Age: 42 | | Director, Chairman of the Board, President and Chief Executive Officer | | 2006 | | Senior Vice President (since 2007), MetLife, Inc.; President, Met Investors Advisory, LLC; Trustee and President, Met Investors Series Trust; Executive Vice President, MetLife Investors Group, Inc.; President, Chief Executive Officer and Chair of the Board of Managers (since 2006), MetLife Advisers; President, Met Investors Advisory, LLC. | | 87 |
| | | | |
Arthur G. Typermass Age: 71 | | Director | | 1998 | | Formerly, Senior Vice President and Treasurer, MetLife. | | 38 |
Non-Interested Directors(1)
Each Director below is not an “interested person” (as defined by the 1940 Act) with respect to the Fund (collectively, the “Independent Directors”).
| | | | | | | | |
Name, Address and Age | | Current
position(s)
with Fund | | Position(s)
held since | | Principal occupations
over past five years, including other directorships(2) | | Number of
Portfolios in
Fund Complex
Overseen by
Director(3) |
Steve A. Garban† Age: 71 | | Director | | 1985 | | Formerly, Chief Financial Officer, Senior Vice President Finance and Operations and Treasurer (Emeritus), The Pennsylvania State University. | | 38 |
| | | | |
Linda B. Strumpf Age: 61 | | Director | | 2000 | | Vice President and Chief Investment Officer, Ford Foundation. | | 38 |
| | | | |
Michael S. Scott Morton† Age: 71 | | Director | | 1993 | | Jay W. Forrester Professor of Management (Emeritus) at Sloan School of Management, MIT. | | 38 |
| | | | |
H. Jesse Arnelle Age: 75 | | Director | | 2001 | | Formerly, Counsel, Womble Carlyle Sandrie & Rice; Director, Textron Inc. (global multi- industry company)*; formerly, Director, Gannet Co. Inc. (diversified news and information company)*; formerly, Director, Eastman Chemical Company (global chemical company)*; formerly, Director, Waste Management, Inc.*; formerly, Director, Armstrong Holdings Inc. (parent company of floor and ceiling products business)*; formerly, Director, FPL Group Inc. (public utility holding company)*; Director, URS Corporation (engineering design services firm)*. | | 38 |
MSF-17
Metropolitan Series Fund, Inc.
Directors and Officers—(Continued)
| | | | | | | | |
Name, Address and Age | | Current
position(s)
with Fund | | Position(s)
held since | | Principal occupations
over past five years, including other directorships(2) | | Number of
Portfolios in
Fund Complex
Overseen by
Director(3) |
Nancy Hawthorne Age: 57 | | Director | | 2003 | | Chief Executive Officer, Clerestory LLC (corporate financial advisor); Director, Avid Technologies (computer software company)*; formerly, Chairman of the Board of Avid Technologies; formerly, Board of Advisors, L. Knife & Sons, Inc. (beverage distributor); formerly, Trustee, New England Zenith Fund (“Zenith Fund”)**; formerly, Chief Executive Officer and Managing Partner, Hawthorne, Krauss and Associates (corporate financial advisor); formerly, Chief Financial Officer and Executive Vice President, Continental Cablevision, subsequently renamed MediaOne (cable television company); formerly, Director, Life F/X, Inc.; formerly, Chairman of the Board, WorldClinic (distance medicine company); formerly, Director, Perini Corporation (construction company)*; formerly, Director, CGU (property and casualty insurance company); formerly, Director, Beacon Power Corporation (energy company)*. | | 38 |
| | | | |
John T. Ludes Age: 72 | | Director | | 2003 | | President, LFP Properties (consulting firm); Formerly, Trustee, Zenith Fund**; formerly, Vice Chairman, President and Chief Operating Officer, Fortune Brands/American Brands (global conglomerate); formerly, President and CEO, Acushnet Company (athletic equipment company). | | 38 |
Officers(1)
| | | | | | | | |
Name and address | | Age | | Current
position(s)
with Fund | | Position(s)
held since | | Principal occupations over past five years(2) |
| Jeffrey L. Bernier | | 37 | | Senior Vice President | | 2008 | | Vice President (since 2008), MetLife, Inc.; Vice President (since 2008), MetLife; Senior Vice President (since 2008), MetLife Advisers; formerly, Director and Senior Investment Analyst (2004 to 2007), John Hancock Financial Services; formerly, Assistant Vice President (2000 to 2001), Wachovia Securities. |
| | | | |
| Alan C. Leland | | 56 | | Senior Vice President | | 2005 | | Treasurer and Chief Financial Officer, MetLife Advisers, LLC; Treasurer (since 2005), Met Investors Advisory, LLC; Vice President (since 2004), Met Investors Advisory, LLC; Vice President (since 2003), MetLife, Inc.; Vice President, MetLife; Senior Vice President, NELICO. |
| | | | |
| Peter Duffy | | 53 | | Vice President
and Treasurer | | 2000 | | Senior Vice President, MetLife Advisers; Second Vice President (since 2003), NELICO; Vice President, MetLife (since 2004); Vice President (since 2004), MetLife, Inc.; formerly, Vice President and Treasurer, Zenith Fund**. |
| | | | |
| Jeffrey P. Halperin | | 41 | | Chief
Compliance Officer | | 2007 | | Vice President (since 2006), MetLife, Inc.; Vice President (since 2006), MetLife; Chief Compliance Officer (since 2006), Met Investors Series Trust, MetLife Advisers, Met Investors Advisory, LLC and MetLife Investment Advisors Company, LLC. |
| * | Indicates a directorship with a registered investment company or a company subject to the reporting requirements of the Securities Exchange Act of 1934, as amended. |
| ** | The Zenith Fund deregistered with the Securities and Exchange Commission (“SEC”) in 2004. |
| (†) | Served as a trustee, director and/or officer of one or more of the following companies, each of which had a direct or indirect advisory relationship with MetLife Advisers or its affiliates prior to January 31, 2005: State Street Research Financial Trust, State Street Research Income Trust, State Street Research Money Market Trust, State Street Research Institutional Funds, State Street Research Capital Trust, State Street Research Master Investment Trust, State Street Research Equity Trust, State Street Research Securities Trust and State Street Research Exchange Trust (collectively, the “State Street Research Funds”). |
| (1) | During the period shown, each Director of the Fund served as a Trustee of Metropolitan Series Fund II, a registered investment company that ceased investment operations in June of 2008 and has applied for deregistration under the Investment Company Act of 1940. During this period, each officer of the Fund served in the same position with Metropolitan Series Fund II. |
| (2) | Previous positions during the past five years with the Fund; Met Investors Series Trust; MetLife; MetLife, Inc.; MetLife Advisers; Met Investors Advisory, LLC; Zenith Fund; NELICO; or New England Securities Corporation are omitted if not materially different. |
| (3) | The Fund Complex includes the Fund (38 portfolios) and Met Investors Series Trust (49 portfolios). |
MSF-18
Metropolitan Series Fund, Inc.
MetLife Moderate Allocation Portfolio
Board Approval of Advisory and Subadvisory Agreements
The Fund’s Contract Review Committees of the Board of Directors (the “Board” or the “Directors”) typically meet in early fall to review the Portfolios’ advisory agreements (the “Advisory Agreements”) and subadvisory agreements (the “Subadvisory Agreements,” and, together with the Advisory Agreements, the “Agreements”) and determine whether to recommend that the full Board approve the continuation of the Agreements for an additional one-year period. (Following the initial approval of an Agreement for a new Portfolio or with a new adviser or subadviser, such annual reviews are not required until 2 years following the execution of such Agreement.) After each Committee has made its recommendations, the full Board, including the Independent Directors, determines whether to approve the continuation of each of the Agreements. In addition, the Board, including the Independent Directors, considers matters bearing on the Agreements at most of its other meetings throughout the year and regularly interviews various individuals at MetLife Advisers responsible for the management of the Portfolios. The Directors also interview selected investment managers and other professionals at the subadvisers at various times throughout the year.
The Directors receive all materials that they or MetLife Advisers, the Fund’s investment adviser, and the subadvisers believe to be reasonably necessary for the Directors to evaluate the Agreements and determine whether to approve the continuation of the Agreements. These materials generally include, among other items, (i) information on the investment performance of the Portfolios and the performance of peer groups of funds and the Portfolios’ performance benchmarks, (ii) information on the Portfolios’ advisory and subadvisory fees and other expenses, including information comparing the Portfolios’ expenses to those of peer groups of funds and information about any applicable expense caps and fee “breakpoints,” (iii) sales and redemption data, (iv) information related to the profitability of the Agreements to MetLife Advisers and certain of the subadvisers, and potential “fall-out” or ancillary benefits that MetLife Advisers, the subadvisers or their affiliates may receive as a result of their relationships with the Fund and (v) information obtained through the subadvisers’ responses to certain requests from MetLife Advisers and the Directors and MetLife Advisers’ responses to requests from the Directors. The Directors may also consider other information such as (vi) MetLife Advisers’ and the subadvisers’ financial results and condition, (vii) each Portfolio’s investment objectives and strategies and the size, education and experience of the investment staffs of MetLife Advisers and the relevant subadvisers and their use of technology and external research, (viii) the allocation of the Portfolios’ brokerage, if any, including allocations to brokers affiliated with the subadvisers and the use of “soft” commission dollars to pay Portfolio expenses and to pay for research and other similar services, (ix) the resources devoted to, and the record of compliance with, the Portfolios’ investment policies and restrictions, policies on personal securities transactions and other compliance policies, (x) the responses of MetLife Advisers, the subadvisers and/or their affiliates to certain legal and regulatory proceedings and (xi) the economic outlook generally and for the mutual fund industry in particular. Throughout the process, the Directors have the opportunity to ask questions of and request additional materials from MetLife Advisers and the subadvisers.
Following meetings of each Contract Review Committee on September 10, 2008, the Board, including the Independent Directors, at its November 6-7, 2008 meeting, approved the continuation through December 31, 2009 of the Advisory Agreements for each Portfolio of the Fund and the Subadvisory Agreements for each Portfolio other than the Zenith Equity Portfolio and Asset Allocation Portfolios (which do not have subadvisers) and the Van Eck Global Natural Resources Portfolio, Met/Dimensional International Small Cap Portfolio and Loomis Sayles Small Cap Growth Portfolio (formerly known as the Franklin Templeton Small Cap Growth Portfolio). The Agreements approved for continuation are referred to below as the “Continued Agreements.”
In considering whether to approve the continuation of the Continued Agreements, the Directors, including the Independent Directors, did not identify any single factor as determinative, and each weighed the various factors as he or she deemed appropriate. The Directors considered the following matters in connection with their approval of the Continued Agreements:
The nature, extent and quality of the services provided to the relevant Portfolios under the Continued Agreements. The Directors considered the nature, extent and quality of the services provided by MetLife Advisers, the relevant subadvisers (if any) and their affiliates (each, an “Adviser,” and, collectively, the “Advisers”) to the relevant Portfolios pursuant to the Continued Agreements and the resources dedicated to these Portfolios by the Advisers. In particular, the Directors considered the Advisers’ abilities to attract and retain highly qualified investment professionals. With respect to MetLife Advisers, the Directors considered (for each Portfolio other than the Zenith Equity and Asset Allocation Portfolios) that MetLife Advisers is (i) ultimately responsible for the performance of such Portfolios; (ii) ultimately responsible for the establishment of the investment strategies of each such Portfolio, primarily through its recommendations to the Board regarding the hiring and selection of subadvisers; (iii) responsible for the hiring and selection, subject to Board approval, of subadvisers; and (iv) responsible for maintaining a program of Subadviser oversight reasonably designed to ensure that the subadvisers have reasonable compliance policies and procedures in place. The Directors also considered that MetLife Advisers provides a full range of day-to-day administrative services for the Portfolios involving all aspects of such Portfolios’ day-to-day operations (other than portfolio management). With respect to the Zenith Equity and Asset Allocation Portfolios, the Directors considered both the portfolio management services and the administrative services provided by MetLife Advisers. After reviewing
MSF-19
Metropolitan Series Fund, Inc.
MetLife Moderate Allocation Portfolio
Board Approval of Advisory and Subadvisory Agreements—(Continued)
these and related factors, the Directors concluded, within the context of their overall conclusions regarding each of the Continued Agreements, that the nature, extent and quality of services provided supported the renewal of these Agreements.
Investment performance of the relevant Portfolios. The Directors reviewed information about the performance of the relevant Portfolios over various time periods, including information prepared by an independent third party that compared the performance of the Portfolios to the performance of peer groups of funds and performance benchmarks. The Directors also reviewed a description of the third party’s methodology for identifying a Portfolio’s peer group(s) for purposes of performance and expense comparisons.
In the case of each relevant Portfolio that had performance that lagged its peer group(s) for certain periods, the Directors concluded that other factors relevant to performance were sufficient, in light of other considerations, to warrant renewal of the Continued Agreements relating to such Portfolio. These factors varied from Portfolio to Portfolio, but included one or more of the following: (i) that such Portfolio’s performance, although lagging in certain recent periods, was stronger over the longer term; (ii) that the underperformance was attributable, to a significant extent, to investment decisions that were reasonable and consistent with the Portfolio’s investment objective(s) and policies and that the Portfolio was performing within the range of reasonable expectations, given market conditions and the Portfolio’s investment objective(s) and policies; (iii) that the Portfolio’s performance was competitive when compared to other relevant performance benchmarks or peer groups; and (iv) that MetLife Advisers and/or the relevant subadviser (if any) had taken or was taking steps designed to help improve the Portfolio’s investment performance (including, in the case of certain Portfolios, that MetLife Advisers was formulating possible proposals, for presentation to the Board in November 2008, to replace the Portfolio’s subadviser or to merge the Portfolio into another Portfolio with a similar investment objective and better investment performance).
The Directors also considered the investment performance of the Advisers and their reputations generally, the historical responsiveness of the Advisers to Director concerns about performance and the willingness of the Advisers to take steps intended to improve performance.
After reviewing these and related factors, the Directors concluded, within the context of their overall conclusions regarding each of the Continued Agreements, that the investment performance of each relevant Portfolio and Adviser was sufficient, in light of other considerations, to warrant the renewal of the Continued Agreements.
The costs of the services to be provided and profits to be realized by the Advisers and their affiliates from their relationships with the Portfolios. The Directors considered the fees charged by MetLife Advisers to the Portfolios for advisory services and, with respect to the subadvised Portfolios, by such subadvisers to MetLife Advisers for subadvisory services (such advisory and subadvisory fees (if any), collectively, “Fees”), as well as the total expense levels of the Portfolios. This information included comparisons (provided by an independent third party) of the Portfolios’ advisory fees and total expense levels to those of their peer groups. In evaluating Fees for the relevant Portfolios, the Directors also took into account the demands, complexity and quality of the investment management services provided to each Portfolio. The Directors considered MetLife Advisers’ recommendations regarding reductions in Fee rates, implementation of Fee breakpoints and institution of Fee waivers and expense caps.
The Directors also considered the compensation directly or indirectly received by the Advisers and their affiliates from their relationships with the relevant Portfolios. The Directors reviewed information relating to the profits received by MetLife Advisers, certain of the subadvisers and their affiliates as a result of their relationships with the relevant Portfolios, and information about the allocation of expenses used to calculate profitability. When reviewing profitability, the Directors also considered the performance of the relevant Portfolios, the expense levels of such Portfolios and whether the relevant Advisers had implemented breakpoints, fee waivers and/or expense caps with respect to such Portfolios.
After reviewing these and related factors, the Directors concluded, within the context of their overall conclusions regarding each of the Continued Agreements, that the Fees charged to each of the relevant Portfolios were fair and reasonable, and that the information provided regarding costs of these services generally, and the related profitability (if known) to the relevant Advisers of their relationships with the relevant Portfolios, supported the renewal of the Continued Agreements.
Economies of Scale. The Directors considered the existence of any economies of scale in the provision of services by the Advisers and whether those economies were shared with the relevant Portfolios through breakpoints in their advisory fees or other means, such as expense caps, fee waivers or relatively low levels of fees. The Directors noted that most of the relevant Portfolios benefited or will benefit from breakpoints, expense caps and/or fee waivers with respect to their advisory fees. In considering these issues, the Directors also took into consideration information relating to the costs of the services provided and the profitability to MetLife Advisers, the relevant subadvisers (if any) and each of their affiliates of their relationships with the relevant Portfolios, as discussed above.
MSF-20
Metropolitan Series Fund, Inc.
MetLife Moderate Allocation Portfolio
Board Approval of Advisory and Subadvisory Agreements—(Continued)
After reviewing these and related factors, the Directors concluded, within the context of their overall conclusions regarding each of the Continued Agreements, that the extent to which economies of scale were shared with the relevant Portfolios supported the renewal of such Agreements.
Other Factors. The Directors also considered other factors, which included but were not limited to the following:
| | • | | the extent to which each relevant Portfolio operated in accordance with its investment objective, and its record of compliance with its investment restrictions and the compliance programs of the Fund and the Advisers. They also considered the compliance-related resources the Advisers and their affiliates provide to the relevant Portfolios; |
| | • | | the nature, quality, cost and extent of administrative and shareholder services performed by MetLife Advisers and its affiliates under the Advisory Agreements; and |
| | • | | so-called “fall-out benefits” to the Advisers, such as the engagement of their affiliates to provide distribution, brokerage and transfer agency services to the Portfolios, and the benefits of research made available to the relevant Advisers by reason of brokerage commissions generated by the relevant Portfolios’ securities transactions. The Directors also considered the possible conflicts of interest associated with these fall-out and other benefits, and the reporting and other processes in place to disclose and monitor these possible conflicts of interest. |
Based on their evaluation of all factors that they deemed to be material, including those factors described above, and assisted by the advice of independent counsel, the Directors, including the Independent Directors, concluded that each of the Continued Agreements should be continued through December 31, 2009.
MSF-21
A description of the policies and procedures that the Fund uses to determine how to vote proxies relating to portfolio securities is available (i) without charge, upon request, by calling (800) 638-7732 and (ii) on the Securities and Exchange Commission’s (the “SEC”) website at http://www.sec.gov.
Information regarding how the Fund voted proxies relating to portfolio securities during the most recent twelve-month period ended December 31, 2008 is available (i) without charge, upon request, by calling (800) 638-7732 and (ii) on the SEC’s website at http://www.sec.gov.
The Fund’s Statement of Additional Information includes additional information about the Directors of the Fund and is available (i) without charge, upon request, by calling (800) 638-7732 and (ii) on the SEC’s website at http://www.sec.gov.
The Fund files with the SEC a complete schedule of its portfolio holdings, as of the close of the first and third quarters of its fiscal year, on “Form N-Q”. These filings are available on the SEC’s website at www.sec.gov and may be reviewed and copied at the SEC’s Public Reference Room in Washington, DC. (Call 1-800-SEC-0330 for information on the operation of the Public Reference Room.)
MSF-22
Simplify your life…
with MetLife eDelivery® while helping MetLife preserve the planet’s natural resources.
(see details on inside cover)
| | |
Metropolitan Series Fund, Inc. MetLife Moderate to Aggressive Allocation Portfolio Annual Report | | December 31, 2008 |
NOT PART OF THE ANNUAL REPORT
Letter from the President
February 1, 2009
Letter to Policy Holders:
2008 was an extraordinary year in the capital markets around the world and for the global economy. Energy prices rose to record levels early in the year before falling by two-thirds by year-end. A credit crisis that began with concerns about sub-prime mortgages led to massive changes in the financial landscape with government takeovers, forced sales, and outright failures of a number of large, once venerable firms.
While bonds as measured by the Barclays Capital U.S. Aggregate Bond Index (formerly known as, Lehman Brothers U.S. Aggregate Bond Index) were up 5.2% for the year in response to declining interest rates, there were large differences in the total returns of the various sectors of the bond market. U.S. treasury securities were up over 13% as frightened investors sought refuge in what they perceived to be the safest and most liquid investments. In contrast, investment grade corporate securities lost nearly 5% as credit spreads widened and below investment grade or high yield bonds fell over 26%.
In response to the growing credit crisis and the weakening economy, common stocks fell sharply across all regions, styles, and capitalizations. As measured by the Standard and Poor’s 500, U.S. common stocks fell 37% for the year, the worst calendar year decline since the 1930s. Foreign stocks were down even more with the MSCI EAFE Index down 43% for the year.
On the following pages, you will find a complete review of your Portfolio and its investment performance.
MetLife is committed to building your financial freedom. We appreciate your trust and will continue to focus our efforts on meeting your investment needs.
Sincerely,
Elizabeth M. Forget
President, Metropolitan Series Fund, Inc.
Metropolitan Series Fund, Inc.
MetLife Moderate to Aggressive Allocation Portfolio
Managed by MetLife Advisers, LLC
Portfolio Manager Commentary*
PORTFOLIO PERFORMANCE
For the twelve-month period ended December 31, 2008, the Class A shares of the MetLife Moderate to Aggressive Allocation Portfolio returned -35.0% compared to the -37.3% return of the Wilshire 5000 Stock Index1 and the 2.4% return of the Barclays Capital U.S. Universal Bond Index2. Considering that no single index or benchmark can accurately capture the multiple asset class design of the Portfolio, we have created a blended benchmark comprised of several indices for use in portfolio design and evaluation purposes. Specifically, the blended benchmark for the MetLife Moderate to Aggressive Allocation Portfolio currently consists of a 4% allocation to the Barclays Capital 1 to 3 Year Government Bond Index3, a 16% allocation to the Barclays Capital U.S. Universal Bond Index, a 60% allocation to the Wilshire 5000 Stock Index, and a 20% allocation to the Morgan Stanley Capital International EAFE Index4. During the twelve-month period ended December 31, 2008, the blended benchmark returned -31.7%.
ECONOMIC AND MARKET REVIEW
The first half of 2008 was highlighted by growing concerns about the economy due to the emerging credit crisis, rising unemployment, falling consumer confidence, a struggling housing sector, and skyrocketing food and energy prices. The forced sale of Bear Stearns in March to JP Morgan at first appeared to be an isolated event, but would prove to be a harbinger of things to come. The Federal Reserve was aggressive early in the year to revive the economy when they cut their target rate several times to bring it down from 4.25% to 2.00% by early May. They held rates steady in subsequent meetings through the summer as they tried to balance the danger of the economy falling into a recession against their desire to control growing inflation pressures.
However, the evidence of a weakening economy (especially falling real estate prices and the impact of the sub-prime mortgage crisis) gained momentum during the summer, climaxing in the extraordinary events of September and October that saw the government’s provision of credit assistance to Fannie Mae and Freddie Mac, the bankruptcy of Lehman Brothers, and the failure of Washington Mutual. The U.S. government and governments around the world took massive fiscal and monetary actions to stabilize the capital markets, restore liquidity to the clogged credit pipeline, and to stimulate the economy. These efforts continue as we move into 2009. Although we now know that the recession began a year ago in December 2007, the recession intensified during the last months of 2008: unemployment rose sharply as companies made massive layoffs, housing prices and sales continued to fall, retail sales fell, and, in a bit of good news / bad news, oil prices fell nearly $100 per barrel in response in expectation of lower global demand. The incoming administration of Barack Obama faces what most pundits call the largest economic crisis since the Great Depression.
During the first half of 2008, bond returns fluctuated as investors’ concerns changed from a weakening economy to inflation pressures fueled by soaring energy prices. Bonds eked out modestly positive total return of 1.1% for the January to June period as measured by the Barclays Capital U.S. Aggregate Bond Index5. During the second half of the year, the weak economy drove yields down and credit spreads wider as investors sought refuge in the safety of treasury securities. This resulted in mixed returns for bonds. Treasury bonds returned over 13% for the full year, while investment grade corporate bonds were down nearly 5%. High yield bonds were down over 26% for the year with most of the decline occurring in the second half of the year. While most credit based bonds recovered somewhat in December, it was not enough to reverse the earlier losses.
U.S. common stocks suffered their worst calendar year decline in over seventy years during 2008 as measured by the -37.0% return of the Standard & Poor’s 500 Index6. Growing expectations for a deep and long recession and a sharp drop in corporate earnings drove stock prices lower. The total collapse of several high profile financial firms pulled the indices down further. While there was very little difference in the return by style within large cap stocks, growth fell more than value at the mid cap and small cap segments. There was little difference in return by capitalization. By sector, Financials and Materials were down the most, while Consumer Staples held up better on a relative basis. Energy, which was up nearly 9% in the first half of the year, fell 40% in the second half to finish the year down almost 35%. Foreign stocks were also down sharply for the year, falling over 43% as measured by the MSCI EAFE Index. Emerging markets were down 53.3% as measured by the MSCI Emerging Markets Index7.
PORTFOLIO REVIEW
The MetLife Moderate to Aggressive Allocation Portfolio is a “fund of funds” consisting of other portfolios of the Met Investors Series Trust and the Metropolitan Series Fund with a broad allocation goal of 80% in equities and 20% in fixed income. The most significant change in strategy during the first half of 2008 was an increase in the asset class goal for foreign stocks from 20% of total equities to 25% of total equities. For this Portfolio, this resulted in a change in the goal for foreign stocks from 16% to 20%. There were also several small adjustments to the underlying portfolio targets that were part of the annual review and restructuring. We initiated positions in two new portfolios during the fourth quarter to add further diversification: a 2% position in the Met/Dimensional International Small Company Portfolio and a 2% position in the Van Eck Global Natural Resources Portfolio.
The Portfolio was structured to be diversified across a wide variety of asset classes to add value over the long term. However, for most of 2008, investors shunned risk and rewarded only what they perceived to be the safest investments.
The Portfolio’s fixed income portfolios had a negative impact on relative performance as the Portfolio’s underlying bond portfolios held higher positions in credit based bonds (and less in Treasury securities) than is held in the broad bond indices. In particular, the
MSF-2
Metropolitan Series Fund, Inc.
MetLife Moderate to Aggressive Allocation Portfolio
Managed by MetLife Advisers, LLC
Portfolio Manager Commentary*
Lord Abbett Bond Debenture Portfolio and the Western Asset Management Strategic Bond Opportunities Portfolio were down sharply relative to the broad index because of their high yield bond and other credit exposure. Overall high yield exposure was about 2% of the portfolio, which was in line with our target of 2%. WAM Strategic was also adversely impacted by its significant exposure to Non-Agency Mortgage Backed Securities, which were down sharply in response to the credit crisis.
Within the equity sector, a cumulative overweight in the Financials and Materials sectors and an underweight to the Consumer Staples sector detracted from relative performance during the full year. Certain Portfolios led a positive impact on relative performance. Dreman Small Cap Value Portfolio, although down over 25% for the year, held up due to an overweight in the Consumer Staples sector and good overall stock selection, especially in the Health Care sector. BlackRock Large Cap Value Portfolio added to relative performance mostly due to stock selection in the Financials sector by avoiding many of the high profile blowups. MFS Value Portfolio also outperformed for the year, where an underweight in the generally struggling Information Technology sector and good stock selection helped performance. They avoided poorer performing stocks such as Apple, Google, and Mircosoft and owned better performing alternatives such as Accenture, Oracle, and IBM.
The Legg Mason Value Equity Portfolio was hurt in the first half of the year by its lack of exposure to the strong energy sector, but it continued to struggle in the second half even though the portfolio managers’ concerns about the sustainability of the high energy prices proved to be correct. The portfolio was also hurt by its exposure to several of the high profile financial stocks. Neuberger Berman Mid Cap Value Portfolio, one of the strongest performing portfolios in the first half of the year due to its energy exposure, struggled in the second half of the year for the same reason. It also was hurt by its exposure to Bear Stearns and poor overall stock selection in the Industrial sector. For example Chicago Bridge & Iron, Terex Corp., and McDermott International were all large positions that each fell over 70% for the year. FI Mid Cap Opportunities Portfolio was also hurt by its energy exposure in the second half and by overall poor stock selection, especially in the Financials (holding Brazilian brokerage firm BM&F Bovespa) and Industrials (holding engineering firm Flowserve) sectors.
Despite the recent poor performance of the Portfolio, we will continue to take a long term view to provide a well diversified portfolio to meet long term objectives.
* The views expressed above are those of the advisory firm as of December 31, 2008 and are subject to change based on market and other conditions. Information about the Portfolio’s holdings, asset allocation, industry allocation, or country diversification is historical and is not an indication of future Portfolio composition, which will vary. The performance of any index mentioned in this commentary has not been adjusted for ongoing management, distribution and operating expenses, and sales charges applicable to mutual fund investments. Direct investment in any index is not possible.
1 The Wilshire 5000 Equity Index measures the performance of all U.S. headquartered equity securities with readily available price data.
2 The Barclays Capital U.S. Universal Bond Index (formerly, Lehman Brothers U.S. Universal Bond Index) represents the union of the U.S. Aggregate Index, the U.S. High-Yield Corporate Index, the 144A Index, the Eurodollar Index, the Emerging Markets Index, the non-EIRSA portion of the Commercial Mortgage Backed Securities Index and the Commercial Mortgage Backed Securities High Yield Index. The index itself remains unchanged since Barclays assumed responsibility for the index from Lehman.
3 The Barclays Capital 1 to 3 Year Government Bond Index (formerly, Lehman Brothers 1 to 3 Year Government Bond Index) includes most obligations of the U.S Treasury, agencies and quasi-federal corporations having maturities between one to three years. The index itself remains unchanged since Barclays assumed responsibility for the index from Lehman.
4 The Morgan Stanley Capital International Europe, Australasia and Far East Index (“MSCI EAFE Index”) is an unmanaged free float-adjusted market capitalization index that is designed to measure developed market equity performance, excluding the U.S. & Canada.
5 Barclays Capital U.S. Aggregate Bond Index (formerly, Lehman Brothers U.S. Aggregate Bond Index) includes most obligations of the U.S. Treasury, agencies and quasi-federal corporations, most publicly issued investment grade corporate bonds and most bonds backed by mortgage pools of GNMA, FNMA and FHLMC. The index itself remains unchanged since Barclays assumed responsibility for the index from Lehman.
6 The Standard & Poor’s (S&P) 500® Composite Stock Price Index is an unmanaged index representing the performance of 500 major companies, most of which are listed on the New York Stock Exchange.
7 The MSCI Emerging Markets Index is a free float-adjusted market capitalization index that is designed to measure equity market performance of emerging markets. As of January 2009 the MSCI Emerging Markets Index consisted of the following 23 emerging market country indices: Argentina, Brazil, Chile, China, Colombia, Czech Republic, Egypt, Hungary, India, Indonesia, Israel, Korea, Malaysia, Mexico, Morocco, Peru, Philippines, Poland, Russia, South Africa, Taiwan, Thailand, and Turkey.
MSF-3
Metropolitan Series Fund, Inc.
MetLife Moderate to Aggressive Allocation Portfolio
A $10,000 INVESTMENT COMPARED TO
THE WILSHIRE 5000 STOCK INDEX AND THE BARCLAYS CAPITAL U.S. UNIVERSAL BOND INDEX
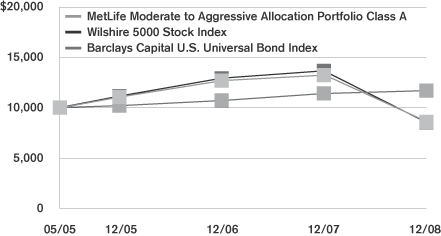
Average Annual Returns as of December 31, 2008
| | | | | | | | | | | | |
| | | MetLife Moderate to Aggressive Allocation Portfolio | | | Wilshire 5000 Stock Index | | | Barclays Capital U.S. Universal Bond Index | |
| | | Class A | | | Class B | | | |
| 1 Year | | -35.0 | % | | -35.1 | % | | -37.3 | % | | 2.4 | % |
| Since Inception | | -4.0 | | | -4.3 | | | -4.2 | | | 4.3 | |
Performance numbers are net of all Portfolio expenses but do not include any insurance, sales, or administrative charges of variable annuity or life insurance contracts or any additional expenses that participants in certain eligible qualified plans may bear relating to the operations of their plans. If these charges were included, the returns would be lower.
Inception date of the Class A and Class B shares is 5/2/05. Index since inception return is based on the Portfolio’s inception date.
This information represents past performance and is not indicative of future results. Investment return and principal value may fluctuate so that shares, upon redemption, may be worth more or less than the original cost.
PORTFOLIO COMPOSITION
as of December 31, 2008
Top Holdings
| | |
| | | % of Total
Net Assets |
Met Investors Series Trust—PIMCO Total Return Portfolio, (Class A) | | 12.1% |
Metropolitan Series Fund, Inc.—Davis Venture Value Portfolio, (Class A) | | 9.8% |
Metropolitan Series Fund, Inc.—BlackRock Large Cap Value Portfolio, (Class A) | | 7.2% |
Metropolitan Series Fund, Inc.—T. Rowe Price Large Cap Growth Portfolio, (Class A) | | 5.9% |
Met Investors Series Trust—MFS Research International Portfolio, (Class A) | | 5.4% |
Met Investors Series Trust—BlackRock Large Cap Core Portfolio, (Class A) | | 5.1% |
Metropolitan Series Fund, Inc.—MetLife Stock Index Portfolio, (Class A) | | 5.0% |
Metropolitan Series Fund, Inc.—Jennison Growth Portfolio, (Class A) | | 4.9% |
Met Investors Series Trust—Legg Mason Value Equity Portfolio, (Class A) | | 4.6% |
Metropolitan Series Fund, Inc.—Julius Baer International Stock Portfolio, (Class A) | | 4.2% |
MSF-4
Metropolitan Series Fund, Inc.
Shareholder Expense Example
As a shareholder of the Fund, you incur ongoing costs, including management fees; distribution and service (12b-1) fees; and other fund expenses. This example is intended to help you understand your ongoing costs (in dollars) (referred to as “expenses”) of investing in the Portfolio and compare these costs with the ongoing costs of investing in other mutual funds. The example is based on an investment of $1,000 invested at the beginning of the period and held for the entire period, July 1, 2008 through December 31, 2008.
Actual Expenses
The first line for each share class of the Portfolio in the table below provides information about actual account values and actual expenses. You may use the information in this line, together with the amount you invested in the particular share class of the Portfolio, to estimate the expenses that you paid over the period. Simply divide your account value by $1,000 (for example, an $8,600 account value divided by $1,000=8.6), then multiply the result by the number in the first line under the heading entitled “Expenses Paid During Period” to estimate the expenses you paid on your account during this period.
Hypothetical Example for Comparison Purposes
The second line for each share class of the Portfolio in the table below provides information about hypothetical account values and hypothetical expenses based on the Portfolio’s actual expense ratio and an assumed rate of return of 5% per year before expenses, which is not the Portfolio’s actual return. The hypothetical account values and expenses may not be used to estimate the actual ending account balance or expenses you paid for the period. You may use this information to compare the ongoing costs of investing in the Portfolio and other funds. To do so, compare this 5% hypothetical example with the 5% hypothetical examples that appear in the shareholder reports of the other funds.
Please note that the expenses shown in the table are meant to highlight your ongoing costs only and do not reflect any fees or charges of your variable insurance product or any additional expenses that participants in certain eligible qualified plans may bear relating to the operations of their plan. Therefore, the second line for each share class in the table is useful in comparing ongoing costs only, and will not help you determine the relative total costs of owning different funds. In addition, if these other costs were included, your costs would have been higher.
| | | | | | | | | | | | | | |
Portfolio | | | | Annualized
Expense
Ratio | | | Beginning
Account Value
July 1,
2008 | | Ending
Account Value
December 31,
2008 | | Expenses Paid
During Period*
July 1, 2008
to
December 31,
2008 |
MetLife Moderate to Aggressive Allocation—Class A(a)(b) | | Actual | | 0.78 | % | | $ | 1,000.00 | | $ | 720.80 | | $ | 3.37 |
| | Hypothetical | | 0.78 | % | | $ | 1,000.00 | | $ | 1,021.17 | | $ | 3.96 |
| | | | | |
MetLife Moderate to Aggressive Allocation—Class B(a)(b) | | Actual | | 1.03 | % | | $ | 1,000.00 | | $ | 720.04 | | $ | 4.45 |
| | Hypothetical | | 1.03 | % | | $ | 1,000.00 | | $ | 1,019.90 | | $ | 5.23 |
* Expenses paid are equal to the Portfolio’s annualized expense ratio for the most recent six month period, as shown above, multiplied by the average account value over the period, multiplied by the number of days in the most recent fiscal half-year, divided by 366 (to reflect the the one-half year period).
(a) The annualized expense ratio shown reflects an expense agreement between MetLife Advisers, LLC and the Portfolio as described under Expense Agreement in Note 4 to the Financial Statements.
(b) The annualized expense ratio reflects the expenses of both the Portfolio and the underlying Portfolios in which it invests.
MSF-5
Metropolitan Series Fund, Inc.
MetLife Moderate to Aggressive Allocation Portfolio
Schedule of Investments as of December 31, 2008
Mutual Funds—100.0%
| | | | | |
| Security Description | | Shares | | Value* |
| | | | | |
| |
Affiliated Investment Companies—100.0% | | | |
Met Investors Series Trust—BlackRock Large Cap Core Portfolio, (Class A) | | 14,557,433 | | $ | 97,098,078 |
Met Investors Series Trust—Clarion Global Real Estate Portfolio, (Class A) | | 5,108,397 | | | 37,802,138 |
Met Investors Series Trust—Dreman Small Cap Value Portfolio, (Class A) | | 6,064,886 | | | 59,435,886 |
Met Investors Series Trust—Harris Oakmark International Portfolio, (Class A) | | 9,158,579 | | | 78,489,018 |
Met Investors Series Trust—Lazard Mid-Cap Portfolio, (Class A) | | 8,169,972 | | | 56,617,906 |
Met Investors Series Trust—Legg Mason Value Equity Portfolio, (Class A) | | 19,157,091 | | | 87,931,047 |
Met Investors Series Trust—Lord Abbett Bond Debenture Portfolio, (Class A) | | 1,926,371 | | | 18,762,858 |
Met Investors Series Trust—Met/AIM Small Cap Growth Portfolio, (Class A) | | 6,804,452 | | | 56,885,217 |
Met Investors Series Trust—MFS Research International Portfolio, (Class A) | | 14,024,532 | | | 103,921,783 |
Met Investors Series Trust—PIMCO Total Return Portfolio, (Class A) | | 19,850,891 | | | 230,270,331 |
Metropolitan Series Fund, Inc.—BlackRock Large Cap Value Portfolio, (Class A) | | 15,746,852 | | | 136,367,734 |
Metropolitan Series Fund, Inc.—Davis Venture Value Portfolio, (Class A) | | 8,562,912 | | | 186,072,084 |
Metropolitan Series Fund, Inc.—FI Mid Cap Opportunities Portfolio, (Class A) | | 5,694,094 | | | 53,638,363 |
Metropolitan Series Fund, Inc.—Jennison Growth Portfolio, (Class A) | | 11,982,498 | | | 93,583,312 |
Metropolitan Series Fund, Inc.—Julius Baer International Stock Portfolio, (Class A) | | 10,195,661 | | | 79,526,153 |
Metropolitan Series Fund, Inc.—Met/Dimensional International Small Co. Portfolio, (Class A) | | 3,657,900 | | | 37,164,261 |
Metropolitan Series Fund, Inc.—MetLife Stock Index Portfolio, (Class A) | | 4,294,962 | | | 94,532,116 |
Metropolitan Series Fund, Inc.—MFS Value Portfolio, (Class A) | | 8,393,760 | | | 77,810,159 |
Metropolitan Series Fund, Inc.—Neuberger Berman Mid Cap Value Portfolio, (Class A) | | 5,233,768 | | | 57,571,446 |
Metropolitan Series Fund, Inc.—Russell 2000 Index Portfolio, (Class A) | | 4,360,666 | | | 38,766,322 |
Metropolitan Series Fund, Inc.—T. Rowe Price Large Cap Growth Portfolio, (Class A) | | 12,374,517 | | | 111,989,375 |
Metropolitan Series Fund, Inc.—Van Eck Global Natural Resources Portfolio, (Class A) | | 3,662,925 | | | 35,566,999 |
Metropolitan Series Fund, Inc.—Western Asset Mgt. Strategic Bond Opportunities Portfolio, (Class A) | | 7,271,308 | | | 75,112,616 |
| | | | | |
Total Mutual Funds
(Identified Cost $2,897,087,942) | | | | | 1,904,915,202 |
| | | | | |
| | | | | | |
| Security Description | | Shares | | Value* | |
| | | | | | |
| | |
Total Investments—100.0%
(Identified Cost $2,897,087,942) (a) | | | | | 1,904,915,202 | |
Liabilities in excess of other assets | | | | | (490,759 | ) |
| | | | | | |
| Total Net Assets—100% | | | | $ | 1,904,424,443 | |
| | | | | | |
| (a) | The aggregate cost of investments for federal income tax purposes as of December 31, 2008 was $2,938,491,816 and the composition of unrealized appreciation and depreciation of investment securities was $639,027 and $(1,034,215,641), respectively. |
*See accompanying notes to financial statements.
MSF-6
Metropolitan Series Fund, Inc.
MetLife Moderate to Aggressive Allocation Portfolio
The Portfolio adopted the provisions of Statement of Financial Accounting Standards No. 157, “Fair Value Measurements” (FAS 157), effective with the beginning of the Portfolio’s fiscal year. FAS 157 establishes a framework for measuring fair value and expands disclosures about fair value measurements in financial statements. The three levels of the hierarchy under FAS 157 are described below:
Level 1 - quoted prices in active markets for identical securities
Level 2 - other significant observable inputs (including quoted prices for similar securities, interest rates, credit risk, etc.)
Level 3 - significant unobservable inputs (including the Portfolio’s own assumptions in determining the fair value of investments)
The inputs or methodology used for valuing securities are not necessarily an indication of the risk associated with investing in those securities.
The following is a summary of the inputs used to value the Portfolio’s net assets as of December 31, 2008:
| | | | | | |
| Valuation Inputs | | Investments In
Securities | | Other Financial
Instruments* |
Level 1 - Quoted Prices | | $ | 1,904,915,202 | | $ | 0 |
Level 2 - Other Significant Observable Inputs | | | 0 | | | 0 |
Level 3 - Significant Unobservable Inputs | | | 0 | | | 0 |
Total | | $ | 1,904,915,202 | | $ | 0 |
* Other financial instruments are derivative instruments not reflected in the Schedule of Investments, such as futures, forwards, swap contracts and written options, which are valued based on the unrealized appreciation/depreciation on the instrument.
MSF-7
Metropolitan Series Fund, Inc.
MetLife Moderate to Aggressive Allocation Portfolio
Statement of Assets & Liabilities
December 31, 2008
| | | | | | | |
Assets | | | | | | | |
Investments at value (a) | | | | | $ | 1,904,915,202 | |
Receivable for: | | | | | | | |
Fund shares sold | | | | | | 2,069,860 | |
| | | | | | | |
Total Assets | | | | | | 1,906,985,062 | |
Liabilities | | | | | | | |
Payable for: | | | | | | | |
Securities purchased | | $ | 1,659,502 | | | | |
Fund shares redeemed | | | 410,358 | | | | |
Accrued expenses: | | | | | | | |
Management fees | | | 108,225 | | | | |
Service and distribution fees | | | 356,010 | | | | |
Other expenses | | | 26,524 | | | | |
| | | | | | | |
Total Liabilities | | | | | | 2,560,619 | |
| | | | | | | |
Net Assets | | | | | $ | 1,904,424,443 | |
| | | | | | | |
Net assets consists of: | | | | | | | |
Capital paid in | | | | | $ | 2,852,017,891 | |
Undistributed net investment income | | | | | | 55,726,368 | |
Accumulated net realized gains | | | | | | (11,147,076 | ) |
Unrealized depreciation on investments | | | | | | (992,172,740 | ) |
| | | | | | | |
Net Assets | | | | | $ | 1,904,424,443 | |
| | | | | | | |
| Computation of offering price: | | | | | | | |
Class A | | | | | | | |
Net asset value and redemption price per share ($131,604,173 divided by 16,659,766 shares outstanding) | | | | | $ | 7.90 | |
| | | | | | | |
Class B | | | | | | | |
Net asset value and redemption price per share ($1,772,820,270 divided by 225,205,211 shares outstanding) | | | | | $ | 7.87 | |
| | | | | | | |
(a) Identified cost of investments | | | | | $ | 2,897,087,942 | |
| | | | | | | |
Statement of Operations
For the Year Ended December 31, 2008
| | | | | | | | |
Investment Income | | | | | | | | |
Dividends from Underlying Portfolios | | | | | | $ | 41,578,464 | |
| | | | | | | | |
Expenses | | | | | | | | |
Management fees | | $ | 1,514,726 | | | | | |
Service and distribution fees—Class B | | | 5,319,868 | | | | | |
Directors’ fees and expenses | | | 627 | | | | | |
Custodian | | | 29,124 | | | | | |
Audit and tax services | | | 16,423 | | | | | |
Legal | | | 40,343 | | | | | |
Miscellaneous | | | 7,806 | | | | | |
| | | | | | | | |
Total expenses | | | | | | | 6,928,917 | |
| | | | | | | | |
Net Investment Income | | | | | | | 34,649,547 | |
| | | | | | | | |
Realized and Unrealized Gain (Loss) | | | | | | | | |
| Realized gain (loss) on: | | | | | | | | |
Investments—net | | | (101,757,739 | ) | | | | |
Capital gains distributions from Underlying Portfolios | | | 112,451,424 | | | | 10,693,685 | |
| | | | | | | | |
| Change in unrealized depreciation on: | | | | | | | | |
Investments—net | | | | | | | (1,003,599,617 | ) |
| | | | | | | | |
Net loss | | | | | | | (992,905,932 | ) |
| | | | | | | | |
Net Decrease in Net Assets From Operations | | | | | | $ | (958,256,385 | ) |
| | | | | | | | |
See accompanying notes to financial statements.
MSF-8
Metropolitan Series Fund, Inc.
MetLife Moderate to Aggressive Allocation Portfolio
Statements of Changes in Net Assets
| | | | | | | | |
| | | Year ended
December 31,
2008 | | | Year ended
December 31,
2007 | |
From Operations | | | | | | | | |
Net investment income | | $ | 34,649,547 | | | $ | 8,195,167 | |
Net realized gain | | | 10,693,685 | | | | 43,067,482 | |
Change in unrealized depreciation | | | (1,003,599,617 | ) | | | (28,789,722 | ) |
| | | | | | | | |
Increase (decrease) in net assets from operations | | | (958,256,385 | ) | | | 22,472,927 | |
| | | | | | | | |
From Distributions to Shareholders | | | | | | | | |
Net investment income | | | | | | | | |
Class A | | | (1,296,462 | ) | | | (253,328 | ) |
Class B | | | (12,759,068 | ) | | | (312,864 | ) |
| | | | | | | | |
| | | (14,055,530 | ) | | | (566,192 | ) |
| | | | | | | | |
Net realized gain | | | | | | | | |
Class A | | | (2,401,866 | ) | | | (144,759 | ) |
Class B | | | (35,087,438 | ) | | | (1,251,456 | ) |
| | | | | | | | |
| | | (37,489,304 | ) | | | (1,396,215 | ) |
| | | | | | | | |
Total distributions | | | (51,544,834 | ) | | | (1,962,407 | ) |
| | | | | | | | |
Increase in net assets from capital share transactions | | | 542,314,998 | | | | 1,631,789,973 | |
| | | | | | | | |
Net increase (decrease) in net assets | | | (467,486,221 | ) | | | 1,652,300,493 | |
| | |
Net Assets | | | | | | | | |
Beginning of the period | | | 2,371,910,664 | | | | 719,610,171 | |
| | | | | | | | |
End of the period | | $ | 1,904,424,443 | | | $ | 2,371,910,664 | |
| | | | | | | | |
Undistributed Net Investment Income | | | | | | | | |
End of the period | | $ | 55,726,368 | | | $ | 13,891,653 | |
| | | | | | | | |
Other Information:
Capital Shares
Transactions in capital shares were as follows:
| | | | | | | | | | | | | | |
| | | Year ended
December 31, 2008 | | | Year ended
December 31, 2007 | |
| | | Shares | | | $ | | | Shares | | | $ | |
Class A | | | | | | | | | | | | | | |
Sales | | 7,549,900 | | | $ | 77,286,058 | | | 8,175,240 | | | $ | 102,020,544 | |
Reinvestments | | 318,273 | | | | 3,698,328 | | | 31,644 | | | | 398,087 | |
Redemptions | | (3,710,386 | ) | | | (36,665,404 | ) | | (2,444,633 | ) | | | (30,451,289 | ) |
| | | | | | | | | | | | | | |
Net increase | | 4,157,787 | | | $ | 44,318,982 | | | 5,762,251 | | | $ | 71,967,342 | |
| | | | | | | | | | | | | | |
Class B | | | | | | | | | | | | | | |
Sales | | 62,262,399 | | | $ | 656,017,314 | | | 135,533,113 | | | $ | 1,684,958,265 | |
Reinvestments | | 4,124,699 | | | | 47,846,506 | | | 124,547 | | | | 1,564,320 | |
Redemptions | | (20,147,452 | ) | | | (205,867,804 | ) | | (10,185,495 | ) | | | (126,699,954 | ) |
| | | | | | | | | | | | | | |
Net increase | | 46,239,646 | | | $ | 497,996,016 | | | 125,472,165 | | | $ | 1,559,822,631 | |
| | | | | | | | | | | | | | |
Increase derived from capital share transactions | | | | | $ | 542,314,998 | | | | | | $ | 1,631,789,973 | |
| | | | | | | | | | | | | | |
See accompanying notes to financial statements.
MSF-9
Metropolitan Series Fund, Inc.
MetLife Moderate to Aggressive Allocation Portfolio
Financial Highlights
| | | | | | | | | | | | | | | | |
| | | Class A | |
| | | Year ended December 31, | |
| | | 2008 | | | 2007 | | | 2006 | | | 2005(a) | |
Net Asset Value, Beginning of Period | | $ | 12.43 | | | $ | 11.98 | | | $ | 11.05 | | | $ | 10.00 | |
| | | | | | | | | | | | | | | | |
Income From Investment Operations | | | | | | | | | | | | | | | | |
Net investment income | | | 0.17 | (b) | | | 0.12 | (b) | | | 0.17 | | | | 0.04 | |
Net realized and unrealized gain (loss) of investments | | | (4.43 | ) | | | 0.38 | | | | 1.39 | | | | 1.05 | |
| | | | | | | | | | | | | | | | |
Total from investment operations | | | (4.26 | ) | | | 0.50 | | | | 1.56 | | | | 1.09 | |
| | | | | | | | | | | | | | | | |
Less Distributions | | | | | | | | | | | | | | | | |
Distributions from net investment income | | | (0.09 | ) | | | (0.03 | ) | | | (0.18 | ) | | | (0.04 | ) |
Distributions from net realized capital gains | | | (0.18 | ) | | | (0.02 | ) | | | (0.45 | ) | | | 0.00 | |
| | | | | | | | | | | | | | | | |
Total distributions | | | (0.27 | ) | | | (0.05 | ) | | | (0.63 | ) | | | (0.04 | ) |
| | | | | | | | | | | | | | | | |
Net Asset Value, End of Period | | $ | 7.90 | | | $ | 12.43 | | | $ | 11.98 | | | $ | 11.05 | |
| | | | | | | | | | | | | | | | |
Total Return (%) | | | (35.0 | ) | | | 4.1 | | | | 14.6 | | | | 10.9 | (c) |
Ratio of operating expenses to average net assets (%) (d) | | | 0.07 | | | | 0.09 | | | | 0.10 | | | | 0.10 | (e) |
Ratio of operating expenses to average net assets without giving effect to the contractual expense agreement would have been (%) (d)(f) | | | N/A | | | | N/A | | | | 0.11 | | | | 0.34 | (e) |
Ratio of net investment income to average net assets (%) (g) | | | 1.69 | | | | 0.95 | | | | 1.07 | | | | 1.34 | (e) |
Portfolio turnover rate (%) | | | 26 | | | | 14 | | | | 23 | | | | 2 | (e) |
Net assets, end of period (000) | | $ | 131,604 | | | $ | 155,393 | | | $ | 80,728 | | | $ | 13,388 | |
| | | | | | | | | | | | | | | | |
| | | Class B | |
| | | Year ended December 31, | |
| | | 2008 | | | 2007 | | | 2006 | | | 2005(a) | |
Net Asset Value, Beginning of Period | | $ | 12.39 | | | $ | 11.94 | | | $ | 11.04 | | | $ | 10.00 | |
| | | | | | | | | | | | | | | | |
Income From Investment Operations | | | | | | | | | | | | | | | | |
Net investment income | | | 0.15 | (b) | | | 0.07 | (b) | | | 0.16 | | | | 0.04 | |
Net realized and unrealized gain (loss) of investments | | | (4.43 | ) | | | 0.40 | | | | 1.36 | | | | 1.05 | |
| | | | | | | | | | | | | | | | |
Total from investment operations | | | (4.28 | ) | | | 0.47 | | | | 1.52 | | | | 1.08 | |
| | | | | | | | | | | | | | | | |
Less Distributions | | | | | | | | | | | | | | | | |
Distributions from net investment income | | | (0.06 | ) | | | (0.00 | ) (h) | | | (0.17 | ) | | | (0.04 | ) |
Distributions from net realized capital gains | | | (0.18 | ) | | | (0.02 | ) | | | (0.45 | ) | | | 0.00 | |
| | | | | | | | | | | | | | | | |
Total distributions | | | (0.24 | ) | | | (0.02 | ) | | | (0.62 | ) | | | (0.04 | ) |
| | | | | | | | | | | | | | | | |
Net Asset Value, End of Period | | $ | 7.87 | | | $ | 12.39 | | | $ | 11.94 | | | $ | 11.04 | |
| | | | | | | | | | | | | | | | |
Total Return (%) | | | (35.1 | ) | | | 3.9 | | | | 14.2 | | | | 10.8 | (c) |
Ratio of operating expenses to average net assets (%) (d) | | | 0.32 | | | | 0.34 | | | | 0.35 | | | | 0.35 | (e) |
Ratio of operating expenses to average net assets without giving effect to the contractual expense agreement would have been (%) (d)(f) | | | N/A | | | | N/A | | | | 0.36 | | | | 0.59 | (e) |
Ratio of net investment income to average net assets (%) (g) | | | 1.51 | | | | 0.56 | | | | 0.54 | | | | 1.33 | (e) |
Portfolio turnover rate (%) | | | 26 | | | | 14 | | | | 23 | | | | 2 | (e) |
Net assets, end of period (000) | | $ | 1,772,820 | | | $ | 2,216,517 | | | $ | 638,882 | | | $ | 74,899 | |
| (a) | Commencement of operations was May 2, 2005. |
| (b) | Per share amount is based on average shares outstanding during the period. |
| (c) | Periods less than one year are not computed on an annualized basis. |
| (d) | The ratio of operating expenses to average net assets does not include expenses of investment companies in which the Portfolio invests. |
| (e) | Computed on an annualized basis. |
| (f) | See Note 4 of the Notes to Financial Statements. |
| (g) | Recognition of net investment income by the Portfolio is affected by the timing of the declaration of dividends by the Underlying Portfolios in which it invests. |
| (h) | Distributions for the period were less than $0.01. |
See accompanying notes to financial statements.
MSF-10
Metropolitan Series Fund, Inc.
MetLife Moderate to Aggressive Allocation Portfolio
Notes to Financial Statements—December 31, 2008
Metropolitan Series Fund, Inc. (the “Fund”) is organized as a corporation under the laws of Maryland pursuant to Articles of Incorporation filed on November 23, 1982, as amended, and registered under the Investment Company Act of 1940, as amended (the “1940 Act”), as an open-end investment company. The Fund is a “series” type of mutual fund, which issues separate series of stock. Each series represents an interest in a separate portfolio of Fund investments. The MetLife Moderate to Aggressive Allocation Portfolio (the “Asset Allocation Portfolio”) is a non-diversified series of the fund. The Asset Allocation Portfolio operates under a “fund of funds” structure, investing substantially all of its assets in other Portfolios advised by MetLife Advisers, LLC (“MetLife Advisers”) or its affiliates (each, an “Underlying Portfolio,” and, collectively, the “Underlying Portfolios”). Shares in the Fund are not offered directly to the general public and are currently available only to separate accounts established by Metropolitan Life Insurance Company (“MetLife”), New England Life Insurance Company, General American Life Insurance Company (“General American”), The MetLife Investors Group of Insurance Companies, MetLife Insurance Company of Connecticut and other affiliated insurance companies (collectively, the “Insurance Companies”) and to certain eligible qualified retirement plans (“Qualified Plans”), as an investment vehicle for variable life insurance, group annuity or variable annuity products of these insurance companies or Qualified Plans, although not all Portfolios are available to all such separate accounts and Qualified Plans. The Asset Allocation Portfolio’s shares may be divided into different classes. Currently, the classes being offered by the Asset Allocation Portfolio are named Class A and Class B. The classes of the Asset Allocation Portfolio’s shares are identical, except that certain additional charges (Rule 12b-1 fees) are made against Class B shares. Investment income, realized and unrealized capital gains and losses, the common expenses of the Asset Allocation Portfolio and certain Portfolio-level expense reductions, if any, are allocated daily, on a pro rata basis, to each class based on the relative net assets of each class to the total net assets of the Asset Allocation Portfolio.
| 2. | SIGNIFICANT ACCOUNTING POLICIES: |
The preparation of financial statements in conformity with accounting principles generally accepted in the United States of America (“GAAP”) requires management to make estimates and assumptions that affect the reported amounts of assets and liabilities and disclosure of contingent assets and liabilities as of the date of the financial statements and the reported amounts of income and expenses during the reporting period. Actual results could differ from those estimates.
The following is a summary of significant accounting policies consistently followed by the Asset Allocation Portfolio in the preparation of its financial statements. The policies are in conformity with GAAP.
Investment Valuation:
The net asset value of the Asset Allocation Portfolio is calculated based on the net asset values of the Underlying Portfolios in which the Asset Allocation Portfolio invests. The Underlying Portfolios that are series of the Fund will use fair value pricing in the circumstances and manner described below. For more information about the use of fair value pricing by the Underlying Portfolios that are series of Met Investors Series Trust (“MIST”), please refer to the prospectus for such Underlying Portfolios.
The Underlying Portfolios that are series of the Fund are valued as follows:
Debt securities (other than short term obligations with a remaining maturity of sixty days or less) are generally valued on the basis of evaluated or composite bid quotations obtained by independent pricing services and/or brokers and dealers selected by the relevant subadviser pursuant to authorization of the Board of Directors of the Fund (the “Board” or “Directors”). Such quotations take into account appropriate factors such as institutional-sized trading in similar groups of securities, yield, quality, coupon rate, maturity, type of issue, trading characteristics and other data. Short term obligations with a remaining maturity of sixty days or less are valued at amortized cost which approximates fair market value.
Equity securities traded on a national securities exchange or other exchanges are valued at their last sale price on the principal trading market. Equity securities traded on the NASDAQ National Market System are valued at the NASDAQ Official Closing Price (the “NOCP”). The NOCP is the last reported sale price if the last reported sale price falls between the spread of the last reported bid and asked prices. If the last reported bid and asked prices are above the last reported sale price, the NOCP will be the last reported bid price. If the last reported bid and asked prices are below the last reported sale price, the NOCP will be the last reported asked price. Equity securities traded on a national securities exchange or other exchanges or on the NASDAQ National Market System for which there is no reported sale during the day are valued at the last reported bid price. A security that is listed or traded on more than one exchange is valued at the quotation on the exchange determined to be the primary market for that
MSF-11
Metropolitan Series Fund, Inc.
MetLife Moderate to Aggressive Allocation Portfolio
Notes to Financial Statements—December 31, 2008—(Continued)
security by the Board or its delegates. If no closing price is available, then such securities are valued by using the last reported bid price. Equity securities traded over-the-counter are valued at the last reported sales price.
If no current market value quotation is readily available or reliable for a portfolio security, fair value will be determined in accordance with procedures established by and under the general supervision of the Board. When an Underlying Portfolio uses fair value pricing, it may take into account any factors it deems appropriate. The value of securities used by the Underlying Portfolio to calculate its net asset value may differ from quoted or published prices for the same securities. Fair value pricing involves subjective judgments and the fair value determined for a security may be materially different than the value that could be realized upon the sale of that security.
The Underlying Portfolios expect to use fair value pricing for securities primarily traded on U.S. exchanges only under very limited circumstances. For example, the Underlying Portfolios may use fair value pricing if the exchange on which a security is traded closes early or trading in the security is suspended.
Securities traded primarily on an exchange outside of the United States which closes before the close of the New York Stock Exchange will be valued at the last sales price on that non-U.S. exchange. Securities traded primarily on an exchange outside of the United States for which there is no reported sale during the day are valued at the mean between the last reported bid and asked prices. However, because most foreign markets close well before the Underlying Portfolio values its securities (typically at 4 p.m. Eastern Time), the earlier close of these foreign markets gives rise to the possibility that significant events, including broad market moves, may have occurred after these foreign markets close but before the Underlying Portfolio values its securities. For example, foreign security values may be affected by activity that occurs after the close of foreign securities markets. To account for this, the Underlying Portfolio may frequently value many of its foreign equity securities using fair value prices based on third party vendor modeling tools.
Forward foreign currency exchange contracts are valued based on the mean between closing bid and asked prices of the forward currency contract rates in the London foreign exchange markets on a daily basis as provided by a reliable bank or dealer.
Options, whether on securities, indices, futures contracts, or otherwise, are valued at the last sales price available as of the close of business on the day of valuation or, if there is no such sale price available, at the mean between the bid and asked prices. Options on currencies are valued at the spot price each day.
The value of futures contracts will be the sum of the margin deposit plus or minus the difference between the value of the futures contract on each day the net asset value is calculated and the value on the date the futures contract originated, value being that established on a recognized commodity exchange, or by reference to other customary sources, with gain or loss being realized when the futures contract closes or expires.
Subject to the Board’s oversight, the Board has delegated the day-to-day oversight of pricing matters, including determinations in good faith under the Fund’s procedures the fair value of securities for which current market quotations are not readily available to MetLife Advisers, LLC (“MetLife Advisers” or the “Adviser”) or the subadviser of the Underlying Portfolio, as applicable.
Investment Transactions and Related Investment Income:
Portfolio security transactions are recorded on the trade date. Dividend income is recorded on the ex-dividend date. Interest income is recorded on the accrual basis. Realized gains and losses on investments and unrealized appreciation and depreciation are determined on the identified cost basis, which is the same basis used for federal income tax purposes.
Federal Income Taxes:
It is the Portfolio’s policy to comply with the requirements of the Internal Revenue Code of 1986, as amended (the “Code”), and regulations thereunder, applicable to regulated investment companies and to distribute, with respect to each taxable year, all of its taxable income to shareholders. Therefore, no federal income tax provision is required. The Portfolio is subject to the provisions of the Financial Accounting Standards Board Interpretation (“FASB”) No. 48, Accounting for Uncertainties in Income Taxes (FIN 48). FIN 48 sets forth a minimum threshold for financial statement recognition of the benefit of a tax position taken or expected to be taken in a tax return. The implementation of FIN 48 did not result in any unrecognized tax benefits in the accompanying financial statements. Each of the Portfolio’s federal tax returns for the prior three fiscal years remains subject to examination by the Internal Revenue Service.
As of December 31, 2008, the Asset Allocation Portfolio had no capital loss carryforwards.
MSF-12
Metropolitan Series Fund, Inc.
MetLife Moderate to Aggressive Allocation Portfolio
Notes to Financial Statements—December 31, 2008—(Continued)
Pursuant to Section 852 of the Code, the Portfolio designated the amount shown below under Long Term Gain as capital gain dividends for its taxable year ended December 31, 2008. The tax character of distributions paid for the periods ended December 31, 2008 and 2007 was as follows:
| | | | | | | | | | | | | | | | | | | | | |
| Ordinary Income | | Long Term Gain | | Return of Capital | | Total |
| 2008 | | 2007 | | 2008 | | 2007 | | 2008 | | 2007 | | 2008 | | 2007 |
| $21,084,774 | | $ | 1,962,407 | | $ | 30,460,060 | | $ | — | | $ | — | | $ | — | | $ | 51,544,834 | | $ | 1,962,407 |
As of December 31, 2008, the components of distributable earnings (accumulated losses) on a federal income tax basis were as follows:
| | | | | | | | | | | | | | |
Undistributed
Ordinary
Income | | Undistributed
Long Term
Gain | | Unrealized
Depreciation | | | Loss
Carryforwards | | Total | |
$55,726,368 | | $ | 30,256,798 | | $ | (1,033,576,614 | ) | | $ | — | | $ | (947,593,448 | ) |
Dividends and Distributions to Shareholders:
The Asset Allocation Portfolio records dividends and distributions on the ex-dividend date. Net realized gains from security transactions (if any) are generally distributed annually to shareholders. The timing and characterization of certain income and capital gains distributions are determined in accordance with federal tax regulations that may differ from GAAP. Permanent book and tax basis differences relating to shareholder distributions will result in reclassification between under/over distributed net investment income, accumulated net realized gains/losses and paid in capital.
| 3. | INVESTMENT TRANSACTIONS: |
For the year ended December 31, 2008, purchases and sales of Underlying Portfolios by the Asset Allocation Portfolio were $1,245,485,578 and $607,835,256, respectively.
| 4. | INVESTMENT MANAGEMENT FEES AND OTHER TRANSACTIONS WITH AFFILIATES: |
Investment Management Agreement:
MetLife Advisers is the investment adviser to the Asset Allocation Portfolio. The Fund has entered into an investment management agreement with MetLife Advisers with respect to the Portfolio. For providing investment management services to the Portfolio, MetLife Advisers receives monthly compensation at the following annual rates:
| | | | |
Management
Fees earned by
MetLife Advisers
for the year ended
December 31, 2008 | | Annual
percentage
rates paid to
MetLife Advisers | | Based on Portfolios
average daily net asset
levels |
| $1,514,726 | | 0.100% | | Of the first $500 million |
| | 0.075% | | Of the next $500 million |
| | 0.050% | | On amounts in excess of $1 billion |
In addition to the above Management Fee paid to MetLife Advisers, the Asset Allocation Portfolio indirectly pays MetLife Advisers an investment advisory fee through its investments in certain Underlying Portfolios.
Certain officers and directors of the Fund may also be officers of MetLife Advisers; however, such officers and directors receive no compensation from the Fund.
Service and Distribution Fees:
The Fund has adopted a Distribution and Service Plan under Rule 12b-1 of the 1940 Act for the Asset Allocation Portfolio’s Class B shares. Under the Distribution and Service Plan, the Class B shares of the Asset Allocation Portfolio pay a fee to compensate the Insurance Companies (or their affiliates) and other broker-dealers and financial intermediaries involved in the offer and sale of Portfolio shares for promoting or selling and servicing the Class B shares of the Asset Allocation Portfolio. The fees under the Distribution and Service Plan for each class of the Asset Allocation Portfolio’s shares are calculated as percentage of the Asset Allocation Portfolio’s average daily net assets that are attributable to that Class. Currently, the fee is 0.25% per year for Class B shares. Amounts paid by the Asset Allocation Portfolio for the year ended December 31, 2008 are shown as Service and Distribution fees in the Statement of Operations.
MSF-13
Metropolitan Series Fund, Inc.
MetLife Moderate to Aggressive Allocation Portfolio
Notes to Financial Statements—December 31, 2008—(Continued)
Expense Agreement:
Pursuant to an expense agreement relating to each class of the Asset Allocation Portfolio, MetLife Advisers has agreed, from May 1, 2008 to April 30, 2009, to waive a portion of its advisory fees or pay a portion of the other operating expenses (not including brokerage costs, interest, taxes, or extraordinary expenses) to the extent total operating expenses exceed stated annual expense limits (based on the Asset Allocation Portfolio’s then current fiscal year). For the Asset Allocation Portfolio, this subsidy, and similar subsidies in effect in earlier periods, are subject to the obligation of each class of the Asset Allocation Portfolio to repay MetLife Advisers in future years, if any, when a class’s expenses fall below the stated expense limit pertaining to that class that was in effect at the time of the subsidy in question. Such deferred expenses may be charged to a class in a subsequent year to the extent that the charge does not cause the total expenses in such subsequent year to exceed the class’ stated expense limit that was in effect at the time of the subsidy in question; provided, however, that no class of the Asset Allocation Portfolio is obligated to repay any expense paid by MetLife Advisers more than five years after the end of the fiscal year in which such expense was incurred.
The expense limits (annual rates as a percentage of each class of the Asset Allocation Portfolio’s net average daily net assets) in effect from May 1, 2008 to April 30, 2009 are 0.10% and 0.35% for Class A and B, respectively.
| 5. | TRANSACTIONS IN SECURITIES OF AFFILIATED ISSUERS: |
The Asset Allocation Portfolio does not invest in the Underlying Portfolios for the purpose of exercising management or control; however, investments by the Asset Allocation Portfolio within its principal investment strategies may represent a significant portion of the Underlying Portfolio’s net assets. Transactions in the Underlying Portfolios during the year ended December 31, 2008 are as follows:
| | | | | | | | |
Underlying Portfolio (Class A) | | Beginning Shares
as of 12/31/2007 | | Shares Purchased
during Period | | Shares Sold
during Period | | Ending Shares
as of 12/31/2008 |
MIST—BlackRock Large Cap Core | | 8,731,788 | | 6,080,393 | | 254,748 | | 14,557,433 |
MIST—Clarion Global Real Estate | | 3,226,467 | | 2,156,810 | | 274,880 | | 5,108,397 |
MIST—Dreman Small Cap Value | | 6,807,033 | | 1,863,973 | | 2,606,120 | | 6,064,886 |
MIST—Harris Oakmark International | | 9,526,664 | | 5,229,572 | | 5,597,657 | | 9,158,579 |
MIST—Lazard Mid-Cap | | 9,408,702 | | 3,490,227 | | 4,728,957 | | 8,169,972 |
MIST—Legg Mason Value Equity | | 13,315,850 | | 7,531,225 | | 1,689,984 | | 19,157,091 |
MIST—Lord Abbett Bond Debenture | | 1,863,824 | | 560,756 | | 498,209 | | 1,926,371 |
MIST—Met/AIM Small Cap Growth | | 4,744,382 | | 2,412,758 | | 352,688 | | 6,804,452 |
MIST—MFS Research International | | 0 | | 14,269,001 | | 244,469 | | 14,024,532 |
MIST—PIMCO Total Return | | 25,217,908 | | 7,084,890 | | 12,451,907 | | 19,850,891 |
MSF—BlackRock Large Cap Value | | 10,656,161 | | 5,397,177 | | 306,486 | | 15,746,852 |
MSF—Davis Venture Value | | 6,545,574 | | 2,254,104 | | 236,766 | | 8,562,912 |
MSF—FI Mid Cap Opportunities | | 3,300,219 | | 2,659,032 | | 265,157 | | 5,694,094 |
MSF—Jennison Growth | | 7,141,902 | | 5,239,563 | | 398,967 | | 11,982,498 |
MSF—Julius Baer International Stock | | 10,245,374 | | 5,525,487 | | 5,575,200 | | 10,195,661 |
MSF—Met/Dimensional International Small Company | | 0 | | 3,660,512 | | 2,612 | | 3,657,900 |
MSF—MetLife Stock Index | | 2,586,957 | | 1,781,795 | | 73,790 | | 4,294,962 |
MSF—MFS Value | | 0 | | 8,696,654 | | 302,894 | | 8,393,760 |
MSF—Neuberger Berman Mid Cap Value | | 8,041,241 | | 2,680,730 | | 5,488,203 | | 5,233,768 |
MSF—Russell 2000 Index | | 3,308,763 | | 1,431,214 | | 379,311 | | 4,360,666 |
MSF—T. Rowe Price Large Cap Growth | | 10,232,141 | | 4,524,099 | | 2,381,723 | | 12,374,517 |
MSF—Van Eck Global Natural Resources | | 0 | | 3,665,616 | | 2,691 | | 3,662,925 |
MSF—Western Asset Mgmt. Strategic Bond Opportunities | | 9,244,507 | | 2,394,573 | | 4,367,772 | | 7,271,308 |
MSF-14
Metropolitan Series Fund, Inc.
MetLife Moderate to Aggressive Allocation Portfolio
Notes to Financial Statements—December 31, 2008—(Continued)
| | | | | | | | | | | | | |
Underlying Portfolio (Class A) | | Realized Gain/(Loss)
during Period | | | Capital Gains
Distributions
during Period | | Dividend Income
during Period | | Ending Value
as of 12/31/2008 |
MIST—BlackRock Large Cap Core | | $ | (847,785 | ) | | $ | 4,119,618 | | $ | 630,653 | | $ | 97,098,078 |
MIST—Clarion Global Real Estate | | | (803,480 | ) | | | 4,354,081 | | | 898,739 | | | 37,802,138 |
MIST—Dreman Small Cap Value | | | 15,782 | | | | 2,814,917 | | | 749,359 | | | 59,435,886 |
MIST—Harris Oakmark International | | | (35,052,371 | ) | | | 25,661,224 | | | 2,997,254 | | | 78,489,018 |
MIST—Lazard Mid-Cap | | | (13,066,180 | ) | | | 8,472,022 | | | 1,390,618 | | | 56,617,906 |
MIST—Legg Mason Value Equity | | | (3,477,056 | ) | | | 5,234,871 | | | 384,047 | | | 87,931,047 |
MIST—Lord Abbett Bond Debenture | | | (797,659 | ) | | | 361,899 | | | 1,043,414 | | | 18,762,858 |
MIST—Met/AIM Small Cap Growth | | | (1,070,659 | ) | | | 6,148,739 | | | 0 | | | 56,885,217 |
MIST—MFS Research International | | | (958,441 | ) | | | 0 | | | 0 | | | 103,921,783 |
MIST—PIMCO Total Return | | | (2,618,244 | ) | | | 7,639,447 | | | 12,556,820 | | | 230,270,331 |
MSF—BlackRock Large Cap Value | | | (1,244,098 | ) | | | 2,269,518 | | | 1,170,220 | | | 136,367,734 |
MSF—Davis Venture Value | | | (158,483 | ) | | | 1,251,715 | | | 3,006,992 | | | 186,072,084 |
MSF—FI Mid Cap Opportunities | | | (687,672 | ) | | | 0 | | | 274,077 | | | 53,638,363 |
MSF—Jennison Growth | | | (877,201 | ) | | | 7,854,753 | | | 2,277,797 | | | 93,583,312 |
MSF—Julius Baer International Stock | | | (29,060,667 | ) | | | 18,678,547 | | | 4,847,958 | | | 79,526,153 |
MSF—Met/Dimensional International Small Company | | | (858 | ) | | | 0 | | | 0 | | | 37,164,261 |
MSF—MetLife Stock Index | | | (602,687 | ) | | | 3,755,739 | | | 1,751,142 | | | 94,532,116 |
MSF—MFS Value | | | (1,046,866 | ) | | | 0 | | | 0 | | | 77,810,159 |
MSF—Neuberger Berman Mid Cap Value | | | (4,620,576 | ) | | | 1,879,333 | | | 1,308,507 | | | 57,571,446 |
MSF—Russell 2000 Index | | | (1,115,778 | ) | | | 2,293,280 | | | 584,561 | | | 38,766,322 |
MSF—T. Rowe Price Large Cap Growth | | | 1,124,491 | | | | 8,958,021 | | | 936,786 | | | 111,989,375 |
MSF—Van Eck Global Natural Resources | | | (1,657 | ) | | | 0 | | | 0 | | | 35,566,999 |
MSF—Western Asset Mgmt. Strategic Bond Opportunities | | | (4,789,555 | ) | | | 703,700 | | | 4,769,520 | | | 75,112,616 |
MSF-15
Metropolitan Series Fund, Inc.
MetLife Moderate to Aggressive Allocation Portfolio
Report of Independent Registered Public Accounting Firm
To the Shareholders and Board of Directors of Metropolitan Series Fund, Inc.:
We have audited the accompanying statement of assets and liabilities, including the schedule of investments, of the MetLife Moderate to Aggressive Allocation Portfolio (one of the portfolios constituting the Metropolitan Series Fund, Inc.) (the “Fund”) as of December 31, 2008, and the related statement of operations for the year then ended, the statements of changes in net assets for each of the two years in the period then ended, and the financial highlights for each of the three years in the period then ended and the period from May 2, 2005 (commencement of operations) through December 31, 2005. These financial statements and financial highlights are the responsibility of the Fund’s management. Our responsibility is to express an opinion on these financial statements and financial highlights based on our audits.
We conducted our audits in accordance with the standards of the Public Company Accounting Oversight Board (United States). Those standards require that we plan and perform the audit to obtain reasonable assurance about whether the financial statements and financial highlights are free of material misstatement. The Fund is not required to have, nor were we engaged to perform, an audit of its internal control over financial reporting. Our audits included consideration of internal control over financial reporting as a basis for designing audit procedures that are appropriate in the circumstances, but not for the purpose of expressing an opinion on the effectiveness of the Fund’s internal control over financial reporting. Accordingly, we express no such opinion. An audit also includes examining, on a test basis, evidence supporting the amounts and disclosures in the financial statements, assessing the accounting principles used and significant estimates made by management, as well as evaluating the overall financial statement presentation. Our procedures included confirmation of securities owned as of December 31, 2008, by correspondence with the transfer agent. We believe that our audits provide a reasonable basis for our opinion.
In our opinion, the financial statements and financial highlights referred to above present fairly, in all material respects, the financial position of the MetLife Moderate to Aggressive Allocation Portfolio of the Metropolitan Series Fund, Inc. as of December 31, 2008, the results of its operations for the year then ended, the changes in its net assets for each of the two years in the period then ended, and the financial highlights for each of the three years in the period then ended and the period from May 2, 2005 (commencement of operations) through December 31, 2005, in conformity with accounting principles generally accepted in the United States of America.
Deloitte & Touche LLP
Boston, Massachusetts
February 26, 2009
MSF-16
Metropolitan Series Fund, Inc.
Directors and Officers
The Fund’s Directors review actions of the Fund’s investment adviser and subadvisers, and decide upon matters of general policy. The Fund’s officers supervise the daily business operations of the Fund. The Board of Directors and the Fund’s officers are listed below. Each Director is responsible for overseeing all 38 Portfolios of the Fund. There is no limit to the term a Director may serve. Directors serve until their resignation, retirement or removal in accordance with the Fund’s organizational documents and policies adopted by the Board from time to time. Officers hold office at the pleasure of the Board or until the election or appointment and the qualification of a successor. The address of the Directors and officers is c/o Metropolitan Series Fund, Inc., 501 Boylston Street, Boston, MA 02116.
Interested Directors(1)
Each Director below is an “interested person” (as defined by the 1940 Act) with respect to the Fund in that Ms. Forget is an employee of MetLife and Mr. Typermass is a former employee of MetLife and owns securities issued by MetLife, Inc., the ultimate parent company of MetLife Advisers.
| | | | | | | | |
Name, Address and Age | | Current
position(s)
with Fund | | Position(s)
held since | | Principal occupations
over past five years, including other directorships(2) | | Number of
Portfolios in
Fund Complex
Overseen by
Director(3) |
Elizabeth M. Forget Age: 42 | | Director, Chairman of the Board, President and Chief Executive Officer | | 2006 | | Senior Vice President (since 2007), MetLife, Inc.; President, Met Investors Advisory, LLC; Trustee and President, Met Investors Series Trust; Executive Vice President, MetLife Investors Group, Inc.; President, Chief Executive Officer and Chair of the Board of Managers (since 2006), MetLife Advisers; President, Met Investors Advisory, LLC. | | 87 |
| | | | |
Arthur G. Typermass Age: 71 | | Director | | 1998 | | Formerly, Senior Vice President and Treasurer, MetLife. | | 38 |
Non-Interested Directors(1)
Each Director below is not an “interested person” (as defined by the 1940 Act) with respect to the Fund (collectively, the “Independent Directors”).
| | | | | | | | |
Name, Address and Age | | Current
position(s)
with Fund | | Position(s)
held since | | Principal occupations
over past five years, including other directorships(2) | | Number of
Portfolios in
Fund Complex
Overseen by
Director(3) |
Steve A. Garban† Age: 71 | | Director | | 1985 | | Formerly, Chief Financial Officer, Senior Vice President Finance and Operations and Treasurer (Emeritus), The Pennsylvania State University. | | 38 |
| | | | |
Linda B. Strumpf Age: 61 | | Director | | 2000 | | Vice President and Chief Investment Officer, Ford Foundation. | | 38 |
| | | | |
Michael S. Scott Morton† Age: 71 | | Director | | 1993 | | Jay W. Forrester Professor of Management (Emeritus) at Sloan School of Management, MIT. | | 38 |
| | | | |
H. Jesse Arnelle Age: 75 | | Director | | 2001 | | Formerly, Counsel, Womble Carlyle Sandrie & Rice; Director, Textron Inc. (global multi- industry company)*; formerly, Director, Gannet Co. Inc. (diversified news and information company)*; formerly, Director, Eastman Chemical Company (global chemical company)*; formerly, Director, Waste Management, Inc.*; formerly, Director, Armstrong Holdings Inc. (parent company of floor and ceiling products business)*; formerly, Director, FPL Group Inc. (public utility holding company)*; Director, URS Corporation (engineering design services firm)*. | | 38 |
MSF-17
Metropolitan Series Fund, Inc.
Directors and Officers—(Continued)
| | | | | | | | |
Name, Address and Age | | Current
position(s)
with Fund | | Position(s)
held since | | Principal occupations
over past five years, including other directorships(2) | | Number of
Portfolios in
Fund Complex
Overseen by
Director(3) |
Nancy Hawthorne Age: 57 | | Director | | 2003 | | Chief Executive Officer, Clerestory LLC (corporate financial advisor); Director, Avid Technologies (computer software company)*; formerly, Chairman of the Board of Avid Technologies; formerly, Board of Advisors, L. Knife & Sons, Inc. (beverage distributor); formerly, Trustee, New England Zenith Fund (“Zenith Fund”)**; formerly, Chief Executive Officer and Managing Partner, Hawthorne, Krauss and Associates (corporate financial advisor); formerly, Chief Financial Officer and Executive Vice President, Continental Cablevision, subsequently renamed MediaOne (cable television company); formerly, Director, Life F/X, Inc.; formerly, Chairman of the Board, WorldClinic (distance medicine company); formerly, Director, Perini Corporation (construction company)*; formerly, Director, CGU (property and casualty insurance company); formerly, Director, Beacon Power Corporation (energy company)*. | | 38 |
| | | | |
John T. Ludes Age: 72 | | Director | | 2003 | | President, LFP Properties (consulting firm); Formerly, Trustee, Zenith Fund**; formerly, Vice Chairman, President and Chief Operating Officer, Fortune Brands/American Brands (global conglomerate); formerly, President and CEO, Acushnet Company (athletic equipment company). | | 38 |
Officers(1)
| | | | | | | | |
Name and address | | Age | | Current
position(s)
with Fund | | Position(s)
held since | | Principal occupations over past five years(2) |
| Jeffrey L. Bernier | | 37 | | Senior Vice President | | 2008 | | Vice President (since 2008), MetLife, Inc.; Vice President (since 2008), MetLife; Senior Vice President (since 2008), MetLife Advisers; formerly, Director and Senior Investment Analyst (2004 to 2007), John Hancock Financial Services; formerly, Assistant Vice President (2000 to 2001), Wachovia Securities. |
| | | | |
| Alan C. Leland | | 56 | | Senior Vice President | | 2005 | | Treasurer and Chief Financial Officer, MetLife Advisers, LLC; Treasurer (since 2005), Met Investors Advisory, LLC; Vice President (since 2004), Met Investors Advisory, LLC; Vice President (since 2003), MetLife, Inc.; Vice President, MetLife; Senior Vice President, NELICO. |
| | | | |
| Peter Duffy | | 53 | | Vice President
and Treasurer | | 2000 | | Senior Vice President, MetLife Advisers; Second Vice President (since 2003), NELICO; Vice President, MetLife (since 2004); Vice President (since 2004), MetLife, Inc.; formerly, Vice President and Treasurer, Zenith Fund**. |
| | | | |
| Jeffrey P. Halperin | | 41 | | Chief
Compliance Officer | | 2007 | | Vice President (since 2006), MetLife, Inc.; Vice President (since 2006), MetLife; Chief Compliance Officer (since 2006), Met Investors Series Trust, MetLife Advisers, Met Investors Advisory, LLC and MetLife Investment Advisors Company, LLC. |
| * | Indicates a directorship with a registered investment company or a company subject to the reporting requirements of the Securities Exchange Act of 1934, as amended. |
| ** | The Zenith Fund deregistered with the Securities and Exchange Commission (“SEC”) in 2004. |
| (†) | Served as a trustee, director and/or officer of one or more of the following companies, each of which had a direct or indirect advisory relationship with MetLife Advisers or its affiliates prior to January 31, 2005: State Street Research Financial Trust, State Street Research Income Trust, State Street Research Money Market Trust, State Street Research Institutional Funds, State Street Research Capital Trust, State Street Research Master Investment Trust, State Street Research Equity Trust, State Street Research Securities Trust and State Street Research Exchange Trust (collectively, the “State Street Research Funds”). |
| (1) | During the period shown, each Director of the Fund served as a Trustee of Metropolitan Series Fund II, a registered investment company that ceased investment operations in June of 2008 and has applied for deregistration under the Investment Company Act of 1940. During this period, each officer of the Fund served in the same position with Metropolitan Series Fund II. |
| (2) | Previous positions during the past five years with the Fund; Met Investors Series Trust; MetLife; MetLife, Inc.; MetLife Advisers; Met Investors Advisory, LLC; Zenith Fund; NELICO; or New England Securities Corporation are omitted if not materially different. |
| (3) | The Fund Complex includes the Fund (38 portfolios) and Met Investors Series Trust (49 portfolios). |
MSF-18
Metropolitan Series Fund, Inc.
MetLife Moderate to Aggressive Allocation Portfolio
Board Approval of Advisory and Subadvisory Agreements
The Fund’s Contract Review Committees of the Board of Directors (the “Board” or the “Directors”) typically meet in early fall to review the Portfolios’ advisory agreements (the “Advisory Agreements”) and subadvisory agreements (the “Subadvisory Agreements,” and, together with the Advisory Agreements, the “Agreements”) and determine whether to recommend that the full Board approve the continuation of the Agreements for an additional one-year period. (Following the initial approval of an Agreement for a new Portfolio or with a new adviser or subadviser, such annual reviews are not required until 2 years following the execution of such Agreement.) After each Committee has made its recommendations, the full Board, including the Independent Directors, determines whether to approve the continuation of each of the Agreements. In addition, the Board, including the Independent Directors, considers matters bearing on the Agreements at most of its other meetings throughout the year and regularly interviews various individuals at MetLife Advisers responsible for the management of the Portfolios. The Directors also interview selected investment managers and other professionals at the subadvisers at various times throughout the year.
The Directors receive all materials that they or MetLife Advisers, the Fund’s investment adviser, and the subadvisers believe to be reasonably necessary for the Directors to evaluate the Agreements and determine whether to approve the continuation of the Agreements. These materials generally include, among other items, (i) information on the investment performance of the Portfolios and the performance of peer groups of funds and the Portfolios’ performance benchmarks, (ii) information on the Portfolios’ advisory and subadvisory fees and other expenses, including information comparing the Portfolios’ expenses to those of peer groups of funds and information about any applicable expense caps and fee “breakpoints,” (iii) sales and redemption data, (iv) information related to the profitability of the Agreements to MetLife Advisers and certain of the subadvisers, and potential “fall-out” or ancillary benefits that MetLife Advisers, the subadvisers or their affiliates may receive as a result of their relationships with the Fund and (v) information obtained through the subadvisers’ responses to certain requests from MetLife Advisers and the Directors and MetLife Advisers’ responses to requests from the Directors. The Directors may also consider other information such as (vi) MetLife Advisers’ and the subadvisers’ financial results and condition, (vii) each Portfolio’s investment objectives and strategies and the size, education and experience of the investment staffs of MetLife Advisers and the relevant subadvisers and their use of technology and external research, (viii) the allocation of the Portfolios’ brokerage, if any, including allocations to brokers affiliated with the subadvisers and the use of “soft” commission dollars to pay Portfolio expenses and to pay for research and other similar services, (ix) the resources devoted to, and the record of compliance with, the Portfolios’ investment policies and restrictions, policies on personal securities transactions and other compliance policies, (x) the responses of MetLife Advisers, the subadvisers and/or their affiliates to certain legal and regulatory proceedings and (xi) the economic outlook generally and for the mutual fund industry in particular. Throughout the process, the Directors have the opportunity to ask questions of and request additional materials from MetLife Advisers and the subadvisers.
Following meetings of each Contract Review Committee on September 10, 2008, the Board, including the Independent Directors, at its November 6-7, 2008 meeting, approved the continuation through December 31, 2009 of the Advisory Agreements for each Portfolio of the Fund and the Subadvisory Agreements for each Portfolio other than the Zenith Equity Portfolio and Asset Allocation Portfolios (which do not have subadvisers) and the Van Eck Global Natural Resources Portfolio, Met/Dimensional International Small Cap Portfolio and Loomis Sayles Small Cap Growth Portfolio (formerly known as the Franklin Templeton Small Cap Growth Portfolio). The Agreements approved for continuation are referred to below as the “Continued Agreements.”
In considering whether to approve the continuation of the Continued Agreements, the Directors, including the Independent Directors, did not identify any single factor as determinative, and each weighed the various factors as he or she deemed appropriate. The Directors considered the following matters in connection with their approval of the Continued Agreements:
The nature, extent and quality of the services provided to the relevant Portfolios under the Continued Agreements. The Directors considered the nature, extent and quality of the services provided by MetLife Advisers, the relevant subadvisers (if any) and their affiliates (each, an “Adviser,” and, collectively, the “Advisers”) to the relevant Portfolios pursuant to the Continued Agreements and the resources dedicated to these Portfolios by the Advisers. In particular, the Directors considered the Advisers’ abilities to attract and retain highly qualified investment professionals. With respect to MetLife Advisers, the Directors considered (for each Portfolio other than the Zenith Equity and Asset Allocation Portfolios) that MetLife Advisers is (i) ultimately responsible for the performance of such Portfolios; (ii) ultimately responsible for the establishment of the investment strategies of each such Portfolio, primarily through its recommendations to the Board regarding the hiring and selection of subadvisers; (iii) responsible for the hiring and selection, subject to Board approval, of subadvisers; and (iv) responsible for maintaining a program of Subadviser oversight reasonably designed to ensure that the subadvisers have reasonable compliance policies and procedures in place. The Directors also considered that MetLife Advisers provides a full range of day-to-day administrative services for the Portfolios involving all aspects of such Portfolios’ day-to-day operations (other than portfolio management). With respect to the Zenith Equity and Asset Allocation Portfolios, the Directors considered both the portfolio management services and the administrative services provided by MetLife Advisers. After reviewing
MSF-19
Metropolitan Series Fund, Inc.
MetLife Moderate to Aggressive Allocation Portfolio
Board Approval of Advisory and Subadvisory Agreements—(Continued)
these and related factors, the Directors concluded, within the context of their overall conclusions regarding each of the Continued Agreements, that the nature, extent and quality of services provided supported the renewal of these Agreements.
Investment performance of the relevant Portfolios. The Directors reviewed information about the performance of the relevant Portfolios over various time periods, including information prepared by an independent third party that compared the performance of the Portfolios to the performance of peer groups of funds and performance benchmarks. The Directors also reviewed a description of the third party’s methodology for identifying a Portfolio’s peer group(s) for purposes of performance and expense comparisons.
In the case of each relevant Portfolio that had performance that lagged its peer group(s) for certain periods, the Directors concluded that other factors relevant to performance were sufficient, in light of other considerations, to warrant renewal of the Continued Agreements relating to such Portfolio. These factors varied from Portfolio to Portfolio, but included one or more of the following: (i) that such Portfolio’s performance, although lagging in certain recent periods, was stronger over the longer term; (ii) that the underperformance was attributable, to a significant extent, to investment decisions that were reasonable and consistent with the Portfolio’s investment objective(s) and policies and that the Portfolio was performing within the range of reasonable expectations, given market conditions and the Portfolio’s investment objective(s) and policies; (iii) that the Portfolio’s performance was competitive when compared to other relevant performance benchmarks or peer groups; and (iv) that MetLife Advisers and/or the relevant subadviser (if any) had taken or was taking steps designed to help improve the Portfolio’s investment performance (including, in the case of certain Portfolios, that MetLife Advisers was formulating possible proposals, for presentation to the Board in November 2008, to replace the Portfolio’s subadviser or to merge the Portfolio into another Portfolio with a similar investment objective and better investment performance).
The Directors also considered the investment performance of the Advisers and their reputations generally, the historical responsiveness of the Advisers to Director concerns about performance and the willingness of the Advisers to take steps intended to improve performance.
After reviewing these and related factors, the Directors concluded, within the context of their overall conclusions regarding each of the Continued Agreements, that the investment performance of each relevant Portfolio and Adviser was sufficient, in light of other considerations, to warrant the renewal of the Continued Agreements.
The costs of the services to be provided and profits to be realized by the Advisers and their affiliates from their relationships with the Portfolios. The Directors considered the fees charged by MetLife Advisers to the Portfolios for advisory services and, with respect to the subadvised Portfolios, by such subadvisers to MetLife Advisers for subadvisory services (such advisory and subadvisory fees (if any), collectively, “Fees”), as well as the total expense levels of the Portfolios. This information included comparisons (provided by an independent third party) of the Portfolios’ advisory fees and total expense levels to those of their peer groups. In evaluating Fees for the relevant Portfolios, the Directors also took into account the demands, complexity and quality of the investment management services provided to each Portfolio. The Directors considered MetLife Advisers’ recommendations regarding reductions in Fee rates, implementation of Fee breakpoints and institution of Fee waivers and expense caps.
The Directors also considered the compensation directly or indirectly received by the Advisers and their affiliates from their relationships with the relevant Portfolios. The Directors reviewed information relating to the profits received by MetLife Advisers, certain of the subadvisers and their affiliates as a result of their relationships with the relevant Portfolios, and information about the allocation of expenses used to calculate profitability. When reviewing profitability, the Directors also considered the performance of the relevant Portfolios, the expense levels of such Portfolios and whether the relevant Advisers had implemented breakpoints, fee waivers and/or expense caps with respect to such Portfolios.
After reviewing these and related factors, the Directors concluded, within the context of their overall conclusions regarding each of the Continued Agreements, that the Fees charged to each of the relevant Portfolios were fair and reasonable, and that the information provided regarding costs of these services generally, and the related profitability (if known) to the relevant Advisers of their relationships with the relevant Portfolios, supported the renewal of the Continued Agreements.
Economies of Scale. The Directors considered the existence of any economies of scale in the provision of services by the Advisers and whether those economies were shared with the relevant Portfolios through breakpoints in their advisory fees or other means, such as expense caps, fee waivers or relatively low levels of fees. The Directors noted that most of the relevant Portfolios benefited or will benefit from breakpoints, expense caps and/or fee waivers with respect to their advisory fees. In considering these issues, the Directors also took into consideration information relating to the costs of the services provided and the profitability to MetLife Advisers, the relevant subadvisers (if any) and each of their affiliates of their relationships with the relevant Portfolios, as discussed above.
MSF-20
Metropolitan Series Fund, Inc.
MetLife Moderate to Aggressive Allocation Portfolio
Board Approval of Advisory and Subadvisory Agreements—(Continued)
After reviewing these and related factors, the Directors concluded, within the context of their overall conclusions regarding each of the Continued Agreements, that the extent to which economies of scale were shared with the relevant Portfolios supported the renewal of such Agreements.
Other Factors. The Directors also considered other factors, which included but were not limited to the following:
| | • | | the extent to which each relevant Portfolio operated in accordance with its investment objective, and its record of compliance with its investment restrictions and the compliance programs of the Fund and the Advisers. They also considered the compliance-related resources the Advisers and their affiliates provide to the relevant Portfolios; |
| | • | | the nature, quality, cost and extent of administrative and shareholder services performed by MetLife Advisers and its affiliates under the Advisory Agreements; and |
| | • | | so-called “fall-out benefits” to the Advisers, such as the engagement of their affiliates to provide distribution, brokerage and transfer agency services to the Portfolios, and the benefits of research made available to the relevant Advisers by reason of brokerage commissions generated by the relevant Portfolios’ securities transactions. The Directors also considered the possible conflicts of interest associated with these fall-out and other benefits, and the reporting and other processes in place to disclose and monitor these possible conflicts of interest. |
Based on their evaluation of all factors that they deemed to be material, including those factors described above, and assisted by the advice of independent counsel, the Directors, including the Independent Directors, concluded that each of the Continued Agreements should be continued through December 31, 2009.
MSF-21
A description of the policies and procedures that the Fund uses to determine how to vote proxies relating to portfolio securities is available (i) without charge, upon request, by calling (800) 638-7732 and (ii) on the Securities and Exchange Commission’s (the “SEC”) website at http://www.sec.gov.
Information regarding how the Fund voted proxies relating to portfolio securities during the most recent twelve-month period ended December 31, 2008 is available (i) without charge, upon request, by calling (800) 638-7732 and (ii) on the SEC’s website at http://www.sec.gov.
The Fund’s Statement of Additional Information includes additional information about the Directors of the Fund and is available (i) without charge, upon request, by calling (800) 638-7732 and (ii) on the SEC’s website at http://www.sec.gov.
The Fund files with the SEC a complete schedule of its portfolio holdings, as of the close of the first and third quarters of its fiscal year, on “Form N-Q”. These filings are available on the SEC’s website at www.sec.gov and may be reviewed and copied at the SEC’s Public Reference Room in Washington, DC. (Call 1-800-SEC-0330 for information on the operation of the Public Reference Room.)
MSF-22
Simplify your life…
with MetLife eDelivery® while helping MetLife preserve the planet’s natural resources.
(see details on inside cover)
| | |
Metropolitan Series Fund, Inc. MetLife Stock Index Portfolio Annual Report | | December 31, 2008 |
NOT PART OF THE ANNUAL REPORT
Letter from the President
February 1, 2009
Letter to Policy Holders:
2008 was an extraordinary year in the capital markets around the world and for the global economy. Energy prices rose to record levels early in the year before falling by two-thirds by year-end. A credit crisis that began with concerns about sub-prime mortgages led to massive changes in the financial landscape with government takeovers, forced sales, and outright failures of a number of large, once venerable firms.
While bonds as measured by the Barclays Capital U.S. Aggregate Bond Index (formerly known as, Lehman Brothers U.S. Aggregate Bond Index) were up 5.2% for the year in response to declining interest rates, there were large differences in the total returns of the various sectors of the bond market. U.S. treasury securities were up over 13% as frightened investors sought refuge in what they perceived to be the safest and most liquid investments. In contrast, investment grade corporate securities lost nearly 5% as credit spreads widened and below investment grade or high yield bonds fell over 26%.
In response to the growing credit crisis and the weakening economy, common stocks fell sharply across all regions, styles, and capitalizations. As measured by the Standard and Poor’s 500, U.S. common stocks fell 37% for the year, the worst calendar year decline since the 1930s. Foreign stocks were down even more with the MSCI EAFE Index down 43% for the year.
On the following pages, you will find a complete review of your Portfolio and its investment performance.
MetLife is committed to building your financial freedom. We appreciate your trust and will continue to focus our efforts on meeting your investment needs.
Sincerely,
Elizabeth M. Forget
President, Metropolitan Series Fund, Inc.
Metropolitan Series Fund, Inc.
MetLife Stock Index Portfolio
Managed by MetLife Investment Advisors Company, LLC
Portfolio Manager Commentary*
PORTFOLIO PERFORMANCE
For the twelve-month period ended December 31, 2008, the Class A shares of the MetLife Stock Index Portfolio returned -37.1%, compared to its benchmark, the Standard & Poor’s 500 Index1, which returned -37.0%. The average return of its peer group, the Lipper Variable Insurance Products S&P 500 Index Funds Universe2, was -37.2% over the same period.
PORTFOLIO REVIEW
The S&P 500 Index had its first negative annual return in six years. During the first half of 2008, the S&P 500 Index returned -11.9%, primarily due to continued weakness in the economy, deteriorating financial market conditions and further credit tightening. The subprime mortgage crisis continued to weaken the housing market, and the ensuing liquidity crisis resulted in one of the worst financial crises in recent history. A few of the consequences included the collapse of Bear Stearns, the bankruptcy of Lehman Brothers, the sale of Merrill Lynch to Bank of America, and the government’s provision of credit assistance to Fannie Mae and Freddie Mac. Other major financial institutions that required rescues included AIG, Washington Mutual and Wachovia.
During the second half of 2008, the S&P 500 Index returned -28.5%, primarily due to concerns that the financial crisis continued to exacerbate. In an effort to support the functioning of the financial markets, a $700 billion financial-rescue plan, also known as the Troubled Asset Relief Program (TARP), was initiated which included bailout loans and the purchasing of large quantities of agency debt and mortgage-backed securities by the Treasury Department. In addition, during the year, the Federal Open Market
Committee (FOMC) lowered the Fed Funds Rate seven times from 4.25% to a target range of zero to 0.25%.
During the year, the price of oil rose from approximately $96 to a high of $145 per barrel in July, before plummeting to $45 per barrel by the end of the year, down approximately 54% from prior year-end. Oil prices fell from its highs due to decreased global oil demand and reduced investment speculation on oil futures by large financial institutions and hedge funds. Some of the factors driving the equity markets included geopolitical concerns, energy prices, Federal Reserve interest rate policy, corporate earnings, and unemployment rates.
All ten sectors comprising the S&P 500 Index experienced negative returns for the year. Consumer Staples, the best relative performing sector, which had a beginning-of-year weight of 10.2%, was down 15.6%. The next best relative performing sectors were Health Care (12.0% beginning weight), down 22.8%; and Utilities (3.6% beginning weight), down 29.0%. The Financials sector (17.6% beginning weight) was the worst-performing sector, down 55.3%, providing the largest negative impact to the benchmark’s one-year return. The next worst-performing sectors were Materials (3.3% beginning weight), down 45.7%; Information Technology (16.8% beginning weight), down 43.1%; and Industrials (11.5% beginning weight), down 39.9%.
The stocks with the largest positive impact on the benchmark return for the year were Anheuser-Busch Companies, up 34.3%; Amgen, up 24.4%; and Wal-Mart Stores, up 20.0%. The stocks with the largest negative impact were American International Group, down 97.3%; General Electric, down 54.0%; and Microsoft, down 44.4%. There were 37 additions and 37 deletions to the benchmark in 2008.
* The views expressed above are those of the subadvisory firm as of December 31, 2008 and are subject to change based on market and other conditions. Information about the Portfolio’s holdings, asset allocation, industry allocation, or country diversification is historical and is not an indication of future Portfolio composition, which will vary. The performance of any index mentioned in this commentary has not been adjusted for ongoing management, distribution and operating expenses, and sales charges applicable to mutual fund investments. Direct investment in any index is not possible.
1 The Standard & Poor’s (S&P) 500® Composite Stock Price Index is an unmanaged index representing the performance of 500 major companies, most of which are listed on the New York Stock Exchange.
2 The Lipper Variable Products Fund Average is an average of the total return performance (calculated on the basis of net asset value) of variable product funds with similar investment objectives to those of the subject Portfolio as calculated by Lipper Analytical Services, an independent mutual fund ranking service.
MSF-2
Metropolitan Series Fund, Inc.
MetLife Stock Index Portfolio
A $10,000 INVESTMENT COMPARED TO THE S&P 500 INDEX
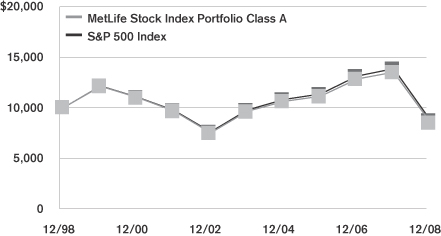
Average Annual Returns as of December 31, 2008
| | | | | | | | | | | | |
| | | MetLife Stock Index Portfolio | | | S&P 500
Index | |
| | | Class A | | | Class B | | | Class E | | |
| 1 Year | | -37.1 | % | | -37.3 | % | | -37.2 | % | | -37.0 | % |
| 5 Year | | -2.4 | | | -2.7 | | | -2.6 | | | -2.2 | |
| 10 Year | | -1.6 | | | — | | | — | | | -1.4 | |
| Since Inception | | 7.3 | | | -3.1 | | | -2.9 | | | — | |
Performance numbers are net of all Portfolio expenses but do not include any insurance, sales, or administrative charges of variable annuity or life insurance contracts or any additional expenses that participants in certain eligible qualified plans may bear relating to the operations of their plans. If these charges were included, the returns would be lower.
Inception dates of the Class A, Class B and Class E shares are: 5/1/90, 1/2/01 and 5/1/01, respectively.
This information represents past performance and is not indicative of future results. Investment return and principal value may fluctuate so that shares, upon redemption, may be worth more or less than the original cost.
PORTFOLIO COMPOSITION
as of December 31, 2008
Top Holdings
| | |
| | | % of Total
Net Assets |
Exxon Mobil Corp. | | 5.1% |
Procter & Gamble Co. | | 2.3% |
General Electric Co. | | 2.1% |
AT&T, Inc. | | 2.1% |
Johnson & Johnson | | 2.1% |
Chevron Corp. | | 1.9% |
Microsoft Corp. | | 1.8% |
Wal-Mart Stores, Inc. | | 1.6% |
Pfizer, Inc. | | 1.5% |
JPMorgan Chase & Co. | | 1.5% |
Top Sectors
| | | |
| | | % of Equity
Market Value | |
Information Technology | | 15.3 | % |
Health Care | | 14.8 | % |
Energy | | 13.3 | % |
Financials | | 13.3 | % |
Consumer Staples | | 12.9 | % |
Industrials | | 11.1 | % |
Consumer Discretionary | | 8.4 | % |
Utilities | | 4.2 | % |
Telecommunication Services | | 3.8 | % |
Materials | | 3.0 | % |
MSF-3
Metropolitan Series Fund, Inc.
Shareholder Expense Example
As a shareholder of the Portfolio, you incur ongoing costs, including management fees; distribution and service (12b-1) fees; and other Portfolio expenses. This example is intended to help you understand your ongoing costs (in dollars) (referred to as “expenses”) of investing in the Portfolio and compare these costs with the ongoing costs of investing in other mutual funds. The example is based on an investment of $1,000 invested at the beginning of the period and held for the entire period, July 1, 2008 through December 31, 2008.
Actual Expenses
The first line for each share class of the Portfolio in the table below provides information about actual account values and actual expenses. You may use the information in this line, together with the amount you invested in the particular share class of the Portfolio, to estimate the expenses that you paid over the period. Simply divide your account value by $1,000 (for example, an $8,600 account value divided by $1,000=8.6), then multiply the result by the number in the first line under the heading entitled “Expenses Paid During Period” to estimate the expenses you paid on your account during this period.
Hypothetical Example for Comparison Purposes
The second line for each share class of the Portfolio in the table below provides information about hypothetical account values and hypothetical expenses based on the Portfolio’s actual expense ratio and an assumed rate of return of 5% per year before expenses, which is not the Portfolio’s actual return. The hypothetical account values and expenses may not be used to estimate the actual ending account balance or expenses you paid for the period. You may use this information to compare the ongoing costs of investing in the Portfolio and other funds. To do so, compare this 5% hypothetical example with the 5% hypothetical examples that appear in the shareholder reports of the other funds.
Please note that the expenses shown in the table are meant to highlight your ongoing costs only and do not reflect any fees or charges of your variable insurance product or any additional expenses that participants in certain eligible qualified plans may bear relating to the operations of their plan. Therefore, the second line for each share class in the table is useful in comparing ongoing costs only, and will not help you determine the relative total costs of owning different funds. In addition, if these other costs were included, your costs would have been higher.
| | | | | | | | | | | | | | |
Portfolio | | | | Annualized
Expense
Ratio | | | Beginning
Account Value
July 1,
2008 | | Ending
Account Value
December 31,
2008 | | Expenses Paid
During Period*
July 1, 2008
to
December 31,
2008 |
MetLife Stock Index—Class A(a) | | Actual | | 0.27 | % | | $ | 1,000.00 | | $ | 714.84 | | $ | 1.16 |
| | Hypothetical | | 0.27 | % | | $ | 1,000.00 | | $ | 1,023.77 | | $ | 1.37 |
| | | | | |
MetLife Stock Index—Class B(a) | | Actual | | 0.52 | % | | $ | 1,000.00 | | $ | 714.10 | | $ | 2.24 |
| | Hypothetical | | 0.52 | % | | $ | 1,000.00 | | $ | 1,022.49 | | $ | 2.64 |
| | | | | |
MetLife Stock Index—Class E(a) | | Actual | | 0.42 | % | | $ | 1,000.00 | | $ | 714.52 | | $ | 1.81 |
| | Hypothetical | | 0.42 | % | | $ | 1,000.00 | | $ | 1,023.00 | | $ | 2.14 |
* Expenses paid are equal to the Portfolio’s annualized expense ratio for the most recent six month period, as shown above, multiplied by the average account value over the period, multiplied by the number of days in the most recent fiscal half-year, divided by 366 (to reflect the the one-half year period).
(a) The annualized expense ratio shown reflects the impact of the management fee waiver as described in Note 4 to the Financial Statements.
MSF-4
Metropolitan Series Fund, Inc.
MetLife Stock Index Portfolio
Schedule of Investments as of December 31, 2008
Common Stock—98.4% of Total Net Assets
| | | | | |
| Security Description | | Shares | | Value* |
| | | | | |
| | |
Aerospace & Defense—2.8% | | | | | |
Boeing Co. | | 333,043 | | $ | 14,210,945 |
General Dynamics Corp. | | 177,170 | | | 10,203,220 |
Goodrich Corp. | | 55,943 | | | 2,071,010 |
Honeywell International, Inc. | | 330,068 | | | 10,836,133 |
L-3 Communications Holdings, Inc. | | 54,262 | | | 4,003,450 |
Lockheed Martin Corp. | | 151,306 | | | 12,721,809 |
Northrop Grumman Corp. | | 148,582 | | | 6,692,133 |
Precision Castparts Corp. | | 63,361 | | | 3,768,712 |
Raytheon Co. | | 188,177 | | | 9,604,554 |
Rockwell Collins, Inc. | | 71,945 | | | 2,812,330 |
United Technologies Corp. | | 432,016 | | | 23,156,058 |
| | | | | |
| | | | | 100,080,354 |
| | | | | |
| | |
Air Freight & Logistics—1.1% | | | | | |
C. H. Robinson Worldwide, Inc. (a) | | 76,896 | | | 4,231,587 |
Expeditors International of Washington, Inc. (a) | | 96,369 | | | 3,206,197 |
FedEx Corp. | | 141,447 | | | 9,073,825 |
United Parcel Service, Inc. (Class B) (a) | | 452,271 | | | 24,947,268 |
| | | | | |
| | | | | 41,458,877 |
| | | | | |
| | |
Airlines—0.1% | | | | | |
Southwest Airlines Co. | | 336,174 | | | 2,897,820 |
| | | | | |
| | |
Auto Components—0.2% | | | | | |
Johnson Controls, Inc. | | 270,030 | | | 4,903,745 |
The Goodyear Tire & Rubber Co. (b) | | 109,655 | | | 654,640 |
| | | | | |
| | | | | 5,558,385 |
| | | | | |
| | |
Automobiles—0.1% | | | | | |
Ford Motor Co. (a) (b) | | 1,085,637 | | | 2,486,108 |
General Motors Corp. (a) (b) | | 277,430 | | | 887,776 |
Harley-Davidson, Inc. (a) | | 105,808 | | | 1,795,562 |
| | | | | |
| | | | | 5,169,446 |
| | | | | |
| | |
Beverages—2.5% | | | | | |
Brown-Forman Corp. (Class B) | | 44,572 | | | 2,295,013 |
Coca-Cola Enterprises, Inc. | | 144,134 | | | 1,733,932 |
Constellation Brands, Inc. (b) | | 88,464 | | | 1,395,077 |
Dr. Pepper Snapple Group, Inc. (b) | | 115,289 | | | 1,873,446 |
Molson Coors Brewing Co. | | 67,640 | | | 3,308,949 |
Pepsi Bottling Group, Inc. | | 61,414 | | | 1,382,429 |
PepsiCo, Inc. | | 705,830 | | | 38,658,309 |
The Coca-Cola Co. | | 904,218 | | | 40,933,949 |
| | | | | |
| | | | | 91,581,104 |
| | | | | |
| | |
Biotechnology—2.1% | | | | | |
Amgen, Inc. (b) (d) | | 481,509 | | | 27,807,145 |
Biogen Idec, Inc. (b) | | 132,590 | | | 6,315,261 |
Celgene Corp. (b) | | 208,228 | | | 11,510,844 |
Cephalon, Inc. (a) (b) | | 31,106 | | | 2,396,406 |
Genzyme Corp. (b) | | 122,940 | | | 8,159,528 |
Gilead Sciences, Inc. (b) | | 418,064 | | | 21,379,793 |
| | | | | |
| | | | | 77,568,977 |
| | | | | |
| | | | | |
| Security Description | | Shares | | Value* |
| | | | | |
| | |
Building Products—0.1% | | | | | |
Masco Corp. | | 163,559 | | $ | 1,820,412 |
| | | | | |
| | |
Capital Markets—2.3% | | | | | |
American Capital, Ltd. (a) | | 93,961 | | | 304,434 |
Ameriprise Financial, Inc. | | 98,434 | | | 2,299,418 |
E*TRADE Financial Corp. (a) (b) | | 255,746 | | | 294,108 |
Federated Investors, Inc. (Class B) | | 40,254 | | | 682,708 |
Franklin Resources, Inc. | | 68,741 | | | 4,384,301 |
Invesco, Ltd. | | 174,952 | | | 2,526,307 |
Janus Capital Group, Inc. | | 71,738 | | | 576,056 |
Legg Mason, Inc. | | 64,499 | | | 1,413,173 |
Merrill Lynch & Co., Inc. | | 727,665 | | | 8,470,021 |
Morgan Stanley | | 482,627 | | | 7,741,337 |
Northern Trust Corp. | | 101,360 | | | 5,284,910 |
State Street Corp. | | 196,305 | | | 7,720,676 |
T. Rowe Price Group, Inc. | | 117,430 | | | 4,161,719 |
The Bank of New York Mellon Corp. | | 521,522 | | | 14,774,718 |
The Charles Schwab Corp. | | 425,242 | | | 6,876,163 |
The Goldman Sachs Group, Inc. | | 200,958 | | | 16,958,846 |
| | | | | |
| | | | | 84,468,895 |
| | | | | |
| | |
Chemicals—1.7% | | | | | |
Air Products & Chemicals, Inc. | | 95,240 | | | 4,787,715 |
CF Industries Holdings, Inc. | | 25,841 | | | 1,270,344 |
E. I. du Pont de Nemours & Co. | | 410,086 | | | 10,375,176 |
Eastman Chemical Co. | | 32,968 | | | 1,045,415 |
Ecolab, Inc. | | 76,192 | | | 2,678,149 |
International Flavors & Fragrances, Inc. | | 35,741 | | | 1,062,222 |
Monsanto Co. | | 249,015 | | | 17,518,205 |
PPG Industries, Inc. | | 74,627 | | | 3,166,424 |
Praxair, Inc. | | 140,154 | | | 8,319,541 |
Rohm & Haas Co. | | 56,775 | | | 3,508,127 |
Sigma-Aldrich Corp. (a) | | 56,970 | | | 2,406,413 |
The Dow Chemical Co. | | 419,820 | | | 6,335,084 |
| | | | | |
| | | | | 62,472,815 |
| | | | | |
|
Commercial & Professional Services—0.5% |
Avery Dennison Corp. | | 48,303 | | | 1,580,957 |
Cintas Corp. | | 59,714 | | | 1,387,156 |
Pitney Bowes, Inc. | | 93,676 | | | 2,386,865 |
R.R. Donnelley & Sons Co. | | 93,164 | | | 1,265,167 |
Republic Services, Inc. | | 145,901 | | | 3,616,886 |
Stericycle, Inc. (b) | | 38,888 | | | 2,025,287 |
Waste Management, Inc. | | 222,944 | | | 7,388,364 |
| | | | | |
| | | | | 19,650,682 |
| | | | | |
| | |
Commercial Banks—3.1% | | | | | |
BB&T Corp. (a) | | 251,082 | | | 6,894,712 |
Comerica, Inc. (a) | | 68,389 | | | 1,357,522 |
Fifth Third Bancorp | | 262,444 | | | 2,167,788 |
First Horizon National Corp. (a) (b) | | 93,297 | | | 986,154 |
Huntington Bancshares, Inc. (a) | | 166,354 | | | 1,274,272 |
KeyCorp. | | 224,960 | | | 1,916,659 |
M&T Bank Corp. | | 35,084 | | | 2,014,172 |
Marshall & Ilsley Corp. (a) | | 118,294 | | | 1,613,530 |
*See accompanying notes to financial statements.
MSF-5
Metropolitan Series Fund, Inc.
MetLife Stock Index Portfolio
Schedule of Investments as of December 31, 2008
Common Stock—(Continued)
| | | | | |
| Security Description | | Shares | | Value* |
| | | | | |
|
Commercial Banks—(Continued) |
National City Corp. | | 925,309 | | $ | 1,674,809 |
PNC Financial Services Group, Inc. | | 158,216 | | | 7,752,584 |
Regions Financial Corp. | | 314,465 | | | 2,503,141 |
SunTrust Banks, Inc. | | 160,928 | | | 4,753,813 |
U.S. Bancorp | | 797,384 | | | 19,942,574 |
Wachovia Corp. | | 982,106 | | | 5,440,867 |
Wells Fargo & Co. | | 1,722,272 | | | 50,772,579 |
Zions Bancorp (a) | | 52,419 | | | 1,284,790 |
| | | | | |
| | | | | 112,349,966 |
| | | | | |
| | |
Communications Equipment—2.5% | | | | | |
Ciena Corp. (a) (b) | | 41,044 | | | 274,995 |
Cisco Systems, Inc. (b) (d) | | 2,660,897 | | | 43,372,621 |
Corning, Inc. | | 706,377 | | | 6,731,773 |
Harris Corp. | | 61,167 | | | 2,327,404 |
JDS Uniphase Corp. (b) | | 99,910 | | | 364,671 |
Juniper Networks, Inc. (a) (b) | | 239,932 | | | 4,201,209 |
Motorola, Inc. | | 1,029,960 | | | 4,562,723 |
QUALCOMM, Inc. | | 752,344 | | | 26,956,486 |
Tellabs, Inc. (a) (b) | | 180,885 | | | 745,246 |
| | | | | |
| | | | | 89,537,128 |
| | | | | |
| | |
Computers & Peripherals—4.2% | | | | | |
Apple, Inc. (b) | | 403,985 | | | 34,480,120 |
Dell, Inc. (b) | | 786,461 | | | 8,053,360 |
EMC Corp. (b) | | 927,439 | | | 9,710,286 |
Hewlett-Packard Co. | | 1,113,017 | | | 40,391,387 |
International Business Machines Corp. | | 610,547 | | | 51,383,635 |
Lexmark International, Inc. (Class A) (a) (b) | | 35,629 | | | 958,420 |
NetApp, Inc. (a) (b) | | 150,045 | | | 2,096,129 |
QLogic Corp. (b) | | 58,138 | | | 781,375 |
SanDisk Corp. (a) (b) | | 102,725 | | | 986,160 |
Sun Microsystems, Inc. (b) | | 335,656 | | | 1,282,206 |
Teradata Corp. (b) | | 79,984 | | | 1,186,163 |
| | | | | |
| | | | | 151,309,241 |
| | | | | |
| | |
Construction & Engineering—0.2% | | | | | |
Fluor Corp. | | 82,487 | | | 3,701,191 |
Jacobs Engineering Group, Inc. (b) | | 55,838 | | | 2,685,808 |
| | | | | |
| | | | | 6,386,999 |
| | | | | |
| | |
Construction Materials—0.1% | | | | | |
Vulcan Materials Co. (a) | | 50,057 | | | 3,482,966 |
| | | | | |
| | |
Consumer Finance—0.5% | | | | | |
American Express Co. | | 527,123 | | | 9,778,131 |
Capital One Financial Corp. (a) | | 177,992 | | | 5,676,165 |
Discover Financial Services | | 218,102 | | | 2,078,512 |
SLM Corp. (b) | | 212,361 | | | 1,890,013 |
| | | | | |
| | | | | 19,422,821 |
| | | | | |
| | |
Containers & Packaging—0.2% | | | | | |
Ball Corp. | | 42,987 | | | 1,787,829 |
Bemis Co., Inc. | | 45,297 | | | 1,072,633 |
Owens-Illinois, Inc. (b) | | 75,897 | | | 2,074,265 |
Pactiv Corp. (b) | | 59,712 | | | 1,485,635 |
| | | | | |
| Security Description | | Shares | | Value* |
| | | | | |
|
Containers & Packaging—(Continued) |
Sealed Air Corp. | | 71,747 | | $ | 1,071,900 |
| | | | | |
| | | | | 7,492,262 |
| | | | | |
| | |
Distributors—0.1% | | | | | |
Genuine Parts Co. | | 72,457 | | | 2,743,222 |
| | | | | |
| | |
Diversified Consumer Services—0.2% | | | | | |
Apollo Group, Inc. (Class A) (b) | | 48,419 | | | 3,709,864 |
H&R Block, Inc. | | 154,036 | | | 3,499,698 |
| | | | | |
| | | | | 7,209,562 |
| | | | | |
| | |
Diversified Financial Services—3.3% | | | | | |
Bank of America Corp. | | 2,280,283 | | | 32,106,385 |
CIT Group, Inc. (a) | | 163,850 | | | 743,879 |
Citigroup, Inc. | | 2,476,592 | | | 16,617,932 |
CME Group, Inc. | | 30,442 | | | 6,335,285 |
IntercontinentalExchange, Inc. (b) | | 32,832 | | | 2,706,670 |
JPMorgan Chase & Co. | | 1,696,204 | | | 53,481,312 |
Leucadia National Corp. | | 80,436 | | | 1,592,633 |
Moody’s Corp. | | 88,273 | | | 1,773,404 |
NYSE Euronext | | 120,431 | | | 3,297,401 |
The NASDAQ OMX Group, Inc. (b) | | 61,867 | | | 1,528,733 |
| | | | | |
| | | | | 120,183,634 |
| | | | | |
| |
Diversified Telecommunication Services—3.6% | | | |
AT&T, Inc. | | 2,678,127 | | | 76,326,619 |
CenturyTel, Inc. (a) | | 45,508 | | | 1,243,734 |
Embarq Corp. | | 64,594 | | | 2,322,800 |
Frontier Communications Corp. | | 141,480 | | | 1,236,535 |
Qwest Communications International, Inc. (a) | | 665,758 | | | 2,423,359 |
Verizon Communications, Inc. | | 1,290,884 | | | 43,760,968 |
Windstream Corp. | | 199,699 | | | 1,837,231 |
| | | | | |
| | | | | 129,151,246 |
| | | | | |
| |
Electric Utilities—2.4% | | | |
Allegheny Energy, Inc. | | 76,828 | | | 2,601,396 |
American Electric Power Co., Inc. | | 183,399 | | | 6,103,519 |
Duke Energy Corp. | | 575,021 | | | 8,631,065 |
Edison International | | 148,068 | | | 4,755,944 |
Entergy Corp. | | 86,043 | | | 7,152,755 |
Exelon Corp. | | 298,999 | | | 16,627,334 |
FirstEnergy Corp. | | 138,535 | | | 6,730,030 |
FPL Group, Inc. | | 185,750 | | | 9,348,798 |
Pepco Holdings, Inc. | | 98,258 | | | 1,745,062 |
Pinnacle West Capital Corp. | | 45,816 | | | 1,472,068 |
PPL Corp. | | 170,422 | | | 5,230,251 |
Progress Energy, Inc. | | 119,562 | | | 4,764,546 |
Southern Co. | | 352,015 | | | 13,024,555 |
| | | | | |
| | | | | 88,187,323 |
| | | | | |
| |
Electrical Equipment—0.5% | | | |
Cooper Industries, Ltd. (Class A) | | 78,764 | | | 2,302,272 |
Emerson Electric Co. | | 348,599 | | | 12,762,209 |
Rockwell Automation, Inc. | | 64,306 | | | 2,073,226 |
| | | | | |
| | | | | 17,137,707 |
| | | | | |
*See accompanying notes to financial statements.
MSF-6
Metropolitan Series Fund, Inc.
MetLife Stock Index Portfolio
Schedule of Investments as of December 31, 2008
Common Stock—(Continued)
| | | | | |
| Security Description | | Shares | | Value* |
| | | | | |
|
Electronic Equipment, Instruments & Components—0.3% |
Agilent Technologies, Inc. (b) | | 159,060 | | $ | 2,486,108 |
Amphenol Corp. (Class A) | | 79,884 | | | 1,915,618 |
FLIR Systems, Inc. (b) | | 63,134 | | | 1,936,951 |
Jabil Circuit, Inc. | | 95,731 | | | 646,184 |
Molex, Inc. | | 64,012 | | | 927,534 |
Tyco Electronics, Ltd. | | 207,972 | | | 3,371,226 |
| | | | | |
| | | | | 11,283,621 |
| | | | | |
| |
Energy Equipment & Services—1.5% | | | |
Baker Hughes, Inc. | | 139,760 | | | 4,482,103 |
BJ Services Co. | | 132,670 | | | 1,548,259 |
Cameron International Corp. (b) | | 99,761 | | | 2,045,101 |
ENSCO International, Inc. | | 64,452 | | | 1,829,792 |
Halliburton Co. | | 406,175 | | | 7,384,261 |
Nabors Industries, Ltd. (a) (b) | | 129,327 | | | 1,548,044 |
National Oilwell Varco, Inc. (b) | | 189,656 | | | 4,635,193 |
Noble Corp. | | 119,948 | | | 2,649,651 |
Rowan Cos., Inc. | | 51,355 | | | 816,545 |
Schlumberger, Ltd. | | 543,609 | | | 23,010,969 |
Smith International, Inc. | | 99,461 | | | 2,276,662 |
Weatherford International, Ltd. (b) | | 309,532 | | | 3,349,136 |
| | | | | |
| | | | | 55,575,716 |
| | | | | |
| |
Food & Staples Retailing—3.2% | | | |
Costco Wholesale Corp. (a) | | 196,179 | | | 10,299,398 |
CVS Caremark Corp. | | 652,707 | | | 18,758,799 |
Safeway, Inc. | | 194,826 | | | 4,631,014 |
SUPERVALU, Inc. | | 96,232 | | | 1,404,987 |
SYSCO Corp. | | 272,284 | | | 6,246,195 |
The Kroger Co. | | 296,524 | | | 7,831,199 |
Wal-Mart Stores, Inc. | | 1,016,104 | | | 56,962,790 |
Walgreen Co. | | 449,861 | | | 11,098,071 |
Whole Foods Market, Inc. (b) | | 63,768 | | | 601,970 |
| | | | | |
| | | | | 117,834,423 |
| | | | | |
| |
Food Products—1.8% | | | |
Archer-Daniels-Midland Co. | | 291,523 | | | 8,404,608 |
Campbell Soup Co. (a) | | 93,501 | | | 2,805,965 |
ConAgra Foods, Inc. | | 203,180 | | | 3,352,470 |
Dean Foods Co. (a) (b) | | 69,963 | | | 1,257,235 |
General Mills, Inc. | | 151,852 | | | 9,225,009 |
H.J. Heinz Co. | | 142,900 | | | 5,373,040 |
Kellogg Co. | | 114,488 | | | 5,020,299 |
Kraft Foods, Inc. (Class A) (a) | | 667,658 | | | 17,926,617 |
McCormick & Co., Inc. | | 59,077 | | | 1,882,193 |
Sara Lee Corp. | | 321,264 | | | 3,145,175 |
The Hershey Co. (a) | | 75,374 | | | 2,618,493 |
The J. M. Smucker Co. | | 53,823 | | | 2,333,765 |
Tyson Foods, Inc. (Class A) (a) | | 137,293 | | | 1,202,687 |
| | | | | |
| | | | | 64,547,556 |
| | | | | |
| | |
Gas Utilities—0.1% | | | | | |
Equitable Resources, Inc. | | 59,468 | | | 1,995,152 |
Nicor, Inc. | | 20,537 | | | 713,455 |
Questar Corp. | | 78,819 | | | 2,576,593 |
| | | | | |
| | | | | 5,285,200 |
| | | | | |
| | | | | |
| Security Description | | Shares | | Value* |
| | | | | |
|
Health Care Equipment & Supplies—2.1% |
Baxter International, Inc. | | 281,842 | | $ | 15,103,913 |
Becton, Dickinson & Co. | | 110,486 | | | 7,556,137 |
Boston Scientific Corp. (b) | | 682,381 | | | 5,281,629 |
C.R. Bard, Inc. | | 45,083 | | | 3,798,694 |
Covidien, Ltd. | | 228,855 | | | 8,293,705 |
Dentsply International, Inc. | | 67,692 | | | 1,911,622 |
Hospira, Inc. (b) | | 72,530 | | | 1,945,255 |
Intuitive Surgical, Inc. (b) | | 17,776 | | | 2,257,374 |
Medtronic, Inc. | | 508,187 | | | 15,967,235 |
St. Jude Medical, Inc. (b) | | 156,417 | | | 5,155,504 |
Stryker Corp. (a) | | 110,089 | | | 4,398,056 |
Varian Medical Systems, Inc. (b) | | 56,466 | | | 1,978,569 |
Zimmer Holdings, Inc. (b) | | 102,058 | | | 4,125,184 |
| | | | | |
| | | | | 77,772,877 |
| | | | | |
| | |
Health Care Providers & Services—2.1% | | | | | |
Aetna, Inc. | | 209,551 | | | 5,972,203 |
AmerisourceBergen Corp. | | 70,995 | | | 2,531,682 |
Cardinal Health, Inc. | | 163,429 | | | 5,633,398 |
Cigna Corp. | | 124,911 | | | 2,104,750 |
Coventry Health Care, Inc. (b) | | 67,703 | | | 1,007,421 |
DaVita, Inc. (b) | | 47,173 | | | 2,338,366 |
Express Scripts, Inc. (b) | | 112,460 | | | 6,183,051 |
Humana, Inc. (b) | | 76,672 | | | 2,858,332 |
Laboratory Corp. of America Holdings (a) (b) | | 49,082 | | | 3,161,372 |
McKesson Corp. | | 125,390 | | | 4,856,355 |
Medco Health Solutions, Inc. (b) | | 226,330 | | | 9,485,490 |
Patterson Cos., Inc. (b) | | 41,437 | | | 776,944 |
Quest Diagnostics, Inc. | | 72,006 | | | 3,737,831 |
Tenet Healthcare Corp. (a) (b) | | 188,663 | | | 216,962 |
UnitedHealth Group, Inc. | | 548,900 | | | 14,600,740 |
WellPoint, Inc. (b) | | 231,338 | | | 9,746,270 |
| | | | | |
| | | | | 75,211,167 |
| | | | | |
| | |
Health Care Technology—0.0% | | | | | |
IMS Health, Inc. | | 82,653 | | | 1,253,019 |
| | | | | |
| | |
Hotels, Restaurants & Leisure—1.5% | | | | | |
Carnival Corp. (b) | | 198,601 | | | 4,829,976 |
Darden Restaurants, Inc. | | 63,044 | | | 1,776,580 |
International Game Technology (a) | | 133,929 | | | 1,592,416 |
Marriott International, Inc. | | 133,268 | | | 2,592,063 |
McDonald’s Corp. | | 506,515 | | | 31,500,168 |
Starbucks Corp. (b) | | 334,254 | | | 3,162,043 |
Starwood Hotels & Resorts Worldwide, Inc. | | 83,177 | | | 1,488,868 |
Wyndham Worldwide Corp. (a) | | 80,586 | | | 527,838 |
Wynn Resorts, Ltd. (a) (b) | | 27,998 | | | 1,183,195 |
Yum! Brands, Inc. | | 210,214 | | | 6,621,741 |
| | | | | |
| | | | | 55,274,888 |
| | | | | |
| | |
Household Durables—0.4% | | | | | |
Black & Decker Corp. (a) | | 27,310 | | | 1,141,831 |
Centex Corp. (b) | | 56,495 | | | 601,107 |
D.R. Horton, Inc. (a) | | 125,200 | | | 885,164 |
Fortune Brands, Inc. | | 68,127 | | | 2,812,283 |
Harman International Industries, Inc. | | 26,606 | | | 445,118 |
*See accompanying notes to financial statements.
MSF-7
Metropolitan Series Fund, Inc.
MetLife Stock Index Portfolio
Schedule of Investments as of December 31, 2008
Common Stock—(Continued)
| | | | | |
| Security Description | | Shares | | Value* |
| | | | | |
|
Household Durables—(Continued) |
KB Home (a) | | 34,213 | | $ | 465,981 |
Leggett & Platt, Inc. (a) | | 70,986 | | | 1,078,277 |
Lennar Corp. (Class A) (a) | | 64,211 | | | 556,709 |
Newell Rubbermaid, Inc. | | 125,976 | | | 1,232,045 |
Pulte Homes, Inc. (a) | | 97,122 | | | 1,061,544 |
Snap-on, Inc. | | 26,104 | | | 1,027,976 |
The Stanley Works | | 35,809 | | | 1,221,087 |
Whirlpool Corp. (a) | | 33,404 | | | 1,381,255 |
| | | | | |
| | | | | 13,910,377 |
| | | | | |
| | |
Household Products—3.1% | | | | | |
Clorox Co. | | 63,040 | | | 3,502,502 |
Colgate-Palmolive Co. | | 229,372 | | | 15,721,157 |
Kimberly-Clark Corp. | | 188,037 | | | 9,917,071 |
Procter & Gamble Co. | | 1,356,881 | | | 83,882,384 |
| | | | | |
| | | | | 113,023,114 |
| | | | | |
|
Independent Power Producers & Energy Traders—0.1% |
Constellation Energy Group, Inc. | | 81,082 | | | 2,034,347 |
Dynegy, Inc. (b) | | 229,839 | | | 459,678 |
The AES Corp. (b) | | 305,736 | | | 2,519,265 |
| | | | | |
| | | | | 5,013,290 |
| | | | | |
| | |
Industrial Conglomerates—2.8% | | | | | |
3M Co. | | 314,920 | | | 18,120,497 |
General Electric Co. | | 4,773,310 | | | 77,327,622 |
Textron, Inc. | | 109,568 | | | 1,519,708 |
Tyco International, Ltd. | | 214,928 | | | 4,642,445 |
| | | | | |
| | | | | 101,610,272 |
| | | | | |
| | |
Insurance—2.6% | | | | | |
Aflac, Inc. | | 211,834 | | | 9,710,471 |
American International Group, Inc. (b) | | 1,221,964 | | | 1,918,484 |
AON Corp. | | 122,605 | | | 5,600,596 |
Assurant, Inc. | | 53,452 | | | 1,603,560 |
Cincinnati Financial Corp. | | 73,796 | | | 2,145,250 |
Genworth Financial, Inc. (Class A) (b) | | 196,841 | | | 557,060 |
Lincoln National Corp. | | 116,287 | | | 2,190,847 |
Loews Corp. | | 164,494 | | | 4,646,956 |
Marsh & McLennan Cos., Inc. | | 233,627 | | | 5,670,127 |
MBIA, Inc. (a) (b) | | 85,617 | | | 348,461 |
MetLife, Inc. (c) | | 360,654 | | | 12,572,398 |
Principal Financial Group, Inc. | | 117,859 | | | 2,660,078 |
Prudential Financial, Inc. | | 192,690 | | | 5,830,799 |
The Allstate Corp. | | 243,573 | | | 7,979,452 |
The Chubb Corp. | | 161,652 | | | 8,244,252 |
The Hartford Financial Services Group, Inc. | | 136,925 | | | 2,248,309 |
The Progressive Corp. | | 307,046 | | | 4,547,351 |
The Travelers Cos., Inc. | | 265,642 | | | 12,007,018 |
Torchmark Corp. | | 38,644 | | | 1,727,387 |
Unum Group | | 150,479 | | | 2,798,909 |
XL Capital, Ltd. (Class A) | | 150,329 | | | 556,217 |
| | | | | |
| | | | | 95,563,982 |
| | | | | |
| | | | | |
| Security Description | | Shares | | Value* |
| | | | | |
| | |
Internet & Catalog Retail—0.2% | | | | | |
Amazon.com, Inc. (b) | | 146,165 | | $ | 7,495,341 |
Expedia, Inc. (b) | | 95,194 | | | 784,399 |
| | | | | |
| | | | | 8,279,740 |
| | | | | |
| | |
Internet Software & Services—1.4% | | | | | |
Akamai Technologies, Inc. (a) (b) | | 76,861 | | | 1,159,833 |
eBay, Inc. (b) | | 487,467 | | | 6,805,039 |
Google, Inc. (Class A) (b) | | 108,713 | | | 33,445,554 |
VeriSign, Inc. (a) (b) | | 88,181 | | | 1,682,494 |
Yahoo!, Inc. (b) | | 630,660 | | | 7,694,052 |
| | | | | |
| | | | | 50,786,972 |
| | | | | |
| | |
IT Services—1.0% | | | | | |
Affiliated Computer Services, Inc.
(Class A) (b) | | 44,333 | | | 2,037,101 |
Automatic Data Processing, Inc. | | 230,810 | | | 9,080,066 |
Cognizant Technology Solutions Corp.
(Class A) (b) | | 132,332 | | | 2,389,916 |
Computer Sciences Corp. (b) | | 68,843 | | | 2,419,143 |
Convergys Corp. (b) | | 55,473 | | | 355,582 |
Fidelity National Information Services, Inc. | | 86,344 | | | 1,404,817 |
Fiserv, Inc. (b) | | 72,782 | | | 2,647,081 |
MasterCard, Inc. (a) | | 32,891 | | | 4,701,111 |
Paychex, Inc. (a) | | 145,930 | | | 3,835,040 |
The Western Union Co. | | 325,199 | | | 4,663,354 |
Total Systems Services, Inc. | | 89,450 | | | 1,252,300 |
| | | | | |
| | | | | 34,785,511 |
| | | | | |
| | |
Leisure Equipment & Products—0.1% | | | | | |
Eastman Kodak Co. (a) | | 122,004 | | | 802,786 |
Hasbro, Inc. (a) | | 56,302 | | | 1,642,330 |
Mattel, Inc. | | 162,891 | | | 2,606,256 |
| | | | | |
| | | | | 5,051,372 |
| | | | | |
| | |
Life Sciences Tools & Services—0.3% | | | | | |
Life Technologies Corp. (b) | | 78,420 | | | 1,827,970 |
Millipore Corp. (a) (b) | | 25,104 | | | 1,293,358 |
PerkinElmer, Inc. | | 53,674 | | | 746,605 |
Thermo Fisher Scientific, Inc. (b) | | 190,970 | | | 6,506,348 |
Waters Corp. (b) | | 44,678 | | | 1,637,449 |
| | | | | |
| | | | | 12,011,730 |
| | | | | |
| | |
Machinery—1.6% | | | | | |
Caterpillar, Inc. | | 274,145 | | | 12,246,057 |
Cummins, Inc. | | 91,515 | | | 2,446,196 |
Danaher Corp. (a) | | 116,199 | | | 6,578,025 |
Deere & Co. | | 194,057 | | | 7,436,264 |
Dover Corp. | | 84,513 | | | 2,782,168 |
Eaton Corp. | | 74,940 | | | 3,725,267 |
Flowserve Corp. | | 25,696 | | | 1,323,344 |
Illinois Tool Works, Inc. | | 178,873 | | | 6,269,499 |
Ingersoll-Rand Co., Ltd. (Class A) | | 144,875 | | | 2,513,581 |
ITT Corp. | | 82,525 | | | 3,795,325 |
PACCAR, Inc. (a) | | 164,823 | | | 4,713,938 |
Pall Corp. | | 53,662 | | | 1,525,611 |
*See accompanying notes to financial statements.
MSF-8
Metropolitan Series Fund, Inc.
MetLife Stock Index Portfolio
Schedule of Investments as of December 31, 2008
Common Stock—(Continued)
| | | | | |
| Security Description | | Shares | | Value* |
| | | | | |
| | |
Machinery—(Continued) | | | | | |
Parker Hannifin Corp. | | 73,237 | | $ | 3,115,502 |
| | | | | |
The Manitowoc Co., Inc. | | 59,239 | | | 513,010 |
| | | | | |
| | | | | 58,983,787 |
| | | | | |
| | |
Media—2.5% | | | | | |
CBS Corp. (Class B) | | 308,997 | | | 2,530,686 |
Comcast Corp. (Class A) | | 1,308,741 | | | 22,091,548 |
Gannett Co., Inc. (a) | | 103,669 | | | 829,352 |
Interpublic Group of Cos., Inc. (a) (b) | | 216,567 | | | 857,605 |
Meredith Corp. (a) | | 16,422 | | | 281,145 |
News Corp. (Class A) | | 1,045,223 | | | 9,501,077 |
Omnicom Group, Inc. | | 141,246 | | | 3,802,342 |
Scripps Networks Interactive, Inc. (a) | | 40,929 | | | 900,438 |
The DIRECTV Group, Inc. (a) (b) | | 248,202 | | | 5,686,308 |
The McGraw-Hill Cos., Inc. | | 142,927 | | | 3,314,477 |
The New York Times Co. (Class A) (a) | | 52,931 | | | 387,984 |
The Walt Disney Co. | | 841,215 | | | 19,087,169 |
The Washington Post Co. (Class B) | | 2,725 | | | 1,063,431 |
Time Warner, Inc. | | 1,630,353 | | | 16,401,351 |
Viacom, Inc. (Class B) (b) | | 278,822 | | | 5,314,347 |
| | | | | |
| | | | | 92,049,260 |
| | | | | |
| | |
Metals & Mining—0.8% | | | | | |
AK Steel Holding Corp. | | 50,906 | | | 474,444 |
Alcoa, Inc. | | 363,711 | | | 4,095,386 |
Allegheny Technologies, Inc. (a) | | 43,761 | | | 1,117,218 |
Freeport-McMoRan Copper & Gold,
Inc. (a) (b) | | 171,627 | | | 4,194,564 |
Newmont Mining Corp. (a) | | 206,458 | | | 8,402,841 |
Nucor Corp. | | 142,677 | | | 6,591,677 |
Titanium Metals Corp. (a) | | 38,673 | | | 340,709 |
United States Steel Corp. | | 52,834 | | | 1,965,425 |
| | | | | |
| | | | | 27,182,264 |
| | | | | |
| | |
Multi-Utilities—1.5% | | | | | |
Ameren Corp. | | 96,097 | | | 3,196,186 |
CenterPoint Energy, Inc. | | 156,407 | | | 1,973,856 |
CMS Energy Corp. (a) | | 102,802 | | | 1,039,328 |
Consolidated Edison, Inc. (a) | | 124,354 | | | 4,841,101 |
Dominion Resources, Inc. | | 264,196 | | | 9,468,785 |
DTE Energy Co. | | 74,088 | | | 2,642,719 |
Integrys Energy Group, Inc. | | 34,731 | | | 1,492,739 |
NiSource, Inc. | | 124,632 | | | 1,367,213 |
PG&E Corp. | | 164,052 | | | 6,350,453 |
Public Service Enterprise Group, Inc. | | 229,999 | | | 6,709,071 |
SCANA Corp. | | 53,407 | | | 1,901,289 |
Sempra Energy | | 110,720 | | | 4,719,994 |
| | | | | |
TECO Energy, Inc. (a) | | 96,701 | | | 1,194,257 |
Wisconsin Energy Corp. | | 53,135 | | | 2,230,607 |
Xcel Energy, Inc. | | 204,074 | | | 3,785,573 |
| | | | | |
| | | | | 52,913,171 |
| | | | | |
| | |
Multiline Retail—0.7% | | | | | |
Big Lots, Inc. (a) (b) | | 37,318 | | | 540,738 |
Family Dollar Stores, Inc. | | 63,497 | | | 1,655,367 |
| | | | | |
| Security Description | | Shares | | Value* |
| | | | | |
| | |
Multiline Retail—(Continued) | | | | | |
J.C. Penney Co., Inc. (a) | | 100,973 | | $ | 1,989,168 |
Kohl’s Corp. (a) (b) | | 138,482 | | | 5,013,048 |
Macy’s, Inc. | | 191,128 | | | 1,978,175 |
Nordstrom, Inc. (a) | | 72,434 | | | 964,096 |
Sears Holdings Corp. (a) (b) | | 25,287 | | | 982,906 |
Target Corp. (a) | | 342,108 | | | 11,812,989 |
| | | | | |
| | | | | 24,936,487 |
| | | | | |
| | |
Office Electronics—0.1% | | | | | |
Xerox Corp. | | 393,379 | | | 3,135,231 |
| | | | | |
| | |
Oil, Gas & Consumable Fuels—11.6% | | | | | |
Anadarko Petroleum Corp. | | 208,615 | | | 8,042,108 |
Apache Corp. | | 152,094 | | | 11,335,566 |
Cabot Oil & Gas Corp. | | 46,969 | | | 1,221,194 |
Chesapeake Energy Corp. (a) | | 245,796 | | | 3,974,521 |
Chevron Corp. | | 923,366 | | | 68,301,383 |
ConocoPhillips | | 677,516 | | | 35,095,329 |
Consol Energy, Inc. | | 82,345 | | | 2,353,420 |
Devon Energy Corp. | | 200,780 | | | 13,193,254 |
El Paso Corp. | | 318,667 | | | 2,495,163 |
EOG Resources, Inc. | | 113,425 | | | 7,551,837 |
Exxon Mobil Corp. | | 2,311,674 | | | 184,540,935 |
Hess Corp. | | 128,921 | | | 6,915,322 |
Marathon Oil Corp. | | 320,655 | | | 8,773,121 |
Massey Energy Co. | | 38,690 | | | 533,535 |
Murphy Oil Corp. | | 86,568 | | | 3,839,291 |
Noble Energy, Inc. | | 78,506 | | | 3,864,065 |
Occidental Petroleum Corp. | | 368,056 | | | 22,079,679 |
Peabody Energy Corp. | | 121,173 | | | 2,756,686 |
Pioneer Natural Resources Co. (a) | | 53,485 | | | 865,387 |
Range Resources Corp. | | 70,594 | | | 2,427,728 |
Southwestern Energy Co. (b) | | 156,028 | | | 4,520,131 |
Spectra Energy Corp. | | 277,696 | | | 4,370,935 |
Sunoco, Inc. (a) | | 53,109 | | | 2,308,117 |
Tesoro Corp. (a) | | 62,923 | | | 828,696 |
The Williams Cos., Inc. | | 262,983 | | | 3,807,994 |
Valero Energy Corp. | | 234,508 | | | 5,074,753 |
| | | | | |
XTO Energy, Inc. | | 262,140 | | | 9,245,678 |
| | | | | |
| | | | | 420,315,828 |
| | | | | |
| | |
Paper & Forest Products—0.2% | | | | | |
International Paper Co. | | 194,305 | | | 2,292,799 |
MeadWestvaco Corp. | | 77,627 | | | 868,646 |
Weyerhaeuser Co. | | 96,022 | | | 2,939,234 |
| | | | | |
| | | | | 6,100,679 |
| | | | | |
| | |
Personal Products—0.2% | | | | | |
Avon Products, Inc. | | 193,734 | | | 4,655,428 |
The Estee Lauder Cos., Inc. (Class A) (a) | | 52,653 | | | 1,630,137 |
| | | | | |
| | | | | 6,285,565 |
| | | | | |
| | |
Pharmaceuticals—7.8% | | | | | |
Abbott Laboratories | | 705,131 | | | 37,632,841 |
Allergan, Inc. | | 139,752 | | | 5,634,801 |
*See accompanying notes to financial statements.
MSF-9
Metropolitan Series Fund, Inc.
MetLife Stock Index Portfolio
Schedule of Investments as of December 31, 2008
Common Stock—(Continued)
| | | | | |
| Security Description | | Shares | | Value* |
| | | | | |
| | |
Pharmaceuticals—(Continued) | | | | | |
Bristol-Myers Squibb Co. | | 899,652 | | $ | 20,916,909 |
Eli Lilly & Co. | | 454,695 | | | 18,310,568 |
Forest Laboratories, Inc. (b) | | 136,965 | | | 3,488,499 |
Johnson & Johnson | | 1,260,928 | | | 75,441,322 |
King Pharmaceuticals, Inc. (b) | | 112,012 | | | 1,189,567 |
Merck & Co., Inc. | | 960,811 | | | 29,208,654 |
Mylan, Inc. (a) (b) | | 138,474 | | | 1,369,508 |
Pfizer, Inc. | | 3,064,387 | | | 54,270,294 |
Schering-Plough Corp. | | 738,764 | | | 12,581,151 |
Watson Pharmaceuticals, Inc. (b) | | 47,540 | | | 1,263,138 |
Wyeth | | 605,106 | | | 22,697,526 |
| | | | | |
| | | | | 284,004,778 |
| | | | | |
| | |
Professional Services—0.2% | | | | | |
Dun & Bradstreet Corp. | | 24,501 | | | 1,891,477 |
Equifax, Inc. | | 57,402 | | | 1,522,301 |
Monster Worldwide, Inc. (a) (b) | | 55,998 | | | 677,016 |
Robert Half International, Inc. (a) | | 70,506 | | | 1,467,935 |
| | | | | |
| | | | | 5,558,729 |
| | | | | |
| | |
Real Estate Investment Trusts—1.0% | | | | | |
Apartment Investment & Management Co. | | 46,014 | | | 531,462 |
AvalonBay Communities, Inc. (a) | | 35,044 | | | 2,122,966 |
Boston Properties, Inc. (a) | | 54,901 | | | 3,019,555 |
Developers Diversified Realty Corp. (a) | | 54,661 | | | 266,746 |
Equity Residential (a) | | 123,623 | | | 3,686,438 |
HCP, Inc. | | 114,820 | | | 3,188,551 |
| | | | | |
Host Hotels & Resorts, Inc. (a) | | 237,477 | | | 1,797,701 |
Kimco Realty Corp. (a) | | 104,073 | | | 1,902,454 |
Plum Creek Timber Co., Inc. (a) | | 75,800 | | | 2,633,292 |
ProLogis (a) | | 120,730 | | | 1,676,940 |
Public Storage | | 56,969 | | | 4,529,035 |
Simon Property Group, Inc. (a) | | 102,622 | | | 5,452,307 |
Vornado Realty Trust | | 62,432 | | | 3,767,771 |
| | | | | |
| | | | | 34,575,218 |
| | | | | |
|
Real Estate Management & Development—0.0% |
CB Richard Ellis Group, Inc. (b) | | 101,343 | | | 437,802 |
| | | | | |
| | |
Road & Rail—1.0% | | | | | |
Burlington Northern Santa Fe Corp. | | 127,570 | | | 9,658,325 |
CSX Corp. | | 179,270 | | | 5,820,897 |
Norfolk Southern Corp. | | 168,277 | | | 7,917,433 |
Ryder System, Inc. | | 25,275 | | | 980,164 |
Union Pacific Corp. | | 230,152 | | | 11,001,266 |
| | | | | |
| | | | | 35,378,085 |
| | | | | |
|
Semiconductors & Semiconductor Equipment—2.1% |
Advanced Micro Devices, Inc. (a) (b) | | 276,532 | | | 597,309 |
Altera Corp. | | 135,140 | | | 2,258,189 |
Analog Devices, Inc. | | 132,335 | | | 2,517,012 |
Applied Materials, Inc. (a) | | 609,729 | | | 6,176,555 |
Broadcom Corp. (b) | | 201,841 | | | 3,425,242 |
Intel Corp. | | 2,527,700 | | | 37,056,082 |
KLA-Tencor Corp. | | 76,739 | | | 1,672,143 |
| | | | | |
| Security Description | | Shares | | Value* |
| | | | | |
|
Semiconductors & Semiconductor Equipment—(Continued) |
Linear Technology Corp. (a) | | 100,766 | | $ | 2,228,944 |
LSI Corp. (a) (b) | | 293,165 | | | 964,513 |
MEMC Electronic Materials, Inc. (a) (b) | | 102,004 | | | 1,456,617 |
Microchip Technology, Inc. (a) | | 82,662 | | | 1,614,389 |
Micron Technology, Inc. (a) (b) | | 347,097 | | | 916,336 |
National Semiconductor Corp. | | 88,653 | | | 892,736 |
Novellus Systems, Inc. (a) (b) | | 44,384 | | | 547,699 |
NVIDIA Corp. (b) | | 244,073 | | | 1,969,669 |
Teradyne, Inc. (b) | | 76,934 | | | 324,661 |
Texas Instruments, Inc. | | 589,172 | | | 9,143,949 |
Xilinx, Inc. | | 124,477 | | | 2,218,180 |
| | | | | |
| | | | | 75,980,225 |
| | | | | |
| | |
Software—3.6% | | | | | |
Adobe Systems, Inc. (b) | | 241,297 | | | 5,137,213 |
Autodesk, Inc. (b) | | 102,839 | | | 2,020,786 |
BMC Software, Inc. (a) (b) | | 85,214 | | | 2,293,109 |
CA, Inc. | | 179,010 | | | 3,317,055 |
Citrix Systems, Inc. (b) | | 82,553 | | | 1,945,774 |
Compuware Corp. (b) | | 112,021 | | | 756,142 |
Electronic Arts, Inc. (b) | | 145,827 | | | 2,339,065 |
Intuit, Inc. (a) (b) | | 145,454 | | | 3,460,351 |
McAfee, Inc. (b) | | 69,369 | | | 2,398,086 |
Microsoft Corp. | | 3,476,699 | | | 67,587,029 |
Novell, Inc. (b) | | 156,903 | | | 610,353 |
Oracle Corp. (b) | | 1,780,292 | | | 31,564,577 |
Salesforce.com, Inc. (a) (b) | | 47,682 | | | 1,526,301 |
Symantec Corp. (b) | | 379,933 | | | 5,136,694 |
| | | | | |
| | | | | 130,092,535 |
| | | | | |
| | |
Specialty Retail—1.8% | | | | | |
Abercrombie & Fitch Co. (Class A) (a) | | 39,553 | | | 912,488 |
AutoNation, Inc. (b) | | 49,027 | | | 484,387 |
AutoZone, Inc. (b) | | 17,389 | | | 2,425,244 |
Bed Bath & Beyond, Inc. (a) (b) | | 118,022 | | | 3,000,119 |
Best Buy Co., Inc. (a) | | 153,508 | | | 4,315,110 |
GameStop Corp. (Class A) (a) (b) | | 74,429 | | | 1,612,132 |
Home Depot, Inc. | | 770,516 | | | 17,737,278 |
Limited Brands, Inc. | | 122,969 | | | 1,234,609 |
Lowe’s Cos., Inc. | | 666,092 | | | 14,334,300 |
Office Depot, Inc. (b) | | 124,924 | | | 372,273 |
RadioShack Corp. | | 56,840 | | | 678,670 |
Staples, Inc. | | 324,205 | | | 5,809,754 |
The Gap, Inc. | | 211,904 | | | 2,837,394 |
The Sherwin-Williams Co. (a) | | 44,627 | | | 2,666,463 |
The TJX Cos., Inc. | | 189,209 | | | 3,892,029 |
Tiffany & Co. (a) | | 55,948 | | | 1,322,051 |
| | | | | |
| | | | | 63,634,301 |
| | | | | |
|
Textiles, Apparel & Luxury Goods—0.4% |
Coach, Inc. (a) (b) | | 148,573 | | | 3,085,861 |
Jones Apparel Group, Inc. (a) | | 37,913 | | | 222,170 |
Nike, Inc. | | 178,298 | | | 9,093,198 |
Polo Ralph Lauren Corp. (a) | | 25,568 | | | 1,161,043 |
VF Corp. (a) | | 40,020 | | | 2,191,896 |
| | | | | |
| | | | | 15,754,168 |
| | | | | |
*See accompanying notes to financial statements.
MSF-10
Metropolitan Series Fund, Inc.
MetLife Stock Index Portfolio
Schedule of Investments as of December 31, 2008
Common Stock—(Continued)
| | | | | |
Security Description | | Shares | | Value* |
| | | | | |
| | |
Thrifts & Mortgage Finance—0.2% | | | | | |
Hudson City Bancorp, Inc. | | 236,884 | | $ | 3,780,669 |
People’s United Financial, Inc. | | 158,051 | | | 2,818,049 |
Sovereign Bancorp, Inc. (b) | | 247,422 | | | 737,318 |
| | | | | |
| | | | | 7,336,036 |
| | | | | |
| | |
Tobacco—1.8% | | | | | |
Altria Group, Inc. | | 936,366 | | | 14,101,672 |
Lorillard, Inc. | | 76,382 | | | 4,304,125 |
Philip Morris International, Inc. | | 919,386 | | | 40,002,485 |
Reynolds American, Inc. | | 76,823 | | | 3,096,735 |
UST, Inc. | | 67,439 | | | 4,678,918 |
| | | | | |
| | | | | 66,183,935 |
| | | | | |
|
Trading Companies & Distributors—0.1% |
Fastenal Co. (a) | | 58,726 | | | 2,046,601 |
W.W. Grainger, Inc. (a) | | 29,385 | | | 2,316,713 |
| | | | | |
| | | | | 4,363,314 |
| | | | | |
| |
Wireless Telecommunication Services—0.2% | | | |
American Tower Corp. (Class A) (b) | | 180,281 | | | 5,285,839 |
Sprint Nextel Corp. (b) | | 1,298,298 | | | 2,375,885 |
| | | | | |
| | | | | 7,661,724 |
| | | | | |
Total Common Stock
(Identified Cost $4,576,045,644) | | | | | 3,574,259,793 |
| | | | | |
| | |
| Mutual Funds—1.0% | | | | | |
| | |
Exchange Traded Funds—1.0% | | | | | |
SPDR Trust, Series 1 | | 399,000 | | | 36,005,760 |
| | | | | |
Total Mutual Funds
(Identified Cost $34,839,122) | | | | | 36,005,760 |
| | | | | |
| | | | | | | |
|
| Short Term Investments—3.9% | |
| Security Description | | Face
Amount/Shares | | Value* | |
| | | | | | | |
| | |
Discount Notes—0.3% | | | | | | | |
Federal Home Loan Bank
0.120%, 03/25/09 | | $ | 6,800,000 | | $ | 6,798,746 | |
2.400%, 01/23/09 | | | 4,775,000 | | | 4,774,971 | |
| | | | | | | |
| | | | | | 11,573,717 | |
| | | | | | | |
| | |
Mutual Funds—3.6% | | | | | | | |
State Street Navigator Securities Lending Prime Portfolio (e) | | | 132,874,380 | | | 132,874,380 | |
| | | | | | | |
Total Short Term Investments
(Identified Cost $144,448,097) | | | | | | 144,448,097 | |
| | | | | | | |
Total Investments—103.3%
(Identified Cost $4,755,332,863) (f) | | | | | | 3,754,713,650 | |
Liabilities in excess of other assets | | | | | | (121,515,780 | ) |
| | | | | | | |
| Total Net Assets—100% | | | | | $ | 3,633,197,870 | |
| | | | | | | |
| (a) | A portion or all of the security was on loan. As of December 31, 2008, the market value of securities loaned was $134,742,394 and the collateral received consisted of cash in the amount of $132,874,380 and non-cash collateral with a value of $2,230,430. The cash collateral is invested in a money market fund managed by an affiliate of the custodian. The non-cash collateral received consists primarily of government securities and bank letters of credit, and are held for the benefit of the Portfolio at the Portfolio’s custodian. The Portfolio cannot repledge or resell this collateral. As such, these are excluded from the Statement of Assets and Liabilities. |
| (c) | Affiliated Issuer. See below. |
| (d) | A portion or all of the security was pledged as collateral against open futures contracts. |
| (e) | Represents investment of cash collateral received from securities lending transactions. |
| (f) | The aggregate cost of investments for federal income tax purposes as of December 31, 2008 was $4,816,918,307 and the composition of unrealized appreciation and depreciation of investment securities was $467,829,498 and $(1,530,034,155), respectively. |
Futures Contracts
| | | | | | | | | | | | | |
Futures Contracts—Long | | Expiration Date | | Number of
Contracts | | Contract
Amount | | Valuation as of
12/31/2008 | | Net Unrealized
Appreciation |
S&P 500 Index Futures | | 3/19/2009 | | 46 | | $ | 10,056,405 | | $ | 10,351,150 | | $ | 294,745 |
| | | | | | | | | | | | | |
Affiliated Issuer
| | | | | | | | | | | | | | | |
Security Description | | Number of Shares
Held at 12/31/2007 | | Shares Purchased
Since 12/31/2007 | | Shares Sold
Since 12/31/2007 | | | Number of Shares
Held at 12/31/2008 | | Realized Gain
on Shares Sold | | Income For
Year Ended
12/31/2008 |
MetLife, Inc. | | 349,275 | | 59,644 | | (48,265 | ) | | 360,654 | | $ | 1,021,906 | | $ | 254,004 |
*See accompanying notes to financial statements.
MSF-11
Metropolitan Series Fund, Inc.
MetLife Stock Index Portfolio
The Portfolio adopted the provisions of Statement of Financial Accounting Standards No. 157, “Fair Value Measurements” (FAS 157), effective with the beginning of the Portfolio’s fiscal year. FAS 157 establishes a framework for measuring fair value and expands disclosures about fair value measurements in financial statements. The three levels of the hierarchy under FAS 157 are described below:
Level 1 - quoted prices in active markets for identical securities
Level 2 - other significant observable inputs (including quoted prices for similar securities, interest rates, credit risk, etc.)
Level 3 - significant unobservable inputs (including the Portfolio’s own assumptions in determining the fair value of investments)
The inputs or methodology used for valuing securities are not necessarily an indication of the risk associated with investing in those securities.
The following is a summary of the inputs used to value the Portfolio’s net assets as of December 31, 2008:
| | | | | | |
| Valuation Inputs | | Investments In
Securities | | Other Financial
Instruments* |
Level 1 - Quoted Prices | | $ | 3,743,139,933 | | $ | 294,745 |
Level 2 - Other Significant Observable Inputs | | | 11,573,717 | | | 0 |
Level 3 - Significant Unobservable Inputs | | | 0 | | | 0 |
Total | | $ | 3,754,713,650 | | $ | 294,745 |
* Other financial instruments are derivative instruments not reflected in the Schedule of Investments, such as futures, forwards, swap contracts and written options, which are valued based on the unrealized appreciation/depreciation on the instrument.
MSF-12
Metropolitan Series Fund, Inc.
MetLife Stock Index Portfolio
Statement of Assets & Liabilities
December 31, 2008
| | | | | | | |
Assets | | | | | | | |
Investments at value (a) (b) | | | | | $ | 3,754,713,650 | |
Receivable for: | | | | | | | |
Securities sold | | | | | | 7,746,119 | |
Fund shares sold | | | | | | 6,292,183 | |
Accrued interest and dividends | | | | | | 8,341,978 | |
Futures variation margin | | | | | | 136,850 | |
| | | | | | | |
Total Assets | | | | | | 3,777,230,780 | |
Liabilities | | | | | | | |
Payable for: | | | | | | | |
Securities purchased | | $ | 5,944,839 | | | | |
Fund shares redeemed | | | 1,695,115 | | | | |
Collateral for securities loaned | | | 132,874,380 | | | | |
Due to custodian bank | | | 2,582,967 | | | | |
Accrued expenses: | | | | | | | |
Management fees | | | 718,367 | | | | |
Service and distribution fees | | | 167,040 | | | | |
Other expenses | | | 50,202 | | | | |
| | | | | | | |
Total Liabilities | | | | | | 144,032,910 | |
| | | | | | | |
Net Assets | | | | | $ | 3,633,197,870 | |
| | | | | | | |
Net assets consists of: | | | | | | | |
Capital paid in | | | | | $ | 4,516,838,639 | |
Undistributed net investment income | | | | | | 100,345,204 | |
Accumulated net realized gains | | | | | | 16,338,495 | |
Unrealized depreciation on investments and futures contracts | | | | | | (1,000,324,468 | ) |
| | | | | | | |
Net Assets | | | | | $ | 3,633,197,870 | |
| | | | | | | |
| Computation of offering price: | | | | | | | |
Class A | | | | | | | |
Net asset value and redemption price per share ($2,739,612,640 divided by 124,445,121 shares outstanding) | | | | | $ | 22.01 | |
| | | | | | | |
Class B | | | | | | | |
Net asset value and redemption price per share ($729,640,552 divided by 34,044,413 shares outstanding) | | | | | $ | 21.43 | |
| | | | | | | |
Class E | | | | | | | |
Net asset value and redemption price per share ($163,944,678 divided by 7,486,150 shares outstanding) | | | | | $ | 21.90 | |
| | | | | | | |
(a) Identified cost of investments | | | | | $ | 4,755,332,863 | |
| | | | | | | |
(b) Includes cash collateral for securities loaned of | | | | | $ | 132,874,380 | |
| | | | | | | |
Statement of Operations
For the Year Ended December 31, 2008
| | | | | | | | |
Investment Income | | | | | | | | |
Dividends | | | | | | $ | 115,566,763 | |
Dividends from affiliates | | | | | | | 254,004 | |
Interest | | | | | | | 2,424,935 | (a) |
| | | | | | | | |
| | | | | | | 118,245,702 | |
Expenses | | | | | | | | |
Management fees | | $ | 12,427,391 | | | | | |
Service and distribution fees—Class B | | | 2,315,658 | | | | | |
Service and distribution fees—Class E | | | 334,606 | | | | | |
Directors’ fees and expenses | | | 31,917 | | | | | |
Custodian | | | 412,831 | | | | | |
Audit and tax services | | | 36,941 | | | | | |
Legal | | | 85,473 | | | | | |
Printing | | | 918,448 | | | | | |
Insurance | | | 68,745 | | | | | |
Miscellaneous | | | 117,280 | | | | | |
| | | | | | | | |
Total expenses | | | 16,749,290 | | | | | |
Management fee waivers | | | (347,967 | ) | | | 16,401,323 | |
| | | | | | | | |
Net Investment Income | | | | | | | 101,844,379 | |
| | | | | | | | |
Realized and Unrealized Gain (Loss) | | | | | | | | |
| Realized gain (loss) on: | | | | | | | | |
Investments of unaffiliated issuers—net | | | 41,111,330 | | | | | |
Investments of affiliated issuers—net | | | 1,021,906 | | | | | |
Futures contracts—net | | | (5,164,861 | ) | | | 36,968,375 | |
| | | | | | | | |
Change in unrealized appreciation
(depreciation) on: | | | | | | | | |
Investments—net | | | (2,330,480,835 | ) | | | | |
Futures contracts—net | | | 787,035 | | | | (2,329,693,800 | ) |
| | | | | | | | |
Net loss | | | | | | | (2,292,725,425 | ) |
| | | | | | | | |
Net Decrease in Net Assets From Operations | | | | | | $ | (2,190,881,046 | ) |
| | | | | | | | |
| (a) | Includes income on securities loaned of $2,303,734. |
See accompanying notes to financial statements.
MSF-13
Metropolitan Series Fund, Inc.
MetLife Stock Index Portfolio
Statements of Changes in Net Assets
December 31, 2008
| | | | | | | | |
| | | Year ended
December 31,
2008 | | | Year ended
December 31,
2007 | |
From Operations | | | | | | | | |
Net investment income | | $ | 101,844,379 | | | $ | 96,551,278 | |
Net realized gain | | | 36,968,375 | | | | 200,860,417 | |
Unrealized depreciation | | | (2,329,693,800 | ) | | | (17,016,969 | ) |
| | | | | | | | |
Increase (decrease) in net assets from operations | | | (2,190,881,046 | ) | | | 280,394,726 | |
| | | | | | | | |
From Distributions to Shareholders | | | | | | | | |
Net investment income | | | | | | | | |
Class A | | | (75,462,441 | ) | | | (43,678,879 | ) |
Class B | | | (15,801,366 | ) | | | (8,803,969 | ) |
Class E | | | (4,055,168 | ) | | | (2,690,749 | ) |
| | | | | | | | |
| | | (95,318,975 | ) | | | (55,173,597 | ) |
| | | | | | | | |
Net realized gain | | | | | | | | |
Class A | | | (161,847,077 | ) | | | (84,906,392 | ) |
Class B | | | (39,854,897 | ) | | | (21,923,608 | ) |
Class E | | | (9,579,599 | ) | | | (6,012,759 | ) |
| | | | | | | | |
| | | (211,281,573 | ) | | | (112,842,759 | ) |
| | | | | | | | |
Total distributions | | | (306,600,548 | ) | | | (168,016,356 | ) |
| | | | | | | | |
Increase in net assets from capital share transactions | | | 24,465,135 | | | | 585,539,125 | |
| | | | | | | | |
Net increase (decrease) in net assets | | | (2,473,016,459 | ) | | | 697,917,495 | |
| | |
Net Assets | | | | | | | | |
Beginning of the period | | | 6,106,214,329 | | | | 5,408,296,834 | |
| | | | | | | | |
End of the period | | $ | 3,633,197,870 | | | $ | 6,106,214,329 | |
| | | | | | | | |
Undistributed Net Investment Income | | | | | | | | |
End of the period | | $ | 100,345,204 | | | $ | 95,281,650 | |
| | | | | | | | |
Other Information:
Capital Shares
Transactions in capital shares were as follows:
| | | | | | | | | | | | | | |
| | | Year ended
December 31, 2008 | | | Year ended
December 31, 2007 | |
| | | Shares | | | $ | | | Shares | | | $ | |
Class A | | | | | | | | | | | | | | |
Sales | | 13,217,540 | | | $ | 375,346,962 | | | 34,990,203 | | | $ | 1,297,764,619 | |
Reinvestments | | 7,124,273 | | | | 237,309,518 | | | 3,487,531 | | | | 128,585,271 | |
Redemptions | | (23,818,379 | ) | | | (686,168,977 | ) | | (24,307,503 | ) | | | (904,992,455 | ) |
| | | | | | | | | | | | | | |
Net increase (decrease) | | (3,476,566 | ) | | $ | (73,512,497 | ) | | 14,170,231 | | | $ | 521,357,435 | |
| | | | | | | | | | | | | | |
Class B | | | | | | | | | | | | | | |
Sales | | 7,244,492 | | | $ | 196,832,804 | | | 8,914,415 | | | $ | 322,546,020 | |
Reinvestments | | 1,713,028 | | | | 55,656,263 | | | 853,544 | | | | 30,727,577 | |
Redemptions | | (5,219,214 | ) | | | (149,650,552 | ) | | (7,494,071 | ) | | | (271,598,959 | ) |
| | | | | | | | | | | | | | |
Net increase | | 3,738,306 | | | $ | 102,838,515 | | | 2,273,888 | | | $ | 81,674,638 | |
| | | | | | | | | | | | | | |
Class E | | | | | | | | | | | | | | |
Sales | | 816,870 | | | $ | 21,341,371 | | | 593,708 | | | $ | 21,859,230 | |
Reinvestments | | 411,057 | | | | 13,634,767 | | | 237,024 | | | | 8,703,508 | |
Redemptions | | (1,350,038 | ) | | | (39,837,021 | ) | | (1,297,297 | ) | | | (48,055,686 | ) |
| | | | | | | | | | | | | | |
Net decrease | | (122,111 | ) | | $ | (4,860,883 | ) | | (466,565 | ) | | $ | (17,492,948 | ) |
| | | | | | | | | | | | | | |
Increase derived from capital share transactions | | | | | $ | 24,465,135 | | | | | | $ | 585,539,125 | |
| | | | | | | | | | | | | | |
See accompanying notes to financial statements.
MSF-14
Metropolitan Series Fund, Inc.
MetLife Stock Index Portfolio
Financial Highlights
| | | | | | | | | | | | | | | | | | | | |
| | | Class A | |
| | | Year ended December 31, | |
| | | 2008 | | | 2007 | | | 2006 | | | 2005 | | | 2004 | |
Net Asset Value, Beginning of Period | | $ | 37.00 | | | $ | 36.26 | | | $ | 33.20 | | | $ | 32.27 | | | $ | 29.45 | |
| | | | | | | | | | | | | | | | | | | | |
Income From Investment Operations | | | | | | | | | | | | | | | | | | | | |
Net investment income | | | 0.63 | (a) | | | 0.63 | (a) | | | 0.58 | | | | 0.55 | | | | 0.54 | |
Net realized and unrealized gain (loss) of investments | | | (13.71 | ) | | | 1.26 | | | | 4.37 | | | | 0.90 | | | | 2.54 | |
| | | | | | | | | | | | | | | | | | | | |
Total from investment operations | | | (13.08 | ) | | | 1.89 | | | | 4.95 | | | | 1.45 | | | | 3.08 | |
| | | | | | | | | | | | | | | | | | | | |
Less Distributions | | | | | | | | | | | | | | | | | | | | |
Distributions from net investment income | | | (0.61 | ) | | | (0.39 | ) | | | (0.70 | ) | | | (0.52 | ) | | | (0.26 | ) |
Distributions from net realized capital gains | | | (1.30 | ) | | | (0.76 | ) | | | (1.19 | ) | | | 0.00 | | | | 0.00 | |
| | | | | | | | | | | | | | | | | | | | |
Total distributions | | | (1.91 | ) | | | (1.15 | ) | | | (1.89 | ) | | | (0.52 | ) | | | (0.26 | ) |
| | | | | | | | | | | | | | | | | | | | |
Net Asset Value, End of Period | | $ | 22.01 | | | $ | 37.00 | | | $ | 36.26 | | | $ | 33.20 | | | $ | 32.27 | |
| | | | | | | | | | | | | | | | | | | | |
Total Return (%) | | | (37.1 | ) | | | 5.2 | | | | 15.5 | | | | 4.6 | | | | 10.5 | |
Ratio of operating expenses to average net assets (%) | | | 0.28 | | | | 0.28 | | | | 0.30 | | | | 0.29 | | | | 0.30 | |
Ratio of operating expenses to average net assets without giving effect to the contractual expense agreement would have been (%) (b) | | | 0.29 | | | | 0.29 | | | | 0.31 | | | | 0.29 | | | | N/A | |
Ratio of net investment income to average net assets (%) | | | 2.10 | | | | 1.69 | | | | 1.63 | | | | 1.59 | | | | 1.73 | |
Portfolio turnover rate (%) | | | 13 | | | | 12 | | | | 9 | | | | 8 | | | | 3 | |
Net assets, end of period (000) | | $ | 2,739,613 | | | $ | 4,733,145 | | | $ | 4,125,102 | | | $ | 3,942,484 | | | $ | 4,139,893 | |
| | | | | | | | | | | | | | | | | | | | |
| | | Class B | |
| | | Year ended December 31, | |
| | | 2008 | | | 2007 | | | 2006 | | | 2005 | | | 2004 | |
Net Asset Value, Beginning of Period | | $ | 36.07 | | | $ | 35.38 | | | $ | 32.41 | | | $ | 31.52 | | | $ | 28.80 | |
| | | | | | | | | | | | | | | | | | | | |
Income From Investment Operations | | | | | | | | | | | | | | | | | | | | |
Net investment income | | | 0.54 | (a) | | | 0.52 | (a) | | | 0.47 | | | | 0.39 | | | | 0.41 | |
Net realized and unrealized gain (loss) of investments | | | (13.36 | ) | | | 1.24 | | | | 4.28 | | | | 0.95 | | | | 2.53 | |
| | | | | | | | | | | | | | | | | | | | |
Total from investment operations | | | (12.82 | ) | | | 1.76 | | | | 4.75 | | | | 1.34 | | | | 2.94 | |
| | | | | | | | | | | | | | | | | | | | |
Less Distributions | | | | | | | | | | | | | | | | | | | | |
Distributions from net investment income | | | (0.52 | ) | | | (0.31 | ) | | | (0.59 | ) | | | (0.45 | ) | | | (0.22 | ) |
Distributions from net realized capital gains | | | (1.30 | ) | | | (0.76 | ) | | | (1.19 | ) | | | 0.00 | | | | 0.00 | |
| | | | | | | | | | | | | | | | | | | | |
Total distributions | | | (1.82 | ) | | | (1.07 | ) | | | (1.78 | ) | | | (0.45 | ) | | | (0.22 | ) |
| | | | | | | | | | | | | | | | | | | | |
Net Asset Value, End of Period | | $ | 21.43 | | | $ | 36.07 | | | $ | 35.38 | | | $ | 32.41 | | | $ | 31.52 | |
| | | | | | | | | | | | | | | | | | | | |
Total Return (%) | | | (37.3 | ) | | | 5.0 | | | | 15.2 | | | | 4.4 | | | | 10.3 | |
Ratio of operating expenses to average net assets (%) | | | 0.53 | | | | 0.53 | | | | 0.55 | | | | 0.54 | | | | 0.55 | |
Ratio of operating expenses to average net assets without giving effect to the contractual expense agreement would have been (%) (b) | | | 0.54 | | | | 0.54 | | | | 0.56 | | | | 0.54 | | | | N/A | |
Ratio of net investment income to average net assets (%) | | | 1.86 | | | | 1.43 | | | | 1.38 | | | | 1.36 | | | | 1.59 | |
Portfolio turnover rate (%) | | | 13 | | | | 12 | | | | 9 | | | | 8 | | | | 3 | |
Net assets, end of period (000) | | $ | 729,641 | | | $ | 1,092,993 | | | $ | 991,777 | | | $ | 765,425 | | | $ | 508,908 | |
| Please | see following page for Financial Highlights footnote legend. |
See accompanying notes to financial statements.
MSF-15
Metropolitan Series Fund, Inc.
MetLife Stock Index Portfolio
Financial Highlights
| | | | | | | | | | | | | | | | | | | | |
| | | Class E | |
| | | Year ended December 31, | |
| | | 2008 | | | 2007 | | | 2006 | | | 2005 | | | 2004 | |
Net Asset Value, Beginning of Period | | $ | 36.81 | | | $ | 36.09 | | | $ | 33.04 | | | $ | 32.11 | | | $ | 29.33 | |
| | | | | | | | | | | | | | | | | | | | |
Income From Investment Operations | | | | | | | | | | | | | | | | | | | | |
Net investment income | | | 0.58 | (a) | | | 0.57 | (a) | | | 0.52 | | | | 0.47 | | | | 0.47 | |
Net realized and unrealized gain (loss) of investments | | | (13.64 | ) | | | 1.25 | | | | 4.35 | | | | 0.93 | | | | 2.56 | |
| | | | | | | | | | | | | | | | | | | | |
Total from investment operations | | | (13.06 | ) | | | 1.82 | | | | 4.87 | | | | 1.40 | | | | 3.03 | |
| | | | | | | | | | | | | | | | | | | | |
Less Distributions | | | | | | | | | | | | | | | | | | | | |
Distributions from net investment income | | | (0.55 | ) | | | (0.34 | ) | | | (0.63 | ) | | | (0.47 | ) | | | (0.25 | ) |
Distributions from net realized capital gains | | | (1.30 | ) | | | (0.76 | ) | | | (1.19 | ) | | | 0.00 | | | | 0.00 | |
| | | | | | | | | | | | | | | | | | | | |
Total distributions | | | (1.85 | ) | | | (1.10 | ) | | | (1.82 | ) | | | (0.47 | ) | | | (0.25 | ) |
| | | | | | | | | | | | | | | | | | | | |
Net Asset Value, End of Period | | $ | 21.90 | | | $ | 36.81 | | | $ | 36.09 | | | $ | 33.04 | | | $ | 32.11 | |
| | | | | | | | | | | | | | | | | | | | |
Total Return (%) | | | (37.2 | ) | | | 5.1 | | | | 15.3 | | | | 4.5 | | | | 10.4 | |
Ratio of operating expenses to average net assets (%) | | | 0.43 | | | | 0.43 | | | | 0.45 | | | | 0.44 | | | | 0.45 | |
Ratio of operating expenses to average net assets without giving effect to the contractual expense agreement would have been (%) (b) | | | 0.44 | | | | 0.44 | | | | 0.46 | | | | 0.44 | | | | N/A | |
Ratio of net investment income to average net assets (%) | | | 1.95 | | | | 1.53 | | | | 1.48 | | | | 1.44 | | | | 1.67 | |
Portfolio turnover rate (%) | | | 13 | | | | 12 | | | | 9 | | | | 8 | | | | 3 | |
Net assets, end of period (000) | | $ | 163,945 | | | $ | 280,076 | | | $ | 291,417 | | | $ | 287,568 | | | $ | 293,266 | |
| (a) | Per share amount is based on average shares outstanding during the period. |
| (b) | See Note 4 of the Notes to Financial Statements. |
See accompanying notes to financial statements.
MSF-16
Metropolitan Series Fund, Inc.
MetLife Stock Index Portfolio
Notes to Financial Statements—December 31, 2008
Metropolitan Series Fund, Inc. (the “Fund”) is organized as a corporation under the laws of Maryland pursuant to Articles of Incorporation filed on November 23, 1982, as amended, and registered under the Investment Company Act of 1940, as amended (the “1940 Act”), as an open-end investment company. The Fund is a “series” type of mutual fund, which issues separate series of stock. Each series represents an interest in a separate portfolio of Fund investments. The MetLife Stock Index Portfolio (the “Portfolio”) is a diversified series of the Fund. Shares in the Fund are not offered directly to the general public and are currently available only to separate accounts established by Metropolitan Life Insurance Company (“MetLife”), New England Life Insurance Company, General American Life Insurance Company (“General American”), The MetLife Investors Group of Insurance Companies, MetLife Insurance Company of Connecticut and other affiliated insurance companies (collectively, the “Insurance Companies”) and to certain eligible qualified retirement plans (“Qualified Plans”), as an investment vehicle for variable life insurance, group annuity or variable annuity products of these insurance companies or Qualified Plans, although the Portfolio is not available to all such separate accounts and Qualified Plans. The Portfolio’s shares may be divided into different classes. Currently, the classes being offered by the Portfolio are named Class A, Class B and Class E. The classes of the Portfolio’s shares are identical, except that certain additional charges (Rule 12b-1 fees) are made against Class B and Class E shares. Investment income, realized and unrealized capital gains and losses, the common expenses of the Portfolio and certain Portfolio-level expense reductions, if any, are allocated daily, on a pro rata basis, to each class based on the relative net assets of each class to the total net assets of the Portfolio.
| 2. | SIGNIFICANT ACCOUNTING POLICIES: |
The preparation of financial statements in conformity with accounting principles generally accepted in the United States of America (“GAAP”) requires management to make estimates and assumptions that affect the reported amounts of assets and liabilities and disclosure of contingent assets and liabilities as of the date of the financial statements and the reported amounts of income and expenses during the reporting period. Actual results could differ from those estimates.
The following is a summary of significant accounting policies consistently followed by the Portfolio in the preparation of its financial statements. The policies are in conformity with GAAP.
Investment Valuation:
Debt securities (other than short term obligations with a remaining maturity of sixty days or less) are generally valued on the basis of evaluated or composite bid quotations obtained by independent pricing services and/or brokers and dealers selected by the relevant subadviser pursuant to authorization of the Board of Directors of the Fund (the “Board” or “Directors”). Such quotations take into account appropriate factors such as institutional-sized trading in similar groups of securities, yield, quality, coupon rate, maturity, type of issue, trading characteristics and other data. Short term obligations with a remaining maturity of sixty days or less are valued at amortized cost which approximates fair market value.
Equity securities traded on a national securities exchange or other exchanges are valued at their last sale price on the principal trading market. Equity securities traded on the NASDAQ National Market System are valued at the NASDAQ Official Closing Price (the “NOCP”). The NOCP is the last reported sale price if the last reported sale price falls between the spread of the last reported bid and asked prices. If the last reported bid and asked prices are above the last reported sale price, the NOCP will be the last reported bid price. If the last reported bid and asked prices are below the last reported sale price, the NOCP will be the last reported asked price. Equity securities traded on a national securities exchange or other exchanges or on the NASDAQ National Market System for which there is no reported sale during the day are valued at the last reported bid price. A security that is listed or traded on more than one exchange is valued at the quotation on the exchange determined to be the primary market for that security by the Board or its delegates. If no closing price is available, then such securities are valued by using the last reported bid price. Equity securities traded over-the-counter are valued at the last reported sales price.
If no current market value quotation is readily available or reliable for a portfolio security, fair value will be determined in accordance with procedures established by and under the general supervision of the Board. When the Portfolio uses fair value pricing, it may take into account any factors it deems appropriate. The value of securities used by the Portfolio to calculate its net asset value may differ from quoted or published prices for the same securities. Fair value pricing involves subjective judgments and the fair value determined for a security may be materially different than the value that could be realized upon the sale of that security.
MSF-17
Metropolitan Series Fund, Inc.
MetLife Stock Index Portfolio
Notes to Financial Statements—December 31, 2008—(Continued)
The Portfolio expects to use fair value pricing for securities primarily traded on U.S. exchanges only under very limited circumstances. For example, the Portfolio may use fair value pricing if the exchange on which a security is traded closes early or trading in the security is suspended.
Securities traded primarily on an exchange outside of the United States which closes before the close of the New York Stock Exchange will be valued at the last sales price on that non-U.S. exchange. Securities traded primarily on an exchange outside of the United States for which there is no reported sale during the day are valued at the mean between the last reported bid and asked prices. However, because most foreign markets close well before the Portfolio values its securities (typically at 4 p.m. Eastern Time), the earlier close of these foreign markets gives rise to the possibility that significant events, including broad market moves, may have occurred after these foreign markets close but before the Portfolio values its securities. To account for this, the Portfolio may frequently value many of its foreign equity securities using fair value prices based on third party vendor modeling tools.
Options, whether on securities, indices, futures contracts, or otherwise, are valued at the last sales price available as of the close of business on the day of valuation or, if there is no such sale price available, at the mean between the bid and asked prices. Options on currencies are valued at the spot price each day.
The value of futures contracts will be the sum of the margin deposit plus or minus the difference between the value of the futures contract on each day the net asset value is calculated and the value on the date the futures contract originated, value being that established on a recognized commodity exchange, or by reference to other customary sources, with gain or loss being realized when the futures contract closes or expires.
Subject to the Board’s oversight, the Board has delegated the day-to-day oversight of pricing matters, including determinations in good faith under the Fund’s procedures the fair value of securities for which current market quotations are not readily available to the subadviser of the Portfolio.
Investment Transactions and Related Investment Income:
Portfolio security transactions are recorded on the trade date. Dividend income is recorded on the ex-dividend date or, for certain foreign securities, when notified. Interest income, which includes amortization of premium and accretion of discount on debt securities, is recorded on the accrual basis. Realized gains and losses on investments and unrealized appreciation and depreciation are determined on the identified cost basis, which is the same basis used for federal income tax purposes.
Repurchase Agreements:
The Portfolio, through the custodian or a subcustodian, receives delivery of the underlying securities collateralizing repurchase agreements. The Portfolio requires the custodian to take possession, to have legally segregated in the Federal Reserve Book Entry System, or to have segregated within the custodian’s vault, all securities held as collateral for repurchase agreements. It is the Portfolio’s policy that the market value of the collateral be at least equal to 100% of the repurchase price in the case of a repurchase agreement of one-day duration and 102% on all other repurchase agreements. The Portfolio’s subadviser is responsible for determining that the value of the collateral is at all times at least equal to the repurchase price. In connection with transactions in repurchase agreements, if the seller defaults and the value of the collateral declines or if the seller enters an insolvency proceeding, realization of the collateral by the Portfolio may be delayed, limited or wholly denied.
Futures Contracts:
The Portfolio may buy and sell futures contracts (on recognized exchanges) as a hedge or to enhance return. Futures contracts are agreements to buy or sell a security, or deliver a final cash settlement price in connection with an index, interest rate, currency, or other contracts not calling for physical delivery, for a set price in the future. The Portfolio must post an amount equal to a portion of the total market value of the futures contract as futures variation margin, which is returned when the Portfolio’s obligations under the contract have been satisfied. From time to time thereafter, the Portfolio may have to post variation margin to maintain this amount as the market value of the contract fluctuates. Risks of entering into futures contracts (and related options) include the possibility that there may be an illiquid market and that a change in the value of the contract or option may not correlate with changes in the value of the underlying securities.
Options:
The Portfolio may use options to enhance returns or to hedge against changes in values of securities the Portfolio owns or expects to purchase. Writing puts or buying calls tends to increase the Portfolio’s exposure to the underlying instrument and writing calls
MSF-18
Metropolitan Series Fund, Inc.
MetLife Stock Index Portfolio
Notes to Financial Statements—December 31, 2008—(Continued)
or buying puts tends to decrease the Portfolio’s exposure to the underlying instrument, and can be used to hedge other Portfolio investments. For options purchased to hedge the Portfolio’s investments, the potential risk to the Portfolio is that the change in value of options contracts may not correspond to the change in value of the hedged instruments. In addition, losses may arise from changes in the value of the underlying instruments, if there is an illiquid secondary market, or if the counterparty is unable to perform. The maximum loss for purchased options is limited to the premium initially paid for the option. For options written by the Portfolio, the maximum loss is not limited to the premium initially received for the option.
The main risk associated with purchasing an option is that the option expires without being exercised. In this case, the option expires worthless and the premium paid for the option is considered the loss. The risk associated with writing a call option is that the Portfolio may forgo the opportunity for a profit if the market value of the underlying position increases and the option is exercised. The risk in writing a put option is that the Portfolio may incur a loss if the market value of the underlying position decreases and the option is exercised. In addition, the Portfolio risks not being able to enter into a closing transaction for the written option as the result of an illiquid market.
“When-Issued” Securities:
Purchasing securities “when-issued” is a forward commitment by the Portfolio to buy a security. The estimated amount of the Portfolio’s payment obligation and the security’s interest rate are determined when the commitment is made, even though no interest accrues until the security is issued, which is generally 15 to 120 days later. The Portfolio will segregate liquid assets with its custodian sufficient at all times to satisfy these commitments. If the value of the security is less when delivered than when the commitment was made, the Portfolio will suffer a loss.
Federal Income Taxes:
It is the Portfolio’s policy to comply with the requirements of the Internal Revenue Code of 1986, as amended (the “Code”), and regulations thereunder, applicable to regulated investment companies and to distribute, with respect to each taxable year, all of its taxable income to shareholders. Therefore, no federal income tax provision is required. The Portfolio is subject to the provisions of the Financial Accounting Standards Board Interpretation (“FASB”) No. 48, Accounting for Uncertainties in Income Taxes (FIN 48). FIN 48 sets forth a minimum threshold for financial statement recognition of the benefit of a tax position taken or expected to be taken in a tax return. The implementation of FIN 48 did not result in any unrecognized tax benefits in the accompanying financial statements. Each of the Portfolio’s federal tax returns for the prior three fiscal years remains subject to examination by the Internal Revenue Service.
As of December 31, 2008, the Portfolio had no capital loss carryforwards.
Pursuant to Section 852 of the Code, the Portfolio designated the amount shown below under Long Term Gain as capital gain dividends for its taxable year ended December 31, 2008. The tax character of distributions paid for the periods ended December 31, 2008 and 2007 was as follows:
| | | | | | | | | | | | | | | | | | | | | |
| Ordinary Income | | Long Term Gain | | Return of Capital | | Total |
| 2008 | | 2007 | | 2008 | | 2007 | | 2008 | | 2007 | | 2008 | | 2007 |
| $97,425,310 | | $ | 57,542,999 | | $ | 209,175,238 | | $ | 110,473,357 | | $ | — | | $ | — | | $ | 306,600,548 | | $ | 168,016,356 |
As of December 31, 2008, the components of distributable earnings (accumulated losses) on a federal income tax basis were as follows:
| | | | | | | | | | | | | | |
Undistributed
Ordinary
Income | | Undistributed
Long Term
Gain | | Unrealized
Depreciation | | | Loss
Carryforwards | | Total | |
$100,345,204 | | $ | 78,218,685 | | $ | (1,062,204,657 | ) | | $ | — | | $ | (883,640,768 | ) |
Dividends and Distributions to Shareholders:
The Portfolio records dividends and distributions on the ex-dividend date. Net realized gains from security transactions (if any) are generally distributed annually to shareholders. The timing and characterization of certain income and capital gains distributions are determined in accordance with federal tax regulations that may differ from GAAP. Permanent book and tax basis differences relating to shareholder distributions will result in reclassification between under/over distributed net investment income, accumulated net realized gains/losses and paid in capital.
MSF-19
Metropolitan Series Fund, Inc.
MetLife Stock Index Portfolio
Notes to Financial Statements—December 31, 2008—(Continued)
| 3. | INVESTMENT TRANSACTIONS: |
For the year ended December 31, 2008, purchases and sales of securities (excluding short term investments) for the Portfolio were as follows:
| | | | | | | | | |
Purchases | | Sales |
U.S. Government | | Other | | U.S. Government | | Other |
$0 | | $ | 642,709,712 | | $ | 0 | | $ | 824,875,310 |
| 4. | INVESTMENT MANAGEMENT FEES AND OTHER TRANSACTIONS WITH AFFILIATES: |
Investment Management Agreement:
MetLife Advisers, LLC (“MetLife Advisers”) is the investment adviser to the Portfolio. The Fund has entered into an investment management agreement with MetLife Advisers with respect to the Portfolio. For providing investment management services to the Portfolio, MetLife Advisers receives monthly compensation at the annual rate of 0.25% of average daily net assets. Fees earned by MetLife Advisers with respect to the Portfolio for the year ended December 31, 2008 were $12,427,391.
Certain officers and directors of the Fund may also be officers of MetLife Advisers; however, such officers and directors receive no compensation from the Fund.
MetLife Advisers has entered into an investment subadvisory agreement with MetLife Investment Advisors, LLC (“MLIAC”) with respect to the Portfolio. MetLife Advisers pays MLIAC an investment subadvisory fee for the Portfolio equal to the costs incurred by MLIAC in providing subadvisory services to the Portfolio. Fees earned by MLIAC with respect to the Portfolio for the year ended December 31, 2008 were $1,143,320.
Management Fee Waivers:
Pursuant to an expense agreement, MetLife Advisers has agreed, for the period May 1, 2008 to April 30, 2009, to reduce its advisory fees set out above under “Investment Management Agreement” for each class of the Portfolio at the annual rate of 0.007% of average daily net assets. A similar expense agreement was in place for the period May 1, 2007 through April 30, 2008. Amounts waived for the year ended December 31, 2008 are shown as management fee waivers in the Statement of Operations.
Service and Distribution Fees:
The Fund has adopted a Distribution and Service Plan under Rule 12b-1 of the 1940 Act for the Portfolio’s Class B and E shares. Under the Distribution and Service Plan, the Class B and E shares of the Portfolio pay a fee to compensate the Insurance Companies (or their affiliates) and other broker-dealers and financial intermediaries involved in the offer and sale of Portfolio shares for promoting or selling and servicing the Class B and E shares. The fees under the Distribution and Service Plan for each class of the Portfolio’s shares are calculated as a percentage of the Portfolio’s average daily net assets that are attributable to that Class. Currently, the fee is 0.25% per year for Class B shares and 0.15% per year for Class E shares. Amounts paid by the Portfolio for the year ended December 31, 2008 are shown as Service and Distribution fees in the Statement of Operations.
The Fund has entered into a securities lending arrangement with the Fund’s custodian, State Street Bank and Trust Company (the “custodian”). Under the agreement, the custodian is authorized to loan securities on the Portfolios’ behalf. In exchange, the Portfolio receives either cash or securities as collateral against the loaned securities. The Portfolio receives collateral at least equal to 102% of the market value of the loaned securities (105% for foreign securities), at each loan’s inception. Collateral must be maintained at least at 100% of the market value of the loaned securities for the duration of the loan. The cash collateral is invested in the Navigator Securities Lending Prime Portfolio, an affiliate of the custodian, which invests in a variety of high quality U.S. dollar-denominated instruments. If the market value of the collateral at the close of trading on a business day is less than 100% of the market value of the loaned securities at the close of trading on that day, the borrower shall be required to deliver, by the close of business on the following business day, an additional amount of collateral, equal to at least 100% of the market value of all the loaned securities as of such preceding day. The Portfolio receives 80% of the annual net income from securities lending transactions, which is included in interest income of the Portfolio. The remaining 20% is paid to the custodian as compensation for its securities lending services. Interest income received by the Portfolio via lending transactions during the
MSF-20
Metropolitan Series Fund, Inc.
MetLife Stock Index Portfolio
Notes to Financial Statements—December 31, 2008—(Continued)
year ended December 31, 2008 is footnoted in the Statement of Operations. The Portfolio bears the risk of any deficiency in the amount of collateral available for return to a borrower due to a loss in an approved investment purchased with such collateral. Any outstanding loans by the Portfolio at December 31, 2008 are footnoted in the Schedule of Investments.
| 6. | MARKET AND CREDIT RISK: |
In the normal course of business, the Portfolio invests in securities and enters into transactions where risks exist due to fluctuations in the market (market risk) or failure of the other party to a transaction to perform (credit risk). The value of securities held by the Portfolio may decline in response to certain events, including those directly involving the companies whose securities are owned by the Portfolio; conditions affecting the general economy; overall market changes; local, regional or global political, social or economic instability; and currency and interest rate and price fluctuations. Similar to credit risk, the Portfolio may be exposed to counterparty risk, or the risk that an entity with which the Portfolio has unsettled or open transactions may default. Financial assets, which potentially expose the Portfolio to credit and counterparty risks, consist principally of investments and cash due from counterparties. The extent of the Portfolio’s exposure to credit and counterparty risks in respect to these financial assets approximates their value as recorded in the Portfolio’s Statements of Assets and Liabilities.
| 7. | RECENT ACCOUNTING PRONOUNCEMENTS: |
In March 2008, the FASB issued Statement of Financial Accounting Standards No. 161, Disclosures about Derivative Instruments and Hedging Activities (“FAS 161”), an amendment of FASB Statement No. 133. FAS 161 requires enhanced disclosures about (a) how and why an entity uses derivative instruments, (b) how derivative instruments and hedging activities are accounted for, and (c) how derivative instruments and related hedging activities affect a fund’s financial position, financial performance, and cash flows. Management does not believe the adoption of FAS 161 will materially impact the financial statement amounts, but will require additional disclosures. This will include qualitative and quantitative disclosures on derivative positions existing at period end and the effect of using derivatives during the reporting period. FAS 161 is effective for financial statements issued for fiscal years and interim periods beginning after November 15, 2008. Management is currently evaluating the impact the adoption of FAS 161 will have on the Portfolio’s financial statement disclosures.
MSF-21
Metropolitan Series Fund, Inc.
MetLife Stock Index Portfolio
Report of Independent Registered Public Accounting Firm
To the Shareholders and Board of Directors of Metropolitan Series Fund, Inc.:
We have audited the accompanying statement of assets and liabilities, including the schedule of investments, of the MetLife Stock Index Portfolio (one of the portfolios constituting the Metropolitan Series Fund, Inc.) (the “Fund”) as of December 31, 2008, and the related statement of operations for the year then ended, the statements of changes in net assets for each of the two years in the period then ended, and the financial highlights for each of the five years in the period then ended. These financial statements and financial highlights are the responsibility of the Fund’s management. Our responsibility is to express an opinion on these financial statements and financial highlights based on our audits.
We conducted our audits in accordance with the standards of the Public Company Accounting Oversight Board (United States). Those standards require that we plan and perform the audit to obtain reasonable assurance about whether the financial statements and financial highlights are free of material misstatement. The Fund is not required to have, nor were we engaged to perform, an audit of its internal control over financial reporting. Our audits included consideration of internal control over financial reporting as a basis for designing audit procedures that are appropriate in the circumstances, but not for the purpose of expressing an opinion on the effectiveness of the Fund’s internal control over financial reporting. Accordingly, we express no such opinion. An audit also includes examining, on a test basis, evidence supporting the amounts and disclosures in the financial statements, assessing the accounting principles used and significant estimates made by management, as well as evaluating the overall financial statement presentation. Our procedures included confirmation of securities owned as of December 31, 2008, by correspondence with the custodian and brokers; where replies were not received from brokers, we performed other auditing procedures. We believe that our audits provide a reasonable basis for our opinion.
In our opinion, the financial statements and financial highlights referred to above present fairly, in all material respects, the financial position of the MetLife Stock Index Portfolio of the Metropolitan Series Fund, Inc. as of December 31, 2008, the results of its operations for the year then ended, the changes in its net assets for each of the two years in the period then ended, and the financial highlights for each of the five years in the period then ended, in conformity with accounting principles generally accepted in the United States of America.
Deloitte & Touche LLP
Boston, Massachusetts
February 23, 2009
MSF-22
Metropolitan Series Fund, Inc.
Directors and Officers
The Fund’s Directors review actions of the Fund’s investment adviser and subadvisers, and decide upon matters of general policy. The Fund’s officers supervise the daily business operations of the Fund. The Board of Directors and the Fund’s officers are listed below. Each Director is responsible for overseeing all 38 Portfolios of the Fund. There is no limit to the term a Director may serve. Directors serve until their resignation, retirement or removal in accordance with the Fund’s organizational documents and policies adopted by the Board from time to time. Officers hold office at the pleasure of the Board or until the election or appointment and the qualification of a successor. The address of the Directors and officers is c/o Metropolitan Series Fund, Inc., 501 Boylston Street, Boston, MA 02116.
Interested Directors(1)
Each Director below is an “interested person” (as defined by the 1940 Act) with respect to the Fund in that Ms. Forget is an employee of MetLife and Mr. Typermass is a former employee of MetLife and owns securities issued by MetLife, Inc., the ultimate parent company of MetLife Advisers.
| | | | | | | | |
Name, Address and Age | | Current
position(s)
with Fund | | Position(s)
held since | | Principal occupations
over past five years, including other directorships(2) | | Number of
Portfolios in
Fund Complex
Overseen by
Director(3) |
Elizabeth M. Forget Age: 42 | | Director, Chairman of the Board, President and Chief Executive Officer | | 2006 | | Senior Vice President (since 2007), MetLife, Inc.; President, Met Investors Advisory, LLC; Trustee and President, Met Investors Series Trust; Executive Vice President, MetLife Investors Group, Inc.; President, Chief Executive Officer and Chair of the Board of Managers (since 2006), MetLife Advisers; President, Met Investors Advisory, LLC. | | 87 |
| | | | |
Arthur G. Typermass Age: 71 | | Director | | 1998 | | Formerly, Senior Vice President and Treasurer, MetLife. | | 38 |
Non-Interested Directors(1)
Each Director below is not an “interested person” (as defined by the 1940 Act) with respect to the Fund (collectively, the “Independent Directors”).
| | | | | | | | |
Name, Address and Age | | Current
position(s)
with Fund | | Position(s)
held since | | Principal occupations
over past five years, including other directorships(2) | | Number of
Portfolios in
Fund Complex
Overseen by
Director(3) |
Steve A. Garban† Age: 71 | | Director | | 1985 | | Formerly, Chief Financial Officer, Senior Vice President Finance and Operations and Treasurer (Emeritus), The Pennsylvania State University. | | 38 |
| | | | |
Linda B. Strumpf Age: 61 | | Director | | 2000 | | Vice President and Chief Investment Officer, Ford Foundation. | | 38 |
| | | | |
Michael S. Scott Morton† Age: 71 | | Director | | 1993 | | Jay W. Forrester Professor of Management (Emeritus) at Sloan School of Management, MIT. | | 38 |
| | | | |
H. Jesse Arnelle Age: 75 | | Director | | 2001 | | Formerly, Counsel, Womble Carlyle Sandrie & Rice; Director, Textron Inc. (global multi- industry company)*; formerly, Director, Gannet Co. Inc. (diversified news and information company)*; formerly, Director, Eastman Chemical Company (global chemical company)*; formerly, Director, Waste Management, Inc.*; formerly, Director, Armstrong Holdings Inc. (parent company of floor and ceiling products business)*; formerly, Director, FPL Group Inc. (public utility holding company)*; Director, URS Corporation (engineering design services firm)*. | | 38 |
MSF-23
Metropolitan Series Fund, Inc.
Directors and Officers—(Continued)
| | | | | | | | |
Name, Address and Age | | Current
position(s)
with Fund | | Position(s)
held since | | Principal occupations
over past five years, including other directorships(2) | | Number of
Portfolios in
Fund Complex
Overseen by
Director(3) |
Nancy Hawthorne Age: 57 | | Director | | 2003 | | Chief Executive Officer, Clerestory LLC (corporate financial advisor); Director, Avid Technologies (computer software company)*; formerly, Chairman of the Board of Avid Technologies; formerly, Board of Advisors, L. Knife & Sons, Inc. (beverage distributor); formerly, Trustee, New England Zenith Fund (“Zenith Fund”)**; formerly, Chief Executive Officer and Managing Partner, Hawthorne, Krauss and Associates (corporate financial advisor); formerly, Chief Financial Officer and Executive Vice President, Continental Cablevision, subsequently renamed MediaOne (cable television company); formerly, Director, Life F/X, Inc.; formerly, Chairman of the Board, WorldClinic (distance medicine company); formerly, Director, Perini Corporation (construction company)*; formerly, Director, CGU (property and casualty insurance company); formerly, Director, Beacon Power Corporation (energy company)*. | | 38 |
| | | | |
John T. Ludes Age: 72 | | Director | | 2003 | | President, LFP Properties (consulting firm); Formerly, Trustee, Zenith Fund**; formerly, Vice Chairman, President and Chief Operating Officer, Fortune Brands/American Brands (global conglomerate); formerly, President and CEO, Acushnet Company (athletic equipment company). | | 38 |
Officers(1)
| | | | | | | | |
Name and address | | Age | | Current
position(s)
with Fund | | Position(s)
held since | | Principal occupations over past five years(2) |
| Jeffrey L. Bernier | | 37 | | Senior Vice President | | 2008 | | Vice President (since 2008), MetLife, Inc.; Vice President (since 2008), MetLife; Senior Vice President (since 2008), MetLife Advisers; formerly, Director and Senior Investment Analyst (2004 to 2007), John Hancock Financial Services; formerly, Assistant Vice President (2000 to 2001), Wachovia Securities. |
| | | | |
| Alan C. Leland | | 56 | | Senior Vice President | | 2005 | | Treasurer and Chief Financial Officer, MetLife Advisers, LLC; Treasurer (since 2005), Met Investors Advisory, LLC; Vice President (since 2004), Met Investors Advisory, LLC; Vice President (since 2003), MetLife, Inc.; Vice President, MetLife; Senior Vice President, NELICO. |
| | | | |
| Peter Duffy | | 53 | | Vice President
and Treasurer | | 2000 | | Senior Vice President, MetLife Advisers; Second Vice President (since 2003), NELICO; Vice President, MetLife (since 2004); Vice President (since 2004), MetLife, Inc.; formerly, Vice President and Treasurer, Zenith Fund**. |
| | | | |
| Jeffrey P. Halperin | | 41 | | Chief
Compliance Officer | | 2007 | | Vice President (since 2006), MetLife, Inc.; Vice President (since 2006), MetLife; Chief Compliance Officer (since 2006), Met Investors Series Trust, MetLife Advisers, Met Investors Advisory, LLC and MetLife Investment Advisors Company, LLC. |
| * | Indicates a directorship with a registered investment company or a company subject to the reporting requirements of the Securities Exchange Act of 1934, as amended. |
| ** | The Zenith Fund deregistered with the Securities and Exchange Commission (“SEC”) in 2004. |
| (†) | Served as a trustee, director and/or officer of one or more of the following companies, each of which had a direct or indirect advisory relationship with MetLife Advisers or its affiliates prior to January 31, 2005: State Street Research Financial Trust, State Street Research Income Trust, State Street Research Money Market Trust, State Street Research Institutional Funds, State Street Research Capital Trust, State Street Research Master Investment Trust, State Street Research Equity Trust, State Street Research Securities Trust and State Street Research Exchange Trust (collectively, the “State Street Research Funds”). |
| (1) | During the period shown, each Director of the Fund served as a Trustee of Metropolitan Series Fund II, a registered investment company that ceased investment operations in June of 2008 and has applied for deregistration under the Investment Company Act of 1940. During this period, each officer of the Fund served in the same position with Metropolitan Series Fund II. |
| (2) | Previous positions during the past five years with the Fund; Met Investors Series Trust; MetLife; MetLife, Inc.; MetLife Advisers; Met Investors Advisory, LLC; Zenith Fund; NELICO; or New England Securities Corporation are omitted if not materially different. |
| (3) | The Fund Complex includes the Fund (38 portfolios) and Met Investors Series Trust (49 portfolios). |
MSF-24
Metropolitan Series Fund, Inc.
MetLife Stock Index Portfolio
Board Approval of Advisory and Subadvisory Agreements
The Fund’s Contract Review Committees of the Board of Directors (the “Board” or the “Directors”) typically meet in early fall to review the Portfolios’ advisory agreements (the “Advisory Agreements”) and subadvisory agreements (the “Subadvisory Agreements,” and, together with the Advisory Agreements, the “Agreements”) and determine whether to recommend that the full Board approve the continuation of the Agreements for an additional one-year period. (Following the initial approval of an Agreement for a new Portfolio or with a new adviser or subadviser, such annual reviews are not required until 2 years following the execution of such Agreement.) After each Committee has made its recommendations, the full Board, including the Independent Directors, determines whether to approve the continuation of each of the Agreements. In addition, the Board, including the Independent Directors, considers matters bearing on the Agreements at most of its other meetings throughout the year and regularly interviews various individuals at MetLife Advisers responsible for the management of the Portfolios. The Directors also interview selected investment managers and other professionals at the subadvisers at various times throughout the year.
The Directors receive all materials that they or MetLife Advisers, the Fund’s investment adviser, and the subadvisers believe to be reasonably necessary for the Directors to evaluate the Agreements and determine whether to approve the continuation of the Agreements. These materials generally include, among other items, (i) information on the investment performance of the Portfolios and the performance of peer groups of funds and the Portfolios’ performance benchmarks, (ii) information on the Portfolios’ advisory and subadvisory fees and other expenses, including information comparing the Portfolios’ expenses to those of peer groups of funds and information about any applicable expense caps and fee “breakpoints,” (iii) sales and redemption data, (iv) information related to the profitability of the Agreements to MetLife Advisers and certain of the subadvisers, and potential “fall-out” or ancillary benefits that MetLife Advisers, the subadvisers or their affiliates may receive as a result of their relationships with the Fund and (v) information obtained through the subadvisers’ responses to certain requests from MetLife Advisers and the Directors and MetLife Advisers’ responses to requests from the Directors. The Directors may also consider other information such as (vi) MetLife Advisers’ and the subadvisers’ financial results and condition, (vii) each Portfolio’s investment objectives and strategies and the size, education and experience of the investment staffs of MetLife Advisers and the relevant subadvisers and their use of technology and external research, (viii) the allocation of the Portfolios’ brokerage, if any, including allocations to brokers affiliated with the subadvisers and the use of “soft” commission dollars to pay Portfolio expenses and to pay for research and other similar services, (ix) the resources devoted to, and the record of compliance with, the Portfolios’ investment policies and restrictions, policies on personal securities transactions and other compliance policies, (x) the responses of MetLife Advisers, the subadvisers and/or their affiliates to certain legal and regulatory proceedings and (xi) the economic outlook generally and for the mutual fund industry in particular. Throughout the process, the Directors have the opportunity to ask questions of and request additional materials from MetLife Advisers and the subadvisers.
Following meetings of each Contract Review Committee on September 10, 2008, the Board, including the Independent Directors, at its November 6-7, 2008 meeting, approved the continuation through December 31, 2009 of the Advisory Agreements for each Portfolio of the Fund and the Subadvisory Agreements for each Portfolio other than the Zenith Equity Portfolio and Asset Allocation Portfolios (which do not have subadvisers) and the Van Eck Global Natural Resources Portfolio, Met/Dimensional International Small Cap Portfolio and Loomis Sayles Small Cap Growth Portfolio (formerly known as the Franklin Templeton Small Cap Growth Portfolio). The Agreements approved for continuation are referred to below as the “Continued Agreements.”
In considering whether to approve the continuation of the Continued Agreements, the Directors, including the Independent Directors, did not identify any single factor as determinative, and each weighed the various factors as he or she deemed appropriate. The Directors considered the following matters in connection with their approval of the Continued Agreements:
The nature, extent and quality of the services provided to the relevant Portfolios under the Continued Agreements. The Directors considered the nature, extent and quality of the services provided by MetLife Advisers, the relevant subadvisers (if any) and their affiliates (each, an “Adviser,” and, collectively, the “Advisers”) to the relevant Portfolios pursuant to the Continued Agreements and the resources dedicated to these Portfolios by the Advisers. In particular, the Directors considered the Advisers’ abilities to attract and retain highly qualified investment professionals. With respect to MetLife Advisers, the Directors considered (for each Portfolio other than the Zenith Equity and Asset Allocation Portfolios) that MetLife Advisers is (i) ultimately responsible for the performance of such Portfolios; (ii) ultimately responsible for the establishment of the investment strategies of each such Portfolio, primarily through its recommendations to the Board regarding the hiring and selection of subadvisers; (iii) responsible for the hiring and selection, subject to Board approval, of subadvisers; and (iv) responsible for maintaining a program of Subadviser oversight reasonably designed to ensure that the subadvisers have reasonable compliance policies and procedures in place. The Directors also considered that MetLife Advisers provides a full range of day-to-day administrative services for the Portfolios involving all aspects of such Portfolios’ day-to-day operations (other than portfolio management). With respect to the Zenith Equity and Asset Allocation Portfolios, the Directors considered both the portfolio management services and the administrative services provided by MetLife Advisers. After reviewing
MSF-25
Metropolitan Series Fund, Inc.
MetLife Stock Index Portfolio
Board Approval of Advisory and Subadvisory Agreements—(Continued)
these and related factors, the Directors concluded, within the context of their overall conclusions regarding each of the Continued Agreements, that the nature, extent and quality of services provided supported the renewal of these Agreements.
Investment performance of the relevant Portfolios. The Directors reviewed information about the performance of the relevant Portfolios over various time periods, including information prepared by an independent third party that compared the performance of the Portfolios to the performance of peer groups of funds and performance benchmarks. The Directors also reviewed a description of the third party’s methodology for identifying a Portfolio’s peer group(s) for purposes of performance and expense comparisons.
In the case of each relevant Portfolio that had performance that lagged its peer group(s) for certain periods, the Directors concluded that other factors relevant to performance were sufficient, in light of other considerations, to warrant renewal of the Continued Agreements relating to such Portfolio. These factors varied from Portfolio to Portfolio, but included one or more of the following: (i) that such Portfolio’s performance, although lagging in certain recent periods, was stronger over the longer term; (ii) that the underperformance was attributable, to a significant extent, to investment decisions that were reasonable and consistent with the Portfolio’s investment objective(s) and policies and that the Portfolio was performing within the range of reasonable expectations, given market conditions and the Portfolio’s investment objective(s) and policies; (iii) that the Portfolio’s performance was competitive when compared to other relevant performance benchmarks or peer groups; and (iv) that MetLife Advisers and/or the relevant subadviser (if any) had taken or was taking steps designed to help improve the Portfolio’s investment performance (including, in the case of certain Portfolios, that MetLife Advisers was formulating possible proposals, for presentation to the Board in November 2008, to replace the Portfolio’s subadviser or to merge the Portfolio into another Portfolio with a similar investment objective and better investment performance).
The Directors also considered the investment performance of the Advisers and their reputations generally, the historical responsiveness of the Advisers to Director concerns about performance and the willingness of the Advisers to take steps intended to improve performance.
After reviewing these and related factors, the Directors concluded, within the context of their overall conclusions regarding each of the Continued Agreements, that the investment performance of each relevant Portfolio and Adviser was sufficient, in light of other considerations, to warrant the renewal of the Continued Agreements.
The costs of the services to be provided and profits to be realized by the Advisers and their affiliates from their relationships with the Portfolios. The Directors considered the fees charged by MetLife Advisers to the Portfolios for advisory services and, with respect to the subadvised Portfolios, by such subadvisers to MetLife Advisers for subadvisory services (such advisory and subadvisory fees (if any), collectively, “Fees”), as well as the total expense levels of the Portfolios. This information included comparisons (provided by an independent third party) of the Portfolios’ advisory fees and total expense levels to those of their peer groups. In evaluating Fees for the relevant Portfolios, the Directors also took into account the demands, complexity and quality of the investment management services provided to each Portfolio. The Directors considered MetLife Advisers’ recommendations regarding reductions in Fee rates, implementation of Fee breakpoints and institution of Fee waivers and expense caps.
The Directors also considered the compensation directly or indirectly received by the Advisers and their affiliates from their relationships with the relevant Portfolios. The Directors reviewed information relating to the profits received by MetLife Advisers, certain of the subadvisers and their affiliates as a result of their relationships with the relevant Portfolios, and information about the allocation of expenses used to calculate profitability. When reviewing profitability, the Directors also considered the performance of the relevant Portfolios, the expense levels of such Portfolios and whether the relevant Advisers had implemented breakpoints, fee waivers and/or expense caps with respect to such Portfolios.
After reviewing these and related factors, the Directors concluded, within the context of their overall conclusions regarding each of the Continued Agreements, that the Fees charged to each of the relevant Portfolios were fair and reasonable, and that the information provided regarding costs of these services generally, and the related profitability (if known) to the relevant Advisers of their relationships with the relevant Portfolios, supported the renewal of the Continued Agreements.
Economies of Scale. The Directors considered the existence of any economies of scale in the provision of services by the Advisers and whether those economies were shared with the relevant Portfolios through breakpoints in their advisory fees or other means, such as expense caps, fee waivers or relatively low levels of fees. The Directors noted that most of the relevant Portfolios benefited or will benefit from breakpoints, expense caps and/or fee waivers with respect to their advisory fees. In considering these issues, the Directors also took into consideration information relating to the costs of the services provided and the profitability to MetLife Advisers, the relevant subadvisers (if any) and each of their affiliates of their relationships with the relevant Portfolios, as discussed above.
MSF-26
Metropolitan Series Fund, Inc.
MetLife Stock Index Portfolio
Board Approval of Advisory and Subadvisory Agreements—(Continued)
After reviewing these and related factors, the Directors concluded, within the context of their overall conclusions regarding each of the Continued Agreements, that the extent to which economies of scale were shared with the relevant Portfolios supported the renewal of such Agreements.
Other Factors. The Directors also considered other factors, which included but were not limited to the following:
| | • | | the extent to which each relevant Portfolio operated in accordance with its investment objective, and its record of compliance with its investment restrictions and the compliance programs of the Fund and the Advisers. They also considered the compliance-related resources the Advisers and their affiliates provide to the relevant Portfolios; |
| | • | | the nature, quality, cost and extent of administrative and shareholder services performed by MetLife Advisers and its affiliates under the Advisory Agreements; and |
| | • | | so-called “fall-out benefits” to the Advisers, such as the engagement of their affiliates to provide distribution, brokerage and transfer agency services to the Portfolios, and the benefits of research made available to the relevant Advisers by reason of brokerage commissions generated by the relevant Portfolios’ securities transactions. The Directors also considered the possible conflicts of interest associated with these fall-out and other benefits, and the reporting and other processes in place to disclose and monitor these possible conflicts of interest. |
Based on their evaluation of all factors that they deemed to be material, including those factors described above, and assisted by the advice of independent counsel, the Directors, including the Independent Directors, concluded that each of the Continued Agreements should be continued through December 31, 2009.
MSF-27
A description of the policies and procedures that the Fund uses to determine how to vote proxies relating to portfolio securities is available (i) without charge, upon request, by calling (800) 638-7732 and (ii) on the Securities and Exchange Commission’s (the “SEC”) website at http://www.sec.gov.
Information regarding how the Fund voted proxies relating to portfolio securities during the most recent twelve-month period ended December 31, 2008 is available (i) without charge, upon request, by calling (800) 638-7732 and (ii) on the SEC’s website at http://www.sec.gov.
The Fund’s Statement of Additional Information includes additional information about the Directors of the Fund and is available (i) without charge, upon request, by calling (800) 638-7732 and (ii) on the SEC’s website at http://www.sec.gov.
The Fund files with the SEC a complete schedule of its portfolio holdings, as of the close of the first and third quarters of its fiscal year, on “Form N-Q”. These filings are available on the SEC’s website at www.sec.gov and may be reviewed and copied at the SEC’s Public Reference Room in Washington, DC. (Call 1-800-SEC-0330 for information on the operation of the Public Reference Room.)
MSF-28
Simplify your life…
with MetLife eDelivery® while helping MetLife preserve the planet’s natural resources.
(see details on inside cover)
| | |
Metropolitan Series Fund, Inc. MFS® Total Return Portfolio Annual Report | | December 31, 2008 |
NOT PART OF THE ANNUAL REPORT
Letter from the President
February 1, 2009
Letter to Policy Holders:
2008 was an extraordinary year in the capital markets around the world and for the global economy. Energy prices rose to record levels early in the year before falling by two-thirds by year-end. A credit crisis that began with concerns about sub-prime mortgages led to massive changes in the financial landscape with government takeovers, forced sales, and outright failures of a number of large, once venerable firms.
While bonds as measured by the Barclays Capital U.S. Aggregate Bond Index (formerly known as, Lehman Brothers U.S. Aggregate Bond Index) were up 5.2% for the year in response to declining interest rates, there were large differences in the total returns of the various sectors of the bond market. U.S. treasury securities were up over 13% as frightened investors sought refuge in what they perceived to be the safest and most liquid investments. In contrast, investment grade corporate securities lost nearly 5% as credit spreads widened and below investment grade or high yield bonds fell over 26%.
In response to the growing credit crisis and the weakening economy, common stocks fell sharply across all regions, styles, and capitalizations. As measured by the Standard and Poor’s 500, U.S. common stocks fell 37% for the year, the worst calendar year decline since the 1930s. Foreign stocks were down even more with the MSCI EAFE Index down 43% for the year.
On the following pages, you will find a complete review of your Portfolio and its investment performance.
MetLife is committed to building your financial freedom. We appreciate your trust and will continue to focus our efforts on meeting your investment needs.
Sincerely,
Elizabeth M. Forget
President, Metropolitan Series Fund, Inc.
Metropolitan Series Fund, Inc.
MFS Total Return Portfolio
Managed by Massachusetts Financial Services Company
Portfolio Manager Commentary*
PORTFOLIO PERFORMANCE
For the twelve-month period ended December 31, 2008, the Class A shares of the MFS Total Return Portfolio returned -22.2%, compared to its benchmark, a blend of the Standard & Poor’s 500 Index1 (60%) and the Barclays Capital U.S. Aggregate Bond Index2 (40%), which returned -20.1%. The average return of its peer group, the Lipper Variable Insurance Products3 Mixed-Asset Target Allocation Moderate Funds Universe, was -25.1% over the same period.
PORTFOLIO REVIEW
The U.S. economy and financial markets experienced significant deterioration and extraordinary volatility over the reporting period. U.S. economic growth slowed significantly, despite the short-term bounce from the second quarter fiscal stimulus. Strong domestic headwinds included accelerated deterioration in the housing market, anemic corporate investment, a markedly weaker job market, and a much tighter credit environment. During the second half of the period, a seemingly continuous series of tumultuous financial events hammered markets, including: the distressed sale of failing Bear Stearns to JPMorgan, the conservatorship of Government Sponsored Enterprises (GSEs) Fannie Mae and Freddie Mac, the bankruptcy of investment bank Lehman Brothers, the Federal Reserve Bank’s complex intervention of insurance company American International Group (AIG), the nationalization of several large European banks, the failure of Washington Mutual, and the distressed sale of Wachovia. As a result of this barrage of turbulent news, global equity markets pushed significantly lower and credit markets witnessed the worst dislocation since the beginning of the credit crisis.
While reasonably resilient during the first half of the period, the global economy and financial system increasingly experienced considerable negative spillovers from the U.S. slowdown. Not only did Europe and Japan show obvious signs of economic softening, the more powerful engine of global growth—emerging markets—also began to display weakening dynamics.
During the reporting period, the U.S. Federal Reserve Board cut interest rates aggressively and introduced a multitude of new lending facilities to alleviate ever-tightening credit markets, while the U.S. federal government moved quickly to design and implement a meaningful fiscal stimulus package. Although several other global central banks also cut rates, the dilemma of rising energy and food prices heightened concerns among central bankers that inflationary expectations might become unhinged despite weaker growth. Only late in the reporting period did slowing global growth result in a precipitous decline in commodity prices, which began to ease inflation and inflationary expectations. As inflationary concerns diminished in the face of global deleveraging, and equity and credit markets deteriorated more sharply, a coordinated rate cut marked the beginning of much more aggressive easing by the major global central banks.
Within the equity portion of the Portfolio, a combination of an underweighted position and stock selection in the health care sector hurt relative performance. Underweighting pharmaceutical company Pfizer held back relative returns as the company’s stock outperformed the benchmark.
Stock selection in the leisure and retailing sectors also had a negative impact on relative results. In the leisure sector, holdings of cruise line operator Royal Caribbean Cruises dampened relative returns. Not owning fast-food company McDonald’s also hurt as the company’s stock significantly outperformed the benchmark. In the retailing sector, an underweighted position in strong-performing discount retailer Wal-Mart Stores hurt.
Stocks in other sectors that were among the top detractors included insurance company Genworth Financial and electronics services provider Flextronics (Singapore). Positioning in financial services companies Hartford Financial Services, Wells Fargo and our ownership of Bear Stearns, which was eventually acquired by JPMorgan Chase, had a negative impact. Not owning alcoholic beverage company Anheuser Busch further weakened relative returns as the company’s stock performed considerably stronger than the benchmark.
Within the fixed income portion of the Portfolio, our exposure to bonds in the financial sector and to commercial mortgage-backed securities (CMBS) held back relative performance as these securities suffered from the turmoil in the subprime market. The Portfolio’s greater exposure to “BBB” rated securities, which suffered as credit spreads widened over the reporting period, was an additional negative factor.
Within the equity portion of the portfolio, a combination of an underweighted position and stock selection in the technology sector was the primary contributor to performance relative to the S&P 500 Index. Not owning computer and electronics maker Apple boosted relative results as the company underperformed the benchmark.
Stock selection in the industrial goods and services sector also bolstered relative returns. Underweighting poor-performing industrial conglomerate General Electric helped while the Portfolio’s overweight position in defense contractor Lockheed Martin strengthened relative performance as this company generated better returns than the benchmark.
Elsewhere, the Portfolio’s positioning in poor-performing insurance company American International Group (AIG) and diversified financial services company Citigroupaided results. Holdings of pharmaceutical company Wyeth, tobacco company Philip Morris International, global food company Nestle (Switzerland), and integrated oil company TOTAL (France) were among the top relative contributors. Not owning oil field services company Schlumberger (Austria) also had a positive effect on relative performance.
Within the fixed income portion of the Portfolio, holdings of U.S. Treasury securities, and an underweighted exposure to weak-performing U.S. Agency securities, aided returns relative to the Barclays Capital U.S. Aggregate Bond Index. The Portfolio generated a higher level of income over the reporting period which also benefited relative results. Additionally, the Portfolio’s greater exposure to corporate bonds with shorter maturity helped as longer term corporate spreads widened.
* The views expressed above are those of the subadvisory firm as of December 31, 2008 and are subject to change based on market and other conditions. Information about the Portfolio’s holdings, asset allocation, industry allocation, or country diversification is historical and is not an indication of future Portfolio composition, which will vary. The performance of any index mentioned in this commentary has not been adjusted for ongoing management, distribution and operating expenses, and sales charges applicable to mutual fund investments. Direct investment in any index is not possible.
1 The Standard & Poor’s (S&P) 500® Composite Stock Price Index is an unmanaged index representing the performance of 500 major companies, most of which are listed on the New York Stock Exchange.
2 Barclays Capital U.S. Aggregate Bond Index (formerly, Lehman Brothers U.S. Aggregate Bond any index) includes most obligations of the U.S. Treasury, agencies and quasi-federal corporations, most publicly issued investment grade corporate bonds and most bonds backed by mortgage pools of GNMA, FNMA and FHLMC. The index itself remains unchanged since Barclays assumed responsibility for the index from Lehman.
3 The Lipper Variable Products Fund Average is an average of the total return performance (calculated on the basis of net asset value) of variable product funds with similar investment objectives to those of the subject Portfolio as calculated by Lipper Analytical Services, an independent mutual fund ranking service.
MSF-2
Metropolitan Series Fund, Inc.
MFS Total Return Portfolio
A $10,000 INVESTMENT COMPARED TO THE
S&P 500 INDEX AND THE BARCLAYS CAPITAL U.S. AGGREGATE BOND INDEX
Average Annual Returns as of December 31, 2008
| | | | | | | | | | | | | | | | | | |
| | | MFS Total Return Portfolio | | | Barclays Capital U.S.
Aggregate Bond Index | | | S&P 500
Index | |
| | | Class A | | | Class B | | | Class E | | | Class F | | | |
| 1 Year | | -22.2 | % | | -22.3 | % | | -22.3 | % | | -22.3 | % | | 5.2 | % | | -37.0 | % |
| 5 Year | | 0.9 | | | 0.7 | | | — | | | — | | | 4.7 | | | -2.2 | |
| 10 Year | | 1.7 | | | — | | | — | | | — | | | 5.6 | | | -1.4 | |
| Since Inception | | — | | | 1.6 | | | 0.3 | | | -4.9 | | | — | | | — | |
Performance numbers are net of all Portfolio expenses but do not include any insurance, sales, or administrative charges of variable annuity or life insurance contracts or any additional expenses that participants in certain eligible qualified plans may bear relating to the operations of their plans. If these charges were included, the returns would be lower.
Inception dates of the Class A, Class B, Class E and Class F shares are: 5/1/87, 5/1/02, 4/26/04 and 5/2/06, respectively.
This information represents past performance and is not indicative of future results. Investment return and principal value may fluctuate so that shares, upon redemption, may be worth more or less than the original cost.
PORTFOLIO COMPOSITION
as of December 31, 2008
Top Holdings
| | | |
| | | % of Total
Net Assets | |
Federal National Mortgage Association | | 11.9 | % |
U.S. Treasury Notes | | 6.7 | % |
Federal Home Loan Mortgage Corp. | | 5.3 | % |
Exxon Mobil Corp. | | 2.5 | % |
U.S. Treasury Bonds | | 2.3 | % |
AT&T, Inc. | | 2.1 | % |
Lockheed Martin Corp. | | 2.1 | % |
Philip Morris International, Inc. | | 2.1 | % |
JPMorgan Chase & Co. | | 1.7 | % |
Total S.A. (ADR) | | 1.6 | % |
Top Equity Sectors
| | |
| | | % of Equity
Market Value |
Financial Services | | 16.8% |
Energy | | 15.5% |
Utilities & Communications | | 12.8% |
Consumer Staples | | 12.0% |
Industrial Goods & Services | | 9.7% |
|
| Top Fixed Income Sectors |
| | | % of Fixed Income
Market Value |
Mortgage-Backed | | 40.9% |
Domestic Governments | | 21.9% |
Financial Services | | 5.8% |
Agency Issues | | 5.3% |
Commercial Mortgage-Backed | | 4.8% |
MSF-3
Metropolitan Series Fund, Inc.
Shareholder Expense Example
As a shareholder of the Portfolio, you incur ongoing costs, including management fees; distribution and service (12b-1) fees; and other Portfolio expenses. This example is intended to help you understand your ongoing costs (in dollars) (referred to as “expenses”) of investing in the Portfolio and compare these costs with the ongoing costs of investing in other mutual funds. The example is based on an investment of $1,000 invested at the beginning of the period and held for the entire period, July 1, 2008 through December 31, 2008.
Actual Expenses
The first line for each share class of the Portfolio in the table below provides information about actual account values and actual expenses. You may use the information in this line, together with the amount you invested in the particular share class of the Portfolio, to estimate the expenses that you paid over the period. Simply divide your account value by $1,000 (for example, an $8,600 account value divided by $1,000=8.6), then multiply the result by the number in the first line under the heading entitled “Expenses Paid During Period” to estimate the expenses you paid on your account during this period.
Hypothetical Example for Comparison Purposes
The second line for each share class of the Portfolio in the table below provides information about hypothetical account values and hypothetical expenses based on the Portfolio’s actual expense ratio and an assumed rate of return of 5% per year before expenses, which is not the Portfolio’s actual return. The hypothetical account values and expenses may not be used to estimate the actual ending account balance or expenses you paid for the period. You may use this information to compare the ongoing costs of investing in the Portfolio and other funds. To do so, compare this 5% hypothetical example with the 5% hypothetical examples that appear in the shareholder reports of the other funds.
Please note that the expenses shown in the table are meant to highlight your ongoing costs only and do not reflect any fees or charges of your variable insurance product or any additional expenses that participants in certain eligible qualified plans may bear relating to the operations of their plan. Therefore, the second line for each share class in the table is useful in comparing ongoing costs only, and will not help you determine the relative total costs of owning different funds. In addition, if these other costs were included, your costs would have been higher.
| | | | | | | | | | | | | | |
Portfolio | | | | Annualized
Expense
Ratio | | | Beginning
Account Value
July 1,
2008 | | Ending
Account Value
December 31,
2008 | | Expenses Paid
During Period*
July 1, 2008
to
December 31,
2008 |
MFS Total Return—Class A | | Actual | | 0.56 | % | | $ | 1,000.00 | | $ | 835.20 | | $ | 2.58 |
| | Hypothetical | | 0.56 | % | | $ | 1,000.00 | | $ | 1,022.29 | | $ | 2.85 |
| | | | | |
MFS Total Return—Class B | | Actual | | 0.81 | % | | $ | 1,000.00 | | $ | 834.14 | | $ | 3.73 |
| | Hypothetical | | 0.81 | % | | $ | 1,000.00 | | $ | 1,021.02 | | $ | 4.11 |
| | | | | |
MFS Total Return—Class E | | Actual | | 0.71 | % | | $ | 1,000.00 | | $ | 834.57 | | $ | 3.27 |
| | Hypothetical | | 0.71 | % | | $ | 1,000.00 | | $ | 1,021.53 | | $ | 3.61 |
| | | | | |
MFS Total Return—Class F | | Actual | | 0.76 | % | | $ | 1,000.00 | | $ | 834.30 | | $ | 3.50 |
| | Hypothetical | | 0.76 | % | | $ | 1,000.00 | | $ | 1,021.27 | | $ | 3.86 |
* Expenses paid are equal to the Portfolio’s annualized expense ratio for the most recent six month period, as shown above, multiplied by the average account value over the period, multiplied by the number of days in the most recent fiscal half-year, divided by 366 (to reflect the the one-half year period).
MSF-4
Metropolitan Series Fund, Inc.
MFS Total Return Portfolio
Schedule of Investments as of December 31, 2008
Common Stock—58.7% of Total Net Assets
| | | | | |
| Security Description | | Shares | | Value* |
| | | | | |
| | |
Aerospace & Defense—4.2% | | | | | |
Lockheed Martin Corp. | | 289,289 | | $ | 24,323,419 |
Northrop Grumman Corp. | | 255,766 | | | 11,519,701 |
United Technologies Corp. (a) | | 238,750 | | | 12,797,000 |
| | | | | |
| | | | | 48,640,120 |
| | | | | |
| | |
Air Freight & Logistics—0.2% | | | | | |
United Parcel Service, Inc. (Class B) (a) | | 31,660 | | | 1,746,366 |
| | | | | |
| | |
Auto Components—0.4% | | | | | |
Johnson Controls, Inc. | | 229,190 | | | 4,162,090 |
| | | | | |
| | |
Beverages—2.0% | | | | | |
Diageo, Plc. (GBP) | | 512,726 | | | 7,132,289 |
Heineken NV (EUR) | | 47,700 | | | 1,465,515 |
Molson Coors Brewing Co. (a) | | 40,280 | | | 1,970,498 |
Pepsi Bottling Group, Inc. | | 10,200 | | | 229,602 |
PepsiCo, Inc. | | 174,755 | | | 9,571,331 |
The Coca-Cola Co. | | 70,030 | | | 3,170,258 |
| | | | | |
| | | | | 23,539,493 |
| | | | | |
| | |
Biotechnology—0.2% | | | | | |
Genzyme Corp. (b) | | 39,460 | | | 2,618,960 |
| | | | | |
| | |
Capital Markets—3.8% | | | | | |
Franklin Resources, Inc. | | 52,420 | | | 3,343,348 |
Invesco, Ltd. | | 82,070 | | | 1,185,091 |
Merrill Lynch & Co., Inc. | | 211,606 | | | 2,463,094 |
State Street Corp. | | 215,460 | | | 8,474,042 |
The Bank of New York Mellon Corp. | | 615,450 | | | 17,435,698 |
The Goldman Sachs Group, Inc. | | 137,240 | | | 11,581,683 |
| | | | | |
| | | | | 44,482,956 |
| | | | | |
| | |
Chemicals—1.3% | | | | | |
Air Products & Chemicals, Inc. (a) | | 99,324 | | | 4,993,017 |
PPG Industries, Inc. | | 249,860 | | | 10,601,560 |
| | | | | |
| | | | | 15,594,577 |
| | | | | |
| | |
Commercial Banks—1.2% | | | | | |
PNC Financial Services Group, Inc. | | 144,580 | | | 7,084,420 |
SunTrust Banks, Inc. (a) | | 24,704 | | | 729,756 |
Wells Fargo & Co. | | 198,500 | | | 5,851,780 |
| | | | | |
| | | | | 13,665,956 |
| | | | | |
| | |
Communications Equipment—0.2% | | | | | |
Nokia OYJ (ADR) | | 122,040 | | | 1,903,824 |
| | | | | |
| | |
Computers & Peripherals—1.2% | | | | | |
Hewlett-Packard Co. | | 91,230 | | | 3,310,737 |
International Business Machines Corp. | | 131,460 | | | 11,063,673 |
| | | | | |
| | | | | 14,374,410 |
| | | | | |
| | | | | |
| Security Description | | Shares | | Value* |
| | | | | |
| | |
Diversified Financial Services—2.3% | | | | | |
Bank of America Corp. | | 539,064 | | $ | 7,590,021 |
JPMorgan Chase & Co. | | 625,500 | | | 19,722,015 |
| | | | | |
| | | | | 27,312,036 |
| | | | | |
|
Diversified Telecommunication Services—2.8% |
AT&T, Inc. | | 864,344 | | | 24,633,804 |
Embarq Corp. | | 166,146 | | | 5,974,610 |
Verizon Communications, Inc. | | 44,867 | | | 1,520,992 |
| | | | | |
| | | | | 32,129,406 |
| | | | | |
| | |
Electric Utilities—1.9% | | | | | |
Allegheny Energy, Inc. | | 71,310 | | | 2,414,557 |
American Electric Power Co., Inc. (a) | | 91,270 | | | 3,037,466 |
Entergy Corp. | | 41,608 | | | 3,458,873 |
FPL Group, Inc. | | 168,060 | | | 8,458,460 |
PPL Corp. | | 170,266 | | | 5,225,463 |
| | | | | |
| | | | | 22,594,819 |
| | | | | |
|
Electronic Equipment, Instruments & Components—0.2% |
Agilent Technologies, Inc. (b) | | 108,420 | | | 1,694,605 |
| | | | | |
| | |
Energy Equipment & Services—0.3% | | | | | |
Halliburton Co. | | 48,470 | | | 881,184 |
National Oilwell Varco, Inc. (b) | | 65,370 | | | 1,597,643 |
Noble Corp. (a) | | 39,840 | | | 880,066 |
| | | | | |
| | | | | 3,358,893 |
| | | | | |
| | |
Food & Staples Retailing—1.8% | | | | | |
CVS Caremark Corp. | | 364,593 | | | 10,478,403 |
The Kroger Co. | | 168,030 | | | 4,437,672 |
Wal-Mart Stores, Inc. | | 59,540 | | | 3,337,812 |
Walgreen Co. (a) | | 133,370 | | | 3,290,238 |
| | | | | |
| | | | | 21,544,125 |
| | | | | |
| | |
Food Products—1.8% | | | | | |
General Mills, Inc. | | 30,440 | | | 1,849,230 |
Groupe Danone (EUR) (a) | | 32,699 | | | 1,973,547 |
Kellogg Co. | | 61,540 | | | 2,698,529 |
Nestle S.A. (CHF) | | 311,966 | | | 12,295,384 |
The J. M. Smucker Co. | | 58,606 | | | 2,541,156 |
| | | | | |
| | | | | 21,357,846 |
| | | | | |
| | |
Health Care Equipment & Supplies—0.2% | | | | | |
Zimmer Holdings, Inc. (b) | | 50,660 | | | 2,047,677 |
| | | | | |
| | |
Health Care Providers & Services—0.5% | | | | | |
UnitedHealth Group, Inc. | | 78,080 | | | 2,076,928 |
WellPoint, Inc. (b) | | 78,110 | | | 3,290,774 |
| | | | | |
| | | | | 5,367,702 |
| | | | | |
*See accompanying notes to financial statements.
MSF-5
Metropolitan Series Fund, Inc.
MFS Total Return Portfolio
Schedule of Investments as of December 31, 2008
Common Stock—(Continued)
| | | | | |
| Security Description | | Shares | | Value* |
| | | | | |
| | |
Hotels, Restaurants & Leisure—0.2% | | | | | |
Royal Caribbean Cruises, Ltd. (a) (b) | | 187,220 | | $ | 2,574,275 |
| | | | | |
| | |
Household Products—0.9% | | | | | |
Clorox Co. | | 66,040 | | | 3,669,182 |
Colgate-Palmolive Co. | | 26,900 | | | 1,843,726 |
Procter & Gamble Co. | | 86,312 | | | 5,335,808 |
| | | | | |
| | | | | 10,848,716 |
| | | | | |
|
Independent Power Producers & Energy Traders—0.3% |
NRG Energy, Inc. (a) (b) | | 139,220 | | | 3,248,003 |
| | | | | |
| | |
Industrial Conglomerates—0.7% | | | | | |
3M Co. (a) | | 125,900 | | | 7,244,286 |
General Electric Co. | | 70,965 | | | 1,149,633 |
| | | | | |
| | | | | 8,393,919 |
| | | | | |
| | |
Insurance—2.6% | | | | | |
AON Corp. | | 29,800 | | | 1,361,264 |
Genworth Financial, Inc. (Class A) (b) | | 160,460 | | | 454,102 |
Prudential Financial, Inc. | | 47,570 | | | 1,439,468 |
The Allstate Corp. | | 499,856 | | | 16,375,283 |
The Chubb Corp. | | 55,610 | | | 2,836,110 |
The Travelers Cos., Inc. | | 172,330 | | | 7,789,316 |
| | | | | |
| | | | | 30,255,543 |
| | | | | |
| | |
Internet Software & Services—0.0% | | | | | |
Google, Inc. (Class A) (b) | | 1,560 | | | 479,934 |
| | | | | |
| | |
IT Services—1.4% | | | | | |
Accenture, Ltd. (Class A) | | 208,299 | | | 6,830,124 |
Automatic Data Processing, Inc. (a) | | 90,580 | | | 3,563,417 |
The Western Union Co. (a) | | 179,110 | | | 2,568,438 |
Visa, Inc. | | 62,440 | | | 3,274,978 |
| | | | | |
| | | | | 16,236,957 |
| | | | | |
| | |
Leisure Equipment & Products—0.2% | | | | | |
Hasbro, Inc. (a) | | 85,620 | | | 2,497,535 |
| | | | | |
| | |
Life Sciences Tools & Services—0.2% | | | | | |
Waters Corp. (b) | | 67,740 | | | 2,482,671 |
| | | | | |
| | |
Machinery—1.0% | | | | | |
Danaher Corp. (a) | | 104,190 | | | 5,898,196 |
Eaton Corp. (a) | | 111,090 | | | 5,522,284 |
| | | | | |
| | | | | 11,420,480 |
| | | | | |
| | |
Media—1.6% | | | | | |
Omnicom Group, Inc. | | 258,400 | | | 6,956,128 |
The Walt Disney Co. | | 318,290 | | | 7,222,000 |
Time Warner Cable, Inc. (Class A) (a) (b) | | 134,270 | | | 2,880,091 |
WPP, Plc. (GBP) | | 320,043 | | | 1,865,608 |
| | | | | |
| | | | | 18,923,827 |
| | | | | |
| | | | | |
| Security Description | | Shares | | Value* |
| | | | | |
| | |
Multi-Utilities—1.7% | | | | | |
CMS Energy Corp. (a) | | 70,710 | | $ | 714,878 |
Dominion Resources, Inc. (a) | | 154,582 | | | 5,540,219 |
PG&E Corp. | | 123,540 | | | 4,782,233 |
Public Service Enterprise Group, Inc. | | 209,150 | | | 6,100,906 |
Sempra Energy | | 67,680 | | | 2,885,198 |
| | | | | |
| | | | | 20,023,434 |
| | | | | |
| | |
Multiline Retail—0.6% | | | | | |
Macy’s, Inc. (a) | | 524,740 | | | 5,431,059 |
Target Corp. | | 40,500 | | | 1,398,465 |
| | | | | |
| | | | | 6,829,524 |
| | | | | |
| | |
Oil, Gas & Consumable Fuels—9.2% | | | | | |
Anadarko Petroleum Corp. | | 83,260 | | | 3,209,673 |
Apache Corp. | | 162,110 | | | 12,082,058 |
Chevron Corp. | | 170,546 | | | 12,615,288 |
ConocoPhillips | | 58,040 | | | 3,006,472 |
Devon Energy Corp. | | 132,110 | | | 8,680,948 |
EOG Resources, Inc. | | 47,660 | | | 3,173,203 |
Exxon Mobil Corp. | | 366,764 | | | 29,278,770 |
Hess Corp. | | 136,870 | | | 7,341,707 |
Marathon Oil Corp. | | 158,360 | | | 4,332,729 |
Occidental Petroleum Corp. | | 31,700 | | | 1,901,683 |
The Williams Cos., Inc. (a) | | 172,390 | | | 2,496,207 |
Total S.A. (ADR) | | 328,150 | | | 18,146,695 |
Ultra Petroleum Corp. (b) | | 22,960 | | | 792,350 |
| | | | | |
| | | | | 107,057,783 |
| | | | | |
| | |
Pharmaceuticals—4.2% | | | | | |
Abbott Laboratories | | 44,218 | | | 2,359,915 |
GlaxoSmithKline, Plc. (GBP) | | 100,130 | | | 1,858,853 |
Johnson & Johnson | | 207,208 | | | 12,397,255 |
Merck & Co., Inc. (a) | | 442,273 | | | 13,445,099 |
Merck KGaA (EUR) (a) | | 24,940 | | | 2,267,483 |
Pfizer, Inc. | | 50,750 | | | 898,783 |
Roche Holding AG (CHF) | | 9,710 | | | 1,494,696 |
Wyeth | | 372,320 | | | 13,965,723 |
| | | | | |
| | | | | 48,687,807 |
| | | | | |
| | |
Road & Rail—0.1% | | | | | |
Burlington Northern Santa Fe Corp. (a) | | 8,255 | | | 624,986 |
| | | | | |
|
Semiconductors & Semiconductor Equipment—0.9% |
Intel Corp. (a) | | 751,050 | | | 11,010,393 |
| | | | | |
| | |
Software—1.4% | | | | | |
Oracle Corp. (a) (b) | | 941,770 | | | 16,697,582 |
| | | | | |
| | |
Specialty Retail—0.7% | | | | | |
O’Reilly Automotive, Inc. (a) (b) | | 23,970 | | | 736,838 |
Staples, Inc. (a) | | 220,840 | | | 3,957,453 |
The Sherwin-Williams Co. (a) | | 58,160 | | | 3,475,060 |
| | | | | |
| | | | | 8,169,351 |
| | | | | |
*See accompanying notes to financial statements.
MSF-6
Metropolitan Series Fund, Inc.
MFS Total Return Portfolio
Schedule of Investments as of December 31, 2008
Common Stock—(Continued)
| | | | | | |
Security Description | | Shares | | Value* |
| | | | | | |
|
Textiles, Apparel & Luxury Goods—0.7% |
Nike, Inc. (a) | | | 170,060 | | $ | 8,673,060 |
| | | | | | |
| | |
Thrifts & Mortgage Finance—0.1% | | | | | | |
New York Community Bancorp, Inc. (a) | | | 64,550 | | | 772,018 |
| | | | | | |
| | |
Tobacco—2.3% | | | | | | |
Altria Group, Inc. | | | 82,266 | | | 1,238,926 |
Lorillard, Inc. | | | 75,930 | | | 4,278,655 |
Philip Morris International, Inc. | | | 502,090 | | | 21,845,936 |
| | | | | | |
| | | | | | 27,363,517 |
| | | | | | |
|
Trading Companies & Distributors—0.5% |
W.W. Grainger, Inc. (a) | | | 76,650 | | | 6,043,086 |
| | | | | | |
|
Wireless Telecommunication Services—0.7% |
América Movil S.A.B. de C.V. (ADR) | | | 9,550 | | | 295,955 |
Rogers Communications, Inc. (CAD) | | | 123,030 | | | 3,646,551 |
Vodafone Group, Plc. (GBP) | | | 2,316,910 | | | 4,664,203 |
| | | | | | |
| | | | | | 8,606,709 |
| | | | | | |
Total Common Stock
(Identified Cost $837,116,169) | | | | | | 686,056,971 |
| | | | | | |
| | |
| Fixed Income—40.7% | | | | | | |
| Security Description | | Face
Amount | | Value* |
| | | | | | |
| | |
Aerospace & Defense—0.1% | | | | | | |
BAE Systems Holdings, Inc. (144A)
5.200%, 08/15/15 | | $ | 1,718,000 | | | 1,598,084 |
| | | | | | |
| | |
Asset Backed—0.6% | | | | | | |
Bayview Financial Revolving Mortgage Loan Trust (144A)
1.271%, 12/28/40 (c) | | | 1,510,000 | | | 936,200 |
Capital Trust Re CDO, Ltd. (144A)
5.160%, 06/25/35 (f) | | | 1,600,000 | | | 880,000 |
Connecticut RRB Special Purpose Trust CL&P
6.210%, 12/30/11 (c) | | | 300,000 | | | 306,452 |
Countrywide Asset-Backed Certificates
4.575%, 07/25/35 | | | 2,496 | | | 2,414 |
4.823%, 08/25/35 | | | 30,592 | | | 29,607 |
5.689%, 10/25/36 | | | 930,000 | | | 524,139 |
GMAC Mortgage Corp. Loan Trust
5.805%, 10/25/36 (c) | | | 1,077,000 | | | 370,216 |
Residential Funding Mortgage Securities II, Inc.
5.320%, 12/25/35 | | | 1,190,000 | | | 402,187 |
Small Business Administration Participation Certificates
4.350%, 07/01/23 (c) | | | 1,378,075 | | | 1,365,858 |
4.770%, 04/01/24 | | | 69,757 | | | 70,315 |
4.950%, 03/01/25 (c) | | | 433,977 | | | 440,642 |
4.990%, 09/01/24 (c) | | | 234,204 | | | 238,464 |
| | | | | | |
| Security Description | | Face
Amount | | Value* |
| | | | | | |
| | |
Asset Backed—(Continued) | | | | | | |
Small Business Administration Participation Certificates
5.110%, 08/01/25 (c) | | $ | 601,760 | | $ | 615,136 |
5.180%, 05/01/24 (c) | | | 112,935 | | | 115,994 |
5.520%, 06/01/24 (c) | | | 390,602 | | | 407,193 |
Structured Asset Securities Corp.
4.670%, 03/25/35 | | | 379,390 | | | 301,950 |
| | | | | | |
| | | | | | 7,006,767 |
| | | | | | |
| | |
Beverages—0.3% | | | | | | |
Dr. Pepper Snapple Group, Inc. (144A)
6.120%, 05/01/13 | | | 430,000 | | | 423,566 |
6.820%, 05/01/18 | | | 533,000 | | | 525,726 |
Miller Brewing Co. (144A)
5.500%, 08/15/13 | | | 2,921,000 | | | 2,723,496 |
| | | | | | |
| | | | | | 3,672,788 |
| | | | | | |
| | |
Capital Markets—0.5% | | | | | | |
Lehman Brothers Holdings, Inc.
6.500%, 07/19/17 (d) | | | 1,540,000 | | | 154 |
Merrill Lynch & Co., Inc.
6.110%, 01/29/37 | | | 1,270,000 | | | 1,141,635 |
6.150%, 04/25/13 | | | 1,160,000 | | | 1,149,431 |
Morgan Stanley
5.750%, 10/18/16 | | | 1,156,000 | | | 971,355 |
6.750%, 04/15/11 | | | 1,180,000 | | | 1,161,033 |
The Goldman Sachs Group, Inc.
5.625%, 01/15/17 | | | 1,493,000 | | | 1,282,602 |
| | | | | | |
| | | | | | 5,706,210 |
| | | | | | |
| | |
Chemicals—0.1% | | | | | | |
PPG Industries, Inc.
5.750%, 03/15/13 | | | 1,511,000 | | | 1,495,656 |
| | | | | | |
|
Collateralized-Mortgage Obligation—0.1% |
BlackRock Capital Finance, L.P. (144A)
7.750%, 09/25/26 | | | 95,769 | | | 15,323 |
RAAC Series
4.971%, 09/25/34 | | | 752,000 | | | 541,459 |
| | | | | | |
| | | | | | 556,782 |
| | | | | | |
|
Commercial & Professional Services—0.3% |
The Western Union Co.
5.400%, 11/17/11 | | | 2,140,000 | | | 2,056,923 |
Waste Management, Inc.
7.375%, 08/01/10 | | | 1,061,000 | | | 1,075,205 |
| | | | | | |
| | | | | | 3,132,128 |
| | | | | | |
| | |
Commercial Banks—0.5% | | | | | | |
Bank One Corp.
8.000%, 04/29/27 | | | 100,000 | | | 107,204 |
BNP Paribas (144A)
7.195%, 12/31/49 (c) | | | 500,000 | | | 317,857 |
Nordea Bank AB (144A)
5.424%, 12/29/49 (c) | | | 359,000 | | | 164,177 |
*See accompanying notes to financial statements.
MSF-7
Metropolitan Series Fund, Inc.
MFS Total Return Portfolio
Schedule of Investments as of December 31, 2008
Fixed Income—(Continued)
| | | | | | |
| Security Description | | Face
Amount | | Value* |
| | | | | | |
| | |
Commercial Banks—(Continued) | | | | | | |
Royal Bank of Scotland Group, Plc. (144A)
6.990%, 10/29/49 (c) | | $ | 360,000 | | $ | 168,313 |
U.S. Bancorp
7.500%, 06/01/26 | | | 400,000 | | | 414,300 |
Wachovia Corp.
5.250%, 08/01/14 | | | 3,334,000 | | | 3,105,668 |
WOORI Bank (144A)
6.125%, 05/03/16 (c) | | | 2,620,000 | | | 1,885,352 |
| | | | | | |
| | | | | | 6,162,871 |
| | | | | | |
| |
Commercial Mortgage-Backed Securities—2.0% | | | |
Bear Stearns Commercial Mortgage Securities
4.680%, 08/13/39 | | | 150,000 | | | 135,685 |
Chase Commercial Mortgage Securities Corp.
7.543%, 07/15/32 | | | 12,405 | | | 12,370 |
Citigroup Commercial Mortgage Trust
5.700%, 12/10/49 (c) | | | 3,630,000 | | | 2,736,225 |
Credit Suisse Mortgage Capital Certificates
5.695%, 09/15/40 (c) | | | 1,735,738 | | | 1,148,071 |
GE Capital Commercial Mortgage Corp.
5.338%, 03/10/44 (c) | | | 1,000,000 | | | 506,655 |
General Electric Capital Assurance Co. (144A)
5.743%, 05/12/35 | | | 35,000 | | | 28,264 |
Greenwich Capital Commercial Funding Corp.
4.305%, 08/10/42 | | | 326,852 | | | 309,289 |
4.915%, 01/05/36 (c) | | | 500,000 | | | 436,949 |
5.317%, 06/10/36 (c) | | | 1,341,434 | | | 1,115,997 |
5.475%, 02/10/17 | | | 3,025,000 | | | 1,532,957 |
JPMorgan Chase Commercial Mortgage Securities Corp.
5.208%, 05/15/41 (c) | | | 1,292,933 | | | 1,091,649 |
5.475%, 04/15/43 (c) | | | 2,260,000 | | | 1,757,774 |
5.552%, 05/12/45 | | | 949,000 | | | 732,704 |
5.819%, 06/15/49 (c) | | | 1,900,000 | | | 1,341,829 |
5.875%, 04/15/45 (c) | | | 2,260,000 | | | 1,802,930 |
Merrill Lynch Mortgage Trust
5.829%, 07/12/17 (c) | | | 929,000 | | | 162,890 |
Merrill Lynch/Countrywide Commercial Mortgage Trust
5.473%, 02/12/39 (c) | | | 560,000 | | | 287,543 |
5.749%, 06/12/50 (c) | | | 1,735,738 | | | 1,232,256 |
Morgan Stanley Capital I
5.150%, 06/13/41 | | | 250,000 | | | 222,084 |
Morgan Stanley Capital I (144A)
0.814%, 11/15/30 (c) (e) | | | 6,760,720 | | | 113,648 |
Multi-Family Capital Access One, Inc.
6.650%, 01/15/24 | | | 107,496 | | | 107,343 |
Spirit Master Funding, LLC (144A)
5.050%, 07/20/23 | | | 1,263,090 | | | 935,786 |
Wachovia Bank Commercial Mortgage Trust
4.847%, 10/15/41 | | | 2,245,000 | | | 1,803,127 |
5.795%, 07/15/45 (c) | | | 609,448 | | | 307,378 |
| | | | | | |
| Security Description | | Face
Amount | | Value* |
| | | | | | |
|
Commercial Mortgage-Backed Securities—(Continued) |
Wachovia Bank Commercial Mortgage Trust
5.903%, 02/15/51 (c) | | $ | 3,000,000 | | $ | 2,168,025 |
5.957%, 06/15/45 (c) | | | 1,530,000 | | | 793,577 |
| | | | | | |
| | | | | | 22,823,005 |
| | | | | | |
| | |
Construction & Engineering—0.1% | | | | | | |
CRH America, Inc.
6.950%, 03/15/12 | | | 1,409,000 | | | 1,134,096 |
| | | | | | |
| | |
Consumer Finance—0.2% | | | | | | |
American Express Co.
5.500%, 09/12/16 | | | 1,997,000 | | | 1,832,369 |
Capital One Financial Corp.
6.150%, 09/01/16 | | | 1,330,000 | | | 935,917 |
| | | | | | |
| | | | | | 2,768,286 |
| | | | | | |
| | |
Diversified Financial Services—2.1% | | | | | | |
Bank of America Corp.
5.490%, 03/15/19 | | | 696,000 | | | 599,422 |
Citigroup, Inc.
5.000%, 09/15/14 | | | 1,105,000 | | | 971,938 |
DBS Capital Funding Corp. (144A)
7.657%, 03/31/49 (c) | | | 1,190,000 | | | 1,187,539 |
Deutsche Telekom International Finance BV
5.750%, 03/23/16 | | | 1,003,000 | | | 960,110 |
Diageo Finance BV
5.500%, 04/01/13 | | | 2,140,000 | | | 2,127,656 |
EDP Finance BV (144A)
6.000%, 02/02/18 | | | 1,061,000 | | | 880,785 |
Enel Finance International S.A. (144A)
6.250%, 09/15/17 (a) | | | 1,494,000 | | | 1,261,619 |
General Electric Capital Corp.
5.450%, 01/15/13 (a) | | | 572,000 | | | 576,096 |
GG1C Funding Corp. (144A)
5.129%, 01/15/14 | | | 604,544 | | | 574,063 |
GlaxoSmithKline Capital, Inc.
4.850%, 05/15/13 (a) | | | 546,000 | | | 547,669 |
HSBC Finance Corp.
5.250%, 01/14/11 (a) | | | 1,300,000 | | | 1,260,371 |
JET Equipment Trust (144A)
11.440%, 11/01/14 (d) (f) (g) | | | 300,000 | | | 0 |
MidAmerican Funding, LLC
6.927%, 03/01/29 | | | 699,000 | | | 638,722 |
MUFG Capital Finance I, Ltd.
6.346%, 07/29/49 (c) | | | 1,711,000 | | | 1,192,093 |
Natixis (144A)
10.000%, 04/29/49 (c) | | | 1,749,000 | | | 931,547 |
ORIX Corp.
5.480%, 11/22/11 | | | 2,170,000 | | | 1,630,271 |
PNC Funding Corp.
5.625%, 02/01/17 | | | 1,080,000 | | | 1,048,969 |
Spectra Energy Capital, LLC
8.000%, 10/01/19 | | | 1,253,000 | | | 1,300,295 |
Telecom Italia Capital S.A.
5.250%, 11/15/13 | | | 753,000 | | | 574,163 |
*See accompanying notes to financial statements.
MSF-8
Metropolitan Series Fund, Inc.
MFS Total Return Portfolio
Schedule of Investments as of December 31, 2008
Fixed Income—(Continued)
| | | | | | |
| Security Description | | Face
Amount | | Value* |
| | | | | | |
|
Diversified Financial Services—(Continued) |
UBS Preferred Funding Trust V
6.243%, 05/12/49 (c) | | $ | 2,180,000 | | $ | 1,190,550 |
UFJ Finance Aruba AEC
6.750%, 07/15/13 | | | 1,320,000 | | | 1,290,165 |
Unicredit Luxembourg Finance S.A. (144A)
6.000%, 10/31/17 | | | 1,520,000 | | | 1,267,399 |
UniCredito Italiano Capital Trust II (144A)
9.200%, 10/05/49 (c) | | | 1,412,000 | | | 540,206 |
W3A Funding Corp.
8.090%, 01/02/17 | | | 677,028 | | | 670,555 |
ZFS Finance USA Trust I (144A)
5.875%, 05/09/32 (c) | | | 500,000 | | | 174,690 |
6.500%, 05/09/37 (c) | | | 1,950,000 | | | 799,500 |
| | | | | | |
| | | | | | 24,196,393 |
| | | | | | |
|
Diversified Telecommunication Services—0.4% |
France Telecom S.A.
7.750%, 03/01/11 (c) | | | 346,000 | | | 364,097 |
Telefonica Europe BV
7.750%, 09/15/10 | | | 650,000 | | | 659,985 |
Verizon New York, Inc.
6.875%, 04/01/12 | | | 3,102,000 | | | 3,086,338 |
| | | | | | |
| | | | | | 4,110,420 |
| | | | | | |
|
Electric Utilities—1.1% |
Bruce Mansfield Unit
6.850%, 06/01/34 | | | 2,390,000 | | | 1,905,354 |
Exelon Generation Co., LLC
6.950%, 06/15/11 | | | 2,478,000 | | | 2,405,392 |
FirstEnergy Corp.
6.450%, 11/15/11 | | | 2,426,000 | | | 2,293,191 |
Hydro-Quebec
6.300%, 05/11/11 | | | 1,600,000 | | | 1,699,018 |
MidAmerican Energy Holdings Co.
5.875%, 10/01/12 | | | 768,000 | | | 766,089 |
Oncor Electric Delivery Co.
7.000%, 09/01/22 | | | 1,825,000 | | | 1,705,295 |
PPL Energy Supply, LLC
6.400%, 11/01/11 | | | 100,000 | | | 98,359 |
PSEG Power, LLC
5.500%, 12/01/15 | | | 977,000 | | | 873,115 |
6.950%, 06/01/12 | | | 1,000,000 | | | 986,670 |
United Energy Distribution Holdings, Ltd. (144A)
5.450%, 04/15/16 | | | 50,000 | | | 56,830 |
| | | | | | |
| | | | | | 12,789,313 |
| | | | | | |
|
Electronic Equipment, Instruments & Components—0.1% |
Tyco Electronics Group S.A.
6.550%, 10/01/17 | | | 1,385,000 | | | 1,163,957 |
| | | | | | |
|
Energy Equipment & Services—0.1% |
Kinder Morgan Energy Partners, L.P.
6.750%, 03/15/11 | | | 1,202,000 | | | 1,169,115 |
7.750%, 03/15/32 | | | 625,000 | | | 547,704 |
| | | | | | |
| | | | | | 1,716,819 |
| | | | | | |
| | | | | | |
| Security Description | | Face
Amount | | Value* |
| | | | | | |
|
Federal Agencies—18.3% |
Federal Home Loan Mortgage Corp.
4.125%, 11/18/09 | | $ | 3,100,000 | | $ | 3,184,044 |
4.500%, 05/01/18 | | | 383,055 | | | 394,119 |
4.500%, 08/01/18 | | | 597,384 | | | 614,639 |
4.500%, 11/01/18 | | | 559,631 | | | 575,795 |
4.500%, 01/01/19 | | | 1,014,605 | | | 1,043,911 |
4.500%, 08/01/19 | | | 57,445 | | | 58,960 |
4.500%, 02/01/20 | | | 399,732 | | | 410,278 |
4.500%, 04/01/35 | | | 1,207,064 | | | 1,225,510 |
5.000%, 12/01/17 | | | 23,857 | | | 24,703 |
5.000%, 05/01/18 | | | 246,073 | | | 254,472 |
5.000%, 06/01/18 | | | 36,381 | | | 37,557 |
5.000%, 09/01/18 | | | 556,058 | | | 574,031 |
5.000%, 12/01/18 | | | 79,821 | | | 82,401 |
5.000%, 02/01/19 | | | 651,298 | | | 671,128 |
5.000%, 05/01/19 | | | 477,868 | | | 493,091 |
5.000%, 06/01/19 | | | 275,537 | | | 283,926 |
5.000%, 09/01/33 | | | 2,306,739 | | | 2,363,064 |
5.000%, 11/01/33 | | | 1,307,501 | | | 1,339,427 |
5.000%, 03/01/34 | | | 385,797 | | | 394,916 |
5.000%, 04/01/34 | | | 422,026 | | | 432,002 |
5.000%, 08/01/35 | | | 1,280,426 | | | 1,310,291 |
5.000%, 10/01/35 | | | 4,016,043 | | | 4,109,713 |
5.000%, 11/01/35 | | | 419,947 | | | 429,741 |
5.500%, 08/23/17 (a) | | | 7,900,000 | | | 9,316,604 |
5.500%, 01/01/19 | | | 116,174 | | | 120,021 |
5.500%, 04/01/19 | | | 69,932 | | | 72,335 |
5.500%, 06/01/19 | | | 50,120 | | | 51,780 |
5.500%, 07/01/19 | | | 179,571 | | | 185,518 |
5.500%, 08/01/19 | | | 56,036 | | | 57,892 |
5.500%, 12/01/19 | | | 97,814 | | | 101,053 |
5.500%, 02/01/20 | | | 26,323 | | | 27,170 |
5.500%, 10/01/24 | | | 521,263 | | | 536,092 |
5.500%, 06/01/25 | | | 1,077,418 | | | 1,107,459 |
5.500%, 07/01/25 | | | 483,024 | | | 496,491 |
5.500%, 08/01/25 | | | 742,206 | | | 762,900 |
5.500%, 05/01/33 | | | 2,611,916 | | | 2,680,182 |
5.500%, 12/01/33 | | | 1,800,705 | | | 1,847,769 |
5.500%, 01/01/34 | | | 1,768,254 | | | 1,814,470 |
5.500%, 04/01/34 | | | 277,268 | | | 284,342 |
5.500%, 11/01/34 | | | 222,315 | | | 227,987 |
5.500%, 12/01/34 | | | 341,501 | | | 350,213 |
5.500%, 05/01/35 | | | 138,023 | | | 141,458 |
5.500%, 09/01/35 | | | 390,035 | | | 399,741 |
5.500%, 10/01/35 | | | 614,904 | | | 630,207 |
6.000%, 04/01/16 | | | 91,292 | | | 94,665 |
6.000%, 04/01/17 | | | 162,604 | | | 168,614 |
6.000%, 07/01/17 | | | 84,247 | | | 87,361 |
6.000%, 10/01/17 | | | 117,530 | | | 121,875 |
6.000%, 08/01/19 | | | 804,562 | | | 834,326 |
6.000%, 09/01/19 | | | 223,362 | | | 231,625 |
6.000%, 11/01/19 | | | 132,944 | | | 137,860 |
6.000%, 05/01/21 | | | 425,154 | | | 440,894 |
6.000%, 10/01/21 | | | 358,544 | | | 371,818 |
6.000%, 02/01/23 | | | 750,140 | | | 776,759 |
6.000%, 12/01/25 | | | 307,765 | | | 317,886 |
*See accompanying notes to financial statements.
MSF-9
Metropolitan Series Fund, Inc.
MFS Total Return Portfolio
Schedule of Investments as of December 31, 2008
Fixed Income—(Continued)
| | | | | | |
| Security Description | | Face
Amount | | Value* |
| | | | | | |
|
Federal Agencies—(Continued) |
Federal Home Loan Mortgage Corp.
6.000%, 02/01/26 | | $ | 317,790 | | $ | 328,241 |
6.000%, 04/01/34 | | | 179,438 | | | 185,249 |
6.000%, 07/01/34 | | | 658,631 | | | 679,961 |
6.000%, 08/01/34 | | | 3,757,080 | | | 3,878,758 |
6.000%, 09/01/34 | | | 81,573 | | | 84,215 |
6.000%, 07/01/35 | | | 357,290 | | | 368,526 |
6.000%, 08/01/35 | | | 435,931 | | | 449,640 |
6.000%, 11/01/35 | | | 1,071,899 | | | 1,105,609 |
6.000%, 03/01/36 | | | 487,640 | | | 502,899 |
6.000%, 10/01/36 | | | 775,719 | | | 800,842 |
6.000%, 01/01/37 | | | 250,897 | | | 258,749 |
6.000%, 03/01/37 | | | 663,114 | | | 683,827 |
6.000%, 05/01/37 | | | 1,684,884 | | | 1,737,513 |
6.000%, 06/01/37 | | | 1,275,387 | | | 1,315,225 |
6.500%, 05/01/34 | | | 141,228 | | | 147,011 |
6.500%, 06/01/34 | | | 186,610 | | | 194,248 |
6.500%, 08/01/34 | | | 803,842 | | | 836,750 |
6.500%, 10/01/34 | | | 697,677 | | | 727,982 |
6.500%, 11/01/34 | | | 404,815 | | | 421,387 |
6.500%, 05/01/37 | | | 410,922 | | | 427,272 |
6.500%, 07/01/37 | | | 1,712,601 | | | 1,780,741 |
Federal National Mortgage Association
3.000%, 07/12/10 | | | 787,000 | | | 811,142 |
4.010%, 08/01/13 (c) | | | 146,350 | | | 144,660 |
4.021%, 08/01/13 (c) | | | 583,021 | | | 577,479 |
4.500%, 04/01/18 | | | 428,293 | | | 440,530 |
4.500%, 06/01/18 | | | 988,253 | | | 1,016,489 |
4.500%, 07/01/18 | | | 1,217,798 | | | 1,252,592 |
4.500%, 03/01/19 | | | 641,055 | | | 657,768 |
4.500%, 06/01/19 | | | 2,345,231 | | | 2,406,374 |
4.500%, 04/01/20 | | | 538,884 | | | 552,933 |
4.500%, 07/01/20 | | | 291,491 | | | 299,091 |
4.500%, 11/01/20 | | | 288,075 | | | 295,226 |
4.500%, 08/01/33 | | | 2,014,089 | | | 2,047,504 |
4.500%, 02/01/35 | | | 500,672 | | | 508,665 |
4.500%, 09/01/35 | | | 686,112 | | | 696,638 |
4.589%, 05/01/14 (c) | | | 834,349 | | | 841,854 |
4.630%, 04/01/14 | | | 363,538 | | | 366,986 |
4.700%, 03/01/15 | | | 609,473 | | | 615,650 |
4.751%, 04/01/13 (c) | | | 78,053 | | | 79,339 |
4.840%, 08/01/14 (c) | | | 891,927 | | | 909,418 |
4.845%, 06/01/13 | | | 91,458 | | | 93,209 |
4.872%, 02/01/14 (c) | | | 651,801 | | | 664,380 |
4.880%, 03/01/20 | | | 442,093 | | | 451,280 |
4.921%, 04/01/15 (c) | | | 2,076,669 | | | 2,122,388 |
4.940%, 08/01/15 | | | 50,000 | | | 50,345 |
5.000%, 11/01/17 | | | 652,210 | | | 675,329 |
5.000%, 02/01/18 | | | 2,622,238 | | | 2,715,110 |
5.000%, 12/01/18 | | | 1,688,026 | | | 1,742,585 |
5.000%, 06/01/19 | | | 366,757 | | | 377,923 |
5.000%, 07/01/19 | | | 913,988 | | | 941,816 |
5.000%, 11/01/19 | | | 177,291 | | | 182,689 |
5.000%, 07/01/20 | | | 958,992 | | | 986,991 |
5.000%, 08/01/20 | | | 217,127 | | | 223,466 |
5.000%, 11/01/33 | | | 1,217,202 | | | 1,245,972 |
| | | | | | |
| Security Description | | Face
Amount | | Value* |
| | | | | | |
|
Federal Agencies—(Continued) |
Federal National Mortgage Association
5.000%, 03/01/34 | | $ | 1,345,830 | | $ | 1,377,410 |
5.000%, 04/01/34 | | | 382,637 | | | 391,442 |
5.000%, 05/01/34 | | | 429,873 | | | 439,765 |
5.000%, 08/01/34 | | | 467,098 | | | 477,846 |
5.000%, 09/01/34 | | | 1,631,485 | | | 1,669,027 |
5.000%, 12/01/34 | | | 249,052 | | | 254,783 |
5.000%, 01/01/35 | | | 473,754 | | | 484,655 |
5.000%, 06/01/35 | | | 1,996,998 | | | 2,041,703 |
5.000%, 07/01/35 | | | 5,619,402 | | | 5,745,200 |
5.000%, 08/01/35 | | | 1,027,390 | | | 1,050,390 |
5.000%, 08/01/36 | | | 497,678 | | | 508,820 |
5.370%, 02/01/13 (c) | | | 381,256 | | | 390,213 |
5.370%, 05/01/18 | | | 630,000 | | | 608,098 |
5.466%, 11/01/15 (c) | | | 430,254 | | | 451,890 |
5.500%, 11/01/17 | | | 1,015,721 | | | 1,051,580 |
5.500%, 12/01/17 | | | 184,462 | | | 190,975 |
5.500%, 01/01/18 | | | 665,997 | | | 689,509 |
5.500%, 02/01/18 | | | 593,554 | | | 614,138 |
5.500%, 06/01/19 | | | 746,693 | | | 771,654 |
5.500%, 07/01/19 | | | 628,709 | | | 649,725 |
5.500%, 08/01/19 | | | 184,909 | | | 191,090 |
5.500%, 09/01/19 | | | 643,664 | | | 665,180 |
5.500%, 01/01/21 | | | 292,408 | | | 301,909 |
5.500%, 03/01/21 | | | 81,633 | | | 84,221 |
5.500%, 02/01/33 | | | 612,786 | | | 629,663 |
5.500%, 04/01/33 | | | 231,448 | | | 237,823 |
5.500%, 05/01/33 | | | 52,373 | | | 53,816 |
5.500%, 06/01/33 | | | 1,922,885 | | | 1,975,846 |
5.500%, 07/01/33 | | | 2,496,202 | | | 2,564,954 |
5.500%, 11/01/33 | | | 1,906,728 | | | 1,959,244 |
5.500%, 12/01/33 | | | 279,187 | | | 286,876 |
5.500%, 01/01/34 (c) | | | 438,557 | | | 450,636 |
5.500%, 01/01/34 | | | 700,434 | | | 719,726 |
5.500%, 02/01/34 | | | 1,621,665 | | | 1,666,096 |
5.500%, 03/01/34 | | | 192,172 | | | 197,407 |
5.500%, 04/01/34 | | | 516,951 | | | 530,866 |
5.500%, 05/01/34 | | | 2,158,048 | | | 2,216,137 |
5.500%, 06/01/34 | | | 2,730,149 | | | 2,803,637 |
5.500%, 07/01/34 | | | 1,505,381 | | | 1,545,904 |
5.500%, 08/01/34 | | | 1,099,378 | | | 1,128,971 |
5.500%, 09/01/34 | | | 5,297,009 | | | 5,439,593 |
5.500%, 10/01/34 | | | 4,829,116 | | | 4,959,104 |
5.500%, 11/01/34 | | | 6,217,630 | | | 6,384,993 |
5.500%, 12/01/34 | | | 2,797,839 | | | 2,873,150 |
5.500%, 01/01/35 | | | 2,140,783 | | | 2,198,407 |
5.500%, 02/01/35 | | | 328,228 | | | 337,063 |
5.500%, 04/01/35 | | | 491,565 | | | 504,489 |
5.500%, 07/01/35 | | | 473,584 | | | 486,036 |
5.500%, 08/01/35 | | | 591,437 | | | 606,987 |
5.500%, 09/01/35 (c) | | | 1,449,503 | | | 1,487,614 |
6.000%, 05/15/11 (a) | | | 1,473,000 | | | 1,628,082 |
6.000%, 07/01/16 | | | 329,087 | | | 342,865 |
6.000%, 01/01/17 | | | 502,533 | | | 523,258 |
6.000%, 02/01/17 (c) | | | 395,005 | | | 411,543 |
6.000%, 07/01/17 | | | 614,707 | | | 640,442 |
*See accompanying notes to financial statements.
MSF-10
Metropolitan Series Fund, Inc.
MFS Total Return Portfolio
Schedule of Investments as of December 31, 2008
Fixed Income—(Continued)
| | | | | | |
| Security Description | | Face
Amount | | Value* |
| | | | | | |
|
Federal Agencies—(Continued) |
Federal National Mortgage Association
6.000%, 08/01/17 | | $ | 67,038 | | $ | 69,803 |
6.000%, 09/01/17 | | | 342,534 | | | 356,660 |
6.000%, 03/01/18 | | | 55,198 | | | 57,475 |
6.000%, 11/01/18 | | | 331,207 | | | 345,073 |
6.000%, 01/01/21 | | | 332,065 | | | 344,981 |
6.000%, 02/01/21 | | | 356,140 | | | 369,992 |
6.000%, 05/01/21 | | | 189,912 | | | 197,299 |
6.000%, 11/01/25 | | | 152,705 | | | 157,579 |
6.000%, 02/01/32 | | | 1,445,556 | | | 1,495,083 |
6.000%, 03/01/34 | | | 120,390 | | | 124,709 |
6.000%, 04/01/34 | | | 1,911,746 | | | 1,973,137 |
6.000%, 05/01/34 | | | 164,286 | | | 169,529 |
6.000%, 06/01/34 | | | 1,895,754 | | | 1,956,263 |
6.000%, 07/01/34 | | | 2,232,343 | | | 2,303,594 |
6.000%, 08/01/34 | | | 5,024,202 | | | 5,184,562 |
6.000%, 10/01/34 | | | 1,864,398 | | | 1,923,906 |
6.000%, 11/01/34 | | | 272,833 | | | 281,542 |
6.000%, 12/01/34 | | | 131,158 | | | 135,344 |
6.000%, 04/01/35 | | | 73,773 | | | 76,047 |
6.000%, 08/01/35 | | | 389,029 | | | 401,021 |
6.000%, 09/01/35 (c) | | | 540,120 | | | 558,806 |
6.000%, 10/01/35 | | | 742,518 | | | 765,406 |
6.000%, 11/01/35 | | | 330,974 | | | 341,176 |
6.000%, 12/01/35 | | | 1,098,944 | | | 1,132,818 |
6.000%, 02/01/36 | | | 1,368,444 | | | 1,410,552 |
6.000%, 04/01/36 | | | 2,359,744 | | | 2,432,112 |
6.000%, 06/01/36 | | | 610,902 | | | 629,700 |
6.000%, 07/01/36 | | | 358,915 | | | 369,922 |
6.000%, 03/01/37 | | | 670,234 | | | 690,751 |
6.000%, 07/01/37 | | | 912,429 | | | 940,359 |
6.330%, 03/01/11 (c) | | | 162,660 | | | 170,758 |
6.500%, 06/01/31 | | | 346,089 | | | 362,204 |
6.500%, 07/01/31 | | | 155,155 | | | 162,380 |
6.500%, 08/01/31 | | | 97,008 | | | 101,525 |
6.500%, 09/01/31 | | | 449,052 | | | 469,961 |
6.500%, 02/01/32 | | | 430,576 | | | 450,625 |
6.500%, 05/01/32 | | | 156,262 | | | 163,049 |
6.500%, 07/01/32 | | | 792,042 | | | 827,908 |
6.500%, 08/01/32 | | | 730,209 | | | 761,927 |
6.500%, 01/01/33 | | | 299,920 | | | 312,948 |
6.500%, 04/01/34 | | | 641,401 | | | 668,624 |
6.500%, 06/01/34 | | | 204,655 | | | 213,161 |
6.500%, 08/01/34 | | | 252,543 | | | 263,040 |
6.500%, 03/01/36 | | | 758,599 | | | 788,824 |
6.500%, 04/01/36 | | | 333,636 | | | 346,929 |
6.500%, 05/01/36 | | | 525,080 | | | 546,002 |
6.500%, 02/01/37 | | | 1,671,494 | | | 1,737,998 |
6.500%, 04/01/37 | | | 540,786 | | | 562,303 |
6.500%, 05/01/37 | | | 883,822 | | | 918,988 |
6.500%, 06/01/37 | | | 451,957 | | | 469,939 |
6.500%, 07/01/37 | | | 755,175 | | | 785,222 |
6.625%, 09/15/09 | | | 3,886,000 | | | 4,044,875 |
7.500%, 10/01/29 | | | 85,014 | | | 90,045 |
7.500%, 02/01/30 | | | 51,573 | | | 54,679 |
7.500%, 11/01/31 | | | 187,422 | | | 198,519 |
7.500%, 02/01/32 | | | 55,576 | | | 58,882 |
| | | | | | |
| Security Description | | Face
Amount | | Value* |
| | | | | | |
|
Federal Agencies—(Continued) |
Government National Mortgage Association
4.500%, 07/20/33 | | $ | 125,505 | | $ | 126,861 |
4.500%, 09/15/33 | | | 537,152 | | | 549,434 |
4.500%, 09/20/33 | | | 65,056 | | | 65,759 |
4.500%, 12/20/34 | | | 65,335 | | | 66,079 |
4.500%, 03/20/35 | | | 322,343 | | | 326,155 |
5.000%, 07/20/33 | | | 246,743 | | | 253,358 |
5.000%, 03/15/34 | | | 234,434 | | | 241,234 |
5.000%, 06/15/34 | | | 395,252 | | | 406,717 |
5.000%, 12/15/34 | | | 228,701 | | | 235,335 |
5.000%, 06/15/35 | | | 88,349 | | | 90,857 |
5.500%, 11/15/32 | | | 653,833 | | | 676,153 |
5.500%, 08/15/33 | | | 2,673,590 | | | 2,763,185 |
5.500%, 12/15/33 | | | 1,013,242 | | | 1,047,542 |
5.500%, 09/15/34 | | | 956,349 | | | 987,799 |
5.500%, 10/15/35 | | | 285,144 | | | 294,432 |
6.000%, 12/15/28 | | | 191,612 | | | 198,945 |
6.000%, 12/15/31 | | | 186,566 | | | 193,355 |
6.000%, 03/15/32 | | | 9,714 | | | 10,058 |
6.000%, 10/15/32 | | | 724,342 | | | 750,027 |
6.000%, 01/15/33 | | | 113,959 | | | 117,928 |
6.000%, 02/15/33 | | | 6,031 | | | 6,241 |
6.000%, 04/15/33 | | | 739,363 | | | 765,118 |
6.000%, 08/15/33 | | | 7,491 | | | 7,752 |
6.000%, 07/15/34 | | | 565,777 | | | 585,044 |
6.000%, 09/15/34 | | | 473,044 | | | 489,152 |
6.000%, 01/20/35 | | | 281,651 | | | 290,454 |
6.000%, 02/20/35 | | | 142,342 | | | 146,790 |
6.000%, 04/20/35 | | | 234,437 | | | 241,765 |
6.000%, 01/15/38 | | | 1,140,421 | | | 1,178,900 |
| | | | | | |
| | | | | | 213,742,948 |
| | | | | | |
| | |
Food & Staples Retailing—0.2% | | | | | | |
CVS Caremark Corp.
6.125%, 08/15/16 | | | 1,080,000 | | | 1,046,340 |
Wal-Mart Stores, Inc.
5.250%, 09/01/35 | | | 1,830,000 | | | 1,822,061 |
| | | | | | |
| | | | | | 2,868,401 |
| | | | | | |
| | |
Foreign Government—0.5% | | | | | | |
Egypt Government AID Bonds
4.450%, 09/15/15 | | | 1,903,000 | | | 2,055,906 |
Israel Government International Bond
4.625%, 06/15/13 | | | 1,095,000 | | | 1,147,682 |
Province of Ontario Canada
5.000%, 10/18/11 | | | 2,170,000 | | | 2,281,169 |
| | | | | | |
| | | | | | 5,484,757 |
| | | | | | |
| | |
Government Agency—0.4% | | | | | | |
California Educational Facilities Authority
5.000%, 03/15/39 | | | 730,000 | | | 728,817 |
Financing Corp. (FICO)
9.650%, 11/02/18 | | | 430,000 | | | 666,722 |
Massachusetts Bay Transportation Authority
5.250%, 07/01/33 | | | 1,190,000 | | | 1,191,618 |
*See accompanying notes to financial statements.
MSF-11
Metropolitan Series Fund, Inc.
MFS Total Return Portfolio
Schedule of Investments as of December 31, 2008
Fixed Income—(Continued)
| | | | | | |
| Security Description | | Face
Amount | | Value* |
| | | | | | |
| | |
Government Agency—(Continued) | | | | | | |
Massachusetts Health & Educational Facilities Authority
5.500%, 06/01/30 | | $ | 735,000 | | $ | 733,126 |
5.500%, 06/01/35 | | | 1,170,000 | | | 1,147,571 |
U.S. Department of Housing & Urban Development
7.498%, 08/01/11 | | | 98,000 | | | 101,744 |
| | | | | | |
| | | | | | 4,569,598 |
| | | | | | |
| |
Health Care Equipment & Supplies—0.2% | | | |
Hospira, Inc.
5.550%, 03/30/12 | | | 530,000 | | | 502,158 |
6.050%, 03/30/17 (c) | | | 1,847,000 | | | 1,500,167 |
| | | | | | |
| | | | | | 2,002,325 |
| | | | | | |
| |
Health Care Providers & Services—0.1% | | | |
Cardinal Health, Inc.
5.800%, 10/15/16 | | | 793,000 | | | 717,410 |
HCA, Inc.
8.750%, 09/01/10 | | | 112,000 | | | 107,520 |
| | | | | | |
| | | | | | 824,930 |
| | | | | | |
| | |
Hotels, Restaurants & Leisure—0.1% | | | | | | |
Marriott International, Inc.
6.375%, 06/15/17 | | | 1,290,000 | | | 899,549 |
Wyndham Worldwide Corp.
6.000%, 12/01/16 | | | 1,077,000 | | | 434,126 |
| | | | | | |
| | | | | | 1,333,675 |
| | | | | | |
| | |
Household Durables—0.1% | | | | | | |
Fortune Brands, Inc.
5.125%, 01/15/11 | | | 1,435,000 | | | 1,378,326 |
| | | | | | |
| | |
Insurance—0.3% | | | | | | |
American International Group, Inc. (144A)
8.250%, 08/15/18 | | | 660,000 | | | 483,066 |
Chubb Corp.
6.375%, 03/29/67 (c) | | | 2,110,000 | | | 1,308,605 |
Everest Reinsurance Holdings, Inc.
8.750%, 03/15/10 | | | 100,000 | | | 94,381 |
ING Groep NV
5.775%, 12/29/49 (c) | | | 1,250,000 | | | 535,365 |
OneBeacon U.S. Holdings, Inc.
5.875%, 05/15/13 | | | 735,000 | | | 534,925 |
The Allstate Corp.
5.550%, 05/09/35 | | | 1,236,000 | | | 1,005,606 |
| | | | | | |
| | | | | | 3,961,948 |
| | | | | | |
| | |
Machinery—0.2% | | | | | | |
Atlas Copco AB (144A)
5.600%, 05/22/17 | | | 910,000 | | | 854,858 |
Kennametal, Inc.
7.200%, 06/15/12 | | | 1,284,000 | | | 1,247,479 |
| | | | | | |
| | | | | | 2,102,337 |
| | | | | | |
| | | | | | |
| Security Description | | Face
Amount | | Value* |
| | | | | | |
| | |
Media—0.4% | | | | | | |
CBS Corp.
6.625%, 05/15/11 | | $ | 1,485,000 | | $ | 1,315,980 |
COX Communications, Inc.
4.625%, 06/01/13 | | | 1,058,000 | | | 916,936 |
Hearst-Argyle Television, Inc.
7.500%, 11/15/27 | | | 200,000 | | | 169,786 |
News America Holdings, Inc.
8.500%, 02/23/25 | | | 722,000 | | | 710,544 |
Time Warner Entertainment Co., L.P.
8.375%, 07/15/33 | | | 1,240,000 | | | 1,251,320 |
| | | | | | |
| | | | | | 4,364,566 |
| | | | | | |
| | |
Metals & Mining—0.1% | | | | | | |
ArcelorMittal
6.125%, 06/01/18 | | | 1,727,000 | | | 1,182,577 |
| | | | | | |
| | |
Multi-Utilities—0.1% | | | | | | |
CenterPoint Energy Resources Corp.
7.875%, 04/01/13 | | | 1,293,000 | | | 1,197,698 |
| | | | | | |
| | |
Multiline Retail—0.0% | | | | | | |
Macy’s Retail Holdings, Inc.
5.350%, 03/15/12 | | | 480,000 | | | 356,531 |
| | | | | | |
| | |
Office Electronics—0.1% | | | | | | |
Xerox Corp.
5.500%, 05/15/12 | | | 820,000 | | | 687,201 |
| | | | | | |
| | |
Oil, Gas & Consumable Fuels—0.6% | | | | | | |
Devon OEI Operating, Inc.
7.250%, 10/01/11 | | | 2,215,000 | | | 2,274,116 |
Enterprise Products Operating, LLC
6.500%, 01/31/19 | | | 908,000 | | | 763,916 |
Pemex Project Funding Master Trust
9.125%, 10/13/10 | | | 35,000 | | | 36,838 |
Ras Laffan Liquefied Natural Gas Co., Ltd. III (144A)
5.832%, 09/30/16 | | | 970,000 | | | 722,117 |
Valero Energy Corp.
6.875%, 04/15/12 | | | 2,023,000 | | | 2,034,389 |
Weatherford International, Inc.
6.350%, 06/15/17 | | | 480,000 | | | 409,649 |
Weatherford International, Ltd.
6.000%, 03/15/18 | | | 1,224,000 | | | 1,027,865 |
| | | | | | |
| | | | | | 7,268,890 |
| | | | | | |
| | |
Paper & Forest Products—0.0% | | | | | | |
MeadWestvaco Corp.
6.850%, 04/01/12 | | | 35,000 | | | 31,620 |
| | | | | | |
| | |
Pharmaceuticals—0.1% | | | | | | |
Allergan, Inc.
5.750%, 04/01/16 | | | 1,430,000 | | | 1,368,112 |
| | | | | | |
*See accompanying notes to financial statements.
MSF-12
Metropolitan Series Fund, Inc.
MFS Total Return Portfolio
Schedule of Investments as of December 31, 2008
Fixed Income—(Continued)
| | | | | | |
| Security Description | | Face
Amount | | Value* |
| | | | | | |
| | |
Real Estate Investment Trusts—0.4% | | | | | | |
Boston Properties, Inc.
5.000%, 06/01/15 | | $ | 200,000 | | $ | 125,941 |
HRPT Properties Trust
6.250%, 08/15/16 | | | 1,776,000 | | | 945,979 |
Prologis
5.750%, 04/01/16 | | | 1,743,000 | | | 869,258 |
Simon Property Group, L.P.
5.100%, 06/15/15 | | | 2,102,000 | | | 1,288,579 |
5.875%, 03/01/17 | | | 1,328,000 | | | 886,857 |
Vornado Realty, L.P.
4.750%, 12/01/10 | | | 530,000 | | | 476,886 |
| | | | | | |
| | | | | | 4,593,500 |
| | | | | | |
| | |
Road & Rail—0.1% | | | | | | |
CSX Corp.
6.750%, 03/15/11 | | | 92,000 | | | 91,638 |
7.900%, 05/01/17 | | | 1,120,000 | | | 1,152,748 |
Norfolk Southern Corp.
7.050%, 05/01/37 | | | 360,000 | | | 376,460 |
| | | | | | |
| | | | | | 1,620,846 |
| | | | | | |
| | |
Specialty Retail—0.1% | | | | | | |
Home Depot, Inc.
5.875%, 12/16/36 | | | 504,000 | | | 395,188 |
Limited Brands, Inc.
5.250%, 11/01/14 | | | 1,028,000 | | | 593,023 |
| | | | | | |
| | | | | | 988,211 |
| | | | | | |
| | |
Tobacco—0.3% | | | | | | |
Altria Group, Inc.
9.700%, 11/10/18 | | | 1,600,000 | | | 1,729,328 |
Philip Morris International, Inc.
4.875%, 05/16/13 | | | 2,160,000 | | | 2,166,182 |
| | | | | | |
| | | | | | 3,895,510 |
| | | | | | |
| | |
U.S. Treasury—8.9% | | | | | | |
U.S. Treasury Bonds
4.500%, 02/15/36 (a) | | | 2,609,000 | | | 3,466,302 |
5.375%, 02/15/31 (a) | | | 12,741,000 | | | 17,506,924 |
6.000%, 02/15/26 (a) | | | 2,615,000 | | | 3,649,559 |
6.250%, 08/15/23 | | | 1,251,000 | | | 1,706,246 |
U.S. Treasury Notes
1.500%, 10/31/10 (a) | | | 4,962,000 | | | 5,036,043 |
2.000%, 11/30/13 (a) | | | 2,098,000 | | | 2,152,418 |
3.500%, 05/31/13 (a) | | | 3,900,000 | | | 4,271,717 |
3.875%, 02/15/13 (a) | | | 5,448,000 | | | 6,069,410 |
4.000%, 06/15/09 (a) | | | 203,000 | | | 206,442 |
4.125%, 08/31/12 (a) | | | 7,209,000 | | | 7,972,707 |
4.125%, 05/15/15 (a) | | | 5,133,000 | | | 5,886,909 |
4.500%, 04/30/12 | | | 3,651,000 | | | 4,043,483 |
4.500%, 11/15/15 (a) | | | 800,000 | | | 948,750 |
4.750%, 08/15/17 (a) | | | 7,877,000 | | | 9,417,938 |
5.125%, 06/30/11 (a) | | | 764,000 | | | 845,593 |
| | | | | | | |
| Security Description | | Face
Amount | | Value* | |
| | | | | | | |
| | |
U.S. Treasury—(Continued) | | | | | | | |
U.S. Treasury Notes
6.500%, 02/15/10 (a) | | $ | 29,404,000 | | $ | 31,363,512 | |
| | | | | | | |
| | | | | | 104,543,953 | |
| | | | | | | |
|
Wireless Telecommunication Services—0.2% | |
AT&T Mobility, LLC
6.500%, 12/15/11 | | | 900,000 | | | 903,596 | |
Rogers Communications, Inc.
6.800%, 08/15/18 | | | 1,483,000 | | | 1,498,469 | |
| | | | | | | |
| | | | | | 2,402,065 | |
| | | | | | | |
|
Yankee—0.3% | |
Nexen, Inc.
5.875%, 03/10/35 | | | 462,000 | | | 347,834 | |
Petro-Canada
6.050%, 05/15/18 | | | 1,664,000 | | | 1,371,420 | |
StatoilHydro ASA
7.750%, 06/15/23 | | | 100,000 | | | 113,746 | |
Telus Corp.
8.000%, 06/01/11 | | | 1,918,000 | | | 1,907,620 | |
| | | | | | | |
| | | | | | 3,740,620 | |
| | | | | | | |
Total Fixed Income
(Identified Cost $497,463,504) | | | | | | 476,544,720 | |
| | | | | | | |
|
| Short Term Investments—10.2% | |
| | |
Mutual Funds—10.0% | | | | | | | |
State Street Navigator Securities Lending Prime Portfolio (h) | | | 117,055,252 | | | 117,055,252 | |
| | | | | | | |
| | |
Repurchase Agreement—0.2% | | | | | | | |
State Street Repurchase Agreement dated 12/31/08 at 0.010% to be repurchased at $1,995,001 on 01/02/09, collateralized by $2,015,000 Federal Home Loan Bank at 2.730% due 06/10/09 with a value of $2,037,770. | | | 1,995,000 | | | 1,995,000 | |
| | | | | | | |
Total Short Term Investments
(Identified Cost $119,050,252) | | | | | | 119,050,252 | |
| | | | | | | |
Total Investments—109.6%
(Identified Cost $1,453,629,925) (i) | | | | | | 1,281,651,943 | |
Liabilities in excess of other assets | | | | | | (112,787,500 | ) |
| | | | | | | |
| Total Net Assets—100% | | | | | $ | 1,168,864,443 | |
| | | | | | | |
| (a) | A portion or all of the security was on loan. As of December 31, 2008, the market value of securities loaned was $115,268,677 and the collateral received consisted of cash in the amount of $117,055,252. The cash collateral is invested in a money market fund managed by an affiliate of the custodian. |
*See accompanying notes to financial statements.
MSF-13
Metropolitan Series Fund, Inc.
MFS Total Return Portfolio
Schedule of Investments as of December 31, 2008
| (c) | Variable or Floating Rate Security. Rate disclosed is as of December 31, 2008. |
| (d) | Non-Income Producing; Defaulted Bond. |
| (e) | Interest Only Certificate. This security receives monthly interest payments but is not entitled to principal payments. |
| (f) | Security was valued in good faith under procedures established by the Board of Directors. |
| (h) | Represents investment of cash collateral received from securities lending transactions. |
| (i) | The aggregate cost of investments for federal income tax purposes as of December 31, 2008 was $1,495,862,889 and the composition of unrealized appreciation and depreciation of investment securities was $24,101,724 and $(238,312,670), respectively. |
| (144A)— | Securities exempt from registration under Rule 144A of the Securities Act of 1933. These securities may be resold in transactions exempt from registration, normally to qualified institutional buyers. As of December 31, 2008, the market value of 144A securities was $20,450,011, which is 1.7% of total net assets. |
| (ADR)— | An American Depositary Receipt is a certificate issued by a custodian bank representing the right to receive securities of the foreign issuer described. Trading on exchanges not located in the United States or Canada significantly influences the value of ADRs. |
The Portfolio adopted the provisions of Statement of Financial Accounting Standards No. 157, “Fair Value Measurements” (FAS 157), effective with the beginning of the Portfolio’s fiscal year. FAS 157 establishes a framework for measuring fair value and expands disclosures about fair value measurements in financial statements. The three levels of the hierarchy under FAS 157 are described below:
Level 1 - quoted prices in active markets for identical securities
Level 2 - other significant observable inputs (including quoted prices for similar securities, interest rates, credit risk, etc.)
Level 3 - significant unobservable inputs (including the Portfolio’s own assumptions in determining the fair value of investments)
The inputs or methodology used for valuing securities are not necessarily an indication of the risk associated with investing in those securities.
The following is a summary of the inputs used to value the Portfolio’s net assets as of December 31, 2008:
| | | | | | |
| Valuation Inputs | | Investments In
Securities | | Other Financial
Instruments* |
Level 1 - Quoted Prices | | $ | 895,827,290 | | $ | 0 |
Level 2 - Other Significant Observable Inputs | | | 383,072,667 | | | 0 |
Level 3 - Significant Unobservable Inputs | | | 2,751,986 | | | 0 |
Total | | $ | 1,281,651,943 | | $ | 0 |
* Other financial instruments are derivative instruments not reflected in the Schedule of Investments, such as futures, forwards, swap contracts and written options, which are valued based on the unrealized appreciation/depreciation on the instrument.
Following is a reconciliation of Level 3 assets for which significant unobservable inputs were used to determine fair value:
| | | | | | | |
| | | Investments In
Securities | | | Other Financial
Instruments |
Balance as of January 1, 2008 | | $ | 2,044,798 | | | $ | 0 |
Transfers In (Out) of Level 3 | | | 1,346,750 | | | | 0 |
Accrued discounts/premiums | | | 0 | | | | 0 |
Realized Gain (Loss) | | | 245 | | | | 0 |
Change in unrealized appreciation (depreciation) | | | (620,791 | ) | | | 0 |
Net Purchases (Sales) | | | (19,016 | ) | | | 0 |
Balance as of December 31, 2008 | | $ | 2,751,986 | | | | 0 |
*See accompanying notes to financial statements.
MSF-14
Metropolitan Series Fund, Inc.
MFS Total Return Portfolio
Statement of Assets & Liabilities
December 31, 2008
| | | | | | | |
Assets | | | | | | | |
Investments at value (a) (b) | | | | | $ | 1,281,651,943 | |
Cash | | | | | | 4,157 | |
Receivable for: | | | | | | | |
Securities sold | | | | | | 1,742,621 | |
Fund shares sold | | | | | | 276,805 | |
Accrued interest and dividends | | | | | | 6,572,932 | |
Foreign taxes | | | | | | 46,490 | |
| | | | | | | |
Total Assets | | | | | | 1,290,294,948 | |
Liabilities | | | | | | | |
Payable for: | | | | | | | |
Securities purchased | | $ | 1,371,687 | | | | |
Fund shares redeemed | | | 2,211,175 | | | | |
Withholding taxes | | | 3,332 | | | | |
Collateral for securities loaned | | | 117,055,252 | | | | |
Accrued expenses: | | | | | | | |
Management fees | | | 527,727 | | | | |
Service and distribution fees | | | 169,752 | | | | |
Deferred directors’ fees | | | 31,906 | | | | |
Other expenses | | | 59,674 | | | | |
| | | | | | | |
Total Liabilities | | | | | | 121,430,505 | |
| | | | | | | |
Net Assets | | | | | $ | 1,168,864,443 | |
| | | | | | | |
Net assets consists of: | | | | | | | |
Capital paid in | | | | | $ | 1,511,064,117 | |
Undistributed net investment income | | | | | | 47,646,451 | |
Accumulated net realized losses | | | | | | (217,866,868 | ) |
Unrealized depreciation on investments and foreign
currency | | | | | | (171,979,257 | ) |
| | | | | | | |
Net Assets | | | | | $ | 1,168,864,443 | |
| | | | | | | |
| Computation of offering price: | | | | | | | |
Class A | | | | | | | |
Net asset value and redemption price per share ($177,741,840 divided by 1,651,045 shares outstanding) | | | | | $ | 107.65 | |
| | | | | | | |
Class B | | | | | | | |
Net asset value and redemption price per share ($161,732,409 divided by 1,518,130 shares outstanding) | | | | | $ | 106.53 | |
| | | | | | | |
Class E | | | | | | | |
Net asset value and redemption price per share ($40,104,128 divided by 374,236 shares outstanding) | | | | | $ | 107.16 | |
| | | | | | | |
Class F | | | | | | | |
Net asset value and redemption price per share ($789,286,066 divided by 7,386,466 shares outstanding) | | | | | $ | 106.86 | |
| | | | | | | |
(a) Identified cost of investments | | | | | $ | 1,453,629,925 | |
| | | | | | | |
(b) Includes cash collateral for securities loaned of | | | | | $ | 117,055,252 | |
| | | | | | | |
Statement of Operations
For the Year Ended December 31, 2008
| | | | | | | | |
Investment Income | | | | | | | | |
Dividends | | | | | | $ | 22,467,390 | (a) |
Interest | | | | | | | 34,507,031 | (b) |
| | | | | | | | |
| | | | | | | 56,974,421 | |
Expenses | | | | | | | | |
Management fees | | $ | 8,186,097 | | | | | |
Service and distribution fees—Class B | | | 505,605 | | | | | |
Service and distribution fees—Class E | | | 84,081 | | | | | |
Service and distribution fees—Class F | | | 2,110,855 | | | | | |
Directors’ fees and expenses | | | 22,890 | | | | | |
Custodian | | | 293,528 | | | | | |
Audit and tax services | | | 38,968 | | | | | |
Legal | | | 26,697 | | | | | |
Printing | | | 242,147 | | | | | |
Insurance | | | 21,684 | | | | | |
Miscellaneous | | | 26,608 | | | | | |
| | | | | | | | |
Total expenses | | | 11,559,160 | | | | | |
Expense reductions | | | (224,429 | ) | | | 11,334,731 | |
| | | | | | | | |
Net Investment Income | | | | | | | 45,639,690 | |
| | | | | | | | |
Realized and Unrealized Loss | | | | | | | | |
| Realized gain (loss) on: | | | | | | | | |
Investments—net | | | (165,528,429 | ) | | | | |
Foreign currency transactions—net | | | 56,794 | | | | (165,471,635 | ) |
| | | | | | | | |
| Change in unrealized depreciation on: | | | | | | | | |
Investments—net | | | (255,111,401 | ) | | | | |
Foreign currency transactions—net | | | (1,140 | ) | | | (255,112,541 | ) |
| | | | | | | | |
Net loss | | | | | | | (420,584,176 | ) |
| | | | | | | | |
Net Decrease in Net Assets From Operations | | | | | | $ | (374,944,486 | ) |
| | | | | | | | |
| (a) | Net of foreign taxes of $250,875. |
| (b) | Includes income on securities loaned of $1,727,257. |
See accompanying notes to financial statements.
MSF-15
Metropolitan Series Fund, Inc.
MFS Total Return Portfolio
Statements of Changes in Net Assets
| | | | | | | | |
| | | Year ended
December 31,
2008 | | | Year ended
December 31,
2007 | |
From Operations | | | | | | | | |
Net investment income | | $ | 45,639,690 | | | $ | 51,562,798 | |
Net realized gain (loss) | | | (165,471,635 | ) | | | 109,835,876 | |
Unrealized depreciation | | | (255,112,541 | ) | | | (78,818,377 | ) |
| | | | | | | | |
Increase (decrease) in net assets from operations | | | (374,944,486 | ) | | | 82,580,297 | |
| | | | | | | | |
From Distributions to Shareholders | | | | | | | | |
Net investment income | | | | | | | | |
Class A | | | (8,242,746 | ) | | | (6,077,127 | ) |
Class B | | | (6,933,300 | ) | | | (4,271,221 | ) |
Class E | | | (2,019,738 | ) | | | (1,741,399 | ) |
Class F | | | (37,319,916 | ) | | | (27,365,987 | ) |
| | | | | | | | |
| | | (54,515,700 | ) | | | (39,455,734 | ) |
| | | | | | | | |
Net realized gain | | | | | | | | |
Class A | | | (17,741,215 | ) | | | (9,194,580 | ) |
Class B | | | (16,174,203 | ) | | | (7,330,189 | ) |
Class E | | | (4,559,937 | ) | | | (2,813,723 | ) |
Class F | | | (85,690,529 | ) | | | (46,173,029 | ) |
| | | | | | | | |
| | | (124,165,884 | ) | | | (65,511,521 | ) |
| | | | | | | | |
Total distributions | | | (178,681,584 | ) | | | (104,967,255 | ) |
| | | | | | | | |
Decrease in net assets from capital share transactions | | | (136,675,245 | ) | | | (92,438,567 | ) |
| | | | | | | | |
Net decrease in net assets | | | (690,301,315 | ) | | | (114,825,525 | ) |
| | |
Net Assets | | | | | | | | |
Beginning of the period | | | 1,859,165,758 | | | | 1,973,991,283 | |
| | | | | | | | |
End of the period | | $ | 1,168,864,443 | | | $ | 1,859,165,758 | |
| | | | | | | | |
Undistributed Net Investment Income | | | | | | | | |
End of the period | | $ | 47,646,451 | | | $ | 54,123,170 | |
| | | | | | | | |
Other Information:
Capital Shares
Transactions in capital shares were as follows:
| | | | | | | | | | | | | | |
| | | Year ended
December 31, 2008 | | | Year ended
December 31, 2007 | |
| | | Shares | | | $ | | | Shares | | | $ | |
Class A | | | | | | | | | | | | | | |
Sales | | 369,060 | | | $ | 41,819,796 | | | 285,406 | | | $ | 44,679,626 | |
Reinvestments | | 193,089 | | | | 25,983,961 | | | 98,527 | | | | 15,271,707 | |
Redemptions | | (621,960 | ) | | | (74,091,292 | ) | | (460,811 | ) | | | (72,109,670 | ) |
| | | | | | | | | | | | | | |
Net decrease | | (59,811 | ) | | $ | (6,287,535 | ) | | (76,878 | ) | | $ | (12,158,337 | ) |
| | | | | | | | | | | | | | |
Class B | | | | | | | | | | | | | | |
Sales | | 236,146 | | | $ | 30,497,195 | | | 536,030 | | | $ | 83,546,125 | |
Reinvestments | | 173,207 | | | | 23,107,503 | | | 75,442 | | | | 11,601,410 | |
Redemptions | | (418,494 | ) | | | (52,728,935 | ) | | (442,313 | ) | | | (68,803,892 | ) |
| | | | | | | | | | | | | | |
Net increase (decrease) | | (9,141 | ) | | $ | 875,763 | | | 169,159 | | | $ | 26,343,643 | |
| | | | | | | | | | | | | | |
Class E | | | | | | | | | | | | | | |
Sales | | 26,795 | | | $ | 3,521,259 | | | 191,657 | | | $ | 30,163,464 | |
Reinvestments | | 49,065 | | | | 6,579,675 | | | 29,485 | | | | 4,555,122 | |
Redemptions | | (179,718 | ) | | | (23,391,550 | ) | | (290,620 | ) | | | (45,525,263 | ) |
| | | | | | | | | | | | | | |
Net decrease | | (103,858 | ) | | $ | (13,290,616 | ) | | (69,478 | ) | | $ | (10,806,677 | ) |
| | | | | | | | | | | | | | |
Class F | | | | | | | | | | | | | | |
Sales | | 552,104 | | | $ | 72,028,264 | | | 529,936 | | | $ | 82,534,533 | |
Reinvestments | | 919,636 | | | | 123,010,445 | | | 477,092 | | | | 73,539,016 | |
Redemptions | | (2,474,872 | ) | | | (313,011,566 | ) | | (1,617,157 | ) | | | (251,890,745 | ) |
| | | | | | | | | | | | | | |
Net decrease | | (1,003,132 | ) | | $ | (117,972,857 | ) | | (610,129 | ) | | $ | (95,817,196 | ) |
| | | | | | | | | | | | | | |
Decrease derived from capital share transactions | | | | | $ | (136,675,245 | ) | | | | | $ | (92,438,567 | ) |
| | | | | | | | | | | | | | |
See accompanying notes to financial statements.
MSF-16
Metropolitan Series Fund, Inc.
MFS Total Return Portfolio
Financial Highlights
| | | | | | | | | | | | | | | | | | | | |
| | | Class A | |
| | | Year ended December 31, | |
| | | 2008 | | | 2007 | | | 2006 | | | 2005 | | | 2004 | |
Net Asset Value, Beginning of Period | | $ | 154.53 | | | $ | 156.45 | | | $ | 147.99 | | | $ | 147.96 | | | $ | 138.13 | |
| | | | | | | | | | | | | | | | | | | | |
Income From Investment Operations | | | | | | | | | | | | | | | | | | | | |
Net investment income | | | 4.08 | (a) | | | 4.40 | (a) | | | 4.32 | | | | 3.84 | | | | 3.60 | |
Net realized and unrealized gain (loss) of investments | | | (35.15 | ) | | | 2.49 | | | | 13.06 | | | | 0.46 | | | | 11.53 | |
| | | | | | | | | | | | | | | | | | | | |
Total from investment operations | | | (31.07 | ) | | | 6.89 | | | | 17.38 | | | | 4.30 | | | | 15.13 | |
| | | | | | | | | | | | | | | | | | | | |
Less Distributions | | | | | | | | | | | | | | | | | | | | |
Distributions from net investment income | | | (5.02 | ) | | | (3.51 | ) | | | (5.49 | ) | | | (2.61 | ) | | | (4.52 | ) |
Distributions from net realized capital gains | | | (10.79 | ) | | | (5.30 | ) | | | (3.43 | ) | | | (1.66 | ) | | | (0.78 | ) |
| | | | | | | | | | | | | | | | | | | | |
Total distributions | | | (15.81 | ) | | | (8.81 | ) | | | (8.92 | ) | | | (4.27 | ) | | | (5.30 | ) |
| | | | | | | | | | | | | | | | | | | | |
Net Asset Value, End of Period | | $ | 107.65 | | | $ | 154.53 | | | $ | 156.45 | | | $ | 147.99 | | | $ | 147.96 | |
| | | | | | | | | | | | | | | | | | | | |
Total Return (%) | | | (22.2 | ) | | | 4.4 | | | | 12.2 | | | | 3.1 | | | | 11.3 | |
Ratio of operating expenses to average net assets before expense reductions (%) | | | 0.58 | | | | 0.58 | | | | 0.59 | | | | 0.66 | | | | 0.64 | |
Ratio of operating expenses to average net assets after expense reductions (%) (b) | | | 0.56 | | | | 0.57 | | | | 0.58 | | | | 0.65 | | | | 0.63 | |
Ratio of net investment income to average net assets (%) | | | 3.15 | | | | 2.80 | | | | 2.74 | | | | 2.53 | | | | 2.60 | |
Portfolio turnover rate (%) | | | 52 | | | | 58 | | | | 55 | | | | 47 | | | | 89 | |
Net assets, end of period (000) | | $ | 177,742 | | | $ | 264,376 | | | $ | 279,698 | | | $ | 261,653 | | | $ | 268,870 | |
| | | | | | | | | | | | | | | | | | | | |
| | | Class B | |
| | | Year ended December 31, | |
| | | 2008 | | | 2007 | | | 2006 | | | 2005 | | | 2004 | |
Net Asset Value, Beginning of Period | | $ | 153.05 | | | $ | 155.02 | | | $ | 146.58 | | | $ | 146.59 | | | $ | 136.93 | |
| | | | | | | | | | | | | | | | | | | | |
Income From Investment Operations | | | | | | | | | | | | | | | | | | | | |
Net investment income | | | 3.72 | (a) | | | 3.97 | (a) | | | 3.71 | | | | 2.75 | | | | 3.64 | |
Net realized and unrealized gain (loss) of investments | | | (34.82 | ) | | | 2.45 | | | | 13.15 | | | | 1.16 | | | | 11.01 | |
| | | | | | | | | | | | | | | | | | | | |
Total from investment operations | | | (31.10 | ) | | | 6.42 | | | | 16.86 | | | | 3.91 | | | | 14.65 | |
| | | | | | | | | | | | | | | | | | | | |
Less Distributions | | | | | | | | | | | | | | | | | | | | |
Distributions from net investment income | | | (4.63 | ) | | | (3.09 | ) | | | (4.99 | ) | | | (2.26 | ) | | | (4.21 | ) |
Distributions from net realized capital gains | | | (10.79 | ) | | | (5.30 | ) | | | (3.43 | ) | | | (1.66 | ) | | | (0.78 | ) |
| | | | | | | | | | | | | | | | | | | | |
Total distributions | | | (15.42 | ) | | | (8.39 | ) | | | (8.42 | ) | | | (3.92 | ) | | | (4.99 | ) |
| | | | | | | | | | | | | | | | | | | | |
Net Asset Value, End of Period | | $ | 106.53 | | | $ | 153.05 | | | $ | 155.02 | | | $ | 146.58 | | | $ | 146.59 | |
| | | | | | | | | | | | | | | | | | | | |
Total Return (%) | | | (22.3 | ) | | | 4.1 | | | | 11.9 | | | | 2.9 | | | | 11.0 | |
Ratio of operating expenses to average net assets before expense reductions (%) | | | 0.83 | | | | 0.83 | | | | 0.84 | | | | 0.91 | | | | 0.89 | |
Ratio of operating expenses to average net assets after expense reductions (%) (b) | | | 0.81 | | | | 0.82 | | | | 0.83 | | | | 0.90 | | | | 0.88 | |
Ratio of net investment income to average net assets (%) | | | 2.90 | | | | 2.56 | | | | 2.50 | | | | 2.29 | | | | 2.39 | |
Portfolio turnover rate (%) | | | 52 | | | | 58 | | | | 55 | | | | 47 | | | | 89 | |
Net assets, end of period (000) | | $ | 161,732 | | | $ | 233,742 | | | $ | 210,529 | | | $ | 158,528 | | | $ | 103,373 | |
| Please | see following page for Financial Highlights footnote legend. |
See accompanying notes to financial statements.
MSF-17
Metropolitan Series Fund, Inc.
MFS Total Return Portfolio
Financial Highlights
| | | | | | | | | | | | | | | | | | | | |
| | | Class E | |
| | | Year ended December 31, | |
| | | 2008 | | | 2007 | | | 2006 | | | 2005 | | | 2004(c) | |
Net Asset Value, Beginning of Period | | $ | 153.85 | | | $ | 155.83 | | | $ | 147.36 | | | $ | 147.29 | | | $ | 135.61 | |
| | | | | | | | | | | | | | | | | | | | |
Income From Investment Operations | | | | | | | | | | | | | | | | | | | | |
Net investment income | | | 3.88 | (a) | | | 4.14 | (a) | | | 4.27 | | | | 3.46 | | | | 2.33 | |
Net realized and unrealized gain (loss) of investments | | | (35.00 | ) | | | 2.46 | | | | 12.81 | | | | 0.60 | | | | 9.35 | |
| | | | | | | | | | | | | | | | | | | | |
Total from investment operations | | | (31.12 | ) | | | 6.60 | | | | 17.08 | | | | 4.06 | | | | 11.68 | |
| | | | | | | | | | | | | | | | | | | | |
Less Distributions | | | | | | | | | | | | | | | | | | | | |
Distributions from net investment income | | | (4.78 | ) | | | (3.28 | ) | | | (5.18 | ) | | | (2.33 | ) | | | 0.00 | |
Distributions from net realized capital gains | | | (10.79 | ) | | | (5.30 | ) | | | (3.43 | ) | | | (1.66 | ) | | | 0.00 | |
| | | | | | | | | | | | | | | | | | | | |
Total distributions | | | (15.57 | ) | | | (8.58 | ) | | | (8.61 | ) | | | (3.99 | ) | | | 0.00 | |
| | | | | | | | | | | | | | | | | | | | |
Net Asset Value, End of Period | | $ | 107.16 | | | $ | 153.85 | | | $ | 155.83 | | | $ | 147.36 | | | $ | 147.29 | |
| | | | | | | | | | | | | | | | | | | | |
Total Return (%) | | | (22.3 | ) | | | 4.2 | | | | 12.0 | | | | 3.0 | | | | 8.6 | (d) |
Ratio of operating expenses to average net assets before expense reductions (%) | | | 0.73 | | | | 0.73 | | | | 0.74 | | | | 0.81 | | | | 0.79 | (e) |
Ratio of operating expenses to average net assets after expense reductions (%) (b) | | | 0.71 | | | | 0.72 | | | | 0.73 | | | | 0.80 | | | | 0.78 | (e) |
Ratio of net investment income to average net assets (%) | | | 2.98 | | | | 2.65 | | | | 2.57 | | | | 2.38 | | | | 2.57 | (e) |
Portfolio turnover rate (%) | | | 52 | | | | 58 | | | | 55 | | | | 47 | | | | 89 | |
Net assets, end of period (000) | | $ | 40,104 | | | $ | 73,557 | | | $ | 85,327 | | | $ | 90,637 | | | $ | 89,519 | |
| | | | | | | | | | | | |
| | | Class F | |
| | | Year ended December 31, | |
| | | 2008 | | | 2007 | | | 2006(c) | |
Net Asset Value, Beginning of Period | | $ | 153.46 | | | $ | 155.39 | | | $ | 143.80 | |
| | | | | | | | | | | | |
Income From Investment Operations | | | | | | | | | | | | |
Net investment income | | | 3.80 | (a) | | | 4.08 | (a) | | | 2.69 | |
Net realized and unrealized gain (loss) on investments | | | (34.91 | ) | | | 2.43 | | | | 8.90 | |
| | | | | | | | | | | | |
Total from investment operations | | | (31.11 | ) | | | 6.51 | | | | 11.59 | |
| | | | | | | | | | | | |
Less Distributions | | | | | | | | | | | | |
Distributions from net investment income | | | (4.70 | ) | | | (3.14 | ) | | | 0.00 | |
Distributions from net realized capital gains | | | (10.79 | ) | | | (5.30 | ) | | | 0.00 | |
| | | | | | | | | | | | |
Total distributions | | | (15.49 | ) | | | (8.44 | ) | | | 0.00 | |
| | | | | | | | | | | | |
Net Asset Value, End of Period | | $ | 106.86 | | | $ | 153.46 | | | $ | 155.39 | |
| | | | | | | | | | | | |
Total Return (%) | | | (22.3 | ) | | | 4.2 | | | | 8.1 | (d) |
Ratio of operating expenses to average net assets before expense reductions (%) | | | 0.78 | | | | 0.78 | | | | 0.79 | (e) |
Ratio of operating expenses to average net assets after expense reductions (%) (b) | | | 0.76 | | | | 0.77 | | | | 0.78 | (e) |
Ratio of net investment income to average net assets (%) | | | 2.94 | | | | 2.60 | | | | 2.67 | (e) |
Portfolio turnover rate (%) | | | 52 | | | | 58 | | | | 55 | |
Net assets, end of period (000) | | $ | 789,286 | | | $ | 1,287,491 | | | $ | 1,398,437 | |
| (a) | Per share amount is based on average shares outstanding during the period. |
| (b) | The Portfolio has entered into arrangements with certain brokers who paid a portion of the Portfolio’s expenses. |
| (c) | Commencement of operations was April 26, 2004 and May 2, 2006 for Classes E and F, respectively. |
| (d) | Periods less than one year are not computed on an annualized basis. |
| (e) | Computed on an annualized basis. |
See accompanying notes to financial statements.
MSF-18
Metropolitan Series Fund, Inc.
MFS Total Return Portfolio
Notes to Financial Statements—December 31, 2008
Metropolitan Series Fund, Inc. (the “Fund”) is organized as a corporation under the laws of Maryland pursuant to Articles of Incorporation filed on November 23, 1982, as amended, and registered under the Investment Company Act of 1940, as amended (the “1940 Act”), as an open-end investment company. The Fund is a “series” type of mutual fund, which issues separate series of stock. Each series represents an interest in a separate portfolio of Fund investments. The MFS Total Return Portfolio (the “Portfolio”) is a diversified series of the Fund. Shares in the Fund are not offered directly to the general public and are currently available only to separate accounts established by Metropolitan Life Insurance Company (“MetLife”), New England Life Insurance Company, General American Life Insurance Company (“General American”), The MetLife Investors Group of Insurance Companies, MetLife Insurance Company of Connecticut and other affiliated insurance companies (collectively, the “Insurance Companies”) and to certain eligible qualified retirement plans (“Qualified Plans”), as an investment vehicle for variable life insurance, group annuity or variable annuity products of these insurance companies or Qualified Plans, although the Portfolio is not available to all such separate accounts and Qualified Plans. The Portfolio’s shares may be divided into different classes. Currently, the classes being offered by the Portfolio are named Class A, Class B, Class E and Class F. The classes of the Portfolio’s shares are identical, except that certain additional charges (Rule 12b-1 fees) are made against Class B, Class E and Class F shares. Investment income, realized and unrealized capital gains and losses, the common expenses of the Portfolio and certain Portfolio-level expense reductions, if any, are allocated daily, on a pro rata basis, to each class based on the relative net assets of each class to the total net assets of the Portfolio.
| 2. | SIGNIFICANT ACCOUNTING POLICIES: |
The preparation of financial statements in conformity with accounting principles generally accepted in the United States of America (“GAAP”) requires management to make estimates and assumptions that affect the reported amounts of assets and liabilities and disclosure of contingent assets and liabilities as of the date of the financial statements and the reported amounts of income and expenses during the reporting period. Actual results could differ from those estimates.
The following is a summary of significant accounting policies consistently followed by the Portfolio in the preparation of its financial statements. The policies are in conformity with GAAP.
Investment Valuation:
Debt securities (other than short term obligations with a remaining maturity of sixty days or less) are generally valued on the basis of evaluated or composite bid quotations obtained by independent pricing services and/or brokers and dealers selected by the relevant subadviser pursuant to authorization of the Board of Directors of the Fund (the “Board” or “Directors”). Such quotations take into account appropriate factors such as institutional-sized trading in similar groups of securities, yield, quality, coupon rate, maturity, type of issue, trading characteristics and other data. Short term obligations with a remaining maturity of sixty days or less are valued at amortized cost which approximates fair market value.
Equity securities traded on a national securities exchange or other exchanges are valued at their last sale price on the principal trading market. Equity securities traded on the NASDAQ National Market System are valued at the NASDAQ Official Closing Price (the “NOCP”). The NOCP is the last reported sale price if the last reported sale price falls between the spread of the last reported bid and asked prices. If the last reported bid and asked prices are above the last reported sale price, the NOCP will be the last reported bid price. If the last reported bid and asked prices are below the last reported sale price, the NOCP will be the last reported asked price. Equity securities traded on a national securities exchange or other exchanges or on the NASDAQ National Market System for which there is no reported sale during the day are valued at the last reported bid price. A security that is listed or traded on more than one exchange is valued at the quotation on the exchange determined to be the primary market for that security by the Board or its delegates. If no closing price is available, then such securities are valued by using the last reported bid price. Equity securities traded over-the-counter are valued at the last reported sales price.
If no current market value quotation is readily available or reliable for a portfolio security, fair value will be determined in accordance with procedures established by and under the general supervision of the Board. When the Portfolio uses fair value pricing, it may take into account any factors it deems appropriate. The value of securities used by the Portfolio to calculate its net asset value may differ from quoted or published prices for the same securities. Fair value pricing involves subjective judgments and the fair value determined for a security may be materially different than the value that could be realized upon the sale of that security.
MSF-19
Metropolitan Series Fund, Inc.
MFS Total Return Portfolio
Notes to Financial Statements—December 31, 2008—(Continued)
The Portfolio expects to use fair value pricing for securities primarily traded on U.S. exchanges only under very limited circumstances. For example, the Portfolio may use fair value pricing if the exchange on which a security is traded closes early or trading in the security is suspended.
Securities traded primarily on an exchange outside of the United States which closes before the close of the New York Stock Exchange will be valued at the last sales price on that non-U.S. exchange. Securities traded primarily on an exchange outside of the United States for which there is no reported sale during the day are valued at the mean between the last reported bid and asked prices. However, because most foreign markets close well before the Portfolio values its securities (typically at 4 p.m. Eastern Time), the earlier close of these foreign markets gives rise to the possibility that significant events, including broad market moves, may have occurred after these foreign markets close but before the Portfolio values its securities. To account for this, the Portfolio may frequently value many of its foreign equity securities using fair value prices based on third party vendor modeling tools.
Forward foreign currency exchange contracts are valued based on the mean between closing bid and asked prices of the forward currency contract rates in the London foreign exchange markets on a daily basis as provided by a reliable bank or dealer.
Options, whether on securities, indices, futures contracts, or otherwise, are valued at the last sales price available as of the close of business on the day of valuation or, if there is no such sale price available, at the mean between the bid and asked prices. Options on currencies are valued at the spot price each day.
The value of futures contracts will be the sum of the margin deposit plus or minus the difference between the value of the futures contract on each day the net asset value is calculated and the value on the date the futures contract originated, value being that established on a recognized commodity exchange, or by reference to other customary sources, with gain or loss being realized when the futures contract closes or expires.
Subject to the Board’s oversight, the Board has delegated the day-to-day oversight of pricing matters, including determinations in good faith under the Fund’s procedures the fair value of securities for which current market quotations are not readily available to MetLife Advisers, LLC (“MetLife Advisers” or the “Adviser”).
Investment Transactions and Related Investment Income:
Portfolio security transactions are recorded on the trade date. Dividend income is recorded on the ex-dividend date or, for certain foreign securities, when notified. Interest income, which includes amortization of premium and accretion of discount on debt securities, is recorded on the accrual basis. Realized gains and losses on investments and unrealized appreciation and depreciation are determined on the identified cost basis, which is the same basis used for federal income tax purposes.
Repurchase Agreements:
The Portfolio, through the custodian or a subcustodian, receives delivery of the underlying securities collateralizing repurchase agreements. The Portfolio requires the custodian to take possession, to have legally segregated in the Federal Reserve Book Entry System, or to have segregated within the custodian’s vault, all securities held as collateral for repurchase agreements. It is the Portfolio’s policy that the market value of the collateral be at least equal to 100% of the repurchase price in the case of a repurchase agreement of one-day duration and 102% on all other repurchase agreements. The Portfolio’s subadviser is responsible for determining that the value of the collateral is at all times at least equal to the repurchase price. In connection with transactions in repurchase agreements, if the seller defaults and the value of the collateral declines or if the seller enters an insolvency proceeding, realization of the collateral by the Portfolio may be delayed, limited or wholly denied.
Foreign Currency Translation:
The books and records of the Portfolio are maintained in U.S. dollars. The values of securities, currencies and other assets and liabilities denominated in currencies other than U.S. dollars are translated into U.S. dollars based upon foreign exchange rates prevailing at the end of the period. Purchases and sales of investment securities, income and expenses are translated on the respective dates of such transactions. Since the values of investment securities are presented at the foreign exchange rates prevailing at the end of the period, it is not practical to isolate that portion of the results of operations arising from changes in exchange rates from that portion of the results of operations reflecting fluctuations arising from changes in market prices of the investment securities. Such fluctuations are included in the net realized and unrealized gain or loss on investments.
MSF-20
Metropolitan Series Fund, Inc.
MFS Total Return Portfolio
Notes to Financial Statements—December 31, 2008—(Continued)
Net realized foreign exchange gains or losses arise from sales of foreign currency, currency gains or losses realized between the trade and settlement dates on securities transactions, and the difference between the amounts of dividends, interest, and foreign withholding taxes recorded by the Portfolio and the U.S. dollar equivalent of the amounts actually received or paid by the Portfolio. Net unrealized foreign exchange gains and losses arise from changes in the value of assets and liabilities, other than investment securities, resulting from changes in the exchange rate.
Forward Foreign Currency Exchange Contracts:
The Portfolio may enter into forward foreign currency exchange contracts primarily to hedge against foreign currency exchange rate risks on its non-U.S. dollar denominated investment securities. When entering into a forward currency contract, the Portfolio agrees to receive or deliver a fixed quantity of foreign currency for an agreed-upon price on an agreed future date. These contracts are valued daily and the Portfolio’s net equity therein, representing unrealized gain or loss on the contracts as measured by the difference between the foreign exchange rates at the dates of entry into the contracts and the forward rates at the settlement date, is included in the Statement of Assets and Liabilities. Realized and unrealized gains and losses are included in the Statement of Operations. These instruments involve market and/or credit risk in excess of the amount recognized in the Statement of Assets and Liabilities. Risks arise from the possible inability of counterparties to meet the terms of their contracts and from movement in currency and securities values and interest rates.
Futures Contracts:
The Portfolio may buy and sell futures contracts (on recognized exchanges) as a hedge, to maintain exposure to the broad equity markets or to enhance return. Futures contracts are agreements to buy or sell a security, or deliver a final cash settlement price in connection with an index, interest rate, currency, or other contracts not calling for physical delivery, for a set price in the future. The Portfolio must post an amount equal to a portion of the total market value of the futures contract as futures variation margin, which is returned when the Portfolio’s obligations under the contract have been satisfied. From time to time thereafter, the Portfolio may have to post variation margin to maintain this amount as the market value of the contract fluctuates. Risks of entering into futures contracts (and related options) include the possibility that there may be an illiquid market and that a change in the value of the contract or option may not correlate with changes in the value of the underlying securities.
Options:
The Portfolio may use options to hedge against changes in values of securities the Portfolio owns or expects to purchase, to maintain exposure to the broad equity markets or to enhance return. Writing puts or buying calls tends to increase the Portfolio’s exposure to the underlying instrument and writing calls or buying puts tends to decrease the Portfolio’s exposure to the underlying instrument, and can be used to hedge other Portfolio investments. For options purchased to hedge the Portfolio’s investments, the potential risk to the Portfolio is that the change in value of options contracts may not correspond to the change in value of the hedged instruments. In addition, losses may arise from changes in the value of the underlying instruments, if there is an illiquid secondary market, or if the counterparty is unable to perform. The maximum loss for purchased options is limited to the premium initially paid for the option. For options written by the Portfolio, the maximum loss is not limited to the premium initially received for the option.
The main risk associated with purchasing an option is that the option expires without being exercised. In this case, the option expires worthless and the premium paid for the option is considered the loss. The risk associated with writing a call option is that the Portfolio may forgo the opportunity for a profit if the market value of the underlying position increases and the option is exercised. The risk in writing a put option is that the Portfolio may incur a loss if the market value of the underlying position decreases and the option is exercised. In addition, the Portfolio risks not being able to enter into a closing transaction for the written option as the result of an illiquid market.
“When-Issued” Securities:
Purchasing securities “when-issued” is a forward commitment by the Portfolio to buy a security. The estimated amount of the Portfolio’s payment obligation and the security’s interest rate are determined when the commitment is made, even though no interest accrues until the security is issued, which is generally 15 to 120 days later. The Portfolio will segregate liquid assets with its custodian sufficient at all times to satisfy these commitments. If the value of the security is less when delivered than when the commitment was made, the Portfolio will suffer a loss.
MSF-21
Metropolitan Series Fund, Inc.
MFS Total Return Portfolio
Notes to Financial Statements—December 31, 2008—(Continued)
High Yield Securities:
The Portfolio may invest in high yield instruments that are subject to certain credit and market risks. The yields of high yield instruments reflect, among other things, perceived credit risk. The Portfolio’s investments in securities rated below investment grade typically involve risks not associated with higher rated securities including, among others, greater risk related to timely and ultimate payment of interest and principal, greater market price volatility and less liquid secondary market trading.
Mortgage-Backed Securities:
The Portfolio invests a portion of its assets in securities of issuers that hold mortgage and asset backed securities and direct investments in securities backed by commercial and residential mortgage loans and other financial assets. The value and related income of these securities are sensitive to changes in economic conditions, including delinquencies and/or defaults. Continuing shifts in the market’s perception of credit quality on securities backed by commercial and residential mortgage loans and other financial assets may result in increased volatility of market price and periods of illiquidity that can negatively impact the valuation of certain issuers held by the Portfolio. At December 31, 2008, the Portfolio held securities of issuers that hold mortgage and asset backed securities and direct investments in mortgage and asset backed securities (excluding federal agencies) with an aggregate value of $30,386,554 (representing 2.6% of the Portfolio’s total net assets).
Federal Income Taxes:
It is the Portfolio’s policy to comply with the requirements of the Internal Revenue Code of 1986, as amended (the “Code”), and regulations thereunder, applicable to regulated investment companies and to distribute, with respect to each taxable year, all of its taxable income to shareholders. Therefore, no federal income tax provision is required. The Portfolio is subject to the provisions of the Financial Accounting Standards Board Interpretation (“FASB”) No. 48, Accounting for Uncertainties in Income Taxes (FIN 48). FIN 48 sets forth a minimum threshold for financial statement recognition of the benefit of a tax position taken or expected to be taken in a tax return. The implementation of FIN 48 did not result in any unrecognized tax benefits in the accompanying financial statements. Each of the Portfolio’s federal tax returns for the prior three fiscal years remains subject to examination by the Internal Revenue Service.
As of December 31, 2008, the Portfolio had capital loss carryforwards as follows:
| | | | | | |
Expiring
12/31/16 | | Expiring
12/31/09 | | Total |
$85,128,576 | | $ | 10,856,151 | | $ | 95,984,727 |
The utilization of the capital loss carryforward acquired as part of a merger may be limited under Section 382 of the Internal Revenue Code.
Pursuant to Section 852 of the Code, the Portfolio designated the amount shown below under Long Term Gain as capital gain dividends for its taxable year ended December 31, 2008. The tax character of distributions paid for the periods ended December 31, 2008 and 2007 was as follows:
| | | | | | | | | | | | | | | | | | | | | |
Ordinary Income | | Long Term Gain | | Return of Capital | | Total |
2008 | | 2007 | | 2008 | | 2007 | | 2008 | | 2007 | | 2008 | | 2007 |
$70,504,822 | | $ | 41,790,578 | | $ | 108,176,762 | | $ | 63,176,677 | | $ | — | | $ | — | | $ | 178,681,584 | | $ | 104,967,255 |
As of December 31, 2008, the components of distributable earnings (accumulated losses) on a federal income tax basis were as follows:
| | | | | | | | | | | | | | | |
Undistributed
Ordinary
Income | | Undistributed
Long Term
Gain | | Unrealized
Depreciation | | | Loss
Carryforwards | | | Total | |
$47,643,404 | | $ | — | | $ | (214,212,220 | ) | | $ | (95,984,727 | ) | | $ | (262,553,543 | ) |
Pursuant to Federal income tax regulations applicable to investment companies, the Portfolio has elected to treat net capital losses realized between November 1 and December 31 of each year as occurring on the first day of the following tax year. For the year ended December 31, 2008, the following amounts of realized capital and currency losses reflected in the accompanying financial statements will not be recognized for Federal income tax purposes until January 1, 2009:
| | | | |
Currency | | Capital | |
$— | | $ | (79,649,179 | ) |
MSF-22
Metropolitan Series Fund, Inc.
MFS Total Return Portfolio
Notes to Financial Statements—December 31, 2008—(Continued)
Dividends and Distributions to Shareholders:
The Portfolio records dividends and distributions on the ex-dividend date. Net realized gains from security transactions (if any) are generally distributed annually to shareholders. The timing and characterization of certain income and capital gains distributions are determined in accordance with federal tax regulations that may differ from GAAP. Permanent book and tax basis differences relating to shareholder distributions will result in reclassification between under/over distributed net investment income, accumulated net realized gains/losses and paid in capital.
Expense Reductions:
Certain Portfolio trades are directed to brokers who paid a portion of the Portfolio’s expenses. Amounts paid for the Portfolio are shown as expense reductions in the Statement of Operations.
| 3. | INVESTMENT TRANSACTIONS: |
For the year ended December 31, 2008, purchases and sales of securities (excluding short term investments) for the Portfolio were as follows:
| | | | | | | | | |
Purchases | | Sales |
U.S. Government | | Other | | U.S. Government | | Other |
$126,400,520 | | $ | 665,517,335 | | $ | 283,018,063 | | $ | 722,584,208 |
| 4. | INVESTMENT MANAGEMENT FEES AND OTHER TRANSACTIONS WITH AFFILIATES: |
Investment Management Agreement:
MetLife Advisers is the investment adviser to the Portfolio. The Fund has entered into an investment management agreement with MetLife Advisers with respect to the Portfolio. For providing investment management services to the Portfolio, MetLife Advisers receives monthly compensation at the following annual rates:
| | | | |
Management
Fees earned by
MetLife Advisers
for the year ended
December 31, 2008 | | Annual
percentage
rates paid to
MetLife Advisers | | Based on Portfolios
average daily net asset
levels |
$8,186,097 | | 0.600% | | Of the first $250 million |
| | 0.550% | | Of the next $500 million |
| | 0.500% | | On amounts in excess of $750 million |
Certain officers and directors of the Fund may also be officers of MetLife Advisers; however, such officers and directors receive no compensation from the Fund.
MetLife Advisers has entered into an investment subadvisory agreement with respect to the Portfolio. Massachusetts Financial Services Co. is compensated by MetLife Advisers to provide subadvisory services for the Portfolio.
Service and Distribution Fees:
The Fund has adopted a Distribution and Service Plan under Rule 12b-1 of the 1940 Act for the Portfolio’s Class B, E and F shares. Under the Distribution and Service Plan, the Class B, E and F shares of the Portfolio pay a fee to compensate the Insurance Companies (or their affiliates) and other broker-dealers and financial intermediaries involved in the offer and sale of Portfolio shares for promoting or selling and servicing the Class B, E and F shares. The fees under the Distribution and Service Plan for each applicable class of the Portfolio’s shares are calculated as a percentage of the Portfolio’s average daily net assets that are attributable to that Class. Currently, the fee is 0.25% per year for Class B shares, 0.15% per year for Class E shares and 0.20% per year for Class F shares. Amounts paid by the Portfolio for the year ended December 31, 2008 are shown as Service and Distribution fees in the Statement of Operations.
The Fund has entered into a securities lending arrangement with the Fund’s custodian, State Street Bank and Trust Company (the “custodian”). Under the agreement, the custodian is authorized to loan securities on the Portfolios’ behalf. In exchange, the
MSF-23
Metropolitan Series Fund, Inc.
MFS Total Return Portfolio
Notes to Financial Statements—December 31, 2008—(Continued)
Portfolio receives either cash or securities as collateral against the loaned securities. The Portfolio receives collateral at least equal to 102% of the market value of the loaned securities (105% for foreign securities), at each loan’s inception. Collateral must be maintained at least at 100% of the market value of the loaned securities for the duration of the loan. The cash collateral is invested in the Navigator Securities Lending Prime Portfolio, an affiliate of the custodian, which invests in a variety of high quality U.S. dollar-denominated instruments. If the market value of the collateral at the close of trading on a business day is less than 100% of the market value of the loaned securities at the close of trading on that day, the borrower shall be required to deliver, by the close of business on the following business day, an additional amount of collateral, equal to at least 100% of the market value of all the loaned securities as of such preceding day. The Portfolio receives 80% of the annual net income from securities lending transactions, which is included in interest income of the Portfolio. The remaining 20% is paid to the custodian as compensation for its securities lending services. Interest income received by the Portfolio via lending transactions during the year ended December 31, 2008 is footnoted in the Statement of Operations. The Portfolio bears the risk of any deficiency in the amount of collateral available for return to a borrower due to a loss in an approved investment purchased with such collateral. Any outstanding loans by the Portfolio at December 31, 2008 are footnoted in the Schedule of Investments.
| 6. | MARKET AND CREDIT RISK: |
In the normal course of business, the Portfolio invests in securities and enters into transactions where risks exist due to fluctuations in the market (market risk) or failure of the other party to a transaction to perform (credit risk). The value of securities held by the Portfolio may decline in response to certain events, including those directly involving the companies whose securities are owned by the Portfolio; conditions affecting the general economy; overall market changes; local, regional or global political, social or economic instability; and currency and interest rate and price fluctuations. Similar to credit risk, the Portfolio may be exposed to counterparty risk, or the risk that an entity with which the Portfolio has unsettled or open transactions may default. Financial assets, which potentially expose the Portfolio to credit and counterparty risks, consist principally of investments and cash due from counterparties. The extent of the Portfolio’s exposure to credit and counterparty risks in respect to these financial assets approximates their value as recorded in the Portfolio’s Statements of Assets and Liabilities.
| 7. | RECENT ACCOUNTING PRONOUNCEMENTS: |
In March 2008, the FASB issued Statement of Financial Accounting Standards No. 161, Disclosures about Derivative Instruments and Hedging Activities (“FAS 161”), an amendment of FASB Statement No. 133. FAS 161 requires enhanced disclosures about (a) how and why an entity uses derivative instruments, (b) how derivative instruments and hedging activities are accounted for, and (c) how derivative instruments and related hedging activities affect a fund’s financial position, financial performance, and cash flows. Management does not believe the adoption of FAS 161 will materially impact the financial statement amounts, but will require additional disclosures. This will include qualitative and quantitative disclosures on derivative positions existing at period end and the effect of using derivatives during the reporting period. FAS 161 is effective for financial statements issued for fiscal years and interim periods beginning after November 15, 2008. Management is currently evaluating the impact the adoption of FAS 161 will have on the Portfolio’s financial statement disclosures.
MSF-24
Metropolitan Series Fund, Inc.
MFS Total Return Portfolio
Report of Independent Registered Public Accounting Firm
To the Shareholders and Board of Directors of Metropolitan Series Fund, Inc.:
We have audited the accompanying statement of assets and liabilities, including the schedule of investments, of the MFS Total Return Portfolio (one of the portfolios constituting the Metropolitan Series Fund, Inc.) (the “Fund”) as of December 31, 2008, and the related statement of operations for the year then ended, the statements of changes in net assets for each of the two years in the period then ended, and the financial highlights for each of the five years in the period then ended. These financial statements and financial highlights are the responsibility of the Fund’s management. Our responsibility is to express an opinion on these financial statements and financial highlights based on our audits.
We conducted our audits in accordance with the standards of the Public Company Accounting Oversight Board (United States). Those standards require that we plan and perform the audit to obtain reasonable assurance about whether the financial statements and financial highlights are free of material misstatement. The Fund is not required to have, nor were we engaged to perform, an audit of its internal control over financial reporting. Our audits included consideration of internal control over financial reporting as a basis for designing audit procedures that are appropriate in the circumstances, but not for the purpose of expressing an opinion on the effectiveness of the Fund’s internal control over financial reporting. Accordingly, we express no such opinion. An audit also includes examining, on a test basis, evidence supporting the amounts and disclosures in the financial statements, assessing the accounting principles used and significant estimates made by management, as well as evaluating the overall financial statement presentation. Our procedures included confirmation of securities owned as of December 31, 2008, by correspondence with the custodian and brokers; where replies were not received from brokers, we performed other auditing procedures. We believe that our audits provide a reasonable basis for our opinion.
In our opinion, the financial statements and financial highlights referred to above present fairly, in all material respects, the financial position of the MFS Total Return Portfolio of the Metropolitan Series Fund, Inc. as of December 31, 2008, the results of its operations for the year then ended, the changes in its net assets for each of the two years in the period then ended, and the financial highlights for each of the five years in the period then ended, in conformity with accounting principles generally accepted in the United States of America.
Deloitte & Touche LLP
Boston, Massachusetts
February 25, 2009
MSF-25
Metropolitan Series Fund, Inc.
Directors and Officers
The Fund’s Directors review actions of the Fund’s investment adviser and subadvisers, and decide upon matters of general policy. The Fund’s officers supervise the daily business operations of the Fund. The Board of Directors and the Fund’s officers are listed below. Each Director is responsible for overseeing all 38 Portfolios of the Fund. There is no limit to the term a Director may serve. Directors serve until their resignation, retirement or removal in accordance with the Fund’s organizational documents and policies adopted by the Board from time to time. Officers hold office at the pleasure of the Board or until the election or appointment and the qualification of a successor. The address of the Directors and officers is c/o Metropolitan Series Fund, Inc., 501 Boylston Street, Boston, MA 02116.
Interested Directors(1)
Each Director below is an “interested person” (as defined by the 1940 Act) with respect to the Fund in that Ms. Forget is an employee of MetLife and Mr. Typermass is a former employee of MetLife and owns securities issued by MetLife, Inc., the ultimate parent company of MetLife Advisers.
| | | | | | | | |
Name, Address and Age | | Current
position(s)
with Fund | | Position(s)
held since | | Principal occupations
over past five years, including other directorships(2) | | Number of
Portfolios in
Fund Complex
Overseen by
Director(3) |
Elizabeth M. Forget Age: 42 | | Director, Chairman of the Board, President and Chief Executive Officer | | 2006 | | Senior Vice President (since 2007), MetLife, Inc.; President, Met Investors Advisory, LLC; Trustee and President, Met Investors Series Trust; Executive Vice President, MetLife Investors Group, Inc.; President, Chief Executive Officer and Chair of the Board of Managers (since 2006), MetLife Advisers; President, Met Investors Advisory, LLC. | | 87 |
| | | | |
Arthur G. Typermass Age: 71 | | Director | | 1998 | | Formerly, Senior Vice President and Treasurer, MetLife. | | 38 |
Non-Interested Directors(1)
Each Director below is not an “interested person” (as defined by the 1940 Act) with respect to the Fund (collectively, the “Independent Directors”).
| | | | | | | | |
Name, Address and Age | | Current
position(s)
with Fund | | Position(s)
held since | | Principal occupations
over past five years, including other directorships(2) | | Number of
Portfolios in
Fund Complex
Overseen by
Director(3) |
Steve A. Garban† Age: 71 | | Director | | 1985 | | Formerly, Chief Financial Officer, Senior Vice President Finance and Operations and Treasurer (Emeritus), The Pennsylvania State University. | | 38 |
| | | | |
Linda B. Strumpf Age: 61 | | Director | | 2000 | | Vice President and Chief Investment Officer, Ford Foundation. | | 38 |
| | | | |
Michael S. Scott Morton† Age: 71 | | Director | | 1993 | | Jay W. Forrester Professor of Management (Emeritus) at Sloan School of Management, MIT. | | 38 |
| | | | |
H. Jesse Arnelle Age: 75 | | Director | | 2001 | | Formerly, Counsel, Womble Carlyle Sandrie & Rice; Director, Textron Inc. (global multi- industry company)*; formerly, Director, Gannet Co. Inc. (diversified news and information company)*; formerly, Director, Eastman Chemical Company (global chemical company)*; formerly, Director, Waste Management, Inc.*; formerly, Director, Armstrong Holdings Inc. (parent company of floor and ceiling products business)*; formerly, Director, FPL Group Inc. (public utility holding company)*; Director, URS Corporation (engineering design services firm)*. | | 38 |
MSF-26
Metropolitan Series Fund, Inc.
Directors and Officers—(Continued)
| | | | | | | | |
Name, Address and Age | | Current
position(s)
with Fund | | Position(s)
held since | | Principal occupations
over past five years, including other directorships(2) | | Number of
Portfolios in
Fund Complex
Overseen by
Director(3) |
Nancy Hawthorne Age: 57 | | Director | | 2003 | | Chief Executive Officer, Clerestory LLC (corporate financial advisor); Director, Avid Technologies (computer software company)*; formerly, Chairman of the Board of Avid Technologies; formerly, Board of Advisors, L. Knife & Sons, Inc. (beverage distributor); formerly, Trustee, New England Zenith Fund (“Zenith Fund”)**; formerly, Chief Executive Officer and Managing Partner, Hawthorne, Krauss and Associates (corporate financial advisor); formerly, Chief Financial Officer and Executive Vice President, Continental Cablevision, subsequently renamed MediaOne (cable television company); formerly, Director, Life F/X, Inc.; formerly, Chairman of the Board, WorldClinic (distance medicine company); formerly, Director, Perini Corporation (construction company)*; formerly, Director, CGU (property and casualty insurance company); formerly, Director, Beacon Power Corporation (energy company)*. | | 38 |
| | | | |
John T. Ludes Age: 72 | | Director | | 2003 | | President, LFP Properties (consulting firm); Formerly, Trustee, Zenith Fund**; formerly, Vice Chairman, President and Chief Operating Officer, Fortune Brands/American Brands (global conglomerate); formerly, President and CEO, Acushnet Company (athletic equipment company). | | 38 |
Officers(1)
| | | | | | | | |
Name and address | | Age | | Current
position(s)
with Fund | | Position(s)
held since | | Principal occupations over past five years(2) |
| Jeffrey L. Bernier | | 37 | | Senior Vice President | | 2008 | | Vice President (since 2008), MetLife, Inc.; Vice President (since 2008), MetLife; Senior Vice President (since 2008), MetLife Advisers; formerly, Director and Senior Investment Analyst (2004 to 2007), John Hancock Financial Services; formerly, Assistant Vice President (2000 to 2001), Wachovia Securities. |
| | | | |
| Alan C. Leland | | 56 | | Senior Vice President | | 2005 | | Treasurer and Chief Financial Officer, MetLife Advisers, LLC; Treasurer (since 2005), Met Investors Advisory, LLC; Vice President (since 2004), Met Investors Advisory, LLC; Vice President (since 2003), MetLife, Inc.; Vice President, MetLife; Senior Vice President, NELICO. |
| | | | |
| Peter Duffy | | 53 | | Vice President
and Treasurer | | 2000 | | Senior Vice President, MetLife Advisers; Second Vice President (since 2003), NELICO; Vice President, MetLife (since 2004); Vice President (since 2004), MetLife, Inc.; formerly, Vice President and Treasurer, Zenith Fund**. |
| | | | |
| Jeffrey P. Halperin | | 41 | | Chief
Compliance Officer | | 2007 | | Vice President (since 2006), MetLife, Inc.; Vice President (since 2006), MetLife; Chief Compliance Officer (since 2006), Met Investors Series Trust, MetLife Advisers, Met Investors Advisory, LLC and MetLife Investment Advisors Company, LLC. |
| * | Indicates a directorship with a registered investment company or a company subject to the reporting requirements of the Securities Exchange Act of 1934, as amended. |
| ** | The Zenith Fund deregistered with the Securities and Exchange Commission (“SEC”) in 2004. |
| (†) | Served as a trustee, director and/or officer of one or more of the following companies, each of which had a direct or indirect advisory relationship with MetLife Advisers or its affiliates prior to January 31, 2005: State Street Research Financial Trust, State Street Research Income Trust, State Street Research Money Market Trust, State Street Research Institutional Funds, State Street Research Capital Trust, State Street Research Master Investment Trust, State Street Research Equity Trust, State Street Research Securities Trust and State Street Research Exchange Trust (collectively, the “State Street Research Funds”). |
| (1) | During the period shown, each Director of the Fund served as a Trustee of Metropolitan Series Fund II, a registered investment company that ceased investment operations in June of 2008 and has applied for deregistration under the Investment Company Act of 1940. During this period, each officer of the Fund served in the same position with Metropolitan Series Fund II. |
| (2) | Previous positions during the past five years with the Fund; Met Investors Series Trust; MetLife; MetLife, Inc.; MetLife Advisers; Met Investors Advisory, LLC; Zenith Fund; NELICO; or New England Securities Corporation are omitted if not materially different. |
| (3) | The Fund Complex includes the Fund (38 portfolios) and Met Investors Series Trust (49 portfolios). |
MSF-27
Metropolitan Series Fund, Inc.
MFS Total Return Portfolio
Board Approval of Advisory and Subadvisory Agreements
The Fund’s Contract Review Committees of the Board of Directors (the “Board” or the “Directors”) typically meet in early fall to review the Portfolios’ advisory agreements (the “Advisory Agreements”) and subadvisory agreements (the “Subadvisory Agreements,” and, together with the Advisory Agreements, the “Agreements”) and determine whether to recommend that the full Board approve the continuation of the Agreements for an additional one-year period. (Following the initial approval of an Agreement for a new Portfolio or with a new adviser or subadviser, such annual reviews are not required until 2 years following the execution of such Agreement.) After each Committee has made its recommendations, the full Board, including the Independent Directors, determines whether to approve the continuation of each of the Agreements. In addition, the Board, including the Independent Directors, considers matters bearing on the Agreements at most of its other meetings throughout the year and regularly interviews various individuals at MetLife Advisers responsible for the management of the Portfolios. The Directors also interview selected investment managers and other professionals at the subadvisers at various times throughout the year.
The Directors receive all materials that they or MetLife Advisers, the Fund’s investment adviser, and the subadvisers believe to be reasonably necessary for the Directors to evaluate the Agreements and determine whether to approve the continuation of the Agreements. These materials generally include, among other items, (i) information on the investment performance of the Portfolios and the performance of peer groups of funds and the Portfolios’ performance benchmarks, (ii) information on the Portfolios’ advisory and subadvisory fees and other expenses, including information comparing the Portfolios’ expenses to those of peer groups of funds and information about any applicable expense caps and fee “breakpoints,” (iii) sales and redemption data, (iv) information related to the profitability of the Agreements to MetLife Advisers and certain of the subadvisers, and potential “fall-out” or ancillary benefits that MetLife Advisers, the subadvisers or their affiliates may receive as a result of their relationships with the Fund and (v) information obtained through the subadvisers’ responses to certain requests from MetLife Advisers and the Directors and MetLife Advisers’ responses to requests from the Directors. The Directors may also consider other information such as (vi) MetLife Advisers’ and the subadvisers’ financial results and condition, (vii) each Portfolio’s investment objectives and strategies and the size, education and experience of the investment staffs of MetLife Advisers and the relevant subadvisers and their use of technology and external research, (viii) the allocation of the Portfolios’ brokerage, if any, including allocations to brokers affiliated with the subadvisers and the use of “soft” commission dollars to pay Portfolio expenses and to pay for research and other similar services, (ix) the resources devoted to, and the record of compliance with, the Portfolios’ investment policies and restrictions, policies on personal securities transactions and other compliance policies, (x) the responses of MetLife Advisers, the subadvisers and/or their affiliates to certain legal and regulatory proceedings and (xi) the economic outlook generally and for the mutual fund industry in particular. Throughout the process, the Directors have the opportunity to ask questions of and request additional materials from MetLife Advisers and the subadvisers.
Following meetings of each Contract Review Committee on September 10, 2008, the Board, including the Independent Directors, at its November 6-7, 2008 meeting, approved the continuation through December 31, 2009 of the Advisory Agreements for each Portfolio of the Fund and the Subadvisory Agreements for each Portfolio other than the Zenith Equity Portfolio and Asset Allocation Portfolios (which do not have subadvisers) and the Van Eck Global Natural Resources Portfolio, Met/Dimensional International Small Cap Portfolio and Loomis Sayles Small Cap Growth Portfolio (formerly known as the Franklin Templeton Small Cap Growth Portfolio). The Agreements approved for continuation are referred to below as the “Continued Agreements.”
In considering whether to approve the continuation of the Continued Agreements, the Directors, including the Independent Directors, did not identify any single factor as determinative, and each weighed the various factors as he or she deemed appropriate. The Directors considered the following matters in connection with their approval of the Continued Agreements:
The nature, extent and quality of the services provided to the relevant Portfolios under the Continued Agreements. The Directors considered the nature, extent and quality of the services provided by MetLife Advisers, the relevant subadvisers (if any) and their affiliates (each, an “Adviser,” and, collectively, the “Advisers”) to the relevant Portfolios pursuant to the Continued Agreements and the resources dedicated to these Portfolios by the Advisers. In particular, the Directors considered the Advisers’ abilities to attract and retain highly qualified investment professionals. With respect to MetLife Advisers, the Directors considered (for each Portfolio other than the Zenith Equity and Asset Allocation Portfolios) that MetLife Advisers is (i) ultimately responsible for the performance of such Portfolios; (ii) ultimately responsible for the establishment of the investment strategies of each such Portfolio, primarily through its recommendations to the Board regarding the hiring and selection of subadvisers; (iii) responsible for the hiring and selection, subject to Board approval, of subadvisers; and (iv) responsible for maintaining a program of Subadviser oversight reasonably designed to ensure that the subadvisers have reasonable compliance policies and procedures in place. The Directors also considered that MetLife Advisers provides a full range of day-to-day administrative services for the Portfolios involving all aspects of such Portfolios’ day-to-day operations (other than portfolio management). With respect to the Zenith Equity and Asset Allocation Portfolios, the Directors considered both the portfolio management services and the administrative services provided by MetLife Advisers. After reviewing
MSF-28
Metropolitan Series Fund, Inc.
MFS Total Return Portfolio
Board Approval of Advisory and Subadvisory Agreements—(Continued)
these and related factors, the Directors concluded, within the context of their overall conclusions regarding each of the Continued Agreements, that the nature, extent and quality of services provided supported the renewal of these Agreements.
Investment performance of the relevant Portfolios. The Directors reviewed information about the performance of the relevant Portfolios over various time periods, including information prepared by an independent third party that compared the performance of the Portfolios to the performance of peer groups of funds and performance benchmarks. The Directors also reviewed a description of the third party’s methodology for identifying a Portfolio’s peer group(s) for purposes of performance and expense comparisons.
In the case of each relevant Portfolio that had performance that lagged its peer group(s) for certain periods, the Directors concluded that other factors relevant to performance were sufficient, in light of other considerations, to warrant renewal of the Continued Agreements relating to such Portfolio. These factors varied from Portfolio to Portfolio, but included one or more of the following: (i) that such Portfolio’s performance, although lagging in certain recent periods, was stronger over the longer term; (ii) that the underperformance was attributable, to a significant extent, to investment decisions that were reasonable and consistent with the Portfolio’s investment objective(s) and policies and that the Portfolio was performing within the range of reasonable expectations, given market conditions and the Portfolio’s investment objective(s) and policies; (iii) that the Portfolio’s performance was competitive when compared to other relevant performance benchmarks or peer groups; and (iv) that MetLife Advisers and/or the relevant subadviser (if any) had taken or was taking steps designed to help improve the Portfolio’s investment performance (including, in the case of certain Portfolios, that MetLife Advisers was formulating possible proposals, for presentation to the Board in November 2008, to replace the Portfolio’s subadviser or to merge the Portfolio into another Portfolio with a similar investment objective and better investment performance).
The Directors also considered the investment performance of the Advisers and their reputations generally, the historical responsiveness of the Advisers to Director concerns about performance and the willingness of the Advisers to take steps intended to improve performance.
After reviewing these and related factors, the Directors concluded, within the context of their overall conclusions regarding each of the Continued Agreements, that the investment performance of each relevant Portfolio and Adviser was sufficient, in light of other considerations, to warrant the renewal of the Continued Agreements.
The costs of the services to be provided and profits to be realized by the Advisers and their affiliates from their relationships with the Portfolios. The Directors considered the fees charged by MetLife Advisers to the Portfolios for advisory services and, with respect to the subadvised Portfolios, by such subadvisers to MetLife Advisers for subadvisory services (such advisory and subadvisory fees (if any), collectively, “Fees”), as well as the total expense levels of the Portfolios. This information included comparisons (provided by an independent third party) of the Portfolios’ advisory fees and total expense levels to those of their peer groups. In evaluating Fees for the relevant Portfolios, the Directors also took into account the demands, complexity and quality of the investment management services provided to each Portfolio. The Directors considered MetLife Advisers’ recommendations regarding reductions in Fee rates, implementation of Fee breakpoints and institution of Fee waivers and expense caps.
The Directors also considered the compensation directly or indirectly received by the Advisers and their affiliates from their relationships with the relevant Portfolios. The Directors reviewed information relating to the profits received by MetLife Advisers, certain of the subadvisers and their affiliates as a result of their relationships with the relevant Portfolios, and information about the allocation of expenses used to calculate profitability. When reviewing profitability, the Directors also considered the performance of the relevant Portfolios, the expense levels of such Portfolios and whether the relevant Advisers had implemented breakpoints, fee waivers and/or expense caps with respect to such Portfolios.
After reviewing these and related factors, the Directors concluded, within the context of their overall conclusions regarding each of the Continued Agreements, that the Fees charged to each of the relevant Portfolios were fair and reasonable, and that the information provided regarding costs of these services generally, and the related profitability (if known) to the relevant Advisers of their relationships with the relevant Portfolios, supported the renewal of the Continued Agreements.
Economies of Scale. The Directors considered the existence of any economies of scale in the provision of services by the Advisers and whether those economies were shared with the relevant Portfolios through breakpoints in their advisory fees or other means, such as expense caps, fee waivers or relatively low levels of fees. The Directors noted that most of the relevant Portfolios benefited or will benefit from breakpoints, expense caps and/or fee waivers with respect to their advisory fees. In considering these issues, the Directors also took into consideration information relating to the costs of the services provided and the profitability to MetLife Advisers, the relevant subadvisers (if any) and each of their affiliates of their relationships with the relevant Portfolios, as discussed above.
MSF-29
Metropolitan Series Fund, Inc.
MFS Total Return Portfolio
Board Approval of Advisory and Subadvisory Agreements—(Continued)
After reviewing these and related factors, the Directors concluded, within the context of their overall conclusions regarding each of the Continued Agreements, that the extent to which economies of scale were shared with the relevant Portfolios supported the renewal of such Agreements.
Other Factors. The Directors also considered other factors, which included but were not limited to the following:
| | • | | the extent to which each relevant Portfolio operated in accordance with its investment objective, and its record of compliance with its investment restrictions and the compliance programs of the Fund and the Advisers. They also considered the compliance-related resources the Advisers and their affiliates provide to the relevant Portfolios; |
| | • | | the nature, quality, cost and extent of administrative and shareholder services performed by MetLife Advisers and its affiliates under the Advisory Agreements; and |
| | • | | so-called “fall-out benefits” to the Advisers, such as the engagement of their affiliates to provide distribution, brokerage and transfer agency services to the Portfolios, and the benefits of research made available to the relevant Advisers by reason of brokerage commissions generated by the relevant Portfolios’ securities transactions. The Directors also considered the possible conflicts of interest associated with these fall-out and other benefits, and the reporting and other processes in place to disclose and monitor these possible conflicts of interest. |
Based on their evaluation of all factors that they deemed to be material, including those factors described above, and assisted by the advice of independent counsel, the Directors, including the Independent Directors, concluded that each of the Continued Agreements should be continued through December 31, 2009.
MSF-30
A description of the policies and procedures that the Fund uses to determine how to vote proxies relating to portfolio securities is available (i) without charge, upon request, by calling (800) 638-7732 and (ii) on the Securities and Exchange Commission’s (the “SEC”) website at http://www.sec.gov.
Information regarding how the Fund voted proxies relating to portfolio securities during the most recent twelve-month period ended December 31, 2008 is available (i) without charge, upon request, by calling (800) 638-7732 and (ii) on the SEC’s website at http://www.sec.gov.
The Fund’s Statement of Additional Information includes additional information about the Directors of the Fund and is available (i) without charge, upon request, by calling (800) 638-7732 and (ii) on the SEC’s website at http://www.sec.gov.
The Fund files with the SEC a complete schedule of its portfolio holdings, as of the close of the first and third quarters of its fiscal year, on “Form N-Q”. These filings are available on the SEC’s website at www.sec.gov and may be reviewed and copied at the SEC’s Public Reference Room in Washington, DC. (Call 1-800-SEC-0330 for information on the operation of the Public Reference Room.)
MSF-31
Simplify your life…
with MetLife eDelivery® while helping MetLife preserve the planet’s natural resources.
(see details on inside cover)
| | |
Metropolitan Series Fund, Inc. MFS® Value Portfolio Annual Report | | December 31, 2008 |
NOT PART OF THE ANNUAL REPORT
Letter from the President
February 1, 2009
Letter to Policy Holders:
2008 was an extraordinary year in the capital markets around the world and for the global economy. Energy prices rose to record levels early in the year before falling by two-thirds by year-end. A credit crisis that began with concerns about sub-prime mortgages led to massive changes in the financial landscape with government takeovers, forced sales, and outright failures of a number of large, once venerable firms.
While bonds as measured by the Barclays Capital U.S. Aggregate Bond Index (formerly known as, Lehman Brothers U.S. Aggregate Bond Index) were up 5.2% for the year in response to declining interest rates, there were large differences in the total returns of the various sectors of the bond market. U.S. treasury securities were up over 13% as frightened investors sought refuge in what they perceived to be the safest and most liquid investments. In contrast, investment grade corporate securities lost nearly 5% as credit spreads widened and below investment grade or high yield bonds fell over 26%.
In response to the growing credit crisis and the weakening economy, common stocks fell sharply across all regions, styles, and capitalizations. As measured by the Standard and Poor’s 500, U.S. common stocks fell 37% for the year, the worst calendar year decline since the 1930s. Foreign stocks were down even more with the MSCI EAFE Index down 43% for the year.
On the following pages, you will find a complete review of your Portfolio and its investment performance.
MetLife is committed to building your financial freedom. We appreciate your trust and will continue to focus our efforts on meeting your investment needs.
Sincerely,
Elizabeth M. Forget
President, Metropolitan Series Fund, Inc.
Metropolitan Series Fund, Inc.
MFS Value Portfolio
Managed by Massachusetts Financial Services Company
Portfolio Manager Commentary*
PORTFOLIO PERFORMANCE
Massachusetts Financial Services Co. became the subadviser to the Portfolio, and the Portfolio changed its investment objective and principal investment strategies, on January 7, 2008, prior to which the Portfolio was named Harris Oakmark Large Cap Value Portfolio and was subadvised by Harris Associates L.P. On April 28, 2008, the MFS Value Portfolio of the Met Investors Series Trust (the “MIST MFS Value Predecessor”) merged with and into the Portfolio. Prior to the merger, the MIST MFS Value Predecessor had succeeded to the operations of the MFS Value Portfolio of the Travelers Series Trust (the “TST MFS Value Predecessor”) on May 1, 2006. Because the MIST MFS Value Predecessor was the accounting survivor of the merger with and into the Portfolio, the performance information set forth below and in the performance table on the following page reflects the management of MFS in the MIST MFS Value Predecessor and the TST MFS Value Predecessor, but not for the Portfolio.
For the twelve-month period ended December 31, 2008, the Class A shares of the MFS Value Portfolio returned -32.5%, compared to its benchmark, the Russell 1000 Value Index1, which returned -36.8%. The average return of its peer group, the Lipper Variable Insurance Products2 Large Cap Value Funds Universe, was -37.1% over the same period.
PORTFOLIO REVIEW
The U.S. economy and financial markets experienced significant deterioration and extraordinary volatility over the reporting period. U.S. economic growth slowed significantly, despite the short-term bounce from the second quarter fiscal stimulus. Strong domestic headwinds included accelerated deterioration in the housing market, anemic corporate investment, a markedly weaker job market, and a much tighter credit environment. During the second half of the year, a seemingly continuous series of tumultuous financial events hammered markets, including: the distressed sale of failing Bear Stearns to JPMorgan, the conservatorship of Government Sponsored Enterprises (GSEs) Fannie Mae and Freddie Mac, the bankruptcy of investment bank Lehman Brothers, the Federal Reserve Bank’s complex intervention of insurance company American International Group (AIG), the nationalization of several large European banks, the failure of Washington Mutual, and the distressed sale of Wachovia. As a result of this barrage of turbulent news, global equity markets pushed significantly lower and credit markets witnessed the worst dislocation since the beginning of the credit crisis.
While reasonably resilient during the first half of the year, the global economy and financial system increasingly experienced considerable negative spillovers from the U.S. slowdown. Not only did Europe and Japan show obvious signs of economic softening, the more powerful engine of global growth—emerging markets—also began to display weakening dynamics.
During the reporting period, the U.S. Federal Reserve Board cut interest rates aggressively and introduced a multitude of new lending facilities to alleviate ever-tightening credit markets, while the U.S. federal government moved quickly to design and implement a meaningful fiscal stimulus package. Although several other global central banks also cut rates, the dilemma of rising energy and food prices heightened concerns among central bankers that inflationary expectations might become unhinged despite weaker growth. Only late in the year did slowing global growth result in a precipitous decline in commodity prices, which began to ease inflation and inflationary expectations. As inflationary concerns diminished in the face of global deleveraging, and equity and credit markets deteriorated more sharply, a coordinated rate cut marked the beginning of much more aggressive easing by the major global central banks.
Strong stock selection in the industrial goods and services sector boosted performance relative to the Russell 1000 Value Index. Not holding poor-performing diversified industrial conglomerate General Electric and the Portfolio’s position in defense contractor Lockheed Martin, which is not a benchmark constituent, were key factors in this result.
The Portfolio’s underweighted positioning in the financial services sector also aided relative performance. Not holding insurance firm American International Group (AIG) and financial services firm Wachovia helped as both these securities underperformed the benchmark. Positioning in international financial conglomerate Citigroup also bolstered relative returns.
Stock selection in the technology sector helped relative results. The Portfolio’s holdings of enterprise software products maker Oracle helped relative performance over the reporting period.
Top relative contributors in other sectors included tobacco company Philip Morris, management consulting firm Accenture, and paint producer Sherwin Williams. Not holding poor-performing precious metals company Freeport-McMoran also strengthened relative performance.
Stock selection and an underweighted position in the health care sector was the primary detractor from performance. The Portfolio’s avoidance of biotechnology firm Amgen, its underweighted position in pharmaceutical giant Pfizer and its ownership of health insurance provider UnitedHealth Group held back relative results.
Elsewhere, an underweighted position in integrated oil and gas company Exxon Mobil and telecommunications provider Verizon hindered relative results. Not holding financial services firm Wells Fargo for a majority of the period weighed on the Portfolio’s results. Additionally, the Portfolio’s positions in insurance company Genworth Financial, financial services firm Goldman Sachs, cruise line operator Royal Caribbean and investment management firm UBS also dampened relative results.
* The views expressed above are those of the subadvisory firm as of December 31, 2008 and are subject to change based on market and other conditions. Information about the Portfolio’s holdings, asset allocation, industry allocation, or country diversification is historical and is not an indication of future Portfolio composition, which will vary. The performance of any index mentioned in this commentary has not been adjusted for ongoing management, distribution and operating expenses, and sales charges applicable to mutual fund investments. Direct investment in any index is not possible.
1 The Russell 1000® Value Index is an unmanaged measure of the largest capitalized U.S. domiciled companies with a less than average growth orientation. Companies in this Index generally have a low price-to-book and price-to-earnings ratio, higher divided yields and lower forecasted growth values.
2 The Lipper Variable Products Fund Average is an average of the total return performance (calculated on the basis of net asset value) of variable product funds with similar investment objectives to those of the subject Portfolio as calculated by Lipper Analytical Services, an independent mutual fund ranking service.
MSF-2
Metropolitan Series Fund, Inc.
MFS Value Portfolio
A $10,000 INVESTMENT COMPARED TO THE RUSSELL 1000 VALUE INDEX
Average Annual Returns as of December 31, 2008
| | | | | | | | | | | | |
| | | MFS Value Portfolio | | | Russell 1000
Value Index | |
| | | Class A | | | Class B | | | Class E | | |
| 1 Year | | -32.5 | % | | — | | | — | | | -36.8 | % |
| 5 Year | | 1.7 | | | — | | | — | | | -0.8 | |
| 10 Year | | 3.4 | | | — | | | — | | | 1.4 | |
| Since Inception | | — | | | -29.6 | % | | -29.6 | % | | — | |
Performance numbers are net of all Portfolio expenses but do not include any insurance, sales, or administrative charges of variable annuity or life insurance contracts or any additional expenses that participants in certain eligible qualified plans may bear relating to the operations of their plans. If these charges were included, the returns would be lower.
Inception dates of the Class A, Class B and Class E shares are: 7/20/98, 4/28/08 and 4/28/08, respectively. Since inception returns for Class B and E displayed above are not annualized.
This information represents past performance and is not indicative of future results. Investment return and principal value may fluctuate so that shares, upon redemption, may be worth more or less than the original cost.
PORTFOLIO COMPOSITION
as of December 31, 2008
Top Holdings
| | |
| | | % of Total
Net Assets |
Lockheed Martin Corp. | | 4.5% |
Philip Morris International, Inc. | | 4.0% |
AT&T, Inc. | | 3.8% |
The Allstate Corp. | | 3.3% |
Total S.A. (ADR) | | 3.3% |
Oracle Corp. | | 2.7% |
Exxon Mobil Corp. | | 2.6% |
The Bank of New York Mellon Corp. | | 2.3% |
Chevron Corp. | | 2.3% |
Northrop Grumman Corp. | | 2.2% |
Top Sectors
| | |
| | | % of Equity
Market Value |
Financial | | 17.5% |
Energy | | 15.2% |
Utilities & Communications | | 11.7% |
Consumer Staples | | 11.5% |
Industrial Goods & Services | | 10.9% |
Health Care | | 8.1% |
Technology | | 7.3% |
Leisure | | 4.1% |
Retailing | | 3.8% |
Basic Materials | | 3.5% |
MSF-3
Metropolitan Series Fund, Inc.
Shareholder Expense Example
As a shareholder of the Portfolio, you incur ongoing costs, including management fees; distribution and service (12b-1) fees; and other Portfolio expenses. This example is intended to help you understand your ongoing costs (in dollars) (referred to as “expenses”) of investing in the Portfolio and compare these costs with the ongoing costs of investing in other mutual funds. The example is based on an investment of $1,000 invested at the beginning of the period and held for the entire period, July 1, 2008 through December 31, 2008.
Actual Expenses
The first line for each share class of the Portfolio in the table below provides information about actual account values and actual expenses. You may use the information in this line, together with the amount you invested in the particular share class of the Portfolio, to estimate the expenses that you paid over the period. Simply divide your account value by $1,000 (for example, an $8,600 account value divided by $1,000=8.6), then multiply the result by the number in the first line under the heading entitled “Expenses Paid During Period” to estimate the expenses you paid on your account during this period.
Hypothetical Example for Comparison Purposes
The second line for each share class of the Portfolio in the table below provides information about hypothetical account values and hypothetical expenses based on the Portfolio’s actual expense ratio and an assumed rate of return of 5% per year before expenses, which is not the Portfolio’s actual return. The hypothetical account values and expenses may not be used to estimate the actual ending account balance or expenses you paid for the period. You may use this information to compare the ongoing costs of investing in the Portfolio and other funds. To do so, compare this 5% hypothetical example with the 5% hypothetical examples that appear in the shareholder reports of the other funds.
Please note that the expenses shown in the table are meant to highlight your ongoing costs only and do not reflect any fees or charges of your variable insurance product or any additional expenses that participants in certain eligible qualified plans may bear relating to the operations of their plan. Therefore, the second line for each share class in the table is useful in comparing ongoing costs only, and will not help you determine the relative total costs of owning different funds. In addition, if these other costs were included, your costs would have been higher.
| | | | | | | | | | | | | | |
Portfolio | | | | Annualized
Expense
Ratio | | | Beginning
Account Value
July 1,
2008 | | Ending
Account Value
December 31,
2008 | | Expenses Paid
During Period*
July 1, 2008
to
December 31,
2008 |
MFS Value—Class A(a) | | Actual | | 0.72 | % | | $ | 1,000.00 | | $ | 756.12 | | $ | 3.18 |
| | Hypothetical | | 0.72 | % | | $ | 1,000.00 | | $ | 1,021.47 | | $ | 3.66 |
| | | | | |
MFS Value—Class B(a) | | Actual | | 0.97 | % | | $ | 1,000.00 | | $ | 754.08 | | $ | 4.28 |
| | Hypothetical | | 0.97 | % | | $ | 1,000.00 | | $ | 1,020.20 | | $ | 4.93 |
| | | | | |
MFS Value—Class E(a) | | Actual | | 0.87 | % | | $ | 1,000.00 | | $ | 754.90 | | $ | 3.84 |
| | Hypothetical | | 0.87 | % | | $ | 1,000.00 | | $ | 1,020.71 | | $ | 4.42 |
* Expenses paid are equal to the Portfolio’s annualized expense ratio for the most recent six month period, as shown above, multiplied by the average account value over the period, multiplied by the number of days in the most recent fiscal half-year, divided by 366 (to reflect the the one-half year period).
(a) The annualized expense ratio shown reflects the impact of the management fee waiver as described in Note 4 to the Financial Statements.
MSF-4
Metropolitan Series Fund, Inc.
MFS Value Portfolio
Schedule of Investments as of December 31, 2008
Common Stock—98.4% of Total Net Assets
| | | | | |
| Security Description | | Shares | | Value* |
| | | | | |
| | |
Aerospace & Defense—8.5% | | | | | |
Lockheed Martin Corp. | | 317,850 | | $ | 26,724,828 |
Northrop Grumman Corp. | | 292,880 | | | 13,191,315 |
United Technologies Corp. | | 188,190 | | | 10,086,984 |
| | | | | |
| | | | | 50,003,127 |
| | | | | |
| | |
Auto Components—0.5% | | | | | |
Johnson Controls, Inc. | | 160,860 | | | 2,921,218 |
| | | | | |
| | |
Beverages—3.1% | | | | | |
Diageo, Plc. (GBP) | | 531,010 | | | 7,386,629 |
Molson Coors Brewing Co. (a) | | 66,570 | | | 3,256,604 |
Pepsi Bottling Group, Inc. | | 24,920 | | | 560,949 |
PepsiCo, Inc. | | 128,380 | | | 7,031,373 |
| | | | | |
| | | | | 18,235,555 |
| | | | | |
| | |
Capital Markets—7.2% | | | | | |
Franklin Resources, Inc. | | 86,020 | | | 5,486,355 |
Invesco, Ltd. | | 65,040 | | | 939,178 |
Merrill Lynch & Co., Inc. | | 224,010 | | | 2,607,476 |
State Street Corp. | | 226,860 | | | 8,922,404 |
The Bank of New York Mellon Corp. | | 480,906 | | | 13,624,067 |
The Goldman Sachs Group, Inc. | | 124,990 | | | 10,547,906 |
| | | | | |
| | | | | 42,127,386 |
| | | | | |
| | |
Chemicals—2.5% | | | | | |
Air Products & Chemicals, Inc. | | 85,460 | | | 4,296,074 |
PPG Industries, Inc. | | 244,210 | | | 10,361,830 |
| | | | | |
| | | | | 14,657,904 |
| | | | | |
| | |
Commercial Banks—1.7% | | | | | |
PNC Financial Services Group, Inc. | | 100,730 | | | 4,935,770 |
SunTrust Banks, Inc. | | 40,770 | | | 1,204,346 |
Wells Fargo & Co. | | 127,160 | | | 3,748,677 |
| | | | | |
| | | | | 9,888,793 |
| | | | | |
| | |
Computers & Peripherals—2.2% | | | | | |
Hewlett-Packard Co. | | 110,330 | | | 4,003,876 |
International Business Machines Corp. | | 109,400 | | | 9,207,104 |
| | | | | |
| | | | | 13,210,980 |
| | | | | |
| | |
Diversified Financial Services—2.7% | | | | | |
Bank of America Corp. | | 361,827 | | | 5,094,524 |
JPMorgan Chase & Co. | | 341,180 | | | 10,757,406 |
| | | | | |
| | | | | 15,851,930 |
| | | | | |
|
Diversified Telecommunication Services—4.3% |
AT&T, Inc. | | 789,310 | | | 22,495,335 |
Verizon Communications, Inc. | | 73,460 | | | 2,490,294 |
| | | | | |
| | | | | 24,985,629 |
| | | | | |
| | |
Electric Utilities—2.7% | | | | | |
Entergy Corp. | | 57,440 | | | 4,774,987 |
FPL Group, Inc. | | 112,150 | | | 5,644,510 |
| | | | | |
| Security Description | | Shares | | Value* |
| | | | | |
| | |
Electric Utilities—(Continued) | | | | | |
PPL Corp. | | 173,400 | | $ | 5,321,646 |
| | | | | |
| | | | | 15,741,143 |
| | | | | |
|
Electronic Equipment, Instruments & Components—0.2% |
Agilent Technologies, Inc. (b) | | 89,460 | | | 1,398,260 |
| | | | | |
| | |
Energy Equipment & Services—0.5% | | | | | |
National Oilwell Varco, Inc. (b) | | 109,690 | | | 2,680,824 |
| | | | | |
| | |
Food & Staples Retailing—1.6% | | | | | |
CVS Caremark Corp. | | 247,338 | | | 7,108,494 |
The Kroger Co. | | 76,820 | | | 2,028,816 |
| | | | | |
| | | | | 9,137,310 |
| | | | | |
| | |
Food Products—2.3% | | | | | |
Kellogg Co. | | 58,140 | | | 2,549,439 |
Nestle S.A. (CHF) | | 224,608 | | | 8,852,380 |
The J. M. Smucker Co. | | 46,800 | | | 2,029,248 |
| | | | | |
| | | | | 13,431,067 |
| | | | | |
| | |
Health Care Providers & Services—0.2% | | | | | |
WellPoint, Inc. (b) | | 32,630 | | | 1,374,702 |
| | | | | |
| | |
Hotels, Restaurants & Leisure—0.6% | | | | | |
Royal Caribbean Cruises, Ltd. (a) (b) | | 276,770 | | | 3,805,587 |
| | | | | |
| | |
Household Products—1.2% | | | | | |
Procter & Gamble Co. | | 114,595 | | | 7,084,263 |
| | | | | |
| | |
Industrial Conglomerates—1.0% | | | | | |
3M Co. | | 106,800 | | | 6,145,272 |
| | | | | |
| | |
Insurance—6.0% | | | | | |
AON Corp. | | 48,320 | | | 2,207,257 |
Genworth Financial, Inc. (Class A) (b) | | 405,220 | | | 1,146,773 |
Prudential Financial, Inc. | | 117,220 | | | 3,547,077 |
The Allstate Corp. | | 593,430 | | | 19,440,767 |
The Chubb Corp. | | 148,920 | | | 7,594,920 |
The Travelers Cos., Inc. | | 28,610 | | | 1,293,172 |
| | | | | |
| | | | | 35,229,966 |
| | | | | |
| | |
IT Services—3.0% | | | | | |
Accenture, Ltd. (Class A) | | 324,590 | | | 10,643,306 |
Automatic Data Processing, Inc. (a) | | 51,930 | | | 2,042,926 |
The Western Union Co. | | 179,870 | | | 2,579,336 |
Visa, Inc. (a) | | 44,320 | | | 2,324,584 |
| | | | | |
| | | | | 17,590,152 |
| | | | | |
| | |
Leisure Equipment & Products—0.2% | | | | | |
Hasbro, Inc. (a) | | 43,580 | | | 1,271,229 |
| | | | | |
| | |
Life Sciences Tools & Services—0.4% | | | | | |
Waters Corp. (b) | | 65,620 | | | 2,404,973 |
| | | | | |
*See accompanying notes to financial statements.
MSF-5
Metropolitan Series Fund, Inc.
MFS Value Portfolio
Schedule of Investments as of December 31, 2008
Common Stock—(Continued)
| | | | | |
| Security Description | | Shares | | Value* |
| | | | | |
| | |
Machinery—1.7% | | | | | |
Danaher Corp. (a) | | 87,780 | | $ | 4,969,226 |
Eaton Corp. (a) | | 96,200 | | | 4,782,102 |
| | | | | |
| | | | | 9,751,328 |
| | | | | |
| | |
Media—3.2% | | | | | |
Omnicom Group, Inc. (a) | | 275,070 | | | 7,404,884 |
The Walt Disney Co. (a) | | 370,371 | | | 8,403,718 |
WPP, Plc. (GBP) | | 520,478 | | | 3,033,992 |
| | | | | |
| | | | | 18,842,594 |
| | | | | |
| | |
Multi-Utilities—2.9% | | | | | |
Dominion Resources, Inc. | | 232,204 | | | 8,322,191 |
PG&E Corp. | | 111,940 | | | 4,333,197 |
Public Service Enterprise Group, Inc. | | 158,480 | | | 4,622,862 |
| | | | | |
| | | | | 17,278,250 |
| | | | | |
| | |
Multiline Retail—0.5% | | | | | |
Macy’s, Inc. (a) | | 267,380 | | | 2,767,383 |
| | | | | |
| | |
Oil, Gas & Consumable Fuels—14.7% | | | | | |
Apache Corp. | | 108,020 | | | 8,050,731 |
Chevron Corp. | | 184,024 | | | 13,612,255 |
ConocoPhillips (a) | | 95,067 | | | 4,924,471 |
Devon Energy Corp. | | 126,810 | | | 8,332,685 |
EOG Resources, Inc. | | 78,360 | | | 5,217,209 |
Exxon Mobil Corp. | | 194,910 | | | 15,559,665 |
Hess Corp. | | 125,870 | | | 6,751,667 |
Marathon Oil Corp. | | 67,220 | | | 1,839,139 |
Occidental Petroleum Corp. | | 52,780 | | | 3,166,272 |
Total S.A. (ADR) (a) | | 347,410 | | | 19,211,773 |
| | | | | |
| | | | | 86,665,867 |
| | | | | |
| | |
Pharmaceuticals—7.5% | | | | | |
Abbott Laboratories | | 70,190 | | | 3,746,040 |
GlaxoSmithKline, Plc. (GBP) | | 164,540 | | | 3,054,586 |
Johnson & Johnson | | 153,720 | | | 9,197,068 |
Merck & Co., Inc. (a) | | 380,180 | | | 11,557,472 |
Pfizer, Inc. | | 120,720 | | | 2,137,951 |
Roche Holding AG (CHF) | | 15,750 | | | 2,424,456 |
Wyeth | | 316,560 | | | 11,874,166 |
| | | | | |
| | | | | 43,991,739 |
| | | | | |
| | |
Road & Rail—0.3% | | | | | |
Burlington Northern Santa Fe Corp. (a) | | 20,090 | | | 1,521,014 |
| | | | | |
|
Semiconductors & Semiconductor Equipment—2.0% |
Intel Corp. (a) | | 813,060 | | | 11,919,460 |
| | | | | |
| | |
Software—2.7% | | | | | |
Oracle Corp. (a) (b) | | 911,530 | | | 16,161,427 |
| | | | | |
| | | | | | | |
| Security Description | | Shares | | Value* | |
| | | | | | | |
| | |
Specialty Retail—1.4% | | | | | | | |
Staples, Inc. (a) | | | 138,240 | | $ | 2,477,261 | |
The Sherwin-Williams Co. (a) | | | 95,010 | | | 5,676,847 | |
| | | | | | | |
| | | | | | 8,154,108 | |
| | | | | | | |
| |
Textiles, Apparel & Luxury Goods—1.4% | | | | |
Nike, Inc. | | | 158,130 | | | 8,064,630 | |
| | | | | | | |
| | |
Tobacco—4.9% | | | | | | | |
Altria Group, Inc. | | | 133,950 | | | 2,017,287 | |
Lorillard, Inc. | | | 56,530 | | | 3,185,465 | |
Philip Morris International, Inc. | | | 544,990 | | | 23,712,515 | |
| | | | | | | |
| | | | | | 28,915,267 | |
| | | | | | | |
| |
Trading Companies & Distributors—0.7% | | | | |
W.W. Grainger, Inc. | | | 55,180 | | | 4,350,391 | |
| | | | | | | |
| |
Wireless Telecommunication Services—1.9% | | | | |
América Movil S.A.B. de C.V. (ADR) | | | 15,590 | | | 483,134 | |
Rogers Communications, Inc. (CAD) | | | 103,250 | | | 3,060,281 | |
Vodafone Group, Plc. (GBP) | | | 3,744,535 | | | 7,538,175 | |
| | | | | | | |
| | | | | | 11,081,590 | |
| | | | | | | |
Total Common Stock
(Identified Cost $782,800,604) | | | | | | 578,642,318 | |
| | | | | | | |
|
| Short Term Investments—8.0% | |
| Security Description | | Shares/Face
Amount | | Value* | |
| | |
Mutual Funds—6.6% | | | | | | | |
State Street Navigator Securities Lending Prime Portfolio (c) | | | 38,463,268 | | | 38,463,268 | |
| | | | | | | |
| | |
Repurchase Agreement—1.4% | | | | | | | |
State Street Repurchase Agreement dated 12/31/08 at 0.010% to be repurchased at $8,233,005 on 01/02/09, collateralized by $8,400,000 U.S. Treasury Bill due 02/19/09 with a value of $8,400,000. | | $ | 8,233,000 | | | 8,233,000 | |
| | | | | | | |
Total Short Term Investments
(Identified Cost $46,696,268) | | | | | | 46,696,268 | |
| | | | | | | |
Total Investments—106.4%
(Identified Cost $829,496,872) (d) | | | | | | 625,338,586 | |
Liabilities in excess of other assets | | | | | | (37,499,628 | ) |
| | | | | | | |
| Total Net Assets—100% | | | | | $ | 587,838,958 | |
| | | | | | | |
| (a) | A portion or all of the security was on loan. As of December 31, 2008, the market value of securities loaned was $38,162,398 and the collateral received consisted of cash in the amount of $38,463,268. The cash collateral is invested in a money market fund managed by an affiliate of the custodian. |
*See accompanying notes to financial statements.
MSF-6
Metropolitan Series Fund, Inc.
MFS Value Portfolio
Schedule of Investments as of December 31, 2008
| (c) | Represents investment of cash collateral received from securities lending transactions. |
| (d) | The aggregate cost of investments for federal income tax purposes as of December 31, 2008 was $837,535,911 and the composition of unrealized appreciation and depreciation of investment securities was $3,085,928 and $(215,283,253), respectively. |
| (ADR)— | An American Depositary Receipt is a certificate issued by a custodian bank representing the right to receive securities of the foreign issuer described. Trading on exchanges not located in the United States or Canada significantly influences the value of ADRs. |
The Portfolio adopted the provisions of Statement of Financial Accounting Standards No. 157, “Fair Value Measurements” (FAS 157), effective with the beginning of the Portfolio’s fiscal year. FAS 157 establishes a framework for measuring fair value and expands disclosures about fair value measurements in financial statements. The three levels of the hierarchy under FAS 157 are described below:
Level 1 - quoted prices in active markets for identical securities
Level 2 - other significant observable inputs (including quoted prices for similar securities, interest rates, credit risk, etc.)
Level 3 - significant unobservable inputs (including the Adviser and Subadvisor’s own assumptions in determining the fair value of investments)
The inputs or methodology used for valuing securities are not necessarily an indication of the risk associated with investing in those securities.
The following is a summary of the inputs used to value the Portfolio’s net assets as of December 31, 2008:
| | | | | | |
| Valuation Inputs | | Investments In
Securities | | Other Financial
Instruments* |
Level 1 - Quoted Prices | | $ | 581,755,087 | | $ | 0 |
Level 2 - Other Significant Observable Inputs | | | 43,583,499 | | | 0 |
Level 3 - Significant Unobservable Inputs | | | 0 | | | 0 |
Total | | $ | 625,338,586 | | $ | 0 |
* Other financial instruments are derivative instruments not reflected in the Schedule of Investments, such as futures, forwards, swap contracts and written options, which are valued based on the unrealized appreciation/depreciation on the instrument.
See accompanying notes to financial statements.
MSF-7
Metropolitan Series Fund, Inc.
MFS Value Portfolio
Statement of Assets & Liabilities
December 31, 2008
| | | | | | | |
Assets | | | | | | | |
Investments at value (a) (b) | | | | | $ | 625,338,586 | |
Cash | | | | | | 579 | |
Receivable for: | | | | | | | |
Fund shares sold | | | | | | 364,160 | |
Accrued interest and dividends | | | | | | 1,558,670 | |
Foreign taxes | | | | | | 42,901 | |
| | | | | | | |
Total Assets | | | | | | 627,304,896 | |
Liabilities | | | | | | | |
Payable for: | | | | | | | |
Securities purchased | | $ | 92,158 | | | | |
Fund shares redeemed | | | 531,804 | | | | |
Withholding taxes | | | 3,085 | | | | |
Collateral for securities loaned | | | 38,463,268 | | | | |
Accrued expenses: | | | | | | | |
Management fees | | | 307,563 | | | | |
Service and distribution fees | | | 28,376 | | | | |
Other expenses | | | 39,684 | | | | |
| | | | | | | |
Total Liabilities | | | | | | 39,465,938 | |
| | | | | | | |
Net Assets | | | | | $ | 587,838,958 | |
| | | | | | | |
Net assets consists of: | | | | | | | |
Capital paid in | | | | | $ | 813,507,978 | |
Overdistributed net investment income | | | | | | (47,766 | ) |
Accumulated net realized losses | | | | | | (21,453,100 | ) |
Unrealized depreciation on investments and foreign currency | | | | | | (204,168,154 | ) |
| | | | | | | |
Net Assets | | | | | $ | 587,838,958 | |
| | | | | | | |
| Computation of offering price: | | | | | | | |
Class A | | | | | | | |
Net asset value and redemption price per share ($419,291,282 divided by 45,247,677 shares outstanding) | | | | | $ | 9.27 | |
| | | | | | | |
Class B | | | | | | | |
Net asset value and redemption price per share ($101,027,693 divided by 10,938,617 shares outstanding) | | | | | $ | 9.24 | |
| | | | | | | |
Class E | | | | | | | |
Net asset value and redemption price per share ($67,519,983 divided by 7,305,702 shares outstanding) | | | | | $ | 9.24 | |
| | | | | | | |
(a) Identified cost of investments | | | | | $ | 829,496,872 | |
| | | | | | | |
(b) Includes cash collateral for securities loaned of | | | | | $ | 38,463,268 | |
| | | | | | | |
Statement of Operations *
For the Year Ended December 31, 2008
| | | | | | | | |
Investment Income | | | | | | | | |
Dividends | | | | | | $ | 14,700,988 | (a) |
Interest | | | | | | | 332,127 | (b) |
| | | | | | | | |
| | | | | | | 15,033,115 | |
Expenses | | | | | | | | |
Management fees | | $ | 3,724,291 | | | | | |
Service and distribution fees—Class B | | | 204,624 | | | | | |
Service and distribution fees—Class E | | | 86,519 | | | | | |
Administration fees | | | 3,793 | | | | | |
Directors’ fees and expenses | | | 26,486 | | | | | |
Custodian | | | 92,295 | | | | | |
Audit and tax services | | | 49,902 | | | | | |
Legal | | | 18,794 | | | | | |
Printing | | | 203,290 | | | | | |
Insurance | | | 6,212 | | | | | |
Miscellaneous | | | 14,005 | | | | | |
| | | | | | | | |
Total expenses | | | 4,430,211 | | | | | |
Management fee waivers | | | (324,466 | ) | | | 4,105,745 | |
| | | | | | | | |
Net Investment Income | | | | | | | 10,927,370 | |
| | | | | | | | |
Realized and Unrealized Loss | | | | | | | | |
| Realized loss on: | | | | | | | | |
Investments—net | | | (39,720,792 | ) | | | | |
Futures contracts—net | | | (366,979 | ) | | | | |
Foreign currency transactions—net | | | (158,952 | ) | | | (40,246,723 | ) |
| | | | | | | | |
| Change in unrealized depreciation on: | | | | | | | | |
Investments—net | | | (222,630,284 | ) | | | | |
Foreign currency transactions—net | | | (10,097 | ) | | | (222,640,381 | ) |
| | | | | | | | |
Net loss | | | | | | | (262,887,104 | ) |
| | | | | | | | |
Net Decrease in Net Assets From Operations | | | | | | $ | (251,959,734 | ) |
| | | | | | | | |
| (a) | Net of foreign taxes of $156,146. |
| (b) | Includes income on securities loaned of $216,589. |
See accompanying notes to financial statements.
MSF-8
Metropolitan Series Fund, Inc.
MFS Value Portfolio
Statements of Changes in Net Assets*
| | | | | | | | |
| | | Year ended
December 31,
2008 | | | Year ended
December 31,
2007 | |
From Operations | | | | | | | | |
Net investment income | | $ | 10,927,370 | | | $ | 1,848,776 | |
Net realized gain (loss) | | | (40,246,723 | ) | | | 9,492,836 | |
Change in unrealized depreciation | | | (222,640,381 | ) | | | (2,499,081 | ) |
| | | | | | | | |
Increase (decrease) in net assets from operations | | | (251,959,734 | ) | | | 8,842,531 | |
| | | | | | | | |
From Distributions to Shareholders | | | | | | | | |
Net investment income | | | | | | | | |
Class A | | | (2,400,602 | ) | | | (786 | ) |
| | | | | | | | |
Net realized gain | | | | | | | | |
Class A | | | (9,523,977 | ) | | | (2,376,175 | ) |
| | | | | | | | |
Total distributions | | | (11,924,579 | ) | | | (2,376,961 | ) |
| | | | | | | | |
Increase in net assets from capital share transactions | | | 708,903,985 | | | | 28,237,637 | |
| | | | | | | | |
Net increase in net assets | | | 445,019,672 | | | | 34,703,207 | |
| | | | | | | | |
| | |
Net Assets | | | | | | | | |
Beginning of the period | | | 142,819,286 | | | | 108,116,079 | |
| | | | | | | | |
End of the period | | $ | 587,838,958 | | | $ | 142,819,286 | |
| | | | | | | | |
Over/Undistributed Net Investment Income | | | | | | | | |
End of the period | | $ | (47,766 | ) | | $ | 1,841,110 | |
| | | | | | | | |
Other Information:
Capital Shares
Transactions in capital shares were as follows:
| | | | | | | | | | | | | | |
| | | Year ended
December 31, 2008 | | | Year ended
December 31, 2007 | |
| | | Shares | | | $ | | | Shares | | | $ | |
Class A | | | | | | | | | | | | | | |
Sales | | 20,406,127 | | | $ | 256,345,368 | | | 3,201,796 | | | $ | 47,683,327 | |
Shares issued through reorganization | | 20,468,082 | | | | 268,991,538 | | | 0 | | | | 0 | |
Reinvestments | | 908,886 | | | | 11,924,579 | | | 160,497 | | | | 2,376,961 | |
Redemptions | | (6,031,476 | ) | | | (68,333,747 | ) | | (1,460,202 | ) | | | (21,822,651 | ) |
| | | | | | | | | | | | | | |
Net increase | | 35,751,619 | | | $ | 468,927,738 | | | 1,902,091 | | | $ | 28,237,637 | |
| | | | | | | | | | | | | | |
Class B | | | | | | | | | | | | | | |
Sales | | 1,294,042 | | | $ | 13,975,261 | | | 0 | | | $ | 0 | |
Shares issued through reorganization | | 10,820,547 | | | | 141,965,576 | | | 0 | | | | 0 | |
Redemptions | | (1,175,972 | ) | | | (12,905,564 | ) | | 0 | | | | 0 | |
| | | | | | | | | | | | | | |
Net increase | | 10,938,617 | | | $ | 143,035,273 | | | 0 | | | $ | 0 | |
| | | | | | | | | | | | | | |
Class E | | | | | | | | | | | | | | |
Sales | | 1,096,333 | | | $ | 12,997,488 | | | 0 | | | $ | 0 | |
Shares issued through reorganization | | 7,424,003 | | | | 97,402,923 | | | 0 | | | | 0 | |
Redemptions | | (1,214,634 | ) | | | (13,459,437 | ) | | 0 | | | | 0 | |
| | | | | | | | | | | | | | |
Net increase | | 7,305,702 | | | $ | 96,940,974 | | | 0 | | | $ | 0 | |
| | | | | | | | | | | | | | |
Increase derived from capital share transactions | | | | | $ | 708,903,985 | | | | | | $ | 28,237,637 | |
| | | | | | | | | | | | | | |
See accompanying notes to financial statements.
MSF-9
Metropolitan Series Fund, Inc.
MFS Value Portfolio
Financial Highlights*
| | | | | | | | | | | | | | | | | | | | |
| | | Class A | |
| | | Year ended December 31, | |
| | | 2008 | | | 2007 | | | 2006 | | | 2005 | | | 2004(a) | |
Net Asset Value, Beginning of Period | | $ | 15.04 | | | $ | 14.24 | | | $ | 12.44 | | | $ | 12.32 | | | $ | 10.83 | |
| | | | | | | | | | | | | | | | | | | | |
Income From Investment Operations | | | | | | | | | | | | | | | | | | | | |
Net investment income | | | 0.24 | (b) | | | 0.21 | (b) | | | 0.20 | (b) | | | 0.17 | (b) | | | 0.14 | |
Net realized and unrealized gain (loss) of investments | | | (4.77 | ) | | | 0.87 | | | | 2.45 | | | | 0.63 | | | | 1.59 | |
| | | | | | | | | | | | | | | | | | | | |
Total from investment operations | | | (4.53 | ) | | | 1.08 | | | | 2.65 | | | | 0.80 | | | | 1.73 | |
| | | | | | | | | | | | | | | | | | | | |
Less Distributions | | | | | | | | | | | | | | | | | | | | |
Distributions from net investment income | | | (0.25 | ) | | | (0.00 | )(c) | | | (0.18 | ) | | | (0.15 | ) | | | (0.14 | ) |
Distributions from net realized capital gains | | | (0.99 | ) | | | (0.28 | ) | | | (0.67 | ) | | | (0.53 | ) | | | (0.10 | ) |
| | | | | | | | | | | | | | | | | | | | |
Total distributions | | | (1.24 | ) | | | (0.28 | ) | | | (0.85 | ) | | | (0.68 | ) | | | (0.24 | ) |
| | | | | | | | | | | | | | | | | | | | |
Net Asset Value, End of Period | | $ | 9.27 | | | $ | 15.04 | | | $ | 14.24 | | | $ | 12.44 | | | $ | 12.32 | |
| | | | | | | | | | | | | | | | | | | | |
Total Return (%) | | | (32.5 | ) | | | 7.6 | | | | 21.3 | | | | 6.4 | | | | 16.0 | |
Ratio of operating expenses to average net assets (%) | | | 0.74 | | | | 0.87 | | | | 1.00 | | | | 0.99 | | | | 1.00 | |
Ratio of operating expenses to average net assets without giving effect to the contractual expense agreement would have been (%) (d) | | | 0.80 | | | | 0.88 | | | | 1.02 | | | | 1.00 | | | | 1.14 | |
Ratio of net investment income to average net assets (%) | | | 2.15 | | | | 1.42 | | | | 1.46 | | | | 1.36 | | | | 1.30 | |
Portfolio turnover rate (%) | | | 34 | | | | 25 | | | | 39 | | | | 23 | | | | 47 | |
Net assets, end of period (000) | | $ | 419,291 | | | $ | 142,819 | | | $ | 108,116 | | | $ | 78,658 | | | $ | 47,252 | |
| | | | | | | | |
| | | Class B | | | Class E | |
| | | Period ended
December 31,
2008(e) | | | Period ended
December 31,
2008(e) | |
Net Asset Value, Beginning of Period | | $ | 13.12 | | | $ | 13.12 | |
| | | | | | | | |
Income From Investment Operations | | | | | | | | |
Net investment income | | | 0.15 | (b) | | | 0.16 | (b) |
Net realized and unrealized loss of investments | | | (4.03 | ) | | | (4.04 | ) |
| | | | | | | | |
Total from investment operations | | | (3.88 | ) | | | (3.88 | ) |
| | | | | | | | |
Net Asset Value, End of Period | | $ | 9.24 | | | $ | 9.24 | |
| | | | | | | | |
Total Return (%) | | | (29.6 | )(f) | | | (29.6 | )(f) |
Ratio of operating expenses to average net assets (%) | | | 0.99 | (g) | | | 0.89 | (g) |
Ratio of operating expenses to average net assets without giving effect to the contractual expense agreement would have been (%) (d) | | | 1.05 | (g) | | | 0.95 | (g) |
Ratio of net investment income to average net assets (%) | | | 1.97 | (g) | | | 2.06 | (g) |
Portfolio turnover rate (%) | | | 34 | | | | 34 | |
Net assets, end of period (000) | | $ | 101,028 | | | $ | 67,520 | |
| (a) | Audited by other Independent Registered Public Accounting Firm. |
| (b) | Per share amount is based on average shares outstanding during the period. |
| (c) | Distributions for the period were less than $0.01. |
| (d) | See Note 4 of the Notes to Financial Statements. |
| (e) | Commencement of operations was April 28, 2008 for Classes B and E. |
| (f) | Periods less than one year are not computed on an annualized basis. |
| (g) | Computed on an annualized basis. |
See accompanying notes to financial statements.
MSF-10
Metropolitan Series Fund, Inc.
MFS Value Portfolio
Notes to Financial Statements—December 31, 2008
Metropolitan Series Fund, Inc. (the “Fund”) is organized as a corporation under the laws of Maryland pursuant to Articles of Incorporation filed on November 23, 1982, as amended, and registered under the Investment Company Act of 1940, as amended (the “1940 Act”), as an open-end investment company. The Fund is a “series” type of mutual fund, which issues separate series of stock. Each series represents an interest in a separate portfolio of Fund investments. The MFS Value Portfolio (the “Portfolio”) is a diversified series of the Fund. On April 28, 2008, the MFS Value Portfolio of the Met Investors Series Trust (the “MIST MFS Value Predecessor”) merged with and into the Portfolio. Prior to the merger, the MIST MFS Value Predecessor had succeeded to the operations of the MFS Value Portfolio of the Travelers Series Trust (the “TST MFS Value Predecessor”) on May 1, 2006. The MIST MFS Value Predecessor was the accounting survivor of the merger with and into the Portfolio. Shares in the Fund are not offered directly to the general public and are currently available only to separate accounts established by Metropolitan Life Insurance Company (“MetLife”), New England Life Insurance Company, General American Life Insurance Company (“General American”), The MetLife Investors Group of Insurance Companies, MetLife Insurance Company of Connecticut and other affiliated insurance companies (collectively, the “Insurance Companies”) and to certain eligible qualified retirement plans (“Qualified Plans”), as an investment vehicle for variable life insurance, group annuity or variable annuity products of these insurance companies or Qualified Plans, although the Portfolio is not available to all such separate accounts and Qualified Plans. The Portfolio’s shares may be divided into different classes. Currently, the classes being offered by the Portfolio are named Class A, Class B and Class E. The classes of the Portfolio’s shares are identical, except that certain additional charges (Rule 12b-1 fees) are made against Class B and Class E shares. Investment income, realized and unrealized capital gains and losses, the common expenses of the Portfolio and certain Portfolio-level expense reductions, if any, are allocated daily, on a pro rata basis, to each class based on the relative net assets of each class to the total net assets of the Portfolio.
| 2. | SIGNIFICANT ACCOUNTING POLICIES: |
The preparation of financial statements in conformity with accounting principles generally accepted in the United States of America (“GAAP”) requires management to make estimates and assumptions that affect the reported amounts of assets and liabilities and disclosure of contingent assets and liabilities as of the date of the financial statements and the reported amounts of income and expenses during the reporting period. Actual results could differ from those estimates.
The following is a summary of significant accounting policies consistently followed by the Portfolio in the preparation of its financial statements. The policies are in conformity with GAAP.
Investment Valuation:
Debt securities (other than short term obligations with a remaining maturity of sixty days or less) are generally valued on the basis of evaluated or composite bid quotations obtained by independent pricing services and/or brokers and dealers selected by the relevant subadviser pursuant to authorization of the Board of Directors of the Fund (the “Board” or “Directors”). Such quotations take into account appropriate factors such as institutional-sized trading in similar groups of securities, yield, quality, coupon rate, maturity, type of issue, trading characteristics and other data. Short term obligations with a remaining maturity of sixty days or less are valued at amortized cost which approximates fair market value.
Equity securities traded on a national securities exchange or other exchanges are valued at their last sale price on the principal trading market. Equity securities traded on the NASDAQ National Market System are valued at the NASDAQ Official Closing Price (the “NOCP”). The NOCP is the last reported sale price if the last reported sale price falls between the spread of the last reported bid and asked prices. If the last reported bid and asked prices are above the last reported sale price, the NOCP will be the last reported bid price. If the last reported bid and asked prices are below the last reported sale price, the NOCP will be the last reported asked price. Equity securities traded on a national securities exchange or other exchanges or on the NASDAQ National Market System for which there is no reported sale during the day are valued at the last reported bid price. A security that is listed or traded on more than one exchange is valued at the quotation on the exchange determined to be the primary market for that security by the Board or its delegates. If no closing price is available, then such securities are valued by using the last reported bid price. Equity securities traded over-the-counter are valued at the last reported sales price.
If no current market value quotation is readily available or reliable for a portfolio security, fair value will be determined in accordance with procedures established by and under the general supervision of the Board. When the Portfolio uses fair value pricing, it may take into account any factors it deems appropriate. The value of securities used by the Portfolio to calculate its net asset value may differ
MSF-11
Metropolitan Series Fund, Inc.
MFS Value Portfolio
Notes to Financial Statements—December 31, 2008—(Continued)
from quoted or published prices for the same securities. Fair value pricing involves subjective judgments and the fair value determined for a security may be materially different than the value that could be realized upon the sale of that security.
The Portfolio expects to use fair value pricing for securities primarily traded on U.S. exchanges only under very limited circumstances. For example, the Portfolio may use fair value pricing if the exchange on which a security is traded closes early or trading in the security is suspended.
Securities traded primarily on an exchange outside of the United States which closes before the close of the New York Stock Exchange will be valued at the last sales price on that non-U.S. exchange. Securities traded primarily on an exchange outside of the United States for which there is no reported sale during the day are valued at the mean between the last reported bid and asked prices. However, because most foreign markets close well before the Portfolio values its securities (typically at 4 p.m. Eastern Time), the earlier close of these foreign markets gives rise to the possibility that significant events, including broad market moves, may have occurred after these foreign markets close but before the Portfolio values its securities. To account for this, the Portfolio may frequently value many of its foreign equity securities using fair value prices based on third party vendor modeling tools.
Forward foreign currency exchange contracts are valued based on the mean between closing bid and asked prices of the forward currency contract rates in the London foreign exchange markets on a daily basis as provided by a reliable bank or dealer.
Options, whether on securities, indices, futures contracts, or otherwise, are valued at the last sales price available as of the close of business on the day of valuation or, if there is no such sale price available, at the mean between the bid and asked prices. Options on currencies are valued at the spot price each day.
The value of futures contracts will be the sum of the margin deposit plus or minus the difference between the value of the futures contract on each day the net asset value is calculated and the value on the date the futures contract originated, value being that established on a recognized commodity exchange, or by reference to other customary sources, with gain or loss being realized when the futures contract closes or expires.
Subject to the Board’s oversight, the Board has delegated the day-to-day oversight of pricing matters, including determinations in good faith under the Fund’s procedures the fair value of securities for which current market quotations are not readily available to MetLife Advisers, LLC (“MetLife Advisers” or the “Adviser”).
Investment Transactions and Related Investment Income:
Portfolio security transactions are recorded on the trade date. Dividend income is recorded on the ex-dividend date or, for certain foreign securities, when notified. Interest income, which includes amortization of premium and accretion of discount on debt securities, is recorded on the accrual basis. Realized gains and losses on investments and unrealized appreciation and depreciation are determined on the identified cost basis, which is the same basis used for federal income tax purposes.
Repurchase Agreements:
The Portfolio, through the custodian or a subcustodian, receives delivery of the underlying securities collateralizing repurchase agreements. The Portfolio requires the custodian to take possession, to have legally segregated in the Federal Reserve Book Entry System, or to have segregated within the custodian’s vault, all securities held as collateral for repurchase agreements. It is the Portfolio’s policy that the market value of the collateral be at least equal to 100% of the repurchase price in the case of a repurchase agreement of one-day duration and 102% on all other repurchase agreements. The Portfolio’s subadviser is responsible for determining that the value of the collateral is at all times at least equal to the repurchase price. In connection with transactions in repurchase agreements, if the seller defaults and the value of the collateral declines or if the seller enters an insolvency proceeding, realization of the collateral by the Portfolio may be delayed, limited or wholly denied.
Foreign Currency Translation:
The books and records of the Portfolio are maintained in U.S. dollars. The values of securities, currencies and other assets and liabilities denominated in currencies other than U.S. dollars are translated into U.S. dollars based upon foreign exchange rates prevailing at the end of the period. Purchases and sales of investment securities, income and expenses are translated on the respective dates of such transactions. Since the values of investment securities are presented at the foreign exchange rates prevailing at the end of the period, it is not practical to isolate that portion of the results of operations arising from changes in
MSF-12
Metropolitan Series Fund, Inc.
MFS Value Portfolio
Notes to Financial Statements—December 31, 2008—(Continued)
exchange rates from that portion of the results of operations reflecting fluctuations arising from changes in market prices of the investment securities. Such fluctuations are included in the net realized and unrealized gain or loss on investments.
Net realized foreign exchange gains or losses arise from sales of foreign currency, currency gains or losses realized between the trade and settlement dates on securities transactions, and the difference between the amounts of dividends, interest, and foreign withholding taxes recorded by the Portfolio and the U.S. dollar equivalent of the amounts actually received or paid by the Portfolio. Net unrealized foreign exchange gains and losses arise from changes in the value of assets and liabilities, other than investment securities, resulting from changes in the exchange rate.
Forward Foreign Currency Exchange Contracts:
The Portfolio may enter into forward foreign currency exchange contracts primarily to hedge against foreign currency exchange rate risks on its non-U.S. dollar denominated investment securities. When entering into a forward currency contract, the Portfolio agrees to receive or deliver a fixed quantity of foreign currency for an agreed-upon price on an agreed future date. These contracts are valued daily and the Portfolio’s net equity therein, representing unrealized gain or loss on the contracts as measured by the difference between the foreign exchange rates at the dates of entry into the contracts and the forward rates at the settlement date, is included in the Statement of Assets and Liabilities. Realized and unrealized gains and losses are included in the Statement of Operations. These instruments involve market and/or credit risk in excess of the amount recognized in the Statement of Assets and Liabilities. Risks arise from the possible inability of counterparties to meet the terms of their contracts and from movement in currency and securities values and interest rates.
Futures Contracts:
The Portfolio may buy and sell futures contracts (on recognized exchanges) as a hedge, to maintain exposure to the broad equity markets or to enhance return. Futures contracts are agreements to buy or sell a security, or deliver a final cash settlement price in connection with an index, interest rate, currency, or other contracts not calling for physical delivery, for a set price in the future. The Portfolio must post an amount equal to a portion of the total market value of the futures contract as futures variation margin, which is returned when the Portfolio’s obligations under the contract have been satisfied. From time to time thereafter, the Portfolio may have to post variation margin to maintain this amount as the market value of the contract fluctuates. Risks of entering into futures contracts (and related options) include the possibility that there may be an illiquid market and that a change in the value of the contract or option may not correlate with changes in the value of the underlying securities.
Options:
The Portfolio may use options to hedge against changes in values of securities the Portfolio owns or expects to purchase, to maintain exposure to the broad equity markets or to enhance return. Writing puts or buying calls tends to increase the Portfolio’s exposure to the underlying instrument and writing calls or buying puts tends to decrease the Portfolio’s exposure to the underlying instrument, and can be used to hedge other Portfolio investments. For options purchased to hedge the Portfolio’s investments, the potential risk to the Portfolio is that the change in value of options contracts may not correspond to the change in value of the hedged instruments. In addition, losses may arise from changes in the value of the underlying instruments, if there is an illiquid secondary market, or if the counterparty is unable to perform. The maximum loss for purchased options is limited to the premium initially paid for the option. For options written by the Portfolio, the maximum loss is not limited to the premium initially received for the option.
The main risk associated with purchasing an option is that the option expires without being exercised. In this case, the option expires worthless and the premium paid for the option is considered the loss. The risk associated with writing a call option is that the Portfolio may forgo the opportunity for a profit if the market value of the underlying position increases and the option is exercised. The risk in writing a put option is that the Portfolio may incur a loss if the market value of the underlying position decreases and the option is exercised. In addition, the Portfolio risks not being able to enter into a closing transaction for the written option as the result of an illiquid market.
“When-Issued” Securities:
Purchasing securities “when-issued” is a forward commitment by the Portfolio to buy a security. The estimated amount of the Portfolio’s payment obligation and the security’s interest rate are determined when the commitment is made, even though no interest accrues until the security is issued, which is generally 15 to 120 days later. The Portfolio will segregate liquid assets with
MSF-13
Metropolitan Series Fund, Inc.
MFS Value Portfolio
Notes to Financial Statements—December 31, 2008—(Continued)
its custodian sufficient at all times to satisfy these commitments. If the value of the security is less when delivered than when the commitment was made, the Portfolio will suffer a loss.
Federal Income Taxes:
It is the Portfolio’s policy to comply with the requirements of the Internal Revenue Code of 1986, as amended (the “Code”), and regulations thereunder, applicable to regulated investment companies and to distribute, with respect to each taxable year, all of its taxable income to shareholders. Therefore, no federal income tax provision is required. The Portfolio is subject to the provisions of the Financial Accounting Standards Board Interpretation (“FASB”) No. 48, Accounting for Uncertainties in Income Taxes (FIN 48). FIN 48 sets forth a minimum threshold for financial statement recognition of the benefit of a tax position taken or expected to be taken in a tax return. The implementation of FIN 48 did not result in any unrecognized tax benefits in the accompanying financial statements. Each of the Portfolio’s federal tax returns for the prior three fiscal years remains subject to examination by the Internal Revenue Service.
As of December 31, 2008, the Portfolio had no capital loss carryforwards.
Pursuant to Section 852 of the Code, the Portfolio designated $88,675,308 as capital gain dividends for its taxable year ended December 31, 2008.
The tax character of distributions paid by MIST MFS Value Predecessor, the accounting survivor; for the periods ended December 31, 2008 and 2007 was as follows:
| | | | | | | | | | | | | | | | |
| Ordinary Income | | Long Term Gain | | Total |
| 2008 | | 2007 | | 2008 | | 2007 | | 2008 | | 2007 |
| $ | 3,322,237 | | $ | 141,072 | | $ | 8,602,342 | | $ | 2,235,889 | | $ | 11,924,579 | | $ | 2,376,961 |
As of December 31, 2008, the components of distributable earnings (accumulated losses) on a federal income tax basis were as follows:
| | | | | | | | | | | | | | | |
Undistributed
Ordinary
Income | | Undistributed
Long Term
Gain | | Unrealized
Depreciation | | | Loss
Carryforwards | | Total | |
| $ | — | | $ | — | | $ | (212,207,193 | ) | | $ | — | | $ | (212,207,193 | ) |
Pursuant to Federal income tax regulations applicable to investment companies, the Portfolio has elected to treat net capital losses realized between November 1 and December 31 of each year as occurring on the first day of the following tax year. For the year ended December 31, 2008, the following amounts of realized capital and currency losses reflected in the accompanying financial statements will not be recognized for Federal income tax purposes until January 1, 2009:
| | | | |
Currency | | Capital | |
$(47,766) | | $ | (13,414,061 | ) |
Dividends and Distributions to Shareholders:
The Portfolio records dividends and distributions on the ex-dividend date. Net realized gains from security transactions (if any) are generally distributed annually to shareholders. The timing and characterization of certain income and capital gains distributions are determined in accordance with federal tax regulations that may differ from GAAP. Permanent book and tax basis differences relating to shareholder distributions will result in reclassification between under/over distributed net investment income, accumulated net realized gains/losses and paid in capital.
| 3. | INVESTMENT TRANSACTIONS: |
For the year ended December 31, 2008, purchases and sales of securities (excluding short term investments) for the Portfolio were as follows:
| | | | | | | | | | |
| Purchases | | Sales |
| U.S. Government | | Other | | U.S. Government | | Other |
| $ | 0 | | $ | 912,936,367 | | $ | 0 | | $ | 215,948,256 |
MSF-14
Metropolitan Series Fund, Inc.
MFS Value Portfolio
Notes to Financial Statements—December 31, 2008—(Continued)
| 4. | INVESTMENT MANAGEMENT FEES AND OTHER TRANSACTIONS WITH AFFILIATES: |
Investment Management Agreement:
MetLife Advisers is the investment adviser to the Portfolio. The Fund has entered into an investment management agreement with MetLife Advisers with respect to the Portfolio. The Portfolio pays MetLife Advisers an investment advisory fee at the annual rate of 0.75% for the first $250 million of the Portfolio’s average daily net assets, 0.70% for the next $2.25 billion, 0.675% for the next $2.5 billion and 0.65% for amounts over $5 billion . Fees earned by Metlife Advisers with respect to the Portfolio for the period starting April 28, 2008, through December 31, 2008 were $3,413,668. Prior to April 28, 2008, the MIST MFS Value Predecessor paid an investment advisory fee to Met Investors Advisory, LLC at the annual rate of 0.725% for the first $250 million of the Portfolio’s average daily net assets, 0.675% for the next $1 billion, 0.60% for the next $250 million and 0.50% for amounts over $1.5 billion. Fees earned by Met Investors Advisory, LLC with respect to the Portfolio for the period starting January 1, 2008 through April 27, 2008 were $310,623.
Certain officers and directors of the Fund may also be officers of MetLife Advisers; however, such officers and directors receive no compensation from the Fund.
MetLife Advisers has entered into an investment subadvisory agreement with respect to the Portfolio. Massachusetts Financial Services Co. is compensated by MetLife Advisers to provide subadvisory services for the Portfolio.
Management Fee Waivers:
MetLife Advisers contractually agreed, for the period January 7, 2008 through April 30, 2008, to reduce its advisory fee as follows: 0.10% on the first $250 million of the combined average net assets of the Portfolio and the MFS Value Portfolio of the Met Investors Series Trust (the “Combined Assets”), 0.05% on the next $1 billion of Combined Assets, 0.10% on the next $250 million of Combined Assets, 0.20% on the next $1 billion of Combined Assets, 0.175% on the next $2.5 billion of Combined Assets, and 0.15% on Combined Assets over $5 billion. MetLife Advisers has contractually agreed, for the period April 28, 2008 through April 30, 2009, to reduce its advisory fee to the annual rate of 0.65% for the first $1.25 billion of the Portfolio’s average daily net assets, 0.60% for the next $250 million and 0.50% for amounts over $1.5 billion. Amounts waived for the year ended December 31, 2008 are shown as management fee waivers in the Statement of Operations.
Service and Distribution Fees:
The Fund has adopted a Distribution and Service Plan under Rule 12b-1 of the 1940 Act for the Portfolio’s Class B and E shares. Under the Distribution and Service Plan, the Class B and E shares of the Portfolio pay a fee to compensate the Insurance Companies (or their affiliates) and other broker-dealers and financial intermediaries involved in the offer and sale of Portfolio shares for promoting or selling and servicing the Class B and E shares. The fees under the Distribution and Service Plan for each class of the Portfolio’s shares are calculated as a percentage of the Portfolio’s average daily net assets that are attributable to that Class. Currently, the fee is 0.25% per year for Class B shares and 0.15% per year for Class E shares. Amounts paid by the Portfolio for the year ended December 31, 2008 are shown as Service and Distribution fees in the Statement of Operations.
The Fund has entered into a securities lending arrangement with the Fund’s custodian, State Street Bank and Trust Company (the “custodian”). Under the agreement, the custodian is authorized to loan securities on the Portfolios’ behalf. In exchange, the Portfolio receives either cash or securities as collateral against the loaned securities. The Portfolio receives collateral at least equal to 102% of the market value of the loaned securities (105% for foreign securities), at each loan’s inception. Collateral must be maintained at least at 100% of the market value of the loaned securities for the duration of the loan. The cash collateral is invested in the Navigator Securities Lending Prime Portfolio, an affiliate of the custodian, which invests in a variety of high quality U.S. dollar-denominated instruments. If the market value of the collateral at the close of trading on a business day is less than 100% of the market value of the loaned securities at the close of trading on that day, the borrower shall be required to deliver, by the close of business on the following business day, an additional amount of collateral, equal to at least 100% of the market value of all the loaned securities as of such preceding day. The Portfolio receives 80% of the annual net income from securities lending transactions, which is included in interest income of the Portfolio. The remaining 20% is paid to the custodian as compensation for its securities lending services. Interest income received by the Portfolio via lending transactions during the year ended December 31, 2008 is footnoted in the Statement of Operations. The Portfolio bears the risk of any deficiency in the
MSF-15
Metropolitan Series Fund, Inc.
MFS Value Portfolio
Notes to Financial Statements—December 31, 2008—(Continued)
amount of collateral available for return to a borrower due to a loss in an approved investment purchased with such collateral. Any outstanding loans by the Portfolio at December 31, 2008 are footnoted in the Schedule of Investments.
| 6. | MARKET AND CREDIT RISK: |
In the normal course of business, the Portfolio invests in securities and enters into transactions where risks exist due to fluctuations in the market (market risk) or failure of the other party to a transaction to perform (credit risk). The value of securities held by the Portfolio may decline in response to certain events, including those directly involving the companies whose securities are owned by the Portfolio; conditions affecting the general economy; overall market changes; local, regional or global political, social or economic instability; and currency and interest rate and price fluctuations. Similar to credit risk, the Portfolio may be exposed to counterparty risk, or the risk that an entity with which the Portfolio has unsettled or open transactions may default. Financial assets, which potentially expose the Portfolio to credit and counterparty risks, consist principally of investments and cash due from counterparties. The extent of the Portfolio’s exposure to credit and counterparty risks in respect to these financial assets approximates their value as recorded in the Portfolio’s Statements of Assets and Liabilities.
After the close of business on April 25, 2008, MFS Value Portfolio (the “Portfolio”) acquired the assets and liabilities of the MFS Value Portfolio of the Met Investors Series Trust (the “MIST MFS Value Predecessor”) in a tax-free reorganization in exchange for shares of the Portfolio pursuant to a certain plan of reorganization. Because the MIST MFS Value Predecessor was the accounting survivor of the merger with and into the Portfolio for financial reporting purposes, the financial results of MIST MFS Value Predecessor survived. Accordingly, the financial statements presented for the Portfolio reflect the historical results of MIST MFS Value Predecessor prior to the reorganization and the combined results thereafter. The number and value of shares issued by the Portfolio were in amounts equal to the number and value of shares held by MIST MFS Value Predecessor shareholders as of the reorganization date.
The acquisition was accomplished by a tax free exchange of 25,423,968 Class A shares of the Portfolio for 20,468,082 Class A shares of MIST MFS Value Predecessor, 13,473,349 Class B shares of the Portfolio for 10,820,547 shares Class B shares of the MIST MFS Value Predecessor and 9,238,782 Class E shares of the Portfolio for 7,424,003 Class E shares of the MIST MFS Value Predecessor.
The aggregate net assets of the Portfolio and MIST MFS Value Predecessor immediately before the acquisition were $508,360,038 and $138,253,279, respectively. The aggregate net assets immediately after the acquisition were $646,613,317, which includes $3,057,634 of acquired net unrealized appreciation on investments. The total cost of acquired securities was $504,639,074.
| 8. | RECENT ACCOUNTING PRONOUNCEMENTS: |
In March 2008, the FASB issued Statement of Financial Accounting Standards No. 161, Disclosures about Derivative Instruments and Hedging Activities (“FAS 161”), an amendment of FASB Statement No. 133. FAS 161 requires enhanced disclosures about (a) how and why an entity uses derivative instruments, (b) how derivative instruments and hedging activities are accounted for, and (c) how derivative instruments and related hedging activities affect a fund’s financial position, financial performance, and cash flows. Management does not believe the adoption of FAS 161 will materially impact the financial statement amounts, but will require additional disclosures. This will include qualitative and quantitative disclosures on derivative positions existing at period end and the effect of using derivatives during the reporting period. FAS 161 is effective for financial statements issued for fiscal years and interim periods beginning after November 15, 2008. Management is currently evaluating the impact the adoption of FAS 161 will have on the Portfolio’s financial statement disclosures.
MSF-16
Metropolitan Series Fund, Inc.
MFS Value Portfolio
Report of Independent Registered Public Accounting Firm
To the Shareholders and Board of Directors of Metropolitan Series Fund, Inc.:
We have audited the accompanying statement of assets and liabilities, including the schedule of investments, of the MFS Value Portfolio (one of the portfolios constituting the Metropolitan Series Fund, Inc.) (the “Fund”) as of December 31, 2008, and the related statement of operations for the year then ended, the statements of changes in net assets for each of the two years in the period then ended, and the financial highlights for each of the four years in the period then ended. The financial highlights for the year ended December 31, 2004 were audited by other auditors whose report, dated February 18, 2005, expressed an unqualified opinion on those financial highlights. These financial statements and financial highlights are the responsibility of the Fund’s management. Our responsibility is to express an opinion on these financial statements and financial highlights based on our audits.
We conducted our audits in accordance with the standards of the Public Company Accounting Oversight Board (United States). Those standards require that we plan and perform the audit to obtain reasonable assurance about whether the financial statements and financial highlights are free of material misstatement. The Fund is not required to have, nor were we engaged to perform, an audit of its internal control over financial reporting. Our audits included consideration of internal control over financial reporting as a basis for designing audit procedures that are appropriate in the circumstances, but not for the purpose of expressing an opinion on the effectiveness of the Fund’s internal control over financial reporting. Accordingly, we express no such opinion. An audit also includes examining, on a test basis, evidence supporting the amounts and disclosures in the financial statements, assessing the accounting principles used and significant estimates made by management, as well as evaluating the overall financial statement presentation. Our procedures included confirmation of securities owned as of December 31, 2008, by correspondence with the custodian and brokers; where replies were not received from brokers, we performed other auditing procedures. We believe that our audits provide a reasonable basis for our opinion.
In our opinion, the financial statements and financial highlights referred to above present fairly, in all material respects, the financial position of the MFS Value Portfolio of the Metropolitan Series Fund, Inc. as of December 31, 2008, the results of its operations for the year then ended, the changes in its net assets for each of the two years in the period then ended, and the financial highlights for each of the four years in the period then ended, in conformity with accounting principles generally accepted in the United States of America.
Deloitte & Touche LLP
Boston, Massachusetts
February 25, 2009
MSF-17
Metropolitan Series Fund, Inc.
Directors and Officers
The Fund’s Directors review actions of the Fund’s investment adviser and subadvisers, and decide upon matters of general policy. The Fund’s officers supervise the daily business operations of the Fund. The Board of Directors and the Fund’s officers are listed below. Each Director is responsible for overseeing all 38 Portfolios of the Fund. There is no limit to the term a Director may serve. Directors serve until their resignation, retirement or removal in accordance with the Fund’s organizational documents and policies adopted by the Board from time to time. Officers hold office at the pleasure of the Board or until the election or appointment and the qualification of a successor. The address of the Directors and officers is c/o Metropolitan Series Fund, Inc., 501 Boylston Street, Boston, MA 02116.
Interested Directors(1)
Each Director below is an “interested person” (as defined by the 1940 Act) with respect to the Fund in that Ms. Forget is an employee of MetLife and Mr. Typermass is a former employee of MetLife and owns securities issued by MetLife, Inc., the ultimate parent company of MetLife Advisers.
| | | | | | | | |
Name, Address and Age | | Current
position(s)
with Fund | | Position(s)
held since | | Principal occupations
over past five years, including other directorships(2) | | Number of
Portfolios in
Fund Complex
Overseen by
Director(3) |
Elizabeth M. Forget Age: 42 | | Director, Chairman of the Board, President and Chief Executive Officer | | 2006 | | Senior Vice President (since 2007), MetLife, Inc.; President, Met Investors Advisory, LLC; Trustee and President, Met Investors Series Trust; Executive Vice President, MetLife Investors Group, Inc.; President, Chief Executive Officer and Chair of the Board of Managers (since 2006), MetLife Advisers; President, Met Investors Advisory, LLC. | | 87 |
| | | | |
Arthur G. Typermass Age: 71 | | Director | | 1998 | | Formerly, Senior Vice President and Treasurer, MetLife. | | 38 |
Non-Interested Directors(1)
Each Director below is not an “interested person” (as defined by the 1940 Act) with respect to the Fund (collectively, the “Independent Directors”).
| | | | | | | | |
Name, Address and Age | | Current
position(s)
with Fund | | Position(s)
held since | | Principal occupations
over past five years, including other directorships(2) | | Number of
Portfolios in
Fund Complex
Overseen by
Director(3) |
Steve A. Garban† Age: 71 | | Director | | 1985 | | Formerly, Chief Financial Officer, Senior Vice President Finance and Operations and Treasurer (Emeritus), The Pennsylvania State University. | | 38 |
| | | | |
Linda B. Strumpf Age: 61 | | Director | | 2000 | | Vice President and Chief Investment Officer, Ford Foundation. | | 38 |
| | | | |
Michael S. Scott Morton† Age: 71 | | Director | | 1993 | | Jay W. Forrester Professor of Management (Emeritus) at Sloan School of Management, MIT. | | 38 |
| | | | |
H. Jesse Arnelle Age: 75 | | Director | | 2001 | | Formerly, Counsel, Womble Carlyle Sandrie & Rice; Director, Textron Inc. (global multi- industry company)*; formerly, Director, Gannet Co. Inc. (diversified news and information company)*; formerly, Director, Eastman Chemical Company (global chemical company)*; formerly, Director, Waste Management, Inc.*; formerly, Director, Armstrong Holdings Inc. (parent company of floor and ceiling products business)*; formerly, Director, FPL Group Inc. (public utility holding company)*; Director, URS Corporation (engineering design services firm)*. | | 38 |
MSF-18
Metropolitan Series Fund, Inc.
Directors and Officers—(Continued)
| | | | | | | | |
Name, Address and Age | | Current
position(s)
with Fund | | Position(s)
held since | | Principal occupations
over past five years, including other directorships(2) | | Number of
Portfolios in
Fund Complex
Overseen by
Director(3) |
Nancy Hawthorne Age: 57 | | Director | | 2003 | | Chief Executive Officer, Clerestory LLC (corporate financial advisor); Director, Avid Technologies (computer software company)*; formerly, Chairman of the Board of Avid Technologies; formerly, Board of Advisors, L. Knife & Sons, Inc. (beverage distributor); formerly, Trustee, New England Zenith Fund (“Zenith Fund”)**; formerly, Chief Executive Officer and Managing Partner, Hawthorne, Krauss and Associates (corporate financial advisor); formerly, Chief Financial Officer and Executive Vice President, Continental Cablevision, subsequently renamed MediaOne (cable television company); formerly, Director, Life F/X, Inc.; formerly, Chairman of the Board, WorldClinic (distance medicine company); formerly, Director, Perini Corporation (construction company)*; formerly, Director, CGU (property and casualty insurance company); formerly, Director, Beacon Power Corporation (energy company)*. | | 38 |
| | | | |
John T. Ludes Age: 72 | | Director | | 2003 | | President, LFP Properties (consulting firm); Formerly, Trustee, Zenith Fund**; formerly, Vice Chairman, President and Chief Operating Officer, Fortune Brands/American Brands (global conglomerate); formerly, President and CEO, Acushnet Company (athletic equipment company). | | 38 |
Officers(1)
| | | | | | | | |
Name and address | | Age | | Current
position(s)
with Fund | | Position(s)
held since | | Principal occupations over past five years(2) |
| Jeffrey L. Bernier | | 37 | | Senior Vice President | | 2008 | | Vice President (since 2008), MetLife, Inc.; Vice President (since 2008), MetLife; Senior Vice President (since 2008), MetLife Advisers; formerly, Director and Senior Investment Analyst (2004 to 2007), John Hancock Financial Services; formerly, Assistant Vice President (2000 to 2001), Wachovia Securities. |
| | | | |
| Alan C. Leland | | 56 | | Senior Vice President | | 2005 | | Treasurer and Chief Financial Officer, MetLife Advisers, LLC; Treasurer (since 2005), Met Investors Advisory, LLC; Vice President (since 2004), Met Investors Advisory, LLC; Vice President (since 2003), MetLife, Inc.; Vice President, MetLife; Senior Vice President, NELICO. |
| | | | |
| Peter Duffy | | 53 | | Vice President
and Treasurer | | 2000 | | Senior Vice President, MetLife Advisers; Second Vice President (since 2003), NELICO; Vice President, MetLife (since 2004); Vice President (since 2004), MetLife, Inc.; formerly, Vice President and Treasurer, Zenith Fund**. |
| | | | |
| Jeffrey P. Halperin | | 41 | | Chief
Compliance Officer | | 2007 | | Vice President (since 2006), MetLife, Inc.; Vice President (since 2006), MetLife; Chief Compliance Officer (since 2006), Met Investors Series Trust, MetLife Advisers, Met Investors Advisory, LLC and MetLife Investment Advisors Company, LLC. |
| * | Indicates a directorship with a registered investment company or a company subject to the reporting requirements of the Securities Exchange Act of 1934, as amended. |
| ** | The Zenith Fund deregistered with the Securities and Exchange Commission (“SEC”) in 2004. |
| (†) | Served as a trustee, director and/or officer of one or more of the following companies, each of which had a direct or indirect advisory relationship with MetLife Advisers or its affiliates prior to January 31, 2005: State Street Research Financial Trust, State Street Research Income Trust, State Street Research Money Market Trust, State Street Research Institutional Funds, State Street Research Capital Trust, State Street Research Master Investment Trust, State Street Research Equity Trust, State Street Research Securities Trust and State Street Research Exchange Trust (collectively, the “State Street Research Funds”). |
| (1) | During the period shown, each Director of the Fund served as a Trustee of Metropolitan Series Fund II, a registered investment company that ceased investment operations in June of 2008 and has applied for deregistration under the Investment Company Act of 1940. During this period, each officer of the Fund served in the same position with Metropolitan Series Fund II. |
| (2) | Previous positions during the past five years with the Fund; Met Investors Series Trust; MetLife; MetLife, Inc.; MetLife Advisers; Met Investors Advisory, LLC; Zenith Fund; NELICO; or New England Securities Corporation are omitted if not materially different. |
| (3) | The Fund Complex includes the Fund (38 portfolios) and Met Investors Series Trust (49 portfolios). |
MSF-19
Metropolitan Series Fund, Inc.
MFS Value Portfolio
Board Approval of Advisory and Subadvisory Agreements
The Fund’s Contract Review Committees of the Board of Directors (the “Board” or the “Directors”) typically meet in early fall to review the Portfolios’ advisory agreements (the “Advisory Agreements”) and subadvisory agreements (the “Subadvisory Agreements,” and, together with the Advisory Agreements, the “Agreements”) and determine whether to recommend that the full Board approve the continuation of the Agreements for an additional one-year period. (Following the initial approval of an Agreement for a new Portfolio or with a new adviser or subadviser, such annual reviews are not required until 2 years following the execution of such Agreement.) After each Committee has made its recommendations, the full Board, including the Independent Directors, determines whether to approve the continuation of each of the Agreements. In addition, the Board, including the Independent Directors, considers matters bearing on the Agreements at most of its other meetings throughout the year and regularly interviews various individuals at MetLife Advisers responsible for the management of the Portfolios. The Directors also interview selected investment managers and other professionals at the subadvisers at various times throughout the year.
The Directors receive all materials that they or MetLife Advisers, the Fund’s investment adviser, and the subadvisers believe to be reasonably necessary for the Directors to evaluate the Agreements and determine whether to approve the continuation of the Agreements. These materials generally include, among other items, (i) information on the investment performance of the Portfolios and the performance of peer groups of funds and the Portfolios’ performance benchmarks, (ii) information on the Portfolios’ advisory and subadvisory fees and other expenses, including information comparing the Portfolios’ expenses to those of peer groups of funds and information about any applicable expense caps and fee “breakpoints,” (iii) sales and redemption data, (iv) information related to the profitability of the Agreements to MetLife Advisers and certain of the subadvisers, and potential “fall-out” or ancillary benefits that MetLife Advisers, the subadvisers or their affiliates may receive as a result of their relationships with the Fund and (v) information obtained through the subadvisers’ responses to certain requests from MetLife Advisers and the Directors and MetLife Advisers’ responses to requests from the Directors. The Directors may also consider other information such as (vi) MetLife Advisers’ and the subadvisers’ financial results and condition, (vii) each Portfolio’s investment objectives and strategies and the size, education and experience of the investment staffs of MetLife Advisers and the relevant subadvisers and their use of technology and external research, (viii) the allocation of the Portfolios’ brokerage, if any, including allocations to brokers affiliated with the subadvisers and the use of “soft” commission dollars to pay Portfolio expenses and to pay for research and other similar services, (ix) the resources devoted to, and the record of compliance with, the Portfolios’ investment policies and restrictions, policies on personal securities transactions and other compliance policies, (x) the responses of MetLife Advisers, the subadvisers and/or their affiliates to certain legal and regulatory proceedings and (xi) the economic outlook generally and for the mutual fund industry in particular. Throughout the process, the Directors have the opportunity to ask questions of and request additional materials from MetLife Advisers and the subadvisers.
Following meetings of each Contract Review Committee on September 10, 2008, the Board, including the Independent Directors, at its November 6-7, 2008 meeting, approved the continuation through December 31, 2009 of the Advisory Agreements for each Portfolio of the Fund and the Subadvisory Agreements for each Portfolio other than the Zenith Equity Portfolio and Asset Allocation Portfolios (which do not have subadvisers) and the Van Eck Global Natural Resources Portfolio, Met/Dimensional International Small Cap Portfolio and Loomis Sayles Small Cap Growth Portfolio (formerly known as the Franklin Templeton Small Cap Growth Portfolio). The Agreements approved for continuation are referred to below as the “Continued Agreements.”
In considering whether to approve the continuation of the Continued Agreements, the Directors, including the Independent Directors, did not identify any single factor as determinative, and each weighed the various factors as he or she deemed appropriate. The Directors considered the following matters in connection with their approval of the Continued Agreements:
The nature, extent and quality of the services provided to the relevant Portfolios under the Continued Agreements. The Directors considered the nature, extent and quality of the services provided by MetLife Advisers, the relevant subadvisers (if any) and their affiliates (each, an “Adviser,” and, collectively, the “Advisers”) to the relevant Portfolios pursuant to the Continued Agreements and the resources dedicated to these Portfolios by the Advisers. In particular, the Directors considered the Advisers’ abilities to attract and retain highly qualified investment professionals. With respect to MetLife Advisers, the Directors considered (for each Portfolio other than the Zenith Equity and Asset Allocation Portfolios) that MetLife Advisers is (i) ultimately responsible for the performance of such Portfolios; (ii) ultimately responsible for the establishment of the investment strategies of each such Portfolio, primarily through its recommendations to the Board regarding the hiring and selection of subadvisers; (iii) responsible for the hiring and selection, subject to Board approval, of subadvisers; and (iv) responsible for maintaining a program of Subadviser oversight reasonably designed to ensure that the subadvisers have reasonable compliance policies and procedures in place. The Directors also considered that MetLife Advisers provides a full range of day-to-day administrative services for the Portfolios involving all aspects of such Portfolios’ day-to-day operations (other than portfolio management). With respect to the Zenith Equity and Asset Allocation Portfolios, the Directors considered both the portfolio management services and the administrative services provided by MetLife Advisers. After reviewing
MSF-20
Metropolitan Series Fund, Inc.
MFS Value Portfolio
Board Approval of Advisory and Subadvisory Agreements—(Continued)
these and related factors, the Directors concluded, within the context of their overall conclusions regarding each of the Continued Agreements, that the nature, extent and quality of services provided supported the renewal of these Agreements.
Investment performance of the relevant Portfolios. The Directors reviewed information about the performance of the relevant Portfolios over various time periods, including information prepared by an independent third party that compared the performance of the Portfolios to the performance of peer groups of funds and performance benchmarks. The Directors also reviewed a description of the third party’s methodology for identifying a Portfolio’s peer group(s) for purposes of performance and expense comparisons.
In the case of each relevant Portfolio that had performance that lagged its peer group(s) for certain periods, the Directors concluded that other factors relevant to performance were sufficient, in light of other considerations, to warrant renewal of the Continued Agreements relating to such Portfolio. These factors varied from Portfolio to Portfolio, but included one or more of the following: (i) that such Portfolio’s performance, although lagging in certain recent periods, was stronger over the longer term; (ii) that the underperformance was attributable, to a significant extent, to investment decisions that were reasonable and consistent with the Portfolio’s investment objective(s) and policies and that the Portfolio was performing within the range of reasonable expectations, given market conditions and the Portfolio’s investment objective(s) and policies; (iii) that the Portfolio’s performance was competitive when compared to other relevant performance benchmarks or peer groups; and (iv) that MetLife Advisers and/or the relevant subadviser (if any) had taken or was taking steps designed to help improve the Portfolio’s investment performance (including, in the case of certain Portfolios, that MetLife Advisers was formulating possible proposals, for presentation to the Board in November 2008, to replace the Portfolio’s subadviser or to merge the Portfolio into another Portfolio with a similar investment objective and better investment performance).
The Directors also considered the investment performance of the Advisers and their reputations generally, the historical responsiveness of the Advisers to Director concerns about performance and the willingness of the Advisers to take steps intended to improve performance.
After reviewing these and related factors, the Directors concluded, within the context of their overall conclusions regarding each of the Continued Agreements, that the investment performance of each relevant Portfolio and Adviser was sufficient, in light of other considerations, to warrant the renewal of the Continued Agreements.
The costs of the services to be provided and profits to be realized by the Advisers and their affiliates from their relationships with the Portfolios. The Directors considered the fees charged by MetLife Advisers to the Portfolios for advisory services and, with respect to the subadvised Portfolios, by such subadvisers to MetLife Advisers for subadvisory services (such advisory and subadvisory fees (if any), collectively, “Fees”), as well as the total expense levels of the Portfolios. This information included comparisons (provided by an independent third party) of the Portfolios’ advisory fees and total expense levels to those of their peer groups. In evaluating Fees for the relevant Portfolios, the Directors also took into account the demands, complexity and quality of the investment management services provided to each Portfolio. The Directors considered MetLife Advisers’ recommendations regarding reductions in Fee rates, implementation of Fee breakpoints and institution of Fee waivers and expense caps.
The Directors also considered the compensation directly or indirectly received by the Advisers and their affiliates from their relationships with the relevant Portfolios. The Directors reviewed information relating to the profits received by MetLife Advisers, certain of the subadvisers and their affiliates as a result of their relationships with the relevant Portfolios, and information about the allocation of expenses used to calculate profitability. When reviewing profitability, the Directors also considered the performance of the relevant Portfolios, the expense levels of such Portfolios and whether the relevant Advisers had implemented breakpoints, fee waivers and/or expense caps with respect to such Portfolios.
After reviewing these and related factors, the Directors concluded, within the context of their overall conclusions regarding each of the Continued Agreements, that the Fees charged to each of the relevant Portfolios were fair and reasonable, and that the information provided regarding costs of these services generally, and the related profitability (if known) to the relevant Advisers of their relationships with the relevant Portfolios, supported the renewal of the Continued Agreements.
Economies of Scale. The Directors considered the existence of any economies of scale in the provision of services by the Advisers and whether those economies were shared with the relevant Portfolios through breakpoints in their advisory fees or other means, such as expense caps, fee waivers or relatively low levels of fees. The Directors noted that most of the relevant Portfolios benefited or will benefit from breakpoints, expense caps and/or fee waivers with respect to their advisory fees. In considering these issues, the Directors also took into consideration information relating to the costs of the services provided and the profitability to MetLife Advisers, the relevant subadvisers (if any) and each of their affiliates of their relationships with the relevant Portfolios, as discussed above.
MSF-21
Metropolitan Series Fund, Inc.
MFS Value Portfolio
Board Approval of Advisory and Subadvisory Agreements—(Continued)
After reviewing these and related factors, the Directors concluded, within the context of their overall conclusions regarding each of the Continued Agreements, that the extent to which economies of scale were shared with the relevant Portfolios supported the renewal of such Agreements.
Other Factors. The Directors also considered other factors, which included but were not limited to the following:
| | • | | the extent to which each relevant Portfolio operated in accordance with its investment objective, and its record of compliance with its investment restrictions and the compliance programs of the Fund and the Advisers. They also considered the compliance-related resources the Advisers and their affiliates provide to the relevant Portfolios; |
| | • | | the nature, quality, cost and extent of administrative and shareholder services performed by MetLife Advisers and its affiliates under the Advisory Agreements; and |
| | • | | so-called “fall-out benefits” to the Advisers, such as the engagement of their affiliates to provide distribution, brokerage and transfer agency services to the Portfolios, and the benefits of research made available to the relevant Advisers by reason of brokerage commissions generated by the relevant Portfolios’ securities transactions. The Directors also considered the possible conflicts of interest associated with these fall-out and other benefits, and the reporting and other processes in place to disclose and monitor these possible conflicts of interest. |
Based on their evaluation of all factors that they deemed to be material, including those factors described above, and assisted by the advice of independent counsel, the Directors, including the Independent Directors, concluded that each of the Continued Agreements should be continued through December 31, 2009.
MSF-22
A description of the policies and procedures that the Fund uses to determine how to vote proxies relating to portfolio securities is available (i) without charge, upon request, by calling (800) 638-7732 and (ii) on the Securities and Exchange Commission’s (the “SEC”) website at http://www.sec.gov.
Information regarding how the Fund voted proxies relating to portfolio securities during the most recent twelve-month period ended December 31, 2008 is available (i) without charge, upon request, by calling (800) 638-7732 and (ii) on the SEC’s website at http://www.sec.gov.
The Fund’s Statement of Additional Information includes additional information about the Directors of the Fund and is available (i) without charge, upon request, by calling (800) 638-7732 and (ii) on the SEC’s website at http://www.sec.gov.
The Fund files with the SEC a complete schedule of its portfolio holdings, as of the close of the first and third quarters of its fiscal year, on “Form N-Q”. These filings are available on the SEC’s website at www.sec.gov and may be reviewed and copied at the SEC’s Public Reference Room in Washington, DC. (Call 1-800-SEC-0330 for information on the operation of the Public Reference Room.)
MSF-23
Simplify your life…
with MetLife eDelivery® while helping MetLife preserve the planet’s natural resources.
(see details on inside cover)
| | |
Metropolitan Series Fund, Inc. Morgan Stanley EAFE® Index Portfolio Annual Report | | December 31, 2008 |
NOT PART OF THE ANNUAL REPORT
Letter from the President
February 1, 2009
Letter to Policy Holders:
2008 was an extraordinary year in the capital markets around the world and for the global economy. Energy prices rose to record levels early in the year before falling by two-thirds by year-end. A credit crisis that began with concerns about sub-prime mortgages led to massive changes in the financial landscape with government takeovers, forced sales, and outright failures of a number of large, once venerable firms.
While bonds as measured by the Barclays Capital U.S. Aggregate Bond Index (formerly known as, Lehman Brothers U.S. Aggregate Bond Index) were up 5.2% for the year in response to declining interest rates, there were large differences in the total returns of the various sectors of the bond market. U.S. treasury securities were up over 13% as frightened investors sought refuge in what they perceived to be the safest and most liquid investments. In contrast, investment grade corporate securities lost nearly 5% as credit spreads widened and below investment grade or high yield bonds fell over 26%.
In response to the growing credit crisis and the weakening economy, common stocks fell sharply across all regions, styles, and capitalizations. As measured by the Standard and Poor’s 500, U.S. common stocks fell 37% for the year, the worst calendar year decline since the 1930s. Foreign stocks were down even more with the MSCI EAFE Index down 43% for the year.
On the following pages, you will find a complete review of your Portfolio and its investment performance.
MetLife is committed to building your financial freedom. We appreciate your trust and will continue to focus our efforts on meeting your investment needs.
Sincerely,
Elizabeth M. Forget
President, Metropolitan Series Fund, Inc.
Metropolitan Series Fund, Inc.
Morgan Stanley EAFE Index Portfolio
Managed by MetLife Investment Advisors Company, LLC
Portfolio Manager Commentary*
PORTFOLIO PERFORMANCE
For the twelve-month period ended December 31, 2008, the Class A shares of the Morgan Stanley EAFE Index Portfolio returned -42.1%, compared to its benchmark, the Morgan Stanley Capital International (MSCI) EAFE Index1, which returned -43.5%. Dividend income accounted for 1.7% of this year’s total return of the Index. The Portfolio’s performance cannot exactly duplicate the MSCI EAFE Index’s return because of differences that primarily result from sampling, pricing, and transaction costs.
PORTFOLIO REVIEW
During the first six months, the MSCI EAFE Index declined almost 11%. This decline was primarily due to weakness in the global economy and deteriorating financial market conditions in the US. During the second half of the year, the Index’s decline accelerated resulting in an additional negative 36% return. The US financial crisis continued to exacerbate, forcing the collapse of several major financial institutions. In an effort to support the functioning of the financial markets, a $700 billion financial-rescue plan, also known as the Troubled Asset Relief Program (TARP), was initiated which included bailout loans and the purchasing of large quantities of agency debt and mortgage-backed securities by the Treasury Department.
The strengthening US Dollar negatively impacted the US investors’ MSCI EAFE Index return versus the local currency return by approximately 3.1%. During the year, the price of oil rose from approximately $96 to a high of $145 per barrel in July, before plummeting to $45 per barrel by the end of the year, down approximately 54% from prior year-end. Oil prices fell from its highs due to decreased global oil demand and reduced investment speculation on oil futures by large financial institutions and hedge funds. Some of the factors driving the foreign equity markets included geopolitical concerns, energy prices, foreign exchange rates, corporate earnings, and unemployment rates.
All twenty-one countries comprising the MSCI EAFE Index experienced negative returns for the year. Japan, the best relative performing country, which had a beginning-of-year weight of 19.9%, was down 29.2%. The next best relative performing countries were Switzerland (6.7% beginning weight), down 29.9%; Spain (4.4% beginning weight), down 40.4%; and France (10.8% beginning weight), down 42.7%. The worst-performing country was Ireland (0.6% beginning weight), down 71.6%. The next worst-performing countries were Austria (0.6% beginning weight), down 68.0%; Belgium (1.2% beginning weight), down 66.5%; and Greece (0.8% beginning weight), down 65.5%. The United Kingdom, down 48.3%, was the largest weight in the index with a beginning weight of 22.2%, and had the largest negative contribution to the index.
The stocks with the largest positive impact on the benchmark return for the year were Volkswagen, up 53.8%; Tokyo Electric Power Company, up 30.8%; and NTT DoCoMo, up 20.4%. The stocks with the largest negative impact were Royal Bank of Scotland, down 89.8%, Nokia Oyj, down 59.1%, and Vodafone Group, down 43.6%.
* The views expressed above are those of the subadvisory firm as of December 31, 2008 and are subject to change based on market and other conditions. Information about the Portfolio’s holdings, asset allocation, industry allocation, or country diversification is historical and is not an indication of future Portfolio composition, which will vary. The performance of any index mentioned in this commentary has not been adjusted for ongoing management, distribution and operating expenses, and sales charges applicable to mutual fund investments. Direct investment in any index is not possible.
1 The Morgan Stanley Capital International Europe, Australasia and Far East Index (“MSCI EAFE Index”) is an unmanaged free float-adjusted market capitalization index that is designed to measure developed market equity performance, excluding the U.S. & Canada.
MSF-2
Metropolitan Series Fund, Inc.
Morgan Stanley EAFE Index Portfolio
A $10,000 INVESTMENT COMPARED TO THE
MSCI EAFE INDEX
Average Annual Returns as of December 31, 2008
| | | | | | | | | | | | |
| | | Morgan Stanley EAFE Index Portfolio | | | MSCI EAFE Index | |
| | | Class A | | | Class B | | | Class E | | |
| 1 Year | | -42.1 | % | | -42.2 | % | | -42.2 | % | | -43.5 | % |
| 5 Year | | 1.8 | | | 1.5 | | | 1.6 | | | 1.7 | |
| 10 Year | | 0.5 | | | — | | | — | | | 0.8 | |
| Since Inception | | — | | | -0.5 | | | 0.5 | | | — | |
Performance numbers are net of all Portfolio expenses but do not include any insurance, sales, or administrative charges of variable annuity or life insurance contracts or any additional expenses that participants in certain eligible qualified plans may bear relating to the operations of their plans. If these charges were included, the returns would be lower.
Inception dates of the Class A, Class B and Class E shares are: 11/9/98, 1/2/01 and 5/1/01, respectively.
This information represents past performance and is not indicative of future results. Investment return and principal value may fluctuate so that shares, upon redemption, may be worth more or less than the original cost.
PORTFOLIO COMPOSITION
as of December 31, 2008
Top Holdings
| | |
| | | % of Total
Net Assets |
iShares MSCI EAFE Index Fund | | 2.5% |
Nestle S.A. | | 1.9% |
BP, Plc. | | 1.8% |
Novartis AG | | 1.5% |
Total S.A. | | 1.4% |
HSBC Holdings, Plc. | | 1.4% |
Roche Holding AG | | 1.3% |
Vodafone Group, Plc. | | 1.3% |
GlaxoSmithKline, Plc. | | 1.2% |
Telefonica S.A. | | 1.2% |
Top Countries
| | | |
| | | % of Equity
Market Value | |
Japan | | 25.2 | % |
United Kingdom | | 19.9 | % |
France | | 10.9 | % |
Germany | | 8.7 | % |
Switzerland | | 8.4 | % |
Australia | | 6.0 | % |
Spain | | 4.5 | % |
Italy | | 3.7 | % |
Netherlands | | 2.4 | % |
Sweden | | 2.0 | % |
MSF-3
Metropolitan Series Fund, Inc.
Shareholder Expense Example
As a shareholder of the Portfolio, you incur ongoing costs, including management fees; distribution and service (12b-1) fees; and other Portfolio expenses. This example is intended to help you understand your ongoing costs (in dollars) (referred to as “expenses”) of investing in the Portfolio and compare these costs with the ongoing costs of investing in other mutual funds. The example is based on an investment of $1,000 invested at the beginning of the period and held for the entire period, July 1, 2008 through December 31, 2008.
Actual Expenses
The first line for each share class of the Portfolio in the table below provides information about actual account values and actual expenses. You may use the information in this line, together with the amount you invested in the particular share class of the Portfolio, to estimate the expenses that you paid over the period. Simply divide your account value by $1,000 (for example, an $8,600 account value divided by $1,000=8.6), then multiply the result by the number in the first line under the heading entitled “Expenses Paid During Period” to estimate the expenses you paid on your account during this period.
Hypothetical Example for Comparison Purposes
The second line for each share class of the Portfolio in the table below provides information about hypothetical account values and hypothetical expenses based on the Portfolio’s actual expense ratio and an assumed rate of return of 5% per year before expenses, which is not the Portfolio’s actual return. The hypothetical account values and expenses may not be used to estimate the actual ending account balance or expenses you paid for the period. You may use this information to compare the ongoing costs of investing in the Portfolio and other funds. To do so, compare this 5% hypothetical example with the 5% hypothetical examples that appear in the shareholder reports of the other funds.
Please note that the expenses shown in the table are meant to highlight your ongoing costs only and do not reflect any fees or charges of your variable insurance product or any additional expenses that participants in certain eligible qualified plans may bear relating to the operations of their plan. Therefore, the second line for each share class in the table is useful in comparing ongoing costs only, and will not help you determine the relative total costs of owning different funds. In addition, if these other costs were included, your costs would have been higher.
| | | | | | | | | | | | | | |
Portfolio | | | | Annualized
Expense
Ratio | | | Beginning
Account Value
July 1,
2008 | | Ending
Account Value
December 31,
2008 | | Expenses Paid
During Period*
July 1, 2008
to
December 31,
2008 |
Morgan Stanley EAFE Index—Class A(a) | | Actual | | 0.42 | % | | $ | 1,000.00 | | $ | 648.20 | | $ | 1.74 |
| | Hypothetical | | 0.42 | % | | $ | 1,000.00 | | $ | 1,023.00 | | $ | 2.14 |
| | | | | |
Morgan Stanley EAFE Index—Class B(a) | | Actual | | 0.67 | % | | $ | 1,000.00 | | $ | 647.68 | | $ | 2.77 |
| | Hypothetical | | 0.67 | % | | $ | 1,000.00 | | $ | 1,021.73 | | $ | 3.40 |
| | | | | |
Morgan Stanley EAFE Index—Class E(a) | | Actual | | 0.57 | % | | $ | 1,000.00 | | $ | 647.43 | | $ | 2.36 |
| | Hypothetical | | 0.57 | % | | $ | 1,000.00 | | $ | 1,022.24 | | $ | 2.90 |
* Expenses paid are equal to the Portfolio’s annualized expense ratio for the most recent six month period, as shown above, multiplied by the average account value over the period, multiplied by the number of days in the most recent fiscal half-year, divided by 366 (to reflect the the one-half year period).
(a) The annualized expense ratio shown reflects the impact of the management fee waiver as described in Note 4 to the Financial Statements.
MSF-4
Metropolitan Series Fund, Inc.
Morgan Stanley EAFE Index Portfolio
Schedule of Investments as of December 31, 2008
Common Stock—96.6% of Total Net Assets
| | | | | |
| Security Description | | Shares | | Value* |
| | | | | |
| | |
Australia—5.7% | | | | | |
AGL Energy, Ltd. | | 27,513 | | $ | 293,637 |
Alumina, Ltd. (a) | | 77,975 | | | 76,334 |
Amcor, Ltd. | | 57,157 | | | 232,307 |
AMP, Ltd. (a) | | 121,108 | | | 460,401 |
ASX, Ltd. (a) | | 11,184 | | | 261,156 |
Australia & New Zealand Banking Group, Ltd. | | 126,733 | | | 1,360,293 |
AXA Asia Pacific Holdings, Ltd. | | 50,272 | | | 174,304 |
Bendigo Bank, Ltd. | | 16,859 | | | 130,526 |
BHP Billiton, Ltd. | | 211,929 | | | 4,463,505 |
BlueScope Steel, Ltd. | | 75,643 | | | 185,781 |
Boral, Ltd. (a) | | 33,631 | | | 108,937 |
Brambles, Ltd. | | 89,667 | | | 465,922 |
CFS Retail Property Trust (REIT) (a) | | 95,649 | | | 125,462 |
Coca-Cola Amatil, Ltd. | | 42,510 | | | 274,750 |
Cochlear, Ltd. | | 4,856 | | | 191,174 |
Commonwealth Bank of Australia | | 90,329 | | | 1,831,421 |
Computershare, Ltd. | | 29,681 | | | 162,304 |
Crown, Ltd. (a) | | 29,464 | | | 123,340 |
CSL, Ltd. | | 37,049 | | | 874,857 |
CSR, Ltd. (a) | | 79,151 | | | 97,707 |
DB RREEF Trust (REIT) | | 188,026 | | | 109,265 |
Fairfax Media, Ltd. (a) | | 84,531 | | | 96,985 |
Fortescue Metals Group, Ltd. (a) (b) | | 82,630 | | | 112,914 |
Foster’s Group, Ltd. | | 131,472 | | | 505,794 |
Goodman Fielder, Ltd. | | 87,559 | | | 81,490 |
Goodman Group (REIT) (a) | | 213,499 | | | 113,209 |
GPT Group (REIT) (a) | | 356,812 | | | 230,751 |
Incitec Pivot, Ltd. | | 104,676 | | | 185,164 |
Insurance Australia Group, Ltd. (a) | | 111,884 | | | 305,240 |
Leighton Holdings, Ltd. | | 9,786 | | | 190,335 |
Lend Lease Corp., Ltd. | | 20,464 | | | 103,479 |
Lion Nathan, Ltd. (a) | | 21,432 | | | 123,320 |
Macquarie Group, Ltd. (a) | | 17,263 | | | 350,878 |
Macquarie Infrastructure Group (a) | | 183,237 | | | 219,773 |
Metcash, Ltd. | | 49,589 | | | 151,991 |
Mirvac Group (REIT) | | 155,809 | | | 140,425 |
National Australia Bank, Ltd. | | 118,494 | | | 1,737,158 |
Newcrest Mining, Ltd. | | 28,699 | | | 680,657 |
OneSteel, Ltd. | | 52,833 | | | 91,453 |
Orica, Ltd. | | 21,486 | | | 210,954 |
Origin Energy, Ltd. | | 54,981 | | | 620,154 |
Oxiana, Ltd. (a) | | 189,734 | | | 72,755 |
Qantas Airways, Ltd. | | 58,796 | | | 108,417 |
QBE Insurance Group, Ltd. | | 62,675 | | | 1,139,280 |
Rio Tinto, Ltd. (a) | | 17,460 | | | 467,666 |
Santos, Ltd. | | 36,830 | | | 384,915 |
Sims Group, Ltd. | | 9,738 | | | 118,434 |
Sonic Healthcare, Ltd. | | 24,290 | | | 247,265 |
Stockland (REIT) (a) | | 92,213 | | | 266,814 |
Suncorp-Metway, Ltd. | | 59,372 | | | 350,506 |
TABCORP Holdings, Ltd. | | 29,263 | | | 143,243 |
Tattersall’s, Ltd. (a) | | 76,330 | | | 149,115 |
Telstra Corp., Ltd. | | 286,849 | | | 768,068 |
Toll Holdings, Ltd. | | 41,980 | | | 181,506 |
Transurban Group | | 86,903 | | | 333,706 |
Wesfarmers, Ltd. (a) | | 43,571 | | | 550,203 |
Wesfarmers, Ltd. (Price Protected Shares) (b) | | 11,090 | | | 140,116 |
| | | | | |
| Security Description | | Shares | | Value* |
| | | | | |
| | |
Australia—(Continued) | | | | | |
Westfield Group (REIT) | | 113,549 | | $ | 1,046,209 |
Westpac Banking Corp. | | 176,877 | | | 2,106,361 |
Woodside Petroleum, Ltd. | | 32,342 | | | 834,658 |
Woolworths, Ltd. | | 75,638 | | | 1,411,247 |
WorleyParsoms, Ltd. | | 10,634 | | | 105,938 |
| | | | | |
| | | | | 29,181,929 |
| | | | | |
| | |
Austria—0.3% | | | | | |
Erste Bank der oesterreichischen Sparkassen AG (a) | | 12,016 | | | 281,684 |
OMV AG | | 11,469 | | | 305,749 |
Raiffeisen International Bank Holding AG (a) | | 3,451 | | | 96,581 |
Strabag SE | | 3,233 | | | 74,489 |
Telekom Austria AG | | 21,249 | | | 307,134 |
Verbund-Oesterreichische Elektrizitaetswirtschafts AG (Class A) | | 5,457 | | | 250,407 |
Voestalpine AG | | 7,335 | | | 157,272 |
Wiener Staedtische Versicherung AG | | 2,420 | | | 83,488 |
Wienerberger AG | | 5,290 | | | 88,343 |
| | | | | |
| | | | | 1,645,147 |
| | | | | |
| | |
Belgium—0.7% | | | | | |
Anheuser-Busch InBev NV | | 17,553 | | | 98 |
Belgacom S.A. | | 10,680 | | | 407,377 |
Colruyt S.A. (a) | | 1,086 | | | 232,578 |
Delhaize Group | | 6,756 | | | 416,870 |
Dexia S.A. (a) | | 32,440 | | | 146,014 |
Fortis | | 137,599 | | | 182,627 |
Fortis Bank S.A. (b) (c) (d) | | 5 | | | 0 |
Groupe Bruxelles Lambert S.A. | | 5,116 | | | 407,121 |
InBev NV | | 30,371 | | | 704,131 |
KBC Groep NV | | 10,239 | | | 309,266 |
Mobistar S.A. | | 1,944 | | | 140,017 |
Nationale A Portefeuille | | 2,443 | | | 118,793 |
Solvay S.A. | | 3,502 | | | 260,366 |
UCB S.A. (a) | | 6,793 | | | 221,272 |
Umicore S.A. | | 6,589 | | | 130,011 |
| | | | | |
| | | | | 3,676,541 |
| | | | | |
| | |
Bermuda—0.3% | | | | | |
Cheung Kong Infrastructure Holdings, Ltd. (HKD) | | 33,000 | | | 124,513 |
Esprit Holdings, Ltd. (HKD) | | 78,500 | | | 447,452 |
Frontline, Ltd. (NOK) | | 3,220 | | | 93,905 |
Kerry Properties, Ltd. (HKD) (a) | | 46,500 | | | 125,159 |
Li & Fung, Ltd. (HKD) (a) | | 150,800 | | | 260,178 |
Noble Group, Ltd. (SGD) | | 146,000 | | | 104,571 |
SeaDrill, Ltd. (NOK) | | 18,268 | | | 148,899 |
Shangri-La Asia, Ltd. (HKD) (a) | | 101,114 | | | 116,867 |
Yue Yuen Industrial Holdings, Ltd. (HKD) | | 50,500 | | | 100,072 |
| | | | | |
| | | | | 1,521,616 |
| | | | | |
| | |
Denmark—0.8% | | | | | |
AP Moller-Maersk A/S (Series A) | | 35 | | | 189,964 |
AP Moller-Maersk A/S (Series B) | | 72 | | | 385,775 |
Carlsberg A/S (Class B) (a) | | 4,506 | | | 147,937 |
Coloplast A/S | | 2,044 | | | 140,882 |
Danisco A/S (a) | | 3,322 | | | 135,396 |
*See accompanying notes to financial statements.
MSF-5
Metropolitan Series Fund, Inc.
Morgan Stanley EAFE Index Portfolio
Schedule of Investments as of December 31, 2008
Common Stock—(Continued)
| | | | | |
| Security Description | | Shares | | Value* |
| | | | | |
| | |
Denmark—(Continued) | | | | | |
Danske Bank A/S | | 26,805 | | $ | 271,032 |
DSV A/S (a) | | 12,153 | | | 132,341 |
FLSmidth & Co. A/S (a) | | 3,194 | | | 111,146 |
Jyske Bank A/S | | 3,993 | | | 94,053 |
Novo Nordisk A/S | | 28,025 | | | 1,426,175 |
Novozymes A/S (Series B) | | 3,213 | | | 255,976 |
Topdanmark A/S | | 1,150 | | | 149,302 |
TrygVesta A/S (a) | | 2,044 | | | 126,818 |
Vestas Wind Systems A/S | | 11,746 | | | 698,111 |
| | | | | |
| | | | | 4,264,908 |
| | | | | |
| | |
Finland—1.3% | | | | | |
Elisa Oyj | | 9,437 | | | 163,348 |
Fortum Oyj | | 27,597 | | | 592,767 |
Kesko Oyj | | 4,472 | | | 112,069 |
Kone Oyj | | 10,280 | | | 225,399 |
Metso Oyj | | 8,217 | | | 99,350 |
Neste Oil Oyj (a) | | 7,224 | | | 107,879 |
Nokia Oyj | | 240,053 | | | 3,721,524 |
Orion Oyj (Series B) | | 5,519 | | | 93,431 |
Outokumpu Oyj (a) | | 6,340 | | | 74,496 |
Pohjola Bank, Plc. (a) | | 7,483 | | | 103,631 |
Rautaruukki Oyj | | 5,366 | | | 92,479 |
Sampo Oyj | | 27,863 | | | 520,432 |
Stora Enso Oyj | | 40,497 | | | 316,129 |
UPM-Kymmene Oyj | | 32,997 | | | 418,384 |
Wartsila Oyj (a) | | 5,341 | | | 158,933 |
| | | | | |
| | | | | 6,800,251 |
| | | | | |
| | |
France—10.1% | | | | | |
Accor S.A. (a) | | 12,073 | | | 594,110 |
Aeroports de Paris | | 2,209 | | | 149,493 |
Air France-KLM (a) | | 7,711 | | | 99,127 |
Air Liquide S.A. (a) | | 15,382 | | | 1,407,371 |
Alcatel-Lucent (a) | | 146,253 | | | 315,792 |
Alstom | | 14,263 | | | 842,270 |
Atos Origin S.A. | | 3,727 | | | 93,543 |
AXA S.A. (a) | | 97,725 | | | 2,178,749 |
BNP Paribas | | 51,799 | | | 2,187,285 |
Bouygues | | 15,053 | | | 637,157 |
Bureau Veritas S.A. (a) (b) | | 2,571 | | | 103,245 |
Cap Gemini S.A. | | 8,581 | | | 330,741 |
Carrefour S.A. (a) | | 41,089 | | | 1,577,944 |
Casino Guichard-Perrachon S.A. | | 3,089 | | | 234,895 |
Christian Dior S.A. | | 3,396 | | | 191,553 |
Cie de Saint-Gobain (a) | | 17,609 | | | 830,530 |
Cie Generale d’Optique Essilor International S.A. (a) | | 12,229 | | | 573,786 |
Cie Generale de Geophysique-Veritas (a) (b) | | 8,270 | | | 123,489 |
CNP Assurances | | 2,630 | | | 190,302 |
Compagnie Générale des Etablissements Michelin (Class B) | | 9,437 | | | 494,821 |
Credit Agricole S.A. | | 60,620 | | | 689,399 |
Dassault Systemes S.A. (a) | | 4,077 | | | 184,231 |
Eiffage S.A. (a) | | 2,346 | | | 122,716 |
Electricite de France | | 12,399 | | | 720,641 |
Eutelsat Communications (a) (b) | | 5,527 | | | 130,520 |
| | | | | |
| Security Description | | Shares | | Value* |
| | | | | |
| | |
France—(Continued) | | | | | |
France Telecom S.A. | | 115,452 | | $ | 3,229,328 |
Gaz de France S.A. (a) | | 69,130 | | | 3,423,802 |
Groupe Danone | | 27,582 | | | 1,664,711 |
Hermes International (a) | | 4,408 | | | 615,751 |
ICADE | | 1,079 | | | 89,810 |
Imerys S.A. | | 1,878 | | | 85,409 |
JC Decaux S.A. | | 4,418 | | | 76,067 |
Klepierre (REIT) (a) | | 5,150 | | | 126,226 |
L’Oreal S.A. | | 15,159 | | | 1,317,261 |
Lafarge S.A. | | 8,052 | | | 489,565 |
Lagardere S.C.A. | | 8,303 | | | 337,015 |
Legrand S.A. | | 5,988 | | | 115,059 |
lliad S.A. | | 1,063 | | | 92,070 |
LVMH Moet Hennessy Louis Vuitton S.A. (a) | | 15,517 | | | 1,042,527 |
M6-Metropole Television | | 4,251 | | | 82,254 |
Natixis | | 61,277 | | | 107,705 |
Neopost S.A. (a) | | 1,997 | | | 180,755 |
PagesJaunes Groupe S.A. (a) | | 6,661 | | | 65,474 |
Pernod-Ricard S.A. (a) | | 10,116 | | | 750,155 |
Peugoet S.A. (a) | | 8,508 | | | 145,068 |
Pinault-Printemps-Redoute S.A. (a) | | 4,886 | | | 319,182 |
Publicis Groupe (a) | | 7,880 | | | 202,841 |
Renault S.A. | | 11,630 | | | 303,359 |
Safran S.A. | | 14,320 | | | 193,067 |
Sanofi-Aventis S.A. | | 66,339 | | | 4,213,448 |
Schneider Electric S.A. (a) | | 14,039 | | | 1,048,662 |
Scor SE | | 11,686 | | | 268,665 |
Societe Des Autoroutes Paris-Rhin-Rhone | | 1,469 | | | 102,059 |
Societe Television Francaise 1 (a) | | 9,194 | | | 134,427 |
Société BIC S.A. | | 1,753 | | | 100,721 |
Société Générale | | 29,858 | | | 1,512,234 |
Sodexho Alliance S.A. (a) | | 5,937 | | | 328,554 |
Suez Environment S.A. (b) | | 16,270 | | | 274,342 |
Technip S.A. | | 6,217 | | | 190,464 |
Thales S.A. | | 6,811 | | | 284,232 |
Total S.A. | | 134,502 | | | 7,332,736 |
Unibail-Rodamco (REIT) | | 5,058 | | | 753,344 |
Vallourec | | 3,284 | | | 373,507 |
Veolia Environnement S.A. | | 23,280 | | | 730,638 |
Vinci S.A. | | 26,531 | | | 1,117,299 |
Vivendi | | 73,828 | | | 2,403,667 |
Wendel (a) | | 1,736 | | | 86,246 |
Zodiac S.A. (a) | | 2,708 | | | 98,557 |
| | | | | |
| | | | | 51,411,973 |
| | | | | |
| | |
Germany—8.2% | | | | | |
Adidas AG (a) | | 12,448 | | | 478,752 |
Allianz SE | | 28,579 | | | 3,065,328 |
BASF AG | | 59,376 | | | 2,346,215 |
Bayer AG (a) | | 48,304 | | | 2,837,607 |
Bayerische Motoren Werke AG (a) | | 20,475 | | | 629,378 |
Beiersdorf AG (a) | | 5,572 | | | 331,482 |
Celesio AG | | 5,284 | | | 144,311 |
Commerzbank AG (a) | | 47,713 | | | 454,816 |
Daimler AG (a) | | 54,923 | | | 2,086,869 |
Deutsche Bank AG | | 33,728 | | | 1,345,018 |
*See accompanying notes to financial statements.
MSF-6
Metropolitan Series Fund, Inc.
Morgan Stanley EAFE Index Portfolio
Schedule of Investments as of December 31, 2008
Common Stock—(Continued)
| | | | | |
| Security Description | | Shares | | Value* |
| | | | | |
| | |
Germany—(Continued) | | | | | |
Deutsche Boerse AG | | 12,158 | | $ | 885,495 |
Deutsche Lufthansa AG | | 17,782 | | | 281,531 |
Deutsche Post AG | | 52,248 | | | 883,932 |
Deutsche Postbank AG (a) | | 5,103 | | | 112,852 |
Deutsche Telekom AG | | 179,150 | | | 2,721,927 |
E.ON AG | | 119,994 | | | 4,852,216 |
Fraport AG Frankfurt Airport Services (a) | | 2,305 | | | 100,663 |
Fresenius Medical Care AG | | 13,073 | | | 613,034 |
Fresenius SE (a) | | 1,704 | | | 86,344 |
GEA Group AG | | 10,696 | | | 183,401 |
Hannover Rueckversicherung AG | | 3,778 | | | 120,192 |
Henkel KGaA | | 9,848 | | | 261,118 |
Hochtief AG | | 3,848 | | | 195,216 |
K&S AG | | 9,505 | | | 545,682 |
Linde AG | | 9,079 | | | 768,297 |
MAN AG | | 6,440 | | | 355,182 |
Merck KGaA | | 4,173 | | | 379,399 |
Metro AG | | 7,039 | | | 285,313 |
Müenchener Rüeckversicherungs AG (a) | | 13,084 | | | 2,056,111 |
Puma AG Rudolf Dassler Sport | | 445 | | | 88,416 |
Q-Cells AG (a) (b) | | 3,759 | | | 136,417 |
RWE AG | | 27,981 | | | 2,515,398 |
Salzgitter AG | | 2,440 | | | 192,719 |
SAP AG | | 55,214 | | | 1,978,822 |
Siemens AG | | 54,835 | | | 4,107,167 |
SolarWorld AG (a) | | 4,671 | | | 101,647 |
ThyssenKrupp AG | | 22,242 | | | 601,478 |
TUI AG | | 13,050 | | | 148,820 |
Volkswagen AG | | 7,364 | | | 2,579,666 |
Wacker Chemie AG | | 978 | | | 104,007 |
| | | | | |
| | | | | 41,962,238 |
| | | | | |
| | |
Greece—0.5% | | | | | |
Alpha Bank A.E. | | 23,734 | | | 222,918 |
Coca-Cola Hellenic Bottling Co. S.A. | | 11,079 | | | 161,616 |
EFG Eurobank Ergasias S.A. | | 21,566 | | | 171,127 |
Hellenic Telecommunications Organization S.A. | | 17,555 | | | 292,035 |
Marfin Investment Group S.A. | | 42,239 | | | 169,741 |
National Bank of Greece S.A. | | 30,833 | | | 571,034 |
OPAP S.A. | | 15,100 | | | 434,402 |
Piraeus Bank S.A. | | 27,240 | | | 245,298 |
Public Power Corp. S.A. | | 7,286 | | | 116,990 |
| | | | | |
| | | | | 2,385,161 |
| | | | | |
| | | | | |
| | |
Hong Kong—1.7% | | | | | |
Bank of East Asia, Ltd. (a) | | 101,200 | | | 213,469 |
BOC Hong Kong Holdings, Ltd. | | 253,965 | | | 289,897 |
Cathay Pacific Airways, Ltd. (a) | | 87,000 | | | 98,108 |
Cheung Kong Holdings, Ltd. | | 88,000 | | | 838,988 |
CLP Holdings, Ltd. | | 130,877 | | | 889,853 |
Hang Lung Group, Ltd. | | 60,000 | | | 183,136 |
Hang Lung Properties, Ltd. | | 160,000 | | | 350,975 |
Hang Seng Bank, Ltd. | | 49,400 | | | 652,454 |
Henderson Land Development Co., Ltd. | | 73,000 | | | 272,703 |
Hong Kong & China Gas Co. | | 257,195 | | | 389,917 |
Hong Kong Electric Holdings (a) | | 93,049 | | | 523,431 |
| | | | | |
| Security Description | | Shares | | Value* |
| | | | | |
| | |
Hong Kong—(Continued) | | | | | |
Hong Kong Exchanges & Clearing, Ltd. (a) | | 67,500 | | $ | 647,144 |
Hopewell Holdings | | 50,000 | | | 165,385 |
Hutchison Whampoa, Ltd. | | 139,000 | | | 701,158 |
MTR Corp. | | 95,000 | | | 221,511 |
New World Development, Ltd. | | 174,354 | | | 178,127 |
PCCW, Ltd. (a) | | 269,794 | | | 129,439 |
Sino Land Co. | | 104,000 | | | 108,696 |
Sun Hung Kai Properties, Ltd. | | 91,000 | | | 765,163 |
Swire Pacific, Ltd. (a) | | 53,817 | | | 373,157 |
The Link (REIT) | | 148,141 | | | 246,253 |
Wharf Holdings, Ltd. | | 95,433 | | | 263,691 |
Wheelock & Co., Ltd. (a) | | 68,000 | | | 150,638 |
| | | | | |
| | | | | 8,653,293 |
| | | | | |
| | |
Ireland—0.3% | | | | | |
Allied Irish Banks, Plc. | | 60,464 | | | 147,043 |
Bank of Ireland | | 71,813 | | | 84,617 |
CRH, Plc. | | 34,755 | | | 877,135 |
Elan Corp., Plc. | | 32,780 | | | 193,122 |
Kerry Group, Plc. | | 9,378 | | | 171,020 |
| | | | | |
| | | | | 1,472,937 |
| | | | | |
| | |
Italy—3.5% | | | | | |
A2A S.p.A. (a) | | 83,970 | | | 150,498 |
Alleanza Assicurazioni S.p.A. | | 34,088 | | | 277,776 |
Assicuraziono Generali S.p.A. | | 68,786 | | | 1,885,669 |
Atlantia S.p.A. | | 16,870 | | | 310,222 |
Banca Carige S.p.A. (a) | | 49,591 | | | 119,161 |
Banca Monte dei Paschi di Siena S.p.A. (a) | | 159,047 | | | 342,834 |
Banca Popolare di Milano Scarl | | 27,586 | | | 163,384 |
Banco Popolare Scarl | | 42,175 | | | 295,449 |
Enel S.p.A. | | 283,024 | | | 1,809,967 |
Eni S.p.A. | | 164,934 | | | 3,908,256 |
FIAT S.p.A. (a) | | 45,156 | | | 294,418 |
Finmeccanica S.p.A. (b) | | 28,782 | | | 440,901 |
Fondiaria-Sai S.p.A. | | 4,556 | | | 82,451 |
Intesa Sanpaolo S.p.A. | | 484,200 | | | 1,744,055 |
Intesa Sanpaolo S.p.A.—RNC | | 56,998 | | | 145,965 |
Lottomatica S.p.A. | | 4,311 | | | 106,440 |
Luxottica Group S.p.A. (a) | | 9,343 | | | 167,019 |
Mediaset S.p.A. (a) | | 51,298 | | | 292,951 |
Mediobanca S.p.A. | | 31,951 | | | 324,489 |
Parmalat S.p.A. (b) | | 142,528 | | | 233,592 |
Prysmian S.p.A. (b) | | 8,255 | | | 129,654 |
Saipem S.p.A. | | 16,902 | | | 283,808 |
Snam Rete Gas S.p.A. (a) | | 57,394 | | | 317,010 |
Telecom Italia S.p.A. | | 644,775 | | | 1,048,759 |
Telecom Italia S.p.A.-RNC | | 396,854 | | | 442,835 |
Terna Rete Elettrica Nazionale S.p.A. | | 79,134 | | | 259,108 |
UniCredito Italiano S.p.A. | | 724,496 | | | 1,803,666 |
Unione di Banche Italiane SCPA | | 37,720 | | | 545,917 |
| | | | | |
| | | | | 17,926,254 |
| | | | | |
| | |
Japan—24.6% | | | | | |
Acom Co., Ltd. | | 3,140 | | | 131,743 |
Advantest Corp. (a) | | 11,800 | | | 191,036 |
*See accompanying notes to financial statements.
MSF-7
Metropolitan Series Fund, Inc.
Morgan Stanley EAFE Index Portfolio
Schedule of Investments as of December 31, 2008
Common Stock—(Continued)
| | | | | |
| Security Description | | Shares | | Value* |
| | | | | |
| | |
Japan—(Continued) | | | | | |
Aeon Co., Ltd. (a) | | 40,400 | | $ | 404,656 |
Aeon Mall Co., Ltd. (a) | | 4,700 | | | 90,737 |
Aioi Insurance Co., Ltd. | | 32,000 | | | 166,836 |
Aisin Seiki Co., Ltd. | | 11,400 | | | 161,786 |
Ajinomoto Co., Inc. (a) | | 40,000 | | | 435,744 |
Alfresa Holdings Corp. (a) | | 2,200 | | | 105,077 |
All Nippon Airways Co., Ltd. (a) | | 40,000 | | | 158,060 |
Amada Co., Ltd. | | 27,000 | | | 130,698 |
Asahi Breweries, Ltd. | | 24,300 | | | 418,190 |
Asahi Glass Co., Ltd. | | 60,000 | | | 340,779 |
Asahi Kasei Corp. | | 79,000 | | | 347,211 |
Asics Corp. | | 11,000 | | | 88,698 |
Astellas Pharma, Inc. | | 29,800 | | | 1,212,604 |
Benesse Corp. | | 5,000 | | | 218,528 |
Bridgestone Corp. | | 38,000 | | | 570,715 |
Brother Industries, Ltd. (a) | | 16,400 | | | 97,834 |
Canon, Inc. (a) | | 67,500 | | | 2,118,929 |
Casio Computer Co., Ltd. | | 18,100 | | | 113,720 |
Central Japan Railway Co. | | 100 | | | 864,287 |
Chubu Electric Power Co., Inc. | | 41,200 | | | 1,252,176 |
Chugai Pharmaceutical Co., Ltd. | | 15,100 | | | 292,290 |
Chuo Mitsui Trust Holdings, Inc. | | 60,262 | | | 294,508 |
Coca-Cola West Holdings Co., Ltd. (a) | | 3,800 | | | 82,162 |
| | | | | |
Cosmo Oil Co., Ltd. | | 37,000 | | | 114,059 |
Credit Saison Co., Ltd. (a) | | 10,500 | | | 144,967 |
Dai Nippon Printing Co., Ltd. | | 40,000 | | | 440,943 |
Daicel Chemical Industries, Ltd. | | 18,000 | | | 85,409 |
Daihatsu Motor Co., Ltd. (a) | | 14,000 | | | 124,980 |
Daiichi Sankyo Co., Ltd. | | 44,700 | | | 1,062,502 |
Daikin Industries, Ltd. | | 16,800 | | | 443,066 |
Dainippon Ink & Chemicals, Inc. | | 42,000 | | | 88,112 |
Dainippon Sumitomo Pharma Co., Ltd. | | 11,000 | | | 102,525 |
Daito Trust Construction Co., Ltd. | | 5,000 | | | 261,806 |
Daiwa House Industry Co., Ltd. | | 33,000 | | | 322,897 |
Daiwa Securities Group, Inc. (a) | | 87,000 | | | 518,474 |
Denso Corp. | | 30,100 | | | 500,736 |
Dentsu, Inc. (a) (d) | | 105 | | | 216,303 |
East Japan Railway Co. (d) | | 210 | | | 1,640,063 |
Eisai Co., Ltd. | | 16,600 | | | 687,895 |
Electric Power Development Co., Ltd. | | 8,800 | | | 345,659 |
FamilyMart Co., Ltd. | | 4,300 | | | 186,799 |
Fanuc, Ltd. | | 12,200 | | | 867,652 |
Fast Retailing Co., Ltd. | | 3,100 | | | 451,795 |
Fuji Heavy Industries, Ltd. | | 42,000 | | | 114,027 |
FUJIFILM Holdings Corp. | | 30,800 | | | 677,845 |
Fujitsu, Ltd. | | 115,000 | | | 555,848 |
Fukuoka Financial Group, Inc. | | 53,000 | | | 230,857 |
Hankyu Hanshin Holdings, Inc. | | 76,000 | | | 437,325 |
Haseko Corp. | | 87,500 | | | 92,959 |
Hirose Electric Co., Ltd. (a) | | 2,200 | | | 222,114 |
Hisamitsu Pharmaceutical Co., Inc. | | 4,700 | | | 191,886 |
Hitachi Construction Machinary Co., Ltd. (a) | | 6,400 | | | 75,542 |
Hitachi, Ltd. | | 214,000 | | | 829,914 |
Hokkaido Electric Power Co., Inc. | | 11,400 | | | 288,548 |
Hokuhoku Financial Group, Inc. | | 76,000 | | | 179,926 |
Hokuriku Electric Power Co. | | 12,000 | | | 339,665 |
Honda Motor Co., Ltd. | | 104,500 | | | 2,266,322 |
| | | | | |
| Security Description | | Shares | | Value* |
| | | | | |
| | |
Japan—(Continued) | | | | | |
Hoya Corp. | | 26,300 | | $ | 456,879 |
Ibiden Co., Ltd. | | 8,100 | | | 166,978 |
Idemitsu Kosan Co., Ltd. | | 1,600 | | | 102,490 |
Ihi Corp. | | 99,000 | | | 125,690 |
Inpex Holdings, Inc. | | 53 | | | 418,729 |
Isetan Mitsukoshi Holdings, Ltd. (a) | | 22,400 | | | 192,966 |
Isuzu Motors, Ltd. | | 84,000 | | | 107,815 |
Itochu Corp. (a) | | 106,000 | | | 531,816 |
J Front Retailing Co., Ltd. (a) | | 30,000 | | | 123,746 |
Japan Airlines Corp. (a) | | 60,000 | | | 142,028 |
| | | | | |
Japan Prime Realty Investment Corp. (REIT) | | 39 | | | 92,973 |
Japan Real Estate Investment Corp. (REIT) | | 27 | | | 242,659 |
Japan Retail Fund Investment Corp. (REIT) | | 24 | | | 104,057 |
Japan Tobacco, Inc. | | 287 | | | 950,373 |
JFE Holding, Inc. | | 32,700 | | | 864,911 |
JGC Corp. | | 13,000 | | | 195,590 |
JS Group Corp. | | 16,900 | | | 261,617 |
JSR Corp. | | 11,300 | | | 127,178 |
JTEKT Corp. | | 12,600 | | | 97,210 |
Jupiter Telecommunications Co., Ltd. (b) | | 191 | | | 199,054 |
Kajima Corp. (a) | | 59,000 | | | 206,523 |
Kamigumi Co., Ltd. | | 17,000 | | | 152,243 |
Kaneka Corp. | | 20,000 | | | 127,463 |
Kao Corp. | | 33,000 | | | 999,338 |
Kawasaki Heavy Industries, Ltd. (a) | | 96,000 | | | 194,694 |
Kawasaki Kisen Kaisha, Ltd. | | 41,000 | | | 191,302 |
KDDI Corp. | | 184 | | | 1,310,519 |
Keihin Electric Express Railway Co., Ltd. (a) | | 25,000 | | | 220,786 |
Keio Corp. (a) | | 45,000 | | | 270,215 |
Keisei Electric Railway Co., Ltd. (a) | | 19,000 | | | 118,406 |
Keyence Corp. | | 2,400 | | | 491,415 |
Kikkoman Corp. | | 11,000 | | | 129,850 |
Kinden Corp. | | 9,000 | | | 81,154 |
Kintetsu Corp. (a) | | 102,120 | | | 469,197 |
Kirin Holdings Co., Ltd. | | 50,000 | | | 659,085 |
Kobe Steel, Ltd. | | 177,000 | | | 325,954 |
Komatsu, Ltd. | | 57,100 | | | 723,288 |
Konami Corp. | | 8,300 | | | 213,679 |
Konica Minolta Holdings, Inc. | | 28,000 | | | 216,966 |
Kubota Corp. | | 70,000 | | | 503,174 |
Kuraray Co., Ltd. | | 24,500 | | | 190,729 |
Kurita Water Industries, Ltd. (a) | | 7,100 | | | 191,270 |
Kyocera Corp. | | 10,000 | | | 721,400 |
Kyowa Hakko Kogyo Co., Ltd. | | 20,000 | | | 208,782 |
Kyushu Electric Power Co., Inc. | | 23,400 | | | 622,405 |
Lawson, Inc. | | 4,900 | | | 282,593 |
Leopalace21 Corp. | | 7,689 | | | 77,963 |
Mabuchi Motor Co., Ltd. (a) | | 2,000 | | | 83,065 |
Makita Corp. (a) | | 9,400 | | | 209,650 |
Marubeni Corp. | | 112,000 | | | 426,880 |
Marui Group Co., Ltd. | | 13,400 | | | 77,794 |
Matsushita Electric Industrial Co., Ltd. | | 115,000 | | | 1,440,992 |
| | | | | |
Matsushita Electric Works, Ltd. | | 24,000 | | | 213,399 |
Mazda Motor Corp. | | 62,000 | | | 104,769 |
Mediceo Paltac Holdings Co., Ltd. (a) | | 11,100 | | | 133,769 |
Meiji Dairies Corp. | | 18,000 | | | 96,567 |
Minebea Co., Ltd. (a) | | 25,000 | | | 85,909 |
*See accompanying notes to financial statements.
MSF-8
Metropolitan Series Fund, Inc.
Morgan Stanley EAFE Index Portfolio
Schedule of Investments as of December 31, 2008
Common Stock—(Continued)
| | | | | |
| Security Description | | Shares | | Value* |
| | | | | |
| | |
Japan—(Continued) | | | | | |
Mitsubishi Chemical Holdings Corp. (a) | | 88,000 | | $ | 388,359 |
Mitsubishi Corp. | | 85,900 | | | 1,205,902 |
Mitsubishi Electric Corp. | | 122,000 | | | 763,440 |
Mitsubishi Estate Co., Ltd. | | 75,000 | | | 1,236,840 |
Mitsubishi Gas & Chemical Co., Inc. | | 26,000 | | | 106,258 |
Mitsubishi Heavy Industries, Ltd. (a) | | 204,000 | | | 910,199 |
Mitsubishi Logistics Corp. | | 8,000 | | | 100,687 |
Mitsubishi Materials Corp. | | 79,000 | | | 199,173 |
Mitsubishi Motors Corp. (a) (b) | | 237,000 | | | 325,352 |
Mitsubishi Rayon Co., Ltd. (a) | | 36,000 | | | 108,573 |
Mitsubishi Tanabe Pharma Corp. | | 15,000 | | | 226,786 |
Mitsubishi UFJ Financial Group, Inc. | | 693,888 | | | 4,305,522 |
Mitsubishi UFJ Lease & Finance Co., Ltd. (a) | | 4,150 | | | 105,437 |
Mitsui & Co., Ltd. | | 109,317 | | | 1,118,237 |
Mitsui Chemicals, Inc. (a) | | 34,000 | | | 125,677 |
Mitsui Fudosan Co., Ltd. | | 53,000 | | | 880,750 |
Mitsui Mining & Smelting Co., Ltd. | | 40,000 | | | 84,530 |
Mitsui OSK Lines, Ltd. | | 75,000 | | | 460,582 |
Mitsui Sumitomo Insurance Group | | 24,000 | | | 765,443 |
Mitsumi Electric Co., Ltd. | | 5,700 | | | 100,750 |
Mizuho Financial Group, Inc. (a) (d) | | 602 | | | 1,791,714 |
Mizuho Trust & Banking Co., Ltd. (a) | | 107,000 | | | 135,529 |
Murata Manufacturing Co., Ltd. | | 14,100 | | | 552,718 |
Namco Bandai Holdings, Inc. (a) | | 12,500 | | | 137,007 |
NEC Corp. | | 120,000 | | | 402,762 |
NGK Insulators, Ltd. | | 17,000 | | | 191,328 |
NGK Spark Plug Co., Ltd. (a) | | 10,000 | | | 80,143 |
Nidec Corp. | | 7,100 | | | 276,103 |
Nikon Corp. (a) | | 23,000 | | | 275,560 |
Nintendo Co., Ltd. | | 6,200 | | | 2,382,008 |
Nippon Building Fund, Inc. (REIT) | | 35 | | | 384,156 |
Nippon Electric Glass Co., Ltd. | | 23,000 | | | 120,809 |
Nippon Express Co., Ltd. | | 48,000 | | | 201,973 |
Nippon Meat Packers, Inc. | | 14,000 | | | 211,574 |
Nippon Mining Holdings, Inc. | | 51,000 | | | 219,143 |
Nippon Oil Corp. | | 90,000 | | | 453,275 |
Nippon Paper Group, Inc. (d) | | 63 | | | 257,224 |
Nippon Sheet Glass Co., Ltd. | | 35,000 | | | 114,942 |
Nippon Steel Corp. (a) | | 319,000 | | | 1,047,543 |
Nippon Telephone & Telegraph Corp. (d) | | 319 | | | 1,714,465 |
| | | | | |
Nippon Yusen K.K. | | 75,000 | | | 462,539 |
NIPPONKOA Insurance Co., Ltd. | | 44,000 | | | 342,052 |
Nissan Chemical Industries, Ltd. (a) | | 10,000 | | | 96,830 |
Nissan Motor Co., Ltd. | | 146,500 | | | 530,624 |
Nisshin Seifun Group, Inc. | | 13,000 | | | 170,576 |
Nisshin Steel Co., Ltd. | | 51,000 | | | 104,902 |
Nissin Food Products Co., Ltd. (a) | | 4,700 | | | 164,843 |
Nitori Co., Ltd. | | 2,650 | | | 205,665 |
Nitto Denko Corp. | | 10,100 | | | 194,044 |
Nomura Holdings, Inc. (a) | | 109,200 | | | 900,496 |
Nomura Real Estate Office Fund, Inc. (REIT) | | 20 | | | 130,759 |
Nomura Research Institute, Ltd. | | 6,200 | | | 117,667 |
NSK, Ltd. | | 30,000 | | | 112,650 |
NTN Corp. (a) | | 25,000 | | | 75,472 |
NTT Data Corp. | | 80 | | | 321,134 |
NTT DoCoMo, Inc. | | 990 | | | 1,951,579 |
NTT Urban Development Corp. | | 80 | | | 86,315 |
| | | | | |
| Security Description | | Shares | | Value* |
| | | | | |
| | |
Japan—(Continued) | | | | | |
Obayashi Corp. (a) | | 39,000 | | $ | 232,537 |
Odakyu Electric Railway Co., Ltd. (a) | | 40,000 | | | 351,411 |
OJI Paper Co., Ltd. (a) | | 50,000 | | | 293,936 |
Olympus Corp. | | 16,000 | | | 321,293 |
Omron Corp. | | 13,600 | | | 182,540 |
Ono Pharmaceutical Co., Ltd. | | 6,400 | | | 332,775 |
Oracle Corp. (a) | | 2,500 | | | 108,483 |
Oriental Land Co., Ltd. (a) | | 3,400 | | | 279,631 |
ORIX Corp. | | 5,960 | | | 338,641 |
Osaka Gas Co., Ltd. | | 119,000 | | | 549,635 |
Promise Co., Ltd. (a) | | 4,100 | | | 103,921 |
Rakuten, Inc. (a) | | 385 | | | 245,114 |
Resona Holdings, Inc. (a) (d) | | 303 | | | 480,319 |
Ricoh Co., Ltd. | | 45,000 | | | 573,092 |
Rohm Co., Ltd. | | 7,400 | | | 373,666 |
Sankyo Co., Ltd. | | 3,600 | | | 181,828 |
Santen Pharmaceutical Co., Ltd. (a) | | 5,500 | | | 165,642 |
Sanyo Electric Co., Ltd. (a) | | 110,000 | | | 205,977 |
Sapporo Hokuyo Holdings, Inc. (d) | | 20 | | | 81,042 |
Sapporo Holdings, Ltd. | | 19,000 | | | 119,644 |
SBI Holdings, Inc. (a) | | 1,149 | | | 177,597 |
Secom Co., Ltd. | | 13,500 | | | 695,367 |
Sega Sammy Holdings, Inc. (a) | | 13,400 | | | 155,490 |
Seiko Epson Corp. (a) | | 8,600 | | | 136,989 |
Sekisui Chemical Co., Ltd. | | 27,000 | | | 168,647 |
Sekisui House, Ltd. (a) | | 26,000 | | | 227,579 |
Seven & I Holdings Co., Ltd. | | 52,900 | | | 1,812,340 |
Seven Bank, Ltd. | | 28 | | | 107,107 |
| | | | | |
Sharp Corp. (a) | | 65,000 | | | 465,974 |
Shikoku Electric Power Co., Inc. (a) | | 11,700 | | | 394,590 |
Shimadzu Corp. (a) | | 18,000 | | | 113,912 |
Shimamura Co., Ltd. (a) | | 1,400 | | | 108,315 |
Shimano, Inc. (a) | | 3,800 | | | 152,252 |
Shimizu Corp. (a) | | 37,000 | | | 215,809 |
Shin-Etsu Chemical Co., Ltd. | | 26,100 | | | 1,197,099 |
Shinsei Bank, Ltd. | | 101,000 | | | 159,642 |
Shionogi & Co., Ltd. | | 19,000 | | | 488,014 |
Shiseido Co., Ltd. | | 21,000 | | | 429,890 |
Showa Denko K.K. | | 83,000 | | | 120,189 |
Showa Shell Sekiyu K.K. | | 14,000 | | | 138,134 |
SMC Corp. | | 3,700 | | | 378,547 |
Softbank Corp. (a) | | 48,100 | | | 871,074 |
Sojitz Corp. | | 70,500 | | | 118,216 |
Sompo Japan Insurance, Inc. | | 51,000 | | | 373,480 |
Sony Corp. (a) | | 63,000 | | | 1,369,558 |
Sony Financial Holdings, Inc. | | 64 | | | 245,773 |
Square Enix Co., Ltd. (a) | | 4,600 | | | 148,502 |
Stanley Electric Co., Ltd. | | 11,800 | | | 124,557 |
Sumco Corp. | | 8,200 | | | 104,724 |
Sumitomo Chemical Co., Ltd. | | 100,000 | | | 341,291 |
Sumitomo Corp. (a) | | 76,600 | | | 675,094 |
Sumitomo Electric Industries, Ltd. | | 48,434 | | | 372,397 |
Sumitomo Heavy Industries, Ltd. | | 39,000 | | | 155,257 |
Sumitomo Metal Industries, Ltd. | | 239,000 | | | 589,012 |
Sumitomo Metal Mining Co., Ltd. | | 34,000 | | | 361,372 |
Sumitomo Mitsui Financial Group, Inc. (a) (d) | | 414 | | | 1,793,349 |
Sumitomo Realty & Development Co., Ltd. | | 25,000 | | | 372,477 |
*See accompanying notes to financial statements.
MSF-9
Metropolitan Series Fund, Inc.
Morgan Stanley EAFE Index Portfolio
Schedule of Investments as of December 31, 2008
Common Stock—(Continued)
| | | | | |
| Security Description | | Shares | | Value* |
| | | | | |
| | |
Japan—(Continued) | | | | | |
Sumitomo Rubber | | 11,300 | | $ | 98,486 |
Suzuken Co., Ltd. | | 5,574 | | | 167,953 |
Suzuki Motor Corp. | | 22,700 | | | 313,832 |
T&D Holdings, Inc. | | 12,400 | | | 519,937 |
Taiheiyo Cement Corp. (a) | | 62,000 | | | 119,486 |
Taisei Corp. (a) | | 69,000 | | | 190,078 |
Taisho Pharmaceutical Co., Ltd. | | 10,000 | | | 212,454 |
Taiyo Nippon Sanso Corp. | | 18,000 | | | 138,753 |
Takashimaya Co., Ltd. (a) | | 17,000 | | | 128,760 |
Takeda Pharmaceutical Co., Ltd. | | 51,500 | | | 2,671,430 |
TDK Corp. | | 7,200 | | | 264,424 |
Teijin, Ltd. (a) | | 66,000 | | | 186,570 |
Terumo Corp. | | 10,800 | | | 505,775 |
The 77 Bank, Ltd. | | 20,000 | | | 108,580 |
The Bank of Kyoto, Ltd. | | 22,000 | | | 246,592 |
The Bank of Yokohama, Ltd. | | 83,000 | | | 490,956 |
| | | | | |
The Chiba Bank, Ltd. | | 47,000 | | | 293,661 |
The Chugoku Bank, Ltd. (a) | | 12,000 | | | 184,794 |
The Chugoku Electric Power Co., Inc. | | 18,300 | | | 482,092 |
The Furukawa Electric Co., Ltd. | | 38,000 | | | 184,969 |
The Gunma Bank, Ltd. | | 26,000 | | | 165,730 |
The Hachijuni Bank, Ltd. (a) | | 30,000 | | | 172,580 |
The Hiroshima Bank, Ltd. (a) | | 38,000 | | | 166,572 |
The Iyo Bank, Ltd. (a) | | 17,000 | | | 210,993 |
The Japan Steel Works, Ltd. | | 21,000 | | | 293,039 |
The Joyo Bank, Ltd. | | 54,000 | | | 307,646 |
The Kansai Electric Power Co., Inc. | | 48,300 | | | 1,399,598 |
The Nishi-Nippon Bank, Ltd. | | 52,000 | | | 150,746 |
The Shizuoka Bank, Ltd. (a) | | 41,000 | | | 474,930 |
The Sumitomo Trust & Banking Co., Ltd. | | 91,000 | | | 538,571 |
The Suruga Bank, Ltd. (a) | | 17,000 | | | 168,365 |
The Tokyo Electric Power Co., Inc. | | 77,000 | | | 2,570,970 |
THK Co., Ltd. (a) | | 7,700 | | | 80,912 |
Tobu Railway Co., Ltd. (a) | | 52,000 | | | 309,560 |
Toho Co., Ltd. (a) | | 6,367 | | | 136,607 |
Toho Gas Co., Ltd. (a) | | 31,000 | | | 204,302 |
Tohoku Electric Power Co., Inc. | | 26,200 | | | 709,140 |
Tokio Marine Holdings, Inc. (d) | | 43,400 | | | 1,271,717 |
Tokuyama Corp. | | 15,000 | | | 126,611 |
Tokyo Electron, Ltd. | | 11,400 | | | 400,348 |
Tokyo Gas Co., Ltd. | | 147,000 | | | 744,919 |
Tokyo Tatemono Co., Ltd. | | 19,000 | | | 86,895 |
Tokyu Corp. | | 76,000 | | | 382,504 |
Tokyu Land Corp. | | 29,000 | | | 110,448 |
TonenGeneral Sekiyu K.K. (a) | | 18,000 | | | 180,181 |
Toppan Printing Co., Ltd. (a) | | 31,000 | | | 238,734 |
Toray Industries, Inc. (a) | | 83,000 | | | 422,664 |
Toshiba Corp. | | 198,000 | | | 815,270 |
Tosoh Corp. | | 36,000 | | | 88,289 |
Toto, Ltd. (a) | | 19,000 | | | 119,186 |
Toyo Seikan Kaisha, Ltd. | | 10,200 | | | 175,727 |
Toyo Suisan Kaisha, Ltd. | | 6,000 | | | 172,457 |
Toyota Industries Corp. | | 12,600 | | | 269,959 |
Toyota Motor Corp. | | 174,100 | | | 5,698,785 |
Toyota Tsusho Corp. | | 14,200 | | | 151,745 |
Trend Micro, Inc. (a) | | 7,000 | | | 244,415 |
Tsumura & Co (a) | | 3,900 | | | 144,668 |
| | | | | |
| Security Description | | Shares | | Value* |
| | | | | |
| | |
Japan—(Continued) | | | | | |
Ube Industries, Ltd. | | 68,000 | | $ | 190,865 |
Unicharm Corp. | | 3,200 | | | 241,877 |
UNY Co., Ltd. | | 13,000 | | | 143,174 |
Ushio, Inc. (a) | | 8,700 | | | 114,697 |
USS Co., Ltd. | | 1,630 | | | 86,243 |
West Japan Railway Co. | | 109 | | | 495,937 |
Yahoo! Japan Corp. (a) | | 900 | | | 368,195 |
Yakult Honsha Co., Ltd. (a) | | 5,300 | | | 113,331 |
Yamada Denki Co., Ltd. | | 5,590 | | | 388,068 |
Yamaguchi Financial Group, Inc. | | 15,000 | | | 168,562 |
Yamaha Corp. | | 11,500 | | | 106,624 |
Yamaha Motor Co., Ltd. (a) | | 13,100 | | | 137,459 |
Yamato Holdings Co., Ltd. (a) | | 27,000 | | | 352,061 |
Yamazaki Baking Co., Ltd. | | 8,000 | | | 123,099 |
Yokogawa Electric Corp. | | 15,500 | | | 101,664 |
| | | | | |
| | | | | 126,040,954 |
| | | | | |
| | |
Jersey—0.1% | | | | | |
WPP, Plc. | | 74,431 | | | 433,876 |
| | | | | |
| | |
Luxembourg—0.4% | | | | | |
ArcelorMittal | | 56,699 | | | 1,366,628 |
Millicom International Cellular S.A. (SEK) (b) | | 4,375 | | | 202,432 |
SES (FDR) | | 18,798 | | | 361,872 |
Tenaris S.A. | | 31,061 | | | 321,190 |
| | | | | |
| | | | | 2,252,122 |
| | | | | |
| | |
Netherlands—2.5% | | | | | |
Aegon NV | | 85,785 | | | 547,435 |
Akzo Nobel NV | | 14,996 | | | 618,395 |
ASML Holding NV (b) | | 26,597 | | | 474,626 |
Corio NV (REIT) | | 3,133 | | | 143,651 |
European Aeronautic Defense & Space Co. NV (a) | | 21,349 | | | 360,435 |
Fugro NV | | 3,571 | | | 102,521 |
Heineken Holding NV | | 6,799 | | | 194,647 |
Heineken NV | | 15,183 | | | 466,476 |
ING Groep NV | | 124,711 | | | 1,303,627 |
James Hardie Industries NV (AUD) | | 34,811 | | | 114,014 |
Koninklijke Ahold NV | | 78,810 | | | 968,614 |
Koninklijke Boskalis Westminster NV | | 3,508 | | | 81,485 |
Koninklijke DSM NV | | 7,886 | | | 202,149 |
Koninklijke Philips Electronics NV | | 63,499 | | | 1,234,991 |
Randstad Holding NV (a) | | 7,076 | | | 143,654 |
Reed Elsevier NV | | 39,611 | | | 466,700 |
Royal KPN NV | | 112,246 | | | 1,627,663 |
SBM Offshore NV (a) | | 9,817 | | | 128,643 |
STMicroelectronics NV (a) | | 44,693 | | | 299,318 |
TNT NV | | 23,558 | | | 452,460 |
Unilever NV | | 102,744 | | | 2,489,499 |
Wolters Kluwer NV | | 17,885 | | | 337,774 |
| | | | | |
| | | | | 12,758,777 |
| | | | | |
| | |
New Zealand—0.1% | | | | | |
Contact Energy, Ltd. | | 27,228 | | | 117,112 |
Fletcher Building, Ltd. | | 37,440 | | | 126,335 |
Telecom Corp. of New Zealand, Ltd. (a) | | 179,842 | | | 240,027 |
| | | | | |
| | | | | 483,474 |
| | | | | |
*See accompanying notes to financial statements.
MSF-10
Metropolitan Series Fund, Inc.
Morgan Stanley EAFE Index Portfolio
Schedule of Investments as of December 31, 2008
Common Stock—(Continued)
| | | | | |
| Security Description | | Shares | | Value* |
| | | | | |
| | |
Norway—0.6% | | | | | |
DnB NOR ASA | | 48,456 | | $ | 193,563 |
Norsk Hydro ASA | | 45,479 | | | 183,672 |
Orkla ASA | | 54,230 | | | 360,632 |
Renewable Energy Corp. ASA (b) | | 10,100 | | | 94,976 |
StatoilHydro ASA | | 84,249 | | | 1,387,604 |
Telenor ASA | | 50,638 | | | 338,863 |
Yara International ASA | | 11,175 | | | 244,250 |
| | | | | |
| | | | | 2,803,560 |
| | | | | |
| | |
Portugal—0.3% | | | | | |
Banco Comercial Portugues S.A. (a) | | 163,646 | | | 187,569 |
Banco Espirito Santo S.A. (a) | | 17,103 | | | 160,766 |
Brisa-Auto Estradas de Portugal S.A. (a) | | 16,279 | | | 121,635 |
Cimpor Cimentos de Portugal, SGPS, S.A. (a) | | 17,988 | | | 87,578 |
Energias de Portugal S.A. | | 120,505 | | | 454,177 |
Galp Energia SGPS S.A. (a) | | 12,522 | | | 126,059 |
Jeronimo Martins, SGPS, S.A. | | 18,941 | | | 105,220 |
Portugal Telecom, SGPS, S.A. (a) | | 42,778 | | | 363,009 |
| | | | | |
| | | | | 1,606,013 |
| | | | | |
| | |
Singapore—1.0% | | | | | |
CapitaLand, Ltd. | | 116,000 | | | 254,850 |
CapitaMall Trust (REIT) (a) | | 98,000 | | | 109,114 |
City Developments, Ltd. (a) | | 40,000 | | | 178,482 |
ComfortDelGro Corp., Ltd. | | 153,000 | | | 154,881 |
DBS Group Holdings, Ltd. | | 74,978 | | | 444,788 |
Fraser & Neave, Ltd. (a) | | 76,000 | | | 156,657 |
Keppel Corp., Ltd. | | 79,000 | | | 239,438 |
Oversea-Chinese Banking Corp. | | 170,880 | | | 595,367 |
SembCorp Industries, Ltd. | | 89,000 | | | 144,603 |
Singapore Airlines, Ltd. | | 40,940 | | | 321,377 |
Singapore Exchange, Ltd. (a) | | 54,000 | | | 193,481 |
Singapore Press Holdings, Ltd. (a) | | 117,250 | | | 253,885 |
Singapore Technologies Engineering, Ltd. | | 127,000 | | | 210,052 |
Singapore Telecommunications, Ltd. | | 500,820 | | | 891,720 |
United Overseas Bank, Ltd. | | 80,392 | | | 725,703 |
Wilmar International, Ltd. | | 62,000 | | | 121,368 |
| | | | | |
| | | | | 4,995,766 |
| | | | | |
| | |
Spain—4.5% | | | | | |
Abertis Infraestructuras S.A. | | 17,694 | | | 314,866 |
Acciona S.A. (a) | | 1,646 | | | 208,194 |
Acerinox S.A. (a) | | 12,363 | | | 198,458 |
ACS Actividades de Construccion y Servicios S.A. (a) | | 11,363 | | | 522,352 |
Banco Bilbao Vizcaya Argentaria S.A. | | 224,492 | | | 2,754,638 |
Banco de Sabadell S.A. (a) | | 57,638 | | | 392,490 |
Banco de Valencia S.A. | | 13,303 | | | 140,342 |
Banco Popular Espanol S.A. (a) | | 47,418 | | | 411,708 |
Banco Santander S.A. (a) | | 504,093 | | | 4,865,064 |
Bankinter S.A. (a) | | 16,977 | | | 152,552 |
Cintra Concesiones de Infraestructuras de Transporte S.A. (a) | | 13,818 | | | 103,963 |
Criteria Caixacorp S.A. (a) (b) | | 53,350 | | | 209,899 |
EDP Renovaveis S.A. | | 14,440 | | | 101,122 |
| | | | | |
| Security Description | | Shares | | Value* |
| | | | | |
| | |
Spain—(Continued) | | | | | |
Enagas S.A. | | 10,769 | | $ | 236,244 |
Fomento de Construcciones y Contratas S.A. | | 3,072 | | | 101,100 |
Gamesa Corp. Tecnologica S.A. | | 10,521 | | | 190,835 |
Gas Natural SDG S.A. | | 7,593 | | | 207,097 |
Gestevision Telecino S.A. | | 7,133 | | | 75,997 |
Grifols S.A. | | 8,240 | | | 143,116 |
Grupo Ferrovial S.A. (a) | | 4,336 | | | 119,443 |
Iberdrola Renovables (b) | | 51,000 | | | 220,497 |
Iberdrola S.A. | | 218,820 | | | 2,031,786 |
Iberia Lineas Aereas de Espana | | 31,120 | | | 87,161 |
Inditex S.A. (a) | | 13,792 | | | 609,625 |
Indra Sistemas S.A. (a) | | 8,289 | | | 188,343 |
Mapfre S.A. (a) | | 45,139 | | | 153,026 |
Red Electrica de Espana | | 6,962 | | | 352,712 |
Repsol YPF S.A. | | 45,323 | | | 965,316 |
Telefonica S.A. | | 266,902 | | | 5,982,732 |
Union Fenosa S.A. | | 23,022 | | | 568,998 |
Zardoya Otis S.A. (a) | | 7,249 | | | 129,055 |
| | | | | |
| | | | | 22,738,731 |
| | | | | |
| | |
Sweden—1.9% | | | | | |
Alfa Laval AB (a) | | 26,060 | | | 226,270 |
Assa Abloy AB (Series B) (a) | | 20,057 | | | 227,576 |
Atlas Copco AB (Series A) (a) | | 47,555 | | | 409,364 |
Atlas Copco AB (Series B) | | 26,061 | | | 200,314 |
Electrolux AB (a) | | 17,118 | | | 147,229 |
Getinge AB | | 1,348 | | | 15,555 |
Getinge AB (Class B) (a) | | 12,136 | | | 145,440 |
Hennes & Mauritz AB (Series B) | | 33,439 | | | 1,306,664 |
Holmen AB (Series B) | | 3,472 | | | 85,843 |
Husqvarna AB (a) | | 17,118 | | | 90,704 |
Investor AB | | 28,200 | | | 424,367 |
Nordea Bank AB | | 128,370 | | | 903,617 |
Sandvik AB (a) | | 61,232 | | | 389,005 |
Scania AB (a) | | 21,772 | | | 217,913 |
Securitas AB (a) | | 21,462 | | | 176,164 |
Skandinaviska Enskilda Banken AB | | 29,510 | | | 237,045 |
Skanska AB (a) | | 25,167 | | | 250,855 |
SKF AB (a) | | 22,272 | | | 221,718 |
SSAB Svenskt Stal AB (Series A) (a) | | 11,498 | | | 101,277 |
Svenska Cellulosa AB | | 34,876 | | | 298,242 |
Svenska Handelsbanken AB | | 29,317 | | | 477,189 |
Swedbank AB (a) | | 22,400 | | | 128,471 |
Swedish Match AB | | 18,278 | | | 261,651 |
Tele2 AB | | 17,423 | | | 154,865 |
Telefonaktiebolaget LM Ericsson (Class B) | | 187,674 | | | 1,439,367 |
TeliaSonera AB | | 142,758 | | | 710,546 |
Volvo AB (Series A) | | 28,429 | | | 160,019 |
Volvo AB (Series B) (a) | | 69,624 | | | 384,703 |
| | | | | |
| | | | | 9,791,973 |
| | | | | |
| | |
Switzerland—8.0% | | | | | |
ABB, Ltd. | | 141,489 | | | 2,132,835 |
Actelion, Ltd. (a) (b) | | 6,285 | | | 353,979 |
Adecco S.A. | | 8,604 | | | 292,037 |
Aryzta AG | | 4,300 | | | 139,598 |
*See accompanying notes to financial statements.
MSF-11
Metropolitan Series Fund, Inc.
Morgan Stanley EAFE Index Portfolio
Schedule of Investments as of December 31, 2008
Common Stock—(Continued)
| | | | | |
| Security Description | | Shares | | Value* |
| | | | | |
| | |
Switzerland—(Continued) | | | | | |
Baloise Holdings AG | | 3,194 | | $ | 240,065 |
BKW FMB Energie AG | | 1,017 | | | 98,871 |
Compagnie Financiere Richemont S.A. | | 32,172 | | | 624,605 |
Credit Suisse Group | | 67,406 | | | 1,847,547 |
Geberit AG (a) | | 2,351 | | | 253,276 |
Givaudan AG | | 405 | | | 319,042 |
Holcim, Ltd. (a) | | 12,518 | | | 720,778 |
Julius Baer Holding AG | | 13,122 | | | 504,773 |
Kuehne & Nagel International AG (a) | | 3,252 | | | 210,847 |
Lindt & Spruengli AG | | 7 | | | 149,249 |
| | | | | |
Lindt & Spruengli AG (Participation Certificate) (a) | | 55 | | | 102,152 |
Logitech International S.A. (b) | | 10,725 | | | 167,434 |
Lonza Group AG (a) | | 2,935 | | | 271,326 |
Nestle S.A. | | 241,405 | | | 9,514,393 |
Nobel Biocare Holding AG (a) | | 8,030 | | | 164,488 |
Novartis AG | | 149,975 | | | 7,514,420 |
Pargesa Holding S.A. | | 1,694 | | | 113,258 |
Roche Holding AG | | 44,287 | | | 6,817,261 |
SGS S.A. (a) | | 302 | | | 316,175 |
Sonova Holding AG (a) | | 2,594 | | | 156,493 |
Straumann Holding AG | | 534 | | | 94,059 |
Sulzer AG | | 1,960 | | | 113,007 |
Swatch Group AG (Class A) | | 3,213 | | | 87,834 |
Swatch Group AG (Class B) | | 2,093 | | | 292,362 |
Swiss Life Holding | | 2,159 | | | 149,765 |
Swiss Reinsurance | | 20,962 | | | 1,018,362 |
Swisscom AG | | 1,500 | | | 484,249 |
Syngenta AG | | 6,316 | | | 1,223,603 |
UBS AG | | 183,932 | | | 2,667,713 |
Zurich Financial Services AG | | 9,117 | | | 1,979,077 |
| | | | | |
| | | | | 41,134,933 |
| | | | | |
| | |
United Kingdom—19.1% | | | | | |
3i Group, Plc. | | 21,064 | | | 82,983 |
Admiral Group, Plc. | | 11,691 | | | 154,419 |
AMEC, Plc. | | 27,500 | | | 196,282 |
Anglo American, Plc. | | 83,380 | | | 1,904,528 |
Antofagasta, Plc. | | 24,514 | | | 151,415 |
Associated British Foods, Plc. | | 22,128 | | | 233,514 |
AstraZeneca, Plc. | | 91,591 | | | 3,711,143 |
Aviva, Plc. | | 165,050 | | | 934,258 |
BAE Systems, Plc. | | 231,814 | | | 1,263,445 |
Balfour Beatty, Plc. | | 30,333 | | | 144,510 |
Barclays, Plc. | | 536,559 | | | 1,209,631 |
BG Group, Plc. | | 211,221 | | | 2,932,543 |
BHP Billiton, Plc. | | 139,323 | | | 2,624,410 |
BP, Plc. | | 1,182,418 | | | 9,060,026 |
British Airways, Plc. | | 41,370 | | | 107,880 |
British American Tobacco, Plc. | | 119,743 | | | 3,111,326 |
British Energy Group, Plc. | | 64,769 | | | 721,359 |
British Land Co., Plc. (REIT) (a) | | 30,642 | | | 245,627 |
British Sky Broadcasting, Plc. | | 73,950 | | | 514,520 |
BT Group, Plc. | | 513,648 | | | 1,009,209 |
Bunzl, Plc. | | 22,401 | | | 191,204 |
Burberry Group, Plc. (a) | | 26,876 | | | 86,197 |
| | | | | |
Cable & Wireless, Plc. | | 157,710 | | | 356,747 |
| | | | | |
| Security Description | | Shares | | Value* |
| | | | | |
| | |
United Kingdom—(Continued) | | | | | |
Cadbury, Plc. | | 86,947 | | $ | 761,141 |
Cairn Energy, Plc. (b) | | 8,110 | | | 237,314 |
Capita Group, Plc. | | 39,413 | | | 419,946 |
Carnival, Plc. | | 11,804 | | | 257,179 |
Centrica, Plc. | | 322,622 | | | 1,239,736 |
Cobham, Plc. | | 73,272 | | | 217,860 |
Compass Group, Plc. | | 126,999 | | | 630,222 |
Diageo, Plc. | | 158,270 | | | 2,201,619 |
Drax Group | | 21,005 | | | 170,273 |
Eurasian Natural Resources Corp. (b) | | 21,266 | | | 101,853 |
Experian Group, Ltd. | | 71,621 | | | 448,521 |
FirstGroup, Plc. | | 30,753 | | | 192,387 |
Friends Provident, Plc. | | 183,982 | | | 230,754 |
G4S, Plc. | | 83,089 | | | 246,595 |
GlaxoSmithKline, Plc. | | 329,925 | | | 6,124,859 |
Hammerson, Plc. (REIT) (a) | | 17,590 | | | 136,257 |
Hays, Plc. | | 89,608 | | | 90,337 |
HBOS, Plc. (c) (d) | | 467,219 | | | 0 |
HBOS, Plc. | | 337,611 | | | 342,637 |
Home Retail Group, Plc. (b) | | 54,363 | | | 166,746 |
HSBC Holdings, Plc. | | 759,927 | | | 7,273,434 |
ICAP, Plc. (a) | | 36,213 | | | 151,021 |
IMI, Plc. | | 24,507 | | | 96,300 |
Imperial Tobacco Group, Plc. | | 64,202 | | | 1,715,036 |
Intercontinental Hotels Group, Plc. | | 22,824 | | | 185,711 |
International Power, Plc. | | 93,731 | | | 325,442 |
Invensys, Plc. | | 47,928 | | | 120,749 |
Investec, Plc. | | 26,347 | | | 109,716 |
J. Sainsbury Co. | | 64,876 | | | 308,497 |
Johnson Matthey, Plc. | | 14,556 | | | 231,034 |
Kingfisher, Plc. | | 152,400 | | | 298,053 |
Ladbrokes, Plc. | | 47,638 | | | 127,404 |
Land Securities Group, Plc. (REIT) | | 28,545 | | | 380,464 |
Legal & General Group, Plc. | | 357,048 | | | 398,258 |
Liberty International, Plc. (REIT) (a) | | 16,665 | | | 115,481 |
Lloyds TSB Group, Plc. (a) | | 371,186 | | | 679,388 |
Logica, Plc. (a) | | 90,803 | | | 90,688 |
Lonmin, Plc. | | 9,678 | | | 127,762 |
Man Group, Plc. | | 108,024 | | | 372,856 |
Marks & Spencer Group, Plc. | | 96,716 | | | 301,018 |
Meggitt, Plc. | | 42,619 | | | 98,865 |
National Grid, Plc. | | 159,194 | | | 1,573,261 |
Next, Plc. | | 13,648 | | | 213,675 |
Old Mutual, Plc. | | 381,581 | | | 304,855 |
Pearson, Plc. | | 50,438 | | | 468,092 |
| | | | | |
Prudential, Plc. | | 157,765 | | | 960,506 |
Reckitt Benckiser Group, Plc. | | 37,679 | | | 1,403,709 |
Reed Elsevier Plc. | | 69,574 | | | 507,113 |
Rexam, Plc. | | 42,308 | | | 216,086 |
Rio Tinto, Plc. | | 62,082 | | | 1,345,120 |
Rolls-Royce Group, Plc. | | 114,239 | | | 559,644 |
Royal Bank of Scotland Group, Plc. | | 1,125,807 | | | 813,857 |
Royal Dutch Shell, Plc. (Class A) (a) | | 223,688 | | | 5,847,276 |
Royal Dutch Shell, Plc. (Class B) | | 171,333 | | | 4,312,029 |
SABMiller, Plc. | | 57,485 | | | 967,892 |
Sage Group, Ltd. | | 78,702 | | | 193,533 |
Schroders, Plc. | | 11,672 | | | 145,759 |
*See accompanying notes to financial statements.
MSF-12
Metropolitan Series Fund, Inc.
Morgan Stanley EAFE Index Portfolio
Schedule of Investments as of December 31, 2008
Common Stock—(Continued)
| | | | | |
| Security Description | | Shares | | Value* |
| | | | | |
| | |
United Kingdom—(Continued) | | | | | |
Scottish & Southern Energy, Plc. | | 54,779 | | $ | 964,538 |
Segro, Plc. (REIT) (a) | | 25,798 | | | 92,283 |
Serco Group, Plc. | | 34,317 | | | 223,352 |
Severn Trent, Plc. | | 14,349 | | | 248,467 |
Shire, Ltd. | | 34,646 | | | 506,656 |
Smith & Nephew, Plc. | | 56,488 | | | 358,399 |
Smiths Group, Plc. | | 25,680 | | | 330,635 |
Standard Chartered, Plc. | | 119,573 | | | 1,528,539 |
Standard Life, Plc. | | 141,054 | | | 413,603 |
Tate & Lyle, Plc. | | 33,442 | | | 194,257 |
Tesco, Plc. | | 496,040 | | | 2,584,325 |
Thomas Cook Group, Plc. | | 30,655 | | | 78,496 |
Thomson Reuters, Plc. | | 12,693 | | | 280,736 |
Tomkins, Plc. (a) | | 54,938 | | | 98,433 |
TUI Travel, Plc. | | 44,767 | | | 151,332 |
Tullow Oil, Plc. | | 45,822 | | | 438,488 |
Unilever, Plc. | | 82,194 | | | 1,867,900 |
United Business Media, Ltd. | | 20,651 | | | 152,031 |
United Utilities G | | 48,207 | | | 436,270 |
Vendeta Resources, Plc. | | 9,571 | | | 84,977 |
Vodafone Group, Plc. | | 3,327,748 | | | 6,699,135 |
Whitbread, Plc. | | 14,577 | | | 192,831 |
WM Morrison Supermarkets, Plc. | | 149,552 | | | 606,549 |
Wolseley, Plc. (a) | | 43,462 | | | 242,326 |
Xstrata, Plc. | | 39,366 | | | 366,995 |
| | | | | |
| | | | | 97,644,549 |
| | | | | |
| | |
United States—0.1% | | | | | |
Synthes, Inc. (CHF) (b) | | 3,629 | | | 458,728 |
| | | | | |
Total Common Stock
(Identified Cost $633,904,653) | | | | | 494,045,704 |
| | | | | |
| | |
| Mutual Funds—2.5% | | | | | |
| | |
United States—2.5% | | | | | |
iShares MSCI EAFE Index Fund (a) | | 288,500 | | | 12,944,995 |
| | | | | |
Total Mutual Funds
(Identified Cost $12,360,985) | | | | | 12,944,995 |
| | | | | |
| | |
| Preferred Stock—0.4% | | | | | |
| | |
Germany—0.4% | | | | | |
Fresenius SE | | 4,821 | | | 282,499 |
Henkel KGaA | | 10,747 | | | 344,563 |
Porsche AG | | 5,610 | | | 437,047 |
RWE AG | | 2,982 | | | 225,451 |
Volkswagen AG | | 6,775 | | | 361,534 |
| | | | | |
| | | | | 1,651,094 |
| | | | | |
| | |
Switzerland—0.0% | | | | | |
Schindler Holding AG (a) | | 2,500 | | | 114,258 |
| | | | | |
Total Preferred Stock
(Identified Cost $2,181,653) | | | | | 1,765,352 |
| | | | | |
| | | | | | | |
| | |
| Rights—0.0% | | | | | | | |
| Security Description | | Shares | | Value* | |
| | | | | | | |
| | |
Belgium—0.0% | | | | | | | |
Anheuser-Busch InBev NV | | | 4 | | $ | 90 | |
Fortis (c) (d) | | | 137,599 | | | 0 | |
| | | | | | | |
| | | | | | 90 | |
| | | | | | | |
| | |
Japan—0.0% | | | | | | | |
Dowa Mining Co., Ltd. | | | 16,000 | | | 2,859 | |
| | | | | | | |
| | |
Singapore—0.0% | | | | | | | |
DBS Group Holdings | | | 37,489 | | | 39,031 | |
| | | | | | | |
| | |
United Kingdom—0.0% | | | | | | | |
Lloyds TSB Group (c) (d) | | | 161,354 | | | 0 | |
| | | | | | | |
Total Rights
(Identified Cost $128) | | | | | | 41,980 | |
| | | | | | | |
|
| Short Term Investments—9.9% | |
| Security Description | | Face
Amount/Shares | | Value* | |
| | |
United States—9.9% | | | | | | | |
Federal Home Loan Bank | | | | | | | |
0.040%, 01/27/09 | | $ | 325,000 | | | 324,972 | |
0.008%, 03/25/09 | | | 875,000 | | | 874,838 | |
2.400%, 01/23/09 | | | 4,425,000 | | | 4,424,973 | |
State Street Navigator Securities Lending Prime Portfolio (e) | | | 45,077,458 | | | 45,077,458 | |
| | | | | | | |
Total Short Term Investments
(Identified Cost $50,702,241) | | | | | | 50,702,241 | |
| | | | | | | |
Total Investments—109.4%
(Identified Cost $699,149,660) (f) | | | | | | 559,500,272 | |
Liabilities in excess of other assets | | | | | | (48,044,934 | ) |
| | | | | | | |
| Total Net Assets—100% | | | | | $ | 511,455,338 | |
| | | | | | | |
*See accompanying notes to financial statements.
MSF-13
Metropolitan Series Fund, Inc.
Morgan Stanley EAFE Index Portfolio
Schedule of Investments as of December 31, 2008
| (a) | A portion or all of the security was on loan. As of December 31, 2008, the market value of securities loaned was $43,246,942 and the collateral received consisted of cash in the amount of $45,077,458 and non-cash collateral with a value of $642,756. The cash collateral is invested in a money market fund managed by an affiliate of the custodian. The non-cash collateral received consists primarily of government securities and bank letters of credit, and are held for the benefit of the Portfolio at the Portfolio’s custodian. The Portfolio cannot repledge or resell this collateral. As such, these are excluded from the Statement of Assets and Liabilities. |
| (d) | Security was valued in good faith under procedures established by the Board of Directors. |
| (e) | Represents investment of cash collateral received from securities lending transactions. |
| (f) | The aggregate cost of investments for federal income tax purposes as of December 31, 2008 was $715,291,214 and the composition of unrealized appreciation and depreciation of investment securities was $31,945,733 and $(187,736,675), respectively. |
| (FDR)— | Fiduciary Depository Receipt |
| (REIT)— | A Real Estate Investment Trust is a pooled investment vehicle that invests primarily in income-producing real estate or real estate related loans or interest. |
| | |
Ten Largest Industries as of
December 31, 2008 (Unaudited) | | Percentage of
Total Net Assets |
Commercial Banks | | 12.3% |
Oil, Gas & Consumable Fuels | | 8.8% |
Diversified Telecommunication Services | | 5.4% |
Semiconductors & Semiconductor Equipment | | 5.3% |
Insurance | | 4.7% |
Electric Utilities | | 4.6% |
Metals & Mining | | 4.0% |
Food Products | | 3.3% |
Automobiles | | 3.2% |
Pharmaceuticals | | 2.9% |
The Portfolio adopted the provisions of Statement of Financial Accounting Standards No. 157, “Fair Value Measurements” (FAS 157), effective with the beginning of the Portfolio’s fiscal year. FAS 157 establishes a framework for measuring fair value and expands disclosures about fair value measurements in financial statements. The three levels of the hierarchy under FAS 157 are described below:
Level 1 - quoted prices in active markets for identical securities
Level 2 - other significant observable inputs (including quoted prices for similar securities, interest rates, credit risk, etc.)
Level 3 - significant unobservable inputs (including the Portfolio’s own assumptions in determining the fair value of investments)
The inputs or methodology used for valuing securities are not necessarily an indication of the risk associated with investing in those securities.
The following is a summary of the inputs used to value the Portfolio’s net assets as of December 31, 2008:
| | | | | | |
| Valuation Inputs | | Investments In
Securities | | Other Financial
Instruments* |
Level 1 - Quoted Prices | | $ | 58,022,453 | | $ | 0 |
Level 2 - Other Significant Observable Inputs | | | 501,477,819 | | | 0 |
Level 3 - Significant Unobservable Inputs | | | 0 | | | 0 |
Total | | $ | 559,500,272 | | $ | 0 |
* Other financial instruments are derivative instruments not reflected in the Schedule of Investments, such as futures, forwards, swap contracts and written options, which are valued based on the unrealized appreciation/depreciation on the instrument.
See accompanying notes to financial statements.
MSF-14
Metropolitan Series Fund, Inc.
Morgan Stanley EAFE Index Portfolio
Statement of Assets & Liabilities
December 31, 2008
| | | | | | | |
Assets | | | | | | | |
Investments at value (a) (b) | | | | | $ | 559,500,272 | |
Cash | | | | | | 248,082 | |
Foreign cash at value (c) | | | | | | 241,359 | |
Receivable for: | | | | | | | |
Securities sold | | | | | | 6,239,742 | |
Fund shares sold | | | | | | 1,389,210 | |
Accrued interest and dividends | | | | | | 710,301 | |
Foreign taxes | | | | | | 93,798 | |
| | | | | | | |
Total Assets | | | | | | 568,422,764 | |
Liabilities | | | | | | | |
Payable for: | | | | | | | |
Securities purchased | | $ | 11,256,753 | | | | |
Fund shares redeemed | | | 378,831 | | | | |
Withholding taxes | | | 23,262 | | | | |
Collateral for securities loaned | | | 45,077,458 | | | | |
Accrued expenses: | | | | | | | |
Management fees | | | 118,470 | | | | |
Service and distribution fees | | | 44,084 | | | | |
Other expenses | | | 68,568 | | | | |
| | | | | | | |
Total Liabilities | | | | | | 56,967,426 | |
| | | | | | | |
Net Assets | | | | | $ | 511,455,338 | |
| | | | | | | |
Net assets consists of: | | | | | | | |
Capital paid in | | | | | $ | 653,683,613 | |
Undistributed net investment income | | | | | | 20,972,538 | |
Accumulated net realized losses | | | | | | (23,519,911 | ) |
Unrealized depreciation on investments and foreign currency | | | | | | (139,680,902 | ) |
| | | | | | | |
Net Assets | | | | | $ | 511,455,338 | |
| | | | | | | |
| Computation of offering price: | | | | | | | |
Class A | | | | | | | |
Net asset value and redemption price per share ($269,717,740 divided by 28,817,119 shares outstanding) | | | | | $ | 9.36 | |
| | | | | | | |
Class B | | | | | | | |
Net asset value and redemption price per share ($196,038,718 divided by 21,292,386 shares outstanding) | | | | | $ | 9.21 | |
| | | | | | | |
Class E | | | | | | | |
Net asset value and redemption price per share ($45,698,880 divided by 4,907,068 shares outstanding) | | | | | $ | 9.31 | |
| | | | | | | |
(a) Identified cost of investments | | | | | $ | 699,149,660 | |
| | | | | | | |
(b) Includes cash collateral for securities loaned of | | | | | $ | 45,077,458 | |
| | | | | | | |
(c) Identified cost of foreign cash | | | | | $ | 256,076 | |
| | | | | | | |
Statement of Operations
For the Year Ended December 31, 2008
| | | | | | | | |
Investment Income | | | | | | | | |
Dividends | | | | | | $ | 25,870,678 | (a) |
Interest | | | | | | | 1,550,941 | (b) |
| | | | | | | | |
| | | | | | | 27,421,619 | |
Expenses | | | | | | | | |
Management fees | | $ | 2,131,106 | | | | | |
Service and distribution fees—Class B | | | 627,562 | | | | | |
Service and distribution fees—Class E | | | 98,222 | | | | | |
Directors’ fees and expenses | | | 31,907 | | | | | |
Custodian | | | 511,219 | | | | | |
Audit and tax services | | | 42,591 | | | | | |
Legal | | | 11,995 | | | | | |
Printing | | | 208,968 | | | | | |
Insurance | | | 8,991 | | | | | |
Miscellaneous | | | 14,986 | | | | | |
| | | | | | | | |
Total expenses | | | 3,687,547 | | | | | |
Management fee waivers | | | (49,726 | ) | | | 3,637,821 | |
| | | | | | | | |
Net Investment Income | | | | | | | 23,783,798 | |
| | | | | | | | |
Realized and Unrealized Loss | | | | | | | | |
| Realized gain (loss) on: | | | | | | | | |
Investments—net | | | (17,395,385 | ) | | | | |
Foreign currency transactions—net | | | 257,343 | | | | (17,138,042 | ) |
| | | | | | | | |
| Change in unrealized depreciation on: | | | | | | | | |
Investments—net | | | (373,721,938 | ) | | | | |
Foreign currency transactions—net | | | (30,230 | ) | | | (373,752,168 | ) |
| | | | | | | | |
Net loss | | | | | | | (390,890,210 | ) |
| | | | | | | | |
Net Decrease in Net Assets From Operations | | | | | | $ | (367,106,412 | ) |
| | | | | | | | |
| (a) | Net of foreign taxes of $2,331,148. |
| (b) | Includes income on securities loaned of $1,542,477. |
See accompanying notes to financial statements.
MSF-15
Metropolitan Series Fund, Inc.
Morgan Stanley EAFE Index Portfolio
Statements of Changes in Net Assets
| | | | | | | | |
| | | Year ended
December 31,
2008 | | | Year ended
December 31,
2007 | |
From Operations | | | | | | | | |
Net investment income | | $ | 23,783,798 | | | $ | 18,778,557 | |
Net realized gain (loss) | | | (17,138,042 | ) | | | 27,396,414 | |
Change in unrealized appreciation (depreciation) | | | (373,752,168 | ) | | | 19,814,731 | |
| | | | | | | | |
Increase (decrease) in net assets from operations | | | (367,106,412 | ) | | | 65,989,702 | |
| | | | | | | | |
From Distributions to Shareholders | | | | | | | | |
Net investment income | | | | | | | | |
Class A | | | (11,876,797 | ) | | | (6,957,555 | ) |
Class B | | | (6,771,340 | ) | | | (4,654,053 | ) |
Class E | | | (1,871,591 | ) | | | (1,623,651 | ) |
| | | | | | | | |
| | | (20,519,728 | ) | | | (13,235,259 | ) |
| | | | | | | | |
Net realized gain | | | | | | | | |
Class A | | | (16,409,488 | ) | | | (3,710,696 | ) |
Class B | | | (10,411,846 | ) | | | (2,816,927 | ) |
Class E | | | (2,752,056 | ) | | | (930,691 | ) |
| | | | | | | | |
| | | (29,573,390 | ) | | | (7,458,314 | ) |
| | | | | | | | |
Total distributions | | | (50,093,118 | ) | | | (20,693,573 | ) |
| | | | | | | | |
Increase in net assets from capital share transactions | | | 34,554,213 | | | | 214,083,082 | |
| | | | | | | | |
Net increase (decrease) in net assets | | | (382,645,317 | ) | | | 259,379,211 | |
| | |
Net Assets | | | | | | | | |
Beginning of the period | | | 894,100,655 | | | | 634,721,444 | |
| | | | | | | | |
End of the period | | $ | 511,455,338 | | | $ | 894,100,655 | |
| | | | | | | | |
Undistributed Net Investment Income | | | | | | | | |
End of the period | | $ | 20,972,538 | | | $ | 16,995,755 | |
| | | | | | | | |
Other Information:
Capital Shares
Transactions in capital shares were as follows:
| | | | | | | | | | | | | | |
| | | Year ended
December 31, 2008 | | | Year ended
December 31, 2007 | |
| | | Shares | | | $ | | | Shares | | | $ | |
Class A | | | | | | | | | | | | | | |
Sales | | 4,271,358 | | | $ | 52,902,915 | | | 14,171,371 | | | $ | 244,141,099 | |
Reinvestments | | 1,828,461 | | | | 28,286,285 | | | 634,637 | | | | 10,668,251 | |
Redemptions | | (7,057,043 | ) | | | (91,096,573 | ) | | (5,081,003 | ) | | | (85,752,377 | ) |
| | | | | | | | | | | | | | |
Net increase (decrease) | | (957,224 | ) | | $ | (9,907,373 | ) | | 9,725,005 | | | $ | 169,056,973 | |
| | | | | | | | | | | | | | |
Class B | | | | | | | | | | | | | | |
Sales | | 5,384,067 | | | $ | 65,932,778 | | | 6,004,028 | | | $ | 99,957,475 | |
Reinvestments | | 1,126,766 | | | | 17,183,186 | | | 450,602 | | | | 7,470,980 | |
Redemptions | | (2,822,733 | ) | | | (37,951,253 | ) | | (3,507,476 | ) | | | (57,974,664 | ) |
| | | | | | | | | | | | | | |
Net increase | | 3,688,100 | | | $ | 45,164,711 | | | 2,947,154 | | | $ | 49,453,791 | |
| | | | | | | | | | | | | | |
Class E | | | | | | | | | | | | | | |
Sales | | 700,062 | | | $ | 8,412,837 | | | 743,690 | | | $ | 12,495,190 | |
Reinvestments | | 300,042 | | | | 4,623,647 | | | 152,498 | | | | 2,554,342 | |
Redemptions | | (1,026,664 | ) | | | (13,739,609 | ) | | (1,162,298 | ) | | | (19,477,214 | ) |
| | | | | | | | | | | | | | |
Net decrease | | (26,560 | ) | | $ | (703,125 | ) | | (266,110 | ) | | $ | (4,427,682 | ) |
| | | | | | | | | | | | | | |
Increase derived from capital share transactions | | | | | $ | 34,554,213 | | | | | | $ | 214,083,082 | |
| | | | | | | | | | | | | | |
See accompanying notes to financial statements.
MSF-16
Metropolitan Series Fund, Inc.
Morgan Stanley EAFE Index Portfolio
Financial Highlights
| | | | | | | | | | | | | | | | | | | | |
| | | Class A | |
| | | Year ended December 31, | |
| | | 2008 | | | 2007 | | | 2006 | | | 2005 | | | 2004 | |
Net Asset Value, Beginning of Period | | $ | 17.19 | | | $ | 16.00 | | | $ | 12.95 | | | $ | 11.64 | | | $ | 9.80 | |
| | | | | | | | | | | | | | | | | | | | |
Income From Investment Operations | | | | | | | | | | | | | | | | | | | | |
Net investment income | | | 0.46 | (a) | | | 0.46 | (a) | | | 0.35 | (a) | | | 0.25 | | | | 0.21 | |
Net realized and unrealized gain (loss) of investments | | | (7.31 | ) | | | 1.26 | | | | 2.95 | | | | 1.26 | | | | 1.70 | |
| | | | | | | | | | | | | | | | | | | | |
Total from investment operations | | | (6.85 | ) | | | 1.72 | | | | 3.30 | | | | 1.51 | | | | 1.91 | |
| | | | | | | | | | | | | | | | | | | | |
Less Distributions | | | | | | | | | | | | | | | | | | | | |
Distributions from net investment income | | | (0.41 | ) | | | (0.35 | ) | | | (0.25 | ) | | | (0.20 | ) | | | (0.07 | ) |
Distributions from net realized capital gains | | | (0.57 | ) | | | (0.18 | ) | | | 0.00 | | | | 0.00 | | | | 0.00 | |
| | | | | | | | | | | | | | | | | | | | |
Total distributions | | | (0.98 | ) | | | (0.53 | ) | | | (0.25 | ) | | | (0.20 | ) | | | (0.07 | ) |
| | | | | | | | | | | | | | | | | | | | |
Net Asset Value, End of Period | | $ | 9.36 | | | $ | 17.19 | | | $ | 16.00 | | | $ | 12.95 | | | $ | 11.64 | |
| | | | | | | | | | | | | | | | | | | | |
Total Return (%) | | | (42.1 | ) | | | 10.8 | | | | 25.7 | | | | 13.2 | | | | 19.6 | |
Ratio of operating expenses to average net assets (%) | | | 0.41 | | | | 0.41 | | | | 0.49 | | | | 0.51 | | | | 0.59 | |
Ratio of operating expenses to average net assets without giving effect to the contractual expense agreement would have been (%) (b) | | | 0.42 | | | | 0.41 | | | | 0.50 | | | | 0.51 | | | | N/A | |
Ratio of net investment income to average net assets (%) | | | 3.44 | | | | 2.69 | | | | 2.46 | | | | 2.19 | | | | 2.01 | |
Portfolio turnover rate (%) | | | 15 | | | | 24 | | | | 18 | | | | 22 | | | | 38 | |
Net assets, end of period (000) | | $ | 269,718 | | | $ | 511,803 | | | $ | 320,845 | | | $ | 242,623 | | | $ | 210,034 | |
| | | | | | | | | | | | | | | | | | | | |
| | | Class B | |
| | | Year ended December 31, | |
| | | 2008 | | | 2007 | | | 2006 | | | 2005 | | | 2004 | |
Net Asset Value, Beginning of Period | | $ | 16.92 | | | $ | 15.76 | | | $ | 12.76 | | | $ | 11.48 | | | $ | 9.68 | |
| | | | | | | | | | | | | | | | | | | | |
Income From Investment Operations | | | | | | | | | | | | | | | | | | | | |
Net investment income | | | 0.42 | (a) | | | 0.41 | (a) | | | 0.31 | (a) | | | 0.19 | | | | 0.12 | |
Net realized and unrealized gain (loss) of investments | | | (7.19 | ) | | | 1.23 | | | | 2.91 | | | | 1.27 | | | | 1.74 | |
| | | | | | | | | | | | | | | | | | | | |
Total from investment operations | | | (6.77 | ) | | | 1.64 | | | | 3.22 | | | | 1.46 | | | | 1.86 | |
| | | | | | | | | | | | | | | | | | | | |
Less Distributions | | | | | | | | | | | | | | | | | | | | |
Distributions from net investment income | | | (0.37 | ) | | | (0.30 | ) | | | (0.22 | ) | | | (0.18 | ) | | | (0.06 | ) |
Distributions from net realized capital gains | | | (0.57 | ) | | | (0.18 | ) | | | 0.00 | | | | 0.00 | | | | 0.00 | |
| | | | | | | | | | | | | | | | | | | | |
Total distributions | | | (0.94 | ) | | | (0.48 | ) | | | (0.22 | ) | | | (0.18 | ) | | | (0.06 | ) |
| | | | | | | | | | | | | | | | | | | | |
Net Asset Value, End of Period | | $ | 9.21 | | | $ | 16.92 | | | $ | 15.76 | | | $ | 12.76 | | | $ | 11.48 | |
| | | | | | | | | | | | | | | | | | | | |
Total Return (%) | | | (42.2 | ) | | | 10.5 | | | | 25.5 | | | | 12.9 | | | | 19.3 | |
Ratio of operating expenses to average net assets (%) | | | 0.66 | | | | 0.66 | | | | 0.74 | | | | 0.76 | | | | 0.84 | |
Ratio of operating expenses to average net assets without giving effect to the contractual expense agreement would have been (%) (b) | | | 0.67 | | | | 0.66 | | | | 0.75 | | | | 0.76 | | | | N/A | |
Ratio of net investment income to average net assets (%) | | | 3.21 | | | | 2.46 | | | | 2.18 | | | | 1.86 | | | | 1.60 | |
Portfolio turnover rate (%) | | | 15 | | | | 24 | | | | 18 | | | | 22 | | | | 38 | |
Net assets, end of period (000) | | $ | 196,039 | | | $ | 297,898 | | | $ | 231,042 | | | $ | 145,077 | | | $ | 73,707 | |
| Please | see following page for Financial Highlights footnote legend. |
See accompanying notes to financial statements.
MSF-17
Metropolitan Series Fund, Inc.
Morgan Stanley EAFE Index Portfolio
Financial Highlights
| | | | | | | | | | | | | | | | | | | | |
| | | Class E | |
| | | Year ended December 31, | |
| | | 2008 | | | 2007 | | | 2006 | | | 2005 | | | 2004 | |
Net Asset Value, Beginning of Period | | $ | 17.11 | | | $ | 15.93 | | | $ | 12.90 | | | $ | 11.59 | | | $ | 9.77 | |
| | | | | | | | | | | | | | | | | | | | |
Income From Investment Operations | | | | | | | | | | | | | | | | | | | | |
Net investment income | | | 0.44 | (a) | | | 0.43 | (a) | | | 0.33 | (a) | | | 0.26 | | | | 0.19 | |
Net realized and unrealized gain (loss) of investments | | | (7.28 | ) | | | 1.25 | | | | 2.94 | | | | 1.23 | | | | 1.70 | |
| | | | | | | | | | | | | | | | | | | | |
Total from investment operations | | | (6.84 | ) | | | 1.68 | | | | 3.27 | | | | 1.49 | | | | 1.89 | |
| | | | | | | | | | | | | | | | | | | | |
Less Distributions | | | | | | | | | | | | | | | | | | | | |
Distributions from net investment income | | | (0.39 | ) | | | (0.32 | ) | | | (0.24 | ) | | | (0.18 | ) | | | (0.07 | ) |
Distributions from net realized capital gains | | | (0.57 | ) | | | (0.18 | ) | | | 0.00 | | | | 0.00 | | | | 0.00 | |
| | | | | | | | | | | | | | | | | | | | |
Total distributions | | | (0.96 | ) | | | (0.50 | ) | | | (0.24 | ) | | | (0.18 | ) | | | (0.07 | ) |
| | | | | | | | | | | | | | | | | | | | |
Net Asset Value, End of Period | | $ | 9.31 | | | $ | 17.11 | | | $ | 15.93 | | | $ | 12.90 | | | $ | 11.59 | |
| | | | | | | | | | | | | | | | | | | | |
Total Return (%) | | | (42.2 | ) | | | 10.6 | | | | 25.6 | | | | 13.0 | | | | 19.4 | |
Ratio of operating expenses to average net assets (%) | | | 0.56 | | | | 0.56 | | | | 0.64 | | | | 0.66 | | | | 0.74 | |
Ratio of operating expenses to average net assets without giving effect to the contractual expense agreement would have been (%) (b) | | | 0.57 | | | | 0.56 | | | | 0.65 | | | | 0.66 | | | | N/A | |
Ratio of net investment income to average net assets (%) | | | 3.31 | | | | 2.57 | | | | 2.32 | | | | 2.05 | | | | 1.91 | |
Portfolio turnover rate (%) | | | 15 | | | | 24 | | | | 18 | | | | 22 | | | | 38 | |
Net assets, end of period (000) | | $ | 45,699 | | | $ | 84,400 | | | $ | 82,835 | | | $ | 74,489 | | | $ | 73,449 | |
| (a) | Per share amount is based on average shares outstanding during the period. |
| (b) | See Note 4 of the Notes to Financial Statements. |
See accompanying notes to financial statements.
MSF-18
Metropolitan Series Fund, Inc.
Morgan Stanley EAFE Index Portfolio
Notes to Financial Statements—December 31, 2008
Metropolitan Series Fund, Inc. (the “Fund”) is organized as a corporation under the laws of Maryland pursuant to Articles of Incorporation filed on November 23, 1982, as amended, and registered under the Investment Company Act of 1940, as amended (the “1940 Act”), as an open-end investment company. The Fund is a “series” type of mutual fund, which issues separate series of stock. Each series represents an interest in a separate portfolio of Fund investments. The Morgan Stanley EAFE Index Portfolio (the “Portfolio”) is a diversified series of the Fund. Shares in the Fund are not offered directly to the general public and are currently available only to separate accounts established by Metropolitan Life Insurance Company (“MetLife”), New England Life Insurance Company, General American Life Insurance Company (“General American”), The MetLife Investors Group of Insurance Companies, MetLife Insurance Company of Connecticut and other affiliated insurance companies (collectively, the “Insurance Companies”) and to certain eligible qualified retirement plans (“Qualified Plans”), as an investment vehicle for variable life insurance, group annuity or variable annuity products of these insurance companies or Qualified Plans, although the Portfolio is not available to all such separate accounts and Qualified Plans. The Portfolio’s shares may be divided into different classes. Currently, the classes being offered by the Portfolio are named Class A, Class B and Class E. The classes of the Portfolio’s shares are identical, except that certain additional charges (Rule 12b-1 fees) are made against Class B and Class E shares. Investment income, realized and unrealized capital gains and losses, the common expenses of the Portfolio and certain Portfolio-level expense reductions, if any, are allocated daily, on a pro rata basis, to each class based on the relative net assets of each class to the total net assets of the Portfolio.
| 2. | SIGNIFICANT ACCOUNTING POLICIES: |
The preparation of financial statements in conformity with accounting principles generally accepted in the United States of America (“GAAP”) requires management to make estimates and assumptions that affect the reported amounts of assets and liabilities and disclosure of contingent assets and liabilities as of the date of the financial statements and the reported amounts of income and expenses during the reporting period. Actual results could differ from those estimates.
The following is a summary of significant accounting policies consistently followed by the Portfolio in the preparation of its financial statements. The policies are in conformity with GAAP.
Investment Valuation:
Debt securities (other than short term obligations with a remaining maturity of sixty days or less) are generally valued on the basis of evaluated or composite bid quotations obtained by independent pricing services and/or brokers and dealers selected by the relevant subadviser pursuant to authorization of the Board of Directors of the Fund (the “Board” or “Directors”). Such quotations take into account appropriate factors such as institutional-sized trading in similar groups of securities, yield, quality, coupon rate, maturity, type of issue, trading characteristics and other data. Short term obligations with a remaining maturity of sixty days or less are valued at amortized cost which approximates fair market value.
Equity securities traded on a national securities exchange or other exchanges are valued at their last sale price on the principal trading market. Equity securities traded on the NASDAQ National Market System are valued at the NASDAQ Official Closing Price (the “NOCP”). The NOCP is the last reported sale price if the last reported sale price falls between the spread of the last reported bid and asked prices. If the last reported bid and asked prices are above the last reported sale price, the NOCP will be the last reported bid price. If the last reported bid and asked prices are below the last reported sale price, the NOCP will be the last reported asked price. Equity securities traded on a national securities exchange or other exchanges or on the NASDAQ National Market System for which there is no reported sale during the day are valued at the last reported bid price. A security that is listed or traded on more than one exchange is valued at the quotation on the exchange determined to be the primary market for that security by the Board or its delegates. If no closing price is available, then such securities are valued by using the last reported bid price. Equity securities traded over-the-counter are valued at the last reported sales price.
If no current market value quotation is readily available or reliable for a portfolio security, fair value will be determined in accordance with procedures established by and under the general supervision of the Board. When the Portfolio uses fair value pricing, it may take into account any factors it deems appropriate. The value of securities used by the Portfolio to calculate its net asset value may differ from quoted or published prices for the same securities. Fair value pricing involves subjective judgments and the fair value determined for a security may be materially different than the value that could be realized upon the sale of that security.
MSF-19
Metropolitan Series Fund, Inc.
Morgan Stanley EAFE Index Portfolio
Notes to Financial Statements—December 31, 2008—(Continued)
The Portfolio expects to use fair value pricing for securities primarily traded on U.S. exchanges only under very limited circumstances. For example, the Portfolio may use fair value pricing if the exchange on which a security is traded closes early or trading in the security is suspended.
Securities traded primarily on an exchange outside of the United States which closes before the close of the New York Stock Exchange will be valued at the last sales price on that non-U.S. exchange. Securities traded primarily on an exchange outside of the United States for which there is no reported sale during the day are valued at the mean between the last reported bid and asked prices. However, because most foreign markets close well before the Portfolio values its securities (typically at 4 p.m. Eastern Time), the earlier close of these foreign markets gives rise to the possibility that significant events, including broad market moves, may have occurred after these foreign markets close but before the Portfolio values its securities. To account for this, the Portfolio may frequently value many of its foreign equity securities using fair value prices based on third party vendor modeling tools.
Forward foreign currency exchange contracts are valued based on the mean between closing bid and asked prices of the forward currency contract rates in the London foreign exchange markets on a daily basis as provided by a reliable bank or dealer.
Options, whether on securities, indices, futures contracts, or otherwise, are valued at the last sales price available as of the close of business on the day of valuation or, if there is no such sale price available, at the mean between the bid and asked prices. Options on currencies are valued at the spot price each day.
The value of futures contracts will be the sum of the margin deposit plus or minus the difference between the value of the futures contract on each day the net asset value is calculated and the value on the date the futures contract originated, value being that established on a recognized commodity exchange, or by reference to other customary sources, with gain or loss being realized when the futures contract closes or expires.
Subject to the Board’s oversight, the Board has delegated the day-to-day oversight of pricing matters, including determinations in good faith under the Fund’s procedures the fair value of securities for which current market quotations are not readily available to the subadviser of the Portfolio.
Investment Transactions and Related Investment Income:
Portfolio security transactions are recorded on the trade date. Dividend income is recorded on the ex-dividend date or, for certain foreign securities, when notified. Interest income, which includes amortization of premium and accretion of discount on debt securities, is recorded on the accrual basis. Realized gains and losses on investments and unrealized appreciation and depreciation are determined on the identified cost basis, which is the same basis used for federal income tax purposes.
Repurchase Agreements:
The Portfolio, through the custodian or a subcustodian, receives delivery of the underlying securities collateralizing repurchase agreements. The Portfolio requires the custodian to take possession, to have legally segregated in the Federal Reserve Book Entry System, or to have segregated within the custodian’s vault, all securities held as collateral for repurchase agreements. It is the Portfolio’s policy that the market value of the collateral be at least equal to 100% of the repurchase price in the case of a repurchase agreement of one-day duration and 102% on all other repurchase agreements. The Portfolio’s subadviser is responsible for determining that the value of the collateral is at all times at least equal to the repurchase price. In connection with transactions in repurchase agreements, if the seller defaults and the value of the collateral declines or if the seller enters an insolvency proceeding, realization of the collateral by the Portfolio may be delayed, limited or wholly denied.
Foreign Currency Translation:
The books and records of the Portfolio are maintained in U.S. dollars. The values of securities, currencies and other assets and liabilities denominated in currencies other than U.S. dollars are translated into U.S. dollars based upon foreign exchange rates prevailing at the end of the period. Purchases and sales of investment securities, income and expenses are translated on the respective dates of such transactions. Since the values of investment securities are presented at the foreign exchange rates prevailing at the end of the period, it is not practical to isolate that portion of the results of operations arising from changes in exchange rates from that portion of the results of operations reflecting fluctuations arising from changes in market prices of the investment securities. Such fluctuations are included in the net realized and unrealized gain or loss on investments.
MSF-20
Metropolitan Series Fund, Inc.
Morgan Stanley EAFE Index Portfolio
Notes to Financial Statements—December 31, 2008—(Continued)
Net realized foreign exchange gains or losses arise from sales of foreign currency, currency gains or losses realized between the trade and settlement dates on securities transactions, and the difference between the amounts of dividends, interest, and foreign withholding taxes recorded by the Portfolio and the U.S. dollar equivalent of the amounts actually received or paid by the Portfolio. Net unrealized foreign exchange gains and losses arise from changes in the value of assets and liabilities, other than investment securities, resulting from changes in the exchange rate.
Forward Foreign Currency Exchange Contracts:
The Portfolio may enter into forward foreign currency exchange contracts primarily to hedge against foreign currency exchange rate risks on their non-U.S. dollar denominated investment securities. When entering into a forward currency contract, the Portfolio agrees to receive or deliver a fixed quantity of foreign currency for an agreed-upon price on an agreed future date. These contracts are valued daily and the Portfolio’s net equity therein, representing unrealized gain or loss on the contracts as measured by the difference between the foreign exchange rates at the dates of entry into the contracts and the forward rates at the settlement date, is included in the Statement of Assets and Liabilities. Realized and unrealized gains and losses are included in the Statement of Operations. These instruments involve market and/or credit risk in excess of the amount recognized in the Statement of Assets and Liabilities. Risks arise from the possible inability of counterparties to meet the terms of their contracts and from movement in currency and securities values and interest rates.
Futures Contracts:
The Portfolio may buy and sell futures contracts (on recognized exchanges) as a hedge or to enhance return. Futures contracts are agreements to buy or sell a security, or deliver a final cash settlement price in connection with an index, interest rate, currency, or other contracts not calling for physical delivery, for a set price in the future. The Portfolio must post an amount equal to a portion of the total market value of the futures contract as futures variation margin, which is returned when the Portfolio’s obligations under the contract have been satisfied. From time to time thereafter, the Portfolio may have to post variation margin to maintain this amount as the market value of the contract fluctuates. Risks of entering into futures contracts (and related options) include the possibility that there may be an illiquid market and that a change in the value of the contract or option may not correlate with changes in the value of the underlying securities.
Options:
The Portfolio may use options to enhance returns or to hedge against changes in values of securities the Portfolio owns or expects to purchase. Writing puts or buying calls tends to increase the Portfolio’s exposure to the underlying instrument and writing calls or buying puts tends to decrease the Portfolio’s exposure to the underlying instrument, or hedge other Portfolio investments. For options purchased to hedge the Portfolio’s investments, the potential risk to the Portfolio is that the change in value of options contracts may not correspond to the change in value of the hedged instruments. In addition, losses may arise from changes in the value of the underlying instruments, if there is an illiquid secondary market, or if the counterparty is unable to perform. The maximum loss for purchased options is limited to the premium initially paid for the option. For options written by the Portfolio, the maximum loss is not limited to the premium initially received for the option.
The main risk associated with purchasing options is that the option expires without being exercised. In this case, the option expires worthless and the premium paid for the option is considered the loss. The risk associated with writing a call option is that the Portfolio may forgo the opportunity for a profit if the market value of the underlying position increases and the option is exercised. The risk in writing put options is that the Portfolio may incur a loss if the market value of the underlying position decreases and the option is exercised. In addition, the Portfolio risks not being able to enter into a closing transaction for the written option as the result of an illiquid market.
“When-Issued” Securities:
Purchasing securities “when-issued” is a forward commitment by the Portfolio to buy a security. The estimated amount of the Portfolio’s payment obligation and the security’s interest rate are determined when the commitment is made, even though no interest accrues until the security is issued, which is generally 15 to 120 days later. The Portfolio will segregate liquid assets with its custodian sufficient at all times to satisfy these commitments. If the value of the security is less when delivered than when the commitment was made, the Portfolio will suffer a loss.
MSF-21
Metropolitan Series Fund, Inc.
Morgan Stanley EAFE Index Portfolio
Notes to Financial Statements—December 31, 2008—(Continued)
Fund Concentration:
The investments by the Portfolio in foreign securities may involve risks not present in domestic investments. Since securities may be denominated in foreign currencies and may require settlement in foreign currencies and pay interest or dividends in foreign currencies, changes in the relationship of these foreign currencies to the U.S. dollar can significantly affect the value of the investments and earnings of the Portfolio. Foreign investments may also subject the Portfolio to foreign government exchange restrictions, expropriation, taxation or other political, social or economic developments, all of which could affect the market and/or credit risk of the investments. In addition to the risks described above, risks may arise from forward foreign currency contracts with respect to the potential inability of counterparties to meet the terms of their contracts.
Federal Income Taxes:
It is the Portfolio’s policy to comply with the requirements of the Internal Revenue Code of 1986, as amended (the “Code”), and regulations thereunder, applicable to regulated investment companies and to distribute, with respect to each taxable year, all of its taxable income to shareholders. Therefore, no federal income tax provision is required. The Portfolio is subject to the provisions of the Financial Accounting Standards Board Interpretation (“FASB”) No. 48, Accounting for Uncertainties in Income Taxes (FIN 48). FIN 48 sets forth a minimum threshold for financial statement recognition of the benefit of a tax position taken or expected to be taken in a tax return. The implementation of FIN 48 did not result in any unrecognized tax benefits in the accompanying financial statements. Each of the Portfolio’s federal tax returns for the prior three fiscal years remains subject to examination by the Internal Revenue Service.
As of December 31, 2008, the Portfolio had no capital loss carryforwards.
Pursuant to Section 852 of the Code, the Portfolio designated the amount shown below under Long Term Gain as capital gain dividends for its taxable year ended December 31, 2008. The tax character of distributions paid for the periods ended December 31, 2008 and 2007 was as follows:
| | | | | | | | | | | | | | | | | | | | | |
Ordinary Income | | Long Term Gain | | Return of Capital | | Total |
2008 | | 2007 | | 2008 | | 2007 | | 2008 | | 2007 | | 2008 | | 2007 |
$23,880,340 | | $ | 14,775,563 | | $ | 26,212,778 | | $ | 5,918,010 | | $ | — | | $ | — | | $ | 50,093,118 | | $ | 20,693,573 |
As of December 31, 2008, the components of distributable earnings (accumulated losses) on a federal income tax basis were as follows:
| | | | | | | | | | | | | | |
Undistributed
Ordinary
Income | | Undistributed
Long Term
Gain | | Unrealized
Depreciation | | | Loss
Carryforwards | | Total | |
$23,042,535 | | $ | 3,829,271 | | $ | (155,696,803 | ) | | $ | — | | $ | (128,824,997 | ) |
Pursuant to Federal income tax regulations applicable to investment companies, the Portfolio has elected to treat net capital losses realized between November 1 and December 31 of each year as occurring on the first day of the following tax year. For the year ended December 31, 2008, the following amounts of realized capital and currency losses reflected in the accompanying financial statements will not be recognized for Federal income tax purposes until January 1, 2009:
| | | | |
Currency | | Capital | |
$— | | $ | (13,403,278 | ) |
Dividends and Distributions to Shareholders:
The Portfolio records dividends and distributions on the ex-dividend date. Net realized gains from security transactions (if any) are generally distributed annually to shareholders. The timing and characterization of certain income and capital gains distributions are determined in accordance with federal tax regulations that may differ from GAAP. Permanent book and tax basis differences relating to shareholder distributions will result in reclassification between under/over distributed net investment income, accumulated net realized gains/losses and paid in capital.
MSF-22
Metropolitan Series Fund, Inc.
Morgan Stanley EAFE Index Portfolio
Notes to Financial Statements—December 31, 2008—(Continued)
| 3. | INVESTMENT TRANSACTIONS: |
For the year ended December 31, 2008, purchases and sales of securities (excluding short term investments) for the Portfolio were as follows:
| | | | | | | | | |
Purchases | | Sales |
U.S. Government | | Other | | U.S. Government | | Other |
$0 | | $ | 123,053,401 | | $ | 0 | | $ | 109,351,606 |
| 4. | INVESTMENT MANAGEMENT FEES AND OTHER TRANSACTIONS WITH AFFILIATES: |
Investment Management Agreement:
MetLife Advisers, LLC (“MetLife Advisers”) is the investment adviser to the Portfolio. The Fund has entered into an investment management agreement with MetLife Advisers with respect to the Portfolio. For providing investment management services to the Portfolio, MetLife Advisers receives monthly compensation at the annual rate of 0.30% of average daily net assets. Fees earned by MetLife Advisers with respect to the Portfolio for the year ended December 31, 2008 were $2,131,106.
Certain officers and directors of the Fund may also be officers of MetLife Advisers; however, such officers and directors receive no compensation from the Fund.
MetLife Advisers has entered into an investment subadvisory agreement with MetLife Investment Advisors, LLC (“MLIAC”) with respect to the Portfolio. MetLife Advisers pays MLIAC an investment subadvisory fee for the Portfolio equal to the costs incurred by MLIAC in providing subadvisory services to the Portfolio. Fees earned by MLIAC with respect to the Portfolio for the year ended December 31, 2008 were $163,385.
Management Fee Waivers:
Pursuant to an expense agreement, MetLife Advisers has agreed, for the period May 1, 2008 to April 30, 2009, to reduce its advisory fees set out above under “Investment Management Agreement” for each class of the Portfolio at the annual rate of 0.007% of average daily net assets. A similar expense agreement was in place for the period May 1, 2007 through April 30, 2008. Amounts waived for the year ended December 31, 2008 are shown as management fee waivers in the Statement of Operations.
Service and Distribution Fees:
The Fund has adopted a Distribution and Service Plan under Rule 12b-1 of the 1940 Act for the Portfolio’s Class B and E shares. Under the Distribution and Service Plan, the Class B and E shares of the Portfolio pay a fee to compensate the Insurance Companies (or their affiliates) and other broker-dealers and financial intermediaries involved in the offer and sale of Portfolio shares for promoting or selling and servicing the Class B and E shares. The fees under the Distribution and Service Plan for each class of the Portfolio’s shares are calculated as a percentage of the Portfolio’s average daily net assets that are attributable to that Class. Currently, the fee is 0.25% per year for Class B shares and 0.15% per year for Class E shares. Amounts paid by the Portfolio for the year ended December 31, 2008 are shown as Service and Distribution fees in the Statement of Operations.
The Fund has entered into a securities lending arrangement with the Fund’s custodian, State Street Bank and Trust Company (the “custodian”). Under the agreement, the custodian is authorized to loan securities on the Portfolios’ behalf. In exchange, the Portfolio receives either cash or securities as collateral against the loaned securities. The Portfolio receives collateral at least equal to 102% of the market value of the loaned securities (105% for foreign securities), at each loan’s inception. Collateral must be maintained at least at 100% of the market value of the loaned securities for the duration of the loan. The cash collateral is invested in the Navigator Securities Lending Prime Portfolio, an affiliate of the custodian, which invests in a variety of high quality U.S. dollar-denominated instruments. If the market value of the collateral at the close of trading on a business day is less than 100% of the market value of the loaned securities at the close of trading on that day, the borrower shall be required to deliver, by the close of business on the following business day, an additional amount of collateral, equal to at least 100% of the market value of all the loaned securities as of such preceding day. The Portfolio receives 80% of the annual net income from securities lending transactions, which is included in interest income of the Portfolio. The remaining 20% is paid to the custodian as compensation for its securities lending services. Interest income received by the Portfolio via lending transactions during the
MSF-23
Metropolitan Series Fund, Inc.
Morgan Stanley EAFE Index Portfolio
Notes to Financial Statements—December 31, 2008—(Continued)
year ended December 31, 2008 is footnoted in the Statement of Operations. The Portfolio bears the risk of any deficiency in the amount of collateral available for return to a borrower due to a loss in an approved investment purchased with such collateral. Any outstanding loans by the Portfolio at December 31, 2008 are footnoted in the Schedule of Investments.
| 6. | MARKET AND CREDIT RISK: |
In the normal course of business, the Portfolio invests in securities and enters into transactions where risks exist due to fluctuations in the market (market risk) or failure of the other party to a transaction to perform (credit risk). The value of securities held by the Portfolio may decline in response to certain events, including those directly involving the companies whose securities are owned by the Portfolio; conditions affecting the general economy; overall market changes; local, regional or global political, social or economic instability; and currency and interest rate and price fluctuations. Similar to credit risk, the Portfolio may be exposed to counterparty risk, or the risk that an entity with which the Portfolio has unsettled or open transactions may default. Financial assets, which potentially expose the Portfolio to credit and counterparty risks, consist principally of investments and cash due from counterparties. The extent of the Portfolio’s exposure to credit and counterparty risks in respect to these financial assets approximates their value as recorded in the Portfolio’s Statements of Assets and Liabilities.
On August 9, 2007, the SEC announced that it had settled an enforcement action regarding late trading against General American with, among other things, General American agreeing to pay a civil penalty and to comply with certain undertakings. General American consented to the SEC’s order without admitting or denying the findings. On May 23, 2008, the SEC released a proposed distribution plan pursuant to which General American would make payments to mutual funds affected by certain late trading activity, including certain portfolios of the Fund. Under this plan, the Portfolio is entitled to $167.
| 8. | RECENT ACCOUNTING PRONOUNCEMENTS: |
In March 2008, the FASB issued Statement of Financial Accounting Standards No. 161, Disclosures about Derivative Instruments and Hedging Activities (“FAS 161”), an amendment of FASB Statement No. 133. FAS 161 requires enhanced disclosures about (a) how and why an entity uses derivative instruments, (b) how derivative instruments and hedging activities are accounted for, and (c) how derivative instruments and related hedging activities affect a fund’s financial position, financial performance, and cash flows. Management does not believe the adoption of FAS 161 will materially impact the financial statement amounts, but will require additional disclosures. This will include qualitative and quantitative disclosures on derivative positions existing at period end and the effect of using derivatives during the reporting period. FAS 161 is effective for financial statements issued for fiscal years and interim periods beginning after November 15, 2008. Management is currently evaluating the impact the adoption of FAS 161 will have on the Portfolio’s financial statement disclosures.
MSF-24
Metropolitan Series Fund, Inc.
Morgan Stanley EAFE Index Portfolio
Report of Independent Registered Public Accounting Firm
To the Shareholders and Board of Directors of Metropolitan Series Fund, Inc.:
We have audited the accompanying statement of assets and liabilities, including the schedule of investments, of the Morgan Stanley EAFE Index Portfolio (one of the portfolios constituting the Metropolitan Series Fund, Inc.) (the “Fund”) as of December 31, 2008, and the related statement of operations for the year then ended, the statements of changes in net assets for each of the two years in the period then ended, and the financial highlights for each of the five years in the period then ended. These financial statements and financial highlights are the responsibility of the Fund’s management. Our responsibility is to express an opinion on these financial statements and financial highlights based on our audits.
We conducted our audits in accordance with the standards of the Public Company Accounting Oversight Board (United States). Those standards require that we plan and perform the audit to obtain reasonable assurance about whether the financial statements and financial highlights are free of material misstatement. The Fund is not required to have, nor were we engaged to perform, an audit of its internal control over financial reporting. Our audits included consideration of internal control over financial reporting as a basis for designing audit procedures that are appropriate in the circumstances, but not for the purpose of expressing an opinion on the effectiveness of the Fund’s internal control over financial reporting. Accordingly, we express no such opinion. An audit also includes examining, on a test basis, evidence supporting the amounts and disclosures in the financial statements, assessing the accounting principles used and significant estimates made by management, as well as evaluating the overall financial statement presentation. Our procedures included confirmation of securities owned as of December 31, 2008, by correspondence with the custodian and brokers; where replies were not received from brokers, we performed other auditing procedures. We believe that our audits provide a reasonable basis for our opinion.
In our opinion, the financial statements and financial highlights referred to above present fairly, in all material respects, the financial position of the Morgan Stanley EAFE Index Portfolio of the Metropolitan Series Fund, Inc. as of December 31, 2008, the results of its operations for the year then ended, the changes in its net assets for each of the two years in the period then ended, and the financial highlights for each of the five years in the period then ended, in conformity with accounting principles generally accepted in the United States of America.
Deloitte & Touche LLP
Boston, Massachusetts
February 23, 2009
MSF-25
Metropolitan Series Fund, Inc.
Directors and Officers
The Fund’s Directors review actions of the Fund’s investment adviser and subadvisers, and decide upon matters of general policy. The Fund’s officers supervise the daily business operations of the Fund. The Board of Directors and the Fund’s officers are listed below. Each Director is responsible for overseeing all 38 Portfolios of the Fund. There is no limit to the term a Director may serve. Directors serve until their resignation, retirement or removal in accordance with the Fund’s organizational documents and policies adopted by the Board from time to time. Officers hold office at the pleasure of the Board or until the election or appointment and the qualification of a successor. The address of the Directors and officers is c/o Metropolitan Series Fund, Inc., 501 Boylston Street, Boston, MA 02116.
Interested Directors(1)
Each Director below is an “interested person” (as defined by the 1940 Act) with respect to the Fund in that Ms. Forget is an employee of MetLife and Mr. Typermass is a former employee of MetLife and owns securities issued by MetLife, Inc., the ultimate parent company of MetLife Advisers.
| | | | | | | | |
Name, Address and Age | | Current
position(s)
with Fund | | Position(s)
held since | | Principal occupations
over past five years, including other directorships(2) | | Number of
Portfolios in
Fund Complex
Overseen by
Director(3) |
Elizabeth M. Forget Age: 42 | | Director, Chairman of the Board, President and Chief Executive Officer | | 2006 | | Senior Vice President (since 2007), MetLife, Inc.; President, Met Investors Advisory, LLC; Trustee and President, Met Investors Series Trust; Executive Vice President, MetLife Investors Group, Inc.; President, Chief Executive Officer and Chair of the Board of Managers (since 2006), MetLife Advisers; President, Met Investors Advisory, LLC. | | 87 |
| | | | |
Arthur G. Typermass Age: 71 | | Director | | 1998 | | Formerly, Senior Vice President and Treasurer, MetLife. | | 38 |
Non-Interested Directors(1)
Each Director below is not an “interested person” (as defined by the 1940 Act) with respect to the Fund (collectively, the “Independent Directors”).
| | | | | | | | |
Name, Address and Age | | Current
position(s)
with Fund | | Position(s)
held since | | Principal occupations
over past five years, including other directorships(2) | | Number of
Portfolios in
Fund Complex
Overseen by
Director(3) |
Steve A. Garban† Age: 71 | | Director | | 1985 | | Formerly, Chief Financial Officer, Senior Vice President Finance and Operations and Treasurer (Emeritus), The Pennsylvania State University. | | 38 |
| | | | |
Linda B. Strumpf Age: 61 | | Director | | 2000 | | Vice President and Chief Investment Officer, Ford Foundation. | | 38 |
| | | | |
Michael S. Scott Morton† Age: 71 | | Director | | 1993 | | Jay W. Forrester Professor of Management (Emeritus) at Sloan School of Management, MIT. | | 38 |
| | | | |
H. Jesse Arnelle Age: 75 | | Director | | 2001 | | Formerly, Counsel, Womble Carlyle Sandrie & Rice; Director, Textron Inc. (global multi- industry company)*; formerly, Director, Gannet Co. Inc. (diversified news and information company)*; formerly, Director, Eastman Chemical Company (global chemical company)*; formerly, Director, Waste Management, Inc.*; formerly, Director, Armstrong Holdings Inc. (parent company of floor and ceiling products business)*; formerly, Director, FPL Group Inc. (public utility holding company)*; Director, URS Corporation (engineering design services firm)*. | | 38 |
MSF-26
Metropolitan Series Fund, Inc.
Directors and Officers—(Continued)
| | | | | | | | |
Name, Address and Age | | Current
position(s)
with Fund | | Position(s)
held since | | Principal occupations
over past five years, including other directorships(2) | | Number of
Portfolios in
Fund Complex
Overseen by
Director(3) |
Nancy Hawthorne Age: 57 | | Director | | 2003 | | Chief Executive Officer, Clerestory LLC (corporate financial advisor); Director, Avid Technologies (computer software company)*; formerly, Chairman of the Board of Avid Technologies; formerly, Board of Advisors, L. Knife & Sons, Inc. (beverage distributor); formerly, Trustee, New England Zenith Fund (“Zenith Fund”)**; formerly, Chief Executive Officer and Managing Partner, Hawthorne, Krauss and Associates (corporate financial advisor); formerly, Chief Financial Officer and Executive Vice President, Continental Cablevision, subsequently renamed MediaOne (cable television company); formerly, Director, Life F/X, Inc.; formerly, Chairman of the Board, WorldClinic (distance medicine company); formerly, Director, Perini Corporation (construction company)*; formerly, Director, CGU (property and casualty insurance company); formerly, Director, Beacon Power Corporation (energy company)*. | | 38 |
| | | | |
John T. Ludes Age: 72 | | Director | | 2003 | | President, LFP Properties (consulting firm); Formerly, Trustee, Zenith Fund**; formerly, Vice Chairman, President and Chief Operating Officer, Fortune Brands/American Brands (global conglomerate); formerly, President and CEO, Acushnet Company (athletic equipment company). | | 38 |
Officers(1)
| | | | | | | | |
Name and address | | Age | | Current
position(s)
with Fund | | Position(s)
held since | | Principal occupations over past five years(2) |
| Jeffrey L. Bernier | | 37 | | Senior Vice President | | 2008 | | Vice President (since 2008), MetLife, Inc.; Vice President (since 2008), MetLife; Senior Vice President (since 2008), MetLife Advisers; formerly, Director and Senior Investment Analyst (2004 to 2007), John Hancock Financial Services; formerly, Assistant Vice President (2000 to 2001), Wachovia Securities. |
| | | | |
| Alan C. Leland | | 56 | | Senior Vice President | | 2005 | | Treasurer and Chief Financial Officer, MetLife Advisers, LLC; Treasurer (since 2005), Met Investors Advisory, LLC; Vice President (since 2004), Met Investors Advisory, LLC; Vice President (since 2003), MetLife, Inc.; Vice President, MetLife; Senior Vice President, NELICO. |
| | | | |
| Peter Duffy | | 53 | | Vice President
and Treasurer | | 2000 | | Senior Vice President, MetLife Advisers; Second Vice President (since 2003), NELICO; Vice President, MetLife (since 2004); Vice President (since 2004), MetLife, Inc.; formerly, Vice President and Treasurer, Zenith Fund**. |
| | | | |
| Jeffrey P. Halperin | | 41 | | Chief
Compliance Officer | | 2007 | | Vice President (since 2006), MetLife, Inc.; Vice President (since 2006), MetLife; Chief Compliance Officer (since 2006), Met Investors Series Trust, MetLife Advisers, Met Investors Advisory, LLC and MetLife Investment Advisors Company, LLC. |
| * | Indicates a directorship with a registered investment company or a company subject to the reporting requirements of the Securities Exchange Act of 1934, as amended. |
| ** | The Zenith Fund deregistered with the Securities and Exchange Commission (“SEC”) in 2004. |
| (†) | Served as a trustee, director and/or officer of one or more of the following companies, each of which had a direct or indirect advisory relationship with MetLife Advisers or its affiliates prior to January 31, 2005: State Street Research Financial Trust, State Street Research Income Trust, State Street Research Money Market Trust, State Street Research Institutional Funds, State Street Research Capital Trust, State Street Research Master Investment Trust, State Street Research Equity Trust, State Street Research Securities Trust and State Street Research Exchange Trust (collectively, the “State Street Research Funds”). |
| (1) | During the period shown, each Director of the Fund served as a Trustee of Metropolitan Series Fund II, a registered investment company that ceased investment operations in June of 2008 and has applied for deregistration under the Investment Company Act of 1940. During this period, each officer of the Fund served in the same position with Metropolitan Series Fund II. |
| (2) | Previous positions during the past five years with the Fund; Met Investors Series Trust; MetLife; MetLife, Inc.; MetLife Advisers; Met Investors Advisory, LLC; Zenith Fund; NELICO; or New England Securities Corporation are omitted if not materially different. |
| (3) | The Fund Complex includes the Fund (38 portfolios) and Met Investors Series Trust (49 portfolios). |
MSF-27
Metropolitan Series Fund, Inc.
Morgan Stanley EAFE Index Portfolio
Board Approval of Advisory and Subadvisory Agreements
The Fund’s Contract Review Committees of the Board of Directors (the “Board” or the “Directors”) typically meet in early fall to review the Portfolios’ advisory agreements (the “Advisory Agreements”) and subadvisory agreements (the “Subadvisory Agreements,” and, together with the Advisory Agreements, the “Agreements”) and determine whether to recommend that the full Board approve the continuation of the Agreements for an additional one-year period. (Following the initial approval of an Agreement for a new Portfolio or with a new adviser or subadviser, such annual reviews are not required until 2 years following the execution of such Agreement.) After each Committee has made its recommendations, the full Board, including the Independent Directors, determines whether to approve the continuation of each of the Agreements. In addition, the Board, including the Independent Directors, considers matters bearing on the Agreements at most of its other meetings throughout the year and regularly interviews various individuals at MetLife Advisers responsible for the management of the Portfolios. The Directors also interview selected investment managers and other professionals at the subadvisers at various times throughout the year.
The Directors receive all materials that they or MetLife Advisers, the Fund’s investment adviser, and the subadvisers believe to be reasonably necessary for the Directors to evaluate the Agreements and determine whether to approve the continuation of the Agreements. These materials generally include, among other items, (i) information on the investment performance of the Portfolios and the performance of peer groups of funds and the Portfolios’ performance benchmarks, (ii) information on the Portfolios’ advisory and subadvisory fees and other expenses, including information comparing the Portfolios’ expenses to those of peer groups of funds and information about any applicable expense caps and fee “breakpoints,” (iii) sales and redemption data, (iv) information related to the profitability of the Agreements to MetLife Advisers and certain of the subadvisers, and potential “fall-out” or ancillary benefits that MetLife Advisers, the subadvisers or their affiliates may receive as a result of their relationships with the Fund and (v) information obtained through the subadvisers’ responses to certain requests from MetLife Advisers and the Directors and MetLife Advisers’ responses to requests from the Directors. The Directors may also consider other information such as (vi) MetLife Advisers’ and the subadvisers’ financial results and condition, (vii) each Portfolio’s investment objectives and strategies and the size, education and experience of the investment staffs of MetLife Advisers and the relevant subadvisers and their use of technology and external research, (viii) the allocation of the Portfolios’ brokerage, if any, including allocations to brokers affiliated with the subadvisers and the use of “soft” commission dollars to pay Portfolio expenses and to pay for research and other similar services, (ix) the resources devoted to, and the record of compliance with, the Portfolios’ investment policies and restrictions, policies on personal securities transactions and other compliance policies, (x) the responses of MetLife Advisers, the subadvisers and/or their affiliates to certain legal and regulatory proceedings and (xi) the economic outlook generally and for the mutual fund industry in particular. Throughout the process, the Directors have the opportunity to ask questions of and request additional materials from MetLife Advisers and the subadvisers.
Following meetings of each Contract Review Committee on September 10, 2008, the Board, including the Independent Directors, at its November 6-7, 2008 meeting, approved the continuation through December 31, 2009 of the Advisory Agreements for each Portfolio of the Fund and the Subadvisory Agreements for each Portfolio other than the Zenith Equity Portfolio and Asset Allocation Portfolios (which do not have subadvisers) and the Van Eck Global Natural Resources Portfolio, Met/Dimensional International Small Cap Portfolio and Loomis Sayles Small Cap Growth Portfolio (formerly known as the Franklin Templeton Small Cap Growth Portfolio). The Agreements approved for continuation are referred to below as the “Continued Agreements.”
In considering whether to approve the continuation of the Continued Agreements, the Directors, including the Independent Directors, did not identify any single factor as determinative, and each weighed the various factors as he or she deemed appropriate. The Directors considered the following matters in connection with their approval of the Continued Agreements:
The nature, extent and quality of the services provided to the relevant Portfolios under the Continued Agreements. The Directors considered the nature, extent and quality of the services provided by MetLife Advisers, the relevant subadvisers (if any) and their affiliates (each, an “Adviser,” and, collectively, the “Advisers”) to the relevant Portfolios pursuant to the Continued Agreements and the resources dedicated to these Portfolios by the Advisers. In particular, the Directors considered the Advisers’ abilities to attract and retain highly qualified investment professionals. With respect to MetLife Advisers, the Directors considered (for each Portfolio other than the Zenith Equity and Asset Allocation Portfolios) that MetLife Advisers is (i) ultimately responsible for the performance of such Portfolios; (ii) ultimately responsible for the establishment of the investment strategies of each such Portfolio, primarily through its recommendations to the Board regarding the hiring and selection of subadvisers; (iii) responsible for the hiring and selection, subject to Board approval, of subadvisers; and (iv) responsible for maintaining a program of Subadviser oversight reasonably designed to ensure that the subadvisers have reasonable compliance policies and procedures in place. The Directors also considered that MetLife Advisers provides a full range of day-to-day administrative services for the Portfolios involving all aspects of such Portfolios’ day-to-day operations (other than portfolio management). With respect to the Zenith Equity and Asset Allocation Portfolios, the Directors considered both the portfolio management services and the administrative services provided by MetLife Advisers. After reviewing
MSF-28
Metropolitan Series Fund, Inc.
Morgan Stanley EAFE Index Portfolio
Board Approval of Advisory and Subadvisory Agreements—(Continued)
these and related factors, the Directors concluded, within the context of their overall conclusions regarding each of the Continued Agreements, that the nature, extent and quality of services provided supported the renewal of these Agreements.
Investment performance of the relevant Portfolios. The Directors reviewed information about the performance of the relevant Portfolios over various time periods, including information prepared by an independent third party that compared the performance of the Portfolios to the performance of peer groups of funds and performance benchmarks. The Directors also reviewed a description of the third party’s methodology for identifying a Portfolio’s peer group(s) for purposes of performance and expense comparisons.
In the case of each relevant Portfolio that had performance that lagged its peer group(s) for certain periods, the Directors concluded that other factors relevant to performance were sufficient, in light of other considerations, to warrant renewal of the Continued Agreements relating to such Portfolio. These factors varied from Portfolio to Portfolio, but included one or more of the following: (i) that such Portfolio’s performance, although lagging in certain recent periods, was stronger over the longer term; (ii) that the underperformance was attributable, to a significant extent, to investment decisions that were reasonable and consistent with the Portfolio’s investment objective(s) and policies and that the Portfolio was performing within the range of reasonable expectations, given market conditions and the Portfolio’s investment objective(s) and policies; (iii) that the Portfolio’s performance was competitive when compared to other relevant performance benchmarks or peer groups; and (iv) that MetLife Advisers and/or the relevant subadviser (if any) had taken or was taking steps designed to help improve the Portfolio’s investment performance (including, in the case of certain Portfolios, that MetLife Advisers was formulating possible proposals, for presentation to the Board in November 2008, to replace the Portfolio’s subadviser or to merge the Portfolio into another Portfolio with a similar investment objective and better investment performance).
The Directors also considered the investment performance of the Advisers and their reputations generally, the historical responsiveness of the Advisers to Director concerns about performance and the willingness of the Advisers to take steps intended to improve performance.
After reviewing these and related factors, the Directors concluded, within the context of their overall conclusions regarding each of the Continued Agreements, that the investment performance of each relevant Portfolio and Adviser was sufficient, in light of other considerations, to warrant the renewal of the Continued Agreements.
The costs of the services to be provided and profits to be realized by the Advisers and their affiliates from their relationships with the Portfolios. The Directors considered the fees charged by MetLife Advisers to the Portfolios for advisory services and, with respect to the subadvised Portfolios, by such subadvisers to MetLife Advisers for subadvisory services (such advisory and subadvisory fees (if any), collectively, “Fees”), as well as the total expense levels of the Portfolios. This information included comparisons (provided by an independent third party) of the Portfolios’ advisory fees and total expense levels to those of their peer groups. In evaluating Fees for the relevant Portfolios, the Directors also took into account the demands, complexity and quality of the investment management services provided to each Portfolio. The Directors considered MetLife Advisers’ recommendations regarding reductions in Fee rates, implementation of Fee breakpoints and institution of Fee waivers and expense caps.
The Directors also considered the compensation directly or indirectly received by the Advisers and their affiliates from their relationships with the relevant Portfolios. The Directors reviewed information relating to the profits received by MetLife Advisers, certain of the subadvisers and their affiliates as a result of their relationships with the relevant Portfolios, and information about the allocation of expenses used to calculate profitability. When reviewing profitability, the Directors also considered the performance of the relevant Portfolios, the expense levels of such Portfolios and whether the relevant Advisers had implemented breakpoints, fee waivers and/or expense caps with respect to such Portfolios.
After reviewing these and related factors, the Directors concluded, within the context of their overall conclusions regarding each of the Continued Agreements, that the Fees charged to each of the relevant Portfolios were fair and reasonable, and that the information provided regarding costs of these services generally, and the related profitability (if known) to the relevant Advisers of their relationships with the relevant Portfolios, supported the renewal of the Continued Agreements.
Economies of Scale. The Directors considered the existence of any economies of scale in the provision of services by the Advisers and whether those economies were shared with the relevant Portfolios through breakpoints in their advisory fees or other means, such as expense caps, fee waivers or relatively low levels of fees. The Directors noted that most of the relevant Portfolios benefited or will benefit from breakpoints, expense caps and/or fee waivers with respect to their advisory fees. In considering these issues, the Directors also took into consideration information relating to the costs of the services provided and the profitability to MetLife Advisers, the relevant subadvisers (if any) and each of their affiliates of their relationships with the relevant Portfolios, as discussed above.
MSF-29
Metropolitan Series Fund, Inc.
Morgan Stanley EAFE Index Portfolio
Board Approval of Advisory and Subadvisory Agreements—(Continued)
After reviewing these and related factors, the Directors concluded, within the context of their overall conclusions regarding each of the Continued Agreements, that the extent to which economies of scale were shared with the relevant Portfolios supported the renewal of such Agreements.
Other Factors. The Directors also considered other factors, which included but were not limited to the following:
| | • | | the extent to which each relevant Portfolio operated in accordance with its investment objective, and its record of compliance with its investment restrictions and the compliance programs of the Fund and the Advisers. They also considered the compliance-related resources the Advisers and their affiliates provide to the relevant Portfolios; |
| | • | | the nature, quality, cost and extent of administrative and shareholder services performed by MetLife Advisers and its affiliates under the Advisory Agreements; and |
| | • | | so-called “fall-out benefits” to the Advisers, such as the engagement of their affiliates to provide distribution, brokerage and transfer agency services to the Portfolios, and the benefits of research made available to the relevant Advisers by reason of brokerage commissions generated by the relevant Portfolios’ securities transactions. The Directors also considered the possible conflicts of interest associated with these fall-out and other benefits, and the reporting and other processes in place to disclose and monitor these possible conflicts of interest. |
Based on their evaluation of all factors that they deemed to be material, including those factors described above, and assisted by the advice of independent counsel, the Directors, including the Independent Directors, concluded that each of the Continued Agreements should be continued through December 31, 2009.
MSF-30
A description of the policies and procedures that the Fund uses to determine how to vote proxies relating to portfolio securities is available (i) without charge, upon request, by calling (800) 638-7732 and (ii) on the Securities and Exchange Commission’s (the “SEC”) website at http://www.sec.gov.
Information regarding how the Fund voted proxies relating to portfolio securities during the most recent twelve-month period ended December 31, 2008 is available (i) without charge, upon request, by calling (800) 638-7732 and (ii) on the SEC’s website at http://www.sec.gov.
The Fund’s Statement of Additional Information includes additional information about the Directors of the Fund and is available (i) without charge, upon request, by calling (800) 638-7732 and (ii) on the SEC’s website at http://www.sec.gov.
The Fund files with the SEC a complete schedule of its portfolio holdings, as of the close of the first and third quarters of its fiscal year, on “Form N-Q”. These filings are available on the SEC’s website at www.sec.gov and may be reviewed and copied at the SEC’s Public Reference Room in Washington, DC. (Call 1-800-SEC-0330 for information on the operation of the Public Reference Room.)
MSF-31
Simplify your life…
with MetLife eDelivery® while helping MetLife preserve the planet’s natural resources.
(see details on inside cover)
| | |
Metropolitan Series Fund, Inc. Neuberger Berman Mid Cap Value Portfolio Annual Report | | December 31, 2008 |
NOT PART OF THE ANNUAL REPORT
Letter from the President
February 1, 2009
Letter to Policy Holders:
2008 was an extraordinary year in the capital markets around the world and for the global economy. Energy prices rose to record levels early in the year before falling by two-thirds by year-end. A credit crisis that began with concerns about sub-prime mortgages led to massive changes in the financial landscape with government takeovers, forced sales, and outright failures of a number of large, once venerable firms.
While bonds as measured by the Barclays Capital U.S. Aggregate Bond Index (formerly known as, Lehman Brothers U.S. Aggregate Bond Index) were up 5.2% for the year in response to declining interest rates, there were large differences in the total returns of the various sectors of the bond market. U.S. treasury securities were up over 13% as frightened investors sought refuge in what they perceived to be the safest and most liquid investments. In contrast, investment grade corporate securities lost nearly 5% as credit spreads widened and below investment grade or high yield bonds fell over 26%.
In response to the growing credit crisis and the weakening economy, common stocks fell sharply across all regions, styles, and capitalizations. As measured by the Standard and Poor’s 500, U.S. common stocks fell 37% for the year, the worst calendar year decline since the 1930s. Foreign stocks were down even more with the MSCI EAFE Index down 43% for the year.
On the following pages, you will find a complete review of your Portfolio and its investment performance.
MetLife is committed to building your financial freedom. We appreciate your trust and will continue to focus our efforts on meeting your investment needs.
Sincerely,
Elizabeth M. Forget
President, Metropolitan Series Fund, Inc.
Metropolitan Series Fund, Inc.
Neuberger Berman Mid Cap Value Portfolio
Managed by Neuberger Berman Management, LLC
Portfolio Manager Commentary*
PORTFOLIO PERFORMANCE
For the twelve-month period ended December 31, 2008, the Class A shares of the Neuberger Berman Mid Cap Value Portfolio returned -47.3%, compared to its benchmark, the Russell Midcap Value Index1, which returned -38.4%. The average return of the Portfolio’s peer group, the Lipper Variable Insurance Products2 Mid-Cap Value Funds Universe, was -38.7% over the same period.
PORTFOLIO REVIEW
The Portfolio posted a negative return as stocks were pressured by the ongoing housing slump, skyrocketing oil prices, continued write-offs from leading financial institutions, and diminished consumer confidence. In the second half of 2008, economic and market conditions deteriorated even further as the collapse of Bear Stearns and Lehman Brothers and the ensuing credit crisis turned a smoldering U.S. recession into a serious global economic slowdown. Forced liquidation by highly leveraged hedge funds faced with margin calls and broad based selling by mutual funds to meet rising redemptions further undermined stocks. Due primarily to lagging performance in the Materials, Industrials and Health Care sectors, the Portfolio finished 2008 trailing the Russell Midcap Value Index.
There was no place to escape the broad-based stock market carnage in 2008. All 10 of the Russell Midcap Value Index sectors posted double digit losses and seven of ten sectors declined by 30% or more. Even traditionally defensive sectors such as Consumer Staples, Healthcare, and Utilities posted double digit percentage losses.
We failed to anticipate the collapse of Lehman Brothers on September 15, 2008 and underestimated how swiftly and severely it would impact the economy and the stock market. Our only option would have been to sell high quality companies with good long term prospects at fire sale prices—a strategy we believed would further penalize shareholders.
Industrials sector investments penalized Portfolio performance most severely. We thought our strategy of owning industrial companies in secular growth businesses, most notably energy infrastructure, would insulate us from the potential damage to traditional cyclicals as the economy weakened. However, cascading energy prices along with the credit crunch was expected to cause delays and/or postponements in energy infrastructure projects, dimming the near-term outlook for several of our holdings. Materials sector holdings, especially metals and mining companies, were also hit hard as the prospect of a global economic slowdown sent materials prices lower. Poor returns in Healthcare were primarily the result of the generally poor performance of the HMOs in the Portfolio.
Information Technology was our only significant relative performance bright spot. The Portfolio was materially over-weighted in the sector and our holdings declined only half as much as the corresponding benchmark sector.
It is difficult to predict precisely when the U.S. and global economies will begin to firm. However, we note that the November 24 rescue of Citigroup along with the Treasury Department and Federal Reserve’s moves to lower interest rates, promote inter-bank lending and narrow credit spreads has begun to have a positive impact on the credit markets.
* The views expressed above are those of the subadvisory firm as of December 31, 2008 and are subject to change based on market and other conditions. Information about the Portfolio’s holdings, asset allocation, industry allocation, or country diversification is historical and is not an indication of future Portfolio composition, which will vary. The performance of any index mentioned in this commentary has not been adjusted for ongoing management, distribution and operating expenses, and sales charges applicable to mutual fund investments. Direct investment in any index is not possible.
1 The Russell Midcap® Value Index is an unmanaged measure of performance of those Russell Midcap companies (the 800 smallest companies in the Russell 1000 Index) with lower price-to-book ratios and higher forecasted growth values.
2 The Lipper Variable Products Fund Average is an average of the total return performance (calculated on the basis of net asset value) of variable product funds with similar investment objectives to those of the subject Portfolio as calculated by Lipper Analytical Services, an independent mutual fund ranking service.
MSF-2
Metropolitan Series Fund, Inc.
Neuberger Berman Mid Cap Value Portfolio
A $10,000 INVESTMENT COMPARED TO THE
RUSSELL MIDCAP VALUE INDEX
Average Annual Returns as of December 31, 2008
| | | | | | | | | | | | |
| | | Neuberger Berman Mid Cap Value Portfolio | | | Russell
MidCap
Value Index | |
| | | Class A | | | Class B | | | Class E | | |
| 1 Year | | -47.3 | % | | -47.5 | % | | -47.4 | % | | -38.4 | % |
| 5 Year | | -3.5 | | | -3.7 | | | -3.6 | | | 0.3 | |
| 10 Year | | 4.3 | | | — | | | — | | | 4.4 | |
| Since Inception | | — | | | 0.0 | | | 0.1 | | | — | |
Performance numbers are net of all Portfolio expenses but do not include any insurance, sales, or administrative charges of variable annuity or life insurance contracts or any additional expenses that participants in certain eligible qualified plans may bear relating to the operations of their plans. If these charges were included, the returns would be lower.
Inception dates of the Class A, Class B and Class E shares are: 11/9/98, 5/1/01 and 5/1/01, respectively.
This information represents past performance and is not indicative of future results. Investment return and principal value may fluctuate so that shares, upon redemption, may be worth more or less than the original cost.
PORTFOLIO COMPOSITION
as of December 31, 2008
Top Holdings
| | |
| | | % of Total
Net Assets |
Assurant, Inc. | | 2.4% |
Constellation Brands, Inc. | | 2.3% |
StanCorp Financial Group, Inc. | | 2.2% |
Affiliated Computer Services, Inc. | | 2.1% |
Shire, Plc. (ADR) | | 2.1% |
DPL, Inc. | | 2.1% |
Invesco, Ltd. | | 2.1% |
NRG Energy, Inc. | | 2.0% |
Annaly Capital Management, Inc. | | 1.9% |
Jefferies Group, Inc. | | 1.8% |
Top Sectors
| | |
| | | % of Total
Market Value |
Financials | | 24.9% |
Energy | | 11.3% |
Utilities | | 10.6% |
Consumer Discretionary | | 10.5% |
Health Care | | 9.6% |
Industrials | | 8.9% |
Information Technology | | 8.7% |
Consumer Staples | | 8.1% |
Materials | | 4.2% |
Cash | | 3.2% |
MSF-3
Metropolitan Series Fund, Inc.
Shareholder Expense Example
As a shareholder of the Portfolio, you incur ongoing costs, including management fees; distribution and service (12b-1) fees; and other Portfolio expenses. This example is intended to help you understand your ongoing costs (in dollars) (referred to as “expenses”) of investing in the Portfolio and compare these costs with the ongoing costs of investing in other mutual funds. The example is based on an investment of $1,000 invested at the beginning of the period and held for the entire period, July 1, 2008 through December 31, 2008.
Actual Expenses
The first line for each share class of the Portfolio in the table below provides information about actual account values and actual expenses. You may use the information in this line, together with the amount you invested in the particular share class of the Portfolio, to estimate the expenses that you paid over the period. Simply divide your account value by $1,000 (for example, an $8,600 account value divided by $1,000=8.6), then multiply the result by the number in the first line under the heading entitled “Expenses Paid During Period” to estimate the expenses you paid on your account during this period.
Hypothetical Example for Comparison Purposes
The second line for each share class of the Portfolio in the table below provides information about hypothetical account values and hypothetical expenses based on the Portfolio’s actual expense ratio and an assumed rate of return of 5% per year before expenses, which is not the Portfolio’s actual return. The hypothetical account values and expenses may not be used to estimate the actual ending account balance or expenses you paid for the period. You may use this information to compare the ongoing costs of investing in the Portfolio and other funds. To do so, compare this 5% hypothetical example with the 5% hypothetical examples that appear in the shareholder reports of the other funds.
Please note that the expenses shown in the table are meant to highlight your ongoing costs only and do not reflect any fees or charges of your variable insurance product or any additional expenses that participants in certain eligible qualified plans may bear relating to the operations of their plan. Therefore, the second line for each share class in the table is useful in comparing ongoing costs only, and will not help you determine the relative total costs of owning different funds. In addition, if these other costs were included, your costs would have been higher.
| | | | | | | | | | | | | | |
Portfolio | | | | Annualized
Expense
Ratio | | | Beginning
Account Value
July 1,
2008 | | Ending
Account Value
December 31,
2008 | | Expenses Paid
During Period*
July 1, 2008
to
December 31,
2008 |
Neuberger Berman Mid Cap Value—Class A | | Actual | | 0.70 | % | | $ | 1,000.00 | | $ | 560.37 | | $ | 2.75 |
| | Hypothetical | | 0.70 | % | | $ | 1,000.00 | | $ | 1,021.58 | | $ | 3.56 |
| | | | | |
Neuberger Berman Mid Cap Value—Class B | | Actual | | 0.95 | % | | $ | 1,000.00 | | $ | 559.67 | | $ | 3.72 |
| | Hypothetical | | 0.95 | % | | $ | 1,000.00 | | $ | 1,020.30 | | $ | 4.82 |
| | | | | |
Neuberger Berman Mid Cap Value—Class E | | Actual | | 0.85 | % | | $ | 1,000.00 | | $ | 560.33 | | $ | 3.33 |
| | Hypothetical | | 0.85 | % | | $ | 1,000.00 | | $ | 1,020.81 | | $ | 4.32 |
* Expenses paid are equal to the Portfolio’s annualized expense ratio for the most recent six month period, as shown above, multiplied by the average account value over the period, multiplied by the number of days in the most recent fiscal half-year, divided by 366 (to reflect the one-half year period).
MSF-4
Metropolitan Series Fund, Inc.
Neuberger Berman Mid Cap Value Portfolio
Schedule of Investments as of December 31, 2008
Common Stock—96.6% of Total Net Assets
| | | | | |
| Security Description | | Shares | | Value* |
| | | | | |
|
Aerospace & Defense—2.7% |
Empresa Brasileira de Aeronautica S.A. (ADR) | | 418,300 | | $ | 6,780,643 |
L-3 Communications Holdings, Inc. | | 113,600 | | | 8,381,408 |
| | | | | |
| | | | | 15,162,051 |
| | | | | |
|
Auto Components—1.1% |
WABCO Holdings, Inc. | | 402,500 | | | 6,355,475 |
| | | | | |
|
Automobiles—1.1% |
Harley-Davidson, Inc. (a) | | 370,500 | | | 6,287,385 |
| | | | | |
|
Beverages—3.3% |
Constellation Brands, Inc. (b) | | 819,200 | | | 12,918,784 |
Dr. Pepper Snapple Group, Inc. (b) | | 356,100 | | | 5,786,625 |
| | | | | |
| | | | | 18,705,409 |
| | | | | |
|
Capital Markets—6.8% |
Invesco, Ltd. | | 814,000 | | | 11,754,160 |
Jefferies Group, Inc. (a) | | 744,800 | | | 10,471,888 |
Legg Mason, Inc. | | 446,900 | | | 9,791,579 |
Morgan Stanley | | 394,800 | | | 6,332,592 |
| | | | | |
| | | | | 38,350,219 |
| | | | | |
|
Commercial Banks—3.4% |
First Horizon National Corp. (a) (b) | | 649,555 | | | 6,865,797 |
KeyCorp. | | 619,700 | | | 5,279,844 |
Zions Bancorp (a) | | 288,000 | | | 7,058,880 |
| | | | | |
| | | | | 19,204,521 |
| | | | | |
|
Construction & Engineering—1.2% |
Chicago Bridge & Iron Co., NV | | 669,100 | | | 6,724,455 |
| | | | | |
|
Diversified Financial Services—0.9% |
Moody’s Corp. | | 262,900 | | | 5,281,661 |
| | | | | |
|
Electric Utilities—6.8% |
DPL, Inc. (a) | | 515,100 | | | 11,764,884 |
Entergy Corp. | | 89,300 | | | 7,423,509 |
FirstEnergy Corp. | | 189,900 | | | 9,225,342 |
NV Energy, Inc. (a) | | 451,100 | | | 4,461,379 |
PPL Corp. | | 182,800 | | | 5,610,132 |
| | | | | |
| | | | | 38,485,246 |
| | | | | |
|
Electronic Equipment, Instruments & Components—2.9% |
Anixter International, Inc. (a) (b) | | 293,500 | | | 8,840,220 |
Avnet, Inc. (b) | | 407,500 | | | 7,420,575 |
| | | | | |
| | | | | 16,260,795 |
| | | | | |
|
Energy Equipment & Services—2.3% |
National Oilwell Varco, Inc. (b) | | 203,700 | | | 4,978,428 |
Noble Corp. | | 163,400 | | | 3,609,506 |
Oceaneering International, Inc. (b) | | 151,400 | | | 4,411,796 |
| | | | | |
| | | | | 12,999,730 |
| | | | | |
| | | | | |
| Security Description | | Shares | | Value* |
| | | | | |
|
Food Products—2.6% |
ConAgra Foods, Inc. | | 398,600 | | $ | 6,576,900 |
Smithfield Foods, Inc. (a) (b) | | 234,700 | | | 3,302,229 |
The J. M. Smucker Co. | | 117,600 | | | 5,099,136 |
| | | | | |
| | | | | 14,978,265 |
| | | | | |
|
Health Care Equipment & Supplies—0.8% |
Covidien, Ltd. | | 119,900 | | | 4,345,176 |
| | | | | |
|
Health Care Providers & Services—5.6% |
Aetna, Inc. | | 310,600 | | | 8,852,100 |
AmerisourceBergen Corp. | | 155,800 | | | 5,555,828 |
Cigna Corp. | | 281,300 | | | 4,739,905 |
Coventry Health Care, Inc. (b) | | 382,850 | | | 5,696,808 |
Mednax, Inc. (b) | | 214,100 | | | 6,786,970 |
| | | | | |
| | | | | 31,631,611 |
| | | | | |
|
Health Care Technology—1.1% |
IMS Health, Inc. | | 430,400 | | | 6,524,864 |
| | | | | |
|
Hotels, Restaurants & Leisure—0.2% |
Darden Restaurants, Inc. (a) | | 31,700 | | | 893,306 |
| | | | | |
|
Household Durables—2.8% |
NVR, Inc. (a) (b) | | 22,500 | | | 10,265,625 |
Whirlpool Corp. (a) | | 136,000 | | | 5,623,600 |
| | | | | |
| | | | | 15,889,225 |
| | | | | |
|
Household Products—0.4% |
Energizer Holdings, Inc. (a) (b) | | 41,200 | | | 2,230,568 |
| | | | | |
|
Independent Power Producers & Energy Traders—2.6% |
Dynegy, Inc. (a) (b) | | 1,752,800 | | | 3,505,600 |
NRG Energy, Inc. (a) (b) | | 476,100 | | | 11,107,413 |
| | | | | |
| | | | | 14,613,013 |
| | | | | |
| | |
Industrial Conglomerates—0.5% | | | | | |
McDermott International, Inc. (a) (b) | | 273,600 | | | 2,703,168 |
| | | | | |
| | |
Insurance—7.8% | | | | | |
Assurant, Inc. | | 446,660 | | | 13,399,800 |
PartnerRe, Ltd. | | 121,000 | | | 8,623,670 |
StanCorp Financial Group, Inc. | | 301,400 | | | 12,589,478 |
W.R. Berkley Corp. | | 313,250 | | | 9,710,750 |
| | | | | |
| | | | | 44,323,698 |
| | | | | |
| | |
IT Services—4.6% | | | | | |
Affiliated Computer Services, Inc. (Class A) (b) | | 263,300 | | | 12,098,635 |
Fidelity National Information Services, Inc. | | 230,700 | | | 3,753,489 |
Lender Processing Services, Inc. | | 352,199 | | | 10,372,261 |
| | | | | |
| | | | | 26,224,385 |
| | | | | |
| | |
Machinery—3.8% | | | | | |
Eaton Corp. | | 144,000 | | | 7,158,240 |
Kennametal, Inc. | | 70,900 | | | 1,573,271 |
*See accompanying notes to financial statements.
MSF-5
Metropolitan Series Fund, Inc.
Neuberger Berman Mid Cap Value Portfolio
Schedule of Investments as of December 31, 2008
Common Stock—(Continued)
| | | | | |
| Security Description | | Shares | | Value* |
| | | | | |
| | |
Machinery—(Continued) | | | | | |
SPX Corp. | | 94,400 | | $ | 3,827,920 |
Terex Corp. (a) | | 523,400 | | | 9,065,288 |
| | | | | |
| | | | | 21,624,719 |
| | | | | |
| | |
Marine—0.7% | | | | | |
Eagle Bulk Shipping, Inc. (a) | | 595,100 | | | 4,058,582 |
| | | | | |
| | |
Media—2.3% | | | | | |
Cablevision Systems Corp. (Class A) (a) | | 212,600 | | | 3,580,184 |
The McGraw-Hill Cos., Inc. (a) | | 400,200 | | | 9,280,638 |
| | | | | |
| | | | | 12,860,822 |
| | | | | |
| | |
Metals & Mining—4.1% | | | | | |
Cliffs Natural Resources, Inc. | | 229,900 | | | 5,887,739 |
Freeport-McMoRan Copper & Gold, Inc. (a) (b) | | 224,900 | | | 5,496,556 |
Sterlite Industries India, Ltd. (ADR) (a) | | 467,500 | | | 2,580,600 |
Teck Cominco, Ltd. (Class B) (CAD) (a) | | 924,400 | | | 4,548,048 |
United States Steel Corp. | | 133,700 | | | 4,973,640 |
| | | | | |
| | | | | 23,486,583 |
| | | | | |
| | |
Multi-Utilities—1.2% | | | | | |
CMS Energy Corp. (a) | | 673,500 | | | 6,809,085 |
| | | | | |
| | |
Multiline Retail—3.1% | | | | | |
J.C. Penney Co., Inc. (a) | | 429,500 | | | 8,461,150 |
Macy’s, Inc. (a) | | 858,700 | | | 8,887,545 |
| | | | | |
| | | | | 17,348,695 |
| | | | | |
| | |
Oil, Gas & Consumable Fuels—9.1% | | | | | |
Apache Corp. | | 77,000 | | | 5,738,810 |
Denbury Resources, Inc. (a) (b) | | 522,800 | | | 5,708,976 |
Noble Energy, Inc. (a) | | 203,000 | | | 9,991,660 |
Ship Finance International, Ltd. (a) | | 290,613 | | | 3,211,274 |
Southwestern Energy Co. (b) | | 292,600 | | | 8,476,622 |
Talisman Energy, Inc. | | 972,315 | | | 9,713,427 |
Whiting Petroleum Corp. (b) | | 252,410 | | | 8,445,638 |
| | | | | |
| | | | | 51,286,407 |
| | | | | |
| | |
Personal Products—1.7% | | | | | |
NBTY, Inc. (b) | | 613,315 | | | 9,598,380 |
| | | | | |
| | |
Pharmaceuticals—2.1% | | | | | |
Shire, Plc. (ADR) (a) | | 265,900 | | | 11,907,002 |
| | |
Real Estate Investment Trusts—5.8% | | | | | |
Alexandria Real Estate Equities, Inc. (a) | | 45,200 | | | 2,727,368 |
Annaly Capital Management, Inc. | | 668,920 | | | 10,615,760 |
Boston Properties, Inc. (a) | | 150,400 | | | 8,272,000 |
Developers Diversified Realty Corp. | | 330,400 | | | 1,612,352 |
Vornado Realty Trust (a) | | 164,100 | | | 9,903,435 |
| | | | | |
| | | | | 33,130,915 |
| | | | | |
| | | | | | | |
| Security Description | | Shares | | Value* | |
| | | | | | | |
|
Semiconductors & Semiconductor Equipment—1.2% | |
International Rectifier Corp. (b) | | | 485,000 | | $ | 6,547,500 | |
| | | | | | | |
Total Common Stock
(Identified Cost $865,575,327) | | | | | | 546,832,916 | |
| | | | | | | |
|
| Short Term Investments—15.2% | |
| Security Description | | Shares/Face
Amount | | Value* | |
| | |
Mutual Funds—12.1% | | | | | | | |
State Street Navigator Securities Lending Prime Portfolio (c) | | | 68,549,887 | | | 68,549,887 | |
| | | | | | | |
| | |
Repurchase Agreement—3.1% | | | | | | | |
State Street Repurchase Agreement dated 12/31/08 at 0.010% to be repurchased at $17,683,010 on 01/02/09, collateralized by $18,040,000 U.S. Treasury Bill due 02/19/09 with a value of $18,040,000. | | $ | 17,683,000 | | | 17,683,000 | |
| | | | | | | |
Total Short Term Investments
(Identified Cost $86,232,887) | | | | | | 86,232,887 | |
| | | | | | | |
Total Investments 111.8%
(Identified Cost $951,808,214) (d) | | | | | | 633,065,803 | |
Liabilities in excess of other assets | | | | | | (66,776,665 | ) |
| | | | | | | |
| Total Net Assets—100% | | | | | $ | 566,289,138 | |
| | | | | | | |
| (a) | A portion or all of the security was on loan. As of December 31, 2008, the market value of securities loaned was $70,280,106 and the collateral received consisted of cash in the amount of $68,549,887. The cash collateral is invested in a money market fund managed by an affiliate of the custodian. |
| (c) | Represents investment of cash collateral received from securities lending transactions. |
| (d) | The aggregate cost of investments for federal income tax purposes as of December 31, 2008 was $976,355,850 and the composition of unrealized appreciation and depreciation of investment securities was $15,576,275 and $(358,866,322), respectively. |
| (ADR)— | An American Depositary Receipt is a certificate issued by a custodian bank representing the right to receive securities of the foreign issuer described. Trading on exchanges not located in the United States or Canada significantly influences the value of ADRs. |
*See accompanying notes to financial statements.
MSF-6
Metropolitan Series Fund, Inc.
Neuberger Berman Mid Cap Value Portfolio
The Portfolio adopted the provisions of Statement of Financial Accounting Standards No. 157, “Fair Value Measurements” (FAS 157), effective with the beginning of the Portfolio’s fiscal year. FAS 157 establishes a framework for measuring fair value and expands disclosures about fair value measurements in financial statements. The three levels of the hierarchy under FAS 157 are described below:
Level 1 - quoted prices in active markets for identical securities
Level 2 - other significant observable inputs (including quoted prices for similar securities, interest rates, credit risk, etc.)
Level 3 - significant unobservable inputs (including the Portfolio’s own assumptions in determining the fair value of investments)
The inputs or methodology used for valuing securities are not necessarily an indication of the risk associated with investing in those securities.
The following is a summary of the inputs used to value the Portfolio’s net assets as of December 31, 2008:
| | | | | | |
| Valuation Inputs | | Investments In
Securities | | Other Financial
Instruments* |
Level 1 - Quoted Prices | | $ | 615,382,803 | | $ | 0 |
Level 2 - Other Significant Observable Inputs | | | 17,683,000 | | | 0 |
Level 3 - Significant Unobservable Inputs | | | 0 | | | 0 |
Total | | $ | 633,065,803 | | $ | 0 |
* Other financial instruments are derivative instruments not reflected in the Schedule of Investments, such as futures, forwards, swap contracts and written options, which are valued based on the unrealized appreciation/depreciation on the instrument.
MSF-7
Metropolitan Series Fund, Inc.
Neuberger Berman Mid Cap Value Portfolio
Statement of Assets & Liabilities
December 31, 2008
| | | | | | | |
Assets | | | | | | | |
Investments at value (a) (b) | | | | | $ | 633,065,803 | |
Cash | | | | | | 72 | |
Foreign cash at value (c) | | | | | | 66,947 | |
Receivable for: | | | | | | | |
Securities sold | | | | | | 1,066,419 | |
Fund shares sold | | | | | | 1,598,513 | |
Accrued interest and dividends | | | | | | 966,284 | |
Foreign taxes | | | | | | 161 | |
| | | | | | | |
Total Assets | | | | | | 636,764,199 | |
Liabilities | | | | | | | |
Payable for: | | | | | | | |
Securities purchased | | $ | 1,381,814 | | | | |
Fund shares redeemed | | | 183,818 | | | | |
Collateral for securities loaned | | | 68,549,887 | | | | |
Accrued expenses: | | | | | | | |
Management fees | | | 285,782 | | | | |
Service and distribution fees | | | 40,441 | | | | |
Other expenses | | | 33,319 | | | | |
| | | | | | | |
Total Liabilities | | | | | | 70,475,061 | |
| | | | | | | |
Net Assets | | | | | $ | 566,289,138 | |
| | | | | | | |
Net assets consists of: | | | | | | | |
Capital paid in | | | | | $ | 919,613,700 | |
Undistributed net investment income | | | | | | 9,251,327 | |
Accumulated net realized losses | | | | | | (43,834,621 | ) |
Unrealized depreciation on investments and foreign currency | | | | | | (318,741,268 | ) |
| | | | | | | |
Net Assets | | | | | $ | 566,289,138 | |
| | | | | | | |
| Computation of offering price: | | | | | | | |
Class A | | | | | | | |
Net asset value and redemption price per share ($342,212,031 divided by 31,100,210 shares outstanding) | | | | | $ | 11.00 | |
| | | | | | | |
Class B | | | | | | | |
Net asset value and redemption price per share ($188,359,744 divided by 17,306,637 shares outstanding) | | | | | $ | 10.88 | |
| | | | | | | |
Class E | | | | | | | |
Net asset value and redemption price per share ($35,717,363 divided by 3,259,041 shares outstanding) | | | | | $ | 10.96 | |
| | | | | | | |
(a) Identified cost of investments | | | | | $ | 951,808,214 | |
| | | | | | | |
(b) Includes cash collateral for securities loaned of | | | | | $ | 68,549,887 | |
| | | | | | | |
(c) Identified cost of foreign cash | | | | | $ | 65,804 | |
| | | | | | | |
Statement of Operations
For the Year Ended December 31, 2008
| | | | | | | | |
Investment Income | | | | | | | | |
Dividends | | | | | | $ | 15,116,710 | (a) |
Interest | | | | | | | 1,936,899 | (b) |
| | | | | | | | |
| | | | | | | 17,053,609 | |
Expenses | | | | | | | | |
Management fees | | $ | 6,025,622 | | | | | |
Service and distribution fees—Class B | | | 696,800 | | | | | |
Service and distribution fees—Class E | | | 90,022 | | | | | |
Directors’ fees and expenses | | | 31,907 | | | | | |
Custodian | | | 82,722 | | | | | |
Audit and tax services | | | 36,941 | | | | | |
Legal | | | 15,531 | | | | | |
Printing | | | 213,184 | | | | | |
Insurance | | | 13,363 | | | | | |
Miscellaneous | | | 21,466 | | | | | |
| | | | | | | | |
Total expenses | | | 7,227,558 | | | | | |
Expense reductions | | | (127,877 | ) | | | 7,099,681 | |
| | | | | | | | |
Net Investment Income | | | | | | | 9,953,928 | |
| | | | | | | | |
Realized and Unrealized Loss | | | | | | | | |
| Realized gain (loss) on: | | | | | | | | |
Investments—net | | | (27,385,173 | ) | | | | |
Futures contracts—net | | | 1,120,051 | | | | | |
Foreign currency transactions—net | | | 6,644 | | | | (26,258,478 | ) |
| | | | | | | | |
| Change in unrealized depreciation on: | | | | | | | | |
Investments—net | | | (469,143,900 | ) | | | | |
Foreign currency transactions—net | | | (4,751 | ) | | | (469,148,651 | ) |
| | | | | | | | |
Net loss | | | | | | | (495,407,129 | ) |
| | | | | | | | |
Net Decrease in Net Assets From Operations | | | | | | $ | (485,453,201 | ) |
| | | | | | | | |
| (a) | Net of foreign taxes of $126,207. |
| (b) | Includes income on securities loaned of $1,797,040. |
See accompanying notes to financial statements.
MSF-8
Metropolitan Series Fund, Inc.
Neuberger Berman Mid Cap Value Portfolio
Statements of Changes in Net Assets
| | | | | | | | |
| | | Year ended
December 31,
2008 | | | Year ended
December 31,
2007 | |
From Operations | | | | | | | | |
Net investment income | | $ | 9,953,928 | | | $ | 13,328,680 | |
Net realized loss | | | (26,258,478 | ) | | | (10,508,610 | ) |
Change in unrealized appreciation (depreciation) | | | (469,148,651 | ) | | | 23,266,453 | |
| | | | | | | | |
Increase (decrease) in net assets from operations | | | (485,453,201 | ) | | | 26,086,523 | |
| | | | | | | | |
From Distributions to Shareholders | | | | | | | | |
Net investment income | | | | | | | | |
Class A | | | (6,188,605 | ) | | | (3,653,118 | ) |
Class B | | | (1,536,377 | ) | | | (1,085,328 | ) |
Class E | | | (408,404 | ) | | | (369,343 | ) |
| | | | | | | | |
| | | (8,133,386 | ) | | | (5,107,789 | ) |
| | | | | | | | |
Net realized gain | | | | | | | | |
Class A | | | (8,888,332 | ) | | | (19,661,495 | ) |
Class B | | | (3,460,891 | ) | | | (10,264,105 | ) |
Class E | | | (753,434 | ) | | | (2,686,871 | ) |
| | | | | | | | |
| | | (13,102,657 | ) | | | (32,612,471 | ) |
| | | | | | | | |
Total distributions | | | (21,236,043 | ) | | | (37,720,260 | ) |
| | | | | | | | |
Increase (decrease) in net assets from capital share transactions | | | (241,928,336 | ) | | | 381,397,860 | |
| | | | | | | | |
Net increase (decrease) in net assets | | | (748,617,580 | ) | | | 369,764,123 | |
| | |
Net Assets | | | | | | | | |
Beginning of the period | | | 1,314,906,718 | | | | 945,142,595 | |
| | | | | | | | |
End of the period | | $ | 566,289,138 | | | $ | 1,314,906,718 | |
| | | | | | | | |
Undistributed Net Investment Income | | | | | | | | |
End of the period | | $ | 9,251,327 | | | $ | 9,312,085 | |
| | | | | | | | |
Other Information:
Capital Shares
Transactions in capital shares were as follows:
| | | | | | | | | | | | | | |
| | | Year ended
December 31, 2008 | | | Year ended
December 31, 2007 | |
| | | Shares | | | $ | | | Shares | | | $ | |
Class A | | | | | | | | | | | | | | |
Sales | | 8,723,331 | | | $ | 132,280,753 | | | 20,952,460 | | | $ | 455,646,071 | |
Reinvestments | | 737,980 | | | | 15,076,937 | | | 1,038,513 | | | | 23,314,613 | |
Redemptions | | (19,355,401 | ) | | | (370,806,840 | ) | | (6,570,813 | ) | | | (142,938,314 | ) |
| | | | | | | | | | | | | | |
Net increase (decrease) | | (9,894,090 | ) | | $ | (223,449,150 | ) | | 15,420,160 | | | $ | 336,022,370 | |
| | | | | | | | | | | | | | |
Class B | | | | | | | | | | | | | | |
Sales | | 3,157,641 | | | $ | 45,080,537 | | | 4,778,926 | | | $ | 103,820,476 | |
Reinvestments | | 246,779 | | | | 4,997,268 | | | 510,087 | | | | 11,349,433 | |
Redemptions | | (3,275,242 | ) | | | (57,435,921 | ) | | (2,939,477 | ) | | | (63,331,566 | ) |
| | | | | | | | | | | | | | |
Net increase (decrease) | | 129,178 | | | $ | (7,358,116 | ) | | 2,349,536 | | | $ | 51,838,343 | |
| | | | | | | | | | | | | | |
Class E | | | | | | | | | | | | | | |
Sales | | 307,511 | | | $ | 4,556,252 | | | 612,491 | | | $ | 13,516,410 | |
Reinvestments | | 57,037 | | | | 1,161,838 | | | 136,560 | | | | 3,056,214 | |
Redemptions | | (981,957 | ) | | | (16,839,160 | ) | | (1,066,379 | ) | | | (23,035,477 | ) |
| | | | | | | | | | | | | | |
Net decrease | | (617,409 | ) | | $ | (11,121,070 | ) | | (317,328 | ) | | $ | (6,462,853 | ) |
| | | | | | | | | | | | | | |
Increase (decrease) derived from capital share transactions | | | | | $ | (241,928,336 | ) | | | | | $ | 381,397,860 | |
| | | | | | | | | | | | | | |
See accompanying notes to financial statements.
MSF-9
Metropolitan Series Fund, Inc.
Neuberger Berman Mid Cap Value Portfolio
Financial Highlights
| | | | | | | | | | | | | | | | | | | | |
| | | Class A | |
| | | Year ended December 31, | |
| | | 2008 | | | 2007 | | | 2006 | | | 2005 | | | 2004 | |
Net Asset Value, Beginning of Period | | $ | 21.26 | | | $ | 21.27 | | | $ | 20.97 | | | $ | 20.67 | | | $ | 17.35 | |
| | | | | | | | | | | | | | | | | | | | |
Income From Investment Operations | | | | | | | | | | | | | | | | | | | | |
Net investment income | | | 0.20 | (a) | | | 0.27 | (a) | | | 0.18 | (a) | | | 0.12 | | | | 0.07 | |
Net realized and unrealized gain (loss) of investments | | | (10.10 | ) | | | 0.50 | | | | 2.18 | | | | 2.08 | | | | 3.82 | |
| | | | | | | | | | | | | | | | | | | | |
Total from investment operations | | | (9.90 | ) | | | 0.77 | | | | 2.36 | | | | 2.20 | | | | 3.89 | |
| | | | | | | | | | | | | | | | | | | | |
Less Distributions | | | | | | | | | | | | | | | | | | | | |
Distributions from net investment income | | | (0.15 | ) | | | (0.12 | ) | | | (0.11 | ) | | | (0.06 | ) | | | (0.05 | ) |
Distributions from net realized capital gains | | | (0.21 | ) | | | (0.66 | ) | | | (1.95 | ) | | | (1.84 | ) | | | (0.52 | ) |
| | | | | | | | | | | | | | | | | | | | |
Total distributions | | | (0.36 | ) | | | (0.78 | ) | | | (2.06 | ) | | | (1.90 | ) | | | (0.57 | ) |
| | | | | | | | | | | | | | | | | | | | |
Net Asset Value, End of Period | | $ | 11.00 | | | $ | 21.26 | | | $ | 21.27 | | | $ | 20.97 | | | $ | 20.67 | |
| | | | | | | | | | | | | | | | | | | | |
Total Return (%) | | | (47.3 | ) | | | 3.4 | | | | 11.5 | | | | 12.3 | | | | 22.9 | |
Ratio of operating expenses to average net assets before expense reductions (%) | | | 0.69 | | | | 0.69 | | | | 0.73 | | | | 0.76 | | | | 0.76 | |
Ratio of operating expenses to average net assets after expense reductions (%) (b) | | | 0.68 | | | | 0.67 | | | | 0.70 | | | | 0.75 | | | | 0.73 | |
Ratio of net investment income to average net assets (%) | | | 1.13 | | | | 1.24 | | | | 0.86 | | | | 0.67 | | | | 0.43 | |
Portfolio turnover rate (%) | | | 62 | | | | 60 | | | | 47 | | | | 90 | | | | 55 | |
Net assets, end of period (000) | | $ | 342,212 | | | $ | 871,569 | | | $ | 544,070 | | | $ | 428,897 | | | $ | 327,782 | |
| | | | | | | | | | | | | | | | | | | | |
| | | Class B | |
| | | Year ended December 31, | |
| | | 2008 | | | 2007 | | | 2006 | | | 2005 | | | 2004 | |
Net Asset Value, Beginning of Period | | $ | 21.03 | | | $ | 21.05 | | | $ | 20.78 | | | $ | 20.51 | | | $ | 17.23 | |
| | | | | | | | | | | | | | | | | | | | |
Income From Investment Operations | | | | | | | | | | | | | | | | | | | | |
Net investment income | | | 0.16 | (a) | | | 0.21 | (a) | | | 0.12 | (a) | | | 0.07 | | | | 0.03 | |
Net realized and unrealized gain (loss) of investments | | | (10.00 | ) | | | 0.50 | | | | 2.16 | | | | 2.06 | | | | 3.79 | |
| | | | | | | | | | | | | | | | | | | | |
Total from investment operations | | | (9.84 | ) | | | 0.71 | | | | 2.28 | | | | 2.13 | | | | 3.82 | |
| | | | | | | | | | | | | | | | | | | | |
Less Distributions | | | | | | | | | | | | | | | | | | | | |
Distributions from net investment income | | | (0.10 | ) | | | (0.07 | ) | | | (0.06 | ) | | | (0.02 | ) | | | (0.02 | ) |
Distributions from net realized capital gains | | | (0.21 | ) | | | (0.66 | ) | | | (1.95 | ) | | | (1.84 | ) | | | (0.52 | ) |
| | | | | | | | | | | | | | | | | | | | |
Total distributions | | | (0.31 | ) | | | (0.73 | ) | | | (2.01 | ) | | | (1.86 | ) | | | (0.54 | ) |
| | | | | | | | | | | | | | | | | | | | |
Net Asset Value, End of Period | | $ | 10.88 | | | $ | 21.03 | | | $ | 21.05 | | | $ | 20.78 | | | $ | 20.51 | |
| | | | | | | | | | | | | | | | | | | | |
Total Return (%) | | | (47.5 | ) | | | 3.2 | | | | 11.2 | | | | 11.9 | | | | 22.7 | |
Ratio of operating expenses to average net assets before expense reductions (%) | | | 0.94 | | | | 0.94 | | | | 0.98 | | | | 1.01 | | | | 1.01 | |
Ratio of operating expenses to average net assets after expense reductions (%) (b) | | | 0.93 | | | | 0.92 | | | | 0.95 | | | | 0.99 | | | | 0.98 | |
Ratio of net investment income to average net assets (%) | | | 0.94 | | | | 0.97 | | | | 0.61 | | | | 0.46 | | | | 0.17 | |
Portfolio turnover rate (%) | | | 62 | | | | 60 | | | | 47 | | | | 90 | | | | 55 | |
Net assets, end of period (000) | | $ | 188,360 | | | $ | 361,252 | | | $ | 312,192 | | | $ | 209,448 | | | $ | 93,366 | |
| Please | see following page for Financial Highlights footnote legend. |
See accompanying notes to financial statements.
MSF-10
Metropolitan Series Fund, Inc.
Neuberger Berman Mid Cap Value Portfolio
Financial Highlights
| | | | | | | | | | | | | | | | | | | | |
| | | Class E | |
| | | Year ended December 31, | |
| | | 2008 | | | 2007 | | | 2006 | | | 2005 | | | 2004 | |
Net Asset Value, Beginning of Period | | $ | 21.18 | | | $ | 21.19 | | | $ | 20.90 | | | $ | 20.61 | | | $ | 17.31 | |
| | | | | | | | | | | | | | | | | | | | |
Income From Investment Operations | | | | | | | | | | | | | | | | | | | | |
Net investment income | | | 0.18 | (a) | | | 0.23 | (a) | | | 0.15 | (a) | | | 0.10 | | | | 0.05 | |
Net realized and unrealized gain (loss) of investments | | | (10.07 | ) | | | 0.51 | | | | 2.17 | | | | 2.06 | | | | 3.81 | |
| | | | | | | | | | | | | | | | | | | | |
Total from investment operations | | | (9.89 | ) | | | 0.74 | | | | 2.32 | | | | 2.16 | | | | 3.86 | |
| | | | | | | | | | | | | | | | | | | | |
Less Distributions | | | | | | | | | | | | | | | | | | | | |
Distributions from net investment income | | | (0.12 | ) | | | (0.09 | ) | | | (0.08 | ) | | | (0.03 | ) | | | (0.04 | ) |
Distributions from net realized capital gains | | | (0.21 | ) | | | (0.66 | ) | | | (1.95 | ) | | | (1.84 | ) | | | (0.52 | ) |
| | | | | | | | | | | | | | | | | | | | |
Total distributions | | | (0.33 | ) | | | (0.75 | ) | | | (2.03 | ) | | | (1.87 | ) | | | (0.56 | ) |
| | | | | | | | | | | | | | | | | | | | |
Net Asset Value, End of Period | | $ | 10.96 | | | $ | 21.18 | | | $ | 21.19 | | | $ | 20.90 | | | $ | 20.61 | |
| | | | | | | | | | | | | | | | | | | | |
Total Return (%) | | | (47.4 | ) | | | 3.3 | | | | 11.3 | | | | 12.1 | | | | 22.8 | |
Ratio of operating expenses to average net assets before expense reductions (%) | | | 0.84 | | | | 0.84 | | | | 0.88 | | | | 0.91 | | | | 0.91 | |
Ratio of operating expenses to average net assets after expense reductions (%) (b) | | | 0.83 | | | | 0.82 | | | | 0.85 | | | | 0.90 | | | | 0.88 | |
Ratio of net investment income to average net assets (%) | | | 1.02 | | | | 1.06 | | | | 0.72 | | | | 0.52 | | | | 0.28 | |
Portfolio turnover rate (%) | | | 62 | | | | 60 | | | | 47 | | | | 90 | | | | 55 | |
Net assets, end of period (000) | | $ | 35,717 | | | $ | 82,085 | | | $ | 88,880 | | | $ | 92,695 | | | $ | 72,652 | |
| (a) | Per share amount is based on average shares outstanding during the period. |
| (b) | The Portfolio has entered into arrangements with certain brokers who paid a portion of the Portfolio’s expenses. |
See accompanying notes to financial statements.
MSF-11
Metropolitan Series Fund, Inc.
Neuberger Berman Mid Cap Value Portfolio
Notes to Financial Statements—December 31, 2008
Metropolitan Series Fund, Inc. (the “Fund”) is organized as a corporation under the laws of Maryland pursuant to Articles of Incorporation filed on November 23, 1982, as amended, and registered under the Investment Company Act of 1940, as amended (the “1940 Act”), as an open-end investment company. The Fund is a “series” type of mutual fund, which issues separate series of stock. Each series represents an interest in a separate portfolio of Fund investments. The Neuberger Berman Mid Cap Value Portfolio (the “Portfolio”) is a diversified series of the Fund. Shares in the Fund are not offered directly to the general public and are currently available only to separate accounts established by Metropolitan Life Insurance Company (“MetLife”), New England Life Insurance Company, General American Life Insurance Company (“General American”), The MetLife Investors Group of Insurance Companies, MetLife Insurance Company of Connecticut and other affiliated insurance companies (collectively, the “Insurance Companies”) and to certain eligible qualified retirement plans (“Qualified Plans”), as an investment vehicle for variable life insurance, group annuity or variable annuity products of these insurance companies or Qualified Plans, although the Portfolio is not available to all such separate accounts and Qualified Plans. The Portfolio’s shares may be divided into different classes. Currently, the classes being offered by the Portfolio are named Class A, Class B and Class E. The classes of the Portfolio’s shares are identical, except that certain additional charges (Rule 12b-1 fees) are made against Class B and Class E shares. Investment income, realized and unrealized capital gains and losses, the common expenses of the Portfolio and certain Portfolio-level expense reductions, if any, are allocated daily, on a pro rata basis, to each class based on the relative net assets of each class to the total net assets of the Portfolio.
| 2. | SIGNIFICANT ACCOUNTING POLICIES: |
The preparation of financial statements in conformity with accounting principles generally accepted in the United States of America (“GAAP”) requires management to make estimates and assumptions that affect the reported amounts of assets and liabilities and disclosure of contingent assets and liabilities as of the date of the financial statements and the reported amounts of income and expenses during the reporting period. Actual results could differ from those estimates.
The following is a summary of significant accounting policies consistently followed by the Portfolio in the preparation of its financial statements. The policies are in conformity with GAAP.
Investment Valuation:
Debt securities (other than short term obligations with a remaining maturity of sixty days or less) are generally valued on the basis of evaluated or composite bid quotations obtained by independent pricing services and/or brokers and dealers selected by the relevant subadviser pursuant to authorization of the Board of Directors of the Fund (the “Board” or “Directors”). Such quotations take into account appropriate factors such as institutional-sized trading in similar groups of securities, yield, quality, coupon rate, maturity, type of issue, trading characteristics and other data. Short term obligations with a remaining maturity of sixty days or less are valued at amortized cost which approximates fair market value.
Equity securities traded on a national securities exchange or other exchanges are valued at their last sale price on the principal trading market. Equity securities traded on the NASDAQ National Market System are valued at the NASDAQ Official Closing Price (the “NOCP”). The NOCP is the last reported sale price if the last reported sale price falls between the spread of the last reported bid and asked prices. If the last reported bid and asked prices are above the last reported sale price, the NOCP will be the last reported bid price. If the last reported bid and asked prices are below the last reported sale price, the NOCP will be the last reported asked price. Equity securities traded on a national securities exchange or other exchanges or on the NASDAQ National Market System for which there is no reported sale during the day are valued at the last reported bid price. A security that is listed or traded on more than one exchange is valued at the quotation on the exchange determined to be the primary market for that security by the Board or its delegates. If no closing price is available, then such securities are valued by using the last reported bid price. Equity securities traded over-the-counter are valued at the last reported sales price.
If no current market value quotation is readily available or reliable for a portfolio security, fair value will be determined in accordance with procedures established by and under the general supervision of the Board. When the Portfolio uses fair value pricing, it may take into account any factors it deems appropriate. The value of securities used by the Portfolio to calculate its net asset value may differ from quoted or published prices for the same securities. Fair value pricing involves subjective judgments and the fair value determined for a security may be materially different than the value that could be realized upon the sale of that security.
MSF-12
Metropolitan Series Fund, Inc.
Neuberger Berman Mid Cap Value Portfolio
Notes to Financial Statements—December 31, 2008—(Continued)
The Portfolio expects to use fair value pricing for securities primarily traded on U.S. exchanges only under very limited circumstances. For example, the Portfolio may use fair value pricing if the exchange on which a security is traded closes early or trading in the security is suspended.
Securities traded primarily on an exchange outside of the United States which closes before the close of the New York Stock Exchange will be valued at the last sales price on that non-U.S. exchange. Securities traded primarily on an exchange outside of the United States for which there is no reported sale during the day are valued at the mean between the last reported bid and asked prices. However, because most foreign markets close well before the Portfolio values its securities (typically at 4 p.m. Eastern Time), the earlier close of these foreign markets gives rise to the possibility that significant events, including broad market moves, may have occurred after these foreign markets close but before the Portfolio values its securities. To account for this, the Portfolio may frequently value many of its foreign equity securities using fair value prices based on third party vendor modeling tools.
Forward foreign currency exchange contracts are valued based on the mean between closing bid and asked prices of the forward currency contract rates in the London foreign exchange markets on a daily basis as provided by a reliable bank or dealer.
The value of futures contracts will be the sum of the margin deposit plus or minus the difference between the value of the futures contract on each day the net asset value is calculated and the value on the date the futures contract originated, value being that established on a recognized commodity exchange, or by reference to other customary sources, with gain or loss being realized when the futures contract closes or expires.
Subject to the Board’s oversight, the Board has delegated the day-to-day oversight of pricing matters, including determinations in good faith under the Fund’s procedures the fair value of securities for which current market quotations are not readily available to the subadviser of the Portfolio.
Investment Transactions and Related Investment Income:
Portfolio security transactions are recorded on the trade date. Dividend income is recorded on the ex-dividend date or, for certain foreign securities, when notified. Interest income, which includes amortization of premium and accretion of discount on debt securities, is recorded on the accrual basis. Realized gains and losses on investments and unrealized appreciation and depreciation are determined on the identified cost basis, which is the same basis used for federal income tax purposes.
Repurchase Agreements:
The Portfolio, through the custodian or a subcustodian, receives delivery of the underlying securities collateralizing repurchase agreements. The Portfolio requires the custodian to take possession, to have legally segregated in the Federal Reserve Book Entry System, or to have segregated within the custodian’s vault, all securities held as collateral for repurchase agreements. It is the Portfolio’s policy that the market value of the collateral be at least equal to 100% of the repurchase price in the case of a repurchase agreement of one-day duration and 102% on all other repurchase agreements. The Portfolio’s subadviser is responsible for determining that the value of the collateral is at all times at least equal to the repurchase price. In connection with transactions in repurchase agreements, if the seller defaults and the value of the collateral declines or if the seller enters an insolvency proceeding, realization of the collateral by the Portfolio may be delayed, limited or wholly denied.
Foreign Currency Translation:
The books and records of the Portfolio are maintained in U.S. dollars. The values of securities, currencies and other assets and liabilities denominated in currencies other than U.S. dollars are translated into U.S. dollars based upon foreign exchange rates prevailing at the end of the period. Purchases and sales of investment securities, income and expenses are translated on the respective dates of such transactions. Since the values of investment securities are presented at the foreign exchange rates prevailing at the end of the period, it is not practical to isolate that portion of the results of operations arising from changes in exchange rates from that portion of the results of operations reflecting fluctuations arising from changes in market prices of the investment securities. Such fluctuations are included in the net realized and unrealized gain or loss on investments.
Net realized foreign exchange gains or losses arise from sales of foreign currency, currency gains or losses realized between the trade and settlement dates on securities transactions, and the difference between the amounts of dividends, interest, and foreign withholding taxes recorded by the Portfolio and the U.S. dollar equivalent of the amounts actually received or paid by the Portfolio. Net unrealized foreign exchange gains and losses arise from changes in the value of assets and liabilities, other than investment securities, resulting from changes in the exchange rate.
MSF-13
Metropolitan Series Fund, Inc.
Neuberger Berman Mid Cap Value Portfolio
Notes to Financial Statements—December 31, 2008—(Continued)
Forward Foreign Currency Exchange Contracts:
The Portfolio may enter into forward foreign currency exchange contracts primarily to hedge against foreign currency exchange rate risks on its non-U.S. dollar denominated investment securities. When entering into a forward currency contract, the Portfolio agrees to receive or deliver a fixed quantity of foreign currency for an agreed-upon price on an agreed future date. These contracts are valued daily and the Portfolio’s net equity therein, representing unrealized gain or loss on the contracts as measured by the difference between the foreign exchange rates at the dates of entry into the contracts and the forward rates at the settlement date, is included in the Statement of Assets and Liabilities. Realized and unrealized gains and losses are included in the Statement of Operations. These instruments involve market and/or credit risk in excess of the amount recognized in the Statement of Assets and Liabilities. Risks arise from the possible inability of counterparties to meet the terms of their contracts and from movement in currency and securities values and interest rates.
Futures Contracts:
The Portfolio may buy and sell futures contracts (on recognized exchanges) as a hedge, to maintain exposure to the broad equity markets or to enhance return. Futures contracts are agreements to buy or sell a security, or deliver a final cash settlement price in connection with an index, interest rate, currency, or other contracts not calling for physical delivery, for a set price in the future. The Portfolio must post an amount equal to a portion of the total market value of the futures contract as futures variation margin, which is returned when the Portfolio’s obligations under the contract have been satisfied. From time to time thereafter, the Portfolio may have to post variation margin to maintain this amount as the market value of the contract fluctuates. Risks of entering into futures contracts (and related options) include the possibility that there may be an illiquid market and that a change in the value of the contract or option may not correlate with changes in the value of the underlying securities.
“When-Issued” Securities:
Purchasing securities “when-issued” is a forward commitment by the Portfolio to buy a security. The estimated amount of the Portfolio’s payment obligation and the security’s interest rate are determined when the commitment is made, even though no interest accrues until the security is issued, which is generally 15 to 120 days later. The Portfolio will segregate liquid assets with its custodian sufficient at all times to satisfy these commitments. If the value of the security is less when delivered than when the commitment was made, the Portfolio will suffer a loss.
Federal Income Taxes:
It is the Portfolio’s policy to comply with the requirements of the Internal Revenue Code of 1986, as amended (the “Code”), and regulations thereunder, applicable to regulated investment companies and to distribute, with respect to each taxable year, all of its taxable income to shareholders. Therefore, no federal income tax provision is required. The Portfolio is subject to the provisions of the Financial Accounting Standards Board Interpretation (“FASB”) No. 48, Accounting for Uncertainties in Income Taxes (FIN 48). FIN 48 sets forth a minimum threshold for financial statement recognition of the benefit of a tax position taken or expected to be taken in a tax return. The implementation of FIN 48 did not result in any unrecognized tax benefits in the accompanying financial statements. Each of the Portfolio’s federal tax returns for the prior three fiscal years remains subject to examination by the Internal Revenue Service.
As of December 31, 2008, the Portfolio had no capital loss carryforwards.
Pursuant to Section 852 of the Code, the Portfolio designated the amount shown below under Long Term Gain as capital gain dividends for its taxable year ended December 31, 2008. The tax character of distributions paid for the periods ended December 31, 2008 and 2007 was as follows:
| | | | | | | | | | | | | | | | | | | | | |
Ordinary Income | | Long Term Gain | | Return of Capital | | Total |
2008 | | 2007 | | 2008 | | 2007 | | 2008 | | 2007 | | 2008 | | 2007 |
$8,133,386 | | $ | 10,970,152 | | $ | 13,102,657 | | $ | 26,750,108 | | $ | — | | $ | — | | $ | 21,236,043 | | $ | 37,720,260 |
As of December 31, 2008, the components of distributable earnings (accumulated losses) on a federal income tax basis were as follows:
| | | | | | | | | | | | | | |
Undistributed
Ordinary
Income | | Undistributed
Long Term
Gain | | Unrealized
Depreciation | | | Loss
Carryforwards | | Total | |
$9,251,330 | | $ | 268,929 | | $ | (343,288,904 | ) | | $ | — | | $ | (333,768,645 | ) |
MSF-14
Metropolitan Series Fund, Inc.
Neuberger Berman Mid Cap Value Portfolio
Notes to Financial Statements—December 31, 2008—(Continued)
Pursuant to Federal income tax regulations applicable to investment companies, the Portfolio has elected to treat net capital losses realized between November 1 and December 31 of each year as occurring on the first day of the following tax year. For the year ended December 31, 2008, the following amounts of realized capital and currency losses reflected in the accompanying financial statements will not be recognized for Federal income tax purposes until January 1, 2009:
| | | | |
Currency | | Capital | |
$— | | $ | (19,555,916 | ) |
Dividends and Distributions to Shareholders:
The Portfolio records dividends and distributions on the ex-dividend date. Net realized gains from security transactions (if any) are generally distributed annually to shareholders. The timing and characterization of certain income and capital gains distributions are determined in accordance with federal tax regulations that may differ from GAAP. Permanent book and tax basis differences relating to shareholder distributions will result in reclassification between under/over distributed net investment income, accumulated net realized gains/losses and paid in capital.
Expense Reductions:
Certain Portfolio trades are directed to brokers who paid a portion of the Portfolio’s expenses. Amounts paid for the Portfolio are shown as expense reductions in the Statement of Operations.
| 3. | INVESTMENT TRANSACTIONS: |
For the year ended December 31, 2008, purchases and sales of securities (excluding short term investments) for the Portfolio were as follows:
| | | | | | | | | |
Purchases | | Sales |
U.S. Government | | Other | | U.S. Government | | Other |
$0 | | $ | 572,863,947 | | $ | 0 | | $ | 820,636,533 |
| 4. | INVESTMENT MANAGEMENT FEES AND OTHER TRANSACTIONS WITH AFFILIATES: |
Investment Management Agreement:
MetLife Advisers, LLC (“MetLife Advisers”) is the investment adviser to the Portfolio. The Fund has entered into an investment management agreement with MetLife Advisers with respect to the Portfolio. For providing investment management services to the Portfolio, MetLife Advisers receives monthly compensation at the following annual rates:
| | | | |
Management
Fees earned by
MetLife Advisers
for the year ended
December 31, 2008 | | Annual
percentage
rates paid to
MetLife Advisers | | Based on Portfolios
average daily net asset
levels |
| $6,025,622 | | 0.650% | | Of the first $1.0 billion |
| | 0.600% | | On amounts in excess of $1.0 billion |
Certain officers and directors of the Fund may also be officers of MetLife Advisers; however, such officers and directors receive no compensation from the Fund.
MetLife Advisers has entered into an investment subadvisory agreement with respect to the Portfolio. Neuberger Berman Management, LLC is compensated by MetLife Advisers to provide subadvisory services for the Portfolio.
Service and Distribution Fees:
The Fund has adopted a Distribution and Service Plan under Rule 12b-1 of the 1940 Act for the Portfolio’s Class B and E shares. Under the Distribution and Service Plan, the Class B and E shares of the Portfolio pay a fee to compensate the Insurance Companies (or their affiliates) and other broker-dealers and financial intermediaries involved in the offer and sale of Portfolio shares for promoting or selling and servicing the Class B and E shares. The fees under the Distribution and Service Plan for each class of the Portfolio’s shares are calculated as a percentage of the Portfolio’s average daily net assets that are attributable to
MSF-15
Metropolitan Series Fund, Inc.
Neuberger Berman Mid Cap Value Portfolio
Notes to Financial Statements—December 31, 2008—(Continued)
that Class. Currently, the fee is 0.25% per year for Class B shares and 0.15% per year for Class E shares. Amounts paid by the Portfolio for the year ended December 31, 2008 are shown as Service and Distribution fees in the Statement of Operations.
The Fund has entered into a securities lending arrangement with the Fund’s custodian, State Street Bank and Trust Company (the “custodian”). Under the agreement, the custodian is authorized to loan securities on the Portfolios’ behalf. In exchange, the Portfolio receives either cash or securities as collateral against the loaned securities. The Portfolio receives collateral at least equal to 102% of the market value of the loaned securities (105% for foreign securities), at each loan’s inception. Collateral must be maintained at least at 100% of the market value of the loaned securities for the duration of the loan. The cash collateral is invested in the Navigator Securities Lending Prime Portfolio, an affiliate of the custodian, which invests in a variety of high quality U.S. dollar-denominated instruments. If the market value of the collateral at the close of trading on a business day is less than 100% of the market value of the loaned securities at the close of trading on that day, the borrower shall be required to deliver, by the close of business on the following business day, an additional amount of collateral, equal to at least 100% of the market value of all the loaned securities as of such preceding day. The Portfolio receives 80% of the annual net income from securities lending transactions, which is included in interest income of the Portfolio. The remaining 20% is paid to the custodian as compensation for its securities lending services. Interest income received by the Portfolio via lending transactions during the year ended December 31, 2008 is footnoted in the Statement of Operations. The Portfolio bears the risk of any deficiency in the amount of collateral available for return to a borrower due to a loss in an approved investment purchased with such collateral. Any outstanding loans by the Portfolio at December 31, 2008 are footnoted in the Schedule of Investments.
| 6. | MARKET AND CREDIT RISK: |
In the normal course of business, the Portfolio invests in securities and enters into transactions where risks exist due to fluctuations in the market (market risk) or failure of the other party to a transaction to perform (credit risk). The value of securities held by the Portfolio may decline in response to certain events, including those directly involving the companies whose securities are owned by the Portfolio; conditions affecting the general economy; overall market changes; local, regional or global political, social or economic instability; and currency and interest rate and price fluctuations. Similar to credit risk, the Portfolio may be exposed to counterparty risk, or the risk that an entity with which the Portfolio has unsettled or open transactions may default. Financial assets, which potentially expose the Portfolio to credit and counterparty risks, consist principally of investments and cash due from counterparties. The extent of the Portfolio’s exposure to credit and counterparty risks in respect to these financial assets approximates their value as recorded in the Portfolio’s Statements of Assets and Liabilities.
| 7. | RECENT ACCOUNTING PRONOUNCEMENTS: |
In March 2008, the FASB issued Statement of Financial Accounting Standards No. 161, Disclosures about Derivative Instruments and Hedging Activities (“FAS 161”), an amendment of FASB Statement No. 133. FAS 161 requires enhanced disclosures about (a) how and why an entity uses derivative instruments, (b) how derivative instruments and hedging activities are accounted for, and (c) how derivative instruments and related hedging activities affect a fund’s financial position, financial performance, and cash flows. Management does not believe the adoption of FAS 161 will materially impact the financial statement amounts, but will require additional disclosures. This will include qualitative and quantitative disclosures on derivative positions existing at period end and the effect of using derivatives during the reporting period. FAS 161 is effective for financial statements issued for fiscal years and interim periods beginning after November 15, 2008. Management is currently evaluating the impact the adoption of FAS 161 will have on the Portfolio’s financial statement disclosures.
MSF-16
Metropolitan Series Fund, Inc.
Neuberger Berman Mid Cap Value Portfolio
Report of Independent Registered Public Accounting Firm
To the Shareholders and Board of Directors of Metropolitan Series Fund, Inc.:
We have audited the accompanying statement of assets and liabilities, including the schedule of investments, of the Neuberger Berman Mid Cap Value Portfolio (one of the portfolios constituting the Metropolitan Series Fund, Inc.) (the “Fund”) as of December 31, 2008, and the related statement of operations for the year then ended, the statements of changes in net assets for each of the two years in the period then ended, and the financial highlights for each of the five years in the period then ended. These financial statements and financial highlights are the responsibility of the Fund’s management. Our responsibility is to express an opinion on these financial statements and financial highlights based on our audits.
We conducted our audits in accordance with the standards of the Public Company Accounting Oversight Board (United States). Those standards require that we plan and perform the audit to obtain reasonable assurance about whether the financial statements and financial highlights are free of material misstatement. The Fund is not required to have, nor were we engaged to perform, an audit of its internal control over financial reporting. Our audits included consideration of internal control over financial reporting as a basis for designing audit procedures that are appropriate in the circumstances, but not for the purpose of expressing an opinion on the effectiveness of the Fund’s internal control over financial reporting. Accordingly, we express no such opinion. An audit also includes examining, on a test basis, evidence supporting the amounts and disclosures in the financial statements, assessing the accounting principles used and significant estimates made by management, as well as evaluating the overall financial statement presentation. Our procedures included confirmation of securities owned as of December 31, 2008, by correspondence with the custodian and brokers; where replies were not received from brokers, we performed other auditing procedures. We believe that our audits provide a reasonable basis for our opinion.
In our opinion, the financial statements and financial highlights referred to above present fairly, in all material respects, the financial position of the Neuberger Berman Mid Cap Value Portfolio of the Metropolitan Series Fund, Inc. as of December 31, 2008, the results of its operations for the year then ended, the changes in its net assets for each of the two years in the period then ended, and the financial highlights for each of the five years in the period then ended, in conformity with accounting principles generally accepted in the United States of America.
Deloitte & Touche LLP
Boston, Massachusetts
February 20, 2009
MSF-17
Metropolitan Series Fund, Inc.
Directors and Officers
The Fund’s Directors review actions of the Fund’s investment adviser and subadvisers, and decide upon matters of general policy. The Fund’s officers supervise the daily business operations of the Fund. The Board of Directors and the Fund’s officers are listed below. Each Director is responsible for overseeing all 38 Portfolios of the Fund. There is no limit to the term a Director may serve. Directors serve until their resignation, retirement or removal in accordance with the Fund’s organizational documents and policies adopted by the Board from time to time. Officers hold office at the pleasure of the Board or until the election or appointment and the qualification of a successor. The address of the Directors and officers is c/o Metropolitan Series Fund, Inc., 501 Boylston Street, Boston, MA 02116.
Interested Directors(1)
Each Director below is an “interested person” (as defined by the 1940 Act) with respect to the Fund in that Ms. Forget is an employee of MetLife and Mr. Typermass is a former employee of MetLife and owns securities issued by MetLife, Inc., the ultimate parent company of MetLife Advisers.
| | | | | | | | |
Name, Address and Age | | Current
position(s)
with Fund | | Position(s)
held since | | Principal occupations
over past five years, including other directorships(2) | | Number of
Portfolios in
Fund Complex
Overseen by
Director(3) |
Elizabeth M. Forget Age: 42 | | Director, Chairman of the Board, President and Chief Executive Officer | | 2006 | | Senior Vice President (since 2007), MetLife, Inc.; President, Met Investors Advisory, LLC; Trustee and President, Met Investors Series Trust; Executive Vice President, MetLife Investors Group, Inc.; President, Chief Executive Officer and Chair of the Board of Managers (since 2006), MetLife Advisers; President, Met Investors Advisory, LLC. | | 87 |
| | | | |
Arthur G. Typermass Age: 71 | | Director | | 1998 | | Formerly, Senior Vice President and Treasurer, MetLife. | | 38 |
Non-Interested Directors(1)
Each Director below is not an “interested person” (as defined by the 1940 Act) with respect to the Fund (collectively, the “Independent Directors”).
| | | | | | | | |
Name, Address and Age | | Current
position(s)
with Fund | | Position(s)
held since | | Principal occupations
over past five years, including other directorships(2) | | Number of
Portfolios in
Fund Complex
Overseen by
Director(3) |
Steve A. Garban† Age: 71 | | Director | | 1985 | | Formerly, Chief Financial Officer, Senior Vice President Finance and Operations and Treasurer (Emeritus), The Pennsylvania State University. | | 38 |
| | | | |
Linda B. Strumpf Age: 61 | | Director | | 2000 | | Vice President and Chief Investment Officer, Ford Foundation. | | 38 |
| | | | |
Michael S. Scott Morton† Age: 71 | | Director | | 1993 | | Jay W. Forrester Professor of Management (Emeritus) at Sloan School of Management, MIT. | | 38 |
| | | | |
H. Jesse Arnelle Age: 75 | | Director | | 2001 | | Formerly, Counsel, Womble Carlyle Sandrie & Rice; Director, Textron Inc. (global multi- industry company)*; formerly, Director, Gannet Co. Inc. (diversified news and information company)*; formerly, Director, Eastman Chemical Company (global chemical company)*; formerly, Director, Waste Management, Inc.*; formerly, Director, Armstrong Holdings Inc. (parent company of floor and ceiling products business)*; formerly, Director, FPL Group Inc. (public utility holding company)*; Director, URS Corporation (engineering design services firm)*. | | 38 |
MSF-18
Metropolitan Series Fund, Inc.
Directors and Officers—(Continued)
| | | | | | | | |
Name, Address and Age | | Current
position(s)
with Fund | | Position(s)
held since | | Principal occupations
over past five years, including other directorships(2) | | Number of
Portfolios in
Fund Complex
Overseen by
Director(3) |
Nancy Hawthorne Age: 57 | | Director | | 2003 | | Chief Executive Officer, Clerestory LLC (corporate financial advisor); Director, Avid Technologies (computer software company)*; formerly, Chairman of the Board of Avid Technologies; formerly, Board of Advisors, L. Knife & Sons, Inc. (beverage distributor); formerly, Trustee, New England Zenith Fund (“Zenith Fund”)**; formerly, Chief Executive Officer and Managing Partner, Hawthorne, Krauss and Associates (corporate financial advisor); formerly, Chief Financial Officer and Executive Vice President, Continental Cablevision, subsequently renamed MediaOne (cable television company); formerly, Director, Life F/X, Inc.; formerly, Chairman of the Board, WorldClinic (distance medicine company); formerly, Director, Perini Corporation (construction company)*; formerly, Director, CGU (property and casualty insurance company); formerly, Director, Beacon Power Corporation (energy company)*. | | 38 |
| | | | |
John T. Ludes Age: 72 | | Director | | 2003 | | President, LFP Properties (consulting firm); Formerly, Trustee, Zenith Fund**; formerly, Vice Chairman, President and Chief Operating Officer, Fortune Brands/American Brands (global conglomerate); formerly, President and CEO, Acushnet Company (athletic equipment company). | | 38 |
Officers(1)
| | | | | | | | |
Name and address | | Age | | Current
position(s)
with Fund | | Position(s)
held since | | Principal occupations over past five years(2) |
| Jeffrey L. Bernier | | 37 | | Senior Vice President | | 2008 | | Vice President (since 2008), MetLife, Inc.; Vice President (since 2008), MetLife; Senior Vice President (since 2008), MetLife Advisers; formerly, Director and Senior Investment Analyst (2004 to 2007), John Hancock Financial Services; formerly, Assistant Vice President (2000 to 2001), Wachovia Securities. |
| | | | |
| Alan C. Leland | | 56 | | Senior Vice President | | 2005 | | Treasurer and Chief Financial Officer, MetLife Advisers, LLC; Treasurer (since 2005), Met Investors Advisory, LLC; Vice President (since 2004), Met Investors Advisory, LLC; Vice President (since 2003), MetLife, Inc.; Vice President, MetLife; Senior Vice President, NELICO. |
| | | | |
| Peter Duffy | | 53 | | Vice President
and Treasurer | | 2000 | | Senior Vice President, MetLife Advisers; Second Vice President (since 2003), NELICO; Vice President, MetLife (since 2004); Vice President (since 2004), MetLife, Inc.; formerly, Vice President and Treasurer, Zenith Fund**. |
| | | | |
| Jeffrey P. Halperin | | 41 | | Chief
Compliance Officer | | 2007 | | Vice President (since 2006), MetLife, Inc.; Vice President (since 2006), MetLife; Chief Compliance Officer (since 2006), Met Investors Series Trust, MetLife Advisers, Met Investors Advisory, LLC and MetLife Investment Advisors Company, LLC. |
| * | Indicates a directorship with a registered investment company or a company subject to the reporting requirements of the Securities Exchange Act of 1934, as amended. |
| ** | The Zenith Fund deregistered with the Securities and Exchange Commission (“SEC”) in 2004. |
| (†) | Served as a trustee, director and/or officer of one or more of the following companies, each of which had a direct or indirect advisory relationship with MetLife Advisers or its affiliates prior to January 31, 2005: State Street Research Financial Trust, State Street Research Income Trust, State Street Research Money Market Trust, State Street Research Institutional Funds, State Street Research Capital Trust, State Street Research Master Investment Trust, State Street Research Equity Trust, State Street Research Securities Trust and State Street Research Exchange Trust (collectively, the “State Street Research Funds”). |
| (1) | During the period shown, each Director of the Fund served as a Trustee of Metropolitan Series Fund II, a registered investment company that ceased investment operations in June of 2008 and has applied for deregistration under the Investment Company Act of 1940. During this period, each officer of the Fund served in the same position with Metropolitan Series Fund II. |
| (2) | Previous positions during the past five years with the Fund; Met Investors Series Trust; MetLife; MetLife, Inc.; MetLife Advisers; Met Investors Advisory, LLC; Zenith Fund; NELICO; or New England Securities Corporation are omitted if not materially different. |
| (3) | The Fund Complex includes the Fund (38 portfolios) and Met Investors Series Trust (49 portfolios). |
MSF-19
Metropolitan Series Fund, Inc.
Neuberger Berman Mid Cap Value Portfolio
Board Approval of Advisory and Subadvisory Agreements
The Fund’s Contract Review Committees of the Board of Directors (the “Board” or the “Directors”) typically meet in early fall to review the Portfolios’ advisory agreements (the “Advisory Agreements”) and subadvisory agreements (the “Subadvisory Agreements,” and, together with the Advisory Agreements, the “Agreements”) and determine whether to recommend that the full Board approve the continuation of the Agreements for an additional one-year period. (Following the initial approval of an Agreement for a new Portfolio or with a new adviser or subadviser, such annual reviews are not required until 2 years following the execution of such Agreement.) After each Committee has made its recommendations, the full Board, including the Independent Directors, determines whether to approve the continuation of each of the Agreements. In addition, the Board, including the Independent Directors, considers matters bearing on the Agreements at most of its other meetings throughout the year and regularly interviews various individuals at MetLife Advisers responsible for the management of the Portfolios. The Directors also interview selected investment managers and other professionals at the subadvisers at various times throughout the year.
The Directors receive all materials that they or MetLife Advisers, the Fund’s investment adviser, and the subadvisers believe to be reasonably necessary for the Directors to evaluate the Agreements and determine whether to approve the continuation of the Agreements. These materials generally include, among other items, (i) information on the investment performance of the Portfolios and the performance of peer groups of funds and the Portfolios’ performance benchmarks, (ii) information on the Portfolios’ advisory and subadvisory fees and other expenses, including information comparing the Portfolios’ expenses to those of peer groups of funds and information about any applicable expense caps and fee “breakpoints,” (iii) sales and redemption data, (iv) information related to the profitability of the Agreements to MetLife Advisers and certain of the subadvisers, and potential “fall-out” or ancillary benefits that MetLife Advisers, the subadvisers or their affiliates may receive as a result of their relationships with the Fund and (v) information obtained through the subadvisers’ responses to certain requests from MetLife Advisers and the Directors and MetLife Advisers’ responses to requests from the Directors. The Directors may also consider other information such as (vi) MetLife Advisers’ and the subadvisers’ financial results and condition, (vii) each Portfolio’s investment objectives and strategies and the size, education and experience of the investment staffs of MetLife Advisers and the relevant subadvisers and their use of technology and external research, (viii) the allocation of the Portfolios’ brokerage, if any, including allocations to brokers affiliated with the subadvisers and the use of “soft” commission dollars to pay Portfolio expenses and to pay for research and other similar services, (ix) the resources devoted to, and the record of compliance with, the Portfolios’ investment policies and restrictions, policies on personal securities transactions and other compliance policies, (x) the responses of MetLife Advisers, the subadvisers and/or their affiliates to certain legal and regulatory proceedings and (xi) the economic outlook generally and for the mutual fund industry in particular. Throughout the process, the Directors have the opportunity to ask questions of and request additional materials from MetLife Advisers and the subadvisers.
Following meetings of each Contract Review Committee on September 10, 2008, the Board, including the Independent Directors, at its November 6-7, 2008 meeting, approved the continuation through December 31, 2009 of the Advisory Agreements for each Portfolio of the Fund and the Subadvisory Agreements for each Portfolio other than the Zenith Equity Portfolio and Asset Allocation Portfolios (which do not have subadvisers) and the Van Eck Global Natural Resources Portfolio, Met/Dimensional International Small Cap Portfolio and Loomis Sayles Small Cap Growth Portfolio (formerly known as the Franklin Templeton Small Cap Growth Portfolio). The Agreements approved for continuation are referred to below as the “Continued Agreements.”
In considering whether to approve the continuation of the Continued Agreements, the Directors, including the Independent Directors, did not identify any single factor as determinative, and each weighed the various factors as he or she deemed appropriate. The Directors considered the following matters in connection with their approval of the Continued Agreements:
The nature, extent and quality of the services provided to the relevant Portfolios under the Continued Agreements. The Directors considered the nature, extent and quality of the services provided by MetLife Advisers, the relevant subadvisers (if any) and their affiliates (each, an “Adviser,” and, collectively, the “Advisers”) to the relevant Portfolios pursuant to the Continued Agreements and the resources dedicated to these Portfolios by the Advisers. In particular, the Directors considered the Advisers’ abilities to attract and retain highly qualified investment professionals. With respect to MetLife Advisers, the Directors considered (for each Portfolio other than the Zenith Equity and Asset Allocation Portfolios) that MetLife Advisers is (i) ultimately responsible for the performance of such Portfolios; (ii) ultimately responsible for the establishment of the investment strategies of each such Portfolio, primarily through its recommendations to the Board regarding the hiring and selection of subadvisers; (iii) responsible for the hiring and selection, subject to Board approval, of subadvisers; and (iv) responsible for maintaining a program of Subadviser oversight reasonably designed to ensure that the subadvisers have reasonable compliance policies and procedures in place. The Directors also considered that MetLife Advisers provides a full range of day-to-day administrative services for the Portfolios involving all aspects of such Portfolios’ day-to-day operations (other than portfolio management). With respect to the Zenith Equity and Asset Allocation Portfolios, the Directors considered both the portfolio management services and the administrative services provided by MetLife Advisers. After reviewing
MSF-20
Metropolitan Series Fund, Inc.
Neuberger Berman Mid Cap Value Portfolio
Board Approval of Advisory and Subadvisory Agreements—(Continued)
these and related factors, the Directors concluded, within the context of their overall conclusions regarding each of the Continued Agreements, that the nature, extent and quality of services provided supported the renewal of these Agreements.
Investment performance of the relevant Portfolios. The Directors reviewed information about the performance of the relevant Portfolios over various time periods, including information prepared by an independent third party that compared the performance of the Portfolios to the performance of peer groups of funds and performance benchmarks. The Directors also reviewed a description of the third party’s methodology for identifying a Portfolio’s peer group(s) for purposes of performance and expense comparisons.
In the case of each relevant Portfolio that had performance that lagged its peer group(s) for certain periods, the Directors concluded that other factors relevant to performance were sufficient, in light of other considerations, to warrant renewal of the Continued Agreements relating to such Portfolio. These factors varied from Portfolio to Portfolio, but included one or more of the following: (i) that such Portfolio’s performance, although lagging in certain recent periods, was stronger over the longer term; (ii) that the underperformance was attributable, to a significant extent, to investment decisions that were reasonable and consistent with the Portfolio’s investment objective(s) and policies and that the Portfolio was performing within the range of reasonable expectations, given market conditions and the Portfolio’s investment objective(s) and policies; (iii) that the Portfolio’s performance was competitive when compared to other relevant performance benchmarks or peer groups; and (iv) that MetLife Advisers and/or the relevant subadviser (if any) had taken or was taking steps designed to help improve the Portfolio’s investment performance (including, in the case of certain Portfolios, that MetLife Advisers was formulating possible proposals, for presentation to the Board in November 2008, to replace the Portfolio’s subadviser or to merge the Portfolio into another Portfolio with a similar investment objective and better investment performance).
The Directors also considered the investment performance of the Advisers and their reputations generally, the historical responsiveness of the Advisers to Director concerns about performance and the willingness of the Advisers to take steps intended to improve performance.
After reviewing these and related factors, the Directors concluded, within the context of their overall conclusions regarding each of the Continued Agreements, that the investment performance of each relevant Portfolio and Adviser was sufficient, in light of other considerations, to warrant the renewal of the Continued Agreements.
The costs of the services to be provided and profits to be realized by the Advisers and their affiliates from their relationships with the Portfolios. The Directors considered the fees charged by MetLife Advisers to the Portfolios for advisory services and, with respect to the subadvised Portfolios, by such subadvisers to MetLife Advisers for subadvisory services (such advisory and subadvisory fees (if any), collectively, “Fees”), as well as the total expense levels of the Portfolios. This information included comparisons (provided by an independent third party) of the Portfolios’ advisory fees and total expense levels to those of their peer groups. In evaluating Fees for the relevant Portfolios, the Directors also took into account the demands, complexity and quality of the investment management services provided to each Portfolio. The Directors considered MetLife Advisers’ recommendations regarding reductions in Fee rates, implementation of Fee breakpoints and institution of Fee waivers and expense caps.
The Directors also considered the compensation directly or indirectly received by the Advisers and their affiliates from their relationships with the relevant Portfolios. The Directors reviewed information relating to the profits received by MetLife Advisers, certain of the subadvisers and their affiliates as a result of their relationships with the relevant Portfolios, and information about the allocation of expenses used to calculate profitability. When reviewing profitability, the Directors also considered the performance of the relevant Portfolios, the expense levels of such Portfolios and whether the relevant Advisers had implemented breakpoints, fee waivers and/or expense caps with respect to such Portfolios.
After reviewing these and related factors, the Directors concluded, within the context of their overall conclusions regarding each of the Continued Agreements, that the Fees charged to each of the relevant Portfolios were fair and reasonable, and that the information provided regarding costs of these services generally, and the related profitability (if known) to the relevant Advisers of their relationships with the relevant Portfolios, supported the renewal of the Continued Agreements.
Economies of Scale. The Directors considered the existence of any economies of scale in the provision of services by the Advisers and whether those economies were shared with the relevant Portfolios through breakpoints in their advisory fees or other means, such as expense caps, fee waivers or relatively low levels of fees. The Directors noted that most of the relevant Portfolios benefited or will benefit from breakpoints, expense caps and/or fee waivers with respect to their advisory fees. In considering these issues, the Directors also took into consideration information relating to the costs of the services provided and the profitability to MetLife Advisers, the relevant subadvisers (if any) and each of their affiliates of their relationships with the relevant Portfolios, as discussed above.
MSF-21
Metropolitan Series Fund, Inc.
Neuberger Berman Mid Cap Value Portfolio
Board Approval of Advisory and Subadvisory Agreements—(Continued)
After reviewing these and related factors, the Directors concluded, within the context of their overall conclusions regarding each of the Continued Agreements, that the extent to which economies of scale were shared with the relevant Portfolios supported the renewal of such Agreements.
Other Factors. The Directors also considered other factors, which included but were not limited to the following:
| | • | | the extent to which each relevant Portfolio operated in accordance with its investment objective, and its record of compliance with its investment restrictions and the compliance programs of the Fund and the Advisers. They also considered the compliance-related resources the Advisers and their affiliates provide to the relevant Portfolios; |
| | • | | the nature, quality, cost and extent of administrative and shareholder services performed by MetLife Advisers and its affiliates under the Advisory Agreements; and |
| | • | | so-called “fall-out benefits” to the Advisers, such as the engagement of their affiliates to provide distribution, brokerage and transfer agency services to the Portfolios, and the benefits of research made available to the relevant Advisers by reason of brokerage commissions generated by the relevant Portfolios’ securities transactions. The Directors also considered the possible conflicts of interest associated with these fall-out and other benefits, and the reporting and other processes in place to disclose and monitor these possible conflicts of interest. |
Based on their evaluation of all factors that they deemed to be material, including those factors described above, and assisted by the advice of independent counsel, the Directors, including the Independent Directors, concluded that each of the Continued Agreements should be continued through December 31, 2009.
MSF-22
A description of the policies and procedures that the Fund uses to determine how to vote proxies relating to portfolio securities is available (i) without charge, upon request, by calling (800) 638-7732 and (ii) on the Securities and Exchange Commission’s (the “SEC”) website at http://www.sec.gov.
Information regarding how the Fund voted proxies relating to portfolio securities during the most recent twelve-month period ended December 31, 2008 is available (i) without charge, upon request, by calling (800) 638-7732 and (ii) on the SEC’s website at http://www.sec.gov.
The Fund’s Statement of Additional Information includes additional information about the Directors of the Fund and is available (i) without charge, upon request, by calling (800) 638-7732 and (ii) on the SEC’s website at http://www.sec.gov.
The Fund files with the SEC a complete schedule of its portfolio holdings, as of the close of the first and third quarters of its fiscal year, on “Form N-Q”. These filings are available on the SEC’s website at www.sec.gov and may be reviewed and copied at the SEC’s Public Reference Room in Washington, DC. (Call 1-800-SEC-0330 for information on the operation of the Public Reference Room.)
MSF-23
Simplify your life…
with MetLife eDelivery® while helping MetLife preserve the planet’s natural resources.
(see details on inside cover)
| | |
Metropolitan Series Fund, Inc. Oppenheimer Global Equity Portfolio Annual Report | | December 31, 2008 |
NOT PART OF THE ANNUAL REPORT
Letter from the President
February 1, 2009
Letter to Policy Holders:
2008 was an extraordinary year in the capital markets around the world and for the global economy. Energy prices rose to record levels early in the year before falling by two-thirds by year-end. A credit crisis that began with concerns about sub-prime mortgages led to massive changes in the financial landscape with government takeovers, forced sales, and outright failures of a number of large, once venerable firms.
While bonds as measured by the Barclays Capital U.S. Aggregate Bond Index (formerly known as, Lehman Brothers U.S. Aggregate Bond Index) were up 5.2% for the year in response to declining interest rates, there were large differences in the total returns of the various sectors of the bond market. U.S. treasury securities were up over 13% as frightened investors sought refuge in what they perceived to be the safest and most liquid investments. In contrast, investment grade corporate securities lost nearly 5% as credit spreads widened and below investment grade or high yield bonds fell over 26%.
In response to the growing credit crisis and the weakening economy, common stocks fell sharply across all regions, styles, and capitalizations. As measured by the Standard and Poor’s 500, U.S. common stocks fell 37% for the year, the worst calendar year decline since the 1930s. Foreign stocks were down even more with the MSCI EAFE Index down 43% for the year.
On the following pages, you will find a complete review of your Portfolio and its investment performance.
MetLife is committed to building your financial freedom. We appreciate your trust and will continue to focus our efforts on meeting your investment needs.
Sincerely,
Elizabeth M. Forget
President, Metropolitan Series Fund, Inc.
Metropolitan Series Fund, Inc.
Oppenheimer Global Equity Portfolio
Managed by Oppenheimer Funds, Inc.
Portfolio Manager Commentary*
PORTFOLIO PERFORMANCE
For the twelve-month period ended December 31, 2008, the Class A shares of the Oppenheimer Global Equity Portfolio returned -40.4%, compared to its benchmark, the Morgan Stanley Capital International (MSCI) World Index1, which returned -40.7%. The average return of its peer group, the Lipper Variable Insurance Products2 Global Growth Funds Universe, was -43.6% over the same period.
PORTFOLIO REVIEW
In an especially volatile year for the financial markets, the Portfolio outperformed its benchmark, the MSCI World Index, for the twelve months ended 12/31/08. While we are disappointed with the Portfolio’s absolute returns thus far, we believe that the global credit crisis and the ensuing economic slowdown overwhelmed the appropriateness of our strategy.
The fall out in the sub-prime lending markets cascaded into the broader financial markets, negatively impacting many financial firms around the world. Widespread aversion to risk permeated the markets triggering significant declines, as growing uncertainty in the credit markets depressed investors’ confidence across almost any asset dependent on an expected cash flow. Due to this panic, most companies, regardless of their financial stability, saw declines in their stock prices. The financial sector was particularly hit hard, as many firms were forced to sell off debt at deep discounts or swallow hefty write downs. These revaluations, to some virtually unknowable market value, led to outstanding losses for formerly venerable financial institutions.
Our strategy during the reporting period resulted in materials and financials being the most underweighted sectors. We underweighted materials because we viewed commodity prices to be unjustifiably inflated. We believed that that double-digit growth rates in industrial production and infrastructure development of commodities was either unsustainable in large emerging markets or would not continue to offset slowdowns in the developed world. Furthermore, commodity companies, even those in bottom quartile of production costs, were making returns that were a multiple of their costs of capital; this too we believed to be unsustainable.
As for financials, the rationale behind our underweight was the belief that the extreme leverage in financial institutions during a period of high stock prices was a recipe for disaster, the risk of which was not well priced into the market.
In information technology we found opportunity and therefore have an overweight in the sector. We believe the information technology companies we chose to invest in have sustainable business models where demand for their products or services become integral to their customers, where the cost of switching is high and the value added to the customer is many times the cost of the product or service. The companies invested in during the period have excellent balance sheets in what is now a capital short world. However, the economic downturn has hurt information technology stocks, weakening the Portfolio’s performance. We continue to maintain our belief in our current positions and have had very little turnover.
While we will not mention all of the year’s detractors, it is important to mention Ericsson, our largest holding. Ericsson is the world’s leading vendor of mobile telecommunications networks. It enjoys leading market shares in both second and third generation networks and is in an excellent position to be a leader in the fourth generation as well. With the internet going mobile worldwide, the capacity required in these networks is growing manifold and will continue to do so regardless of the rate of economic growth since it has become integral to today’s lifestyle. As the market leader with a market share of about 40%, we believe Ericsson is well positioned to take advantage of this rapid growth. Its margins are also industry leading, with the majority of the competition making low single digit margins at best in their networks business.
Other holdings which hindered performance during the reporting period included American International Group (AIG), Technip SA, Sony Corp, Royal Bank of Scotland Group plc and Credit Suisse Group AG. On the flip side, of our larger holdings, notable successes included Wal-Mart Stores, Inc., Gilead Sciences, Inc., Shionogi & Co. Ltd., McDonald’s Corp and Intuit, Inc. We exited our positions in AIG and Gilead Sciences by reporting period end.
The Portfolio continues to be diversified across a number of geographies. Currently, about one-third of the Portfolio is invested in the U.S., a country that we believe remains the largest and most innovative economy in the world, with stocks priced reasonably. Our second largest geographic weight was Japan, a country whose economy is expansive. Many Japanese companies are reputable and have long track records of significant innovations. Likewise, the Portfolio is invested in the U.K. for the same reasons—it is one of the world’s most open economies and offers extremely high quality companies. Other large markets that the Portfolio had exposure to at period end were Sweden, Germany, and France.
*The views expressed above are those of the subadvisory firm as of December 31, 2008 and are subject to change based on market and other conditions. Information about the Portfolio’s holdings, asset allocation, industry allocation, or country diversification is historical and is not an indication of future Portfolio composition, which will vary. The performance of any index mentioned in this commentary has not been adjusted for ongoing management, distribution and operating expenses, and sales charges applicable to mutual fund investments. Direct investment in any index is not possible.
1 The Morgan Stanley Capital International (MSCI) World® Index is a capitalization weighted index that measures performance of stocks from developed countries around the world.
2 The Lipper Variable Products Fund Average is an average of the total return performance (calculated on the basis of net asset value) of variable product funds with similar investment objectives to those of the subject Portfolio as calculated by Lipper Analytical Services, an independent mutual fund ranking service.
MSF-2
Metropolitan Series Fund, Inc.
Oppenheimer Global Equity Portfolio
A $10,000 INVESTMENT COMPARED TO THE
MSCI WORLD INDEX
Average Annual Returns as of December 31, 2008
| | | | | | | | | | | | |
| | | Oppenheimer Global Equity Portfolio | | | MSCI World Index | |
| | | Class A | | | Class B | | | Class E | | |
| 1 Year | | -40.4 | % | | -40.6 | % | | -40.5 | % | | -40.7 | % |
| 5 Year | | 0.0 | | | — | | | -0.1 | | | -0.5 | |
| 10 Year | | 1.3 | | | — | | | — | | | -0.6 | |
| Since Inception | | — | | | -0.9 | | | -0.5 | | | — | |
Performance numbers are net of all Portfolio expenses but do not include any insurance, sales, or administrative charges of variable annuity or life insurance contracts or any additional expenses that participants in certain eligible qualified plans may bear relating to the operations of their plans. If these charges were included, the returns would be lower.
Inception dates of the Class A, Class B and Class E shares are: 3/3/97, 4/26/04 and 5/1/01, respectively.
This information represents past performance and is not indicative of future results. Investment return and principal value may fluctuate so that shares, upon redemption, may be worth more or less than the original cost.
PORTFOLIO COMPOSITION
as of December 31, 2008
Top Holdings
| | |
| | | % of Total
Net Assets |
Telefonaktiebolaget LM Ericsson (Class B) | | 3.9% |
Roche Holding AG | | 2.9% |
Siemens AG | | 2.6% |
KDDI Corp. | | 2.0% |
Juniper Networks, Inc. | | 1.9% |
Wal-Mart Stores, Inc. | | 1.8% |
SAP AG | | 1.8% |
LVMH Moet Hennessy Louis Vuitton S.A. | | 1.8% |
Hennes & Mauritz AB (Series B) | | 1.8% |
Microsoft Corp. | | 1.7% |
Top Countries
| | |
| | | % of Equity
Market Value |
United States | | 30.8% |
Japan | | 14.5% |
United Kingdom | | 8.5% |
Sweden | | 8.2% |
Germany | | 7.5% |
Switzerland | | 5.5% |
France | | 5.4% |
Netherlands | | 3.3% |
Mexico | | 3.0% |
Taiwan | | 2.1% |
MSF-3
Metropolitan Series Fund, Inc.
Shareholder Expense Example
As a shareholder of the Portfolio, you incur ongoing costs, including management fees; distribution and service (12b-1) fees; and other Portfolio expenses. This example is intended to help you understand your ongoing costs (in dollars) (referred to as “expenses”) of investing in the Portfolio and compare these costs with the ongoing costs of investing in other mutual funds. The example is based on an investment of $1,000 invested at the beginning of the period and held for the entire period, July 1, 2008 through December 31, 2008.
Actual Expenses
The first line for each share class of the Portfolio in the table below provides information about actual account values and actual expenses. You may use the information in this line, together with the amount you invested in the particular share class of the Portfolio, to estimate the expenses that you paid over the period. Simply divide your account value by $1,000 (for example, an $8,600 account value divided by $1,000=8.6), then multiply the result by the number in the first line under the heading entitled “Expenses Paid During Period” to estimate the expenses you paid on your account during this period.
Hypothetical Example for Comparison Purposes
The second line for each share class of the Portfolio in the table below provides information about hypothetical account values and hypothetical expenses based on the Portfolio’s actual expense ratio and an assumed rate of return of 5% per year before expenses, which is not the Portfolio’s actual return. The hypothetical account values and expenses may not be used to estimate the actual ending account balance or expenses you paid for the period. You may use this information to compare the ongoing costs of investing in the Portfolio and other funds. To do so, compare this 5% hypothetical example with the 5% hypothetical examples that appear in the shareholder reports of the other funds.
Please note that the expenses shown in the table are meant to highlight your ongoing costs only and do not reflect any fees or charges of your variable insurance product or any additional expenses that participants in certain eligible qualified plans may bear relating to the operations of their plan. Therefore, the second line for each share class in the table is useful in comparing ongoing costs only, and will not help you determine the relative total costs of owning different funds. In addition, if these other costs were included, your costs would have been higher.
| | | | | | | | | | | | | | |
Portfolio | | | | Annualized
Expense
Ratio | | | Beginning
Account Value
July 1,
2008 | | Ending
Account Value
December 31,
2008 | | Expenses Paid
During Period*
July 1, 2008
to
December 31,
2008 |
Oppenheimer Global Equity—Class A | | Actual | | 0.61 | % | | $ | 1,000.00 | | $ | 688.94 | | $ | 2.59 |
| | Hypothetical | | 0.61 | % | | $ | 1,000.00 | | $ | 1,022.03 | | $ | 3.10 |
| | | | | |
Oppenheimer Global Equity—Class B | | Actual | | 0.86 | % | | $ | 1,000.00 | | $ | 687.59 | | $ | 3.65 |
| | Hypothetical | | 0.86 | % | | $ | 1,000.00 | | $ | 1,020.76 | | $ | 4.37 |
| | | | | |
Oppenheimer Global Equity—Class E | | Actual | | 0.76 | % | | $ | 1,000.00 | | $ | 688.07 | | $ | 3.22 |
| | Hypothetical | | 0.76 | % | | $ | 1,000.00 | | $ | 1,021.27 | | $ | 3.86 |
* Expenses paid are equal to the Portfolio’s annualized expense ratio for the most recent six month period, as shown above, multiplied by the average account value over the period, multiplied by the number of days in the most recent fiscal half-year, divided by 366 (to reflect the the one-half year period).
MSF-4
Metropolitan Series Fund, Inc.
Oppenheimer Global Equity Portfolio
Schedule of Investments as of December 31, 2008
Common Stock—96.3% of Total Net Assets
| | | | | | |
| Security Description | | Shares | | Value* |
| | | | | | |
| | |
Australia—0.1% | | | | | | |
Aristocrat Leisure, Ltd. (a) | | $ | 112,400 | | $ | 310,570 |
| | | | | | |
| | |
Brazil—1.4% | | | | | | |
Companhia de Bebidas das Americas (ADR) (a) | | | 89,250 | | | 3,954,668 |
Empresa Brasileira de Aeronautica S.A. (ADR) | | | 216,810 | | | 3,514,490 |
| | | | | | |
| | | | | | 7,469,158 |
| | | | | | |
| | |
Canada—1.1% | | | | | | |
Husky Energy, Inc. (b) | | | 229,200 | | | 5,731,393 |
| | | | | | |
| | |
Cayman Islands—0.3% | | | | | | |
XL Capital, Ltd. (Class A) | | | 366,510 | | | 1,356,087 |
| | | | | | |
| | |
Finland—0.9% | | | | | | |
Fortum Oyj | | | 225,980 | | | 4,853,912 |
| | | | | | |
| | |
France—5.3% | | | | | | |
LVMH Moet Hennessy Louis Vuitton S.A. (a) | | | 138,041 | | | 9,274,441 |
NicOx S.A. (a) (b) | | | 54,205 | | | 591,948 |
Sanofi-Aventis S.A. (a) | | | 85,242 | | | 5,414,051 |
Société Générale | | | 63,191 | | | 3,200,468 |
Technip S.A. | | | 142,070 | | | 4,352,465 |
Total S.A. | | | 90,058 | | | 4,909,752 |
| | | | | | |
| | | | | | 27,743,125 |
| | | | | | |
| | |
Germany—6.6% | | | | | | |
Allianz SE | | | 68,658 | | | 7,364,125 |
Bayerische Motoren Werke AG (a) | | | 156,170 | | | 4,800,485 |
SAP AG | | | 259,344 | | | 9,294,663 |
Siemens AG | | | 180,607 | | | 13,527,547 |
| | | | | | |
| | | | | | 34,986,820 |
| | | | | | |
| | |
India—2.1% | | | | | | |
Dish TV India, Ltd. (b) | | | 631,114 | | | 262,399 |
Hindustan Lever, Ltd. | | | 248,700 | | | 1,282,658 |
ICICI Bank, Ltd. (ADR) | | | 2,430 | | | 46,778 |
Infosys Technologies, Ltd. | | | 302,726 | | | 7,014,544 |
Wire & Wireless India, Ltd. (b) | | | 588,030 | | | 150,174 |
Zee Telefilms, Ltd. | | | 703,060 | | | 2,038,464 |
| | | | | | |
| | | | | | 10,795,017 |
| | | | | | |
| | |
Italy—1.1% | | | | | | |
Bulgari S.p.A. (a) | | | 458,300 | | | 2,861,388 |
Tod’s S.p.A. | | | 75,600 | | | 3,184,031 |
| | | | | | |
| | | | | | 6,045,419 |
| | | | | | |
| | |
Japan—14.2% | | | | | | |
Fanuc, Ltd. | | | 30,400 | | | 2,162,019 |
Hoya Corp. | | | 248,000 | | | 4,308,216 |
KDDI Corp. | | | 1,452 | | | 10,341,708 |
Keyence Corp. (a) | | | 24,500 | | | 5,016,525 |
Kyocera Corp. | | | 38,800 | | | 2,799,030 |
Mitsubishi Electric Corp. | | | 410,000 | | | 2,565,657 |
Murata Manufacturing Co., Ltd. (a) | | | 150,600 | | | 5,903,496 |
Nidec Corp. | | | 40,200 | | | 1,563,286 |
| | | | | |
| Security Description | | Shares | | Value* |
| | | | | |
| | |
Japan—(Continued) | | | | | |
Nintendo Co., Ltd. | | 12,000 | | $ | 4,610,339 |
Secom Co., Ltd. | | 95,900 | | | 4,939,678 |
Sega Sammy Holdings, Inc. (a) | | 146,700 | | | 1,702,270 |
Seven & I Holdings Co., Ltd. | | 121,291 | | | 4,155,397 |
Shionogi & Co., Ltd. | | 196,000 | | | 5,034,253 |
Sony Corp. (a) | | 346,528 | | | 7,533,178 |
Sony Financial Holdings, Inc. | | 595 | | | 2,284,922 |
Sumitomo Mitsui Financial Group, Inc. (a) | | 1,312 | | | 5,683,270 |
Toyota Motor Corp. | | 132,800 | | | 4,346,920 |
| | | | | |
| | | | | 74,950,164 |
| | | | | |
| | |
Mexico—1.7% | | | | | |
Grupo Modelo S.A. de C.V. (a) | | 920,510 | | | 2,924,680 |
Grupo Televisa S.A. (ADR) | | 420,670 | | | 6,284,810 |
| | | | | |
| | | | | 9,209,490 |
| | | | | |
| | |
Netherlands—3.2% | | | | | |
European Aeronautic Defense & Space Co. NV (a) | | 366,897 | | | 6,194,313 |
Koninklijke Philips Electronics NV | | 341,348 | | | 6,638,870 |
TNT NV | | 220,400 | | | 4,233,048 |
| | | | | |
| | | | | 17,066,231 |
| | | | | |
| | |
Norway—0.6% | | | | | |
Tandberg ASA (a) | | 272,070 | | | 2,994,960 |
| | | | | |
| | |
Panama—1.3% | | | | | |
Carnival Corp. (b) | | 281,070 | | | 6,835,622 |
| | | | | |
| | |
South Korea—0.5% | | | | | |
SK Telecom Co., Ltd. (ADR) | | 147,940 | | | 2,689,549 |
| | | | | |
| | |
Spain—1.5% | | | | | |
Inditex S.A. (a) | | 178,390 | | | 7,885,073 |
| | | | | |
| | |
Sweden—8.1% | | | | | |
Assa Abloy AB (Series B) (a) | | 626,600 | | | 7,109,698 |
Hennes & Mauritz AB (Series B) (a) | | 236,710 | | | 9,249,691 |
Investor AB | | 379,225 | | | 5,706,763 |
Telefonaktiebolaget LM Ericsson (Class B) (a) | | 2,685,396 | | | 20,595,665 |
| | | | | |
| | | | | 42,661,817 |
| | | | | |
| | |
Switzerland—5.4% | | | | | |
Basilea Pharmaceutica (a) (b) | | 7,311 | | | 1,031,583 |
Credit Suisse Group | | 265,732 | | | 7,283,513 |
Roche Holding AG | | 99,389 | | | 15,299,316 |
Transocean, Ltd. | | 98,558 | | | 4,656,865 |
| | | | | |
| | | | | 28,271,277 |
| | | | | |
| | |
Taiwan—2.1% | | | | | |
MediaTek, Inc. | | 660,379 | | | 4,461,003 |
Taiwan Semiconductor Manufacturing Co., Ltd. | | 3,151,024 | | | 4,312,902 |
Taiwan Semiconductor Manufacturing Co., Ltd. (ADR) | | 255,619 | | | 2,019,390 |
| | | | | |
| | | | | 10,793,295 |
| | | | | |
*See accompanying notes to financial statements.
MSF-5
Metropolitan Series Fund, Inc.
Oppenheimer Global Equity Portfolio
Schedule of Investments as of December 31, 2008
Common Stock—(Continued)
| | | | | |
| Security Description | | Shares | | Value* |
| | | | | |
| | |
Turkey—0.3% | | | | | |
Turkcell Iletisim Hizmet AS (ADR) (a) (b) | | 125,485 | | $ | 1,829,571 |
| | | | | |
| | |
United Kingdom—8.3% | | | | | |
3i Group, Plc. | | 270,540 | | | 1,065,807 |
BP, Plc. (ADR) (a) | | 107,650 | | | 5,031,561 |
Burberry Group, Plc. (a) | | 377,223 | | | 1,209,833 |
Cadbury, Plc. | | 516,558 | | | 4,521,989 |
Diageo, Plc. | | 237,032 | | | 3,297,240 |
HSBC Holdings, Plc. | | 646,457 | | | 6,205,532 |
Prudential, Plc. | | 691,902 | | | 4,212,444 |
Reckitt Benckiser Group, Plc. | | 150,458 | | | 5,605,226 |
Royal Bank of Scotland Group, Plc. | | 1,857,136 | | | 1,342,541 |
RT Group, Plc. (c) (d) (e) | | 282,264 | | | 0 |
Tesco, Plc. | | 1,151,559 | | | 5,999,520 |
Vodafone Group, Plc. | | 2,634,391 | | | 5,303,329 |
| | | | | |
| | | | | 43,795,022 |
| | | | | |
| | |
United States—30.2% | | | | | |
3M Co. | | 120,470 | | | 6,931,844 |
Acadia Pharmaceuticals, Inc. (a) (b) | | 82,900 | | | 74,610 |
Adobe Systems, Inc. (b) | | 314,470 | | | 6,695,066 |
Aetna, Inc. | | 179,400 | | | 5,112,900 |
Aflac, Inc. | | 138,700 | | | 6,358,008 |
Altera Corp. | | 329,030 | | | 5,498,091 |
Automatic Data Processing, Inc. (a) | | 225,510 | | | 8,871,564 |
Boeing Co. | | 60,760 | | | 2,592,629 |
Citigroup, Inc. | | 157,500 | | | 1,056,825 |
CME Group, Inc. | | 2,600 | | | 541,086 |
Colgate-Palmolive Co. | | 97,500 | | | 6,682,650 |
Corning, Inc. | | 471,010 | | | 4,488,725 |
Cree, Inc. (a) (b) | | 142,040 | | | 2,254,175 |
eBay, Inc. (b) | | 535,630 | | | 7,477,395 |
Emerson Electric Co. | | 116,100 | | | 4,250,421 |
InterMune, Inc. (a) (b) | | 76,200 | | | 806,196 |
International Game Technology (a) | | 117,270 | | | 1,394,340 |
Intuit, Inc. (a) (b) | | 372,620 | | | 8,864,630 |
Juniper Networks, Inc. (a) (b) | | 568,300 | | | 9,950,933 |
Linear Technology Corp. (a) | | 130,410 | | | 2,884,669 |
Lockheed Martin Corp. | | 43,680 | | | 3,672,614 |
Maxim Integrated Products, Inc. | | 321,590 | | | 3,672,558 |
McDonald’s Corp. | | 134,500 | | | 8,364,555 |
Microsoft Corp. | | 468,360 | | | 9,104,919 |
Northrop Grumman Corp. | | 59,230 | | | 2,667,719 |
Raytheon Co. (a) | | 106,350 | | | 5,428,104 |
Regeneron Pharmaceuticals, Inc. (a) (b) | | 48,890 | | | 897,620 |
Seattle Genetics, Inc. (a) (b) | | 142,526 | | | 1,274,183 |
Shuffle Master, Inc. (a) (b) | | 147,300 | | | 730,608 |
SIRIUS XM Radio, Inc. (a) | | 3,213,660 | | | 385,639 |
SLM Corp. (b) | | 494,200 | | | 4,398,380 |
The Walt Disney Co. | | 322,660 | | | 7,321,155 |
Theravance, Inc. (a) (b) | | 125,780 | | | 1,558,414 |
Tiffany & Co. (a) | | 217,700 | | | 5,144,251 |
Wal-Mart Stores, Inc. | | 167,610 | | | 9,396,217 |
WellPoint, Inc. (b) | | 47,400 | | | 1,996,962 |
| | | | | |
| | | | | 158,800,655 |
| | | | | |
Total Common Stock
(Identified Cost $759,405,814) | | | | | 507,074,227 |
| | | | | |
| | | | | | | |
| | |
| Units—1.2% | | | | | | | |
| Security Description | | Shares | | Value* | |
| | |
Mexico—1.2% | | | | | | | |
Fomento Economico Mexicano S.A. de C.V. (a) | | | 2,083,260 | | $ | 6,227,892 | |
| | | | | | | |
Total Units
(Identified Cost $6,061,994) | | | | | | 6,227,892 | |
| | | | | | | |
| | |
| Preferred Stock—0.8% | | | | | | | |
| | |
Germany—0.7% | | | | | | | |
Bayerische Motoren Werke AG | | | 56,190 | | | 1,103,827 | |
Porsche AG (a) | | | 33,609 | | | 2,618,307 | |
| | | | | | | |
| | | | | | 3,722,134 | |
| | | | | | | |
| | |
United States—0.1% | | | | | | | |
Schering-Plough Corp. | | | 2,250 | | | 392,625 | |
| | | | | | | |
Total Preferred Stock
(Identified Cost $6,796,178) | | | | | | 4,114,759 | |
| | | | | | | |
| |
| Fixed Income—Convertible—0.1% | | | | |
| Security Description | | Face
Amount | | Value* | |
| | |
United States—0.1% | | | | | | | |
Theravance, Inc.
3.000%, 01/15/15 | | $ | 699,000 | | | 428,138 | |
| | | | | | | |
Total Fixed Income—Convertible
(Identified Cost $699,000) | | | | | | 428,138 | |
| | | | | | | |
| |
| Rights—0.0% | | | | |
| Security Description | | Shares | | Value* | |
| | |
India—0.0% | | | | | | | |
Dish TV India, Ltd. (b) (c) (e) | | | 722,507 | | | 0 | |
| | | | | | | |
Total Rights
(Identified Cost $0) | | | | | | 0 | |
| | | | | | | |
| |
| Short Term Investments—13.8% | | | | |
| Security Description | | Shares/Face
Amount | | Value* | |
| | |
United States—13.8% | | | | | | | |
State Street Navigator Securities Lending Prime Portfolio (f) | | | 64,971,099 | | | 64,971,099 | |
State Street Repurchase Agreement dated 12/31/08 at 0.010% to be repurchased at $7,467,004 on 01/02/09, collateralized by $7,620,000 U.S. Treasury Bill due 02/19/09 with a value of $7,620,000. | | $ | 7,467,000 | | | 7,467,000 | |
| | | | | | | |
Total Short Term Investments
(Identified Cost $72,438,099) | | | | | | 72,438,099 | |
| | | | | | | |
Total Investments—112.2%
(Identified Cost $845,401,085) (g) | | | | | | 590,283,115 | |
Liabilities in excess of other assets | | | | | | (64,044,864 | ) |
| | | | | | | |
| Total Net Assets—100% | | | | | $ | 526,238,251 | |
| | | | | | | |
*See accompanying notes to financial statements.
MSF-6
Metropolitan Series Fund, Inc.
Oppenheimer Global Equity Portfolio
Schedule of Investments as of December 31, 2008
| (a) | A portion or all of the security was on loan. As of December 31, 2008, the market value of securities loaned was $60,389,593 and the collateral received consisted of cash in the amount of $64,971,099. The cash collateral is invested in a money market fund managed by an affiliate of the custodian. |
| (c) | Security was valued in good faith under procedures established by the Board of Directors. |
| (d) | Non-Income Producing; issuer filed under Chapter 11 of the Federal Bankruptcy Code. |
| (f) | Represents investment of cash collateral received from securities lending transactions. |
| (g) | The aggregate cost of investments for federal income tax purposes as of December 31, 2008 was $848,287,904 and the composition of unrealized appreciation and depreciation of investment securities was $11,944,713 and $(269,949,502), respectively. |
| (ADR)— | An American Depositary Receipt is a certificate issued by a custodian bank representing the right to receive securities of the foreign issuer described. Trading on exchanges not located in the United States or Canada significantly influences the value of ADRs. |
| | |
Ten Largest Industries as of
December 31, 2008 (Unaudited) | | Percentage of
Total Net Assets |
Semiconductors & Semiconductor Equipment | | 7.8% |
Software | | 7.3% |
Communications Equipment | | 6.7% |
Food & Staples Retailing | | 4.6% |
Aerospace & Defense | | 4.6% |
Specialty Retail | | 4.6% |
Commercial Banks | | 4.5% |
Industrial Conglomerates | | 4.1% |
Oil, Gas & Consumable Fuels | | 3.9% |
Wireless Telecommunication Services | | 3.8% |
The Portfolio adopted the provisions of Statement of Financial Accounting Standards No. 157, “Fair Value Measurements” (FAS 157), effective with the beginning of the Portfolio’s fiscal year. FAS 157 establishes a framework for measuring fair value and expands disclosures about fair value measurements in financial statements. The three levels of the hierarchy under FAS 157 are described below:
Level 1 - quoted prices in active markets for identical securities
Level 2 - other significant observable inputs (including quoted prices for similar securities, interest rates, credit risk, etc.)
Level 3 - significant unobservable inputs (including the Portfolio’s own assumptions in determining the fair value of investments)
The inputs or methodology used for valuing securities are not necessarily an indication of the risk associated with investing in those securities.
The following is a summary of the inputs used to value the Portfolio’s net assets as of December 31, 2008:
| | | | | | |
| Valuation Inputs | | Investments In
Securities | | Other Financial
Instruments* |
Level 1 - Quoted Prices | | $ | 262,383,771 | | $ | 0 |
Level 2 - Other Significant Observable Inputs | | | 327,899,344 | | | 0 |
Level 3 - Significant Unobservable Inputs | | | 0 | | | 0 |
Total | | $ | 590,283,115 | | $ | 0 |
* Other financial instruments are derivative instruments not reflected in the Schedule of Investments, such as futures, forwards, swap contracts and written options, which are valued based on the unrealized appreciation/depreciation on the instrument.
*See accompanying notes to financial statements.
MSF-7
Metropolitan Series Fund, Inc.
Oppenheimer Global Equity Portfolio
Statement of Assets & Liabilities
December 31, 2008
| | | | | | | |
Assets | | | | | | | |
Investments at value (a) (b) | | | | | $ | 590,283,115 | |
Cash | | | | | | 360 | |
Foreign cash at value (c) | | | | | | 1,351,717 | |
Receivable for: | | | | | | | |
Securities sold | | | | | | 49,581 | |
Fund shares sold | | | | | | 113,447 | |
Accrued interest and dividends | | | | | | 682,968 | |
Foreign taxes | | | | | | 27,013 | |
| | | | | | | |
Total Assets | | | | | | 592,508,201 | |
Liabilities | | | | | | | |
Payable for: | | | | | | | |
Securities purchased | | $ | 780,112 | | | | |
Fund shares redeemed | | | 176,144 | | | | |
Withholding taxes | | | 14,670 | | | | |
Collateral for securities loaned | | | 64,971,099 | | | | |
Accrued expenses: | | | | | | | |
Management fees | | | 231,622 | | | | |
Service and distribution fees | | | 34,898 | | | | |
Other expenses | | | 61,405 | | | | |
| | | | | | | |
Total Liabilities | | | | | | 66,269,950 | |
| | | | | | | |
Net Assets | | | | | $ | 526,238,251 | |
| | | | | | | |
Net assets consists of: | | | | | | | |
Capital paid in | | | | | $ | 795,243,460 | |
Undistributed net investment income | | | | | | 13,914,971 | |
Accumulated net realized losses | | | | | | (27,805,580 | ) |
Unrealized depreciation on investments and foreign currency | | | | | | (255,114,600 | ) |
| | | | | | | |
Net Assets | | | | | $ | 526,238,251 | |
| | | | | | | |
| Computation of offering price: | | | | | | | |
Class A | | | | | | | |
Net asset value and redemption price per share ($349,028,929 divided by 35,271,722 shares outstanding) | | | | | $ | 9.90 | |
| | | | | | | |
Class B | | | | | | | |
Net asset value and redemption price per share ($166,044,793 divided by 16,838,541 shares outstanding) | | | | | $ | 9.86 | |
| | | | | | | |
Class E | | | | | | | |
Net asset value and redemption price per share ($11,164,529 divided by 1,132,148 shares outstanding) | | | | | $ | 9.86 | |
| | | | | | | |
(a) Identified cost of investments | | | | | $ | 845,401,085 | |
| | | | | | | |
(b) Includes cash collateral for securities loaned of | | | | | $ | 64,971,099 | |
| | | | | | | |
(c) Identified cost of foreign cash | | | | | $ | 1,348,729 | |
| | | | | | | |
Statement of Operations
For the Year Ended December 31, 2008
| | | | | | | | |
Investment Income | | | | | | | | |
Dividends | | | | | | $ | 18,742,261 | (a) |
Interest | | | | | | | 2,352,072 | (b) |
| | | | | | | | |
| | | | | | | 21,094,333 | |
Expenses | | | | | | | | |
Management fees | | $ | 3,970,890 | | | | | |
Service and distribution fees—Class B | | | 585,331 | | | | | |
Service and distribution fees—Class E | | | 26,580 | | | | | |
Directors’ fees and expenses | | | 31,907 | | | | | |
Custodian | | | 394,848 | | | | | |
Audit and tax services | | | 42,955 | | | | | |
Legal | | | 12,448 | | | | | |
Printing | | | 161,014 | | | | | |
Insurance | | | 11,142 | | | | | |
Miscellaneous | | | 23,747 | | | | | |
| | | | | | | | |
Total expenses | | | | | | | 5,260,862 | |
| | | | | | | | |
Net Investment Income | | | | | | | 15,833,471 | |
| | | | | | | | |
Realized and Unrealized Loss | | | | | | | | |
| Realized gain (loss) on: | | | | | | | | |
Investments—net | | | (26,630,168 | ) | | | | |
Futures contracts—net | | | 68,755 | | | | | |
Foreign currency transactions—net | | | 1,272,047 | | | | (25,289,366 | ) |
| | | | | | | | |
| Change in unrealized depreciation on: | | | | | | | | |
Investments—net | | | (368,615,604 | ) | | | | |
Foreign currency transactions—net | | | (2,129 | ) | | | (368,617,733 | ) |
| | | | | | | | |
Net loss | | | | | | | (393,907,099 | ) |
| | | | | | | | |
Net Decrease in Net Assets From Operations | | | | | | $ | (378,073,628 | ) |
| | | | | | | | |
| (a) | Net of foreign taxes of $1,535,985. |
| (b) | Includes income on securities loaned of $2,283,596. |
See accompanying notes to financial statements.
MSF-8
Metropolitan Series Fund, Inc.
Oppenheimer Global Equity Portfolio
Statements of Changes in Net Assets
| | | | | | | | |
| | | Year ended
December 31,
2008 | | | Year ended
December 31,
2007 | |
From Operations | | | | | | | | |
Net investment income | | $ | 15,833,471 | | | $ | 10,939,775 | |
Net realized gain (loss) | | | (25,289,366 | ) | | | 31,534,845 | |
Unrealized appreciation (depreciation) | | | (368,617,733 | ) | | | 16,693,027 | |
| | | | | | | | |
Increase (decrease) in net assets from operations | | | (378,073,628 | ) | | | 59,167,647 | |
| | | | | | | | |
From Distributions to Shareholders | | | | | | | | |
Net investment income | | | | | | | | |
Class A | | | (11,146,915 | ) | | | (7,335,264 | ) |
Class B | | | (4,193,822 | ) | | | (2,440,729 | ) |
Class E | | | (369,402 | ) | | | (241,497 | ) |
| | | | | | | | |
| | | (15,710,139 | ) | | | (10,017,490 | ) |
| | | | | | | | |
Net realized gain | | | | | | | | |
Class A | | | (19,263,601 | ) | | | (9,569,355 | ) |
Class B | | | (8,450,946 | ) | | | (4,046,887 | ) |
Class E | | | (697,035 | ) | | | (358,756 | ) |
| | | | | | | | |
| | | (28,411,582 | ) | | | (13,974,998 | ) |
| | | | | | | | |
Total distributions | | | (44,121,721 | ) | | | (23,992,488 | ) |
| | | | | | | | |
Decrease in net assets from capital share transactions | | | (15,386,735 | ) | | | (4,231,804 | ) |
| | | | | | | | |
Net increase (decrease) in net assets | | | (437,582,084 | ) | | | 30,943,355 | |
| | |
Net Assets | | | | | | | | |
Beginning of the period | | | 963,820,335 | | | | 932,876,980 | |
| | | | | | | | |
End of the period | | $ | 526,238,251 | | | $ | 963,820,335 | |
| | | | | | | | |
Undistributed Net Investment Income | | | | | | | | |
End of the period | | $ | 13,914,971 | | | $ | 12,317,160 | |
| | | | | | | | |
Other Information:
Capital Shares
Transactions in capital shares were as follows:
| | | | | | | | | | | | | | |
| | | Year ended
December 31, 2008 | | | Year ended
December 31, 2007 | |
| | | Shares | | | $ | | | Shares | | | $ | |
Class A | | | | | | | | | | | | | | |
Sales | | 1,794,157 | | | $ | 25,364,068 | | | 4,194,704 | | | $ | 73,742,074 | |
Reinvestments | | 1,953,148 | | | | 30,410,516 | | | 967,637 | | | | 16,904,619 | |
Redemptions | | (5,836,665 | ) | | | (79,066,291 | ) | | (6,228,657 | ) | | | (109,336,843 | ) |
| | | | | | | | | | | | | | |
Net decrease | | (2,089,360 | ) | | $ | (23,291,707 | ) | | (1,066,316 | ) | | $ | (18,690,150 | ) |
| | | | | | | | | | | | | | |
Class B | | | | | | | | | | | | | | |
Sales | | 4,256,389 | | | $ | 61,415,885 | | | 3,442,632 | | | $ | 60,341,810 | |
Reinvestments | | 813,692 | | | | 12,644,768 | | | 371,996 | | | | 6,487,616 | |
Redemptions | | (4,580,034 | ) | | | (62,273,005 | ) | | (2,968,518 | ) | | | (52,002,112 | ) |
| | | | | | | | | | | | | | |
Net increase | | 490,047 | | | $ | 11,787,648 | | | 846,110 | | | $ | 14,827,314 | |
| | | | | | | | | | | | | | |
Class E | | | | | | | | | | | | | | |
Sales | | 127,934 | | | $ | 1,760,228 | | | 267,137 | | | $ | 4,723,139 | |
Reinvestments | | 68,669 | | | | 1,066,437 | | | 34,438 | | | | 600,253 | |
Redemptions | | (485,811 | ) | | | (6,709,341 | ) | | (326,485 | ) | | | (5,692,360 | ) |
| | | | | | | | | | | | | | |
Net decrease | | (289,208 | ) | | $ | (3,882,676 | ) | | (24,910 | ) | | $ | (368,968 | ) |
| | | | | | | | | | | | | | |
Decrease derived from capital share transactions | | | | | $ | (15,386,735 | ) | | | | | $ | (4,231,804 | ) |
| | | | | | | | | | | | | | |
See accompanying notes to financial statements.
MSF-9
Metropolitan Series Fund, Inc.
Oppenheimer Global Equity Portfolio
Financial Highlights
| | | | | | | | | | | | | | | | | | | | |
| | | Class A | |
| | | Year ended December 31, | |
| | | 2008 | | | 2007 | | | 2006 | | | 2005 | | | 2004 | |
Net Asset Value, Beginning of Period | | $ | 17.50 | | | $ | 16.86 | | | $ | 15.11 | | | $ | 13.09 | | | $ | 11.43 | |
| | | | | | | | | | | | | | | | | | | | |
Income From Investment Operations | | | | | | | | | | | | | | | | | | | | |
Net investment income | | | 0.30 | (a) | | | 0.21 | (a) | | | 0.21 | (a) | | | 0.12 | | | | 0.11 | |
Net realized and unrealized gain (loss) of investments | | | (7.06 | ) | | | 0.89 | | | | 2.26 | | | | 1.98 | | | | 1.74 | |
| | | | | | | | | | | | | | | | | | | | |
Total from investment operations | | | (6.76 | ) | | | 1.10 | | | | 2.47 | | | | 2.10 | | | | 1.85 | |
| | | | | | | | | | | | | | | | | | | | |
Less Distributions | | | | | | | | | | | | | | | | | | | | |
Distributions from net investment income | | | (0.31 | ) | | | (0.20 | ) | | | (0.41 | ) | | | (0.08 | ) | | | (0.19 | ) |
Distributions from net realized capital gains | | | (0.53 | ) | | | (0.26 | ) | | | (0.31 | ) | | | 0.00 | | | | 0.00 | |
| | | | | | | | | | | | | | | | | | | | |
Total distributions | | | (0.84 | ) | | | (0.46 | ) | | | (0.72 | ) | | | (0.08 | ) | | | (0.19 | ) |
| | | | | | | | | | | | | | | | | | | | |
Net Asset Value, End of Period | | $ | 9.90 | | | $ | 17.50 | | | $ | 16.86 | | | $ | 15.11 | | | $ | 13.09 | |
| | | | | | | | | | | | | | | | | | | | |
Total Return (%) | | | (40.4 | ) | | | 6.5 | | | | 16.6 | | | | 16.2 | | | | 16.4 | |
Ratio of operating expenses to average net assets (%) | | | 0.61 | | | | 0.61 | | | | 0.66 | | | | 0.93 | | | | 0.81 | |
Ratio of net investment income to average net assets (%) | | | 2.16 | | | | 1.19 | | | | 1.37 | | | | 0.87 | | | | 0.95 | |
Portfolio turnover rate (%) | | | 20 | | | | 17 | | | | 73 | | | | 115 | | | | 79 | |
Net assets, end of period (000) | | $ | 349,029 | | | $ | 653,910 | | | $ | 648,024 | | | $ | 226,037 | | | $ | 195,181 | |
| | | | | | | | | | | | | | | | | | | | |
| | | Class B | |
| | | Year ended December 31, | |
| | | 2008 | | | 2007 | | | 2006 | | | 2005 | | | 2004(b) | |
Net Asset Value, Beginning of Period | | $ | 17.44 | | | $ | 16.81 | | | $ | 15.06 | | | $ | 13.04 | | | $ | 11.59 | |
| | | | | | | | | | | | | | | | | | | | |
Income From Investment Operations | | | | | | | | | | | | | | | | | | | | |
Net investment income | | | 0.26 | (a) | | | 0.16 | (a) | | | 0.17 | (a) | | | 0.05 | | | | 0.02 | |
Net realized and unrealized gain (loss) of investments | | | (7.04 | ) | | | 0.89 | | | | 2.25 | | | | 2.02 | | | | 1.43 | |
| | | | | | | | | | | | | | | | | | | | |
Total from investment operations | | | (6.78 | ) | | | 1.05 | | | | 2.42 | | | | 2.07 | | | | 1.45 | |
| | | | | | | | | | | | | | | | | | | | |
Less Distributions | | | | | | | | | | | | | | | | | | | | |
Distributions from net investment income | | | (0.27 | ) | | | (0.16 | ) | | | (0.36 | ) | | | (0.05 | ) | | | 0.00 | |
Distributions from net realized capital gains | | | (0.53 | ) | | | (0.26 | ) | | | (0.31 | ) | | | 0.00 | | | | 0.00 | |
| | | | | | | | | | | | | | | | | | | | |
Total distributions | | | (0.80 | ) | | | (0.42 | ) | | | (0.67 | ) | | | (0.05 | ) | | | 0.00 | |
| | | | | | | | | | | | | | | | | | | | |
Net Asset Value, End of Period | | $ | 9.86 | | | $ | 17.44 | | | $ | 16.81 | | | $ | 15.06 | | | $ | 13.04 | |
| | | | | | | | | | | | | | | | | | | | |
Total Return (%) | | | (40.6 | ) | | | 6.3 | | | | 16.4 | | | | 16.0 | | | | 12.5 | (c) |
Ratio of operating expenses to average net assets (%) | | | 0.86 | | | | 0.86 | | | | 0.91 | | | | 1.18 | | | | 1.06 | (d) |
Ratio of net investment income to average net assets (%) | | | 1.91 | | | | 0.94 | | | | 1.09 | | | | 0.53 | | | | 0.54 | (d) |
Portfolio turnover rate (%) | | | 20 | | | | 17 | | | | 73 | | | | 115 | | | | 79 | |
Net assets, end of period (000) | | $ | 166,045 | | | $ | 285,118 | | | $ | 260,542 | | | $ | 27,790 | | | $ | 3,646 | |
| Please | see following page for Financial Highlights footnote legend. |
See accompanying notes to financial statements.
MSF-10
Metropolitan Series Fund, Inc.
Oppenheimer Global Equity Portfolio
Financial Highlights
| | | | | | | | | | | | | | | | | | | | |
| | | Class E | |
| | | Year ended December 31, | |
| | | 2008 | | | 2007 | | | 2006 | | | 2005 | | | 2004 | |
Net Asset Value, Beginning of Period | | $ | 17.44 | | | $ | 16.81 | | | $ | 15.06 | | | $ | 13.04 | | | $ | 11.40 | |
| | | | | | | | | | | | | | | | | | | | |
Income From Investment Operations | | | | | | | | | | | | | | | | | | | | |
Net investment income | | | 0.28 | (a) | | | 0.18 | (a) | | | 0.18 | (a) | | | 0.11 | | | | 0.11 | |
Net realized and unrealized gain (loss) of investments | | | (7.05 | ) | | | 0.88 | | | | 2.27 | | | | 1.97 | | | | 1.71 | |
| | | | | | | | | | | | | | | | | | | | |
Total from investment operations | | | (6.77 | ) | | | 1.06 | | | | 2.45 | | | | 2.08 | | | | 1.82 | |
| | | | | | | | | | | | | | | | | | | | |
Less Distributions | | | | | | | | | | | | | | | | | | | | |
Distributions from net investment income | | | (0.28 | ) | | | (0.17 | ) | | | (0.39 | ) | | | (0.06 | ) | | | (0.18 | ) |
Distributions from net realized capital gains | | | (0.53 | ) | | | (0.26 | ) | | | (0.31 | ) | | | 0.00 | | | | 0.00 | |
| | | | | | | | | | | | | | | | | | | | |
Total distributions | | | (0.81 | ) | | | (0.43 | ) | | | (0.70 | ) | | | (0.06 | ) | | | (0.18 | ) |
| | | | | | | | | | | | | | | | | | | | |
Net Asset Value, End of Period | | $ | 9.86 | | | $ | 17.44 | | | $ | 16.81 | | | $ | 15.06 | | | $ | 13.04 | |
| | | | | | | | | | | | | | | | | | | | |
Total Return (%) | | | (40.5 | ) | | | 6.3 | | | | 16.5 | | | | 16.1 | | | | 16.1 | |
Ratio of operating expenses to average net assets (%) | | | 0.76 | | | | 0.76 | | | | 0.81 | | | | 1.08 | | | | 0.96 | |
Ratio of net investment income to average net assets (%) | | | 2.01 | | | | 1.04 | | | | 1.13 | | | | 0.71 | | | | 0.81 | |
Portfolio turnover rate (%) | | | 20 | | | | 17 | | | | 73 | | | | 115 | | | | 79 | |
Net assets, end of period (000) | | $ | 11,165 | | | $ | 24,793 | | | $ | 24,311 | | | $ | 20,674 | | | $ | 15,303 | |
| (a) | Per share amount is based on average shares outstanding during the period. |
| (b) | Commencement of operations was April 26, 2004 for Class B. |
| (c) | Periods less than one year are not computed on an annualized basis. |
| (d) | Computed on an annualized basis. |
See accompanying notes to financial statements.
MSF-11
Metropolitan Series Fund, Inc.
Oppenheimer Global Equity Portfolio
Notes to Financial Statements—December 31, 2008
Metropolitan Series Fund, Inc. (the “Fund”) is organized as a corporation under the laws of Maryland pursuant to Articles of Incorporation filed on November 23, 1982, as amended, and registered under the Investment Company Act of 1940, as amended (the “1940 Act”), as an open-end investment company. The Fund is a “series” type of mutual fund, which issues separate series of stock. Each series represents an interest in a separate portfolio of Fund investments. The Oppenheimer Global Equity Portfolio (the “Portfolio”) is a diversified series of the Fund. Shares in the Fund are not offered directly to the general public and are currently available only to separate accounts established by Metropolitan Life Insurance Company (“MetLife”), New England Life Insurance Company, General American Life Insurance Company (“General American”), The MetLife Investors Group of Insurance Companies, MetLife Insurance Company of Connecticut and other affiliated insurance companies (collectively, the “Insurance Companies”) and to certain eligible qualified retirement plans (“Qualified Plans”), as an investment vehicle for variable life insurance, group annuity or variable annuity products of these insurance companies or Qualified Plans, although the Portfolio is not available to all such separate accounts and Qualified Plans. The Portfolio’s shares may be divided into different classes. Currently, the classes being offered by the Portfolio are named Class A, Class B and Class E. The classes of the Portfolio’s shares are identical, except that certain additional charges (Rule 12b-1 fees) are made against Class B and Class E shares. Investment income, realized and unrealized capital gains and losses, the common expenses of the Portfolio and certain Portfolio-level expense reductions, if any, are allocated daily, on a pro rata basis, to each class based on the relative net assets of each class to the total net assets of the Portfolio.
| 2. | SIGNIFICANT ACCOUNTING POLICIES: |
The preparation of financial statements in conformity with accounting principles generally accepted in the United States of America (“GAAP”) requires management to make estimates and assumptions that affect the reported amounts of assets and liabilities and disclosure of contingent assets and liabilities as of the date of the financial statements and the reported amounts of income and expenses during the reporting period. Actual results could differ from those estimates.
The following is a summary of significant accounting policies consistently followed by the Portfolio in the preparation of its financial statements. The policies are in conformity with GAAP.
Investment Valuation:
Debt securities (other than short term obligations with a remaining maturity of sixty days or less) are generally valued on the basis of evaluated or composite bid quotations obtained by independent pricing services and/or brokers and dealers selected by the relevant subadviser pursuant to authorization of the Board of Directors of the Fund (the “Board” or “Directors”). Such quotations take into account appropriate factors such as institutional-sized trading in similar groups of securities, yield, quality, coupon rate, maturity, type of issue, trading characteristics and other data. Short term obligations with a remaining maturity of sixty days or less are valued at amortized cost which approximates fair market value.
Equity securities traded on a national securities exchange or other exchanges are valued at their last sale price on the principal trading market. Equity securities traded on the NASDAQ National Market System are valued at the NASDAQ Official Closing Price (the “NOCP”). The NOCP is the last reported sale price if the last reported sale price falls between the spread of the last reported bid and asked prices. If the last reported bid and asked prices are above the last reported sale price, the NOCP will be the last reported bid price. If the last reported bid and asked prices are below the last reported sale price, the NOCP will be the last reported asked price. Equity securities traded on a national securities exchange or other exchanges or on the NASDAQ National Market System for which there is no reported sale during the day are valued at the last reported bid price. A security that is listed or traded on more than one exchange is valued at the quotation on the exchange determined to be the primary market for that security by the Board or its delegates. If no closing price is available, then such securities are valued by using the last reported bid price. Equity securities traded over-the-counter are valued at the last reported sales price.
If no current market value quotation is readily available or reliable for a portfolio security, fair value will be determined in accordance with procedures established by and under the general supervision of the Board. When the Portfolio uses fair value pricing, it may take into account any factors it deems appropriate. The value of securities used by the Portfolio to calculate its net asset value may differ from quoted or published prices for the same securities. Fair value pricing involves subjective judgments and the fair value determined for a security may be materially different than the value that could be realized upon the sale of that security.
MSF-12
Metropolitan Series Fund, Inc.
Oppenheimer Global Equity Portfolio
Notes to Financial Statements—December 31, 2008—(Continued)
The Portfolio expects to use fair value pricing for securities primarily traded on U.S. exchanges only under very limited circumstances. For example, the Portfolio may use fair value pricing if the exchange on which a security is traded closes early or trading in the security is suspended.
Securities traded primarily on an exchange outside of the United States which closes before the close of the New York Stock Exchange will be valued at the last sales price on that non-U.S. exchange. Securities traded primarily on an exchange outside of the United States for which there is no reported sale during the day are valued at the mean between the last reported bid and asked prices. However, because most foreign markets close well before the Portfolio values its securities (typically at 4 p.m. Eastern Time), the earlier close of these foreign markets gives rise to the possibility that significant events, including broad market moves, may have occurred after these foreign markets close but before the Portfolio values its securities. To account for this, the Portfolio may frequently value many of its foreign equity securities using fair value prices based on third party vendor modeling tools.
Forward foreign currency exchange contracts are valued based on the mean between closing bid and asked prices of the forward currency contract rates in the London foreign exchange markets on a daily basis as provided by a reliable bank or dealer.
Options, whether on securities, indices, futures contracts, or otherwise, are valued at the last sales price available as of the close of business on the day of valuation or, if there is no such sale price available, at the mean between the bid and asked prices. Options on currencies are valued at the spot price each day.
The value of futures contracts will be the sum of the margin deposit plus or minus the difference between the value of the futures contract on each day the net asset value is calculated and the value on the date the futures contract originated, value being that established on a recognized commodity exchange, or by reference to other customary sources, with gain or loss being realized when the futures contract closes or expires.
Subject to the Board’s oversight, the Board has delegated the day-to-day oversight of pricing matters, including determinations in good faith under the Fund’s procedures the fair value of securities for which current market quotations are not readily available to MetLife Advisers, LLC (“MetLife Advisers” or the “Adviser”).
Investment Transactions and Related Investment Income:
Portfolio security transactions are recorded on the trade date. Dividend income is recorded on the ex-dividend date or, for certain foreign securities, when notified. Interest income, which includes amortization of premium and accretion of discount on debt securities, is recorded on the accrual basis. Realized gains and losses on investments and unrealized appreciation and depreciation are determined on the identified cost basis, which is the same basis used for federal income tax purposes.
Repurchase Agreements:
The Portfolio, through the custodian or a subcustodian, receives delivery of the underlying securities collateralizing repurchase agreements. The Portfolio requires the custodian to take possession, to have legally segregated in the Federal Reserve Book Entry System, or to have segregated within the custodian’s vault, all securities held as collateral for repurchase agreements. It is the Portfolio’s policy that the market value of the collateral be at least equal to 100% of the repurchase price in the case of a repurchase agreement of one-day duration and 102% on all other repurchase agreements. The Portfolio’s subadviser is responsible for determining that the value of the collateral is at all times at least equal to the repurchase price. In connection with transactions in repurchase agreements, if the seller defaults and the value of the collateral declines or if the seller enters an insolvency proceeding, realization of the collateral by the Portfolio may be delayed, limited or wholly denied.
Foreign Currency Translation:
The books and records of the Portfolio are maintained in U.S. dollars. The values of securities, currencies and other assets and liabilities denominated in currencies other than U.S. dollars are translated into U.S. dollars based upon foreign exchange rates prevailing at the end of the period. Purchases and sales of investment securities, income and expenses are translated on the respective dates of such transactions. Since the values of investment securities are presented at the foreign exchange rates prevailing at the end of the period, it is not practical to isolate that portion of the results of operations arising from changes in exchange rates from that portion of the results of operations reflecting fluctuations arising from changes in market prices of the investment securities. Such fluctuations are included in the net realized and unrealized gain or loss on investments.
MSF-13
Metropolitan Series Fund, Inc.
Oppenheimer Global Equity Portfolio
Notes to Financial Statements—December 31, 2008—(Continued)
Net realized foreign exchange gains or losses arise from sales of foreign currency, currency gains or losses realized between the trade and settlement dates on securities transactions, and the difference between the amounts of dividends, interest, and foreign withholding taxes recorded by the Portfolio and the U.S. dollar equivalent of the amounts actually received or paid by the Portfolio. Net unrealized foreign exchange gains and losses arise from changes in the value of assets and liabilities, other than investment securities, resulting from changes in the exchange rate.
Forward Foreign Currency Exchange Contracts:
The Portfolio may enter into forward foreign currency exchange contracts primarily to hedge against foreign currency exchange rate risks on its non-U.S. dollar denominated investment securities. When entering into a forward currency contract, the Portfolio agrees to receive or deliver a fixed quantity of foreign currency for an agreed-upon price on an agreed future date. These contracts are valued daily and the Portfolio’s net equity therein, representing unrealized gain or loss on the contracts as measured by the difference between the foreign exchange rates at the dates of entry into the contracts and the forward rates at the settlement date, is included in the Statement of Assets and Liabilities. Realized and unrealized gains and losses are included in the Statement of Operations. These instruments involve market and/or credit risk in excess of the amount recognized in the Statement of Assets and Liabilities. Risks arise from the possible inability of counterparties to meet the terms of their contracts and from movement in currency and securities values and interest rates.
Futures Contracts:
The Portfolio may buy and sell futures contracts (on recognized exchanges) as a hedge, to maintain exposure to the broad equity markets or to enhance return. Futures contracts are agreements to buy or sell a security, or deliver a final cash settlement price in connection with an index, interest rate, currency, or other contracts not calling for physical delivery, for a set price in the future. The Portfolio must post an amount equal to a portion of the total market value of the futures contract as futures variation margin, which is returned when the Portfolio’s obligations under the contract have been satisfied. From time to time thereafter, the Portfolio may have to post variation margin to maintain this amount as the market value of the contract fluctuates. Risks of entering into futures contracts (and related options) include the possibility that there may be an illiquid market and that a change in the value of the contract or option may not correlate with changes in the value of the underlying securities.
Options:
The Portfolio may use options to hedge against changes in values of securities the Portfolio owns or expects to purchase, to maintain exposure to the broad equity markets or to enhance return. Writing puts or buying calls tends to increase the Portfolio’s exposure to the underlying instrument and writing calls or buying puts tends to decrease the Portfolio’s exposure to the underlying instrument, and can be used to hedge other Portfolio investments. For options purchased to hedge the Portfolio’s investments, the potential risk to the Portfolio is that the change in value of options contracts may not correspond to the change in value of the hedged instruments. In addition, losses may arise from changes in the value of the underlying instruments, if there is an illiquid secondary market, or if the counterparty is unable to perform. The maximum loss for purchased options is limited to the premium initially paid for the option. For options written by the Portfolio, the maximum loss is not limited to the premium initially received for the option.
The main risk associated with purchasing an option is that the option expires without being exercised. In this case, the option expires worthless and the premium paid for the option is considered the loss. The risk associated with writing a call option is that the Portfolio may forgo the opportunity for a profit if the market value of the underlying position increases and the option is exercised. The risk in writing a put option is that the Portfolio may incur a loss if the market value of the underlying position decreases and the option is exercised. In addition, the Portfolio risks not being able to enter into a closing transaction for the written option as the result of an illiquid market.
“When-Issued” Securities:
Purchasing securities “when-issued” is a forward commitment by the Portfolio to buy a security. The estimated amount of the Portfolio’s payment obligation and the security’s interest rate are determined when the commitment is made, even though no interest accrues until the security is issued, which is generally 15 to 120 days later. The Portfolio will segregate liquid assets with its custodian sufficient at all times to satisfy these commitments. If the value of the security is less when delivered than when the commitment was made, the Portfolio will suffer a loss.
MSF-14
Metropolitan Series Fund, Inc.
Oppenheimer Global Equity Portfolio
Notes to Financial Statements—December 31, 2008—(Continued)
Fund Concentration:
The investments by the Portfolio in foreign securities may involve risks not present in domestic investments. Since securities may be denominated in foreign currencies and may require settlement in foreign currencies and pay interest or dividends in foreign currencies, changes in the relationship of these foreign currencies to the U.S. dollar can significantly affect the value of the investments and earnings of the Portfolio. Foreign investments may also subject the Portfolio to foreign government exchange restrictions, expropriation, taxation or other political, social or economic developments, all of which could affect the market and/or credit risk of the investments. In addition to the risks described above, risks may arise from forward foreign currency contracts with respect to the potential inability of counterparties to meet the terms of their contracts.
Federal Income Taxes:
It is the Portfolio’s policy to comply with the requirements of the Internal Revenue Code of 1986, as amended (the “Code”), and regulations thereunder, applicable to regulated investment companies and to distribute, with respect to each taxable year, all of its taxable income to shareholders. Therefore, no federal income tax provision is required. The Portfolio is subject to the provisions of the Financial Accounting Standards Board Interpretation (“FASB”) No. 48, Accounting for Uncertainties in Income Taxes (FIN 48). FIN 48 sets forth a minimum threshold for financial statement recognition of the benefit of a tax position taken or expected to be taken in a tax return. The implementation of FIN 48 did not result in any unrecognized tax benefits in the accompanying financial statements. Each of the Portfolio’s federal tax returns for the prior three fiscal years remains subject to examination by the Internal Revenue Service.
As of December 31, 2008 the Portfolio had $17,775,110 in capital loss carryforwards expiring on December 31, 2016.
Pursuant to Section 852 of the Code, the Portfolio designated the amount shown below under Long Term Gain as capital gain dividends for its taxable year ended December 31, 2008. The tax character of distributions paid for the periods ended December 31, 2008 and 2007 was as follows:
| | | | | | | | | | | | | | | | | | | | | | |
| Ordinary Income | | Long Term Gain | | Return of
Capital | | Total |
| 2008 | | 2007 | | 2008 | | 2007 | | 2008 | | 2007 | | 2008 | | 2007 |
| $ | 16,346,159 | | $ | 13,497,645 | | $ | 27,775,562 | | $ | 10,494,843 | | $ | — | | $ | — | | $ | 44,121,721 | | $ | 23,992,488 |
As of December 31, 2008, the components of distributable earnings (accumulated losses) on a federal income tax basis were as follows:
| | | | | | | | | | | | | | | | |
Undistributed
Ordinary
Income | | Undistributed
Long Term
Gain | | Unrealized
Depreciation | | | Loss
Carryforwards | | | Total | |
| $ | 14,139,919 | | $ | — | | $ | (258,001,419 | ) | | $ | (17,775,110 | ) | | $ | (261,636,610 | ) |
Pursuant to Federal income tax regulations applicable to investment companies, the Portfolio has elected to treat net capital losses realized between November 1 and December 31 of each year as occurring on the first day of the following tax year. For the year ended December 31, 2008, the following amounts of realized capital and currency losses reflected in the accompanying financial statements will not be recognized for Federal income tax purposes until January 1, 2009:
| | | | |
Currency | | Capital | |
$— | | $ | (7,368,597 | ) |
Dividends and Distributions to Shareholders:
The Portfolio records dividends and distributions on the ex-dividend date. Net realized gains from security transactions (if any) are generally distributed annually to shareholders. The timing and characterization of certain income and capital gains distributions are determined in accordance with federal tax regulations that may differ from GAAP. Permanent book and tax basis differences relating to shareholder distributions will result in reclassification between under/over distributed net investment income, accumulated net realized gains/losses and paid in capital.
MSF-15
Metropolitan Series Fund, Inc.
Oppenheimer Global Equity Portfolio
Notes to Financial Statements—December 31, 2008—(Continued)
| 3. | INVESTMENT TRANSACTIONS: |
For the year ended December 31, 2008, purchases and sales of securities (excluding short term investments) for the Portfolio were as follows:
| | | | | | | | | | |
| Purchases | | Sales |
| U.S. Government | | Other | | U.S. Government | | Other |
| $ | 0 | | $ | 153,354,301 | | $ | 0 | | $ | 194,441,421 |
| 4. | INVESTMENT MANAGEMENT FEES AND OTHER TRANSACTIONS WITH AFFILIATES: |
Investment Management Agreement:
MetLife Advisers is the investment adviser to the Portfolio. The Fund has entered into an investment management agreement with MetLife Advisers with respect to the Portfolio. For providing investment management services to the Portfolio, MetLife Advisers receives monthly compensation at the following annual rates:
| | | | |
Management
Fees earned by
MetLife Advisers
for the year ended
December 31, 2008 | | Annual
percentage
rates paid to
MetLife Advisers | | Based on Portfolios
average daily net
asset levels |
| $3,970,890 | | 0.900% | | Of the first $ 50 million |
| | 0.550% | | Of the next $50 million |
| | 0.500% | | Of the next $400 million |
| | 0.475% | | On amounts in excess of $500 million |
Certain officers and directors of the Fund may also be officers of MetLife Advisers; however, such officers and directors receive no compensation from the Fund.
MetLife Advisers has entered into an investment subadvisory agreement with respect to the Portfolio. OppenheimerFunds, Inc. is compensated by MetLife Advisers to provide subadvisory services for the Portfolio.
Service and Distribution Fees:
The Fund has adopted a Distribution and Service Plan under Rule 12b-1 of the 1940 Act for the Portfolio’s Class B and E shares. Under the Distribution and Service Plan, the Class B and E shares of the Portfolio pay a fee to compensate the Insurance Companies (or their affiliates) and other broker-dealers and financial intermediaries involved in the offer and sale of Portfolio shares for promoting or selling and servicing the Class B and E shares. The fees under the Distribution and Service Plan for each class of the Portfolio’s shares are calculated as a percentage of the Portfolio’s average daily net assets that are attributable to that Class. Currently, the fee is 0.25% per year for Class B shares and 0.15% per year for Class E shares. Amounts paid by the Portfolio for the year ended December 31, 2008 are shown as Service and Distribution fees in the Statement of Operations.
The Fund has entered into a securities lending arrangement with the Fund’s custodian, State Street Bank and Trust Company (the “custodian”). Under the agreement, the custodian is authorized to loan securities on the Portfolios’ behalf. In exchange, the Portfolio receives either cash or securities as collateral against the loaned securities. The Portfolio receives collateral at least equal to 102% of the market value of the loaned securities (105% for foreign securities), at each loan’s inception. Collateral must be maintained at least at 100% of the market value of the loaned securities for the duration of the loan. The cash collateral is invested in the Navigator Securities Lending Prime Portfolio, an affiliate of the custodian, which invests in a variety of high quality U.S. dollar-denominated instruments. If the market value of the collateral at the close of trading on a business day is less than 100% of the market value of the loaned securities at the close of trading on that day, the borrower shall be required to deliver, by the close of business on the following business day, an additional amount of collateral, equal to at least 100% of the market value of all the loaned securities as of such preceding day. The Portfolio receives 80% of the annual net income from securities lending transactions, which is included in interest income of the Portfolio. The remaining 20% is paid to the custodian as compensation for its securities lending services. Interest income received by the Portfolio via lending transactions during the year ended December 31, 2008 is footnoted in the Statement of Operations. The Portfolio bears the risk of any deficiency in the
MSF-16
Metropolitan Series Fund, Inc.
Oppenheimer Global Equity Portfolio
Notes to Financial Statements—December 31, 2008—(Continued)
amount of collateral available for return to a borrower due to a loss in an approved investment purchased with such collateral. Any outstanding loans by the Portfolio at December 31, 2008 are footnoted in the Schedule of Investments.
| 6. | MARKET AND CREDIT RISK: |
In the normal course of business, the Portfolio invests in securities and enters into transactions where risks exist due to fluctuations in the market (market risk) or failure of the other party to a transaction to perform (credit risk). The value of securities held by the Portfolio may decline in response to certain events, including those directly involving the companies whose securities are owned by the Portfolio; conditions affecting the general economy; overall market changes; local, regional or global political, social or economic instability; and currency and interest rate and price fluctuations. Similar to credit risk, the Portfolio may be exposed to counterparty risk, or the risk that an entity with which the Portfolio has unsettled or open transactions may default. Financial assets, which potentially expose the Portfolio to credit and counterparty risks, consist principally of investments and cash due from counterparties. The extent of the Portfolio’s exposure to credit and counterparty risks in respect to these financial assets approximates their value as recorded in the Portfolio’s Statements of Assets and Liabilities.
| 7. | RECENT ACCOUNTING PRONOUNCEMENTS: |
In March 2008, the FASB issued Statement of Financial Accounting Standards No. 161, Disclosures about Derivative Instruments and Hedging Activities (“FAS 161”), an amendment of FASB Statement No. 133. FAS 161 requires enhanced disclosures about (a) how and why an entity uses derivative instruments, (b) how derivative instruments and hedging activities are accounted for, and (c) how derivative instruments and related hedging activities affect a fund’s financial position, financial performance, and cash flows. Management does not believe the adoption of FAS 161 will materially impact the financial statement amounts, but will require additional disclosures. This will include qualitative and quantitative disclosures on derivative positions existing at period end and the effect of using derivatives during the reporting period. FAS 161 is effective for financial statements issued for fiscal years and interim periods beginning after November 15, 2008. Management is currently evaluating the impact the adoption of FAS 161 will have on the Portfolio’s financial statement disclosures.
MSF-17
Metropolitan Series Fund, Inc.
Oppenheimer Global Equity Portfolio
Report of Independent Registered Public Accounting Firm
To the Shareholders and Board of Directors of Metropolitan Series Fund, Inc.:
We have audited the accompanying statement of assets and liabilities, including the schedule of investments, of the Oppenheimer Global Equity Portfolio (one of the portfolios constituting the Metropolitan Series Fund, Inc.) (the “Fund”) as of December 31, 2008, and the related statement of operations for the year then ended, the statements of changes in net assets for each of the two years in the period then ended, and the financial highlights for each of the five years in the period then ended. These financial statements and financial highlights are the responsibility of the Fund’s management. Our responsibility is to express an opinion on these financial statements and financial highlights based on our audits.
We conducted our audits in accordance with the standards of the Public Company Accounting Oversight Board (United States). Those standards require that we plan and perform the audit to obtain reasonable assurance about whether the financial statements and financial highlights are free of material misstatement. The Fund is not required to have, nor were we engaged to perform, an audit of its internal control over financial reporting. Our audits included consideration of internal control over financial reporting as a basis for designing audit procedures that are appropriate in the circumstances, but not for the purpose of expressing an opinion on the effectiveness of the Fund’s internal control over financial reporting. Accordingly, we express no such opinion. An audit also includes examining, on a test basis, evidence supporting the amounts and disclosures in the financial statements, assessing the accounting principles used and significant estimates made by management, as well as evaluating the overall financial statement presentation. Our procedures included confirmation of securities owned as of December 31, 2008, by correspondence with the custodian and brokers; where replies were not received from brokers, we performed other auditing procedures. We believe that our audits provide a reasonable basis for our opinion.
In our opinion, the financial statements and financial highlights referred to above present fairly, in all material respects, the financial position of the Oppenheimer Global Equity Portfolio of the Metropolitan Series Fund, Inc. as of December 31, 2008, the results of its operations for the year then ended, the changes in its net assets for each of the two years in the period then ended, and the financial highlights for each of the five years in the period then ended, in conformity with accounting principles generally accepted in the United States of America.
Deloitte & Touche LLP
Boston, Massachusetts
February 20, 2009
MSF-18
Metropolitan Series Fund, Inc.
Directors and Officers
The Fund’s Directors review actions of the Fund’s investment adviser and subadvisers, and decide upon matters of general policy. The Fund’s officers supervise the daily business operations of the Fund. The Board of Directors and the Fund’s officers are listed below. Each Director is responsible for overseeing all 38 Portfolios of the Fund. There is no limit to the term a Director may serve. Directors serve until their resignation, retirement or removal in accordance with the Fund’s organizational documents and policies adopted by the Board from time to time. Officers hold office at the pleasure of the Board or until the election or appointment and the qualification of a successor. The address of the Directors and officers is c/o Metropolitan Series Fund, Inc., 501 Boylston Street, Boston, MA 02116.
Interested Directors(1)
Each Director below is an “interested person” (as defined by the 1940 Act) with respect to the Fund in that Ms. Forget is an employee of MetLife and Mr. Typermass is a former employee of MetLife and owns securities issued by MetLife, Inc., the ultimate parent company of MetLife Advisers.
| | | | | | | | |
Name, Address and Age | | Current
position(s)
with Fund | | Position(s)
held since | | Principal occupations
over past five years, including other directorships(2) | | Number of
Portfolios in
Fund Complex
Overseen by
Director(3) |
Elizabeth M. Forget Age: 42 | | Director, Chairman of the Board, President and Chief Executive Officer | | 2006 | | Senior Vice President (since 2007), MetLife, Inc.; President, Met Investors Advisory, LLC; Trustee and President, Met Investors Series Trust; Executive Vice President, MetLife Investors Group, Inc.; President, Chief Executive Officer and Chair of the Board of Managers (since 2006), MetLife Advisers; President, Met Investors Advisory, LLC. | | 87 |
| | | | |
Arthur G. Typermass Age: 71 | | Director | | 1998 | | Formerly, Senior Vice President and Treasurer, MetLife. | | 38 |
Non-Interested Directors(1)
Each Director below is not an “interested person” (as defined by the 1940 Act) with respect to the Fund (collectively, the “Independent Directors”).
| | | | | | | | |
Name, Address and Age | | Current
position(s)
with Fund | | Position(s)
held since | | Principal occupations
over past five years, including other directorships(2) | | Number of
Portfolios in
Fund Complex
Overseen by
Director(3) |
Steve A. Garban† Age: 71 | | Director | | 1985 | | Formerly, Chief Financial Officer, Senior Vice President Finance and Operations and Treasurer (Emeritus), The Pennsylvania State University. | | 38 |
| | | | |
Linda B. Strumpf Age: 61 | | Director | | 2000 | | Vice President and Chief Investment Officer, Ford Foundation. | | 38 |
| | | | |
Michael S. Scott Morton† Age: 71 | | Director | | 1993 | | Jay W. Forrester Professor of Management (Emeritus) at Sloan School of Management, MIT. | | 38 |
| | | | |
H. Jesse Arnelle Age: 75 | | Director | | 2001 | | Formerly, Counsel, Womble Carlyle Sandrie & Rice; Director, Textron Inc. (global multi- industry company)*; formerly, Director, Gannet Co. Inc. (diversified news and information company)*; formerly, Director, Eastman Chemical Company (global chemical company)*; formerly, Director, Waste Management, Inc.*; formerly, Director, Armstrong Holdings Inc. (parent company of floor and ceiling products business)*; formerly, Director, FPL Group Inc. (public utility holding company)*; Director, URS Corporation (engineering design services firm)*. | | 38 |
MSF-19
Metropolitan Series Fund, Inc.
Directors and Officers—(Continued)
| | | | | | | | |
Name, Address and Age | | Current
position(s)
with Fund | | Position(s)
held since | | Principal occupations
over past five years, including other directorships(2) | | Number of
Portfolios in
Fund Complex
Overseen by
Director(3) |
Nancy Hawthorne Age: 57 | | Director | | 2003 | | Chief Executive Officer, Clerestory LLC (corporate financial advisor); Director, Avid Technologies (computer software company)*; formerly, Chairman of the Board of Avid Technologies; formerly, Board of Advisors, L. Knife & Sons, Inc. (beverage distributor); formerly, Trustee, New England Zenith Fund (“Zenith Fund”)**; formerly, Chief Executive Officer and Managing Partner, Hawthorne, Krauss and Associates (corporate financial advisor); formerly, Chief Financial Officer and Executive Vice President, Continental Cablevision, subsequently renamed MediaOne (cable television company); formerly, Director, Life F/X, Inc.; formerly, Chairman of the Board, WorldClinic (distance medicine company); formerly, Director, Perini Corporation (construction company)*; formerly, Director, CGU (property and casualty insurance company); formerly, Director, Beacon Power Corporation (energy company)*. | | 38 |
| | | | |
John T. Ludes Age: 72 | | Director | | 2003 | | President, LFP Properties (consulting firm); Formerly, Trustee, Zenith Fund**; formerly, Vice Chairman, President and Chief Operating Officer, Fortune Brands/American Brands (global conglomerate); formerly, President and CEO, Acushnet Company (athletic equipment company). | | 38 |
Officers(1)
| | | | | | | | |
Name and address | | Age | | Current
position(s)
with Fund | | Position(s)
held since | | Principal occupations over past five years(2) |
| Jeffrey L. Bernier | | 37 | | Senior Vice President | | 2008 | | Vice President (since 2008), MetLife, Inc.; Vice President (since 2008), MetLife; Senior Vice President (since 2008), MetLife Advisers; formerly, Director and Senior Investment Analyst (2004 to 2007), John Hancock Financial Services; formerly, Assistant Vice President (2000 to 2001), Wachovia Securities. |
| | | | |
| Alan C. Leland | | 56 | | Senior Vice President | | 2005 | | Treasurer and Chief Financial Officer, MetLife Advisers, LLC; Treasurer (since 2005), Met Investors Advisory, LLC; Vice President (since 2004), Met Investors Advisory, LLC; Vice President (since 2003), MetLife, Inc.; Vice President, MetLife; Senior Vice President, NELICO. |
| | | | |
| Peter Duffy | | 53 | | Vice President
and Treasurer | | 2000 | | Senior Vice President, MetLife Advisers; Second Vice President (since 2003), NELICO; Vice President, MetLife (since 2004); Vice President (since 2004), MetLife, Inc.; formerly, Vice President and Treasurer, Zenith Fund**. |
| | | | |
| Jeffrey P. Halperin | | 41 | | Chief
Compliance Officer | | 2007 | | Vice President (since 2006), MetLife, Inc.; Vice President (since 2006), MetLife; Chief Compliance Officer (since 2006), Met Investors Series Trust, MetLife Advisers, Met Investors Advisory, LLC and MetLife Investment Advisors Company, LLC. |
| * | Indicates a directorship with a registered investment company or a company subject to the reporting requirements of the Securities Exchange Act of 1934, as amended. |
| ** | The Zenith Fund deregistered with the Securities and Exchange Commission (“SEC”) in 2004. |
| (†) | Served as a trustee, director and/or officer of one or more of the following companies, each of which had a direct or indirect advisory relationship with MetLife Advisers or its affiliates prior to January 31, 2005: State Street Research Financial Trust, State Street Research Income Trust, State Street Research Money Market Trust, State Street Research Institutional Funds, State Street Research Capital Trust, State Street Research Master Investment Trust, State Street Research Equity Trust, State Street Research Securities Trust and State Street Research Exchange Trust (collectively, the “State Street Research Funds”). |
| (1) | During the period shown, each Director of the Fund served as a Trustee of Metropolitan Series Fund II, a registered investment company that ceased investment operations in June of 2008 and has applied for deregistration under the Investment Company Act of 1940. During this period, each officer of the Fund served in the same position with Metropolitan Series Fund II. |
| (2) | Previous positions during the past five years with the Fund; Met Investors Series Trust; MetLife; MetLife, Inc.; MetLife Advisers; Met Investors Advisory, LLC; Zenith Fund; NELICO; or New England Securities Corporation are omitted if not materially different. |
| (3) | The Fund Complex includes the Fund (38 portfolios) and Met Investors Series Trust (49 portfolios). |
MSF-20
Metropolitan Series Fund, Inc.
Oppenheimer Global Equity Portfolio
Board Approval of Advisory and Subadvisory Agreements
The Fund’s Contract Review Committees of the Board of Directors (the “Board” or the “Directors”) typically meet in early fall to review the Portfolios’ advisory agreements (the “Advisory Agreements”) and subadvisory agreements (the “Subadvisory Agreements,” and, together with the Advisory Agreements, the “Agreements”) and determine whether to recommend that the full Board approve the continuation of the Agreements for an additional one-year period. (Following the initial approval of an Agreement for a new Portfolio or with a new adviser or subadviser, such annual reviews are not required until 2 years following the execution of such Agreement.) After each Committee has made its recommendations, the full Board, including the Independent Directors, determines whether to approve the continuation of each of the Agreements. In addition, the Board, including the Independent Directors, considers matters bearing on the Agreements at most of its other meetings throughout the year and regularly interviews various individuals at MetLife Advisers responsible for the management of the Portfolios. The Directors also interview selected investment managers and other professionals at the subadvisers at various times throughout the year.
The Directors receive all materials that they or MetLife Advisers, the Fund’s investment adviser, and the subadvisers believe to be reasonably necessary for the Directors to evaluate the Agreements and determine whether to approve the continuation of the Agreements. These materials generally include, among other items, (i) information on the investment performance of the Portfolios and the performance of peer groups of funds and the Portfolios’ performance benchmarks, (ii) information on the Portfolios’ advisory and subadvisory fees and other expenses, including information comparing the Portfolios’ expenses to those of peer groups of funds and information about any applicable expense caps and fee “breakpoints,” (iii) sales and redemption data, (iv) information related to the profitability of the Agreements to MetLife Advisers and certain of the subadvisers, and potential “fall-out” or ancillary benefits that MetLife Advisers, the subadvisers or their affiliates may receive as a result of their relationships with the Fund and (v) information obtained through the subadvisers’ responses to certain requests from MetLife Advisers and the Directors and MetLife Advisers’ responses to requests from the Directors. The Directors may also consider other information such as (vi) MetLife Advisers’ and the subadvisers’ financial results and condition, (vii) each Portfolio’s investment objectives and strategies and the size, education and experience of the investment staffs of MetLife Advisers and the relevant subadvisers and their use of technology and external research, (viii) the allocation of the Portfolios’ brokerage, if any, including allocations to brokers affiliated with the subadvisers and the use of “soft” commission dollars to pay Portfolio expenses and to pay for research and other similar services, (ix) the resources devoted to, and the record of compliance with, the Portfolios’ investment policies and restrictions, policies on personal securities transactions and other compliance policies, (x) the responses of MetLife Advisers, the subadvisers and/or their affiliates to certain legal and regulatory proceedings and (xi) the economic outlook generally and for the mutual fund industry in particular. Throughout the process, the Directors have the opportunity to ask questions of and request additional materials from MetLife Advisers and the subadvisers.
Following meetings of each Contract Review Committee on September 10, 2008, the Board, including the Independent Directors, at its November 6-7, 2008 meeting, approved the continuation through December 31, 2009 of the Advisory Agreements for each Portfolio of the Fund and the Subadvisory Agreements for each Portfolio other than the Zenith Equity Portfolio and Asset Allocation Portfolios (which do not have subadvisers) and the Van Eck Global Natural Resources Portfolio, Met/Dimensional International Small Cap Portfolio and Loomis Sayles Small Cap Growth Portfolio (formerly known as the Franklin Templeton Small Cap Growth Portfolio). The Agreements approved for continuation are referred to below as the “Continued Agreements.”
In considering whether to approve the continuation of the Continued Agreements, the Directors, including the Independent Directors, did not identify any single factor as determinative, and each weighed the various factors as he or she deemed appropriate. The Directors considered the following matters in connection with their approval of the Continued Agreements:
The nature, extent and quality of the services provided to the relevant Portfolios under the Continued Agreements. The Directors considered the nature, extent and quality of the services provided by MetLife Advisers, the relevant subadvisers (if any) and their affiliates (each, an “Adviser,” and, collectively, the “Advisers”) to the relevant Portfolios pursuant to the Continued Agreements and the resources dedicated to these Portfolios by the Advisers. In particular, the Directors considered the Advisers’ abilities to attract and retain highly qualified investment professionals. With respect to MetLife Advisers, the Directors considered (for each Portfolio other than the Zenith Equity and Asset Allocation Portfolios) that MetLife Advisers is (i) ultimately responsible for the performance of such Portfolios; (ii) ultimately responsible for the establishment of the investment strategies of each such Portfolio, primarily through its recommendations to the Board regarding the hiring and selection of subadvisers; (iii) responsible for the hiring and selection, subject to Board approval, of subadvisers; and (iv) responsible for maintaining a program of Subadviser oversight reasonably designed to ensure that the subadvisers have reasonable compliance policies and procedures in place. The Directors also considered that MetLife Advisers provides a full range of day-to-day administrative services for the Portfolios involving all aspects of such Portfolios’ day-to-day operations (other than portfolio management). With respect to the Zenith Equity and Asset Allocation Portfolios, the Directors considered both the portfolio management services and the administrative services provided by MetLife Advisers. After reviewing
MSF-21
Metropolitan Series Fund, Inc.
Oppenheimer Global Equity Portfolio
Board Approval of Advisory and Subadvisory Agreements—(Continued)
these and related factors, the Directors concluded, within the context of their overall conclusions regarding each of the Continued Agreements, that the nature, extent and quality of services provided supported the renewal of these Agreements.
Investment performance of the relevant Portfolios. The Directors reviewed information about the performance of the relevant Portfolios over various time periods, including information prepared by an independent third party that compared the performance of the Portfolios to the performance of peer groups of funds and performance benchmarks. The Directors also reviewed a description of the third party’s methodology for identifying a Portfolio’s peer group(s) for purposes of performance and expense comparisons.
In the case of each relevant Portfolio that had performance that lagged its peer group(s) for certain periods, the Directors concluded that other factors relevant to performance were sufficient, in light of other considerations, to warrant renewal of the Continued Agreements relating to such Portfolio. These factors varied from Portfolio to Portfolio, but included one or more of the following: (i) that such Portfolio’s performance, although lagging in certain recent periods, was stronger over the longer term; (ii) that the underperformance was attributable, to a significant extent, to investment decisions that were reasonable and consistent with the Portfolio’s investment objective(s) and policies and that the Portfolio was performing within the range of reasonable expectations, given market conditions and the Portfolio’s investment objective(s) and policies; (iii) that the Portfolio’s performance was competitive when compared to other relevant performance benchmarks or peer groups; and (iv) that MetLife Advisers and/or the relevant subadviser (if any) had taken or was taking steps designed to help improve the Portfolio’s investment performance (including, in the case of certain Portfolios, that MetLife Advisers was formulating possible proposals, for presentation to the Board in November 2008, to replace the Portfolio’s subadviser or to merge the Portfolio into another Portfolio with a similar investment objective and better investment performance).
The Directors also considered the investment performance of the Advisers and their reputations generally, the historical responsiveness of the Advisers to Director concerns about performance and the willingness of the Advisers to take steps intended to improve performance.
After reviewing these and related factors, the Directors concluded, within the context of their overall conclusions regarding each of the Continued Agreements, that the investment performance of each relevant Portfolio and Adviser was sufficient, in light of other considerations, to warrant the renewal of the Continued Agreements.
The costs of the services to be provided and profits to be realized by the Advisers and their affiliates from their relationships with the Portfolios. The Directors considered the fees charged by MetLife Advisers to the Portfolios for advisory services and, with respect to the subadvised Portfolios, by such subadvisers to MetLife Advisers for subadvisory services (such advisory and subadvisory fees (if any), collectively, “Fees”), as well as the total expense levels of the Portfolios. This information included comparisons (provided by an independent third party) of the Portfolios’ advisory fees and total expense levels to those of their peer groups. In evaluating Fees for the relevant Portfolios, the Directors also took into account the demands, complexity and quality of the investment management services provided to each Portfolio. The Directors considered MetLife Advisers’ recommendations regarding reductions in Fee rates, implementation of Fee breakpoints and institution of Fee waivers and expense caps.
The Directors also considered the compensation directly or indirectly received by the Advisers and their affiliates from their relationships with the relevant Portfolios. The Directors reviewed information relating to the profits received by MetLife Advisers, certain of the subadvisers and their affiliates as a result of their relationships with the relevant Portfolios, and information about the allocation of expenses used to calculate profitability. When reviewing profitability, the Directors also considered the performance of the relevant Portfolios, the expense levels of such Portfolios and whether the relevant Advisers had implemented breakpoints, fee waivers and/or expense caps with respect to such Portfolios.
After reviewing these and related factors, the Directors concluded, within the context of their overall conclusions regarding each of the Continued Agreements, that the Fees charged to each of the relevant Portfolios were fair and reasonable, and that the information provided regarding costs of these services generally, and the related profitability (if known) to the relevant Advisers of their relationships with the relevant Portfolios, supported the renewal of the Continued Agreements.
Economies of Scale. The Directors considered the existence of any economies of scale in the provision of services by the Advisers and whether those economies were shared with the relevant Portfolios through breakpoints in their advisory fees or other means, such as expense caps, fee waivers or relatively low levels of fees. The Directors noted that most of the relevant Portfolios benefited or will benefit from breakpoints, expense caps and/or fee waivers with respect to their advisory fees. In considering these issues, the Directors also took into consideration information relating to the costs of the services provided and the profitability to MetLife Advisers, the relevant subadvisers (if any) and each of their affiliates of their relationships with the relevant Portfolios, as discussed above.
MSF-22
Metropolitan Series Fund, Inc.
Oppenheimer Global Equity Portfolio
Board Approval of Advisory and Subadvisory Agreements—(Continued)
After reviewing these and related factors, the Directors concluded, within the context of their overall conclusions regarding each of the Continued Agreements, that the extent to which economies of scale were shared with the relevant Portfolios supported the renewal of such Agreements.
Other Factors. The Directors also considered other factors, which included but were not limited to the following:
| | • | | the extent to which each relevant Portfolio operated in accordance with its investment objective, and its record of compliance with its investment restrictions and the compliance programs of the Fund and the Advisers. They also considered the compliance-related resources the Advisers and their affiliates provide to the relevant Portfolios; |
| | • | | the nature, quality, cost and extent of administrative and shareholder services performed by MetLife Advisers and its affiliates under the Advisory Agreements; and |
| | • | | so-called “fall-out benefits” to the Advisers, such as the engagement of their affiliates to provide distribution, brokerage and transfer agency services to the Portfolios, and the benefits of research made available to the relevant Advisers by reason of brokerage commissions generated by the relevant Portfolios’ securities transactions. The Directors also considered the possible conflicts of interest associated with these fall-out and other benefits, and the reporting and other processes in place to disclose and monitor these possible conflicts of interest. |
Based on their evaluation of all factors that they deemed to be material, including those factors described above, and assisted by the advice of independent counsel, the Directors, including the Independent Directors, concluded that each of the Continued Agreements should be continued through December 31, 2009.
MSF-23
A description of the policies and procedures that the Fund uses to determine how to vote proxies relating to portfolio securities is available (i) without charge, upon request, by calling (800) 638-7732 and (ii) on the Securities and Exchange Commission’s (the “SEC”) website at http://www.sec.gov.
Information regarding how the Fund voted proxies relating to portfolio securities during the most recent twelve-month period ended December 31, 2008 is available (i) without charge, upon request, by calling (800) 638-7732 and (ii) on the SEC’s website at http://www.sec.gov.
The Fund’s Statement of Additional Information includes additional information about the Directors of the Fund and is available (i) without charge, upon request, by calling (800) 638-7732 and (ii) on the SEC’s website at http://www.sec.gov.
The Fund files with the SEC a complete schedule of its portfolio holdings, as of the close of the first and third quarters of its fiscal year, on “Form N-Q”. These filings are available on the SEC’s website at www.sec.gov and may be reviewed and copied at the SEC’s Public Reference Room in Washington, DC. (Call 1-800-SEC-0330 for information on the operation of the Public Reference Room.)
MSF-24
Simplify your life…
with MetLife eDelivery® while helping MetLife preserve the planet’s natural resources.
(see details on inside cover)
| | |
Metropolitan Series Fund, Inc. Russell 2000® Index Portfolio Annual Report | | December 31, 2008 |
NOT PART OF THE ANNUAL REPORT
Letter from the President
February 1, 2009
Letter to Policy Holders:
2008 was an extraordinary year in the capital markets around the world and for the global economy. Energy prices rose to record levels early in the year before falling by two-thirds by year-end. A credit crisis that began with concerns about sub-prime mortgages led to massive changes in the financial landscape with government takeovers, forced sales, and outright failures of a number of large, once venerable firms.
While bonds as measured by the Barclays Capital U.S. Aggregate Bond Index (formerly known as, Lehman Brothers U.S. Aggregate Bond Index) were up 5.2% for the year in response to declining interest rates, there were large differences in the total returns of the various sectors of the bond market. U.S. treasury securities were up over 13% as frightened investors sought refuge in what they perceived to be the safest and most liquid investments. In contrast, investment grade corporate securities lost nearly 5% as credit spreads widened and below investment grade or high yield bonds fell over 26%.
In response to the growing credit crisis and the weakening economy, common stocks fell sharply across all regions, styles, and capitalizations. As measured by the Standard and Poor’s 500, U.S. common stocks fell 37% for the year, the worst calendar year decline since the 1930s. Foreign stocks were down even more with the MSCI EAFE Index down 43% for the year.
On the following pages, you will find a complete review of your Portfolio and its investment performance.
MetLife is committed to building your financial freedom. We appreciate your trust and will continue to focus our efforts on meeting your investment needs.
Sincerely,
Elizabeth M. Forget
President, Metropolitan Series Fund, Inc.
Metropolitan Series Fund, Inc.
Russell 2000 Index Portfolio
Managed by MetLife Investment Advisors Company, LLC
Portfolio Manager Commentary*
PORTFOLIO PERFORMANCE
For the twelve-month period ended December 31, 2008, the Class A shares of the Russell 2000 Index Portfolio returned -33.5%, compared to its benchmark, the Russell 2000 Index1, which returned -33.8%. The Portfolio’s performance cannot exactly duplicate the Russell 2000 Index’s return because of differences that primarily result from sampling, pricing, and transaction costs.
PORTFOLIO REVIEW
During the first half of 2008, the Russell 2000 Index returned -9.4%, primarily due to continued weakness in the economy, deteriorating financial market conditions and further credit tightening. The subprime mortgage crisis continued to weaken the housing market, and the ensuing liquidity crisis resulted in one of the worst financial crises in recent history. A few of the consequences included the collapse of Bear Stearns, the bankruptcy of Lehman Brothers, the sale of Merrill Lynch to Bank of America, and the government’s provision of credit assistance to Fannie Mae and Freddie Mac. Other major financial institutions that required rescues included AIG, Washington Mutual, and Wachovia.
During the second half of 2008, the Russell 2000 Index returned -26.9%, primarily due to concerns that the financial crisis continued to exacerbate. In an effort to support the functioning of the financial markets, a $700 billion financial-rescue plan, also known as the Troubled Asset Relief Program (TARP), was initiated which included bailout loans and the purchasing of large quantities of agency debt and mortgage-backed securities by the Treasury Department. In addition, during the year, the Federal Open Market Committee (FOMC) lowered the Fed Funds Rate seven times from 4.25% to a target range of zero to 0.25%.
During the year, the price of oil rose from approximately $96 to a high of $145 per barrel in July, before plummeting to $45 per barrel by the end of the year, down approximately 54% from prior year-end. Oil prices fell from its highs due to decreased global oil demand and reduced investment speculation on oil futures by large financial institutions and hedge funds. Some of the factors driving the equity markets included geopolitical concerns, energy prices, Federal Reserve interest rate policy, corporate earnings, and unemployment rates.
All twelve sectors comprising the Russell 2000 Index experienced negative returns for the year. The best relative performing sectors were Consumer Staples (2.2% beginning weight), down 17.5%; Utilities (4.3% beginning weight), down 20.8%; and Financial Services (20.5% beginning weight), down 25.2%. Other Energy (6.0% beginning weight), down 53.0%, was the worst-performing sector. The next worst-performing sectors were Integrated Oils (0.2% beginning weight), down 44.9%; Producer Durables (7.5% beginning weight), down 42.6%; and Technology (14.2% beginning weight), down 42.4%. Consumer Discretionary (17.1% beginning weight), down 41.0%, provided the largest negative impact to the benchmark’s one-year return.
The stocks with the largest positive impact on the benchmark return for the year were Alpha Natural Resources, up 221.1%; Walter Industries, up 203.2%; and Petrohawk Energy, up 167.5%. The stocks with the largest negative impact were Coeur d’Alene Mines, down 82.2%, EXCO Resources, down 41.5%; and Hologic, down 36.5%.
On June 27, 2008 Frank Russell underwent their annual reconstitution. In total, 271 companies were added to the Russell 2000 Index and 169 companies were deleted. The difference of 102 names is due to IPO additions on a quarterly basis and attrition throughout the period between annual reconstitutions. The annual Russell 2000 reconstitution generated approximately 27% turnover.
* The views expressed above are those of the subadvisory firm as of December 31, 2008 and are subject to change based on market and other conditions. Information about the Portfolio’s holdings, asset allocation, industry allocation, or country diversification is historical and is not an indication of future Portfolio composition, which will vary. The performance of any index mentioned in this commentary has not been adjusted for ongoing management, distribution and operating expenses, and sales charges applicable to mutual fund investments. Direct investment in any index is not possible.
1 The Russell 2000® Index is an unmanaged measure of performance of the 2,000 smallest companies in the Russell 3000® Index.
MSF-2
Metropolitan Series Fund, Inc.
Russell 2000 Index Portfolio
A $10,000 INVESTMENT COMPARED TO THE
RUSSELL 2000 INDEX
Average Annual Returns as of December 31, 2008
| | | | | | | | | | | | |
| | | Russell 2000 Index Portfolio | | | Russell 2000 Index | |
| | | Class A | | | Class B | | | Class E | | |
| 1 Year | | -33.5 | % | | -33.6 | % | | -33.5 | % | | -33.8 | % |
| 5 Year | | -1.0 | | | -1.3 | | | -1.2 | | | -0.9 | |
| 10 Year | | 2.8 | | | — | | | — | | | 3.0 | |
| Since Inception | | — | | | 1.7 | | | 1.1 | | | — | |
Performance numbers are net of all Portfolio expenses but do not include any insurance, sales, or administrative charges of variable annuity or life insurance contracts or any additional expenses that participants in certain eligible qualified plans may bear relating to the operations of their plans. If these charges were included, the returns would be lower.
Inception dates of the Class A, Class B and Class E shares are: 11/9/98, 1/2/01 and 5/1/01, respectively.
This information represents past performance and is not indicative of future results. Investment return and principal value may fluctuate so that shares, upon redemption, may be worth more or less than the original cost.
PORTFOLIO COMPOSITION as of December 31, 2008
Top Holdings
| | |
| | | % of Total
Net Assets |
iShares Russell 2000 Index Fund | | 3.1% |
Ralcorp Holdings, Inc. | | 0.4% |
Myriad Genetics, Inc. | | 0.4% |
Alexion Pharmaceuticals, Inc. | | 0.4% |
Waste Connections, Inc. | | 0.3% |
Realty Income Corp. | | 0.3% |
Piedmont Natural Gas Co. | | 0.3% |
ITC Holdings Corp. | | 0.3% |
Comstock Resources, Inc. | | 0.3% |
Westar Energy, Inc. | | 0.3% |
Top Sectors
| | |
| | | % of Equity
Market Value |
Financial Services | | 24.5% |
Health Care | | 15.2% |
Consumer Discretionary | | 15.0% |
Technology | | 12.5% |
Materials & Processing | | 8.4% |
Producer Durables | | 7.3% |
Utilities | | 5.5% |
Auto & Transportation | | 3.9% |
Other Energy | | 3.7% |
Consumer Staples | | 3.3% |
MSF-3
Metropolitan Series Fund, Inc.
Shareholder Expense Example
As a shareholder of the Portfolio, you incur ongoing costs, including management fees; distribution and service (12b-1) fees; and other Portfolio expenses. This example is intended to help you understand your ongoing costs (in dollars) (referred to as “expenses”) of investing in the Portfolio and compare these costs with the ongoing costs of investing in other mutual funds. The example is based on an investment of $1,000 invested at the beginning of the period and held for the entire period, July 1, 2008 through December 31, 2008.
Actual Expenses
The first line for each share class of the Portfolio in the table below provides information about actual account values and actual expenses. You may use the information in this line, together with the amount you invested in the particular share class of the Portfolio, to estimate the expenses that you paid over the period. Simply divide your account value by $1,000 (for example, an $8,600 account value divided by $1,000=8.6), then multiply the result by the number in the first line under the heading entitled “Expenses Paid During Period” to estimate the expenses you paid on your account during this period.
Hypothetical Example for Comparison Purposes
The second line for each share class of the Portfolio in the table below provides information about hypothetical account values and hypothetical expenses based on the Portfolio’s actual expense ratio and an assumed rate of return of 5% per year before expenses, which is not the Portfolio’s actual return. The hypothetical account values and expenses may not be used to estimate the actual ending account balance or expenses you paid for the period. You may use this information to compare the ongoing costs of investing in the Portfolio and other funds. To do so, compare this 5% hypothetical example with the 5% hypothetical examples that appear in the shareholder reports of the other funds.
Please note that the expenses shown in the table are meant to highlight your ongoing costs only and do not reflect any fees or charges of your variable insurance product or any additional expenses that participants in certain eligible qualified plans may bear relating to the operations of their plan. Therefore, the second line for each share class in the table is useful in comparing ongoing costs only, and will not help you determine the relative total costs of owning different funds. In addition, if these other costs were included, your costs would have been higher.
| | | | | | | | | | | | | | |
Portfolio | | | | Annualized
Expense
Ratio | | | Beginning
Account Value
July 1,
2008 | | Ending
Account Value
December 31,
2008 | | Expenses Paid
During Period*
July 1, 2008
to
December 31,
2008 |
Russell 2000 Index—Class A(a) | | Actual | | 0.31 | % | | $ | 1,000.00 | | $ | 732.89 | | $ | 1.35 |
| | Hypothetical | | 0.31 | % | | $ | 1,000.00 | | $ | 1,023.56 | | $ | 1.58 |
| | | | | |
Russell 2000 Index—Class B(a) | | Actual | | 0.56 | % | | $ | 1,000.00 | | $ | 731.99 | | $ | 2.44 |
| | Hypothetical | | 0.56 | % | | $ | 1,000.00 | | $ | 1,022.29 | | $ | 2.85 |
| | | | | |
Russell 2000 Index—Class E(a) | | Actual | | 0.46 | % | | $ | 1,000.00 | | $ | 732.62 | | $ | 2.00 |
| | Hypothetical | | 0.46 | % | | $ | 1,000.00 | | $ | 1,022.80 | | $ | 2.34 |
* Expenses paid are equal to the Portfolio’s annualized expense ratio for the most recent six month period, as shown above, multiplied by the average account value over the period, multiplied by the number of days in the most recent fiscal half-year, divided by 366 (to reflect the the one-half year period).
(a) The annualized expense ratio shown reflects the impact of the management fee waiver as described in Note 4 to the Financial Statements.
MSF-4
Metropolitan Series Fund, Inc.
Russell 2000 Index Portfolio
Schedule of Investments as of December 31, 2008
Common Stock—93.9% of Total Net Assets
| | | | | |
| Security Description | | Shares | | Value* |
| | | | | |
|
Aerospace & Defense—2.0% |
AAR Corp. (a) (b) | | 25,386 | | $ | 467,356 |
AeroVironment, Inc. (a) | | 7,017 | | | 258,296 |
American Science & Engineering, Inc. | | 6,035 | | | 446,349 |
Applied Signal Technology, Inc. | | 8,961 | | | 160,760 |
Argon, Inc. (b) | | 8,892 | | | 167,703 |
Axsys Technologies, Inc. (b) | | 5,846 | | | 320,711 |
Ceradyne, Inc. (b) | | 16,510 | | | 335,318 |
Cubic Corp. | | 10,446 | | | 284,131 |
Curtiss-Wright Corp. | | 29,303 | | | 978,427 |
Ducommun, Inc. | | 7,298 | | | 121,877 |
DynCorp International, Inc. (b) | | 15,363 | | | 233,057 |
Esterline Technologies Corp. (b) | | 19,839 | | | 751,700 |
GenCorp, Inc. (a) (b) | | 39,139 | | | 144,032 |
HEICO Corp. (Class B) (a) | | 15,783 | | | 612,854 |
Herley Industries, Inc. (a) (b) | | 9,374 | | | 115,113 |
Hexcel Corp. (b) | | 64,740 | | | 478,429 |
Ladish, Inc. (b) | | 11,078 | | | 153,430 |
Moog, Inc. (b) | | 28,692 | | | 1,049,266 |
Orbital Sciences Corp. (b) | | 37,758 | | | 737,414 |
Stanley, Inc. (a) (b) | | 5,973 | | | 216,342 |
Taser International, Inc. (a) (b) | | 44,282 | | | 233,809 |
Teledyne Technologies, Inc. (b) | | 23,838 | | | 1,061,983 |
TransDigm Group, Inc. (a) (b) | | 22,498 | | | 755,258 |
Triumph Group, Inc. | | 11,060 | | | 469,608 |
| | | | | |
| | | | | 10,553,223 |
| | | | | |
|
Air Freight & Logistics—0.3% |
Atlas Air Worldwide Holdings, Inc. (b) | | 8,084 | | | 152,788 |
Dynamex, Inc. (a) (b) | | 6,006 | | | 88,588 |
Forward Air Corp. (a) | | 18,684 | | | 453,461 |
HUB Group, Inc. (Class A) (b) | | 26,106 | | | 692,592 |
Pacer International, Inc. | | 22,347 | | | 233,079 |
| | | | | |
| | | | | 1,620,508 |
| | | | | |
|
Airlines—1.0% |
Airtran Holdings, Inc. (a) (b) | | 78,447 | | | 348,305 |
Alaska Air Group, Inc. (a) (b) | | 24,261 | | | 709,634 |
Allegiant Travel Co. (a) (b) | | 9,131 | | | 443,493 |
Hawaiian Holdings, Inc. (b) | | 26,730 | | | 170,537 |
JetBlue Airways Corp. (a) (b) | | 116,901 | | | 829,997 |
Republic Airways Holdings, Inc. (b) | | 23,593 | | | 251,737 |
Skywest, Inc. | | 40,484 | | | 753,002 |
UAL Corp. (a) (b) | | 85,334 | | | 940,381 |
US Airways Group, Inc. (a) (b) | | 75,546 | | | 583,971 |
| | | | | |
| | | | | 5,031,057 |
| | | | | |
|
Auto Components—0.4% |
American Axle & Manufacturing Holdings, Inc. (a) | | 27,908 | | | 80,654 |
ArvinMeritor, Inc. (a) | | 47,717 | | | 135,994 |
Cooper Tire & Rubber Co. (a) | | 36,658 | | | 225,813 |
Dorman Products, Inc. (a) | | 7,851 | | | 103,633 |
Drew Industries, Inc. (a) (b) | | 16,866 | | | 202,392 |
Exide Technologies (a) (b) | | 49,077 | | | 259,617 |
Fuel System Solutions, Inc. (a) | | 7,974 | | | 261,228 |
Lear Corp. (a) (b) | | 47,108 | | | 66,422 |
| | | | | |
| Security Description | | Shares | | Value* |
| | | | | |
|
Auto Components—(Continued) |
Modine Manufacturing Co. | | 20,814 | | $ | 101,364 |
Raser Technologies, Inc. (a) (b) | | 30,438 | | | 115,360 |
Spartan Motors, Inc. (a) | | 19,530 | | | 92,377 |
Superior Industries International, Inc. (a) | | 13,180 | | | 138,654 |
Tenneco, Inc. (b) | | 28,545 | | | 84,208 |
| | | | | |
| | | | | 1,867,716 |
| | | | | |
|
Automobiles—0.0% |
Winnebago Industries (a) (b) | | 20,312 | | | 122,481 |
| | | | | |
|
Beverages—0.1% |
Coca-Cola Bottling Co. Consolidated | | 2,746 | | | 126,206 |
National Beverage Corp. | | 7,440 | | | 66,960 |
The Boston Beer Co., Inc. (a) (b) | | 4,936 | | | 140,183 |
| | | | | |
| | | | | 333,349 |
| | | | | |
|
Biotechnology—4.3% |
Acorda Therapeutics, Inc. (b) | | 24,638 | | | 505,325 |
Affymax, Inc. (a) (b) | | 7,931 | | | 79,231 |
Alexion Pharmaceuticals, Inc. (b) (d) | | 49,961 | | | 1,808,089 |
Alkermes, Inc. (b) | | 62,831 | | | 669,150 |
Allos Therapeutics, Inc. (b) | | 37,060 | | | 226,807 |
Alnylam Pharmaceuticals, Inc. (a) (b) | | 23,565 | | | 582,762 |
Arena Pharmaceuticals, Inc. (a) (b) | | 46,806 | | | 195,181 |
Arqule, Inc. (b) | | 28,549 | | | 120,477 |
Array Biopharma, Inc. (a) (b) | | 31,105 | | | 125,975 |
Celera Corp. (b) | | 55,005 | | | 612,206 |
Cepheid (b) | | 37,111 | | | 385,212 |
Cougar Biotechnology, Inc. (a) (b) | | 9,818 | | | 255,268 |
Cubist Pharmaceuticals, Inc. (a) (b) | | 37,259 | | | 900,177 |
CV Therapeutics, Inc. (b) | | 40,547 | | | 373,438 |
Dendreon Corp. (a) (b) | | 66,216 | | | 303,269 |
Dyax Corp. (a) (b) | | 42,026 | | | 152,975 |
Emergent Biosolutions, Inc. | | 9,176 | | | 239,585 |
Enzon Pharmaceuticals, Inc. (a) (b) | | 27,534 | | | 160,523 |
Facet Biotech Corp. (b) | | 16,272 | | | 156,049 |
Genomic Health, Inc. (b) | | 9,495 | | | 184,963 |
Geron Corp. (a) (b) | | 52,781 | | | 246,487 |
GTx, Inc. (a) (b) | | 12,605 | | | 212,268 |
Halozyme Therapeutics, Inc. (a) (b) | | 39,723 | | | 222,449 |
Human Genome Sciences, Inc. (b) | | 100,386 | | | 212,818 |
Idenix Pharmaceuticals, Inc. (b) | | 19,197 | | | 111,151 |
Idera Pharmaceuticals, Inc. (a) (b) | | 14,570 | | | 111,898 |
Immunogen, Inc. (b) | | 34,988 | | | 150,099 |
Immunomedics, Inc. (b) | | 47,664 | | | 81,029 |
Incyte Corp. (a) (b) | | 45,130 | | | 171,043 |
Indevus Pharmaceuticals, Inc. (a) (b) | | 53,471 | | | 167,899 |
InterMune, Inc. (a) (b) | | 20,699 | | | 218,995 |
Isis Pharmaceuticals, Inc. (a) (b) | | 61,606 | | | 873,573 |
Lexicon Pharmaceuticals, Inc. (a) (b) | | 58,121 | | | 81,369 |
Ligand Pharmaceuticals, Inc. (a) (b) | | 66,630 | | | 182,566 |
MannKind Corp. (b) | | 35,698 | | | 122,444 |
Martek Biosciences Corp. (a) (b) | | 22,497 | | | 681,884 |
Maxygen, Inc. | | 17,352 | | | 154,780 |
Medarex, Inc. (b) | | 88,090 | | | 491,542 |
*See accompanying notes to financial statements.
MSF-5
Metropolitan Series Fund, Inc.
Russell 2000 Index Portfolio
Schedule of Investments as of December 31, 2008
Common Stock—(Continued)
| | | | | |
| Security Description | | Shares | | Value* |
| | | | | |
|
Biotechnology—(Continued) |
Metabolix, Inc. (a) (b) | | 12,459 | | $ | 158,479 |
Momenta Pharmaceuticals, Inc. (a) (b) | | 17,269 | | | 200,320 |
Myriad Genetics, Inc. (b) | | 29,200 | | | 1,934,792 |
Nabi Biopharmaceuticals (a) (b) | | 32,116 | | | 107,589 |
Neurocrine Biosciences, Inc. (b) | | 21,044 | | | 67,341 |
Novavax, Inc. | | 41,369 | | | 78,187 |
NPS Pharmaceuticals, Inc. (b) | | 35,144 | | | 218,244 |
Onyx Pharmaceuticals, Inc. (a) (b) | | 35,624 | | | 1,216,916 |
OSI Pharmaceuticals, Inc. (a) (b) | | 36,747 | | | 1,434,970 |
Osiris Therapeutics, Inc. (a) (b) | | 11,221 | | | 214,994 |
PDL BioPharma, Inc. (b) | | 81,362 | | | 502,817 |
Pharmasset, Inc. (a) (b) | | 11,069 | | | 145,115 |
Progenics Pharmaceuticals, Inc. (a) (b) | | 21,526 | | | 221,933 |
Regeneron Pharmaceuticals, Inc. (b) | | 40,300 | | | 739,908 |
Repligen Corp. | | 22,423 | | | 84,759 |
Rigel Pharmaceuticals, Inc. (a) (b) | | 24,433 | | | 195,464 |
Sangamo Biosciences, Inc. (a) (b) | | 25,684 | | | 89,380 |
Savient Pharmaceuticals, Inc. (a) (b) | | 35,468 | | | 205,360 |
Seattle Genetics, Inc. (a) (b) | | 37,822 | | | 338,129 |
Theravance, Inc. (a) (b) | | 34,733 | | | 430,342 |
United Therapeutics Corp. (b) | | 15,212 | | | 951,511 |
XOMA, Ltd. (a) (b) | | 82,412 | | | 51,095 |
Zymogenetics, Inc. (a) (b) | | 26,358 | | | 79,074 |
| | | | | |
| | | | | 22,197,675 |
| | | | | |
|
Building Products—0.6% |
AAON, Inc. | | 7,694 | | | 160,651 |
American Woodmark Corp. (a) | | 8,732 | | | 159,184 |
Ameron International Corp. | | 6,018 | | | 378,652 |
Apogee Enterprises, Inc. | | 17,370 | | | 179,953 |
Gibraltar Industries, Inc. (a) | | 18,286 | | | 218,335 |
Griffon Corp. (b) | | 30,404 | | | 283,669 |
Insteel Industries, Inc. (a) | | 12,134 | | | 136,993 |
NCI Building Systems, Inc. (a) (b) | | 12,366 | | | 201,566 |
Quanex Building Products Corp. (b) | | 22,520 | | | 211,012 |
Simpson Manufacturing Co., Inc. (a) | | 25,268 | | | 701,440 |
Trex Co., Inc. (b) | | 12,252 | | | 201,668 |
Universal Forest Products, Inc. (a) | | 10,348 | | | 278,465 |
| | | | | |
| | | | | 3,111,588 |
| | | | | |
|
Capital Markets—1.6% |
Apollo Investment Corp. (a) | | 95,871 | | | 892,559 |
Ares Capital Corp. | | 63,806 | | | 403,892 |
BGC Partners Inc. | | 23,944 | | | 66,085 |
Blackrock Kelso Capital Corp. | | 9,116 | | | 89,884 |
Calamos Asset Management, Inc. | | 15,750 | | | 116,550 |
Capital Southwest Corp. (a) | | 1,881 | | | 203,449 |
Cohen & Steers, Inc. (a) | | 10,675 | | | 117,318 |
Diamond Hill Investment Group, Inc. (a) (b) | | 1,546 | | | 100,490 |
Evercore Partners, Inc. | | 6,900 | | | 86,181 |
FBR Capital Markets Corp. (b) | | 18,281 | | | 88,846 |
FCStone Group, Inc. (b) | | 15,110 | | | 66,937 |
GAMCO Investors, Inc. (a) | | 5,201 | | | 142,091 |
GFI Group, Inc. | | 50,761 | | | 179,694 |
Gladstone Capital Corp. (a) | | 14,623 | | | 118,300 |
Gladstone Investment Corp. | | 15,667 | | | 76,925 |
| | | | | |
| Security Description | | Shares | | Value* |
| | | | | |
|
Capital Markets—(Continued) |
Greenhill & Co., Inc. (a) | | 11,446 | | $ | 798,587 |
Harris & Harris Group, Inc. (b) | | 18,276 | | | 72,190 |
Hercules Technology Growth Capital, Inc. (a) | | 18,966 | | | 150,211 |
KBW, Inc. (a) (b) | | 17,828 | | | 410,044 |
Knight Capital Group, Inc. (b) | | 60,410 | | | 975,622 |
LaBranche & Co., Inc. (b) | | 36,996 | | | 177,211 |
Ladenburg Thalmann Financial Services, Inc. (a) (b) | | 62,538 | | | 45,027 |
MVC Capital, Inc. | | 15,052 | | | 165,121 |
NGP Capital Resources Co. (a) | | 14,986 | | | 125,433 |
optionsXpress Holdings, Inc. | | 26,495 | | | 353,973 |
Penson Worldwide, Inc. (b) | | 9,106 | | | 69,388 |
Piper Jaffray Cos. (b) | | 12,145 | | | 482,885 |
Prospect Capital Corp. (a) | | 18,121 | | | 216,908 |
RiskMetrics Group, Inc. (a) (b) | | 14,649 | | | 218,124 |
Sanders Morris Harris Group, Inc. | | 13,865 | | | 83,051 |
Stifel Financial Corp. (b) | | 17,519 | | | 803,246 |
SWS Group, Inc. | | 16,924 | | | 320,710 |
TradeStation Group, Inc. (b) | | 22,284 | | | 143,732 |
Westwood Holdings Group, Inc. | | 3,904 | | | 110,913 |
| | | | | |
| | | | | 8,471,577 |
| | | | | |
| | |
Chemicals—1.7% | | | | | |
A. Schulman, Inc. | | 16,618 | | | 282,506 |
American Vanguard Corp. (a) | | 13,990 | | | 163,683 |
Arch Chemicals, Inc. | | 16,387 | | | 427,209 |
Balchem Corp. | | 12,153 | | | 302,731 |
Calgon Carbon Corp. (a) (b) | | 35,836 | | | 550,441 |
Ferro Corp. (a) | | 27,506 | | | 193,917 |
GenTek, Inc. (a) (b) | | 5,631 | | | 84,747 |
H.B. Fuller Co. | | 32,191 | | | 518,597 |
Innophos Holdings, Inc. | | 7,232 | | | 143,266 |
Innospec, Inc. | | 17,009 | | | 100,183 |
Koppers Holdings, Inc. | | 13,722 | | | 296,670 |
Landec Corp. (a) (b) | | 16,296 | | | 107,228 |
LSB Industries, Inc. (a) (b) | | 11,999 | | | 99,832 |
Minerals Technologies, Inc. | | 12,371 | | | 505,974 |
NewMarket Corp. | | 8,857 | | | 309,198 |
Olin Corp. | | 50,412 | | | 911,449 |
OM Group, Inc. (a) (b) | | 19,970 | | | 421,567 |
Penford Corp. (a) | | 8,220 | | | 83,186 |
PolyOne Corp. (b) | | 69,497 | | | 218,916 |
Quaker Chemical Corp. | | 7,230 | | | 118,933 |
Rockwood Holdings, Inc. (b) | | 27,106 | | | 292,745 |
Sensient Technologies Corp. | | 32,682 | | | 780,446 |
ShengdaTech, Inc. (a) (b) | | 21,210 | | | 74,659 |
Solutia, Inc. (b) | | 63,760 | | | 286,920 |
Spartech Corp. | | 20,427 | | | 127,873 |
Stepan Co. | | 4,458 | | | 209,481 |
W.R. Grace & Co. (a) (c) | | 46,759 | | | 279,151 |
Westlake Chemical Corp. (a) | | 13,301 | | | 216,673 |
Zep, Inc. | | 14,264 | | | 275,438 |
Zoltek Cos., Inc. (a) (b) | | 18,207 | | | 163,681 |
| | | | | |
| | | | | 8,547,300 |
| | | | | |
*See accompanying notes to financial statements.
MSF-6
Metropolitan Series Fund, Inc.
Russell 2000 Index Portfolio
Schedule of Investments as of December 31, 2008
Common Stock—(Continued)
| | | | | |
| Security Description | | Shares | | Value* |
| | | | | |
| | |
Commercial & Professional Services—2.7% | | | | | |
ABM Industries, Inc. | | 27,860 | | $ | 530,733 |
ACCO Brands Corp. (b) | | 32,678 | | | 112,739 |
American Ecology Corp. | | 10,910 | | | 220,709 |
American Reprographics Co. (b) | | 23,904 | | | 164,938 |
ATC Technology Corp. (b) | | 13,111 | | | 191,814 |
Bowne & Co., Inc. | | 18,709 | | | 110,009 |
Cenveo, Inc. (a) (b) | | 31,208 | | | 138,876 |
Clean Harbors, Inc. (b) | | 13,383 | | | 849,018 |
Comfort Systems USA, Inc. | | 24,012 | | | 255,968 |
Consolidated Graphics, Inc. (b) | | 7,728 | | | 174,962 |
Cornell Companies, Inc. (b) | | 7,626 | | | 141,767 |
Courier Corp. (a) | | 10,526 | | | 188,415 |
Deluxe Corp. | | 32,151 | | | 480,979 |
EnergySolutions, Inc. | | 21,760 | | | 122,944 |
Ennis, Inc. | | 15,615 | | | 189,098 |
Fuel Tech, Inc. (a) (b) | | 10,672 | | | 113,016 |
G&K Services, Inc. | | 12,200 | | | 246,684 |
GeoEye, Inc. (a) (b) | | 10,978 | | | 211,107 |
Healthcare Services Group, Inc. (a) | | 28,064 | | | 447,060 |
Herman Miller, Inc. | | 39,315 | | | 512,274 |
HNI Corp. (a) | | 30,271 | | | 479,493 |
Innerworkings, Inc. (a) (b) | | 21,565 | | | 141,251 |
Interface, Inc. | | 33,244 | | | 154,252 |
Kimball International, Inc. (Class B) (a) | | 28,479 | | | 245,204 |
Knoll, Inc. | | 30,139 | | | 271,854 |
M&F Worldwide Corp. (a) (b) | | 8,341 | | | 128,868 |
McGrath Rentcorp | | 15,045 | | | 321,361 |
Mine Safety Appliances Co. (a) | | 20,956 | | | 501,058 |
Mobile Mini, Inc. (a) (b) | | 23,164 | | | 334,025 |
Multi-Color Corp. (a) | | 6,895 | | | 109,079 |
Rollins, Inc. | | 29,043 | | | 525,097 |
Schawk, Inc. (a) | | 10,309 | | | 118,141 |
Standard Parking Corp. (b) | | 5,891 | | | 113,932 |
Sykes Enterprises, Inc. (b) | | 20,294 | | | 388,021 |
Team, Inc. (b) | | 12,181 | | | 337,414 |
Tetra Technologies, Inc. (b) | | 39,824 | | | 961,750 |
The GEO Group, Inc. (b) | | 34,657 | | | 624,866 |
The Standard Register Co. | | 10,679 | | | 95,363 |
United Stationers, Inc. (b) | | 14,796 | | | 495,518 |
Viad Corp. | | 14,216 | | | 351,704 |
Waste Connections, Inc. (b) | | 52,589 | | | 1,660,235 |
Waste Services, Inc. | | 17,330 | | | 114,031 |
| | | | | |
| | | | | 13,875,627 |
| | | | | |
| | |
Commercial Banks—7.9% | | | | | |
1st Source Corp. | | 10,619 | | | 250,927 |
Ameris Bancorp | | 9,428 | | | 111,722 |
Ames National Corp. | | 4,449 | | | 118,076 |
Arrow Financial Corp. | | 6,737 | | | 169,368 |
Bancfirst Corp. | | 5,056 | | | 267,564 |
Banco Latinoamericano de Exportaciones S.A. | | 17,785 | | | 255,393 |
Banctrust Financial Group, Inc. | | 12,058 | | | 177,976 |
Bank of the Ozarks, Inc. (a) | | 7,390 | | | 219,040 |
Banner Corp. | | 10,368 | | | 97,563 |
Boston Private Financial Holdings, Inc. | | 36,709 | | | 251,090 |
Bryn Mawr Bank Corp. | | 4,797 | | | 96,420 |
| | | | | |
| Security Description | | Shares | | Value* |
| | | | | |
| | |
Commercial Banks—(Continued) | | | | | |
Camden National Corp. (a) | | 5,621 | | $ | 151,655 |
Capital City Bank Group, Inc. (a) | | 7,854 | | | 213,943 |
Capitol Bancorp, Ltd. | | 10,229 | | | 79,786 |
Cardinal Financial Corp. | | 18,171 | | | 103,393 |
Cascade Bancorp. (a) | | 13,690 | | | 92,407 |
Cathay General Bancorp (a) | | 32,868 | | | 780,615 |
Centerstate Banks of Florida, Inc. | | 6,416 | | | 109,008 |
Central Pacific Financial Corp. (a) | | 19,720 | | | 197,989 |
Chemical Financial Corp. (a) | | 17,023 | | | 474,601 |
Citizens & Northern Corp. | | 6,716 | | | 132,641 |
Citizens Republic Bancorp, Inc. (b) | | 84,861 | | | 252,886 |
City Holdings Co. | | 9,914 | | | 344,809 |
CoBiz Financial, Inc. | | 12,936 | | | 125,997 |
Columbia Banking System, Inc. | | 15,187 | | | 181,181 |
Community Bank System, Inc. | | 21,718 | | | 529,702 |
Community Trust Bancorp, Inc. | | 9,791 | | | 359,819 |
CVB Financial Corp. (a) | | 46,000 | | | 547,400 |
East West Bancorp, Inc. (a) | | 41,034 | | | 655,313 |
Enterprise Financial Services Corp. (a) | | 8,030 | | | 122,377 |
Farmers Capital Bank Corp. | | 4,290 | | | 104,762 |
Financial Institutions, Inc. | | 8,161 | | | 117,110 |
First Bancorp (a) | | 10,486 | | | 192,418 |
First Bancorp (Puerto Rico) (a) | | 47,002 | | | 523,602 |
First Bancorp, Inc. | | 5,982 | | | 118,982 |
First Busey Corp. (a) | | 16,930 | | | 308,803 |
First Commonwealth Financial Corp. (a) | | 56,035 | | | 693,713 |
First Community Bancshares, Inc. (a) | | 6,026 | | | 210,127 |
First Financial Bancorp | | 25,847 | | | 320,244 |
First Financial Bankshares, Inc. (a) | | 13,782 | | | 760,904 |
First Financial Corp. | | 6,809 | | | 279,101 |
First Merchants Corp. | | 11,118 | | | 246,931 |
First Midwest Bancorp, Inc. | | 32,527 | | | 649,564 |
First South BanCorp, Inc. (a) | | 5,773 | | | 72,509 |
FirstMerit Corp. | | 51,974 | | | 1,070,145 |
FNB Corp. (a) | | 56,644 | | | 747,701 |
Frontier Financial Corp. (a) | | 32,200 | | | 140,392 |
Glacier Bancorp, Inc. | | 40,573 | | | 771,698 |
Green Bancshares, Inc. (a) | | 9,009 | | | 121,979 |
Guaranty Bancorp (a) (b) | | 31,105 | | | 62,210 |
Hancock Holding Co. (a) | | 16,761 | | | 761,955 |
Harleysville National Corp. (a) | | 28,374 | | | 409,721 |
Heartland Financial USA, Inc. (a) | | 7,703 | | | 158,605 |
Heritage Commerce Corp. | | 7,298 | | | 82,030 |
Home Bancshares, Inc. (a) | | 8,887 | | | 239,505 |
IBERIABANK Corp. | | 10,516 | | | 504,768 |
Independent Bank Corp. | | 10,279 | | | 268,899 |
International Bancshares Corp. | | 34,799 | | | 759,662 |
Investors Bancorp, Inc. (b) | | 29,242 | | | 392,720 |
Lakeland Bancorp, Inc. (a) | | 12,623 | | | 142,135 |
Lakeland Financial Corp. (a) | | 7,109 | | | 169,336 |
MainSource Financial Group, Inc. | | 12,856 | | | 199,268 |
MB Financial, Inc. (a) | | 23,006 | | | 643,018 |
Nara Bancorp, Inc. | | 15,312 | | | 150,517 |
National Penn Bancshares, Inc. (a) | | 52,323 | | | 759,207 |
NBT Bancorp, Inc. | | 21,508 | | | 601,364 |
Northfield Bancorp, Inc. (b) | | 14,322 | | | 161,122 |
Old National Bancorp (a) | | 45,541 | | | 827,025 |
*See accompanying notes to financial statements.
MSF-7
Metropolitan Series Fund, Inc.
Russell 2000 Index Portfolio
Schedule of Investments as of December 31, 2008
Common Stock—(Continued)
| | | | | |
| Security Description | | Shares | | Value* |
| | | | | |
| | |
Commercial Banks—(Continued) | | | | | |
Old Second Bancorp, Inc. (a) | | 7,369 | | $ | 85,480 |
Oriental Financial Group, Inc. | | 14,047 | | | 84,984 |
Pacific Capital Bancorp (a) | | 30,213 | | | 509,995 |
Pacific Continental Corp. | | 7,392 | | | 110,658 |
PacWest Bancorp | | 15,528 | | | 417,703 |
Park National Corp. (a) | | 6,924 | | | 496,797 |
Peapack Gladstone Financial Corp. | | 6,042 | | | 160,959 |
Pennsylvania Commerce Bancorp, Inc. (b) | | 3,609 | | | 96,216 |
People’s Bancorp, Inc. | | 5,816 | | | 111,260 |
Pinnacle Financial Partners, Inc. (b) | | 15,243 | | | 454,394 |
Premierwest Bancorp | | 13,514 | | | 90,409 |
PrivateBancorp, Inc. (a) | | 14,256 | | | 462,750 |
Prosperity Bancshares, Inc. | | 26,788 | | | 792,657 |
Provident Bankshares Corp. (a) | | 19,334 | | | 186,766 |
Republic Bancorp, Inc. (Class A) | | 6,675 | | | 181,560 |
S&T Bancorp, Inc. | | 15,513 | | | 550,711 |
S.Y. Bancorp, Inc. (a) | | 8,983 | | | 247,032 |
Sandy Spring Bancorp, Inc. (a) | | 11,016 | | | 240,479 |
SCBT Financial Corp. | | 7,106 | | | 245,157 |
Seacoast Banking Corp. of Florida | | 10,547 | | | 69,610 |
Shore Bancshares, Inc. | | 6,207 | | | 148,906 |
Sierra Bancorp | | 5,140 | | | 107,940 |
Signature Bank (b) | | 23,932 | | | 686,609 |
Simmons First National Corp. | | 8,478 | | | 249,847 |
Smithtown Bancorp, Inc. (a) | | 7,342 | | | 117,692 |
Southside Bancshares, Inc. | | 8,775 | | | 206,212 |
Southwest Bancorp, Inc. | | 10,385 | | | 134,590 |
State Bancorp, Inc. | | 10,603 | | | 103,273 |
StellarOne Corp. (a) | | 15,621 | | | 263,995 |
Sterling Bancorp | | 13,033 | | | 182,853 |
Sterling Bancshares, Inc. | | 48,745 | | | 296,370 |
Sterling Financial Corp. (a) | | 34,833 | | | 306,530 |
Suffolk Bancorp(a) | | 6,431 | | | 231,066 |
Sun Bancorp, Inc. (b) | | 10,341 | | | 77,454 |
Susquehanna Bancshares, Inc. | | 56,086 | | | 892,328 |
SVB Financial Group (b) | | 20,305 | | | 532,600 |
Texas Capital Bancshares, Inc. (b) | | 19,670 | | | 262,791 |
The Colonial BancGroup, Inc. (a) (b) | | 132,990 | | | 275,289 |
The South Financial Group, Inc. (a) | | 44,741 | | | 193,281 |
Tompkins Financial Corp. | | 3,731 | | | 216,211 |
TowneBank | | 14,459 | | | 358,439 |
TriCo Bancshares (a) | | 9,316 | | | 232,621 |
Trustmark Corp. (a) | | 32,547 | | | 702,690 |
UCBH Holdings, Inc. (a) | | 73,281 | | | 504,173 |
UMB Financial Corp. (a) | | 20,407 | | | 1,002,800 |
Umpqua Holdings Corp. (a) | | 38,555 | | | 557,891 |
Union Bankshares Corp. (a) | | 9,069 | | | 224,911 |
United Bankshares, Inc. (a) | | 25,558 | | | 849,037 |
United Community Banks, Inc. (a) | | 25,325 | | | 343,918 |
United Security Bancshares | | 6,046 | | | 70,013 |
Univest Corp. of Pennsylvania (a) | | 7,788 | | | 250,306 |
Washington Trust Bancorp, Inc. (a) | | 9,162 | | | 180,949 |
WesBanco, Inc. | | 17,979 | | | 489,209 |
West Bancorp, Inc. | | 13,056 | | | 159,936 |
Westamerica Bancorp (a) | | 19,042 | | | 973,998 |
Western Alliance BanCorp (b) | | 14,726 | | | 148,585 |
Wilshire Bancorp, Inc. (a) | | 14,336 | | | 130,171 |
| | | | | |
| Security Description | | Shares | | Value* |
| | | | | |
| | |
Commercial Banks—(Continued) | | | | | |
Wintrust Financial Corp. | | 16,617 | | $ | 341,812 |
Yadkin Valley Financial Corp. | | 7,907 | | | 112,675 |
| | | | | |
| | | | | 40,929,961 |
| | | | | |
| | |
Communications Equipment—2.4% | | | | | |
3Com Corp. (b) | | 273,003 | | | 622,447 |
Acme Packet, Inc. (a) (b) | | 15,723 | | | 82,703 |
Adtran, Inc. | | 37,119 | | | 552,331 |
Airvana, Inc. | | 17,814 | | | 109,022 |
Anaren, Inc. (b) | | 13,662 | | | 163,261 |
Arris Group, Inc. (b) | | 83,114 | | | 660,756 |
Aruba Networks, Inc. (a) (b) | | 35,336 | | | 90,107 |
Avocent Corp. (b) | | 30,183 | | | 540,578 |
Bel Fuse, Inc. (Class B) (a) | | 7,133 | | | 151,220 |
BigBand Networks, Inc. (b) | | 23,069 | | | 127,341 |
Black Box Corp. | | 12,292 | | | 321,067 |
Blue Coat Systems, Inc. (b) | | 20,555 | | | 172,662 |
Cogo Group, Inc. (b) | | 17,560 | | | 85,342 |
Comtech Telecommunications Corp. (b) | | 15,422 | | | 706,636 |
DG FastChannel, Inc. (b) | | 14,043 | | | 175,257 |
Digi International, Inc. (b) | | 18,330 | | | 148,656 |
EMS Technologies, Inc. (b) | | 12,768 | | | 330,308 |
Emulex Corp. (b) | | 56,197 | | | 392,255 |
Extreme Networks, Inc. (a) (b) | | 74,142 | | | 173,492 |
Finisar Corp. (a) (b) | | 205,504 | | | 78,092 |
Globecomm Systems, Inc. (b) | | 14,070 | | | 77,244 |
Harmonic, Inc. (b) | | 58,826 | | | 330,014 |
Harris Stratex Networks, Inc. (a) (b) | | 13,458 | | | 69,443 |
Hughes Communications, Inc. (a) (b) | | 4,058 | | | 64,685 |
Infinera Corp. (a) (b) | | 60,445 | | | 541,587 |
InterDigital, Inc. (b) (d) | | 31,506 | | | 866,415 |
Ixia (b) | | 26,295 | | | 151,985 |
Loral Space & Communications, Inc. (b) | | 6,397 | | | 92,948 |
MRV Communications, Inc. (a) (b) | | 90,098 | | | 69,375 |
Netgear, Inc. (b) | | 21,529 | | | 245,646 |
Neutral Tandem, Inc. (b) | | 11,068 | | | 179,523 |
Oplink Communications, Inc. (b) | | 14,091 | | | 121,183 |
PC-Tel, Inc. (b) | | 14,472 | | | 95,081 |
Plantronics, Inc. | | 31,840 | | | 420,288 |
Polycom, Inc. (b) | | 58,781 | | | 794,131 |
Riverbed Technology, Inc. (a) (b) | | 38,051 | | | 433,401 |
SeaChange International, Inc. (b) | | 21,156 | | | 152,535 |
ShoreTel, Inc. (a) (b) | | 29,847 | | | 134,013 |
Sonus Networks, Inc. (a) (b) | | 144,761 | | | 228,722 |
Starent Networks Corp. (a) (b) | | 19,794 | | | 236,142 |
Sycamore Networks, Inc. (b) | | 127,467 | | | 342,886 |
Symmetricom, Inc. (a) (b) | | 28,539 | | | 112,729 |
Tekelec, Inc. (b) | | 44,100 | | | 588,294 |
UTStarcom, Inc. (a) (b) | | 77,850 | | | 144,022 |
ViaSat, Inc. (b) | | 16,884 | | | 406,567 |
| | | | | |
| | | | | 12,582,392 |
| | | | | |
| | |
Computers & Peripherals—0.7% | | | | | |
3PAR, Inc. (b) | | 18,633 | | | 142,915 |
Adaptec, Inc. (b) | | 81,124 | | | 267,709 |
Avid Technology, Inc. (a) (b) | | 22,062 | | | 240,696 |
*See accompanying notes to financial statements.
MSF-8
Metropolitan Series Fund, Inc.
Russell 2000 Index Portfolio
Schedule of Investments as of December 31, 2008
Common Stock—(Continued)
| | | | | |
| Security Description | | Shares | | Value* |
| | | | | |
| | |
Computers & Peripherals—(Continued) | | | | | |
Compellent Technologies, Inc. (a) (b) | | 9,865 | | $ | 95,987 |
Data Domain, Inc. (a) (b) | | 21,547 | | | 405,084 |
Electronics for Imaging, Inc. (b) | | 33,985 | | | 324,897 |
Imation Corp. (a) | | 21,384 | | | 290,181 |
Immersion Corp. (a) (b) | | 16,446 | | | 96,867 |
Intermec, Inc. (a) (b) | | 39,805 | | | 528,610 |
Intevac, Inc. (b) | | 14,334 | | | 72,673 |
Netezza Corp. (b) | | 26,060 | | | 173,038 |
Novatel Wireless, Inc. (a) (b) | | 18,653 | | | 86,550 |
Palm, Inc. (a) (b) | | 77,857 | | | 239,021 |
Rackable Systems, Inc. (a) (b) | | 18,071 | | | 71,200 |
Rimage Corp. (b) | | 6,814 | | | 91,376 |
STEC, Inc. (a) (b) | | 20,594 | | | 87,730 |
Stratasys, Inc. (a) (b) | | 11,733 | | | 126,130 |
Super Micro Computer, Inc. (b) | | 15,529 | | | 98,299 |
Synaptics, Inc. (a) (b) | | 22,643 | | | 374,968 |
| | | | | |
| | | | | 3,813,931 |
| | | | | |
| | |
Construction & Engineering—1.0% | | | | | |
Dycom Industries, Inc. (b) | | 26,092 | | | 214,476 |
EMCOR Group, Inc. (b) | | 45,795 | | | 1,027,182 |
Furmanite Corp. (b) | | 25,504 | | | 137,467 |
Granite Construction, Inc. (a) | | 22,508 | | | 988,777 |
Great Lakes Dredge & Dock Corp. | | 28,321 | | | 117,532 |
Insituform Technologies, Inc. (a) (b) | | 18,179 | | | 357,945 |
Layne Christensen Co. (b) | | 12,615 | | | 302,886 |
MasTec, Inc. (b) | | 29,193 | | | 338,055 |
Michael Baker Corp. | | 5,009 | | | 184,882 |
Northwest Pipe Co. (b) | | 5,677 | | | 241,897 |
Orion Marine Group, Inc. (a) (b) | | 14,296 | | | 138,099 |
Perini Corp. (a) (b) | | 33,893 | | | 792,418 |
Pike Electric Corp. (b) | | 10,661 | | | 131,130 |
Sterling Construction Co., Inc. (a) (b) | | 8,227 | | | 152,529 |
| | | | | |
| | | | | 5,125,275 |
| | | | | |
| | |
Construction Materials—0.2% | | | | | |
Headwaters, Inc. (a) (b) | | 27,972 | | | 188,811 |
Texas Industries, Inc. (a) | | 16,438 | | | 567,111 |
U.S. Concrete, Inc. (b) | | 39,530 | | | 132,821 |
| | | | | |
| | | | | 888,743 |
| | | | | |
| | |
Consumer Finance—0.3% | | | | | |
Advanta Corp. (Class B) | | 22,458 | | | 46,937 |
Cash America International, Inc. | | 18,731 | | | 512,293 |
Dollar Financial Corp. (b) | | 16,563 | | | 170,599 |
Ezcorp., Inc. (b) | | 25,729 | | | 391,338 |
First Cash Financial Services, Inc. (b) | | 12,600 | | | 240,156 |
Nelnet, Inc. (b) | | 10,868 | | | 155,738 |
World Acceptance Corp. (a) (b) | | 12,260 | | | 242,258 |
| | | | | |
| | | | | 1,759,319 |
| | | | | |
| | |
Containers & Packaging—0.4% | | | | | |
AEP Industries, Inc. (b) | | 4,004 | | | 70,390 |
Graphic Packaging Holding Co. (a) (b) | | 99,937 | | | 113,928 |
Myers Industries, Inc. | | 18,955 | | | 151,640 |
| | | | | |
| Security Description | | Shares | | Value* |
| | | | | |
| | |
Containers & Packaging—(Continued) | | | | | |
Rock-Tenn Co. | | 25,936 | | $ | 886,493 |
Silgan Holdings, Inc. | | 17,127 | | | 818,842 |
| | | | | |
| | | | | 2,041,293 |
| | | | | |
| | |
Distributors—0.0% | | | | | |
Audiovox Corp. (b) | | 12,365 | | | 61,949 |
Core-Mark Holding Co., Inc. (b) | | 5,639 | | | 121,351 |
| | | | | |
| | | | | 183,300 |
| | | | | |
| | |
Diversified Consumer Services—1.0% | | | | | |
American Public Education, Inc. (a) (b) | | 7,447 | | | 276,954 |
Capella Education Co. (b) | | 9,374 | | | 550,816 |
Coinstar, Inc. (a) (b) | | 18,307 | | | 357,170 |
Corinthian Colleges, Inc. (a) (b) | | 58,171 | | | 952,259 |
Grand Canyon Education, Inc. (b) | | 7,515 | | | 141,132 |
Jackson Hewitt Tax Service, Inc. (a) | | 19,469 | | | 305,469 |
K12, Inc. (b) | | 4,707 | | | 89,763 |
Matthews International Corp. | | 21,647 | | | 794,012 |
Pre-Paid Legal Services, Inc. (a) (b) | | 4,860 | | | 181,229 |
Regis Corp. | | 27,373 | | | 397,730 |
Sotheby’s (a) | | 45,005 | | | 400,094 |
Steiner Leisure, Ltd. (b) | | 10,437 | | | 308,100 |
Stewart Enterprises, Inc. (a) | | 59,993 | | | 180,579 |
thinkorswim Group, Inc. (a) (b) | | 39,002 | | | 219,191 |
Universal Technical Institute, Inc. (a) (b) | | 14,118 | | | 242,406 |
| | | | | |
| | | | | 5,396,904 |
| | | | | |
| | |
Diversified Financial Services—0.5% | | | | | |
Compass Diversified Holdings (a) | | 19,791 | | | 222,649 |
Encore Capital Group, Inc. | | 9,815 | | | 70,668 |
Financial Federal Corp. | | 16,143 | | | 375,648 |
Interactive Brokers Group, Inc. (b) | | 27,598 | | | 493,728 |
Life Partners Holdings, Inc. | | 4,033 | | | 176,000 |
MarketAxess Holdings, Inc. (b) | | 22,737 | | | 185,534 |
Medallion Financial Corp. | | 10,546 | | | 80,466 |
PHH Corp. (b) | | 34,498 | | | 439,159 |
Pico Holdings, Inc. (a) (b) | | 10,763 | | | 286,081 |
Portfolio Recovery Associates, Inc. (a) (b) | | 10,501 | | | 355,354 |
| | | | | |
| | | | | 2,685,287 |
| | | | | |
|
Diversified Telecommunication Services—0.9% |
Alaska Communication Systems Group, Inc. (a) | | 28,336 | | | 265,792 |
Atlantic Tele-Network, Inc. | | 5,823 | | | 154,601 |
Cbeyond, Inc. (a) (b) | | 15,923 | | | 254,449 |
Cincinnati Bell, Inc. (b) | | 150,258 | | | 289,998 |
Cogent Communications Group, Inc. (a) (b) | | 30,249 | | | 197,526 |
Consolidated Communications Holdings, Inc. (a) | | 14,378 | | | 170,811 |
Fairpoint Communications, Inc. (a) | | 54,444 | | | 178,576 |
General Communication, Inc. (a) (b) | | 33,319 | | | 269,551 |
Global Crossing, Ltd. (a) (b) | | 20,150 | | | 159,991 |
Iowa Telecommunications Services, Inc. (a) | | 21,245 | | | 303,379 |
NTELOS Holdings Corp. | | 19,410 | | | 478,650 |
PAETEC Holding Corp. (b) | | 80,095 | | | 115,337 |
Premiere Global Services, Inc. (b) | | 37,778 | | | 325,268 |
Shenandoah Telecommunications Co. | | 14,453 | | | 405,407 |
*See accompanying notes to financial statements.
MSF-9
Metropolitan Series Fund, Inc.
Russell 2000 Index Portfolio
Schedule of Investments as of December 31, 2008
Common Stock—(Continued)
| | | | | |
| Security Description | | Shares | | Value* |
| | | | | |
|
Diversified Telecommunication Services—(Continued) |
tw telecom, Inc. (a) (b) | | 94,490 | | $ | 800,330 |
| | | | | |
| | | | | 4,369,666 |
| | | | | |
|
Electric Utilities—1.7% |
Allete, Inc. | | 16,982 | | | 548,009 |
Central Vermont Public Service Corp. | | 7,804 | | | 186,203 |
CLECO Corp. (a) | | 40,390 | | | 922,104 |
El Paso Electric Co. (b) | | 28,290 | | | 511,766 |
IDACORP, Inc. | | 30,372 | | | 894,455 |
ITC Holdings Corp. | | 33,035 | | | 1,442,969 |
MGE Energy, Inc. | | 14,934 | | | 492,822 |
Portland General Electric Co. | | 41,963 | | | 817,019 |
The Empire District Electric Co. | | 21,975 | | | 386,760 |
UIL Holdings Corp. | | 17,054 | | | 512,132 |
Unisource Energy Corp. (a) | | 22,299 | | | 654,699 |
Westar Energy, Inc. | | 70,119 | | | 1,438,141 |
| | | | | |
| | | | | 8,807,079 |
| | | | | |
|
Electrical Equipment—2.0% |
A.O. Smith Corp. | | 13,278 | | | 391,967 |
Acuity Brands, Inc. (a) | | 27,361 | | | 955,172 |
Advanced Battery Technologies, Inc. (a) (b) | | 30,239 | | | 80,436 |
American Superconductor Corp. (a) (b) | | 27,164 | | | 443,045 |
AZZ, Inc. (a) (b) | | 7,338 | | | 184,184 |
Baldor Electric Co. | | 31,034 | | | 553,957 |
Belden, Inc. (a) | | 30,704 | | | 641,100 |
Brady Corp. | | 33,910 | | | 812,144 |
Capstone Turbine Corp. (a) (b) | | 133,589 | | | 112,215 |
Encore Wire Corp. (a) | | 14,708 | | | 278,864 |
Ener1, Inc. (a) (b) | | 24,918 | | | 178,164 |
Energy Conversion Devices, Inc. (a) (b) | | 29,723 | | | 749,317 |
EnerSys (b) | | 18,079 | | | 198,869 |
Evergreen Solar, Inc. (a) (b) | | 100,895 | | | 321,855 |
Franklin Electric Co., Inc. (a) | | 15,538 | | | 436,773 |
FuelCell Energy, Inc. (a) (b) | | 50,459 | | | 195,781 |
GrafTech International, Ltd. (b) | | 78,717 | | | 654,925 |
II-VI, Inc. (b) | | 16,368 | | | 312,465 |
LaBarge, Inc. (b) | | 8,720 | | | 125,132 |
LSI Industries, Inc. | | 16,398 | | | 112,654 |
Microvision, Inc. (b) | | 39,881 | | | 67,000 |
Plug Power, Inc. (a) (b) | | 57,674 | | | 58,827 |
Polypore International, Inc. (b) | | 10,847 | | | 82,003 |
Powell Industries, Inc. (b) | | 4,404 | | | 127,804 |
Power-One, Inc. (b) | | 57,357 | | | 68,255 |
Preformed Line Products Co. | | 2,003 | | | 92,218 |
Regal-Beloit Corp. | | 21,703 | | | 824,497 |
Ultralife Corp. (a) | | 8,980 | | | 120,422 |
Valence Technology, Inc. (a) (b) | | 37,370 | | | 68,013 |
Vicor Corp. (a) | | 15,700 | | | 103,777 |
Woodward Governor Co. | | 38,890 | | | 895,248 |
| | | | | |
| | | | | 10,247,083 |
| | | | | |
|
Electronic Equipment, Instruments & Components—1.7% |
Agilysys, Inc. | | 20,665 | | | 88,653 |
Anixter International, Inc. (a) (b) | | 21,041 | | | 633,755 |
| | | | | |
| Security Description | | Shares | | Value* |
| | | | | |
|
Electronic Equipment, Instruments & Components—(Continued) |
Benchmark Electronics, Inc. (b) | | 43,585 | | $ | 556,581 |
Brightpoint, Inc. (b) | | 30,518 | | | 132,753 |
Checkpoint Systems, Inc. (b) | | 26,372 | | | 259,501 |
China Security & Surveillance Technology, Inc. (a) (b) | | 18,338 | | | 81,237 |
Cogent, Inc. (a) (b) | | 27,200 | | | 369,104 |
Cognex Corp. | | 27,796 | | | 411,381 |
Coherent, Inc. (b) | | 15,435 | | | 331,235 |
Comverge, Inc. (a) (b) | | 14,757 | | | 72,309 |
CTS Corp. | | 24,167 | | | 133,160 |
Daktronics, Inc. (a) | | 24,015 | | | 224,780 |
DTS, Inc. (a) (b) | | 12,053 | | | 221,173 |
Echelon Corp. (a) (b) | | 22,668 | | | 184,744 |
Electro Rent Corp. | | 15,175 | | | 169,353 |
Electro Scientific Industries, Inc. (b) | | 17,241 | | | 117,066 |
FARO Technologies, Inc. (a) (b) | | 11,147 | | | 187,938 |
ICx Technologies, Inc. | | 9,961 | | | 78,792 |
Insight Enterprises, Inc. (b) (d) | | 31,718 | | | 218,854 |
IPG Photonics Corp. (a) (b) | | 12,833 | | | 169,139 |
L-1 Identity Solutions, Inc. (a) (b) | | 46,548 | | | 313,734 |
Littelfuse, Inc. (b) | | 13,779 | | | 228,731 |
Measurement Specialties, Inc. (b) | | 10,016 | | | 69,611 |
Mercury Computer Systems, Inc. (b) | | 12,071 | | | 76,168 |
Methode Electronics, Inc. | | 22,249 | | | 149,958 |
MTS Systems Corp. | | 11,959 | | | 318,588 |
Multi-Fineline Electronix, Inc. (a) (b) | | 5,936 | | | 69,392 |
Newport Corp. (b) | | 26,749 | | | 181,358 |
NVE Corp. | | 3,316 | | | 86,647 |
OSI Systems, Inc. (b) | | 10,131 | | | 140,314 |
Park Electrochemical Corp. | | 12,787 | | | 242,442 |
Plexus Corp. (b) (d) | | 27,090 | | | 459,176 |
RadiSys Corp. (a) (b) | | 14,648 | | | 81,003 |
Rofin-Sinar Technologies, Inc. (a) (b) | | 19,918 | | | 409,912 |
Rogers Corp. (b) | | 11,170 | | | 310,191 |
Sanmina-SCI Corp. (b) | | 346,519 | | | 162,864 |
Scansource, Inc. (a) (b) | | 16,538 | | | 318,687 |
SYNNEX Corp. (a) (b) | | 9,776 | | | 110,762 |
Technitrol, Inc. | | 27,072 | | | 94,211 |
TTM Technologies, Inc. (b) | | 26,267 | | | 136,851 |
Universal Display Corp. (a) (b) | | 19,791 | | | 187,025 |
Zygo Corp. (b) | | 11,525 | | | 79,638 |
| | | | | |
| | | | | 8,868,771 |
| | | | | |
| | |
Energy Equipment & Services—1.1% | | | | | |
Allis-Chalmers Energy, Inc. (a) (b) | | 32,506 | | | 178,783 |
Basic Energy Services, Inc. (b) | | 26,849 | | | 350,111 |
Bristow Group, Inc. (a) | | 16,194 | | | 433,837 |
Bronco Drilling Co., Inc. (a) (b) | | 25,638 | | | 165,621 |
Cal Dive International, Inc. (b) | | 32,206 | | | 209,661 |
CARBO Ceramics, Inc. (a) | | 14,047 | | | 499,090 |
Complete Production Services, Inc. (b) | | 37,636 | | | 306,733 |
Dawson Geophysical Co. (b) | | 5,124 | | | 91,258 |
Dril-Quip, Inc. (b) | | 23,039 | | | 472,530 |
Gulf Island Fabrication, Inc. (a) | | 8,075 | | | 116,361 |
Gulfmark Offshore, Inc. (b) | | 15,050 | | | 358,040 |
Hornbeck Offshore Services, Inc. (a) (b) | | 15,736 | | | 257,126 |
ION Geophysical Corp. (a) (b) | | 52,448 | | | 179,897 |
*See accompanying notes to financial statements.
MSF-10
Metropolitan Series Fund, Inc.
Russell 2000 Index Portfolio
Schedule of Investments as of December 31, 2008
Common Stock—(Continued)
| | | | | |
| Security Description | | Shares | | Value* |
| | | | | |
| | |
Energy Equipment & Services—(Continued) | | | | | |
Lufkin Industries, Inc. | | 9,623 | | $ | 331,994 |
Matrix Service Co. (b) | | 18,598 | | | 142,647 |
NATCO Group, Inc. (b) | | 13,050 | | | 198,099 |
Natural Gas Services Group, Inc. (a) (b) | | 8,238 | | | 83,451 |
Newpark Resources, Inc. (b) | | 59,296 | | | 219,395 |
Parker Drilling Co. (b) | | 73,654 | | | 213,597 |
PHI, Inc. (a) (b) | | 8,963 | | | 125,572 |
Pioneer Drilling Co. (a) (b) | | 36,355 | | | 202,497 |
Precision Drilling Trust | | 19,779 | | | 165,948 |
RPC, Inc. (a) | | 23,695 | | | 231,263 |
Superior Well Services, Inc. (b) | | 16,346 | | | 163,460 |
T-3 Energy Services, Inc. (b) | | 8,164 | | | 77,068 |
Willbros Group, Inc. (a) (b) | | 25,158 | | | 213,088 |
| | | | | |
| | | | | 5,987,127 |
| | | | | |
| | |
Food & Staples Retailing—1.0% | | | | | |
American Dairy, Inc. (a) | | 4,895 | | | 73,621 |
Arden Group, Inc. | | 779 | | | 98,154 |
Casey’s General Stores, Inc. | | 34,126 | | | 777,049 |
Great Atlantic & Pacific Tea Co. (a) (b) | | 23,378 | | | 146,580 |
Ingles Markets, Inc. | | 7,334 | | | 129,005 |
Nash Finch Co. (a) | | 8,007 | | | 359,434 |
Pricesmart, Inc. | | 8,493 | | | 175,465 |
Ruddick Corp. | | 28,590 | | | 790,513 |
Spartan Stores, Inc. | | 14,846 | | | 345,170 |
Susser Holdings Corp | | 5,337 | | | 70,929 |
The Andersons, Inc. (a) | | 12,096 | | | 199,342 |
The Pantry, Inc. (b) | | 14,653 | | | 314,307 |
United Natural Foods, Inc. (a) (b) | | 27,427 | | | 488,749 |
Village Supermarket, Inc. | | 2,156 | | | 123,733 |
Weis Markets, Inc. | | 7,822 | | | 263,054 |
Winn-Dixie Stores, Inc. (b) | | 37,194 | | | 598,823 |
| | | | | |
| | | | | 4,953,928 |
| | | | | |
| | |
Food Products—1.9% | | | | | |
Alico, Inc. | | 2,563 | | | 105,057 |
B&G Foods, Inc. | | 15,047 | | | 81,254 |
Cal-Maine Foods, Inc. | | 8,978 | | | 257,669 |
Calavo Growers, Inc. | | 7,587 | | | 87,250 |
Chiquita Brands International, Inc. (a) (b) | | 28,967 | | | 428,132 |
Darling International, Inc. (b) | | 52,851 | | | 290,152 |
Diamond Foods, Inc. (a) | | 11,210 | | | 225,881 |
Farmer Bros. Co. | | 4,569 | | | 113,951 |
Flowers Foods, Inc. (a) | | 50,614 | | | 1,232,957 |
Fresh Del Monte Produce, Inc. (b) | | 28,757 | | | 644,732 |
Green Mountain Coffee Roasters, Inc. (a) (b) | | 11,336 | | | 438,703 |
Griffin Land & Nurseries, Inc. | | 2,418 | | | 89,127 |
Hain Celestial Group, Inc. (a) (b) | | 27,811 | | | 530,912 |
Imperial Sugar Co. (a) | | 6,849 | | | 98,215 |
J&J Snack Foods Corp. | | 9,782 | | | 350,978 |
Lancaster Colony Corp. | | 12,997 | | | 445,797 |
Lance, Inc. | | 16,482 | | | 378,097 |
Ralcorp Holdings, Inc. (b) (d) | | 36,659 | | | 2,140,886 |
Sanderson Farms, Inc. (a) | | 13,479 | | | 465,834 |
Smart Balance, Inc. (a) (b) | | 42,576 | | | 289,517 |
Synutra International, Inc. (b) | | 7,279 | | | 80,215 |
| | | | | |
| Security Description | | Shares | | Value* |
| | | | | |
| | |
Food Products—(Continued) | | | | | |
Tootsie Roll Industries, Inc. (a) | | 15,965 | | $ | 408,864 |
TreeHouse Foods, Inc. (a) (b) | | 19,425 | | | 529,137 |
Zhongpin, Inc. (a) (b) | | 13,539 | | | 162,468 |
| | | | | |
| | | | | 9,875,785 |
| | | | | |
| | |
Gas Utilities—1.5% | | | | | |
Chesapeake Utilities Corp. | | 4,668 | | | 146,949 |
New Jersey Resources Corp. | | 28,147 | | | 1,107,584 |
Nicor, Inc. | | 29,602 | | | 1,028,374 |
Northwest Natural Gas Co. | | 17,364 | | | 768,010 |
Piedmont Natural Gas Co. (a) | | 48,070 | | | 1,522,377 |
South Jersey Industries, Inc. (a) | | 19,676 | | | 784,089 |
Southwest Gas Corp. | | 29,070 | | | 733,145 |
The Laclede Group, Inc. | | 14,354 | | | 672,341 |
WGL Holdings, Inc. | | 33,147 | | | 1,083,575 |
| | | | | |
| | | | | 7,846,444 |
| | | | | |
| | |
Health Care Equipment & Supplies—3.7% | | | | | |
Abaxis, Inc. (a) (b) | | 14,594 | | | 233,942 |
ABIOMED, Inc. (a) (b) | | 22,685 | | | 372,488 |
Accuray, Inc. (a) (b) | | 25,622 | | | 132,210 |
Align Technology, Inc. (a) (b) | | 41,474 | | | 362,897 |
American Medical Systems Holdings, Inc. (a) (b) | | 46,536 | | | 418,359 |
Analogic Corp. | | 9,258 | | | 252,558 |
Angiodynamics, Inc. (b) | | 16,977 | | | 232,415 |
ArthroCare Corp. (a) (b) | | 17,369 | | | 82,850 |
Atrion Corp. | | 1,058 | | | 102,732 |
Cantel Medical Corp. | | 8,706 | | | 127,717 |
Cardiac Science Corp. | | 13,791 | | | 103,433 |
Conceptus, Inc. (a) (b) | | 20,238 | | | 308,022 |
Conmed Corp. (b) | | 19,090 | | | 457,015 |
CryoLife, Inc. (b) | | 19,595 | | | 190,267 |
Cyberonics, Inc. (a) (b) | | 16,539 | | | 274,051 |
Datascope Corp. | | 9,172 | | | 479,145 |
ev3, Inc. (b) | | 47,024 | | | 286,846 |
Exactech, Inc. (b) | | 5,322 | | | 89,622 |
Greatbatch, Inc. (a) (b) | | 14,650 | | | 387,639 |
Haemonetics Corp. (a) (b) | | 16,668 | | | 941,742 |
Hansen Medical, Inc. (a) (b) | | 12,148 | | | 87,709 |
I-Flow Corp. (b) | | 19,111 | | | 91,733 |
ICU Medical, Inc. (b) | | 7,464 | | | 247,357 |
Immucor, Inc. (b) | | 47,050 | | | 1,250,589 |
Insulet Corp. (a) (b) | | 12,961 | | | 100,059 |
Integra LifeSciences Holdings Corp. (a) (b) | | 11,261 | | | 400,554 |
Invacare Corp. (a) | | 21,559 | | | 334,596 |
IRIS International, Inc. (b) | | 13,110 | | | 182,753 |
Kensey Nash Corp. (b) | | 5,237 | | | 101,650 |
Masimo Corp. (a) (b) | | 31,279 | | | 933,053 |
Medical Action Industries, Inc. (b) | | 10,034 | | | 100,340 |
Mentor Corp. (a) | | 22,570 | | | 698,090 |
Meridian Bioscience, Inc. | | 27,470 | | | 699,661 |
Merit Medical Systems, Inc. (b) | | 18,475 | | | 331,257 |
Micrus Endovascular Corp. (a) (b) | | 9,469 | | | 109,935 |
Natus Medical, Inc. (b) | | 18,650 | | | 241,517 |
Neogen Corp. (b) | | 10,072 | | | 251,599 |
NuVasive, Inc. (a) (b) | | 24,156 | | | 837,005 |
*See accompanying notes to financial statements.
MSF-11
Metropolitan Series Fund, Inc.
Russell 2000 Index Portfolio
Schedule of Investments as of December 31, 2008
Common Stock—(Continued)
| | | | | |
| Security Description | | Shares | | Value* |
| | | | | |
|
Health Care Equipment & Supplies—(Continued) |
OraSure Technologies, Inc. (b) | | 34,671 | | $ | 127,589 |
Orthofix International NV (b) | | 11,410 | | | 174,915 |
Orthovita, Inc. | | 45,538 | | | 154,374 |
Palomar Medical Technologies, Inc. (b) | | 11,206 | | | 129,205 |
Quidel Corp. (b) | | 19,051 | | | 248,997 |
RTI Biologics, Inc. (a) (b) | | 36,658 | | | 101,176 |
Sirona Dental Systems, Inc. (a) (b) | | 10,033 | | | 105,346 |
Somanetics Corp. (b) | | 9,278 | | | 153,180 |
SonoSite, Inc. (b) | | 10,253 | | | 195,627 |
Stereotaxis, Inc. (b) | | 19,636 | | | 86,398 |
STERIS Corp. | | 38,449 | | | 918,547 |
SurModics, Inc. (a) (b) | | 9,719 | | | 245,599 |
Symmetry Medical, Inc. (b) | | 23,943 | | | 190,826 |
Synovis Life Technologies, Inc. (b) | | 9,090 | | | 170,347 |
Thoratec Corp. (a) (b) | | 35,982 | | | 1,169,055 |
TomoTherapy, Inc. (a) (b) | | 28,676 | | | 68,249 |
Vnus Medical Technologies, Inc. (b) | | 9,368 | | | 151,949 |
Volcano Corp. (b) | | 31,778 | | | 476,670 |
West Pharmaceutical Services, Inc. (a) | | 22,003 | | | 831,053 |
Wright Medical Group, Inc. (a) (b) | | 24,478 | | | 500,086 |
Zoll Medical Corp. (b) | | 13,957 | | | 263,648 |
| | | | | |
| | | | | 19,298,243 |
| | | | | |
| | |
Health Care Providers & Services—3.3% | | | | | |
Air Methods Corp. (a) (b) | | 6,724 | | | 107,517 |
Alliance Imaging, Inc. (b) | | 16,629 | | | 132,533 |
Almost Family, Inc. (a) (b) | | 4,862 | | | 218,693 |
Amedisys, Inc. (a) (b) | | 18,064 | | | 746,766 |
AMERIGROUP Corp. (b) | | 34,288 | | | 1,012,182 |
AMN Healthcare Services, Inc. (b) | | 21,359 | | | 180,697 |
AmSurg Corp. (b) | | 21,523 | | | 502,347 |
Assisted Living Concepts, Inc. (a) (b) | | 37,605 | | | 156,061 |
athenahealth, Inc. (b) | | 13,877 | | | 522,053 |
BIO-Reference Labs, Inc. (b) | | 7,862 | | | 206,220 |
BMP Sunstone Corp. (b) | | 16,733 | | | 93,203 |
CardioNet, Inc. (b) | | 3,324 | | | 81,937 |
Catalyst Health Solutions, Inc. (b) | | 21,754 | | | 529,710 |
Centene Corp. (b) | | 28,806 | | | 567,766 |
Chemed Corp. | | 15,910 | | | 632,741 |
Corvel Corp. (b) | | 5,760 | | | 126,605 |
Cross Country Healthcare, Inc. (a) (b) | | 22,155 | | | 194,742 |
Emergency Medical Services Corp. (a) (b) | | 5,882 | | | 215,340 |
Emeritus Corp. (a) (b) | | 13,754 | | | 137,953 |
Genoptix, Inc. (b) | | 6,000 | | | 204,480 |
Gentiva Health Services, Inc. (b) | | 16,446 | | | 481,210 |
Hanger Orthopedic Group, Inc. (b) | | 20,660 | | | 299,777 |
Healthsouth Corp. (a) (b) | | 58,276 | | | 638,705 |
Healthspring, Inc. (b) | | 32,796 | | | 654,936 |
Healthways, Inc. (b) | | 23,126 | | | 265,486 |
HMS Holdings Corp. (b) | | 16,943 | | | 534,043 |
inVentiv Health, Inc. (b) | | 21,700 | | | 250,418 |
Kindred Healthcare, Inc. (b) | | 18,529 | | | 241,247 |
Landauer, Inc. | | 5,855 | | | 429,171 |
LHC Group, Inc. (b) | | 9,790 | | | 352,440 |
Magellan Health Services, Inc. (b) | | 27,500 | | | 1,076,900 |
Medcath Corp. (a) (b) | | 11,258 | | | 117,533 |
| | | | | |
| Security Description | | Shares | | Value* |
| | | | | |
|
Health Care Providers & Services—(Continued) |
Molina Healthcare, Inc. (a) (b) | | 8,887 | | $ | 156,500 |
MWI Veterinary Supply, Inc. (b) | | 7,031 | | | 189,556 |
National Healthcare Corp. (a) | | 5,865 | | | 297,004 |
Odyssey HealthCare, Inc. (b) | | 18,943 | | | 175,223 |
Owens & Minor, Inc. | | 27,821 | | | 1,047,461 |
PharMerica Corp. (a) (b) | | 20,347 | | | 318,837 |
PSS World Medical, Inc. (a) (b) | | 40,661 | | | 765,240 |
Psychiatric Solutions, Inc. (a) (b) | | 36,388 | | | 1,013,406 |
RehabCare Group, Inc. (b) | | 10,778 | | | 163,394 |
Res-Care, Inc. (b) | | 16,070 | | | 241,371 |
Skilled Healthcare Group, Inc. (b) | | 14,177 | | | 119,654 |
Sun Healthcare Group, Inc. (b) | | 26,563 | | | 235,082 |
Triple-S Management Corp. (a) (b) | | 10,309 | | | 118,553 |
The Ensign Group, Inc. | | 5,940 | | | 99,436 |
U.S. Physical Therapy, Inc. (b) | | 8,827 | | | 117,664 |
Universal American Corp. (b) | | 28,541 | | | 251,732 |
| | | | | |
| | | | | 17,221,525 |
| | | | | |
| | |
Health Care Technology—0.5% | | | | | |
Allscripts-Misys Heathcare Solutions, Inc. (a) (b) | | 96,202 | | | 954,324 |
Computer Programs & Systems, Inc. | | 5,856 | | | 156,941 |
Eclipsys Corp. (b) | | 37,263 | | | 528,762 |
MedAssets, Inc. (b) | | 10,952 | | | 159,899 |
Omnicell, Inc. (b) | | 20,699 | | | 252,734 |
Phase Forward, Inc. (b) | | 28,519 | | | 357,058 |
Vital Images, Inc. (a) (b) | | 10,111 | | | 140,644 |
| | | | | |
| | | | | 2,550,362 |
| | | | | |
| | |
Hotels, Restaurants & Leisure—2.2% | | | | | |
AFC Enterprises, Inc. (b) | | 19,632 | | | 92,074 |
Ambassadors Group, Inc. (a) | | 11,473 | | | 105,552 |
Ameristar Casinos, Inc. (a) | | 16,928 | | | 146,258 |
Bally Technologies, Inc. (b) | | 36,834 | | | 885,121 |
BJ’s Restaurants, Inc. (a) (b) | | 10,206 | | | 109,919 |
Bob Evans Farms, Inc. | | 19,755 | | | 403,595 |
Buffalo Wild Wings, Inc. (a) (b) | | 12,741 | | | 326,807 |
California Pizza Kitchen, Inc. (b) | | 16,897 | | | 181,136 |
CEC Entertainment, Inc. (b) | | 14,049 | | | 340,688 |
Churchill Downs, Inc. | | 6,537 | | | 264,226 |
CKE Restaurants, Inc. | | 35,991 | | | 312,402 |
Cracker Barrel Old Country Store (a) | | 14,976 | | | 308,356 |
Denny’s Corp. (b) | | 67,630 | | | 134,584 |
DineEquity, Inc. (a) (b) | | 10,820 | | | 125,079 |
Domino’s Pizza, Inc. (a) (b) | | 26,291 | | | 123,831 |
Gaylord Entertainment Co. (a) (b) | | 26,951 | | | 292,149 |
Jack in the Box, Inc. (a) (b) | | 38,617 | | | 853,050 |
Krispy Kreme Doughnuts, Inc. (a) (b) | | 38,377 | | | 64,473 |
Landry’s Restaurants, Inc. (a) (b) | | 8,548 | | | 99,157 |
Life Time Fitness, Inc. (a) (b) | | 22,744 | | | 294,535 |
Luby’s, Inc. | | 15,897 | | | 66,608 |
Marcus Corp. | | 15,610 | | | 253,350 |
Monarch Casino & Resort, Inc. (b) | | 8,526 | | | 99,328 |
Morgans Hotel Group Co. (a) (b) | | 18,708 | | | 87,179 |
P.F. Chang’s China Bistro, Inc. (a) (b) | | 16,111 | | | 337,364 |
Papa John’s International, Inc. (b) | | 13,676 | | | 252,049 |
Peet’s Coffee & Tea, Inc. (a) (b) | | 8,820 | | | 205,065 |
*See accompanying notes to financial statements.
MSF-12
Metropolitan Series Fund, Inc.
Russell 2000 Index Portfolio
Schedule of Investments as of December 31, 2008
Common Stock—(Continued)
| | | | | |
| Security Description | | Shares | | Value* |
| | | | | |
| | |
Hotels, Restaurants & Leisure—(Continued) | | | | | |
Pinnacle Entertainment, Inc. (a) (b) | | 45,209 | | $ | 347,205 |
Red Robin Gourmet Burgers, Inc. (a) (b) | | 13,382 | | | 225,219 |
Shuffle Master, Inc. (b) | | 36,745 | | | 182,255 |
Sonic Corp. (a) (b) | | 37,820 | | | 460,269 |
Speedway Motorsports, Inc. | | 8,883 | | | 143,105 |
Texas Roadhouse, Inc. (a) (b) | | 31,607 | | | 244,954 |
The Cheesecake Factory (b) | | 43,774 | | | 442,117 |
The Steak n Shake Co. (a) (b) | | 15,973 | | | 95,039 |
Vail Resorts, Inc. (a) (b) | | 20,735 | | | 551,551 |
Wendy’s/Arby’s Group, Inc. (a) | | 260,726 | | | 1,287,986 |
WMS Industries, Inc. (b) | | 29,718 | | | 799,414 |
| | | | | |
| | | | | 11,543,049 |
| | | | | |
|
Household Durables—0.8% |
American Greetings Corp. (Class A) | | 30,939 | | | 234,208 |
Blyth, Inc. | | 15,326 | | | 120,156 |
Cavco Industries Inc. (b) | | 4,504 | | | 121,113 |
CSS Industries, Inc. | | 4,704 | | | 83,449 |
Ethan Allen Interiors, Inc. (a) | | 15,394 | | | 221,212 |
Furniture Brands International, Inc. (b) | | 29,013 | | | 64,119 |
Helen of Troy, Ltd. (b) | | 20,347 | | | 353,224 |
Hovnanian Enterprises, Inc. (Class A) (a) (b) | | 31,771 | | | 54,646 |
iRobot Corp. (a) (b) | | 12,683 | | | 114,527 |
La-Z-Boy, Inc. (a) | | 32,284 | | | 70,056 |
M/I Homes, Inc. (a) (b) | | 8,667 | | | 91,350 |
Meritage Homes Corp. (a) (b) | | 20,380 | | | 248,025 |
National Presto Industries, Inc. | | 3,085 | | | 237,545 |
Ryland Group, Inc. (a) | | 27,611 | | | 487,886 |
Sealy Corp. (b) | | 27,397 | | | 68,766 |
Skyline Corp. | | 4,895 | | | 97,851 |
Standard Pacific Corp. (b) | | 71,046 | | | 126,462 |
Tempur-Pedic International, Inc. (a) (b) | | 47,078 | | | 333,783 |
Tupperware Brands Corp. | | 41,704 | | | 946,681 |
Universal Electronics, Inc. (b) | | 9,803 | | | 159,005 |
| | | | | |
| | | | | 4,234,064 |
| | | | | |
|
Household Products—0.1% |
Central Garden & Pet Co. (b) | | 43,733 | | | 258,025 |
WD-40 Co. (a) | | 10,145 | | | 287,002 |
| | | | | |
| | | | | 545,027 |
| | | | | |
|
Independent Power Producers & Energy Traders—0.1% |
Ormat Technologies, Inc. (a) | | 11,722 | | | 373,580 |
| | | | | |
|
Industrial Conglomerates—0.3% |
Otter Tail Corp. (a) | | 23,260 | | | 542,656 |
Raven Industries, Inc. (a) | | 10,703 | | | 257,942 |
Seaboard Corp. (a) | | 219 | | | 261,486 |
Standex International Corp. | | 11,526 | | | 228,676 |
Tredegar Industries, Inc. | | 16,163 | | | 293,843 |
| | | | | |
| | | | | 1,584,603 |
| | | | | |
|
Insurance—4.3% |
AMBAC Financial Group, Inc. (a) (b) | | 201,101 | | | 261,431 |
American Equity Investment Life Holding Co. (a) | | 36,575 | | | 256,025 |
| | | | | |
| Security Description | | Shares | | Value* |
| | | | | |
|
Insurance—(Continued) |
American Physicians Capital, Inc. | | 6,414 | | $ | 308,513 |
American Safety Insurance Holdings Ltd. | | 7,486 | | | 98,890 |
Amerisafe, Inc. (b) | | 11,822 | | | 242,706 |
Amtrust Financial Services, Inc. (a) | | 9,993 | | | 115,919 |
Argo Group International Holdings, Ltd. (b) | | 20,967 | | | 711,201 |
Aspen Insurance Holdings, Ltd. | | 56,017 | | | 1,358,412 |
Assured Guaranty, Ltd. (a) | | 36,518 | | | 416,305 |
Baldwin & Lyons, Inc. (Class B) | | 6,414 | | | 116,671 |
Castlepoint Holdings, Ltd. | | 23,312 | | | 316,111 |
Citizens, Inc. (a) (b) | | 22,172 | | | 215,068 |
CNA Surety Corp. (b) | | 9,923 | | | 190,522 |
Crawford & Co. (Class B) (a) (b) | | 17,980 | | | 261,429 |
Delphi Financial Group, Inc. | | 25,658 | | | 473,133 |
Donegal Group, Inc. | | 8,649 | | | 145,044 |
eHealth, Inc. (a) (b) | | 16,863 | | | 223,941 |
EMC Insurance Group, Inc. | | 4,088 | | | 104,857 |
Employers Holdings, Inc. | | 33,650 | | | 555,225 |
Enstar Group, Ltd. (b) | | 4,274 | | | 252,764 |
FBL Financial Group, Inc. | | 8,813 | | | 136,161 |
First Mercury Financial Corp. (b) | | 10,341 | | | 147,463 |
Flagstone Reinsurance Holdings, Ltd. (a) | | 20,769 | | | 202,913 |
FPIC Insurance Group, Inc. (b) | | 5,920 | | | 259,178 |
Greenlight Capital Re, Ltd. (b) | | 19,232 | | | 249,824 |
Harleysville Group, Inc. (a) | | 7,934 | | | 275,548 |
Hilltop Holdings, Inc. (b) | | 28,463 | | | 277,230 |
Horace Mann Educators Corp. | | 26,595 | | | 244,408 |
Infinity Property & Casualty Corp. | | 9,479 | | | 442,954 |
IPC Holdings, Ltd. | | 30,710 | | | 918,229 |
Kansas City Life Insurance Co. | | 3,354 | | | 145,396 |
Maiden Holdings, Ltd. (a) | | 34,068 | | | 106,633 |
Max Capital Group, Ltd. | | 37,895 | | | 670,741 |
Meadowbrook Insurance Group, Inc. | | 37,114 | | | 239,014 |
Montpelier Re Holdings, Ltd. | | 61,328 | | | 1,029,697 |
National Financial Partners Corp. (a) (b) | | 26,174 | | | 79,569 |
National Interstate Corp. | | 4,305 | | | 76,930 |
National Western Life Insurance Co. | | 1,512 | | | 255,785 |
Navigators Group, Inc. (b) | | 8,311 | | | 456,357 |
Odyssey Re Holdings Corp. | | 14,479 | | | 750,157 |
Platinum Underwriters Holdings, Ltd. | | 33,116 | | | 1,194,825 |
PMA Capital Corp. (b) | | 28,283 | | | 200,244 |
Presidential Life Corp. | | 15,310 | | | 151,416 |
ProAssurance Corp. (b) | | 21,718 | | | 1,146,276 |
RLI Corp. | | 12,284 | | | 751,289 |
Safety Insurance Group, Inc. | | 10,092 | | | 384,101 |
SeaBright Insurance Holdings, Inc. | | 12,481 | | | 146,527 |
Selective Insurance Group | | 34,176 | | | 783,656 |
State Auto Financial Corp. | | 9,434 | | | 283,586 |
Stewart Information Services Corp. | | 11,597 | | | 272,413 |
The Phoenix Cos., Inc. | | 85,019 | | | 278,012 |
Tower Group, Inc. | | 12,792 | | | 360,862 |
United America Indemity, Ltd. (b) | | 15,178 | | | 194,430 |
United Fire & Casualty Co. | | 14,209 | | | 441,474 |
Validus Holdings, Ltd. | | 41,335 | | | 1,081,324 |
Zenith National Insurance Corp. | | 24,665 | | | 778,674 |
| | | | | |
| | | | | 22,037,463 |
| | | | | |
*See accompanying notes to financial statements.
MSF-13
Metropolitan Series Fund, Inc.
Russell 2000 Index Portfolio
Schedule of Investments as of December 31, 2008
Common Stock—(Continued)
| | | | | |
| Security Description | | Shares | | Value* |
| | | | | |
|
Internet & Catalog Retail—0.4% |
Blue Nile, Inc. (a) (b) | | 10,191 | | $ | 249,578 |
Drugstore.com (b) | | 62,307 | | | 77,261 |
NetFlix, Inc. (a) (b) | | 26,536 | | | 793,161 |
NutriSystem, Inc. (a) | | 20,512 | | | 299,270 |
Orbitz Worldwide, Inc. (a) (b) | | 20,423 | | | 79,241 |
Overstock.com, Inc. (a) (b) | | 10,438 | | | 112,522 |
PetMed Express, Inc. (a) (b) | | 16,381 | | | 288,797 |
Shutterfly, Inc. (a) (b) | | 13,808 | | | 96,518 |
Stamps.com, Inc. (b) | | 10,227 | | | 100,531 |
| | | | | |
| | | | | 2,096,879 |
| | | | | |
|
Internet Software & Services—1.9% |
Ariba, Inc. (b) | | 57,598 | | | 415,282 |
Art Technology Group, Inc. (b) | | 76,761 | | | 148,149 |
AsiaInfo Holdings, Inc. (b) | | 23,217 | | | 274,889 |
Bankrate, Inc. (a) (b) | | 8,478 | | | 322,164 |
comScore, Inc. (a) (b) | | 11,964 | | | 152,541 |
Constant Contact, Inc. (b) | | 13,574 | | | 179,856 |
DealerTrack Holdings, Inc. (b) | | 27,908 | | | 331,826 |
Digital River, Inc. (b) | | 26,392 | | | 654,522 |
DivX, Inc. (b) | | 14,635 | | | 76,541 |
EarthLink, Inc. (b) | | 71,922 | | | 486,193 |
GSI Commerce, Inc. (a) (b) | | 16,053 | | | 168,878 |
InfoSpace, Inc. (b) | | 30,704 | | | 231,815 |
Internap Network Services Corp. (a) (b) | | 30,035 | | | 75,088 |
Internet Brands, Inc. (a) | | 15,937 | | | 92,753 |
Internet Capital Group, Inc. (a) (b) | | 29,139 | | | 158,808 |
Interwoven, Inc. (b) | | 29,924 | | | 377,042 |
j2 Global Communications, Inc. (b) | | 30,847 | | | 618,174 |
Keynote Systems, Inc. (b) | | 10,145 | | | 78,218 |
Liquidity Services, Inc. (b) | | 10,729 | | | 89,373 |
LoopNet, Inc. (a) (b) | | 25,998 | | | 177,306 |
Marchex, Inc. (a) | | 16,789 | | | 97,880 |
MercadoLibre, Inc. (a) (b) | | 16,558 | | | 271,717 |
ModusLink Global Solutions, Inc. (b) | | 29,234 | | | 84,486 |
Move, Inc. (b) | | 70,880 | | | 113,408 |
NIC, Inc. (b) | | 24,542 | | | 112,893 |
Omniture, Inc. (a) (b) | | 40,376 | | | 429,601 |
Perficient, Inc. (b) | | 28,133 | | | 134,476 |
Rackspace Hosting, Inc. (b) | | 12,609 | | | 67,836 |
RealNetworks, Inc. (b) | | 66,317 | | | 234,099 |
S1 Corp. (b) | | 34,158 | | | 269,507 |
SAVVIS, Inc. (a) (b) | | 24,770 | | | 170,665 |
SonicWall, Inc. (b) | | 40,485 | | | 161,130 |
SupportSoft, Inc. (b) | | 33,767 | | | 75,300 |
Switch & Data Facilities Co., Inc. (a) (b) | | 13,728 | | | 101,450 |
Terremark Worldwide, Inc. (a) (b) | | 29,552 | | | 114,957 |
The Knot, Inc. (b) | | 17,057 | | | 141,914 |
United Online, Inc. | | 50,168 | | | 304,520 |
ValueClick, Inc. (b) | | 62,129 | | | 424,962 |
Vignette Corp. (b) | | 18,591 | | | 174,941 |
VistaPrint, Ltd. (a) (b) | | 30,022 | | | 558,709 |
Vocus, Inc. (b) | | 10,601 | | | 193,044 |
Websense, Inc. (b) | | 33,750 | | | 505,237 |
| | | | | |
| | | | | 9,852,150 |
| | | | | |
| | | | | |
| Security Description | | Shares | | Value* |
| | | | | |
|
IT Services—1.8% |
Acxiom Corp. (b) | | 39,865 | | $ | 323,305 |
CACI International, Inc. (Class A) (b) (d) | | 19,310 | | | 870,688 |
Cass Information Systems, Inc. (a) | | 4,912 | | | 149,620 |
Ciber, Inc. (b) | | 32,578 | | | 156,700 |
CSG Systems International, Inc. (b) | | 25,464 | | | 444,856 |
Cybersource Corp. (b) | | 46,971 | | | 563,182 |
Euronet Worldwide, Inc. (a) (b) | | 31,152 | | | 361,675 |
ExlService Holdings, Inc. (a) (b) | | 14,049 | | | 120,400 |
Forrester Research, Inc. (b) | | 12,247 | | | 345,488 |
Gartner, Inc. (Class A) (b) | | 41,305 | | | 736,468 |
Heartland Payment Systems, Inc. (a) | | 16,385 | | | 286,738 |
iGate Corp. (b) | | 15,358 | | | 99,981 |
infoGROUP, Inc. | | 24,161 | | | 114,523 |
Integral Systems, Inc. (b) | | 13,332 | | | 160,651 |
Mantech International Corp. (b) | | 13,882 | | | 752,266 |
Maximus, Inc. | | 11,910 | | | 418,160 |
NCI, Inc. (b) | | 4,528 | | | 136,429 |
Ness Technologies, Inc. (b) | | 26,083 | | | 111,635 |
Online Resources Corp. (b) | | 20,541 | | | 97,364 |
Perot Systems Corp. (b) | | 61,767 | | | 844,355 |
RightNow Technologies, Inc. (b) | | 18,528 | | | 143,221 |
Sapient Corp. (b) | | 57,748 | | | 256,401 |
SRA International, Inc. (b) | | 31,245 | | | 538,976 |
Syntel, Inc. (a) | | 7,885 | | | 182,301 |
TeleTech Holdings, Inc. (b) | | 25,316 | | | 211,389 |
The Hackett Group, Inc. (b) | | 28,213 | | | 82,382 |
TNS, Inc. (a) (b) | | 16,455 | | | 154,512 |
VeriFone Holdings, Inc. (a) (b) | | 44,469 | | | 217,898 |
Wright Express Corp. (b) | | 24,854 | | | 313,160 |
| | | | | |
| | | | | 9,194,724 |
| | | | | |
| | |
Leisure Equipment & Products—0.5% | | | | | |
Brunswick Corp. (a) | | 56,263 | | | 236,867 |
Callaway Golf Co. (a) | | 41,730 | | | 387,672 |
Jakks Pacific, Inc. (a) (b) | | 16,889 | | | 348,420 |
LeapFrog Enterprises, Inc. (b) | | 28,909 | | | 101,181 |
Polaris Industries, Inc. (a) | | 22,365 | | | 640,757 |
Pool Corp. (a) | | 32,671 | | | 587,098 |
RC2 Corp. (b) | | 10,877 | | | 116,058 |
Steinway Musical Instruments, Inc. (b) | | 4,118 | | | 72,106 |
| | | | | |
| | | | | 2,490,159 |
| | | | | |
| | |
Life Sciences Tools & Services—1.3% | | | | | |
Accelrys, Inc. | | 19,395 | | | 84,562 |
Affymetrix, Inc. (b) (d) | | 42,415 | | | 126,821 |
Albany Molecular Research, Inc. (b) | | 13,735 | | | 133,779 |
AMAG Pharmaceuticals, Inc. (a) (b) | | 11,452 | | | 410,554 |
Bio-Rad Laboratories, Inc. (b) | | 12,861 | | | 968,562 |
Bruker Corp. (b) | | 40,189 | | | 162,364 |
Cambrex Corp. | | 14,910 | | | 68,884 |
Clinical Data, Inc. | | 8,228 | | | 73,229 |
Dionex Corp. (b) | | 13,130 | | | 588,880 |
Enzo Biochem, Inc. (a) (b) | | 22,322 | | | 109,155 |
eResearch Technology, Inc. (b) | | 26,533 | | | 175,914 |
Exelixis, Inc. (a) (b) | | 68,977 | | | 346,264 |
Kendle International, Inc. (a) (b) | | 8,850 | | | 227,622 |
*See accompanying notes to financial statements.
MSF-14
Metropolitan Series Fund, Inc.
Russell 2000 Index Portfolio
Schedule of Investments as of December 31, 2008
Common Stock—(Continued)
| | | | | |
| Security Description | | Shares | | Value* |
| | | | | |
| | |
Life Sciences Tools & Services—(Continued) | | | | | |
Luminex Corp. (a) (b) | | 27,286 | | $ | 582,829 |
Medivation, Inc. (a) | | 17,968 | | | 261,794 |
Nektar Therapeutics (a) (b) | | 61,780 | | | 343,497 |
Parexel International Corp. (b) | | 39,231 | | | 380,933 |
Sequenom, Inc. (a) (b) | | 40,007 | | | 793,739 |
Varian, Inc. (b) | | 18,573 | | | 622,381 |
| | | | | |
| | | | | 6,461,763 |
| | | | | |
| | |
Machinery—2.9% | | | | | |
3D Systems Corp. (b) | | 11,338 | | | 90,024 |
Actuant Corp. (a) | | 39,384 | | | 749,084 |
Albany International Corp. (Class A) | | 19,528 | | | 250,740 |
Altra Holdings, Inc. (b) | | 17,632 | | | 139,469 |
American Railcar Industries, Inc. (a) | | 5,293 | | | 55,735 |
AMPCO-Pittsburgh Corp. | | 5,636 | | | 122,301 |
Astec Industries, Inc. (a) (b) | | 11,497 | | | 360,201 |
Badger Meter, Inc. (a) | | 9,649 | | | 280,014 |
Barnes Group, Inc. | | 31,270 | | | 453,415 |
Blount International, Inc. (b) | | 25,432 | | | 241,095 |
Briggs & Stratton Corp. (a) | | 33,045 | | | 581,262 |
Cascade Corp. (a) | | 8,261 | | | 246,673 |
Chart Industries, Inc. (b) | | 18,382 | | | 195,401 |
Circor International, Inc. | | 11,100 | | | 305,250 |
Clarcor, Inc. (a) | | 34,089 | | | 1,131,073 |
Colfax Corp. (a) (b) | | 14,330 | | | 148,889 |
Columbus McKinnon Corp. (b) | | 11,301 | | | 154,259 |
Dynamic Materials Corp. (a) | | 10,450 | | | 201,790 |
Energy Recovery, Inc. (a) (b) | | 10,987 | | | 83,281 |
EnPro Industries, Inc. (b) | | 14,882 | | | 320,558 |
ESCO Technologies, Inc. (b) | | 16,850 | | | 690,008 |
Federal Signal Corp. | | 31,621 | | | 259,608 |
Force Protection, Inc. (b) | | 41,101 | | | 245,784 |
FreightCar America, Inc. (a) | | 7,047 | | | 128,749 |
Graham Corp. (a) | | 6,734 | | | 72,862 |
Greenbrier Cos., Inc. | | 9,593 | | | 65,904 |
K-Tron International, Inc. (a) (b) | | 1,654 | | | 132,155 |
Kadant, Inc. (b) | | 8,363 | | | 112,733 |
Kaydon Corp. | | 22,613 | | | 776,757 |
LB Foster Co. (b) | | 6,950 | | | 217,396 |
Lindsay Corp. (a) | | 7,760 | | | 246,690 |
Met-Pro Corp. (a) | | 10,588 | | | 141,032 |
Mueller Industries, Inc. | | 24,461 | | | 613,482 |
Mueller Water Products, Inc. (a) | | 78,673 | | | 660,853 |
NACCO Industries, Inc. | | 3,492 | | | 130,636 |
Nordson Corp. (a) | | 22,593 | | | 729,528 |
PMFG, Inc. (a) (b) | | 8,902 | | | 85,103 |
RBC Bearings, Inc. (b) | | 14,425 | | | 292,539 |
Robbins & Myers, Inc. | | 18,236 | | | 294,876 |
Sun Hydraulics Corp. (a) | | 7,039 | | | 132,615 |
Tecumseh Products Co. | | 10,819 | | | 103,321 |
Tennant Co. (a) | | 10,316 | | | 158,866 |
The Gorman-Rupp Co. (a) | | 9,576 | | | 298,005 |
The Middleby Corp. (a) (b) | | 11,127 | | | 303,433 |
Thermadyne Holdings Corp. (b) | | 9,451 | | | 64,928 |
Titan International, Inc. | | 22,213 | | | 183,257 |
Titan Machinery, Inc. (a) (b) | | 5,112 | | | 71,875 |
| | | | | |
| Security Description | | Shares | | Value* |
| | | | | |
| | |
Machinery—(Continued) | | | | | |
Turbochef Technologies, Inc. (b) | | 18,040 | | $ | 88,576 |
Wabash National Corp. (a) (b) | | 17,632 | | | 79,344 |
Wabtec Corp. | | 31,779 | | | 1,263,215 |
Watts Water Technologies, Inc. (a) | | 19,051 | | | 475,704 |
| | | | | |
| | | | | 15,230,348 |
| | | | | |
| | |
Marine—0.2% | | | | | |
American Commercial Lines, Inc. (a) (b) | | 31,509 | | | 154,394 |
Eagle Bulk Shipping, Inc. (a) | | 30,187 | | | 205,875 |
Genco Shipping & Trading, Ltd. (a) | | 16,321 | | | 241,551 |
Horizon Lines, Inc. (a) | | 20,292 | | | 70,819 |
International Shipholding Corp. | | 4,053 | | | 102,663 |
TBS International, Ltd. (a) (b) | | 6,937 | | | 69,578 |
| | | | | |
| | | | | 844,880 |
| | | | | |
| | |
Media—0.8% | | | | | |
Arbitron, Inc. (a) | | 18,813 | | | 249,837 |
Belo Corp. (Class A) | | 59,052 | | | 92,121 |
Cinemark Holdings, Inc. (a) | | 22,209 | | | 165,013 |
CKX, Inc. (b) | | 35,334 | | | 129,676 |
Cox Radio, Inc. (Class A) (a) (b) | | 21,485 | | | 129,125 |
Dolan Media Co. (a) (b) | | 14,833 | | | 97,749 |
Fisher Communications, Inc. (a) (b) | | 3,926 | | | 81,033 |
Global Sources, Ltd. (b) | | 10,946 | | | 59,656 |
Harte-Hanks, Inc. (a) | | 24,803 | | | 154,771 |
Interactive Data Corp. | | 24,889 | | | 613,763 |
Knology, Inc. (a) (b) | | 24,666 | | | 127,276 |
Live Nation, Inc. (a) (b) | | 49,895 | | | 286,397 |
Marvel Entertainment, Inc. (b) | | 33,021 | | | 1,015,396 |
Mediacom Communications Corp. (a) (b) | | 34,201 | | | 147,064 |
National CineMedia, Inc. (a) | | 30,180 | | | 306,025 |
Outdoor Channel Holdings, Inc. (b) | | 11,405 | | | 85,423 |
RCN Corp. (b) | | 24,738 | | | 145,954 |
Scholastic Corp. (a) | | 15,917 | | | 216,153 |
Sinclair Broadcast Group, Inc. | | 35,527 | | | 110,134 |
World Wrestling Entertainment, Inc. (a) | | 13,534 | | | 149,957 |
| | | | | |
| | | | | 4,362,523 |
| | | | | |
| | |
Metals & Mining—1.0% | | | | | |
A.M. Castle & Co. | | 11,149 | | | 120,744 |
Allied Nevada Gold Corp. (a) (b) | | 31,716 | | | 160,483 |
AMCOL International Corp. (a) | | 17,195 | | | 360,235 |
Brush Engineered Material, Inc. (a) (b) | | 12,873 | | | 163,745 |
Coeur D’Alene Mines Corp. (a) | | 357,943 | | | 314,990 |
Compass Minerals International, Inc. | | 22,036 | | | 1,292,632 |
Haynes International, Inc. (a) (b) | | 8,860 | | | 218,133 |
Hecla Mining Co. (a) (b) | | 114,395 | | | 320,306 |
Horsehead Holding Corp. (b) | | 23,752 | | | 111,634 |
Kaiser Aluminum Corp. | | 10,376 | | | 233,667 |
Olympic Steel, Inc. | | 6,018 | | | 122,587 |
Royal Gold, Inc. (a) | | 20,085 | | | 988,383 |
RTI International Metals, Inc. (a) (b) | | 14,086 | | | 201,571 |
Stillwater Mining Co. (a) (b) | | 29,045 | | | 143,482 |
Universal Stainless & Alloy (b) | | 4,250 | | | 61,582 |
Worthington Industries, Inc. (a) | | 45,793 | | | 504,639 |
| | | | | |
| | | | | 5,318,813 |
| | | | | |
*See accompanying notes to financial statements.
MSF-15
Metropolitan Series Fund, Inc.
Russell 2000 Index Portfolio
Schedule of Investments as of December 31, 2008
Common Stock—(Continued)
| | | | | |
| Security Description | | Shares | | Value* |
| | | | | |
| | |
Multi-Utilities—0.6% | | | | | |
Avista Corp. | | 35,689 | | $ | 691,653 |
Black Hills Corp. | | 25,800 | | | 695,568 |
CH Energy Group, Inc. (a) | | 9,850 | | | 506,192 |
NorthWestern Corp. | | 25,215 | | | 591,796 |
PNM Resources, Inc. | | 56,877 | | | 573,320 |
| | | | | |
| | | | | 3,058,529 |
| | | | | |
| | |
Multiline Retail—0.2% | | | | | |
99 Cents Only Stores (b) | | 31,594 | | | 345,323 |
Dillard’s, Inc. | | 37,757 | | | 149,895 |
Fred’s, Inc. (a) | | 31,780 | | | 341,953 |
| | | | | |
| | | | | 837,171 |
| | | | | |
| | |
Oil, Gas & Consumable Fuels—3.0% | | | | | |
Alon USA Energy, Inc. (a) | | 9,248 | | | 84,619 |
Arena Resources, Inc. (b) | | 25,500 | | | 716,295 |
Atlas America, Inc. | | 26,436 | | | 392,575 |
ATP Oil & Gas Corp. (a) (b) | | 18,136 | | | 106,096 |
Berry Petroleum Co. | | 28,659 | | | 216,662 |
Bill Barrett Corp. (b) | | 26,491 | | | 559,755 |
BPZ Resources, Inc. (a) (b) | | 48,087 | | | 307,757 |
Brigham Exploration Co. (a) (b) | | 34,342 | | | 109,894 |
Carrizo Oil & Gas, Inc. (b) | | 21,748 | | | 350,143 |
Cheniere Energy, Inc. (a) (b) | | 34,100 | | | 97,185 |
Clayton Williams Energy, Inc. (b) | | 3,590 | | | 163,130 |
Clean Energy Fuels Corp. (a) (b) | | 26,172 | | | 158,079 |
Comstock Resources, Inc. (b) | | 30,503 | | | 1,441,267 |
Concho Resources, Inc. (b) | | 37,052 | | | 845,527 |
Contango Oil & Gas Co. (a) (b) | | 8,999 | | | 506,644 |
Delta Petroleum Corp. (a) (b) | | 39,961 | | | 190,214 |
DHT Maritime, Inc. (a) | | 25,976 | | | 143,907 |
Energy XXI Bermuda, Ltd. | | 76,222 | | | 60,215 |
EXCO Resources, Inc. (a) (b) | | 98,815 | | | 895,264 |
FX Energy, Inc. (a) (b) | | 45,308 | | | 126,409 |
General Maritime Corp. (a) | | 31,394 | | | 339,055 |
GMX Resources, Inc. (a) (b) | | 11,323 | | | 286,698 |
Golar LNG, Ltd. | | 21,224 | | | 143,474 |
Goodrich Petroleum Corp. (a) (b) | | 15,394 | | | 461,050 |
Gran Tierra Energy, Inc. (a) (b) | | 152,693 | | | 427,540 |
Gulfport Energy Corp. (a) (b) | | 17,744 | | | 70,089 |
Harvest Natural Resources, Inc. (a) (b) | | 22,532 | | | 96,888 |
International Coal Group, Inc. (a) (b) | | 103,477 | | | 237,997 |
James River Coal Co. (a) (b) | | 19,449 | | | 298,153 |
Knightbridge Tankers, Ltd. (a) | | 10,435 | | | 152,873 |
McMoRan Exploration Co. (a) (b) | | 41,245 | | | 404,201 |
Nordic American Tanker Shipping, Ltd. (a) | | 23,124 | | | 780,435 |
Oilsands Quest, Inc. (a) (b) | | 146,579 | | | 107,003 |
Panhandle Oil & Gas, Inc. | | 5,102 | | | 91,836 |
Parallel Petroleum Corp. (b) | | 48,389 | | | 97,262 |
Penn Virginia Corp. | | 27,897 | | | 724,764 |
Petroleum Development Corp. (a) (b) | | 9,706 | | | 233,623 |
PetroQuest Energy, Inc. (a) (b) | | 28,823 | | | 194,844 |
Rentech, Inc. (a) (b) | | 133,219 | | | 90,589 |
Rosetta Resources, Inc. (b) | | 41,753 | | | 295,611 |
Ship Finance International, Ltd. (a) | | 27,269 | | | 301,322 |
Stone Energy Corp. (b) | | 21,793 | | | 240,159 |
| | | | | |
| Security Description | | Shares | | Value* |
| | | | | |
| | |
Oil, Gas & Consumable Fuels—(Continued) | | | | | |
Swift Energy Co. (b) | | 20,570 | | $ | 345,782 |
Teekay Tankers, Ltd. | | 9,320 | | | 118,364 |
USEC, Inc. (a) (b) | | 82,809 | | | 371,812 |
Vaalco Energy, Inc. (b) | | 40,432 | | | 300,814 |
Warren Resources, Inc. (b) | | 57,247 | | | 113,922 |
Western Refining, Inc. (a) (b) | | 20,283 | | | 157,396 |
Westmoreland Coal Co. (b) | | 6,870 | | | 76,257 |
World Fuel Services Corp. | | 20,146 | | | 745,402 |
| | | | | |
| | | | | 15,776,852 |
| | | | | |
| | |
Paper & Forest Products—0.3% | | | | | |
Buckeye Technologies, Inc. (b) | | 26,263 | | | 95,597 |
Clearwater Paper Corp. (b) | | 7,604 | | | 63,798 |
Deltic Timber Corp. | | 8,066 | | | 369,019 |
Glatfelter | | 34,445 | | | 320,339 |
Louisiana-Pacific Corp. (a) (b) | | 67,795 | | | 105,760 |
Neenah Paper, Inc. | | 10,748 | | | 95,012 |
Schweitzer-Mauduit International, Inc. | | 8,700 | | | 174,174 |
Wausau Paper Corp. (a) | | 26,829 | | | 306,924 |
| | | | | |
| | | | | 1,530,623 |
| | | | | |
| | |
Personal Products—0.4% | | | | | |
American Oriental Bioengineering, Inc. (a) (b) | | 41,566 | | | 282,233 |
Chattem, Inc. (a) (b) | | 11,517 | | | 823,811 |
China Sky One Medical, Inc. | | 5,765 | | | 92,182 |
Elizabeth Arden, Inc. (b) | | 14,516 | | | 183,047 |
Inter Parfums, Inc. (a) | | 10,037 | | | 77,084 |
Nu Skin Enterprises, Inc. | | 31,956 | | | 333,301 |
Prestige Brands Holdings, Inc. (b) | | 23,318 | | | 246,005 |
USANA Health Sciences, Inc. (a) (b) | | 5,737 | | | 196,435 |
| | | | | |
| | | | | 2,234,098 |
| | | | | |
| | |
Pharmaceuticals—1.3% | | | | | |
Adolor Corp. (a) (b) | | 33,331 | | | 55,329 |
Akorn, Inc. (a) (b) | | 33,037 | | | 75,985 |
Ardea Bioscience, Inc. | | 8,657 | | | 103,624 |
Auxilium Pharmaceuticals, Inc. (a) (b) | | 26,908 | | | 765,263 |
BioMimetic Therapeutics, Inc. | | 9,666 | | | 89,120 |
Cadence Pharmaceuticals, Inc. (a) (b) | | 14,478 | | | 104,676 |
Cypress Biosciences, Inc. (b) | | 22,201 | | | 151,855 |
Discovery Laboratories, Inc. (a) (b) | | 54,214 | | | 60,720 |
Durect Corp., Inc. (b) | | 48,440 | | | 164,212 |
Inspire Pharmaceutical, Inc. (a) (b) | | 31,626 | | | 113,854 |
KV Pharmaceutical Co. (a) (b) | | 25,617 | | | 73,777 |
Medicis Pharmaceutical Corp. (a) | | 37,076 | | | 515,356 |
Noven Pharmaceuticals, Inc. (a) (b) | | 17,432 | | | 191,752 |
Obagi Medical Products, Inc. (b) | | 13,504 | | | 100,740 |
Optimer Pharmaceuticals, Inc. (a) (b) | | 18,035 | | | 218,404 |
Pain Therapeutics, Inc. (a) (b) | | 19,603 | | | 116,050 |
Par Pharmaceutical Cos., Inc. (b) | | 23,316 | | | 312,668 |
Pozen, Inc. (a) (b) | | 15,141 | | | 76,311 |
Questcor Pharmaceuticals, Inc. (a) (b) | | 30,322 | | | 282,298 |
Salix Pharmaceuticals, Ltd. (a) (b) | | 32,098 | | | 283,425 |
The Medicines Co. (b) | | 35,725 | | | 526,229 |
Valeant Pharmaceuticals International (a) (b) | | 41,907 | | | 959,670 |
*See accompanying notes to financial statements.
MSF-16
Metropolitan Series Fund, Inc.
Russell 2000 Index Portfolio
Schedule of Investments as of December 31, 2008
Common Stock—(Continued)
| | | | | |
| Security Description | | Shares | | Value* |
| | | | | |
| | |
Pharmaceuticals—(Continued) | | | | | |
ViroPharma, Inc. (b) | | 52,041 | | $ | 677,574 |
Vivus, Inc. (a) (b) | | 46,503 | | | 247,396 |
XenoPort, Inc. (a) (b) | | 17,252 | | | 432,680 |
| | | | | |
| | | | | 6,698,968 |
| | | | | |
| | |
Professional Services—1.6% | | | | | |
Administaff, Inc. | | 14,105 | | | 305,796 |
CBIZ, Inc. (a) (b) | | 32,679 | | | 282,673 |
CDI Corp. | | 7,746 | | | 100,233 |
CoStar Group, Inc. (a) (b) | | 12,830 | | | 422,620 |
CRA International, Inc. (b) | | 9,028 | | | 243,124 |
Duff & Phelps Corp. (b) | | 7,904 | | | 151,124 |
Exponent, Inc. (b) | | 9,587 | | | 288,377 |
First Advantage Corp. | | 7,503 | | | 106,167 |
Heidrick & Struggles International, Inc. (a) | | 11,860 | | | 255,464 |
Hill International, Inc. (b) | | 16,010 | | | 112,710 |
Huron Consulting Group, Inc. (a) (b) | | 13,483 | | | 772,171 |
ICF International, Inc. (a) (b) | | 4,800 | | | 117,936 |
Kelly Services, Inc. (Class A) | | 17,549 | | | 228,313 |
Kforce, Inc. (b) | | 18,129 | | | 139,231 |
Korn/Ferry International (b) | | 30,619 | | | 349,669 |
LECG Corp. (b) | | 14,501 | | | 97,302 |
MPS Group, Inc. (b) | | 67,017 | | | 504,638 |
Navigant Consulting, Inc. (b) | | 32,158 | | | 510,347 |
Odyssey Marine Exploration, Inc. (a) (b) | | 36,989 | | | 119,105 |
On Assignment, Inc. (b) | | 20,637 | | | 117,012 |
Resources Connection, Inc. (b) | | 28,983 | | | 474,742 |
School Specialty, Inc. (a) (b) | | 12,829 | | | 245,291 |
The Advisory Board Co. (b) | | 11,952 | | | 266,530 |
TrueBlue, Inc. (a) (b) | | 30,139 | | | 288,430 |
Volt Information Sciences, Inc. (a) (b) | | 7,738 | | | 55,946 |
VSE Corp. | | 2,837 | | | 111,296 |
Watson Wyatt Worldwide, Inc. | | 28,700 | | | 1,372,434 |
| | | | | |
| | | | | 8,038,681 |
| | | | | |
| | |
Real Estate Investment Trusts—5.5% | | | | | |
Acadia Realty Trust | | 21,412 | | | 305,549 |
Agree Realty Corp. | | 4,326 | | | 78,430 |
Alexander’s, Inc. (b) | | 1,300 | | | 331,370 |
American Campus Communities, Inc. | | 27,217 | | | 557,404 |
American Capital Agency Corp. (a) | | 7,451 | | | 159,153 |
Anthracite Capital, Inc. (a) | | 39,169 | | | 87,347 |
Anworth Mortgage Asset Corp. | | 59,403 | | | 381,961 |
Ashford Hospitality Trust, Inc. (a) | | 80,110 | | | 92,127 |
Associated Estates Realty Corp. | | 10,121 | | | 92,405 |
BioMed Realty Trust, Inc. | | 53,970 | | | 632,528 |
Capstead Mortgage Corp. | | 35,788 | | | 385,437 |
Care Investment Trust, Inc. | | 9,450 | | | 73,616 |
Cedar Shopping Centers, Inc. | | 28,436 | | | 201,327 |
Chimera Investment Corp. | | 91,029 | | | 314,050 |
Cogdell Spencer, Inc. | | 7,749 | | | 72,531 |
Colonial Properties Trust (a) | | 31,156 | | | 259,529 |
Corporate Office Properties Trust (a) | | 28,392 | | | 871,634 |
Cousins Properties, Inc. | | 30,499 | | | 422,411 |
DCT Industrial Trust, Inc. | | 111,847 | | | 565,946 |
DiamondRock Hospitality Co. | | 62,158 | | | 315,141 |
| | | | | |
| Security Description | | Shares | | Value* |
| | | | | |
| | |
Real Estate Investment Trusts—(Continued) | | | | | |
EastGroup Properties, Inc. | | 16,332 | | $ | 581,093 |
Education Realty Trust, Inc. | | 19,777 | | | 103,236 |
Entertainment Properties Trust | | 22,169 | | | 660,636 |
Equity Lifestyle Properties, Inc. | | 13,482 | | | 517,170 |
Equity One, Inc. (a) | | 21,357 | | | 378,019 |
Extra Space Storage, Inc. | | 54,099 | | | 558,302 |
FelCor Lodging Trust, Inc. (b) | | 41,820 | | | 76,949 |
First Industrial Realty Trust, Inc. (a) | | 30,864 | | | 233,023 |
First Potomac Realty Trust | | 16,284 | | | 151,441 |
Franklin Street Properties Corp. (a) | | 36,824 | | | 543,154 |
Getty Realty Corp. | | 11,618 | | | 244,675 |
Glimcher Realty Trust (a) | | 22,979 | | | 64,571 |
Hatteras Financial Corp. (a) | | 10,383 | | | 276,188 |
Healthcare Realty Trust, Inc. | | 38,656 | | | 907,643 |
Hersha Hospitality Trust | | 25,342 | | | 76,026 |
Highwoods Properties, Inc. | | 41,688 | | | 1,140,584 |
Home Properties, Inc. (a) | | 20,887 | | | 848,012 |
Inland Real Estate Corp. (a) | | 36,358 | | | 471,927 |
Investors Real Estate Trust | | 38,560 | | | 412,978 |
Kite Realty Group Trust | | 14,565 | | | 80,981 |
LaSalle Hotel Properties (a) | | 24,950 | | | 275,697 |
Lexington Realty Trust (a) | | 50,292 | | | 251,460 |
LTC Properties, Inc. | | 15,049 | | | 305,194 |
Medical Properties Trust, Inc. (a) | | 44,184 | | | 278,801 |
MFA Mortgage Investments, Inc. | | 134,360 | | | 791,380 |
Mid-America Apartment Communities, Inc. | | 17,835 | | | 662,749 |
Mission West Properties, Inc. | | 12,528 | | | 95,839 |
Monmouth Real Estate Investment Corp. | | 13,822 | | | 96,754 |
National Health Investors, Inc. | | 14,649 | | | 401,822 |
National Retail Properties, Inc. | | 52,865 | | | 908,749 |
NorthStar Realty Finance Corp. (a) | | 35,021 | | | 136,932 |
Omega Healthcare Investors, Inc. | | 53,863 | | | 860,192 |
Parkway Properties, Inc. | | 9,472 | | | 170,496 |
Pennsylvania Real Estate Investment Trust (a) | | 23,259 | | | 173,280 |
Post Properties, Inc. (a) | | 29,943 | | | 494,059 |
Potlatch Corp. | | 26,616 | | | 692,282 |
PS Business Parks, Inc. | | 9,502 | | | 424,359 |
RAIT Financial Trust (a) | | 39,676 | | | 103,158 |
Ramco-Gershenson Properties Trust | | 11,167 | | | 69,012 |
Realty Income Corp. (a) | | 67,814 | | | 1,569,894 |
Redwood Trust, Inc. (a) | | 21,610 | | | 322,205 |
Resource Capital Corp. (a) | | 13,847 | | | 53,034 |
Saul Centers, Inc. | | 5,803 | | | 229,219 |
Senior Housing Properties Trust (a) | | 75,116 | | | 1,346,079 |
Sovran Self Storage, Inc. | | 14,398 | | | 518,328 |
Strategic Hotels & Resorts, Inc. (b) | | 54,702 | | | 91,899 |
Sun Communities, Inc. (a) | | 12,799 | | | 179,186 |
Sunstone Hotel Investors, Inc. (a) | | 37,671 | | | 233,183 |
Tanger Factory Outlet Centers (a) | | 21,522 | | | 809,658 |
U-Store-It Trust | | 31,251 | | | 139,067 |
Universal Health Realty Income Trust | | 8,355 | | | 274,963 |
Urstadt Biddle Properties, Inc. | | 12,686 | | | 202,088 |
Washington Real Estate Investment Trust | | 35,366 | | | 1,000,858 |
Winthrop Realty Trust | | 6,380 | | | 69,159 |
| | | | | |
| | | | | 28,757,539 |
| | | | | |
*See accompanying notes to financial statements.
MSF-17
Metropolitan Series Fund, Inc.
Russell 2000 Index Portfolio
Schedule of Investments as of December 31, 2008
Common Stock—(Continued)
| | | | | |
| Security Description | | Shares | | Value* |
| | | | | |
|
Real Estate Management & Development—0.1% |
Avatar Holdings, Inc. (a) (b) | | 3,358 | | $ | 89,054 |
Consolidated-Tomoka Land Co. (a) | | 3,138 | | | 119,840 |
Forestar Group, Inc. (a) (b) | | 23,546 | | | 224,158 |
Tejon Ranch Co. (a) (b) | | 7,567 | | | 187,208 |
| | | | | |
| | | | | 620,260 |
| | | | | |
| | |
Road & Rail—0.8% | | | | | |
Amerco, Inc. (b) | | 6,294 | | | 217,332 |
Arkansas Best Corp. (a) | | 15,099 | | | 454,631 |
Celadon Group, Inc. (b) | | 13,384 | | | 114,166 |
Genesee & Wyoming, Inc. (b) | | 20,451 | | | 623,755 |
Heartland Express, Inc. (a) | | 39,221 | | | 618,123 |
Knight Transportation, Inc. (a) | | 36,396 | | | 586,704 |
Marten Transport, Ltd. (b) | | 14,050 | | | 266,388 |
Old Dominion Freight Line, Inc. (a) (b) | | 19,927 | | | 567,122 |
Patriot Transportation Holdings, Inc. (a) | | 1,157 | | | 81,071 |
Saia, Inc. (b) | | 9,687 | | | 105,201 |
Universal Truckload Services, Inc. | | 4,395 | | | 62,233 |
Werner Enterprises, Inc. (a) | | 30,512 | | | 529,078 |
YRC Worldwide, Inc. (a) (b) | | 37,074 | | | 106,402 |
| | | | | |
| | | | | 4,332,206 |
| | | | | |
|
Semiconductors & Semiconductor Equipment—2.5% |
Actel Corp. (b) | | 16,772 | | | 196,568 |
Advanced Analogic Technologies, Inc. (a) (b) | | 24,209 | | | 73,111 |
Advanced Energy Industries, Inc. (b) | | 23,757 | | | 236,382 |
Amkor Technology, Inc. (b) | | 70,619 | | | 153,949 |
Applied Micro Circuits Corp. (b) | | 42,638 | | | 167,567 |
Atheros Communications, Inc. (b) | | 39,837 | | | 570,067 |
ATMI, Inc. (b) | | 22,055 | | | 340,309 |
Brooks Automation, Inc. (a) (b) | | 47,372 | | | 275,231 |
Cabot Microelectronics Corp. (b) | | 14,624 | | | 381,248 |
Cavium Networks, Inc. (a) (b) | | 19,819 | | | 208,298 |
Ceva, Inc. (b) | | 14,170 | | | 99,190 |
Cirrus Logic, Inc. (b) | | 52,948 | | | 141,901 |
Cohu, Inc. | | 16,023 | | | 194,679 |
Cymer, Inc. (b) | | 19,276 | | | 422,337 |
Diodes, Inc. (a) (b) | | 20,159 | | | 122,164 |
DSP Group, Inc. (a) (b) | | 17,234 | | | 138,217 |
Entegris, Inc. (b) | | 80,270 | | | 175,791 |
Exar Corp. (b) (d) | | 26,962 | | | 179,837 |
FEI Co. (b) | | 23,419 | | | 441,682 |
FormFactor, Inc. (b) (d) | | 34,244 | | | 499,962 |
Hittite Microwave Corp. (b) | | 12,770 | | | 376,204 |
IXYS Corp. | | 21,409 | | | 176,838 |
Kopin Corp. (b) | | 47,669 | | | 97,245 |
Kulicke & Soffa Industries, Inc. (b) | | 32,332 | | | 54,964 |
Lattice Semiconductor Corp. (b) | | 63,675 | | | 96,149 |
Micrel, Inc. | | 32,874 | | | 240,309 |
Microsemi Corp. (b) | | 52,731 | | | 666,520 |
Microtune, Inc. (b) | | 32,159 | | | 65,604 |
MKS Instruments, Inc. (b) | | 35,363 | | | 523,019 |
Monolithic Power Systems, Inc. (b) | | 17,526 | | | 221,003 |
NetLogic Microsystems, Inc. (a) (b) | | 12,862 | | | 283,093 |
OmniVision Technologies, Inc. (a) (b) | | 33,553 | | | 176,153 |
Pericom Semiconductor Corp. (b) | | 16,354 | | | 89,620 |
| | | | | |
| Security Description | | Shares | | Value* |
| | | | | |
|
Semiconductors & Semiconductor Equipment—(Continued) |
PMC-Sierra, Inc. (a) (b) | | 146,801 | | $ | 713,453 |
Power Integrations, Inc. (a) | | 19,758 | | | 392,789 |
RF Micro Devices, Inc. (a) (b) | | 162,114 | | | 126,449 |
Semtech Corp. (b) | | 44,521 | | | 501,752 |
Sigma Designs, Inc. (a) (b) | | 18,438 | | | 175,161 |
Silicon Image, Inc. (b) | | 51,588 | | | 216,670 |
Silicon Storage Technology, Inc. (b) | | 66,738 | | | 152,830 |
Skyworks Solutions, Inc. (b) | | 109,586 | | | 607,106 |
Standard Microsystems Corp. (b) | | 14,611 | | | 238,744 |
Supertex, Inc. (a) (b) | | 6,854 | | | 164,565 |
Tessera Technologies, Inc. (b) | | 36,348 | | | 431,814 |
Transmeta Corp. (a) (b) | | 8,545 | | | 155,519 |
Trident Microsystems, Inc. (b) | | 33,467 | | | 63,253 |
TriQuint Semiconductor, Inc. (b) (d) | | 86,708 | | | 298,276 |
Ultratech, Inc. (b) | | 15,771 | | | 188,621 |
Veeco Instruments, Inc. (b) | | 24,505 | | | 155,362 |
Volterra Semiconductor Corp. (b) | | 16,829 | | | 120,327 |
Zoran Corp. (a) (b) | | 33,953 | | | 231,899 |
| | | | | |
| | | | | 13,019,801 |
| | | | | |
| | |
Software—3.8% | | | | | |
ACI Worldwide, Inc. (a) (b) | | 22,537 | | | 358,338 |
Actuate Corp. (b) | | 36,337 | | | 107,557 |
Advent Software, Inc. (a) (b) | | 12,161 | | | 242,855 |
American Software, Inc. | | 16,487 | | | 77,489 |
Blackbaud, Inc. | | 27,827 | | | 375,664 |
Blackboard, Inc. (b) | | 20,873 | | | 547,499 |
Bottomline Technologies, Inc. (b) | | 12,369 | | | 87,820 |
Commvault Systems, Inc. (b) | | 27,932 | | | 374,568 |
Concur Technologies, Inc. (a) (b) | | 28,992 | | | 951,517 |
DemandTec, Inc. (b) | | 13,832 | | | 111,624 |
Double-Take Software, Inc. (a) (b) | | 11,826 | | | 106,079 |
Ebix, Inc. (a) (b) | | 4,266 | | | 101,957 |
Epicor Software Corp. (a) (b) | | 37,761 | | | 181,253 |
EPIQ Systems, Inc. (a) (b) | | 23,311 | | | 389,527 |
Fair Isaac Corp. | | 31,913 | | | 538,053 |
FalconStor Software, Inc. (b) | | 30,124 | | | 83,745 |
i2 Technologies, Inc. (a) (b) | | 8,649 | | | 55,267 |
Informatica Corp. (b) | | 59,561 | | | 817,772 |
Interactive Intelligence, Inc. (a) (b) | | 8,397 | | | 53,825 |
Jack Henry & Associates, Inc. | | 50,636 | | | 982,845 |
JDA Software Group, Inc. (b) | | 18,999 | | | 249,457 |
Kenexa Corp. (b) | | 15,403 | | | 122,916 |
Lawson Software, Inc. (b) | | 82,021 | | | 388,780 |
Macrovision Solutions Corp. (a) (b) | | 55,563 | | | 702,872 |
Manhattan Associates, Inc. (b) | | 15,513 | | | 245,261 |
Mentor Graphics Corp. (b) | | 58,684 | | | 303,396 |
MICROS Systems, Inc. (b) | | 53,222 | | | 868,583 |
MicroStrategy, Inc. (Class A) (b) | | 6,205 | | | 230,392 |
MSC.Software Corp. (b) | | 27,127 | | | 181,208 |
Net 1 UEPS Technologies, Inc. (a) (b) | | 33,390 | | | 457,443 |
NetScout Systems, Inc. (b) | | 19,729 | | | 170,064 |
OpenTV Corp. (b) | | 62,898 | | | 77,365 |
Opnet Technologies, Inc. (a) | | 9,341 | | | 92,102 |
Parametric Technology Corp. (b) | | 77,235 | | | 977,023 |
Pegasystems, Inc. | | 10,030 | | | 123,971 |
*See accompanying notes to financial statements.
MSF-18
Metropolitan Series Fund, Inc.
Russell 2000 Index Portfolio
Schedule of Investments as of December 31, 2008
Common Stock—(Continued)
| | | | | |
| Security Description | | Shares | | Value* |
| | | | | |
| | |
Software—(Continued) | | | | | |
Phoenix Technologies, Ltd. (b) | | 18,618 | | $ | 65,163 |
Progress Software Corp. (b) | | 27,788 | | | 535,197 |
Quality Systems, Inc. (a) | | 11,861 | | | 517,377 |
Quest Software, Inc. (b) | | 48,854 | | | 615,072 |
Radiant Systems, Inc. (b) | | 15,752 | | | 53,084 |
Smith Micro Software, Inc. (a) (b) | | 18,686 | | | 103,894 |
Solera Holdings, Inc. (b) | | 34,730 | | | 836,993 |
Sourcefire, Inc. | | 14,391 | | | 80,590 |
SPSS, Inc. (b) | | 11,960 | | | 322,442 |
SuccessFactors, Inc. (a) (b) | | 15,533 | | | 89,159 |
Sybase, Inc. (a) (b) (d) | | 52,836 | | | 1,308,748 |
Symyx Technologies (b) | | 19,225 | | | 114,196 |
Synchronoss Technologies, Inc. (a) (b) | | 11,423 | | | 121,769 |
Take-Two Interactive Software, Inc. (b) | | 51,790 | | | 391,532 |
Taleo Corp. (b) | | 14,949 | | | 117,051 |
Telecommunication Systerm, Inc. | | 22,959 | | | 197,218 |
THQ, Inc. (b) | | 42,100 | | | 176,399 |
TIBCO Software, Inc. (b) | | 130,684 | | | 678,250 |
TiVo, Inc. (a) (b) | | 71,013 | | | 508,453 |
Tyler Technologies, Inc. (a) (b) | | 23,370 | | | 279,973 |
Ultimate Software Group, Inc. (a) (b) | | 16,554 | | | 241,688 |
Vasco Data Security International, Inc. (a) (b) | | 18,296 | | | 188,998 |
Wind River Systems, Inc. (b) | | 48,121 | | | 434,533 |
| | | | | |
| | | | | 19,713,866 |
| | | | | |
|
Specialty Retail—2.4% |
Aaron Rents, Inc. (Class B) (a) | | 30,851 | | | 821,254 |
Aeropostale, Inc. (a) (b) (d) | | 45,515 | | | 732,791 |
America’s Car-Mart, Inc. | | 7,441 | | | 102,760 |
Asbury Automotive Group, Inc. | | 21,593 | | | 98,680 |
Bebe Stores, Inc. | | 26,084 | | | 194,847 |
Big 5 Sporting Goods Corp. | | 15,464 | | | 80,567 |
Blockbuster, Inc. (a) (b) | | 121,924 | | | 153,624 |
Brown Shoe Co., Inc. (a) | | 26,195 | | | 221,872 |
Cabela’s, Inc. (a) (b) | | 23,327 | | | 135,996 |
Cato Corp. | | 18,861 | | | 284,801 |
Charlotte Russe Holding, Inc. (b) | | 14,068 | | | 91,301 |
Charming Shoppes, Inc. (a) (b) | | 74,119 | | | 180,850 |
Chico’s FAS, Inc. (b) | | 115,414 | | | 482,431 |
Christopher & Banks Corp. (a) | | 30,606 | | | 171,394 |
Citi Trends, Inc. (a) (b) | | 8,551 | | | 125,871 |
Coldwater Creek, Inc. (a) (b) | | 39,275 | | | 111,934 |
Collective Brands, Inc. (a) (b) (d) | | 42,687 | | | 500,292 |
DSW, Inc. (Class A) (a) (b) | | 9,118 | | | 113,610 |
Genesco, Inc. (a) (b) | | 13,758 | | | 232,785 |
Group 1 Automotive, Inc. (a) | | 15,023 | | | 161,798 |
Gymboree Corp. (b) | | 17,775 | | | 463,750 |
Haverty Furniture Cos., Inc. (a) | | 14,903 | | | 139,045 |
Hibbett Sports, Inc. (a) (b) | | 18,992 | | | 298,364 |
Hot Topic, Inc. (b) | | 28,681 | | | 265,873 |
J. Crew Group, Inc. (a) (b) | | 28,675 | | | 349,835 |
Jo-Ann Stores, Inc. (a) (b) | | 17,237 | | | 267,001 |
Jos. A. Bank Clothiers, Inc. (a) (b) | | 12,192 | | | 318,821 |
Lumber Liquidators, Inc. | | 7,128 | | | 75,272 |
Midas, Inc. (b) | | 10,186 | | | 106,851 |
Monro Muffler, Inc. | | 11,587 | | | 295,469 |
| | | | | |
| Security Description | | Shares | | Value* |
| | | | | |
|
Specialty Retail—(Continued) |
Pacific Sunwear of California, Inc. (b) | | 47,131 | | $ | 74,938 |
Rent-A-Center, Inc. (b) | | 43,400 | | | 766,010 |
Sally Beauty Holdings, Inc. (a) (b) | | 63,633 | | | 362,072 |
Sonic Automotive, Inc. (a) | | 19,007 | | | 75,648 |
Stage Stores, Inc. | | 24,947 | | | 205,813 |
Systemax, Inc. (a) (b) | | 7,935 | | | 85,460 |
The Buckle, Inc. (a) | | 15,325 | | | 334,392 |
The Children’s Place Retail Stores, Inc. (b) | | 15,373 | | | 333,287 |
The Dress Barn, Inc. (a) (b) | | 30,389 | | | 326,378 |
The Finish Line, Inc. (Class A) (b) | | 34,432 | | | 192,819 |
The Men’s Wearhouse, Inc. (a) | | 33,086 | | | 447,984 |
The Pep Boys-Manny, Moe & Jack (a) | | 25,683 | | | 106,071 |
The Wet Seal, Inc. (b) | | 62,348 | | | 185,174 |
Tractor Supply Co. (b) | | 22,731 | | | 821,498 |
Tween Brands, Inc. (b) | | 15,747 | | | 68,027 |
Ulta Salon Cosmetics & Fragrance, Inc. (a) (b) | | 14,415 | | | 119,356 |
Zale Corp. (a) (b) | | 24,736 | | | 82,371 |
Zumiez, Inc. (a) (b) | | 13,421 | | | 99,986 |
| | | | | |
| | | | | 12,267,023 |
| | | | | |
|
Textiles, Apparel & Luxury Goods—1.4% |
Carter’s, Inc. (b) | | 36,774 | | | 708,267 |
Cherokee, Inc. (a) | | 8,189 | | | 142,079 |
Columbia Sportswear Co. (a) | | 8,790 | | | 310,902 |
CROCS, Inc. (a) (b) | | 55,103 | | | 68,328 |
Deckers Outdoor Corp. (b) | | 8,793 | | | 702,297 |
FGX International Holdings, Ltd. (b) | | 9,825 | | | 134,995 |
Fossil, Inc. (b) | | 30,722 | | | 513,057 |
Iconix Brand Group, Inc. (a) (b) | | 38,141 | | | 373,019 |
K-Swiss, Inc. | | 21,850 | | | 249,090 |
Lululemon Athletica, Inc. (a) (b) | | 12,058 | | | 95,620 |
Maidenform Brands, Inc. (b) | | 14,280 | | | 144,942 |
Movado Group, Inc. | | 10,013 | | | 94,022 |
Oxford Industries, Inc. | | 8,566 | | | 75,124 |
Quiksilver, Inc. (b) | | 82,134 | | | 151,127 |
Skechers U.S.A., Inc. (b) | | 21,712 | | | 278,348 |
Steven Madden, Ltd. (b) | | 13,172 | | | 280,827 |
The Warnaco Group, Inc. (b) | | 30,646 | | | 601,581 |
Timberland Co. (Class A) (b) | | 34,662 | | | 400,346 |
True Religion Apparel, Inc. (a) (b) | | 11,524 | | | 143,359 |
Under Armour, Inc. (a) (b) | | 22,523 | | | 536,948 |
Unifi, Inc. | | 31,523 | | | 88,895 |
UniFirst Corp. | | 10,837 | | | 321,750 |
Volcom, Inc. (a) (b) | | 12,211 | | | 133,100 |
Weyco Group, Inc. (a) | | 5,240 | | | 173,182 |
Wolverine World Wide, Inc. | | 33,718 | | | 709,427 |
| | | | | |
| | | | | 7,430,632 |
| | | | | |
|
Thrifts & Mortgage Finance—1.7% |
Abington Bancorp, Inc. | | 17,608 | | | 162,874 |
Bank Mutual Corp. | | 32,564 | | | 375,789 |
BankFinancial Corp. | | 11,879 | | | 121,047 |
Beneficial Mutual Bancorp, Inc. (b) | | 22,606 | | | 254,317 |
Berkshire Hill Bancorp, Inc. | | 7,472 | | | 230,586 |
Brookline Bancorp, Inc. | | 41,732 | | | 444,446 |
Clifton Savings Bancorp, Inc. | | 7,385 | | | 87,586 |
*See accompanying notes to financial statements.
MSF-19
Metropolitan Series Fund, Inc.
Russell 2000 Index Portfolio
Schedule of Investments as of December 31, 2008
Common Stock—(Continued)
| | | | | |
| Security Description | | Shares | | Value* |
| | | | | |
|
Thrifts & Mortgage Finance—(Continued) |
Danvers Bancorp, Inc. (b) | | 12,056 | | $ | 161,189 |
Dime Community Bancshares | | 17,298 | | | 230,063 |
ESSA Bancorp, Inc. (a) | | 12,365 | | | 174,717 |
First Financial Holdings, Inc. | | 6,397 | | | 129,475 |
First Financial Northwest, Inc. | | 16,499 | | | 154,101 |
First Niagara Financial Group, Inc. | | 75,988 | | | 1,228,726 |
Flushing Financial Corp. | | 12,920 | | | 154,523 |
Guaranty Financial Group, Inc. (b) | | 63,848 | | | 166,643 |
Kearny Financial Corp. (a) | | 11,434 | | | 146,355 |
Meridian Interstate Bancorp, Inc. | | 7,545 | | | 69,791 |
NASB Financial, Inc. | | 2,449 | | | 66,123 |
NewAlliance Bancshares, Inc. | | 72,912 | | | 960,251 |
Northwest Bancorp, Inc. | | 11,002 | | | 235,223 |
OceanFirst Financial Corp. | | 6,649 | | | 110,373 |
Ocwen Financial Corp. (a) (b) | | 21,044 | | | 193,184 |
Oritani Financial Corp. (a) (b) | | 9,458 | | | 159,367 |
Provident Financial Services, Inc. | | 39,436 | | | 603,371 |
Provident New York Bancorp | | 26,686 | | | 330,906 |
Radian Group, Inc. | | 54,532 | | | 200,678 |
Rockville Financial, Inc. | | 6,245 | | | 87,243 |
Roma Financial Corp. | | 6,169 | | | 77,668 |
The PMI Group, Inc. (a) | | 57,762 | | | 112,636 |
TrustCo Bank Corp. (a) | | 50,006 | | | 475,557 |
United Financial Bancorp, Inc. | | 13,044 | | | 197,486 |
ViewPoint Financial Group | | 7,611 | | | 122,157 |
Westfield Financial, Inc. | | 22,291 | | | 230,043 |
WSFS Financial Corp. | | 4,144 | | | 198,871 |
| | | | | |
| | | | | 8,653,365 |
| | | | | |
|
Tobacco—0.2% |
Alliance One International, Inc. (b) | | 57,683 | | | 169,588 |
Star Scientific, Inc. (b) | | 44,110 | | | 168,941 |
Universal Corp. | | 16,545 | | | 494,199 |
Vector Group, Ltd. (a) | | 21,791 | | | 296,794 |
| | | | | |
| | | | | 1,129,522 |
| | | | | |
|
Trading Companies & Distributors—0.6% |
Aceto Corp. | | 18,035 | | | 180,530 |
Aircastle, Ltd. | | 32,053 | | | 153,213 |
Applied Industrial Technologies, Inc. | | 29,120 | | | 550,950 |
Beacon Roofing Supply, Inc. (b) | | 29,180 | | | 405,018 |
DXP Enterprises, Inc. (b) | | 5,432 | | | 79,362 |
H&E Equipment Services, Inc. (b) | | 11,032 | | | 85,057 |
Houston Wire & Cable Co. (a) | | 10,450 | | | 97,290 |
Interline Brands, Inc. (b) | | 21,799 | | | 231,723 |
Kaman Corp. | | 17,163 | | | 311,165 |
RSC Holdings, Inc. (a) (b) | | 31,909 | | | 271,865 |
Rush Enterprises, Inc. (b) | | 19,917 | | | 170,689 |
TAL International Group, Inc. (a) | | 8,589 | | | 121,105 |
Watsco, Inc. (a) | | 15,968 | | | 613,171 |
| | | | | |
| | | | | 3,271,138 |
| | | | | |
|
Water Utilities—0.3% |
American State Water Co. | | 11,419 | | | 376,599 |
Cadiz, Inc. (a) (b) | | 7,581 | | | 94,838 |
| | | | | | | |
| Security Description | | Shares | | Value* | |
| | | | | | | |
|
Water Utilities—(Continued) | |
California Water Service Group | | | 12,742 | | $ | 591,611 | |
Connecticut Water Service, Inc. (a) | | | 5,731 | | | 135,309 | |
Consolidated Water Co., Inc. (a) | | | 8,783 | | | 109,788 | |
Middlesex Water Co. | | | 8,945 | | | 154,122 | |
SJW Corp. (a) | | | 9,794 | | | 293,232 | |
| | | | | | | |
| | | | | | 1,755,499 | |
| | | | | | | |
|
Wireless Telecommunication Services—0.2% | |
Centennial Communications Corp. | | | 44,169 | | | 356,002 | |
ICO Global Communications Holdings, Ltd. (a) (b) | | | 62,811 | | | 70,977 | |
Renasant Corp. (a) | | | 12,711 | | | 216,468 | |
Syniverse Holdings, Inc. (b) | | | 34,830 | | | 415,870 | |
USA Mobility, Inc. (b) | | | 15,317 | | | 177,218 | |
| | | | | | | |
| | | | | | 1,236,535 | |
| | | | | | | |
Total Common Stock
(Identified Cost $679,199,484) | | | | | | 487,696,852 | |
| | | | | | | |
|
| Mutual Funds—3.1% | |
|
Exchange Traded Funds—3.1% | |
iShares Russell 2000 Index Fund (a) | | | 322,000 | | | 15,864,940 | |
| | | | | | | |
Total Mutual Funds
(Identified Cost $15,413,819) | | | | | | 15,864,940 | |
| | | | | | | |
|
| Short Term Investments—20.5% | |
| Security Description | | Face
Amount/Shares | | Value* | |
|
Discount Notes—2.9% | |
Federal Home Loan Bank
0.008%, 03/25/09 | | $ | 2,800,000 | | | 2,799,484 | |
1.800%, 01/23/09 | | | 9,800,000 | | | 9,799,940 | |
2.150%, 01/27/09 | | | 1,800,000 | | | 1,799,844 | |
Federal Home Loan Mortgage Corp. 1.700%, 02/27/09 | | | 650,000 | | | 649,897 | |
| | | | | | | |
| | | | | | 15,049,165 | |
| | | | | | | |
|
Mutual Funds—17.6% | |
State Street Navigator Securities Lending Prime Portfolio (e) | | | 91,501,115 | | | 91,501,115 | |
| | | | | | | |
Total Short Term Investments
(Identified Cost $106,550,280) | | | | | | 106,550,280 | |
| | | | | | | |
Total Investments—117.5%
(Identified Cost $801,163,583) (f) | | | | | | 610,112,072 | |
Liabilities in excess of other assets | | | | | | (90,747,858 | ) |
| | | | | | | |
| Total Net Assets—100% | | | | | $ | 519,364,214 | |
| | | | | | | |
*See accompanying notes to financial statements.
MSF-20
Metropolitan Series Fund, Inc.
Russell 2000 Index Portfolio
Schedule of Investments as of December 31, 2008
| (a) | A portion or all of the security was on loan. As of December 31, 2008, the market value of securities loaned was $91,394,780 and the collateral received consisted of cash in the amount of $91,501,115 and non-cash collateral with a value of $143,996. The cash collateral is invested in a money market fund managed by an affiliate of the custodian. The non-cash collateral received consists primarily of government securities and bank letters of credit, and are held for the benefit of the Portfolio at the Portfolio’s custodian. The Portfolio cannot repledge or resell this collateral. As such, these are excluded from the Statement of Assets and Liabilities. |
| (c) | Non-Income Producing; issuer filed under Chapter 11 of the Federal Bankruptcy Code. |
| (d) | All or a portion of the security was pledged as collateral against open futures contracts. |
| (e) | Represents investment of cash collateral received from securities lending transactions. |
| (f) | The aggregate cost of investments for federal income tax purposes as of December 31, 2008 was $807,360,109 and the composition of unrealized appreciation and depreciation of investment securities was $32,885,825 and $(230,133,862), respectively. |
Futures Contracts
| | | | | | | | | | | | | |
Futures Contracts—Long | | Expiration Date | | Number of
Contracts | | Contract
Amount | | Valuation as of
12/31/2008 | | Net Unrealized
Appreciation |
Russell 2000 Mini Index Futures | | 3/20/2009 | | 300 | | $ | 13,439,370 | | $ | 14,937,000 | | $ | 1,497,630 |
| | | | | | | | | | | | | |
The Portfolio adopted the provisions of Statement of Financial Accounting Standards No. 157, “Fair Value Measurements” (FAS 157), effective with the beginning of the Portfolio’s fiscal year. FAS 157 establishes a framework for measuring fair value and expands disclosures about fair value measurements in financial statements. The three levels of the hierarchy under FAS 157 are described below:
Level 1 - quoted prices in active markets for identical securities
Level 2 - other significant observable inputs (including quoted prices for similar securities, interest rates, credit risk, etc.)
Level 3 - significant unobservable inputs (including the Portfolio’s own assumptions in determining the fair value of investments)
The inputs or methodology used for valuing securities are not necessarily an indication of the risk associated with investing in those securities.
The following is a summary of the inputs used to value the Portfolio’s net assets as of December 31, 2008:
| | | | | | |
| Valuation Inputs | | Investments In
Securities | | Other Financial
Instruments* |
Level 1 - Quoted Prices | | $ | 595,062,907 | | $ | 1,497,630 |
Level 2 - Other Significant Observable Inputs | | | 15,049,165 | | | 0 |
Level 3 - Significant Unobservable Inputs | | | 0 | | | 0 |
Total | | $ | 610,112,072 | | $ | 1,497,630 |
* Other financial instruments are derivative instruments not reflected in the Schedule of Investments, such as futures, forwards, swap contracts and written options, which are valued based on the unrealized appreciation/depreciation on the instrument.
*See accompanying notes to financial statements.
MSF-21
Metropolitan Series Fund, Inc.
Russell 2000 Index Portfolio
Statement of Assets & Liabilities
December 31, 2008
| | | | | | | |
Assets | | | | | | | |
Investments at value (a) (b) | | | | | $ | 610,112,072 | |
Cash | | | | | | 782,289 | |
Receivable for: | | | | | | | |
Securities sold | | | | | | 1,906,685 | |
Fund shares sold | | | | | | 791,280 | |
Accrued interest and dividends | | | | | | 761,093 | |
Futures variation margin | | | | | | 429,000 | |
| | | | | | | |
Total Assets | | | | | | 614,782,419 | |
Liabilities | | | | | | | |
Payable for: | | | | | | | |
Securities purchased | | $ | 3,175,977 | | | | |
Fund shares redeemed | | | 580,167 | | | | |
Withholding taxes | | | 509 | | | | |
Collateral for securities loaned | | | 91,501,115 | | | | |
Accrued expenses: | | | | | | | |
Management fees | | | 100,223 | | | | |
Service and distribution fees | | | 23,254 | | | | |
Other expenses | | | 36,960 | | | | |
| | | | | | | |
Total Liabilities | | | | | | 95,418,205 | |
| | | | | | | |
Net Assets | | | | | $ | 519,364,214 | |
| | | | | | | |
Net assets consists of: | | | | | | | |
Capital paid in | | | | | $ | 738,114,544 | |
Undistributed net investment income | | | | | | 10,984,501 | |
Accumulated net realized losses | | | | | | (40,180,925 | ) |
Unrealized depreciation on investments and futures contracts | | | | | | (189,553,906 | ) |
| | | | | | | |
Net Assets | | | | | $ | 519,364,214 | |
| | | | | | | |
| Computation of offering price: | | | | | | | |
Class A | | | | | | | |
Net asset value and redemption price per share ($389,887,826 divided by 43,848,908 shares outstanding) | | | | | $ | 8.89 | |
| | | | | | | |
Class B | | | | | | | |
Net asset value and redemption price per share ($103,465,026 divided by 11,838,454 shares outstanding) | | | | | $ | 8.74 | |
| | | | | | | |
Class E | | | | | | | |
Net asset value and redemption price per share ($26,011,362 divided by 2,939,502 shares outstanding) | | | | | $ | 8.85 | |
| | | | | | | |
(a) Identified cost of investments | | | | | $ | 801,163,583 | |
| | | | | | | |
(b) Includes cash collateral for securities loaned of | | | | | $ | 91,501,115 | |
| | | | | | | |
Statement of Operations
For the Year Ended December 31, 2008
| | | | | | | | |
Investment Income | | | | | | | | |
Dividends | | | | | | $ | 10,057,839 | (a) |
Interest | | | | | | | 3,497,145 | (b) |
| | | | | | | | |
| | | | | | | 13,554,984 | |
Expenses | | | | | | | | |
Management fees | | $ | 1,704,284 | | | | | |
Service and distribution fees—Class B | | | 330,246 | | | | | |
Service and distribution fees—Class E | | | 54,483 | | | | | |
Directors’ fees and expenses | | | 31,907 | | | | | |
Custodian | | | 102,614 | | | | | |
Audit and tax services | | | 36,941 | | | | | |
Legal | | | 11,922 | | | | | |
Printing | | | 219,735 | | | | | |
Insurance | | | 8,208 | | | | | |
Miscellaneous | | | 21,446 | | | | | |
| | | | | | | | |
Total Expenses | | | 2,521,786 | | | | | |
Management fee waivers | | | (47,720 | ) | | | 2,474,066 | |
| | | | | | | | |
Net Investment Income | | | | | | | 11,080,918 | |
| | | | | | | | |
Realized and Unrealized Loss | | | | | | | | |
| Realized loss on: | | | | | | | | |
Investments—net | | | (30,135,957 | ) | | | | |
Futures contracts—net | | | (10,667,570 | ) | | | (40,803,527 | ) |
| | | | | | | | |
| Change in unrealized appreciation (depreciation) on: | | | | | | | | |
Investments—net | | | (234,912,215 | ) | | | | |
Futures contracts—net | | | 2,351,055 | | | | (232,561,160 | ) |
| | | | | | | | |
Net loss | | | | | | | (273,364,687 | ) |
| | | | | | | | |
Net Decrease in Net Assets From Operations | | | | | | $ | (262,283,769 | ) |
| | | | | | | | |
| (a) | Net of foreign taxes of $2,845. |
| (b) | Includes income on securities loaned of $3,123,015. |
See accompanying notes to financial statements.
MSF-22
Metropolitan Series Fund, Inc.
Russell 2000 Index Portfolio
Statements of Changes in Net Assets
| | | | | | | | |
| | | Year ended
December 31,
2008 | | | Year ended
December 31,
2007 | |
From Operations | | | | | | | | |
Net investment income | | $ | 11,080,918 | | | $ | 9,087,447 | |
Net realized gain (loss) | | | (40,803,527 | ) | | | 34,291,840 | |
Unrealized depreciation | | | (232,561,160 | ) | | | (60,599,223 | ) |
| | | | | | | | |
Decrease in net assets from operations | | | (262,283,769 | ) | | | (17,219,936 | ) |
| | | | | | | | |
From Distributions to Shareholders | | | | | | | | |
Net investment income | | | | | | | | |
Class A | | | (6,616,777 | ) | | | (3,188,576 | ) |
Class B | | | (1,310,921 | ) | | | (1,196,833 | ) |
Class E | | | (404,790 | ) | | | (431,556 | ) |
| | | | | | | | |
| | | (8,332,488 | ) | | | (4,816,965 | ) |
| | | | | | | | |
Net realized gain | | | | | | | | |
Class A | | | (25,958,126 | ) | | | (26,094,268 | ) |
Class B | | | (6,741,879 | ) | | | (12,971,085 | ) |
Class E | | | (1,862,644 | ) | | | (4,153,294 | ) |
| | | | | | | | |
| | | (34,562,649 | ) | | | (43,218,647 | ) |
| | | | | | | | |
Total distributions | | | (42,895,137 | ) | | | (48,035,612 | ) |
| | | | | | | | |
Increase in net assets from capital share transactions | | | 5,989,223 | | | | 338,031,175 | |
| | | | | | | | |
Net increase (decrease) in net assets | | | (299,189,683 | ) | | | 272,775,627 | |
| | |
Net Assets | | | | | | | | |
Beginning of the period | | | 818,553,897 | | | | 545,778,270 | |
| | | | | | | | |
End of the period | | $ | 519,364,214 | | | $ | 818,553,897 | |
| | | | | | | | |
Undistributed Net Investment Income | | | | | | | | |
End of the period | | $ | 10,984,501 | | | $ | 8,346,869 | |
| | | | | | | | |
Other Information:
Capital Shares
Transactions in capital shares were as follows:
| | | | | | | | | | | | | | |
| | | Year ended
December 31, 2008 | | | Year ended
December 31, 2007 | |
| | | Shares | | | $ | | | Shares | | | $ | |
Class A | | | | | | | | | | | | | | |
Sales | | 9,179,686 | | | $ | 100,758,210 | | | 26,866,189 | | | $ | 396,007,191 | |
Reinvestments | | 2,575,091 | | | | 32,574,903 | | | 1,931,586 | | | | 29,282,844 | |
Redemptions | | (11,021,555 | ) | | | (124,539,993 | ) | | (6,831,606 | ) | | | (103,249,575 | ) |
| | | | | | | | | | | | | | |
Net increase | | 733,222 | | | $ | 8,793,120 | | | 21,966,169 | | | $ | 322,040,460 | |
| | | | | | | | | | | | | | |
Class B | | | | | | | | | | | | | | |
Sales | | 2,405,560 | | | $ | 25,749,629 | | | 3,050,121 | | | $ | 45,954,278 | |
Reinvestments | | 646,811 | | | | 8,052,800 | | | 948,321 | | | | 14,167,918 | |
Redemptions | | (2,757,458 | ) | | | (32,025,973 | ) | | (2,751,410 | ) | | | (41,002,941 | ) |
| | | | | | | | | | | | | | |
Net increase | | 294,913 | | | $ | 1,776,456 | | | 1,247,032 | | | $ | 19,119,255 | |
| | | | | | | | | | | | | | |
Class E | | | | | | | | | | | | | | |
Sales | | 347,015 | | | $ | 3,778,658 | | | 479,620 | | | $ | 7,307,786 | |
Reinvestments | | 179,955 | | | | 2,267,434 | | | 303,632 | | | | 4,584,850 | |
Redemptions | | (911,021 | ) | | | (10,626,445 | ) | | (996,313 | ) | | | (15,021,176 | ) |
| | | | | | | | | | | | | | |
Net decrease | | (384,051 | ) | | $ | (4,580,353 | ) | | (213,061 | ) | | $ | (3,128,540 | ) |
| | | | | | | | | | | | | | |
Increase derived from capital share transactions | | | | | $ | 5,989,223 | | | | | | $ | 338,031,175 | |
| | | | | | | | | | | | | | |
See accompanying notes to financial statements.
MSF-23
Metropolitan Series Fund, Inc.
Russell 2000 Index Portfolio
Financial Highlights
| | | | | | | | | | | | | | | | | | | | |
| | | Class A | |
| | | Year ended December 31, | |
| | | 2008 | | | 2007 | | | 2006 | | | 2005 | | | 2004 | |
Net Asset Value, Beginning of Period | | $ | 14.17 | | | $ | 15.68 | | | $ | 13.92 | | | $ | 14.01 | | | $ | 11.95 | |
| | | | | | | | | | | | | | | | | | | | |
Income From Investment Operations | | | | | | | | | | | | | | | | | | | | |
Net investment income | | | 0.20 | (a) | | | 0.22 | (a) | | | 0.18 | (a) | | | 0.14 | | | | 0.12 | |
Net realized and unrealized gain (loss) of investments | | | (4.71 | ) | | | (0.38 | ) | | | 2.30 | | | | 0.40 | | | | 2.00 | |
| | | | | | | | | | | | | | | | | | | | |
Total from investment operations | | | (4.51 | ) | | | (0.16 | ) | | | 2.48 | | | | 0.54 | | | | 2.12 | |
| | | | | | | | | | | | | | | | | | | | |
Less Distributions | | | | | | | | | | | | | | | | | | | | |
Distributions from net investment income | | | (0.16 | ) | | | (0.15 | ) | | | (0.13 | ) | | | (0.11 | ) | | | (0.06 | ) |
Distributions from net realized capital gains | | | (0.61 | ) | | | (1.20 | ) | | | (0.59 | ) | | | (0.52 | ) | | | 0.00 | |
| | | | | | | | | | | | | | | | | | | | |
Total distributions | | | (0.77 | ) | | | (1.35 | ) | | | (0.72 | ) | | | (0.63 | ) | | | (0.06 | ) |
| | | | | | | | | | | | | | | | | | | | |
Net Asset Value, End of Period | | $ | 8.89 | | | $ | 14.17 | | | $ | 15.68 | | | $ | 13.92 | | | $ | 14.01 | |
| | | | | | | | | | | | | | | | | | | | |
Total Return (%) | | | (33.5 | ) | | | (1.6 | ) | | | 18.0 | | | | 4.5 | | | | 17.8 | |
Ratio of operating expenses to average net assets (%) | | | 0.31 | | | | 0.31 | | | | 0.35 | | | | 0.35 | | | | 0.37 | |
Ratio of operating expenses to average net assets without giving effect to the contractual expense agreement would have been (%) (b) | | | 0.32 | | | | 0.32 | | | | 0.36 | | | | 0.36 | | | | N/A | |
Ratio of net investment income to average net assets (%) | | | 1.68 | | | | 1.47 | | | | 1.21 | | | | 1.10 | | | | 0.97 | |
Portfolio turnover rate (%) | | | 33 | | | | 37 | | | | 44 | | | | 39 | | | | 39 | |
Net assets, end of period (000) | | $ | 389,888 | | | $ | 610,844 | | | $ | 331,568 | | | $ | 266,467 | | | $ | 254,898 | |
| | | | | | | | | | | | | | | | | | | | |
| | | Class B | |
| | | Year ended December 31, | |
| | | 2008 | | | 2007 | | | 2006 | | | 2005 | | | 2004 | |
Net Asset Value, Beginning of Period | | $ | 13.93 | | | $ | 15.44 | | | $ | 13.73 | | | $ | 13.82 | | | $ | 11.80 | |
| | | | | | | | | | | | | | | | | | | | |
Income From Investment Operations | | | | | | | | | | | | | | | | | | | | |
Net investment income | | | 0.17 | (a) | | | 0.18 | (a) | | | 0.14 | (a) | | | 0.10 | | | | 0.08 | |
Net realized and unrealized gain (loss) of investments | | | (4.63 | ) | | | (0.38 | ) | | | 2.25 | | | | 0.41 | | | | 1.98 | |
| | | | | | | | | | | | | | | | | | | | |
Total from investment operations | | | (4.46 | ) | | | (0.20 | ) | | | 2.39 | | | | 0.51 | | | | 2.06 | |
| | | | | | | | | | | | | | | | | | | | |
Less Distributions | | | | | | | | | | | | | | | | | | | | |
Distributions from net investment income | | | (0.12 | ) | | | (0.11 | ) | | | (0.09 | ) | | | (0.08 | ) | | | (0.04 | ) |
Distributions from net realized capital gains | | | (0.61 | ) | | | (1.20 | ) | | | (0.59 | ) | | | (0.52 | ) | | | 0.00 | |
| | | | | | | | | | | | | | | | | | | | |
Total distributions | | | (0.73 | ) | | | (1.31 | ) | | | (0.68 | ) | | | (0.60 | ) | | | (0.04 | ) |
| | | | | | | | | | | | | | | | | | | | |
Net Asset Value, End of Period | | $ | 8.74 | | | $ | 13.93 | | | $ | 15.44 | | | $ | 13.73 | | | $ | 13.82 | |
| | | | | | | | | | | | | | | | | | | | |
Total Return (%) | | | (33.6 | ) | | | (1.8 | ) | | | 17.6 | | | | 4.3 | | | | 17.4 | |
Ratio of operating expenses to average net assets (%) | | | 0.56 | | | | 0.56 | | | | 0.60 | | | | 0.60 | | | | 0.62 | |
Ratio of operating expenses to average net assets without giving effect to the contractual expense agreement would have been (%) (b) | | | 0.57 | | | | 0.57 | | | | 0.61 | | | | 0.61 | | | | N/A | |
Ratio of net investment income to average net assets (%) | | | 1.43 | | | | 1.17 | | | | 0.97 | | | | 0.87 | | | | 0.77 | |
Portfolio turnover rate (%) | | | 33 | | | | 37 | | | | 44 | | | | 39 | | | | 39 | |
Net assets, end of period (000) | | $ | 103,465 | | | $ | 160,849 | | | $ | 159,003 | | | $ | 108,689 | | | $ | 76,322 | |
| Please | see following page for Financial Highlights footnote legend. |
See accompanying notes to financial statements.
MSF-24
Metropolitan Series Fund, Inc.
Russell 2000 Index Portfolio
Financial Highlights
| | | | | | | | | | | | | | | | | | | | |
| | | Class E | |
| | | Year ended December 31, | |
| | | 2008 | | | 2007 | | | 2006 | | | 2005 | | | 2004 | |
Net Asset Value, Beginning of Period | | $ | 14.10 | | | $ | 15.61 | | | $ | 13.87 | | | $ | 13.95 | | | $ | 11.92 | |
| | | | | | | | | | | | | | | | | | | | |
Income From Investment Operations | | | | | | | | | | | | | | | | | | | | |
Net investment income | | | 0.18 | (a) | | | 0.19 | (a) | | | 0.16 | (a) | | | 0.13 | | | | 0.09 | |
Net realized and unrealized gain (loss) of investments | | | (4.69 | ) | | | (0.37 | ) | | | 2.28 | | | | 0.40 | | | | 1.99 | |
| | | | | | | | | | | | | | | | | | | | |
Total from investment operations | | | (4.51 | ) | | | (0.18 | ) | | | 2.44 | | | | 0.53 | | | | 2.08 | |
| | | | | | | | | | | | | | | | | | | | |
Less Distributions | | | | | | | | | | | | | | | | | | | | |
Distributions from net investment income | | | (0.13 | ) | | | (0.13 | ) | | | (0.11 | ) | | | (0.09 | ) | | | (0.05 | ) |
Distributions from net realized capital gains | | | (0.61 | ) | | | (1.20 | ) | | | (0.59 | ) | | | (0.52 | ) | | | 0.00 | |
| �� | | | | | | | | | | | | | | | | | | | |
Total distributions | | | (0.74 | ) | | | (1.33 | ) | | | (0.70 | ) | | | (0.61 | ) | | | (0.05 | ) |
| | | | | | | | | | | | | | | | | | | | |
Net Asset Value, End of Period | | $ | 8.85 | | | $ | 14.10 | | | $ | 15.61 | | | $ | 13.87 | | | $ | 13.95 | |
| | | | | | | | | | | | | | | | | | | | |
Total Return (%) | | | (33.5 | ) | | | (1.7 | ) | | | 17.7 | | | | 4.4 | | | | 17.5 | |
Ratio of operating expenses to average net assets (%) | | | 0.46 | | | | 0.46 | | | | 0.50 | | | | 0.50 | | | | 0.52 | |
Ratio of operating expenses to average net assets without giving effect to the contractual expense agreement would have been (%) (b) | | | 0.47 | | | | 0.47 | | | | 0.51 | | | | 0.51 | | | | N/A | |
Ratio of net investment income to average net assets (%) | | | 1.52 | | | | 1.27 | | | | 1.05 | | | | 0.95 | | | | 0.82 | |
Portfolio turnover rate (%) | | | 33 | | | | 37 | | | | 44 | | | | 39 | | | | 39 | |
Net assets, end of period (000) | | $ | 26,011 | | | $ | 46,861 | | | $ | 55,208 | | | $ | 49,489 | | | $ | 51,061 | |
| (a) | Per share amount is based on average shares outstanding during the period. |
| (b) | See Note 4 of the Notes to Financial Statements. |
See accompanying notes to financial statements.
MSF-25
Metropolitan Series Fund, Inc.
Russell 2000 Index Portfolio
Notes to Financial Statements—December 31, 2008
Metropolitan Series Fund, Inc. (the “Fund”) is organized as a corporation under the laws of Maryland pursuant to Articles of Incorporation filed on November 23, 1982, as amended, and registered under the Investment Company Act of 1940, as amended (the “1940 Act”), as an open-end investment company. The Fund is a “series” type of mutual fund, which issues separate series of stock. Each series represents an interest in a separate portfolio of Fund investments. The Russell 2000 Index Portfolio (the “Portfolio”) is a diversified series of the Fund. Shares in the Fund are not offered directly to the general public and are currently available only to separate accounts established by Metropolitan Life Insurance Company (“MetLife”), New England Life Insurance Company, General American Life Insurance Company (“General American”), The MetLife Investors Group of Insurance Companies, MetLife Insurance Company of Connecticut and other affiliated insurance companies (collectively, the “Insurance Companies”) and to certain eligible qualified retirement plans (“Qualified Plans”), as an investment vehicle for variable life insurance, group annuity or variable annuity products of these insurance companies or Qualified Plans, although the Portfolio is not available to all such separate accounts and Qualified Plans. The Portfolio’s shares may be divided into different classes. Currently, the classes being offered by the Portfolio are named Class A, Class B and Class E. The classes of the Portfolio’s shares are identical, except that certain additional charges (Rule 12b-1 fees) are made against Class B and Class E shares. Investment income, realized and unrealized capital gains and losses, the common expenses of the Portfolio and certain Portfolio-level expense reductions, if any, are allocated daily, on a pro rata basis, to each class based on the relative net assets of each class to the total net assets of the Portfolio.
| 2. | SIGNIFICANT ACCOUNTING POLICIES: |
The preparation of financial statements in conformity with accounting principles generally accepted in the United States of America (“GAAP”) requires management to make estimates and assumptions that affect the reported amounts of assets and liabilities and disclosure of contingent assets and liabilities as of the date of the financial statements and the reported amounts of income and expenses during the reporting period. Actual results could differ from those estimates.
The following is a summary of significant accounting policies consistently followed by the Portfolio in the preparation of its financial statements. The policies are in conformity with GAAP.
Investment Valuation:
Debt securities (other than short term obligations with a remaining maturity of sixty days or less) are generally valued on the basis of evaluated or composite bid quotations obtained by independent pricing services and/or brokers and dealers selected by the relevant subadviser pursuant to authorization of the Board of Directors of the Fund (the “Board” or “Directors”). Such quotations take into account appropriate factors such as institutional-sized trading in similar groups of securities, yield, quality, coupon rate, maturity, type of issue, trading characteristics and other data. Short term obligations with a remaining maturity of sixty days or less are valued at amortized cost which approximates fair market value.
Equity securities traded on a national securities exchange or other exchanges are valued at their last sale price on the principal trading market. Equity securities traded on the NASDAQ National Market System are valued at the NASDAQ Official Closing Price (the “NOCP”). The NOCP is the last reported sale price if the last reported sale price falls between the spread of the last reported bid and asked prices. If the last reported bid and asked prices are above the last reported sale price, the NOCP will be the last reported bid price. If the last reported bid and asked prices are below the last reported sale price, the NOCP will be the last reported asked price. Equity securities traded on a national securities exchange or other exchanges or on the NASDAQ National Market System for which there is no reported sale during the day are valued at the last reported bid price. A security that is listed or traded on more than one exchange is valued at the quotation on the exchange determined to be the primary market for that security by the Board or its delegates. If no closing price is available, then such securities are valued by using the last reported bid price. Equity securities traded over-the-counter are valued at the last reported sales price.
If no current market value quotation is readily available or reliable for a portfolio security, fair value will be determined in accordance with procedures established by and under the general supervision of the Board. When the Portfolio uses fair value pricing, it may take into account any factors it deems appropriate. The value of securities used by the Portfolio to calculate its net asset value may differ from quoted or published prices for the same securities. Fair value pricing involves subjective judgments and the fair value determined for a security may be materially different than the value that could be realized upon the sale of that security.
The Portfolio expects to use fair value pricing for securities primarily traded on U.S. exchanges only under very limited circumstances. For example, the Portfolio may use fair value pricing if the exchange on which a security is traded closes early or trading in the security is suspended.
MSF-26
Metropolitan Series Fund, Inc.
Russell 2000 Index Portfolio
Notes to Financial Statements—December 31, 2008—(Continued)
Securities traded primarily on an exchange outside of the United States which closes before the close of the New York Stock Exchange will be valued at the last sales price on that non-U.S. exchange. Securities traded primarily on an exchange outside of the United States for which there is no reported sale during the day are valued at the mean between the last reported bid and asked prices. However, because most foreign markets close well before the Portfolio values its securities (typically at 4 p.m. Eastern Time), the earlier close of these foreign markets gives rise to the possibility that significant events, including broad market moves, may have occurred after these foreign markets close but before the Portfolio values its securities. To account for this, the Portfolio may frequently value many of its foreign equity securities using fair value prices based on third party vendor modeling tools.
Options, whether on securities, indices, futures contracts, or otherwise, are valued at the last sales price available as of the close of business on the day of valuation or, if there is no such sale price available, at the mean between the bid and asked prices. Options on currencies are valued at the spot price each day.
The value of futures contracts will be the sum of the margin deposit plus or minus the difference between the value of the futures contract on each day the net asset value is calculated and the value on the date the futures contract originated, value being that established on a recognized commodity exchange, or by reference to other customary sources, with gain or loss being realized when the futures contract closes or expires.
Subject to the Board’s oversight, the Board has delegated the day-to-day oversight of pricing matters, including determinations in good faith under the Fund’s procedures the fair value of securities for which current market quotations are not readily available to the subadviser of the Portfolio.
Investment Transactions and Related Investment Income:
Portfolio security transactions are recorded on the trade date. Dividend income is recorded on the ex-dividend date or, for certain foreign securities, when notified. Interest income, which includes amortization of premium and accretion of discount on debt securities, is recorded on the accrual basis. Realized gains and losses on investments and unrealized appreciation and depreciation are determined on the identified cost basis, which is the same basis used for federal income tax purposes.
Repurchase Agreements:
The Portfolio, through the custodian or a subcustodian, receives delivery of the underlying securities collateralizing repurchase agreements. The Portfolio requires the custodian to take possession, to have legally segregated in the Federal Reserve Book Entry System, or to have segregated within the custodian’s vault, all securities held as collateral for repurchase agreements. It is the Portfolio’s policy that the market value of the collateral be at least equal to 100% of the repurchase price in the case of a repurchase agreement of one-day duration and 102% on all other repurchase agreements. The Portfolio’s subadviser is responsible for determining that the value of the collateral is at all times at least equal to the repurchase price. In connection with transactions in repurchase agreements, if the seller defaults and the value of the collateral declines or if the seller enters an insolvency proceeding, realization of the collateral by the Portfolio may be delayed, limited or wholly denied.
Futures Contracts:
The Portfolio may buy and sell futures contracts (on recognized exchanges) as a hedge or to enhance return. Futures contracts are agreements to buy or sell a security, or deliver a final cash settlement price in connection with an index, interest rate, currency, or other contracts not calling for physical delivery, for a set price in the future. The Portfolio must post an amount equal to a portion of the total market value of the futures contract as futures variation margin, which is returned when the Portfolio’s obligations under the contract have been satisfied. From time to time thereafter, the Portfolio may have to post variation margin to maintain this amount as the market value of the contract fluctuates. Risks of entering into futures contracts (and related options) include the possibility that there may be an illiquid market and that a change in the value of the contract or option may not correlate with changes in the value of the underlying securities.
Options:
The Portfolio may use options to enhance returns or to hedge against changes in values of securities the Portfolio owns or expects to purchase. Writing puts or buying calls tends to increase the Portfolio’s exposure to the underlying instrument and writing calls or buying puts tends to decrease the Portfolio’s exposure to the underlying instrument, and can be used to hedge other Portfolio
MSF-27
Metropolitan Series Fund, Inc.
Russell 2000 Index Portfolio
Notes to Financial Statements—December 31, 2008—(Continued)
investments. For options purchased to hedge the Portfolio’s investments, the potential risk to the Portfolio is that the change in value of options contracts may not correspond to the change in value of the hedged instruments. In addition, losses may arise from changes in the value of the underlying instruments, if there is an illiquid secondary market, or if the counterparty is unable to perform. The maximum loss for purchased options is limited to the premium initially paid for the option. For options written by the Portfolio, the maximum loss is not limited to the premium initially received for the option.
The main risk associated with purchasing an option is that the option expires without being exercised. In this case, the option expires worthless and the premium paid for the option is considered the loss. The risk associated with writing a call option is that the Portfolio may forgo the opportunity for a profit if the market value of the underlying position increases and the option is exercised. The risk in writing a put option is that the Portfolio may incur a loss if the market value of the underlying position decreases and the option is exercised. In addition, the Portfolio risks not being able to enter into a closing transaction for the written option as the result of an illiquid market.
“When-Issued” Securities:
Purchasing securities “when-issued” is a forward commitment by the Portfolio to buy a security. The estimated amount of the Portfolio’s payment obligation and the security’s interest rate are determined when the commitment is made, even though no interest accrues until the security is issued, which is generally 15 to 120 days later. The Portfolio will segregate liquid assets with its custodian sufficient at all times to satisfy these commitments. If the value of the security is less when delivered than when the commitment was made, the Portfolio will suffer a loss.
Federal Income Taxes:
It is the Portfolio’s policy to comply with the requirements of the Internal Revenue Code of 1986, as amended (the “Code”), and regulations thereunder, applicable to regulated investment companies and to distribute, with respect to each taxable year, all of its taxable income to shareholders. Therefore, no federal income tax provision is required. The Portfolio is subject to the provisions of the Financial Accounting Standards Board Interpretation (“FASB”) No. 48, Accounting for Uncertainties in Income Taxes (FIN 48). FIN 48 sets forth a minimum threshold for financial statement recognition of the benefit of a tax position taken or expected to be taken in a tax return. The implementation of FIN 48 did not result in any unrecognized tax benefits in the accompanying financial statements. Each of the Portfolio’s federal tax returns for the prior three fiscal years remains subject to examination by the Internal Revenue Service.
As of December 31, 2008, the Portfolio had no capital loss carryforwards.
Pursuant to Section 852 of the Code, the Portfolio designated the amount shown below under Long Term Gain as capital gain dividends for its taxable year ended December 31, 2008. The tax character of distributions paid for the periods ended December 31, 2008 and 2007 was as follows:
| | | | | | | | | | | | | | | | | | | | | |
Ordinary Income | | Long Term Gain | | Return of Capital | | Total |
2008 | | 2007 | | 2008 | | 2007 | | 2008 | | 2007 | | 2008 | | 2007 |
$14,883,578 | | $ | 8,404,113 | | $ | 28,011,559 | | $ | 39,631,499 | | $ | — | | $ | — | | $ | 42,895,137 | | $ | 48,035,612 |
As of December 31, 2008, the components of distributable earnings (accumulated losses) on a federal income tax basis were as follows:
| | | | | | | | | | | | | | |
Undistributed
Ordinary
Income | | Undistributed
Long Term
Gain | | Unrealized
Depreciation | | | Loss
Carryforwards | | Total | |
$10,988,765 | | $ | 15,131,895 | | $ | (197,248,063 | ) | | $ | — | | $ | (171,127,403 | ) |
Pursuant to Federal income tax regulations applicable to investment companies, the Portfolio has elected to treat net capital losses realized between November 1 and December 31 of each year as occurring on the first day of the following tax year. For the year ended December 31, 2008, the following amounts of realized capital and currency losses reflected in the accompanying financial statements will not be recognized for Federal income tax purposes until January 1, 2009:
| | | | |
Currency | | Capital | |
$— | | $ | (47,622,906 | ) |
MSF-28
Metropolitan Series Fund, Inc.
Russell 2000 Index Portfolio
Notes to Financial Statements—December 31, 2008—(Continued)
Dividends and Distributions to Shareholders:
The Portfolio records dividends and distributions on the ex-dividend date. Net realized gains from security transactions (if any) are generally distributed annually to shareholders. The timing and characterization of certain income and capital gains distributions are determined in accordance with federal tax regulations that may differ from GAAP. Permanent book and tax basis differences relating to shareholder distributions will result in reclassification between under/over distributed net investment income, accumulated net realized gains/losses and paid in capital.
| 3. | INVESTMENT TRANSACTIONS: |
For the year ended December 31, 2008, purchases and sales of securities (excluding short term investments) for the Portfolio were as follows:
| | | | | | | | | |
Purchases | | Sales |
U.S. Government | | Other | | U.S. Government | | Other |
$0 | | $ | 222,277,395 | | $ | 0 | | $ | 244,348,189 |
| 4. | INVESTMENT MANAGEMENT FEES AND OTHER TRANSACTIONS WITH AFFILIATES: |
Investment Management Agreement:
MetLife Advisers, LLC (“MetLife Advisers”) is the investment adviser to the Portfolio. The Fund has entered into an investment management agreement with MetLife Advisers with respect to the Portfolio. For providing investment management services to the Portfolio, MetLife Advisers receives monthly compensation at the annual rate of 0.250% of average daily net assets. Fees earned by MetLife Advisers with respect to the Portfolio for the year ended December 31, 2008 were $1,704,284.
Certain officers and directors of the Fund may also be officers of MetLife Advisers; however, such officers and directors receive no compensation from the Fund.
MetLife Advisers has entered into an investment subadvisory agreement with MetLife Investment Advisors, LLC (“MLIAC”) with respect to the Portfolio. MetLife Advisers pays MLIAC an investment subadvisory fee for the Portfolio equal to the costs incurred by MLIAC in providing subadvisory services to the Portfolio. Fees earned by MLIAC with respect to the Portfolio for the year ended December 31, 2008 were $156,794.
Management Fee Waivers:
Pursuant to an expense agreement, MetLife Advisers has agreed, for the period May 1, 2008 to April 30, 2009, to reduce its advisory fees set out above under “Investment Management Agreement” for each class of the Portfolio at the annual rate of 0.007% of average daily net assets. A similar expense agreement was in place for the period May 1, 2007 through April 30, 2008. Amounts waived for the year ended December 31, 2008 are shown as management fee waivers in the Statement of Operations.
Service and Distribution Fees:
The Fund has adopted a Distribution and Service Plan under Rule 12b-1 of the 1940 Act for the Portfolio’s Class B and E shares. Under the Distribution and Service Plan, the Class B and E shares of the Portfolio pay a fee to compensate the Insurance Companies (or their affiliates) and other broker-dealers and financial intermediaries involved in the offer and sale of Portfolio shares for promoting or selling and servicing the Class B and E shares of the Portfolio. The fees under the Distribution and Service Plan for each class of the Portfolio’s shares are calculated as a percentage of the Portfolio’s average daily net assets that are attributable to that Class. Currently, the fee is 0.25% per year for Class B shares and 0.15% per year for Class E shares. Amounts paid by the Portfolio for the year ended December 31, 2008 are shown as Service and Distribution fees in the Statement of Operations.
The Fund has entered into a securities lending arrangement with the Fund’s custodian, State Street Bank and Trust Company (the “custodian”). Under the agreement, the custodian is authorized to loan securities on the Portfolios’ behalf. In exchange, the Portfolio receives either cash or securities as collateral against the loaned securities. The Portfolio receives collateral at least equal to 102% of the market value of the loaned securities (105% for foreign securities), at each loan’s inception. Collateral must
MSF-29
Metropolitan Series Fund, Inc.
Russell 2000 Index Portfolio
Notes to Financial Statements—December 31, 2008—(Continued)
be maintained at least at 100% of the market value of the loaned securities for the duration of the loan. The cash collateral is invested in the Navigator Securities Lending Prime Portfolio, an affiliate of the custodian, which invests in a variety of high quality U.S. dollar-denominated instruments. If the market value of the collateral at the close of trading on a business day is less than 100% of the market value of the loaned securities at the close of trading on that day, the borrower shall be required to deliver, by the close of business on the following business day, an additional amount of collateral, equal to at least 100% of the market value of all the loaned securities as of such preceding day. The Portfolio receives 80% of the annual net income from securities lending transactions, which is included in interest income of the Portfolio. The remaining 20% is paid to the custodian as compensation for its securities lending services. Interest income received by the Portfolio via lending transactions during the year ended December 31, 2008 is footnoted in the Statement of Operations. The Portfolio bears the risk of any deficiency in the amount of collateral available for return to a borrower due to a loss in an approved investment purchased with such collateral. Any outstanding loans by the Portfolio at December 31, 2008 are footnoted in the Schedule of Investments.
| 6. | MARKET AND CREDIT RISK: |
In the normal course of business, the Portfolio invests in securities and enters into transactions where risks exist due to fluctuations in the market (market risk) or failure of the other party to a transaction to perform (credit risk). The value of securities held by the Portfolio may decline in response to certain events, including those directly involving the companies whose securities are owned by the Portfolio; conditions affecting the general economy; overall market changes; local, regional or global political, social or economic instability; and currency and interest rate and price fluctuations. Similar to credit risk, the Portfolio may be exposed to counterparty risk, or the risk that an entity with which the Portfolio has unsettled or open transactions may default. Financial assets, which potentially expose the Portfolio to credit and counterparty risks, consist principally of investments and cash due from counterparties. The extent of the Portfolio’s exposure to credit and counterparty risks in respect to these financial assets approximates their value as recorded in the Portfolio’s Statements of Assets and Liabilities.
| 7. | RECENT ACCOUNTING PRONOUNCEMENTS: |
In March 2008, the FASB issued Statement of Financial Accounting Standards No. 161, Disclosures about Derivative Instruments and Hedging Activities (“FAS 161”), an amendment of FASB Statement No. 133. FAS 161 requires enhanced disclosures about (a) how and why an entity uses derivative instruments, (b) how derivative instruments and hedging activities are accounted for, and (c) how derivative instruments and related hedging activities affect a fund’s financial position, financial performance, and cash flows. Management does not believe the adoption of FAS 161 will materially impact the financial statement amounts, but will require additional disclosures. This will include qualitative and quantitative disclosures on derivative positions existing at period end and the effect of using derivatives during the reporting period. FAS 161 is effective for financial statements issued for fiscal years and interim periods beginning after November 15, 2008. Management is currently evaluating the impact the adoption of FAS 161 will have on the Portfolio’s financial statement disclosures.
MSF-30
Metropolitan Series Fund, Inc.
Russell 2000 Index Portfolio
Report of Independent Registered Public Accounting Firm
To the Shareholders and Board of Directors of Metropolitan Series Fund, Inc.:
We have audited the accompanying statement of assets and liabilities, including the schedule of investments, of the Russell 2000 Index Portfolio (one of the portfolios constituting the Metropolitan Series Fund, Inc.) (the “Fund”) as of December 31, 2008, and the related statement of operations for the year then ended, the statements of changes in net assets for each of the two years in the period then ended, and the financial highlights for each of the five years in the period then ended. These financial statements and financial highlights are the responsibility of the Fund’s management. Our responsibility is to express an opinion on these financial statements and financial highlights based on our audits.
We conducted our audits in accordance with the standards of the Public Company Accounting Oversight Board (United States). Those standards require that we plan and perform the audit to obtain reasonable assurance about whether the financial statements and financial highlights are free of material misstatement. The Fund is not required to have, nor were we engaged to perform, an audit of its internal control over financial reporting. Our audit included consideration of internal control over financial reporting as a basis for designing audit procedures that are appropriate in the circumstances, but not for the purpose of expressing an opinion on the effectiveness of the Fund’s internal control over financial reporting. Accordingly, we express no such opinion. An audit also includes examining, on a test basis, evidence supporting the amounts and disclosures in the financial statements, assessing the accounting principles used and significant estimates made by management, as well as evaluating the overall financial statement presentation. Our procedures included confirmation of securities owned as of December 31, 2008, by correspondence with the custodian and brokers; where replies were not received from brokers, we performed other auditing procedures. We believe that our audits provide a reasonable basis for our opinion.
In our opinion, the financial statements and financial highlights referred to above present fairly, in all material respects, the financial position of the Russell 2000 Index Portfolio of the Metropolitan Series Fund, Inc. as of December 31, 2008, the results of its operations for the year then ended, the changes in its net assets for each of the two years in the period then ended, and the financial highlights for each of the five years in the period then ended, in conformity with accounting principles generally accepted in the United States of America.
Deloitte & Touche LLP
Boston, Massachusetts
February 24, 2009
MSF-31
Metropolitan Series Fund, Inc.
Directors and Officers
The Fund’s Directors review actions of the Fund’s investment adviser and subadvisers, and decide upon matters of general policy. The Fund’s officers supervise the daily business operations of the Fund. The Board of Directors and the Fund’s officers are listed below. Each Director is responsible for overseeing all 38 Portfolios of the Fund. There is no limit to the term a Director may serve. Directors serve until their resignation, retirement or removal in accordance with the Fund’s organizational documents and policies adopted by the Board from time to time. Officers hold office at the pleasure of the Board or until the election or appointment and the qualification of a successor. The address of the Directors and officers is c/o Metropolitan Series Fund, Inc., 501 Boylston Street, Boston, MA 02116.
Interested Directors(1)
Each Director below is an “interested person” (as defined by the 1940 Act) with respect to the Fund in that Ms. Forget is an employee of MetLife and Mr. Typermass is a former employee of MetLife and owns securities issued by MetLife, Inc., the ultimate parent company of MetLife Advisers.
| | | | | | | | |
Name, Address and Age | | Current
position(s)
with Fund | | Position(s)
held since | | Principal occupations
over past five years, including other directorships(2) | | Number of
Portfolios in
Fund Complex
Overseen by
Director(3) |
Elizabeth M. Forget Age: 42 | | Director, Chairman of the Board, President and Chief Executive Officer | | 2006 | | Senior Vice President (since 2007), MetLife, Inc.; President, Met Investors Advisory, LLC; Trustee and President, Met Investors Series Trust; Executive Vice President, MetLife Investors Group, Inc.; President, Chief Executive Officer and Chair of the Board of Managers (since 2006), MetLife Advisers; President, Met Investors Advisory, LLC. | | 87 |
| | | | |
Arthur G. Typermass Age: 71 | | Director | | 1998 | | Formerly, Senior Vice President and Treasurer, MetLife. | | 38 |
Non-Interested Directors(1)
Each Director below is not an “interested person” (as defined by the 1940 Act) with respect to the Fund (collectively, the “Independent Directors”).
| | | | | | | | |
Name, Address and Age | | Current
position(s)
with Fund | | Position(s)
held since | | Principal occupations
over past five years, including other directorships(2) | | Number of
Portfolios in
Fund Complex
Overseen by
Director(3) |
Steve A. Garban† Age: 71 | | Director | | 1985 | | Formerly, Chief Financial Officer, Senior Vice President Finance and Operations and Treasurer (Emeritus), The Pennsylvania State University. | | 38 |
| | | | |
Linda B. Strumpf Age: 61 | | Director | | 2000 | | Vice President and Chief Investment Officer, Ford Foundation. | | 38 |
| | | | |
Michael S. Scott Morton† Age: 71 | | Director | | 1993 | | Jay W. Forrester Professor of Management (Emeritus) at Sloan School of Management, MIT. | | 38 |
| | | | |
H. Jesse Arnelle Age: 75 | | Director | | 2001 | | Formerly, Counsel, Womble Carlyle Sandrie & Rice; Director, Textron Inc. (global multi- industry company)*; formerly, Director, Gannet Co. Inc. (diversified news and information company)*; formerly, Director, Eastman Chemical Company (global chemical company)*; formerly, Director, Waste Management, Inc.*; formerly, Director, Armstrong Holdings Inc. (parent company of floor and ceiling products business)*; formerly, Director, FPL Group Inc. (public utility holding company)*; Director, URS Corporation (engineering design services firm)*. | | 38 |
MSF-32
Metropolitan Series Fund, Inc.
Directors and Officers—(Continued)
| | | | | | | | |
Name, Address and Age | | Current
position(s)
with Fund | | Position(s)
held since | | Principal occupations
over past five years, including other directorships(2) | | Number of
Portfolios in
Fund Complex
Overseen by
Director(3) |
Nancy Hawthorne Age: 57 | | Director | | 2003 | | Chief Executive Officer, Clerestory LLC (corporate financial advisor); Director, Avid Technologies (computer software company)*; formerly, Chairman of the Board of Avid Technologies; formerly, Board of Advisors, L. Knife & Sons, Inc. (beverage distributor); formerly, Trustee, New England Zenith Fund (“Zenith Fund”)**; formerly, Chief Executive Officer and Managing Partner, Hawthorne, Krauss and Associates (corporate financial advisor); formerly, Chief Financial Officer and Executive Vice President, Continental Cablevision, subsequently renamed MediaOne (cable television company); formerly, Director, Life F/X, Inc.; formerly, Chairman of the Board, WorldClinic (distance medicine company); formerly, Director, Perini Corporation (construction company)*; formerly, Director, CGU (property and casualty insurance company); formerly, Director, Beacon Power Corporation (energy company)*. | | 38 |
| | | | |
John T. Ludes Age: 72 | | Director | | 2003 | | President, LFP Properties (consulting firm); Formerly, Trustee, Zenith Fund**; formerly, Vice Chairman, President and Chief Operating Officer, Fortune Brands/American Brands (global conglomerate); formerly, President and CEO, Acushnet Company (athletic equipment company). | | 38 |
Officers(1)
| | | | | | | | |
Name and address | | Age | | Current
position(s)
with Fund | | Position(s)
held since | | Principal occupations over past five years(2) |
| Jeffrey L. Bernier | | 37 | | Senior Vice President | | 2008 | | Vice President (since 2008), MetLife, Inc.; Vice President (since 2008), MetLife; Senior Vice President (since 2008), MetLife Advisers; formerly, Director and Senior Investment Analyst (2004 to 2007), John Hancock Financial Services; formerly, Assistant Vice President (2000 to 2001), Wachovia Securities. |
| | | | |
| Alan C. Leland | | 56 | | Senior Vice President | | 2005 | | Treasurer and Chief Financial Officer, MetLife Advisers, LLC; Treasurer (since 2005), Met Investors Advisory, LLC; Vice President (since 2004), Met Investors Advisory, LLC; Vice President (since 2003), MetLife, Inc.; Vice President, MetLife; Senior Vice President, NELICO. |
| | | | |
| Peter Duffy | | 53 | | Vice President
and Treasurer | | 2000 | | Senior Vice President, MetLife Advisers; Second Vice President (since 2003), NELICO; Vice President, MetLife (since 2004); Vice President (since 2004), MetLife, Inc.; formerly, Vice President and Treasurer, Zenith Fund**. |
| | | | |
| Jeffrey P. Halperin | | 41 | | Chief
Compliance Officer | | 2007 | | Vice President (since 2006), MetLife, Inc.; Vice President (since 2006), MetLife; Chief Compliance Officer (since 2006), Met Investors Series Trust, MetLife Advisers, Met Investors Advisory, LLC and MetLife Investment Advisors Company, LLC. |
| * | Indicates a directorship with a registered investment company or a company subject to the reporting requirements of the Securities Exchange Act of 1934, as amended. |
| ** | The Zenith Fund deregistered with the Securities and Exchange Commission (“SEC”) in 2004. |
| (†) | Served as a trustee, director and/or officer of one or more of the following companies, each of which had a direct or indirect advisory relationship with MetLife Advisers or its affiliates prior to January 31, 2005: State Street Research Financial Trust, State Street Research Income Trust, State Street Research Money Market Trust, State Street Research Institutional Funds, State Street Research Capital Trust, State Street Research Master Investment Trust, State Street Research Equity Trust, State Street Research Securities Trust and State Street Research Exchange Trust (collectively, the “State Street Research Funds”). |
| (1) | During the period shown, each Director of the Fund served as a Trustee of Metropolitan Series Fund II, a registered investment company that ceased investment operations in June of 2008 and has applied for deregistration under the Investment Company Act of 1940. During this period, each officer of the Fund served in the same position with Metropolitan Series Fund II. |
| (2) | Previous positions during the past five years with the Fund; Met Investors Series Trust; MetLife; MetLife, Inc.; MetLife Advisers; Met Investors Advisory, LLC; Zenith Fund; NELICO; or New England Securities Corporation are omitted if not materially different. |
| (3) | The Fund Complex includes the Fund (38 portfolios) and Met Investors Series Trust (49 portfolios). |
MSF-33
Metropolitan Series Fund, Inc.
Russell 2000 Index Portfolio
Board Approval of Advisory and Subadvisory Agreements
The Fund’s Contract Review Committees of the Board of Directors (the “Board” or the “Directors”) typically meet in early fall to review the Portfolios’ advisory agreements (the “Advisory Agreements”) and subadvisory agreements (the “Subadvisory Agreements,” and, together with the Advisory Agreements, the “Agreements”) and determine whether to recommend that the full Board approve the continuation of the Agreements for an additional one-year period. (Following the initial approval of an Agreement for a new Portfolio or with a new adviser or subadviser, such annual reviews are not required until 2 years following the execution of such Agreement.) After each Committee has made its recommendations, the full Board, including the Independent Directors, determines whether to approve the continuation of each of the Agreements. In addition, the Board, including the Independent Directors, considers matters bearing on the Agreements at most of its other meetings throughout the year and regularly interviews various individuals at MetLife Advisers responsible for the management of the Portfolios. The Directors also interview selected investment managers and other professionals at the subadvisers at various times throughout the year.
The Directors receive all materials that they or MetLife Advisers, the Fund’s investment adviser, and the subadvisers believe to be reasonably necessary for the Directors to evaluate the Agreements and determine whether to approve the continuation of the Agreements. These materials generally include, among other items, (i) information on the investment performance of the Portfolios and the performance of peer groups of funds and the Portfolios’ performance benchmarks, (ii) information on the Portfolios’ advisory and subadvisory fees and other expenses, including information comparing the Portfolios’ expenses to those of peer groups of funds and information about any applicable expense caps and fee “breakpoints,” (iii) sales and redemption data, (iv) information related to the profitability of the Agreements to MetLife Advisers and certain of the subadvisers, and potential “fall-out” or ancillary benefits that MetLife Advisers, the subadvisers or their affiliates may receive as a result of their relationships with the Fund and (v) information obtained through the subadvisers’ responses to certain requests from MetLife Advisers and the Directors and MetLife Advisers’ responses to requests from the Directors. The Directors may also consider other information such as (vi) MetLife Advisers’ and the subadvisers’ financial results and condition, (vii) each Portfolio’s investment objectives and strategies and the size, education and experience of the investment staffs of MetLife Advisers and the relevant subadvisers and their use of technology and external research, (viii) the allocation of the Portfolios’ brokerage, if any, including allocations to brokers affiliated with the subadvisers and the use of “soft” commission dollars to pay Portfolio expenses and to pay for research and other similar services, (ix) the resources devoted to, and the record of compliance with, the Portfolios’ investment policies and restrictions, policies on personal securities transactions and other compliance policies, (x) the responses of MetLife Advisers, the subadvisers and/or their affiliates to certain legal and regulatory proceedings and (xi) the economic outlook generally and for the mutual fund industry in particular. Throughout the process, the Directors have the opportunity to ask questions of and request additional materials from MetLife Advisers and the subadvisers.
Following meetings of each Contract Review Committee on September 10, 2008, the Board, including the Independent Directors, at its November 6-7, 2008 meeting, approved the continuation through December 31, 2009 of the Advisory Agreements for each Portfolio of the Fund and the Subadvisory Agreements for each Portfolio other than the Zenith Equity Portfolio and Asset Allocation Portfolios (which do not have subadvisers) and the Van Eck Global Natural Resources Portfolio, Met/Dimensional International Small Cap Portfolio and Loomis Sayles Small Cap Growth Portfolio (formerly known as the Franklin Templeton Small Cap Growth Portfolio). The Agreements approved for continuation are referred to below as the “Continued Agreements.”
In considering whether to approve the continuation of the Continued Agreements, the Directors, including the Independent Directors, did not identify any single factor as determinative, and each weighed the various factors as he or she deemed appropriate. The Directors considered the following matters in connection with their approval of the Continued Agreements:
The nature, extent and quality of the services provided to the relevant Portfolios under the Continued Agreements. The Directors considered the nature, extent and quality of the services provided by MetLife Advisers, the relevant subadvisers (if any) and their affiliates (each, an “Adviser,” and, collectively, the “Advisers”) to the relevant Portfolios pursuant to the Continued Agreements and the resources dedicated to these Portfolios by the Advisers. In particular, the Directors considered the Advisers’ abilities to attract and retain highly qualified investment professionals. With respect to MetLife Advisers, the Directors considered (for each Portfolio other than the Zenith Equity and Asset Allocation Portfolios) that MetLife Advisers is (i) ultimately responsible for the performance of such Portfolios; (ii) ultimately responsible for the establishment of the investment strategies of each such Portfolio, primarily through its recommendations to the Board regarding the hiring and selection of subadvisers; (iii) responsible for the hiring and selection, subject to Board approval, of subadvisers; and (iv) responsible for maintaining a program of Subadviser oversight reasonably designed to ensure that the subadvisers have reasonable compliance policies and procedures in place. The Directors also considered that MetLife Advisers provides a full range of day-to-day administrative services for the Portfolios involving all aspects of such Portfolios’ day-to-day operations (other than portfolio management). With respect to the Zenith Equity and Asset Allocation Portfolios, the Directors considered both the portfolio management services and the administrative services provided by MetLife Advisers. After reviewing
MSF-34
Metropolitan Series Fund, Inc.
Russell 2000 Index Portfolio
Board Approval of Advisory and Subadvisory Agreements—(Continued)
these and related factors, the Directors concluded, within the context of their overall conclusions regarding each of the Continued Agreements, that the nature, extent and quality of services provided supported the renewal of these Agreements.
Investment performance of the relevant Portfolios. The Directors reviewed information about the performance of the relevant Portfolios over various time periods, including information prepared by an independent third party that compared the performance of the Portfolios to the performance of peer groups of funds and performance benchmarks. The Directors also reviewed a description of the third party’s methodology for identifying a Portfolio’s peer group(s) for purposes of performance and expense comparisons.
In the case of each relevant Portfolio that had performance that lagged its peer group(s) for certain periods, the Directors concluded that other factors relevant to performance were sufficient, in light of other considerations, to warrant renewal of the Continued Agreements relating to such Portfolio. These factors varied from Portfolio to Portfolio, but included one or more of the following: (i) that such Portfolio’s performance, although lagging in certain recent periods, was stronger over the longer term; (ii) that the underperformance was attributable, to a significant extent, to investment decisions that were reasonable and consistent with the Portfolio’s investment objective(s) and policies and that the Portfolio was performing within the range of reasonable expectations, given market conditions and the Portfolio’s investment objective(s) and policies; (iii) that the Portfolio’s performance was competitive when compared to other relevant performance benchmarks or peer groups; and (iv) that MetLife Advisers and/or the relevant subadviser (if any) had taken or was taking steps designed to help improve the Portfolio’s investment performance (including, in the case of certain Portfolios, that MetLife Advisers was formulating possible proposals, for presentation to the Board in November 2008, to replace the Portfolio’s subadviser or to merge the Portfolio into another Portfolio with a similar investment objective and better investment performance).
The Directors also considered the investment performance of the Advisers and their reputations generally, the historical responsiveness of the Advisers to Director concerns about performance and the willingness of the Advisers to take steps intended to improve performance.
After reviewing these and related factors, the Directors concluded, within the context of their overall conclusions regarding each of the Continued Agreements, that the investment performance of each relevant Portfolio and Adviser was sufficient, in light of other considerations, to warrant the renewal of the Continued Agreements.
The costs of the services to be provided and profits to be realized by the Advisers and their affiliates from their relationships with the Portfolios. The Directors considered the fees charged by MetLife Advisers to the Portfolios for advisory services and, with respect to the subadvised Portfolios, by such subadvisers to MetLife Advisers for subadvisory services (such advisory and subadvisory fees (if any), collectively, “Fees”), as well as the total expense levels of the Portfolios. This information included comparisons (provided by an independent third party) of the Portfolios’ advisory fees and total expense levels to those of their peer groups. In evaluating Fees for the relevant Portfolios, the Directors also took into account the demands, complexity and quality of the investment management services provided to each Portfolio. The Directors considered MetLife Advisers’ recommendations regarding reductions in Fee rates, implementation of Fee breakpoints and institution of Fee waivers and expense caps.
The Directors also considered the compensation directly or indirectly received by the Advisers and their affiliates from their relationships with the relevant Portfolios. The Directors reviewed information relating to the profits received by MetLife Advisers, certain of the subadvisers and their affiliates as a result of their relationships with the relevant Portfolios, and information about the allocation of expenses used to calculate profitability. When reviewing profitability, the Directors also considered the performance of the relevant Portfolios, the expense levels of such Portfolios and whether the relevant Advisers had implemented breakpoints, fee waivers and/or expense caps with respect to such Portfolios.
After reviewing these and related factors, the Directors concluded, within the context of their overall conclusions regarding each of the Continued Agreements, that the Fees charged to each of the relevant Portfolios were fair and reasonable, and that the information provided regarding costs of these services generally, and the related profitability (if known) to the relevant Advisers of their relationships with the relevant Portfolios, supported the renewal of the Continued Agreements.
Economies of Scale. The Directors considered the existence of any economies of scale in the provision of services by the Advisers and whether those economies were shared with the relevant Portfolios through breakpoints in their advisory fees or other means, such as expense caps, fee waivers or relatively low levels of fees. The Directors noted that most of the relevant Portfolios benefited or will benefit from breakpoints, expense caps and/or fee waivers with respect to their advisory fees. In considering these issues, the Directors also took into consideration information relating to the costs of the services provided and the profitability to MetLife Advisers, the relevant subadvisers (if any) and each of their affiliates of their relationships with the relevant Portfolios, as discussed above.
MSF-35
Metropolitan Series Fund, Inc.
Russell 2000 Index Portfolio
Board Approval of Advisory and Subadvisory Agreements—(Continued)
After reviewing these and related factors, the Directors concluded, within the context of their overall conclusions regarding each of the Continued Agreements, that the extent to which economies of scale were shared with the relevant Portfolios supported the renewal of such Agreements.
Other Factors. The Directors also considered other factors, which included but were not limited to the following:
| | • | | the extent to which each relevant Portfolio operated in accordance with its investment objective, and its record of compliance with its investment restrictions and the compliance programs of the Fund and the Advisers. They also considered the compliance-related resources the Advisers and their affiliates provide to the relevant Portfolios; |
| | • | | the nature, quality, cost and extent of administrative and shareholder services performed by MetLife Advisers and its affiliates under the Advisory Agreements; and |
| | • | | so-called “fall-out benefits” to the Advisers, such as the engagement of their affiliates to provide distribution, brokerage and transfer agency services to the Portfolios, and the benefits of research made available to the relevant Advisers by reason of brokerage commissions generated by the relevant Portfolios’ securities transactions. The Directors also considered the possible conflicts of interest associated with these fall-out and other benefits, and the reporting and other processes in place to disclose and monitor these possible conflicts of interest. |
Based on their evaluation of all factors that they deemed to be material, including those factors described above, and assisted by the advice of independent counsel, the Directors, including the Independent Directors, concluded that each of the Continued Agreements should be continued through December 31, 2009.
MSF-36
A description of the policies and procedures that the Fund uses to determine how to vote proxies relating to portfolio securities is available (i) without charge, upon request, by calling (800) 638-7732 and (ii) on the Securities and Exchange Commission’s (the “SEC”) website at http://www.sec.gov.
Information regarding how the Fund voted proxies relating to portfolio securities during the most recent twelve-month period ended December 31, 2008 is available (i) without charge, upon request, by calling (800) 638-7732 and (ii) on the SEC’s website at http://www.sec.gov.
The Fund’s Statement of Additional Information includes additional information about the Directors of the Fund and is available (i) without charge, upon request, by calling (800) 638-7732 and (ii) on the SEC’s website at http://www.sec.gov.
The Fund files with the SEC a complete schedule of its portfolio holdings, as of the close of the first and third quarters of its fiscal year, on “Form N-Q”. These filings are available on the SEC’s website at www.sec.gov and may be reviewed and copied at the SEC’s Public Reference Room in Washington, DC. (Call 1-800-SEC-0330 for information on the operation of the Public Reference Room.)
MSF-37
Simplify your life…
with MetLife eDelivery® while helping MetLife preserve the planet’s natural resources.
(see details on inside cover)
| | |
Metropolitan Series Fund, Inc. T. Rowe Price Large Cap Growth Portfolio Annual Report | | December 31, 2008 |
NOT PART OF THE ANNUAL REPORT
Letter from the President
February 1, 2009
Letter to Policy Holders:
2008 was an extraordinary year in the capital markets around the world and for the global economy. Energy prices rose to record levels early in the year before falling by two-thirds by year-end. A credit crisis that began with concerns about sub-prime mortgages led to massive changes in the financial landscape with government takeovers, forced sales, and outright failures of a number of large, once venerable firms.
While bonds as measured by the Barclays Capital U.S. Aggregate Bond Index (formerly known as, Lehman Brothers U.S. Aggregate Bond Index) were up 5.2% for the year in response to declining interest rates, there were large differences in the total returns of the various sectors of the bond market. U.S. treasury securities were up over 13% as frightened investors sought refuge in what they perceived to be the safest and most liquid investments. In contrast, investment grade corporate securities lost nearly 5% as credit spreads widened and below investment grade or high yield bonds fell over 26%.
In response to the growing credit crisis and the weakening economy, common stocks fell sharply across all regions, styles, and capitalizations. As measured by the Standard and Poor’s 500, U.S. common stocks fell 37% for the year, the worst calendar year decline since the 1930s. Foreign stocks were down even more with the MSCI EAFE Index down 43% for the year.
On the following pages, you will find a complete review of your Portfolio and its investment performance.
MetLife is committed to building your financial freedom. We appreciate your trust and will continue to focus our efforts on meeting your investment needs.
Sincerely,
Elizabeth M. Forget
President, Metropolitan Series Fund, Inc.
Metropolitan Series Fund, Inc.
T. Rowe Price Large Cap Growth Portfolio
Managed by T. Rowe Price Associates, Inc.
Portfolio Manager Commentary*
PORTFOLIO PERFORMANCE
For the twelve-month period ended December 31, 2008, the Class A shares of the T. Rowe Price Large Cap Growth Portfolio returned -41.9%, compared to its benchmark, the Standard & Poor’s 500 Index1, which returned -37.0%. The average return of its peer group, the Lipper Variable Insurance Products2 Large-Cap Growth Funds Universe, was -41.7% over the same period.
PORTFOLIO REVIEW
The worsening credit crisis, a slowing global economy, and falling commodity prices led to steep declines over the year in the S&P 500. All sectors posted double-digit negative returns, but the consumer staples and health care sectors held up better than the rest, as demand in these two groups is typically less affected by an economic slowdown. The financials and materials sectors were the biggest losers for the year, each declining by more than 45%. Small-cap stocks held up better than large-caps over the year, while value edged growth in the large-cap universe, according to major market indexes.
Stock selection was the primary reason for underperformance against the index. An underweight to financials was the primary contributor to outperformance against the index. The consumer discretionary, energy, and consumer staples sectors were the leading detractors from relative performance. Underweighting financials, the worst performing sector in the S&P 500 Index, made the largest contribution to outperformance. The Portfolio also benefited from avoiding or limiting losses from large companies that suffered substantial losses from the credit crisis. Some of these firms lost nearly all their market value before they were acquired or taken under federal conservatorship. The Portfolio remains cautious and underweight, with concentrations in the capital markets industry.
Stock selection in consumer discretionary was the leading cause of Portfolio underperformance. The hotels, restaurants, and leisure industry weighed heavily on results. Gaming holdings such as Las Vegas Sands and International Game Technology notably disappointed. In past downturns, gaming stocks have typically held up better than other groups in this sector, but this time the restricted access to capital undercut company development efforts. With consumer belt-tightening, online travel agent Expedia saw a significant drop in business.
Energy was a major source of weakness on stock selection. The Portfolio’s oil services holdings were hard hit, as exploration activity became less attractive in the face of dropping energy prices. Schlumberger declined on leveraging exploration spending, and on economic problems in Russia, where it has significant exposure. Smith International saw sharply decreasing revenues and margins from its major exposure in North America. Underweighting ExxonMobil hurt as the company has outperformed many energy firms. In a period of falling oil prices, the large integrated energy companies generally outperform because they are less leveraged to the price of oil. The Portfolio is still underweight this sector.
Underweighting and stock selection combined for detrimental relative results in consumer staples, which was the best performer in the index. At December 31, 2008, the Portfolio remained underweight to the benchmark, as we felt the recent investor inflows to these stocks had inflated valuations, and we did not see good long-term growth opportunities here.
* The views expressed above are those of the subadvisory firm as of December 31, 2008 and are subject to change based on market and other conditions. Information about the Portfolio’s holdings, asset allocation, industry allocation, or country diversification is historical and is not an indication of future Portfolio composition, which will vary. The performance of any index mentioned in this commentary has not been adjusted for ongoing management, distribution and operating expenses, and sales charges applicable to mutual fund investments. Direct investment in any index is not possible.
1 The Standard & Poor’s (S&P) 500® Composite Stock Price Index is an unmanaged index representing the performance of 500 major companies, most of which are listed on the New York Stock Exchange.
2 The Lipper Variable Products Fund Average is an average of the total return performance (calculated on the basis of net asset value) of variable product funds with similar investment objectives to those of the subject Portfolio as calculated by Lipper Analytical Services, an independent mutual fund ranking service.
MSF-2
Metropolitan Series Fund, Inc.
T. Rowe Price Large Cap Growth Portfolio
A $10,000 INVESTMENT COMPARED TO THE
S&P 500 INDEX
Average Annual Returns as of December 31, 2008
| | | | | | | | | | | | |
| | | T. Rowe Price Large Cap Growth Portfolio | | | S&P 500 Index | |
| | | Class A | | | Class B | | | Class E | | |
| 1 Year | | -41.9 | % | | -42.0 | % | | -41.9 | % | | -37.0 | % |
| 5 Year | | -3.3 | | | -3.6 | | | -3.5 | | | -2.2 | |
| 10 Year | | -0.7 | | | — | | | — | | | -1.4 | |
| Since Inception | | — | | | 1.2 | | | -3.0 | | | — | |
Performance numbers are net of all Portfolio expenses but do not include any insurance, sales, or administrative charges of variable annuity or life insurance contracts or any additional expenses that participants in certain eligible qualified plans may bear relating to the operations of their plans. If these charges were included, the returns would be lower.
Inception dates of the Class A, Class B and Class E shares are: 11/9/98, 7/30/02 and 5/1/01, respectively.
This information represents past performance and is not indicative of future results. Investment return and principal value may fluctuate so that shares, upon redemption, may be worth more or less than the original cost.
PORTFOLIO COMPOSITION
as of December 31, 2008
Top Holdings
| | |
| | | % of Total
Net Assets |
Apple, Inc. | | 3.6% |
Gilead Sciences, Inc. | | 3.5% |
Danaher Corp. | | 3.5% |
Amazon.com, Inc. | | 3.4% |
Google, Inc. (Class A) | | 3.0% |
Medco Health Solutions, Inc. | | 2.8% |
Microsoft Corp. | | 2.5% |
Exxon Mobil Corp. | | 2.2% |
Genentech, Inc. | | 2.2% |
QUALCOMM, Inc. | | 2.1% |
Top Sectors
| | |
| | | % of Total
Market Value |
Information Technology | | 28.0% |
Health Care | | 25.8% |
Consumer Discretionary | | 9.6% |
Consumer Staples | | 9.3% |
Energy | | 7.4% |
Industrials & Business Services | | 6.4% |
Telecommunication Services | | 4.7% |
Cash/Other | | 3.5% |
Financials | | 2.9% |
Materials | | 2.4% |
MSF-3
Metropolitan Series Fund, Inc.
Shareholder Expense Example
As a shareholder of the Portfolio, you incur ongoing costs, including management fees; distribution and service (12b-1) fees; and other Portfolio expenses. This example is intended to help you understand your ongoing costs (in dollars) (referred to as “expenses”) of investing in the Portfolio and compare these costs with the ongoing costs of investing in other mutual funds. The example is based on an investment of $1,000 invested at the beginning of the period and held for the entire period, July 1, 2008 through December 31, 2008.
Actual Expenses
The first line for each share class of the Portfolio in the table below provides information about actual account values and actual expenses. You may use the information in this line, together with the amount you invested in the particular share class of the Portfolio, to estimate the expenses that you paid over the period. Simply divide your account value by $1,000 (for example, an $8,600 account value divided by $1,000=8.6), then multiply the result by the number in the first line under the heading entitled “Expenses Paid During Period” to estimate the expenses you paid on your account during this period.
Hypothetical Example for Comparison Purposes
The second line for each share class of the Portfolio in the table below provides information about hypothetical account values and hypothetical expenses based on the Portfolio’s actual expense ratio and an assumed rate of return of 5% per year before expenses, which is not the Portfolio’s actual return. The hypothetical account values and expenses may not be used to estimate the actual ending account balance or expenses you paid for the period. You may use this information to compare the ongoing costs of investing in the Portfolio and other funds. To do so, compare this 5% hypothetical example with the 5% hypothetical examples that appear in the shareholder reports of the other funds.
Please note that the expenses shown in the table are meant to highlight your ongoing costs only and do not reflect any fees or charges of your variable insurance product or any additional expenses that participants in certain eligible qualified plans may bear relating to the operations of their plan. Therefore, the second line for each share class in the table is useful in comparing ongoing costs only, and will not help you determine the relative total costs of owning different funds. In addition, if these other costs were included, your costs would have been higher.
| | | | | | | | | | | | | | |
Portfolio | | | | Annualized
Expense
Ratio | | | Beginning
Account Value
July 1,
2008 | | Ending
Account value
December 31,
2008 | | Expenses Paid
During Period*
July 1, 2008
to
December 31,
2008 |
T. Rowe Price Large Cap Growth—Class A(a) | | Actual | | 0.64 | % | | $ | 1,000.00 | | $ | 638.67 | | $ | 2.64 |
| | Hypothetical | | 0.64 | % | | $ | 1,000.00 | | $ | 1,021.88 | | $ | 3.25 |
| | | | | |
T. Rowe Price Large Cap Growth—Class B(a) | | Actual | | 0.89 | % | | $ | 1,000.00 | | $ | 638.55 | | $ | 3.67 |
| | Hypothetical | | 0.89 | % | | $ | 1,000.00 | | $ | 1,020.61 | | $ | 4.52 |
| | | | | |
T. Rowe Price Large Cap Growth—Class E(a) | | Actual | | 0.79 | % | | $ | 1,000.00 | | $ | 638.36 | | $ | 3.25 |
| | Hypothetical | | 0.79 | % | | $ | 1,000.00 | | $ | 1,021.12 | | $ | 4.01 |
* Expenses paid are equal to the Portfolio’s annualized expense ratio for the most recent six month period, as shown above, multiplied by the average account value over the period, multiplied by the number of days in the most recent fiscal half-year, divided by 366 (to reflect the the one-half year period).
(a) The annualized expense ratio shown reflects the impact of the management fee waiver as described in Note 4 to the Financial Statements.
MSF-4
Metropolitan Series Fund, Inc.
T. Rowe Price Large Cap Growth Portfolio
Schedule of Investments as of December 31, 2008
Common Stock—96.6% of Total Net Assets
| | | | | |
| Security Description | | Shares | | Value* |
| | | | | |
| | |
Aerospace & Defense—0.2% | | | | | |
General Dynamics Corp. | | 19,900 | | $ | 1,146,041 |
| | | | | |
| | |
Air Freight & Logistics—1.7% | | | | | |
Expeditors International of Washington, Inc. | | 161,600 | | | 5,376,432 |
United Parcel Service, Inc. (Class B) (a) | | 69,000 | | | 3,806,040 |
| | | | | |
| | | | | 9,182,472 |
| | | | | |
| | |
Beverages—2.8% | | | | | |
PepsiCo, Inc. | | 185,500 | | | 10,159,835 |
The Coca-Cola Co. | | 98,000 | | | 4,436,460 |
| | | | | |
| | | | | 14,596,295 |
| | | | | |
| | |
Biotechnology—7.0% | | | | | |
Amgen, Inc. (b) | | 56,400 | | | 3,257,100 |
Celgene Corp. (b) | | 64,300 | | | 3,554,504 |
Genentech, Inc. (b) | | 139,800 | | | 11,590,818 |
Gilead Sciences, Inc. (a) (b) | | 360,100 | | | 18,415,514 |
| | | | | |
| | | | | 36,817,936 |
| | | | | |
| | |
Capital Markets—2.4% | | | | | |
BlackRock, Inc. (a) | | 16,900 | | | 2,267,135 |
Franklin Resources, Inc. | | 42,500 | | | 2,710,650 |
Northern Trust Corp. | | 40,800 | | | 2,127,312 |
State Street Corp. | | 56,500 | | | 2,222,145 |
The Goldman Sachs Group, Inc. | | 37,200 | | | 3,139,308 |
| | | | | |
| | | | | 12,466,550 |
| | | | | |
| | |
Chemicals—1.8% | | | | | |
Monsanto Co. | | 36,700 | | | 2,581,845 |
Praxair, Inc. | | 116,900 | | | 6,939,184 |
| | | | | |
| | | | | 9,521,029 |
| | | | | |
| | |
Communications Equipment—5.1% | | | | | |
Cisco Systems, Inc. (b) | | 460,400 | | | 7,504,520 |
Juniper Networks, Inc. (b) | | 210,200 | | | 3,680,602 |
QUALCOMM, Inc. | | 309,100 | | | 11,075,053 |
Research In Motion, Ltd. (b) | | 114,900 | | | 4,662,642 |
| | | | | |
| | | | | 26,922,817 |
| | | | | |
| | |
Computers & Peripherals—4.3% | | | | | |
Apple, Inc. (a) (b) | | 219,500 | | | 18,734,325 |
Dell, Inc. (b) | | 194,700 | | | 1,993,728 |
EMC Corp. (b) | | 189,000 | | | 1,978,830 |
| | | | | |
| | | | | 22,706,883 |
| | | | | |
| | |
Diversified Financial Services—0.5% | | | | | |
Moody’s Corp. | | 125,847 | | | 2,528,266 |
| | | | | |
|
Electronic Equipment, Instruments & Components—0.7% |
Dolby Laboratories, Inc. (Class A) (a) (b) | | 118,300 | | | 3,875,508 |
| | | | | |
| | |
Energy Equipment & Services—3.0% | | | | | |
Baker Hughes, Inc. | | 14,700 | | | 471,429 |
Cameron International Corp. (a) (b) | | 96,000 | | | 1,968,000 |
| | | | | |
| Security Description | | Shares | | Value* |
| | | | | |
| | |
Energy Equipment & Services—(Continued) | | | | | |
Schlumberger, Ltd. | | 245,900 | | $ | 10,408,947 |
Smith International, Inc. | | 129,400 | | | 2,961,966 |
| | | | | |
| | | | | 15,810,342 |
| | | | | |
| | |
Food & Staples Retailing—2.8% | | | | | |
Costco Wholesale Corp. | | 126,400 | | | 6,636,000 |
CVS Caremark Corp. | | 179,590 | | | 5,161,417 |
SYSCO Corp. | | 130,500 | | | 2,993,670 |
| | | | | |
| | | | | 14,791,087 |
| | | | | |
| | |
Food Products—2.1% | | | | | |
Groupe Danone (EUR) | | 87,885 | | | 5,304,296 |
Nestle S.A. (CHF) | | 147,260 | | | 5,803,896 |
| | | | | |
| | | | | 11,108,192 |
| | | | | |
| | |
Health Care Equipment & Supplies—7.2% | | | | | |
Alcon, Inc. | | 39,800 | | | 3,549,762 |
Baxter International, Inc. | | 72,000 | | | 3,858,480 |
Becton, Dickinson & Co. | | 80,700 | | | 5,519,073 |
Covidien, Ltd. | | 143,350 | | | 5,195,004 |
Dentsply International, Inc. | | 70,800 | | | 1,999,392 |
Intuitive Surgical, Inc. (a) (b) | | 10,100 | | | 1,282,599 |
Medtronic, Inc. | | 289,100 | | | 9,083,522 |
St. Jude Medical, Inc. (b) | | 111,600 | | | 3,678,336 |
Stryker Corp. | | 91,100 | | | 3,639,445 |
| | | | | |
| | | | | 37,805,613 |
| | | | | |
| | |
Health Care Providers & Services—7.7% | | | | | |
Aetna, Inc. | | 178,900 | | | 5,098,650 |
Express Scripts, Inc. (b) | | 123,300 | | | 6,779,034 |
Humana, Inc. (b) | | 32,100 | | | 1,196,688 |
McKesson Corp. | | 88,100 | | | 3,412,113 |
Medco Health Solutions, Inc. (b) | | 352,100 | | | 14,756,511 |
WellPoint, Inc. (b) | | 225,400 | | | 9,496,102 |
| | | | | |
| | | | | 40,739,098 |
| | | | | |
| | |
Hotels, Restaurants & Leisure—1.5% | | | | | |
Wynn Resorts, Ltd. (a) (b) | | 7,500 | | | 316,950 |
Yum! Brands, Inc. | | 237,700 | | | 7,487,550 |
| | | | | |
| | | | | 7,804,500 |
| | | | | |
| | |
Household Products—1.7% | | | | | |
Procter & Gamble Co. | | 140,305 | | | 8,673,655 |
| | | | | |
| | |
Internet & Catalog Retail—4.1% | | | | | |
Amazon.com, Inc. (a) (b) | | 346,800 | | | 17,783,904 |
Expedia, Inc. (b) | | 200,645 | | | 1,653,315 |
priceline.com, Inc. (a) (b) | | 28,400 | | | 2,091,660 |
| | | | | |
| | | | | 21,528,879 |
| | | | | |
| | |
Internet Software & Services—4.7% | | | | | |
Google, Inc. (Class A) (b) | | 51,500 | | | 15,843,975 |
Tencent Holdings, Ltd. (HKD) | | 432,800 | | | 2,817,631 |
*See accompanying notes to financial statements.
MSF-5
Metropolitan Series Fund, Inc.
T. Rowe Price Large Cap Growth Portfolio
Schedule of Investments as of December 31, 2008
Common Stock—(Continued)
| | | | | |
| Security Description | | Shares | | Value* |
| | | | | |
| | |
Internet Software & Services—(Continued) | | | | | |
VeriSign, Inc. (a) (b) | | 308,300 | | $ | 5,882,364 |
| | | | | |
| | | | | 24,543,970 |
| | | | | |
| | |
IT Services—5.1% | | | | | |
Accenture, Ltd. (Class A) | | 285,800 | | | 9,371,382 |
Automatic Data Processing, Inc. | | 190,900 | | | 7,510,006 |
Fiserv, Inc. (b) | | 94,400 | | | 3,433,328 |
MasterCard, Inc. (a) | | 1,900 | | | 271,567 |
Redecard S.A. (BRL) | | 92,400 | | | 1,030,252 |
The Western Union Co. | | 356,400 | | | 5,110,776 |
Visa, Inc. (a) | | 4,600 | | | 241,270 |
| | | | | |
| | | | | 26,968,581 |
| | | | | |
| | |
Machinery—4.2% | | | | | |
Danaher Corp. (a) | | 324,700 | | | 18,381,267 |
Deere & Co. | | 103,000 | | | 3,946,960 |
| | | | | |
| | | | | 22,328,227 |
| | | | | |
| | |
Media—2.7% | | | | | |
Shaw Communications, Inc. | | 246,100 | | | 4,351,048 |
The McGraw-Hill Cos., Inc. | | 430,500 | | | 9,983,295 |
| | | | | |
| | | | | 14,334,343 |
| | | | | |
| | |
Metals & Mining—0.6% | | | | | |
BHP Billiton, Ltd. (AUD) | | 149,400 | | | 3,146,561 |
| | | | | |
| | |
Oil, Gas & Consumable Fuels—4.4% | | | | | |
Chevron Corp. | | 47,000 | | | 3,476,590 |
EOG Resources, Inc. | | 59,200 | | | 3,941,536 |
Exxon Mobil Corp. | | 146,416 | | | 11,688,389 |
Petroleo Brasileiro S.A. (ADR) | | 201,600 | | | 4,114,656 |
| | | | | |
| | | | | 23,221,171 |
| | | | | |
| | |
Pharmaceuticals—3.9% | | | | | |
Allergan, Inc. | | 161,800 | | | 6,523,776 |
Elan Corp., Plc. (ADR) (a) (b) | | 238,400 | | | 1,430,400 |
Novo Nordisk A/S (DKK) | | 36,800 | | | 1,872,729 |
Teva Pharmaceutical Industries, Ltd. (ADR) (a) | | 58,600 | | | 2,494,602 |
Wyeth | | 216,600 | | | 8,124,666 |
| | | | | |
| | | | | 20,446,173 |
| | | | | |
| | |
Road & Rail—0.2% | | | | | |
Union Pacific Corp. (a) | | 24,800 | | | 1,185,440 |
| | | | | |
|
Semiconductors & Semiconductor Equipment—1.4% |
Broadcom Corp. (b) | | 73,900 | | | 1,254,083 |
Intel Corp. (a) | | 178,900 | | | 2,622,674 |
Marvell Technology Group, Ltd. (b) | | 560,400 | | | 3,737,868 |
| | | | | |
| | | | | 7,614,625 |
| | | | | |
| | |
Software—6.7% | | | | | |
Adobe Systems, Inc. (b) | | 89,100 | | | 1,896,939 |
Autodesk, Inc. (a) (b) | | 234,900 | | | 4,615,785 |
Electronic Arts, Inc. (b) | | 100,205 | | | 1,607,288 |
| | | | | | |
| Security Description | | Shares | | Value* | |
| | | | | | |
| | |
Software—(Continued) | | | | | | |
McAfee, Inc. (b) | | 118,500 | | $ | 4,096,545 | |
Microsoft Corp. | | 666,900 | | | 12,964,536 | |
Nintendo Co., Ltd. (JPY) | | 16,300 | | | 6,262,377 | |
Salesforce.com, Inc. (a) (b) | | 119,800 | | | 3,834,798 | |
| | | | | | |
| | | | | 35,278,268 | |
| | | | | | |
| | |
Specialty Retail—0.5% | | | | | | |
The TJX Cos., Inc. | | 123,600 | | | 2,542,452 | |
| | | | | | |
| | |
Textiles, Apparel & Luxury Goods—0.9% | | | | | | |
Nike, Inc. (a) | | 88,900 | | | 4,533,900 | |
| | | | | | |
|
Wireless Telecommunication Services—4.7% | |
American Tower Corp. (Class A) (a) (b) | | 303,800 | | | 8,907,416 | |
Crown Castle International Corp. (a) (b) | | 453,700 | | | 7,976,046 | |
Leap Wireless International, Inc. (a) (b) | | 103,300 | | | 2,777,737 | |
MetroPCS Communications, Inc. (a) (b) | | 340,200 | | | 5,051,970 | |
| | | | | | |
| | | | | 24,713,169 | |
| | | | | | |
Total Common Stock
(Identified Cost $682,378,028) | | | | | 508,882,043 | |
| | | | | | |
| | |
| Short Term Investments—11.1% | | | | | | |
| | |
Mutual Funds—11.1% | | | | | | |
State Street Navigator Securities Lending Prime Portfolio (c) | | 42,501,379 | | | 42,501,379 | |
T. Rowe Price Reserve Investment Fund (d) | | 15,889,578 | | | 15,889,578 | |
| | | | | | |
Total Short Term Investments
(Identified Cost $58,390,957) | | | | | 58,390,957 | |
| | | | | | |
Total Investments—107.7%
(Identified Cost $740,768,985) (e) | | | | | 567,273,000 | |
Liabilities in excess of other assets | | | | | (40,339,415 | ) |
| | | | | | |
| Total Net Assets—100% | | | | $ | 526,933,585 | |
| | | | | | |
| (a) | A portion or all of the security was on loan. As of December 31, 2008, the market value of securities loaned was $42,438,046 and the collateral received consisted of cash in the amount of $42,501,379. The cash collateral is invested in a money market fund managed by an affiliate of the custodian. |
| (c) | Represents investment of cash collateral received from securities lending transactions. |
| (d) | Affiliated issuer. See below. |
| (e) | The aggregate cost of investments for federal income tax purposes as of December 31, 2008 was $746,087,940 and the composition of unrealized appreciation and depreciation of investment securities was $7,029,305 and $(185,844,245), respectively. |
| (ADR)— | An American Depositary Receipt is a certificate issued by a custodian bank representing the right to receive securities of the foreign issuer described. Trading on exchanges not located in the United States or Canada significantly influences the value of ADRs. |
*See accompanying notes to financial statements.
MSF-6
Metropolitan Series Fund, Inc.
T. Rowe Price Large Cap Growth Portfolio
Schedule of Investments as of December 31, 2008
Affiliated Issuer
| | | | | | | | | | | | | | | |
Security Description | | Number of
Shares
Held at
12/31/2007 | | Shares
Purchased
Since
12/31/2007 | | Shares Sold
Since
12/31/2007 | | | Number of
Shares
Held at
12/31/2008 | | Realized
Gain/Loss on
Shares Sold | | Income for
Year Ended
12/31/2008 |
T. Rowe Price Reserve Investment Fund | | 25,468,225 | | 210,980,818 | | (220,559,465 | ) | | 15,889,578 | | $ | 0 | | $ | 435,806 |
The Portfolio adopted the provisions of Statement of Financial Accounting Standards No. 157, “Fair Value Measurements” (FAS 157), effective with the beginning of the Portfolio’s fiscal year. FAS 157 establishes a framework for measuring fair value and expands disclosures about fair value measurements in financial statements. The three levels of the hierarchy under FAS 157 are described below:
Level 1 - quoted prices in active markets for identical securities
Level 2 - other significant observable inputs (including quoted prices for similar securities, interest rates, credit risk, etc.)
Level 3 - significant unobservable inputs (including the Portfolio’s own assumptions in determining the fair value of investments)
The inputs or methodology used for valuing securities are not necessarily an indication of the risk associated with investing in those securities.
The following is a summary of the inputs used to value the Portfolio’s net assets as of December 31, 2008:
| | | | | | |
| Valuation Inputs | | Investments In
Securities | | Other Financial
Instruments* |
Level 1 - Quoted Prices | | $ | 541,035,258 | | $ | 0 |
Level 2 - Other Significant Observable Inputs | | | 26,237,742 | | | 0 |
Level 3 - Significant Unobservable Inputs | | | 0 | | | 0 |
Total | | $ | 567,273,000 | | $ | 0 |
* Other financial instruments are derivative instruments not reflected in the Schedule of Investments, such as futures, forwards, swap contracts and written options, which are valued based on the unrealized appreciation/depreciation on the instrument.
See accompanying notes to financial statements.
MSF-7
Metropolitan Series Fund, Inc.
T. Rowe Price Large Cap Growth Portfolio
Statement of Assets & Liabilities
December 31, 2008
| | | | | | | |
Assets | | | | | | | |
Investments at value (a) (b) | | | | | $ | 567,273,000 | |
Foreign cash at value (c) | | | | | | 1,954,474 | |
Receivable for: | | | | | | | |
Securities sold | | | | | | 191,054 | |
Fund shares sold | | | | | | 328,771 | |
Accrued interest and dividends | | | | | | 723,455 | |
Foreign taxes | | | | | | 85,662 | |
| | | | | | | |
Total Assets | | | | | | 570,556,416 | |
Liabilities | | | | | | | |
Payable for: | | | | | | | |
Securities purchased | | $ | 558,388 | | | | |
Fund shares redeemed | | | 226,311 | | | | |
Withholding taxes | | | 185 | | | | |
Collateral for securities loaned | | | 42,501,379 | | | | |
Accrued expenses: | | | | | | | |
Management fees | | | 255,436 | | | | |
Service and distribution fees | | | 35,098 | | | | |
Other expenses | | | 46,034 | | | | |
| | | | | | | |
Total Liabilities | | | | | | 43,622,831 | |
| | | | | | | |
Net Assets | | | | | $ | 526,933,585 | |
| | | | | | | |
Net assets consists of: | | | | | | | |
Capital paid in | | | | | $ | 788,679,216 | |
Undistributed net investment income | | | | | | 3,209,107 | |
Accumulated net realized losses | | | | | | (91,472,168 | ) |
Unrealized depreciation on investments and foreign currency | | | | | | (173,482,570 | ) |
| | | | | | | |
Net Assets | | | | | $ | 526,933,585 | |
| | | | | | | |
| Computation of offering price: | | | | | | | |
Class A | | | | | | | |
Net asset value and redemption price per share ($349,388,135 divided by 38,593,299 shares outstanding) | | | | | $ | 9.05 | |
| | | | | | | |
Class B | | | | | | | |
Net asset value and redemption price per share ($161,931,582 divided by 17,973,328 shares outstanding) | | | | | $ | 9.01 | |
| | | | | | | |
Class E | | | | | | | |
Net asset value and redemption price per share ($15,613,868 divided by 1,730,796 shares outstanding) | | | | | $ | 9.02 | |
| | | | | | | |
(a) Identified cost of investments | | | | | $ | 740,768,985 | |
| | | | | | | |
(b) Includes cash collateral for securities loaned of | | | | | $ | 42,501,379 | |
| | | | | | | |
(c) Identified cost of foreign cash | | | | | $ | 1,937,450 | |
| | | | | | | |
Statement of Operations
For the Year Ended December 31, 2008
| | | | | | | | |
Investment Income | | | | | | | | |
Dividends | | | | | | $ | 8,291,291 | (a) |
Interest | | | | | | | 316,577 | (b) |
Interest from affiliates | | | | | | | 435,806 | |
| | | | | | | | |
| | | | | | | 9,043,674 | |
Expenses | | | | | | | | |
Management fees | | $ | 4,368,011 | | | | | |
Service and distribution fees—Class B | | | 588,932 | | | | | |
Service and distribution fees—Class E | | | 35,905 | | | | | |
Directors’ fees and expenses | | | 31,907 | | | | | |
Custodian | | | 170,989 | | | | | |
Audit and tax services | | | 36,941 | | | | | |
Legal | | | 12,435 | | | | | |
Printing | | | 158,058 | | | | | |
Insurance | | | 9,675 | | | | | |
Miscellaneous | | | 22,597 | | | | | |
| | | | | | | | |
Total expenses | | | 5,435,450 | | | | | |
Expense reductions | | | (20,427 | ) | | | | |
Management fee waivers | | | (122,613 | ) | | | 5,292,410 | |
| | | | | | | | |
Net Investment Income | | | | | | | 3,751,264 | |
| | | | | | | | |
Realized and Unrealized Loss | | | | | | | | |
| Realized gain (loss) on: | | | | | | | | |
Investments—net | | | (87,059,396 | ) | | | | |
Futures contracts—net | | | 500,922 | | | | | |
Foreign currency transactions—net | | | (380,247 | ) | | | (86,938,721 | ) |
| | | | | | | | |
| Change in unrealized appreciation (depreciation) on: | | | | | | | | |
Investments—net | | | (277,657,644 | ) | | | | |
Foreign currency transactions—net | | | 5,269 | | | | (277,652,375 | ) |
| | | | | | | | |
Net loss | | | | | | | (364,591,096 | ) |
| | | | | | | | |
Net Decrease in Net Assets From Operations | | | | | | $ | (360,839,832 | ) |
| | | | | | | | |
| (a) | Net of foreign taxes of $254,524. |
| (b) | Includes income on securities loaned of $314,902. |
See accompanying notes to financial statements.
MSF-8
Metropolitan Series Fund, Inc.
T. Rowe Price Large Cap Growth Portfolio
Statements of Changes in Net Assets
| | | | | | | | |
| | | Year ended
December 31,
2008 | | | Year ended
December 31,
2007 | |
From Operations | | | | | | | | |
Net investment income | | $ | 3,751,264 | | | $ | 4,267,220 | |
Net realized gain (loss) | | | (86,938,721 | ) | | | 40,192,023 | |
Unrealized appreciation (depreciation) | | | (277,652,375 | ) | | | 21,456,162 | |
| | | | | | | | |
Increase (decrease) in net assets from operations | | | (360,839,832 | ) | | | 65,915,405 | |
| | | | | | | | |
From Distributions to Shareholders | | | | | | | | |
Net investment income | | | | | | | | |
Class A | | | (2,889,397 | ) | | | (2,029,262 | ) |
Class B | | | (698,154 | ) | | | (535,551 | ) |
Class E | | | (102,304 | ) | | | (92,499 | ) |
| | | | | | | | |
| | | (3,689,855 | ) | | | (2,657,312 | ) |
| | | | | | | | |
Net realized gain | | | | | | | | |
Class A | | | (27,629,858 | ) | | | (4,030,340 | ) |
Class B | | | (13,352,198 | ) | | | (2,470,445 | ) |
Class E | | | (1,397,544 | ) | | | (275,570 | ) |
| | | | | | | | |
| | | (42,379,600 | ) | | | (6,776,355 | ) |
| | | | | | | | |
Total distributions | | | (46,069,455 | ) | | | (9,433,667 | ) |
| | | | | | | | |
Increase in net assets from capital share transactions | | | 57,214,320 | | | | 136,440,858 | |
| | | | | | | | |
Net increase (decrease) in net assets | | | (349,694,967 | ) | | | 192,922,596 | |
| | |
Net Assets | | | | | | | | |
Beginning of the period | | | 876,628,552 | | | | 683,705,956 | |
| | | | | | | | |
End of the period | | $ | 526,933,585 | | | $ | 876,628,552 | |
| | | | | | | | |
Undistributed Net Investment Income | | | | | | | | |
End of the period | | $ | 3,209,107 | | | $ | 3,618,628 | |
| | | | | | | | |
Other Information:
Capital Shares
Transactions in capital shares were as follows:
| | | | | | | | | | | | | | |
| | | Year ended
December 31, 2008 | | | Year ended
December 31, 2007 | |
| | | Shares | | | $ | | | Shares | | | $ | |
Class A | | | | | | | | | | | | | | |
Sales | | 10,609,211 | | | $ | 132,411,115 | | | 18,615,964 | | | $ | 299,429,944 | |
Reinvestments | | 2,104,776 | | | | 30,519,255 | | | 381,587 | | | | 6,059,602 | |
Redemptions | | (7,651,482 | ) | | | (106,168,770 | ) | | (8,709,171 | ) | | | (140,654,691 | ) |
| | | | | | | | | | | | | | |
Net increase | | 5,062,505 | | | $ | 56,761,600 | | | 10,288,380 | | | $ | 164,834,855 | |
| | | | | | | | | | | | | | |
Class B | | | | | | | | | | | | | | |
Sales | | 3,550,685 | | | $ | 45,815,236 | | | 4,092,071 | | | $ | 65,765,107 | |
Reinvestments | | 972,343 | | | | 14,050,352 | | | 189,773 | | | | 3,005,996 | |
Redemptions | | (4,357,772 | ) | | | (56,349,953 | ) | | (6,126,259 | ) | | | (96,631,962 | ) |
| | | | | | | | | | | | | | |
Net increase (decrease) | | 165,256 | | | $ | 3,515,635 | | | (1,844,415 | ) | | $ | (27,860,859 | ) |
| | | | | | | | | | | | | | |
Class E | | | | | | | | | | | | | | |
Sales | | 457,373 | | | $ | 5,923,875 | | | 620,754 | | | $ | 10,039,787 | |
Reinvestments | | 103,724 | | | | 1,499,848 | | | 23,222 | | | | 368,069 | |
Redemptions | | (788,254 | ) | | | (10,486,638 | ) | | (679,344 | ) | | | (10,940,994 | ) |
| | | | | | | | | | | | | | |
Net decrease | | (227,157 | ) | | $ | (3,062,915 | ) | | (35,368 | ) | | $ | (533,138 | ) |
| | | | | | | | | | | | | | |
Increase derived from capital share transactions | | | | | $ | 57,214,320 | | | | | | $ | 136,440,858 | |
| | | | | | | | | | | | | | |
See accompanying notes to financial statements.
MSF-9
Metropolitan Series Fund, Inc.
T. Rowe Price Large Cap Growth Portfolio
Financial Highlights
| | | | | | | | | | | | | | | | | | | | |
| | | Class A | |
| | | Year ended December 31, | |
| | | 2008 | | | 2007 | | | 2006 | | | 2005 | | | 2004 | |
Net Asset Value, Beginning of Period | | $ | 16.48 | | | $ | 15.27 | | | $ | 13.53 | | | $ | 12.77 | | | $ | 11.64 | |
| | | | | | | | | | | | | | | | | | | | |
Income From Investment Operations | | | | | | | | | | | | | | | | | | | | |
Net investment income | | | 0.08 | (a) | | | 0.10 | (a) | | | 0.09 | (a) | | | 0.05 | | | | 0.08 | |
Net realized and unrealized gain (loss) of investments | | | (6.66 | ) | | | 1.32 | | | | 1.70 | | | | 0.78 | | | | 1.07 | |
| | | | | | | | | | | | | | | | | | | | |
Total from investment operations | | | (6.58 | ) | | | 1.42 | | | | 1.79 | | | | 0.83 | | | | 1.15 | |
| | | | | | | | | | | | | | | | | | | | |
Less Distributions | | | | | | | | | | | | | | | | | | | | |
Distributions from net investment income | | | (0.08 | ) | | | (0.07 | ) | | | (0.05 | ) | | | (0.07 | ) | | | (0.02 | ) |
Distributions from net realized capital gains | | | (0.77 | ) | | | (0.14 | ) | | | 0.00 | | | | 0.00 | | | | 0.00 | |
| | | | | | | | | | | | | | | | | | | | |
Total distributions | | | (0.85 | ) | | | (0.21 | ) | | | (0.05 | ) | | | (0.07 | ) | | | (0.02 | ) |
| | | | | | | | | | | | | | | | | | | | |
Net Asset Value, End of Period | | $ | 9.05 | | | $ | 16.48 | | | $ | 15.27 | | | $ | 13.53 | | | $ | 12.77 | |
| | | | | | | | | | | | | | | | | | | | |
Total Return (%) | | | (41.9 | ) | | | 9.4 | | | | 13.2 | | | | 6.6 | | | | 9.9 | |
Ratio of operating expenses to average net assets before expense reductions (%) | | | 0.65 | | | | 0.66 | | | | 0.68 | | | | 0.71 | | | | 0.74 | |
Ratio of operating expenses to average net assets after expense reductions (%) (b) | | | 0.64 | | | | 0.65 | | | | 0.68 | | | | 0.70 | | | | 0.73 | |
Ratio of operating expenses to average net assets without giving effect to the contractual expense agreement would have been (%) (c) | | | 0.67 | | | | 0.67 | | | | 0.70 | | | | N/A | | | | N/A | |
Ratio of net investment income to average net assets (%) | | | 0.61 | | | | 0.64 | | | | 0.65 | | | | 0.44 | | | | 0.68 | |
Portfolio turnover rate (%) | | | 59 | | | | 61 | | | | 55 | | | | 35 | | | | 37 | |
Net assets, end of period (000) | | $ | 349,388 | | | $ | 552,460 | | | $ | 354,798 | | | $ | 235,513 | | | $ | 198,913 | |
| | | | | | | | | | | | | | | | | | | | |
| | | Class B | |
| | | Year ended December 31, | |
| | | 2008 | | | 2007 | | | 2006 | | | 2005 | | | 2004 | |
Net Asset Value, Beginning of Period | | $ | 16.40 | | | $ | 15.19 | | | $ | 13.47 | | | $ | 12.72 | | | $ | 11.60 | |
| | | | | | | | | | | | | | | | | | | | |
Income From Investment Operations | | | | | | | | | | | | | | | | | | | | |
Net investment income | | | 0.05 | (a) | | | 0.06 | (a) | | | 0.05 | (a) | | | 0.01 | | | | 0.05 | |
Net realized and unrealized gain (loss) of investments | | | (6.63 | ) | | | 1.32 | | | | 1.68 | | | | 0.79 | | | | 1.08 | |
| | | | | | | | | | | | | | | | | | | | |
Total from investment operations | | | (6.58 | ) | | | 1.38 | | | | 1.73 | | | | 0.80 | | | | 1.13 | |
| | | | | | | | | | | | | | | | | | | | |
Less Distributions | | | | | | | | | | | | | | | | | | | | |
Distributions from net investment income | | | (0.04 | ) | | | (0.03 | ) | | | (0.01 | ) | | | (0.05 | ) | | | (0.01 | ) |
Distributions from net realized capital gains | | | (0.77 | ) | | | (0.14 | ) | | | 0.00 | | | | 0.00 | | | | 0.00 | |
| | | | | | | | | | | | | | | | | | | | |
Total distributions | | | (0.81 | ) | | | (0.17 | ) | | | (0.01 | ) | | | (0.05 | ) | | | (0.01 | ) |
| | | | | | | | | | | | | | | | | | | | |
Net Asset Value, End of Period | | $ | 9.01 | | | $ | 16.40 | | | $ | 15.19 | | | $ | 13.47 | | | $ | 12.72 | |
| | | | | | | | | | | | | | | | | | | | |
Total Return (%) | | | (42.0 | ) | | | 9.2 | | | | 12.9 | | | | 6.3 | | | | 9.7 | |
Ratio of operating expenses to average net assets before expense reductions (%) | | | 0.90 | | | | 0.91 | | | | 0.93 | | | | 0.96 | | | | 0.99 | |
Ratio of operating expenses to average net assets after expense reductions (%) (b) | | | 0.89 | | | | 0.90 | | | | 0.93 | | | | 0.95 | | | | 0.98 | |
Ratio of operating expenses to average net assets without giving effect to the contractual expense agreement would have been (%) (c) | | | 0.92 | | | | 0.92 | | | | 0.95 | | | | N/A | | | | N/A | |
Ratio of net investment income to average net assets (%) | | | 0.35 | | | | 0.39 | | | | 0.34 | | | | 0.20 | | | | 0.93 | |
Portfolio turnover rate (%) | | | 59 | | | | 61 | | | | 55 | | | | 35 | | | | 37 | |
Net assets, end of period (000) | | $ | 161,932 | | | $ | 292,019 | | | $ | 298,582 | | | $ | 106,181 | | | $ | 48,955 | |
| Please | see following page for Financial Highlights footnote legend. |
See accompanying notes to financial statements.
MSF-10
Metropolitan Series Fund, Inc.
T. Rowe Price Large Cap Growth Portfolio
Financial Highlights
| | | | | | | | | | | | | | | | | | | | |
| | | Class E | |
| | | Year ended December 31, | |
| | | 2008 | | | 2007 | | | 2006 | | | 2005 | | | 2004 | |
Net Asset Value, Beginning of Period | | $ | 16.42 | | | $ | 15.21 | | | $ | 13.49 | | | $ | 12.73 | | | $ | 11.61 | |
| | | | | | | | | | | | | | | | | | | | |
Income From Investment Operations | | | | | | | | | | | | | | | | | | | | |
Net investment income | | | 0.06 | (a) | | | 0.08 | (a) | | | 0.07 | (a) | | | 0.04 | | | | 0.06 | |
Net realized and unrealized gain (loss) of investments | | | (6.63 | ) | | | 1.32 | | | | 1.68 | | | | 0.77 | | | | 1.08 | |
| | | | | | | | | | | | | | | | | | | | |
Total from investment operations | | | (6.57 | ) | | | 1.40 | | | | 1.75 | | | | 0.81 | | | | 1.14 | |
| | | | | | | | | | | | | | | | | | | | |
Less Distributions | | | | | | | | | | | | | | | | | | | | |
Distributions from net investment income | | | (0.06 | ) | | | (0.05 | ) | | | (0.03 | ) | | | (0.05 | ) | | | (0.02 | ) |
Distributions from net realized capital gains | | | (0.77 | ) | | | (0.14 | ) | | | 0.00 | | | | 0.00 | | | | 0.00 | |
| | | | | | | | | | | | | | | | | | | | |
Total distributions | | | (0.83 | ) | | | (0.19 | ) | | | (0.03 | ) | | | (0.05 | ) | | | (0.02 | ) |
| | | | | | | | | | | | | | | | | | | | |
Net Asset Value, End of Period | | $ | 9.02 | | | $ | 16.42 | | | $ | 15.21 | | | $ | 13.49 | | | $ | 12.73 | |
| | | | | | | | | | | | | | | | | | | | |
Total Return (%) | | | (41.9 | ) | | | 9.3 | | | | 13.0 | | | | 6.4 | | | | 9.8 | |
Ratio of operating expenses to average net assets before expense reductions (%) | | | 0.80 | | | | 0.81 | | | | 0.83 | | | | 0.86 | | | | 0.89 | |
Ratio of operating expenses to average net assets after expense reductions (%) (b) | | | 0.79 | | | | 0.80 | | | | 0.83 | | | | 0.85 | | | | 0.88 | |
Ratio of operating expenses to average net assets without giving effect to the contractual expense agreement would have been (%) (c) | | | 0.82 | | | | 0.82 | | | | 0.85 | | | | N/A | | | | N/A | |
Ratio of net investment income to average net assets (%) | | | 0.45 | | | | 0.50 | | | | 0.51 | | | | 0.29 | | | | 0.56 | |
Portfolio turnover rate (%) | | | 59 | | | | 61 | | | | 55 | | | | 35 | | | | 37 | |
Net assets, end of period (000) | | $ | 15,614 | | | $ | 32,149 | | | $ | 30,325 | | | $ | 28,968 | | | $ | 27,341 | |
| (a) | Per share amount is based on average shares outstanding during the period. |
| (b) | The Portfolio has entered into arrangements with certain brokers who paid a portion of the Portfolio’s expenses. |
| (c) | See Note 4 of the Notes to Financial Statements. |
See accompanying notes to financial statements.
MSF-11
Metropolitan Series Fund, Inc.
T. Rowe Price Large Cap Growth Portfolio
Notes to Financial Statements—December 31, 2008
Metropolitan Series Fund, Inc. (the “Fund”) is organized as a corporation under the laws of Maryland pursuant to Articles of Incorporation filed on November 23, 1982, as amended, and registered under the Investment Company Act of 1940, as amended (the “1940 Act”), as an open-end investment company. The Fund is a “series” type of mutual fund, which issues separate series of stock. Each series represents an interest in a separate portfolio of Fund investments. The T. Rowe Price Large Cap Growth Portfolio (the “Portfolio”) is a diversified series of the Fund. Shares in the Fund are not offered directly to the general public and are currently available only to separate accounts established by Metropolitan Life Insurance Company (“MetLife”), New England Life Insurance Company, General American Life Insurance Company (“General American”), The MetLife Investors Group of Insurance Companies, MetLife Insurance Company of Connecticut and other affiliated insurance companies (collectively, the “Insurance Companies”) and to certain eligible qualified retirement plans (“Qualified Plans”), as an investment vehicle for variable life insurance, group annuity or variable annuity products of these insurance companies or Qualified Plans, although the Portfolio is not available to all such separate accounts and Qualified Plans. The Portfolio’s shares may be divided into different classes. Currently, the classes being offered by the Portfolio are named Class A, Class B and Class E. The classes of the Portfolio’s shares are identical, except that certain additional charges (Rule 12b-1 fees) are made against Class B and Class E shares. Investment income, realized and unrealized capital gains and losses, the common expenses of the Portfolio and certain Portfolio-level expense reductions, if any, are allocated daily, on a pro rata basis, to each class based on the relative net assets of each class to the total net assets of the Portfolio.
| 2. | SIGNIFICANT ACCOUNTING POLICIES: |
The preparation of financial statements in conformity with accounting principles generally accepted in the United States of America (“GAAP”) requires management to make estimates and assumptions that affect the reported amounts of assets and liabilities and disclosure of contingent assets and liabilities as of the date of the financial statements and the reported amounts of income and expenses during the reporting period. Actual results could differ from those estimates.
The following is a summary of significant accounting policies consistently followed by the Portfolio in the preparation of its financial statements. The policies are in conformity with GAAP.
Investment Valuation:
Debt securities (other than short term obligations with a remaining maturity of sixty days or less) are generally valued on the basis of evaluated or composite bid quotations obtained by independent pricing services and/or brokers and dealers selected by the relevant subadviser pursuant to authorization of the Board of Directors of the Fund (the “Board” or “Directors”). Such quotations take into account appropriate factors such as institutional-sized trading in similar groups of securities, yield, quality, coupon rate, maturity, type of issue, trading characteristics and other data. Short term obligations with a remaining maturity of sixty days or less are valued at amortized cost which approximates fair market value.
Equity securities traded on a national securities exchange or other exchanges are valued at their last sale price on the principal trading market. Equity securities traded on the NASDAQ National Market System are valued at the NASDAQ Official Closing Price (the “NOCP”). The NOCP is the last reported sale price if the last reported sale price falls between the spread of the last reported bid and asked prices. If the last reported bid and asked prices are above the last reported sale price, the NOCP will be the last reported bid price. If the last reported bid and asked prices are below the last reported sale price, the NOCP will be the last reported asked price. Equity securities traded on a national securities exchange or other exchanges or on the NASDAQ National Market System for which there is no reported sale during the day are valued at the last reported bid price. A security that is listed or traded on more than one exchange is valued at the quotation on the exchange determined to be the primary market for that security by the Board or its delegates. If no closing price is available, then such securities are valued by using the last reported bid price. Equity securities traded over-the-counter are valued at the last reported sales price.
If no current market value quotation is readily available or reliable for a portfolio security, fair value will be determined in accordance with procedures established by and under the general supervision of the Board. When the Portfolio uses fair value pricing, it may take into account any factors it deems appropriate. The value of securities used by the Portfolio to calculate its net asset value may differ from quoted or published prices for the same securities. Fair value pricing involves subjective judgments and the fair value determined for a security may be materially different than the value that could be realized upon the sale of that security.
The Portfolio expects to use fair value pricing for securities primarily traded on U.S. exchanges only under very limited circumstances. For example, the Portfolio may use fair value pricing if the exchange on which a security is traded closes early or trading in the security is suspended.
MSF-12
Metropolitan Series Fund, Inc.
T. Rowe Price Large Cap Growth Portfolio
Notes to Financial Statements—December 31, 2008—(Continued)
Securities traded primarily on an exchange outside of the United States which closes before the close of the New York Stock Exchange will be valued at the last sales price on that non-U.S. exchange. Securities traded primarily on an exchange outside of the United States for which there is no reported sale during the day are valued at the mean between the last reported bid and asked prices. However, because most foreign markets close well before the Portfolio values its securities (typically at 4 p.m. Eastern Time), the earlier close of these foreign markets gives rise to the possibility that significant events, including broad market moves, may have occurred after these foreign markets close but before the Portfolio values its securities. To account for this, the Portfolio may frequently value many of its foreign equity securities using fair value prices based on third party vendor modeling tools.
Forward foreign currency exchange contracts are valued based on the mean between closing bid and asked prices of the forward currency contract rates in the London foreign exchange markets on a daily basis as provided by a reliable bank or dealer.
Options, whether on securities, indices, futures contracts, or otherwise, are valued at the last sales price available as of the close of business on the day of valuation or, if there is no such sale price available, at the mean between the bid and asked prices. Options on currencies are valued at the spot price each day.
The value of futures contracts will be the sum of the margin deposit plus or minus the difference between the value of the futures contract on each day the net asset value is calculated and the value on the date the futures contract originated, value being that established on a recognized commodity exchange, or by reference to other customary sources, with gain or loss being realized when the futures contract closes or expires.
Subject to the Board’s oversight, the Board has delegated the day-to-day oversight of pricing matters, including determinations in good faith under the Fund’s procedures the fair value of securities for which current market quotations are not readily available to the subadviser of the Portfolio.
Investment Transactions and Related Investment Income:
Portfolio security transactions are recorded on the trade date. Dividend income is recorded on the ex-dividend date or, for certain foreign securities, when notified. Interest income, which includes amortization of premium and accretion of discount on debt securities, is recorded on the accrual basis. Realized gains and losses on investments and unrealized appreciation and depreciation are determined on the identified cost basis, which is the same basis used for federal income tax purposes.
Repurchase Agreements:
The Portfolio, through the custodian or a subcustodian, receives delivery of the underlying securities collateralizing repurchase agreements. The Portfolio requires the custodian to take possession, to have legally segregated in the Federal Reserve Book Entry System, or to have segregated within the custodian’s vault, all securities held as collateral for repurchase agreements. It is the Portfolio’s policy that the market value of the collateral be at least equal to 100% of the repurchase price in the case of a repurchase agreement of one-day duration and 102% on all other repurchase agreements. The Portfolio’s subadviser is responsible for determining that the value of the collateral is at all times at least equal to the repurchase price. In connection with transactions in repurchase agreements, if the seller defaults and the value of the collateral declines or if the seller enters an insolvency proceeding, realization of the collateral by the Portfolio may be delayed, limited or wholly denied.
Foreign Currency Translation:
The books and records of the Portfolio are maintained in U.S. dollars. The values of securities, currencies and other assets and liabilities denominated in currencies other than U.S. dollars are translated into U.S. dollars based upon foreign exchange rates prevailing at the end of the period. Purchases and sales of investment securities, income and expenses are translated on the respective dates of such transactions. Since the values of investment securities are presented at the foreign exchange rates prevailing at the end of the period, it is not practical to isolate that portion of the results of operations arising from changes in exchange rates from that portion of the results of operations reflecting fluctuations arising from changes in market prices of the investment securities. Such fluctuations are included in the net realized and unrealized gain or loss on investments.
Net realized foreign exchange gains or losses arise from sales of foreign currency, currency gains or losses realized between the trade and settlement dates on securities transactions, and the difference between the amounts of dividends, interest, and foreign withholding taxes recorded by the Portfolio and the U.S. dollar equivalent of the amounts actually received or paid by the Portfolio. Net unrealized foreign exchange gains and losses arise from changes in the value of assets and liabilities, other than investment securities, resulting from changes in the exchange rate.
MSF-13
Metropolitan Series Fund, Inc.
T. Rowe Price Large Cap Growth Portfolio
Notes to Financial Statements—December 31, 2008—(Continued)
Forward Foreign Currency Exchange Contracts:
The Portfolio may enter into forward foreign currency exchange contracts primarily to hedge against foreign currency exchange rate risks on its non-U.S. dollar denominated investment securities. When entering into a forward currency contract, the Portfolio agrees to receive or deliver a fixed quantity of foreign currency for an agreed-upon price on an agreed future date. These contracts are valued daily and the Portfolio’s net equity therein, representing unrealized gain or loss on the contracts as measured by the difference between the foreign exchange rates at the dates of entry into the contracts and the forward rates at the settlement date, is included in the Statement of Assets and Liabilities. Realized and unrealized gains and losses are included in the Statement of Operations. These instruments involve market and/or credit risk in excess of the amount recognized in the Statement of Assets and Liabilities. Risks arise from the possible inability of counterparties to meet the terms of their contracts and from movement in currency and securities values and interest rates.
Futures Contracts:
The Portfolio may buy and sell futures contracts (on recognized exchanges) as a hedge, to maintain exposure to the broad equity markets or to enhance return. Futures contracts are agreements to buy or sell a security, or deliver a final cash settlement price in connection with an index, interest rate, currency, or other contracts not calling for physical delivery, for a set price in the future. The Portfolio must post an amount equal to a portion of the total market value of the futures contract as futures variation margin, which is returned when the Portfolio’s obligations under the contract have been satisfied. From time to time thereafter, the Portfolio may have to post variation margin to maintain this amount as the market value of the contract fluctuates. Risks of entering into futures contracts (and related options) include the possibility that there may be an illiquid market and that a change in the value of the contract or option may not correlate with changes in the value of the underlying securities.
Options:
The Portfolio may use options to hedge against changes in values of securities the Portfolio owns or expects to purchase, to maintain exposure to the broad equity markets or to enhance return. Writing puts or buying calls tends to increase the Portfolio’s exposure to the underlying instrument and writing calls or buying puts tends to decrease the Portfolio’s exposure to the underlying instrument, and can be used to hedge other Portfolio investments. For options purchased to hedge the Portfolio’s investments, the potential risk to the Portfolio is that the change in value of options contracts may not correspond to the change in value of the hedged instruments. In addition, losses may arise from changes in the value of the underlying instruments, if there is an illiquid secondary market, or if the counterparty is unable to perform. The maximum loss for purchased options is limited to the premium initially paid for the option. For options written by the Portfolio, the maximum loss is not limited to the premium initially received for the option.
The main risk associated with purchasing an option is that the option expires without being exercised. In this case, the option expires worthless and the premium paid for the option is considered the loss. The risk associated with writing a call option is that the Portfolio may forgo the opportunity for a profit if the market value of the underlying position increases and the option is exercised. The risk in writing a put option is that the Portfolio may incur a loss if the market value of the underlying position decreases and the option is exercised. In addition, the Portfolio risks not being able to enter into a closing transaction for the written option as the result of an illiquid market.
“When-Issued” Securities:
Purchasing securities “when-issued” is a forward commitment by the Portfolio to buy a security. The estimated amount of the Portfolio’s payment obligation and the security’s interest rate are determined when the commitment is made, even though no interest accrues until the security is issued, which is generally 15 to 120 days later. The Portfolio will segregate liquid assets with its custodian sufficient at all times to satisfy these commitments. If the value of the security is less when delivered than when the commitment was made, the Portfolio will suffer a loss.
Federal Income Taxes:
It is the Portfolio’s policy to comply with the requirements of the Internal Revenue Code of 1986, as amended (the “Code”), and regulations thereunder, applicable to regulated investment companies and to distribute, with respect to each taxable year, all of its taxable income to shareholders. Therefore, no federal income tax provision is required. The Portfolio is subject to the provisions of the Financial Accounting Standards Board Interpretation (“FASB”) No. 48, Accounting for Uncertainties in Income
MSF-14
Metropolitan Series Fund, Inc.
T. Rowe Price Large Cap Growth Portfolio
Notes to Financial Statements—December 31, 2008—(Continued)
Taxes (FIN 48). FIN 48 sets forth a minimum threshold for financial statement recognition of the benefit of a tax position taken or expected to be taken in a tax return. The implementation of FIN 48 did not result in any unrecognized tax benefits in the accompanying financial statements. Each of the Portfolio’s federal tax returns for the prior three fiscal years remains subject to examination by the Internal Revenue Service.
As of December 31, 2008, the Portfolio had $40,338,334 in capital loss carryforwards expiring on December 31, 2016.
Pursuant to Section 852 of the Code, the Portfolio designated the amount shown below under Long Term Gain as capital gain dividends for its taxable year ended December 31, 2008. The tax character of distributions paid for the periods ended December 31, 2008 and 2007 was as follows:
| | | | | | | | | | | | | | | | | | | | | | |
| Ordinary Income | | Long Term Gain | | Return of
Capital | | Total |
| 2008 | | 2007 | | 2008 | | 2007 | | 2008 | | 2007 | | 2008 | | 2007 |
| $ | 12,048,296 | | $ | 2,657,312 | | $ | 34,021,159 | | $ | 6,776,355 | | $ | — | | $ | — | | $ | 46,069,455 | | $ | 9,433,667 |
As of December 31, 2008, the components of distributable earnings (accumulated losses) on a federal income tax basis were as follows:
| | | | | | | | | | | | | | | | |
Undistributed
Ordinary
Income | | Undistributed
Long Term
Gain | | Unrealized
Depreciation | | | Loss
Carryforwards | | | Total | |
| $ | 3,209,108 | | $ | — | | $ | (178,801,525 | ) | | $ | (40,338,334 | ) | | $ | (215,930,751 | ) |
Pursuant to Federal income tax regulations applicable to investment companies, the Portfolio has elected to treat net capital losses realized between November 1 and December 31 of each year as occurring on the first day of the following tax year. For the year ended December 31, 2008, the following amounts of realized capital and currency losses reflected in the accompanying financial statements will not be recognized for Federal income tax purposes until January 1, 2009:
| | | | |
Currency | | Capital | |
$— | | $ | (45,814,880 | ) |
Dividends and Distributions to Shareholders:
The Portfolio records dividends and distributions on the ex-dividend date. Net realized gains from security transactions (if any) are generally distributed annually to shareholders. The timing and characterization of certain income and capital gains distributions are determined in accordance with federal tax regulations that may differ from GAAP. Permanent book and tax basis differences relating to shareholder distributions will result in reclassification between under/over distributed net investment income, accumulated net realized gains/losses and paid in capital.
Expense Reductions:
Certain Portfolio trades are directed to brokers who paid a portion of the Portfolio’s expenses. Amounts paid for the Portfolio are shown as expense reductions in the Statement of Operations.
| 3. | INVESTMENT TRANSACTIONS: |
For the year ended December 31, 2008, purchases and sales of securities (excluding short term investments) for the Portfolio were as follows:
| | | | | | | | | | |
| Purchases | | Sales |
| U.S. Government | | Other | | U.S. Government | | Other |
| $ | 0 | | $ | 442,742,948 | | $ | 0 | | $ | 422,153,153 |
MSF-15
Metropolitan Series Fund, Inc.
T. Rowe Price Large Cap Growth Portfolio
Notes to Financial Statements—December 31, 2008—(Continued)
| 4. | INVESTMENT MANAGEMENT FEES AND OTHER TRANSACTIONS WITH AFFILIATES: |
Investment Management Agreement:
MetLife Advisers, LLC (“MetLife Advisers”) is the investment adviser to the Portfolio. The Fund has entered into an investment management agreement with MetLife Advisers with respect to the Portfolio. For providing investment management services to the Portfolio, MetLife Advisers receives monthly compensation at the following annual rates:
| | | | |
Management
Fees earned by
MetLife Advisers
for the year ended
December 31, 2008 | | Annual
percentage
rates paid to
MetLife Advisers | | Based on Portfolios
average daily net asset
levels |
| $4,368,011 | | 0.650% | | Of the first $50 million |
| | 0.600% | | On amounts in excess of $50 million |
Certain officers and directors of the Fund may also be officers of MetLife Advisers; however, such officers and directors receive no compensation from the Fund.
MetLife Advisers has entered into an investment subadvisory agreement with respect to the Portfolio. T. Rowe Price Associates, Inc. (“T. Rowe Price”) is compensated by MetLife Advisers to provide subadvisory services for the Portfolio.
Management Fee Waivers:
Pursuant to an expense agreement, MetLife Advisers has agreed, for the period May 1, 2008 to April 30, 2009, to reduce its advisory fees set out above under “Investment Management Agreement” for each class of the Portfolio at the annual rate of 0.015% of the first $50 million of the Portfolio’s average daily net assets. A similar agreement was in place for the period May 1, 2007 through April 30, 2008. Amounts waived for the year ended December 31, 2008 are shown as management fee waivers in the Statement of Operations.
Effective February 17, 2005, T. Rowe Price agreed to a voluntary subadvisory fee waiver that applies if (i) assets under management by T. Rowe Price for the Fund and Met Investor Series Trust (“MIST”), in the aggregate, exceed $750,000,000, (ii) T. Rowe Price subadvises three or more portfolios of the Fund and MIST in the aggregate, and (iii) at least one of those portfolios is a large cap domestic equity portfolio.
If the aforementioned conditions are met, T. Rowe Price will waive its subadvisory fee paid by MetLife Advisers by 5% for combined Fund and MIST average daily net assets over $750,000,000, 7.5% for the next $1,500,000,000 of combined assets, and 10% for amounts over $3,000,000,000. Any amounts waived pursuant to this subadvisory fee waiver will be allocated with respect to the Fund and MIST portfolios in proportion to such portfolios’ net assets. MetLife Advisers has voluntarily agreed to reduce its advisory fee for T. Rowe Price Large Cap Growth and T. Rowe Price Small Cap Growth by the amount waived (if any) by T. Rowe Price for the relevant Portfolio(s) pursuant to this voluntary subadvisory fee waiver. Because these fee waivers are voluntary, and not contractual, they may be discontinued by T. Rowe Price and MetLife Advisers at any time. Amounts waived for the year ended December 31, 2008 are shown as management fee waivers in the Statement of Operations of the respective Portfolios.
Service and Distribution Fees:
The Fund has adopted a Distribution and Service Plan under Rule 12b-1 of the 1940 Act for the Portfolio’s Class B and E shares. Under the Distribution and Service Plan, the Class B and E shares of the Portfolio pay a fee to compensate the Insurance Companies (or their affiliates) and other broker-dealers and financial intermediaries involved in the offer and sale of Portfolio shares for promoting or selling and servicing the Class B and E shares. The fees under the Distribution and Service Plan for each class of the Portfolio’s shares are calculated as a percentage of the Portfolio’s average daily net assets that are attributable to that Class. Currently, the fee is 0.25% per year for Class B shares and 0.15% per year for Class E shares. Amounts paid by the Portfolio for the year ended December 31, 2008 are shown as Service and Distribution fees in the Statement of Operations.
The Fund has entered into a securities lending arrangement with the Fund’s custodian, State Street Bank and Trust Company (the “custodian”). Under the agreement, the custodian is authorized to loan securities on the Portfolios’ behalf. In exchange, the Portfolio receives either cash or securities as collateral against the loaned securities. The Portfolio receives collateral at least equal to 102% of the market value of the loaned securities (105% for foreign securities), at each loan’s inception. Collateral must
MSF-16
Metropolitan Series Fund, Inc.
T. Rowe Price Large Cap Growth Portfolio
Notes to Financial Statements—December 31, 2008—(Continued)
be maintained at least at 100% of the market value of the loaned securities for the duration of the loan. The cash collateral is invested in the Navigator Securities Lending Prime Portfolio, an affiliate of the custodian, which invests in a variety of high quality U.S. dollar-denominated instruments. If the market value of the collateral at the close of trading on a business day is less than 100% of the market value of the loaned securities at the close of trading on that day, the borrower shall be required to deliver, by the close of business on the following business day, an additional amount of collateral, equal to at least 100% of the market value of all the loaned securities as of such preceding day. The Portfolio receives 80% of the annual net income from securities lending transactions, which is included in interest income of the Portfolio. The remaining 20% is paid to the custodian as compensation for its securities lending services. Interest income received by the Portfolio via lending transactions during the year ended December 31, 2008 is footnoted in the Statement of Operations. The Portfolio bears the risk of any deficiency in the amount of collateral available for return to a borrower due to a loss in an approved investment purchased with such collateral. Any outstanding loans by the Portfolio at December 31, 2008 are footnoted in the Schedule of Investments.
| 6. | MARKET AND CREDIT RISK: |
In the normal course of business, the Portfolio invests in securities and enters into transactions where risks exist due to fluctuations in the market (market risk) or failure of the other party to a transaction to perform (credit risk). The value of securities held by the Portfolio may decline in response to certain events, including those directly involving the companies whose securities are owned by the Portfolio; conditions affecting the general economy; overall market changes; local, regional or global political, social or economic instability; and currency and interest rate and price fluctuations. Similar to credit risk, the Portfolio may be exposed to counterparty risk, or the risk that an entity with which the Portfolio has unsettled or open transactions may default. Financial assets, which potentially expose the Portfolio to credit and counterparty risks, consist principally of investments and cash due from counterparties. The extent of the Portfolio’s exposure to credit and counterparty risks in respect to these financial assets approximates their value as recorded in the Portfolio’s Statements of Assets and Liabilities.
| 7. | RECENT ACCOUNTING PRONOUNCEMENTS: |
In March 2008, the FASB issued Statement of Financial Accounting Standards No. 161, Disclosures about Derivative Instruments and Hedging Activities (“FAS 161”), an amendment of FASB Statement No. 133. FAS 161 requires enhanced disclosures about (a) how and why an entity uses derivative instruments, (b) how derivative instruments and hedging activities are accounted for, and (c) how derivative instruments and related hedging activities affect a fund’s financial position, financial performance, and cash flows. Management does not believe the adoption of FAS 161 will materially impact the financial statement amounts, but will require additional disclosures. This will include qualitative and quantitative disclosures on derivative positions existing at period end and the effect of using derivatives during the reporting period. FAS 161 is effective for financial statements issued for fiscal years and interim periods beginning after November 15, 2008. Management is currently evaluating the impact the adoption of FAS 161 will have on the Portfolio’s financial statement disclosures.
MSF-17
Metropolitan Series Fund, Inc.
T. Rowe Price Large Cap Growth Portfolio
Report of Independent Registered Public Accounting Firm
To the Shareholders and Board of Directors of Metropolitan Series Fund, Inc.:
We have audited the accompanying statement of assets and liabilities, including the schedule of investments, of the T. Rowe Price Large Cap Growth Portfolio (one of the portfolios constituting the Metropolitan Series Fund, Inc.) (the “Fund”) as of December 31, 2008, and the related statement of operations for the year then ended, the statements of changes in net assets for each of the two years in the period then ended, and the financial highlights for each of the five years in the period then ended. These financial statements and financial highlights are the responsibility of the Fund’s management. Our responsibility is to express an opinion on these financial statements and financial highlights based on our audits.
We conducted our audits in accordance with the standards of the Public Company Accounting Oversight Board (United States). Those standards require that we plan and perform the audit to obtain reasonable assurance about whether the financial statements and financial highlights are free of material misstatement. The Fund is not required to have, nor were we engaged to perform, an audit of its internal control over financial reporting. Our audits included consideration of internal control over financial reporting as a basis for designing audit procedures that are appropriate in the circumstances, but not for the purpose of expressing an opinion on the effectiveness of the Fund’s internal control over financial reporting. Accordingly, we express no such opinion. An audit also includes examining, on a test basis, evidence supporting the amounts and disclosures in the financial statements, assessing the accounting principles used and significant estimates made by management, as well as evaluating the overall financial statement presentation. Our procedures included confirmation of securities owned as of December 31, 2008, by correspondence with the custodian and brokers; where replies were not received from brokers, we performed other auditing procedures. We believe that our audits provide a reasonable basis for our opinion.
In our opinion, the financial statements and financial highlights referred to above present fairly, in all material respects, the financial position of the T. Rowe Price Large Cap Growth Portfolio of the Metropolitan Series Fund, Inc. as of December 31, 2008, the results of its operations for the year then ended, the changes in its net assets for each of the two years in the period then ended, and the financial highlights for each of the five years in the period then ended, in conformity with accounting principles generally accepted in the United States of America.
Deloitte & Touche LLP
Boston, Massachusetts
February 24, 2009
MSF-18
Metropolitan Series Fund, Inc.
Directors and Officers
The Fund’s Directors review actions of the Fund’s investment adviser and subadvisers, and decide upon matters of general policy. The Fund’s officers supervise the daily business operations of the Fund. The Board of Directors and the Fund’s officers are listed below. Each Director is responsible for overseeing all 38 Portfolios of the Fund. There is no limit to the term a Director may serve. Directors serve until their resignation, retirement or removal in accordance with the Fund’s organizational documents and policies adopted by the Board from time to time. Officers hold office at the pleasure of the Board or until the election or appointment and the qualification of a successor. The address of the Directors and officers is c/o Metropolitan Series Fund, Inc., 501 Boylston Street, Boston, MA 02116.
Interested Directors(1)
Each Director below is an “interested person” (as defined by the 1940 Act) with respect to the Fund in that Ms. Forget is an employee of MetLife and Mr. Typermass is a former employee of MetLife and owns securities issued by MetLife, Inc., the ultimate parent company of MetLife Advisers.
| | | | | | | | |
Name, Address and Age | | Current
position(s)
with Fund | | Position(s)
held since | | Principal occupations
over past five years, including other directorships(2) | | Number of
Portfolios in
Fund Complex
Overseen by
Director(3) |
Elizabeth M. Forget Age: 42 | | Director, Chairman of the Board, President and Chief Executive Officer | | 2006 | | Senior Vice President (since 2007), MetLife, Inc.; President, Met Investors Advisory, LLC; Trustee and President, Met Investors Series Trust; Executive Vice President, MetLife Investors Group, Inc.; President, Chief Executive Officer and Chair of the Board of Managers (since 2006), MetLife Advisers; President, Met Investors Advisory, LLC. | | 87 |
| | | | |
Arthur G. Typermass Age: 71 | | Director | | 1998 | | Formerly, Senior Vice President and Treasurer, MetLife. | | 38 |
Non-Interested Directors(1)
Each Director below is not an “interested person” (as defined by the 1940 Act) with respect to the Fund (collectively, the “Independent Directors”).
| | | | | | | | |
Name, Address and Age | | Current
position(s)
with Fund | | Position(s)
held since | | Principal occupations
over past five years, including other directorships(2) | | Number of
Portfolios in
Fund Complex
Overseen by
Director(3) |
Steve A. Garban† Age: 71 | | Director | | 1985 | | Formerly, Chief Financial Officer, Senior Vice President Finance and Operations and Treasurer (Emeritus), The Pennsylvania State University. | | 38 |
| | | | |
Linda B. Strumpf Age: 61 | | Director | | 2000 | | Vice President and Chief Investment Officer, Ford Foundation. | | 38 |
| | | | |
Michael S. Scott Morton† Age: 71 | | Director | | 1993 | | Jay W. Forrester Professor of Management (Emeritus) at Sloan School of Management, MIT. | | 38 |
| | | | |
H. Jesse Arnelle Age: 75 | | Director | | 2001 | | Formerly, Counsel, Womble Carlyle Sandrie & Rice; Director, Textron Inc. (global multi- industry company)*; formerly, Director, Gannet Co. Inc. (diversified news and information company)*; formerly, Director, Eastman Chemical Company (global chemical company)*; formerly, Director, Waste Management, Inc.*; formerly, Director, Armstrong Holdings Inc. (parent company of floor and ceiling products business)*; formerly, Director, FPL Group Inc. (public utility holding company)*; Director, URS Corporation (engineering design services firm)*. | | 38 |
MSF-19
Metropolitan Series Fund, Inc.
Directors and Officers—(Continued)
| | | | | | | | |
Name, Address and Age | | Current
position(s)
with Fund | | Position(s)
held since | | Principal occupations
over past five years, including other directorships(2) | | Number of
Portfolios in
Fund Complex
Overseen by
Director(3) |
Nancy Hawthorne Age: 57 | | Director | | 2003 | | Chief Executive Officer, Clerestory LLC (corporate financial advisor); Director, Avid Technologies (computer software company)*; formerly, Chairman of the Board of Avid Technologies; formerly, Board of Advisors, L. Knife & Sons, Inc. (beverage distributor); formerly, Trustee, New England Zenith Fund (“Zenith Fund”)**; formerly, Chief Executive Officer and Managing Partner, Hawthorne, Krauss and Associates (corporate financial advisor); formerly, Chief Financial Officer and Executive Vice President, Continental Cablevision, subsequently renamed MediaOne (cable television company); formerly, Director, Life F/X, Inc.; formerly, Chairman of the Board, WorldClinic (distance medicine company); formerly, Director, Perini Corporation (construction company)*; formerly, Director, CGU (property and casualty insurance company); formerly, Director, Beacon Power Corporation (energy company)*. | | 38 |
| | | | |
John T. Ludes Age: 72 | | Director | | 2003 | | President, LFP Properties (consulting firm); Formerly, Trustee, Zenith Fund**; formerly, Vice Chairman, President and Chief Operating Officer, Fortune Brands/American Brands (global conglomerate); formerly, President and CEO, Acushnet Company (athletic equipment company). | | 38 |
Officers(1)
| | | | | | | | |
Name and address | | Age | | Current
position(s)
with Fund | | Position(s)
held since | | Principal occupations over past five years(2) |
| Jeffrey L. Bernier | | 37 | | Senior Vice President | | 2008 | | Vice President (since 2008), MetLife, Inc.; Vice President (since 2008), MetLife; Senior Vice President (since 2008), MetLife Advisers; formerly, Director and Senior Investment Analyst (2004 to 2007), John Hancock Financial Services; formerly, Assistant Vice President (2000 to 2001), Wachovia Securities. |
| | | | |
| Alan C. Leland | | 56 | | Senior Vice President | | 2005 | | Treasurer and Chief Financial Officer, MetLife Advisers, LLC; Treasurer (since 2005), Met Investors Advisory, LLC; Vice President (since 2004), Met Investors Advisory, LLC; Vice President (since 2003), MetLife, Inc.; Vice President, MetLife; Senior Vice President, NELICO. |
| | | | |
| Peter Duffy | | 53 | | Vice President
and Treasurer | | 2000 | | Senior Vice President, MetLife Advisers; Second Vice President (since 2003), NELICO; Vice President, MetLife (since 2004); Vice President (since 2004), MetLife, Inc.; formerly, Vice President and Treasurer, Zenith Fund**. |
| | | | |
| Jeffrey P. Halperin | | 41 | | Chief
Compliance Officer | | 2007 | | Vice President (since 2006), MetLife, Inc.; Vice President (since 2006), MetLife; Chief Compliance Officer (since 2006), Met Investors Series Trust, MetLife Advisers, Met Investors Advisory, LLC and MetLife Investment Advisors Company, LLC. |
| * | Indicates a directorship with a registered investment company or a company subject to the reporting requirements of the Securities Exchange Act of 1934, as amended. |
| ** | The Zenith Fund deregistered with the Securities and Exchange Commission (“SEC”) in 2004. |
| (†) | Served as a trustee, director and/or officer of one or more of the following companies, each of which had a direct or indirect advisory relationship with MetLife Advisers or its affiliates prior to January 31, 2005: State Street Research Financial Trust, State Street Research Income Trust, State Street Research Money Market Trust, State Street Research Institutional Funds, State Street Research Capital Trust, State Street Research Master Investment Trust, State Street Research Equity Trust, State Street Research Securities Trust and State Street Research Exchange Trust (collectively, the “State Street Research Funds”). |
| (1) | During the period shown, each Director of the Fund served as a Trustee of Metropolitan Series Fund II, a registered investment company that ceased investment operations in June of 2008 and has applied for deregistration under the Investment Company Act of 1940. During this period, each officer of the Fund served in the same position with Metropolitan Series Fund II. |
| (2) | Previous positions during the past five years with the Fund; Met Investors Series Trust; MetLife; MetLife, Inc.; MetLife Advisers; Met Investors Advisory, LLC; Zenith Fund; NELICO; or New England Securities Corporation are omitted if not materially different. |
| (3) | The Fund Complex includes the Fund (38 portfolios) and Met Investors Series Trust (49 portfolios). |
MSF-20
Metropolitan Series Fund, Inc.
T. Rowe Price Large Cap Growth Portfolio
Board Approval of Advisory and Subadvisory Agreements
The Fund’s Contract Review Committees of the Board of Directors (the “Board” or the “Directors”) typically meet in early fall to review the Portfolios’ advisory agreements (the “Advisory Agreements”) and subadvisory agreements (the “Subadvisory Agreements,” and, together with the Advisory Agreements, the “Agreements”) and determine whether to recommend that the full Board approve the continuation of the Agreements for an additional one-year period. (Following the initial approval of an Agreement for a new Portfolio or with a new adviser or subadviser, such annual reviews are not required until 2 years following the execution of such Agreement.) After each Committee has made its recommendations, the full Board, including the Independent Directors, determines whether to approve the continuation of each of the Agreements. In addition, the Board, including the Independent Directors, considers matters bearing on the Agreements at most of its other meetings throughout the year and regularly interviews various individuals at MetLife Advisers responsible for the management of the Portfolios. The Directors also interview selected investment managers and other professionals at the subadvisers at various times throughout the year.
The Directors receive all materials that they or MetLife Advisers, the Fund’s investment adviser, and the subadvisers believe to be reasonably necessary for the Directors to evaluate the Agreements and determine whether to approve the continuation of the Agreements. These materials generally include, among other items, (i) information on the investment performance of the Portfolios and the performance of peer groups of funds and the Portfolios’ performance benchmarks, (ii) information on the Portfolios’ advisory and subadvisory fees and other expenses, including information comparing the Portfolios’ expenses to those of peer groups of funds and information about any applicable expense caps and fee “breakpoints,” (iii) sales and redemption data, (iv) information related to the profitability of the Agreements to MetLife Advisers and certain of the subadvisers, and potential “fall-out” or ancillary benefits that MetLife Advisers, the subadvisers or their affiliates may receive as a result of their relationships with the Fund and (v) information obtained through the subadvisers’ responses to certain requests from MetLife Advisers and the Directors and MetLife Advisers’ responses to requests from the Directors. The Directors may also consider other information such as (vi) MetLife Advisers’ and the subadvisers’ financial results and condition, (vii) each Portfolio’s investment objectives and strategies and the size, education and experience of the investment staffs of MetLife Advisers and the relevant subadvisers and their use of technology and external research, (viii) the allocation of the Portfolios’ brokerage, if any, including allocations to brokers affiliated with the subadvisers and the use of “soft” commission dollars to pay Portfolio expenses and to pay for research and other similar services, (ix) the resources devoted to, and the record of compliance with, the Portfolios’ investment policies and restrictions, policies on personal securities transactions and other compliance policies, (x) the responses of MetLife Advisers, the subadvisers and/or their affiliates to certain legal and regulatory proceedings and (xi) the economic outlook generally and for the mutual fund industry in particular. Throughout the process, the Directors have the opportunity to ask questions of and request additional materials from MetLife Advisers and the subadvisers.
Following meetings of each Contract Review Committee on September 10, 2008, the Board, including the Independent Directors, at its November 6-7, 2008 meeting, approved the continuation through December 31, 2009 of the Advisory Agreements for each Portfolio of the Fund and the Subadvisory Agreements for each Portfolio other than the Zenith Equity Portfolio and Asset Allocation Portfolios (which do not have subadvisers) and the Van Eck Global Natural Resources Portfolio, Met/Dimensional International Small Cap Portfolio and Loomis Sayles Small Cap Growth Portfolio (formerly known as the Franklin Templeton Small Cap Growth Portfolio). The Agreements approved for continuation are referred to below as the “Continued Agreements.”
In considering whether to approve the continuation of the Continued Agreements, the Directors, including the Independent Directors, did not identify any single factor as determinative, and each weighed the various factors as he or she deemed appropriate. The Directors considered the following matters in connection with their approval of the Continued Agreements:
The nature, extent and quality of the services provided to the relevant Portfolios under the Continued Agreements. The Directors considered the nature, extent and quality of the services provided by MetLife Advisers, the relevant subadvisers (if any) and their affiliates (each, an “Adviser,” and, collectively, the “Advisers”) to the relevant Portfolios pursuant to the Continued Agreements and the resources dedicated to these Portfolios by the Advisers. In particular, the Directors considered the Advisers’ abilities to attract and retain highly qualified investment professionals. With respect to MetLife Advisers, the Directors considered (for each Portfolio other than the Zenith Equity and Asset Allocation Portfolios) that MetLife Advisers is (i) ultimately responsible for the performance of such Portfolios; (ii) ultimately responsible for the establishment of the investment strategies of each such Portfolio, primarily through its recommendations to the Board regarding the hiring and selection of subadvisers; (iii) responsible for the hiring and selection, subject to Board approval, of subadvisers; and (iv) responsible for maintaining a program of Subadviser oversight reasonably designed to ensure that the subadvisers have reasonable compliance policies and procedures in place. The Directors also considered that MetLife Advisers provides a full range of day-to-day administrative services for the Portfolios involving all aspects of such Portfolios’ day-to-day operations (other than portfolio management). With respect to the Zenith Equity and Asset Allocation Portfolios, the Directors considered both the portfolio management services and the administrative services provided by MetLife Advisers. After reviewing
MSF-21
Metropolitan Series Fund, Inc.
T. Rowe Price Large Cap Growth Portfolio
Board Approval of Advisory and Subadvisory Agreements—(Continued)
these and related factors, the Directors concluded, within the context of their overall conclusions regarding each of the Continued Agreements, that the nature, extent and quality of services provided supported the renewal of these Agreements.
Investment performance of the relevant Portfolios. The Directors reviewed information about the performance of the relevant Portfolios over various time periods, including information prepared by an independent third party that compared the performance of the Portfolios to the performance of peer groups of funds and performance benchmarks. The Directors also reviewed a description of the third party’s methodology for identifying a Portfolio’s peer group(s) for purposes of performance and expense comparisons.
In the case of each relevant Portfolio that had performance that lagged its peer group(s) for certain periods, the Directors concluded that other factors relevant to performance were sufficient, in light of other considerations, to warrant renewal of the Continued Agreements relating to such Portfolio. These factors varied from Portfolio to Portfolio, but included one or more of the following: (i) that such Portfolio’s performance, although lagging in certain recent periods, was stronger over the longer term; (ii) that the underperformance was attributable, to a significant extent, to investment decisions that were reasonable and consistent with the Portfolio’s investment objective(s) and policies and that the Portfolio was performing within the range of reasonable expectations, given market conditions and the Portfolio’s investment objective(s) and policies; (iii) that the Portfolio’s performance was competitive when compared to other relevant performance benchmarks or peer groups; and (iv) that MetLife Advisers and/or the relevant subadviser (if any) had taken or was taking steps designed to help improve the Portfolio’s investment performance (including, in the case of certain Portfolios, that MetLife Advisers was formulating possible proposals, for presentation to the Board in November 2008, to replace the Portfolio’s subadviser or to merge the Portfolio into another Portfolio with a similar investment objective and better investment performance).
The Directors also considered the investment performance of the Advisers and their reputations generally, the historical responsiveness of the Advisers to Director concerns about performance and the willingness of the Advisers to take steps intended to improve performance.
After reviewing these and related factors, the Directors concluded, within the context of their overall conclusions regarding each of the Continued Agreements, that the investment performance of each relevant Portfolio and Adviser was sufficient, in light of other considerations, to warrant the renewal of the Continued Agreements.
The costs of the services to be provided and profits to be realized by the Advisers and their affiliates from their relationships with the Portfolios. The Directors considered the fees charged by MetLife Advisers to the Portfolios for advisory services and, with respect to the subadvised Portfolios, by such subadvisers to MetLife Advisers for subadvisory services (such advisory and subadvisory fees (if any), collectively, “Fees”), as well as the total expense levels of the Portfolios. This information included comparisons (provided by an independent third party) of the Portfolios’ advisory fees and total expense levels to those of their peer groups. In evaluating Fees for the relevant Portfolios, the Directors also took into account the demands, complexity and quality of the investment management services provided to each Portfolio. The Directors considered MetLife Advisers’ recommendations regarding reductions in Fee rates, implementation of Fee breakpoints and institution of Fee waivers and expense caps.
The Directors also considered the compensation directly or indirectly received by the Advisers and their affiliates from their relationships with the relevant Portfolios. The Directors reviewed information relating to the profits received by MetLife Advisers, certain of the subadvisers and their affiliates as a result of their relationships with the relevant Portfolios, and information about the allocation of expenses used to calculate profitability. When reviewing profitability, the Directors also considered the performance of the relevant Portfolios, the expense levels of such Portfolios and whether the relevant Advisers had implemented breakpoints, fee waivers and/or expense caps with respect to such Portfolios.
After reviewing these and related factors, the Directors concluded, within the context of their overall conclusions regarding each of the Continued Agreements, that the Fees charged to each of the relevant Portfolios were fair and reasonable, and that the information provided regarding costs of these services generally, and the related profitability (if known) to the relevant Advisers of their relationships with the relevant Portfolios, supported the renewal of the Continued Agreements.
Economies of Scale. The Directors considered the existence of any economies of scale in the provision of services by the Advisers and whether those economies were shared with the relevant Portfolios through breakpoints in their advisory fees or other means, such as expense caps, fee waivers or relatively low levels of fees. The Directors noted that most of the relevant Portfolios benefited or will benefit from breakpoints, expense caps and/or fee waivers with respect to their advisory fees. In considering these issues, the Directors also took into consideration information relating to the costs of the services provided and the profitability to MetLife Advisers, the relevant subadvisers (if any) and each of their affiliates of their relationships with the relevant Portfolios, as discussed above.
MSF-22
Metropolitan Series Fund, Inc.
T. Rowe Price Large Cap Growth Portfolio
Board Approval of Advisory and Subadvisory Agreements—(Continued)
After reviewing these and related factors, the Directors concluded, within the context of their overall conclusions regarding each of the Continued Agreements, that the extent to which economies of scale were shared with the relevant Portfolios supported the renewal of such Agreements.
Other Factors. The Directors also considered other factors, which included but were not limited to the following:
| | • | | the extent to which each relevant Portfolio operated in accordance with its investment objective, and its record of compliance with its investment restrictions and the compliance programs of the Fund and the Advisers. They also considered the compliance-related resources the Advisers and their affiliates provide to the relevant Portfolios; |
| | • | | the nature, quality, cost and extent of administrative and shareholder services performed by MetLife Advisers and its affiliates under the Advisory Agreements; and |
| | • | | so-called “fall-out benefits” to the Advisers, such as the engagement of their affiliates to provide distribution, brokerage and transfer agency services to the Portfolios, and the benefits of research made available to the relevant Advisers by reason of brokerage commissions generated by the relevant Portfolios’ securities transactions. The Directors also considered the possible conflicts of interest associated with these fall-out and other benefits, and the reporting and other processes in place to disclose and monitor these possible conflicts of interest. |
Based on their evaluation of all factors that they deemed to be material, including those factors described above, and assisted by the advice of independent counsel, the Directors, including the Independent Directors, concluded that each of the Continued Agreements should be continued through December 31, 2009.
MSF-23
A description of the policies and procedures that the Fund uses to determine how to vote proxies relating to portfolio securities is available (i) without charge, upon request, by calling (800) 638-7732 and (ii) on the Securities and Exchange Commission’s (the “SEC”) website at http://www.sec.gov.
Information regarding how the Fund voted proxies relating to portfolio securities during the most recent twelve-month period ended December 31, 2008 is available (i) without charge, upon request, by calling (800) 638-7732 and (ii) on the SEC’s website at http://www.sec.gov.
The Fund’s Statement of Additional Information includes additional information about the Directors of the Fund and is available (i) without charge, upon request, by calling (800) 638-7732 and (ii) on the SEC’s website at http://www.sec.gov.
The Fund files with the SEC a complete schedule of its portfolio holdings, as of the close of the first and third quarters of its fiscal year, on “Form N-Q”. These filings are available on the SEC’s website at www.sec.gov and may be reviewed and copied at the SEC’s Public Reference Room in Washington, DC. (Call 1-800-SEC-0330 for information on the operation of the Public Reference Room.)
MSF-24
Simplify your life…
with MetLife eDeliverys® while helping MetLife preserve the planet’s natural resources.
(see details on inside cover)
| | |
Metropolitan Series Fund, Inc. T. Rowe Price Small Cap Growth Portfolio Annual Report | | December 31, 2008 |
NOT PART OF THE ANNUAL REPORT
Letter from the President
February 1, 2009
Letter to Policy Holders:
2008 was an extraordinary year in the capital markets around the world and for the global economy. Energy prices rose to record levels early in the year before falling by two-thirds by year-end. A credit crisis that began with concerns about sub-prime mortgages led to massive changes in the financial landscape with government takeovers, forced sales, and outright failures of a number of large, once venerable firms.
While bonds as measured by the Barclays Capital U.S. Aggregate Bond Index (formerly known as, Lehman Brothers U.S. Aggregate Bond Index) were up 5.2% for the year in response to declining interest rates, there were large differences in the total returns of the various sectors of the bond market. U.S. treasury securities were up over 13% as frightened investors sought refuge in what they perceived to be the safest and most liquid investments. In contrast, investment grade corporate securities lost nearly 5% as credit spreads widened and below investment grade or high yield bonds fell over 26%.
In response to the growing credit crisis and the weakening economy, common stocks fell sharply across all regions, styles, and capitalizations. As measured by the Standard and Poor’s 500, U.S. common stocks fell 37% for the year, the worst calendar year decline since the 1930s. Foreign stocks were down even more with the MSCI EAFE Index down 43% for the year.
On the following pages, you will find a complete review of your Portfolio and its investment performance.
MetLife is committed to building your financial freedom. We appreciate your trust and will continue to focus our efforts on meeting your investment needs.
Sincerely,
Elizabeth M. Forget
President, Metropolitan Series Fund, Inc.
Metropolitan Series Fund, Inc.
T. Rowe Price Small Cap Growth Portfolio
Managed by T. Rowe Price Associates, Inc.
Portfolio Manager Commentary*
PORTFOLIO PERFORMANCE
For the twelve-month period ended December 31, 2008, the Class A shares of the T. Rowe Price Small Cap Growth Portfolio returned -36.2%, compared to its benchmark, the Morgan Stanley Capital International (MSCI) U.S. Small Cap Growth Index1 , which returned -40.1%. The average return of its peer group, the Lipper Variable Insurance Products2 Small-Cap Growth Funds Universe, was -41.1% over the same period.
PORTFOLIO REVIEW
U.S. stocks had sharply negative returns as a result of ongoing turmoil in the financial sector and the severe economic downturn. As measured by various Russell indexes, large-cap stocks held up better than those of small- and mid-sized companies. Within the small-cap universe, value stocks held up better than growth. Within the small-cap growth benchmark, no sector had positive returns for the year. Defensive-oriented health care and consumer staples shares held up best, while telecommunications, energy, and utilities sectors all lost more than half their value.
It was security selection decisions that made information technology shares the leading contributors to relative return, followed by holdings in the consumer discretionary and financials segments. However, not all of our stock selection decisions worked as well, as the Portfolio’s industrials stake underperformed the index.
The key contribution to relative return came from stock picks in the information technology sector. A leading contributor in this sector was NCI Inc., which provides technology services to government agencies. The company is relatively insulated from the economic downturn and continues to win work orders and contracts. Positioning in the communication equipment industry also contributed, as it helped to avoid a number of poor performers. Stock picks in the electronic equipment segment also helped, behind a stake in military contractor FLIR Systems.
Consumer discretionary shares were other key sources of strength. Here it helped to avoid the hard-hit media segment, which suffered from declining advertising revenues. The Portfolio also benefited from holdings in continuing-education companies ITT Educational Services and DeVry, which saw enrollments increase as workers sought additional skills and qualifications. Workplace child-care provider Bright Horizons Family Solutions contributed after being acquired at a premium.
Stock picks in the financials segment also aided relative results, with the Portfolio continuing to benefit from positioning among insurance companies. These companies were somewhat insulated from the credit crisis in the sense that they don’t face the risk of “run on the bank” as do many of the hardest hit companies in the sector. The leading contributor was Philadelphia Consolidated, which was acquired at a premium. Property and casualty firm HCC Insurance Holdings used its relatively healthy financial position to acquire two smaller competitors. In the capital market industry, boutique M&A advisory firm Greenhill performed well on strength in its high-margin business despite difficulties in the broader economy.
Industrials and business services shares were the leading detractors from relative return, largely due to stock picks in the machinery industry. The leading detractor in this segment was Bucyrus International, which makes mining equipment. The company saw demand for its products fall along with commodity prices and the outlook for growth. In addition, business support systems provider Advisory Board struggled throughout the period. This was primarily due to a slowdown in expected revenue growth.
* The views expressed above are those of the subadvisory firm as of December 31, 2008 and are subject to change based on market and other conditions. Information about the Portfolio’s holdings, asset allocation, industry allocation, or country diversification is historical and is not an indication of future Portfolio composition, which will vary. The performance of any index mentioned in this commentary has not been adjusted for ongoing management, distribution and operating expenses, and sales charges applicable to mutual fund investments. Direct investment in any index is not possible.
1 The Morgan Stanley Capital International (MSCI) U.S. Small Cap Growth Index represents the growth companies of the MSCI U.S. Small Cap 1750 Index. (The MSCI U.S. Small Cap 1750 Index represents the universe of small capitalization companies in the U.S. equity market).
2 The Lipper Variable Products Fund Average is an average of the total return performance (calculated on the basis of net asset value) of variable product funds with similar investment objectives to those of the subject Portfolio as calculated by Lipper Analytical Services, an independent mutual fund ranking service.
MSF-2
Metropolitan Series Fund, Inc.
T. Rowe Price Small Cap Growth Portfolio
A $10,000 INVESTMENT COMPARED TO THE
MSCI U.S. SMALL CAP GROWTH INDEX
Average Annual Returns as of December 31, 2008
| | | | | | | | | | | | |
| | | T. Rowe Price Small Cap Growth Portfolio | | | MSCI U.S.
Small Cap
Growth Index | |
| | | Class A | | | Class B | | | Class E | | |
| 1 Year | | -36.2 | % | | -36.3 | % | | -36.3 | % | | -40.1 | % |
| 5 Year | | -2.1 | | | -2.3 | | | -2.3 | | | -1.5 | |
| 10 Year | | -0.2 | | | — | | | — | | | 2.4 | |
| Since Inception | | — | | | 3.4 | | | -1.6 | | | — | |
Performance numbers are net of all Portfolio expenses but do not include any insurance, sales, or administrative charges of variable annuity or life insurance contracts or any additional expenses that participants in certain eligible qualified plans may bear relating to the operations of their plans. If these charges were included, the returns would be lower.
Inception dates of the Class A, Class B and Class E shares are: 3/3/97, 7/30/02 and 5/1/01, respectively.
This information represents past performance and is not indicative of future results. Investment return and principal value may fluctuate so that shares, upon redemption, may be worth more or less than the original cost.
PORTFOLIO COMPOSITION
as of December 31, 2008
Top Holdings
| | |
| | | % of Total
Net Assets |
FLIR Systems, Inc. | | 1.2% |
ITT Educational Services, Inc. | | 1.1% |
NCI, Inc. | | 1.1% |
DeVry, Inc. | | 1.0% |
Actuant Corp. | | 1.0% |
Stericycle, Inc. | | 0.9% |
Waste Connections, Inc. | | 0.9% |
Comstock Resources, Inc. | | 0.9% |
Greenhill & Co., Inc. | | 0.8% |
Church & Dwight Co., Inc. | | 0.8% |
Top Sectors
| | |
| | | % of Total
Market Value |
Information Technology | | 24.7% |
Health Care | | 20.3% |
Industrials & Business Services | | 19.0% |
Consumer Discretionary | | 14.1% |
Financials | | 6.8% |
Energy | | 6.2% |
Consumer Staples | | 3.5% |
Materials | | 2.7% |
Telecommunication Services | | 1.4% |
Cash/Other | | 1.3% |
MSF-3
Metropolitan Series Fund, Inc.
Shareholder Expense Example
As a shareholder of the Portfolio, you incur ongoing costs, including management fees; distribution and service (12b-1) fees; and other Portfolio expenses. This example is intended to help you understand your ongoing costs (in dollars) (referred to as “expenses”) of investing in the Portfolio and compare these costs with the ongoing costs of investing in other mutual funds. The example is based on an investment of $1,000 invested at the beginning of the period and held for the entire period, July 1, 2008 through December 31, 2008.
Actual Expenses
The first line for each share class of the Portfolio in the table below provides information about actual account values and actual expenses. You may use the information in this line, together with the amount you invested in the particular share class of the Portfolio, to estimate the expenses that you paid over the period. Simply divide your account value by $1,000 (for example, an $8,600 account value divided by $1,000=8.6), then multiply the result by the number in the first line under the heading entitled “Expenses Paid During Period” to estimate the expenses you paid on your account during this period.
Hypothetical Example for Comparison Purposes
The second line for each share class of the Portfolio in the table below provides information about hypothetical account values and hypothetical expenses based on the Portfolio’s actual expense ratio and an assumed rate of return of 5% per year before expenses, which is not the Portfolio’s actual return. The hypothetical account values and expenses may not be used to estimate the actual ending account balance or expenses you paid for the period. You may use this information to compare the ongoing costs of investing in the Portfolio and other funds. To do so, compare this 5% hypothetical example with the 5% hypothetical examples that appear in the shareholder reports of the other funds.
Please note that the expenses shown in the table are meant to highlight your ongoing costs only and do not reflect any fees or charges of your variable insurance product or any additional expenses that participants in certain eligible qualified plans may bear relating to the operations of their plan. Therefore, the second line for each share class in the table is useful in comparing ongoing costs only, and will not help you determine the relative total costs of owning different funds. In addition, if these other costs were included, your costs would have been higher.
| | | | | | | | | | | | | | |
Portfolio | | | | Annualized
Expense
Ratio | | | Beginning
Account Value
July 1,
2008 | | Ending
Account Value
December 31,
2008 | | Expenses Paid
During Period*
July 1, 2008
to
December 31,
2008 |
T. Rowe Price Small Cap Growth—Class A(a) | | Actual | | 0.58 | % | | $ | 1,000.00 | | $ | 664.95 | | $ | 2.43 |
| | Hypothetical | | 0.58 | % | | $ | 1,000.00 | | $ | 1,022.19 | | $ | 2.95 |
| | | | | |
T. Rowe Price Small Cap Growth—Class B(a) | | Actual | | 0.83 | % | | $ | 1,000.00 | | $ | 663.90 | | $ | 3.47 |
| | Hypothetical | | 0.83 | % | | $ | 1,000.00 | | $ | 1,020.91 | | $ | 4.22 |
| | | | | |
T. Rowe Price Small Cap Growth—Class E(a) | | Actual | | 0.73 | % | | $ | 1,000.00 | | $ | 664.92 | | $ | 3.06 |
| | Hypothetical | | 0.73 | % | | $ | 1,000.00 | | $ | 1,021.42 | | $ | 3.71 |
* Expenses paid are equal to the Portfolio’s annualized expense ratio for the most recent six month period, as shown above, multiplied by the average account value over the period, multiplied by the number of days in the most recent fiscal half-year, divided by 366 (to reflect the the one-half year period).
(a) The annualized expense ratio shown reflects the impact of the management fee waiver as described in Note 4 to the Financial Statements.
MSF-4
Metropolitan Series Fund, Inc.
T. Rowe Price Small Cap Growth Portfolio
Schedule of Investments as of December 31, 2008
Common Stock—98.9% of Total Net Assets
| | | | | |
| Security Description | | Shares | | Value* |
| | | | | |
|
Aerospace & Defense—2.4% |
Alliant Techsystems, Inc. (a) (b) | | 29,300 | | $ | 2,512,768 |
Ceradyne, Inc. (a) (b) | | 35,100 | | | 712,881 |
Esterline Technologies Corp. (b) | | 22,000 | | | 833,580 |
Heico Corp. (Class A) | | 17,100 | | | 495,216 |
Teledyne Technologies, Inc. (b) | | 51,900 | | | 2,312,145 |
TransDigm Group, Inc. (a) (b) | | 23,700 | | | 795,609 |
| | | | | |
| | | | | 7,662,199 |
| | | | | |
|
Air Freight & Logistics—1.3% |
HUB Group, Inc. (Class A) (b) | | 71,700 | | | 1,902,201 |
UTi Worldwide, Inc. | | 148,600 | | | 2,130,924 |
| | | | | |
| | | | | 4,033,125 |
| | | | | |
|
Airlines—0.2% |
Skywest, Inc. | | 30,400 | | | 565,440 |
| | | | | |
|
Auto Components—0.3% |
Drew Industries, Inc. (a) (b) | | 27,600 | | | 331,200 |
Gentex Corp. (a) | | 54,800 | | | 483,884 |
| | | | | |
| | | | | 815,084 |
| | | | | |
|
Beverages—0.3% |
The Boston Beer Co., Inc. (a) (b) | | 34,787 | | | 987,951 |
| | | | | |
|
Biotechnology—5.8% |
Acorda Therapeutics, Inc. (a) (b) | | 23,500 | | | 481,985 |
Alexion Pharmaceuticals, Inc. (a) (b) | | 60,300 | | | 2,182,257 |
Alkermes, Inc. (b) | | 71,400 | | | 760,410 |
Allos Therapeutics, Inc. (b) | | 37,300 | | | 228,276 |
Alnylam Pharmaceuticals, Inc. (a) (b) | | 11,700 | | | 289,341 |
Amylin Pharmaceuticals, Inc. (a) (b) | | 28,800 | | | 312,480 |
Array Biopharma, Inc. (a) (b) | | 21,400 | | | 86,670 |
BioMarin Pharmaceutical, Inc. (a) (b) | | 77,100 | | | 1,372,380 |
Cepheid (a) (b) | | 36,600 | | | 379,908 |
Cougar Biotechnology, Inc. (a) (b) | | 12,800 | | | 332,800 |
Cubist Pharmaceuticals, Inc. (a) (b) | | 38,400 | | | 927,744 |
Facet Biotech Corp. (a) | | 14,280 | | | 136,945 |
Human Genome Sciences, Inc. (a) (b) | | 70,000 | | | 148,400 |
Idenix Pharmaceuticals, Inc. (b) | | 16,400 | | | 94,956 |
Incyte Corp. (a) (b) | | 225,000 | | | 852,750 |
Isis Pharmaceuticals, Inc. (a) (b) | | 14,900 | | | 211,282 |
Lexicon Pharmaceuticals, Inc. (a) (b) | | 80,900 | | | 113,260 |
Martek Biosciences Corp. (a) (b) | | 21,200 | | | 642,572 |
Medarex, Inc. (a) (b) | | 68,100 | | | 379,998 |
Momenta Pharmaceuticals, Inc. (a) (b) | | 11,300 | | | 131,080 |
Myriad Genetics, Inc. (b) | | 30,600 | | | 2,027,556 |
Onyx Pharmaceuticals, Inc. (a) (b) | | 35,900 | | | 1,226,344 |
OSI Pharmaceuticals, Inc. (a) (b) | | 37,200 | | | 1,452,660 |
PDL BioPharma, Inc. (a) (b) | | 71,400 | | | 441,252 |
Pharmasset, Inc. (b) | | 18,100 | | | 237,291 |
Regeneron Pharmaceuticals, Inc. (a) (b) | | 55,900 | | | 1,026,324 |
Seattle Genetics, Inc. (a) (b) | | 40,500 | | | 362,070 |
Senomyx, Inc. (a) (b) | | 69,600 | | | 194,184 |
Theravance, Inc. (a) (b) | | 29,800 | | | 369,222 |
United Therapeutics Corp. (a) (b) | | 15,800 | | | 988,290 |
| | | | | |
| | | | | 18,390,687 |
| | | | | |
| | | | | |
| Security Description | | Shares | | Value* |
| | | | | |
|
Capital Markets—1.8% |
Affiliated Managers Group, Inc. (b) | | 22,049 | | $ | 924,294 |
Cohen & Steers, Inc. (a) | | 13,100 | | | 143,969 |
GFI Group, Inc. | | 50,500 | | | 178,770 |
Greenhill & Co., Inc. (a) | | 38,200 | | | 2,665,214 |
Knight Capital Group, Inc. (b) | | 20,300 | | | 327,845 |
optionsXpress Holdings, Inc. (a) | | 38,700 | | | 517,032 |
Penson Worldwide, Inc. (b) | | 22,200 | | | 169,164 |
RiskMetrics Group, Inc. (b) | | 24,600 | | | 366,294 |
Stifel Financial Corp. (b) | | 11,700 | | | 536,445 |
| | | | | |
| | | | | 5,829,027 |
| | | | | |
|
Chemicals—1.4% |
Airgas, Inc. | | 45,000 | | | 1,754,550 |
Koppers Holdings, Inc. | | 40,100 | | | 866,962 |
Nalco Holding Co. | | 89,700 | | | 1,035,138 |
The Scotts Miracle-Gro Co. | | 31,200 | | | 927,264 |
| | | | | |
| | | | | 4,583,914 |
| | | | | |
|
Commercial & Professional Services—3.3% |
American Ecology Corp. | | 27,300 | | | 552,279 |
Clean Harbors, Inc. (b) | | 21,600 | | | 1,370,304 |
Copart, Inc. (b) | | 37,200 | | | 1,011,468 |
Rollins, Inc. | | 43,000 | | | 777,440 |
Stericycle, Inc. (b) | | 58,100 | | | 3,025,848 |
The Brink’s Co. | | 34,300 | | | 921,984 |
Waste Connections, Inc. (b) | | 93,000 | | | 2,936,010 |
| | | | | |
| | | | | 10,595,333 |
| | | | | |
|
Commercial Banks—1.7% |
Bank of the Ozarks, Inc. | | 13,000 | | | 385,320 |
Glacier Bancorp, Inc. | | 46,300 | | | 880,626 |
Home Bancshares, Inc. | | 13,500 | | | 363,825 |
Pinnacle Financial Partners, Inc. (b) | | 40,100 | | | 1,195,381 |
Signature Bank (b) | | 38,800 | | | 1,113,172 |
SVB Financial Group (b) | | 31,000 | | | 813,130 |
Texas Capital Bancshares, Inc. (b) | | 51,400 | | | 686,704 |
| | | | | |
| | | | | 5,438,158 |
| | | | | |
|
Communications Equipment—2.8% |
Adtran, Inc. | | 59,700 | | | 888,336 |
Avocent Corp. (a) (b) | | 31,625 | | | 566,404 |
Blue Coat Systems, Inc. (a) (b) | | 60,700 | | | 509,880 |
CommScope, Inc. (b) | | 56,900 | | | 884,226 |
Comtech Telecommunications Corp. (a) (b) | | 52,000 | | | 2,382,640 |
Emulex Corp. (b) | | 42,800 | | | 298,744 |
F5 Networks, Inc. (a) (b) | | 94,500 | | | 2,160,270 |
Plantronics, Inc. (a) | | 38,200 | | | 504,240 |
Polycom, Inc. (b) | | 57,493 | | | 776,730 |
| | | | | |
| | | | | 8,971,470 |
| | | | | |
|
Computers & Peripherals—0.2% |
Intermec, Inc. (a) (b) | | 25,700 | | | 341,296 |
Palm, Inc. (a) (b) | | 113,400 | | | 348,138 |
| | | | | |
| | | | | 689,434 |
| | | | | |
*See accompanying notes to financial statements.
MSF-5
Metropolitan Series Fund, Inc.
T. Rowe Price Small Cap Growth Portfolio
Schedule of Investments as of December 31, 2008
Common Stock—(Continued)
| | | | | |
| Security Description | | Shares | | Value* |
| | | | | |
|
Construction & Engineering—0.6% |
Dycom Industries, Inc. (b) | | 27,000 | | $ | 221,940 |
Perini Corp. (a) (b) | | 16,700 | | | 390,446 |
Quanta Services, Inc. (b) | | 65,724 | | | 1,301,335 |
| | | | | |
| | | | | 1,913,721 |
| | | | | |
|
Consumer Finance—0.1% |
World Acceptance Corp. (a) (b) | | 17,200 | | | 339,872 |
| | | | | |
|
Containers & Packaging—0.6% |
Crown Holdings, Inc. (b) | | 66,500 | | | 1,276,800 |
Greif, Inc. | | 17,500 | | | 585,025 |
| | | | | |
| | | | | 1,861,825 |
| | | | | |
|
Distributors—0.3% |
LKQ Corp. (a) (b) | | 87,900 | | | 1,024,914 |
| | | | | |
|
Diversified Consumer Services—3.6% |
American Public Education, Inc. (b) | | 15,300 | | | 569,007 |
Brink’s Home Security Holdings, Inc. (b) | | 34,300 | | | 751,856 |
Capella Education Co. (a) (b) | | 22,500 | | | 1,322,100 |
DeVry, Inc. | | 57,500 | | | 3,301,075 |
ITT Educational Services, Inc. (a) (b) | | 38,400 | | | 3,647,232 |
Matthews International Corp. | | 34,800 | | | 1,276,464 |
Steiner Leisure, Ltd. (b) | | 23,400 | | | 690,768 |
| | | | | |
| | | | | 11,558,502 |
| | | | | |
|
Diversified Financial Services—0.6% |
Interactive Brokers Group, Inc. (b) | | 46,300 | | | 828,307 |
MSCI, Inc. (b) | | 66,500 | | | 1,181,040 |
| | | | | |
| | | | | 2,009,347 |
| | | | | |
|
Diversified Telecommunication Services—0.4% |
Cbeyond, Inc. (a) (b) | | 31,900 | | | 509,762 |
tw telecom, inc. (a) (b) | | 77,600 | | | 657,272 |
| | | | | |
| | | | | 1,167,034 |
| | | | | |
|
Electrical Equipment—1.8% |
Acuity Brands, Inc. (a) | | 56,900 | | | 1,986,379 |
Ametek, Inc. | | 59,000 | | | 1,782,390 |
II-VI, Inc. (b) | | 64,600 | | | 1,233,214 |
Thomas & Betts Corp. (b) | | 34,200 | | | 821,484 |
| | | | | |
| | | | | 5,823,467 |
| | | | | |
|
Electronic Equipment, Instruments & Components—3.9% |
CyberOptics Corp. (a) (b) | | 103,937 | | | 540,473 |
Dolby Laboratories, Inc. (Class A) (a) (b) | | 58,600 | | | 1,919,736 |
DTS, Inc. (a) (b) | | 10,900 | | | 200,015 |
FLIR Systems, Inc. (a) (b) | | 121,500 | | | 3,727,620 |
Itron, Inc. (a) (b) | | 26,800 | | | 1,708,232 |
Mettler Toledo International, Inc. (b) | | 38,700 | | | 2,608,380 |
Rofin-Sinar Technologies, Inc. (a) (b) | | 36,600 | | | 753,228 |
Trimble Navigation, Ltd. (b) | | 30,900 | | | 667,749 |
TTM Technologies, Inc. (a) (b) | | 77,100 | | | 401,691 |
| | | | | |
| | | | | 12,527,124 |
| | | | | |
| | | | | |
| Security Description | | Shares | | Value* |
| | | | | |
|
Energy Equipment & Services—3.5% |
Atwood Oceanics, Inc. (b) | | 44,400 | | $ | 678,432 |
Complete Production Services, Inc. (b) | | 103,600 | | | 844,340 |
Core Laboratories NV (a) | | 28,200 | | | 1,688,052 |
Dawson Geophysical Co. (a) (b) | | 15,500 | | | 276,055 |
Dresser-Rand Group, Inc. (b) | | 62,100 | | | 1,071,225 |
Gulf Island Fabrication, Inc. | | 15,900 | | | 229,119 |
Helmerich & Payne, Inc. | | 18,100 | | | 411,775 |
IHS, Inc. (b) | | 25,400 | | | 950,468 |
ION Geophysical Corp. (a) (b) | | 104,300 | | | 357,749 |
Oceaneering International, Inc. (b) | | 38,200 | | | 1,113,148 |
Oil States International, Inc. (b) | | 69,400 | | | 1,297,086 |
Superior Energy Services, Inc. (b) | | 77,900 | | | 1,240,947 |
Tetra Technologies, Inc. (b) | | 98,700 | | | 479,682 |
Unit Corp. (b) | | 13,500 | | | 360,720 |
| | | | | |
| | | | | 10,998,798 |
| | | | | |
|
Food Products—0.6% |
Flowers Foods, Inc. (a) | | 63,700 | | | 1,551,732 |
Ralcorp Holdings, Inc. (b) | | 6,200 | | | 362,080 |
| | | | | |
| | | | | 1,913,812 |
| | | | | |
|
Health Care Equipment & Supplies—4.4% |
American Medical Systems Holdings, Inc. (a) (b) | | 47,600 | | | 427,924 |
ArthroCare Corp. (a) (b) | | 33,300 | | | 158,841 |
Edwards Lifesciences Corp. (b) | | 35,500 | | | 1,950,725 |
Gen-Probe, Inc. (b) | | 51,500 | | | 2,206,260 |
IDEXX Laboratories, Inc. (a) (b) | | 44,800 | | | 1,616,384 |
Immucor, Inc. (b) | | 81,950 | | | 2,178,231 |
Integra LifeSciences Holdings Corp. (a) (b) | | 12,800 | | | 455,296 |
Meridian Bioscience, Inc. (a) | | 96,400 | | | 2,455,308 |
ResMed, Inc. (b) | | 38,400 | | | 1,439,232 |
Stereotaxis, Inc. (a) (b) | | 34,100 | | | 150,040 |
STERIS Corp. | | 44,600 | | | 1,065,494 |
| | | | | |
| | | | | 14,103,735 |
| | | | | |
|
Health Care Providers & Services—5.4% |
Alliance Imaging, Inc. (b) | | 66,000 | | | 526,020 |
Amedisys, Inc. (a) (b) | | 35,533 | | | 1,468,934 |
Catalyst Health Solutions, Inc. (b) | | 62,100 | | | 1,512,135 |
Centene Corp. (b) | | 55,500 | | | 1,093,905 |
Chemed Corp. (a) | | 18,100 | | | 719,837 |
Chindex International, Inc. (b) | | 27,400 | | | 217,830 |
Corvel Corp. (b) | | 20,700 | | | 454,986 |
Gentiva Health Services, Inc. (b) | | 63,200 | | | 1,849,232 |
Healthsouth Corp. (a) (b) | | 89,700 | | | 983,112 |
Healthspring, Inc. (b) | | 40,400 | | | 806,788 |
Healthways, Inc. (b) | | 21,400 | | | 245,672 |
inVentiv Health, Inc. (b) | | 33,200 | | | 383,128 |
LifePoint Hospitals, Inc. (a) (b) | | 33,900 | | | 774,276 |
Mednax, Inc. (b) | | 27,600 | | | 874,920 |
PharMerica Corp. (a) (b) | | 90,000 | | | 1,410,300 |
PSS World Medical, Inc. (a) (b) | | 49,800 | | | 937,236 |
Psychiatric Solutions, Inc. (a) (b) | | 38,600 | | | 1,075,010 |
Sun Healthcare Group, Inc. (b) | | 79,500 | | | 703,575 |
VCA Antech, Inc. (a) (b) | | 55,700 | | | 1,107,316 |
| | | | | |
| | | | | 17,144,212 |
| | | | | |
*See accompanying notes to financial statements.
MSF-6
Metropolitan Series Fund, Inc.
T. Rowe Price Small Cap Growth Portfolio
Schedule of Investments as of December 31, 2008
Common Stock—(Continued)
| | | | | |
| Security Description | | Shares | | Value* |
| | | | | |
|
Health Care Technology—0.5% |
Cerner Corp. (a) (b) | | 26,200 | | $ | 1,007,390 |
Phase Forward, Inc. (b) | | 29,700 | | | 371,844 |
Vital Images, Inc. (b) | | 17,500 | | | 243,425 |
| | | | | |
| | | | | 1,622,659 |
| | | | | |
|
Hotels, Restaurants & Leisure—2.8% |
Burger King Holdings, Inc. | | 78,000 | | | 1,862,640 |
Chipotle Mexican Grill, Inc. (b) | | 21,700 | | | 1,243,193 |
Choice Hotels International, Inc. (a) | | 28,900 | | | 868,734 |
Orient-Express Hotels, Ltd. (Class A) (a) (b) | | 17,800 | | | 136,348 |
Panera Bread Co. (a) (b) | | 14,900 | | | 778,376 |
Red Robin Gourmet Burgers, Inc. (a) (b) | | 49,500 | | | 833,085 |
Sonic Corp. (a) (b) | | 52,462 | | | 638,463 |
WMS Industries, Inc. (b) | | 96,150 | | | 2,586,435 |
| | | | | |
| | | | | 8,947,274 |
| | | | | |
|
Household Durables—0.3% |
Jarden Corp. (a) (b) | | 44,200 | | | 508,300 |
Tempur-Pedic International, Inc. (b) | | 42,900 | | | 304,161 |
| | | | | |
| | | | | 812,461 |
| | | | | |
|
Household Products—0.8% |
Church & Dwight Co., Inc. | | 47,200 | | | 2,648,864 |
| | | | | |
|
Insurance—2.2% |
Amtrust Financial Services, Inc. | | 49,600 | | | 575,360 |
HCC Insurance Holdings, Inc. | | 78,600 | | | 2,102,550 |
Max Capital Group, Ltd. | | 41,000 | | | 725,700 |
Navigators Group, Inc. (b) | | 15,900 | | | 873,069 |
RLI Corp. | | 16,900 | | | 1,033,604 |
StanCorp Financial Group, Inc. | | 38,900 | | | 1,624,853 |
| | | | | |
| | | | | 6,935,136 |
| | | | | |
|
Internet & Catalog Retail—1.0% |
Blue Nile, Inc. (a) (b) | | 9,425 | | | 230,818 |
PetMed Express, Inc. (a) (b) | | 27,400 | | | 483,062 |
priceline.com, Inc. (a) (b) | | 33,800 | | | 2,489,370 |
| | | | | |
| | | | | 3,203,250 |
| | | | | |
| | |
Internet Software & Services—2.0% | | | | | |
Art Technology Group, Inc. (b) | | 122,400 | | | 236,232 |
Digital River, Inc. (b) | | 54,700 | | | 1,356,560 |
Interwoven, Inc. (b) | | 42,900 | | | 540,540 |
j2 Global Communications, Inc. (a) (b) | | 57,600 | | | 1,154,304 |
MercadoLibre, Inc. (a) (b) | | 21,600 | | | 354,456 |
Omniture, Inc. (a) (b) | | 35,649 | | | 379,305 |
SINA Corp. (a) (b) | | 42,000 | | | 972,300 |
ValueClick, Inc. (b) | | 80,100 | | | 547,884 |
Websense, Inc. (b) | | 47,500 | | | 711,075 |
| | | | | |
| | | | | 6,252,656 |
| | | | | |
| | |
IT Services—4.8% | | | | | |
CACI International, Inc. (Class A) (a) (b) | | 31,700 | | | 1,429,353 |
Cybersource Corp. (b) | | 118,900 | | | 1,425,611 |
| | | | | |
| Security Description | | Shares | | Value* |
| | | | | |
| | |
IT Services—(Continued) | | | | | |
Genpact, Ltd. (b) | | 44,700 | | $ | 367,434 |
Global Payments, Inc. | | 69,020 | | | 2,263,166 |
Heartland Payment Systems, Inc. (a) | | 79,700 | | | 1,394,750 |
Mantech International Corp. (b) | | 14,800 | | | 802,012 |
NCI, Inc. (b) | | 120,734 | | | 3,637,715 |
NeuStar, Inc. (b) | | 39,300 | | | 751,809 |
Perot Systems Corp. (b) | | 116,800 | | | 1,596,656 |
RightNow Technologies, Inc. (a) (b) | | 108,400 | | | 837,932 |
SRA International, Inc. (b) | | 45,400 | | | 783,150 |
| | | | | |
| | | | | 15,289,588 |
| | | | | |
| | |
Leisure Equipment & Products—0.6% | | | | | |
Polaris Industries, Inc. (a) | | 38,400 | | | 1,100,160 |
Pool Corp. (a) | | 47,200 | | | 848,184 |
| | | | | |
| | | | | 1,948,344 |
| | | | | |
| | |
Life Sciences Tools & Services—2.9% | | | | | |
Bio-Rad Laboratories, Inc. (b) | | 11,800 | | | 888,658 |
Dionex Corp. (b) | | 11,200 | | | 502,320 |
eResearch Technology, Inc. (a) (b) | | 64,700 | | | 428,961 |
Exelixis, Inc. (a) (b) | | 83,400 | | | 418,668 |
Illumina, Inc. (a) (b) | | 77,300 | | | 2,013,665 |
Life Technologies Corp. (a) (b) | | 55,000 | | | 1,282,050 |
Parexel International Corp. (b) | | 49,400 | | | 479,674 |
Techne Corp. (b) | | 37,800 | | | 2,438,856 |
Varian, Inc. (b) | | 22,700 | | | 760,677 |
| | | | | |
| | | | | 9,213,529 |
| | | | | |
| | |
Machinery—4.7% | | | | | |
Actuant Corp. | | 159,500 | | | 3,033,690 |
Bucyrus International, Inc. (a) | | 31,600 | | | 585,232 |
Chart Industries, Inc. (b) | | 39,300 | | | 417,759 |
Gardner Denver, Inc. (b) | | 35,000 | | | 816,900 |
Graco, Inc. (a) | | 42,100 | | | 999,033 |
IDEX Corp. (a) | | 60,300 | | | 1,456,245 |
Kennametal, Inc. | | 27,300 | | | 605,787 |
Nordson Corp. (a) | | 30,700 | | | 991,303 |
RBC Bearings, Inc. (b) | | 27,900 | | | 565,812 |
Robbins & Myers, Inc. | | 31,400 | | | 507,738 |
The Middleby Corp. (a) (b) | | 25,600 | | | 698,112 |
The Toro Co. (a) | | 49,200 | | | 1,623,600 |
Valmont Industries, Inc. (a) | | 14,800 | | | 908,128 |
Wabtec Corp. | | 46,300 | | | 1,840,425 |
| | | | | |
| | | | | 15,049,764 |
| | | | | |
| | |
Marine—0.4% | | | | | |
Horizon Lines, Inc. (a) | | 21,000 | | | 73,290 |
Kirby Corp. (b) | | 43,900 | | | 1,201,104 |
| | | | | |
| | | | | 1,274,394 |
| | | | | |
| | |
Media—1.2% | | | | | |
Interactive Data Corp. | | 37,300 | | | 919,818 |
John Wiley & Sons, Inc. | | 45,700 | | | 1,626,006 |
Marvel Entertainment, Inc. (a) (b) | | 42,700 | | | 1,313,025 |
| | | | | |
| | | | | 3,858,849 |
| | | | | |
*See accompanying notes to financial statements.
MSF-7
Metropolitan Series Fund, Inc.
T. Rowe Price Small Cap Growth Portfolio
Schedule of Investments as of December 31, 2008
Common Stock—(Continued)
| | | | | |
| Security Description | | Shares | | Value* |
| | | | | |
| | |
Metals & Mining—0.7% | | | | | |
Carpenter Technology Corp. | | 37,400 | | $ | 768,196 |
Compass Minerals International, Inc. | | 24,800 | | | 1,454,768 |
| | | | | |
| | | | | 2,222,964 |
| | | | | |
| | |
Multiline Retail—0.4% | | | | | |
Big Lots, Inc. (a) (b) | | 80,300 | | | 1,163,547 |
| | | | | |
| | |
Oil, Gas & Consumable Fuels—3.1% | | | | | |
Bill Barrett Corp. (a) (b) | | 35,300 | | | 745,889 |
Cabot Oil & Gas Corp. | | 27,100 | | | 704,600 |
Comstock Resources, Inc. (b) | | 57,500 | | | 2,716,875 |
Concho Resources, Inc. (b) | | 38,300 | | | 874,006 |
Foundation Coal Holdings, Inc. | | 38,900 | | | 545,378 |
Frontier Oil Corp. | | 38,400 | | | 484,992 |
Mariner Energy, Inc. (b) | | 73,336 | | | 748,027 |
Penn Virginia Corp. | | 61,100 | | | 1,587,378 |
PetroQuest Energy, Inc. (a) (b) | | 42,300 | | | 285,948 |
St. Mary Land & Exploration Co. | | 55,900 | | | 1,135,329 |
| | | | | |
| | | | | 9,828,422 |
| | | | | |
| | |
Personal Products—1.7% | | | | | |
Alberto-Culver Co. | | 86,000 | | | 2,107,860 |
Chattem, Inc. (a) (b) | | 25,100 | | | 1,795,403 |
Herbalife, Ltd. | | 45,000 | | | 975,600 |
NBTY, Inc. (b) | | 41,400 | | | 647,910 |
| | | | | |
| | | | | 5,526,773 |
| | | | | |
| | |
Pharmaceuticals—1.3% | | | | | |
Cadence Pharmaceuticals, Inc. (a) (b) | | 28,926 | | | 209,135 |
The Medicines Co. (b) | | 75,600 | | | 1,113,588 |
Valeant Pharmaceuticals International (a) (b) | | 69,500 | | | 1,591,550 |
ViroPharma, Inc. (a) (b) | | 43,600 | | | 567,672 |
XenoPort, Inc. (a) (b) | | 29,700 | | | 744,876 |
| | | | | |
| | | | | 4,226,821 |
| | | | | |
| | |
Professional Services—2.3% | | | | | |
Administaff, Inc. | | 28,100 | | | 609,208 |
Heidrick & Struggles International, Inc. (a) | | 24,300 | | | 523,422 |
Huron Consulting Group, Inc. (a) (b) | | 26,400 | | | 1,511,928 |
Korn/Ferry International (b) | | 35,500 | | | 405,410 |
Navigant Consulting, Inc. (b) | | 22,400 | | | 355,488 |
Resources Connection, Inc. (b) | | 115,500 | | | 1,891,890 |
The Corporate Executive Board Co. | | 27,600 | | | 608,856 |
Watson Wyatt Worldwide, Inc. | | 27,900 | | | 1,334,178 |
| | | | | |
| | | | | 7,240,380 |
| | | | | |
| | |
Real Estate Investment Trusts—0.1% | | | | | |
PS Business Parks, Inc. | | 5,400 | | | 241,164 |
| | | | | |
| |
Real Estate Management & Development—0.2% | | | |
Jones Lang LaSalle, Inc. (a) | | 18,400 | | | 509,680 |
| | | | | |
| | |
Road & Rail—0.9% | | | | | |
Landstar System, Inc. (a) | | 58,500 | | | 2,248,155 |
Old Dominion Freight Line, Inc. (a) (b) | | 19,100 | | | 543,586 |
| | | | | |
| | | | | 2,791,741 |
| | | | | |
| | | | | |
| Security Description | | Shares | | Value* |
| | | | | |
|
Semiconductors & Semiconductor Equipment—4.3% |
Advanced Energy Industries, Inc. (b) | | 104,800 | | $ | 1,042,760 |
Cabot Microelectronics Corp. (b) | | 20,000 | | | 521,400 |
Cohu, Inc. | | 58,700 | | | 713,205 |
Cymer, Inc. (a) (b) | | 47,800 | | | 1,047,298 |
Diodes, Inc. (a) (b) | | 32,700 | | | 198,162 |
Entegris, Inc. (b) | | 125,500 | | | 274,845 |
FormFactor, Inc. (b) | | 40,700 | | | 594,220 |
Integrated Device Technology, Inc. (b) | | 85,750 | | | 481,058 |
Intersil Corp. | | 56,664 | | | 520,742 |
Micrel, Inc. | | 105,200 | | | 769,012 |
Microsemi Corp. (b) | | 81,700 | | | 1,032,688 |
ON Semiconductor Corp. (a) (b) | | 366,900 | | | 1,247,460 |
Pericom Semiconductor Corp. (b) | | 36,435 | | | 199,664 |
PMC-Sierra, Inc. (b) | | 107,700 | | | 523,422 |
Semtech Corp. (b) | | 98,400 | | | 1,108,968 |
Silicon Laboratories, Inc. (b) | | 52,400 | | | 1,298,472 |
Standard Microsystems Corp. (b) | | 12,600 | | | 205,884 |
Varian Semiconductor Equipment Associates, Inc. (a) (b) | | 86,650 | | | 1,570,098 |
Verigy, Ltd. (b) | | 42,900 | | | 412,698 |
| | | | | |
| | | | | 13,762,056 |
| | | | | |
| | |
Software—6.7% | | | | | |
Actuate Corp. (a) (b) | | 134,619 | | | 398,472 |
Ansys, Inc. (b) | | 85,730 | | | 2,391,010 |
Blackboard, Inc. (a) (b) | | 55,800 | | | 1,463,634 |
Commvault Systems, Inc. (b) | | 16,200 | | | 217,242 |
Epicor Software Corp. (a) (b) | | 58,000 | | | 278,400 |
FactSet Research Systems, Inc. (a) | | 48,900 | | | 2,163,336 |
Informatica Corp. (b) | | 184,600 | | | 2,534,558 |
Jack Henry & Associates, Inc. | | 36,100 | | | 700,701 |
Kenexa Corp. (a) (b) | | 51,600 | | | 411,768 |
Lawson Software, Inc. (b) | | 69,400 | | | 328,956 |
Macrovision Solutions Corp. (b) | | 66,600 | | | 842,490 |
MICROS Systems, Inc. (b) | | 79,300 | | | 1,294,176 |
Monotype Imaging Holdings, Inc. (b) | | 45,600 | | | 264,480 |
Parametric Technology Corp. (a) (b) | | 112,200 | | | 1,419,330 |
Phoenix Technologies, Ltd. (b) | | 28,100 | | | 98,350 |
Progress Software Corp. (b) | | 27,000 | | | 520,020 |
Quest Software, Inc. (b) | | 68,000 | | | 856,120 |
SPSS, Inc. (b) | | 37,200 | | | 1,002,912 |
Sybase, Inc. (a) (b) | | 67,700 | | | 1,676,929 |
Synopsys, Inc. (b) | | 44,400 | | | 822,288 |
Taleo Corp. (a) (b) | | 79,370 | | | 621,467 |
TIBCO Software, Inc. (b) | | 100,900 | | | 523,671 |
Wind River Systems, Inc. (b) | | 71,100 | | | 642,033 |
| | | | | |
| | | | | 21,472,343 |
| | | | | |
| | |
Specialty Retail—2.3% | | | | | |
Aaron Rents, Inc. (Class B) | | 47,700 | | | 1,269,774 |
Aeropostale, Inc. (a) (b) | | 74,250 | | | 1,195,425 |
Guess?, Inc. | | 35,600 | | | 546,460 |
Gymboree Corp. (b) | | 70,100 | | | 1,828,909 |
Hibbett Sports, Inc. (a) (b) | | 36,850 | | | 578,914 |
J. Crew Group, Inc. (a) (b) | | 16,900 | | | 206,180 |
*See accompanying notes to financial statements.
MSF-8
Metropolitan Series Fund, Inc.
T. Rowe Price Small Cap Growth Portfolio
Schedule of Investments as of December 31, 2008
Common Stock—(Continued)
| | | | | |
| Security Description | | Shares | | Value* |
| | | | | |
| | |
Specialty Retail—(Continued) | | | | | |
Tractor Supply Co. (a) (b) | | 41,200 | | $ | 1,488,968 |
Zumiez, Inc. (a) (b) | | 17,200 | | | 128,140 |
| | | | | |
| | | | | 7,242,770 |
| | | | | |
|
Textiles, Apparel & Luxury Goods—1.4% |
Deckers Outdoor Corp. (a) (b) | | 14,900 | | | 1,190,063 |
Fossil, Inc. (b) | | 32,849 | | | 548,578 |
Hanesbrands, Inc. (a) (b) | | 60,900 | | | 776,475 |
Iconix Brand Group, Inc. (b) | | 78,000 | | | 762,840 |
The Warnaco Group, Inc. (b) | | 55,100 | | | 1,081,613 |
| | | | | |
| | | | | 4,359,569 |
| | | | | |
|
Thrifts & Mortgage Finance—0.1% |
Danvers Bancorp, Inc. (b) | | 33,300 | | | 445,221 |
| | | | | |
|
Trading Companies & Distributors—0.8% |
Beacon Roofing Supply, Inc. (a) (b) | | 78,000 | | | 1,082,640 |
MSC Industrial Direct Co. (a) | | 43,200 | | | 1,591,056 |
| | | | | |
| | | | | 2,673,696 |
| | | | | |
|
Wireless Telecommunication Services—1.1% |
Leap Wireless International, Inc. (a) (b) | | 36,700 | | | 986,863 |
SBA Communications Corp. (b) | | 126,600 | | | 2,066,112 |
Syniverse Holdings, Inc. (b) | | 40,100 | | | 478,794 |
| | | | | |
| | | | | 3,531,769 |
| | | | | |
Total Common Stock
(Identified Cost $438,419,409) | | | | | 315,243,869 |
| | | | | |
| | | | | | |
|
| Short Term Investments—20.2% | |
| Security Description | | Shares | | Value* | |
| | | | | | |
|
Mutual Funds—20.2% | |
State Street Navigator Securities Lending Prime Portfolio (c) | | 59,363,029 | | $ | 59,363,029 | |
T. Rowe Price Reserve Investment Fund (d) | | 5,080,171 | | | 5,080,171 | |
| | | | | | |
Total Short Term Investments
(Identified Cost $64,443,200) | | | | | 64,443,200 | |
| | | | | | |
Total Investments—119.1%
(Identified Cost $502,862,609) (e) | | | | | 379,687,069 | |
Liabilities in excess of other assets | | | | | (60,965,640 | ) |
| | | | | | |
| Total Net Assets—100% | | | | $ | 318,721,429 | |
| | | | | | |
| (a) | A portion or all of the security was on loan. As of December 31, 2008, the market value of securities loaned was $59,247,295 and the collateral received consisted of cash in the amount of $59,363,029. The cash collateral is invested in a money market fund managed by an affiliate of the custodian. |
| (c) | Represents investment of cash collateral received from securities lending transactions. |
| (d) | Affiliated Issuer. See below. |
| (e) | The aggregate cost of investments for federal income tax purposes as of December 31, 2008 was $504,588,492 and the composition of unrealized appreciation and depreciation of investment securities was $13,426,293 and $(138,327,716), respectively. |
Affiliated Issuer
| | | | | | | | | | | | | | | |
Security Description | | Number of
Shares
Held at
12/31/2007 | | Shares
Purchased
Since
12/31/2007 | | Shares Sold
Since
12/31/2007 | | | Number of
Shares
Held at
12/31/2008 | | Realized
Gain/Loss on
Shares Sold | | Income for
Year Ended
12/31/2008 |
T. Rowe Price Reserve Investment Fund | | 3,756,232 | | 80,317,843 | | (78,993,904 | ) | | 5,080,171 | | $ | 0 | | $ | 74,039 |
The Portfolio adopted the provisions of Statement of Financial Accounting Standards No. 157, “Fair Value Measurements” (FAS 157), effective with the beginning of the Portfolio’s fiscal year. FAS 157 establishes a framework for measuring fair value and expands disclosures about fair value measurements in financial statements. The three levels of the hierarchy under FAS 157 are described below:
Level 1 - quoted prices in active markets for identical securities
Level 2 - other significant observable inputs (including quoted prices for similar securities, interest rates, credit risk, etc.)
Level 3 - significant unobservable inputs (including the Portfolio’s own assumptions in determining the fair value of investments)
The inputs or methodology used for valuing securities are not necessarily an indication of the risk associated with investing in those securities.
The following is a summary of the inputs used to value the Portfolio’s net assets as of December 31, 2008:
| | | | | | |
| Valuation Inputs | | Investments In
Securities | | Other Financial
Instruments* |
Level 1 - Quoted Prices | | $ | 379,687,069 | | $ | 0 |
Level 2 - Other Significant Observable Inputs | | | 0 | | | 0 |
Level 3 - Significant Unobservable Inputs | | | 0 | | | 0 |
Total | | $ | 379,687,069 | | $ | 0 |
* Other financial instruments are derivative instruments not reflected in the Schedule of Investments, such as futures, forwards, swap contracts and written options, which are valued based on the unrealized appreciation/depreciation on the instrument.
*See accompanying notes to financial statements.
MSF-9
Metropolitan Series Fund, Inc.
T. Rowe Price Small Cap Growth Portfolio
Statement of Assets & Liabilities
December 31, 2008
| | | | | | | |
Assets | | | | | | | |
Investments at value (a) (b) | | | | | $ | 379,687,069 | |
Receivable for: | | | | | | | |
Securities sold | | | | | | 340,841 | |
Fund shares sold | | | | | | 292,143 | |
Accrued interest and dividends | | | | | | 88,140 | |
| | | | | | | |
Total Assets | | | | | | 380,408,193 | |
Liabilities | | | | | | | |
Payable for: | | | | | | | |
Securities purchased | | $ | 1,422,887 | | | | |
Fund shares redeemed | | | 705,568 | | | | |
Collateral for securities loaned | | | 59,363,029 | | | | |
Accrued expenses: | | | | | | | |
Management fees | | | 128,576 | | | | |
Service and distribution fees | | | 28,823 | | | | |
Other expenses | | | 37,881 | | | | |
| | | | | | | |
Total Liabilities | | | | | | 61,686,764 | |
| | | | | | | |
Net Assets | | | | | $ | 318,721,429 | |
| | | | | | | |
Net assets consists of: | | | | | | | |
Capital paid in | | | | | $ | 444,898,578 | |
Undistributed net investment income | | | | | | 711,795 | |
Accumulated net realized losses | | | | | | (3,713,404 | ) |
Unrealized depreciation on investments | | | | | | (123,175,540 | ) |
| | | | | | | |
Net Assets | | | | | $ | 318,721,429 | |
| | | | | | | |
| Computation of offering price: | | | | | | | |
Class A | | | | | | | |
Net asset value and redemption price per share ($170,236,161 divided by 18,812,825 shares outstanding) | | | | | $ | 9.05 | |
| | | | | | | |
Class B | | | | | | | |
Net asset value and redemption price per share ($138,120,990 divided by 15,709,967 shares outstanding) | | | | | $ | 8.79 | |
| | | | | | | |
Class E | | | | | | | |
Net asset value and redemption price per share ($10,364,278 divided by 1,168,954 shares outstanding) | | | | | $ | 8.87 | |
| | | | | | | |
(a) Identified cost of investments | | | | | $ | 502,862,609 | |
| | | | | | | |
(b) Includes cash collateral for securities loaned of | | | | | $ | 59,363,029 | |
| | | | | | | |
Statement of Operations
For the Year Ended December 31, 2008
| | | | | | | | |
Investment Income | | | | | | | | |
Dividends | | | | | | $ | 2,057,057 | (a) |
Interest | | | | | | | 1,203,176 | (b) |
Interest from affiliates | | | | | | | 74,039 | |
| | | | | | | | |
| | | | | | | 3,334,272 | |
Expenses | | | | | | | | |
Management fees | | $ | 2,010,381 | | | | | |
Service and distribution fees—Class B | | | 351,947 | | | | | |
Service and distribution fees—Class E | | | 20,836 | | | | | |
Directors’ fees and expenses | | | 31,907 | | | | | |
Custodian | | | 80,584 | | | | | |
Audit and tax services | | | 37,080 | | | | | |
Legal | | | 6,970 | | | | | |
Printing | | | 128,545 | | | | | |
Insurance | | | 5,187 | | | | | |
Miscellaneous | | | 11,457 | | | | | |
| | | | | | | | |
Total expenses | | | 2,684,894 | | | | | |
Expense reductions | | | (1,557 | ) | | | | |
Management fee waivers | | | (62,580 | ) | | | 2,620,757 | |
| | | | | | | | |
Net Investment Income | | | | | | | 713,515 | |
| | | | | | | | |
Realized and Unrealized Loss | | | | | | | | |
| Realized loss on: | | | | | | | | |
Investments—net | | | | | | | (3,447,049 | ) |
| Change in unrealized depreciation on: | | | | | | | | |
Investments—net | | | | | | | (176,369,396 | ) |
| | | | | | | | |
Net loss | | | | | | | (179,816,445 | ) |
| | | | | | | | |
Net Decrease in Net Assets From Operations | | | | | | $ | (179,102,930 | ) |
| | | | | | | | |
| (a) | Net of foreign taxes of $5,981. |
| (b) | Includes income on securities loaned of $1,202,747. |
See accompanying notes to financial statements.
MSF-10
Metropolitan Series Fund, Inc.
T. Rowe Price Small Cap Growth Portfolio
Statements of Changes in Net Assets
| | | | | | | | |
| | | Year ended
December 31,
2008 | | | Year ended
December 31,
2007 | |
From Operations | | | | | | | | |
Net investment income (loss) | | $ | 713,515 | | | $ | (618,086 | ) |
Net realized gain (loss) | | | (3,447,049 | ) | | | 71,786,255 | |
Unrealized depreciation | | | (176,369,396 | ) | | | (31,913,290 | ) |
| | | | | | | | |
Increase (decrease) in net assets from operations | | | (179,102,930 | ) | | | 39,254,879 | |
| | | | | | | | |
From Distributions to Shareholders | | | | | | | | |
Net realized gain | | | | | | | | |
Class A | | | (47,824,507 | ) | | | 0 | |
Class B | | | (9,541,030 | ) | | | 0 | |
Class E | | | (2,721,485 | ) | | | 0 | |
| | | | | | | | |
Total distributions | | | (60,087,022 | ) | | | 0 | |
| | | | | | | | |
Increase (decrease) in net assets from capital share transactions | | | 192,439,509 | | | | (86,751,199 | ) |
| | | | | | | | |
Net decrease in net assets | | | (46,750,443 | ) | | | (47,496,320 | ) |
| | |
Net Assets | | | | | | | | |
Beginning of the period | | | 365,471,872 | | | | 412,968,192 | |
| | | | | | | | |
End of the period | | $ | 318,721,429 | | | $ | 365,471,872 | |
| | | | | | | | |
Undistributed Net Investment Income | | | | | | | | |
End of the period | | $ | 711,795 | | | $ | 0 | |
| | | | | | | | |
Other Information:
Capital Shares
Transactions in capital shares were as follows:
| | | | | | | | | | | | | | |
| | | Year ended
December 31, 2008 | | | Year ended
December 31, 2007 | |
| | | Shares | | | $ | | | Shares | | | $ | |
Class A | | | | | | | | | | | | | | |
Sales | | 1,313,809 | | | $ | 16,392,413 | | | 2,902,264 | | | $ | 48,368,155 | |
Reinvestments | | 3,579,679 | | | | 47,824,507 | | | 0 | | | | 0 | |
Redemptions | | (3,136,155 | ) | | | (39,686,967 | ) | | (8,064,495 | ) | | | (136,495,142 | ) |
| | | | | | | | | | | | | | |
Net increase (decrease) | | 1,757,333 | | | $ | 24,529,953 | | | (5,162,231 | ) | | $ | (88,126,987 | ) |
| | | | | | | | | | | | | | |
Class B | | | | | | | | | | | | | | |
Sales | | 14,711,289 | | | $ | 190,996,684 | | | 995,536 | | | $ | 16,637,781 | |
Reinvestments | | 733,925 | | | | 9,541,030 | | | 0 | | | | 0 | |
Redemptions | | (2,953,523 | ) | | | (35,214,166 | ) | | (709,679 | ) | | | (11,749,801 | ) |
| | | | | | | | | | | | | | |
Net increase | | 12,491,691 | | | $ | 165,323,548 | | | 285,857 | | | $ | 4,887,980 | |
| | | | | | | | | | | | | | |
Class E | | | | | | | | | | | | | | |
Sales | | 331,393 | | | $ | 4,031,436 | | | 148,888 | | | $ | 2,517,344 | |
Reinvestments | | 207,588 | | | | 2,721,485 | | | 0 | | | | 0 | |
Redemptions | | (349,314 | ) | | | (4,166,913 | ) | | (362,937 | ) | | | (6,029,536 | ) |
| | | | | | | | | | | | | | |
Net increase (decrease) | | 189,667 | | | $ | 2,586,008 | | | (214,049 | ) | | $ | (3,512,192 | ) |
| | | | | | | | | | | | | | |
Increase (decrease) derived from capital share transactions | | | | | $ | 192,439,509 | | | | | | $ | (86,751,199 | ) |
| | | | | | | | | | | | | | |
See accompanying notes to financial statements.
MSF-11
Metropolitan Series Fund, Inc.
T. Rowe Price Small Cap Growth Portfolio
Financial Highlights
| | | | | | | | | | | | | | | | | | | | |
| | | Class A | |
| | | Year ended December 31, | |
| | | 2008 | | | 2007 | | | 2006 | | | 2005 | | | 2004 | |
Net Asset Value, Beginning of Period | | $ | 17.26 | | | $ | 15.72 | | | $ | 15.13 | | | $ | 13.63 | | | $ | 12.27 | |
| | | | | | | | | | | | | | | | | | | | |
Income From Investment Operations | | | | | | | | | | | | | | | | | | | | |
Net investment income (loss) | | | 0.03 | (a) | | | (0.02 | )(a) | | | (0.03 | ) | | | (0.02 | ) | | | (0.04 | ) |
Net realized and unrealized gain (loss) of investments | | | (5.33 | ) | | | 1.56 | | | | 0.62 | | | | 1.52 | | | | 1.40 | |
| | | | | | | | | | | | | | | | | | | | |
Total from investment operations | | | (5.30 | ) | | | 1.54 | | | | 0.59 | | | | 1.50 | | | | 1.36 | |
| | | | | | | | | | | | | | | | | | | | |
Less Distributions | | | | | | | | | | | | | | | | | | | | |
Distributions from net realized capital gains | | | (2.91 | ) | | | 0.00 | | | | 0.00 | | | | 0.00 | | | | 0.00 | |
| | | | | | | | | | | | | | | | | | | | |
Total distributions | | | (2.91 | ) | | | 0.00 | | | | 0.00 | | | | 0.00 | | | | 0.00 | |
| | | | | | | | | | | | | | | | | | | | |
Net Asset Value, End of Period | | $ | 9.05 | | | $ | 17.26 | | | $ | 15.72 | | | $ | 15.13 | | | $ | 13.63 | |
| | | | | | | | | | | | | | | | | | | | |
Total Return (%) | | | (36.2 | ) | | | 9.9 | | | | 3.9 | | | | 11.0 | | | | 11.1 | |
Ratio of operating expenses to average net assets before expense reductions (%) | | | 0.57 | | | | 0.57 | | | | 0.59 | | | | 0.60 | | | | 0.60 | |
Ratio of operating expenses to average net assets after expense reductions (%) (b) | | | 0.57 | | | | 0.57 | | | | 0.59 | | | | 0.59 | | | | 0.60 | |
Ratio of operating expenses to average net assets without giving effect to the contractual expense agreement would have been (%) (c) | | | 0.59 | | | | 0.59 | | | | 0.60 | | | | N/A | | | | N/A | |
Ratio of net investment income (loss) to average net assets (%) | | | 0.23 | | | | (0.12 | ) | | | (0.19 | ) | | | (0.14 | ) | | | (0.31 | ) |
Portfolio turnover rate (%) | | | 73 | | | | 51 | | | | 38 | | | | 31 | | | | 28 | |
Net assets, end of period (000) | | $ | 170,236 | | | $ | 294,458 | | | $ | 349,258 | | | $ | 318,845 | | | $ | 312,834 | |
| | | | | | | | | | | | | | | | | | | | |
| | | Class B | |
| | | Year ended December 31, | |
| | | 2008 | | | 2007 | | | 2006 | | | 2005 | | | 2004 | |
Net Asset Value, Beginning of Period | | $ | 16.89 | | | $ | 15.42 | | | $ | 14.88 | | | $ | 13.44 | | | $ | 12.11 | |
| | | | | | | | | | | | | | | | | | | | |
Income From Investment Operations | | | | | | | | | | | | | | | | | | | | |
Net investment income (loss) | | | 0.01 | (a) | | | (0.06 | )(a) | | | (0.05 | ) | | | (0.04 | ) | | | (0.03 | ) |
Net realized and unrealized gain (loss) of investments | | | (5.20 | ) | | | 1.53 | | | | 0.59 | | | | 1.48 | | | | 1.36 | |
| | | | | | | | | | | | | | | | | | | | |
Total from investment operations | | | (5.19 | ) | | | 1.47 | | | | 0.54 | | | | 1.44 | | | | 1.33 | |
| | | | | | | | | | | | | | | | | | | | |
Less Distributions | | | | | | | | | | | | | | | | | | | | |
Distributions from net realized capital gains | | | (2.91 | ) | | | 0.00 | | | | 0.00 | | | | 0.00 | | | | 0.00 | |
| | | | | | | | | | | | | | | | | | | | |
Total distributions | | | (2.91 | ) | | | 0.00 | | | | 0.00 | | | | 0.00 | | | | 0.00 | |
| | | | | | | | | | | | | | | | | | | | |
Net Asset Value, End of Period | | $ | 8.79 | | | $ | 16.89 | | | $ | 15.42 | | | $ | 14.88 | | | $ | 13.44 | |
| | | | | | | | | | | | | | | | | | | | |
Total Return (%) | | | (36.3 | ) | | | 9.5 | | | | 3.6 | | | | 10.7 | | | | 11.0 | |
Ratio of operating expenses to average net assets before expense reductions (%) | | | 0.82 | | | | 0.82 | | | | 0.84 | | | | 0.84 | | | | 0.85 | |
Ratio of operating expenses to average net assets after expense reductions (%) (b) | | | 0.82 | | | | 0.82 | | | | 0.84 | | | | 0.84 | | | | 0.85 | |
Ratio of operating expenses to average net assets without giving effect to the contractual expense agreement would have been (%) (c) | | | 0.84 | | | | 0.84 | | | | 0.85 | | | | N/A | | | | N/A | |
Ratio of net investment income (loss) to average net assets (%) | | | 0.10 | | | | (0.36 | ) | | | (0.44 | ) | | | (0.40 | ) | | | (0.52 | ) |
Portfolio turnover rate (%) | | | 73 | | | | 51 | | | | 38 | | | | 31 | | | | 28 | |
Net assets, end of period (000) | | $ | 138,121 | | | $ | 54,366 | | | $ | 45,213 | | | $ | 30,357 | | | $ | 15,516 | |
| Please | see following page for Financial Highlights footnote legend. |
See accompanying notes to financial statements.
MSF-12
Metropolitan Series Fund, Inc.
T. Rowe Price Small Cap Growth Portfolio
Financial Highlights
| | | | | | | | | | | | | | | | | | | | |
| | | Class E | |
| | | Year ended December 31, | |
| | | 2008 | | | 2007 | | | 2006 | | | 2005 | | | 2004 | |
Net Asset Value, Beginning of Period | | $ | 17.00 | | | $ | 15.50 | | | $ | 14.95 | | | $ | 13.49 | | | $ | 12.15 | |
| | | | | | | | | | | | | | | | | | | | |
Income From Investment Operations | | | | | | | | | | | | | | | | | | | | |
Net investment income (loss) | | | 0.01 | (a) | | | (0.04 | )(a) | | | (0.06 | ) | | | (0.04 | ) | | | (0.05 | ) |
Net realized and unrealized gain (loss) of investments | | | (5.23 | ) | | | 1.54 | | | | 0.61 | | | | 1.50 | | | | 1.39 | |
| | | | | | | | | | | | | | | | | | | | |
Total from investment operations | | | (5.22 | ) | | | 1.50 | | | | 0.55 | | | | 1.46 | | | | 1.34 | |
| | | | | | | | | | | | | | | | | | | | |
Less Distributions | | | | | | | | | | | | | | | | | | | | |
Distributions from net realized capital gains | | | (2.91 | ) | | | 0.00 | | | | 0.00 | | | | 0.00 | | | | 0.00 | |
| | | | | | | | | | | | | | | | | | | | |
Total distributions | | | (2.91 | ) | | | 0.00 | | | | 0.00 | | | | 0.00 | | | | 0.00 | |
| | | | | | | | | | | | | | | | | | | | |
Net Asset Value, End of Period | | $ | 8.87 | | | $ | 17.00 | | | $ | 15.50 | | | $ | 14.95 | | | $ | 13.49 | |
| | | | | | | | | | | | | | | | | | | | |
Total Return (%) | | | (36.3 | ) | | | 9.7 | | | | 3.7 | | | | 10.8 | | | | 11.0 | |
Ratio of operating expenses to average net assets before expense reductions (%) | | | 0.72 | | | | 0.72 | | | | 0.74 | | | | 0.74 | | | | 0.75 | |
Ratio of operating expenses to average net assets after expense reductions (%) (b) | | | 0.72 | | | | 0.72 | | | | 0.74 | | | | 0.74 | | | | 0.75 | |
Ratio of operating expenses to average net assets without giving effect to the contractual expense agreement would have been (%) (c) | | | 0.74 | | | | 0.74 | | | | 0.75 | | | | N/A | | | | N/A | |
Ratio of net investment income (loss) to average net assets (%) | | | 0.09 | | | | (0.26 | ) | | | (0.35 | ) | | | (0.30 | ) | | | (0.45 | ) |
Portfolio turnover rate (%) | | | 73 | | | | 51 | | | | 38 | | | | 31 | | | | 28 | |
Net assets, end of period (000) | | $ | 10,364 | | | $ | 16,647 | | | $ | 18,497 | | | $ | 19,910 | | | $ | 18,321 | |
| (a) | Per share amount is based on average shares outstanding during the period. |
| (b) | The Portfolio has entered into arrangements with certain brokers who paid a portion of the Portfolio’s expenses. |
| (c) | See Note 4 of the Notes to Financial Statements. |
See accompanying notes to financial statements.
MSF-13
Metropolitan Series Fund, Inc.
T. Rowe Price Small Cap Growth Portfolio
Notes to Financial Statements—December 31, 2008
Metropolitan Series Fund, Inc. (the “Fund”) is organized as a corporation under the laws of Maryland pursuant to Articles of Incorporation filed on November 23, 1982, as amended, and registered under the Investment Company Act of 1940, as amended (the “1940 Act”), as an open-end investment company. The Fund is a “series” type of mutual fund, which issues separate series of stock. Each series represents an interest in a separate portfolio of Fund investments. The T. Rowe Price Small Cap Growth Portfolio (the “Portfolio”) is a diversified series of the Fund. Shares in the Fund are not offered directly to the general public and are currently available only to separate accounts established by Metropolitan Life Insurance Company (“MetLife”), New England Life Insurance Company, General American Life Insurance Company (“General American”), The MetLife Investors Group of Insurance Companies, MetLife Insurance Company of Connecticut and other affiliated insurance companies (collectively, the “Insurance Companies”) and to certain eligible qualified retirement plans (“Qualified Plans”), as an investment vehicle for variable life insurance, group annuity or variable annuity products of these insurance companies or Qualified Plans, although the Portfolio is not available to all such separate accounts and Qualified Plans. The Portfolio’s shares may be divided into different classes. Currently, the classes being offered by the Portfolio are named Class A, Class B and Class E. The classes of the Portfolio’s shares are identical, except that certain additional charges (Rule 12b-1 fees) are made against Class B and Class E shares. Investment income, realized and unrealized capital gains and losses, the common expenses of the Portfolio and certain Portfolio-level expense reductions, if any, are allocated daily, on a pro rata basis, to each class based on the relative net assets of each class to the total net assets of the Portfolio.
| 2. | SIGNIFICANT ACCOUNTING POLICIES: |
The preparation of financial statements in conformity with accounting principles generally accepted in the United States of America (“GAAP”) requires management to make estimates and assumptions that affect the reported amounts of assets and liabilities and disclosure of contingent assets and liabilities as of the date of the financial statements and the reported amounts of income and expenses during the reporting period. Actual results could differ from those estimates.
The following is a summary of significant accounting policies consistently followed by the Portfolio in the preparation of its financial statements. The policies are in conformity with GAAP.
Investment Valuation:
Debt securities (other than short term obligations with a remaining maturity of sixty days or less) are generally valued on the basis of evaluated or composite bid quotations obtained by independent pricing services and/or brokers and dealers selected by the relevant subadviser pursuant to authorization of the Board of Directors of the Fund (the “Board” or “Directors”). Such quotations take into account appropriate factors such as institutional-sized trading in similar groups of securities, yield, quality, coupon rate, maturity, type of issue, trading characteristics and other data. Short term obligations with a remaining maturity of sixty days or less are valued at amortized cost which approximates fair market value.
Equity securities traded on a national securities exchange or other exchanges are valued at their last sale price on the principal trading market. Equity securities traded on the NASDAQ National Market System are valued at the NASDAQ Official Closing Price (the “NOCP”). The NOCP is the last reported sale price if the last reported sale price falls between the spread of the last reported bid and asked prices. If the last reported bid and asked prices are above the last reported sale price, the NOCP will be the last reported bid price. If the last reported bid and asked prices are below the last reported sale price, the NOCP will be the last reported asked price. Equity securities traded on a national securities exchange or other exchanges or on the NASDAQ National Market System for which there is no reported sale during the day are valued at the last reported bid price. A security that is listed or traded on more than one exchange is valued at the quotation on the exchange determined to be the primary market for that security by the Board or its delegates. If no closing price is available, then such securities are valued by using the last reported bid price. Equity securities traded over-the-counter are valued at the last reported sales price.
If no current market value quotation is readily available or reliable for a portfolio security, fair value will be determined in accordance with procedures established by and under the general supervision of the Board. When the Portfolio uses fair value pricing, it may take into account any factors it deems appropriate. The value of securities used by the Portfolio to calculate its net asset value may differ from quoted or published prices for the same securities. Fair value pricing involves subjective judgments and the fair value determined for a security may be materially different than the value that could be realized upon the sale of that security.
MSF-14
Metropolitan Series Fund, Inc.
T. Rowe Price Small Cap Growth Portfolio
Notes to Financial Statements—December 31, 2008—(Continued)
The Portfolio expects to use fair value pricing for securities primarily traded on U.S. exchanges only under very limited circumstances. For example, the Portfolio may use fair value pricing if the exchange on which a security is traded closes early or trading in the security is suspended.
Securities traded primarily on an exchange outside of the United States which closes before the close of the New York Stock Exchange will be valued at the last sales price on that non-U.S. exchange. Securities traded primarily on an exchange outside of the United States for which there is no reported sale during the day are valued at the mean between the last reported bid and asked prices. However, because most foreign markets close well before the Portfolio values its securities (typically at 4 p.m. Eastern Time), the earlier close of these foreign markets gives rise to the possibility that significant events, including broad market moves, may have occurred after these foreign markets close but before the Portfolio values its securities. To account for this, the Portfolio may frequently value many of its foreign equity securities using fair value prices based on third party vendor modeling tools.
Forward foreign currency exchange contracts are valued based on the mean between closing bid and asked prices of the forward currency contract rates in the London foreign exchange markets on a daily basis as provided by a reliable bank or dealer.
Options, whether on securities, indices, futures contracts, or otherwise, are valued at the last sales price available as of the close of business on the day of valuation or, if there is no such sale price available, at the mean between the bid and asked prices. Options on currencies are valued at the spot price each day.
The value of futures contracts will be the sum of the margin deposit plus or minus the difference between the value of the futures contract on each day the net asset value is calculated and the value on the date the futures contract originated, value being that established on a recognized commodity exchange, or by reference to other customary sources, with gain or loss being realized when the futures contract closes or expires.
Subject to the Board’s oversight, the Board has delegated the day-to-day oversight of pricing matters, including determinations in good faith under the Fund’s procedures the fair value of securities for which current market quotations are not readily available to the subadviser of the Portfolio.
Investment Transactions and Related Investment Income:
Portfolio security transactions are recorded on the trade date. Dividend income is recorded on the ex-dividend date or, for certain foreign securities, when notified. Interest income, which includes amortization of premium and accretion of discount on debt securities, is recorded on the accrual basis. Realized gains and losses on investments and unrealized appreciation and depreciation are determined on the identified cost basis, which is the same basis used for federal income tax purposes.
Repurchase Agreements:
The Portfolio, through the custodian or a subcustodian, receives delivery of the underlying securities collateralizing repurchase agreements. The Portfolio requires the custodian to take possession, to have legally segregated in the Federal Reserve Book Entry System, or to have segregated within the custodian’s vault, all securities held as collateral for repurchase agreements. It is the Portfolio’s policy that the market value of the collateral be at least equal to 100% of the repurchase price in the case of a repurchase agreement of one-day duration and 102% on all other repurchase agreements. The Portfolio’s subadviser is responsible for determining that the value of the collateral is at all times at least equal to the repurchase price. In connection with transactions in repurchase agreements, if the seller defaults and the value of the collateral declines or if the seller enters an insolvency proceeding, realization of the collateral by the Portfolio may be delayed, limited or wholly denied.
Foreign Currency Translation:
The books and records of the Portfolio are maintained in U.S. dollars. The values of securities, currencies and other assets and liabilities denominated in currencies other than U.S. dollars are translated into U.S. dollars based upon foreign exchange rates prevailing at the end of the period. Purchases and sales of investment securities, income and expenses are translated on the respective dates of such transactions. Since the values of investment securities are presented at the foreign exchange rates prevailing at the end of the period, it is not practical to isolate that portion of the results of operations arising from changes in exchange rates from that portion of the results of operations reflecting fluctuations arising from changes in market prices of the investment securities. Such fluctuations are included in the net realized and unrealized gain or loss on investments.
MSF-15
Metropolitan Series Fund, Inc.
T. Rowe Price Small Cap Growth Portfolio
Notes to Financial Statements—December 31, 2008—(Continued)
Net realized foreign exchange gains or losses arise from sales of foreign currency, currency gains or losses realized between the trade and settlement dates on securities transactions, and the difference between the amounts of dividends, interest, and foreign withholding taxes recorded by the Portfolio and the U.S. dollar equivalent of the amounts actually received or paid by the Portfolio. Net unrealized foreign exchange gains and losses arise from changes in the value of assets and liabilities, other than investment securities, resulting from changes in the exchange rate.
Forward Foreign Currency Exchange Contracts:
The Portfolio may enter into forward foreign currency exchange contracts primarily to hedge against foreign currency exchange rate risks on its non-U.S. dollar denominated investment securities. When entering into a forward currency contract, the Portfolio agrees to receive or deliver a fixed quantity of foreign currency for an agreed-upon price on an agreed future date. These contracts are valued daily and the Portfolio’s net equity therein, representing unrealized gain or loss on the contracts as measured by the difference between the foreign exchange rates at the dates of entry into the contracts and the forward rates at the settlement date, is included in the Statement of Assets and Liabilities. Realized and unrealized gains and losses are included in the Statement of Operations. These instruments involve market and/or credit risk in excess of the amount recognized in the Statement of Assets and Liabilities. Risks arise from the possible inability of counterparties to meet the terms of their contracts and from movement in currency and securities values and interest rates.
Futures Contracts:
The Portfolio may buy and sell futures contracts (on recognized exchanges) as a hedge, to maintain exposure to the broad equity markets or to enhance return. Futures contracts are agreements to buy or sell a security, or deliver a final cash settlement price in connection with an index, interest rate, currency, or other contracts not calling for physical delivery, for a set price in the future. The Portfolio must post an amount equal to a portion of the total market value of the futures contract as futures variation margin, which is returned when the Portfolio’s obligations under the contract have been satisfied. From time to time thereafter, the Portfolio may have to post variation margin to maintain this amount as the market value of the contract fluctuates. Risks of entering into futures contracts (and related options) include the possibility that there may be an illiquid market and that a change in the value of the contract or option may not correlate with changes in the value of the underlying securities.
Options:
The Portfolio may use options to hedge against changes in values of securities the Portfolio owns or expects to purchase, to maintain exposure to the broad equity markets or to enhance return. Writing puts or buying calls tends to increase the Portfolio’s exposure to the underlying instrument and writing calls or buying puts tends to decrease the Portfolio’s exposure to the underlying instrument, and can be used to hedge other Portfolio investments. For options purchased to hedge the Portfolio’s investments, the potential risk to the Portfolio is that the change in value of options contracts may not correspond to the change in value of the hedged instruments. In addition, losses may arise from changes in the value of the underlying instruments, if there is an illiquid secondary market, or if the counterparty is unable to perform. The maximum loss for purchased options is limited to the premium initially paid for the option. For options written by the Portfolio, the maximum loss is not limited to the premium initially received for the option.
The main risk is associated with purchasing an option is that the option expires without being exercised. In this case, the option expires worthless and the premium paid for the option is considered the loss. The risk associated with writing a call option is that the Portfolio may forgo the opportunity for a profit if the market value of the underlying position increases and the option is exercised. The risk in writing a put option is that the Portfolio may incur a loss if the market value of the underlying position decreases and the option is exercised. In addition, the Portfolio risks not being able to enter into a closing transaction for the written option as the result of an illiquid market.
“When-Issued” Securities:
Purchasing securities “when-issued” is a forward commitment by the Portfolio to buy a security. The estimated amount of the Portfolio’s payment obligation and the security’s interest rate are determined when the commitment is made, even though no interest accrues until the security is issued, which is generally 15 to 120 days later. The Portfolio will segregate liquid assets with its custodian sufficient at all times to satisfy these commitments. If the value of the security is less when delivered than when the commitment was made, the Portfolio will suffer a loss.
MSF-16
Metropolitan Series Fund, Inc.
T. Rowe Price Small Cap Growth Portfolio
Notes to Financial Statements—December 31, 2008—(Continued)
Federal Income Taxes:
It is the Portfolio’s policy to comply with the requirements of the Internal Revenue Code of 1986, as amended (the “Code”), and regulations thereunder, applicable to regulated investment companies and to distribute, with respect to each taxable year, all of its taxable income to shareholders. Therefore, no federal income tax provision is required. The Portfolio is subject to the provisions of the Financial Accounting Standards Board Interpretation (“FASB”) No. 48, Accounting for Uncertainties in Income Taxes (FIN 48). FIN 48 sets forth a minimum threshold for financial statement recognition of the benefit of a tax position taken or expected to be taken in a tax return. The implementation of FIN 48 did not result in any unrecognized tax benefits in the accompanying financial statements. Each of the Portfolio’s federal tax returns for the prior three fiscal years remains subject to examination by the Internal Revenue Service.
As of December 31, 2008, the Portfolio had no capital loss carryforwards.
Pursuant to Section 852 of the Code, the Portfolio designated the amount shown below under Long Term Gain as capital gain dividends for its taxable year ended December 31, 2008. The tax character of distributions paid for the periods ended December 31, 2008 and 2007 was as follows:
| | | | | | | | | | | | | | | | | | | | | |
Ordinary Income | | Long Term Gain | | Return of Capital | | Total |
2008 | | 2007 | | 2008 | | 2007 | | 2008 | | 2007 | | 2008 | | 2007 |
$— | | $ | — | | $ | 60,087,022 | | $ | — | | $ | — | | $ | — | | $ | 60,087,022 | | $ | — |
As of December 31, 2008, the components of distributable earnings (accumulated losses) on a federal income tax basis were as follows:
| | | | | | | | | | | | | | |
Undistributed
Ordinary
Income | | Undistributed
Long Term
Gain | | Unrealized
Depreciation | | | Loss
Carryforwards | | Total | |
$711,795 | | $ | 9,573,250 | | $ | (124,901,423 | ) | | $ | — | | $ | (114,616,378 | ) |
Pursuant to Federal income tax regulations applicable to investment companies, the Portfolio has elected to treat net capital losses realized between November 1 and December 31 of each year as occurring on the first day of the following tax year. For the year ended December 31, 2008, the following amounts of realized capital and currency losses reflected in the accompanying financial statements will not be recognized for Federal income tax purposes until January 1, 2009:
| | | | |
Currency | | Capital | |
$— | | $ | (11,560,772 | ) |
Dividends and Distributions to Shareholders:
The Portfolio records dividends and distributions on the ex-dividend date. Net realized gains from security transactions (if any) are generally distributed annually to shareholders. The timing and characterization of certain income and capital gains distributions are determined in accordance with federal tax regulations that may differ from GAAP. Permanent book and tax basis differences relating to shareholder distributions will result in reclassification between under/over distributed net investment income, accumulated net realized gains/losses and paid in capital.
Expense Reductions:
Certain Portfolio trades are directed to brokers who paid a portion of the Portfolio’s expenses. Amounts paid for the Portfolio are shown as expense reductions in the Statement of Operations.
| 3. | INVESTMENT TRANSACTIONS: |
For the year ended December 31, 2008, purchases and sales of securities (excluding short term investments) for the Portfolio were as follows:
| | | | | | | | | |
Purchases | | Sales |
U.S. Government | | Other | | U.S. Government | | Other |
$0 | | $ | 426,287,580 | | $ | 0 | | $ | 292,770,517 |
MSF-17
Metropolitan Series Fund, Inc.
T. Rowe Price Small Cap Growth Portfolio
Notes to Financial Statements—December 31, 2008—(Continued)
| 4. | INVESTMENT MANAGEMENT FEES AND OTHER TRANSACTIONS WITH AFFILIATES: |
Investment Management Agreement:
MetLife Advisers, LLC (“MetLife Advisers”) is the investment adviser to the Portfolio. The Fund has entered into an investment management agreement with MetLife Advisers with respect to the Portfolio. For providing investment management services to the Portfolio, MetLife Advisers receives monthly compensation at the following annual rates:
| | | | |
Management
Fees earned by
MetLife Advisers
for the year ended
December 31, 2008 | | Annual
percentage
rates paid to
MetLife Advisers | | Based on Portfolios
average daily net asset
levels |
| $2,010,381 | | 0.550% | | Of the first $100 million |
| | 0.500% | | Of the next $300 million |
| | 0.450% | | On amounts in excess of $400 million |
Certain officers and directors of the Fund may also be officers of MetLife Advisers; however, such officers and directors receive no compensation from the Fund.
MetLife Advisers has entered into an investment subadvisory agreement with respect to the Portfolio. T. Rowe Price Associates, Inc. (“T. Rowe Price”) is compensated by MetLife Advisers to provide subadvisory services for the Portfolio.
Management Fee Waivers:
Effective February 17, 2005, T. Rowe Price agreed to a voluntary subadvisory fee waiver that applies if (i) assets under management by T. Rowe Price for the Fund and Met Investor Series Trust (“MIST”), in the aggregate, exceed $750,000,000, (ii) T. Rowe Price subadvises three or more portfolios of the Fund and MIST in the aggregate, and (iii) at least one of those portfolios is a large cap domestic equity portfolio.
If the aforementioned conditions are met, T. Rowe Price will waive its subadvisory fee paid by MetLife Advisers by 5% for combined Fund and MIST average daily net assets over $750,000,000, 7.5% for the next $1,500,000,000 of combined assets, and 10% for amounts over $3,000,000,000. Any amounts waived pursuant to this subadvisory fee waiver will be allocated with respect to the Fund and MIST portfolios in proportion to such portfolios’ net assets. MetLife Advisers has voluntarily agreed to reduce its advisory fee for T. Rowe Price Large Cap Growth and T. Rowe Price Small Cap Growth by the amount waived (if any) by T. Rowe Price for the relevant Portfolio(s) pursuant to this voluntary subadvisory fee waiver. Because these fee waivers are voluntary, and not contractual, they may be discontinued by T. Rowe Price and MetLife Advisers at any time. Amounts waived for the year ended December 31, 2008 are shown as management fee waivers in the Statement of Operations of the respective Portfolios.
Service and Distribution Fees:
The Fund has adopted a Distribution and Service Plan under Rule 12b-1 of the 1940 Act for the Portfolio’s Class B and E shares. Under the Distribution and Service Plan, the Class B and E shares of the Portfolio pay a fee to compensate the Insurance Companies (or their affiliates) and other broker-dealers and financial intermediaries involved in the offer and sale of Portfolio shares for promoting or selling and servicing the Class B and E shares. The fees under the Distribution and Service Plan for each class of the Portfolio’s shares are calculated as a percentage of the Portfolio’s average daily net assets that are attributable to that Class. Currently, the fee is 0.25% per year for Class B shares and 0.15% per year for Class E shares. Amounts paid by the Portfolio for the year ended December 31, 2008 are shown as Service and Distribution fees in the Statement of Operations.
The Fund has entered into a securities lending arrangement with the Fund’s custodian, State Street Bank and Trust Company (the “custodian”). Under the agreement, the custodian is authorized to loan securities on the Portfolios’ behalf. In exchange, the Portfolio receives either cash or securities as collateral against the loaned securities. The Portfolio receives collateral at least equal to 102% of the market value of the loaned securities (105% for foreign securities), at each loan’s inception. Collateral must be maintained at least at 100% of the market value of the loaned securities for the duration of the loan. The cash collateral is invested in the Navigator Securities Lending Prime Portfolio, an affiliate of the custodian, which invests in a variety of high quality U.S. dollar-denominated instruments. If the market value of the collateral at the close of trading on a business day is less
MSF-18
Metropolitan Series Fund, Inc.
T. Rowe Price Small Cap Growth Portfolio
Notes to Financial Statements—December 31, 2008—(Continued)
than 100% of the market value of the loaned securities at the close of trading on that day, the borrower shall be required to deliver, by the close of business on the following business day, an additional amount of collateral, equal to at least 100% of the market value of all the loaned securities as of such preceding day. The Portfolio receives 80% of the annual net income from securities lending transactions, which is included in interest income of the Portfolio. The remaining 20% is paid to the custodian as compensation for its securities lending services. Interest income received by the Portfolio via lending transactions during the year ended December 31, 2008 is footnoted in the Statement of Operations. The Portfolio bears the risk of any deficiency in the amount of collateral available for return to a borrower due to a loss in an approved investment purchased with such collateral. Any outstanding loans by the Portfolio at December 31, 2008 are footnoted in the Schedule of Investments.
| 6. | MARKET AND CREDIT RISK: |
In the normal course of business, the Portfolio invests in securities and enters into transactions where risks exist due to fluctuations in the market (market risk) or failure of the other party to a transaction to perform (credit risk). The value of securities held by the Portfolio may decline in response to certain events, including those directly involving the companies whose securities are owned by the Portfolio; conditions affecting the general economy; overall market changes; local, regional or global political, social or economic instability; and currency and interest rate and price fluctuations. Similar to credit risk, the Portfolio may be exposed to counterparty risk, or the risk that an entity with which the Portfolio has unsettled or open transactions may default. Financial assets, which potentially expose the Portfolio to credit and counterparty risks, consist principally of investments and cash due from counterparties. The extent of the Portfolio’s exposure to credit and counterparty risks in respect to these financial assets approximates their value as recorded in the Portfolio’s Statements of Assets and Liabilities.
| 7. | RECENT ACCOUNTING PRONOUNCEMENTS: |
In March 2008, the FASB issued Statement of Financial Accounting Standards No. 161, Disclosures about Derivative Instruments and Hedging Activities (“FAS 161”), an amendment of FASB Statement No. 133. FAS 161 requires enhanced disclosures about (a) how and why an entity uses derivative instruments, (b) how derivative instruments and hedging activities are accounted for, and (c) how derivative instruments and related hedging activities affect a fund’s financial position, financial performance, and cash flows. Management does not believe the adoption of FAS 161 will materially impact the financial statement amounts, but will require additional disclosures. This will include qualitative and quantitative disclosures on derivative positions existing at period end and the effect of using derivatives during the reporting period. FAS 161 is effective for financial statements issued for fiscal years and interim periods beginning after November 15, 2008. Management is currently evaluating the impact the adoption of FAS 161 will have on the Portfolio’s financial statement disclosures.
MSF-19
Metropolitan Series Fund, Inc.
T. Rowe Price Small Cap Growth Portfolio
Report of Independent Registered Public Accounting Firm
To the Shareholders and Board of Directors of Metropolitan Series Fund, Inc.:
We have audited the accompanying statement of assets and liabilities, including the schedule of investments, of the T. Rowe Price Small Cap Growth Portfolio (one of the portfolios constituting the Metropolitan Series Fund, Inc.) (the “Fund”) as of December 31, 2008, and the related statement of operations for the year then ended, the statements of changes in net assets for each of the two years in the period then ended, and the financial highlights for each of the five years in the period then ended. These financial statements and financial highlights are the responsibility of the Fund’s management. Our responsibility is to express an opinion on these financial statements and financial highlights based on our audits.
We conducted our audits in accordance with the standards of the Public Company Accounting Oversight Board (United States). Those standards require that we plan and perform the audit to obtain reasonable assurance about whether the financial statements and financial highlights are free of material misstatement. The Fund is not required to have, nor were we engaged to perform, an audit of its internal control over financial reporting. Our audits included consideration of internal control over financial reporting as a basis for designing audit procedures that are appropriate in the circumstances, but not for the purpose of expressing an opinion on the effectiveness of the Fund’s internal control over financial reporting. Accordingly, we express no such opinion. An audit also includes examining, on a test basis, evidence supporting the amounts and disclosures in the financial statements, assessing the accounting principles used and significant estimates made by management, as well as evaluating the overall financial statement presentation. Our procedures included confirmation of securities owned as of December 31, 2008, by correspondence with the custodian and brokers; where replies were not received from brokers, we performed other auditing procedures. We believe that our audits provide a reasonable basis for our opinion.
In our opinion, the financial statements and financial highlights referred to above present fairly, in all material respects, the financial position of the T. Rowe Price Small Cap Growth Portfolio of the Metropolitan Series Fund, Inc. as of December 31, 2008, the results of its operations for the year then ended, the changes in its net assets for each of the two years in the period then ended, and the financial highlights for each of the five years in the period then ended, in conformity with accounting principles generally accepted in the United States of America.
Deloitte & Touche LLP
Boston, Massachusetts
February 24, 2009
MSF-20
Metropolitan Series Fund, Inc.
Directors and Officers
The Fund’s Directors review actions of the Fund’s investment adviser and subadvisers, and decide upon matters of general policy. The Fund’s officers supervise the daily business operations of the Fund. The Board of Directors and the Fund’s officers are listed below. Each Director is responsible for overseeing all 38 Portfolios of the Fund. There is no limit to the term a Director may serve. Directors serve until their resignation, retirement or removal in accordance with the Fund’s organizational documents and policies adopted by the Board from time to time. Officers hold office at the pleasure of the Board or until the election or appointment and the qualification of a successor. The address of the Directors and officers is c/o Metropolitan Series Fund, Inc., 501 Boylston Street, Boston, MA 02116.
Interested Directors(1)
Each Director below is an “interested person” (as defined by the 1940 Act) with respect to the Fund in that Ms. Forget is an employee of MetLife and Mr. Typermass is a former employee of MetLife and owns securities issued by MetLife, Inc., the ultimate parent company of MetLife Advisers.
| | | | | | | | |
Name, Address and Age | | Current
position(s)
with Fund | | Position(s)
held since | | Principal occupations
over past five years, including other directorships(2) | | Number of
Portfolios in
Fund Complex
Overseen by
Director(3) |
Elizabeth M. Forget Age: 42 | | Director, Chairman of the Board, President and Chief Executive Officer | | 2006 | | Senior Vice President (since 2007), MetLife, Inc.; President, Met Investors Advisory, LLC; Trustee and President, Met Investors Series Trust; Executive Vice President, MetLife Investors Group, Inc.; President, Chief Executive Officer and Chair of the Board of Managers (since 2006), MetLife Advisers; President, Met Investors Advisory, LLC. | | 87 |
| | | | |
Arthur G. Typermass Age: 71 | | Director | | 1998 | | Formerly, Senior Vice President and Treasurer, MetLife. | | 38 |
Non-Interested Directors(1)
Each Director below is not an “interested person” (as defined by the 1940 Act) with respect to the Fund (collectively, the “Independent Directors”).
| | | | | | | | |
Name, Address and Age | | Current
position(s)
with Fund | | Position(s)
held since | | Principal occupations
over past five years, including other directorships(2) | | Number of
Portfolios in
Fund Complex
Overseen by
Director(3) |
Steve A. Garban† Age: 71 | | Director | | 1985 | | Formerly, Chief Financial Officer, Senior Vice President Finance and Operations and Treasurer (Emeritus), The Pennsylvania State University. | | 38 |
| | | | |
Linda B. Strumpf Age: 61 | | Director | | 2000 | | Vice President and Chief Investment Officer, Ford Foundation. | | 38 |
| | | | |
Michael S. Scott Morton† Age: 71 | | Director | | 1993 | | Jay W. Forrester Professor of Management (Emeritus) at Sloan School of Management, MIT. | | 38 |
| | | | |
H. Jesse Arnelle Age: 75 | | Director | | 2001 | | Formerly, Counsel, Womble Carlyle Sandrie & Rice; Director, Textron Inc. (global multi- industry company)*; formerly, Director, Gannet Co. Inc. (diversified news and information company)*; formerly, Director, Eastman Chemical Company (global chemical company)*; formerly, Director, Waste Management, Inc.*; formerly, Director, Armstrong Holdings Inc. (parent company of floor and ceiling products business)*; formerly, Director, FPL Group Inc. (public utility holding company)*; Director, URS Corporation (engineering design services firm)*. | | 38 |
MSF-21
Metropolitan Series Fund, Inc.
Directors and Officers—(Continued)
| | | | | | | | |
Name, Address and Age | | Current
position(s)
with Fund | | Position(s)
held since | | Principal occupations
over past five years, including other directorships(2) | | Number of
Portfolios in
Fund Complex
Overseen by
Director(3) |
Nancy Hawthorne Age: 57 | | Director | | 2003 | | Chief Executive Officer, Clerestory LLC (corporate financial advisor); Director, Avid Technologies (computer software company)*; formerly, Chairman of the Board of Avid Technologies; formerly, Board of Advisors, L. Knife & Sons, Inc. (beverage distributor); formerly, Trustee, New England Zenith Fund (“Zenith Fund”)**; formerly, Chief Executive Officer and Managing Partner, Hawthorne, Krauss and Associates (corporate financial advisor); formerly, Chief Financial Officer and Executive Vice President, Continental Cablevision, subsequently renamed MediaOne (cable television company); formerly, Director, Life F/X, Inc.; formerly, Chairman of the Board, WorldClinic (distance medicine company); formerly, Director, Perini Corporation (construction company)*; formerly, Director, CGU (property and casualty insurance company); formerly, Director, Beacon Power Corporation (energy company)*. | | 38 |
| | | | |
John T. Ludes Age: 72 | | Director | | 2003 | | President, LFP Properties (consulting firm); Formerly, Trustee, Zenith Fund**; formerly, Vice Chairman, President and Chief Operating Officer, Fortune Brands/American Brands (global conglomerate); formerly, President and CEO, Acushnet Company (athletic equipment company). | | 38 |
Officers(1)
| | | | | | | | |
Name and address | | Age | | Current
position(s)
with Fund | | Position(s)
held since | | Principal occupations over past five years(2) |
| Jeffrey L. Bernier | | 37 | | Senior Vice President | | 2008 | | Vice President (since 2008), MetLife, Inc.; Vice President (since 2008), MetLife; Senior Vice President (since 2008), MetLife Advisers; formerly, Director and Senior Investment Analyst (2004 to 2007), John Hancock Financial Services; formerly, Assistant Vice President (2000 to 2001), Wachovia Securities. |
| | | | |
| Alan C. Leland | | 56 | | Senior Vice President | | 2005 | | Treasurer and Chief Financial Officer, MetLife Advisers, LLC; Treasurer (since 2005), Met Investors Advisory, LLC; Vice President (since 2004), Met Investors Advisory, LLC; Vice President (since 2003), MetLife, Inc.; Vice President, MetLife; Senior Vice President, NELICO. |
| | | | |
| Peter Duffy | | 53 | | Vice President
and Treasurer | | 2000 | | Senior Vice President, MetLife Advisers; Second Vice President (since 2003), NELICO; Vice President, MetLife (since 2004); Vice President (since 2004), MetLife, Inc.; formerly, Vice President and Treasurer, Zenith Fund**. |
| | | | |
| Jeffrey P. Halperin | | 41 | | Chief
Compliance Officer | | 2007 | | Vice President (since 2006), MetLife, Inc.; Vice President (since 2006), MetLife; Chief Compliance Officer (since 2006), Met Investors Series Trust, MetLife Advisers, Met Investors Advisory, LLC and MetLife Investment Advisors Company, LLC. |
| * | Indicates a directorship with a registered investment company or a company subject to the reporting requirements of the Securities Exchange Act of 1934, as amended. |
| ** | The Zenith Fund deregistered with the Securities and Exchange Commission (“SEC”) in 2004. |
| (†) | Served as a trustee, director and/or officer of one or more of the following companies, each of which had a direct or indirect advisory relationship with MetLife Advisers or its affiliates prior to January 31, 2005: State Street Research Financial Trust, State Street Research Income Trust, State Street Research Money Market Trust, State Street Research Institutional Funds, State Street Research Capital Trust, State Street Research Master Investment Trust, State Street Research Equity Trust, State Street Research Securities Trust and State Street Research Exchange Trust (collectively, the “State Street Research Funds”). |
| (1) | During the period shown, each Director of the Fund served as a Trustee of Metropolitan Series Fund II, a registered investment company that ceased investment operations in June of 2008 and has applied for deregistration under the Investment Company Act of 1940. During this period, each officer of the Fund served in the same position with Metropolitan Series Fund II. |
| (2) | Previous positions during the past five years with the Fund; Met Investors Series Trust; MetLife; MetLife, Inc.; MetLife Advisers; Met Investors Advisory, LLC; Zenith Fund; NELICO; or New England Securities Corporation are omitted if not materially different. |
| (3) | The Fund Complex includes the Fund (38 portfolios) and Met Investors Series Trust (49 portfolios). |
MSF-22
Metropolitan Series Fund, Inc.
T. Rowe Price Small Cap Growth Portfolio
Board Approval of Advisory and Subadvisory Agreements
The Fund’s Contract Review Committees of the Board of Directors (the “Board” or the “Directors”) typically meet in early fall to review the Portfolios’ advisory agreements (the “Advisory Agreements”) and subadvisory agreements (the “Subadvisory Agreements,” and, together with the Advisory Agreements, the “Agreements”) and determine whether to recommend that the full Board approve the continuation of the Agreements for an additional one-year period. (Following the initial approval of an Agreement for a new Portfolio or with a new adviser or subadviser, such annual reviews are not required until 2 years following the execution of such Agreement.) After each Committee has made its recommendations, the full Board, including the Independent Directors, determines whether to approve the continuation of each of the Agreements. In addition, the Board, including the Independent Directors, considers matters bearing on the Agreements at most of its other meetings throughout the year and regularly interviews various individuals at MetLife Advisers responsible for the management of the Portfolios. The Directors also interview selected investment managers and other professionals at the subadvisers at various times throughout the year.
The Directors receive all materials that they or MetLife Advisers, the Fund’s investment adviser, and the subadvisers believe to be reasonably necessary for the Directors to evaluate the Agreements and determine whether to approve the continuation of the Agreements. These materials generally include, among other items, (i) information on the investment performance of the Portfolios and the performance of peer groups of funds and the Portfolios’ performance benchmarks, (ii) information on the Portfolios’ advisory and subadvisory fees and other expenses, including information comparing the Portfolios’ expenses to those of peer groups of funds and information about any applicable expense caps and fee “breakpoints,” (iii) sales and redemption data, (iv) information related to the profitability of the Agreements to MetLife Advisers and certain of the subadvisers, and potential “fall-out” or ancillary benefits that MetLife Advisers, the subadvisers or their affiliates may receive as a result of their relationships with the Fund and (v) information obtained through the subadvisers’ responses to certain requests from MetLife Advisers and the Directors and MetLife Advisers’ responses to requests from the Directors. The Directors may also consider other information such as (vi) MetLife Advisers’ and the subadvisers’ financial results and condition, (vii) each Portfolio’s investment objectives and strategies and the size, education and experience of the investment staffs of MetLife Advisers and the relevant subadvisers and their use of technology and external research, (viii) the allocation of the Portfolios’ brokerage, if any, including allocations to brokers affiliated with the subadvisers and the use of “soft” commission dollars to pay Portfolio expenses and to pay for research and other similar services, (ix) the resources devoted to, and the record of compliance with, the Portfolios’ investment policies and restrictions, policies on personal securities transactions and other compliance policies, (x) the responses of MetLife Advisers, the subadvisers and/or their affiliates to certain legal and regulatory proceedings and (xi) the economic outlook generally and for the mutual fund industry in particular. Throughout the process, the Directors have the opportunity to ask questions of and request additional materials from MetLife Advisers and the subadvisers.
Following meetings of each Contract Review Committee on September 10, 2008, the Board, including the Independent Directors, at its November 6-7, 2008 meeting, approved the continuation through December 31, 2009 of the Advisory Agreements for each Portfolio of the Fund and the Subadvisory Agreements for each Portfolio other than the Zenith Equity Portfolio and Asset Allocation Portfolios (which do not have subadvisers) and the Van Eck Global Natural Resources Portfolio, Met/Dimensional International Small Cap Portfolio and Loomis Sayles Small Cap Growth Portfolio (formerly known as the Franklin Templeton Small Cap Growth Portfolio). The Agreements approved for continuation are referred to below as the “Continued Agreements.”
In considering whether to approve the continuation of the Continued Agreements, the Directors, including the Independent Directors, did not identify any single factor as determinative, and each weighed the various factors as he or she deemed appropriate. The Directors considered the following matters in connection with their approval of the Continued Agreements:
The nature, extent and quality of the services provided to the relevant Portfolios under the Continued Agreements. The Directors considered the nature, extent and quality of the services provided by MetLife Advisers, the relevant subadvisers (if any) and their affiliates (each, an “Adviser,” and, collectively, the “Advisers”) to the relevant Portfolios pursuant to the Continued Agreements and the resources dedicated to these Portfolios by the Advisers. In particular, the Directors considered the Advisers’ abilities to attract and retain highly qualified investment professionals. With respect to MetLife Advisers, the Directors considered (for each Portfolio other than the Zenith Equity and Asset Allocation Portfolios) that MetLife Advisers is (i) ultimately responsible for the performance of such Portfolios; (ii) ultimately responsible for the establishment of the investment strategies of each such Portfolio, primarily through its recommendations to the Board regarding the hiring and selection of subadvisers; (iii) responsible for the hiring and selection, subject to Board approval, of subadvisers; and (iv) responsible for maintaining a program of Subadviser oversight reasonably designed to ensure that the subadvisers have reasonable compliance policies and procedures in place. The Directors also considered that MetLife Advisers provides a full range of day-to-day administrative services for the Portfolios involving all aspects of such Portfolios’ day-to-day operations (other than portfolio management). With respect to the Zenith Equity and Asset Allocation Portfolios, the Directors considered both the portfolio management services and the administrative services provided by MetLife Advisers. After reviewing
MSF-23
Metropolitan Series Fund, Inc.
T. Rowe Price Small Cap Growth Portfolio
Board Approval of Advisory and Subadvisory Agreements—(Continued)
these and related factors, the Directors concluded, within the context of their overall conclusions regarding each of the Continued Agreements, that the nature, extent and quality of services provided supported the renewal of these Agreements.
Investment performance of the relevant Portfolios. The Directors reviewed information about the performance of the relevant Portfolios over various time periods, including information prepared by an independent third party that compared the performance of the Portfolios to the performance of peer groups of funds and performance benchmarks. The Directors also reviewed a description of the third party’s methodology for identifying a Portfolio’s peer group(s) for purposes of performance and expense comparisons.
In the case of each relevant Portfolio that had performance that lagged its peer group(s) for certain periods, the Directors concluded that other factors relevant to performance were sufficient, in light of other considerations, to warrant renewal of the Continued Agreements relating to such Portfolio. These factors varied from Portfolio to Portfolio, but included one or more of the following: (i) that such Portfolio’s performance, although lagging in certain recent periods, was stronger over the longer term; (ii) that the underperformance was attributable, to a significant extent, to investment decisions that were reasonable and consistent with the Portfolio’s investment objective(s) and policies and that the Portfolio was performing within the range of reasonable expectations, given market conditions and the Portfolio’s investment objective(s) and policies; (iii) that the Portfolio’s performance was competitive when compared to other relevant performance benchmarks or peer groups; and (iv) that MetLife Advisers and/or the relevant subadviser (if any) had taken or was taking steps designed to help improve the Portfolio’s investment performance (including, in the case of certain Portfolios, that MetLife Advisers was formulating possible proposals, for presentation to the Board in November 2008, to replace the Portfolio’s subadviser or to merge the Portfolio into another Portfolio with a similar investment objective and better investment performance).
The Directors also considered the investment performance of the Advisers and their reputations generally, the historical responsiveness of the Advisers to Director concerns about performance and the willingness of the Advisers to take steps intended to improve performance.
After reviewing these and related factors, the Directors concluded, within the context of their overall conclusions regarding each of the Continued Agreements, that the investment performance of each relevant Portfolio and Adviser was sufficient, in light of other considerations, to warrant the renewal of the Continued Agreements.
The costs of the services to be provided and profits to be realized by the Advisers and their affiliates from their relationships with the Portfolios. The Directors considered the fees charged by MetLife Advisers to the Portfolios for advisory services and, with respect to the subadvised Portfolios, by such subadvisers to MetLife Advisers for subadvisory services (such advisory and subadvisory fees (if any), collectively, “Fees”), as well as the total expense levels of the Portfolios. This information included comparisons (provided by an independent third party) of the Portfolios’ advisory fees and total expense levels to those of their peer groups. In evaluating Fees for the relevant Portfolios, the Directors also took into account the demands, complexity and quality of the investment management services provided to each Portfolio. The Directors considered MetLife Advisers’ recommendations regarding reductions in Fee rates, implementation of Fee breakpoints and institution of Fee waivers and expense caps.
The Directors also considered the compensation directly or indirectly received by the Advisers and their affiliates from their relationships with the relevant Portfolios. The Directors reviewed information relating to the profits received by MetLife Advisers, certain of the subadvisers and their affiliates as a result of their relationships with the relevant Portfolios, and information about the allocation of expenses used to calculate profitability. When reviewing profitability, the Directors also considered the performance of the relevant Portfolios, the expense levels of such Portfolios and whether the relevant Advisers had implemented breakpoints, fee waivers and/or expense caps with respect to such Portfolios.
After reviewing these and related factors, the Directors concluded, within the context of their overall conclusions regarding each of the Continued Agreements, that the Fees charged to each of the relevant Portfolios were fair and reasonable, and that the information provided regarding costs of these services generally, and the related profitability (if known) to the relevant Advisers of their relationships with the relevant Portfolios, supported the renewal of the Continued Agreements.
Economies of Scale. The Directors considered the existence of any economies of scale in the provision of services by the Advisers and whether those economies were shared with the relevant Portfolios through breakpoints in their advisory fees or other means, such as expense caps, fee waivers or relatively low levels of fees. The Directors noted that most of the relevant Portfolios benefited or will benefit from breakpoints, expense caps and/or fee waivers with respect to their advisory fees. In considering these issues, the Directors also took into consideration information relating to the costs of the services provided and the profitability to MetLife Advisers, the relevant subadvisers (if any) and each of their affiliates of their relationships with the relevant Portfolios, as discussed above.
MSF-24
Metropolitan Series Fund, Inc.
T. Rowe Price Small Cap Growth Portfolio
Board Approval of Advisory and Subadvisory Agreements—(Continued)
After reviewing these and related factors, the Directors concluded, within the context of their overall conclusions regarding each of the Continued Agreements, that the extent to which economies of scale were shared with the relevant Portfolios supported the renewal of such Agreements.
Other Factors. The Directors also considered other factors, which included but were not limited to the following:
| | • | | the extent to which each relevant Portfolio operated in accordance with its investment objective, and its record of compliance with its investment restrictions and the compliance programs of the Fund and the Advisers. They also considered the compliance-related resources the Advisers and their affiliates provide to the relevant Portfolios; |
| | • | | the nature, quality, cost and extent of administrative and shareholder services performed by MetLife Advisers and its affiliates under the Advisory Agreements; and |
| | • | | so-called “fall-out benefits” to the Advisers, such as the engagement of their affiliates to provide distribution, brokerage and transfer agency services to the Portfolios, and the benefits of research made available to the relevant Advisers by reason of brokerage commissions generated by the relevant Portfolios’ securities transactions. The Directors also considered the possible conflicts of interest associated with these fall-out and other benefits, and the reporting and other processes in place to disclose and monitor these possible conflicts of interest. |
Based on their evaluation of all factors that they deemed to be material, including those factors described above, and assisted by the advice of independent counsel, the Directors, including the Independent Directors, concluded that each of the Continued Agreements should be continued through December 31, 2009.
MSF-25
A description of the policies and procedures that the Fund uses to determine how to vote proxies relating to portfolio securities is available (i) without charge, upon request, by calling (800) 638-7732 and (ii) on the Securities and Exchange Commission’s (the “SEC”) website at http://www.sec.gov.
Information regarding how the Fund voted proxies relating to portfolio securities during the most recent twelve-month period ended December 31, 2008 is available (i) without charge, upon request, by calling (800) 638-7732 and (ii) on the SEC’s website at http://www.sec.gov.
The Fund’s Statement of Additional Information includes additional information about the Directors of the Fund and is available (i) without charge, upon request, by calling (800) 638-7732 and (ii) on the SEC’s website at http://www.sec.gov.
The Fund files with the SEC a complete schedule of its portfolio holdings, as of the close of the first and third quarters of its fiscal year, on “Form N-Q”. These filings are available on the SEC’s website at www.sec.gov and may be reviewed and copied at the SEC’s Public Reference Room in Washington, DC. (Call 1-800-SEC-0330 for information on the operation of the Public Reference Room.)
MSF-26
Simplify your life…
with MetLife eDelivery® while helping MetLife preserve the planet’s natural resources.
(see details on inside cover)
| | |
Metropolitan Series Fund, Inc. Van Eck Global Natural Resources Portfolio Annual Report | | December 31, 2008 |
NOT PART OF THE ANNUAL REPORT
Letter from the President
February 1, 2009
Letter to Policy Holders:
2008 was an extraordinary year in the capital markets around the world and for the global economy. Energy prices rose to record levels early in the year before falling by two-thirds by year-end. A credit crisis that began with concerns about sub-prime mortgages led to massive changes in the financial landscape with government takeovers, forced sales, and outright failures of a number of large, once venerable firms.
While bonds as measured by the Barclays Capital U.S. Aggregate Bond Index (formerly known as, Lehman Brothers U.S. Aggregate Bond Index) were up 5.2% for the year in response to declining interest rates, there were large differences in the total returns of the various sectors of the bond market. U.S. treasury securities were up over 13% as frightened investors sought refuge in what they perceived to be the safest and most liquid investments. In contrast, investment grade corporate securities lost nearly 5% as credit spreads widened and below investment grade or high yield bonds fell over 26%.
In response to the growing credit crisis and the weakening economy, common stocks fell sharply across all regions, styles, and capitalizations. As measured by the Standard and Poor’s 500, U.S. common stocks fell 37% for the year, the worst calendar year decline since the 1930s. Foreign stocks were down even more with the MSCI EAFE Index down 43% for the year.
On the following pages, you will find a complete review of your Portfolio and its investment performance.
MetLife is committed to building your financial freedom. We appreciate your trust and will continue to focus our efforts on meeting your investment needs.
Sincerely,
Elizabeth M. Forget
President, Metropolitan Series Fund, Inc.
Metropolitan Series Fund, Inc.
Van Eck Global Natural Resources Portfolio
Managed by Van Eck Global
Portfolio Manager Commentary*
PORTFOLIO PERFORMANCE
Since its inception on October 31, 2008, the Class A shares of the Van Eck Global Natural Resources Portfolio returned -2.9%, compared to its benchmark, the S&P North American Natural Resources Index1, which returned -4.0%.
PORTFOLIO REVIEW
Since the Portfolio’s inception, we focused on sectors and companies that had good underlying value and strong prospects ahead and that we felt were currently undervalued. Positioning in the gold, other precious metals, steel, other base metals, and infrastructure areas boosted the Portfolio’s results during the period from inception through the end of the year. For the period, those individual holdings that contributed most to the Portfolio’s outperformance were all gold equities, which generated the strongest performance among the hard assets commodities during the last two months of the year. For the period, Canadian gold producers Agnico-Eagle Mines, Kinross Gold and Goldcorp saw their share prices advance 85.64%, 76.61% and 69.20%, respectively. Shares of U.K. gold producer Randgold Resources gained 41.63%, and SPDR Gold Trust, the world’s largest gold-backed exchange-traded fund, increased 21.28%.
The biggest detractors from the Portfolio’s performance were energy companies, specifically coal and oil services companies. To a more modest degree, holdings in the forest products and agriculture sub-sectors detracted as well. For the period, those individual holdings that detracted most from the Portfolio’s performance were two U.S. coal producers, Alpha Natural Resources and Walter Industries, whose share prices dropped 54.74% and 54.68%, respectively, on weakness in coking coal prices driven by exceedingly low steel utilization. Coal prices dropped significantly during the period on the weakening economy, supply/demand issues and unwinding by hedge funds of their leveraged positions in commodities. Concerns that coal prices and demand for coal would continue to decrease over the months ahead affected these companies’ share prices as well. Other names that detracted from results were U.S. oil services firms that faced the possibility of crude oil prices continuing to decline given lower demand. These included offshore drilling company Transocean, energy engineering firm McDermott International and oilfield services provider Schlumberger, which saw their share prices decline 42.61%, 42.32% and 17.64%, respectively. For each of these companies, as oil prices moved lower, the cost of supplying their services became somewhat burdensome, and so they cut back on current and future projects.
Since the Portfolio’s inception, we adjusted sub-sector weightings as market conditions shifted and for stock-specific reasons. During the two months, we reduced the Portfolio’s exposure to coal companies as well as to agriculture. We increased the Portfolio’s weighting in gold stocks and integrated oil companies. With these changes, at the end of December, the Portfolio had a significantly overweight position compared to the S&P North American Natural Resources Sector Index in precious metals and more modest overweight positions in base metals and agriculture. The Portfolio had a significantly underweight position compared to its benchmark in energy and a rather neutral-weighted exposure to forest products.
* The views expressed above are those of the subadvisory firm as of December 31, 2008 and are subject to change based on market and other conditions. Information about the Portfolio’s holdings, asset allocation, industry allocation, or country diversification is historical and is not an indication of future Portfolio composition, which will vary. The performance of any index mentioned in this commentary has not been adjusted for ongoing management, distribution and operating expenses, and sales charges applicable to mutual fund investments. Direct investment in any index is not possible.
1 The S&P North American Natural Resources Sector Index was developed as an equity benchmark for U.S. traded natural resource related stocks. The Index includes companies in the following categories: extractive industries, energy companies, owners and operators of timber tracts, forestry services, producers of pulp and paper, and owners of plantations. It is a modified capitalization-weighted index and component companies must meet objective criteria for inclusion. Reconstitution is semi-annual.
MSF-2
Metropolitan Series Fund, Inc.
Van Eck Global Natural Resources Portfolio
A $10,000 INVESTMENT COMPARED TO THE
S&P NORTH AMERICAN NATURAL RESOURCES INDEX
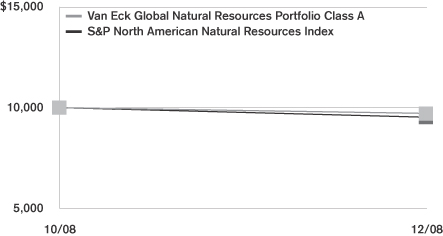
Returns as of December 31, 2008
| | | | | | |
| | | Van Eck Global Natural Resources Portfolio | | | S&P North American
Natural Resources Index | |
| | | Class A | | |
| Since Inception | | -2.9 | % | | -4.0 | % |
Performance numbers are net of all Portfolio expenses but do not include any insurance, sales, or administrative charges of variable annuity or life insurance contracts or any additional expenses that participants in certain eligible qualified plans may bear relating to the operations of their plans. If these charges were included, the returns would be lower.
Inception date of the Class A shares is 10/31/08. Index since inception return is based on the Portfolio’s inception date. Returns shown are not computed on an annualized basis.
This information represents past performance and is not indicative of future results. Investment return and principal value may fluctuate so that shares, upon redemption, may be worth more or less than the original cost.
PORTFOLIO COMPOSITION
as of December 31, 2008
Top Holdings
| | |
| | | % of Total
Net Assets |
Agnico-Eagle Mines, Ltd. | | 5.7% |
Exxon Mobil Corp. | | 5.5% |
Kinross Gold Corp. | | 5.4% |
BHP Billiton, Plc. | | 4.6% |
Anadarko Petroleum Corp. | | 4.4% |
XTO Energy, Inc. | | 4.0% |
Randgold Resources, Ltd. | | 3.8% |
SPDR Gold Trust | | 3.7% |
Nucor Corp. | | 3.5% |
Schlumberger, Ltd. | | 3.3% |
Top Countries
| | |
| | | % of Equity
Market Value |
United States | | 58.1% |
Canada | | 16.4% |
United Kingdom | | 5.6% |
Channel Islands | | 4.2% |
Netherlands Antilles | | 3.7% |
Switzerland | | 3.1% |
France | | 2.6% |
Brazil | | 2.5% |
Bermuda | | 2.1% |
Kazakhstan | | 1.0% |
MSF-3
Metropolitan Series Fund, Inc.
Shareholder Expense Example
As a shareholder of the Portfolio, you incur ongoing costs, including management fees; distribution and service (12b-1) fees; and other Portfolio expenses. This example is intended to help you understand your ongoing costs (in dollars) (referred to as “expenses”) of investing in the Portfolio and compare these costs with the ongoing costs of investing in other mutual funds. The example is based on an investment of $1,000 invested at the inception of the Portfolio and held for the entire period, October 31, 2008 through December 31, 2008.
Actual Expenses
The first line for each share class of the Portfolio in the table below provides information about actual account values and actual expenses. You may use the information in this line, together with the amount you invested in the particular share class of the Portfolio, to estimate the expenses that you paid over the period. Simply divide your account value by $1,000 (for example, an $8,600 account value divided by $1,000=8.6), then multiply the result by the number in the first line under the heading entitled “Expenses Paid During Period” to estimate the expenses you paid on your account during this period.
Hypothetical Example for Comparison Purposes
The second line for each share class of the Portfolio in the table below provides information about hypothetical account values and hypothetical expenses based on the Portfolio’s actual expense ratio and an assumed rate of return of 5% per year before expenses, which is not the Portfolio’s actual return. The hypothetical account values and expenses may not be used to estimate the actual ending account balance or expenses you paid for the period. You may use this information to compare the ongoing costs of investing in the Portfolio and other funds. To do so, compare this 5% hypothetical example with the 5% hypothetical examples that appear in the shareholder reports of the other funds.
Please note that the expenses shown in the table are meant to highlight your ongoing costs only and do not reflect any fees or charges of your variable insurance product or any additional expenses that participants in certain eligible qualified plans may bear relating to the operations of their plan. Therefore, the second line for each share class in the table is useful in comparing ongoing costs only, and will not help you determine the relative total costs of owning different funds. In addition, if these other costs were included, your costs would have been higher.
| | | | | | | | | | | | | | |
Portfolio | | | | Annualized
Expense
Ratio | | | Beginning
Account Value
October 31,
2008 | | Ending
Account Value
December 31,
2008 | | Expenses Paid
During Period*
October 31, 2008
to
December 31,
2008 |
Van Eck Global Natural Resources—Class A | | Actual | | 1.00 | % | | $ | 1,000.00 | | $ | 971.00 | | $ | 4.95 |
| | Hypothetical | | 1.00 | % | | $ | 1,000.00 | | $ | 1,020.05 | | $ | 5.08 |
* Expenses paid are equal to the Portfolio’s annualized expense ratio for the period from inception, as shown above, multiplied by the average account value over the period, multiplied by the number of days since inception, divided by 366 (to reflect the period since inception).
MSF-4
Metropolitan Series Fund, Inc.
Van Eck Global Natural Resources Portfolio
Schedule of Investments as of December 31, 2008
Common Stock—87.0% of Total Net Assets
| | | | | |
| Security Description | | Shares | | Value* |
| | | | | |
| | |
Bermuda—1.9% | | | | | |
SeaDrill, Ltd. (NOK) | | 267,000 | | $ | 2,176,265 |
Weatherford International, Ltd. (a) | | 237,000 | | | 2,564,340 |
| | | | | |
| | | | | 4,740,605 |
| | | | | |
| | |
Brazil—2.3% | | | | | |
Petroleo Brasileiro S.A. (ADR) | | 236,000 | | | 5,779,640 |
| | | | | |
| | |
Canada—14.9% | | | | | |
Addax Petroleum Corp. | | 85,700 | | | 1,464,085 |
Agnico-Eagle Mines, Ltd. (b) | | 275,400 | | | 14,136,282 |
Goldcorp, Inc. | | 189,100 | | | 5,962,323 |
Kinross Gold Corp. | | 730,200 | | | 13,450,284 |
Yamana Gold, Inc. | | 268,400 | | | 2,054,581 |
| | | | | |
| | | | | 37,067,555 |
| | | | | |
| | |
Channel Islands—3.8% | | | | | |
Randgold Resources, Ltd. (ADR) | | 217,900 | | | 9,570,168 |
| | | | | |
| | |
France—2.4% | | | | | |
Total S.A. (ADR) | | 108,000 | | | 5,972,400 |
| | | | | |
| | |
Kazakhstan—0.9% | | | | | |
KazMunaiGas Exploration Production (GDR) | | 181,300 | | | 2,284,380 |
| | | | | |
| | |
Netherlands Antilles—3.3% | | | | | |
Schlumberger, Ltd. (b) | | 196,600 | | | 8,322,078 |
| | | | | |
| | |
South Africa—0.5% | | | | | |
Gold Fields, Ltd. (ADR) | | 122,000 | | | 1,211,460 |
| | | | | |
| | |
Switzerland—2.8% | | | | | |
Transocean, Ltd. (a) | | 149,900 | | | 7,082,775 |
| | | | | |
| | |
United Kingdom—5.1% | | | | | |
BHP Billiton, Plc. | | 606,600 | | | 11,426,450 |
Xstrata, Plc. | | 147,400 | | | 1,374,156 |
| | | | | |
| | | | | 12,800,606 |
| | | | | |
| | |
United States—49.1% | | | | | |
Alpha Natural Resources, Inc. (a) | | 145,900 | | | 2,362,121 |
American Water Works Co., Inc. (a) | | 125,200 | | | 2,614,176 |
Anadarko Petroleum Corp. | | 287,700 | | | 11,090,835 |
BPZ Resources, Inc. (a) | | 256,400 | | | 1,640,960 |
Cabot Oil & Gas Corp. | | 180,900 | | | 4,703,400 |
Cameron International Corp. (a) | | 209,300 | | | 4,290,650 |
Diamond Offshore Drilling, Inc. | | 57,200 | | | 3,371,368 |
Equitable Resources, Inc. | | 182,800 | | | 6,132,940 |
Exxon Mobil Corp. | | 171,200 | | | 13,666,896 |
Freeport-McMoRan Copper & Gold, Inc. | | 50,000 | | | 1,222,000 |
Frontier Oil Corp. | | 188,000 | | | 2,374,440 |
Hess Corp. | | 76,600 | | | 4,108,824 |
International Coal Group, Inc. (a) | | 705,200 | | | 1,621,960 |
Jacobs Engineering Group, Inc. (a) | | 27,000 | | | 1,298,700 |
National Oilwell Varco, Inc. (a)(b) | | 169,900 | | | 4,152,356 |
Noble Energy, Inc. | | 73,500 | | | 3,617,670 |
NRG Energy, Inc. (a) | | 218,400 | | | 5,095,272 |
| | | | | |
| Security Description | | Shares | | Value* |
|
United States—(Continued) |
Nucor Corp. | | 188,000 | | $ | 8,685,600 |
Occidental Petroleum Corp. | | 131,300 | | | 7,876,687 |
PetroHawk Energy Corp. (a) | | 294,700 | | | 4,606,161 |
Pride International, Inc. (a) | | 78,200 | | | 1,249,636 |
Quanta Services, Inc. (a) | | 136,000 | | | 2,692,800 |
Range Resources Corp. | | 120,300 | | | 4,137,117 |
Smith International, Inc. | | 73,600 | | | 1,684,704 |
Steel Dynamics, Inc. | | 104,400 | | | 1,167,192 |
Tyson Foods, Inc. (Class A) | | 580,900 | | | 5,088,684 |
Weyerhaeuser Co. | | 66,400 | | | 2,032,504 |
XTO Energy, Inc. (b) | | 282,500 | | | 9,963,775 |
| | | | | |
| | | | | 122,549,428 |
| | | | | |
Total Common Stock
(Identified Cost $213,911,647) | | | | | 217,381,095 |
| | | | | |
| | |
| Exchange Traded Funds—3.7% | | | | | |
| | |
United States—3.7% | | | | | |
SPDR Gold Trust | | 106,800 | | | 9,243,540 |
| | | | | |
Total Exchange Traded Funds
(Identified Cost $7,763,419) | | | | | 9,243,540 |
| | | | | |
| | |
| Units—0.1% | | | | | |
| | |
Canada—0.1% | | | | | |
Timberwest Forest Corp. | | 68,200 | | | 195,567 |
| | | | | |
Total Units
(Identified Cost $390,179) | | | | | 195,567 |
| | | | | |
| | |
| Short Term Investments—8.5% | | | | | |
| | |
United States—8.5% | | | | | |
AIM STIT-STIC Prime Portfolio
(Institutional Class) | | 21,226,733 | | | 21,226,733 |
| | | | | |
Total Short Term Investments
(Identified Cost $21,226,733) | | | | | 21,226,733 |
| | | | | |
Total Investments—99.3%
(Identified Cost $243,291,978) (c) | | | | | 248,046,935 |
Other assets less liabilities | | | | | 1,685,828 |
| | | | | |
| Total Net Assets—100% | | | | $ | 249,732,763 |
| | | | | |
| (b) | All or a portion of security is pledged as collateral against written options. |
| (c) | The aggregate cost of investments for federal income tax purposes as of December 31, 2008 was $243,291,978 and the composition of unrealized appreciation and depreciation of investment securities was $25,180,554 and $(20,425,597), respectively. |
| (GDR)— | Global Depository Receipt. |
| (ADR)— | An American Depositary Receipt is a certificate issued by a custodian bank representing the right to receive securities of the foreign issuer described. Trading on exchanges not located in the United States or Canada significantly influences the value of ADRs. |
*See accompanying notes to financial statements.
MSF-5
Metropolitan Series Fund, Inc.
Van Eck Global Natural Resources Portfolio
Schedule of Investments as of December 31, 2008
| | |
Ten Largest Industries as of December 31, 2008 (Unaudited) | | Percentage of
Total Net Assets |
Oil, Gas & Consumable Fuels | | 34.1% |
Metals & Mining | | 25.2% |
Energy Equipment & Services | | 14.0% |
Industrial Conglomerates | | 3.8% |
Exchange Traded Funds | | 3.7% |
Gas Utilities | | 2.5% |
Independent Power Producers & Energy Traders | | 2.0% |
Food Products | | 2.0% |
Construction & Engineering | | 1.6% |
Water Utilities | | 1.0% |
Options Written
| | | | | | | | | | | | | | | | | | | |
Options Written-Covered Calls | | Strike Price | | Expiration
Date | | Number of
Contracts | | | Premiums
Received | | | Valuation as of
12/31/2008 | | | Unrealized
Appreciation |
Agnico-Eagle Mines, Ltd. | | $ | 55 | | 1/17/2009 | | (250 | ) | | $ | (51,492 | ) | | $ | (41,250 | ) | | $ | 10,242 |
National Oilwell Varco, Inc. | | | 30 | | 1/17/2009 | | (244 | ) | | | (37,583 | ) | | | (4,880 | ) | | | 32,703 |
Schlumberger, Ltd. | | | 45 | | 1/17/2009 | | (492 | ) | | | (124,313 | ) | | | (56,580 | ) | | | 67,733 |
XTO Energy, Inc. | | | 40 | | 1/17/2009 | | (494 | ) | | | (126,399 | ) | | | (17,290 | ) | | | 109,109 |
| | | | | | | | | | | | | | | | | | | |
Net Unrealized Appreciation | | | $ | 219,787 |
| | | | | | | | | | | | | | | | | | | |
The Portfolio adopted the provisions of Statement of Financial Accounting Standards No. 157, “Fair Value Measurements” (FAS 157), effective with the beginning of the Portfolio’s fiscal year. FAS 157 establishes a framework for measuring fair value and expands disclosures about fair value measurements in financial statements. The three levels of the hierarchy under FAS 157 are described below:
Level 1 - quoted prices in active markets for identical securities
Level 2 - other significant observable inputs (including quoted prices for similar securities, interest rates, credit risk, etc.)
Level 3 - significant unobservable inputs (including the Portfolio’s own assumptions in determining the fair value of investments)
The inputs or methodology used for valuing securities are not necessarily an indication of the risk associated with investing in those securities.
The following is a summary of the inputs used to value the Portfolio’s net assets as of December 31, 2008:
| | | | | | |
| Valuation Inputs | | Investments In
Securities | | Other Financial
Instruments* |
Level 1 - Quoted Prices | | $ | 229,355,831 | | $ | 219,787 |
Level 2 - Other Significant Observable Inputs | | | 18,691,104 | | | 0 |
Level 3 - Significant Unobservable Inputs | | | 0 | | | 0 |
Total | | $ | 248,046,935 | | $ | 219,787 |
* Other financial instruments are derivative instruments not reflected in the Schedule of Investments, such as futures, forwards, swap contracts and written options, which are valued based on the unrealized appreciation/depreciation on the instrument.
*See accompanying notes to financial statements.
MSF-6
Metropolitan Series Fund, Inc.
Van Eck Global Natural Resources Portfolio
Statement of Assets & Liabilities
December 31, 2008
| | | | | | | |
Assets | | | | | | | |
Investments at value (a) | | | | | $ | 248,046,935 | |
Foreign cash at value (b) | | | | | | 8,243 | |
Receivable for: | | | | | | | |
Securities sold | | | | | | 8,156,035 | |
Fund shares sold | | | | | | 90,025 | |
Accrued interest and dividends | | | | | | 398,183 | |
Due from investment adviser | | | | | | 35,760 | |
| | | | | | | |
Total Assets | | | | | | 256,735,181 | |
Liabilities | | | | | | | |
Payable for: | | | | | | | |
Securities purchased | | $ | 6,686,133 | | | | |
Fund shares redeemed | | | 2,760 | | | | |
Withholding taxes | | | 403 | | | | |
Options written, at fair value (c) | | | 120,000 | | | | |
Accrued expenses: | | | | | | | |
Management fees | | | 158,253 | | | | |
Other expenses | | | 34,869 | | | | |
| | | | | | | |
Total Liabilities | | | | | | 7,002,418 | |
| | | | | | | |
Net Assets | | | | | $ | 249,732,763 | |
| | | | | | | |
Net assets consists of: | | | | | | | |
Capital paid in | | | | | $ | 256,806,965 | |
Undistributed net investment income | | | | | | 305,438 | |
Accumulated net realized losses | | | | | | (12,354,488 | ) |
Unrealized appreciation on investments, options and foreign currency | | | | | | 4,974,848 | |
| | | | | | | |
Net Assets | | | | | $ | 249,732,763 | |
| | | | | | | |
| Computation of offering price: | | | | | | | |
Class A | | | | | | | |
Net asset value and redemption price per share ($249,732,763 divided by 25,711,262 shares outstanding) | | | | | $ | 9.71 | |
| | | | | | | |
(a) Identified cost of investments | | | | | $ | 243,291,978 | |
| | | | | | | |
(b) Identified cost of foreign cash | | | | | $ | 8,139 | |
| | | | | | | |
(c) Premiums received on written options | | | | | $ | 339,787 | |
| | | | | | | |
Statement of Operations
For the Period October 31, 2008(a) to December 31, 2008
| | | | | | | | |
Investment Income | | | | | �� | | | |
Dividends | | | | | | $ | 703,521 | (b) |
Interest | | | | | | | 103,448 | |
| | | | | | | | |
| | | | | | | 806,969 | |
Expenses | | | | | | | | |
Management fees | | $ | 312,346 | | | | | |
Directors’ fees and expenses | | | 7,154 | | | | | |
Custodian | | | 6,097 | | | | | |
Audit and tax services | | | 35,800 | | | | | |
Legal | | | 60,264 | | | | | |
Miscellaneous | | | 4,565 | | | | | |
| | | | | | | | |
Total expenses | | | 426,226 | | | | | |
Expense reimbursements | | | (35,760 | ) | | | | |
Expense reductions | | | (567 | ) | | | 389,899 | |
| | | | | | | | |
Net Investment Income | | | | | | | 417,070 | |
| | | | | | | | |
Realized and Unrealized Gain (Loss) | | | | | | | | |
| Realized loss on: | | | | | | | | |
Investments—net | | | (12,355,055 | ) | | | | |
Foreign currency transactions—net | | | (111,086 | ) | | | (12,466,141 | ) |
| | | | | | | | |
| Change in unrealized appreciation on: | | | | | | | | |
Investments—net | | | 4,754,957 | | | | | |
Foreign currency transactions—net | | | 104 | | | | | |
Options—net | | | 219,787 | | | | 4,974,848 | |
| | | | | | | | |
Net loss | | | | | | | (7,491,293 | ) |
| | | | | | | | |
Net Decrease in Net Assets From Operations | | | | | | $ | (7,074,223 | ) |
| | | | | | | | |
| (a) | Commencement of operations. |
| (b) | Net of foreign taxes of $13,961. |
See accompanying notes to financial statements.
MSF-7
Metropolitan Series Fund, Inc.
Van Eck Global Natural Resources Portfolio
Statements of Changes in Net Assets
| | | | |
| | | Period ended
December 31,
2008(a) | |
From Operations | | | | |
Net investment income | | $ | 417,070 | |
Net realized loss | | | (12,466,141 | ) |
Change in unrealized appreciation | | | 4,974,848 | |
| | | | |
Decrease in net assets from operations | | | (7,074,223 | ) |
| | | | |
Increase in net assets from capital share transactions | | | 256,806,986 | |
| | | | |
Net increase in net assets | | | 249,732,763 | |
| |
Net Assets | | | | |
End of the period | | $ | 249,732,763 | |
| | | | |
Undistributed Net Investment Income | | | | |
End of the period | | $ | 305,438 | |
| | | | |
Other Information:
Capital Shares
Transactions in capital shares were as follows:
| | | | | | | |
| | | Period ended
December 31, 2008(a) | |
| | | Shares | | | $ | |
Sales | | 25,824,862 | | | $ | 257,814,423 | |
Redemptions | | (113,600 | ) | | | (1,007,437 | ) |
| | | | | | | |
Net increase | | 25,711,262 | | | $ | 256,806,986 | |
| | | | | | | |
| (a) | Commencement of operations was October 31, 2008. |
See accompanying notes to financial statements.
MSF-8
Metropolitan Series Fund, Inc.
Van Eck Global Natural Resources Portfolio
Financial Highlights
| | | | |
| | | Class A | |
| | | Period ended
December 31,
2008(a) | |
Net Asset Value, Beginning of Period | | $ | 10.00 | |
| | | | |
Income From Investment Operations | | | | |
Net investment income | | | 0.02 | (b) |
Net realized and unrealized loss of investments | | | (0.31 | ) |
| | | | |
Total from investment operations | | | (0.29 | ) |
| | | | |
Net Asset Value, End of Period | | $ | 9.71 | |
| | | | |
Total Return (%) | | | (2.9 | )(c) |
Ratio of operating expenses to average net assets before expense reductions (%) | | | 1.00 | (d) |
Ratio of operating expenses to average net assets after expense reductions (%) (e) | | | 1.00 | (d) |
Ratio of operating expenses to average net assets without giving effect to the contractual expense agreement would have been (%) (f) | | | 1.09 | (d) |
Ratio of net investment income to average net assets (%) | | | 1.07 | (d) |
Portfolio turnover rate (%) | | | 125 | (d) |
Net assets, end of period (000) | | $ | 249,733 | |
| (a) | Commencement of operations was October 31, 2008. |
| (b) | Per share amount is based on average shares outstanding during the period. |
| (c) | Periods less than one year are not computed on an annualized basis. |
| (d) | Computed on an annualized basis. |
| (e) | The Portfolio has entered into arrangements with certain brokers who paid a portion of the Portfolio’s expenses. |
| (f) | See Note 4 of the Notes to Financial Statements. |
See accompanying notes to financial statements.
MSF-9
Metropolitan Series Fund, Inc.
Van Eck Global Natural Resources Portfolio
Notes to Financial Statements—December 31, 2008
Metropolitan Series Fund, Inc. (the “Fund”) is organized as a corporation under the laws of Maryland pursuant to Articles of Incorporation filed on November 23, 1982, as amended, and registered under the Investment Company Act of 1940, as amended (the “1940 Act”), as an open-end investment company. The Fund is a “series” type of mutual fund, which issues separate series of stock. Each series represents an interest in a separate portfolio of Fund investments. The Van Eck Global Natural Resources Portfolio (the “Portfolio”) is a non-diversified series of the Fund. Shares in the Fund are not offered directly to the general public and are currently available only to separate accounts established by Metropolitan Life Insurance Company (“MetLife”), New England Life Insurance Company, General American Life Insurance Company (“General American”), The MetLife Investors Group of Insurance Companies, MetLife Insurance Company of Connecticut and other affiliated insurance companies (collectively, the “Insurance Companies”) and to certain eligible qualified retirement plans (“Qualified Plans”), as an investment vehicle for variable life insurance, group annuity or variable annuity products of these insurance companies or Qualified Plans, although the Portfolio is not available to all such separate accounts and Qualified Plans.
| 2. | SIGNIFICANT ACCOUNTING POLICIES: |
The preparation of financial statements in conformity with accounting principles generally accepted in the United States of America (“GAAP”) requires management to make estimates and assumptions that affect the reported amounts of assets and liabilities and disclosure of contingent assets and liabilities as of the date of the financial statements and the reported amounts of income and expenses during the reporting period. Actual results could differ from those estimates.
The following is a summary of significant accounting policies consistently followed by the Portfolio in the preparation of its financial statements. The policies are in conformity with GAAP.
Investment Valuation:
Debt securities (other than short term obligations with a remaining maturity of sixty days or less) are generally valued on the basis of evaluated or composite bid quotations obtained by independent pricing services and/or brokers and dealers selected by the relevant subadviser pursuant to authorization of the Board of Directors of the Fund (the “Board” or “Directors”). Such quotations take into account appropriate factors such as institutional-sized trading in similar groups of securities, yield, quality, coupon rate, maturity, type of issue, trading characteristics and other data. Short term obligations with a remaining maturity of sixty days or less are valued at amortized cost which approximates fair market value.
Equity securities traded on a national securities exchange or other exchanges are valued at their last sale price on the principal trading market. Equity securities traded on the NASDAQ National Market System are valued at the NASDAQ Official Closing Price (the “NOCP”). The NOCP is the last reported sale price if the last reported sale price falls between the spread of the last reported bid and asked prices. If the last reported bid and asked prices are above the last reported sale price, the NOCP will be the last reported bid price. If the last reported bid and asked prices are below the last reported sale price, the NOCP will be the last reported asked price. Equity securities traded on a national securities exchange or other exchanges or on the NASDAQ National Market System for which there is no reported sale during the day are valued at the last reported bid price. A security that is listed or traded on more than one exchange is valued at the quotation on the exchange determined to be the primary market for that security by the Board or its delegates. If no closing price is available, then such securities are valued by using the last reported bid price. Equity securities traded over-the-counter are valued at the last reported sales price.
If no current market value quotation is readily available or reliable for a portfolio security, fair value will be determined in accordance with procedures established by and under the general supervision of the Board. When the Portfolio uses fair value pricing, it may take into account any factors it deems appropriate. The value of securities used by the Portfolio to calculate its net asset value may differ from quoted or published prices for the same securities. Fair value pricing involves subjective judgments and the fair value determined for a security may be materially different than the value that could be realized upon the sale of that security.
The Portfolio expects to use fair value pricing for securities primarily traded on U.S. exchanges only under very limited circumstances. For example, the Portfolio may use fair value pricing if the exchange on which a security is traded closes early or trading in the security is suspended.
Securities traded primarily on an exchange outside of the United States which closes before the close of the New York Stock Exchange will be valued at the last sales price on that non-U.S. exchange. Securities traded primarily on an exchange outside of the United States for which there is no reported sale during the day are valued at the mean between the last reported bid and
MSF-10
Metropolitan Series Fund, Inc.
Van Eck Global Natural Resources Portfolio
Notes to Financial Statements—December 31, 2008—(Continued)
asked prices. However, because most foreign markets close well before the Portfolio values its securities (typically at 4 p.m. Eastern Time), the earlier close of these foreign markets gives rise to the possibility that significant events, including broad market moves, may have occurred after these foreign markets close but before the Portfolio values its securities. To account for this, the Portfolio may frequently value many of its foreign equity securities using fair value prices based on third party vendor modeling tools.
Forward foreign currency exchange contracts are valued based on the mean between closing bid and asked prices of the forward currency contract rates in the London foreign exchange markets on a daily basis as provided by a reliable bank or dealer.
Options, whether on securities, indices, futures contracts, or otherwise, are valued at the last sales price available as of the close of business on the day of valuation or, if there is no such sale price available, at the mean between the bid and asked prices. Options on currencies are valued at the spot price each day.
The value of futures contracts will be the sum of the margin deposit plus or minus the difference between the value of the futures contract on each day the net asset value is calculated and the value on the date the futures contract originated, value being that established on a recognized commodity exchange, or by reference to other customary sources, with gain or loss being realized when the futures contract closes or expires.
Subject to the Board’s oversight, the Board has delegated the day-to-day oversight of pricing matters, including determinations in good faith under the Fund’s procedures the fair value of securities for which current market quotations are not readily available to the subadviser of the Portfolio.
Investment Transactions and Related Investment Income:
Portfolio security transactions are recorded on the trade date. Dividend income is recorded on the ex-dividend date or, for certain foreign securities, when notified. Interest income, which includes amortization of premium and accretion of discount on debt securities, is recorded on the accrual basis. Realized gains and losses on investments and unrealized appreciation and depreciation are determined on the identified cost basis, which is the same basis used for federal income tax purposes.
Repurchase Agreements:
The Portfolio, through the custodian or a subcustodian, receives delivery of the underlying securities collateralizing repurchase agreements. The Portfolio requires the custodian to take possession, to have legally segregated in the Federal Reserve Book Entry System, or to have segregated within the custodian’s vault, all securities held as collateral for repurchase agreements. It is the Portfolio’s policy that the market value of the collateral be at least equal to 100% of the repurchase price in the case of a repurchase agreement of one-day duration and 102% on all other repurchase agreements. The Portfolio’s subadviser is responsible for determining that the value of the collateral is at all times at least equal to the repurchase price. In connection with transactions in repurchase agreements, if the seller defaults and the value of the collateral declines or if the seller enters an insolvency proceeding, realization of the collateral by the Portfolio may be delayed, limited or wholly denied.
Foreign Currency Translation:
The books and records of the Portfolio are maintained in U.S. dollars. The values of securities, currencies and other assets and liabilities denominated in currencies other than U.S. dollars are translated into U.S. dollars based upon foreign exchange rates prevailing at the end of the period. Purchases and sales of investment securities, income and expenses are translated on the respective dates of such transactions. Since the values of investment securities are presented at the foreign exchange rates prevailing at the end of the period, it is not practical to isolate that portion of the results of operations arising from changes in exchange rates from that portion of the results of operations reflecting fluctuations arising from changes in market prices of the investment securities. Such fluctuations are included in the net realized and unrealized gain or loss on investments.
Net realized foreign exchange gains or losses arise from sales of foreign currency, currency gains or losses realized between the trade and settlement dates on securities transactions, and the difference between the amounts of dividends, interest, and foreign withholding taxes recorded by the Portfolio and the U.S. dollar equivalent of the amounts actually received or paid by the Portfolio. Net unrealized foreign exchange gains and losses arise from changes in the value of assets and liabilities, other than investment securities, resulting from changes in the exchange rate.
Forward Foreign Currency Exchange Contracts:
The Portfolio may enter into forward foreign currency exchange contracts primarily to hedge against foreign currency exchange rate risks on its non-U.S. dollar denominated investment securities. When entering into a forward currency contract, the Portfolio
MSF-11
Metropolitan Series Fund, Inc.
Van Eck Global Natural Resources Portfolio
Notes to Financial Statements—December 31, 2008—(Continued)
agrees to receive or deliver a fixed quantity of foreign currency for an agreed-upon price on an agreed future date. These contracts are valued daily and the Portfolio’s net equity therein, representing unrealized gain or loss on the contracts as measured by the difference between the foreign exchange rates at the dates of entry into the contracts and the forward rates at the settlement date, is included in the Statement of Assets and Liabilities. Realized and unrealized gains and losses are included in the Statement of Operations. These instruments involve market and/or credit risk in excess of the amount recognized in the Statement of Assets and Liabilities. Risks arise from the possible inability of counterparties to meet the terms of their contracts and from movement in currency and securities values and interest rates.
Futures Contracts:
The Portfolio may buy and sell futures contracts (on recognized exchanges) as a hedge, to maintain exposure to the broad equity markets or to enhance return. Futures contracts are agreements to buy or sell a security, or deliver a final cash settlement price in connection with an index, interest rate, currency, or other contracts not calling for physical delivery, for a set price in the future. The Portfolio must post an amount equal to a portion of the total market value of the futures contract as futures variation margin, which is returned when the Portfolio’s obligations under the contract have been satisfied. From time to time thereafter, the Portfolio may have to post variation margin to maintain this amount as the market value of the contract fluctuates. Risks of entering into futures contracts (and related options) include the possibility that there may be an illiquid market and that a change in the value of the contract or option may not correlate with changes in the value of the underlying securities.
Options:
The Portfolio may use options to hedge against changes in values of securities the Portfolio owns or expects to purchase, to maintain exposure to the broad equity markets or to enhance return. Writing puts or buying calls tends to increase the Portfolio’s exposure to the underlying instrument and writing calls or buying puts tends to decrease the Portfolio’s exposure to the underlying instrument, and can be used to hedge other Portfolio investments. For options purchased to hedge the Portfolio’s investments, the potential risk to the Portfolio is that the change in value of options contracts may not correspond to the change in value of the hedged instruments. In addition, losses may arise from changes in the value of the underlying instruments, if there is an illiquid secondary market, or if the counterparty is unable to perform. The maximum loss for purchased options is limited to the premium initially paid for the option. For options written by the Portfolio, the maximum loss is not limited to the premium initially received for the option.
The main risk associated with purchasing an option is that the option expires without being exercised. In this case, the option expires worthless and the premium paid for the option is considered the loss. The risk associated with writing a call option is that the Portfolio may forgo the opportunity for a profit if the market value of the underlying position increases and the option is exercised. The risk in writing a put option is that the Portfolio may incur a loss if the market value of the underlying position decreases and the option is exercised. In addition, the Portfolio risks not being able to enter into a closing transaction for the written option as the result of an illiquid market.
“When-Issued” Securities:
Purchasing securities “when-issued” is a forward commitment by the Portfolio to buy a security. The estimated amount of the Portfolio’s payment obligation and the security’s interest rate are determined when the commitment is made, even though no interest accrues until the security is issued, which is generally 15 to 120 days later. The Portfolio will segregate liquid assets with its custodian sufficient at all times to satisfy these commitments. If the value of the security is less when delivered than when the commitment was made, the Portfolio will suffer a loss.
Fund Concentration:
The Portfolio may concentrate its investments in companies which are significantly engaged in the exploration, development, production and distribution of gold and other natural resources such as strategic and other metals, minerals, forest products, oil, natural gas and coal and by investing in gold bullion and coins. Since the Portfolio may so concentrate, it may be subject to greater risks and market fluctuations than other more diversified portfolios. The production and marketing of gold and other natural resources may be affected by actions and changes in governments. In addition, gold and natural resources may be cyclical in nature.
Additionally, the investments by the Portfolio in foreign securities may involve risks not present in domestic investments. Since securities may be denominated in foreign currencies and may require settlement in foreign currencies and pay interest or
MSF-12
Metropolitan Series Fund, Inc.
Van Eck Global Natural Resources Portfolio
Notes to Financial Statements—December 31, 2008—(Continued)
dividends in foreign currencies, changes in the relationship of these foreign currencies to the U.S. dollar can significantly affect the value of the investments and earnings of the Portfolio. Foreign investments may also subject the Portfolio to foreign government exchange restrictions, expropriation, taxation or other political, social or economic developments, all of which could affect the market and/or credit risk of the investments. In addition to the risks described above, risks may arise from forward foreign currency contracts with respect to the potential inability of counterparties to meet the terms of their contracts.
Federal Income Taxes:
It is the Portfolio’s policy to comply with the requirements of the Internal Revenue Code of 1986, as amended (the “Code”), and regulations thereunder, applicable to regulated investment companies and to distribute, with respect to each taxable year, all of its taxable income to shareholders. Therefore, no federal income tax provision is required. The Portfolio is subject to the provisions of the Financial Accounting Standards Board Interpretation (“FASB”) No. 48, Accounting for Uncertainties in Income Taxes (FIN 48). FIN 48 sets forth a minimum threshold for financial statement recognition of the benefit of a tax position taken or expected to be taken in a tax return. The implementation of FIN 48 did not result in any unrecognized tax benefits in the accompanying financial statements. Each of the Portfolio’s federal tax returns for the prior three fiscal years remains subject to examination by the Internal Revenue Service.
As of December 31, 2008, the Portfolio had no capital loss carryforwards.
As of December 31, 2008, the components of distributable earnings (accumulated losses) on a federal income tax basis were as follows:
| | | | | | | | | | | | | |
Undistributed
Ordinary
Income | | Undistributed
Long Term
Gain | | Unrealized
Appreciation | | Loss
Carryforwards | | Total |
| $ | 305,818 | | $ | — | | $ | 4,974,848 | | $ | — | | $ | 5,280,666 |
Pursuant to Federal income tax regulations applicable to investment companies, the Portfolio has elected to treat net capital losses realized between November 1 and December 31 of each year as occurring on the first day of the following tax year. For the year ended December 31, 2008, the following amounts of realized capital and currency losses reflected in the accompanying financial statements will not be recognized for Federal income tax purposes until January 1, 2009:
| | | | |
Currency | | Capital | |
$— | | $ | (12,354,488 | ) |
Dividends and Distributions to Shareholders:
The Portfolio records dividends and distributions on the ex-dividend date. Net realized gains from security transactions (if any) are generally distributed annually to shareholders. The timing and characterization of certain income and capital gains distributions are determined in accordance with federal tax regulations that may differ from GAAP. Permanent book and tax basis differences relating to shareholder distributions will result in reclassification between under/over distributed net investment income, accumulated net realized gains/losses and paid in capital.
Expense Reductions:
Certain Portfolio trades are directed to brokers who paid a portion of the Portfolio’s expenses. Amounts paid for the Portfolio are shown as expense reductions in the Statement of Operations.
| 3. | INVESTMENT TRANSACTIONS: |
For the period ended December 31, 2008, purchases and sales of securities (excluding short term investments) for the Portfolio were as follows:
| | | | | | | | | | |
| Purchases | | Sales |
U.S. Government | | Other | | U.S. Government | | Other |
| $ | 0 | | $ | 280,121,636 | | $ | 0 | | $ | 45,567,258 |
MSF-13
Metropolitan Series Fund, Inc.
Van Eck Global Natural Resources Portfolio
Notes to Financial Statements—December 31, 2008—(Continued)
Options Written:
The Portfolio transactions in options written during the year ended December 31, 2008 were as follows:
| | | | | | | |
Call Options | | Number of
contracts | | | Premiums
received | |
Options outstanding October 31, 2008 | | 0 | | | $ | 0 | |
Options written | | 1,480 | | | | 339,787 | |
Options closed | | 0 | | | | 0 | |
Options expired | | (0 | ) | | | (0 | ) |
| | | | | | | |
Options outstanding December 31, 2008 | | 1,480 | | | $ | 339,787 | |
| | | | | | | |
| 4. | INVESTMENT MANAGEMENT FEES AND OTHER TRANSACTIONS WITH AFFILIATES: |
Investment Management Agreement:
MetLife Advisers is the investment adviser to the Portfolio. The Fund has entered into an investment management agreement with MetLife Advisers with respect to the Portfolio. For providing investment management services to the Portfolio, MetLife Advisers receives monthly compensation at the following annual rates:
| | | | |
Management
Fees earned by
MetLife Advisers
for the period ended
December 31, 2008 | | Annual
percentage
rates paid to
MetLife Advisers | | Based on Portfolios
average daily net asset
levels |
$312,346 | | 0.800% | | Of the first $250 million |
| | 0.775% | | Of the next $750 million |
| | 0.750% | | On amounts in excess of $1.0 billion |
Certain officers and directors of the Fund may also be officers of MetLife Advisers; however, such officers and directors receive no compensation from the Fund.
MetLife Advisers has entered into an investment subadvisory agreement with respect to the Portfolio. Van Eck Associates Corp. is compensated by MetLife Advisers to provide subadvisory services for the Portfolio.
Expense Agreement:
Pursuant to an expense agreement relating to each class of the Portfolio, MetLife Advisers has agreed, from October 31, 2008 to April 30, 2009, to waive a portion of its advisory fees or pay a portion of the other operating expenses (not including brokerage costs, interest, taxes, or extraordinary expenses) to the extent total operating expenses exceed stated annual expense limits (based on the Portfolio’s then current fiscal year). For the Portfolio, this subsidy, is subject to the obligation of each class of the Portfolio to repay MetLife Advisers in future years, if any, when a class’ expenses fall below the stated expense limit pertaining to that class that was in effect at the time of the subsidy in question. Such deferred expenses may be charged to a class in a subsequent year to the extent that the charge does not cause the total expenses in such subsequent year to exceed the class’ stated expense limit that was in effect at the time of the subsidy in question; provided, however, that no class of the Portfolio is obligated to repay any expense paid by MetLife Advisers more than five years after the end of the fiscal year in which such expense was incurred.
The expense limit (annual rate as a percentage of each class of the Portfolio’s net average daily net assets) in effect from October 31, 2008 to April 30, 2009 is 1.00% for Class A.
As of December 31, 2008, the amount of expenses deferred in 2008 subject to repayment until December 31, 2013 was $35,760.
| 5. | MARKET AND CREDIT RISK: |
In the normal course of business, the Portfolio invests in securities and enters into transactions where risks exist due to fluctuations in the market (market risk) or failure of the other party to a transaction to perform (credit risk). The value of securities held by the Portfolio may decline in response to certain events, including those directly involving the companies whose securities are owned by the Portfolio; conditions affecting the general economy; overall market changes; local, regional or global political, social or economic instability; and currency and interest rate and price fluctuations. Similar to credit risk, the Portfolio may be exposed to counterparty risk, or the risk that an entity with which the Portfolio has unsettled or open transactions may default. Financial assets, which potentially expose the Portfolio to credit and counterparty risks, consist principally of
MSF-14
Metropolitan Series Fund, Inc.
Van Eck Global Natural Resources Portfolio
Notes to Financial Statements—December 31, 2008—(Continued)
investments and cash due from counterparties. The extent of the Portfolio’s exposure to credit and counterparty risks in respect to these financial assets approximates their value as recorded in the Portfolio’s Statements of Assets and Liabilities.
| 6. | RECENT ACCOUNTING PRONOUNCEMENTS: |
In March 2008, the FASB issued Statement of Financial Accounting Standards No. 161, Disclosures about Derivative Instruments and Hedging Activities (“FAS 161”), an amendment of FASB Statement No. 133. FAS 161 requires enhanced disclosures about (a) how and why an entity uses derivative instruments, (b) how derivative instruments and hedging activities are accounted for, and (c) how derivative instruments and related hedging activities affect a fund’s financial position, financial performance, and cash flows. Management does not believe the adoption of FAS 161 will materially impact the financial statement amounts, but will require additional disclosures. This will include qualitative and quantitative disclosures on derivative positions existing at period end and the effect of using derivatives during the reporting period. FAS 161 is effective for financial statements issued for fiscal years and interim periods beginning after November 15, 2008. Management is currently evaluating the impact the adoption of FAS 161 will have on the Portfolio’s financial statement disclosures.
MSF-15
Metropolitan Series Fund, Inc.
Van Eck Global Natural Resources Portfolio
Report of Independent Registered Public Accounting Firm
To the Shareholders and Board of Directors of Metropolitan Series Fund, Inc.:
We have audited the accompanying statement of assets and liabilities, including the schedule of investments, of the Van Eck Global Natural Resources Portfolio (one of the portfolios constituting the Metropolitan Series Fund, Inc.) (the “Fund”) as of December 31, 2008, and the related statement of operations, the statement of changes in net assets and the financial highlights for the period from October 31, 2008 (commencement of operations) through December 31, 2008. These financial statements and financial highlights are the responsibility of the Fund’s management. Our responsibility is to express an opinion on these financial statements and financial highlights based on our audit.
We conducted our audit in accordance with the standards of the Public Company Accounting Oversight Board (United States). Those standards require that we plan and perform the audit to obtain reasonable assurance about whether the financial statements and financial highlights are free of material misstatement. The Fund is not required to have, nor were we engaged to perform, an audit of its internal control over financial reporting. Our audit included consideration of internal control over financial reporting as a basis for designing audit procedures that are appropriate in the circumstances, but not for the purpose of expressing an opinion on the effectiveness of the Fund’s internal control over financial reporting. Accordingly, we express no such opinion. An audit also includes examining, on a test basis, evidence supporting the amounts and disclosures in the financial statements, assessing the accounting principles used and significant estimates made by management, as well as evaluating the overall financial statement presentation. Our procedures included confirmation of securities owned as of December 31, 2008, by correspondence with the custodian and brokers; where replies were not received from brokers, we performed other auditing procedures. We believe that our audit provides a reasonable basis for our opinion.
In our opinion, the financial statements and financial highlights referred to above present fairly, in all material respects, the financial position of the Van Eck Global Natural Resources Portfolio of the Metropolitan Series Fund, Inc. as of December 31, 2008, the results of its operations, the changes in its net assets and the financial highlights for the period from October 31, 2008 (commencement of operations) through December 31, 2008, in conformity with accounting principles generally accepted in the United States of America.
Deloitte & Touche LLP
Boston, Massachusetts
February 20, 2009
MSF-16
Metropolitan Series Fund, Inc.
Directors and Officers
The Fund’s Directors review actions of the Fund’s investment adviser and subadvisers, and decide upon matters of general policy. The Fund’s officers supervise the daily business operations of the Fund. The Board of Directors and the Fund’s officers are listed below. Each Director is responsible for overseeing all 38 Portfolios of the Fund. There is no limit to the term a Director may serve. Directors serve until their resignation, retirement or removal in accordance with the Fund’s organizational documents and policies adopted by the Board from time to time. Officers hold office at the pleasure of the Board or until the election or appointment and the qualification of a successor. The address of the Directors and officers is c/o Metropolitan Series Fund, Inc., 501 Boylston Street, Boston, MA 02116.
Interested Directors(1)
Each Director below is an “interested person” (as defined by the 1940 Act) with respect to the Fund in that Ms. Forget is an employee of MetLife and Mr. Typermass is a former employee of MetLife and owns securities issued by MetLife, Inc., the ultimate parent company of MetLife Advisers.
| | | | | | | | |
Name, Address and Age | | Current
position(s)
with Fund | | Position(s)
held since | | Principal occupations
over past five years, including other directorships(2) | | Number of
Portfolios in
Fund Complex
Overseen by
Director(3) |
Elizabeth M. Forget Age: 42 | | Director, Chairman of the Board, President and Chief Executive Officer | | 2006 | | Senior Vice President (since 2007), MetLife, Inc.; President, Met Investors Advisory, LLC; Trustee and President, Met Investors Series Trust; Executive Vice President, MetLife Investors Group, Inc.; President, Chief Executive Officer and Chair of the Board of Managers (since 2006), MetLife Advisers; President, Met Investors Advisory, LLC. | | 87 |
| | | | |
Arthur G. Typermass Age: 71 | | Director | | 1998 | | Formerly, Senior Vice President and Treasurer, MetLife. | | 38 |
Non-Interested Directors(1)
Each Director below is not an “interested person” (as defined by the 1940 Act) with respect to the Fund (collectively, the “Independent Directors”).
| | | | | | | | |
Name, Address and Age | | Current
position(s)
with Fund | | Position(s)
held since | | Principal occupations
over past five years, including other directorships(2) | | Number of
Portfolios in
Fund Complex
Overseen by
Director(3) |
Steve A. Garban† Age: 71 | | Director | | 1985 | | Formerly, Chief Financial Officer, Senior Vice President Finance and Operations and Treasurer (Emeritus), The Pennsylvania State University. | | 38 |
| | | | |
Linda B. Strumpf Age: 61 | | Director | | 2000 | | Vice President and Chief Investment Officer, Ford Foundation. | | 38 |
| | | | |
Michael S. Scott Morton† Age: 71 | | Director | | 1993 | | Jay W. Forrester Professor of Management (Emeritus) at Sloan School of Management, MIT. | | 38 |
| | | | |
H. Jesse Arnelle Age: 75 | | Director | | 2001 | | Formerly, Counsel, Womble Carlyle Sandrie & Rice; Director, Textron Inc. (global multi- industry company)*; formerly, Director, Gannet Co. Inc. (diversified news and information company)*; formerly, Director, Eastman Chemical Company (global chemical company)*; formerly, Director, Waste Management, Inc.*; formerly, Director, Armstrong Holdings Inc. (parent company of floor and ceiling products business)*; formerly, Director, FPL Group Inc. (public utility holding company)*; Director, URS Corporation (engineering design services firm)*. | | 38 |
MSF-17
Metropolitan Series Fund, Inc.
Directors and Officers—(Continued)
| | | | | | | | |
Name, Address and Age | | Current
position(s)
with Fund | | Position(s)
held since | | Principal occupations
over past five years, including other directorships(2) | | Number of
Portfolios in
Fund Complex
Overseen by
Director(3) |
Nancy Hawthorne Age: 57 | | Director | | 2003 | | Chief Executive Officer, Clerestory LLC (corporate financial advisor); Director, Avid Technologies (computer software company)*; formerly, Chairman of the Board of Avid Technologies; formerly, Board of Advisors, L. Knife & Sons, Inc. (beverage distributor); formerly, Trustee, New England Zenith Fund (“Zenith Fund”)**; formerly, Chief Executive Officer and Managing Partner, Hawthorne, Krauss and Associates (corporate financial advisor); formerly, Chief Financial Officer and Executive Vice President, Continental Cablevision, subsequently renamed MediaOne (cable television company); formerly, Director, Life F/X, Inc.; formerly, Chairman of the Board, WorldClinic (distance medicine company); formerly, Director, Perini Corporation (construction company)*; formerly, Director, CGU (property and casualty insurance company); formerly, Director, Beacon Power Corporation (energy company)*. | | 38 |
| | | | |
John T. Ludes Age: 72 | | Director | | 2003 | | President, LFP Properties (consulting firm); Formerly, Trustee, Zenith Fund**; formerly, Vice Chairman, President and Chief Operating Officer, Fortune Brands/American Brands (global conglomerate); formerly, President and CEO, Acushnet Company (athletic equipment company). | | 38 |
Officers(1)
| | | | | | | | |
Name and address | | Age | | Current
position(s)
with Fund | | Position(s)
held since | | Principal occupations over past five years(2) |
| Jeffrey L. Bernier | | 37 | | Senior Vice President | | 2008 | | Vice President (since 2008), MetLife, Inc.; Vice President (since 2008), MetLife; Senior Vice President (since 2008), MetLife Advisers; formerly, Director and Senior Investment Analyst (2004 to 2007), John Hancock Financial Services; formerly, Assistant Vice President (2000 to 2001), Wachovia Securities. |
| | | | |
| Alan C. Leland | | 56 | | Senior Vice President | | 2005 | | Treasurer and Chief Financial Officer, MetLife Advisers, LLC; Treasurer (since 2005), Met Investors Advisory, LLC; Vice President (since 2004), Met Investors Advisory, LLC; Vice President (since 2003), MetLife, Inc.; Vice President, MetLife; Senior Vice President, NELICO. |
| | | | |
| Peter Duffy | | 53 | | Vice President
and Treasurer | | 2000 | | Senior Vice President, MetLife Advisers; Second Vice President (since 2003), NELICO; Vice President, MetLife (since 2004); Vice President (since 2004), MetLife, Inc.; formerly, Vice President and Treasurer, Zenith Fund**. |
| | | | |
| Jeffrey P. Halperin | | 41 | | Chief
Compliance Officer | | 2007 | | Vice President (since 2006), MetLife, Inc.; Vice President (since 2006), MetLife; Chief Compliance Officer (since 2006), Met Investors Series Trust, MetLife Advisers, Met Investors Advisory, LLC and MetLife Investment Advisors Company, LLC. |
| * | Indicates a directorship with a registered investment company or a company subject to the reporting requirements of the Securities Exchange Act of 1934, as amended. |
| ** | The Zenith Fund deregistered with the Securities and Exchange Commission (“SEC”) in 2004. |
| (†) | Served as a trustee, director and/or officer of one or more of the following companies, each of which had a direct or indirect advisory relationship with MetLife Advisers or its affiliates prior to January 31, 2005: State Street Research Financial Trust, State Street Research Income Trust, State Street Research Money Market Trust, State Street Research Institutional Funds, State Street Research Capital Trust, State Street Research Master Investment Trust, State Street Research Equity Trust, State Street Research Securities Trust and State Street Research Exchange Trust (collectively, the “State Street Research Funds”). |
| (1) | During the period shown, each Director of the Fund served as a Trustee of Metropolitan Series Fund II, a registered investment company that ceased investment operations in June of 2008 and has applied for deregistration under the Investment Company Act of 1940. During this period, each officer of the Fund served in the same position with Metropolitan Series Fund II. |
| (2) | Previous positions during the past five years with the Fund; Met Investors Series Trust; MetLife; MetLife, Inc.; MetLife Advisers; Met Investors Advisory, LLC; Zenith Fund; NELICO; or New England Securities Corporation are omitted if not materially different. |
| (3) | The Fund Complex includes the Fund (38 portfolios) and Met Investors Series Trust (49 portfolios). |
MSF-18
Metropolitan Series Fund, Inc.
Van Eck Global Natural Resources Portfolio
Board Approval of Advisory and Subadvisory Agreements
The Fund’s Contract Review Committees of the Board of Directors (the “Board” or the “Directors”) typically meet in early fall to review the Portfolios’ advisory agreements (the “Advisory Agreements”) and subadvisory agreements (the “Subadvisory Agreements,” and, together with the Advisory Agreements, the “Agreements”) and determine whether to recommend that the full Board approve the continuation of the Agreements for an additional one-year period. (Following the initial approval of an Agreement for a new Portfolio or with a new adviser or subadviser, such annual reviews are not required until 2 years following the execution of such Agreement.) After each Committee has made its recommendations, the full Board, including the Independent Directors, determines whether to approve the continuation of each of the Agreements. In addition, the Board, including the Independent Directors, considers matters bearing on the Agreements at most of its other meetings throughout the year and regularly interviews various individuals at MetLife Advisers responsible for the management of the Portfolios. The Directors also interview selected investment managers and other professionals at the subadvisers at various times throughout the year.
The Directors receive all materials that they or MetLife Advisers, the Fund’s investment adviser, and the subadvisers believe to be reasonably necessary for the Directors to evaluate the Agreements and determine whether to approve the continuation of the Agreements. These materials generally include, among other items, (i) information on the investment performance of the Portfolios and the performance of peer groups of funds and the Portfolios’ performance benchmarks, (ii) information on the Portfolios’ advisory and subadvisory fees and other expenses, including information comparing the Portfolios’ expenses to those of peer groups of funds and information about any applicable expense caps and fee “breakpoints,” (iii) sales and redemption data, (iv) information related to the profitability of the Agreements to MetLife Advisers and certain of the subadvisers, and potential “fall-out” or ancillary benefits that MetLife Advisers, the subadvisers or their affiliates may receive as a result of their relationships with the Fund and (v) information obtained through the subadvisers’ responses to certain requests from MetLife Advisers and the Directors and MetLife Advisers’ responses to requests from the Directors. The Directors may also consider other information such as (vi) MetLife Advisers’ and the subadvisers’ financial results and condition, (vii) each Portfolio’s investment objectives and strategies and the size, education and experience of the investment staffs of MetLife Advisers and the relevant subadvisers and their use of technology and external research, (viii) the allocation of the Portfolios’ brokerage, if any, including allocations to brokers affiliated with the subadvisers and the use of “soft” commission dollars to pay Portfolio expenses and to pay for research and other similar services, (ix) the resources devoted to, and the record of compliance with, the Portfolios’ investment policies and restrictions, policies on personal securities transactions and other compliance policies, (x) the responses of MetLife Advisers, the subadvisers and/or their affiliates to certain legal and regulatory proceedings and (xi) the economic outlook generally and for the mutual fund industry in particular. Throughout the process, the Directors have the opportunity to ask questions of and request additional materials from MetLife Advisers and the subadvisers.
Following meetings of each Contract Review Committee on September 10, 2008, the Board, including the Independent Directors, at its November 6-7, 2008 meeting, approved the continuation through December 31, 2009 of the Advisory Agreements for each Portfolio of the Fund and the Subadvisory Agreements for each Portfolio other than the Zenith Equity Portfolio and Asset Allocation Portfolios (which do not have subadvisers) and the Van Eck Global Natural Resources Portfolio, Met/Dimensional International Small Cap Portfolio and Loomis Sayles Small Cap Growth Portfolio (formerly known as the Franklin Templeton Small Cap Growth Portfolio). The Agreements approved for continuation are referred to below as the “Continued Agreements.”
In considering whether to approve the continuation of the Continued Agreements, the Directors, including the Independent Directors, did not identify any single factor as determinative, and each weighed the various factors as he or she deemed appropriate. The Directors considered the following matters in connection with their approval of the Continued Agreements:
The nature, extent and quality of the services provided to the relevant Portfolios under the Continued Agreements. The Directors considered the nature, extent and quality of the services provided by MetLife Advisers, the relevant subadvisers (if any) and their affiliates (each, an “Adviser,” and, collectively, the “Advisers”) to the relevant Portfolios pursuant to the Continued Agreements and the resources dedicated to these Portfolios by the Advisers. In particular, the Directors considered the Advisers’ abilities to attract and retain highly qualified investment professionals. With respect to MetLife Advisers, the Directors considered (for each Portfolio other than the Zenith Equity and Asset Allocation Portfolios) that MetLife Advisers is (i) ultimately responsible for the performance of such Portfolios; (ii) ultimately responsible for the establishment of the investment strategies of each such Portfolio, primarily through its recommendations to the Board regarding the hiring and selection of subadvisers; (iii) responsible for the hiring and selection, subject to Board approval, of subadvisers; and (iv) responsible for maintaining a program of Subadviser oversight reasonably designed to ensure that the subadvisers have reasonable compliance policies and procedures in place. The Directors also considered that MetLife Advisers provides a full range of day-to-day administrative services for the Portfolios involving all aspects of such Portfolios’ day-to-day operations (other than portfolio management). With respect to the Zenith Equity and Asset Allocation Portfolios, the Directors considered both the portfolio management services and the administrative services provided by MetLife Advisers. After reviewing
MSF-19
Metropolitan Series Fund, Inc.
Van Eck Global Natural Resources Portfolio
Board Approval of Advisory and Subadvisory Agreements—(Continued)
these and related factors, the Directors concluded, within the context of their overall conclusions regarding each of the Continued Agreements, that the nature, extent and quality of services provided supported the renewal of these Agreements.
Investment performance of the relevant Portfolios. The Directors reviewed information about the performance of the relevant Portfolios over various time periods, including information prepared by an independent third party that compared the performance of the Portfolios to the performance of peer groups of funds and performance benchmarks. The Directors also reviewed a description of the third party’s methodology for identifying a Portfolio’s peer group(s) for purposes of performance and expense comparisons.
In the case of each relevant Portfolio that had performance that lagged its peer group(s) for certain periods, the Directors concluded that other factors relevant to performance were sufficient, in light of other considerations, to warrant renewal of the Continued Agreements relating to such Portfolio. These factors varied from Portfolio to Portfolio, but included one or more of the following: (i) that such Portfolio’s performance, although lagging in certain recent periods, was stronger over the longer term; (ii) that the underperformance was attributable, to a significant extent, to investment decisions that were reasonable and consistent with the Portfolio’s investment objective(s) and policies and that the Portfolio was performing within the range of reasonable expectations, given market conditions and the Portfolio’s investment objective(s) and policies; (iii) that the Portfolio’s performance was competitive when compared to other relevant performance benchmarks or peer groups; and (iv) that MetLife Advisers and/or the relevant subadviser (if any) had taken or was taking steps designed to help improve the Portfolio’s investment performance (including, in the case of certain Portfolios, that MetLife Advisers was formulating possible proposals, for presentation to the Board in November 2008, to replace the Portfolio’s subadviser or to merge the Portfolio into another Portfolio with a similar investment objective and better investment performance).
The Directors also considered the investment performance of the Advisers and their reputations generally, the historical responsiveness of the Advisers to Director concerns about performance and the willingness of the Advisers to take steps intended to improve performance.
After reviewing these and related factors, the Directors concluded, within the context of their overall conclusions regarding each of the Continued Agreements, that the investment performance of each relevant Portfolio and Adviser was sufficient, in light of other considerations, to warrant the renewal of the Continued Agreements.
The costs of the services to be provided and profits to be realized by the Advisers and their affiliates from their relationships with the Portfolios. The Directors considered the fees charged by MetLife Advisers to the Portfolios for advisory services and, with respect to the subadvised Portfolios, by such subadvisers to MetLife Advisers for subadvisory services (such advisory and subadvisory fees (if any), collectively, “Fees”), as well as the total expense levels of the Portfolios. This information included comparisons (provided by an independent third party) of the Portfolios’ advisory fees and total expense levels to those of their peer groups. In evaluating Fees for the relevant Portfolios, the Directors also took into account the demands, complexity and quality of the investment management services provided to each Portfolio. The Directors considered MetLife Advisers’ recommendations regarding reductions in Fee rates, implementation of Fee breakpoints and institution of Fee waivers and expense caps.
The Directors also considered the compensation directly or indirectly received by the Advisers and their affiliates from their relationships with the relevant Portfolios. The Directors reviewed information relating to the profits received by MetLife Advisers, certain of the subadvisers and their affiliates as a result of their relationships with the relevant Portfolios, and information about the allocation of expenses used to calculate profitability. When reviewing profitability, the Directors also considered the performance of the relevant Portfolios, the expense levels of such Portfolios and whether the relevant Advisers had implemented breakpoints, fee waivers and/or expense caps with respect to such Portfolios.
After reviewing these and related factors, the Directors concluded, within the context of their overall conclusions regarding each of the Continued Agreements, that the Fees charged to each of the relevant Portfolios were fair and reasonable, and that the information provided regarding costs of these services generally, and the related profitability (if known) to the relevant Advisers of their relationships with the relevant Portfolios, supported the renewal of the Continued Agreements.
Economies of Scale. The Directors considered the existence of any economies of scale in the provision of services by the Advisers and whether those economies were shared with the relevant Portfolios through breakpoints in their advisory fees or other means, such as expense caps, fee waivers or relatively low levels of fees. The Directors noted that most of the relevant Portfolios benefited or will benefit from breakpoints, expense caps and/or fee waivers with respect to their advisory fees. In considering these issues, the Directors also took into consideration information relating to the costs of the services provided and the profitability to MetLife Advisers, the relevant subadvisers (if any) and each of their affiliates of their relationships with the relevant Portfolios, as discussed above.
MSF-20
Metropolitan Series Fund, Inc.
Van Eck Global Natural Resources Portfolio
Board Approval of Advisory and Subadvisory Agreements—(Continued)
After reviewing these and related factors, the Directors concluded, within the context of their overall conclusions regarding each of the Continued Agreements, that the extent to which economies of scale were shared with the relevant Portfolios supported the renewal of such Agreements.
Other Factors. The Directors also considered other factors, which included but were not limited to the following:
| | • | | the extent to which each relevant Portfolio operated in accordance with its investment objective, and its record of compliance with its investment restrictions and the compliance programs of the Fund and the Advisers. They also considered the compliance-related resources the Advisers and their affiliates provide to the relevant Portfolios; |
| | • | | the nature, quality, cost and extent of administrative and shareholder services performed by MetLife Advisers and its affiliates under the Advisory Agreements; and |
| | • | | so-called “fall-out benefits” to the Advisers, such as the engagement of their affiliates to provide distribution, brokerage and transfer agency services to the Portfolios, and the benefits of research made available to the relevant Advisers by reason of brokerage commissions generated by the relevant Portfolios’ securities transactions. The Directors also considered the possible conflicts of interest associated with these fall-out and other benefits, and the reporting and other processes in place to disclose and monitor these possible conflicts of interest. |
Based on their evaluation of all factors that they deemed to be material, including those factors described above, and assisted by the advice of independent counsel, the Directors, including the Independent Directors, concluded that each of the Continued Agreements should be continued through December 31, 2009.
Certain Matters Relating to Van Eck Global Natural Resources Portfolio (the “Van Eck Portfolio”). At the August 13-14, 2008 Board meeting, the Board established the Van Eck Portfolio. The Board also approved the Van Eck Portfolio’s advisory agreement between the Fund, on behalf of the Van Eck Portfolio, and MetLife Advisers (the “Van Eck Advisory Agreement”) and the subadvisory agreement between MetLife Advisers and Van Eck Associates Corporation (“Van Eck”) (the “Van Eck Subadvisory Agreement,” and, together with the Van Eck Advisory Agreement, the “Van Eck Agreements”).
The Board met with representatives from Van Eck and received information regarding Van Eck’s future plans for the management of the Van Eck Portfolio. In making the determination to approve the Van Eck Agreements, the Board carefully considered those factors described above with respect to the continuation of the Continued Agreements, as relevant to both the Van Eck Advisory Agreement and Van Eck Subadvisory Agreement. In addition to these factors, the Board also considered as relevant the experience, investment style and investment performance history of Van Eck as portfolio manager.
Following such consideration, and assisted by the advice of independent counsel, the Directors, including the Independent Directors, unanimously voted to approve the Van Eck Agreements, effective October 30, 2008 through October 29, 2010.
MSF-21
A description of the policies and procedures that the Fund uses to determine how to vote proxies relating to portfolio securities is available (i) without charge, upon request, by calling (800) 638-7732 and (ii) on the Securities and Exchange Commission’s (the “SEC”) website at http://www.sec.gov.
Information regarding how the Fund voted proxies relating to portfolio securities during the most recent twelve-month period ended December 31, 2008 is available (i) without charge, upon request, by calling (800) 638-7732 and (ii) on the SEC’s website at http://www.sec.gov.
The Fund’s Statement of Additional Information includes additional information about the Directors of the Fund and is available (i) without charge, upon request, by calling (800) 638-7732 and (ii) on the SEC’s website at http://www.sec.gov.
The Fund files with the SEC a complete schedule of its portfolio holdings, as of the close of the first and third quarters of its fiscal year, on “Form N-Q”. These filings are available on the SEC’s website at www.sec.gov and may be reviewed and copied at the SEC’s Public Reference Room in Washington, DC. (Call 1-800-SEC-0330 for information on the operation of the Public Reference Room.)
MSF-22
Simplify your life…
with MetLife eDelivery® while helping MetLife preserve the planet’s natural resources.
(see details on inside cover)
| | |
Metropolitan Series Fund, Inc. Western Asset Management Strategic Bond Opportunities Portfolio Annual Report | | December 31, 2008 |
NOT PART OF THE ANNUAL REPORT
Letter from the President
February 1, 2009
Letter to Policy Holders:
2008 was an extraordinary year in the capital markets around the world and for the global economy. Energy prices rose to record levels early in the year before falling by two-thirds by year-end. A credit crisis that began with concerns about sub-prime mortgages led to massive changes in the financial landscape with government takeovers, forced sales, and outright failures of a number of large, once venerable firms.
While bonds as measured by the Barclays Capital U.S. Aggregate Bond Index (formerly known as, Lehman Brothers U.S. Aggregate Bond Index) were up 5.2% for the year in response to declining interest rates, there were large differences in the total returns of the various sectors of the bond market. U.S. treasury securities were up over 13% as frightened investors sought refuge in what they perceived to be the safest and most liquid investments. In contrast, investment grade corporate securities lost nearly 5% as credit spreads widened and below investment grade or high yield bonds fell over 26%.
In response to the growing credit crisis and the weakening economy, common stocks fell sharply across all regions, styles, and capitalizations. As measured by the Standard and Poor’s 500, U.S. common stocks fell 37% for the year, the worst calendar year decline since the 1930s. Foreign stocks were down even more with the MSCI EAFE Index down 43% for the year.
On the following pages, you will find a complete review of your Portfolio and its investment performance.
MetLife is committed to building your financial freedom. We appreciate your trust and will continue to focus our efforts on meeting your investment needs.
Sincerely,
Elizabeth M. Forget
President, Metropolitan Series Fund, Inc.
Metropolitan Series Fund, Inc.
Western Asset Management Strategic Bond Opportunities Portfolio
Managed by Western Asset Management Company
Portfolio Manager Commentary*
PORTFOLIO PERFORMANCE
For the twelve-month period ended December 31, 2008, the Class A shares of the Western Asset Management Strategic Bond Opportunities Portfolio returned -15.0%, compared to its benchmark, the Barclays Capital U.S. Aggregate Bond Index1, which returned 5.2%. The average return of its peer group, the Lipper Variable Insurance Products2 General Bond Funds Universe, was -9.2% over the same period.
PORTFOLIO REVIEW
The Federal Reserve intensified its campaign against downside risks to growth in response to the deepening financial crisis. The TED3 spread surged beyond previous extreme levels, and without the provision of credit, investors began to question the durability of the underlying economy. The federal funds rate was reduced a cumulative 425 basis points (525 basis points for the cycle) to near 0% by year end; this essentially moved the Fed beyond its traditional form of stimulus. A number of new lending facilities, designed to meet the liquidity demands of financial intermediaries across the full banking spectrum, were implemented. The Fed and the Treasury recently announced plans to channel up to $600 billion directly to the mortgage market, and up to $200 billion directly to consumer and small business finance, including credit card, auto and student loans. Details emerged that much of this funding would be unsterilized and result in a major increase in the money supply. Yields on 30-year fixed-rate conventional mortgages declined roughly 1% as a result, to the lowest level on record. The Treasury allocated the first $250 billion of funds authorized under Troubled Asset Relief Program (TARP) by taking direct equity stakes in the U.S. banking system. Economic data was negative and third-quarter GDP contracted 0.5% on falling consumption expenditures. Consumer confidence fell as labor market conditions deteriorated and equity prices plunged. The unemployment rate increased 1.7% to 6.7%, though the U.S. dollar gained close to 6% against a trade-weighted basket of currencies. The dollar’s negative correlation with oil held strong as the price per barrel fell 54% after temporarily spiking in the summer. All in all, the period was the worst year for risk-taking in a quarter century. Spreads widened over 350 basis points on investment-grade issues and more than 1,100 basis points on high-yield issues. Mortgage-backed securities performed better, though even these government-backed securities underperformed Treasuries by 2.32% over the period. The S&P 500 Index lost 37% as volatility soared, marking 2008 as the worst year for equities since 1931.
A large overweight exposure to the mortgage-backed sector detracted from returns as volatility remained high and negative housing news continued to damage market sentiment. We had diversified into a number of non-agency issues that were particularly impacted and further detracted from performance due to rising defaults, uncertainty in that marketplace and a lack of liquidity. An emphasis on lower-quality credits and select financial issues was also a large negative as spreads soared in the wake of the subprime lending crisis, deteriorating liquidity conditions and slowing economic growth. Spreads widened to new all-time highs in mid March before partially recovering in April and May. These gains were given back later in the period, however, on deteriorating investor sentiment and poor earnings. The high-yield sector performed poorly on news of more ratings downgrades, rising defaults, and a volatile and declining stock market. A modest exposure to international bonds in other advanced economies had a negative impact as the flight-to-safety outside the U.S. was minimal relative to U.S. Treasury markets. A modest Treasury Inflation Protected Securities (TIPS) exposure had a negative impact as oil plunged to $40/barrel and inflation fears switched to deflation fears. On a positive note, a tactically-driven duration posture contributed modestly to returns as bond yields rallied over the year. A curve-steepening strategy had a positive impact on performance as the spread between 2- and 10-year yields widened.
* The views expressed above are those of the subadvisory firm as of December 31, 2008 and are subject to change based on market and other conditions. Information about the Portfolio’s holdings, asset allocation, industry allocation, or country diversification is historical and is not an indication of future Portfolio composition, which will vary. The performance of any index mentioned in this commentary has not been adjusted for ongoing management, distribution and operating expenses, and sales charges applicable to mutual fund investments. Direct investment in any index is not possible.
1 Barclays Capital U.S. Aggregate Bond Index (formerly, Lehman Brothers U.S. Aggregate Bond Index) includes most obligations of the U.S. Treasury, agencies and quasi-federal corporations, most publicly issued investment grade corporate bonds and most bonds backed by mortgage pools of GNMA, FNMA and FHLMC. The index itself remains unchanged since Barclays assumed responsibility for the index from Lehman.
2 The Lipper Variable Products Fund Average is an average of the total return performance (calculated on the basis of net asset value) of variable product funds with similar investment objectives to those of the subject Portfolio as calculated by Lipper Analytical Services, an independent mutual fund ranking service.
3 The TED spread is the difference between the 3 month LIBOR and the 3 month U.S. Treasury Bill rate. It is used as a measure of the risk premium of lending to a bank vs. lending to the U.S. government.
MSF-2
Metropolitan Series Fund, Inc.
Western Asset Management Strategic Bond Opportunities Portfolio
A $10,000 INVESTMENT COMPARED TO THE
BARCLAYS CAPITAL U.S. AGGREGATE BOND INDEX
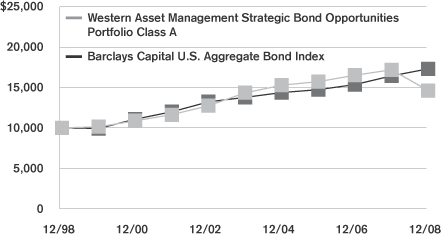
Average Annual Returns as of December 31, 2008
| | | | | | | | | | | | |
| | | Western Asset Management Strategic Bond Opportunities Portfolio | | | Barclays Capital U.S.
Aggregate Bond Index | |
| | Class A | | | Class B | | | Class E | | |
| 1 Year | | -15.0 | % | | -15.2 | % | | -15.1 | % | | 5.2 | % |
| 5 Year | | 0.4 | | | 0.1 | | | 0.2 | | | 4.7 | |
| 10 Year | | 3.9 | | | — | | | — | | | 5.6 | |
| Since Inception | | — | | | 3.4 | | | 3.4 | | | — | |
Performance numbers are net of all Portfolio expenses but do not include any insurance, sales, or administrative charges of variable annuity or life insurance contracts or any additional expenses that participants in certain eligible qualified plans may bear relating to the operations of their plans. If these charges were included, the returns would be lower.
Inception dates of the Class A, Class B and Class E shares are: 10/31/94, 7/30/02 and 5/1/01, respectively.
This information represents past performance and is not indicative of future results. Investment return and principal value may fluctuate so that shares, upon redemption, may be worth more or less than the original cost.
PORTFOLIO COMPOSITION
as of December 31, 2008
Top Holdings
| | |
| | | % of Total
Net Assets |
Federal National Mortgage Association | | 18.6% |
U.S. Treasury Bonds | | 5.7% |
Government National Mortgage Association | | 4.5% |
Ford Motor Credit Co., LLC | | 2.0% |
Federal Home Loan Mortgage Corp. | | 1.9% |
WaMu Mortgage Pass-Through Certificates | | 1.6% |
GMAC, LLC | | 1.5% |
Bear Stearns Structured Products, Inc. (144A) | | 1.4% |
Prime Mortgage Trust | | 1.4% |
Bear Stearns Asset Backed Securities Trust | | 1.4% |
Top Sectors
| | |
| | | % of Total
Market Value |
Residential Mortgage-Backed | | 35.0% |
High Yield | | 27.7% |
Investment Grade | | 24.4% |
Government | | 5.2% |
Commercial Mortgage-Backed | | 2.9% |
Index-Linked | | 2.7% |
Asset Backed | | 1.1% |
Cash Equivalents | | 1.0% |
Emerging Markets | | 0.0% |
MSF-3
Metropolitan Series Fund, Inc.
Shareholder Expense Example
As a shareholder of the Portfolio, you incur ongoing costs, including management fees; distribution and service (12b-1) fees; and other Portfolio expenses. This example is intended to help you understand your ongoing costs (in dollars) (referred to as “expenses”) of investing in the Portfolio and compare these costs with the ongoing costs of investing in other mutual funds. The example is based on an investment of $1,000 invested at the beginning of the period and held for the entire period, July 1, 2008 through December 31, 2008.
Actual Expenses
The first line for each share class of the Portfolio in the table below provides information about actual account values and actual expenses. You may use the information in this line, together with the amount you invested in the particular share class of the Portfolio, to estimate the expenses that you paid over the period. Simply divide your account value by $1,000 (for example, an $8,600 account value divided by $1,000=8.6), then multiply the result by the number in the first line under the heading entitled “Expenses Paid During Period” to estimate the expenses you paid on your account during this period.
Hypothetical Example for Comparison Purposes
The second line for each share class of the Portfolio in the table below provides information about hypothetical account values and hypothetical expenses based on the Portfolio’s actual expense ratio and an assumed rate of return of 5% per year before expenses, which is not the Portfolio’s actual return. The hypothetical account values and expenses may not be used to estimate the actual ending account balance or expenses you paid for the period. You may use this information to compare the ongoing costs of investing in the Portfolio and other funds. To do so, compare this 5% hypothetical example with the 5% hypothetical examples that appear in the shareholder reports of the other funds.
Please note that the expenses shown in the table are meant to highlight your ongoing costs only and do not reflect any fees or charges of your variable insurance product or any additional expenses that participants in certain eligible qualified plans may bear relating to the operations of their plan. Therefore, the second line for each share class in the table is useful in comparing ongoing costs only, and will not help you determine the relative total costs of owning different funds. In addition, if these other costs were included, your costs would have been higher.
| | | | | | | | | | | | | | |
Portfolio | | | | Annualized
Expense
Ratio | | | Beginning
Account Value
July 1,
2008 | | Ending
Account Value
December 31,
2008 | | Expenses Paid
During Period*
July 1, 2008
to
December 31,
2008 |
Western Asset Mgt. Strategic Bond Opportunities—Class A | | Actual | | 0.65 | % | | $ | 1,000.00 | | $ | 873.94 | | $ | 3.06 |
| | Hypothetical | | 0.65 | % | | $ | 1,000.00 | | $ | 1,021.83 | | $ | 3.30 |
| | | | | |
Western Asset Mgt. Strategic Bond Opportunities—Class B | | Actual | | 0.90 | % | | $ | 1,000.00 | | $ | 872.67 | | $ | 4.24 |
| | Hypothetical | | 0.90 | % | | $ | 1,000.00 | | $ | 1,020.56 | | $ | 4.57 |
| | | | | |
Western Asset Mgt. Strategic Bond Opportunities—Class E | | Actual | | 0.80 | % | | $ | 1,000.00 | | $ | 873.62 | | $ | 3.77 |
| | Hypothetical | | 0.80 | % | | $ | 1,000.00 | | $ | 1,021.07 | | $ | 4.06 |
* Expenses paid are equal to the Portfolio’s annualized expense ratio for the most recent six month period, as shown above, multiplied by the average account value over the period, multiplied by the number of days in the most recent fiscal half-year, divided by 366 (to reflect the the one-half year period).
MSF-4
Metropolitan Series Fund, Inc.
Western Asset Management Strategic Bond Opportunities Portfolio
Schedule of Investments as of December 31, 2008
Fixed Income—106.1% of Total Net Assets
| | | | | | |
| Security Description | | Face
Amount | | Value* |
| | | | | | |
| | | | | | |
| | |
Aerospace & Defense—0.6% | | | | | | |
DRS Technologies, Inc.
6.625%, 02/01/16 | | $ | 375,000 | | $ | 375,000 |
L-3 Communications Corp.
6.375%, 10/15/15 | | | 3,845,000 | | | 3,595,075 |
7.625%, 06/15/12 | | | 400,000 | | | 391,000 |
Sequa Corp. (144A)
11.750%, 12/01/15 | | | 660,000 | | | 250,800 |
13.500%, 12/01/15 | | | 705,301 | | | 229,223 |
| | | | | | |
| | | | | | 4,841,098 |
| | | | | | |
| | |
Airlines—0.3% | | | | | | |
Delta Airlines, Inc.
6.821%, 08/10/22 | | | 934,936 | | | 542,721 |
Northwest Airlines, Inc.
4.030%, 05/20/14 (a) | | | 2,294,859 | | | 1,606,401 |
| | | | | | |
| | | | | | 2,149,122 |
| | | | | | |
| | |
Asset Backed—5.2% | | | | | | |
ACE Securities Corp.
0.601%, 02/25/31 (a) | | | 2,046,745 | | | 1,478,533 |
Amortizing Residential Collateral Trust
2.271%, 08/25/32 (a) | | | 109,629 | | | 51,690 |
Asset Backed Securities Corp.
4.045%, 04/15/33 (a) | | | 54,319 | | | 26,919 |
Bear Stearns Asset Backed Securities Trust
0.841%, 01/25/34 (a) | | | 101,022 | | | 72,755 |
1.721%, 08/25/37 (a) | | | 3,548,224 | | | 3,017,303 |
6.000%, 10/25/36 | | | 5,517,442 | | | 3,607,452 |
6.500%, 10/25/36 | | | 5,312,128 | | | 4,203,991 |
Conseco Financial Corp.
7.070%, 01/15/29 | | | 310,309 | | | 263,348 |
Countrywide Asset Backed Certificates
1.721%, 06/25/34 (a) | | | 262,572 | | | 108,189 |
Countrywide Home Equity Loan Trust
1.335%, 12/25/31 (a) | | | 2,465,582 | | | 991,001 |
Ellington Loan Acquisition Trust (144A)
1.471%, 05/25/37 (a) | | | 3,675,435 | | | 3,197,787 |
2.645%, 05/25/37 (a) | | | 4,400,000 | | | 2,255,376 |
EMC Mortgage Loan Trust (144A)
0.921%, 05/25/43 (a) | | | 2,654,220 | | | 2,208,285 |
1.171%, 01/25/41 (a) | | | 700,000 | | | 330,337 |
GMAC Mortgage Corp. Loan Trust
0.681%, 11/25/36 (a) | | | 9,126,220 | | | 2,400,763 |
GSAMP Trust
0.561%, 07/05/36 (a) | | | 1,065,508 | | | 402,473 |
GSAMP Trust (144A)
0.581%, 05/25/36 (a) | | | 1,736,431 | | | 1,441,220 |
GSRPM Mortgage Loan Trust (144A)
0.771%, 03/25/35 (a) | | | 2,084,871 | | | 1,396,926 |
Indymac Seconds Asset Backed Trust
0.601%, 06/25/36 (a) | | | 2,862,169 | | | 485,265 |
Lehman XS Trust
0.591%, 06/25/37 (a) | | | 1,974,189 | | | 1,435,369 |
Long Beach Mortgage Loan Trust
0.611%, 11/25/35 (a) | | | 219,740 | | | 216,139 |
1.028%, 01/21/31 (a) | | | 48,404 | | | 41,575 |
| | | | | | |
| Security Description | | Face
Amount | | Value* |
| | | | | | |
| | |
Asset Backed—(Continued) | | | | | | |
Mid-State Trust
7.340%, 07/01/35 | | $ | 499,244 | | $ | 489,966 |
Morgan Stanley Mortgage Loan Trust
0.621%, 03/25/36 (a) | | | 1,697,836 | | | 399,317 |
Nelnet Student Loan Trust
5.015%, 04/25/24 (a) | | | 1,680,000 | | | 1,361,025 |
RAAC Series (144A)
0.721%, 08/25/35 (a) | | | 2,221,030 | | | 1,610,383 |
SACO I, Inc.
0.601%, 06/25/36 (a) | | | 2,614,301 | | | 434,708 |
Sail Net Interest Margin Notes (144A)
5.500%, 03/27/34 (b) (h) | | | 35,690 | | | 0 |
7.750%, 04/27/33 (b) (h) | | | 783 | | | 0 |
SLM Student Loan Trust
3.525%, 07/25/17 (a) | | | 1,857,415 | | | 1,801,378 |
Structured Asset Securities Corp.
0.721%, 11/25/37 (a) | | | 2,426,424 | | | 1,893,860 |
Structured Asset Securities Corp. (144A)
0.581%, 02/25/36 (a) (c) | | | 1,967,877 | | | 257,140 |
Washington Mutual Master Note Trust (144A)
1.225%, 09/16/13 (a) | | | 4,150,000 | | | 3,632,812 |
| | | | | | |
| | | | | | 41,513,285 |
| | | | | | |
| | |
Auto Components—0.4% | | | | | | |
Allison Transmission (144A)
11.000%, 11/01/15 (d) | | | 200,000 | | | 98,000 |
11.250%, 11/01/15 | | | 3,900,000 | | | 1,540,500 |
Keystone Automotive Operations, Inc.
9.750%, 11/01/13 (d) | | | 775,000 | | | 294,500 |
Visteon Corp.
8.250%, 08/01/10 (d) | | | 971,000 | | | 301,010 |
12.250%, 12/31/16 (d) | | | 2,508,000 | | | 601,920 |
| | | | | | |
| | | | | | 2,835,930 |
| | | | | | |
| | |
Automobiles—0.4% | | | | | | |
Ford Motor Co.
6.625%, 10/01/28 | | | 135,000 | | | 29,700 |
7.450%, 07/16/31 (d) | | | 5,045,000 | | | 1,412,600 |
8.900%, 01/15/32 | | | 105,000 | | | 25,200 |
General Motors Corp.
8.250%, 07/15/23 (d) | | | 685,000 | | | 113,025 |
8.375%, 07/15/33 (d) | | | 10,580,000 | | | 1,851,500 |
| | | | | | |
| | | | | | 3,432,025 |
| | | | | | |
| | |
Beverages—0.2% | | | | | | |
PepsiCo, Inc.
7.900%, 11/01/18 | | | 1,550,000 | | | 1,899,753 |
| | | | | | |
| | |
Building Products—0.8% | | | | | | |
AMH Holdings, Inc.
11.500%, 03/01/14 (d) (e) | | | 1,165,000 | | | 646,575 |
Associated Materials, Inc.
9.750%, 04/15/12 (d) | | | 5,830,000 | | | 4,591,125 |
Nortek, Inc.
8.500%, 09/01/14 | | | 3,860,000 | | | 887,800 |
| | | | | | |
| | | | | | 6,125,500 |
| | | | | | |
*See accompanying notes to financial statements.
MSF-5
Metropolitan Series Fund, Inc.
Western Asset Management Strategic Bond Opportunities Portfolio
Schedule of Investments as of December 31, 2008
Fixed Income—(Continued)
| | | | | | |
| Security Description | | Face
Amount | | Value* |
| | | | | | |
| | |
Capital Markets—0.7% | | | | | | |
Lehman Brothers Holdings, Inc.
6.750%, 12/28/17 (c) | | $ | 2,890,000 | | $ | 289 |
Morgan Stanley
5.625%, 01/09/12 | | | 1,290,000 | | | 1,223,316 |
5.824%, 10/18/16 (a) | | | 490,000 | | | 337,146 |
The Bear Stearns Cos., LLC
6.400%, 10/02/17 | | | 470,000 | | | 488,414 |
7.250%, 02/01/18 | | | 2,300,000 | | | 2,520,469 |
The Goldman Sachs Group, Inc.
4.500%, 06/15/10 (d) | | | 1,110,000 | | | 1,093,782 |
| | | | | | |
| | | | | | 5,663,416 |
| | | | | | |
| | |
Chemicals—0.1% | | | | | | |
Georgia Gulf Corp.
9.500%, 10/15/14 (d) | | | 320,000 | | | 96,000 |
10.750%, 10/15/16 | | | 1,770,000 | | | 424,800 |
Key Plastics, LLC (144A)
10.250%, 03/15/17 (h) | | | 250,000 | | | 250 |
LyondellBasell Industries AF SCA (144A)
8.375%, 08/15/15 | | | 1,630,000 | | | 40,750 |
| | | | | | |
| | | | | | 561,800 |
| | | | | | |
| |
Collateralized-Mortgage Obligation—13.0% | | | |
American Home Mortgage Investment Trust
5.294%, 06/25/45 | | | 3,434,461 | | | 1,606,739 |
Banc of America Funding Corp.
0.678%, 05/20/36 (a) | | | 1,439,568 | | | 963,289 |
Banc of America Mortgage Securities, Inc.
4.805%, 09/25/35 (a) | | | 4,350,149 | | | 3,238,731 |
5.169%, 12/25/34 (a) | | | 10,507,953 | | | 7,603,076 |
Bear Stearns Adjustable Rate Mortgage Trust
4.650%, 10/25/35 (a) | | | 2,700,000 | | | 1,301,145 |
Bear Stearns Structured Products, Inc. (144A)
1.071%, 09/25/37 (a) | | | 11,259,480 | | | 10,949,619 |
Citigroup Mortgage Loan Trust, Inc.
5.528%, 12/25/35 (a) | | | 5,625,404 | | | 2,745,182 |
Countrywide Alternative Loan Trust
0.671%, 05/25/36 (a) | | | 2,657,119 | | | 1,072,418 |
0.708%, 07/25/36 (a) | | | 3,855,062 | | | 1,337,124 |
0.801%, 11/20/35 (a) | | | 4,833,973 | | | 2,416,407 |
Crusade Global Trust
2.038%, 09/18/34 (a) | | | 449,069 | | | 434,513 |
Greenpoint Mortgage Funding Trust
0.551%, 03/25/37 (a) | | | 5,757,108 | | | 2,906,682 |
GSMPS Mortgage Loan Trust (144A)
0.821%, 01/25/35 (a) | | | 1,544,449 | | | 1,227,694 |
GSR Mortgage Loan Trust
5.181%, 01/25/36 (a) | | | 3,438,260 | | | 2,664,196 |
5.276%, 10/25/35 (a) | | | 771,499 | | | 451,190 |
Harborview Mortgage Loan Trust
0.801%, 06/25/37 (a) | | | 7,113,734 | | | 2,986,060 |
0.831%, 01/19/36 (a) | | | 2,275,384 | | | 1,049,743 |
1.471%, 08/19/37 (a) | | | 7,104,535 | | | 2,732,862 |
| | | | | | |
| Security Description | | Face
Amount | | Value* |
| | | | | | |
|
Collateralized-Mortgage Obligation—(Continued) |
Impac Secured Assets CMN Owner Trust
0.821%, 08/25/36 (a) | | $ | 527,341 | | $ | 279,066 |
5.400%, 03/25/36 (a) | | | 2,519,720 | | | 1,168,993 |
Indymac INDA Mortgage Loan Trust
6.176%, 11/25/37 (a) | | | 3,644,089 | | | 2,246,545 |
Indymac Index Mortgage Loan Trust
5.178%, 01/25/35 (a) | | | 1,440,605 | | | 745,157 |
5.707%, 03/25/35 (a) | | | 1,300,527 | | | 628,025 |
5.940%, 08/25/37 (a) | | | 5,619,832 | | | 2,281,601 |
Lehman XS Trust
0.601%, 06/25/37 (a) | | | 5,679,938 | | | 4,114,427 |
Luminent Mortgage Trust
0.661%, 05/25/46 (a) | | | 3,107,639 | | | 1,377,072 |
MASTR Seasoned Securities Trust
5.734%, 10/25/32 (a) | | | 658,218 | | | 455,125 |
Merit Securities Corp. (144A)
1.971%, 09/28/32 (a) | | | 673,793 | | | 470,606 |
Merrill Lynch Mortgage Investors, Inc.
5.035%, 05/25/34 (a) | | | 1,134,629 | | | 823,214 |
Morgan Stanley Mortgage Loan Trust
0.791%, 01/25/35 (a) | | | 1,969,023 | | | 938,977 |
5.459%, 06/26/36 (a) | | | 3,099,781 | | | 1,860,892 |
Novastar Mortgage-Backed Notes
0.661%, 06/25/36 (a) | | | 2,989,508 | | | 1,240,227 |
Prime Mortgage Trust (144A)
6.000%, 05/25/35 | | | 1,252,853 | | | 971,387 |
6.000%, 11/25/36 | | | 5,180,418 | | | 3,254,701 |
Prime Mortgage Trust (Class 1) (144A)
5.500%, 05/25/35 | | | 2,785,737 | | | 2,150,088 |
Prime Mortgage Trust (Class 2) (144A)
5.500%, 05/25/35 | | | 7,289,485 | | | 4,560,666 |
RBSGC Mortgage Pass Through Certificates
0.921%, 01/25/37 (a) | | | 3,241,092 | | | 1,640,452 |
Structured Adjustable Rate Mortgage Loan Trust
5.193%, 01/25/35 (a) | | | 1,813,615 | | | 1,058,834 |
5.642%, 09/25/35 (a) | | | 2,880,987 | | | 1,426,705 |
Structured Asset Mortgage Investments, Inc.
5.648%, 08/25/35 (a) | | | 251,749 | | | 126,317 |
Thornburg Mortgage Securities Trust
0.641%, 01/25/46 (a) | | | 2,138,039 | | | 2,129,885 |
WaMu Mortgage Pass-Through Certificates
0.741%, 12/25/45 (a) | | | 4,682,092 | | | 2,175,910 |
0.751%, 11/25/45 (a) | | | 3,323,079 | | | 1,632,154 |
0.761%, 07/25/45 (a) | | | 62,527 | | | 29,018 |
0.761%, 10/25/45 (a) | | | 1,935,100 | | | 1,056,905 |
5.347%, 08/25/36 (a) | | | 6,448,867 | | | 3,689,657 |
5.506%, 04/25/37 (a) | | | 2,737,516 | | | 1,915,747 |
5.647%, 03/25/37 (a) | | | 3,043,843 | | | 1,524,616 |
5.929%, 09/25/36 (a) | | | 1,679,120 | | | 970,887 |
Wells Fargo Mortgage Backed Securities Trust
4.542%, 02/25/35 (a) | | | 4,959,679 | | | 3,123,310 |
4.671%, 06/25/35 (a) | | | 419,726 | | | 322,169 |
5.240%, 05/25/36 (a) | | | 1,180,896 | | | 855,262 |
Zuni Mortgage Loan Trust
0.601%, 06/25/36 (a) | | | 2,138,571 | | | 2,027,240 |
| | | | | | |
| | | | | | 102,958,507 |
| | | | | | |
*See accompanying notes to financial statements.
MSF-6
Metropolitan Series Fund, Inc.
Western Asset Management Strategic Bond Opportunities Portfolio
Schedule of Investments as of December 31, 2008
Fixed Income—(Continued)
| | | | | | |
| Security Description | | Face
Amount | | Value* |
| | | | | | |
| |
Commercial & Professional Services—0.5% | | | |
Allied Waste North America, Inc.
7.875%, 04/15/13 | | $ | 75,000 | | $ | 71,250 |
Corrections Corp. of America
6.250%, 03/15/13 | | | 150,000 | | | 139,500 |
6.750%, 01/31/14 | | | 275,000 | | | 256,438 |
DynCorp International
9.500%, 02/15/13 | | | 730,000 | | | 636,012 |
Interface, Inc.
10.375%, 02/01/10 | | | 650,000 | | | 643,500 |
Safety-Kleen Services, Inc.
9.250%, 06/01/08 (b) (c) (h) | | | 250,000 | | | 0 |
U.S. Investigations Services, Inc. (144A)
11.750%, 05/01/16 | | | 1,440,000 | | | 907,200 |
Waste Management, Inc.
6.375%, 11/15/12 | | | 1,290,000 | | | 1,202,961 |
| | | | | | |
| | | | | | 3,856,861 |
| | | | | | |
| | |
Commercial Banks—1.2% | | | | | | |
Capital One Bank USA, N.A.
5.750%, 09/15/10 | | | 50,000 | | | 48,528 |
Glitnir Banki Hf (144A)
6.330%, 07/28/11 (c) | | | 720,000 | | | 34,200 |
6.693%, 06/15/16 (c) | | | 1,400,000 | | | 210 |
HSBK Europe BV (144A)
9.250%, 10/16/13 | | | 1,690,000 | | | 1,233,700 |
ICICI Bank, Ltd.
6.375%, 04/30/22 (a) (d) | | | 939,000 | | | 416,766 |
ICICI Bank, Ltd. (144A)
6.375%, 04/30/22 (a) | | | 1,364,000 | | | 716,253 |
Kaupthing Bank Hf (144A)
5.750%, 10/04/11 (c) | | | 350,000 | | | 21,000 |
7.125%, 05/19/16 (c) | | | 450,000 | | | 3,375 |
7.625%, 02/28/15 (c) (h) | | | 5,920,000 | | | 355,200 |
Landsbanki Islands Hf (144A)
6.100%, 08/25/11 (c) | | | 2,000,000 | | | 35,000 |
Royal Bank of Scotland Group, Plc.
7.640%, 03/31/49 (a) | | | 500,000 | | | 199,142 |
Royal Bank of Scotland Group, Plc. (144A)
6.990%, 10/29/49 (a) | | | 790,000 | | | 369,353 |
Santander Issuances S.A. Unipersonal (144A)
5.805%, 06/20/16 (a) | | | 1,180,000 | | | 1,061,589 |
TuranAlem Finance BV
8.250%, 01/22/37 | | | 1,620,000 | | | 696,600 |
TuranAlem Finance BV (144A)
8.250%, 01/22/37 | | | 2,490,000 | | | 1,070,700 |
Wachovia Corp.
5.250%, 08/01/14 | | | 3,110,000 | | | 2,897,009 |
| | | | | | |
| | | | | | 9,158,625 |
| | | | | | |
| |
Commercial Mortgage-Backed Securities—2.9% | | | |
Commercial Mortgage Asset Trust
7.350%, 01/17/32 | | | 475,000 | | | 417,839 |
Commercial Mortgage Pass-Through Certificates (144A)
5.447%, 07/16/34 | | | 563,997 | | | 543,102 |
| | | | | | |
| Security Description | | Face
Amount | | Value* |
| | | | | | |
|
Commercial Mortgage-Backed Securities—(Continued) |
Credit Suisse Mortgage Capital Certificates
5.552%, 02/15/39 (a) | | $ | 3,270,000 | | $ | 2,655,048 |
First Union National Bank Commercial Mortgage
0.562%, 05/17/32 (a) (f) | | | 10,473,000 | | | 102,883 |
JPMorgan Chase Commercial Mortgage Securities Corp.
5.814%, 06/12/43 | | | 4,960,000 | | | 3,816,136 |
LB-UBS Commercial Mortgage Trust
5.430%, 02/15/40 | | | 7,970,000 | | | 5,728,074 |
Merrill Lynch Mortgage Trust
5.657%, 05/12/39 (a) | | | 1,890,000 | | | 1,539,212 |
Merrill Lynch/Countrywide Commercial Mortgage Trust
5.485%, 03/12/51 (a) | | | 2,070,000 | | | 1,425,158 |
5.749%, 06/12/50 (a) | | | 6,940,000 | | | 4,926,928 |
Morgan Stanley Capital I
5.692%, 04/15/49 | | | 2,240,000 | | | 1,681,014 |
| | | | | | |
| | | | | | 22,835,394 |
| | | | | | |
| | |
Communications Equipment—0.3% | | | | | | |
Intelsat Corp. (144A)
9.250%, 08/15/14 | | | 2,000,000 | | | 1,860,000 |
Intelsat Jackson Holdings, Ltd.
11.250%, 06/15/16 (d) | | | 500,000 | | | 455,000 |
| | | | | | |
| | | | | | 2,315,000 |
| | | | | | |
| | |
Construction & Engineering—0.4% | | | | | | |
K. Hovnanian Enterprises, Inc.
11.500%, 05/01/13 | | | 3,895,000 | | | 2,960,200 |
| | | | | | |
| | |
Consumer Finance—0.7% | | | | | | |
American Express Co.
6.800%, 09/01/66 (a) | | | 3,550,000 | | | 1,837,661 |
SLM Corp.
5.000%, 10/01/13 | | | 1,565,000 | | | 1,119,789 |
5.000%, 04/15/15 | | | 60,000 | | | 38,064 |
5.050%, 11/14/14 | | | 310,000 | | | 206,302 |
5.375%, 05/15/14 | | | 2,955,000 | | | 1,994,253 |
5.625%, 08/01/33 | | | 295,000 | | | 178,960 |
| | | | | | |
| | | | | | 5,375,029 |
| | | | | | |
| | |
Containers & Packaging—0.1% | | | | | | |
Graham Packaging Co., Inc.
8.500%, 10/15/12 | | | 280,000 | | | 199,500 |
Graphic Packaging International, Inc.
9.500%, 08/15/13 (d) | | | 260,000 | | | 179,400 |
Plastipak Holdings, Inc. (144A)
8.500%, 12/15/15 | | | 200,000 | | | 134,000 |
Radnor Holdings Corp.
11.000%, 03/15/10 (c) | | | 175,000 | | | 219 |
| | | | | | |
| | | | | | 513,119 |
| | | | | | |
*See accompanying notes to financial statements.
MSF-7
Metropolitan Series Fund, Inc.
Western Asset Management Strategic Bond Opportunities Portfolio
Schedule of Investments as of December 31, 2008
Fixed Income—(Continued)
| | | | | | |
| Security Description | | Face
Amount | | Value* |
| | | | | | |
| | |
Diversified Consumer Services—0.0% | | | | | | |
Service Corp. International
7.500%, 04/01/27 | | $ | 330,000 | | $ | 211,200 |
7.625%, 10/01/18 | | | 125,000 | | | 92,500 |
| | | | | | |
| | | | | | 303,700 |
| | | | | | |
| | |
Diversified Financial Services—13.1% | | | | | | |
AGFC Capital Trust I (144A)
6.000%, 01/15/67 (a) | | | 815,000 | | | 194,660 |
Aiful Corp. (144A)
5.000%, 08/10/10 | | | 800,000 | | | 439,839 |
American General Finance Corp.
6.900%, 12/15/17 | | | 610,000 | | | 263,992 |
Anadarko Finance Co.
7.500%, 05/01/31 | | | 1,500,000 | | | 1,326,415 |
BAC Capital Trust XIV
5.630%, 12/31/49 (a) (d) | | | 2,520,000 | | | 1,009,653 |
Bank of America Corp.
5.420%, 03/15/17 | | | 1,700,000 | | | 1,511,084 |
8.000%, 12/29/49 (a) (d) | | | 1,610,000 | | | 1,158,054 |
BP Capital Markets, Plc.
5.250%, 11/07/13 | | | 2,780,000 | | | 2,902,142 |
Caterpillar Financial Services Corp.
6.200%, 09/30/13 | | | 2,290,000 | | | 2,360,800 |
Citigroup, Inc.
5.000%, 09/15/14 | | | 3,650,000 | | | 3,210,474 |
6.500%, 08/19/13 | | | 2,990,000 | | | 3,017,167 |
6.875%, 03/05/38 | | | 2,720,000 | | | 3,095,053 |
Credit Suisse Guernsey, Ltd.
5.860%, 05/29/49 (a) | | | 500,000 | | | 233,367 |
Deutsche Telekom International Finance BV
5.750%, 03/23/16 (d) | | | 820,000 | | | 784,935 |
Devon Financing Corp.
6.875%, 09/30/11 | | | 3,680,000 | | | 3,713,712 |
Diageo Capital, Plc.
7.375%, 01/15/14 | | | 3,230,000 | | | 3,440,761 |
El Paso Performance-Linked Trust (144A)
7.750%, 07/15/11 | | | 1,940,000 | | | 1,679,555 |
FMC Finance III S.A.
6.875%, 07/15/17 | | | 750,000 | | | 701,250 |
Ford Motor Credit Co., LLC
7.246%, 06/15/11 (a) (d) | | | 904,000 | | | 596,640 |
7.375%, 10/28/09 | | | 5,150,000 | | | 4,522,838 |
7.800%, 06/01/12 (d) | | | 10,000,000 | | | 7,015,743 |
7.875%, 06/15/10 | | | 1,975,000 | | | 1,580,355 |
12.000%, 05/15/15 | | | 3,010,000 | | | 2,247,745 |
Gaz Capital for Gazprom (144A)
8.625%, 04/28/34 | | | 800,000 | | | 640,000 |
Gaz Capital S.A. (144A)
6.510%, 03/07/22 | | | 1,130,000 | | | 672,350 |
General Electric Capital Corp.
6.375%, 11/15/67 (a) (d) | | | 6,110,000 | | | 3,840,557 |
GMAC, LLC
5.625%, 05/15/09 (c) (d) | | | 1,410,000 | | | 1,354,962 |
5.850%, 01/14/09 (c) (d) | | | 370,000 | | | 367,589 |
6.625%, 05/15/12 | | | 3,223,000 | | | 2,510,137 |
| | | | | | |
| Security Description | | Face
Amount | | Value* |
| | | | | | |
| |
Diversified Financial Services—(Continued) | | | |
GMAC, LLC
6.750%, 12/01/14 | | $ | 411,000 | | $ | 282,678 |
6.875%, 09/15/11 (c) | | | 7,171,103 | | | 5,874,998 |
7.250%, 03/02/11 (c) | | | 25,000 | | | 21,495 |
7.500%, 12/31/13 (c) | | | 748,000 | | | 546,040 |
8.000%, 12/31/18 (c) | | | 632,000 | | | 316,000 |
8.000%, 11/01/31 (c) | | | 1,013,000 | | | 603,221 |
Goldman Sachs Capital II
5.793%, 12/29/49 (a) | | | 3,880,000 | | | 1,491,561 |
Hawker Beechcraft Acquisition Co., LLC.
8.875%, 04/01/15 (d) | | | 5,420,000 | | | 1,842,800 |
HSBC Finance Capital Trust IX
5.911%, 11/30/35 (a) | | | 50,000 | | | 20,920 |
ILFC E-Capital Trust II (144A)
6.250%, 12/21/65 (a) | | | 330,000 | | | 137,812 |
Intergas Finance BV (144A)
6.375%, 05/14/17 | | | 2,450,000 | | | 1,421,000 |
International Lease Finance Corp.
5.875%, 05/01/13 | | | 50,000 | | | 33,380 |
John Deere Capital Corp.
5.100%, 01/15/13 (d) | | | 2,000,000 | | | 1,967,724 |
JPMorgan Chase & Co.
5.125%, 09/15/14 | | | 2,740,000 | | | 2,655,274 |
5.150%, 10/01/15 | | | 1,430,000 | | | 1,350,288 |
6.125%, 06/27/17 | | | 1,130,000 | | | 1,112,058 |
6.625%, 03/15/12 | | | 70,000 | | | 71,708 |
KAC Aquisition Co. (144A)
Zero Coupon, 04/26/26 (b) (h) | | | 3,316 | | | 0 |
KazMunaiGaz Finance Sub BV (144A)
8.375%, 07/02/13 | | | 2,500,000 | | | 1,950,000 |
Lehman Brothers Holdings Capital Trust VII
5.857%, 11/29/49 (a) (c) | | | 3,780,000 | | | 378 |
Lehman Brothers Holdings E-Capital Trust I
3.850%, 08/19/65 (a) (c) | | | 1,080,000 | | | 108 |
Leucadia National Corp.
8.125%, 09/15/15 | | | 520,000 | | | 417,300 |
Level 3 Financing, Inc.
9.250%, 11/01/14 (d) | | | 4,015,000 | | | 2,328,700 |
Petrobras International Finance Co.
6.125%, 10/06/16 | | | 1,190,000 | | | 1,160,250 |
Resona Preferred Global Securities Cayman, Ltd. (144A)
7.191%, 12/29/49 (a) | | | 770,000 | | | 366,588 |
Rio Tinto Finance USA, Ltd.
6.500%, 07/15/18 | | | 2,160,000 | | | 1,583,649 |
RSHB Capital S.A. for OJSC Russian Agricultural Bank (144A)
6.299%, 05/15/17 | | | 570,000 | | | 324,900 |
Shinsei Finance Cayman, Ltd. (144A)
6.418%, 01/29/49 (a) | | | 1,100,000 | | | 230,067 |
Sprint Capital Corp.
6.900%, 05/01/19 | | | 30,000 | | | 21,300 |
8.375%, 03/15/12 | | | 1,725,000 | | | 1,380,000 |
8.750%, 03/15/32 | | | 160,000 | | | 108,000 |
SunTrust Capital VIII
6.100%, 12/01/66 (a) | | | 650,000 | | | 457,606 |
*See accompanying notes to financial statements.
MSF-8
Metropolitan Series Fund, Inc.
Western Asset Management Strategic Bond Opportunities Portfolio
Schedule of Investments as of December 31, 2008
Fixed Income—(Continued)
| | | | | | |
| Security Description | | Face
Amount | | Value* |
| | | | | | |
| |
Diversified Financial Services—(Continued) | | | |
Telecom Italia Capital S.A.
6.999%, 06/04/18 (d) | | $ | 560,000 | | $ | 454,300 |
TNK-BP Finance S.A.
7.500%, 07/18/16 | | | 108,000 | | | 56,160 |
TNK-BP Finance S.A. (144A)
6.625%, 03/20/17 | | | 670,000 | | | 321,600 |
7.500%, 07/18/16 | | | 1,080,000 | | | 561,600 |
7.875%, 03/13/18 | | | 2,440,000 | | | 1,220,000 |
Tyco International Finance S.A.
6.000%, 11/15/13 | | | 2,660,000 | | | 2,495,918 |
VIP Finance Ireland, Ltd. for OJSC Vimpel Communications (144A)
8.375%, 04/30/13 | | | 1,950,000 | | | 1,248,000 |
Virgin Media Finance, Plc.
9.125%, 08/15/16 | | | 7,780,000 | | | 5,757,200 |
Wells Fargo Capital X
5.950%, 12/15/36 | | | 930,000 | | | 797,055 |
Wells Fargo Capital XV
9.750%, 12/31/49 (a) (d) | | | 3,300,000 | | | 3,333,000 |
Wind Acquisition Finance S.A. (144A)
10.750%, 12/01/15 | | | 960,000 | | | 825,600 |
| | | | | | |
| | | | | | 103,540,065 |
| | | | | | |
|
Diversified Telecommunication Services—2.8% |
AT&T, Inc.
5.500%, 02/01/18 | | | 2,570,000 | | | 2,597,306 |
Embarq Corp.
6.738%, 06/01/13 | | | 3,550,000 | | | 2,999,750 |
Frontier Communications Corp.
7.125%, 03/15/19 | | | 165,000 | | | 110,550 |
7.875%, 01/15/27 | | | 250,000 | | | 145,000 |
Nordic Telephone Co. Holdings ApS (144A)
8.875%, 05/01/16 | | | 1,070,000 | | | 749,000 |
Qwest Communications International, Inc. (Series B)
7.500%, 02/15/14 | | | 4,613,000 | | | 3,298,295 |
Royal KPN NV
8.000%, 10/01/10 | | | 990,000 | | | 999,111 |
Telecom Italia Capital S.A.
5.250%, 10/01/15 | | | 2,100,000 | | | 1,598,625 |
Verizon Communications, Inc.
5.500%, 02/15/18 | | | 970,000 | | | 932,990 |
8.950%, 03/01/39 | | | 1,910,000 | | | 2,467,128 |
Verizon Florida, LLC
6.125%, 01/15/13 (d) | | | 70,000 | | | 66,714 |
Verizon New York, Inc.
6.875%, 04/01/12 (d) | | | 1,820,000 | | | 1,810,811 |
Windstream Corp.
8.625%, 08/01/16 | | | 4,560,000 | | | 4,035,600 |
| | | | | | |
| | | | | | 21,810,880 |
| | | | | | |
| | |
Electric Utilities—2.5% | | | | | | |
Duke Energy Carolinas, LLC
5.625%, 11/30/12 | | | 370,000 | | | 376,810 |
Edison Mission Energy
7.000%, 05/15/17 (d) | | | 390,000 | | | 339,300 |
7.200%, 05/15/19 | | | 5,780,000 | | | 4,739,600 |
| | | | | | |
| Security Description | | Face
Amount | | Value* |
| | | | | | |
| | |
Electric Utilities—(Continued) | | | | | | |
Edison Mission Energy
7.625%, 05/15/27 | | $ | 190,000 | | $ | 147,250 |
Energy Future Holdings Corp.
5.550%, 11/15/14 | | | 420,000 | | | 196,236 |
Energy Future Holdings Corp. (144A)
11.250%, 11/01/17 | | | 18,230,000 | | | 8,841,550 |
Exelon Corp.
5.625%, 06/15/35 | | | 595,000 | | | 375,601 |
FirstEnergy Corp.
6.450%, 11/15/11 | | | 770,000 | | | 727,847 |
7.375%, 11/15/31 | | | 1,645,000 | | | 1,556,196 |
Mirant Mid-Atlantic Pass Through Trust
9.125%, 06/30/17 | | | 2,692,529 | | | 2,423,276 |
| | | | | | |
| | | | | | 19,723,666 |
| | | | | | |
|
Electronic Equipment, Instruments & Components—0.0% |
NXP BV
9.500%, 10/15/15 | | | 115,000 | | | 21,850 |
| | | | | | |
| | |
Energy Equipment & Services—1.0% | | | | | | |
Baker Hughes, Inc.
7.500%, 11/15/18 | | | 2,070,000 | | | 2,294,922 |
Cie Generale de Geophysique-Veritas
7.500%, 05/15/15 | | | 115,000 | | | 71,300 |
7.750%, 05/15/17 | | | 480,000 | | | 278,400 |
Kinder Morgan Energy Partners, L.P.
5.850%, 09/15/12 | | | 190,000 | | | 174,002 |
6.000%, 02/01/17 | | | 1,410,000 | | | 1,224,127 |
6.300%, 02/01/09 | | | 200,000 | | | 199,807 |
6.750%, 03/15/11 | | | 680,000 | | | 661,396 |
6.950%, 01/15/38 | | | 2,600,000 | | | 2,102,742 |
7.125%, 03/15/12 | | | 20,000 | | | 19,316 |
Pride International, Inc.
7.375%, 07/15/14 | | | 700,000 | | | 651,000 |
Transocean, Inc.
5.250%, 03/15/13 | | | 320,000 | | | 297,215 |
| | | | | | |
| | | | | | 7,974,227 |
| | | | | | |
| | |
Federal Agencies—26.5% | | | | | | |
Farmer Mac Guaranteed Notes Trust
5.125%, 04/19/17 | | | 3,400,000 | | | 3,837,308 |
Federal Home Loan Bank
5.000%, 12/21/15 | | | 3,660,000 | | | 4,099,284 |
5.500%, 07/15/36 | | | 2,690,000 | | | 3,447,318 |
Federal Home Loan Mortgage Corp.
5.000%, 12/01/34 | | | 132,798 | | | 135,937 |
5.500%, 10/01/35 | | | 1,398,040 | | | 1,432,832 |
5.500%, 07/01/37 | | | 1,826,286 | | | 1,871,347 |
5.500%, 12/01/37 | | | 3,620,021 | | | 3,709,412 |
5.776%, 02/01/37 (a) | | | 1,157,379 | | | 1,183,678 |
5.932%, 05/01/37 (a) | | | 2,903,281 | | | 2,973,939 |
6.000%, TBA | | | 3,800,000 | | | 3,914,000 |
11.565%, 06/15/21 (a) (f) | | | 67 | | | 1,468 |
Federal National Mortgage Association
5.000%, 08/01/34 | | | 317,548 | | | 324,855 |
*See accompanying notes to financial statements.
MSF-9
Metropolitan Series Fund, Inc.
Western Asset Management Strategic Bond Opportunities Portfolio
Schedule of Investments as of December 31, 2008
Fixed Income—(Continued)
| | | | | | |
| Security Description | | Face
Amount | | Value* |
| | | | | | |
| | |
Federal Agencies—(Continued) | | | | | | |
Federal National Mortgage Association
5.000%, 03/01/35 | | $ | 272,067 | | $ | 278,327 |
5.000%, 05/01/35 | | | 717,598 | | | 733,662 |
5.000%, 06/01/35 | | | 11,959,868 | | | 12,235,081 |
5.000%, 08/01/35 | | | 220,573 | | | 225,511 |
5.000%, 02/01/36 | | | 14,882,927 | | | 15,216,102 |
5.000%, 07/01/38 | | | 9,896,238 | | | 10,114,687 |
5.000%, TBA | | | 56,800,000 | | | 57,989,278 |
5.129%, 10/01/35 (a) | | | 952,159 | | | 957,387 |
5.500%, 04/01/36 | | | 8,156,584 | | | 8,198,480 |
5.500%, 11/01/36 | | | 4,058,218 | | | 4,164,919 |
5.500%, 01/01/37 | | | 6,451,815 | | | 6,621,450 |
5.500%, 08/01/37 | | | 2,669,700 | | | 2,739,893 |
6.000%, 10/01/36 | | | 13,049,880 | | | 13,450,087 |
6.000%, 07/01/37 | | | 905,670 | | | 933,394 |
6.000%, 09/01/37 | | | 674,306 | | | 694,948 |
6.000%, TBA | | | 2,200,000 | | | 2,270,625 |
6.500%, 03/01/26 | | | 14,989 | | | 15,696 |
6.500%, 03/01/36 | | | 821,361 | | | 854,087 |
6.500%, 08/01/36 | | | 868,239 | | | 902,833 |
6.500%, 10/01/36 | | | 523,504 | | | 544,362 |
6.500%, 12/01/36 | | | 598,369 | | | 622,211 |
6.500%, 05/01/37 | | | 945,017 | | | 982,616 |
6.500%, 07/01/37 | | | 947,659 | | | 985,364 |
6.500%, 08/01/37 | | | 455,994 | | | 474,137 |
6.500%, 09/01/37 | | | 1,927,602 | | | 2,004,297 |
6.500%, 10/01/37 | | | 2,554,663 | | | 2,656,307 |
7.000%, 05/01/26 | | | 3,368 | | | 3,568 |
7.500%, 12/01/29 | | | 3,969 | | | 4,208 |
7.500%, 06/01/30 | | | 6,321 | | | 6,692 |
7.500%, 08/01/30 | | | 1,149 | | | 1,216 |
7.500%, 11/01/30 | | | 26,723 | | | 28,292 |
7.500%, 02/01/31 | | | 1,891 | | | 2,002 |
8.000%, 08/01/27 | | | 4,439 | | | 4,705 |
8.000%, 01/01/31 | | | 121,120 | | | 128,132 |
8.500%, 08/01/19 | | | 84,665 | | | 90,811 |
10.400%, 04/25/19 | | | 2,808 | | | 3,037 |
Government National Mortgage Association
5.000%, TBA | | | 13,600,000 | | | 13,940,000 |
5.500%, TBA | | | 9,800,000 | | | 10,078,687 |
6.000%, TBA | | | 11,000,000 | | | 11,340,465 |
| | | | | | |
| | | | | | 209,428,934 |
| | | | | | |
| | |
Food & Staples Retailing—0.4% | | | | | | |
CVS Pass-Through Trust (144A)
6.943%, 01/10/30 | | | 2,091,891 | | | 1,315,318 |
Dollar General Corp.
11.875%, 07/15/17 (d) | | | 2,115,000 | | | 1,808,325 |
Safeway, Inc.
7.250%, 02/01/31 (d) | | | 50,000 | | | 55,491 |
| | | | | | |
| | | | | | 3,179,134 |
| | | | | | |
| | | | | | |
| Security Description | | Face
Amount | | Value* |
| | | | | | |
| | |
Food Products—0.4% | | | | | | |
Alliance One International, Inc.
11.000%, 05/15/12 | | $ | 1,480,000 | | $ | 1,228,400 |
Dole Food Co., Inc.
7.250%, 06/15/10 (d) | | | 2,535,000 | | | 1,768,162 |
8.875%, 03/15/11 | | | 150,000 | | | 93,750 |
| | | | | | |
| | | | | | 3,090,312 |
| | | | | | |
| | |
Foreign Government—0.6% | | | | | | |
Mexico Government International Bond
5.625%, 01/15/17 (d) | | | 1,260,000 | | | 1,260,000 |
5.875%, 01/15/14 | | | 760,000 | | | 777,100 |
6.750%, 09/27/34 | | | 851,000 | | | 897,805 |
10.375%, 02/17/09 | | | 238,000 | | | 239,190 |
Region of Lombardy Italy
5.804%, 10/25/32 | | | 925,000 | | | 1,148,942 |
Russian Federation
11.000%, 07/24/18 | | | 590,000 | | | 698,649 |
| | | | | | |
| | | | | | 5,021,686 |
| | | | | | |
| | |
Gas Utilities—0.2% | | | | | | |
El Paso Natural Gas Co.
8.375%, 06/15/32 | | | 590,000 | | | 509,106 |
Suburban Propane Partners, L.P.
6.875%, 12/15/13 | | | 1,682,000 | | | 1,379,240 |
| | | | | | |
| | | | | | 1,888,346 |
| | | | | | |
| | |
Government Agency—0.9% | | | | | | |
Tennessee Valley Authority
5.980%, 04/01/36 | | | 2,320,000 | | | 3,011,360 |
Virginia Housing Development Authority
6.000%, 06/25/34 | | | 3,858,904 | | | 3,763,512 |
| | | | | | |
| | | | | | 6,774,872 |
| | | | | | |
| |
Health Care Providers & Services—2.9% | | | |
Community Health Systems, Inc.
8.875%, 07/15/15 (d) | | | 965,000 | | | 887,800 |
DaVita, Inc.
6.625%, 03/15/13 | | | 405,000 | | | 384,750 |
HCA, Inc.
6.250%, 02/15/13 | | | 1,143,000 | | | 714,375 |
6.375%, 01/15/15 | | | 4,595,000 | | | 2,802,950 |
9.125%, 11/15/14 | | | 90,000 | | | 83,475 |
9.250%, 11/15/16 | | | 690,000 | | | 633,075 |
9.625%, 11/15/16 (d) | | | 6,651,000 | | | 5,187,780 |
Humana, Inc.
7.200%, 06/15/18 | | | 540,000 | | | 434,262 |
Tenet Healthcare Corp.
6.500%, 06/01/12 | | | 2,595,000 | | | 1,972,200 |
6.875%, 11/15/31 | | | 95,000 | | | 39,900 |
7.375%, 02/01/13 | | | 325,000 | | | 231,562 |
9.250%, 02/01/15 (d) | | | 4,545,000 | | | 3,658,725 |
9.875%, 07/01/14 | | | 1,280,000 | | | 1,030,400 |
*See accompanying notes to financial statements.
MSF-10
Metropolitan Series Fund, Inc.
Western Asset Management Strategic Bond Opportunities Portfolio
Schedule of Investments as of December 31, 2008
Fixed Income—(Continued)
| | | | | | |
| Security Description | | Face
Amount | | Value* |
| | | | | | |
| |
Health Care Providers & Services—(Continued) | | | |
U.S. Oncology Holdings, Inc.
8.334%, 03/15/12 (a) | | $ | 5,175,000 | | $ | 3,260,250 |
Vanguard Health Holdings Co. I, LLC
11.250%, 10/01/15 (d) (e) | | | 900,000 | | | 706,500 |
Vanguard Health Holdings Co. II, LLC
9.000%, 10/01/14 | | | 580,000 | | | 484,300 |
WellPoint, Inc.
5.875%, 06/15/17 | | | 130,000 | | | 118,318 |
| | | | | | |
| | | | | | 22,630,622 |
| | | | | | |
| | |
Hotels, Restaurants & Leisure—0.6% | | | | | | |
Boyd Gaming Corp.
6.750%, 04/15/14 (d) | | | 100,000 | | | 63,000 |
Caesars Entertainment, Inc.
8.125%, 05/15/11 (d) | | | 6,070,000 | | | 2,974,300 |
Carrols Corp.
9.000%, 01/15/13 (d) | | | 205,000 | | | 138,375 |
Inn of the Mountain Gods Resort & Casino
12.000%, 11/15/10 | | | 1,025,000 | | | 338,250 |
MGM MIRAGE
6.750%, 09/01/12 (d) | | | 320,000 | | | 224,000 |
7.625%, 01/15/17 (d) | | | 385,000 | | | 248,325 |
Station Casinos, Inc.
6.500%, 02/01/14 (d) | | | 125,000 | | | 7,187 |
7.750%, 08/15/16 (d) | | | 2,870,000 | | | 545,300 |
Turning Stone Resort Casino Enterprise (144A)
9.125%, 12/15/10 | | | 275,000 | | | 231,000 |
| | | | | | |
| | | | | | 4,769,737 |
| | | | | | |
| | |
Household Durables—0.5% | | | | | | |
Norcraft Cos., L.P.
9.000%, 11/01/11 | | | 4,635,000 | | | 3,939,750 |
Norcraft Holdings, L.P.
0/9.750%, 09/01/12 (e) | | | 225,000 | | | 167,625 |
| | | | | | |
| | | | | | 4,107,375 |
| | | | | | |
|
Independent Power Producers & Energy Traders—2.0% |
Mirant North America, LLC
7.375%, 12/31/13 | | | 400,000 | | | 384,000 |
NRG Energy, Inc.
7.250%, 02/01/14 (d) | | | 155,000 | | | 144,925 |
7.375%, 02/01/16 (d) | | | 8,790,000 | | | 8,174,700 |
SemGroup, L.P. (144A)
8.750%, 11/15/15 (c) | | | 1,125,000 | | | 39,375 |
The AES Corp.
7.750%, 03/01/14 | | | 35,000 | | | 30,800 |
7.750%, 10/15/15 | | | 520,000 | | | 436,800 |
8.000%, 10/15/17 (d) | | | 6,850,000 | | | 5,617,000 |
8.875%, 02/15/11 | | | 150,000 | | | 140,250 |
9.375%, 09/15/10 (d) | | | 403,000 | | | 382,850 |
The AES Corp. (144A)
8.000%, 06/01/20 | | | 620,000 | | | 480,500 |
| | | | | | |
| | | | | | 15,831,200 |
| | | | | | |
| | | | | | |
| Security Description | | Face
Amount | | Value* |
| | | | | | |
| | |
Industrial Conglomerates—0.3% | | | | | | |
Corporacion Andina de Fomento
6.875%, 03/15/12 | | $ | 2,900,000 | | $ | 2,805,515 |
| | | | | | |
| | |
Insurance—0.6% | | | | | | |
American International Group, Inc.
5.850%, 01/16/18 | | | 350,000 | | | 234,600 |
6.250%, 03/15/37 (d) | | | 760,000 | | | 284,067 |
American International Group, Inc. (144A)
8.250%, 08/15/18 | | | 1,930,000 | | | 1,412,603 |
The Travelers Cos., Inc.
6.250%, 03/15/67 (a) | | | 4,400,000 | | | 2,882,163 |
| | | | | | |
| | | | | | 4,813,433 |
| | | | | | |
|
Internet Software & Services—0.0% |
Expedia, Inc. (144A)
8.500%, 07/01/16 | | | 140,000 | | | 104,300 |
| | | | | | |
|
IT Services—0.6% |
Electronic Data Systems Corp.
7.125%, 10/15/09 | | | 1,270,000 | | | 1,291,114 |
First Data Corp.
9.875%, 09/24/15 (d) | | | 1,000,000 | | | 605,000 |
SunGard Data Systems, Inc.
10.250%, 08/15/15 | | | 4,120,000 | | | 2,719,200 |
| | | | | | |
| | | | | | 4,615,314 |
| | | | | | |
|
Leisure Equipment & Products—0.0% |
Seneca Gaming Corp.
7.250%, 05/01/12 | | | 225,000 | | | 181,125 |
| | | | | | |
|
Marine—0.1% |
Overseas Shipholding Group, Inc.
7.500%, 02/15/24 | | | 340,000 | | | 226,100 |
Teekay Corp.
8.875%, 07/15/11 | | | 650,000 | | | 549,250 |
| | | | | | |
| | | | | | 775,350 |
| | | | | | |
|
Media—3.9% |
Affinion Group, Inc.
10.125%, 10/15/13 | | | 500,000 | | | 365,000 |
11.500%, 10/15/15 | | | 1,060,000 | | | 637,325 |
Cablevision Systems Corp
8.000%, 04/15/12 | | | 1,210,000 | | | 1,076,900 |
CCH I, LLC
11.000%, 10/01/15 (d) | | | 2,984,000 | | | 522,200 |
Cengage Learning Aquisitions, Inc. (144A)
10.500%, 01/15/15 | | | 4,190,000 | | | 1,717,900 |
Charter Communications Operating, LLC (144A)
8.000%, 04/30/12 | | | 1,560,000 | | | 1,279,200 |
10.875%, 09/15/14 | | | 9,995,000 | | | 7,996,000 |
Clear Channel Communications, Inc.
6.250%, 03/15/11 (d) | | | 1,130,000 | | | 339,000 |
Comcast Cable Communications Holdings, Inc.
8.375%, 03/15/13 | | | 50,000 | | | 51,726 |
*See accompanying notes to financial statements.
MSF-11
Metropolitan Series Fund, Inc.
Western Asset Management Strategic Bond Opportunities Portfolio
Schedule of Investments as of December 31, 2008
Fixed Income—(Continued)
| | | | | | |
| Security Description | | Face
Amount | | Value* |
| | | | | | |
|
Media—(Continued) |
Comcast Cable Communications, LLC
8.875%, 05/01/17 | | $ | 600,000 | | $ | 640,712 |
Comcast Corp.
5.875%, 02/15/18 | | | 170,000 | | | 161,092 |
6.500%, 01/15/15 | | | 1,890,000 | | | 1,857,740 |
6.500%, 01/15/17 (d) | | | 130,000 | | | 128,403 |
CSC Holdings, Inc.
6.750%, 04/15/12 (d) | | | 350,000 | | | 320,250 |
8.125%, 08/15/09 | | | 200,000 | | | 199,000 |
CSC Holdings, Inc. (144A)
8.500%, 06/15/15 | | | 2,375,000 | | | 2,090,000 |
Dex Media West, LLC
8.500%, 08/15/10 | | | 3,240,000 | | | 1,960,200 |
9.875%, 08/15/13 | | | 267,000 | | | 63,413 |
Dex Media, Inc.
9.000%, 11/15/13 (c) | | | 295,000 | | | 54,575 |
DirecTV Holdings, LLC
8.375%, 03/15/13 (d) | | | 162,000 | | | 161,190 |
EchoStar DBS Corp.
6.625%, 10/01/14 | | | 320,000 | | | 267,200 |
7.750%, 05/31/15 | | | 4,595,000 | | | 3,905,750 |
Idearc, Inc.
8.000%, 11/15/16 (d) | | | 10,300,000 | | | 772,500 |
News America, Inc.
6.650%, 11/15/37 | | | 100,000 | | | 98,976 |
R.H. Donnelley Corp.
6.875%, 01/15/13 | | | 180,000 | | | 24,300 |
6.875%, 01/15/13 (d) | | | 45,000 | | | 6,075 |
8.875%, 01/15/16 (d) | | | 225,000 | | | 33,750 |
Time Warner Cable, Inc.
5.850%, 05/01/17 | | | 2,650,000 | | | 2,420,915 |
Time Warner Entertainment Co., L.P.
8.375%, 07/15/33 | | | 510,000 | | | 514,656 |
Time Warner, Inc.
6.875%, 05/01/12 (d) | | | 1,270,000 | | | 1,220,084 |
7.625%, 04/15/31 | | | 50,000 | | | 49,141 |
7.700%, 05/01/32 | | | 120,000 | | | 120,148 |
| | | | | | |
| | | | | | 31,055,321 |
| | | | | | |
|
Metals & Mining—2.0% |
Alcoa, Inc.
6.000%, 07/15/13 | | | 1,840,000 | | | 1,663,697 |
Evraz Group S.A.
8.875%, 04/24/13 | | | 1,200,000 | | | 624,000 |
Evraz Group S.A. (144A)
8.875%, 04/24/13 (d) | | | 2,109,000 | | | 1,075,590 |
Freeport-McMoRan Copper & Gold, Inc.
8.375%, 04/01/17 | | | 3,315,000 | | | 2,718,300 |
Novelis, Inc.
7.250%, 02/15/15 | | | 4,345,000 | | | 2,520,100 |
Ryerson, Inc. (144A)
12.000%, 11/01/15 | | | 1,800,000 | | | 1,111,500 |
Steel Dynamics, Inc.
6.750%, 04/01/15 | | | 370,000 | | | 255,300 |
7.375%, 11/01/12 | | | 180,000 | | | 131,400 |
| | | | | | |
| Security Description | | Face
Amount | | Value* |
| | | | | | |
|
Metals & Mining—(Continued) |
Steel Dynamics, Inc. (144A)
7.750%, 04/15/16 | | $ | 3,300,000 | | $ | 2,285,250 |
Vale Overseas, Ltd.
6.875%, 11/21/36 | | | 2,750,000 | | | 2,496,175 |
Vedanta Resources, Plc. (144A)
8.750%, 01/15/14 | | | 1,210,000 | | | 726,000 |
| | | | | | |
| | | | | | 15,607,312 |
| | | | | | |
| | |
Multi-Utilities—1.1% | | | | | | |
Dominion Resources, Inc.
5.700%, 09/17/12 | | | 1,350,000 | | | 1,336,743 |
8.875%, 01/15/19 | | | 1,570,000 | | | 1,693,071 |
Dynegy Holdings, Inc.
7.125%, 05/15/18 | | | 115,000 | | | 70,150 |
7.750%, 06/01/19 | | | 4,075,000 | | | 2,811,750 |
Dynegy-Roseton Danskammer Pass-Through Trust
7.670%, 11/08/16 | | | 500,000 | | | 355,312 |
Pacific Gas & Electric Co.
5.625%, 11/30/17 | | | 1,480,000 | | | 1,515,803 |
5.800%, 03/01/37 | | | 430,000 | | | 445,999 |
6.050%, 03/01/34 | | | 770,000 | | | 817,785 |
| | | | | | |
| | | | | | 9,046,613 |
| | | | | | |
| | |
Multiline Retail—0.4% | | | | | | |
The Neiman Marcus Group, Inc.
7.125%, 06/01/28 | | | 3,810,000 | | | 1,790,700 |
9.000%, 10/15/15 (d) | | | 3,185,000 | | | 1,401,400 |
| | | | | | |
| | | | | | 3,192,100 |
| | | | | | |
| | |
Office Electronics—0.0% | | | | | | |
Xerox Corp.
6.400%, 03/15/16 | | | 360,000 | | | 280,800 |
| | | | | | |
| | |
Oil, Gas & Consumable Fuels—4.3% | | | | | | |
Anadarko Petroleum Corp.
5.950%, 09/15/16 | | | 60,000 | | | 52,998 |
6.450%, 09/15/36 | | | 910,000 | | | 717,839 |
Apache Corp.
5.250%, 04/15/13 | | | 680,000 | | | 689,026 |
5.625%, 01/15/17 (d) | | | 2,620,000 | | | 2,637,596 |
Belden & Blake Corp.
8.750%, 07/15/12 | | | 1,450,000 | | | 993,250 |
Chesapeake Energy Corp.
6.250%, 01/15/18 | | | 25,000 | | | 18,500 |
6.375%, 06/15/15 | | | 425,000 | | | 335,750 |
6.500%, 08/15/17 | | | 450,000 | | | 344,250 |
6.875%, 01/15/16 | | | 2,250,000 | | | 1,800,000 |
6.875%, 11/15/20 | | | 2,420,000 | | | 1,742,400 |
ConocoPhillips Holding Co.
6.950%, 04/15/29 | | | 1,230,000 | | | 1,323,604 |
El Paso Corp.
7.000%, 06/15/17 | | | 2,410,000 | | | 1,886,078 |
7.375%, 12/15/12 (d) | | | 50,000 | | | 43,181 |
7.750%, 01/15/32 | | | 179,000 | | | 116,193 |
*See accompanying notes to financial statements.
MSF-12
Metropolitan Series Fund, Inc.
Western Asset Management Strategic Bond Opportunities Portfolio
Schedule of Investments as of December 31, 2008
Fixed Income—(Continued)
| | | | | | |
| Security Description | | Face
Amount | | Value* |
| | | | | | |
| |
Oil, Gas & Consumable Fuels—(Continued) | | | |
El Paso Corp.
7.800%, 08/01/31 | | $ | 45,000 | | $ | 29,318 |
7.875%, 06/15/12 (d) | | | 575,000 | | | 516,336 |
Enterprise Products Operating, LLC
9.750%, 01/31/14 | | | 2,630,000 | | | 2,678,097 |
Exco Resources, Inc.
7.250%, 01/15/11 | | | 960,000 | | | 748,800 |
Hess Corp.
6.650%, 08/15/11 (d) | | | 2,330,000 | | | 2,329,077 |
7.300%, 08/15/31 | | | 960,000 | | | 873,462 |
7.875%, 10/01/29 | | | 240,000 | | | 230,396 |
Kerr-McGee Corp.
6.950%, 07/01/24 | | | 500,000 | | | 438,424 |
7.875%, 09/15/31 | | | 2,270,000 | | | 2,089,642 |
Occidental Petroleum Corp.
7.000%, 11/01/13 | | | 2,650,000 | | | 2,892,329 |
OPTI Canada, Inc.
7.875%, 12/15/14 | | | 430,000 | | | 219,300 |
8.250%, 12/15/14 | | | 310,000 | | | 167,400 |
Peabody Energy Corp.
6.875%, 03/15/13 (d) | | | 120,000 | | | 113,700 |
Pemex Project Funding Master Trust
6.625%, 06/15/35 | | | 260,000 | | | 220,090 |
6.625%, 06/15/35 | | | 150,000 | | | 126,975 |
Quicksilver Resources, Inc.
7.125%, 04/01/16 | | | 250,000 | | | 133,750 |
SandRidge Energy, Inc.
8.625%, 04/01/15 | | | 2,000,000 | | | 1,050,000 |
Valero Energy Corp.
4.750%, 06/15/13 | | | 50,000 | | | 45,942 |
VeraSun Energy Corp.
9.875%, 12/15/12 (c) | | | 800,000 | | | 480,000 |
Whiting Peteroleum Corp.
7.000%, 02/01/14 (d) | | | 205,000 | | | 144,525 |
7.250%, 05/01/12 (d) | | | 300,000 | | | 223,500 |
Williams Cos., Inc.
7.125%, 09/01/11 | | | 50,000 | | | 46,000 |
7.500%, 01/15/31 | | | 925,000 | | | 619,750 |
7.625%, 07/15/19 (d) | | | 125,000 | | | 97,656 |
7.750%, 06/15/31 | | | 1,410,000 | | | 965,850 |
7.875%, 09/01/21 | | | 1,091,000 | | | 834,615 |
8.750%, 03/15/32 | | | 455,000 | | | 338,975 |
XTO Energy, Inc.
5.650%, 04/01/16 | | | 2,190,000 | | | 2,009,255 |
6.250%, 08/01/17 | | | 20,000 | | | 19,206 |
6.500%, 12/15/18 | | | 280,000 | | | 271,046 |
6.750%, 08/01/37 | | | 200,000 | | | 187,313 |
7.500%, 04/15/12 | | | 390,000 | | | 385,460 |
| | | | | | |
| | | | | | 34,226,854 |
| | | | | | |
| | |
Paper & Forest Products—0.9% | | | | | | |
Abitibi-Consolidated Co. of Canada (144A)
13.750%, 04/01/11 (a) | | | 1,580,000 | | | 1,011,200 |
Appleton Papers, Inc.
9.750%, 06/15/14 (d) | | | 4,280,000 | | | 2,503,800 |
| | | | | | |
| Security Description | | Face
Amount | | Value* |
| | | | | | |
| | |
Paper & Forest Products—(Continued) | | | | | | |
NewPage Corp.
9.443%, 05/01/12 (a) | | $ | 1,090,000 | | $ | 416,925 |
10.000%, 05/01/12 | | | 5,080,000 | | | 2,235,200 |
Weyerhaeuser Co.
6.750%, 03/15/12 | | | 680,000 | | | 608,702 |
| | | | | | |
| | | | | | 6,775,827 |
| | | | | | |
| | |
Pharmaceuticals—0.6% | | | | | | |
Abbott Laboratories
5.600%, 11/30/17 (d) | | | 3,150,000 | | | 3,408,864 |
Wyeth
5.500%, 03/15/13 (a) | | | 50,000 | | | 50,931 |
5.950%, 04/01/37 (d) | | | 1,190,000 | | | 1,321,241 |
| | | | | | |
| | | | | | 4,781,036 |
| | | | | | |
| | |
Real Estate Investment Trusts—0.3% | | | | | | |
Boston Properties, L.P.
6.250%, 01/15/13 | | | 65,000 | | | 48,253 |
iStar Financial, Inc.
5.150%, 03/01/12 (d) | | | 50,000 | | | 15,750 |
Ventas Realty, L.P.
9.000%, 05/01/12 | | | 3,050,000 | | | 2,714,500 |
| | | | | | |
| | | | | | 2,778,503 |
| | | | | | |
|
Real Estate Management & Development—0.0% |
Realogy Corp.
10.500%, 04/15/14 | | | 660,000 | | | 113,850 |
11.000%, 04/15/14 | | | 575 | | | 66 |
12.375%, 04/15/15 | | | 1,400,000 | | | 189,000 |
| | | | | | |
| | | | | | 302,916 |
| | | | | | |
| | |
Road & Rail—0.4% | | | | | | |
The Hertz Corp.
10.500%, 01/01/16 (d) | | | 7,170,000 | | | 3,271,312 |
| | | | | | |
|
Semiconductors & Semiconductor Equipment—0.1% |
Freescale Semiconductor, Inc.
8.875%, 12/15/14 | | | 120,000 | | | 52,800 |
Sensata Technologies BV
8.000%, 05/01/14 | | | 910,000 | | | 409,500 |
| | | | | | |
| | | | | | 462,300 |
| | | | | | |
| | |
Specialty Retail—0.1% | | | | | | |
Blockbuster, Inc.
9.000%, 09/01/12 (d) | | | 1,490,000 | | | 722,650 |
Limited Brands, Inc.
6.950%, 03/01/33 | | | 60,000 | | | 28,130 |
| | | | | | |
| | | | | | 750,780 |
| | | | | | |
| |
Textiles, Apparel & Luxury Goods—0.0% | | | |
Oxford Industries, Inc.
8.875%, 06/01/11 | | | 120,000 | | | 90,600 |
| | | | | | |
*See accompanying notes to financial statements.
MSF-13
Metropolitan Series Fund, Inc.
Western Asset Management Strategic Bond Opportunities Portfolio
Schedule of Investments as of December 31, 2008
Fixed Income—(Continued)
| | | | | | |
| Security Description | | Face
Amount | | Value* |
| | | | | | |
| | |
Thrifts & Mortgage Finance—0.1% | | | | | | |
Countrywide Financial Corp.
4.348%, 01/05/09 (a) | | $ | 460,000 | | $ | 460,000 |
Countrywide Home Loans, Inc.
4.000%, 03/22/11 | | | 75,000 | | | 71,400 |
| | | | | | |
| | | | | | 531,400 |
| | | | | | |
| | |
Tobacco—0.5% | | | | | | |
Altria Group, Inc.
9.700%, 11/10/18 | | | 2,930,000 | | | 3,166,832 |
Reynolds American, Inc.
6.750%, 06/15/17 | | | 575,000 | | | 456,427 |
| | | | | | |
| | | | | | 3,623,259 |
| | | | | | |
| |
Trading Companies & Distributors—0.4% | | | |
H&E Equipment Services, Inc.
8.375%, 07/15/16 (d) | | | 500,000 | | | 265,000 |
RSC Equipment Rental, Inc.
9.500%, 12/01/14 (d) | | | 5,250,000 | | | 2,887,500 |
| | | | | | |
| | | | | | 3,152,500 |
| | | | | | |
| | |
U.S. Treasury—6.7% | | | | | | |
U.S. Treasury Bonds
4.750%, 02/15/37 (d) | | | 40,000 | | | 55,738 |
5.375%, 02/15/31 (d) | | | 1,740,000 | | | 2,390,868 |
5.500%, 08/15/28 (d) (i) | | | 19,880,000 | | | 26,869,055 |
6.125%, 11/15/27 (d) (i) | | | 400,000 | | | 573,562 |
6.375%, 08/15/27 | | | 300,000 | | | 439,031 |
8.875%, 08/15/17 (d) | | | 340,000 | | | 506,148 |
U.S. Treasury Inflation Indexed Bonds (TII)
1.750%, 01/15/28 (d) (i) | | | 9,038,209 | | | 8,350,455 |
2.000%, 01/15/26 (d) (i) | | | 1,539,057 | | | 1,449,720 |
2.375%, 01/15/27 (i) | | | 4,388,434 | | | 4,408,660 |
U.S. Treasury Inflation Indexed Notes (TII)
2.000%, 01/15/16 (d) | | | 4,464,358 | | | 4,275,319 |
2.500%, 07/15/16 (d) | | | 718,741 | | | 713,070 |
2.625%, 07/15/17 | | | 1,996,523 | | | 2,045,969 |
U.S. Treasury Notes
4.750%, 05/31/12 (d) | | | 640,000 | | | 716,350 |
| | | | | | |
| | | | | | 52,793,945 |
| | | | | | |
|
Wireless Telecommunication Services—0.2% |
America Movil S.A.B. de C.V.
5.625%, 11/15/17 | | | 880,000 | | | 782,346 |
American Tower Corp.
7.500%, 05/01/12 (d) | | | 150,000 | | | 147,750 |
New Cingular Wireless Services, Inc.
8.750%, 03/01/31 | | | 50,000 | | | 62,504 |
Nextel Communications, Inc.
6.875%, 10/31/13 | | | 1,295,000 | | | 550,375 |
7.375%, 08/01/15 | | | 800,000 | | | 336,000 |
| | | | | | |
| | | | | | 1,878,975 |
| | | | | | |
| | | | | | |
| Security Description | | Face
Amount | | Value* |
| | | | | | |
| | |
Yankee—0.3% | | | | | | |
Methanex Corp.
8.750%, 08/15/12 | | $ | 225,000 | | $ | 213,750 |
Morgan Stanley Bank AG for OAO Gazprom
9.625%, 03/01/13 | | | 170,000 | | | 154,700 |
Shell International Finance BV
6.375%, 12/15/38 | | | 1,690,000 | | | 1,901,231 |
Smurfit Kappa Treasury Funding, Ltd.
7.500%, 11/20/25 | | | 275,000 | | | 162,250 |
| | | | | | |
| | | | | | 2,431,931 |
| | | | | | |
Total Fixed Income
(Identified Cost $1,091,719,701) | | | | | | 839,420,591 |
| | | | | | |
| | |
| Term Loans—0.2% | | | | | | |
| | |
IT Services—0.2% | | | | | | |
First Data Corp.
7.960%, 09/24/14 (a) | | | 2,376,000 | | | 1,521,488 |
| | | | | | |
Total Term Loans
(Identified Cost $2,280,960) | | | | | | 1,521,488 |
| | | | | | |
| | |
| Preferred Stock—0.1% | | | | | | |
| Security Description | | Shares | | Value* |
| |
Commercial & Professional Services—0.1% | | | |
Preferred Blocker, Inc. | | | 2,564 | | | 552,300 |
| | | | | | |
| | |
Diversified Financial Services—0.0% | | | | | | |
TCR Holdings (Class B) (g) (h) | | | 840 | | | 1 |
TCR Holdings (Class C) (b) (g) (h) | | | 462 | | | 0 |
TCR Holdings (Class D) (g) (h) | | | 1,219 | | | 1 |
TCR Holdings (Class E) (g) (h) | | | 2,521 | | | 3 |
| | | | | | |
| | | | | | 5 |
| | | | | | |
| | |
Thrifts & Mortgage Finance—0.0% | | | | | | |
Federal Home Loan Mortgage Corp. | | | 117,175 | | | 45,698 |
Federal National Mortgage Association (d) | | | 84,850 | | | 70,426 |
Federal National Mortgage Association (144A) (d) | | | 3,400 | | | 2,656 |
| | | | | | |
| | | | | | 118,780 |
| | | | | | |
Total Preferred Stock
(Identified Cost $5,784,105) | | | | | | 671,085 |
| | | | | | |
| |
| Fixed Income—Convertible—0.1% | | | |
| Security Description | | Face
Amount | | Value* |
| | |
Automobiles—0.0% | | | | | | |
Ford Motor Co.
4.250%, 12/15/36 | | $ | 170,000 | | | 43,775 |
| | | | | | |
*See accompanying notes to financial statements.
MSF-14
Metropolitan Series Fund, Inc.
Western Asset Management Strategic Bond Opportunities Portfolio
Schedule of Investments as of December 31, 2008
Fixed Income—Convertible—(Continued)
| | | | | | | |
| Security Description | | Face
Amount | | Value* | |
| | | | | | | |
| |
Diversified Telecommunication Services—0.1% | | | | |
Qwest Communications International, Inc.
3.500%, 11/15/25 | | $ | 1,370,000 | | $ | 1,136,788 | |
| | | | | | | |
Total Fixed Income—Convertible
(Identified Cost $1,158,484) | | | | | | 1,180,563 | |
| | | | | | | |
| | |
| Common Stock—0.0% | | | | | | | |
| Security Description | | Shares | | Value* | |
| | |
Chemicals—0.0% | | | | | | | |
Applied Extrusion Technologies, Inc. (Class B) (g) (h) | | | 2,424 | | | 16,968 | |
| | | | | | | |
Total Common Stock
(Identified Cost $98,629) | | | | | | 16,968 | |
| | | | | | | |
| | |
| Warrants—0.0% | | | | | | | |
| |
Wireless Telecommunication Services – 0.0% | | | | |
Leap Wireless International, Inc. (144A) (b) (g) (h) | | | 125 | | | 0 | |
| | | | | | | |
| | |
Yankee—0.0% | | | | | | | |
Republic of Venezuela (g) | | | 3,750 | | | 93,750 | |
| | | | | | | |
Total Warrants
(Identified Cost $40,147) | | | | | | 93,750 | |
| | | | | | | |
| |
| Short Term Investments—9.3% | | | | |
| Security Description | | Shares/Face
Amount | | Value* | |
| | |
Mutual Funds—5.8% | | | | | | | |
State Street Navigator Securities Lending Prime Portfolio (j) | | | 45,417,390 | | | 45,417,390 | |
| | | | | | | |
| | |
Repurchase Agreement—3.5% | | | | | | | |
State Street Repurchase Agreement dated 12/31/08 at 0.005% to be repurchased at $28,004,008 on 01/02/09, collateralized by $28,615,000 U.S. Treasury Bill due 07/30/09 with a value of $28,566,355. | | $ | 28,004,000 | | | 28,004,000 | |
| | | | | | | |
Total Short Term Investments
(Identified Cost $73,421,390) | | | | | | 73,421,390 | |
| | | | | | | |
Total Investments—115.8%
(Identified Cost $1,174,503,416) (k) | | | | | | 916,325,835 | |
Liabilities in excess of other assets | | | | | | (124,842,801 | ) |
| | | | | | | |
| Total Net Assets—100% | | | | | $ | 791,483,034 | |
| | | | | | | |
| (a) | Variable or Floating Rate Security. Rate disclosed is as of December 31, 2008. |
| (c) | Non-Income Producing; Defaulted Bond. |
| (d) | A portion or all of the security was on loan. As of December 31, 2008, the market value of securities loaned was $44,397,476 and the collateral received consisted of cash in the amount of $45,417,390. The cash collateral is invested in a money market fund managed by an affiliate of the custodian. |
| (e) | Step Bond: Coupon rate is set for an initial period and then increased to a higher coupon rate at a specified date. Rate disclosed is as of December 31, 2008. |
| (f) | Interest Only Certificate. This security receives monthly interest payments but is not entitled to principal payments. |
| (h) | Security was valued in good faith under procedures established by the Board of Directors. |
| (i) | A portion or all of the security was pledged as collateral against open futures contracts. |
| (j) | Represents investment of cash collateral received from securities lending transactions. |
| (k) | The aggregate cost of investments for federal income tax purposes as of December 31, 2008 was $1,175,904,101 and the composition of unrealized appreciation and depreciation of investment securities was $14,591,232 and $(274,169,498), respectively. |
| (144A)— | Securities exempt from registration under Rule 144A of the Securities Act of 1933. These securities may be resold in transactions exempt from registration, normally to qualified institutional buyers. As of December 31, 2008, the market value of 144A securities was $95,121,952, which is 12.0% of total net assets. |
| (TBA)— | A contract for the purchase or sale of a Mortgage Backed Security to be delivered at a future date but does not include a specified pool or precise amount to be delivered. |
| (TII)— | A Treasury Inflation Index is a security with a fixed interest rate and the principal is adjusted for inflation. At maturity, the security will be redeemed at the greater of the inflation adjusted principal or par amount at original issue. |
*See accompanying notes to financial statements.
MSF-15
Metropolitan Series Fund, Inc.
Western Asset Management Strategic Bond Opportunities Portfolio
Schedule of Investments as of December 31, 2008
Futures Contracts
| | | | | | | | | | | | | | | | | |
Futures Contracts—Long | | Expiration Date | | Number of
Contracts | | | Contract
Amount | | | Valuation as of
12/31/2008 | | | Unrealized
Appreciation/
(Depreciation) | |
90 Day Eurodollar Futures | | 3/16/2009 | | 617 | | | $ | 149,345,030 | | | $ | 152,614,950 | | | $ | 3,269,920 | |
90 Day Eurodollar Futures | | 6/15/2009 | | 10 | | | | 2,402,700 | | | | 2,471,750 | | | | 69,050 | |
90 Day Eurodollar Futures | | 9/14/2009 | | 10 | | | | 2,399,325 | | | | 2,468,625 | | | | 69,300 | |
German Euro Bund Futures | | 3/6/2009 | | 217 | | | | 37,709,101 | | | | 37,656,822 | | | | (52,279 | ) |
U.S. Treasury Notes 2 Year Futures | | 3/31/2009 | | 353 | | | | 75,859,886 | | | | 76,976,063 | | | | 1,116,177 | |
U.S. Treasury Notes 5 Year Futures | | 3/31/2009 | | 71 | | | | 8,391,632 | | | | 8,452,883 | | | | 61,251 | |
U.S. Treasury Bond 30 Year Futures | | 3/20/2009 | | 40 | | | | 5,010,321 | | | | 5,521,875 | | | | 511,554 | |
| | | | | |
Futures Contracts—Short | | | | | | | | | | | | | | |
U.S. Treasury Notes 10 Year Futures | | 3/20/2009 | | (87 | ) | | | (11,119,327 | ) | | | (10,940,250 | ) | | | 179,077 | |
| | | | | | | | | | | | | | | | | |
Net Unrealized Appreciation | | | $ | 5,224,050 | |
| | | | | | | | | | | | | | | | | |
Options Written
| | | | | | | | | | | | | | | | | |
Options Written—Calls | | Expiration Date | | Number of
Contracts | | | Premiums
Received | | | Valuation as of
12/31/2008 | | | Unrealized
Appreciation/
(Depreciation) | |
Eurodollar Futures 97.625 Call | | 9/14/2009 | | (10 | ) | | $ | (7,700) | | | $ | (29,438) | | | $ | (21,738) | |
Eurodollar Futures 98.25 Call | | 3/16/2009 | | (497 | ) | | | (356,651 | ) | | | (900,812 | ) | | | (544,161 | ) |
U.S. Treasury Notes 10 Year Futures 118 Call | | 2/20/2009 | | (453 | ) | | | (421,774 | ) | | | (3,716,016 | ) | | | (3,294,242 | ) |
| | | | | |
Options Written—Puts | | | | | | | | | | | | | | |
Eurodollar Futures 96.75 Put | | 3/16/2009 | | (736 | ) | | | (480,088 | ) | | | (4,600 | ) | | | 475,488 | |
U.S. Treasury Notes 10 Year Futures 110 Put | | 2/20/2009 | | (431 | ) | | | (585,045 | ) | | | (53,875 | ) | | | 531,170 | |
U.S. Treasury Notes 10 Year Futures 111 Put | | 2/20/2009 | | (110 | ) | | | (190,286 | ) | | | (15,469 | ) | | | 174,817 | |
| | | | | | | | | | | | | | | | | |
Net Unrealized Depreciation | | | $ | (2,678,666 | ) |
| | | | | | | | | | | | | | | | | |
The Portfolio adopted the provisions of Statement of Financial Accounting Standards No. 157, “Fair Value Measurements” (FAS 157), effective with the beginning of the Portfolio’s fiscal year. FAS 157 establishes a framework for measuring fair value and expands disclosures about fair value measurements in financial statements. The three levels of the hierarchy under FAS 157 are described below:
Level 1 - quoted prices in active markets for identical securities
Level 2 - other significant observable inputs (including quoted prices for similar securities, interest rates, credit risk, etc.)
Level 3 - significant unobservable inputs (including the Portfolio’s own assumptions in determining the fair value of investments)
The inputs or methodology used for valuing securities are not necessarily an indication of the risk associated with investing in those securities.
The following is a summary of the inputs used to value the Portfolio’s net assets as of December 31, 2008:
| | | | | | |
| Valuation Inputs | | Investments In
Securities | | Other Financial
Instruments* |
Level 1 - Quoted Prices | | $ | 108,885,421 | | $ | 2,545,384 |
Level 2 - Other Significant Observable Inputs | | | 805,452,750 | | | 0 |
Level 3 - Significant Unobservable Inputs | | | 1,987,664 | | | 0 |
Total | | $ | 916,325,835 | | $ | 2,545,384 |
* Other financial instruments are derivative instruments not reflected in the Schedule of Investments, such as futures, forwards, swap contracts and written options, which are valued based on the unrealized appreciation/depreciation on the instrument.
Following is a reconciliation of Level 3 assets for which significant unobservable inputs were used to determine fair value:
| | | | | | | |
| | | Investments In
Securities | | | Other Financial
Instruments |
Balance as of January 1, 2008 | | $ | 2,444,378 | | | $ | 0 |
Transfers in (Out) of Level 3 | | | 5,541,120 | | | | 0 |
Accrued discounts/premiums | | | (7,101 | ) | | | 0 |
Realized Gain (Loss) | | | (1,956,033 | ) | | | 0 |
Change in unrealized appreciation (depreciation) | | | (4,064,382 | ) | | | 0 |
Net Purchases (Sales) | | | 29,682 | | | | 0 |
Balance as of December 31, 2008 | | $ | 1,987,664 | | | $ | 0 |
See accompanying notes to financial statements.
MSF-16
Metropolitan Series Fund, Inc.
Western Asset Management Strategic Bond Opportunities Portfolio
Statement of Assets & Liabilities
December 31, 2008
| | | | | | | |
Assets | | | | | | | |
Investments at value (a) (b) | | | | | $ | 916,325,835 | |
Cash | | | | | | 3,434,089 | |
Receivable for: | | | | | | | |
Securities sold | | | | | | 313,414 | |
Fund shares sold | | | | | | 302,269 | |
Accrued interest and dividends | | | | | | 13,219,751 | |
Foreign taxes | | | | | | 39,783 | |
Futures variation margin | | | | | | 9,179,731 | |
| | | | | | | |
Total Assets | | | | | | 942,814,872 | |
Liabilities | | | | | | | |
Payable for: | | | | | | | |
Securities purchased | | $ | 98,227,922 | | | | |
Fund shares redeemed | | | 2,462,743 | | | | |
Withholding taxes | | | 9,905 | | | | |
Collateral for securities loaned | | | 45,417,390 | | | | |
Options written, at fair value (c) | | | 4,720,210 | | | | |
Accrued expenses: | | | | | | | |
Management fees | | | 397,538 | | | | |
Service and distribution fees | | | 45,120 | | | | |
Deferred directors’ fees | | | 9,702 | | | | |
Other expenses | | | 41,308 | | | | |
| | | | | | | |
Total Liabilities | | | | | | 151,331,838 | |
| | | | | | | |
Net Assets | | | | | $ | 791,483,034 | |
| | | | | | | |
Net assets consists of: | | | | | | | |
Capital paid in | | | | | $ | 966,571,956 | |
Undistributed net investment income | | | | | | 58,492,452 | |
Accumulated net realized gains | | | | | | 22,008,556 | |
Unrealized depreciation on investments, futures contracts, options and foreign currency | | | | | | (255,589,930 | ) |
| | | | | | | |
Net Assets | | | | | $ | 791,483,034 | |
| | | | | | | |
| Computation of offering price: | | | | | | | |
Class A | | | | | | | |
Net asset value and redemption price per share ($541,022,856 divided by 52,506,407 shares outstanding) | | | | | $ | 10.30 | |
| | | | | | | |
Class B | | | | | | | |
Net asset value and redemption price per share ($170,286,347 divided by 16,598,724 shares outstanding) | | | | | $ | 10.26 | |
| | | | | | | |
Class E | | | | | | | |
Net asset value and redemption price per share ($80,173,831 divided by 7,803,031 shares outstanding) | | | | | $ | 10.27 | |
| | | | | | | |
(a) Identified cost of investments | | | | | $ | 1,174,503,416 | |
| | | | | | | |
(b) Includes cash collateral for securities loaned of | | | | | $ | 45,417,390 | |
| | | | | | | |
(c) Premiums received on written options | | | | | $ | 2,041,544 | |
| | | | | | | |
Statement of Operations
For the Year Ended December 31, 2008
| | | | | | | | |
Investment Income | | | | | | | | |
Dividends | | | | | | $ | 312,781 | |
Interest | | | | | | | 68,204,592 | (a) |
| | | | | | | | |
| | | | | | | 68,517,373 | |
Expenses | | | | | | | | |
Management fees | | $ | 5,895,684 | | | | | |
Service and distribution fees—Class B | | | 541,160 | | | | | |
Service and distribution fees—Class E | | | 162,726 | | | | | |
Directors’ fees and expenses | | | 30,193 | | | | | |
Custodian | | | 141,718 | | | | | |
Audit and tax services | | | 39,791 | | | | | |
Legal | | | 17,170 | | | | | |
Printing | | | 196,339 | | | | | |
Insurance | | | 11,473 | | | | | |
Miscellaneous | | | 16,443 | | | | | |
| | | | | | | | |
Total expenses | | | | | | | 7,052,697 | |
| | | | | | | | |
Net Investment Income | | | | | | | 61,464,676 | |
| | | | | | | | |
Realized and Unrealized Gain (Loss) | | | | | | | | |
| Realized gain (loss) on: | | | | | | | | |
Investments—net | | | (6,007,046 | ) | | | | |
Futures contracts—net | | | 26,655,501 | | | | | |
Foreign currency transactions—net | | | (2,980,929 | ) | | | | |
Options—net | | | 1,851,206 | | | | 19,518,732 | |
| | | | | | | | |
| Change in unrealized appreciation (depreciation) on: | | | | | | | | |
Investments—net | | | (242,935,061 | ) | | | | |
Futures contracts—net | | | 5,909,203 | | | | | |
Foreign currency transactions—net | | | 42,266 | | | | | |
Options—net | | | (2,007,050 | ) | | | (238,990,642 | ) |
| | | | | | | | |
Net loss | | | | | | | (219,471,910 | ) |
| | | | | | | | |
Net Decrease in Net Assets From Operations | | | | | | $ | (158,007,234 | ) |
| | | | | | | | |
| (a) | Includes income on securities loaned of $953,595. |
See accompanying notes to financial statements.
MSF-17
Metropolitan Series Fund, Inc.
Western Asset Management Strategic Bond Opportunities Portfolio
Statements of Changes in Net Assets
| | | | | | | | |
| | | Year ended
December 31,
2008 | | | Year ended
December 31,
2007 | |
From Operations | | | | | | | | |
Net investment income | | $ | 61,464,676 | | | $ | 42,332,494 | |
Net realized gain | | | 19,518,732 | | | | 5,826,853 | |
Change in unrealized depreciation | | | (238,990,642 | ) | | | (15,227,645 | ) |
| | | | | | | | |
Increase (decrease) in net assets from operations | | | (158,007,234 | ) | | | 32,931,702 | |
| | | | | | | | |
From Distributions to Shareholders | | | | | | | | |
Net investment income | | | | | | | | |
Class A | | | (28,408,409 | ) | | | (12,132,873 | ) |
Class B | | | (8,483,742 | ) | | | (5,326,759 | ) |
Class E | | | (4,435,092 | ) | | | (3,551,481 | ) |
| | | | | | | | |
| | | (41,327,243 | ) | | | (21,011,113 | ) |
| | | | | | | | |
Net realized gain | | | | | | | | |
Class A | | | (4,191,405 | ) | | | (418,375 | ) |
Class B | | | (1,336,607 | ) | | | (202,282 | ) |
Class E | | | (680,867 | ) | | | (129,537 | ) |
| | | | | | | | |
| | | (6,208,879 | ) | | | (750,194 | ) |
| | | | | | | | |
Total distributions | | | (47,536,122 | ) | | | (21,761,307 | ) |
| | | | | | | | |
Increase (decrease) in net assets from capital share transactions | | | (69,742,945 | ) | | | 352,934,887 | |
| | | | | | | | |
Net increase (decrease) in net assets | | | (275,286,301 | ) | | | 364,105,282 | |
| | |
Net Assets | | | | | | | | |
Beginning of the period | | | 1,066,769,335 | | | | 702,664,053 | |
| | | | | | | | |
End of the period | | $ | 791,483,034 | | | $ | 1,066,769,335 | |
| | | | | | | | |
Undistributed Net Investment Income | | | | | | | | |
End of the period | | $ | 58,492,452 | | | $ | 42,183,643 | |
| | | | | | | | |
Other Information:
Capital Shares
Transactions in capital shares were as follows:
| | | | | | | | | | | | | | |
| | | Year ended
December 31, 2008 | | | Year ended
December 31, 2007 | |
| | | Shares | | | $ | | | Shares | | | $ | |
Class A | | | | | | | | | | | | | | |
Sales | | 13,155,483 | | | $ | 156,957,768 | | | 32,064,594 | | | $ | 402,583,204 | |
Reinvestments | | 2,707,626 | | | | 32,599,814 | | | 1,006,516 | | | | 12,551,248 | |
Redemptions | | (18,154,270 | ) | | | (206,280,393 | ) | | (7,446,566 | ) | | | (93,255,284 | ) |
| | | | | | | | | | | | | | |
Net increase (decrease) | | (2,291,161 | ) | | $ | (16,722,811 | ) | | 25,624,544 | | | $ | 321,879,168 | |
| | | | | | | | | | | | | | |
Class B | | | | | | | | | | | | | | |
Sales | | 1,612,409 | | | $ | 19,385,190 | | | 6,040,423 | | | $ | 75,317,405 | |
Reinvestments | | 817,681 | | | | 9,820,349 | | | 444,814 | | | | 5,529,041 | |
Redemptions | | (4,895,477 | ) | | | (55,151,766 | ) | | (3,276,505 | ) | | | (40,875,803 | ) |
| | | | | | | | | | | | | | |
Net increase (decrease) | | (2,465,387 | ) | | $ | (25,946,227 | ) | | 3,208,732 | | | $ | 39,970,643 | |
| | | | | | | | | | | | | | |
Class E | | | | | | | | | | | | | | |
Sales | | 477,667 | | | $ | 5,666,238 | | | 1,544,488 | | | $ | 19,309,344 | |
Reinvestments | | 425,621 | | | | 5,115,959 | | | 295,902 | | | | 3,681,018 | |
Redemptions | | (3,313,362 | ) | | | (37,856,104 | ) | | (2,551,275 | ) | | | (31,905,286 | ) |
| | | | | | | | | | | | | | |
Net decrease | | (2,410,074 | ) | | $ | (27,073,907 | ) | | (710,885 | ) | | $ | (8,914,924 | ) |
| | | | | | | | | | | | | | |
Increase (decrease) derived from capital share transactions | | | | | $ | (69,742,945 | ) | | | | | $ | 352,934,887 | |
| | | | | | | | | | | | | | |
See accompanying notes to financial statements.
MSF-18
Metropolitan Series Fund, Inc.
Western Asset Management Strategic Bond Opportunities Portfolio
Financial Highlights
| | | | | | | | | | | | | | | | | | | | |
| | | Class A | |
| | | Year ended December 31, | |
| | | 2008 | | | 2007 | | | 2006 | | | 2005 | | | 2004 | |
Net Asset Value, Beginning of Period | | $ | 12.70 | | | $ | 12.58 | | | $ | 12.72 | | | $ | 13.04 | | | $ | 12.61 | |
| | | | | | | | | | | | | | | | | | | | |
Income From Investment Operations | | | | | | | | | | | | | | | | | | | | |
Net investment income | | | 0.74 | (a) | | | 0.63 | (a) | | | 0.38 | | | | 0.36 | | | | 0.46 | |
Net realized and unrealized gain (loss) of investments | | | (2.58 | ) | | | (0.15 | ) | | | 0.22 | | | | (0.01 | ) | | | 0.35 | |
| | | | | | | | | | | | | | | | | | | | |
Total from investment operations | | | (1.84 | ) | | | 0.48 | | | | 0.60 | | | | 0.35 | | | | 0.81 | |
| | | | | | | | | | | | | | | | | �� | | | |
Less Distributions | | | | | | | | | | | | | | | | | | | | |
Distributions from net investment income | | | (0.49 | ) | | | (0.35 | ) | | | (0.64 | ) | | | (0.41 | ) | | | (0.38 | ) |
Distributions from net realized capital gains | | | (0.07 | ) | | | (0.01 | ) | | | (0.10 | ) | | | (0.26 | ) | | | 0.00 | |
| | | | | | | | | | | | | | | | | | | | |
Total distributions | | | (0.56 | ) | | | (0.36 | ) | | | (0.74 | ) | | | (0.67 | ) | | | (0.38 | ) |
| | | | | | | | | | | | | | | | | | | | |
Net Asset Value, End of Period | | $ | 10.30 | | | $ | 12.70 | | | $ | 12.58 | | | $ | 12.72 | | | $ | 13.04 | |
| | | | | | | | | | | | | | | | | | | | |
Total Return (%) | | | (15.0 | ) | | | 4.0 | | | | 5.1 | | | | 2.8 | | | | 6.6 | |
Ratio of operating expenses to average net assets (%) | | | 0.65 | | | | 0.66 | | | | 0.72 | | | | 0.75 | | | | 0.77 | |
Ratio of net investment income to average net assets (%) | | | 6.34 | | | | 5.03 | | | | 4.91 | | | | 4.11 | | | | 3.79 | |
Portfolio turnover rate (%) | | | 280 | | | | 504 | | | | 700 | | | | 507 | | | | 393 | |
Net assets, end of period (000) | | $ | 541,023 | | | $ | 696,191 | | | $ | 366,984 | | | $ | 213,906 | | | $ | 164,213 | |
| | | | | | | | | | | | | | | | | | | | |
| | | Class B | |
| | | Year ended December 31, | |
| | | 2008 | | | 2007 | | | 2006 | | | 2005 | | | 2004 | |
Net Asset Value, Beginning of Period | | $ | 12.65 | | | $ | 12.53 | | | $ | 12.66 | | | $ | 12.99 | | | $ | 12.58 | |
| | | | | | | | | | | | | | | | | | | | |
Income From Investment Operations | | | | | | | | | | | | | | | | | | | | |
Net investment income | | | 0.71 | (a) | | | 0.59 | (a) | | | 0.54 | | | | 0.40 | | | | 0.39 | |
Net realized and unrealized gain (loss) of investments | | | (2.57 | ) | | | (0.14 | ) | | | 0.03 | | | | (0.08 | ) | | | 0.38 | |
| | | | | | | | | | | | | | | | | | | | |
Total from investment operations | | | (1.86 | ) | | | 0.45 | | | | 0.57 | | | | 0.32 | | | | 0.77 | |
| | | | | | | | | | | | | | | | | | | | |
Less Distributions | | | | | | | | | | | | | | | | | | | | |
Distributions from net investment income | | | (0.46 | ) | | | (0.32 | ) | | | (0.60 | ) | | | (0.39 | ) | | | (0.36 | ) |
Distributions from net realized capital gains | | | (0.07 | ) | | | (0.01 | ) | | | (0.10 | ) | | | (0.26 | ) | | | 0.00 | |
| | | | | | | | | | | | | | | | | | | | |
Total distributions | | | (0.53 | ) | | | (0.33 | ) | | | (0.70 | ) | | | (0.65 | ) | | | (0.36 | ) |
| | | | | | | | | | | | | | | | | | | | |
Net Asset Value, End of Period | | $ | 10.26 | | | $ | 12.65 | | | $ | 12.53 | | | $ | 12.66 | | | $ | 12.99 | |
| | | | | | | | | | | | | | | | | | | | |
Total Return (%) | | | (15.2 | ) | | | 3.7 | | | | 4.8 | | | | 2.6 | | | | 6.3 | |
Ratio of operating expenses to average net assets (%) | | | 0.90 | | | | 0.91 | | | | 0.97 | | | | 1.00 | | | | 1.02 | |
Ratio of net investment income to average net assets (%) | | | 6.08 | | | | 4.77 | | | | 4.66 | | | | 3.92 | | | | 3.66 | |
Portfolio turnover rate (%) | | | 280 | | | | 504 | | | | 700 | | | | 507 | | | | 393 | |
Net assets, end of period (000) | | $ | 170,286 | | | $ | 241,184 | | | $ | 198,632 | | | $ | 120,590 | | | $ | 36,346 | |
| Please | see following page for Financial Highlights footnote legend. |
See accompanying notes to financial statements.
MSF-19
Metropolitan Series Fund, Inc.
Western Asset Management Strategic Bond Opportunities Portfolio
Financial Highlights
| | | | | | | | | | | | | | | | | | | | |
| | | Class E | |
| | | Year ended December 31, | |
| | | 2008 | | | 2007 | | | 2006 | | | 2005 | | | 2004 | |
Net Asset Value, Beginning of Period | | $ | 12.67 | | | $ | 12.55 | | | $ | 12.68 | | | $ | 13.00 | | | $ | 12.58 | |
| | | | | | | | | | | | | | | | | | | | |
Income From Investment Operations | | | | | | | | | | | | | | | | | | | | |
Net investment income | | | 0.72 | (a) | | | 0.61 | (a) | | | 0.62 | | | | 0.50 | | | | 0.38 | |
Net realized and unrealized gain (loss) of investments | | | (2.58 | ) | | | (0.15 | ) | | | (0.03 | ) | | | (0.17 | ) | | | 0.41 | |
| | | | | | | | | | | | | | | | | | | | |
Total from investment operations | | | (1.86 | ) | | | 0.46 | | | | 0.59 | | | | 0.33 | | | | 0.79 | |
| | | | | | | | | | | | | | | | | | | | |
Less Distributions | | | | | | | | | | | | | | | | | | | | |
Distributions from net investment income | | | (0.47 | ) | | | (0.33 | ) | | | (0.62 | ) | | | (0.39 | ) | | | (0.37 | ) |
Distributions from net realized capital gains | | | (0.07 | ) | | | (0.01 | ) | | | (0.10 | ) | | | (0.26 | ) | | | 0.00 | |
| | | | | | | | | | | | | | | | | | | | |
Total distributions | | | (0.54 | ) | | | (0.34 | ) | | | (0.72 | ) | | | (0.65 | ) | | | (0.37 | ) |
| | | | | | | | | | | | | | | | | | | | |
Net Asset Value, End of Period | | $ | 10.27 | | | $ | 12.67 | | | $ | 12.55 | | | $ | 12.68 | | | $ | 13.00 | |
| | | | | | | | | | | | | | | | | | | | |
Total Return (%) | | | (15.1 | ) | | | 3.9 | | | | 4.9 | | | | 2.7 | | | | 6.5 | |
Ratio of operating expenses to average net assets (%) | | | 0.80 | | | | 0.81 | | | | 0.87 | | | | 0.90 | | | | 0.92 | |
Ratio of net investment income to average net assets (%) | | | 6.15 | | | | 4.87 | | | | 4.75 | | | | 3.95 | | | | 3.64 | |
Portfolio turnover rate (%) | | | 280 | | | | 504 | | | | 700 | | | | 507 | | | | 393 | |
Net assets, end of period (000) | | $ | 80,174 | | | $ | 129,394 | | | $ | 137,048 | | | $ | 151,881 | | | $ | 144,605 | |
| (a) | Per share amount is based on average shares outstanding during the period. |
See accompanying notes to financial statements.
MSF-20
Metropolitan Series Fund, Inc.
Western Asset Management Strategic Bond Opportunities Portfolio
Notes to Financial Statements—December 31, 2008
Metropolitan Series Fund, Inc. (the “Fund”) is organized as a corporation under the laws of Maryland pursuant to Articles of Incorporation filed on November 23, 1982, as amended, and registered under the Investment Company Act of 1940, as amended (the “1940 Act”), as an open-end investment company. The Fund is a “series” type of mutual fund, which issues separate series of stock. Each series represents an interest in a separate portfolio of Fund investments. The Western Asset Management Strategic Bond Opportunities Portfolio (the “Portfolio”) is a diversified series of the Fund. Shares in the Fund are not offered directly to the general public and are currently available only to separate accounts established by Metropolitan Life Insurance Company (“MetLife”), New England Life Insurance Company, General American Life Insurance Company (“General American”), The MetLife Investors Group of Insurance Companies, MetLife Insurance Company of Connecticut and other affiliated insurance companies (collectively, the “Insurance Companies”) and to certain eligible qualified retirement plans (“Qualified Plans”), as an investment vehicle for variable life insurance, group annuity or variable annuity products of these insurance companies or Qualified Plans, although the Portfolio is not available to all such separate accounts and Qualified Plans. The Portfolio’s shares may be divided into different classes. Currently, the classes being offered by the Portfolio are named Class A, Class B and Class E. The classes of the Portfolio’s shares are identical, except that certain additional charges (Rule 12b-1 fees) are made against Class B and Class E shares. Investment income, realized and unrealized capital gains and losses, the common expenses of the Portfolio and certain Portfolio-level expense reductions, if any, are allocated daily, on a pro rata basis, to each class based on the relative net assets of each class to the total net assets of the Portfolio.
| 2. | SIGNIFICANT ACCOUNTING POLICIES: |
The preparation of financial statements in conformity with accounting principles generally accepted in the United States of America (“GAAP”) requires management to make estimates and assumptions that affect the reported amounts of assets and liabilities and disclosure of contingent assets and liabilities as of the date of the financial statements and the reported amounts of income and expenses during the reporting period. Actual results could differ from those estimates.
The following is a summary of significant accounting policies consistently followed by the Portfolio in the preparation of its financial statements. The policies are in conformity with GAAP.
Investment Valuation:
Debt securities (other than short term obligations with a remaining maturity of sixty days or less) are generally valued on the basis of evaluated or composite bid quotations obtained by independent pricing services and/or brokers and dealers selected by the relevant subadviser pursuant to authorization of the Board of Directors of the Fund (the “Board” or “Directors”). Such quotations take into account appropriate factors such as institutional-sized trading in similar groups of securities, yield, quality, coupon rate, maturity, type of issue, trading characteristics and other data. Short term obligations with a remaining maturity of sixty days or less are valued at amortized cost which approximates fair market value.
Equity securities traded on a national securities exchange or other exchanges are valued at their last sale price on the principal trading market. Equity securities traded on the NASDAQ National Market System are valued at the NASDAQ Official Closing Price (the “NOCP”). The NOCP is the last reported sale price if the last reported sale price falls between the spread of the last reported bid and asked prices. If the last reported bid and asked prices are above the last reported sale price, the NOCP will be the last reported bid price. If the last reported bid and asked prices are below the last reported sale price, the NOCP will be the last reported asked price. Equity securities traded on a national securities exchange or other exchanges or on the NASDAQ National Market System for which there is no reported sale during the day are valued at the last reported bid price. A security that is listed or traded on more than one exchange is valued at the quotation on the exchange determined to be the primary market for that security by the Board or its delegates. If no closing price is available, then such securities are valued by using the last reported bid price. Equity securities traded over-the-counter are valued at the last reported sales price.
If no current market value quotation is readily available or reliable for a portfolio security, fair value will be determined in accordance with procedures established by and under the general supervision of the Board. When the Portfolio uses fair value pricing, it may take into account any factors it deems appropriate. The value of securities used by the Portfolio to calculate its net asset value may differ from quoted or published prices for the same securities. Fair value pricing involves subjective judgments and the fair value determined for a security may be materially different than the value that could be realized upon the sale of that security.
MSF-21
Metropolitan Series Fund, Inc.
Western Asset Management Strategic Bond Opportunities Portfolio
Notes to Financial Statements—December 31, 2008—(Continued)
The Portfolio expects to use fair value pricing for securities primarily traded on U.S. exchanges only under very limited circumstances. For example, the Portfolio may use fair value pricing if the exchange on which a security is traded closes early or trading in the security is suspended.
Securities traded primarily on an exchange outside of the United States which closes before the close of the New York Stock Exchange will be valued at the last sales price on that non-U.S. exchange. Securities traded primarily on an exchange outside of the United States for which there is no reported sale during the day are valued at the mean between the last reported bid and asked prices. However, because most foreign markets close well before the Portfolio values its securities (typically at 4 p.m. Eastern Time), the earlier close of these foreign markets gives rise to the possibility that significant events, including broad market moves, may have occurred after these foreign markets close but before the Portfolio values its securities. To account for this, the Portfolio may frequently value many of its foreign equity securities using fair value prices based on third party vendor modeling tools.
Forward foreign currency exchange contracts are valued based on the mean between closing bid and asked prices of the forward currency contract rates in the London foreign exchange markets on a daily basis as provided by a reliable bank or dealer.
Options, whether on securities, indices, futures contracts, or otherwise, are valued at the last sales price available as of the close of business on the day of valuation or, if there is no such sale price available, at the mean between the bid and asked prices. Options on currencies are valued at the spot price each day.
The value of futures contracts will be the sum of the margin deposit plus or minus the difference between the value of the futures contract on each day the net asset value is calculated and the value on the date the futures contract originated, value being that established on a recognized commodity exchange, or by reference to other customary sources, with gain or loss being realized when the futures contract closes or expires.
Subject to the Board’s oversight, the Board has delegated the day-to-day oversight of pricing matters, including determinations in good faith under the Fund’s procedures the fair value of securities for which current market quotations are not readily available to the subadviser of the Portfolio.
Investment Transactions and Related Investment Income:
Portfolio security transactions are recorded on the trade date. Dividend income is recorded on the ex-dividend date or, for certain foreign securities, when notified. Interest income, which includes amortization of premium and accretion of discount on debt securities, is recorded on the accrual basis. Realized gains and losses on investments and unrealized appreciation and depreciation are determined on the identified cost basis, which is the same basis used for federal income tax purposes.
Repurchase Agreements:
The Portfolio, through the custodian or a subcustodian, receives delivery of the underlying securities collateralizing repurchase agreements. The Portfolio requires the custodian to take possession, to have legally segregated in the Federal Reserve Book Entry System, or to have segregated within the custodian’s vault, all securities held as collateral for repurchase agreements. It is the Portfolio’s policy that the market value of the collateral be at least equal to 100% of the repurchase price in the case of a repurchase agreement of one-day duration and 102% on all other repurchase agreements. The Portfolio’s subadviser is responsible for determining that the value of the collateral is at all times at least equal to the repurchase price. In connection with transactions in repurchase agreements, if the seller defaults and the value of the collateral declines or if the seller enters an insolvency proceeding, realization of the collateral by the Portfolio may be delayed, limited or wholly denied.
Foreign Currency Translation:
The books and records of the Portfolio are maintained in U.S. dollars. The values of securities, currencies and other assets and liabilities denominated in currencies other than U.S. dollars are translated into U.S. dollars based upon foreign exchange rates prevailing at the end of the period. Purchases and sales of investment securities, income and expenses are translated on the respective dates of such transactions. Since the values of investment securities are presented at the foreign exchange rates prevailing at the end of the period, it is not practical to isolate that portion of the results of operations arising from changes in exchange rates from that portion of the results of operations reflecting fluctuations arising from changes in market prices of the investment securities. Such fluctuations are included in the net realized and unrealized gain or loss on investments.
MSF-22
Metropolitan Series Fund, Inc.
Western Asset Management Strategic Bond Opportunities Portfolio
Notes to Financial Statements—December 31, 2008—(Continued)
Net realized foreign exchange gains or losses arise from sales of foreign currency, currency gains or losses realized between the trade and settlement dates on securities transactions, and the difference between the amounts of dividends, interest, and foreign withholding taxes recorded by the Portfolio and the U.S. dollar equivalent of the amounts actually received or paid by the Portfolio. Net unrealized foreign exchange gains and losses arise from changes in the value of assets and liabilities, other than investment securities, resulting from changes in the exchange rate.
Forward Foreign Currency Exchange Contracts:
The Portfolio may enter into forward foreign currency exchange contracts primarily to hedge against foreign currency exchange rate risks on its non-U.S. dollar denominated investment securities. When entering into a forward currency contract, the Portfolio agrees to receive or deliver a fixed quantity of foreign currency for an agreed-upon price on an agreed future date. These contracts are valued daily and the Portfolio’s net equity therein, representing unrealized gain or loss on the contracts as measured by the difference between the foreign exchange rates at the dates of entry into the contracts and the forward rates at the settlement date, is included in the Statement of Assets and Liabilities. Realized and unrealized gains and losses are included in the Statement of Operations. These instruments involve market and/or credit risk in excess of the amount recognized in the Statement of Assets and Liabilities. Risks arise from the possible inability of counterparties to meet the terms of their contracts and from movement in currency and securities values and interest rates.
Futures Contracts:
The Portfolio may buy and sell futures contracts (on recognized exchanges) as a hedge, to maintain exposure to the broad markets or to enhance return. Futures contracts are agreements to buy or sell a security, or deliver a final cash settlement price in connection with an index, interest rate, currency, or other contracts not calling for physical delivery, for a set price in the future. The Portfolio must post an amount equal to a portion of the total market value of the futures contract as futures variation margin, which is returned when the Portfolio’s obligations under the contract have been satisfied. From time to time thereafter, the Portfolio may have to post variation margin to maintain this amount as the market value of the contract fluctuates. Risks of entering into futures contracts (and related options) include the possibility that there may be an illiquid market and that a change in the value of the contract or option may not correlate with changes in the value of the underlying securities.
Options:
The Portfolio may use options to hedge against changes in values of securities the Portfolio owns or expects to purchase, to maintain exposure to the broad markets or to enhance return. Writing puts or buying calls tends to increase the Portfolio’s exposure to the underlying instrument and writing calls or buying puts tends to decrease the Portfolio’s exposure to the underlying instrument, and can be used to hedge other Portfolio investments. For options purchased to hedge the Portfolio’s investments, the potential risk to the Portfolio is that the change in value of options contracts may not correspond to the change in value of the hedged instruments. In addition, losses may arise from changes in the value of the underlying instruments, if there is an illiquid secondary market, or if the counterparty is unable to perform. The maximum loss for purchased options is limited to the premium initially paid for the option. For options written by the Portfolio, the maximum loss is not limited to the premium initially received for the option.
The main risk associated with purchasing an option is that the option expires without being exercised. In this case, the option expires worthless and the premium paid for the option is considered the loss. The risk associated with writing a call option is that the Portfolio may forgo the opportunity for a profit if the market value of the underlying position increases and the option is exercised. The risk in writing a put option is that the Portfolio may incur a loss if the market value of the underlying position decreases and the option is exercised. In addition, the Portfolio risks not being able to enter into a closing transaction for the written option as the result of an illiquid market.
Mortgage Dollar Rolls:
The Portfolio may enter into mortgage “dollar rolls” in which a Portfolio sells mortgage-backed securities for delivery in the current month and simultaneously contracts to repurchase substantially similar (same type, coupon and maturity) securities on a specified future date. Dollar rolls are accounted for as purchase and sale transactions; gain/loss is recognized at the end of the term of the dollar roll. The average monthly balance of dollar rolls outstanding during the year ended December 31, 2008 was $182,650,433 for the Portfolio.
MSF-23
Metropolitan Series Fund, Inc.
Western Asset Management Strategic Bond Opportunities Portfolio
Notes to Financial Statements—December 31, 2008—(Continued)
A Portfolio that enters into mortgage dollar rolls is subject to the risk that the market value of the securities the Portfolio is obligated to repurchase under the agreement may decline below the repurchase price. In the event the buyer of securities under a mortgage dollar roll files for bankruptcy or becomes insolvent, the Portfolio’s use of proceeds from the dollar roll may be restricted pending a court determination, a determination by the other party, or its trustee or receiver, whether to enforce the Portfolio’s obligation to repurchase the securities.
“When-Issued” Securities:
Purchasing securities “when-issued” is a forward commitment by the Portfolio to buy a security. The estimated amount of the Portfolio’s payment obligation and the security’s interest rate are determined when the commitment is made, even though no interest accrues until the security is issued, which is generally 15 to 120 days later. The Portfolio will segregate liquid assets with its custodian sufficient at all times to satisfy these commitments. If the value of the security is less when delivered than when the commitment was made, the Portfolio will suffer a loss.
High Yield Securities:
The Portfolio may invest in high yield instruments that are subject to certain credit and market risks. The yields of high yield instruments reflect, among other things, perceived credit risk. The Portfolio’s investments in securities rated below investment grade typically involve risks not associated with higher rated securities including, among others, greater risk related to timely and ultimate payment of interest and principal, greater market price volatility and less liquid secondary market trading.
Mortgage-Backed Securities:
The Portfolio invests a significant portion of its assets in securities of issuers that hold mortgage and asset backed securities and direct investments in securities backed by commercial and residential mortgage loans and other financial assets. The value and related income of these securities are sensitive to changes in economic conditions, including delinquencies and/or defaults. Continuing shifts in the market’s perception of credit quality on securities backed by commercial and residential mortgage loans and other financial assets may result in increased volatility of market price and periods of illiquidity that can negatively impact the valuation of certain issuers held by the Portfolio. At December 31, 2008, the Portfolio held securities of issuers that hold mortgage and asset backed securities and direct investments in mortgage and asset backed securities (excluding federal agencies) with an aggregate value of $167,307,186 (representing 21.1% of the Portfolio’s total net assets).
Federal Income Taxes:
It is the Portfolio’s policy to comply with the requirements of the Internal Revenue Code of 1986, as amended (the “Code”), and regulations thereunder, applicable to regulated investment companies and to distribute, with respect to each taxable year, all of its taxable income to shareholders. Therefore, no federal income tax provision is required. The Portfolio is subject to the provisions of the Financial Accounting Standards Board Interpretation (“FASB”) No. 48, Accounting for Uncertainties in Income Taxes (FIN 48). FIN 48 sets forth a minimum threshold for financial statement recognition of the benefit of a tax position taken or expected to be taken in a tax return. The implementation of FIN 48 did not result in any unrecognized tax benefits in the accompanying financial statements. Each of the Portfolio’s federal tax returns for the prior three fiscal years remains subject to examination by the Internal Revenue Service.
As of December 31, 2008, the Portfolio had no capital loss carryforwards.
Pursuant to Section 852 of the Code, the Portfolio designated the amount shown below under Long Term Gain as capital gain dividends for its taxable year ended December 31, 2008. The tax character of distributions paid for the periods ended December 31, 2008 and 2007 was as follows:
| | | | | | | | | | | | | | | | | | | | | | |
| Ordinary Income | | Long Term Gain | | Return of Capital | | Total |
| 2008 | | 2007 | | 2008 | | 2007 | | 2008 | | 2007 | | 2008 | | 2007 |
| $ | 45,638,965 | | $ | 21,761,307 | | $ | 1,897,157 | | $ | — | | $ | — | | $ | — | | $ | 47,536,122 | | $ | 21,761,307 |
As of December 31, 2008, the components of distributable earnings (accumulated losses) on a federal income tax basis were as follows:
| | | | | | | | | | | | | | | |
Undistributed
Ordinary
Income | | Undistributed
Long Term
Gain | | Unrealized
Depreciation | | | Loss
Carryforwards | | Total | |
| $ | 73,731,214 | | $ | 10,830,853 | | $ | (259,588,279 | ) | | $ | — | | $ | (175,026,212 | ) |
MSF-24
Metropolitan Series Fund, Inc.
Western Asset Management Strategic Bond Opportunities Portfolio
Notes to Financial Statements—December 31, 2008—(Continued)
Dividends and Distributions to Shareholders:
The Portfolio records dividends and distributions on the ex-dividend date. Net realized gains from security transactions (if any) are generally distributed annually to shareholders. The timing and characterization of certain income and capital gains distributions are determined in accordance with federal tax regulations that may differ from GAAP. Permanent book and tax basis differences relating to shareholder distributions will result in reclassification between under/over distributed net investment income, accumulated net realized gains/losses and paid in capital.
| 3. | INVESTMENT TRANSACTIONS: |
For the year ended December 31, 2008, purchases and sales of securities (excluding short term investments) for the Portfolio were as follows:
| | | | | | | | | | |
| Purchases | | Sales |
| U.S. Government | | Other | | U.S. Government | | Other |
| $ | 2,480,265,018 | | $ | 460,375,030 | | $ | 2,715,847,808 | | $ | 124,208,621 |
Options Written:
The Portfolio transactions in options written during the year ended December 31, 2008 were as follows:
| | | | | | | |
Call Options | | Number of
contracts | | | Premiums
received | |
Options outstanding December 31, 2007 | | 376 | | | $ | 270,714 | |
Options written | | 2,575 | | | | 1,758,272 | |
Options closed | | (1,811 | ) | | | (1,171,761 | ) |
Options expired | | (180 | ) | | | (71,100 | ) |
| | | | | | | |
Options outstanding December 31, 2008 | | 960 | | | $ | 786,125 | |
| | | | | | | |
| | | | | | | |
Put Options | | Number of
contracts | | | Premiums
received | |
Options outstanding December 31, 2007 | | 325 | | | $ | 265,906 | |
Options written | | 3,019 | | | | 2,441,950 | |
Options closed | | (1,905 | ) | | | (1,397,559 | ) |
Options expired | | (162 | ) | | | (54,878 | ) |
| | | | | | | |
Options outstanding December 31, 2008 | | 1,277 | | | $ | 1,255,419 | |
| | | | | | | |
| 4. | INVESTMENT MANAGEMENT FEES AND OTHER TRANSACTIONS WITH AFFILIATES: |
Investment Management Agreement:
MetLife Advisers, LLC (“MetLife Advisers”) is the investment adviser to the Portfolio. The Fund has entered into an investment management agreement with MetLife Advisers with respect to the Portfolio. For providing investment management services to the Portfolio, MetLife Advisers receives monthly compensation at the following annual rates:
| | | | |
Management
Fees earned by
MetLife Advisers
for the year ended
December 31, 2008 | | Annual
percentage
rates paid to
MetLife Advisers | | Based on Portfolios
average daily net asset
levels |
| $5,895,684 | | 0.650% | | Of the first $500 million |
| | 0.550% | | On amounts in excess of $500 million |
Certain officers and directors of the Fund may also be officers of MetLife Advisers; however, such officers and directors receive no compensation from the Fund.
MetLife Advisers has entered into an investment subadvisory agreement with respect to the Portfolio. Western Asset Management Co. is compensated by MetLife Advisers to provide subadvisory services for the Portfolio.
MSF-25
Metropolitan Series Fund, Inc.
Western Asset Management Strategic Bond Opportunities Portfolio
Notes to Financial Statements—December 31, 2008—(Continued)
Service and Distribution Fees:
The Fund has adopted a Distribution and Service Plan under Rule 12b-1 of the 1940 Act for the Portfolio’s Class B and E shares. Under the Distribution and Service Plan, the Class B and E shares of the Portfolio pay a fee to compensate the Insurance Companies (or their affiliates) and other broker-dealers and financial intermediaries involved in the offer and sale of Portfolio shares for promoting or selling and servicing the Class B and E shares. The fees under the Distribution and Service Plan for each class of the Portfolio’s shares are calculated as a percentage of the Portfolio’s average daily net assets that are attributable to that Class. Currently, the fee is 0.25% per year for Class B shares and 0.15% per year for Class E shares. Amounts paid by the Portfolio for the year ended December 31, 2008 are shown as Service and Distribution fees in the Statement of Operations.
The Fund has entered into a securities lending arrangement with the Fund’s custodian, State Street Bank and Trust Company (the “custodian”). Under the agreement, the custodian is authorized to loan securities on the Portfolios’ behalf. In exchange, the Portfolio receives either cash or securities as collateral against the loaned securities. The Portfolio receives collateral at least equal to 102% of the market value of the loaned securities (105% for foreign securities), at each loan’s inception. Collateral must be maintained at least at 100% of the market value of the loaned securities for the duration of the loan. The cash collateral is invested in the Navigator Securities Lending Prime Portfolio, an affiliate of the custodian, which invests in a variety of high quality U.S. dollar-denominated instruments. If the market value of the collateral at the close of trading on a business day is less than 100% of the market value of the loaned securities at the close of trading on that day, the borrower shall be required to deliver, by the close of business on the following business day, an additional amount of collateral, equal to at least 100% of the market value of all the loaned securities as of such preceding day. The Portfolio receives 80% of the annual net income from securities lending transactions, which is included in interest income of the Portfolio. The remaining 20% is paid to the custodian as compensation for its securities lending services. Interest income received by the Portfolio via lending transactions during the year ended December 31, 2008 is footnoted in the Statement of Operations. The Portfolio bears the risk of any deficiency in the amount of collateral available for return to a borrower due to a loss in an approved investment purchased with such collateral. Any outstanding loans by the Portfolio at December 31, 2008 are footnoted in the Schedule of Investments.
| 6. | MARKET AND CREDIT RISK: |
In the normal course of business, the Portfolio invests in securities and enters into transactions where risks exist due to fluctuations in the market (market risk) or failure of the other party to a transaction to perform (credit risk). The value of securities held by the Portfolio may decline in response to certain events, including those directly involving the companies whose securities are owned by the Portfolio; conditions affecting the general economy; overall market changes; local, regional or global political, social or economic instability; and currency and interest rate and price fluctuations. Similar to credit risk, the Portfolio may be exposed to counterparty risk, or the risk that an entity with which the Portfolio has unsettled or open transactions may default. Financial assets, which potentially expose the Portfolio to credit and counterparty risks, consist principally of investments and cash due from counterparties. The extent of the Portfolio’s exposure to credit and counterparty risks in respect to these financial assets approximates their value as recorded in the Portfolio’s Statements of Assets and Liabilities.
| 7. | RECENT ACCOUNTING PRONOUNCEMENTS: |
In March 2008, the FASB issued Statement of Financial Accounting Standards No. 161, Disclosures about Derivative Instruments and Hedging Activities (“FAS 161”), an amendment of FASB Statement No. 133. FAS 161 requires enhanced disclosures about (a) how and why an entity uses derivative instruments, (b) how derivative instruments and hedging activities are accounted for, and (c) how derivative instruments and related hedging activities affect a fund’s financial position, financial performance, and cash flows. Management does not believe the adoption of FAS 161 will materially impact the financial statement amounts, but will require additional disclosures. This will include qualitative and quantitative disclosures on derivative positions existing at period end and the effect of using derivatives during the reporting period. FAS 161 is effective for financial statements issued for fiscal years and interim periods beginning after November 15, 2008. Management is currently evaluating the impact the adoption of FAS 161 will have on the Portfolio’s financial statement disclosures.
MSF-26
Metropolitan Series Fund, Inc.
Western Asset Management Strategic Bond Opportunities Portfolio
Report of Independent Registered Public Accounting Firm
To the Shareholders and Board of Directors of Metropolitan Series Fund, Inc.:
We have audited the accompanying statement of assets and liabilities, including the schedule of investments, of the Western Asset Management Strategic Bond Opportunities Portfolio (one of the portfolios constituting the Metropolitan Series Fund, Inc.) (the “Fund”) as of December 31, 2008, and the related statement of operations for the year then ended, the statements of changes in net assets for each of the two years in the period then ended, and the financial highlights for each of the five years in the period then ended. These financial statements and financial highlights are the responsibility of the Fund’s management. Our responsibility is to express an opinion on these financial statements and financial highlights based on our audits.
We conducted our audits in accordance with the standards of the Public Company Accounting Oversight Board (United States). Those standards require that we plan and perform the audit to obtain reasonable assurance about whether the financial statements and financial highlights are free of material misstatement. The Fund is not required to have, nor were we engaged to perform, an audit of its internal control over financial reporting. Our audits included consideration of internal control over financial reporting as a basis for designing audit procedures that are appropriate in the circumstances, but not for the purpose of expressing an opinion on the effectiveness of the Fund’s internal control over financial reporting. Accordingly, we express no such opinion. An audit also includes examining, on a test basis, evidence supporting the amounts and disclosures in the financial statements, assessing the accounting principles used and significant estimates made by management, as well as evaluating the overall financial statement presentation. Our procedures included confirmation of securities owned as of December 31, 2008, by correspondence with the custodian and brokers; where replies were not received from brokers, we performed other auditing procedures. We believe that our audits provide a reasonable basis for our opinion.
In our opinion, the financial statements and financial highlights referred to above present fairly, in all material respects, the financial position of the Western Asset Management Strategic Bond Opportunities Portfolio of the Metropolitan Series Fund, Inc. as of December 31, 2008, the results of its operations for the year then ended, the changes in its net assets for each of the two years in the period then ended, and the financial highlights for each of the five years in the period then ended, in conformity with accounting principles generally accepted in the United States of America.
Deloitte & Touche LLP
Boston, Massachusetts
February 26, 2009
MSF-27
Metropolitan Series Fund, Inc.
Directors and Officers
The Fund’s Directors review actions of the Fund’s investment adviser and subadvisers, and decide upon matters of general policy. The Fund’s officers supervise the daily business operations of the Fund. The Board of Directors and the Fund’s officers are listed below. Each Director is responsible for overseeing all 38 Portfolios of the Fund. There is no limit to the term a Director may serve. Directors serve until their resignation, retirement or removal in accordance with the Fund’s organizational documents and policies adopted by the Board from time to time. Officers hold office at the pleasure of the Board or until the election or appointment and the qualification of a successor. The address of the Directors and officers is c/o Metropolitan Series Fund, Inc., 501 Boylston Street, Boston, MA 02116.
Interested Directors(1)
Each Director below is an “interested person” (as defined by the 1940 Act) with respect to the Fund in that Ms. Forget is an employee of MetLife and Mr. Typermass is a former employee of MetLife and owns securities issued by MetLife, Inc., the ultimate parent company of MetLife Advisers.
| | | | | | | | |
Name, Address and Age | | Current
position(s)
with Fund | | Position(s)
held since | | Principal occupations
over past five years, including other directorships(2) | | Number of
Portfolios in
Fund Complex
Overseen by
Director(3) |
Elizabeth M. Forget Age: 42 | | Director, Chairman of the Board, President and Chief Executive Officer | | 2006 | | Senior Vice President (since 2007), MetLife, Inc.; President, Met Investors Advisory, LLC; Trustee and President, Met Investors Series Trust; Executive Vice President, MetLife Investors Group, Inc.; President, Chief Executive Officer and Chair of the Board of Managers (since 2006), MetLife Advisers; President, Met Investors Advisory, LLC. | | 87 |
| | | | |
Arthur G. Typermass Age: 71 | | Director | | 1998 | | Formerly, Senior Vice President and Treasurer, MetLife. | | 38 |
Non-Interested Directors(1)
Each Director below is not an “interested person” (as defined by the 1940 Act) with respect to the Fund (collectively, the “Independent Directors”).
| | | | | | | | |
Name, Address and Age | | Current
position(s)
with Fund | | Position(s)
held since | | Principal occupations
over past five years, including other directorships(2) | | Number of
Portfolios in
Fund Complex
Overseen by
Director(3) |
Steve A. Garban† Age: 71 | | Director | | 1985 | | Formerly, Chief Financial Officer, Senior Vice President Finance and Operations and Treasurer (Emeritus), The Pennsylvania State University. | | 38 |
| | | | |
Linda B. Strumpf Age: 61 | | Director | | 2000 | | Vice President and Chief Investment Officer, Ford Foundation. | | 38 |
| | | | |
Michael S. Scott Morton† Age: 71 | | Director | | 1993 | | Jay W. Forrester Professor of Management (Emeritus) at Sloan School of Management, MIT. | | 38 |
| | | | |
H. Jesse Arnelle Age: 75 | | Director | | 2001 | | Formerly, Counsel, Womble Carlyle Sandrie & Rice; Director, Textron Inc. (global multi- industry company)*; formerly, Director, Gannet Co. Inc. (diversified news and information company)*; formerly, Director, Eastman Chemical Company (global chemical company)*; formerly, Director, Waste Management, Inc.*; formerly, Director, Armstrong Holdings Inc. (parent company of floor and ceiling products business)*; formerly, Director, FPL Group Inc. (public utility holding company)*; Director, URS Corporation (engineering design services firm)*. | | 38 |
MSF-28
Metropolitan Series Fund, Inc.
Directors and Officers—(Continued)
| | | | | | | | |
Name, Address and Age | | Current
position(s)
with Fund | | Position(s)
held since | | Principal occupations
over past five years, including other directorships(2) | | Number of
Portfolios in
Fund Complex
Overseen by
Director(3) |
Nancy Hawthorne Age: 57 | | Director | | 2003 | | Chief Executive Officer, Clerestory LLC (corporate financial advisor); Director, Avid Technologies (computer software company)*; formerly, Chairman of the Board of Avid Technologies; formerly, Board of Advisors, L. Knife & Sons, Inc. (beverage distributor); formerly, Trustee, New England Zenith Fund (“Zenith Fund”)**; formerly, Chief Executive Officer and Managing Partner, Hawthorne, Krauss and Associates (corporate financial advisor); formerly, Chief Financial Officer and Executive Vice President, Continental Cablevision, subsequently renamed MediaOne (cable television company); formerly, Director, Life F/X, Inc.; formerly, Chairman of the Board, WorldClinic (distance medicine company); formerly, Director, Perini Corporation (construction company)*; formerly, Director, CGU (property and casualty insurance company); formerly, Director, Beacon Power Corporation (energy company)*. | | 38 |
| | | | |
John T. Ludes Age: 72 | | Director | | 2003 | | President, LFP Properties (consulting firm); Formerly, Trustee, Zenith Fund**; formerly, Vice Chairman, President and Chief Operating Officer, Fortune Brands/American Brands (global conglomerate); formerly, President and CEO, Acushnet Company (athletic equipment company). | | 38 |
Officers(1)
| | | | | | | | |
Name and address | | Age | | Current
position(s)
with Fund | | Position(s)
held since | | Principal occupations over past five years(2) |
| Jeffrey L. Bernier | | 37 | | Senior Vice President | | 2008 | | Vice President (since 2008), MetLife, Inc.; Vice President (since 2008), MetLife; Senior Vice President (since 2008), MetLife Advisers; formerly, Director and Senior Investment Analyst (2004 to 2007), John Hancock Financial Services; formerly, Assistant Vice President (2000 to 2001), Wachovia Securities. |
| | | | |
| Alan C. Leland | | 56 | | Senior Vice President | | 2005 | | Treasurer and Chief Financial Officer, MetLife Advisers, LLC; Treasurer (since 2005), Met Investors Advisory, LLC; Vice President (since 2004), Met Investors Advisory, LLC; Vice President (since 2003), MetLife, Inc.; Vice President, MetLife; Senior Vice President, NELICO. |
| | | | |
| Peter Duffy | | 53 | | Vice President
and Treasurer | | 2000 | | Senior Vice President, MetLife Advisers; Second Vice President (since 2003), NELICO; Vice President, MetLife (since 2004); Vice President (since 2004), MetLife, Inc.; formerly, Vice President and Treasurer, Zenith Fund**. |
| | | | |
| Jeffrey P. Halperin | | 41 | | Chief
Compliance Officer | | 2007 | | Vice President (since 2006), MetLife, Inc.; Vice President (since 2006), MetLife; Chief Compliance Officer (since 2006), Met Investors Series Trust, MetLife Advisers, Met Investors Advisory, LLC and MetLife Investment Advisors Company, LLC. |
| * | Indicates a directorship with a registered investment company or a company subject to the reporting requirements of the Securities Exchange Act of 1934, as amended. |
| ** | The Zenith Fund deregistered with the Securities and Exchange Commission (“SEC”) in 2004. |
| (†) | Served as a trustee, director and/or officer of one or more of the following companies, each of which had a direct or indirect advisory relationship with MetLife Advisers or its affiliates prior to January 31, 2005: State Street Research Financial Trust, State Street Research Income Trust, State Street Research Money Market Trust, State Street Research Institutional Funds, State Street Research Capital Trust, State Street Research Master Investment Trust, State Street Research Equity Trust, State Street Research Securities Trust and State Street Research Exchange Trust (collectively, the “State Street Research Funds”). |
| (1) | During the period shown, each Director of the Fund served as a Trustee of Metropolitan Series Fund II, a registered investment company that ceased investment operations in June of 2008 and has applied for deregistration under the Investment Company Act of 1940. During this period, each officer of the Fund served in the same position with Metropolitan Series Fund II. |
| (2) | Previous positions during the past five years with the Fund; Met Investors Series Trust; MetLife; MetLife, Inc.; MetLife Advisers; Met Investors Advisory, LLC; Zenith Fund; NELICO; or New England Securities Corporation are omitted if not materially different. |
| (3) | The Fund Complex includes the Fund (38 portfolios) and Met Investors Series Trust (49 portfolios). |
MSF-29
Metropolitan Series Fund, Inc.
Western Asset Management Strategic Bond Opportunities Portfolio
Board Approval of Advisory and Subadvisory Agreements
The Fund’s Contract Review Committees of the Board of Directors (the “Board” or the “Directors”) typically meet in early fall to review the Portfolios’ advisory agreements (the “Advisory Agreements”) and subadvisory agreements (the “Subadvisory Agreements,” and, together with the Advisory Agreements, the “Agreements”) and determine whether to recommend that the full Board approve the continuation of the Agreements for an additional one-year period. (Following the initial approval of an Agreement for a new Portfolio or with a new adviser or subadviser, such annual reviews are not required until 2 years following the execution of such Agreement.) After each Committee has made its recommendations, the full Board, including the Independent Directors, determines whether to approve the continuation of each of the Agreements. In addition, the Board, including the Independent Directors, considers matters bearing on the Agreements at most of its other meetings throughout the year and regularly interviews various individuals at MetLife Advisers responsible for the management of the Portfolios. The Directors also interview selected investment managers and other professionals at the subadvisers at various times throughout the year.
The Directors receive all materials that they or MetLife Advisers, the Fund’s investment adviser, and the subadvisers believe to be reasonably necessary for the Directors to evaluate the Agreements and determine whether to approve the continuation of the Agreements. These materials generally include, among other items, (i) information on the investment performance of the Portfolios and the performance of peer groups of funds and the Portfolios’ performance benchmarks, (ii) information on the Portfolios’ advisory and subadvisory fees and other expenses, including information comparing the Portfolios’ expenses to those of peer groups of funds and information about any applicable expense caps and fee “breakpoints,” (iii) sales and redemption data, (iv) information related to the profitability of the Agreements to MetLife Advisers and certain of the subadvisers, and potential “fall-out” or ancillary benefits that MetLife Advisers, the subadvisers or their affiliates may receive as a result of their relationships with the Fund and (v) information obtained through the subadvisers’ responses to certain requests from MetLife Advisers and the Directors and MetLife Advisers’ responses to requests from the Directors. The Directors may also consider other information such as (vi) MetLife Advisers’ and the subadvisers’ financial results and condition, (vii) each Portfolio’s investment objectives and strategies and the size, education and experience of the investment staffs of MetLife Advisers and the relevant subadvisers and their use of technology and external research, (viii) the allocation of the Portfolios’ brokerage, if any, including allocations to brokers affiliated with the subadvisers and the use of “soft” commission dollars to pay Portfolio expenses and to pay for research and other similar services, (ix) the resources devoted to, and the record of compliance with, the Portfolios’ investment policies and restrictions, policies on personal securities transactions and other compliance policies, (x) the responses of MetLife Advisers, the subadvisers and/or their affiliates to certain legal and regulatory proceedings and (xi) the economic outlook generally and for the mutual fund industry in particular. Throughout the process, the Directors have the opportunity to ask questions of and request additional materials from MetLife Advisers and the subadvisers.
Following meetings of each Contract Review Committee on September 10, 2008, the Board, including the Independent Directors, at its November 6-7, 2008 meeting, approved the continuation through December 31, 2009 of the Advisory Agreements for each Portfolio of the Fund and the Subadvisory Agreements for each Portfolio other than the Zenith Equity Portfolio and Asset Allocation Portfolios (which do not have subadvisers) and the Van Eck Global Natural Resources Portfolio, Met/Dimensional International Small Cap Portfolio and Loomis Sayles Small Cap Growth Portfolio (formerly known as the Franklin Templeton Small Cap Growth Portfolio). The Agreements approved for continuation are referred to below as the “Continued Agreements.”
In considering whether to approve the continuation of the Continued Agreements, the Directors, including the Independent Directors, did not identify any single factor as determinative, and each weighed the various factors as he or she deemed appropriate. The Directors considered the following matters in connection with their approval of the Continued Agreements:
The nature, extent and quality of the services provided to the relevant Portfolios under the Continued Agreements. The Directors considered the nature, extent and quality of the services provided by MetLife Advisers, the relevant subadvisers (if any) and their affiliates (each, an “Adviser,” and, collectively, the “Advisers”) to the relevant Portfolios pursuant to the Continued Agreements and the resources dedicated to these Portfolios by the Advisers. In particular, the Directors considered the Advisers’ abilities to attract and retain highly qualified investment professionals. With respect to MetLife Advisers, the Directors considered (for each Portfolio other than the Zenith Equity and Asset Allocation Portfolios) that MetLife Advisers is (i) ultimately responsible for the performance of such Portfolios; (ii) ultimately responsible for the establishment of the investment strategies of each such Portfolio, primarily through its recommendations to the Board regarding the hiring and selection of subadvisers; (iii) responsible for the hiring and selection, subject to Board approval, of subadvisers; and (iv) responsible for maintaining a program of Subadviser oversight reasonably designed to ensure that the subadvisers have reasonable compliance policies and procedures in place. The Directors also considered that MetLife Advisers provides a full range of day-to-day administrative services for the Portfolios involving all aspects of such Portfolios’ day-to-day operations (other than portfolio management). With respect to the Zenith Equity and Asset Allocation Portfolios, the Directors considered both the portfolio management services and the administrative services provided by MetLife Advisers. After reviewing
MSF-30
Metropolitan Series Fund, Inc.
Western Asset Management Strategic Bond Opportunities Portfolio
Board Approval of Advisory and Subadvisory Agreements—(Continued)
these and related factors, the Directors concluded, within the context of their overall conclusions regarding each of the Continued Agreements, that the nature, extent and quality of services provided supported the renewal of these Agreements.
Investment performance of the relevant Portfolios. The Directors reviewed information about the performance of the relevant Portfolios over various time periods, including information prepared by an independent third party that compared the performance of the Portfolios to the performance of peer groups of funds and performance benchmarks. The Directors also reviewed a description of the third party’s methodology for identifying a Portfolio’s peer group(s) for purposes of performance and expense comparisons.
In the case of each relevant Portfolio that had performance that lagged its peer group(s) for certain periods, the Directors concluded that other factors relevant to performance were sufficient, in light of other considerations, to warrant renewal of the Continued Agreements relating to such Portfolio. These factors varied from Portfolio to Portfolio, but included one or more of the following: (i) that such Portfolio’s performance, although lagging in certain recent periods, was stronger over the longer term; (ii) that the underperformance was attributable, to a significant extent, to investment decisions that were reasonable and consistent with the Portfolio’s investment objective(s) and policies and that the Portfolio was performing within the range of reasonable expectations, given market conditions and the Portfolio’s investment objective(s) and policies; (iii) that the Portfolio’s performance was competitive when compared to other relevant performance benchmarks or peer groups; and (iv) that MetLife Advisers and/or the relevant subadviser (if any) had taken or was taking steps designed to help improve the Portfolio’s investment performance (including, in the case of certain Portfolios, that MetLife Advisers was formulating possible proposals, for presentation to the Board in November 2008, to replace the Portfolio’s subadviser or to merge the Portfolio into another Portfolio with a similar investment objective and better investment performance).
The Directors also considered the investment performance of the Advisers and their reputations generally, the historical responsiveness of the Advisers to Director concerns about performance and the willingness of the Advisers to take steps intended to improve performance.
After reviewing these and related factors, the Directors concluded, within the context of their overall conclusions regarding each of the Continued Agreements, that the investment performance of each relevant Portfolio and Adviser was sufficient, in light of other considerations, to warrant the renewal of the Continued Agreements.
The costs of the services to be provided and profits to be realized by the Advisers and their affiliates from their relationships with the Portfolios. The Directors considered the fees charged by MetLife Advisers to the Portfolios for advisory services and, with respect to the subadvised Portfolios, by such subadvisers to MetLife Advisers for subadvisory services (such advisory and subadvisory fees (if any), collectively, “Fees”), as well as the total expense levels of the Portfolios. This information included comparisons (provided by an independent third party) of the Portfolios’ advisory fees and total expense levels to those of their peer groups. In evaluating Fees for the relevant Portfolios, the Directors also took into account the demands, complexity and quality of the investment management services provided to each Portfolio. The Directors considered MetLife Advisers’ recommendations regarding reductions in Fee rates, implementation of Fee breakpoints and institution of Fee waivers and expense caps.
The Directors also considered the compensation directly or indirectly received by the Advisers and their affiliates from their relationships with the relevant Portfolios. The Directors reviewed information relating to the profits received by MetLife Advisers, certain of the subadvisers and their affiliates as a result of their relationships with the relevant Portfolios, and information about the allocation of expenses used to calculate profitability. When reviewing profitability, the Directors also considered the performance of the relevant Portfolios, the expense levels of such Portfolios and whether the relevant Advisers had implemented breakpoints, fee waivers and/or expense caps with respect to such Portfolios.
After reviewing these and related factors, the Directors concluded, within the context of their overall conclusions regarding each of the Continued Agreements, that the Fees charged to each of the relevant Portfolios were fair and reasonable, and that the information provided regarding costs of these services generally, and the related profitability (if known) to the relevant Advisers of their relationships with the relevant Portfolios, supported the renewal of the Continued Agreements.
Economies of Scale. The Directors considered the existence of any economies of scale in the provision of services by the Advisers and whether those economies were shared with the relevant Portfolios through breakpoints in their advisory fees or other means, such as expense caps, fee waivers or relatively low levels of fees. The Directors noted that most of the relevant Portfolios benefited or will benefit from breakpoints, expense caps and/or fee waivers with respect to their advisory fees. In considering these issues, the Directors also took into consideration information relating to the costs of the services provided and the profitability to MetLife Advisers, the relevant subadvisers (if any) and each of their affiliates of their relationships with the relevant Portfolios, as discussed above.
MSF-31
Metropolitan Series Fund, Inc.
Western Asset Management Strategic Bond Opportunities Portfolio
Board Approval of Advisory and Subadvisory Agreements—(Continued)
After reviewing these and related factors, the Directors concluded, within the context of their overall conclusions regarding each of the Continued Agreements, that the extent to which economies of scale were shared with the relevant Portfolios supported the renewal of such Agreements.
Other Factors. The Directors also considered other factors, which included but were not limited to the following:
| | • | | the extent to which each relevant Portfolio operated in accordance with its investment objective, and its record of compliance with its investment restrictions and the compliance programs of the Fund and the Advisers. They also considered the compliance-related resources the Advisers and their affiliates provide to the relevant Portfolios; |
| | • | | the nature, quality, cost and extent of administrative and shareholder services performed by MetLife Advisers and its affiliates under the Advisory Agreements; and |
| | • | | so-called “fall-out benefits” to the Advisers, such as the engagement of their affiliates to provide distribution, brokerage and transfer agency services to the Portfolios, and the benefits of research made available to the relevant Advisers by reason of brokerage commissions generated by the relevant Portfolios’ securities transactions. The Directors also considered the possible conflicts of interest associated with these fall-out and other benefits, and the reporting and other processes in place to disclose and monitor these possible conflicts of interest. |
Based on their evaluation of all factors that they deemed to be material, including those factors described above, and assisted by the advice of independent counsel, the Directors, including the Independent Directors, concluded that each of the Continued Agreements should be continued through December 31, 2009.
MSF-32
A description of the policies and procedures that the Fund uses to determine how to vote proxies relating to portfolio securities is available (i) without charge, upon request, by calling (800) 638-7732 and (ii) on the Securities and Exchange Commission’s (the “SEC”) website at http://www.sec.gov.
Information regarding how the Fund voted proxies relating to portfolio securities during the most recent twelve-month period ended December 31, 2008 is available (i) without charge, upon request, by calling (800) 638-7732 and (ii) on the SEC’s website at http://www.sec.gov.
The Fund’s Statement of Additional Information includes additional information about the Directors of the Fund and is available (i) without charge, upon request, by calling (800) 638-7732 and (ii) on the SEC’s website at http://www.sec.gov.
The Fund files with the SEC a complete schedule of its portfolio holdings, as of the close of the first and third quarters of its fiscal year, on “Form N-Q”. These filings are available on the SEC’s website at www.sec.gov and may be reviewed and copied at the SEC’s Public Reference Room in Washington, DC. (Call 1-800-SEC-0330 for information on the operation of the Public Reference Room.)
MSF-33
Simplify your life…
with MetLife eDelivery® while helping MetLife preserve the planet’s natural resources.
(see details on inside cover)
| | |
Metropolitan Series Fund, Inc. Western Asset Management U.S. Government Portfolio Annual Report | | December 31, 2008 |
NOT PART OF THE ANNUAL REPORT
Letter from the President
February 1, 2009
Letter to Policy Holders:
2008 was an extraordinary year in the capital markets around the world and for the global economy. Energy prices rose to record levels early in the year before falling by two-thirds by year-end. A credit crisis that began with concerns about sub-prime mortgages led to massive changes in the financial landscape with government takeovers, forced sales, and outright failures of a number of large, once venerable firms.
While bonds as measured by the Barclays Capital U.S. Aggregate Bond Index (formerly known as, Lehman Brothers U.S. Aggregate Bond Index) were up 5.2% for the year in response to declining interest rates, there were large differences in the total returns of the various sectors of the bond market. U.S. treasury securities were up over 13% as frightened investors sought refuge in what they perceived to be the safest and most liquid investments. In contrast, investment grade corporate securities lost nearly 5% as credit spreads widened and below investment grade or high yield bonds fell over 26%.
In response to the growing credit crisis and the weakening economy, common stocks fell sharply across all regions, styles, and capitalizations. As measured by the Standard and Poor’s 500, U.S. common stocks fell 37% for the year, the worst calendar year decline since the 1930s. Foreign stocks were down even more with the MSCI EAFE Index down 43% for the year.
On the following pages, you will find a complete review of your Portfolio and its investment performance.
MetLife is committed to building your financial freedom. We appreciate your trust and will continue to focus our efforts on meeting your investment needs.
Sincerely,
Elizabeth M. Forget
President, Metropolitan Series Fund, Inc.
Metropolitan Series Fund, Inc.
Western Asset Management U.S. Government Portfolio
Managed by Western Asset Management Company
Portfolio Manager Commentary*
PORTFOLIO PERFORMANCE
For the twelve-month period ended December 31, 2008, the Class A shares of the Western Asset Management U.S. Government Portfolio returned -0.4%, compared to its benchmark, the Barclays Capital U.S. Intermediate Government Bond Index1, which returned 10.4%. The average return of its peer group, a universe of short-term and intermediate term government bond funds (mutual and variable) tracked by Morningstar, was 3.8% over the same period.
PORTFOLIO REVIEW
The Federal Reserve intensified its campaign against downside risks to growth in response to the deepening financial crisis. The TED2 spread surged beyond previous extreme levels, and without the provision of credit, investors began to question the durability of the underlying economy. The federal funds rate was reduced a cumulative 425 basis points (525 basis points for the cycle) to near 0% by year end; this essentially moved the Fed beyond its traditional form of stimulus. A number of new lending facilities, designed to meet the liquidity demands of financial intermediaries across the full banking spectrum, were implemented. The Fed and the Treasury recently announced plans to channel up to $600 billion directly to the mortgage market, and up to $200 billion directly to consumer and small business finance, including credit card, auto and student loans. Details emerged that much of this funding would be unsterilized and result in a major increase in the money supply. Yields on 30-year fixed-rate conventional mortgages declined roughly 1% as a result, to the lowest level on record. The Treasury allocated the first $250 billion of funds authorized under Troubled Asset Relief Program (TARP) by taking direct equity stakes in the U.S. banking system. Economic data was negative and third-quarter GDP contracted 0.5% on falling consumption expenditures. Consumer confidence fell as labor market conditions deteriorated and equity prices plunged. The unemployment rate increased 1.7% to 6.7%, though the U.S. dollar gained close to 6% against a trade-weighted basket of currencies. The dollar’s negative correlation with oil held strong as the price per barrel fell 54% after temporarily spiking in the summer. All in all, the period was the worst year for risk-taking in a quarter century. Spreads widened over 350 basis points on investment-grade issues and more than 1,100 basis points on high-yield issues. Mortgage-backed securities performed better, though even these government-backed securities underperformed Treasuries by 2.32% over the period. The S&P 500 Index lost 37% as volatility soared, marking 2008 as the worst year for equities since 1931.
A large overweight exposure to the mortgage-backed sector detracted from returns as volatility remained high and negative housing news continued to damage market sentiment. We had diversified into a number of non-agency issues that were particularly impacted and further detracted from performance due to rising defaults, uncertainty in that marketplace and a lack of liquidity. A modest Treasury Inflation Protected Securities (TIPS) exposure had a negative impact as oil plunged to $40/barrel and inflation fears switched to deflation fears. On a positive note, a tactically-driven duration posture contributed modestly to returns as bond yields rallied over the year. A curve-steepening strategy had a positive impact on performance as the spread between 2- and 10-year yields widened.
* The views expressed above are those of the subadvisory firm as of December 31, 2008 and are subject to change based on market and other conditions. Information about the Portfolio’s holdings, asset allocation, industry allocation, or country diversification is historical and is not an indication of future Portfolio composition, which will vary. The performance of any index mentioned in this commentary has not been adjusted for ongoing management, distribution and operating expenses, and sales charges applicable to mutual fund investments. Direct investment in any index is not possible.
1 The Barclays Capital U.S. Intermediate Government Bond Index® (formerly, Lehman Brothers Intermediate U.S. Government Bond Index) includes most obligations of the U.S. Treasury, agencies and quasi-federal corporations having maturities between one to ten years. The index itself remains unchanged since Barclays assumed responsibility for the index from Lehman.
2 The TED spread is the difference between the 3 month LIBOR and the 3 month U.S. Treasury Bill rate. It is used as a measure of the risk premium of lending to a bank vs. lending to the U.S. government.
MSF-2
Metropolitan Series Fund, Inc.
Western Asset Management U.S. Government Portfolio
A $10,000 INVESTMENT COMPARED TO THE
BARCLAYS CAPITAL U.S. INTERMEDIATE GOVERNMENT BOND INDEX
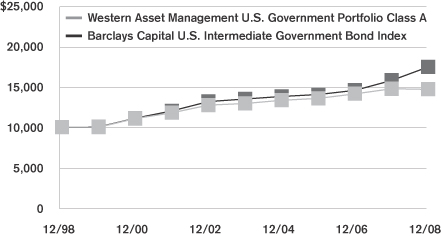
Average Annual Returns as of December 31, 2008
| | | | | | | | | | | | |
| | | Western Asset Management U.S. Government Portfolio | | | Barclays Capital
U.S. Intermediate
Government Bond Index | |
| | | Class A | | | Class B | | | Class E | | |
| 1 Year | | -0.4 | % | | -0.5 | % | | -0.4 | % | | 10.4 | % |
| 5 Year | | 2.6 | | | 2.3 | | | 2.4 | | | 5.3 | |
| 10 Year | | 3.9 | | | — | | | — | | | 5.7 | |
| Since Inception | | — | | | 2.6 | | | 3.3 | | | — | |
Performance numbers are net of all Portfolio expenses but do not include any insurance, sales, or administrative charges of variable annuity or life insurance contracts or any additional expenses that participants in certain eligible qualified plans may bear relating to the operations of their plans. If these charges were included, the returns would be lower.
Inception dates of the Class A, Class B and Class E shares are: 10/31/94, 7/30/02 and 5/1/01, respectively.
This information represents past performance and is not indicative of future results. Investment return and principal value may fluctuate so that shares, upon redemption, may be worth more or less than the original cost.
PORTFOLIO COMPOSITION
as of December 31, 2008
Top Holdings
| | |
| | | % of Total
Net Assets |
Federal National Mortgage Association | | 41.4% |
Federal Home Loan Mortgage Corp. | | 14.4% |
U.S. Treasury Bonds | | 4.4% |
U.S. Treasury Notes | | 3.2% |
Government National Mortgage Association | | 1.9% |
Federal Home Loan Bank | | 1.2% |
Thornburg Mortgage Securities Trust | | 0.9% |
General Electric Capital Corp. | | 0.9% |
Bear Stearns Structured Products, Inc. (144A) | | 0.9% |
MASTR Reperforming Loan Trust (144A) | | 0.7% |
Top Sectors
| | |
| | | % of Total
Market Value |
Residential Mortgage-Backed | | 73.7% |
Government | | 9.1% |
Index-Linked | | 5.6% |
Cash Equivalents | | 5.5% |
Commercial Mortgage-Backed | | 3.2% |
Asset Backed | | 1.6% |
Investment Grade | | 1.3% |
MSF-3
Metropolitan Series Fund, Inc.
Shareholder Expense Example
As a shareholder of the Portfolio, you incur ongoing costs, including management fees; distribution and service (12b-1) fees; and other Portfolio expenses. This example is intended to help you understand your ongoing costs (in dollars) (referred to as “expenses”) of investing in the Portfolio and compare these costs with the ongoing costs of investing in other mutual funds. The example is based on an investment of $1,000 invested at the beginning of the period and held for the entire period, July 1, 2008 through December 31, 2008.
Actual Expenses
The first line for each share class of the Portfolio in the table below provides information about actual account values and actual expenses. You may use the information in this line, together with the amount you invested in the particular share class of the Portfolio, to estimate the expenses that you paid over the period. Simply divide your account value by $1,000 (for example, an $8,600 account value divided by $1,000=8.6), then multiply the result by the number in the first line under the heading entitled “Expenses Paid During Period” to estimate the expenses you paid on your account during this period.
Hypothetical Example for Comparison Purposes
The second line for each share class of the Portfolio in the table below provides information about hypothetical account values and hypothetical expenses based on the Portfolio’s actual expense ratio and an assumed rate of return of 5% per year before expenses, which is not the Portfolio’s actual return. The hypothetical account values and expenses may not be used to estimate the actual ending account balance or expenses you paid for the period. You may use this information to compare the ongoing costs of investing in the Portfolio and other funds. To do so, compare this 5% hypothetical example with the 5% hypothetical examples that appear in the shareholder reports of the other funds.
Please note that the expenses shown in the table are meant to highlight your ongoing costs only and do not reflect any fees or charges of your variable insurance product or any additional expenses that participants in certain eligible qualified plans may bear relating to the operations of their plan. Therefore, the second line for each share class in the table is useful in comparing ongoing costs only, and will not help you determine the relative total costs of owning different funds. In addition, if these other costs were included, your costs would have been higher.
| | | | | | | | | | | | | | |
Portfolio | | | | Annualized
Expense
Ratio | | | Beginning
Account Value
July 1,
2008 | | Ending
Account Value
December 31,
2008 | | Expenses Paid
During Period*
July 1, 2008
to
December 31,
2008 |
Western Asset Mgt. U.S. Government—Class A | | Actual | | 0.52 | % | | $ | 1,000.00 | | $ | 1,000.00 | | $ | 2.61 |
| | Hypothetical | | 0.52 | % | | $ | 1,000.00 | | $ | 1,022.49 | | $ | 2.64 |
| | | | | |
Western Asset Mgt. U.S. Government—Class B | | Actual | | 0.77 | % | | $ | 1,000.00 | | $ | 999.16 | | $ | 3.87 |
| | Hypothetical | | 0.77 | % | | $ | 1,000.00 | | $ | 1,021.22 | | $ | 3.91 |
| | | | | |
Western Asset Mgt. U.S. Government—Class E | | Actual | | 0.67 | % | | $ | 1,000.00 | | $ | 999.16 | | $ | 3.37 |
| | Hypothetical | | 0.67 | % | | $ | 1,000.00 | | $ | 1,021.73 | | $ | 3.40 |
* Expenses paid are equal to the Portfolio’s annualized expense ratio for the most recent six month period, as shown above, multiplied by the average account value over the period, multiplied by the number of days in the most recent fiscal half-year, divided by 366 (to reflect the the one-half year period).
MSF-4
Metropolitan Series Fund, Inc.
Western Asset Management U.S. Government Portfolio
Schedule of Investments as of December 31, 2008
Fixed Income—112.9% of Total Net Assets
| | | | | | |
| Security Description | | Face
Amount | | Value* |
| | | | | | |
|
Asset Backed—4.3% |
AAMES Mortgage Investment Trust (144A)
0.621%, 08/25/35 (a) | | $ | 130,886 | | $ | 121,899 |
ACE Securities Corp.
0.601%, 02/25/31 (a) | | | 4,022,913 | | | 2,906,081 |
Bayview Financial Aquisition Trust
0.861%, 08/28/44 (a) | | | 53,501 | | | 47,227 |
Bayview Financial Asset Trust (144A)
1.071%, 12/25/39 (a) | | | 756,951 | | | 581,005 |
Bear Stearns Asset Backed Securities Trust
0.581%, 10/25/36 (a) | | | 1,458,116 | | | 1,319,537 |
0.821%, 09/25/34 (a) | | | 3,202,198 | | | 3,017,372 |
Bravo Mortgage Asset Trust (144A)
0.601%, 07/25/36 (a) | | | 148,653 | | | 132,253 |
Capital One Multi-Asset Execution Trust
1.285%, 01/17/12 (a) | | | 500,000 | | | 495,001 |
Carrington Mortgage Loan Trust
0.631%, 10/25/36 (a) | | | 1,200,000 | | | 764,080 |
Compucredit Acquired Portfolio Voltage Master Trust (144A)
1.365%, 09/15/18 (a) | | | 4,205,326 | | | 2,801,798 |
Countrywide Home Equity Loan Trust
1.335%, 12/25/31 (a) | | | 4,888,654 | | | 1,964,915 |
1.475%, 02/15/34 (a) | | | 651,529 | | | 312,467 |
1.485%, 02/15/34 (a) | | | 435,935 | | | 239,829 |
1.565%, 12/15/28 (a) | | | 471,077 | | | 349,102 |
1.745%, 08/15/37 (a) | | | 772,524 | | | 406,711 |
EMC Mortgage Loan Trust (144A)
0.921%, 12/25/42 (a) | | | 199,699 | | | 157,432 |
Fremont Home Loan Trust
0.571%, 08/25/36 (a) | | | 875,497 | | | 704,053 |
GMAC Mortgage Corp. Loan Trust
0.541%, 07/25/36 (a) | | | 1,739,235 | | | 603,885 |
0.681%, 11/25/36 (a) | | | 9,206,274 | | | 2,421,823 |
Green Tree (144A)
8.970%, 04/25/38 | | | 10,600,000 | | | 8,448,194 |
GSAMP Trust
0.561%, 07/05/36 (a) | | | 1,843,499 | | | 696,341 |
GSR Mortgage Loan Trust
0.741%, 11/25/30 (a) | | | 2,000,000 | | | 311,525 |
Indymac Seconds Asset Backed Trust
0.601%, 06/25/36 (a) | | | 5,674,124 | | | 962,017 |
Lehman XS Trust
0.561%, 02/25/37 (a) | | | 3,666,608 | | | 2,973,238 |
0.591%, 06/25/37 (a) | | | 4,672,248 | | | 3,397,040 |
Morgan Stanley Mortgage Loan Trust
0.561%, 09/25/46 (a) | | | 649,799 | | | 515,923 |
0.591%, 10/25/36 (a) | | | 2,281,072 | | | 1,952,236 |
0.621%, 03/25/36 (a) | | | 3,337,127 | | | 784,865 |
Natixis Real Estate Capital Trust
0.601%, 07/25/37 (a) | | | 675,520 | | | 593,560 |
Nelnet Student Loan Trust
5.015%, 04/25/24 (a) | | | 2,490,000 | | | 2,017,233 |
Option One Mortgage Loan Trust
1.051%, 06/25/33 (a) | | | 236,604 | | | 151,900 |
| | | | | | |
| Security Description | | Face
Amount | | Value* |
| | | | | | |
|
Asset Backed—(Continued) |
Ownit Mortgage Loan Asset Backed Certificates
5.290%, 12/25/36 (a) | | $ | 3,149,449 | | $ | 2,109,083 |
RAAC Series (144A)
0.741%, 05/25/36 (a) | | | 4,443,468 | | | 3,330,287 |
SACO I, Inc.
0.601%, 06/25/36 (a) | | | 4,632,358 | | | 770,273 |
0.621%, 04/25/36 (a) | | | 1,610,544 | | | 314,572 |
0.721%, 07/25/35 (a) | | | 87,934 | | | 76,620 |
0.731%, 06/25/36 (a) | | | 64,231 | | | 31,296 |
SLM Student Loan Trust
3.525%, 07/25/17 (a) | | | 3,682,805 | | | 3,571,698 |
3.545%, 10/25/17 (a) | | | 545,256 | | | 543,327 |
Soundview Home Equity Loan Trust
5.645%, 10/25/36 (a) | | | 4,180,000 | | | 4,056,780 |
Structured Asset Securities Corp. (144A)
0.581%, 02/25/36 (a) (b) | | | 3,528,607 | | | 461,078 |
| | | | | | |
| | | | | | 57,415,556 |
| | | | | | |
|
Collateralized-Mortgage Obligation—10.1% |
American Home Mortgage Assets
0.661%, 11/25/36 (a) | | | 4,588,247 | | | 1,899,628 |
0.661%, 09/25/46 (a) | | | 1,714,221 | | | 679,099 |
Banc of America Funding Corp.
4.123%, 06/20/35 (a) | | | 686,803 | | | 299,515 |
5.791%, 10/25/36 (a) | | | 557,090 | | | 465,897 |
Banc of America Mortgage Securities, Inc.
5.007%, 07/25/35 (a) | | | 474,203 | | | 344,742 |
Bear Stearns Alt-A Trust
6.089%, 05/25/36 (a) | | | 3,170,805 | | | 1,876,576 |
Bear Stearns Structured Products, Inc. (144A)
1.071%, 09/27/37 (a) | | | 17,190,796 | | | 16,717,705 |
Citigroup Mortgage Loan Trust, Inc.
4.700%, 12/25/35 (a) | | | 866,287 | | | 628,339 |
Countrywide Alternative Loan Trust
0.661%, 09/25/46 (a) | | | 814,477 | | | 285,045 |
0.708%, 07/25/36 (a) | | | 15,617,659 | | | 5,255,124 |
0.738%, 07/20/35 (a) | | | 2,413,980 | | | 1,191,078 |
0.741%, 11/25/35 (a) | | | 513,073 | | | 247,442 |
1.685%, 05/25/34 (a) | | | 8,281,920 | | | 4,632,054 |
2.495%, 02/25/36 (a) | | | 3,248,734 | | | 1,074,461 |
Deutsche Mortgage Securities, Inc. (144A)
5.094%, 06/26/35 (a) | | | 4,670,000 | | | 3,375,313 |
First Horizon Alternative Mortgage Securities
1.765%, 02/25/37 (a) | | | 725,329 | | | 217,081 |
GMAC Mortgage Corp. Loan Trust
5.584%, 11/19/35 (a) | | | 1,958,062 | | | 1,126,079 |
Greenpoint Mortgage Funding Trust
0.551%, 03/25/37 (a) | | | 921,137 | | | 465,069 |
GSMPS Mortgage Loan Trust (144A)
5.911%, 06/25/34 (a) | | | 8,117,331 | | | 4,477,944 |
GSR Mortgage Loan Trust
5.384%, 04/25/35 (a) | | | 1,875,198 | | | 1,035,634 |
Harborview Mortgage Trust
0.731%, 03/19/38 (a) | | | 928,018 | | | 368,499 |
*See accompanying notes to financial statements.
MSF-5
Metropolitan Series Fund, Inc.
Western Asset Management U.S. Government Portfolio
Schedule of Investments as of December 31, 2008
Fixed Income—(Continued)
| | | | | | |
| Security Description | | Face
Amount | | Value* |
| | | | | | |
|
Collateralized-Mortgage Obligation—(Continued) |
Harborview Mortgage Trust
0.761%, 11/19/46 (a) | | $ | 324,135 | | $ | 128,878 |
0.781%, 10/19/37 (a) | | | 791,231 | | | 322,294 |
Impac Secured Assets CMN Owner Trust
0.791%, 03/25/36 (a) | | | 9,813,874 | | | 4,553,026 |
JPMorgan Mortgage Trust
4.587%, 07/25/34 (a) | | | 1,502,546 | | | 1,158,387 |
Lehman XS Trust
0.601%, 06/25/37 (a) | | | 841,472 | | | 609,545 |
Luminent Mortgage Trust
0.661%, 05/25/46 (a) | | | 6,108,117 | | | 2,706,659 |
MASTR Adjustable Rate Mortgages Trust
0.671%, 05/25/47 (a) | | | 12,163,276 | | | 4,689,659 |
3.279%, 12/25/46 (a) | | | 10,979,394 | | | 2,240,126 |
4.281%, 02/25/34 (a) | | | 551,248 | | | 280,512 |
5.737%, 12/25/34 (a) | | | 44,828 | | | 23,771 |
MASTR Reperforming Loan Trust (144A)
1.745%, 05/25/35 (a) | | | 740,816 | | | 493,165 |
5.524%, 05/25/35 (a) | | | 8,561,868 | | | 7,256,440 |
5.895%, 05/25/36 (a) | | | 7,066,354 | | | 5,860,658 |
Merrill Lynch Mortgage Investors, Inc.
1.665%, 04/25/35 (a) | | | 136,233 | | | 53,360 |
Morgan Stanley Mortgage Loan Trust
0.541%, 06/25/36 (a) | | | 3,198,057 | | | 2,639,712 |
5.063%, 07/25/35 (a) | | | 700,509 | | | 379,944 |
5.364%, 10/25/34 (a) | | | 396,468 | | | 206,970 |
5.485%, 06/26/36 (a) | | | 5,470,202 | | | 3,283,927 |
Novastar Mortgage-Backed Notes
0.661%, 06/25/36 (a) | | | 5,875,930 | | | 2,437,688 |
Provident Funding Mortgage Loan Trust
4.628%, 10/25/35 (a) | | | 485,873 | | | 342,808 |
5.729%, 05/25/35 (a) | | | 3,256,689 | | | 2,267,924 |
Residential Accredit Loans, Inc.
0.631%, 01/25/37 (a) | | | 1,040,738 | | | 385,919 |
0.871%, 10/25/45 (a) | | | 885,487 | | | 407,051 |
5.410%, 10/25/46 (a) | | | 6,463,397 | | | 5,007,797 |
5.812%, 12/25/35 (a) | | | 5,302,285 | | | 2,843,598 |
Residential Funding Mortgage Securities I
4.750%, 12/25/18 | | | 3,522,843 | | | 3,439,176 |
SACO I, Inc. (144A)
8.964%, 06/25/21 (a) | | | 4,215,447 | | | 4,347,727 |
Structured Adjustable Rate Mortgage Loan Trust
5.370%, 05/25/35 (a) | | | 9,585,683 | | | 4,997,174 |
Structured Asset Mortgage Investments, Inc.
0.651%, 09/25/37 (a) | | | 5,060,199 | | | 1,560,008 |
0.651%, 07/25/46 (a) | | | 718,625 | | | 287,170 |
0.681%, 08/25/36 (a) | | | 891,185 | | | 354,054 |
Thornburg Mortgage Securities Trust
0.576%, 05/25/46 (a) | | | 811,019 | | | 736,863 |
0.581%, 06/25/36 (a) | | | 4,921,347 | | | 4,814,644 |
0.641%, 01/25/36 (a) | | | 3,832,633 | | | 3,818,016 |
1.525%, 06/25/37 (a) | | | 8,737,380 | | | 7,297,421 |
6.203%, 09/25/37 (a) | | | 349,818 | | | 268,386 |
6.216%, 09/25/37 (a) | | | 373,302 | | | 264,379 |
| | | | | | |
| Security Description | | Face
Amount | | Value* |
| | | | | | |
|
Collateralized-Mortgage Obligation—(Continued) |
WaMu Mortgage Pass-Through Certificates
0.731%, 11/25/45 (a) | | $ | 170,414 | | $ | 83,604 |
0.741%, 12/25/45 (a) | | | 4,749,328 | | | 2,230,785 |
0.761%, 12/25/45 (a) | | | 376,213 | | | 173,566 |
0.791%, 08/25/45 (a) | | | 426,050 | | | 230,381 |
0.871%, 08/25/45 (a) | | | 875,446 | | | 299,812 |
Zuni Mortgage Loan Trust
0.601%, 08/25/36 (a) | | | 737,438 | | | 699,048 |
| | | | | | |
| | | | | | 133,144,356 |
| | | | | | |
|
Commercial Mortgage-Backed Securities—3.2% |
Banc of America Commercial Mortgage, Inc.
5.620%, 02/10/51 | | | 80,000 | | | 51,409 |
Credit Suisse Mortgage Capital Certificates
5.311%, 12/15/39 | | | 10,200,000 | | | 7,914,430 |
CS First Boston Mortgage Securities Corp.
4.889%, 11/15/37 (a) | | | 4,280,000 | | | 2,013,450 |
5.100%, 08/15/38 (a) | | | 7,550,000 | | | 6,178,188 |
GE Capital Commercial Mortgage Corp.
5.334%, 11/10/45 (a) | | | 3,000,000 | | | 2,428,498 |
JPMorgan Chase Commercial Mortgage Securities Corp.
4.951%, 01/12/37 (a) | | | 4,950,000 | | | 2,363,531 |
4.999%, 10/15/42 (a) | | | 3,100,000 | | | 1,820,372 |
5.420%, 01/15/49 | | | 1,200,000 | | | 848,361 |
5.429%, 12/12/43 | | | 10,990,000 | | | 8,341,572 |
LB-UBS Commercial Mortgage Trust
4.858%, 12/15/39 (a) | | | 5,500,000 | | | 2,611,698 |
5.661%, 03/15/39 (a) | | | 3,480,000 | | | 2,834,545 |
Merrill Lynch Mortgage Trust
5.657%, 05/12/39 (a) | | | 5,635,000 | | | 4,589,131 |
| | | | | | |
| | | | | | 41,995,185 |
| | | | | | |
|
Diversified Financial Services—1.3% |
General Electric Capital Corp.
3.000%, 12/09/11 (c) | | | 16,500,000 | | | 17,058,525 |
| | | | | | |
|
Federal Agencies—81.9% |
Federal Home Loan Bank
2.450%, 05/04/09 | | | 7,900,000 | | | 7,957,196 |
5.250%, 12/11/20 | | | 12,000,000 | | | 14,388,636 |
Federal Home Loan Mortgage Corp.
3.250%, 02/25/11 (c) | | | 14,040,000 | | | 14,599,775 |
4.000%, 05/01/19 | | | 132,812 | | | 134,675 |
4.101%, 01/01/35 (a) | | | 76,182 | | | 74,955 |
4.141%, 01/01/35 (a) | | | 137,315 | | | 137,020 |
4.500%, 04/15/32 | | | 304,579 | | | 303,251 |
4.500%, 04/01/33 | | | 1,852,703 | | | 1,883,073 |
4.500%, 04/01/35 | | | 1,501,563 | | | 1,524,300 |
5.000%, 12/01/18 | | | 1,329,615 | | | 1,372,932 |
5.000%, 08/01/19 | | | 1,932,057 | | | 1,990,881 |
5.000%, 08/01/33 | | | 229,348 | | | 234,948 |
5.000%, 12/01/34 | | | 331,995 | | | 339,842 |
5.000%, 10/01/35 | | | 8,150,768 | | | 8,340,875 |
5.000%, 05/01/36 | | | 2,360,858 | | | 2,415,923 |
5.500%, 07/01/35 | | | 2,077,519 | | | 2,129,220 |
*See accompanying notes to financial statements.
MSF-6
Metropolitan Series Fund, Inc.
Western Asset Management U.S. Government Portfolio
Schedule of Investments as of December 31, 2008
Fixed Income—(Continued)
| | | | | | |
| Security Description | | Face
Amount | | Value* |
| | | | | | |
|
Federal Agencies—(Continued) |
Federal Home Loan Mortgage Corp.
5.500%, 10/01/35 | | $ | 7,199,907 | | $ | 7,379,086 |
5.500%, 07/01/37 | | | 3,661,568 | | | 3,751,913 |
5.500%, 12/01/37 | | | 130,570,336 | | | 133,794,590 |
5.551%, 11/01/37 (a) | | | 1,391,167 | | | 1,420,983 |
5.674%, 01/01/37 (a) | | | 1,101,673 | | | 1,124,505 |
5.776%, 02/01/37 (a) | | | 136,162 | | | 139,256 |
5.822%, 11/01/37 (a) | | | 1,189,175 | | | 1,220,269 |
5.852%, 01/01/37 (a) | | | 1,948,494 | | | 1,991,772 |
5.887%, 05/01/37 (a) | | | 306,166 | | | 313,546 |
5.932%, 05/01/37 (a) | | | 345,820 | | | 354,236 |
6.000%, 10/01/10 | | | 101 | | | 105 |
6.000%, 10/01/28 | | | 68,611 | | | 71,176 |
6.000%, 11/01/28 | | | 76,536 | | | 79,397 |
6.000%, 12/01/31 | | | 82,767 | | | 85,654 |
6.000%, 10/01/37 | | | 6,632,642 | | | 6,839,822 |
6.000%, 12/01/37 | | | 65,537,662 | | | 67,584,821 |
6.000%, TBA | | | 1,000,000 | | | 1,030,000 |
6.414%, 10/01/36 (a) | | | 721,728 | | | 740,443 |
6.500%, 08/01/13 | | | 11,258 | | | 11,647 |
6.500%, 03/01/26 | | | 2,012 | | | 2,109 |
6.500%, 07/01/26 | | | 40,275 | | | 42,226 |
6.500%, 09/01/31 | | | 133,281 | | | 139,237 |
7.000%, 07/01/11 | | | 3,460 | | | 3,585 |
7.500%, 05/01/32 | | | 218,331 | | | 231,606 |
8.000%, 12/01/19 | | | 9,707 | | | 10,250 |
8.000%, 07/01/20 | | | 25,001 | | | 26,369 |
8.000%, 09/01/30 | | | 17,845 | | | 18,930 |
8.500%, 06/15/21 | | | 139,822 | | | 152,552 |
9.000%, 10/01/17 | | | 3,495 | | | 3,520 |
Federal National Mortgage Association
4.000%, 08/01/19 | | | 92,692 | | | 94,210 |
4.000%, 08/01/20 | | | 1,033,044 | | | 1,046,741 |
4.000%, 05/01/33 | | | 741,913 | | | 734,995 |
4.223%, 12/01/34 (a) | | | 215,918 | | | 214,966 |
4.341%, 11/01/34 (a) | | | 139,147 | | | 139,628 |
4.500%, 05/01/19 | | | 1,016,501 | | | 1,043,002 |
4.500%, 09/01/19 | | | 2,463,868 | | | 2,528,104 |
4.500%, 03/01/20 | | | 447,486 | | | 458,593 |
4.500%, 04/01/20 | | | 16,920 | | | 17,340 |
4.500%, 08/01/35 | | | 155,473 | | | 157,858 |
4.500%, 10/01/35 | | | 340,928 | | | 346,158 |
4.750%, 11/19/12 | | | 7,550,000 | | | 8,308,209 |
5.000%, 10/01/17 | | | 2,230,207 | | | 2,309,260 |
5.000%, 12/01/17 | | | 12,080,222 | | | 12,508,423 |
5.000%, 02/01/18 | | | 2,557,808 | | | 2,645,059 |
5.000%, 03/01/18 | | | 2,105,831 | | | 2,175,829 |
5.000%, 04/01/18 | | | 3,112,040 | | | 3,212,625 |
5.000%, 05/01/18 | | | 971,795 | | | 1,003,205 |
5.000%, 06/01/18 | | | 2,922,349 | | | 3,016,804 |
5.000%, 11/01/18 | | | 3,243,633 | | | 3,348,472 |
5.000%, 10/01/20 | | | 1,815,273 | | | 1,868,273 |
5.000%, 11/01/33 | | | 9,382,627 | | | 9,604,398 |
5.000%, 07/01/34 | | | 11,343,396 | | | 11,604,423 |
5.000%, 08/01/34 | | | 1,016,153 | | | 1,039,536 |
| | | | | | |
| Security Description | | Face
Amount | | Value* |
| | | | | | |
|
Federal Agencies—(Continued) |
Federal National Mortgage Association
5.000%, 03/01/35 | | $ | 748,183 | | $ | 765,400 |
5.000%, 06/01/35 | | | 10,447,701 | | | 10,688,116 |
5.000%, 08/01/35 | | | 7,565,056 | | | 7,734,410 |
5.000%, 09/01/35 | | | 3,067,041 | | | 3,135,701 |
5.000%, 10/01/35 | | | 10,432,222 | | | 10,665,762 |
5.000%, 12/01/35 | | | 551,914 | | | 564,270 |
5.000%, 11/01/36 | | | 2,509,955 | | | 2,566,144 |
5.000%, 06/01/38 | | | 62,475 | | | 63,854 |
5.000%, 07/01/38 | | | 7,680,855 | | | 7,850,401 |
5.000%, TBA | | | 263,100,000 | | | 268,608,788 |
5.500%, 03/15/11 (c) | | | 13,980,000 | | | 15,285,243 |
5.500%, 08/01/22 | | | 626,106 | | | 645,924 |
5.500%, 12/01/22 | | | 47,015 | | | 48,503 |
5.500%, 09/01/24 | | | 2,956,405 | | | 3,039,808 |
5.500%, 02/01/35 | | | 12,823,400 | | | 13,190,616 |
5.500%, 04/01/35 | | | 3,028,731 | | | 3,108,364 |
5.500%, 09/01/35 | | | 9,708,299 | | | 9,963,556 |
5.500%, 12/01/35 | | | 827,079 | | | 848,825 |
5.500%, 02/01/36 (a) | | | 15,570,338 | | | 15,870,595 |
5.500%, 11/01/36 | | | 22,416,823 | | | 23,006,220 |
5.500%, 08/01/37 | | | 14,238,400 | | | 14,612,765 |
5.500%, 04/01/38 | | | 298,526 | | | 306,329 |
5.500%, 05/01/38 | | | 1,971,777 | | | 2,023,312 |
5.500%, TBA | | | 56,800,000 | | | 58,486,278 |
5.542%, 01/25/43 (a) | | | 784,986 | | | 703,216 |
5.557%, 05/01/36 (a) | | | 14,013,055 | | | 14,343,526 |
5.745%, 08/01/37 (a) | | | 12,082,462 | | | 12,536,942 |
6.000%, 06/01/32 | | | 214,511 | | | 221,660 |
6.000%, 01/01/33 | | | 790,036 | | | 816,363 |
6.000%, 04/01/35 | | | 6,865,614 | | | 7,088,034 |
6.000%, 10/01/36 | | | 12,098,047 | | | 12,469,065 |
6.000%, 11/01/36 | | | 10,821,613 | | | 11,153,486 |
6.000%, 09/01/37 | | | 168,577 | | | 173,737 |
6.000%, 10/01/37 | | | 25,219,758 | | | 25,991,769 |
6.000%, 11/01/37 | | | 61,725,591 | | | 63,615,096 |
6.000%, TBA | | | 1,800,000 | | | 1,863,375 |
6.077%, 02/17/09 (a) | | | 3,000,000 | | | 2,996,250 |
6.328%, 07/01/37 (a) | | | 15,022,840 | | | 15,590,468 |
6.476%, 07/01/37 (a) | | | 729,529 | | | 758,033 |
6.500%, 12/01/10 | | | 1,086 | | | 1,129 |
6.500%, 04/01/13 | | | 35,750 | | | 37,167 |
6.500%, 07/01/13 | | | 20,674 | | | 21,494 |
6.500%, 06/01/17 | | | 330,905 | | | 343,824 |
6.500%, 03/01/26 | | | 3,730 | | | 3,906 |
6.500%, 12/01/27 | | | 13,681 | | | 14,361 |
6.500%, 04/01/29 | | | 220,081 | | | 230,329 |
6.500%, 05/01/32 | | | 417,738 | | | 433,957 |
6.500%, 07/01/32 | | | 2,683,016 | | | 2,823,159 |
6.500%, 09/01/34 | | | 344,645 | | | 358,970 |
6.500%, 11/01/36 | | | 562,102 | | | 584,498 |
6.500%, 09/01/37 | | | 832,458 | | | 865,580 |
6.500%, 10/01/37 | | | 56,340 | | | 58,581 |
6.500%, TBA | | | 37,800,000 | | | 39,252,956 |
7.000%, 12/01/14 | | | 21,380 | | | 22,220 |
*See accompanying notes to financial statements.
MSF-7
Metropolitan Series Fund, Inc.
Western Asset Management U.S. Government Portfolio
Schedule of Investments as of December 31, 2008
Fixed Income—(Continued)
| | | | | | |
| Security Description | | Face
Amount | | Value* |
| | | | | | |
|
Federal Agencies—(Continued) |
Federal National Mortgage Association
7.000%, 07/01/15 | | $ | 3,875 | | $ | 4,039 |
7.000%, 11/01/23 | | | 5,194 | | | 5,500 |
7.000%, 02/01/28 | | | 16,665 | | | 17,649 |
7.000%, 10/01/28 | | | 127,718 | | | 135,115 |
7.000%, 11/01/28 | | | 7,103 | | | 7,480 |
7.000%, 02/01/29 | | | 30,875 | | | 32,687 |
7.000%, 01/01/30 | | | 12,925 | | | 13,674 |
7.000%, 11/01/31 | | | 88,085 | | | 93,206 |
7.000%, 01/01/34 | | | 553,135 | | | 584,112 |
7.500%, 02/01/16 | | | 77,313 | | | 80,796 |
7.500%, 11/01/29 | | | 59,525 | | | 63,048 |
7.500%, 11/01/30 | | | 20,042 | | | 21,219 |
7.500%, 01/01/31 | | | 11,002 | | | 11,648 |
7.500%, 04/01/32 | | | 42,412 | | | 44,937 |
7.500%, 05/01/32 | | | 27,804 | | | 29,460 |
8.000%, 05/01/28 | | | 8,968 | | | 9,498 |
8.000%, 08/01/30 | | | 3,205 | | | 3,404 |
8.000%, 10/01/30 | | | 10,939 | | | 11,618 |
8.000%, 02/01/31 | | | 287,311 | | | 304,600 |
8.000%, 07/01/32 | | | 1,365 | | | 1,450 |
11.500%, 09/01/19 | | | 536 | | | 609 |
12.000%, 10/01/15 | | | 31,933 | | | 36,657 |
12.000%, 01/15/16 | | | 1,464 | | | 1,683 |
12.500%, 09/20/15 | | | 2,118 | | | 2,458 |
12.500%, 01/15/16 | | | 14,451 | | | 16,853 |
Government National Mortgage Association 5.500%, 09/15/34 | | | 1,969,230 | | | 2,033,990 |
5.500%, 06/15/35 | | | 628,642 | | | 649,119 |
5.500%, 12/15/35 | | | 4,378,764 | | | 4,521,396 |
6.000%, 03/15/33 | | | 4,259,991 | | | 4,408,386 |
6.000%, 10/15/36 | | | 600,068 | | | 620,505 |
6.000%, 02/15/37 | | | 132,776 | | | 137,392 |
6.000%, 11/15/37 | | | 181,754 | | | 187,952 |
6.000%, TBA | | | 20,200,000 | | | 20,806,000 |
6.500%, 06/15/31 | | | 26,997 | | | 28,376 |
6.500%, 08/15/34 | | | 649,975 | | | 677,898 |
7.000%, 09/15/31 | | | 36,212 | | | 38,314 |
7.500%, 01/15/29 | | | 13,985 | | | 14,820 |
7.500%, 09/15/29 | | | 13,706 | | | 14,525 |
7.500%, 02/15/30 | | | 19,070 | | | 20,126 |
7.500%, 04/15/30 | | | 30,159 | | | 31,961 |
7.500%, 05/15/30 | | | 13,151 | | | 13,937 |
7.500%, 09/15/30 | | | 26,816 | | | 28,419 |
8.500%, 05/15/18 | | | 20,698 | | | 22,130 |
8.500%, 06/15/25 | | | 112,835 | | | 120,599 |
9.000%, 03/15/09 | | | 108 | | | 110 |
9.000%, 04/15/09 | | | 506 | | | 516 |
9.000%, 05/15/09 | | | 281 | | | 287 |
9.000%, 09/15/09 | | | 1,158 | | | 1,184 |
9.000%, 12/15/16 | | | 10,422 | | | 11,141 |
| | | | | | |
| | | | | | 1,080,192,036 |
| | | | | | |
| | | | | | |
| Security Description | | Face
Amount | | Value* |
| | | | | | |
|
Government Agency—1.5% |
Financing Corp. Strips
Zero Coupon, 06/27/11 | | $ | 13,949,000 | | $ | 13,486,200 |
National Archives Facility Trust
8.500%, 09/01/19 | | | 4,742,894 | | | 5,731,218 |
| | | | | | |
| | | | | | 19,217,418 |
| | | | | | |
|
U.S. Treasury—10.6% |
U.S. Treasury Bond Principal Strip
Zero Coupon, 11/15/09 | | | 7,500,000 | | | 7,429,905 |
U.S. Treasury Bonds
7.125%, 02/15/23 (c) | | | 25,770,000 | | | 37,386,627 |
U.S. Treasury Inflation Indexed Bonds (TII)
2.000%, 01/15/26 (c) (d) | | | 27,200,928 | | | 25,621,995 |
2.375%, 01/15/27 (c) | | | 10,356,059 | | | 10,403,790 |
U.S. Treasury Inflation Indexed Notes (TII)
0.875%, 04/15/10 (c) | | | 30,430,398 | | | 28,599,827 |
1.375%, 07/15/18 (c) (d) | | | 9,383,524 | | | 8,775,791 |
U.S. Treasury Notes
4.000%, 08/31/09 (c) | | | 14,790,000 | | | 15,142,993 |
4.000%, 08/15/18 | | | 20,000 | | | 23,095 |
4.750%, 05/31/12 (c) | | | 5,370,000 | | | 6,010,625 |
| | | | | | |
| | | | | | 139,394,648 |
| | | | | | |
Total Fixed Income
(Identified Cost $1,569,404,809) | | | | | | 1,488,417,724 |
| | | | | | |
|
| Options Purchased—0.0% |
| Security Description | | Contracts | | Value* |
|
Put Options—0.0% |
U.S. Treasury Notes 10 Year Future | | | 191 | | | 29,844 |
| | | | | | |
Total Options Purchased
(Identified Cost $251,547) | | | | | | 29,844 |
| | | | | | |
|
| Preferred Stock—0.0% |
| Security Description | | Shares | | Value* |
|
Thrifts & Mortgage Finance—0.0% |
Federal Home Loan Mortgage Corp. (c) | | | 150,025 | | | 58,510 |
Federal National Mortgage Association | | | 108,775 | | | 90,283 |
| | | | | | |
Total Preferred Stock
(Identified Cost $6,470,000) | | | | | | 148,793 |
| | | | | | |
*See accompanying notes to financial statements.
MSF-8
Metropolitan Series Fund, Inc.
Western Asset Management U.S. Government Portfolio
Schedule of Investments as of December 31, 2008
Short Term Investments—26.3%
| | | | | | | |
| Security Description | | Shares/Face
Amount | | Value* | |
| | | | | | | |
|
Discount Notes—13.9% | |
Federal Home Loan Bank
0.125%, 01/02/09 | | $ | 30,500,000 | | $ | 30,497,645 | |
1.123%, 03/26/09 | | | 28,200,000 | | | 28,190,130 | |
1.363%, 05/20/09 | | | 48,200,000 | | | 47,976,673 | |
Federal Home Loan Mortgage Corp.
1.385%, 05/05/09 | | | 21,100,000 | | | 21,009,153 | |
Federal National Mortgage Association
1.385%, 05/05/09 | | | 56,100,000 | | | 55,858,458 | |
| | | | | | | |
| | | | | | 183,532,059 | |
| | | | | | | |
| | |
Mutual Funds—10.4% | | | | | | | |
State Street Navigator Securities Lending Prime Portfolio (e) | | | 137,507,248 | | | 137,507,248 | |
| | | | | | | |
| | |
Repurchase Agreement—2.0% | | | | | | | |
State Street Repurchase Agreement dated 12/31/08 at 0.005% to be repurchased at $25,777,007 on 01/02/09, collateralized by $26,340,000 U.S. Treasury Bill due 07/30/09 with a value of $26,295,222. | | | 25,777,000 | | | 25,777,000 | |
| | | | | | | |
Total Short Term Investments
(Identified Cost $346,816,307) | | | | | | 346,816,307 | |
| | | | | | | |
Total Investments—139.2%
(Identified Cost $1,922,942,663) (f) | | | | | | 1,835,412,668 | |
Liabilities in excess of other assets | | | | | | (516,471,788 | ) |
| | | | | | | |
| Total Net Assets—100% | | | | | $ | 1,318,940,880 | |
| | | | | | | |
| (a) | Variable or Floating Rate Security. Rate disclosed is as of December 31, 2008. |
| (b) | Non-Income Producing; Defaulted Bond. |
| (c) | A portion or all of the security was on loan. As of December 31, 2008, the market value of securities loaned was $133,661,908 and the collateral received consisted of cash in the amount of $137,507,248. The cash collateral is invested in a money market fund managed by an affiliate of the custodian. |
| (d) | A portion or all of the security was pledged as collateral against open futures contracts. |
| (e) | Represents investment of cash collateral received from securities lending transactions. |
| (f) | The aggregate cost of investments for federal income tax purposes as of December 31, 2008 was $1,923,632,948 and the composition of unrealized appreciation and depreciation of investment securities was $38,435,061 and $(126,655,341), respectively. |
| (144A)— | Securities exempt from registration under Rule 144A of the Securities Act of 1933. These securities may be resold in transactions exempt from registration, normally to qualified institutional buyers. As of December 31, 2008, the market value of 144A securities was $58,562,898, which is 4.4% of total net assets. |
| (TBA)— | A contract for the purchase or sale of a Mortgage Backed Security to be delivered at a future date but does not include a specified pool or precise amount to be delivered. |
| (TII)— | A Treasury Inflation Index is a security with a fixed interest rate and the principal is adjusted for inflation. At maturity, the security will be redeemed at the greater of the inflation adjusted principal or par amount at original issue. |
Futures Contracts
| | | | | | | | | | | | | | | | | |
Futures Contracts—Long | | Expiration Date | | Number of
Contracts | | | Contract
Amount | | | Valuation as of
12/31/2008 | | | Unrealized
Appreciation/
Depreciation | |
90 Day Eurodollar Futures | | 3/16/2009 | | 796 | | | $ | 192,796,540 | | | $ | 196,890,600 | | | $ | 4,094,060 | |
90 Day Eurodollar Futures | | 9/14/2009 | | 842 | | | | 203,455,659 | | | | 207,858,225 | | | | 4,402,566 | |
90 Day Eurodollar Futures | | 6/14/2010 | | 177 | | | | 43,317,059 | | | | 43,480,050 | | | | 162,991 | |
90 Day Eurodollar Futures | | 12/13/2010 | | 106 | | | | 25,791,590 | | | | 25,938,200 | | | | 146,610 | |
90 Day Eurodollar Futures | | 3/14/2011 | | 200 | | | | 48,987,638 | | | | 48,880,000 | | | | (107,638 | ) |
U.S. Treasury Notes 10 Year Futures | | 3/20/2009 | | 1,625 | | | | 193,869,414 | | | | 204,343,750 | | | | 10,474,336 | |
| | | | | |
Futures Contracts—Short | | | | | | | | | | | | | | |
U.S. Treasury Notes 5 Year Futures | | 3/31/2009 | | (2,527 | ) | | | (291,196,981 | ) | | | (300,851,197 | ) | | | (9,654,216 | ) |
U.S. Treasury Notes 30 Year Futures | | 3/20/2009 | | (15 | ) | | | (1,968,167 | ) | | | (2,070,703 | ) | | | (102,536 | ) |
| | | | | | | | | | | | | | | | | |
Net Unrealized Appreciation | | | $ | 9,416,173 | |
| | | | | | | | | | | | | | | | | |
Options Written
| | | | | | | | | | | | | | | | | |
Options Written—Calls | | Expiration Date | | Number of
Contracts | | | Premiums
Received | | | Valuation as of
12/31/2008 | | | Unrealized
Depreciation | |
Eurodollar Futures 97.625 Call | | 9/14/2009 | | (842 | ) | | $ | (650,540 | ) | | $ | (2,478,638 | ) | | $ | (1,828,098 | ) |
U.S. Treasury Notes 10 Year Futures 120 Call | | 2/20/2009 | | (191 | ) | | | (261,766 | ) | | | (1,229,563 | ) | | | (967,797 | ) |
| | | | | | | | | | | | | | | | | |
Net Unrealized Depreciation | | | $ | (2,795,895 | ) |
| | | | | | | | | | | | | | | | | |
*See accompanying notes to financial statements.
MSF-9
Metropolitan Series Fund, Inc.
Western Asset Management U.S. Government Portfolio
The Portfolio adopted the provisions of Statement of Financial Accounting Standards No. 157, “Fair Value Measurements” (FAS 157), effective with the beginning of the Portfolio’s fiscal year. FAS 157 establishes a framework for measuring fair value and expands disclosures about fair value measurements in financial statements. The three levels of the hierarchy under FAS 157 are described below:
Level 1 - quoted prices in active markets for identical securities
Level 2 - other significant observable inputs (including quoted prices for similar securities, interest rates, credit risk, etc.)
Level 3 - significant unobservable inputs (including the Portfolio’s own assumptions in determining the fair value of investments)
The inputs or methodology used for valuing securities are not necessarily an indication of the risk associated with investing in those securities.
The following is a summary of the inputs used to value the Portfolio’s net assets as of December 31, 2008:
| | | | | | |
| Valuation Inputs | | Investments In
Securities | | Other Financial
Instruments* |
Level 1 - Quoted Prices | | $ | 333,185,936 | | $ | 6,620,278 |
Level 2 - Other Significant Observable Inputs | | | 1,502,226,732 | | | 0 |
Level 3 - Significant Unobservable Inputs | | | 0 | | | 0 |
Total | | $ | 1,835,412,668 | | $ | 6,620,278 |
* Other financial instruments are derivative instruments not reflected in the Schedule of Investments, such as futures, forwards, swap contracts and written options, which are valued based on the unrealized appreciation/depreciation on the instrument.
MSF-10
Metropolitan Series Fund, Inc.
Western Asset Management U.S. Government Portfolio
Statement of Assets & Liabilities
December 31, 2008
| | | | | | | |
Assets | | | | | | | |
Investments at value (a) (b) | | | | | $ | 1,835,412,668 | |
Cash | | | | | | 6,605,296 | |
Receivable for: | | | | | | | |
Securities sold | | | | | | 1,219 | |
Fund shares sold | | | | | | 942,830 | |
Accrued interest | | | | | | 6,001,101 | |
| | | | | | | |
Total Assets | | | | �� | | 1,848,963,114 | |
Liabilities | | | | | | | |
Payable for: | | | | | | | |
Securities purchased | | $ | 383,108,965 | | | | |
Fund shares redeemed | | | 3,750,933 | | | | |
Futures variation margin | | | 1,289,053 | | | | |
Collateral for securities loaned | | | 137,507,248 | | | | |
Options written, at fair value (c) | | | 3,708,201 | | | | |
Accrued expenses: | | | | | | | |
Management fees | | | 542,840 | | | | |
Service and distribution fees | | | 63,673 | | | | |
Deferred directors’ fees | | | 9,345 | | | | |
Other expenses | | | 41,976 | | | | |
| | | | | | | |
Total Liabilities | | | | | | 530,022,234 | |
| | | | | | | |
Net Assets | | | | | $ | 1,318,940,880 | |
| | | | | | | |
Net assets consists of: | | | | | | | |
Capital paid in | | | | | $ | 1,351,684,548 | |
Undistributed net investment income | | | | | | 60,499,766 | |
Accumulated net realized losses | | | | | | (12,333,717 | ) |
Unrealized depreciation on investments, futures contracts and options | | | | | | (80,909,717 | ) |
| | | | | | | |
Net Assets | | | | | $ | 1,318,940,880 | |
| | | | | | | |
| Computation of offering price: | | | | | | | |
Class A | | | | | | | |
Net asset value and redemption price per share ($989,317,420 divided by 82,982,479 shares outstanding) | | | | | $ | 11.92 | |
| | | | | | | |
Class B | | | | | | | |
Net asset value and redemption price per share ($258,917,857 divided by 21,818,313 shares outstanding) | | | | | $ | 11.87 | |
| | | | | | | |
Class E | | | | | | | |
Net asset value and redemption price per share ($70,705,603 divided by 5,952,926 shares outstanding) | | | | | $ | 11.88 | |
| | | | | | | |
(a) Identified cost of investments | | | | | $ | 1,922,942,663 | |
| | | | | | | |
(b) Includes cash collateral for securities loaned of | | | | | $ | 137,507,248 | |
| | | | | | | |
(c) Premiums received on written options | | | | | $ | 912,306 | |
| | | | | | | |
Statement of Operations
For the Year Ended December 31, 2008
| | | | | | | | |
Investment Income | | | | | | | | |
Dividends | | | | | | $ | 360,462 | |
Interest | | | | | | | 66,864,780 | (a) |
| | | | | | | | |
| | | | | | | 67,225,242 | |
Expenses | | | | | | | | |
Management fees | | $ | 7,017,761 | | | | | |
Service and distribution fees—Class B | | | 620,250 | | | | | |
Service and distribution fees—Class E | | | 125,779 | | | | | |
Directors’ fees and expenses | | | 31,874 | | | | | |
Custodian | | | 150,949 | | | | | |
Audit and tax services | | | 39,791 | | | | | |
Legal | | | 26,064 | | | | | |
Printing | | | 228,260 | | | | | |
Insurance | | | 16,848 | | | | | |
Miscellaneous | | | 45,021 | | | | | |
| | | | | | | | |
Total expenses | | | | | | | 8,302,597 | |
| | | | | | | | |
Net Investment Income | | | | | | | 58,922,645 | |
| | | | | | | | |
Realized and Unrealized Gain (Loss) | | | | | | | | |
| Realized gain (loss) on: | | | | | | | | |
Investments—net | | | 22,381,523 | | | | | |
Futures contracts—net | | | (22,503,236 | ) | | | | |
Options—net | | | 5,582,455 | | | | 5,460,742 | |
| | | | | | | | |
| Change in unrealized appreciation (depreciation) on: | | | | | | | | |
Investments—net | | | (81,512,636 | ) | | | | |
Futures contracts—net | | | 9,070,591 | | | | | |
Options—net | | | (3,472,987 | ) | | | (75,915,032 | ) |
| | | | | | | | |
Net loss | | | | | | | (70,454,290 | ) |
| | | | | | | | |
Net Decrease in Net Assets From Operations | | | | | | $ | (11,531,645 | ) |
| | | | | | | | |
| (a) | Includes income on securities loaned of $2,259,065. |
See accompanying notes to financial statements.
MSF-11
Metropolitan Series Fund, Inc.
Western Asset Management U.S. Government Portfolio
Statements of Changes in Net Assets
| | | | | | | | |
| | | Year ended
December 31,
2008 | | | Year ended
December 31,
2007 | |
From Operations | | | | | | | | |
Net investment income | | $ | 58,922,645 | | | $ | 58,123,290 | |
Net realized gain (loss) | | | 5,460,742 | | | | (5,263,684 | ) |
Change in unrealized appreciation (depreciation) | | | (75,915,032 | ) | | | 777,370 | |
| | | | | | | | |
Increase (decrease) in net assets from operations | | | (11,531,645 | ) | | | 53,636,976 | |
| | | | | | | | |
From Distributions to Shareholders | | | | | | | | |
Net investment income | | | | | | | | |
Class A | | | (45,803,273 | ) | | | (25,701,258 | ) |
Class B | | | (9,570,316 | ) | | | (5,038,642 | ) |
Class E | | | (3,580,246 | ) | | | (2,574,347 | ) |
| | | | | | | | |
Total distributions | | | (58,953,835 | ) | | | (33,314,247 | ) |
| | | | | | | | |
Increase in net assets from capital share transactions | | | 39,042,622 | | | | 158,560,156 | |
| | | | | | | | |
Net increase (decrease) in net assets | | | (31,442,858 | ) | | | 178,882,885 | |
| | |
Net Assets | | | | | | | | |
Beginning of the period | | | 1,350,383,738 | | | | 1,171,500,853 | |
| | | | | | | | |
End of the period | | $ | 1,318,940,880 | | | $ | 1,350,383,738 | |
| | | | | | | | |
Undistributed Net Investment Income | | | | | | | | |
End of the period | | $ | 60,499,766 | | | $ | 58,910,311 | |
| | | | | | | | |
Other Information:
Capital Shares
Transactions in capital shares were as follows:
| | | | | | | | | | | | | | |
| | | Year ended
December 31, 2008 | | | Year ended
December 31, 2007 | |
| | | Shares | | | $ | | | Shares | | | $ | |
Class A | | | | | | | | | | | | | | |
Sales | | 32,176,748 | | | $ | 390,719,708 | | | 25,944,586 | | | $ | 318,487,141 | |
Reinvestments | | 3,813,761 | | | | 45,803,273 | | | 2,110,120 | | | | 25,701,258 | |
Redemptions | | (35,673,810 | ) | | | (424,028,463 | ) | | (17,495,862 | ) | | | (214,420,714 | ) |
| | | | | | | | | | | | | | |
Net increase | | 316,699 | | | $ | 12,494,518 | | | 10,558,844 | | | $ | 129,767,685 | |
| | | | | | | | | | | | | | |
Class B | | | | | | | | | | | | | | |
Sales | | 10,004,147 | | | $ | 120,227,070 | | | 7,713,101 | | | $ | 94,310,450 | |
Reinvestments | | 799,525 | | | | 9,570,316 | | | 414,703 | | | | 5,038,642 | |
Redemptions | | (7,223,550 | ) | | | (86,313,042 | ) | | (4,789,601 | ) | | | (58,633,913 | ) |
| | | | | | | | | | | | | | |
Net increase | | 3,580,122 | | | $ | 43,484,344 | | | 3,338,203 | | | $ | 40,715,179 | |
| | | | | | | | | | | | | | |
Class E | | | | | | | | | | | | | | |
Sales | | 541,261 | | | $ | 6,580,861 | | | 1,092,215 | | | $ | 13,418,398 | |
Reinvestments | | 298,852 | | | | 3,580,246 | | | 211,880 | | | | 2,574,347 | |
Redemptions | | (2,253,679 | ) | | | (27,097,347 | ) | | (2,277,527 | ) | | | (27,915,453 | ) |
| | | | | | | | | | | | | | |
Net decrease | | (1,413,566 | ) | | $ | (16,936,240 | ) | | (973,432 | ) | | $ | (11,922,708 | ) |
| | | | | | | | | | | | | | |
Increase derived from capital share transactions | | | | | $ | 39,042,622 | | | | | | $ | 158,560,156 | |
| | | | | | | | | | | | | | |
See accompanying notes to financial statements.
MSF-12
Metropolitan Series Fund, Inc.
Western Asset Management U.S. Government Portfolio
Financial Highlights
| | | | | | | | | | | | | | | | | | | | |
| | | Class A | |
| | | Year ended December 31, | |
| | | 2008 | | | 2007 | | | 2006 | | | 2005 | | | 2004 | |
Net Asset Value, Beginning of Period | | $ | 12.48 | | | $ | 12.30 | | | $ | 12.22 | | | $ | 12.43 | | | $ | 12.34 | |
| | | | | | | | | | | | | | | | | | | | |
Income From Investment Operations | | | | | | | | | | | | | | | | | | | | |
Net investment income | | | 0.50 | (a) | | | 0.57 | (a) | | | 0.46 | | | | 0.19 | | | | 0.20 | |
Net realized and unrealized gain (loss) of investments | | | (0.53 | ) | | | (0.05 | ) | | | 0.03 | | | | 0.01 | | | | 0.18 | |
| | | | | | | | | | | | | | | | | | | | |
Total from investment operations | | | (0.03 | ) | | | 0.52 | | | | 0.49 | | | | 0.20 | | | | 0.38 | |
| | | | | | | | | | | | | | | | | | | | |
Less Distributions | | | | | | | | | | | | | | | | | | | | |
Distributions from net investment income | | | (0.53 | ) | | | (0.34 | ) | | | (0.41 | ) | | | (0.17 | ) | | | (0.16 | ) |
Distributions from net realized capital gains | | | 0.00 | | | | 0.00 | | | | 0.00 | | | | (0.24 | ) | | | (0.13 | ) |
| | | | | | | | | | | | | | | | | | | | |
Total distributions | | | (0.53 | ) | | | (0.34 | ) | | | (0.41 | ) | | | (0.41 | ) | | | (0.29 | ) |
| | | | | | | | | | | | | | | | | | | | |
Net Asset Value, End of Period | | $ | 11.92 | | | $ | 12.48 | | | $ | 12.30 | | | $ | 12.22 | | | $ | 12.43 | |
| | | | | | | | | | | | | | | | | | | | |
Total Return (%) | | | (0.4 | ) | | | 4.4 | | | | 4.2 | | | | 1.7 | | | | 3.0 | |
Ratio of operating expenses to average net assets (%) | | | 0.52 | | | | 0.54 | | | | 0.58 | | | | 0.61 | | | | 0.64 | |
Ratio of operating expenses to average net assets without giving effect to the contractual expense agreement would have been (%) (b) | | | N/A | | | | N/A | | | | N/A | | | | N/A | | | | 0.64 | |
Ratio of net investment income to average net assets (%) | | | 4.12 | | | | 4.66 | | | | 4.36 | | | | 3.00 | | | | 1.56 | |
Portfolio turnover rate (%) | | | 436 | | | | 685 | | | | 835 | | | | 964 | | | | 977 | |
Net assets, end of period (000) | | $ | 989,317 | | | $ | 1,032,047 | | | $ | 886,805 | | | $ | 471,703 | | | $ | 148,047 | |
| | | | | | | | | | | | | | | | | | | | |
| | | Class B | |
| | | Year ended December 31, | |
| | | 2008 | | | 2007 | | | 2006 | | | 2005 | | | 2004 | |
Net Asset Value, Beginning of Period | | $ | 12.43 | | | $ | 12.25 | | | $ | 12.16 | | | $ | 12.38 | | | $ | 12.31 | |
| | | | | | | | | | | | | | | | | | | | |
Income From Investment Operations | | | | | | | | | | | | | | | | | | | | |
Net investment income | | | 0.46 | (a) | | | 0.54 | (a) | | | 0.44 | | | | 0.25 | | | | 0.16 | |
Net realized and unrealized gain (loss) of investments | | | (0.52 | ) | | | (0.05 | ) | | | 0.02 | | | | (0.08 | ) | | | 0.17 | |
| | | | | | | | | | | | | | | | | | | | |
Total from investment operations | | | (0.06 | ) | | | 0.49 | | | | 0.46 | | | | 0.17 | | | | 0.33 | |
| | | | | | | | | | | | | | | | | | | | |
Less Distributions | | | | | | | | | | | | | | | | | | | | |
Distributions from net investment income | | | (0.50 | ) | | | (0.31 | ) | | | (0.37 | ) | | | (0.15 | ) | | | (0.13 | ) |
Distributions from net realized capital gains | | | 0.00 | | | | 0.00 | | | | 0.00 | | | | (0.24 | ) | | | (0.13 | ) |
| | | | | | | | | | | | | | | | | | | | |
Total distributions | | | (0.50 | ) | | | (0.31 | ) | | | (0.37 | ) | | | (0.39 | ) | | | (0.26 | ) |
| | | | | | | | | | | | | | | | | | | | |
Net Asset Value, End of Period | | $ | 11.87 | | | $ | 12.43 | | | $ | 12.25 | | | $ | 12.16 | | | $ | 12.38 | |
| | | | | | | | | | | | | | | | | | | | |
Total Return (%) | | | (0.5 | ) | | | 4.0 | | | | 3.9 | | | | 1.4 | | | | 2.7 | |
Ratio of operating expenses to average net assets (%) | | | 0.77 | | | | 0.79 | | | | 0.83 | | | | 0.86 | | | | 0.89 | |
Ratio of operating expenses to average net assets without giving effect to the contractual expense agreement would have been (%) (b) | | | N/A | | | | N/A | | | | N/A | | | | N/A | | | | 0.89 | |
Ratio of net investment income to average net assets (%) | | | 3.87 | | | | 4.41 | | | | 4.08 | | | | 2.76 | | | | 1.81 | |
Portfolio turnover rate (%) | | | 436 | | | | 685 | | | | 835 | | | | 964 | | | | 977 | |
Net assets, end of period (000) | | $ | 258,918 | | | $ | 226,693 | | | $ | 182,472 | | | $ | 117,258 | | | $ | 35,073 | |
| Please | see following page for Financial Highlights footnote legend. |
See accompanying notes to financial statements.
MSF-13
Metropolitan Series Fund, Inc.
Western Asset Management U.S. Government Portfolio
Financial Highlights
| | | | | | | | | | | | | | | | | | | | |
| | | Class E | |
| | | Year ended December 31, | |
| | | 2008 | | | 2007 | | | 2006 | | | 2005 | | | 2004 | |
Net Asset Value, Beginning of Period | | $ | 12.44 | | | $ | 12.26 | | | $ | 12.18 | | | $ | 12.38 | | | $ | 12.31 | |
| | | | | | | | | | | | | | | | | | | | |
Income From Investment Operations | | | | | | | | | | | | | | | | | | | | |
Net investment income | | | 0.48 | (a) | | | 0.55 | (a) | | | 0.54 | | | | 0.34 | | | | 0.17 | |
Net realized and unrealized gain (loss) of investments | | | (0.53 | ) | | | (0.05 | ) | | | (0.07 | ) | | | (0.15 | ) | | | 0.17 | |
| | | | | | | | | | | | | | | | | | | | |
Total from investment operations | | | (0.05 | ) | | | 0.50 | | | | 0.47 | | | | 0.19 | | | | 0.34 | |
| | | | | | | | | | | | | | | | | | | | |
Less distributions | | | | | | | | | | | | | | | | | | | | |
Distributions from net investment income | | | (0.51 | ) | | | (0.32 | ) | | | (0.39 | ) | | | (0.15 | ) | | | (0.14 | ) |
Distributions from net realized capital gains | | | 0.00 | | | | 0.00 | | | | 0.00 | | | | (0.24 | ) | | | (0.13 | ) |
| | | | | | | | | | | | | | | | | | | | |
Total distributions | | | (0.51 | ) | | | (0.32 | ) | | | (0.39 | ) | | | (0.39 | ) | | | (0.27 | ) |
| | | | | | | | | | | | | | | | | | | | |
Net Asset Value, End of Period | | $ | 11.88 | | | $ | 12.44 | | | $ | 12.26 | | | $ | 12.18 | | | $ | 12.38 | |
| | | | | | | | | | | | | | | | | | | | |
Total Return (%) | | | (0.4 | ) | | | 4.1 | | | | 4.0 | | | | 1.6 | | | | 2.8 | |
Ratio of operating expenses to average net assets (%) | | | 0.67 | | | | 0.69 | | | | 0.73 | | | | 0.76 | | | | 0.79 | |
Ratio of operating expenses to average net assets without giving effect to the contractual expense agreement would have been (%) (b) | | | N/A | | | | N/A | | | | N/A | | | | N/A | | | | 0.79 | |
Ratio of net investment income to average net assets (%) | | | 3.98 | | | | 4.51 | | | | 4.13 | | | | 2.74 | | | | 1.42 | |
Portfolio turnover rate (%) | | | 436 | | | | 685 | | | | 835 | | | | 964 | | | | 977 | |
Net assets, end of period (000) | | $ | 70,706 | | | $ | 91,643 | | | $ | 102,223 | | | $ | 117,409 | | | $ | 123,455 | |
| (a) | Per share amount is based on average shares outstanding during the period. |
| (b) | The Portfolio had previously entered into a contractual agreement to limit Portfolio expenses. This agreement expired in 2004. |
See accompanying notes to financial statements.
MSF-14
Metropolitan Series Fund, Inc.
Western Asset Management U.S. Government Portfolio
Notes to Financial Statements—December 31, 2008
Metropolitan Series Fund, Inc. (the “Fund”) is organized as a corporation under the laws of Maryland pursuant to Articles of Incorporation filed on November 23, 1982, as amended, and registered under the Investment Company Act of 1940, as amended (the “1940 Act”), as an open-end investment company. The Fund is a “series” type of mutual fund, which issues separate series of stock. Each series represents an interest in a separate portfolio of Fund investments. The Western Asset Management U.S. Government Portfolio (the “Portfolio”) is a diversified series of the Fund. Shares in the Fund are not offered directly to the general public and are currently available only to separate accounts established by Metropolitan Life Insurance Company (“MetLife”), New England Life Insurance Company, General American Life Insurance Company (“General American”), The MetLife Investors Group of Insurance Companies, MetLife Insurance Company of Connecticut and other affiliated insurance companies (collectively, the “Insurance Companies”) and to certain eligible qualified retirement plans (“Qualified Plans”), as an investment vehicle for variable life insurance, group annuity or variable annuity products of these insurance companies or Qualified Plans, although the Portfolio is not available to all such separate accounts and Qualified Plans. The Portfolio’s shares may be divided into different classes. Currently, the classes being offered by the Portfolio are named Class A, Class B and Class E. The classes of the Portfolio’s shares are identical, except that certain additional charges (Rule 12b-1 fees) are made against Class B and Class E shares. Investment income, realized and unrealized capital gains and losses, the common expenses of the Portfolio and certain Portfolio-level expense reductions, if any, are allocated daily, on a pro rata basis, to each class based on the relative net assets of each class to the total net assets of the Portfolio.
| 2. | SIGNIFICANT ACCOUNTING POLICIES: |
The preparation of financial statements in conformity with accounting principles generally accepted in the United States of America (“GAAP”) requires management to make estimates and assumptions that affect the reported amounts of assets and liabilities and disclosure of contingent assets and liabilities as of the date of the financial statements and the reported amounts of income and expenses during the reporting period. Actual results could differ from those estimates.
The following is a summary of significant accounting policies consistently followed by the Portfolio in the preparation of its financial statements. The policies are in conformity with GAAP.
Investment Valuation:
Debt securities (other than short term obligations with a remaining maturity of sixty days or less) are generally valued on the basis of evaluated or composite bid quotations obtained by independent pricing services and/or brokers and dealers selected by the relevant subadviser pursuant to authorization of the Board of Directors of the Fund (the “Board” or “Directors”). Such quotations take into account appropriate factors such as institutional-sized trading in similar groups of securities, yield, quality, coupon rate, maturity, type of issue, trading characteristics and other data. Short term obligations with a remaining maturity of sixty days or less are valued at amortized cost which approximates fair market value.
Equity securities traded on a national securities exchange or other exchanges are valued at their last sale price on the principal trading market. Equity securities traded on the NASDAQ National Market System are valued at the NASDAQ Official Closing Price (the “NOCP”). The NOCP is the last reported sale price if the last reported sale price falls between the spread of the last reported bid and asked prices. If the last reported bid and asked prices are above the last reported sale price, the NOCP will be the last reported bid price. If the last reported bid and asked prices are below the last reported sale price, the NOCP will be the last reported asked price. Equity securities traded on a national securities exchange or other exchanges or on the NASDAQ National Market System for which there is no reported sale during the day are valued at the last reported bid price. A security that is listed or traded on more than one exchange is valued at the quotation on the exchange determined to be the primary market for that security by the Board or its delegates. If no closing price is available, then such securities are valued by using the last reported bid price. Equity securities traded over-the-counter are valued at the last reported sales price.
If no current market value quotation is readily available or reliable for a portfolio security, fair value will be determined in accordance with procedures established by and under the general supervision of the Board. When the Portfolio uses fair value pricing, it may take into account any factors it deems appropriate. The value of securities used by the Portfolio to calculate its net asset value may differ from quoted or published prices for the same securities. Fair value pricing involves subjective judgments and the fair value determined for a security may be materially different than the value that could be realized upon the sale of that security.
MSF-15
Metropolitan Series Fund, Inc.
Western Asset Management U.S. Government Portfolio
Notes to Financial Statements—December 31, 2008—(Continued)
The Portfolio expects to use fair value pricing for securities primarily traded on U.S. exchanges only under very limited circumstances. For example, the Portfolio may use fair value pricing if the exchange on which a security is traded closes early or trading in the security is suspended.
Securities traded primarily on an exchange outside of the United States which closes before the close of the New York Stock Exchange will be valued at the last sales price on that non-U.S. exchange. Securities traded primarily on an exchange outside of the United States for which there is no reported sale during the day are valued at the mean between the last reported bid and asked prices. However, because most foreign markets close well before the Portfolio values its securities (typically at 4 p.m. Eastern Time), the earlier close of these foreign markets gives rise to the possibility that significant events, including broad market moves, may have occurred after these foreign markets close but before the Portfolio values its securities. To account for this, the Portfolio may frequently value many of its foreign equity securities using fair value prices based on third party vendor modeling tools.
Forward foreign currency exchange contracts are valued based on the mean between closing bid and asked prices of the forward currency contract rates in the London foreign exchange markets on a daily basis as provided by a reliable bank or dealer.
Options, whether on securities, indices, futures contracts, or otherwise, are valued at the last sales price available as of the close of business on the day of valuation or, if there is no such sale price available, at the mean between the bid and asked prices. Options on currencies are valued at the spot price each day.
The value of futures contracts will be the sum of the margin deposit plus or minus the difference between the value of the futures contract on each day the net asset value is calculated and the value on the date the futures contract originated, value being that established on a recognized commodity exchange, or by reference to other customary sources, with gain or loss being realized when the futures contract closes or expires.
Subject to the Board’s oversight, the Board has delegated the day-to-day oversight of pricing matters, including determinations in good faith under the Fund’s procedures the fair value of securities for which current market quotations are not readily available to the subadviser of the Portfolio.
Investment Transactions and Related Investment Income:
Portfolio security transactions are recorded on the trade date. Dividend income is recorded on the ex-dividend date or, for certain foreign securities, when notified. Interest income, which includes amortization of premium and accretion of discount on debt securities, is recorded on the accrual basis. Realized gains and losses on investments and unrealized appreciation and depreciation are determined on the identified cost basis, which is the same basis used for federal income tax purposes.
Repurchase Agreements:
The Portfolio, through the custodian or a subcustodian, receives delivery of the underlying securities collateralizing repurchase agreements. The Portfolio requires the custodian to take possession, to have legally segregated in the Federal Reserve Book Entry System, or to have segregated within the custodian’s vault, all securities held as collateral for repurchase agreements. It is the Portfolio’s policy that the market value of the collateral be at least equal to 100% of the repurchase price in the case of a repurchase agreement of one-day duration and 102% on all other repurchase agreements. The Portfolio’s subadviser is responsible for determining that the value of the collateral is at all times at least equal to the repurchase price. In connection with transactions in repurchase agreements, if the seller defaults and the value of the collateral declines or if the seller enters an insolvency proceeding, realization of the collateral by the Portfolio may be delayed, limited or wholly denied.
Futures Contracts:
The Portfolio may buy and sell futures contracts (on recognized exchanges) as a hedge, to maintain exposure to the broad markets or to enhance return. Futures contracts are agreements to buy or sell a security, or deliver a final cash settlement price in connection with an index, interest rate, currency, or other contracts not calling for physical delivery, for a set price in the future. The Portfolio must post an amount equal to a portion of the total market value of the futures contract as futures variation margin, which is returned when the Portfolio’s obligations under the contract have been satisfied. From time to time thereafter, the Portfolio may have to post variation margin to maintain this amount as the market value of the contract fluctuates. Risks of entering into futures contracts (and related options) include the possibility that there may be an illiquid market and that a change in the value of the contract or option may not correlate with changes in the value of the underlying securities.
MSF-16
Metropolitan Series Fund, Inc.
Western Asset Management U.S. Government Portfolio
Notes to Financial Statements—December 31, 2008—(Continued)
Options:
The Portfolio may use options to hedge against changes in values of securities the Portfolio owns or expects to purchase, to maintain exposure to the broad markets or to enhance return. Writing puts or buying calls tends to increase the Portfolio’s exposure to the underlying instrument and writing calls or buying puts tends to decrease the Portfolio’s exposure to the underlying instrument, and can be used to hedge other Portfolio investments. For options purchased to hedge the Portfolio’s investments, the potential risk to the Portfolio is that the change in value of options contracts may not correspond to the change in value of the hedged instruments. In addition, losses may arise from changes in the value of the underlying instruments, if there is an illiquid secondary market, or if the counterparty is unable to perform. The maximum loss for purchased options is limited to the premium initially paid for the option. For options written by the Portfolio, the maximum loss is not limited to the premium initially received for the option.
The main risk associated with purchasing an option is that the option expires without being exercised. In this case, the option expires worthless and the premium paid for the option is considered the loss. The risk associated with writing a call option is that the Portfolio may forgo the opportunity for a profit if the market value of the underlying position increases and the option is exercised. The risk in writing a put option is that the Portfolio may incur a loss if the market value of the underlying position decreases and the option is exercised. In addition, the Portfolio risks not being able to enter into a closing transaction for the written option as the result of an illiquid market.
Mortgage Dollar Rolls:
The Portfolio may enter into mortgage “dollar rolls” in which a Portfolio sells mortgage-backed securities for delivery in the current month and simultaneously contracts to repurchase substantially similar (same type, coupon and maturity) securities on a specified future date. Dollar rolls are accounted for as purchase and sale transactions; gain/loss is recognized at the end of the term of the dollar roll. The average monthly balance of dollar rolls outstanding during the year ended December 31, 2008 was $490,719,022 for the Portfolio.
A Portfolio that enters into mortgage dollar rolls is subject to the risk that the market value of the securities the Portfolio is obligated to repurchase under the agreement may decline below the repurchase price. In the event the buyer of securities under a mortgage dollar roll files for bankruptcy or becomes insolvent, the Portfolio’s use of proceeds from the dollar roll may be restricted pending a court determination, a determination by the other party, or its trustee or receiver, whether to enforce the Portfolio’s obligation to repurchase the securities.
“When-Issued” Securities:
Purchasing securities “when-issued” is a forward commitment by the Portfolio to buy a security. The estimated amount of the Portfolio’s payment obligation and the security’s interest rate are determined when the commitment is made, even though no interest accrues until the security is issued, which is generally 15 to 120 days later. The Portfolio will segregate liquid assets with its custodian sufficient at all times to satisfy these commitments. If the value of the security is less when delivered than when the commitment was made, the Portfolio will suffer a loss.
Mortgage-Backed Securities:
The Portfolio invests a significant portion of its assets in securities of issuers that hold mortgage and asset backed securities and direct investments in securities backed by commercial and residential mortgage loans and other financial assets. The value and related income of these securities are sensitive to changes in economic conditions, including delinquencies and/or defaults. Continuing shifts in the market’s perception of credit quality on securities backed by commercial and residential mortgage loans and other financial assets may result in increased volatility of market price and periods of illiquidity that can negatively impact the valuation of certain issuers held by the Portfolio. At December 31, 2008, the Portfolio held securities of issuers that hold mortgage and asset backed securities and direct investments in mortgage and asset backed securities (excluding federal agencies) with an aggregate value of $232,555,097 (representing 17.6% of the Portfolio’s total net assets).
Federal Income Taxes:
It is the Portfolio’s policy to comply with the requirements of the Internal Revenue Code of 1986, as amended (the “Code”), and regulations thereunder, applicable to regulated investment companies and to distribute, with respect to each taxable year, all of
MSF-17
Metropolitan Series Fund, Inc.
Western Asset Management U.S. Government Portfolio
Notes to Financial Statements—December 31, 2008—(Continued)
its taxable income to shareholders. Therefore, no federal income tax provision is required. The Portfolio is subject to the provisions of the Financial Accounting Standards Board Interpretation (“FASB”) No. 48, Accounting for Uncertainties in Income Taxes (FIN 48). FIN 48 sets forth a minimum threshold for financial statement recognition of the benefit of a tax position taken or expected to be taken in a tax return. The implementation of FIN 48 did not result in any unrecognized tax benefits in the accompanying financial statements. Each of the Portfolio’s federal tax returns for the prior three fiscal years remains subject to examination by the Internal Revenue Service.
As of December 31, 2008, the Portfolio had capital loss carryforwards as follows:
| | | |
Expiring
12/31/15 | | Total |
| $507,028 | | $ | 507,028 |
Pursuant to Section 852 of the Code, the Portfolio designated the amount shown below under Long Term Gain as capital gain dividends for its taxable year ended December 31, 2008. The tax character of distributions paid for the periods ended December 31, 2008 and 2007 was as follows:
| | | | | | | | | | | | | | | | | | | | | | |
| Ordinary Income | | Long Term Gain | | Return of Capital | | Total |
| 2008 | | 2007 | | 2008 | | 2007 | | 2008 | | 2007 | | 2008 | | 2007 |
| $ | 58,953,835 | | $ | 33,314,247 | | $ | — | | $ | — | | $ | — | | $ | — | | $ | 58,953,835 | | $ | 33,314,247 |
As of December 31, 2008, the components of distributable earnings (accumulated losses) on a federal income tax basis were as follows:
| | | | | | | | | | | | | | | | |
Undistributed
Ordinary
Income | | Undistributed
Long Term
Gain | | Unrealized
Depreciation | | | Loss
Carryforwards | | | Total | |
| $ | 61,154,844 | | $ | — | | $ | (87,998,577 | ) | | $ | (507,028 | ) | | $ | (27,350,761 | ) |
Pursuant to Federal income tax regulations applicable to investment companies, the Portfolio has elected to treat net capital losses realized between November 1 and December 31 of each year as occurring on the first day of the following tax year. For the year ended December 31, 2008, the following amounts of realized capital and currency losses reflected in the accompanying financial statements will not be recognized for Federal income tax purposes until January 1, 2009:
| | | | |
Currency | | Capital | |
$— | | $ | (4,737,825 | ) |
Dividends and Distributions to Shareholders:
The Portfolio records dividends and distributions on the ex-dividend date. Net realized gains from security transactions (if any) are generally distributed annually to shareholders. The timing and characterization of certain income and capital gains distributions are determined in accordance with federal tax regulations that may differ from GAAP. Permanent book and tax basis differences relating to shareholder distributions will result in reclassification between under/over distributed net investment income, accumulated net realized gains/losses and paid in capital.
| 3. | INVESTMENT TRANSACTIONS: |
For the year ended December 31, 2008, purchases and sales of securities (excluding short term investments) for the Portfolio were as follows:
| | | | | | | | | | |
| Purchases | | Sales |
| U.S. Government | | Other | | U.S. Government | | Other |
| $ | 6,827,938,765 | | $ | 193,435,340 | | $ | 6,897,019,347 | | $ | 30,901,992 |
MSF-18
Metropolitan Series Fund, Inc.
Western Asset Management U.S. Government Portfolio
Notes to Financial Statements—December 31, 2008—(Continued)
Options Written:
The Portfolio transactions in options written during the year ended December 31, 2008 were as follows:
| | | | | | | |
Call Options | | Number of
contracts | | | Premiums
received | |
Options outstanding December 31, 2007 | | 758 | | | $ | 542,085 | |
Options written | | 3,311 | | | | 2,951,227 | |
Options closed | | (1,546 | ) | | | (1,367,384 | ) |
Options expired | | (1,490 | ) | | | (1,213,622 | ) |
| | | | | | | |
Options outstanding December 31, 2008 | | 1,033 | | | $ | 912,306 | |
| | | | | | | |
| | | | | | | |
Put Options | | Number of
contracts | | | Premiums
received | |
Options outstanding December 31, 2007 | | 758 | | | $ | 375,210 | |
Options written | | 1,644 | | | | 1,220,891 | |
Options closed | | (189 | ) | | | (229,493 | ) |
Options expired | | (2,213 | ) | | | (1,366,608 | ) |
| | | | | | | |
Options outstanding December 31, 2008 | | 0 | | | $ | 0 | |
| | | | | | | |
| 4. | INVESTMENT MANAGEMENT FEES AND OTHER TRANSACTIONS WITH AFFILIATES: |
Investment Management Agreement:
MetLife Advisers, LLC (“MetLife Advisers”) is the investment adviser to the Portfolio. The Fund has entered into an investment management agreement with MetLife Advisers with respect to the Portfolio. For providing investment management services to the Portfolio, MetLife Advisers receives monthly compensation at the following annual rates:
| | | | |
Management
Fees earned by
MetLife Advisers
for the year ended
December 31, 2008 | | Annual
percentage
rates paid to
MetLife Advisers | | Based on Portfolios
average daily net asset
levels |
| $7,017,761 | | 0.550% | | Of the first $500 million |
| | 0.450% | | On amounts in excess of $500 million |
Certain officers and directors of the Fund may also be officers of MetLife Advisers; however, such officers and directors receive no compensation from the Fund.
MetLife Advisers has entered into an investment subadvisory agreement with respect to the Portfolio. Western Asset Management Co. is compensated by MetLife Advisers to provide subadvisory services for the Portfolio.
Service and Distribution Fees:
The Fund has adopted a Distribution and Service Plan under Rule 12b-1 of the 1940 Act for the Portfolio’s Class B and E shares. Under the Distribution and Service Plan, the Class B and E shares of the Portfolio pay a fee to compensate the Insurance Companies (or their affiliates) and other broker-dealers and financial intermediaries involved in the offer and sale of Portfolio shares for promoting or selling and servicing the Class B and E shares. The fees under the Distribution and Service Plan for each class of the Portfolio’s shares are calculated as a percentage of the Portfolio’s average daily net assets that are attributable to that Class. Currently, the fee is 0.25% per year for Class B shares and 0.15% per year for Class E shares. Amounts paid by the Portfolio for the year ended December 31, 2008 are shown as Service and Distribution fees in the Statement of Operations.
The Fund has entered into a securities lending arrangement with the Fund’s custodian, State Street Bank and Trust Company (the “custodian”). Under the agreement, the custodian is authorized to loan securities on the Portfolios’ behalf. In exchange, the Portfolio receives either cash or securities as collateral against the loaned securities. The Portfolio receives collateral at least equal to 102% of the market value of the loaned securities (105% for foreign securities), at each loan’s inception. Collateral must be maintained at least at 100% of the market value of the loaned securities for the duration of the loan. The cash collateral is
MSF-19
Metropolitan Series Fund, Inc.
Western Asset Management U.S. Government Portfolio
Notes to Financial Statements—December 31, 2008—(Continued)
invested in the Navigator Securities Lending Prime Portfolio, an affiliate of the custodian, which invests in a variety of high quality U.S. dollar-denominated instruments. If the market value of the collateral at the close of trading on a business day is less than 100% of the market value of the loaned securities at the close of trading on that day, the borrower shall be required to deliver, by the close of business on the following business day, an additional amount of collateral, equal to at least 100% of the market value of all the loaned securities as of such preceding day. The Portfolio receives 80% of the annual net income from securities lending transactions, which is included in interest income of the Portfolio. The remaining 20% is paid to the custodian as compensation for its securities lending services. Interest income received by the Portfolio via lending transactions during the year ended December 31, 2008 is footnoted in the Statement of Operations. The Portfolio bears the risk of any deficiency in the amount of collateral available for return to a borrower due to a loss in an approved investment purchased with such collateral. Any outstanding loans by the Portfolio at December 31, 2008 are footnoted in the Schedule of Investments.
| 6. | MARKET AND CREDIT RISK: |
In the normal course of business, the Portfolio invests in securities and enters into transactions where risks exist due to fluctuations in the market (market risk) or failure of the other party to a transaction to perform (credit risk). The value of securities held by the Portfolio may decline in response to certain events, including those directly involving the companies whose securities are owned by the Portfolio; conditions affecting the general economy; overall market changes; local, regional or global political, social or economic instability; and currency and interest rate and price fluctuations. Similar to credit risk, the Portfolio may be exposed to counterparty risk, or the risk that an entity with which the Portfolio has unsettled or open transactions may default. Financial assets, which potentially expose the Portfolio to credit and counterparty risks, consist principally of investments and cash due from counterparties. The extent of the Portfolio’s exposure to credit and counterparty risks in respect to these financial assets approximates their value as recorded in the Portfolio’s Statements of Assets and Liabilities.
| 7. | RECENT ACCOUNTING PRONOUNCEMENTS: |
In March 2008, the FASB issued Statement of Financial Accounting Standards No. 161, Disclosures about Derivative Instruments and Hedging Activities (“FAS 161”), an amendment of FASB Statement No. 133. FAS 161 requires enhanced disclosures about (a) how and why an entity uses derivative instruments, (b) how derivative instruments and hedging activities are accounted for, and (c) how derivative instruments and related hedging activities affect a fund’s financial position, financial performance, and cash flows. Management does not believe the adoption of FAS 161 will materially impact the financial statement amounts, but will require additional disclosures. This will include qualitative and quantitative disclosures on derivative positions existing at period end and the effect of using derivatives during the reporting period. FAS 161 is effective for financial statements issued for fiscal years and interim periods beginning after November 15, 2008. Management is currently evaluating the impact the adoption of FAS 161 will have on the Portfolio’s financial statement disclosures.
MSF-20
Metropolitan Series Fund, Inc.
Western Asset Management U.S. Government Portfolio
Report of Independent Registered Public Accounting Firm
To the Shareholders and Board of Directors of Metropolitan Series Fund, Inc.:
We have audited the accompanying statement of assets and liabilities, including the schedule of investments, of the Western Asset Management U.S. Government Portfolio (one of the portfolios constituting the Metropolitan Series Fund, Inc.) (the “Fund”) as of December 31, 2008, and the related statement of operations for the year then ended, the statements of changes in net assets for each of the two years in the period then ended, and the financial highlights for each of the five years in the period then ended. These financial statements and financial highlights are the responsibility of the Fund’s management. Our responsibility is to express an opinion on these financial statements and financial highlights based on our audits.
We conducted our audits in accordance with the standards of the Public Company Accounting Oversight Board (United States). Those standards require that we plan and perform the audit to obtain reasonable assurance about whether the financial statements and financial highlights are free of material misstatement. The Fund is not required to have, nor were we engaged to perform, an audit of its internal control over financial reporting. Our audits included consideration of internal control over financial reporting as a basis for designing audit procedures that are appropriate in the circumstances, but not for the purpose of expressing an opinion on the effectiveness of the Fund’s internal control over financial reporting. Accordingly, we express no such opinion. An audit also includes examining, on a test basis, evidence supporting the amounts and disclosures in the financial statements, assessing the accounting principles used and significant estimates made by management, as well as evaluating the overall financial statement presentation. Our procedures included confirmation of securities owned as of December 31, 2008, by correspondence with the custodian and brokers; where replies were not received from brokers, we performed other auditing procedures. We believe that our audits provide a reasonable basis for our opinion.
In our opinion, the financial statements and financial highlights referred to above present fairly, in all material respects, the financial position of the Western Asset Management U.S. Government Portfolio of the Metropolitan Series Fund, Inc. as of December 31, 2008, the results of its operations for the year then ended, the changes in its net assets for each of the two years in the period then ended, and the financial highlights for each of the five years in the period then ended, in conformity with accounting principles generally accepted in the United States of America.
Deloitte & Touche LLP
Boston, Massachusetts
February 26, 2009
MSF-21
Metropolitan Series Fund, Inc.
Directors and Officers
The Fund’s Directors review actions of the Fund’s investment adviser and subadvisers, and decide upon matters of general policy. The Fund’s officers supervise the daily business operations of the Fund. The Board of Directors and the Fund’s officers are listed below. Each Director is responsible for overseeing all 38 Portfolios of the Fund. There is no limit to the term a Director may serve. Directors serve until their resignation, retirement or removal in accordance with the Fund’s organizational documents and policies adopted by the Board from time to time. Officers hold office at the pleasure of the Board or until the election or appointment and the qualification of a successor. The address of the Directors and officers is c/o Metropolitan Series Fund, Inc., 501 Boylston Street, Boston, MA 02116.
Interested Directors(1)
Each Director below is an “interested person” (as defined by the 1940 Act) with respect to the Fund in that Ms. Forget is an employee of MetLife and Mr. Typermass is a former employee of MetLife and owns securities issued by MetLife, Inc., the ultimate parent company of MetLife Advisers.
| | | | | | | | |
Name, Address and Age | | Current
position(s)
with Fund | | Position(s)
held since | | Principal occupations
over past five years, including other directorships(2) | | Number of
Portfolios in
Fund Complex
Overseen by
Director(3) |
Elizabeth M. Forget Age: 42 | | Director, Chairman of the Board, President and Chief Executive Officer | | 2006 | | Senior Vice President (since 2007), MetLife, Inc.; President, Met Investors Advisory, LLC; Trustee and President, Met Investors Series Trust; Executive Vice President, MetLife Investors Group, Inc.; President, Chief Executive Officer and Chair of the Board of Managers (since 2006), MetLife Advisers; President, Met Investors Advisory, LLC. | | 87 |
| | | | |
Arthur G. Typermass Age: 71 | | Director | | 1998 | | Formerly, Senior Vice President and Treasurer, MetLife. | | 38 |
Non-Interested Directors(1)
Each Director below is not an “interested person” (as defined by the 1940 Act) with respect to the Fund (collectively, the “Independent Directors”).
| | | | | | | | |
Name, Address and Age | | Current
position(s)
with Fund | | Position(s)
held since | | Principal occupations
over past five years, including other directorships(2) | | Number of
Portfolios in
Fund Complex
Overseen by
Director(3) |
Steve A. Garban† Age: 71 | | Director | | 1985 | | Formerly, Chief Financial Officer, Senior Vice President Finance and Operations and Treasurer (Emeritus), The Pennsylvania State University. | | 38 |
| | | | |
Linda B. Strumpf Age: 61 | | Director | | 2000 | | Vice President and Chief Investment Officer, Ford Foundation. | | 38 |
| | | | |
Michael S. Scott Morton† Age: 71 | | Director | | 1993 | | Jay W. Forrester Professor of Management (Emeritus) at Sloan School of Management, MIT. | | 38 |
| | | | |
H. Jesse Arnelle Age: 75 | | Director | | 2001 | | Formerly, Counsel, Womble Carlyle Sandrie & Rice; Director, Textron Inc. (global multi- industry company)*; formerly, Director, Gannet Co. Inc. (diversified news and information company)*; formerly, Director, Eastman Chemical Company (global chemical company)*; formerly, Director, Waste Management, Inc.*; formerly, Director, Armstrong Holdings Inc. (parent company of floor and ceiling products business)*; formerly, Director, FPL Group Inc. (public utility holding company)*; Director, URS Corporation (engineering design services firm)*. | | 38 |
MSF-22
Metropolitan Series Fund, Inc.
Directors and Officers—(Continued)
| | | | | | | | |
Name, Address and Age | | Current
position(s)
with Fund | | Position(s)
held since | | Principal occupations
over past five years, including other directorships(2) | | Number of
Portfolios in
Fund Complex
Overseen by
Director(3) |
Nancy Hawthorne Age: 57 | | Director | | 2003 | | Chief Executive Officer, Clerestory LLC (corporate financial advisor); Director, Avid Technologies (computer software company)*; formerly, Chairman of the Board of Avid Technologies; formerly, Board of Advisors, L. Knife & Sons, Inc. (beverage distributor); formerly, Trustee, New England Zenith Fund (“Zenith Fund”)**; formerly, Chief Executive Officer and Managing Partner, Hawthorne, Krauss and Associates (corporate financial advisor); formerly, Chief Financial Officer and Executive Vice President, Continental Cablevision, subsequently renamed MediaOne (cable television company); formerly, Director, Life F/X, Inc.; formerly, Chairman of the Board, WorldClinic (distance medicine company); formerly, Director, Perini Corporation (construction company)*; formerly, Director, CGU (property and casualty insurance company); formerly, Director, Beacon Power Corporation (energy company)*. | | 38 |
| | | | |
John T. Ludes Age: 72 | | Director | | 2003 | | President, LFP Properties (consulting firm); Formerly, Trustee, Zenith Fund**; formerly, Vice Chairman, President and Chief Operating Officer, Fortune Brands/American Brands (global conglomerate); formerly, President and CEO, Acushnet Company (athletic equipment company). | | 38 |
Officers(1)
| | | | | | | | |
Name and address | | Age | | Current
position(s)
with Fund | | Position(s)
held since | | Principal occupations over past five years(2) |
| Jeffrey L. Bernier | | 37 | | Senior Vice President | | 2008 | | Vice President (since 2008), MetLife, Inc.; Vice President (since 2008), MetLife; Senior Vice President (since 2008), MetLife Advisers; formerly, Director and Senior Investment Analyst (2004 to 2007), John Hancock Financial Services; formerly, Assistant Vice President (2000 to 2001), Wachovia Securities. |
| | | | |
| Alan C. Leland | | 56 | | Senior Vice President | | 2005 | | Treasurer and Chief Financial Officer, MetLife Advisers, LLC; Treasurer (since 2005), Met Investors Advisory, LLC; Vice President (since 2004), Met Investors Advisory, LLC; Vice President (since 2003), MetLife, Inc.; Vice President, MetLife; Senior Vice President, NELICO. |
| | | | |
| Peter Duffy | | 53 | | Vice President
and Treasurer | | 2000 | | Senior Vice President, MetLife Advisers; Second Vice President (since 2003), NELICO; Vice President, MetLife (since 2004); Vice President (since 2004), MetLife, Inc.; formerly, Vice President and Treasurer, Zenith Fund**. |
| | | | |
| Jeffrey P. Halperin | | 41 | | Chief
Compliance Officer | | 2007 | | Vice President (since 2006), MetLife, Inc.; Vice President (since 2006), MetLife; Chief Compliance Officer (since 2006), Met Investors Series Trust, MetLife Advisers, Met Investors Advisory, LLC and MetLife Investment Advisors Company, LLC. |
| * | Indicates a directorship with a registered investment company or a company subject to the reporting requirements of the Securities Exchange Act of 1934, as amended. |
| ** | The Zenith Fund deregistered with the Securities and Exchange Commission (“SEC”) in 2004. |
| (†) | Served as a trustee, director and/or officer of one or more of the following companies, each of which had a direct or indirect advisory relationship with MetLife Advisers or its affiliates prior to January 31, 2005: State Street Research Financial Trust, State Street Research Income Trust, State Street Research Money Market Trust, State Street Research Institutional Funds, State Street Research Capital Trust, State Street Research Master Investment Trust, State Street Research Equity Trust, State Street Research Securities Trust and State Street Research Exchange Trust (collectively, the “State Street Research Funds”). |
| (1) | During the period shown, each Director of the Fund served as a Trustee of Metropolitan Series Fund II, a registered investment company that ceased investment operations in June of 2008 and has applied for deregistration under the Investment Company Act of 1940. During this period, each officer of the Fund served in the same position with Metropolitan Series Fund II. |
| (2) | Previous positions during the past five years with the Fund; Met Investors Series Trust; MetLife; MetLife, Inc.; MetLife Advisers; Met Investors Advisory, LLC; Zenith Fund; NELICO; or New England Securities Corporation are omitted if not materially different. |
| (3) | The Fund Complex includes the Fund (38 portfolios) and Met Investors Series Trust (49 portfolios). |
MSF-23
Metropolitan Series Fund, Inc.
Western Asset Management U.S. Government Portfolio
Board Approval of Advisory and Subadvisory Agreements
The Fund’s Contract Review Committees of the Board of Directors (the “Board” or the “Directors”) typically meet in early fall to review the Portfolios’ advisory agreements (the “Advisory Agreements”) and subadvisory agreements (the “Subadvisory Agreements,” and, together with the Advisory Agreements, the “Agreements”) and determine whether to recommend that the full Board approve the continuation of the Agreements for an additional one-year period. (Following the initial approval of an Agreement for a new Portfolio or with a new adviser or subadviser, such annual reviews are not required until 2 years following the execution of such Agreement.) After each Committee has made its recommendations, the full Board, including the Independent Directors, determines whether to approve the continuation of each of the Agreements. In addition, the Board, including the Independent Directors, considers matters bearing on the Agreements at most of its other meetings throughout the year and regularly interviews various individuals at MetLife Advisers responsible for the management of the Portfolios. The Directors also interview selected investment managers and other professionals at the subadvisers at various times throughout the year.
The Directors receive all materials that they or MetLife Advisers, the Fund’s investment adviser, and the subadvisers believe to be reasonably necessary for the Directors to evaluate the Agreements and determine whether to approve the continuation of the Agreements. These materials generally include, among other items, (i) information on the investment performance of the Portfolios and the performance of peer groups of funds and the Portfolios’ performance benchmarks, (ii) information on the Portfolios’ advisory and subadvisory fees and other expenses, including information comparing the Portfolios’ expenses to those of peer groups of funds and information about any applicable expense caps and fee “breakpoints,” (iii) sales and redemption data, (iv) information related to the profitability of the Agreements to MetLife Advisers and certain of the subadvisers, and potential “fall-out” or ancillary benefits that MetLife Advisers, the subadvisers or their affiliates may receive as a result of their relationships with the Fund and (v) information obtained through the subadvisers’ responses to certain requests from MetLife Advisers and the Directors and MetLife Advisers’ responses to requests from the Directors. The Directors may also consider other information such as (vi) MetLife Advisers’ and the subadvisers’ financial results and condition, (vii) each Portfolio’s investment objectives and strategies and the size, education and experience of the investment staffs of MetLife Advisers and the relevant subadvisers and their use of technology and external research, (viii) the allocation of the Portfolios’ brokerage, if any, including allocations to brokers affiliated with the subadvisers and the use of “soft” commission dollars to pay Portfolio expenses and to pay for research and other similar services, (ix) the resources devoted to, and the record of compliance with, the Portfolios’ investment policies and restrictions, policies on personal securities transactions and other compliance policies, (x) the responses of MetLife Advisers, the subadvisers and/or their affiliates to certain legal and regulatory proceedings and (xi) the economic outlook generally and for the mutual fund industry in particular. Throughout the process, the Directors have the opportunity to ask questions of and request additional materials from MetLife Advisers and the subadvisers.
Following meetings of each Contract Review Committee on September 10, 2008, the Board, including the Independent Directors, at its November 6-7, 2008 meeting, approved the continuation through December 31, 2009 of the Advisory Agreements for each Portfolio of the Fund and the Subadvisory Agreements for each Portfolio other than the Zenith Equity Portfolio and Asset Allocation Portfolios (which do not have subadvisers) and the Van Eck Global Natural Resources Portfolio, Met/Dimensional International Small Cap Portfolio and Loomis Sayles Small Cap Growth Portfolio (formerly known as the Franklin Templeton Small Cap Growth Portfolio). The Agreements approved for continuation are referred to below as the “Continued Agreements.”
In considering whether to approve the continuation of the Continued Agreements, the Directors, including the Independent Directors, did not identify any single factor as determinative, and each weighed the various factors as he or she deemed appropriate. The Directors considered the following matters in connection with their approval of the Continued Agreements:
The nature, extent and quality of the services provided to the relevant Portfolios under the Continued Agreements. The Directors considered the nature, extent and quality of the services provided by MetLife Advisers, the relevant subadvisers (if any) and their affiliates (each, an “Adviser,” and, collectively, the “Advisers”) to the relevant Portfolios pursuant to the Continued Agreements and the resources dedicated to these Portfolios by the Advisers. In particular, the Directors considered the Advisers’ abilities to attract and retain highly qualified investment professionals. With respect to MetLife Advisers, the Directors considered (for each Portfolio other than the Zenith Equity and Asset Allocation Portfolios) that MetLife Advisers is (i) ultimately responsible for the performance of such Portfolios; (ii) ultimately responsible for the establishment of the investment strategies of each such Portfolio, primarily through its recommendations to the Board regarding the hiring and selection of subadvisers; (iii) responsible for the hiring and selection, subject to Board approval, of subadvisers; and (iv) responsible for maintaining a program of Subadviser oversight reasonably designed to ensure that the subadvisers have reasonable compliance policies and procedures in place. The Directors also considered that MetLife Advisers provides a full range of day-to-day administrative services for the Portfolios involving all aspects of such Portfolios’ day-to-day operations (other than portfolio management). With respect to the Zenith Equity and Asset Allocation Portfolios, the Directors considered both the portfolio management services and the administrative services provided by MetLife Advisers. After reviewing
MSF-24
Metropolitan Series Fund, Inc.
Western Asset Management U.S. Government Portfolio
Board Approval of Advisory and Subadvisory Agreements—(Continued)
these and related factors, the Directors concluded, within the context of their overall conclusions regarding each of the Continued Agreements, that the nature, extent and quality of services provided supported the renewal of these Agreements.
Investment performance of the relevant Portfolios. The Directors reviewed information about the performance of the relevant Portfolios over various time periods, including information prepared by an independent third party that compared the performance of the Portfolios to the performance of peer groups of funds and performance benchmarks. The Directors also reviewed a description of the third party’s methodology for identifying a Portfolio’s peer group(s) for purposes of performance and expense comparisons.
In the case of each relevant Portfolio that had performance that lagged its peer group(s) for certain periods, the Directors concluded that other factors relevant to performance were sufficient, in light of other considerations, to warrant renewal of the Continued Agreements relating to such Portfolio. These factors varied from Portfolio to Portfolio, but included one or more of the following: (i) that such Portfolio’s performance, although lagging in certain recent periods, was stronger over the longer term; (ii) that the underperformance was attributable, to a significant extent, to investment decisions that were reasonable and consistent with the Portfolio’s investment objective(s) and policies and that the Portfolio was performing within the range of reasonable expectations, given market conditions and the Portfolio’s investment objective(s) and policies; (iii) that the Portfolio’s performance was competitive when compared to other relevant performance benchmarks or peer groups; and (iv) that MetLife Advisers and/or the relevant subadviser (if any) had taken or was taking steps designed to help improve the Portfolio’s investment performance (including, in the case of certain Portfolios, that MetLife Advisers was formulating possible proposals, for presentation to the Board in November 2008, to replace the Portfolio’s subadviser or to merge the Portfolio into another Portfolio with a similar investment objective and better investment performance).
The Directors also considered the investment performance of the Advisers and their reputations generally, the historical responsiveness of the Advisers to Director concerns about performance and the willingness of the Advisers to take steps intended to improve performance.
After reviewing these and related factors, the Directors concluded, within the context of their overall conclusions regarding each of the Continued Agreements, that the investment performance of each relevant Portfolio and Adviser was sufficient, in light of other considerations, to warrant the renewal of the Continued Agreements.
The costs of the services to be provided and profits to be realized by the Advisers and their affiliates from their relationships with the Portfolios. The Directors considered the fees charged by MetLife Advisers to the Portfolios for advisory services and, with respect to the subadvised Portfolios, by such subadvisers to MetLife Advisers for subadvisory services (such advisory and subadvisory fees (if any), collectively, “Fees”), as well as the total expense levels of the Portfolios. This information included comparisons (provided by an independent third party) of the Portfolios’ advisory fees and total expense levels to those of their peer groups. In evaluating Fees for the relevant Portfolios, the Directors also took into account the demands, complexity and quality of the investment management services provided to each Portfolio. The Directors considered MetLife Advisers’ recommendations regarding reductions in Fee rates, implementation of Fee breakpoints and institution of Fee waivers and expense caps.
The Directors also considered the compensation directly or indirectly received by the Advisers and their affiliates from their relationships with the relevant Portfolios. The Directors reviewed information relating to the profits received by MetLife Advisers, certain of the subadvisers and their affiliates as a result of their relationships with the relevant Portfolios, and information about the allocation of expenses used to calculate profitability. When reviewing profitability, the Directors also considered the performance of the relevant Portfolios, the expense levels of such Portfolios and whether the relevant Advisers had implemented breakpoints, fee waivers and/or expense caps with respect to such Portfolios.
After reviewing these and related factors, the Directors concluded, within the context of their overall conclusions regarding each of the Continued Agreements, that the Fees charged to each of the relevant Portfolios were fair and reasonable, and that the information provided regarding costs of these services generally, and the related profitability (if known) to the relevant Advisers of their relationships with the relevant Portfolios, supported the renewal of the Continued Agreements.
Economies of Scale. The Directors considered the existence of any economies of scale in the provision of services by the Advisers and whether those economies were shared with the relevant Portfolios through breakpoints in their advisory fees or other means, such as expense caps, fee waivers or relatively low levels of fees. The Directors noted that most of the relevant Portfolios benefited or will benefit from breakpoints, expense caps and/or fee waivers with respect to their advisory fees. In considering these issues, the Directors also took into consideration information relating to the costs of the services provided and the profitability to MetLife Advisers, the relevant subadvisers (if any) and each of their affiliates of their relationships with the relevant Portfolios, as discussed above.
MSF-25
Metropolitan Series Fund, Inc.
Western Asset Management U.S. Government Portfolio
Board Approval of Advisory and Subadvisory Agreements—(Continued)
After reviewing these and related factors, the Directors concluded, within the context of their overall conclusions regarding each of the Continued Agreements, that the extent to which economies of scale were shared with the relevant Portfolios supported the renewal of such Agreements.
Other Factors. The Directors also considered other factors, which included but were not limited to the following:
| | • | | the extent to which each relevant Portfolio operated in accordance with its investment objective, and its record of compliance with its investment restrictions and the compliance programs of the Fund and the Advisers. They also considered the compliance-related resources the Advisers and their affiliates provide to the relevant Portfolios; |
| | • | | the nature, quality, cost and extent of administrative and shareholder services performed by MetLife Advisers and its affiliates under the Advisory Agreements; and |
| | • | | so-called “fall-out benefits” to the Advisers, such as the engagement of their affiliates to provide distribution, brokerage and transfer agency services to the Portfolios, and the benefits of research made available to the relevant Advisers by reason of brokerage commissions generated by the relevant Portfolios’ securities transactions. The Directors also considered the possible conflicts of interest associated with these fall-out and other benefits, and the reporting and other processes in place to disclose and monitor these possible conflicts of interest. |
Based on their evaluation of all factors that they deemed to be material, including those factors described above, and assisted by the advice of independent counsel, the Directors, including the Independent Directors, concluded that each of the Continued Agreements should be continued through December 31, 2009.
MSF-26
A description of the policies and procedures that the Fund uses to determine how to vote proxies relating to portfolio securities is available (i) without charge, upon request, by calling (800) 638-7732 and (ii) on the Securities and Exchange Commission’s (the “SEC”) website at http://www.sec.gov.
Information regarding how the Fund voted proxies relating to portfolio securities during the most recent twelve-month period ended December 31, 2008 is available (i) without charge, upon request, by calling (800) 638-7732 and (ii) on the SEC’s website at http://www.sec.gov.
The Fund’s Statement of Additional Information includes additional information about the Directors of the Fund and is available (i) without charge, upon request, by calling (800) 638-7732 and (ii) on the SEC’s website at http://www.sec.gov.
The Fund files with the SEC a complete schedule of its portfolio holdings, as of the close of the first and third quarters of its fiscal year, on “Form N-Q”. These filings are available on the SEC’s website at www.sec.gov and may be reviewed and copied at the SEC’s Public Reference Room in Washington, DC. (Call 1-800-SEC-0330 for information on the operation of the Public Reference Room.)
MSF-27
Simplify your life…
with MetLife eDelivery® while helping MetLife preserve the planet’s natural resources.
(see details on inside cover)
| | |
Metropolitan Series Fund, Inc. Zenith Equity Portfolio Annual Report | | December 31, 2008 |
NOT PART OF THE ANNUAL REPORT
Letter from the President
February 1, 2009
Letter to Policy Holders:
2008 was an extraordinary year in the capital markets around the world and for the global economy. Energy prices rose to record levels early in the year before falling by two-thirds by year-end. A credit crisis that began with concerns about sub-prime mortgages led to massive changes in the financial landscape with government takeovers, forced sales, and outright failures of a number of large, once venerable firms.
While bonds as measured by the Barclays Capital U.S. Aggregate Bond Index (formerly known as, Lehman Brothers U.S. Aggregate Bond Index) were up 5.2% for the year in response to declining interest rates, there were large differences in the total returns of the various sectors of the bond market. U.S. treasury securities were up over 13% as frightened investors sought refuge in what they perceived to be the safest and most liquid investments. In contrast, investment grade corporate securities lost nearly 5% as credit spreads widened and below investment grade or high yield bonds fell over 26%.
In response to the growing credit crisis and the weakening economy, common stocks fell sharply across all regions, styles, and capitalizations. As measured by the Standard and Poor’s 500, U.S. common stocks fell 37% for the year, the worst calendar year decline since the 1930s. Foreign stocks were down even more with the MSCI EAFE Index down 43% for the year.
On the following pages, you will find a complete review of your Portfolio and its investment performance.
MetLife is committed to building your financial freedom. We appreciate your trust and will continue to focus our efforts on meeting your investment needs.
Sincerely,
Elizabeth M. Forget
President, Metropolitan Series Fund, Inc.
Metropolitan Series Fund, Inc.
Zenith Equity Portfolio
Managed by MetLife Advisers, LLC
Portfolio Manager Commentary*
PORTFOLIO PERFORMANCE
For the twelve-month period ended December 31, 2008, the Class A shares of the Zenith Equity Portfolio returned -38.5%, compared to its benchmark, the Standard & Poor’s 500 Index1, which returned -37.0%. The average return of its peer group, the Lipper Variable Insurance Products Large-Cap Core Funds Universe2, was -38.8% over the same period.
ECONOMIC AND MARKET REVIEW
The first half of 2008 was highlighted by growing concerns about the economy due to the emerging credit crisis, rising unemployment, falling consumer confidence, a struggling housing sector, and skyrocketing food and energy prices. The forced sale of Bear Stearns in March to JP Morgan at first appeared to be an isolated event, but would prove to be a harbinger of things to come. The Federal Reserve was aggressive early in the year to revive the economy when they cut their target rate several times to bring it down from 4.25% to 2.00% by early May. They held rates steady in subsequent meetings through the summer as they tried to balance the danger of the economy falling into a recession against their desire to control growing inflation pressures.
However, the evidence of a weakening economy (especially falling real estate prices and the impact of the sub-prime mortgage crisis) gained momentum during the summer, climaxing in the extraordinary events of September and October that saw the government’s provision of credit assistance to Fannie Mae and Freddie Mac, the bankruptcy of Lehman Brothers, and the failure of Washington Mutual. The U.S. government and governments around the world took massive fiscal and monetary actions to stabilize the capital markets, restore liquidity to the clogged credit pipeline, and to stimulate the economy. These efforts continue as we move into 2009. Although we now know that the recession began a year ago in December 2007, the recession intensified during the last months of 2008: unemployment rose sharply as companies made massive layoffs, housing prices and sales continued to fall, retail sales fell, and, in a bit of good news/bad news, oil prices fell nearly $100 per barrel in response in expectation of lower global demand. The incoming administration of Barack Obama faces what most pundits call the largest economic crisis since the Great Depression.
U.S. common stocks suffered their worst calendar year decline in over seventy years during 2008 as measured by the -37.0% return of the Standard & Poor’s 500 Index. Growing expectations for a deep and long recession and a sharp drop in corporate earnings drove stock prices lower. The total collapse of several high profile financial firms pulled the indices down further. While there was very little difference in the return by style within large cap stocks, growth fell more than value at the mid cap and small cap segments. There was little difference in return by capitalization. By sector, Financials and Materials were down the most, while Consumer Staples held up better on a relative basis. Energy, which was up nearly 9% in the first half of the year, fell 40% in the second half to finish the year down almost 35%. Foreign stocks were also down sharply for the year, falling over 43% as measured by the MSCI EAFE Index. Emerging markets were down 53.3% as measured by the MSCI Emerging Markets Index5.
PORTFOLIO REVIEW
The Zenith Equity Portfolio is a “fund of funds” that invests in other Portfolios of the Metropolitan Series Fund, Inc. At the end of the period, MetLife Advisers invested the assets of Zenith Equity Portfolio equally among the Capital Guardian U.S. Equity Portfolio, the FI Value Leaders Portfolio, and Jennison Growth Portfolio (the Underlying Portfolios). Capital Guardian returned -39.4% for the period compared to its benchmark (S&P 500), which returned -37.0%. It was hurt by weak stock selection in the financial sector. Four financial stocks, Lehman Brothers (securities), Freddie Mac (mortgages), Fannie Mae (mortgages), and Washington Mutual (mortgage lender) lost nearly all of their value during the year and together were responsible for the Portfolio’s entire underperformance. Overperformance in Health Care helped buoy the Portfolio, namely its stake in Genentech. FI Value Leaders returned -38.9% compared to the Russell 1000 Value Index3 return of -36.8%. Its stock selection was mixed. In the Financials sector, it was helped by avoiding Wachovia and Washington Mutual and holding Wells Fargo. It was hurt by stock selection in the Consumer Staples sector; holding food company Bunge, Ltd. and not owning stalwart Wal-Mart Stores. With a return of -36.4%, Jennison still lost absolute ground, but it outperformed the S&P 500 and the -38.4% return of the Russell 1000 Growth Index4. Jennison was helped by an underweight in the weak Financial sector and good stock selection, avoiding most of the high profile financial names that blew up. On the other hand, the Portfolio was hurt by stock selection in the Energy sector. It did not hold the strong performing Exxon Mobil, but did hold the relatively weak oil service companies Halliburton and Schlumberger.
* The views expressed above are those of the advisory firm as of December 31, 2008 and are subject to change based on market and other conditions. Information about the Portfolio’s holdings, asset allocation, industry allocation, or country diversification is historical and is not an indication of future Portfolio composition, which will vary. The performance of any index mentioned in this commentary has not been adjusted for ongoing management, distribution and operating expenses, and sales charges applicable to mutual fund investments. Direct investment in any index is not possible.
1 The Standard & Poor’s (S&P) 500® Composite Stock Price Index is an unmanaged index representing the performance of 500 major companies, most of which are listed on the New York Stock Exchange.
2 The Lipper Variable Products Fund Average is an average of the total return performance (calculated on the basis of net asset value) of variable product funds with similar investment objectives to those of the subject Portfolio as calculated by Lipper Analytical Services, an independent mutual fund ranking service.
3 The Russell 1000® Value Index is an unmanaged measure of the largest capitalized U.S. domiciled companies with a less than average growth orientation. Companies in this Index generally have a low price-to-book and price-to-earnings ratio, higher divided yields and lower forecasted growth values.
4 The Russell 1000® Growth Index is an unmanaged measure of performance of the largest capitalized U.S. companies, within the Russell 1000 companies, that have higher price-to-book ratios and forecasted growth values.
5 The MSCI Emerging Markets Index is a free float-adjusted market capitalization index that is designed to measure equity market performance of emerging markets. As of January 2009 the MSCI Emerging Markets Index consisted of the following 23 emerging market country indices: Argentina, Brazil, Chile, China, Colombia, Czech Republic, Egypt, Hungary, India, Indonesia, Israel, Korea, Malaysia, Mexico, Morocco, Peru, Philippines, Poland, Russia, South Africa, Taiwan, Thailand, and Turkey.
MSF-2
Metropolitan Series Fund, Inc.
Zenith Equity Portfolio
A $10,000 INVESTMENT COMPARED TO THE
S&P 500 INDEX
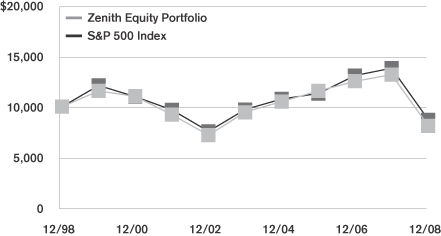
Average Annual Returns as of December 31, 2008
| | | | |
| | | Zenith Equity Portfolio | | S&P 500 Index |
| 1 Year | | -38.5% | | -37.0% |
| 5 Year | | -3.0 | | -2.2 |
| 10 Year | | -2.1 | | -1.4 |
Performance numbers are net of all Portfolio expenses but do not include any insurance, sales, or administrative charges of variable annuity or life insurance contracts or any additional expenses that participants in certain eligible qualified plans may bear relating to the operations of their plans. If these charges were included, the returns would be lower.
This information represents past performance and is not indicative of future results. Investment return and principal value may fluctuate so that shares, upon redemption, may be worth more or less than the original cost.
PORTFOLIO COMPOSITION
as of December 31, 2008
Top Holdings
| | |
| | | % of Total
Net Assets |
Metropolitan Series Fund, Inc.—FI Value Leaders Portfolio, (Class A) | | 33.8% |
Metropolitan Series Fund, Inc.—Capital Guardian U.S Equity Portfolio, (Class A) | | 33.1% |
Metropolitan Series Fund, Inc.—Jennison Growth Portfolio, (Class A) | | 33.1% |
MSF-3
Metropolitan Series Fund, Inc.
Shareholder Expense Example
As a shareholder of the Portfolio, you incur ongoing costs, including management fees; distribution and service (12b-1) fees; and other Portfolio expenses. This example is intended to help you understand your ongoing costs (in dollars) (referred to as “expenses”) of investing in the Portfolio and compare these costs with the ongoing costs of investing in other mutual funds. The example is based on an investment of $1,000 invested at the beginning of the period and held for the entire period, July 1, 2008 through December 31, 2008.
Actual Expenses
The first line for each share class of the Portfolio in the table below provides information about actual account values and actual expenses. You may use the information in this line, together with the amount you invested in the particular share class of the Portfolio, to estimate the expenses that you paid over the period. Simply divide your account value by $1,000 (for example, an $8,600 account value divided by $1,000=8.6), then multiply the result by the number in the first line under the heading entitled “Expenses Paid During Period” to estimate the expenses you paid on your account during this period.
Hypothetical Example for Comparison Purposes
The second line for each share class of the Portfolio in the table below provides information about hypothetical account values and hypothetical expenses based on the Portfolio’s actual expense ratio and an assumed rate of return of 5% per year before expenses, which is not the Portfolio’s actual return. The hypothetical account values and expenses may not be used to estimate the actual ending account balance or expenses you paid for the period. You may use this information to compare the ongoing costs of investing in the Portfolio and other funds. To do so, compare this 5% hypothetical example with the 5% hypothetical examples that appear in the shareholder reports of the other funds.
Please note that the expenses shown in the table are meant to highlight your ongoing costs only and do not reflect any fees or charges of your variable insurance product or any additional expenses that participants in certain eligible qualified plans may bear relating to the operations of their plan. Therefore, the second line for each share class in the table is useful in comparing ongoing costs only, and will not help you determine the relative total costs of owning different funds. In addition, if these other costs were included, your costs would have been higher.
| | | | | | | | | | | | | | |
Portfolio | | | | Annualized
Expense
Ratio | | | Beginning
Account Value
July 1,
2008 | | Ending
Account Value
December 31,
2008 | | Expenses Paid
During Period*
July 1, 2008
to
December 31, 2008 |
Zenith Equity(a) | | Actual | | 0.75 | % | | $ | 1,000.00 | | $ | 699.35 | | $ | 3.20 |
| | Hypothetical | | 0.75 | % | | $ | 1,000.00 | | $ | 1,021.32 | | $ | 3.81 |
* Expenses paid are equal to the Portfolio’s annualized expense ratio for the most recent six month period, as shown above, multiplied by the average account value over the period, multiplied by the number of days in the most recent fiscal half-year, divided by 366 (to reflect the the one-half year period).
(a) The annualized expense ratio reflects the expenses of both the Zenith Equity Portfolio and the underlying Portfolios in which it invests.
MSF-4
Metropolitan Series Fund, Inc.
Zenith Equity Portfolio
Schedule of Investments as of December 31, 2008
Mutual Funds—100.0%
| | | | | | |
| Security Description | | Shares | | Value* | |
| |
Affiliated Investment Companies—100.0% | | | | |
Metropolitan Series Fund, Inc.—Capital Guardian U.S. Equity Portfolio, (Class A) | | 23,307,023 | | $ | 150,796,440 | |
Metropolitan Series Fund, Inc.—FI Value Leaders Portfolio, (Class A) | | 1,442,626 | | | 153,654,140 | |
Metropolitan Series Fund, Inc.—Jennison Growth Portfolio, (Class A) | | 19,282,892 | | | 150,599,388 | |
| | | | | | |
Total Mutual Funds
(Identified Cost $673,807,887) | | | | | 455,049,968 | |
| | | | | | |
Total Investments—100.0%
(Identified Cost $673,807,887) (a) | | | | | 455,049,968 | |
Liabilities in excess of other assets | | | | | (58,981 | ) |
| | | | | | |
| Total Net Assets—100% | | | | $ | 454,990,987 | |
| | | | | | |
| (a) | The aggregate cost of investments for federal income tax purposes as of December 31, 2008 was $683,761,969 and the unrealized depreciation of investment securities was $(228,712,001). |
The Portfolio adopted the provisions of Statement of Financial Accounting Standards No. 157, “Fair Value Measurements” (FAS 157), effective with the beginning of the Portfolio’s fiscal year. FAS 157 establishes a framework for measuring fair value and expands disclosures about fair value measurements in financial statements. The three levels of the hierarchy under FAS 157 are described below:
Level 1 - quoted prices in active markets for identical securities
Level 2 - other significant observable inputs (including quoted prices for similar securities, interest rates, credit risk, etc.)
Level 3 - significant unobservable inputs (including the Portfolio’s own assumptions in determining the fair value of investments)
The inputs or methodology used for valuing securities are not necessarily an indication of the risk associated with investing in those securities.
The following is a summary of the inputs used to value the Portfolio’s net assets as of December 31, 2008:
| | | | | | |
| Valuation Inputs | | Investments In
Securities | | Other Financial
Instruments* |
Level 1 - Quoted Prices | | $ | 455,049,968 | | $ | 0 |
Level 2 - Other Significant Observable Inputs | | | 0 | | | 0 |
Level 3 - Significant Unobservable Inputs | | | 0 | | | 0 |
Total | | $ | 455,049,968 | | $ | 0 |
* Other financial instruments are derivative instruments not reflected in the Schedule of Investments, such as futures, forwards, swap contracts and written options, which are valued based on the unrealized appreciation/depreciation on the instrument.
*See accompanying notes to financial statements.
MSF-5
Metropolitan Series Fund, Inc.
Zenith Equity Portfolio
Statement of Assets & Liabilities
December 31, 2008
| | | | | | | |
Assets | | | | | | | |
Investments at value (a) | | | | | $ | 455,049,968 | |
Cash | | | | | | 1 | |
Receivable for: | | | | | | | |
Securities sold | | | | | | 203,842 | |
Fund shares sold | | | | | | 27,697 | |
| | | | | | | |
Total Assets | | | | | | 455,281,508 | |
Liabilities | | | | | | | |
Payable for: | | | | | | | |
Fund shares redeemed | | $ | 231,539 | | | | |
Accrued expenses: | | | | | | | |
Deferred directors’ fees | | | 36,425 | | | | |
Other expenses | | | 22,557 | | | | |
| | | | | | | |
Total Liabilities | | | | | | 290,521 | |
| | | | | | | |
Net Assets | | | | | $ | 454,990,987 | |
| | | | | | | |
Net assets consists of: | | | | | | | |
Capital paid in | | | | | $ | 595,521,280 | |
Undistributed net investment income | | | | | | 26,893,197 | |
Accumulated net realized gains | | | | | | 51,334,429 | |
Unrealized depreciation on investments | | | | | | (218,757,919 | ) |
| | | | | | | |
Net Assets | | | | | $ | 454,990,987 | |
| | | | | | | |
| Computation of offering price: | | | | | | | |
Class A | | | | | | | |
Net asset value and redemption price per share ($454,990,987 divided by 1,626,542 shares outstanding) | | | | | $ | 279.73 | |
| | | | | | | |
(a) Identified cost of investments | | | | | $ | 673,807,887 | |
| | | | | | | |
Statement of Operations
For the Year Ended December 31, 2008
| | | | | | | | |
Investment Income | | | | | | | | |
Dividends from Underlying Portfolios | | | | | | $ | 12,800,694 | |
| | | | | | | | |
Expenses | | | | | | | | |
Directors’ fees and expenses (a) | | $ | (22,199 | ) | | | | |
Custodian | | | 32,828 | | | | | |
Audit and tax services | | | 21,423 | | | | | |
Legal | | | 11,265 | | | | | |
Miscellaneous | | | 7,406 | | | | | |
| | | | | | | | |
Total expenses | | | | | | | 50,723 | |
| | | | | | | | |
Net Investment Income | | | | | | | 12,749,971 | |
| | | | | | | | |
Realized and Unrealized Gain (Loss) | | | | | | | | |
| Realized gain (loss) on: | | | | | | | | |
Investments—net | | | (241,510 | ) | | | | |
Capital gains distributions from Underlying Portfolios | | | 73,596,787 | | | | 73,355,277 | |
| | | | | | | | |
| Change in unrealized depreciation on: | | | | | | | | |
Investments—net | | | | | | | (391,180,914 | ) |
| | | | | | | | |
Net loss | | | | | | | (317,825,637 | ) |
| | | | | | | | |
Net Decrease in Net Assets From Operations | | | | | | $ | (305,075,666 | ) |
| | | | | | | | |
| (a) | Reflects the change in the deferred directors fee liability which is marked to market based on the portfolio’s investment performance. |
See accompanying notes to financial statements.
MSF-6
Metropolitan Series Fund, Inc.
Zenith Equity Portfolio
Statements of Changes in Net Assets
| | | | | | | | |
| | | Year ended
December 31,
2008 | | | Year ended
December 31,
2007 | |
From Operations | | | | | | | | |
Net investment income | | $ | 12,749,971 | | | $ | 5,680,584 | |
Net realized gain | | | 73,355,277 | | | | 99,132,587 | |
Change in unrealized depreciation | | | (391,180,914 | ) | | | (55,905,944 | ) |
| | | | | | | | |
Increase (decrease) in net assets from operations | | | (305,075,666 | ) | | | 48,907,227 | |
| | | | | | | | |
From Distributions to Shareholders | | | | | | | | |
Net Investment Income | | | (18,168,336 | ) | | | (6,947,399 | ) |
Net realized gain | | | (4,644,866 | ) | | | 0 | |
| | | | | | | | |
Total distributions | | | (22,813,202 | ) | | | (6,947,399 | ) |
| | | | | | | | |
Decrease in net assets from capital share transactions | | | (70,097,264 | ) | | | (126,957,251 | ) |
| | | | | | | | |
Net decrease in net assets | | | (397,986,132 | ) | | | (84,997,423 | ) |
| | |
Net Assets | | | | | | | | |
Beginning of the period | | | 852,977,119 | | | | 937,974,542 | |
| | | | | | | | |
End of the period | | $ | 454,990,987 | | | $ | 852,977,119 | |
| | | | | | | | |
Undistributed Net Investment Income | | | | | | | | |
End of the period | | $ | 26,893,197 | | | $ | 18,091,157 | |
| | | | | | | | |
Other Information:
Capital Shares
Transactions in capital shares were as follows:
| | | | | | | | | | | | | | |
| | | Year ended
December 31, 2008 | | | Year ended
December 31, 2007 | |
| | | Shares | | | $ | | | Shares | | | $ | |
Sales | | 144,954 | | | $ | 45,318,219 | | | 186,558 | | | $ | 87,294,647 | |
Reinvestments | | 53,615 | | | | 22,813,202 | | | 14,827 | | | | 6,947,399 | |
Redemptions | | (390,997 | ) | | | (138,228,685 | ) | | (472,139 | ) | | | (221,199,297 | ) |
| | | | | | | | | | | | | | |
Net decrease | | (192,428 | ) | | $ | (70,097,264 | ) | | (270,754 | ) | | $ | (126,957,251 | ) |
| | | | | | | | | | | | | | |
See accompanying notes to financial statements.
MSF-7
Metropolitan Series Fund, Inc.
Zenith Equity Portfolio
Financial Highlights
| | | | | | | | | | | | | | | | | | | | |
| | | Year ended December 31, | |
| | | 2008 | | | 2007 | | | 2006 | | | 2005 | | | 2004 | |
Net Asset Value, Beginning of Period | | $ | 468.93 | | | $ | 448.85 | | | $ | 416.68 | | | $ | 381.97 | | | $ | 345.68 | |
| | | | | | | | | | | | | | | | | | | | |
Income From Investment Operations | | | | | | | | | | | | | | | | | | | | |
Net investment income | | | 7.34 | (a) | | | 2.91 | (a) | | | 3.40 | | | | 2.29 | | | | 3.44 | |
Net realized and unrealized gain (loss) of investments | | | (183.50 | ) | | | 20.66 | | | | 31.01 | | | | 35.94 | | | | 34.45 | |
| | | | | | | | | | | | | | | | | | | | |
Total from investment operations | | | (176.16 | ) | | | 23.57 | | | | 34.41 | | | | 38.23 | | | | 37.89 | |
| | | | | | | | | | | | | | | | | | | | |
Less Distributions | | | | | | | | | | | | | | | | | | | | |
Distributions from net investment income | | | (10.38 | ) | | | (3.49 | ) | | | (2.24 | ) | | | (3.52 | ) | | | (1.60 | ) |
Distributions from net realized capital gains | | | (2.66 | ) | | | 0.00 | | | | 0.00 | | | | 0.00 | | | | 0.00 | |
| | | | | | | | | | | | | | | | | | | | |
Total distributions | | | (13.04 | ) | | | (3.49 | ) | | | (2.24 | ) | | | (3.52 | ) | | | (1.60 | ) |
| | | | | | | | | | | | | | | | | | | | |
Net Asset Value, End of Period | | $ | 279.73 | | | $ | 468.93 | | | $ | 448.85 | | | $ | 416.68 | | | $ | 381.97 | |
| | | | | | | | | | | | | | | | | | | | |
Total Return (%) | | | (38.5 | ) | | | 5.3 | | | | 8.3 | | | | 10.2 | | | | 11.0 | |
Ratio of operating expenses to average net assets (%) | | | 0.01 | (b) | | | 0.01 | (b) | | | 0.01 | (b) | | | 0.01 | (b) | | | 0.01 | (b) |
Ratio of net investment income to average net assets (%) | | | 1.92 | | | | 0.62 | | | | 0.72 | | | | 0.52 | | | | 0.91 | |
Portfolio turnover rate (%) | | | 17 | | | | 11 | | | | 6 | | | | 5 | | | | 4 | |
Net assets, end of period (000) | | $ | 454,991 | | | $ | 852,977 | | | $ | 937,975 | | | $ | 996,855 | | | $ | 1,029,383 | |
| (a) | Per share amount is based on average shares outstanding during the period. |
| (b) | The ratio of operating expenses to average net assets does not include expenses of investment companies in which the Portfolio invests. |
See accompanying notes to financial statements.
MSF-8
Metropolitan Series Fund, Inc.
Zenith Equity Portfolio
Notes to Financial Statements—December 31, 2008
Metropolitan Series Fund, Inc. (the “Fund”) is organized as a corporation under the laws of Maryland pursuant to Articles of Incorporation filed on November 23, 1982, as amended, and registered under the Investment Company Act of 1940, as amended (the “1940 Act”), as an open-end investment company. The Fund is a “series” type of mutual fund, which issues separate series of stock. Each series represents an interest in a separate portfolio of Fund investments. The Zenith Equity Portfolio (the “Asset Allocation Portfolio”) is a non-diversified series of the fund. The Asset Allocation Portfolio operates under a “fund of funds” structure, investing substantially all of its assets in other Portfolios advised by MetLife Advisers, LLC (“MetLife Advisers”) or its affiliates (each, an “Underlying Portfolio,” and, collectively, the “Underlying Portfolios”). Shares in the Fund are not offered directly to the general public and are currently available only to separate accounts established by Metropolitan Life Insurance Company (“MetLife”), New England Life Insurance Company, General American Life Insurance Company (“General American”), The MetLife Investors Group of Insurance Companies, MetLife Insurance Company of Connecticut and other affiliated insurance companies (collectively, the “Insurance Companies”) and to certain eligible qualified retirement plans (“Qualified Plans”), as an investment vehicle for variable life insurance, group annuity or variable annuity products of these insurance companies or Qualified Plans, although not all Portfolios are available to all such separate accounts and Qualified Plans.
| 2. | SIGNIFICANT ACCOUNTING POLICIES: |
The preparation of financial statements in conformity with accounting principles generally accepted in the United States of America (“GAAP”) requires management to make estimates and assumptions that affect the reported amounts of assets and liabilities and disclosure of contingent assets and liabilities as of the date of the financial statements and the reported amounts of income and expenses during the reporting period. Actual results could differ from those estimates.
The following is a summary of significant accounting policies consistently followed by the Asset Allocation Portfolio in the preparation of its financial statements. The policies are in conformity with GAAP.
Investment Valuation:
The net asset value of the Asset Allocation Portfolio is calculated based on the net asset values of the Underlying Portfolios in which the Asset Allocation Portfolio invests. The Underlying Portfolios that are series of the Fund will use fair value pricing in the circumstances and manner described below.
The Underlying Portfolios are valued as follows:
Debt securities (other than short term obligations with a remaining maturity of sixty days or less) are generally valued on the basis of evaluated or composite bid quotations obtained by independent pricing services and/or brokers and dealers selected by the relevant subadviser pursuant to authorization of the Board of Directors of the Fund (the “Board” or “Directors”). Such quotations take into account appropriate factors such as institutional-sized trading in similar groups of securities, yield, quality, coupon rate, maturity, type of issue, trading characteristics and other data. Short term obligations with a remaining maturity of sixty days or less are valued at amortized cost which approximates fair market value.
Equity securities traded on a national securities exchange or other exchanges are valued at their last sale price on the principal trading market. Equity securities traded on the NASDAQ National Market System are valued at the NASDAQ Official Closing Price (the “NOCP”). The NOCP is the last reported sale price if the last reported sale price falls between the spread of the last reported bid and asked prices. If the last reported bid and asked prices are above the last reported sale price, the NOCP will be the last reported bid price. If the last reported bid and asked prices are below the last reported sale price, the NOCP will be the last reported asked price. Equity securities traded on a national securities exchange or other exchanges or on the NASDAQ National Market System for which there is no reported sale during the day are valued at the last reported bid price. A security that is listed or traded on more than one exchange is valued at the quotation on the exchange determined to be the primary market for that security by the Board or its delegates. If no closing price is available, then such securities are valued by using the last reported bid price. Equity securities traded over-the-counter are valued at the last reported sales price.
If no current market value quotation is readily available or reliable for a portfolio security, fair value will be determined in accordance with procedures established by and under the general supervision of the Board. When an Underlying Portfolio uses fair value pricing, it may take into account any factors it deems appropriate. The value of securities used by the Portfolio to calculate its net asset value may differ from quoted or published prices for the same securities. Fair value pricing involves subjective judgments and the fair value determined for a security may be materially different than the value that could be realized upon the sale of that security.
The Underlying Portfolios expect to use fair value pricing for securities primarily traded on U.S. exchanges only under very limited circumstances. For example, the Underlying Portfolios may use fair value pricing if the exchange on which a security is traded closes early or trading in the security is suspended.
MSF-9
Metropolitan Series Fund, Inc.
Zenith Equity Portfolio
Notes to Financial Statements—December 31, 2008—(Continued)
Securities traded primarily on an exchange outside of the United States which closes before the close of the New York Stock Exchange will be valued at the last sales price on that non-U.S. exchange. Securities traded primarily on an exchange outside of the United States for which there is no reported sale during the day are valued at the mean between the last reported bid and asked prices. However, because most foreign markets close well before the Underlying Portfolios value their securities (typically at 4 p.m. Eastern Time), the earlier close of these foreign markets gives rise to the possibility that significant events, including broad market moves, may have occurred after these foreign markets close but before the Underlying Portfolios value their securities. To account for this, the Underlying Portfolios may frequently value many of the Underlying Portfolios’ foreign equity securities using fair value prices based on third party vendor modeling tools.
Forward foreign currency exchange contracts are valued based on the mean between closing bid and asked prices of the forward currency contract rates in the London foreign exchange markets on a daily basis as provided by a reliable bank or dealer.
Options, whether on securities, indices, futures contracts, or otherwise, are valued at the last sales price available as of the close of business on the day of valuation or, if there is no such sale price available, at the mean between the bid and asked prices. Options on currencies are valued at the spot price each day.
The value of futures contracts will be the sum of the margin deposit plus or minus the difference between the value of the futures contract on each day the net asset value is calculated and the value on the date the futures contract originated, value being that established on a recognized commodity exchange, or by reference to other customary sources, with gain or loss being realized when the futures contract closes or expires.
Subject to the Board’s oversight, the Board has delegated the day-to-day oversight of pricing matters, including determinations in good faith under the Fund’s procedures the fair value of securities for which current market quotations are not readily available to MetLife Advisers, LLC (“MetLife Advisers” or the “Adviser”) or the subadviser of the Underlying Portfolio, as applicable.
Investment Transactions and Related Investment Income:
Portfolio security transactions are recorded on the trade date. Dividend income is recorded on the ex-dividend date. Interest income is recorded on the accrual basis. Realized gains and losses on investments and unrealized appreciation and depreciation are determined on the identified cost basis, which is the same basis used for federal income tax purposes.
Federal Income Taxes:
It is the Portfolio’s policy to comply with the requirements of the Internal Revenue Code of 1986, as amended (the “Code”), and regulations thereunder, applicable to regulated investment companies and to distribute, with respect to each taxable year, all of its taxable income to shareholders. Therefore, no federal income tax provision is required. The Portfolio is subject to the provisions of the Financial Accounting Standards Board Interpretation (“FASB”) No. 48, Accounting for Uncertainties in Income Taxes (FIN 48). FIN 48 sets forth a minimum threshold for financial statement recognition of the benefit of a tax position taken or expected to be taken in a tax return. The implementation of FIN 48 did not result in any unrecognized tax benefits in the accompanying financial statements. Each of the Portfolio’s federal tax returns for the prior three fiscal years remains subject to examination by the Internal Revenue Service.
As of December 31, 2008, the Asset Allocation Portfolio had no capital loss carryforwards.
Pursuant to Section 852 of the Code, the Portfolio designated the amount shown below under Long Term Gain as capital gain dividends for its taxable year ended December 31, 2008. The tax character of distributions paid for the periods ended December 31, 2008 and 2007 was as follows:
| | | | | | | | | | | | | | | | | | | | | | |
| Ordinary Income | | Long Term Gain | | Return of Capital | | Total |
| 2008 | | 2007 | | 2008 | | 2007 | | 2008 | | 2007 | | 2008 | | 2007 |
| $ | 18,168,336 | | $ | 6,947,399 | | $ | 4,644,866 | | $ | — | | $ | — | | $ | — | | $ | 22,813,202 | | $ | 6,947,399 |
As of December 31, 2008, the components of distributable earnings (accumulated losses) on a federal income tax basis were as follows:
| | | | | | | | | | | | | | | |
Undistributed
Ordinary
Income | | Undistributed
Long Term
Gain | | Unrealized
Depreciation | | | Loss
Carryforwards | | Total | |
| $ | 26,880,564 | | $ | 66,815,967 | | $ | (228,712,001 | ) | | $ | — | | $ | (135,015,470 | ) |
Pursuant to Federal income tax regulations applicable to investment companies, the Portfolio has elected to treat net capital losses realized between November 1 and December 31 of each year as occurring on the first day of the following tax year. For the
MSF-10
Metropolitan Series Fund, Inc.
Zenith Equity Portfolio
Notes to Financial Statements—December 31, 2008—(Continued)
year ended December 31, 2008, the following amounts of realized capital and currency losses reflected in the accompanying financial statements will not be recognized for Federal income tax purposes until January 1, 2009:
| | | | |
Currency | | Capital | |
$— | | $ | (5,527,456 | ) |
Dividends and Distributions to Shareholders:
The Asset Allocation Portfolio records dividends and distributions on the ex-dividend date. Net realized gains from security transactions (if any) are generally distributed annually to shareholders. The timing and characterization of certain income and capital gains distributions are determined in accordance with federal tax regulations that may differ from GAAP. Permanent book and tax basis differences relating to shareholder distributions will result in reclassification between under/over distributed net investment income, accumulated net realized gains/losses and paid in capital.
| 3. | INVESTMENT TRANSACTIONS: |
For the year ended December 31, 2008, purchases and sales of Underlying Portfolios by the Zenith Equity Portfolio were $111,412,243 and $117,905,230, respectively.
| 4. | INVESTMENT MANAGEMENT FEES AND OTHER TRANSACTIONS WITH AFFILIATES: |
Investment Management Agreement:
MetLife Advisers is the investment adviser to the Asset Allocation Portfolio. The Asset Allocation Portfolio does not directly pay MetLife Advisers an investment advisory fee for its services, but indirectly pays MetLife Advisers an investment advisory fee through its investments in the Underlying Portfolios.
Certain officers and directors of the Fund may also be officers of MetLife Advisers; however, such officers and directors receive no compensation from the Fund.
| 5. | RECENT ACCOUNTING PRONOUNCEMENTS: |
In March 2008, the FASB issued Statement of Financial Accounting Standards No. 161, Disclosures about Derivative Instruments and Hedging Activities (“FAS 161”), an amendment of FASB Statement No. 133. FAS 161 requires enhanced disclosures about (a) how and why an entity uses derivative instruments, (b) how derivative instruments and hedging activities are accounted for, and (c) how derivative instruments and related hedging activities affect a fund’s financial position, financial performance, and cash flows. Management does not believe the adoption of FAS 161 will materially impact the financial statement amounts, but will require additional disclosures. This will include qualitative and quantitative disclosures on derivative positions existing at period end and the effect of using derivatives during the reporting period. FAS 161 is effective for financial statements issued for fiscal years and interim periods beginning after November 15, 2008. Management is currently evaluating the impact the adoption of FAS 161 will have on the Portfolio’s financial statement disclosures.
| 6. | TRANSACTIONS IN SECURITIES OF AFFILIATED ISSUERS: |
The Asset Allocation Portfolio does not invest in the Underlying Portfolios for the purpose of exercising management or control; however, investments by the Asset Allocation Portfolio within its principal investment strategies may represent a significant portion of the Underlying Portfolio’s net assets. Transactions in the Underlying Portfolios during the year ended December 31, 2008 in which the Asset Allocation Portfolio had ownership of at least 5% of the outstanding voting securities during the period are as follows:
| | | | | | | | | | | | | |
Underlying Portfolio (Class A) | | Beginning Shares
as of
12/31/2007 | | | Shares
Purchased
during Period | | Shares Sold
during Period | | Ending Shares
as of
12/31/2008 |
Metropolitan Series Fund, Inc.—Capital Guardian U.S. Equity | | | 22,154,374 | | | | 4,653,736 | | | 3,501,087 | | | 23,307,023 |
Metropolitan Series Fund, Inc.—FI Value Leaders | | | 1,467,259 | | | | 222,018 | | | 246,651 | | | 1,442,626 |
Metropolitan Series Fund, Inc.—Jennison Growth | | | 21,266,895 | | | | 2,631,460 | | | 4,615,463 | | | 19,282,892 |
| | | | |
Underlying Portfolio (Class A) | | Realized
Gain/(Loss)
during Period | | | Capital Gains
Distributions
during Period | | Dividend Income
during Period | | Ending Value
as of
12/31/2008 |
Metropolitan Series Fund, Inc.—Capital Guardian U.S. Equity | | $ | (2,953,650 | ) | | $ | 29,957,602 | | $ | 2,643,945 | | $ | 150,796,440 |
Metropolitan Series Fund, Inc.—FI Value Leaders | | | (872,846 | ) | | | 23,585,242 | | | 4,341,312 | | | 153,654,140 |
Metropolitan Series Fund, Inc.—Jennison Growth | | | 3,462,599 | | | | 20,053,943 | | | 5,815,437 | | | 150,599,388 |
MSF-11
Metropolitan Series Fund, Inc.
Zenith Equity Portfolio
Report of Independent Registered Public Accounting Firm
To the Shareholders and Board of Directors of Metropolitan Series Fund, Inc.:
We have audited the accompanying statement of assets and liabilities, including the schedule of investments, of the Zenith Equity Portfolio (one of the portfolios constituting the Metropolitan Series Fund, Inc.) (the “Fund”) as of December 31, 2008, and the related statement of operations for the year then ended, the statements of changes in net assets for each of the two years in the period then ended, and the financial highlights for each of the five years in the period then ended. These financial statements and financial highlights are the responsibility of the Fund’s management. Our responsibility is to express an opinion on these financial statements and financial highlights based on our audits.
We conducted our audits in accordance with the standards of the Public Company Accounting Oversight Board (United States). Those standards require that we plan and perform the audit to obtain reasonable assurance about whether the financial statements and financial highlights are free of material misstatement. The Fund is not required to have, nor were we engaged to perform, an audit of its internal control over financial reporting. Our audits included consideration of internal control over financial reporting as a basis for designing audit procedures that are appropriate in the circumstances, but not for the purpose of expressing an opinion on the effectiveness of the Fund’s internal control over financial reporting. Accordingly, we express no such opinion. An audit also includes examining, on a test basis, evidence supporting the amounts and disclosures in the financial statements, assessing the accounting principles used and significant estimates made by management, as well as evaluating the overall financial statement presentation. Our procedures included confirmation of securities owned as of December 31, 2008, by correspondence with the transfer agent. We believe that our audits provide a reasonable basis for our opinion.
In our opinion, the financial statements and financial highlights referred to above present fairly, in all material respects, the financial position of the Zenith Equity Portfolio of the Metropolitan Series Fund, Inc. as of December 31, 2008, the results of its operations for the year then ended, the changes in its net assets for each of the two years in the period then ended, and the financial highlights for each of the five years in the period then ended, in conformity with accounting principles generally accepted in the United States of America.
Deloitte & Touche LLP
Boston, Massachusetts
February 23, 2009
MSF-12
Metropolitan Series Fund, Inc.
Directors and Officers
The Fund’s Directors review actions of the Fund’s investment adviser and subadvisers, and decide upon matters of general policy. The Fund’s officers supervise the daily business operations of the Fund. The Board of Directors and the Fund’s officers are listed below. Each Director is responsible for overseeing all 38 Portfolios of the Fund. There is no limit to the term a Director may serve. Directors serve until their resignation, retirement or removal in accordance with the Fund’s organizational documents and policies adopted by the Board from time to time. Officers hold office at the pleasure of the Board or until the election or appointment and the qualification of a successor. The address of the Directors and officers is c/o Metropolitan Series Fund, Inc., 501 Boylston Street, Boston, MA 02116.
Interested Directors(1)
Each Director below is an “interested person” (as defined by the 1940 Act) with respect to the Fund in that Ms. Forget is an employee of MetLife and Mr. Typermass is a former employee of MetLife and owns securities issued by MetLife, Inc., the ultimate parent company of MetLife Advisers.
| | | | | | | | |
Name, Address and Age | | Current
position(s)
with Fund | | Position(s)
held since | | Principal occupations
over past five years, including other directorships(2) | | Number of
Portfolios in
Fund Complex
Overseen by
Director(3) |
Elizabeth M. Forget Age: 42 | | Director, Chairman of the Board, President and Chief Executive Officer | | 2006 | | Senior Vice President (since 2007), MetLife, Inc.; President, Met Investors Advisory, LLC; Trustee and President, Met Investors Series Trust; Executive Vice President, MetLife Investors Group, Inc.; President, Chief Executive Officer and Chair of the Board of Managers (since 2006), MetLife Advisers; President, Met Investors Advisory, LLC. | | 87 |
| | | | |
Arthur G. Typermass Age: 71 | | Director | | 1998 | | Formerly, Senior Vice President and Treasurer, MetLife. | | 38 |
Non-Interested Directors(1)
Each Director below is not an “interested person” (as defined by the 1940 Act) with respect to the Fund (collectively, the “Independent Directors”).
| | | | | | | | |
Name, Address and Age | | Current
position(s)
with Fund | | Position(s)
held since | | Principal occupations
over past five years, including other directorships(2) | | Number of
Portfolios in
Fund Complex
Overseen by
Director(3) |
Steve A. Garban† Age: 71 | | Director | | 1985 | | Formerly, Chief Financial Officer, Senior Vice President Finance and Operations and Treasurer (Emeritus), The Pennsylvania State University. | | 38 |
| | | | |
Linda B. Strumpf Age: 61 | | Director | | 2000 | | Vice President and Chief Investment Officer, Ford Foundation. | | 38 |
| | | | |
Michael S. Scott Morton† Age: 71 | | Director | | 1993 | | Jay W. Forrester Professor of Management (Emeritus) at Sloan School of Management, MIT. | | 38 |
| | | | |
H. Jesse Arnelle Age: 75 | | Director | | 2001 | | Formerly, Counsel, Womble Carlyle Sandrie & Rice; Director, Textron Inc. (global multi- industry company)*; formerly, Director, Gannet Co. Inc. (diversified news and information company)*; formerly, Director, Eastman Chemical Company (global chemical company)*; formerly, Director, Waste Management, Inc.*; formerly, Director, Armstrong Holdings Inc. (parent company of floor and ceiling products business)*; formerly, Director, FPL Group Inc. (public utility holding company)*; Director, URS Corporation (engineering design services firm)*. | | 38 |
MSF-13
Metropolitan Series Fund, Inc.
Directors and Officers—(Continued)
| | | | | | | | |
Name, Address and Age | | Current
position(s)
with Fund | | Position(s)
held since | | Principal occupations
over past five years, including other directorships(2) | | Number of
Portfolios in
Fund Complex
Overseen by
Director(3) |
Nancy Hawthorne Age: 57 | | Director | | 2003 | | Chief Executive Officer, Clerestory LLC (corporate financial advisor); Director, Avid Technologies (computer software company)*; formerly, Chairman of the Board of Avid Technologies; formerly, Board of Advisors, L. Knife & Sons, Inc. (beverage distributor); formerly, Trustee, New England Zenith Fund (“Zenith Fund”)**; formerly, Chief Executive Officer and Managing Partner, Hawthorne, Krauss and Associates (corporate financial advisor); formerly, Chief Financial Officer and Executive Vice President, Continental Cablevision, subsequently renamed MediaOne (cable television company); formerly, Director, Life F/X, Inc.; formerly, Chairman of the Board, WorldClinic (distance medicine company); formerly, Director, Perini Corporation (construction company)*; formerly, Director, CGU (property and casualty insurance company); formerly, Director, Beacon Power Corporation (energy company)*. | | 38 |
| | | | |
John T. Ludes Age: 72 | | Director | | 2003 | | President, LFP Properties (consulting firm); Formerly, Trustee, Zenith Fund**; formerly, Vice Chairman, President and Chief Operating Officer, Fortune Brands/American Brands (global conglomerate); formerly, President and CEO, Acushnet Company (athletic equipment company). | | 38 |
Officers(1)
| | | | | | | | |
Name and address | | Age | | Current
position(s)
with Fund | | Position(s)
held since | | Principal occupations over past five years(2) |
| Jeffrey L. Bernier | | 37 | | Senior Vice President | | 2008 | | Vice President (since 2008), MetLife, Inc.; Vice President (since 2008), MetLife; Senior Vice President (since 2008), MetLife Advisers; formerly, Director and Senior Investment Analyst (2004 to 2007), John Hancock Financial Services; formerly, Assistant Vice President (2000 to 2001), Wachovia Securities. |
| | | | |
| Alan C. Leland | | 56 | | Senior Vice President | | 2005 | | Treasurer and Chief Financial Officer, MetLife Advisers, LLC; Treasurer (since 2005), Met Investors Advisory, LLC; Vice President (since 2004), Met Investors Advisory, LLC; Vice President (since 2003), MetLife, Inc.; Vice President, MetLife; Senior Vice President, NELICO. |
| | | | |
| Peter Duffy | | 53 | | Vice President
and Treasurer | | 2000 | | Senior Vice President, MetLife Advisers; Second Vice President (since 2003), NELICO; Vice President, MetLife (since 2004); Vice President (since 2004), MetLife, Inc.; formerly, Vice President and Treasurer, Zenith Fund**. |
| | | | |
| Jeffrey P. Halperin | | 41 | | Chief
Compliance Officer | | 2007 | | Vice President (since 2006), MetLife, Inc.; Vice President (since 2006), MetLife; Chief Compliance Officer (since 2006), Met Investors Series Trust, MetLife Advisers, Met Investors Advisory, LLC and MetLife Investment Advisors Company, LLC. |
| * | Indicates a directorship with a registered investment company or a company subject to the reporting requirements of the Securities Exchange Act of 1934, as amended. |
| ** | The Zenith Fund deregistered with the Securities and Exchange Commission (“SEC”) in 2004. |
| (†) | Served as a trustee, director and/or officer of one or more of the following companies, each of which had a direct or indirect advisory relationship with MetLife Advisers or its affiliates prior to January 31, 2005: State Street Research Financial Trust, State Street Research Income Trust, State Street Research Money Market Trust, State Street Research Institutional Funds, State Street Research Capital Trust, State Street Research Master Investment Trust, State Street Research Equity Trust, State Street Research Securities Trust and State Street Research Exchange Trust (collectively, the “State Street Research Funds”). |
| (1) | During the period shown, each Director of the Fund served as a Trustee of Metropolitan Series Fund II, a registered investment company that ceased investment operations in June of 2008 and has applied for deregistration under the Investment Company Act of 1940. During this period, each officer of the Fund served in the same position with Metropolitan Series Fund II. |
| (2) | Previous positions during the past five years with the Fund; Met Investors Series Trust; MetLife; MetLife, Inc.; MetLife Advisers; Met Investors Advisory, LLC; Zenith Fund; NELICO; or New England Securities Corporation are omitted if not materially different. |
| (3) | The Fund Complex includes the Fund (38 portfolios) and Met Investors Series Trust (49 portfolios). |
MSF-14
Metropolitan Series Fund, Inc.
Zenith Equity Portfolio
Board Approval of Advisory and Subadvisory Agreements
The Fund’s Contract Review Committees of the Board of Directors (the “Board” or the “Directors”) typically meet in early fall to review the Portfolios’ advisory agreements (the “Advisory Agreements”) and subadvisory agreements (the “Subadvisory Agreements,” and, together with the Advisory Agreements, the “Agreements”) and determine whether to recommend that the full Board approve the continuation of the Agreements for an additional one-year period. (Following the initial approval of an Agreement for a new Portfolio or with a new adviser or subadviser, such annual reviews are not required until 2 years following the execution of such Agreement.) After each Committee has made its recommendations, the full Board, including the Independent Directors, determines whether to approve the continuation of each of the Agreements. In addition, the Board, including the Independent Directors, considers matters bearing on the Agreements at most of its other meetings throughout the year and regularly interviews various individuals at MetLife Advisers responsible for the management of the Portfolios. The Directors also interview selected investment managers and other professionals at the subadvisers at various times throughout the year.
The Directors receive all materials that they or MetLife Advisers, the Fund’s investment adviser, and the subadvisers believe to be reasonably necessary for the Directors to evaluate the Agreements and determine whether to approve the continuation of the Agreements. These materials generally include, among other items, (i) information on the investment performance of the Portfolios and the performance of peer groups of funds and the Portfolios’ performance benchmarks, (ii) information on the Portfolios’ advisory and subadvisory fees and other expenses, including information comparing the Portfolios’ expenses to those of peer groups of funds and information about any applicable expense caps and fee “breakpoints,” (iii) sales and redemption data, (iv) information related to the profitability of the Agreements to MetLife Advisers and certain of the subadvisers, and potential “fall-out” or ancillary benefits that MetLife Advisers, the subadvisers or their affiliates may receive as a result of their relationships with the Fund and (v) information obtained through the subadvisers’ responses to certain requests from MetLife Advisers and the Directors and MetLife Advisers’ responses to requests from the Directors. The Directors may also consider other information such as (vi) MetLife Advisers’ and the subadvisers’ financial results and condition, (vii) each Portfolio’s investment objectives and strategies and the size, education and experience of the investment staffs of MetLife Advisers and the relevant subadvisers and their use of technology and external research, (viii) the allocation of the Portfolios’ brokerage, if any, including allocations to brokers affiliated with the subadvisers and the use of “soft” commission dollars to pay Portfolio expenses and to pay for research and other similar services, (ix) the resources devoted to, and the record of compliance with, the Portfolios’ investment policies and restrictions, policies on personal securities transactions and other compliance policies, (x) the responses of MetLife Advisers, the subadvisers and/or their affiliates to certain legal and regulatory proceedings and (xi) the economic outlook generally and for the mutual fund industry in particular. Throughout the process, the Directors have the opportunity to ask questions of and request additional materials from MetLife Advisers and the subadvisers.
Following meetings of each Contract Review Committee on September 10, 2008, the Board, including the Independent Directors, at its November 6-7, 2008 meeting, approved the continuation through December 31, 2009 of the Advisory Agreements for each Portfolio of the Fund and the Subadvisory Agreements for each Portfolio other than the Zenith Equity Portfolio and Asset Allocation Portfolios (which do not have subadvisers) and the Van Eck Global Natural Resources Portfolio, Met/Dimensional International Small Cap Portfolio and Loomis Sayles Small Cap Growth Portfolio (formerly known as the Franklin Templeton Small Cap Growth Portfolio). The Agreements approved for continuation are referred to below as the “Continued Agreements.”
In considering whether to approve the continuation of the Continued Agreements, the Directors, including the Independent Directors, did not identify any single factor as determinative, and each weighed the various factors as he or she deemed appropriate. The Directors considered the following matters in connection with their approval of the Continued Agreements:
The nature, extent and quality of the services provided to the relevant Portfolios under the Continued Agreements. The Directors considered the nature, extent and quality of the services provided by MetLife Advisers, the relevant subadvisers (if any) and their affiliates (each, an “Adviser,” and, collectively, the “Advisers”) to the relevant Portfolios pursuant to the Continued Agreements and the resources dedicated to these Portfolios by the Advisers. In particular, the Directors considered the Advisers’ abilities to attract and retain highly qualified investment professionals. With respect to MetLife Advisers, the Directors considered (for each Portfolio other than the Zenith Equity and Asset Allocation Portfolios) that MetLife Advisers is (i) ultimately responsible for the performance of such Portfolios; (ii) ultimately responsible for the establishment of the investment strategies of each such Portfolio, primarily through its recommendations to the Board regarding the hiring and selection of subadvisers; (iii) responsible for the hiring and selection, subject to Board approval, of subadvisers; and (iv) responsible for maintaining a program of Subadviser oversight reasonably designed to ensure that the subadvisers have reasonable compliance policies and procedures in place. The Directors also considered that MetLife Advisers provides a full range of day-to-day administrative services for the Portfolios involving all aspects of such Portfolios’ day-to-day operations (other than portfolio management). With respect to the Zenith Equity and Asset Allocation Portfolios, the Directors considered both the portfolio management services and the administrative services provided by MetLife Advisers. After reviewing
MSF-15
Metropolitan Series Fund, Inc.
Zenith Equity Portfolio
Board Approval of Advisory and Subadvisory Agreements—(Continued)
these and related factors, the Directors concluded, within the context of their overall conclusions regarding each of the Continued Agreements, that the nature, extent and quality of services provided supported the renewal of these Agreements.
Investment performance of the relevant Portfolios. The Directors reviewed information about the performance of the relevant Portfolios over various time periods, including information prepared by an independent third party that compared the performance of the Portfolios to the performance of peer groups of funds and performance benchmarks. The Directors also reviewed a description of the third party’s methodology for identifying a Portfolio’s peer group(s) for purposes of performance and expense comparisons.
In the case of each relevant Portfolio that had performance that lagged its peer group(s) for certain periods, the Directors concluded that other factors relevant to performance were sufficient, in light of other considerations, to warrant renewal of the Continued Agreements relating to such Portfolio. These factors varied from Portfolio to Portfolio, but included one or more of the following: (i) that such Portfolio’s performance, although lagging in certain recent periods, was stronger over the longer term; (ii) that the underperformance was attributable, to a significant extent, to investment decisions that were reasonable and consistent with the Portfolio’s investment objective(s) and policies and that the Portfolio was performing within the range of reasonable expectations, given market conditions and the Portfolio’s investment objective(s) and policies; (iii) that the Portfolio’s performance was competitive when compared to other relevant performance benchmarks or peer groups; and (iv) that MetLife Advisers and/or the relevant subadviser (if any) had taken or was taking steps designed to help improve the Portfolio’s investment performance (including, in the case of certain Portfolios, that MetLife Advisers was formulating possible proposals, for presentation to the Board in November 2008, to replace the Portfolio’s subadviser or to merge the Portfolio into another Portfolio with a similar investment objective and better investment performance).
The Directors also considered the investment performance of the Advisers and their reputations generally, the historical responsiveness of the Advisers to Director concerns about performance and the willingness of the Advisers to take steps intended to improve performance.
After reviewing these and related factors, the Directors concluded, within the context of their overall conclusions regarding each of the Continued Agreements, that the investment performance of each relevant Portfolio and Adviser was sufficient, in light of other considerations, to warrant the renewal of the Continued Agreements.
The costs of the services to be provided and profits to be realized by the Advisers and their affiliates from their relationships with the Portfolios. The Directors considered the fees charged by MetLife Advisers to the Portfolios for advisory services and, with respect to the subadvised Portfolios, by such subadvisers to MetLife Advisers for subadvisory services (such advisory and subadvisory fees (if any), collectively, “Fees”), as well as the total expense levels of the Portfolios. This information included comparisons (provided by an independent third party) of the Portfolios’ advisory fees and total expense levels to those of their peer groups. In evaluating Fees for the relevant Portfolios, the Directors also took into account the demands, complexity and quality of the investment management services provided to each Portfolio. The Directors considered MetLife Advisers’ recommendations regarding reductions in Fee rates, implementation of Fee breakpoints and institution of Fee waivers and expense caps.
The Directors also considered the compensation directly or indirectly received by the Advisers and their affiliates from their relationships with the relevant Portfolios. The Directors reviewed information relating to the profits received by MetLife Advisers, certain of the subadvisers and their affiliates as a result of their relationships with the relevant Portfolios, and information about the allocation of expenses used to calculate profitability. When reviewing profitability, the Directors also considered the performance of the relevant Portfolios, the expense levels of such Portfolios and whether the relevant Advisers had implemented breakpoints, fee waivers and/or expense caps with respect to such Portfolios.
After reviewing these and related factors, the Directors concluded, within the context of their overall conclusions regarding each of the Continued Agreements, that the Fees charged to each of the relevant Portfolios were fair and reasonable, and that the information provided regarding costs of these services generally, and the related profitability (if known) to the relevant Advisers of their relationships with the relevant Portfolios, supported the renewal of the Continued Agreements.
Economies of Scale. The Directors considered the existence of any economies of scale in the provision of services by the Advisers and whether those economies were shared with the relevant Portfolios through breakpoints in their advisory fees or other means, such as expense caps, fee waivers or relatively low levels of fees. The Directors noted that most of the relevant Portfolios benefited or will benefit from breakpoints, expense caps and/or fee waivers with respect to their advisory fees. In considering these issues, the Directors also took into consideration information relating to the costs of the services provided and the profitability to MetLife Advisers, the relevant subadvisers (if any) and each of their affiliates of their relationships with the relevant Portfolios, as discussed above.
MSF-16
Metropolitan Series Fund, Inc.
Zenith Equity Portfolio
Board Approval of Advisory and Subadvisory Agreements—(Continued)
After reviewing these and related factors, the Directors concluded, within the context of their overall conclusions regarding each of the Continued Agreements, that the extent to which economies of scale were shared with the relevant Portfolios supported the renewal of such Agreements.
Other Factors. The Directors also considered other factors, which included but were not limited to the following:
| | • | | the extent to which each relevant Portfolio operated in accordance with its investment objective, and its record of compliance with its investment restrictions and the compliance programs of the Fund and the Advisers. They also considered the compliance-related resources the Advisers and their affiliates provide to the relevant Portfolios; |
| | • | | the nature, quality, cost and extent of administrative and shareholder services performed by MetLife Advisers and its affiliates under the Advisory Agreements; and |
| | • | | so-called “fall-out benefits” to the Advisers, such as the engagement of their affiliates to provide distribution, brokerage and transfer agency services to the Portfolios, and the benefits of research made available to the relevant Advisers by reason of brokerage commissions generated by the relevant Portfolios’ securities transactions. The Directors also considered the possible conflicts of interest associated with these fall-out and other benefits, and the reporting and other processes in place to disclose and monitor these possible conflicts of interest. |
Based on their evaluation of all factors that they deemed to be material, including those factors described above, and assisted by the advice of independent counsel, the Directors, including the Independent Directors, concluded that each of the Continued Agreements should be continued through December 31, 2009.
MSF-17
A description of the policies and procedures that the Fund uses to determine how to vote proxies relating to portfolio securities is available (i) without charge, upon request, by calling (800) 638-7732 and (ii) on the Securities and Exchange Commission’s (the “SEC”) website at http://www.sec.gov.
Information regarding how the Fund voted proxies relating to portfolio securities during the most recent twelve-month period ended December 31, 2008 is available (i) without charge, upon request, by calling (800) 638-7732 and (ii) on the SEC’s website at http://www.sec.gov.
The Fund’s Statement of Additional Information includes additional information about the Directors of the Fund and is available (i) without charge, upon request, by calling (800) 638-7732 and (ii) on the SEC’s website at http://www.sec.gov.
The Fund files with the SEC a complete schedule of its portfolio holdings, as of the close of the first and third quarters of its fiscal year, on “Form N-Q”. These filings are available on the SEC’s website at www.sec.gov and may be reviewed and copied at the SEC’s Public Reference Room in Washington, DC. (Call 1-800-SEC-0330 for information on the operation of the Public Reference Room.)
MSF-18
As of December 31, 2008, the registrant has adopted a “code of ethics” (as such term is defined in the instructions to Item 2 of Form N-CSR) that applies to the registrant’s principal executive officer and principal financial and accounting officer. There were no substantive amendments or waivers to this code of ethics during the period covered by this report.
| Item 3. | Audit Committee Financial Expert. |
The registrant’s Board of Directors has determined that Steve A. Garban, John T. Ludes and Linda B. Strumpf are “audit committee financial experts” (as such term is defined in the instructions to Item 3 of Form N-CSR). Each of these individuals is “independent” for purposes of Item 3 of Form N-CSR.
| Item 4. | Principal Accountant Fees and Services. |
(a) – (d)
Fees for Services Rendered to the Registrant
| | | | | | | | | | | | |
Fiscal Year | | Audit Fees | | Audit - Related Fees | | Tax Fees | | All Other Fees |
2007 | | $ | 902,800 | | $ | 36,000 | | $ | 111,000 | | $ | 0 |
2008 | | $ | 990,800 | | $ | 53,200 | | $ | 292,000 | | $ | 0 |
Audit-Related Fees represent fees for services rendered to the registrant (i) for security valuation testing in connection with the registrant’s semi-annual report for the periods ended June 30, 2007 and June 30, 2008 respectively; and (ii) related to reorganizations involving certain portfolios of the Registrant.
Tax Fees represent fees for services rendered to the registrant for tax return preparation and review of and participation in determining required income and capital gains distributions.
There were no fees required to be approved pursuant to paragraph (c)(7)(ii) of Rule 2-01 of Regulation S-X.
(e)(1) The registrant’s Audit Committee has established pre-approval procedures pursuant to paragraph (c)(7)(i)(B) of Rule 2-01 of Regulation S-X, which include regular pre-approval procedures and interim pre-approval procedures. Under the regular pre-approval procedures, the Audit Committee pre-approves at its regularly scheduled meetings audit and non-audit services that are required to be pre-approved under paragraph (c)(7) of Rule 2-01 of Regulation S-X. Under the interim pre-approval procedures, any member of the Audit Committee who is an independent Director is authorized to pre-approve proposed services that arise between regularly scheduled Audit Committee meetings and that need to commence prior to the next regularly scheduled Audit Committee meeting. Such Audit Committee member must report to the Audit Committee at its next regularly scheduled meeting on the pre-approval decision.
(e)(2) Not applicable.
(f) Not applicable.
(g)
| | | |
Fiscal Year | | Aggregate
Non-Audit Fees |
2007 | | $ | 4,700,000 |
2008 | | $ | 8,000,000 |
The amounts set out above represent the aggregate non-audit fees billed by the registrant’s accountant to MetLife, Inc., and include, among other non-audit fees, non-audit fees for services rendered to the registrant and rendered to the registrant’s investment adviser (not including any subadviser whose role is primarily portfolio management and is subcontracted with or overseen by another investment adviser) and any entity controlling, controlled by, or under common control with the adviser that provides ongoing services to the registrant.
(h) The Audit Committee of the registrant’s Board of Directors considered the provision of non-audit services that were rendered to the registrant’s investment adviser (not including any subadviser whose role is primarily portfolio management and is subcontracted with or overseen by another investment adviser), and any entity controlling, controlled by or under common control with the investment adviser that provides ongoing services to the registrant that were not pre-approved pursuant to paragraph (c)(7)(ii) of Rule 2-01 of Regulation S-X and concluded that such services are compatible with maintaining the principal accountant’s independence.
| Item 5. | Audit Committee of Listed Registrants |
Not applicable.
| Item 6. | Schedule of Investments. |
Included in reports to Shareholders under Item 1.
| Item 7. | Disclosure of Proxy Voting Policies and Procedures for Closed-End Management Investment Companies. |
Not applicable.
| Item 8. | Portfolio Managers of Closed-End Management Investment Companies. |
Not applicable.
| Item 9. | Purchases of Equity Securities by Closed-End Management Investment Company and Affiliated Purchasers. |
Not applicable.
| Item 10. | Submission of Matters to a Vote of Security Holders. |
There have been no material changes to the procedures by which shareholders may recommend nominees to the Board of Directors since the registrant last provided disclosure in response to this Item.
| Item 11. | Controls and Procedures. |
(a) The President and Treasurer of the registrant have concluded, based on their evaluation of the effectiveness of the registrant’s disclosure controls and procedures (as defined in Rule 30a-3(c) under the Act) as of a date within 90 days of the filing date of this report on Form N-CSR, that the design and operation of such procedures provide reasonable assurance that information required to be disclosed by the registrant in this report on Form N-CSR is recorded, processed, summarized, and reported within the time periods specified in the Securities and Exchange Commission’s rules and forms.
(b) There has been no change in the registrant’s internal controls over financial reporting (as defined in Rule 30a-3(d) under the Act) that occurred during the second fiscal quarter of the period covered by this report that has materially affected, or is reasonably likely to materially affect, the registrant’s internal control over financial reporting.
| | |
| (a)(1) | | Not applicable. |
| |
| (2) | | Certifications required by Rule 30a-2(a) under the Act. |
| |
| (3) | | Not applicable. |
| |
| (b) | | Certification required by Rule 30a-2(b) under the Act. |
SIGNATURES
Pursuant to the requirements of the Securities Exchange Act of 1934 and the Investment Company Act of 1940, the registrant has duly caused this report to be signed on its behalf by the undersigned, thereunto duly authorized.
| | | | |
| | METROPOLITAN SERIES FUND, INC. |
| | |
| | By: | | /s/ Elizabeth Forget |
| | Name: | | Elizabeth Forget |
| | Title: | | President |
| | Date: | | February 27, 2009 |
Pursuant to the requirements of the Securities Exchange Act of 1934 and the Investment Company Act of 1940, this report has been signed below by the following persons on behalf of the registrant and in the capacities and on the dates indicated.
| | | | |
| | By: | | /s/ Elizabeth Forget |
| | Name: | | Elizabeth Forget |
| | Title: | | President |
| | Date: | | February 27, 2009 |
| | |
| | By: | | /s/ Peter H. Duffy |
| | Name: | | Peter H. Duffy |
| | Title: | | Treasurer |
| | Date: | | February 27, 2009 |
EXHIBIT LIST
| | |
| Exhibit 12(a)(1): | | Code of Ethics |
| |
| Exhibit 12(a)(2)(a): | | Certification of the Principal Executive Officer required by Rule 30a-2(a) under the Act |
| |
| Exhibit 12(a)(2)(b): | | Certification of the Principal Financial Officer required by Rule 30a-2(a) under the Act |
| |
| Exhibit 12(b): | | Certification required by Rule 30a-2(b) under the Act |