
MACOM Technology Solutions Holdings (MTSI) November, 2016 Filed by MACOM Technology Solutions Holdings, Inc. pursuant to Rule 425 under the Securities Act of 1933, as amended and deemed filed pursuant to Rule 14a-12 of the Securities Exchange Act of 1934, as amended Subject Company: Applied Micro Circuits Corporation Commission File No. 000-23193

Forward-Looking Statement Safe Harbor and Use of Non-GAAP Financial Measures DISCLOSURE NOTICE: This presentation contains forward-looking statements based on MACOM management's beliefs and assumptions and on information currently available to our management. Forward-looking statements include, among others, information related to the proposed acquisition of AppliedMicro by MACOM, information concerning our stated guidance, business outlook and future results of operations, our improving product mix, our strategy for driving revenue growth, accelerating growth and expanding margins, our expectations for a ramp up in volume GaN base station production programs, our projected increase in earnings per share, our expectations for our aerospace and defense business unit, optical business or any other product line or business unit, the potential benefits and synergies, strategic plans, divestitures, cost savings, accretion, revenue, margins, market share capture, competitive position, integration and financial and business expectations associated with the acquisition of AppliedMicro, the price of the transaction with AppliedMicro, the consideration used in the transaction with AppliedMicro, the anticipated timing of closing of the acquisition of AppliedMicro, and any other statements regarding future trends, business strategies, competitive position, industry conditions, other acquisitions and their expected benefits, and market opportunities. Forward-looking statements include all statements that are not historical facts and generally may be identified by terms such as "anticipates," "believes," "could," "estimates," "expects," "intends," "may," "plans," "potential," "predicts," "projects," "seeks," "should," "will," "would" or similar expressions and the negatives of those terms. Our forward-looking statements are subject to assumptions, risks and uncertainties, and are not guarantees of future results. Risks and uncertainties related to the proposed acquisition of AppliedMicro by MACOM include, among other things, risks related to the satisfaction of the conditions to closing the acquisition (including the failure to obtain necessary regulatory approvals) in the anticipated timeframe or at all, including uncertainties as to how many of AppliedMicro’s stockholders will tender their shares in the tender offer and the possibility that the acquisition does not close; risks related to the ability to realize the anticipated benefits of the acquisition, including the possibility that the expected benefits from the proposed acquisition will not be realized or will not be realized within the expected time period; the risk that the businesses will not be integrated successfully; disruption from the transaction making it more difficult to maintain business, contractual and operational relationships; negative effects of this presentation or the consummation of the proposed acquisition on the market price of MACOM’s common stock and on MACOM’s operating results; significant transaction costs; unknown liabilities; the risk of litigation and/or regulatory actions related to the proposed acquisition; other business effects, including the effects of industry, market, economic, political or regulatory conditions; future exchange and interest rates; changes in tax and other laws, regulations, rates and policies; future business combinations or disposals; the uncertainties inherent in research and development, including the ability to sustain and increase the rate of growth in revenues for AppliedMicro’s products; and competitive developments. Actual results may differ materially from the outcomes stated or implied by our forward-looking statements based on any assumptions and other risk factors we may mention today. A further description of risks and uncertainties relating to MACOM and AppliedMicro can be found in their respective Annual Reports on Form 10-K for the fiscal years ended September 30, 2016 and March 31, 2016, respectively, and in their subsequent Quarterly Reports on Form 10-Q and Current Reports on Form 8-K, all of which are filed with the U.S. Securities and Exchange Commission (the “SEC”) and available at www.sec.gov. We make references in this presentation to certain financial information calculated on a basis other than in accordance with accounting principles generally accepted in the United States (GAAP) including non-GAAP gross margin and operating margin, non-GAAP earnings per share, non-GAAP operating income and non-GAAP adjusted revenue. These non-GAAP measures are provided as additional insight into on-going financial performance. These non-GAAP measures are provided in addition to, and not as a substitute for, or superior to, measures of financial performance prepared in accordance with GAAP. See our reconciliation of MACOM non-GAAP results to the nearest GAAP measure in the appendix provided at the end of this presentation. We have not provided a reconciliation with respect to any forward-looking non-GAAP financial data presented, because we do not have and cannot reliably estimate certain key inputs required to calculate the most comparable GAAP financial data, such as the future price per share of our common stock for purposes of calculating the value of our common stock warrant liability and share-based compensation costs, future acquisition costs, the possibility and impact of any litigation costs, changes in our GAAP effective tax rate, impairment charges and acquisition, integration and other costs related to our acquisitions, which are difficult to predict and estimate. Our fiscal year end is the Friday closest to September 30th. Fiscal year 2017 will include 52 weeks. This presentation also contains market statistics and industry data that are subject to uncertainty and are not necessarily reflective of market conditions. Although MACOM believes that these statistics and data are reasonable, they have been derived from third party sources and have not been independently verified by MACOM. All financial guidance projections referenced in this presentation were made as of November 15, 2016 or another historical date noted herein, and any references to such projections herein are not intended to reaffirm them as of any later date. Neither MACOM nor AppliedMicro assumes any obligation to update forward-looking statements contained in this presentation as the result of new information or future events or developments.
Additional Information and Where to Find It The exchange offer for the outstanding shares of AppliedMicro stock described in this presentation has not yet commenced. This presentation is for informational purposes only and is neither an offer to purchase nor a solicitation of an offer to sell shares, nor is it a substitute for any materials that MACOM and its offering subsidiary, Montana Merger Sub I, Inc. (“Purchaser”), will file with the SEC. Purchaser plans to file a Tender Offer Statement on Schedule TO, together with other related exchange offer documents, including a letter of transmittal, in connection with the offer; AppliedMicro plans to file a Recommendation Statement on Schedule 14D-9 in connection with the offer; and MACOM plans to file a Registration Statement on Form S-4 that will serve as a prospectus for MACOM stock to be issued as consideration in the offer and the acquisition. These documents will contain important information about MACOM, AppliedMicro and the acquisition. AppliedMicro stockholders are urged to read these documents carefully and in their entirety when they become available before making any decision regarding exchanging their shares. These documents will be made available to AppliedMicro stockholders at no expense to them and will also be available for free at the SEC's website at www.sec.gov. Additional copies may be obtained for free by contacting MACOM’s investor relations department at 949-224-3874 or AppliedMicro’s investor relations department at 415-217-4962. In addition to the SEC filings made in connection with the transaction, each of MACOM and AppliedMicro files annual, quarterly and current reports and other information with the SEC. You may read and copy any reports or other such filed information at the SEC public reference room at 100 F Street, N.E., Washington, D.C. 20549. Please call the SEC at 1-800-SEC-0330 for further information on the public reference room. MACOM’s and AppliedMicro’s filings with the SEC are also available to the public from commercial document-retrieval services and at the website maintained by the SEC at http://www.sec.gov.
Pure play leader in high performance analog RF, microwave, millimeterwave and photonic semiconductors Growth and richer product mix driving gross and operating margin expansion Focused R&D investments in high-growth, high-margin applications Broad catalog business of long lifecycle products serving large and diverse end markets Disciplined consolidator and proven integrator Scalable “fab-lite” manufacturing model with differentiated domestic manufacturing Increasing profitability supported by strong balance sheet Experienced management team supported by best in class operating professionals Company Highlights
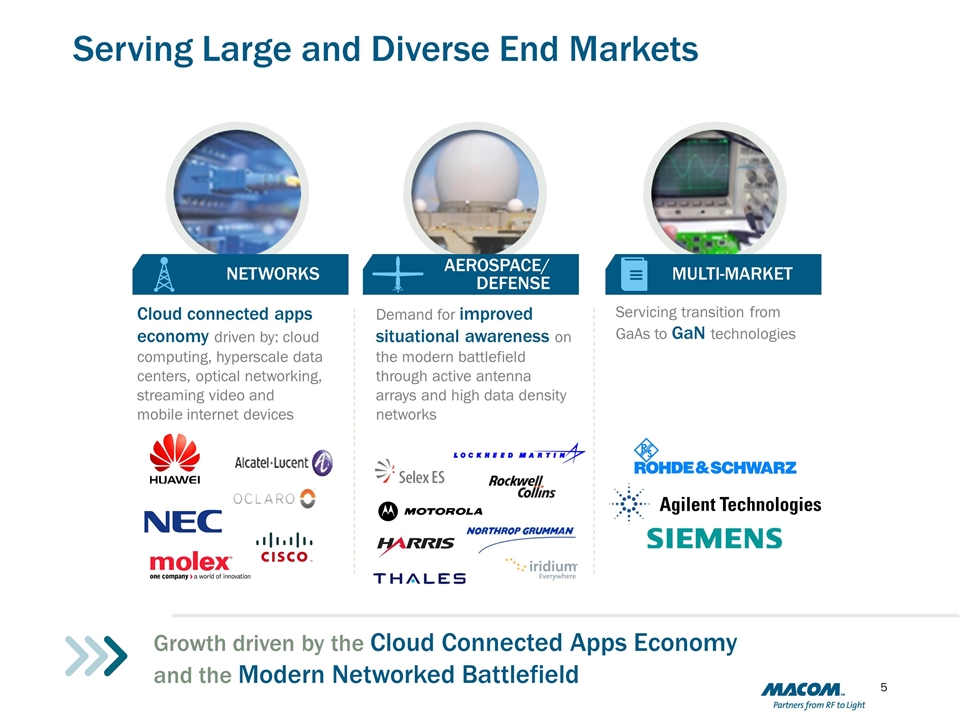
Serving Large and Diverse End Markets Cloud connected apps economy driven by: cloud computing, hyperscale data centers, optical networking, streaming video and mobile internet devices Demand for improved situational awareness on the modern battlefield through active antenna arrays and high data density networks Servicing transition from GaAs to GaN technologies Growth driven by the Cloud Connected Apps Economy and the Modern Networked Battlefield NETWORKS AEROSPACE/ DEFENSE MULTI-MARKET
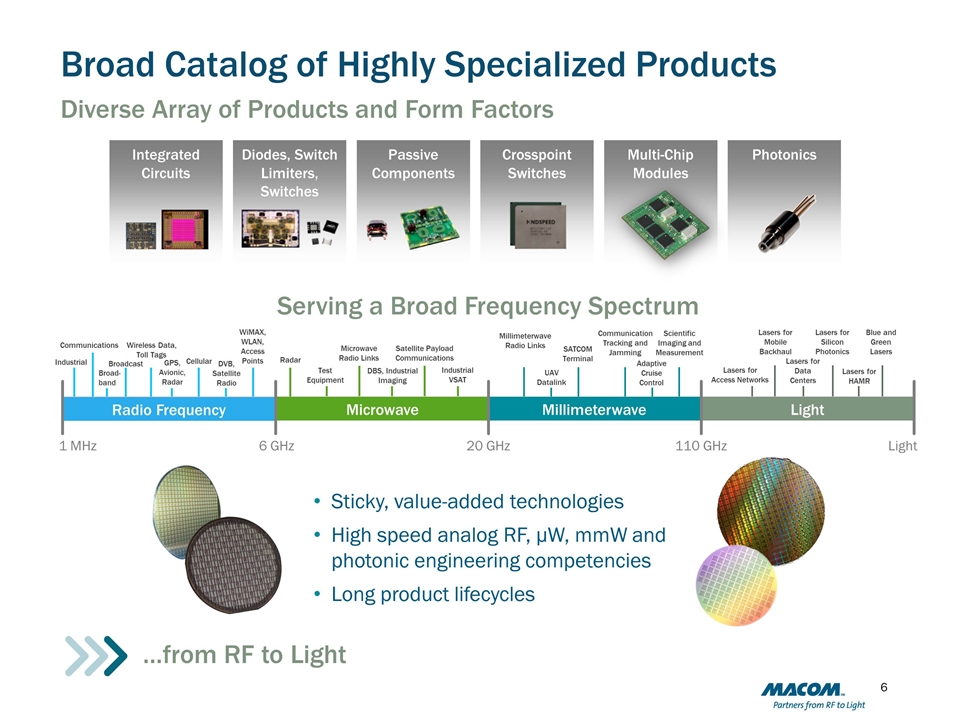
…from RF to Light Broad Catalog of Highly Specialized Products Serving a Broad Frequency Spectrum Industrial Broad-band Wireless Data, Toll Tags GPS, Avionic, Radar Cellular DVB, Satellite Radio WiMAX, WLAN, Access Points Test Equipment Microwave Radio Links DBS, Industrial Imaging Satellite Payload Communications Industrial VSAT Millimeterwave Radio Links UAV Datalink SATCOM Terminal Communication Tracking and Jamming Adaptive Cruise Control Scientific Imaging and Measurement Radar Communications Broadcast Lasers for Access Networks Lasers for Mobile Backhaul Lasers for Data Centers Lasers for Silicon Photonics Lasers for HAMR Blue and Green Lasers 1 MHz 6 GHz 20 GHz Light 110 GHz Radio Frequency Microwave Millimeterwave Light Sticky, value-added technologies High speed analog RF, μW, mmW and photonic engineering competencies Long product lifecycles Diverse Array of Products and Form Factors Integrated Circuits Diodes, Switch Limiters, Switches Passive Components Crosspoint Switches Photonics Multi-Chip Modules
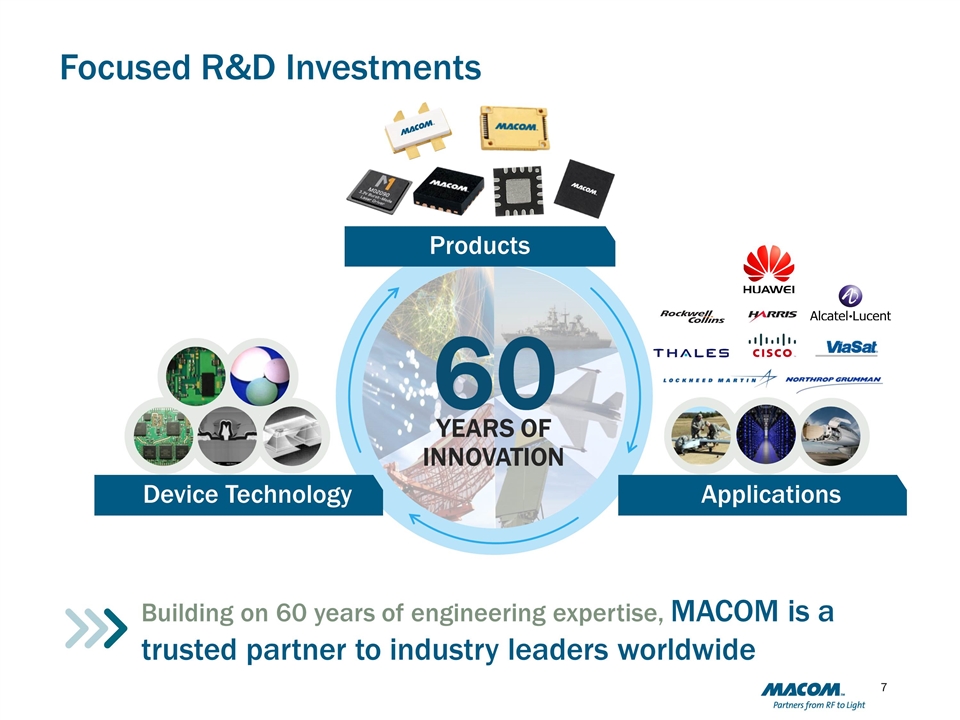
Focused R&D Investments Building on 60 years of engineering expertise, MACOM is a trusted partner to industry leaders worldwide 60 YEARS OF INNOVATION Products Device Technology Applications
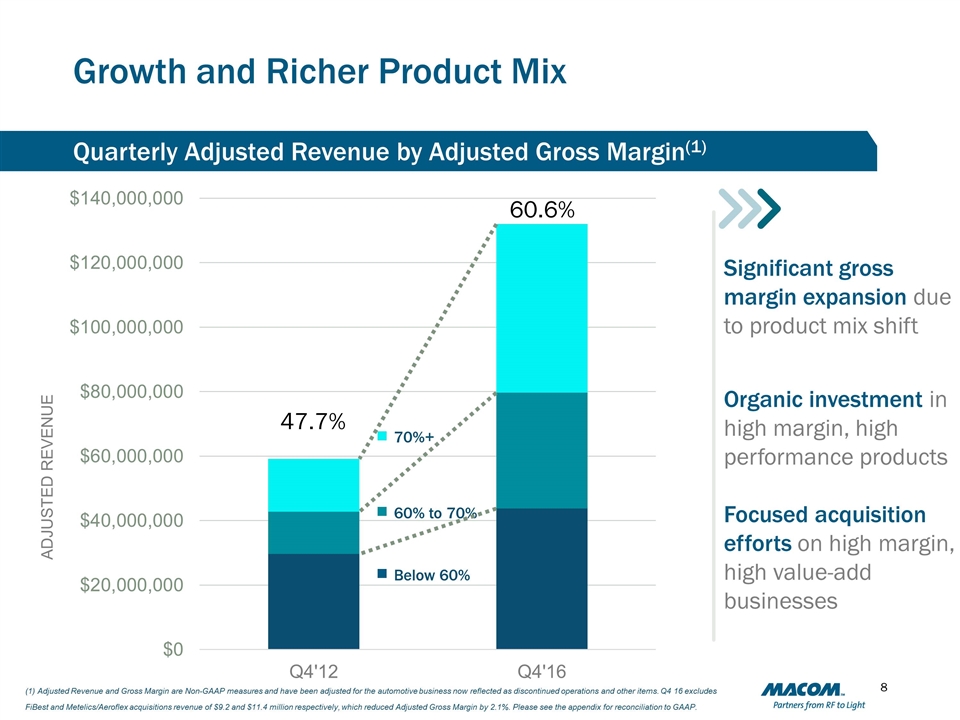
Growth and Richer Product Mix Quarterly Adjusted Revenue by Adjusted Gross Margin(1) (1) Adjusted Revenue and Gross Margin are Non-GAAP measures and have been adjusted for the automotive business now reflected as discontinued operations and other items. Q4 16 excludes FiBest and Metelics/Aeroflex acquisitions revenue of $9.2 and $11.4 million respectively, which reduced Adjusted Gross Margin by 2.1%. Please see the appendix for reconciliation to GAAP. Significant gross margin expansion due to product mix shift Organic investment in high margin, high performance products Focused acquisition efforts on high margin, high value-add businesses Below 60% 60% to 70% 70%+
Our M&A strategy is designed to: Acquire companies that expand MACOM’s footprint in adjacent markets (>$50 million purchase price) Acquire smaller product companies that accelerate MACOM’s growth strategies with products, people and intellectual property (<$30 million purchase price) Investments in exchange for licensed Patents and Intellectual Property to design new products that MACOM will bring to market in a specific field of use Target neutral to accretive in year 1 Disciplined Consolidator and Proven Integrator *EPS is Non-GAAP
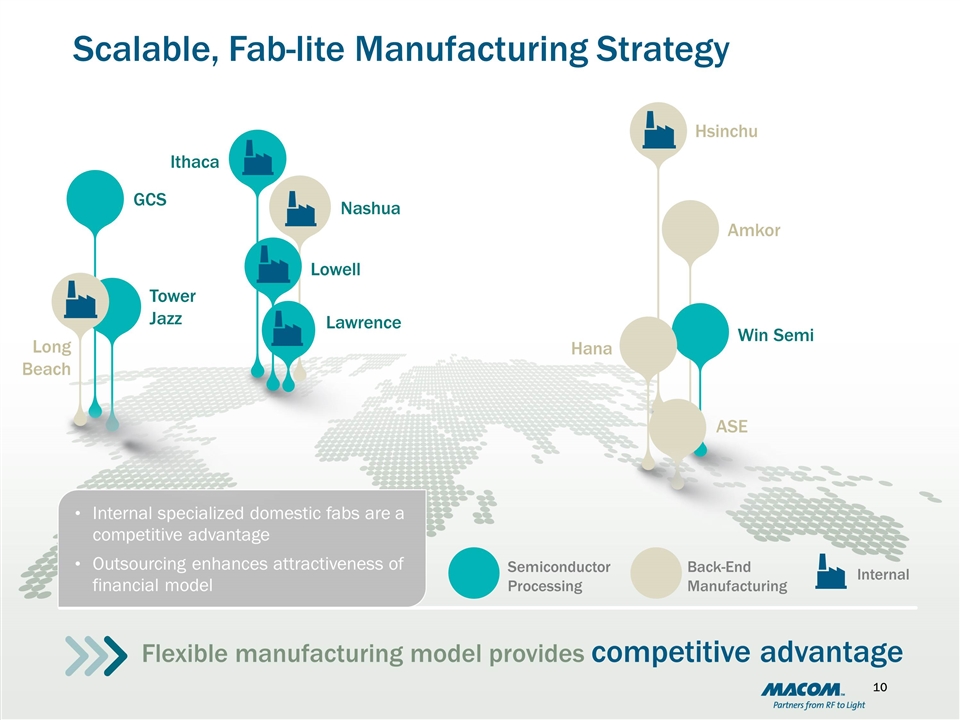
Scalable, Fab-lite Manufacturing Strategy Tower Jazz GCS Amkor Internal specialized domestic fabs are a competitive advantage Outsourcing enhances attractiveness of financial model Semiconductor Processing Back-End Manufacturing Flexible manufacturing model provides competitive advantage Hsinchu Win Semi ASE Hana Ithaca Long Beach 10 Internal Lowell Nashua Lawrence
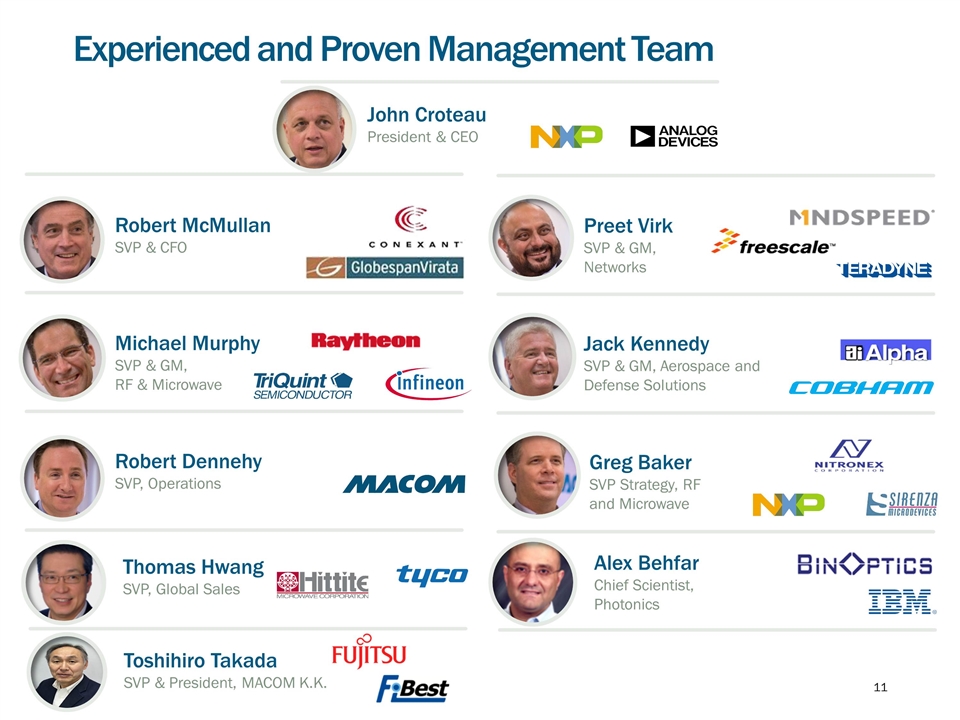
Experienced and Proven Management Team Greg Baker SVP Strategy, RF and Microwave Robert McMullan SVP & CFO Preet Virk SVP & GM, Networks Michael Murphy SVP & GM, RF & Microwave Jack Kennedy SVP & GM, Aerospace and Defense Solutions Robert Dennehy SVP, Operations Thomas Hwang SVP, Global Sales Alex Behfar Chief Scientist, Photonics John Croteau President & CEO Toshihiro Takada SVP & President, MACOM K.K.
Recipe for Growth & Profitability
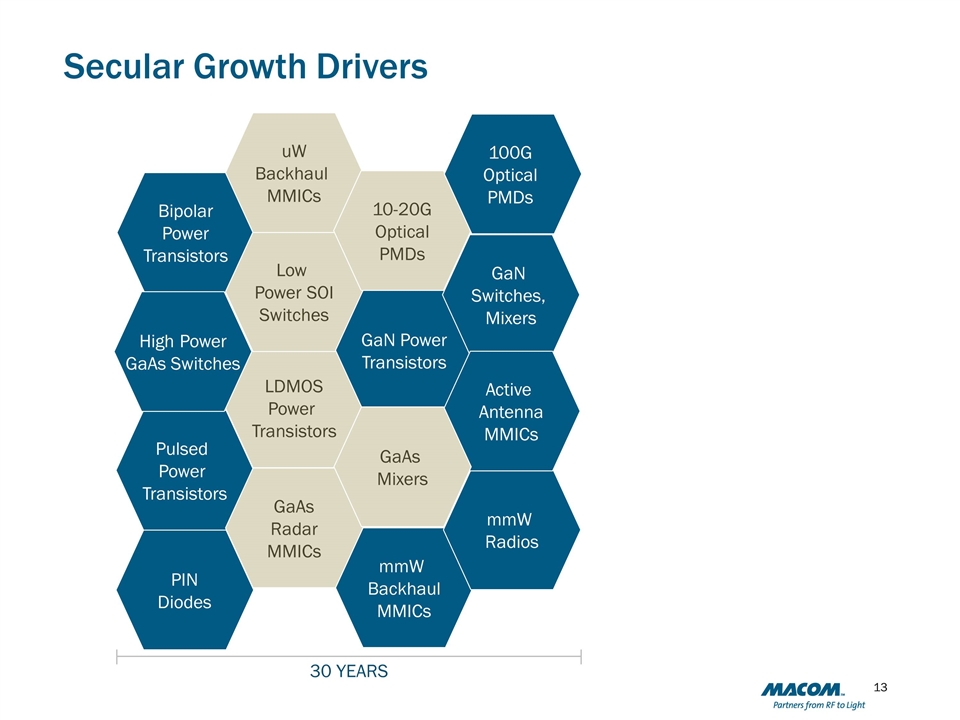
Secular Growth Drivers Pulsed Power Transistors PIN Diodes LDMOS Power Transistors Bipolar Power Transistors Low Power SOI Switches GaAs Radar MMICs mmW Backhaul MMICs uW Backhaul MMICs 10-20G Optical PMDs GaN Power Transistors mmW Radios GaN Switches, Mixers Active Antenna MMICs High Power GaAs Switches GaAs Mixers 100G Optical PMDs 30 YEARS
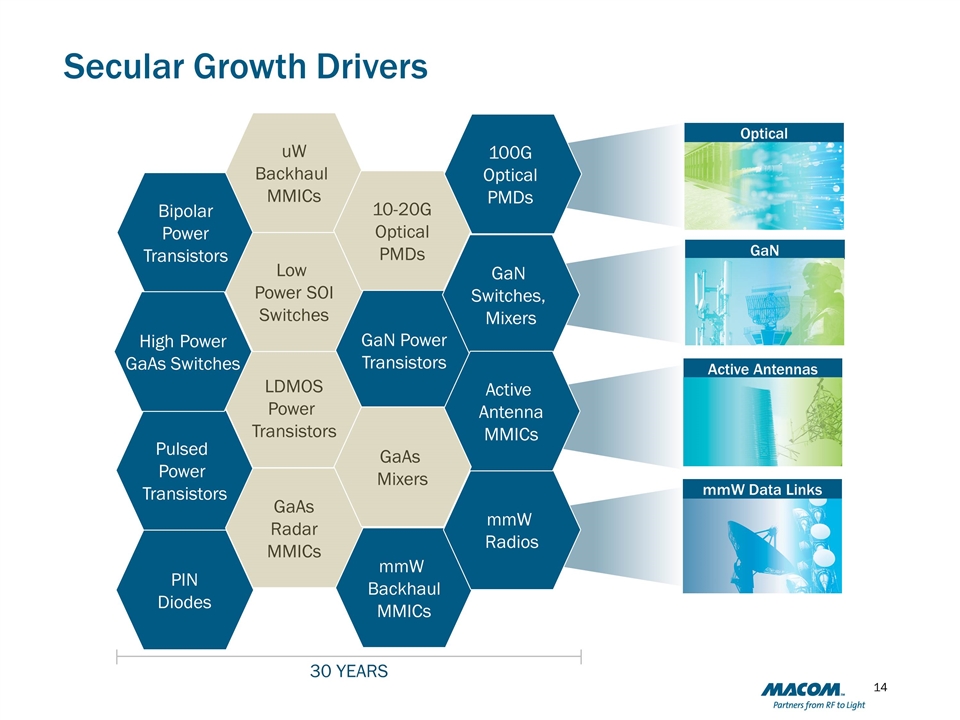
Secular Growth Drivers Active Antennas mmW Data Links Optical GaN Pulsed Power Transistors PIN Diodes LDMOS Power Transistors Bipolar Power Transistors Low Power SOI Switches GaAs Radar MMICs mmW Backhaul MMICs uW Backhaul MMICs 10-20G Optical PMDs GaN Power Transistors mmW Radios GaN Switches, Mixers Active Antenna MMICs High Power GaAs Switches GaAs Mixers 100G Optical PMDs 30 YEARS

OPTICAL
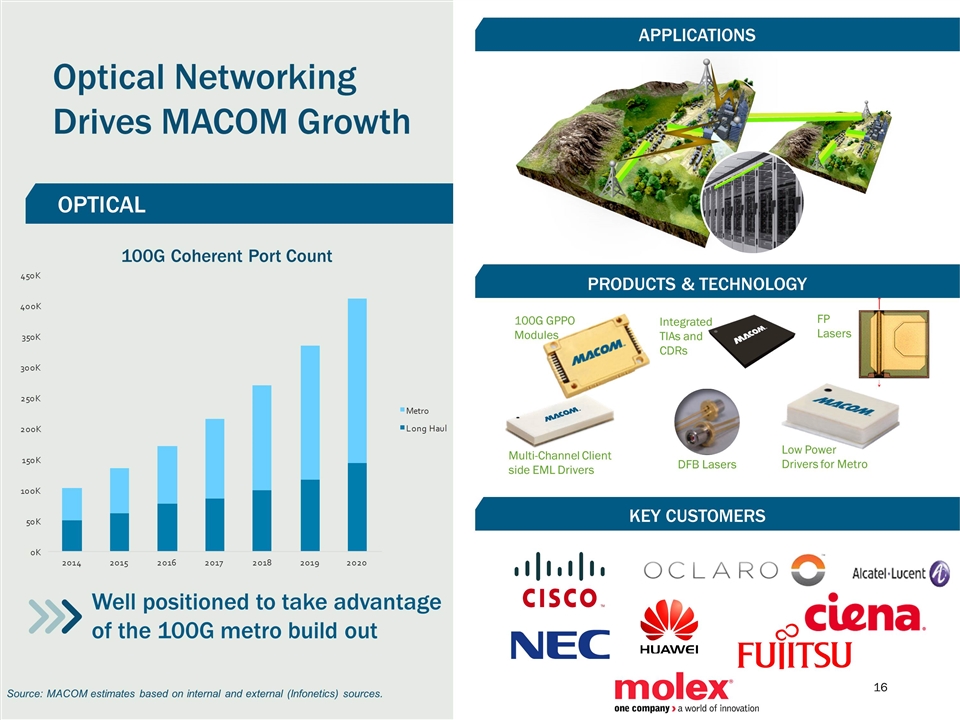
Low Power Drivers for Metro FP Lasers 100G GPPO Modules Multi-Channel Client side EML Drivers Integrated TIAs and CDRs DFB Lasers Optical Networking Drives MACOM Growth Source: MACOM estimates based on internal and external (Infonetics) sources. Well positioned to take advantage of the 100G metro build out 100G Coherent Port Count OPTICAL PRODUCTS & TECHNOLOGY KEY CUSTOMERS APPLICATIONS
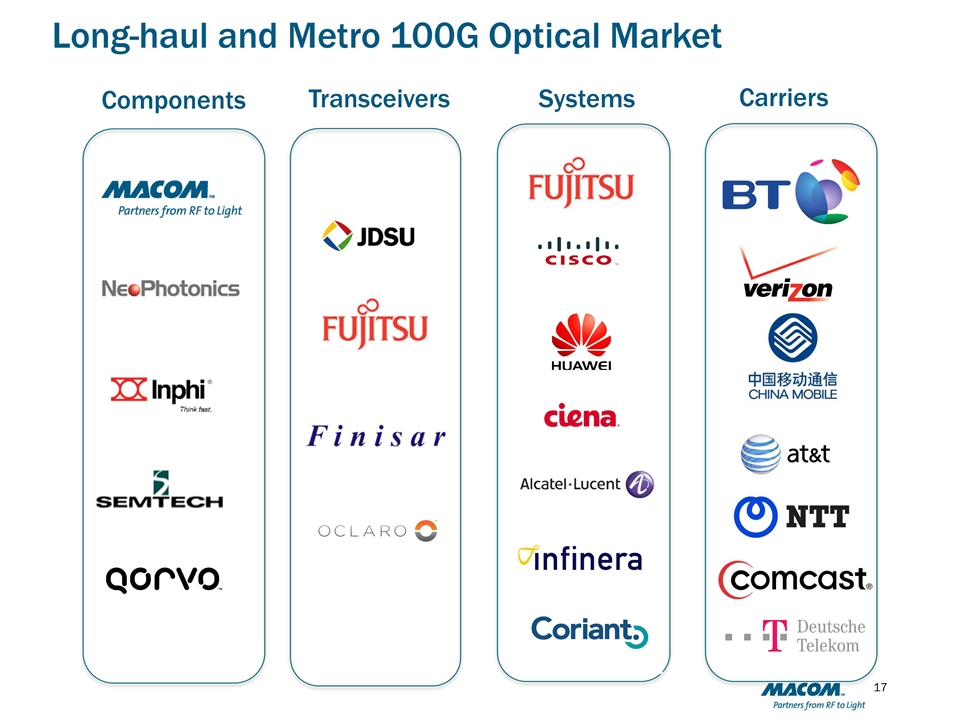
Long-haul and Metro 100G Optical Market Components Systems Carriers Transceivers
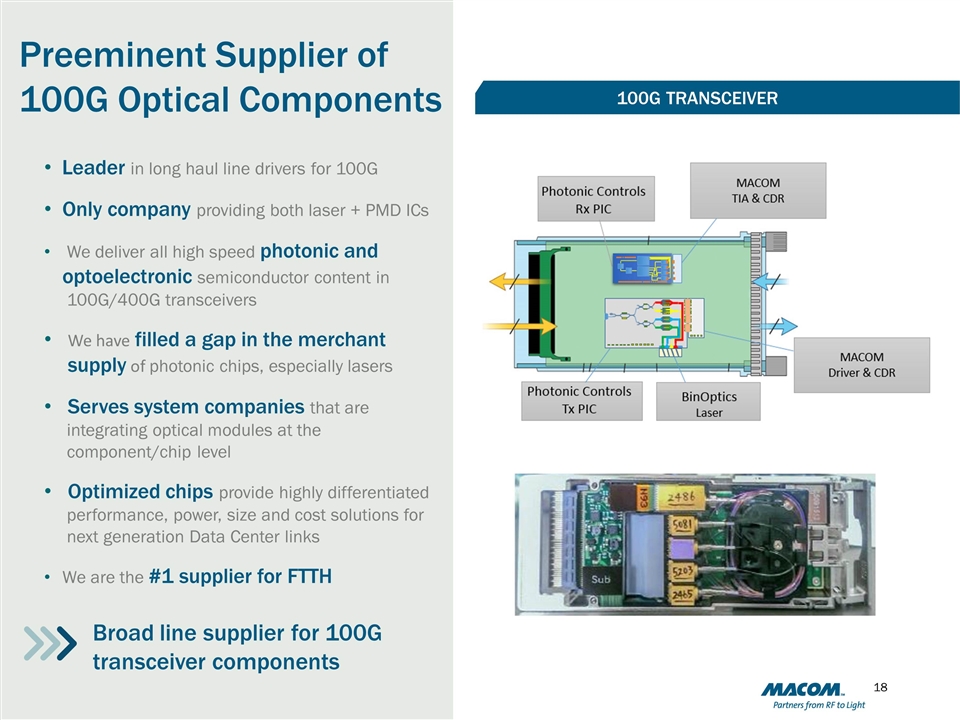
Preeminent Supplier of 100G Optical Components Broad line supplier for 100G transceiver components Leader in long haul line drivers for 100G Only company providing both laser + PMD ICs We deliver all high speed photonic and optoelectronic semiconductor content in 100G/400G transceivers We have filled a gap in the merchant supply of photonic chips, especially lasers Serves system companies that are integrating optical modules at the component/chip level Optimized chips provide highly differentiated performance, power, size and cost solutions for next generation Data Center links We are the #1 supplier for FTTH 100G TRANSCEIVER
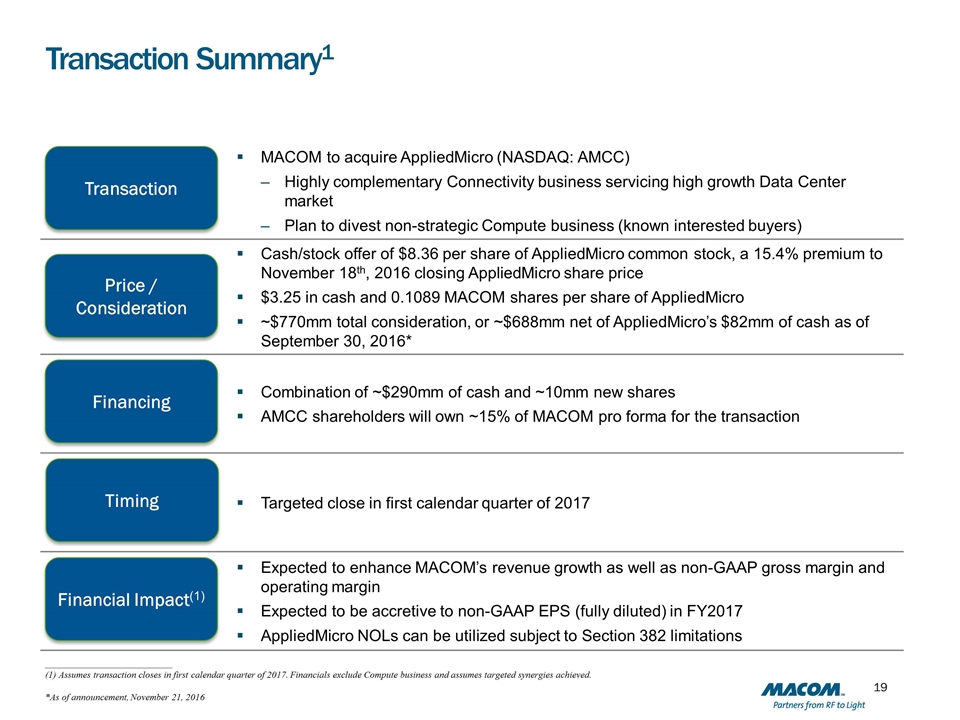
Transaction Summary1 MACOM to acquire AppliedMicro (NASDAQ: AMCC) Highly complementary Connectivity business servicing high growth Data Center market Plan to divest non-strategic Compute business (known interested buyers) Cash Cash/stock offer of $8.36 per share of AppliedMicro common stock, a 15.4% premium to November 18th, 2016 closing AppliedMicro share price $3.25 in cash and 0.1089 MACOM shares per share of AppliedMicro ~$770mm total consideration, or ~$688mm net of AppliedMicro’s $82mm of cash as of September 30, 2016* Combination of ~$290mm of cash and ~10mm new shares AMCC shareholders will own ~15% of MACOM pro forma for the transaction Targeted close in first calendar quarter of 2017 Expected to enhance MACOM’s revenue growth as well as non-GAAP gross margin and operating margin Expected to be accretive to non-GAAP EPS (fully diluted) in FY2017 AppliedMicro NOLs can be utilized subject to Section 382 limitations Transaction Price / Consideration Financing Financial Impact(1) Timing ___________________________ (1) Assumes transaction closes in first calendar quarter of 2017. Financials exclude Compute business and assumes targeted synergies achieved. *As of announcement, November 21, 2016
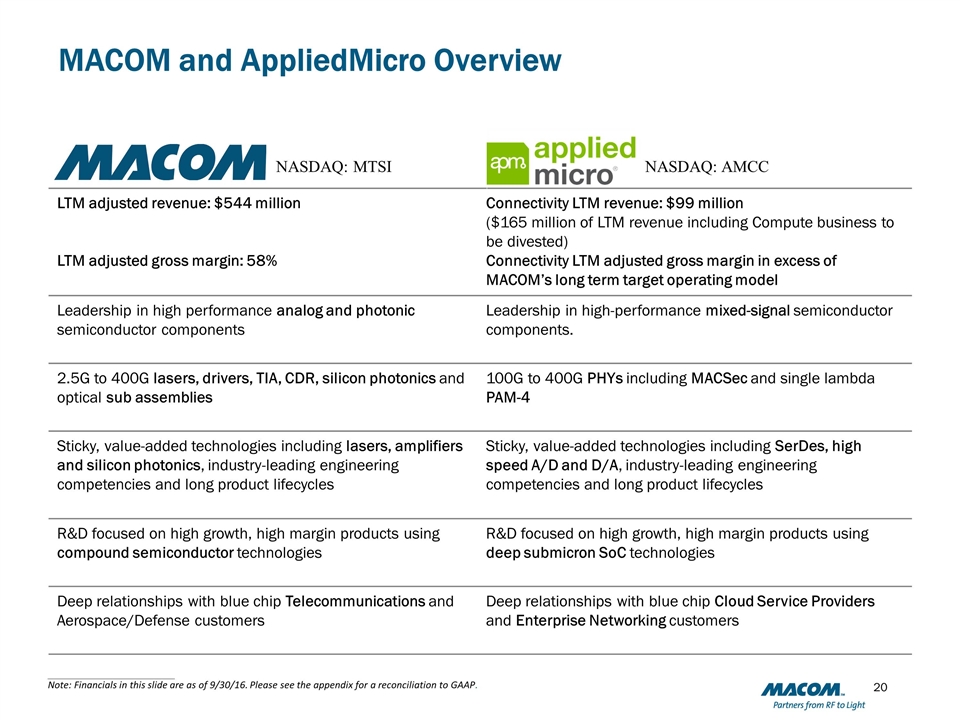
MACOM and AppliedMicro Overview LTM adjusted revenue: $544 million LTM adjusted gross margin: 58% Connectivity LTM revenue: $99 million ($165 million of LTM revenue including Compute business to be divested) Connectivity LTM adjusted gross margin in excess of MACOM’s long term target operating model Leadership in high performance analog and photonic semiconductor components Leadership in high-performance mixed-signal semiconductor components. 2.5G to 400G lasers, drivers, TIA, CDR, silicon photonics and optical sub assemblies 100G to 400G PHYs including MACSec and single lambda PAM-4 Sticky, value-added technologies including lasers, amplifiers and silicon photonics, industry-leading engineering competencies and long product lifecycles Sticky, value-added technologies including SerDes, high speed A/D and D/A, industry-leading engineering competencies and long product lifecycles R&D focused on high growth, high margin products using compound semiconductor technologies R&D focused on high growth, high margin products using deep submicron SoC technologies Deep relationships with blue chip Telecommunications and Aerospace/Defense customers Deep relationships with blue chip Cloud Service Providers and Enterprise Networking customers NASDAQ: MTSI NASDAQ: AMCC ___________________________ Note: Financials in this slide are as of 9/30/16. Please see the appendix for a reconciliation to GAAP.
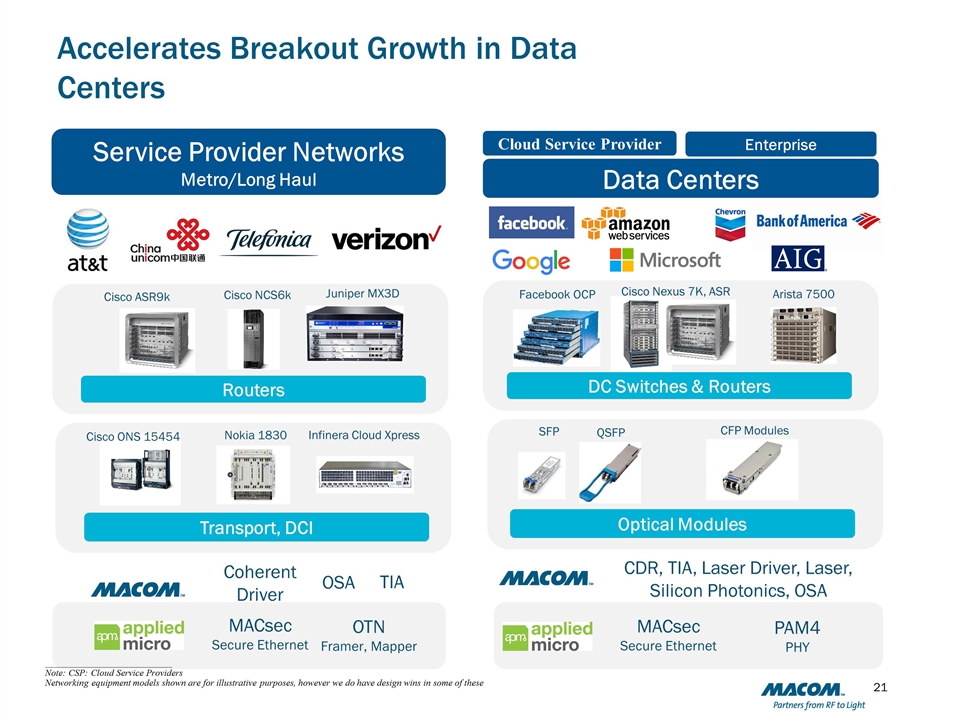
Accelerates Breakout Growth in Data Centers Service Provider Networks Metro/Long Haul OTN Framer, Mapper MACsec Secure Ethernet Cisco ASR9k Cisco NCS6k Routers Juniper MX3D Coherent Driver TIA Transport, DCI Cisco ONS 15454 Nokia 1830 Infinera Cloud Xpress Cloud Service Provider Enterprise Data Centers Optical Modules Arista 7500 Cisco Nexus 7K, ASR SFP QSFP DC Switches & Routers Facebook OCP CFP Modules PAM4 PHY MACsec Secure Ethernet CDR, TIA, Laser Driver, Laser, Silicon Photonics, OSA OSA ___________________________ Note: CSP: Cloud Service Providers Networking equipment models shown are for illustrative purposes, however we do have design wins in some of these
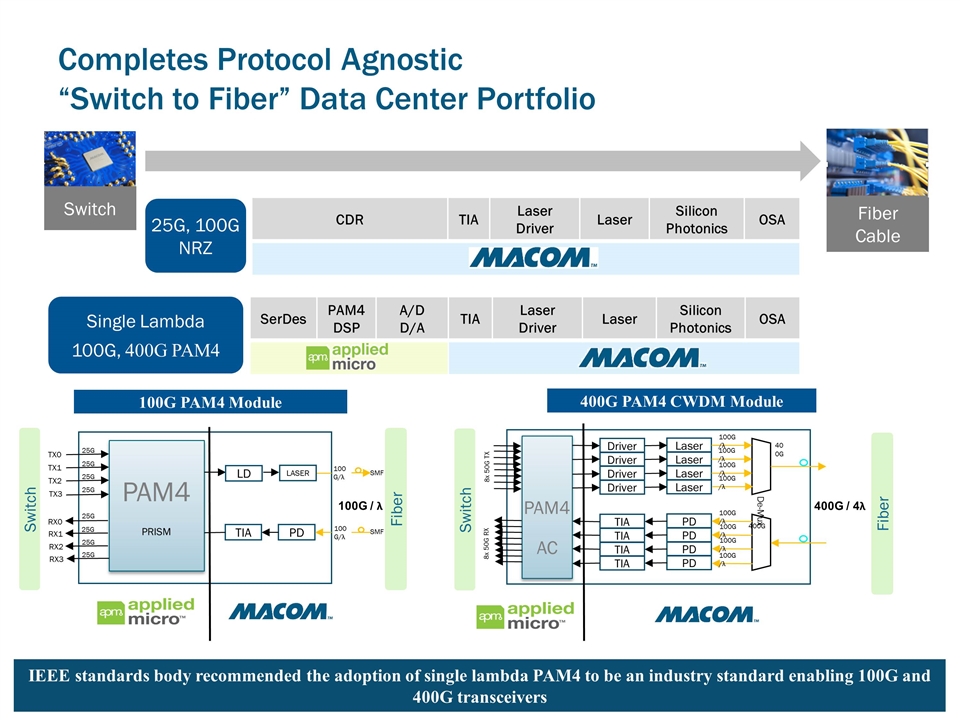
Completes Protocol Agnostic “Switch to Fiber” Data Center Portfolio CDR TIA Laser Driver Laser Silicon Photonics OSA 25G, 100G NRZ Single Lambda 100G, 400G PAM4 SerDes PAM4 DSP A/D D/A TIA Laser Driver Laser Silicon Photonics OSA IEEE standards body recommended the adoption of single lambda PAM4 to be an industry standard enabling 100G and 400G transceivers Switch Fiber Cable PAM4 PRISM 25G 25G 25G 25G 25G 25G 25G 25G TX0 TX1 TX2 TX3 RX0 RX1 RX2 RX3 LD 100G/λ TIA LASER PD SMF 100G/λ SMF 100G PAM4 Module 400G PAM4 CWDM Module PAM4 AC Driver Driver Driver Driver Laser Laser Laser Laser TIA TIA TIA TIA PD PD PD PD De-Mux 400G 400G 100G/λ 100G/λ 100G/λ 100G/λ 100G/λ 100G/λ 100G/λ 100G/λ 8x 50G TX 8x 50G RX 100G / λ Fiber Switch Switch 400G / 4λ Fiber

GaN
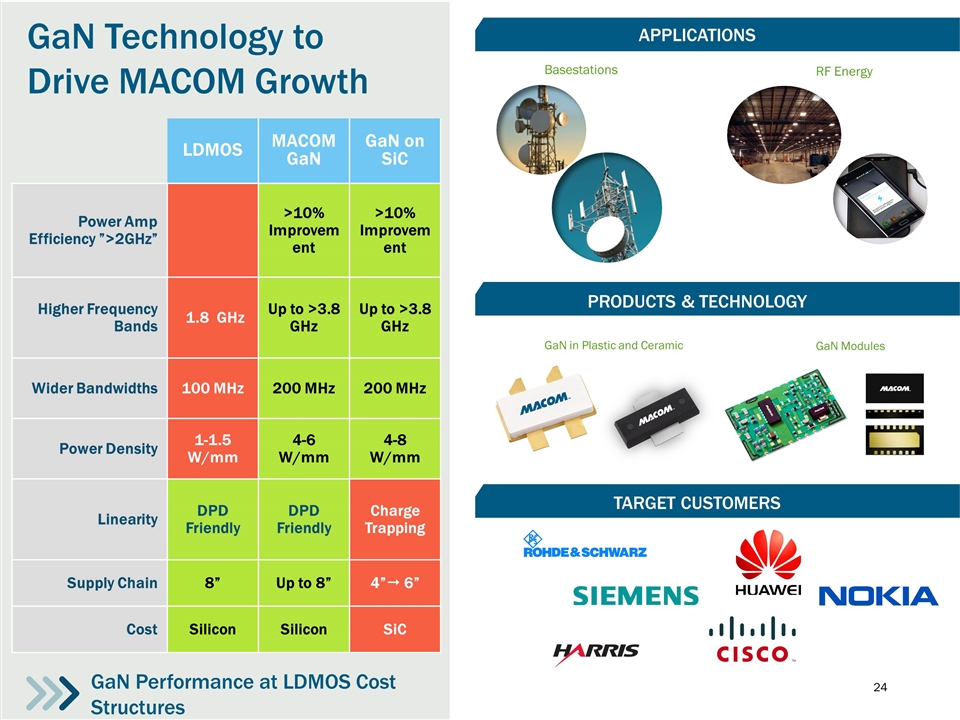
GaN Technology to Drive MACOM Growth GaN Performance at LDMOS Cost Structures GaN in Plastic and Ceramic PRODUCTS & TECHNOLOGY TARGET CUSTOMERS APPLICATIONS Basestations RF Energy LDMOS MACOM GaN GaN on SiC Power Amp Efficiency ”>2GHz” >10% Improvement >10% Improvement Higher Frequency Bands 1.8 GHz Up to >3.8 GHz Up to >3.8 GHz Wider Bandwidths 100 MHz 200 MHz 200 MHz Power Density 1-1.5 W/mm 4-6 W/mm 4-8 W/mm Linearity DPD Friendly DPD Friendly Charge Trapping Supply Chain 8” Up to 8” 4”" 6” Cost Silicon Silicon SiC GaN Modules
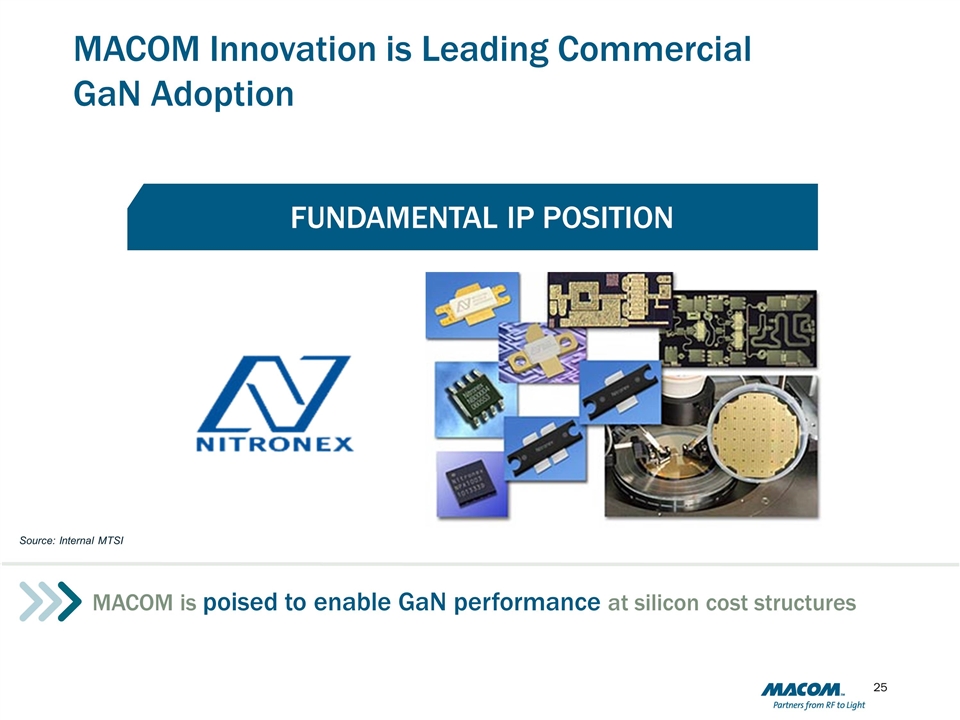
MACOM Innovation is Leading Commercial GaN Adoption MACOM is poised to enable GaN performance at silicon cost structures Source: Internal MTSI Estimates FUNDAMENTAL IP POSITION
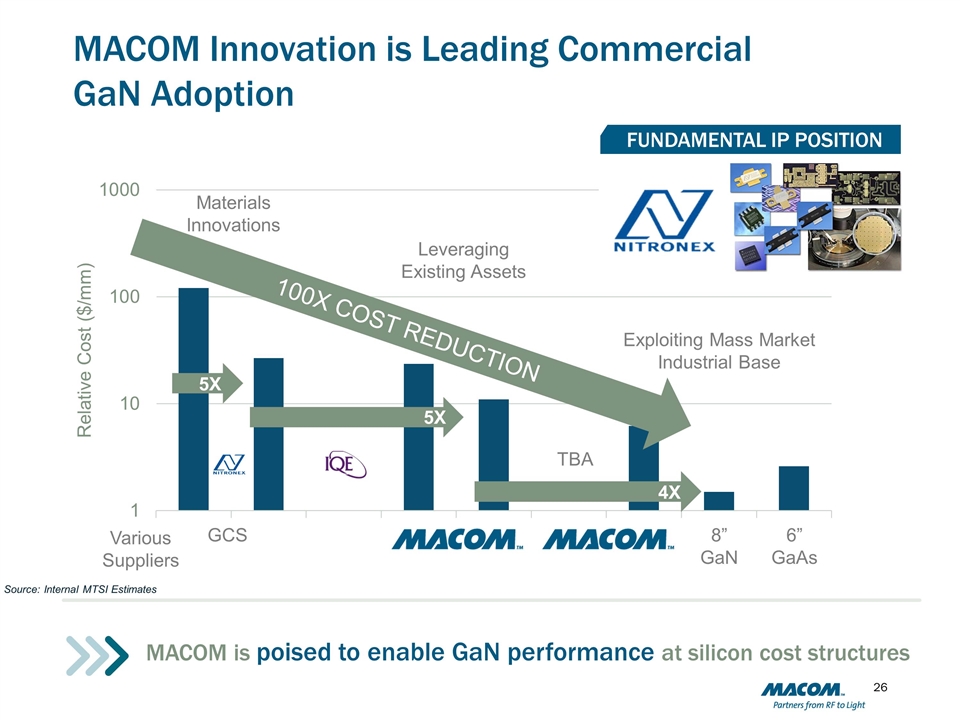
MACOM Innovation is Leading Commercial GaN Adoption Source: Internal MTSI Estimates 6” GaAs Leveraging Existing Assets Exploiting Mass Market Industrial Base 100X COST REDUCTION 8” GaN Various Suppliers GCS 5X 4X TBA 5X Materials Innovations FUNDAMENTAL IP POSITION MACOM is poised to enable GaN performance at silicon cost structures

ACTIVE ANTENNAS
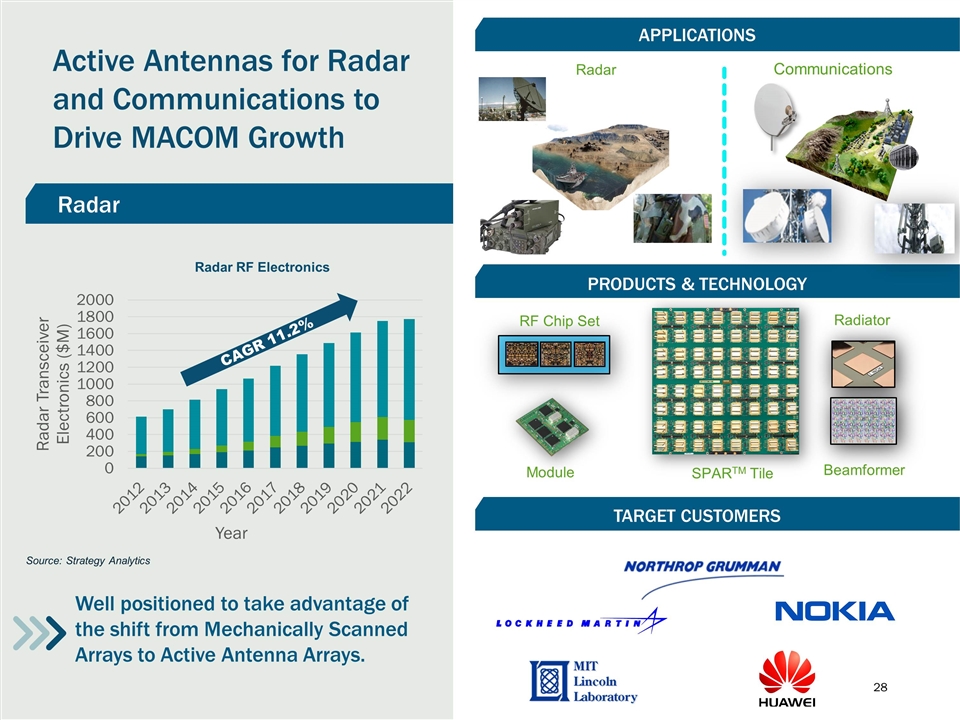
Active Antennas for Radar and Communications to Drive MACOM Growth Well positioned to take advantage of the shift from Mechanically Scanned Arrays to Active Antenna Arrays. Radar PRODUCTS & TECHNOLOGY TARGET CUSTOMERS APPLICATIONS Radar Communications Radiator Beamformer Module RF Chip Set CAGR 11.2% Source: Strategy Analytics Radar RF Electronics SPARTM Tile
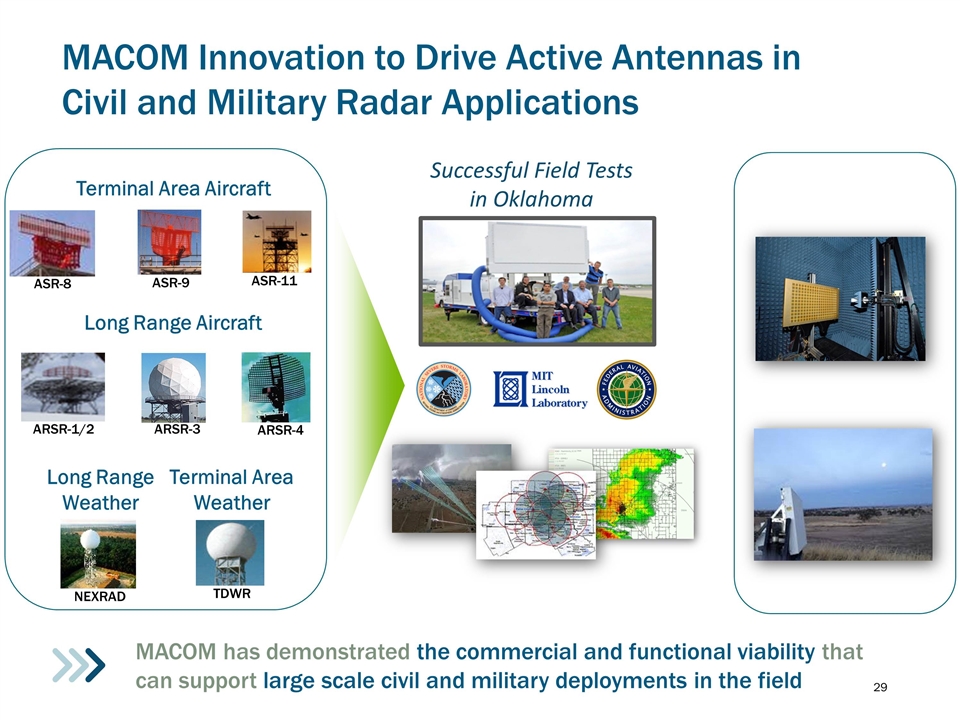
MACOM Innovation to Drive Active Antennas in Civil and Military Radar Applications Successful Field Tests in Oklahoma MACOM has demonstrated the commercial and functional viability that can support large scale civil and military deployments in the field Terminal Area Aircraft Long Range Aircraft Long Range Weather Terminal Area Weather ASR-8 ASR-9 ASR-11 ARSR-4 ARSR-3 ARSR-1/2 NEXRAD TDWR
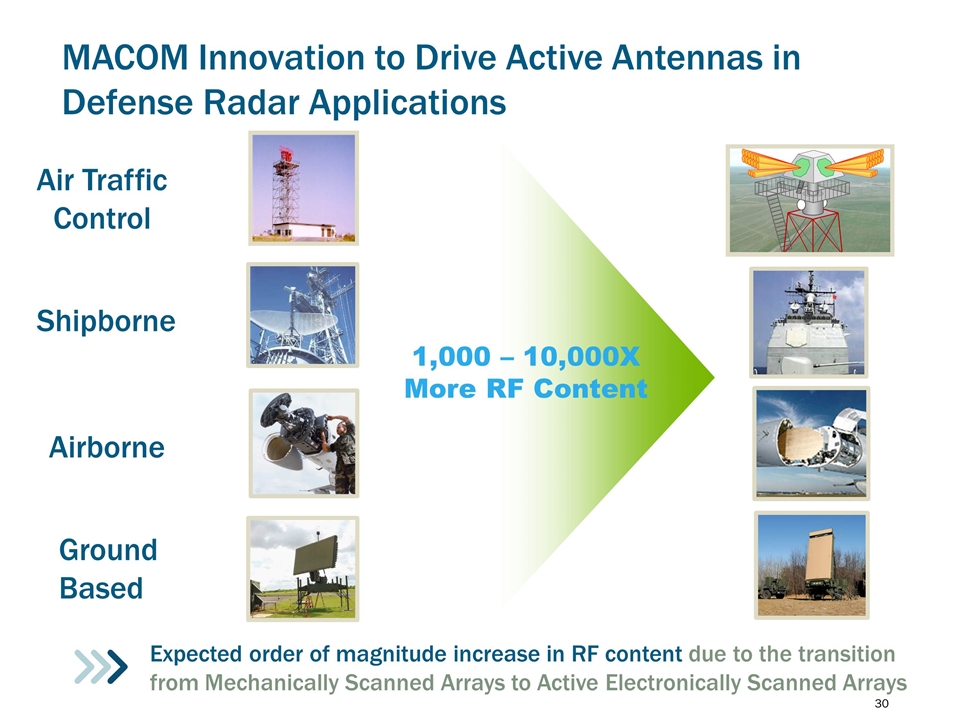
MACOM Innovation to Drive Active Antennas in Defense Radar Applications 1,000 – 10,000X More RF Content Expected order of magnitude increase in RF content due to the transition from Mechanically Scanned Arrays to Active Electronically Scanned Arrays Air Traffic Control Shipborne Airborne Ground Based
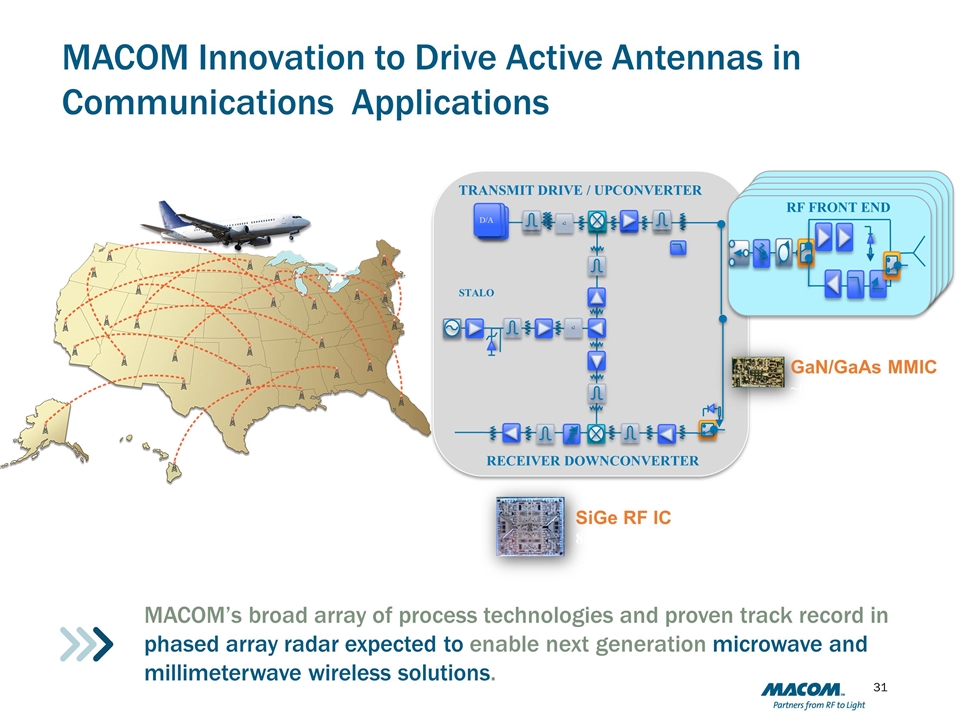
MACOM Innovation to Drive Active Antennas in Communications Applications x2 x2 TRANSMIT DRIVE / UPCONVERTER STALO D/A D/A D/A D/A RECEIVER DOWNCONVERTER SiGe RF IC 850 transistors (octal) GaN/GaAs MMIC ~60 transistors RF FRONT END MACOM’s broad array of process technologies and proven track record in phased array radar expected to enable next generation microwave and millimeterwave wireless solutions.

FINANCIAL OVERVIEW
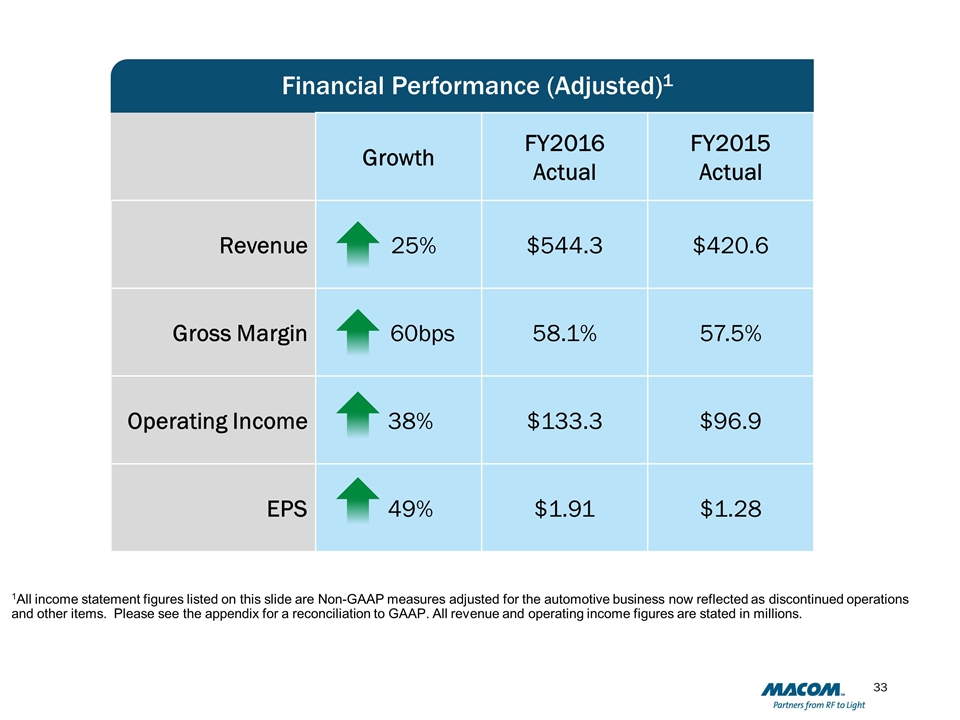
1All figures below are Non-GAAP measures adjusted for the automotive business now reflected as discontinued operations and other items. See reconciliation to GAAP on last page of Analyst Day 2016 slide deck. Dollar figures in millions except per share date. Financial Performance (Adjusted)1 Growth FY2016 Actual FY2015 Actual Revenue 25% $544.3 $420.6 Gross Margin 60bps 58.1% 57.5% Operating Income 38% $133.3 $96.9 EPS 49% $1.91 $1.28 1All income statement figures listed on this slide are Non-GAAP measures adjusted for the automotive business now reflected as discontinued operations and other items. Please see the appendix for a reconciliation to GAAP. All revenue and operating income figures are stated in millions.
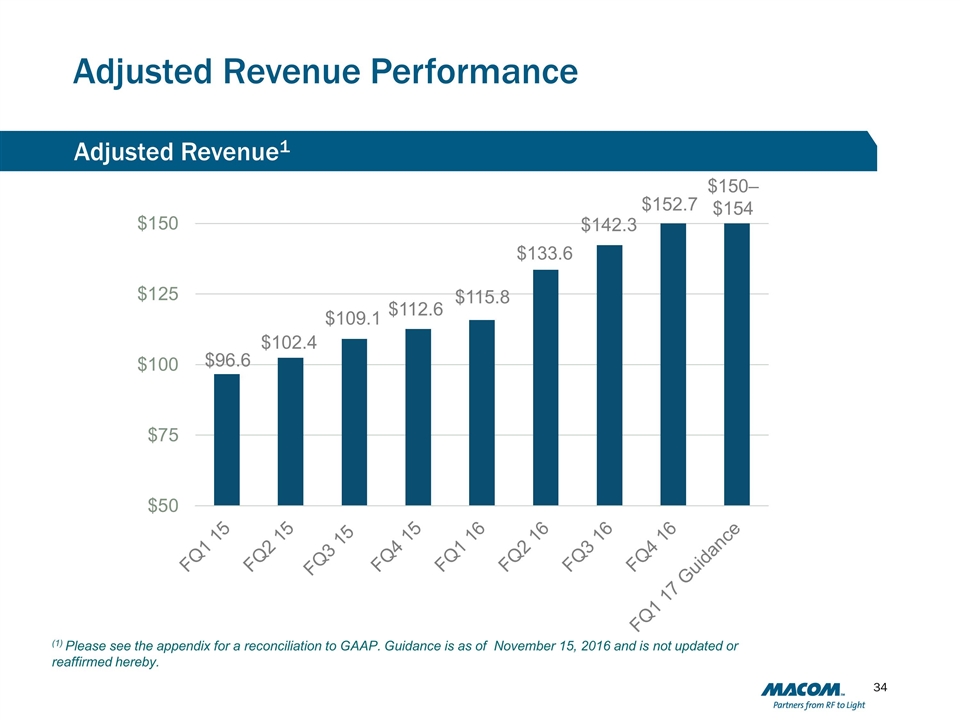
Adjusted Revenue Performance Adjusted Revenue1 (1) Please see the appendix for a reconciliation to GAAP. Guidance is as of November 15, 2016 and is not updated or reaffirmed hereby. $112.6 $133.6 $142.3 $150– $154 $152.7
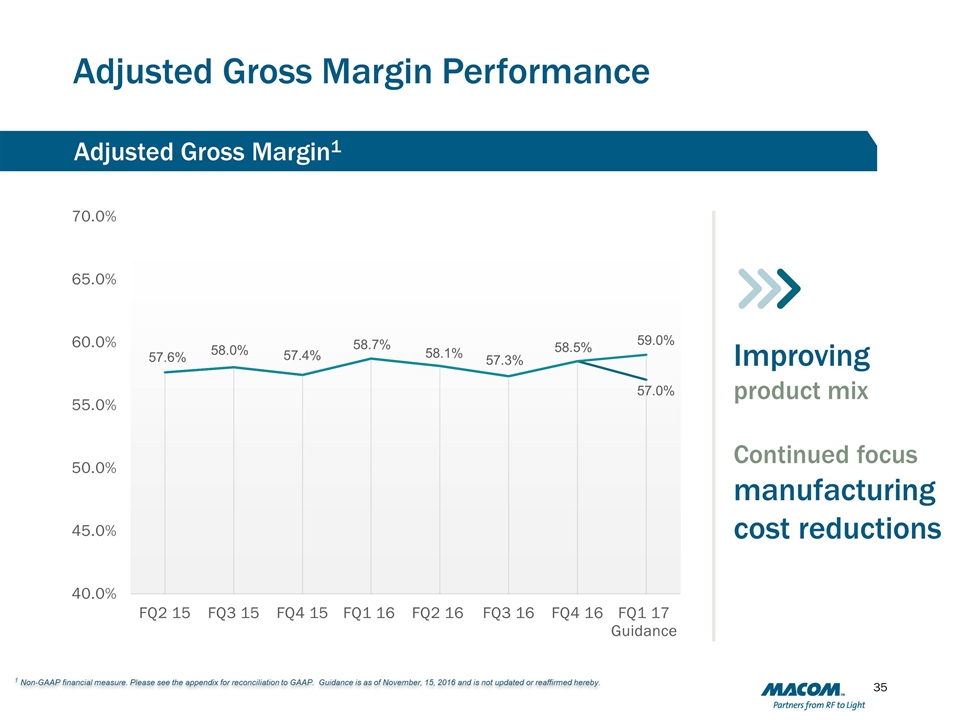
Adjusted Gross Margin Performance Adjusted Gross Margin1 Improving product mix Continued focus manufacturing cost reductions 58.0% 1 Non-GAAP financial measure. Please see the appendix for reconciliation to GAAP. Guidance is as of November, 15, 2016 and is not updated or reaffirmed hereby. 57.6% 58.7% 58.5%
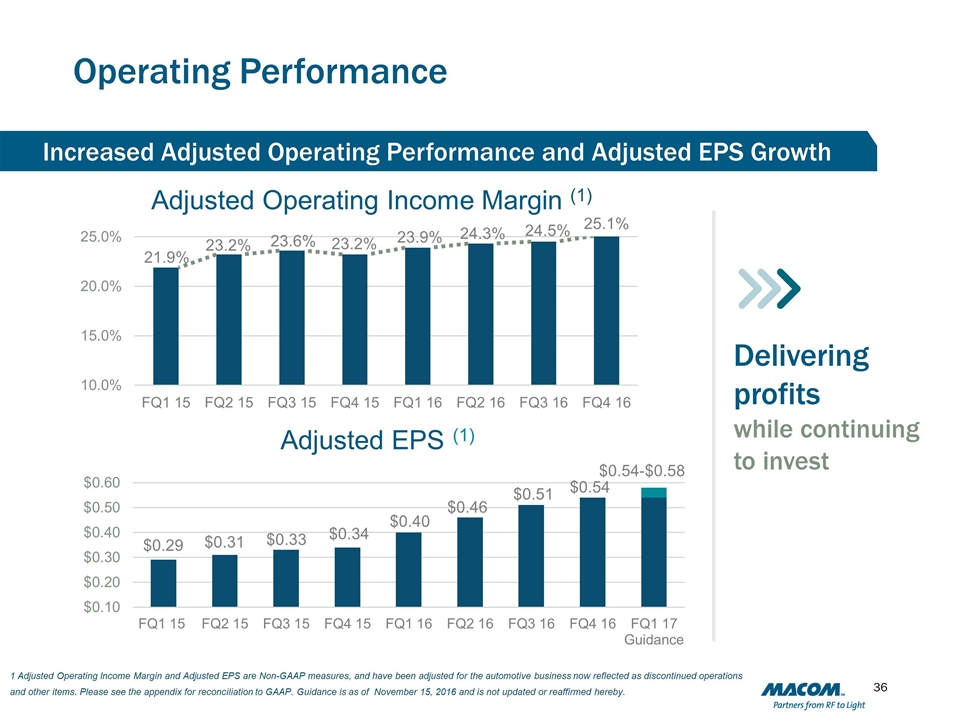
Operating Performance Increased Adjusted Operating Performance and Adjusted EPS Growth Delivering profits while continuing to invest Adjusted EPS (1) Adjusted Operating Income Margin (1) 1 Adjusted Operating Income Margin and Adjusted EPS are Non-GAAP measures, and have been adjusted for the automotive business now reflected as discontinued operations and other items. Please see the appendix for reconciliation to GAAP. Guidance is as of November 15, 2016 and is not updated or reaffirmed hereby. 24.5% $0.46 $0.51 24.3%
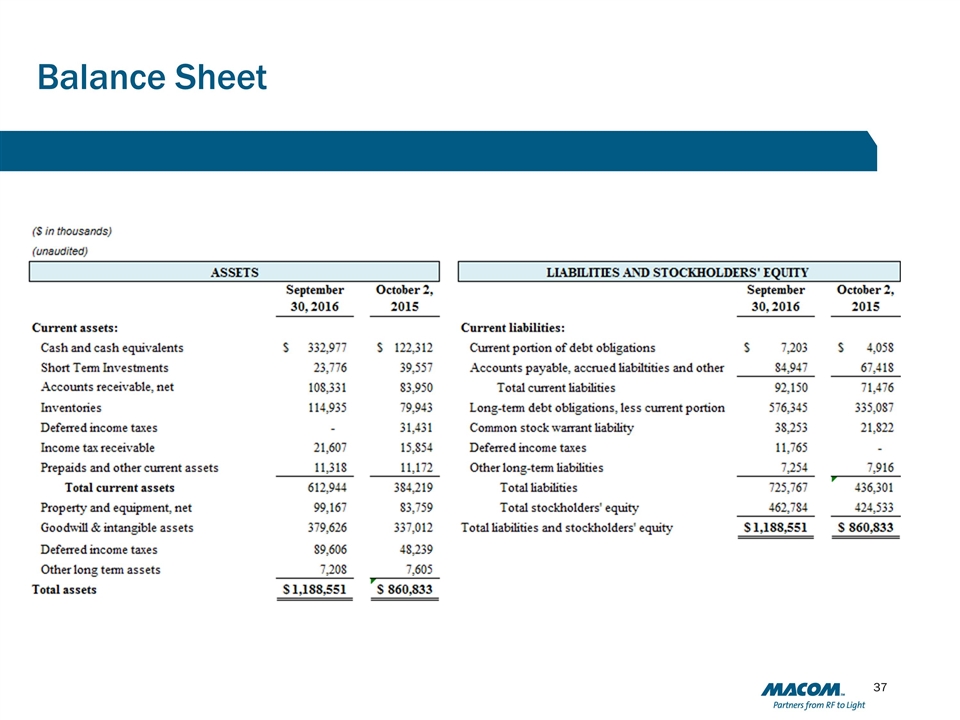
Balance Sheet
Drive revenue growth through market share gains and leadership in high growth segments of our markets Accelerate growth through targeted acquisitions and investments in high growth, defensible markets Expand margins to drive strong adjusted EPS growth and increase shareholder value Our Strategy

Appendix
Non-GAAP Financial Measures This non-GAAP information excludes the effect, where applicable, of discontinued operations, intangible amortization expense, share-based compensation costs, impairment and restructuring charges, changes in common stock warrant liability, financing and litigation costs, acquisition and integration related costs, other costs and the tax effect of each adjustment. The non-GAAP information includes consulting agreement related to income associated with the Automotive divestiture. Management believes that these items are not reflective of our underlying performance. Management uses these non-GAAP financial measures to; evaluate our ongoing operating performance and compare it against prior periods, make operating decisions, forecast future periods, evaluate potential acquisitions, compare our operating performance against peer companies and assess certain compensation programs. The presentation of these and other similar items in our non-GAAP financial results should not be interpreted as implying that these items are non-recurring, infrequent or unusual. We believe this non-GAAP financial information provides additional insight into our ongoing performance and have therefore chosen to provide this information to investors for a more consistent basis of comparison and to help them evaluate the results of our ongoing operations and enable more meaningful period-to-period comparisons. These non-GAAP measures are provided in addition to, and not as a substitute for, or superior to, measures of financial performance prepared in accordance with GAAP. A reconciliation between GAAP and non-GAAP financial data is attached to this presentation. We have not provided a reconciliation with respect to any forward-looking non-GAAP financial data presented, because we do not have and cannot reliably estimate certain key inputs required to calculate the most comparable GAAP financial data, such as the future price per share of our common stock for purposes of calculating the value of our common stock warrant liability and share-based compensation costs, future acquisition costs, the possibility and impact of any litigation costs, changes in our GAAP effective tax rate, impairment charges and acquisition integration and other costs related to our acquisitions, which are difficult to predict and estimate. We believe these unknown inputs are likely to have a significant impact on any estimate of the comparable GAAP financial data. Investors are cautioned against placing undue reliance on these non-GAAP financial measures and are urged to review and consider carefully the adjustments made by management to the most directly comparable GAAP financial measures to arrive at these non-GAAP financial measures. Non-GAAP financial measures may have limited value as analytical tools because they may exclude certain expenses that some investors consider important in evaluating our operating performance or ongoing business performance. Further, non-GAAP financial measures may have limited value for purposes of drawing comparisons between companies because different companies may calculate similarly titled non-GAAP financial measures in different ways because non-GAAP measures are not based on any comprehensive set of accounting rules or principles.
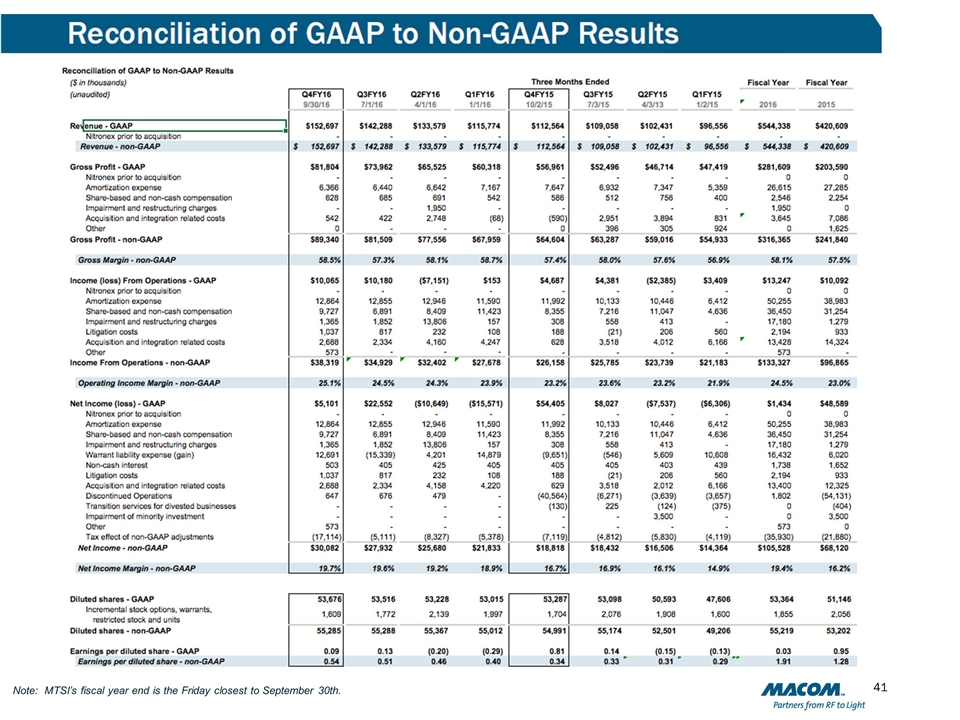
Note: MTSI’s fiscal year end is the Friday closest to September 30th.
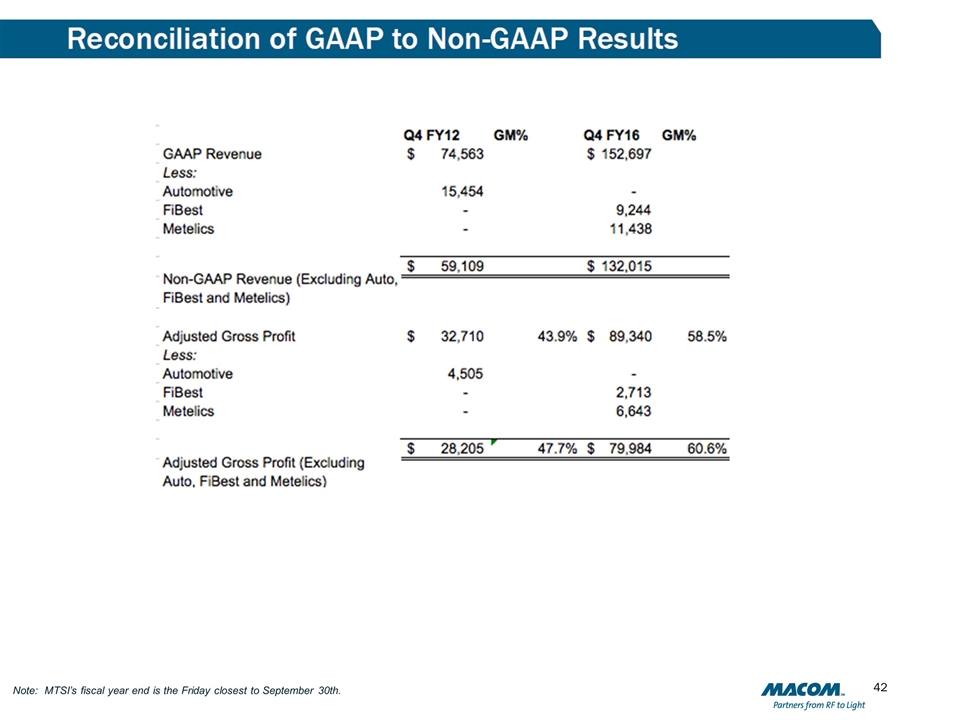
Note: MTSI’s fiscal year end is the Friday closest to September 30th.
THANK YOU