UNITED STATES
SECURITIES AND EXCHANGE COMMISSION
Washington, D.C. 20549
FORM N-CSR
CERTIFIED SHAREHOLDER REPORT OF REGISTERED MANAGEMENT
INVESTMENT COMPANIES
| Investment Company Act file number | 811-03651 |
| Touchstone Strategic Trust – December Funds |
| (Exact name of registrant as specified in charter) |
| 303 Broadway, Suite 1100 |
| Cincinnati, Ohio 45202-4203 |
| (Address of principal executive offices) (Zip code) |
| E. Blake Moore, Jr. |
| 303 Broadway, Suite 1100 |
| Cincinnati, Ohio 45202-4203 |
| (Name and address of agent for service) |
Registrant's telephone number, including area code: 800-638-8194
Date of fiscal year end: December 31
Date of reporting period: December 31, 2020
Form N-CSR is to be used by management investment companies to file reports with the Commission not later than 10 days after the transmission to stockholders of any report that is required to be transmitted to stockholders under Rule 30e-1 under the Investment Company Act of 1940 (17 CFR 270.30e-1). The Commission may use the information provided on Form N-CSR in its regulatory, disclosure review, inspection, and policymaking roles.
A registrant is required to disclose the information specified by Form N-CSR, and the Commission will make this information public. A registrant is not required to respond to the collection of information contained in Form N-CSR unless the Form displays a currently valid Office of Management and Budget ("OMB") control number. Please direct comments concerning the accuracy of the information collection burden estimate and any suggestions for reducing the burden to Secretary, Securities and Exchange Commission, 450 Fifth Street, NW, Washington, DC 20549-0609. The OMB has reviewed this collection of information under the clearance requirements of 44 U.S.C. § 3507.
Item 1. Reports to Stockholders.
| (a) | The Report to Shareholders is attached herewith. |
December 31, 2020
Annual Report
| Touchstone Strategic Trust |
| Touchstone Anti-Benchmark® US Core Equity Fund (formerly known as Touchstone Dynamic Equity Fund) |
| Touchstone Dynamic Diversified Income Fund |
| Touchstone Dynamic Global Allocation Fund |

This report identifies the Funds' investments on December 31, 2020. These holdings are subject to change. Not all investments in each Fund performed the same, nor is there any guarantee that these investments will perform as well in the future. Market forecasts provided in this report may not occur.
Letter from the President
Dear Shareholder:
We are pleased to provide you with the Touchstone Strategic Trust Annual Report. Inside you will find key financial information, as well as manager commentaries for the Funds, for the 12 months ended December 31, 2020.
A tumultuous calendar year 2020 ended on a high. Third quarter U.S. GDP data released in October reported the largest quarterly growth rate ever recorded while U.S. unemployment continued to decline. This represented a significant rebound in GDP growth from the second quarter; however, the year was expected to end in negative territory. Despite a hotly contested presidential election and a spike in COVID-19 cases leading to a re-imposition of economic restrictions, U.S. capital markets continued to climb following massive stimulus that was enacted in March to combat the widening pandemic. Capital markets received a boost late in the year as vaccine trial results provided reason for optimism. Outside the U.S., economic growth was relatively benign as GDP growth rates in the European Union (EU), Japan and the U.K. rebounded in the third quarter, but not as strongly as in the U.S. Garnering less attention was the official British exit from the EU, also known as Brexit, which occurred at midnight on December 31, 2020, concluding a long saga of negotiation breakdowns and changes in U.K. political leadership.
U.S. equity markets posted strong returns for 2020. The S&P 500® Index was driven by growth equities, which far outpaced value equities due to growth equities’ lower exposure to pandemic-sensitive cyclicals, financials and energy segments of the U.S. economy. Non-U.S. equities posted solid-to-strong returns relative to those in the U.S. International Developed Markets (MSCI EAFE Index) were led by “safe haven” countries such as Japan, Switzerland and France, and Emerging Markets (MSCI EM Index) were led by South Korea, China, Taiwan and India for the year.
The U.S. Federal Reserve Board (Fed) continued near zero overnight rates and substantial direct purchases of an unprecedented breadth of various fixed income securities leading to overall low yields. Higher quality fixed income, which outperformed below investment grade corporate credit, benefited from a “flight to quality” early in the year followed by the aforementioned aggressive Fed monetary policy actions in response to the growing pandemic in March. Cutting overnight rates to zero and reinstituting Global Financial Crisis era policies, such as direct bond issue purchases, precipitated a significant downward shift across the yield curve. Conversely, below investment grade credit illustrated the strong, risk-on sentiment in response to Fed actions and fiscal stimulus efforts beginning in March throughout the remainder of 2020. However, both investment grade and below investment grade corporate credit spreads tightened following the November presidential election, providing a performance tailwind for corporate bonds.
Markets such as these reaffirm our belief in the importance of the steady hands of financial professionals, trust in one’s investment strategy and understanding of the risks of trying to time the market. We believe that environments that are more volatile create opportunity for active managers to add value, especially those that are Distinctively Active.
We greatly value your continued support. Thank you for including Touchstone as part of your investment plan.
Sincerely, | | |
| | | |
 | | |
| E. Blake Moore Jr. | | |
| President | | |
| Touchstone Strategic Trust | | |
| | | |
Management's Discussion of Fund Performance (Unaudited)
Touchstone Anti-Benchmark® US Core Equity Fund
Sub-Advised by TOBAM S.A.S
Investment Philosophy
The Touchstone Anti-Benchmark® US Core Equity Fund seeks capital appreciation. TOBAM’s methodology seeks to enhance the diversification of portfolio holdings to reduce market bias and potentially improve risk-adjusted returns. TOBAM’s process selects individual stocks and their weights in an effort to reduce the correlations between individual holdings. This enables the creation of portfolios that seek to mitigate the inherent concentration risks associated with capitalization-weighted benchmarks. The lower correlations have the potential to provide a differentiated source of value than other methods of diversification. This quantitative approach creates fully invested, long-only portfolios that do not use leverage, and are designed to help guard against structural biases.
Fund Performance
The Touchstone Anti-Benchmark® US Core Equity Fund (Class Y Share) underperformed its benchmark, the Russell 1000® Index, for the 3-month period ended December 31, 2020. The Fund’s total return was 10.23 percent while the total return of the benchmark was 13.69 percent.
Market Environment
The fourth quarter of 2020 ended a tumultuous year on a high note. Third quarter U.S. gross domestic product (GDP) data released in October indicated the largest growth rate (33.4 percent annualized) ever recorded while U.S. unemployment continued its decline from 7.9 percent in September to 6.7 percent in November. Despite a hotly contested presidential election and a spike in COVID-19 cases leading to a re-implementation of economic lockdowns, U.S. capital markets continued to climb during the quarter as vaccine trial results gave investors reason for optimism. Outside the U.S., economic growth was relatively benign as GDP growth rates in the European Union (EU), Japan and the U.K. rebounded in the third quarter, but not as strongly as in the U.S. Garnering less investor attention was the official British exit from the EU, also known as Brexit, which occurred at midnight on December 31, ending a long saga of negotiation breakdowns and changes in U.K. political leadership.
U.S. equity markets generated strong returns during the fourth quarter and for calendar year 2020. Strong leadership among small cap equities, regardless of style, outperforming their mid cap and large cap brethren was reported. From a style standpoint, value equities outperformed growth and core, across the market capitalization spectrum. A notable shift occurred in equity style where value equities outperformed growth following multiple quarters of strong growth equity performance compared to value equities. However, growth equities, and their lower exposure to pandemic-sensitive cyclicals, financials, and energy segments of the U.S. economy, was a net beneficiary in 2020 as they far outpaced value equities over the full calendar year.
Portfolio Review
Despite the COVID-19 virus spread not being contained in the U.S., investors regained confidence. This translated into a steep rebound for the remainder of the year in broad market returns, culminating in strong broad market performance in the fourth quarter. Cyclical and growth-oriented sectors led the market during the quarter. Energy, Financials, Materials, Industrials and Communication Services sectors all posted strong returns. This contributed to even higher levels of market concentration in the U.S. equity market at year-end. The Financials and Energy sectors specifically rebounded over the last two months of the year after vaccine excitement started to be priced into the market and a slow cool down of the oil price war helped to stabilize oil prices. While Energy, Financials and Industrials sectors led the market, the Fund underperformed these sectors due to stock selection in the Energy sector and an underweight and stock selection within Financials and Industrials. An overweight position and poor stock selection within the Consumer Staples sector was the largest detractor to fund performance during the quarter. This was offset slightly by strong stock selection within Communication Services sector.
Outlook and Conclusion
TOBAM’s Anti-Benchmark® strategy does not forecast but simply seeks to maximize diversification. Thus, it does not include fundamental analysis of individual stocks, countries, sectors, economic environments or factors. No discretionary tactical or strategic asset allocation decisions are made with respect to specific regions, sectors or industries. TOBAM’s investment process consists of maximizing diversification from a bottom-up perspective. Securities are bought or sold solely in relation to their potential relative
Management's Discussion of Fund Performance (Unaudited) (Continued)
diversification benefits within the portfolio. A security will be completely sold when it no longer provides the most marginal diversification among all available stocks in the universe, and others purchased when they begin to provide more marginal diversification. TOBAM’s patented Anti-Benchmark® approach is designed to avoid explicit and implicit biases in terms of sector, style, market cap and other statistical measures. For this reason, we apply as few constraints as possible and do not rely on any given view or forecast, in order to avoid unwanted systematic exposures. The Fund’s portfolio reflects even risk contributions from all independent effective risk factors in the investment universe, which may include sector and country factors.
Management's Discussion of Fund Performance (Unaudited) (Continued)
Comparison of the Change in Value of a $10,000 Investment in the Touchstone Anti-Benchmark® US Core Equity Fund - Class Y*, the Russell 1000® Index, the S&P 500® Index and the FTSE 3-Month T-Bill Index
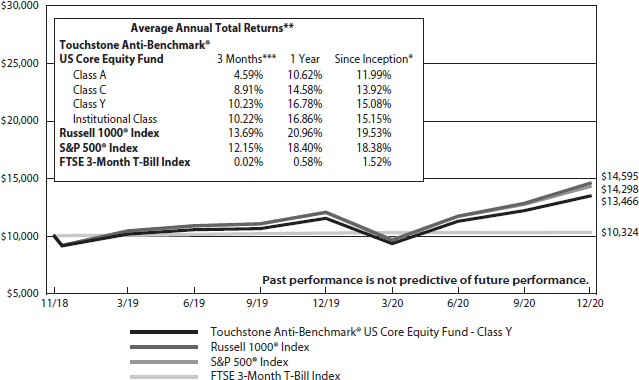
| * | The chart above represents performance of Class Y shares only, which will vary from the performance of Class A shares, Class C shares and Institutional Class shares based on the differences in sales loads and fees paid by shareholders in the different classes. The inception date of Class A shares, Class C shares, Class Y shares and Institutional Class shares was October 2, 2020, October 2, 2020, November 19, 2018, and November 19, 2018, respectively. Class A shares' and Class C shares' performance was calculated using the historical performance of Class Y shares for the periods prior to October 2, 2020. The returns have been restated for sales loads and fees applicable to Class A and Class C. The returns of the indexes listed above are based on the inception date of the Fund. |
| ** | The average annual total returns shown above are adjusted for maximum sales loads and fees, if applicable. The maximum offering price per share of Class A shares is equal to the net asset value (“NAV”) per share plus a sales load equal to 5.26% of the NAV (or 5.00% of the offering price). Class C shares are subject to a contingent deferred sales charge (“CDSC”) of 1.00%. The CDSC will be assessed on an amount equal to the lesser of (1) the NAV at the time of purchase of the shares being redeemed or (2) the NAV of such shares being redeemed, if redeemed within a one-year period from the date of purchase. Class Y shares and Institutional Class shares are not subject to sales charges. |
The performance of the above Fund does not reflect the deduction of taxes that a shareholder would pay on Fund distributions or the redemption of Fund shares.
Notes to Chart
Russell 1000® Index measures the performance of the 1,000 largest companies in the Russell 3000® Index.
S&P 500® Index is a group of 500 widely held stocks and is commonly regarded to be representative of the large capitalization stock universe.
FTSE 3-Month T-Bill Index tracks the performance of U.S. Treasury Bills with a remaining maturity of three months.
The Frank Russell Company (FRC) is the source and owner of the data contained or reflected in this material and all trademarks and copyrights related thereto. The material may contain confidential information and unauthorized use, disclosure, copying, dissemination or redistribution is strictly prohibited. This is a Touchstone Investments presentation of the data, and FRC is not responsible for the formatting or configuration of this material or for any inaccuracy in the presentation thereof.
Management's Discussion of Fund Performance (Unaudited)
Touchstone Dynamic Diversified Income Fund
Sub-Advised by Wilshire Associates Incorporated
Investment Philosophy
The Touchstone Dynamic Diversified Income Fund is a “fund-of-funds,” which seeks to achieve its investment goal of providing investors with current income by investing primarily in a diversified portfolio of fixed-income and equity-income oriented underlying funds (although a portion of its assets may be invested in cash, cash equivalents, or in money market funds). The majority of the underlying funds in which the Fund invests will be affiliated funds; however, the Fund has the ability to invest in unaffiliated underlying funds, including exchange-traded funds (ETFs) and exchange-traded notes (ETNs), to the extent that the desired asset class exposure is not available through Touchstone Funds.
Fund Performance
The Touchstone Dynamic Diversified Income Fund (Class A shares) underperformed both its first benchmark, the Bloomberg Barclays U.S. Aggregate Bond Index, and its second benchmark, the MSCI All Country World Index (ACWI), for the 12-month period ended December 31, 2020. The Fund’s total return was 2.52 percent (calculated excluding the maximum sales charge) while the total return of the Bloomberg Barclays U.S. Aggregate Bond Index was 7.51 percent and the total return of the MSCI ACWI Index was 16.25 percent.
Market Environment
From both societal and investment perspectives, 2020 will be defined by COVID-19 and the impact of severe economic restrictions and unprecedented government responses. As the virus spread to the U.S., the equity market sold-off quickly from February 19 to March 23. In turn, the U.S. Federal Reserve Board (Fed) slashed its overnight rate from 1.5 percent to zero and the U.S. federal government passed a $2.2 trillion stimulus bill. In April alone, the economy shed more than 20 million jobs while Q1 real gross domestic product (GDP) declined by five percent. The 2020 bear market was historically brief, however, bouncing off the lows on March 23 and rallied to a new high by August 12. Despite the social and economic challenges, the U.S. stock market, represented by the Russell 3000® Index increased during 2020. Seven of the eleven major sectors gained during the year, with Consumer Discretionary, Information Technology and Communication Services ending the year with the highest returns. Sectors that declined were Energy and interest rate-sensitive Real Estate, Financials and Utilities. Large capitalization stocks outperformed small caps and growth stocks continued to outperform value equities during the twelve-month period.
Equity markets outside of the U.S. produced positive gains, though less than U.S. markets. The U.K. was on a path to recovery, with Q3 GDP up a record 16 percent, but concerns about a new variant of the COVID-19 virus led to renewed restrictions and the withdrawal of social accommodations granted for holiday gatherings. A second wave of infections hindered other European countries, as well, and the European Central Bank (ECB) responded by expanding its money-printing program by hundreds of billions of euros. U.S. investors in developed markets equities benefited from a weakening U.S. dollar, but still underperformed Emerging Markets equities.
The U.S. Treasury yield curve finished down meaningfully for the year. The 10-year Treasury yield ended the fourth quarter at 0.93 percent. The U.S. Federal Reserve Board (Fed) decreased rates two times in 2020. In December, the Fed reiterated its pledge to support the economic recovery, including an increase in its bond-buying activities. The domestic fixed income market displayed positive returns for the year across all major indexes led by long-term U.S. Treasuries and corporate bonds.
U.S. and global real estate securities declined for the year. Commodities also declined for the one-year period as the price of crude oil fell. Master Limited Partnerships (MLPs) returns were positive during the fourth quarter but produced negative results for 2020. Finally, gold prices were up for 2020.
Portfolio Review
The Fund’s permanent bias towards equity income and MLPs was a significant detractor. These decisions within the equity bucket detracted from relative performance as the defensive nature of the Fund’s equity income allocations failed to keep pace with the MSCI ACWI Index and exposure to MLPs served as a material headwind. However, the Fund’s selection of underlying funds contributed positively to the Fund’s relative returns.
Management's Discussion of Fund Performance (Unaudited) (Continued)
The Fund’s fixed income holdings posted strong positive results, but lagged the Bloomberg Barclays U.S. Aggregate Bond Index. An overweight to below investment grade credit and foreign fixed income weighed on relative returns. The Touchstone Flexible Income Fund and Touchstone Impact Bond Fund were the strongest performers within the fixed income bucket and within the Fund overall.
During 2020, the Fund made a handful of notable allocation changes. In early February, the decision was made to materially reduce credit risk due to concerns that U.S. credit spreads had narrowed too much and could widen materially at the first sign of any negative market or economic stress. We reduced the allocation to each Touchstone Credit Opportunities Fund and Touchstone High Yield Fund and reallocated to the relatively higher quality Touchstone Impact Bond Fund and Touchstone Flexible Income Fund. We did not foresee the impending negative impact of the spread of COVID-19, but we were concerned that risks were growing in the credit market and wanted to position the Fund more conservatively. These changes ultimately benefited the Fund.
In late April, the decision was made to redeploy some credit risk due to liquidity returning to the credit markets and attractive credit spread levels. The Fund trimmed its exposure to the Touchstone Impact Bond Fund and reallocated the capital to the Touchstone High Yield Fund in order to increase credit risk and take advantage of wide domestic credit spreads. In addition, the allocation to the VanEck Vectors JP Morgan Emerging Markets Local Currency Bond ETF was reduced and reallocated evenly to the Touchstone High Yield Fund and Touchstone Credit Opportunities Fund in order to favor U.S. credit over Emerging Markets Debt.
During the second quarter of 2020, within equities, the Fund eliminated its allocation to the WisdomTree Emerging Markets High Dividend ETF and reallocated evenly to the Touchstone Value Fund and iShares MSCI EAFE Value ETF in order to remove the overweight to emerging markets equity and reduce the overall allocation to foreign equities. The decision to reduce emerging markets exposure was related to the risk that COVID-19 presented to Emerging Markets, particularly with respect to the more limited ability of many emerging economies to deal with the humanitarian crisis of this pandemic. The other notable change was the decision made to trim from JPMorgan Alerian MLP ETN and reallocate to Vanguard High Dividend Yield ETF due to falling conviction in the MLP structure, tempered with an expectation that oil prices have troughed and would likely rise in the coming months.
In late July, the decision was made to further reduce long-term MLP exposure by trimming from the JPMorgan Alerian MLP ETN and reallocating evenly to the Vanguard High Dividend Yield ETF and iShares International Select Dividend ETF due to falling conviction in the MLP structure, tempered by the potential for MLPs to rally in coming months and still provide attractive levels of yield.
In late October, the decision was made to eliminate the remaining allocation to the JPMorgan Alerian MLP ETN and reallocate evenly to the Touchstone Value Fund, Vanguard High Dividend Yield ETF and iShares International Select Dividend ETF due to falling conviction in the MLP structure. This change modestly increased exposure to foreign equity income and reduced expected income in the short-term. It is expected that the MLPs will continue to cut their income payouts, but in the short-term the MLP yield will likely remain much higher than other portfolio investments. The high income potential, however, does not offset the falling conviction in the MLP structure.
Outlook
Although much remains uncertain at the start of 2021, we remain optimistic about risk assets and believe the Fund is well-positioned for the year ahead. Although we believe that volatility may be elevated over the year. Global economic fundamentals have potential for improvement in 2021, particularly if central banks remain accommodative and progress in fighting the pandemic continues on pace.
The Fund continues to be positioned in a mildly conservative manner relative to its long-term strategic target. Overall, we continue to believe that the Fund is best served by remaining invested in risk assets, but we will continue to seek to mitigate risk where appropriate. In fixed income, the Fund remains overweight credit, relative to government. In domestic equities, it remains overweight value, relative to growth equities.
Management's Discussion of Fund Performance (Unaudited) (Continued)
Comparison of the Change in Value of a $10,000 Investment in the Touchstone Dynamic
Diversified Income Fund - Class A*, the Bloomberg Barclays U.S. Aggregate Bond Index and the MSCI All Country
World Index
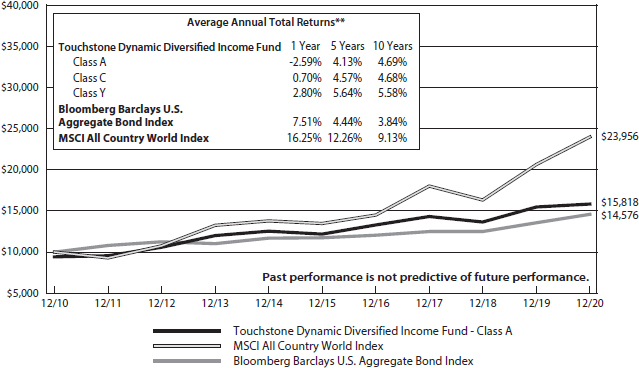
| * | The chart above represents performance of Class A shares only, which will vary from the performance of Class C shares and Class Y shares based on the differences in sales loads and fees paid by shareholders in the different classes. |
| ** | The average annual total returns shown above are adjusted for maximum sales loads and fees, if applicable. The maximum offering price per share of Class A shares is equal to the net asset value (“NAV”) per share plus a sales load equal to 5.26% of the NAV (or 5.00% of the offering price). Class C shares are subject to a contingent deferred sales charge (“CDSC”) of 1.00%. The CDSC will be assessed on an amount equal to the lesser of (1) the NAV at the time of purchase of the shares being redeemed or (2) the NAV of such shares being redeemed, if redeemed within a one-year period from the date of purchase. Class Y shares are not subject to sales charges. |
The performance of the above Fund does not reflect the deduction of taxes that a shareholder would pay on Fund distributions or the redemption of Fund shares.
Notes to Chart
Bloomberg Barclays U.S. Aggregate Bond Index is an unmanaged index comprised of U.S. investment grade, fixed rate bond market securities, including government, government agency, corporate and mortgage-backed securities between one and ten years.
MSCI All Country World Index is an unmanaged index that measures the equity market performance of developed and emerging markets.
Source: MSCI. MSCI makes no express or implied warranties or representations and shall have no liability whatsoever with respect to any MSCI data contained herein. The MSCI data may not be further redistributed or used to create indices or financial products. This report is not approved or produced by MSCI.
Management's Discussion of Fund Performance (Unaudited)
Touchstone Dynamic Global Allocation Fund
Sub-Advised by Wilshire Associates Incorporated
Investment Philosophy
The Touchstone Dynamic Global Allocation Fund is a “fund-of-funds,” which seeks to achieve its investment goal of providing investors with capital appreciation by primarily investing in a diversified portfolio of underlying equity and fixed-income funds. These underlying funds, in turn, invest in a variety of U.S. and foreign equity and fixed-income securities (although a portion of its assets may be invested in cash, cash equivalents, or in money market funds). The majority of the underlying funds in which the Fund invests will be affiliated funds; however, the Fund has the ability to invest in unaffiliated underlying funds, including exchange-traded funds (ETFs) and exchange-traded notes (ETNs), to the extent that the desired asset class exposure is not available through Touchstone Funds.
Fund Performance
The Touchstone Dynamic Global Allocation Fund (Class A shares) underperformed its primary benchmark the MSCI All Country World Index (ACWI), but outperformed its secondary benchmark the Bloomberg Barclays Global Aggregate Index for the 12-month period ended December 31, 2020. The Fund’s total return was 13.09 percent (calculated excluding the maximum sales charge) while the total return of the MSCI ACWI was 16.25 percent and the total return of the Bloomberg Barclays Global Aggregate Index was 9.20 percent.
Market Environment
From both societal and investment perspectives, 2020 will be defined by COVID-19 and the impact of severe economic restrictions and unprecedented government responses. As the virus spread to the U.S., the equity market sold-off quickly from February 19 to March 23. In turn, the U.S. Federal Reserve Board (Fed) slashed its overnight rate from 1.5 percent to zero and the U.S. federal government passed a $2.2 trillion stimulus bill. In April alone, the economy shed more than 20 million jobs while Q1 real gross domestic product (GDP) declined by five percent. The 2020 bear market was historically brief, however, bouncing off the lows on March 23 and rallied to a new high by August 12. Despite the social and economic challenges, the U.S. stock market, represented by the Russell 3000® Index increased during 2020. Seven of the eleven major sectors gained during the year, with Consumer Discretionary, Information Technology and Communication Services ending the year with the highest returns. Sectors that declined were Energy and interest rate-sensitive Real Estate, Financials and Utilities. Large capitalization stocks outperformed small caps and growth stocks continued to outperform value equities during the twelve-month period.
Equity markets outside of the U.S. produced positive gains, though less than U.S. markets. The U.K. was on a path to recovery, with Q3 GDP up a record 16 percent, but concerns about a new variant of the COVID-19 virus led to renewed restrictions and the withdrawal of social accommodations granted for holiday gatherings. A second wave of infections hindered other European countries, as well, and the European Central Bank responded by expanding its money-printing program by hundreds of billions of euros. U.S. investors in developed markets equities benefitted from a weakening U.S. dollar, but still underperformed Emerging Markets equities.
The U.S. Treasury yield curve finished down meaningfully for the year. The 10-year Treasury yield ended the fourth quarter at 0.93 percent. The Fed decreased rates two times in 2020. In December, the Fed reiterated its pledge to support the economic recovery, including an increase in its bond-buying activities. The domestic fixed income market displayed positive returns for the year across all major indexes led by long-term U.S. Treasuries and corporate bonds.
U.S. and global real estate securities declined for the year. Commodities also declined for the one-year period as the price of crude oil fell. Master Limited Partnerships (MLPs) returns were positive during the fourth quarter but produced negative results for 2020. Finally, gold prices were up for 2020.
Portfolio Review
A generally strong global equity market environment helped lead the Fund to strong absolute returns for the year. Returns were largely dominated by domestic large cap equities. Individual manager performance within the equity bucket was a positive contributor to returns during the year, while allocation decisions within the equity bucket detracted, with the overweight to U.S. value equities and structural overweight to small cap equities weighing on returns.
Management's Discussion of Fund Performance (Unaudited) (Continued)
On a stand-alone basis, the Fund’s “fixed income bucket” underperformed the Bloomberg Barclays Global Aggregate Index as allocations that materially underweight unhedged foreign developed fixed income detracted from performance. An overweight to domestic credit that was implemented early in the 2nd quarter of 2020 benefited Fund returns throughout the remainder of 2020.
For the year, the Fund’s allocation to Touchstone Sands Capital Institutional Growth Fund which was merged into the Touchstone Sands Capital Select Growth Fund – INST Class in mid-December 2020 and Touchstone Sands Capital Emerging Markets Growth Fund were the two strongest performing allocations on the stand-alone basis. In terms of contribution to returns, the most notable contributions were from the Touchstone Sands Capital Select Growth Fund and Touchstone Growth Opportunities Fund. Allocations to the Touchstone International Small Cap (partial year holding) and iShares MSCI EAFE Value ETF were modest detractors to Fund returns during the year.
During 2020, the Fund made several notable allocation changes. In early February, the decision was made to modestly reduce credit risk due to concerns that U.S. credit spreads had narrowed too much and could widen materially at the first sign of any negative market or economic stress. The allocation to the Touchstone Credit Opportunities was reallocated to the relatively higher quality Touchstone Impact Bond Fund. While we did not foresee the impending negative impact of the spread of COVID-19, we were concerned that risks were growing in the credit market and wanted the relatively conservative positioning of the Fund’s credit exposure to be even more conservative. In addition, we modestly trimmed exposure to the Touchstone Small Cap Value Fund and Touchstone Mid Cap Fund and rotated into the Touchstone Value Fund.
In late April, the decision was made to redeploy some credit risk due to liquidity returning to the credit markets and attractive credit spread levels. The Fund initiated an allocation to the Touchstone High Yield, sourced from the Touchstone Impact Bond and from Touchstone Ultra Short Duration Fixed Income Fund and increased the Fund’s credit risk to take advantage of wide domestic credit spreads. In addition, the allocation to the VanEck Vectors JP Morgan Emerging Markets Local Currency Bond ETF was eliminated and reallocated to the iShares International Treasury Bond ETF and Vanguard Total International Bond ETF in order to eliminate the Fund’s overweight to emerging markets debt, relative to foreign developed fixed income.
In the second quarter of 2020, the Fund’s positions in Touchstone Anti-Benchmark® International Core Equity Fund, iShares MSCI EAFE Value ETF and Touchstone International Growth Opportunities Fund were reduced and those proceeds were reallocated to Touchstone Value Fund and Touchstone Growth Opportunities Fund in order to remove the Fund’s overweight to foreign equities due to our reduced conviction in foreign equities relative to U.S. equities. The U.S. had provided substantially more fiscal and monetary stimulus relative to foreign developed nations and demonstrated effective collaboration across political party lines. The structural headwinds that Europe faced with a unified monetary policy applied to differentiated economies had been more challenging in recovering from the downturn. The Fund also trimmed from Touchstone Small Cap Value Fund and reallocated to Touchstone Sands Capital Institutional Growth Fund (which was merged into the Touchstone Sands Capital Select Growth Fund – INST Class) in order to remove the Fund’s overweight to domestic small cap equities. Given the rapid deterioration of the economy and uncertainty regarding when the economic recovery would begin, the decision was made to reduce exposure to more economically sensitive small capitalization equities.
Outlook
Although much remains uncertain at the start of 2021, we remain optimistic about risk assets and believe the Fund is well-positioned for the year ahead, although we believe that volatility may be elevated over the year. Global economic fundamentals have potential for improvement in 2021, particularly if central banks remain accommodative and progress in fighting the pandemic continues on pace.
The Fund is positioned roughly in line with its long-term strategic target. Overall, we continue to believe that the Fund is best served by remaining invested in risk assets, but we will continue to seek to mitigate risk where appropriate. Within fixed income, the Fund remains overweight credit, relative to government. In domestic equities, the Fund remains overweight value relative to growth equities, and within foreign equities, we favor emerging markets over developed markets.
Management's Discussion of Fund Performance (Unaudited) (Continued)
Comparison of the Change in Value of a $10,000 Investment in the Touchstone Dynamic
Global Allocation Fund - Class A*, the MSCI All Country World Index and the Bloomberg Barclays Global Aggregate Index
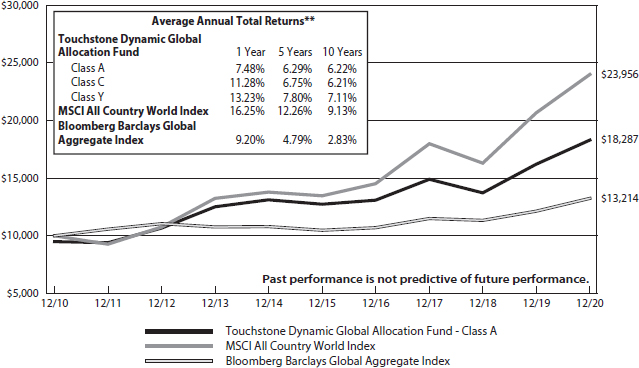
| * | The chart above represents performance of Class A shares only, which will vary from the performance of Class C shares and Class Y shares based on the differences in sales loads and fees paid by shareholders in the different classes. |
| ** | The average annual total returns shown above are adjusted for maximum sales loads and fees, if applicable. The maximum offering price per share of Class A shares is equal to the net asset value (“NAV”) per share plus a sales load equal to 5.26% of the NAV (or 5.00% of the offering price). Class C shares are subject to a contingent deferred sales charge (“CDSC”) of 1.00%. The CDSC will be assessed on an amount equal to the lesser of (1) the NAV at the time of purchase of the shares being redeemed or (2) the NAV of such shares being redeemed, if redeemed within a one-year period from the date of purchase. Class Y shares are not subject to sales charges. |
The performance of the above Fund does not reflect the deduction of taxes that a shareholder would pay on Fund distributions or the redemption of Fund shares.
Notes to Chart
MSCI All Country World Index is an unmanaged index that measures the equity market performance of developed and emerging markets.
Bloomberg Barclays Global Aggregate Index is an unmanaged index that measures global investment grade debt from twenty-four local currency markets. This multi-currency benchmark includes treasury, government-related, corporate and securitized fixed-rate bonds from both developed and emerging markets issuers.
Source: MSCI. MSCI makes no express or implied warranties or representations and shall have no liability whatsoever with respect to any MSCI data contained herein. The MSCI data may not be further redistributed or used to create indices or financial products. This report is not approved or produced by MSCI.
Tabular Presentation of Portfolios of Investments (Unaudited)
December 31, 2020
The tables below provide each Fund’s sector allocation. We hope it will be useful to shareholders as it summarizes key information about each Fund’s investments.
| Touchstone Anti-Benchmark® US Core Equity Fund | | | | |
| Sector Allocation* | | | (% of Net Assets) | |
| Consumer Staples | | | 22.1 | % |
| Consumer Discretionary | | | 17.3 | |
| Health Care | | | 17.0 | |
| Information Technology | | | 9.8 | |
| Communication Services | | | 7.9 | |
| Real Estate | | | 6.1 | |
| Financials | | | 5.9 | |
| Materials | | | 5.7 | |
| Utilities | | | 3.3 | |
| Energy | | | 2.4 | |
| Industrials | | | 2.1 | |
| Short-Term Investment Fund | | | 0.6 | |
| Other Assets/Liabilities (Net) | | | (0.2 | ) |
| Total | | | 100.0 | % |
| Touchstone Dynamic Diversified Income Fund | | | | |
| Sector Allocation | | | (% of Net Assets) | |
| Affiliated Mutual Funds | | | | |
| Fixed Income Funds | | | 60.0 | % |
| Equity Funds | | | 10.6 | |
| Exchange-Traded Funds | | | 28.4 | |
| Short-Term Investment Funds | | | 5.0 | |
| Other Assets/Liabilities (Net) | | | (4.0 | ) |
| Total | | | 100.0 | % |
| Touchstone Dynamic Global Allocation Fund | | | | |
| Sector Allocation | | | (% of Net Assets) | |
| Affiliated Mutual Funds | | | | |
| Equity Funds | | | 52.8 | % |
| Fixed Income Funds | | | 23.7 | |
| Exchange-Traded Funds | | | 22.7 | |
| Short-Term Investment Funds | | | 5.9 | |
| Other Assets/Liabilities (Net) | | | (5.1 | ) |
| Total | | | 100.0 | % |
* Sector classifications are based upon the Global Industry Classification Standard (GICS®).
Portfolio of Investments
Touchstone Anti-Benchmark® US Core Equity Fund – December 31, 2020
| | | Shares | | | Market
Value | |
| Common Stocks — 99.6% | | | | | | | | |
| Consumer Staples — 22.1% | | | | | | | | |
| Boston Beer Co., Inc.(The) - Class A* | | | 428 | | | $ | 425,556 | |
| Campbell Soup Co. | | | 28,386 | | | | 1,372,463 | |
| Church & Dwight Co., Inc. | | | 1,638 | | | | 142,883 | |
| Clorox Co. (The) | | | 6,461 | | | | 1,304,605 | |
| Conagra Brands, Inc. | | | 32,091 | | | | 1,163,620 | |
| General Mills, Inc. | | | 16,624 | | | | 977,491 | |
| Hormel Foods Corp. | | | 3,937 | | | | 183,504 | |
| JM Smucker Co. (The) | | | 12,057 | | | | 1,393,789 | |
| Kellogg Co. | | | 9,218 | | | | 573,636 | |
| Keurig Dr Pepper, Inc. | | | 19,655 | | | | 628,960 | |
| Kraft Heinz Co. (The) | | | 14,101 | | | | 488,741 | |
| Kroger Co. (The) | | | 45,640 | | | | 1,449,526 | |
| Lamb Weston Holdings, Inc. | | | 7,984 | | | | 628,660 | |
| | | | | | | | 10,733,434 | |
| | | | | | | | | |
| Consumer Discretionary — 17.3% | | | | | | | | |
| Aramark | | | 7,747 | | | | 298,105 | |
| Bright Horizons Family Solutions, Inc.* | | | 586 | | | | 101,372 | |
| Carnival Corp. | | | 10,077 | | | | 218,268 | |
| Chegg, Inc.* | | | 13,176 | | | | 1,190,188 | |
| Chipotle Mexican Grill, Inc.* | | | 371 | | | | 514,469 | |
| Dollar Tree, Inc.* | | | 8,182 | | | | 883,983 | |
| Domino's Pizza, Inc. | | | 3,731 | | | | 1,430,689 | |
| Expedia Group, Inc. | | | 608 | | | | 80,499 | |
| Las Vegas Sands Corp. | | | 4,240 | | | | 252,704 | |
| Marriott International, Inc. - Class A | | | 5,740 | | | | 757,221 | |
| Peloton Interactive, Inc. - Class A* | | | 4,222 | | | | 640,562 | |
| Royal Caribbean Cruises Ltd. | | | 3,233 | | | | 241,473 | |
| Target Corp. | | | 1,041 | | | | 183,768 | |
| Ulta Beauty, Inc.* | | | 231 | | | | 66,334 | |
| Vail Resorts, Inc. | | | 584 | | | | 162,913 | |
| Wynn Resorts Ltd. | | | 964 | | | | 108,768 | |
| Yum China Holdings, Inc. (China) | | | 22,532 | | | | 1,286,352 | |
| | | | | | | | 8,417,668 | |
| | | | | | | | | |
| Health Care — 17.0% | | | | | | | | |
| 10X Genomics, Inc. - Class A* | | | 815 | | | | 115,404 | |
| ABIOMED, Inc.* | | | 4,665 | | | | 1,512,393 | |
| Alnylam Pharmaceuticals, Inc.* | | | 1,945 | | | | 252,792 | |
| Biogen, Inc.* | | | 3,655 | | | | 894,963 | |
| DENTSPLY SIRONA, Inc. | | | 3,267 | | | | 171,060 | |
| DexCom, Inc.* | | | 677 | | | | 250,300 | |
| Exact Sciences Corp.* | | | 998 | | | | 132,225 | |
| Gilead Sciences, Inc. | | | 16,515 | | | | 962,164 | |
| Guardant Health, Inc.* | | | 453 | | | | 58,383 | |
| Insulet Corp.* | | | 1,509 | | | | 385,746 | |
| Jazz Pharmaceuticals PLC* | | | 4,523 | | | | 746,521 | |
| Moderna, Inc.* | | | 4,354 | | | | 454,862 | |
| Neurocrine Biosciences, Inc.* | | | 2,466 | | | | 236,366 | |
| Regeneron Pharmaceuticals, Inc.* | | | 349 | | | | 168,605 | |
| Sarepta Therapeutics, Inc.* | | | 2,278 | | | | 388,376 | |
| Seagen, Inc.* | | | 642 | | | | 112,440 | |
| Teladoc Health, Inc.* | | | 4,757 | | | | 951,210 | |
| Viatris, Inc.* | | | 23,773 | | | | 445,506 | |
| | | | | | | | 8,239,316 | |
| | | | | | | | | |
| Information Technology — 9.8% | | | | | | | | |
| Atlassian Corp. PLC - Class A* | | | 311 | | | | 72,734 | |
| Citrix Systems, Inc. | | | 2,014 | | | | 262,021 | |
| Cloudflare, Inc. - Class A* | | | 2,039 | | | | 154,944 | |
| DocuSign, Inc.* | | | 4,665 | | | | 1,037,029 | |
| Fastly, Inc. - Class A* | | | 5,194 | | | | 453,800 | |
| NortonLifeLock, Inc. | | | 46,723 | | | | 970,904 | |
| RingCentral, Inc. - Class A* | | | 436 | | | | 165,231 | |
| Zoom Video Communications, Inc. - Class A* | | | 1,919 | | | | 647,317 | |
| Zscaler, Inc.* | | | 5,072 | | | | 1,012,929 | |
| | | | | | | | 4,776,909 | |
| | | | | | | | | |
| Communication Services — 7.9% | | | | | | | | |
| Discovery, Inc. - Class C* | | | 12,984 | | | | 340,051 | |
| Fox Corp. - Class A | | | 3,991 | | | | 116,218 | |
| Match Group, Inc.* | | | 2,565 | | | | 387,802 | |
| Roku, Inc.* | | | 2,438 | | | | 809,465 | |
| Snap, Inc. - Class A* | | | 16,223 | | | | 812,286 | |
| Spotify Technology SA* | | | 3,460 | | | | 1,088,724 | |
| Verizon Communications, Inc. | | | 5,192 | | | | 305,030 | |
| | | | | | | | 3,859,576 | |
| | | | | | | | | |
| Real Estate — 6.1% | | | | | | | | |
| Extra Space Storage, Inc. REIT | | | 10,929 | | | | 1,266,234 | |
| Federal Realty Investment Trust REIT | | | 2,079 | | | | 176,964 | |
| Host Hotels & Resorts, Inc. REIT | | | 15,067 | | | | 220,430 | |
| Public Storage REIT | | | 3,078 | | | | 710,803 | |
| Regency Centers Corp. REIT | | | 2,063 | | | | 94,052 | |
| Simon Property Group, Inc. REIT | | | 5,511 | | | | 469,978 | |
| | | | | | | | 2,938,461 | |
| | | | | | | | | |
| Financials — 5.9% | | | | | | | | |
| AGNC Investment Corp. | | | 35,362 | | | | 551,647 | |
| Annaly Capital Management, Inc. | | | 98,057 | | | | 828,582 | |
| Cboe Global Markets, Inc. | | | 5,094 | | | | 474,353 | |
| Credicorp Ltd. (Peru) | | | 1,184 | | | | 194,200 | |
| Huntington Bancshares, Inc. | | | 10,404 | | | | 131,403 | |
| M&T Bank Corp. | | | 1,805 | | | | 229,777 | |
| MarketAxess Holdings, Inc. | | | 809 | | | | 461,583 | |
| | | | | | | | 2,871,545 | |
| | | | | | | | | |
| Materials — 5.7% | | | | | | | | |
| Newmont Corp. | | | 22,738 | | | | 1,361,779 | |
| Royal Gold, Inc. | | | 11,476 | | | | 1,220,587 | |
| Vulcan Materials Co. | | | 1,388 | | | | 205,854 | |
| | | | | | | | 2,788,220 | |
| | | | | | | | | |
| Utilities — 3.3% | | | | | | | | |
| Consolidated Edison, Inc. | | | 12,436 | | | | 898,750 | |
| Eversource Energy | | | 620 | | | | 53,636 | |
| PG&E Corp.* | | | 54,001 | | | | 672,852 | |
| | | | | | | | 1,625,238 | |
| | | | | | | | | |
| Energy — 2.4% | | | | | | | | |
| Cabot Oil & Gas Corp. | | | 28,986 | | | | 471,892 | |
| Diamondback Energy, Inc. | | | 13,833 | | | | 669,517 | |
| | | | | | | | 1,141,409 | |
| | | | | | | | | |
| Industrials — 2.1% | | | | | | | | |
| CH Robinson Worldwide, Inc. | | | 3,298 | | | | 309,583 | |
| IAA, Inc.* | | | 5,458 | | | | 354,661 | |
| Lyft, Inc. - Class A* | | | 2,960 | | | | 145,425 | |
| Plug Power, Inc.* | | | 2,239 | | | | 75,924 | |
| Watsco, Inc. | | | 681 | | | | 154,281 | |
| | | | | | | | 1,039,874 | |
| Total Common Stocks | | | | | | $ | 48,431,650 | |
Touchstone Anti-Benchmark® US Core Equity Fund (Continued)
| | | Shares | | | Market
Value | |
| Short-Term Investment Fund — 0.6% | | | | | | | | |
| Dreyfus Government Cash Management, Institutional Shares, 0.03%∞Ω | | | 286,491 | | | $ | 286,491 | |
| | | | | | | | | |
| Total Investment Securities —100.2% | | | | | | | | |
| (Cost $41,847,112) | | | | | | $ | 48,718,141 | |
| | | | | | | | | |
| Liabilities in Excess of Other Assets — (0.2%) | | | | | | | (94,045 | ) |
| | | | | | | | | |
| Net Assets — 100.0% | | | | | | $ | 48,624,096 | |
| * | Non-income producing security. |
| ∞ | Open-End Fund. |
| Ω | Represents the 7-day SEC yield as of December 31, 2020. |
Portfolio Abbreviations:
PLC - Public Limited Company
REIT - Real Estate Investment Trust
Other Information:
The inputs or methodology used for valuing securities may not be an indication of the risk associated with investing in those securities. For more information on valuation inputs, and their aggregation into the levels used in the table below, please refer to the security valuation section in the accompanying Notes to Financial Statements.
| Valuation inputs at Reporting Date: | |
| Description | | | Level 1 | | | | Level 2 | | | | Level 3 | | | | Total | |
| Common Stocks | | $ | 48,431,650 | | | $ | — | | | $ | — | | | $ | 48,431,650 | |
| Short-Term Investment Fund | | | 286,491 | | | | — | | | | — | | | | 286,491 | |
| Total | | $ | 48,718,141 | | | $ | — | | | $ | — | | | $ | 48,718,141 | |
See accompanying Notes to Financial Statements.
Portfolio of Investments
Touchstone Dynamic Diversified Income Fund – December 31, 2020
| | | Shares | | | Market
Value | |
| Affiliated Mutual Funds~^∞ — 70.6% | | | | | | | | |
| Fixed Income Funds — 60.0% | | | | | | | | |
| Touchstone Credit Opportunities Fund | | | 856,662 | | | $ | 8,592,320 | |
| Touchstone Flexible Income Fund | | | 602,231 | | | | 6,775,101 | |
| Touchstone High Yield Fund | | | 671,847 | | | | 5,703,977 | |
| Touchstone Impact Bond Fund | | | 1,196,070 | | | | 12,929,520 | |
| | | | | | | | 34,000,918 | |
| | | | | | | | | |
| Equity Funds — 10.6% | | | | | | | | |
| Touchstone Value Fund | | | 622,593 | | | | 6,045,381 | |
| Total Affiliated Mutual Funds | | | | | | $ | 40,046,299 | |
| | | | | | | | | |
| Exchange-Traded Funds~ — 28.4% | | | | | | | | |
| iShares International Select Dividend ETF | | | 98,286 | | | | 2,896,488 | |
| iShares MSCI EAFE Value ETF† | | | 48,169 | | | | 2,273,577 | |
| VanEck Vectors J.P. Morgan EM Local Currency Bond ETF | | | 35,295 | | | | 1,174,265 | |
| Vanguard Emerging Markets Government Bond ETF† | | | 14,025 | | | | 1,154,258 | |
| Vanguard Global ex-U.S. Real Estate ETF | | | 31,936 | | | | 1,734,444 | |
| Vanguard High Dividend Yield ETF | | | 56,148 | | | | 5,138,103 | |
| Vanguard REIT ETF | | | 20,033 | | | | 1,701,403 | |
| Total Exchange-Traded Funds | | | | | | $ | 16,072,538 | |
| | | | | | | | | |
| Short-Term Investment Funds — 5.0% | | | | | | | | |
| Dreyfus Government Cash Management, Institutional Shares, 0.03%∞Ω | | | 535,591 | | | | 535,591 | |
| Invesco Government & Agency Portfolio, Institutional Class, 0.03%**∞Ω | | | 2,288,940 | | | | 2,288,940 | |
| Total Short-Term Investment Funds | | | | | | $ | 2,824,531 | |
| | | | | | | | | |
| Total Investment Securities —104.0% | | | | | | | | |
| (Cost $58,046,933) | | | | | | $ | 58,943,368 | |
| | | | | | | | | |
| Liabilities in Excess of Other Assets — (4.0%) | | | | | | | (2,254,689 | ) |
| | | | | | | | | |
| Net Assets — 100.0% | | | | | | $ | 56,688,679 | |
| ** | Represents collateral for securities loaned. |
| ^ | All affiliated funds are invested in the Institutional Class, unless otherwise indicated. |
| ~ | The financial statements of the underlying funds can be found on the SEC website. |
| † | All or a portion of the security is on loan. The total market value of the securities on loan as of December 31, 2020 was $2,217,190. |
| ∞ | Open-End Fund. |
| Ω | Represents the 7-day SEC yield as of December 31, 2020. |
Portfolio Abbreviations:
ETF - Exchange-Traded Fund REIT - Real Estate Investment Trust
Other Information:
The inputs or methodology used for valuing securities may not be an indication of the risk associated with investing in those securities. For more information on valuation inputs, and their aggregation into the levels used in the table below, please refer to the security valuation section in the accompanying Notes to Financial Statements.
| Valuation inputs at Reporting Date: | |
| Description | | | Level 1 | | | | Level 2 | | | | Level 3 | | | | Total | |
| Affiliated Mutual Funds | | $ | 40,046,299 | | | $ | — | | | $ | — | | | $ | 40,046,299 | |
| Exchange-Traded Funds | | | 16,072,538 | | | | — | | | | — | | | | 16,072,538 | |
| Short-Term Investment Funds | | | 2,824,531 | | | | — | | | | — | | | | 2,824,531 | |
| Total | | $ | 58,943,368 | | | $ | — | | | $ | — | | | $ | 58,943,368 | |
See accompanying Notes to Financial Statements.
Portfolio of Investments
Touchstone Dynamic Global Allocation Fund – December 31, 2020
| | | Shares | | | Market
Value | |
| Affiliated Mutual Funds~^∞ — 76.5% | | | | | | | | |
| Equity Funds — 52.8% | | | | | | | | |
| Touchstone Anti-Benchmark® International Core Equity Fund | | | 767,712 | | | $ | 9,082,029 | |
| Touchstone Growth Opportunities Fund | | | 169,926 | | | | 7,255,842 | |
| Touchstone International Growth Fund | | | 295,537 | | | | 4,495,125 | |
| Touchstone Mid Cap Fund | | | 40,263 | | | | 1,787,292 | |
| Touchstone Sands Capital Emerging Markets Growth Fund | | | 128,026 | | | | 2,806,340 | |
| Touchstone Sands Capital Select Growth Fund | | | 278,904 | | | | 5,681,280 | |
| Touchstone Small Cap Value Fund | | | 66,453 | | | | 1,781,595 | |
| Touchstone Value Fund | | | 1,468,720 | | | | 14,261,275 | |
| | | | | | | | 47,150,778 | |
| | | | | | | | | |
| Fixed Income Funds — 23.7% | | | | | | | | |
| Touchstone Credit Opportunities Fund | | | 271,017 | | | | 2,718,304 | |
| Touchstone High Yield Fund | | | 316,158 | | | | 2,684,179 | |
| Touchstone Impact Bond Fund | | | 1,139,506 | | | | 12,318,055 | |
| Touchstone Ultra Short Duration Fixed Income Fund | | | 379,350 | | | | 3,501,404 | |
| | | | | | | | 21,221,942 | |
| Total Affiliated Mutual Funds | | | | | | $ | 68,372,720 | |
| | | | | | | | | |
| Exchange-Traded Funds~ — 22.7% | | | | | | | | |
| iShares Core MSCI Emerging Markets ETF | | | 58,238 | | | | 3,613,086 | |
| iShares International Treasury Bond ETF† | | | 96,093 | | | | 5,338,927 | |
| iShares MSCI EAFE Value ETF† | | | 73,561 | | | | 3,472,079 | |
| Vanguard Emerging Markets Government Bond ETF | | | 32,161 | | | | 2,646,850 | |
| Vanguard Total International Bond ETF | | | 89,130 | | | | 5,218,562 | |
| Total Exchange-Traded Funds | | | | | | $ | 20,289,504 | |
| | | | | | | | | |
| Short-Term Investment Funds — 5.9% | | | | | | | | |
| Dreyfus Government Cash Management, Institutional Shares, 0.03%∞Ω | | | 804,278 | | | | 804,278 | |
| Invesco Government & Agency Portfolio, Institutional Class, 0.03%**∞Ω | | | 4,432,320 | | | | 4,432,320 | |
| Total Short-Term Investment Funds | | | | | | $ | 5,236,598 | |
| | | | | | | | | |
| Total Investment Securities —105.1% | | | | | | | | |
| (Cost $84,813,272) | | | | | | $ | 93,898,822 | |
| | | | | | | | | |
| Liabilities in Excess of Other Assets — (5.1%) | | | | | | | (4,524,778 | ) |
| | | | | | | | | |
| Net Assets — 100.0% | | | | | | $ | 89,374,044 | |
| ** | Represents collateral for securities loaned. |
| ^ | All affiliated funds are invested in the Institutional Class, unless otherwise indicated. |
| ~ | The financial statements of the underlying funds can be found on the SEC website. |
| † | All or a portion of the security is on loan. The total market value of the securities on loan as of December 31, 2020 was $4,297,340. |
| ∞ | Open-End Fund. |
| Ω | Represents the 7-day SEC yield as of December 31, 2020. |
Portfolio Abbreviations:
ETF - Exchange-Traded Fund
Other Information:
The inputs or methodology used for valuing securities may not be an indication of the risk associated with investing in those securities. For more information on valuation inputs, and their aggregation into the levels used in the table below, please refer to the security valuation section in the accompanying Notes to Financial Statements.
| Valuation inputs at Reporting Date: | |
| Description | | | Level 1 | | | | Level 2 | | | | Level 3 | | | | Total | |
| Affiliated Mutual Funds | | $ | 68,372,720 | | | $ | — | | | $ | — | | | $ | 68,372,720 | |
| Exchange-Traded Funds | | | 20,289,504 | | | | | | | | | | | | 20,289,504 | |
| Short-Term Investment Funds | | | 5,236,598 | | | | — | | | | — | | | | 5,236,598 | |
| Total | | $ | 93,898,822 | | | $ | — | | | $ | — | | | $ | 93,898,822 | |
See accompanying Notes to Financial Statements.
Statements of Assets and Liabilities
December 31, 2020
| | | Touchstone Anti-Benchmark® US Core Equity Fund | | | Touchstone Dynamic Diversified Income Fund | | | Touchstone Dynamic Global Allocation Fund | |
| Assets | | | | | | | | | | | | |
| Affiliated securities, at cost | | $ | — | | | $ | 39,705,323 | | | $ | 60,742,977 | |
| Non-affiliated securities, at cost | | | 41,847,112 | | | | 18,341,610 | | | | 24,070,295 | |
| Affiliated securities, at market value | | $ | — | | | $ | 40,046,299 | | | $ | 68,372,720 | |
| Non-affiliated securities, at market value(A) | | | 48,718,141 | | | | 18,897,069 | | | | 25,526,102 | |
| Dividends and interest receivable | | | 42,606 | | | | 4,560 | | | | — | |
| Receivable for capital shares sold | | | 161 | | | | 45,931 | | | | 2,872 | |
| Receivable for investments sold | | | — | | | | 104,554 | | | | 72,224 | |
| Receivable for securities lending income | | | 1,279 | | | | 1,852 | | | | 2,201 | |
| Other assets | | | 1,810 | | | | 15,227 | | | | 14,774 | |
| Total Assets | | | 48,763,997 | | | | 59,115,492 | | | | 93,990,893 | |
| Liabilities | | | | | | | | | | | | |
| Bank overdrafts | | | 160 | | | | — | | | | — | |
| Payable for return of collateral for securities on loan | | | — | | | | 2,288,940 | | | | 4,432,320 | |
| Payable for capital shares redeemed | | | 46,295 | | | | 5,830 | | | | 38,807 | |
| Payable to Investment Advisor | | | 14,949 | | | | 41,810 | | | | 10,541 | |
| Payable to other affiliates | | | 11,090 | | | | 9,122 | | | | 13,109 | |
| Payable to Trustees | | | 9,746 | | | | 9,746 | | | | 9,746 | |
| Payable for professional services | | | 24,555 | | | | 23,562 | | | | 24,135 | |
| Payable for transfer agent services | | | 8,600 | | | | 35,018 | | | | 74,423 | |
| Payable for reports to shareholders | | | 9,054 | | | | 6,936 | | | | 8,021 | |
| Other accrued expenses and liabilities | | | 15,452 | | | | 5,849 | | | | 5,747 | |
| Total Liabilities | | | 139,901 | | | | 2,426,813 | | | | 4,616,849 | |
| Net Assets | | $ | 48,624,096 | | | $ | 56,688,679 | | | $ | 89,374,044 | |
| Net assets consist of: | | | | | | | | | | | | |
| Paid-in capital | | $ | 42,440,473 | | | $ | 60,030,321 | | | $ | 80,382,180 | |
| Distributable earnings (deficit) | | | 6,183,623 | | | | (3,341,642 | ) | | | 8,991,864 | |
| Net Assets | | $ | 48,624,096 | | | $ | 56,688,679 | | | $ | 89,374,044 | |
| (A) Includes market value of securities on loan of: | | $ | — | | | $ | 2,217,190 | | | $ | 4,297,340 | |
See accompanying Notes to Financial Statements.
Statements of Assets and Liabilities (Continued)
| | | Touchstone Anti-Benchmark® US Core Equity Fund | | | Touchstone Dynamic Diversified Income Fund | | | Touchstone Dynamic Global Allocation Fund | |
| Pricing of Class A Shares | | | | | | | | | | | | |
| Net assets applicable to Class A shares | | $ | 6,183,558 | | | $ | 46,997,478 | | | $ | 81,623,777 | |
Shares of beneficial interest outstanding
(unlimited number of shares authorized, no par value) | | | 440,367 | | | | 3,613,403 | | | | 6,166,549 | |
| Net asset value per share* | | $ | 14.04 | | | $ | 13.01 | | | $ | 13.24 | |
| Maximum sale charge - Class A Shares | | | 5.00 | % | | | 5.00 | % | | | 5.00 | % |
Maximum offering price per share
(100%/(100%-maximum sales charge) of net asset value
adjusted to the nearest cent) - Class A shares | | $ | 14.78 | | | $ | 13.69 | | | $ | 13.94 | |
| Pricing of Class C Shares | | | | | | | | | | | | |
| Net assets applicable to Class C shares | | $ | 1,968,508 | | | $ | 2,335,427 | | | $ | 3,014,782 | |
Shares of beneficial interest outstanding
(unlimited number of shares authorized, no par value) | | | 155,793 | | | | 178,246 | | | | 232,781 | |
| Net asset value and offering price per share** | | $ | 12.64 | | | $ | 13.10 | | | $ | 12.95 | |
| Pricing of Class Y Shares | | | | | | | | | | | | |
| Net assets applicable to Class Y shares | | $ | 17,411,330 | | | $ | 7,355,774 | | | $ | 4,735,485 | |
Shares of beneficial interest outstanding
(unlimited number of shares authorized, no par value) | | | 1,226,323 | | | | 564,296 | | | | 354,118 | |
| Net asset value, offering price and redemption price per share | | $ | 14.20 | | | $ | 13.04 | | | $ | 13.37 | |
| Pricing of Institutional Class Shares | | | | | | | | | | | | |
| Net assets applicable to Institutional Class Shares | | $ | 23,060,700 | | | $ | — | | | $ | — | |
Shares of beneficial interest outstanding
(unlimited number of shares authorized, no par value) | | | 1,583,218 | | | | — | | | | — | |
| Net asset value, offering price and redemption price per share | | $ | 14.57 | | | $ | — | | | $ | — | |
* There is no sales load on subscriptions of $1 million or more. Redemptions that were part of a $1 million or more subscription may be subject to a contingent deferred sales load if redeemed within a one-year period from the date of purchase.
** Redemption price per share varies by length of time shares are held due to the terms of the contingent deferred sales charge.
See accompanying Notes to Financial Statements.
Statements of Operations
For the Year and Three Months Ended December 31, 2020
| | | | Touchstone Anti-Benchmark® US Core Equity Fund | | | | Touchstone Dynamic Diversified Income Fund | | | | Touchstone Dynamic Global Allocation Fund | |
| | | | For the Three Months Ended December 31, 2020(A) | | | | For the Year Ended September 30, 2020(B) | | | | For the Year Ended December 31, 2020 | | | | For the Year Ended December 31, 2020 | |
| Investment Income | | | | | | | | | | | | | | | | |
| Dividends from affiliated securities | | $ | — | | | $ | — | | | $ | 1,682,699 | | | $ | 1,021,193 | |
| Dividends from non-affiliated securities(C) | | | 171,647 | | | | 688,713 | | | | 493,350 | | | | 313,092 | |
| Income from securities loaned | | | 2,360 | | | | 411 | | | | 42,730 | | | | 93,537 | |
| Total Investment Income | | | 174,007 | | | | 689,124 | | | | 2,218,779 | | | | 1,427,822 | |
| Expenses | | | | | | | | | | | | | | | | |
| Investment advisory fees | | | 41,671 | | | | 98,351 | | | | 116,036 | | | | 203,607 | |
| Administration fees | | | 16,894 | | | | 40,746 | | | | 83,694 | | | | 117,422 | |
| Compliance fees and expenses | | | 717 | | | | 2,497 | | | | 2,631 | | | | 2,631 | |
| Custody fees | | | 2,754 | | | | 3,635 | | | | 4,262 | | | | 3,834 | |
| Professional fees | | | 20,352 | | | | 25,793 | | | | 22,926 | | | | 23,441 | |
| Transfer Agent fees, Class A | | | 2,338 | | | | — | | | | 33,432 | | | | 72,910 | |
| Transfer Agent fees, Class C | | | 670 | | | | — | | | | 2,080 | | | | 4,820 | |
| Transfer Agent fees, Class Y | | | 4,502 | | | | 273 | | | | 10,762 | | | | 3,917 | |
| Transfer Agent fees, Institutional Class | | | 41 | | | | 116 | | | | — | | | | — | |
| Pricing Expense | | | 171 | | | | 822 | | | | — | | | | — | |
| Transfer Agent out-of-pocket expenses | | | — | | | | — | | | | 23,977 | | | | 41,996 | |
| Registration Fees, Class A | | | — | | | | — | | | | 15,052 | | | | 14,188 | |
| Registration Fees, Class C | | | — | | | | — | | | | 11,794 | | | | 11,305 | |
| Registration Fees, Class Y | | | 4,702 | | | | 4,887 | | | | 14,174 | | | | 6,385 | |
| Registration Fees, Institutional Class | | | 1,617 | | | | 3,064 | | | | — | | | | — | |
| Reports to Shareholders, Class A | | | 1,945 | | | | — | | | | 8,197 | | | | 11,313 | |
| Reports to Shareholders, Class C | | | 1,656 | | | | — | | | | 3,855 | | | | 3,954 | |
| Reports to Shareholders, Class Y | | | 2,301 | | | | 5,117 | | | | 4,379 | | | | 3,768 | |
| Reports to Shareholders, Institutional Class | | | 1,609 | | | | 5,106 | | | | — | | | | — | |
| Distribution expenses, Class A | | | 3,647 | | | | — | | | | 114,002 | | | | 183,586 | |
| Distribution and shareholder servicing expenses, Class C | | | 4,932 | | | | — | | | | 32,495 | | | | 40,281 | |
| Trustee fees | | | 4,921 | | | | 21,452 | | | | 20,818 | | | | 20,818 | |
| Other expenses | | | 3,884 | | | | 14,267 | | | | 16,238 | | | | 16,764 | |
| Total Expenses | | | 121,324 | | | | 226,126 | | | | 540,804 | | | | 786,940 | |
| Fees waived and/or reimbursed by the Advisor and/or Affiliates(D) | | | (54,070 | ) | | | (102,369 | ) | | | (255,063 | ) | | | (367,610 | ) |
| Net Expenses | | | 67,254 | | | | 123,757 | | | | 285,741 | | | | 419,330 | |
| Net Investment Income | | | 106,753 | | | | 565,367 | | | | 1,933,038 | | | | 1,008,492 | |
| Realized and Unrealized Gains (Losses) on Investments | | | | | | | | | | | | | | | | |
| Net realized gains (losses) on investments in non-affiliated securities | | | 5,181,759 | | | | 1,127,307 | | | | (3,235,513 | ) | | | (364,571 | ) |
| Net realized gains (losses) on investments in affiliated securities | | | — | | | | — | | | | 119,343 | | | | (37,697 | ) |
| Capital gain distributions received from affiliated funds | | | — | | | | — | | | | 158,455 | | | | 1,433,030 | |
| Net change in unrealized appreciation (depreciation) on investments in non-affiliated securities(E) | | | (644,549 | ) | | | 2,259,173 | | | | 668,601 | | | | 942,144 | |
| Net change in unrealized appreciation (depreciation) on investments in affiliated securities | | | — | | | | — | | | | 789,172 | | | | 7,173,789 | |
| Net Realized and Unrealized Gains (Losses) on Investments | | $ | 4,537,210 | | | $ | 3,386,480 | | | $ | (1,499,942 | ) | | $ | 9,146,695 | |
| Change in Net Assets Resulting from Operations | | $ | 4,643,963 | | | $ | 3,951,847 | | | $ | 433,096 | | | $ | 10,155,187 | |
| (A) The fund changed its fiscal year end from September 30 to December 31. | | | | | | | | | | | | | | | | |
| (B) See Note 9 in Notes to Financial Statements. | | | | | | | | | | | | | | | | |
| (C) Net of foreign tax withholding of: | | $ | 86 | | | $ | — | | | $ | — | | | $ | — | |
| (D) See Note 4 in Notes to Financial Statements. | | | | | | | | | | | | | | | | |
| (E) Change in unrealized appreciation (depreciation) does not include net appreciation of $3,297,182, for the Touchstone Anti-Benchmark® US Core Equity Fund in connection with the Fund's reorganization. See Note 9 in the Notes to Financial Statements. | |
| | | | | | | | | | | | | | | | | |
| See accompanying Notes to Financial Statements. | | | | | | | | | | | | | | | | |
This page intentionally left blank.
Statements of Changes in Net Assets
| | | Touchstone
Anti-Benchmark® US Core
Equity Fund | | Touchstone
Dynamic Diversified
Income
Fund | |
| | | For the Three
Months Ended
December 31,
2020(A) | | For the
Year
Ended
September 30,
2020 | | For the
Period Ended
September 30,
2019(B) | | For the
Year
Ended
December 31,
2020 | | For the
Year
Ended
December 31,
2019 | |
| From Operations | | | | | | | | | | | | | | | | |
| Net investment income | | $ | 106,753 | | $ | 565,367 | | $ | 484,961 | | $ | 1,933,038 | | $ | 2,578,177 | |
| Net realized gains (losses) on investments and capital gain distributions received | | | 5,181,759 | | | 1,127,307 | | | (798,930 | ) | | (2,957,715 | ) | | (886,803 | ) |
| Net change in unrealized appreciation (depreciation) on investments | | | (644,549 | ) | | 2,259,173 | | | 1,959,223 | | | 1,457,773 | | | 5,380,330 | |
| Change in Net Assets from Operations | | | 4,643,963 | | | 3,951,847 | | | 1,645,254 | | | 433,096 | | | 7,071,704 | |
| Distributions to Shareholders: | | | | | | | | | | | | | | | | |
| Distributed earnings, Class A | | | (65,466) | | | — | | | — | | | (1,669,389 | ) | | (1,983,829 | ) |
| Distributed earnings, Class C | | | — | | | — | | | — | | | (84,415 | ) | | (144,648 | ) |
| Distributed earnings, Class Y | | | (224,585 | ) | | (4,992 | ) | | (14 | ) | | (328,104 | ) | | (549,570 | ) |
| Distributed earnings, Institutional Class | | | (3,121 | ) | | (1,274,135 | ) | | (145,890 | ) | | — | | | — | |
| Return of capital, Class Y | | | — | | | (98 | ) | | — | | | — | | | — | |
| Return of capital, Institutional Class | | | — | | | (28,806 | ) | | — | | | — | | | — | |
| Total Distributions | | | (293,172 | ) | | (1,308,031 | ) | | (145,904 | ) | | (2,081,908 | ) | | (2,678,047 | ) |
| Change in Net Assets from Share Transactions(C) | | | 13,528,761 | | | 1,401,151 | | | 25,200,227 | | | (10,940,475 | ) | | 20,549,282 | |
| | | | | | | | | | | | | | | | | |
| Total Increase (Decrease) in Net Assets | | | 17,879,552 | | | 4,044,967 | | | 26,699,577 | | | (12,589,287 | ) | | 24,942,939 | |
| | | | | | | | | | | | | | | | | |
| Net Assets | | | | | | | | | | | | | | | | |
| Beginning of period | | | 30,744,544 | | | 26,699,577 | | | — | | | 69,277,966 | | | 44,335,027 | |
| End of period | | $ | 48,624,096 | | $ | 30,744,544 | | $ | 26,699,577 | | $ | 56,688,679 | | $ | 69,277,966 | |
| (A) | The Fund changed its year end from September 30 to December 31. |
| (B) | Represents the period from commencement of operations (November 19, 2018) through September 30, 2019. |
| (C) | For details on share transactions by class, see Statements of Changes in Net Assets - Capital Stock Activity on page 24 to 25. |
See accompanying Notes to Financial Statements.
Statements of Changes in Net Assets (Continued)
| | Touchstone
Dynamic Global
Allocation
Fund | |
| | For the
Year
Ended
December 31,
2020 | | For the
Year
Ended
December 31,
2019 | |
| | | | | | | |
| | $ | 1,008,492 | | $ | 1,493,295 | |
| | | | | | | |
| | | 1,030,762 | | | 487,110 | |
| | | 8,115,933 | | | 12,374,268 | |
| | | 10,155,187 | | | 14,354,673 | |
| | | | | | | |
| | | (2,320,966 | ) | | (2,967,349 | ) |
| | | (69,303 | ) | | (150,046 | ) |
| | | (139,672 | ) | | (169,554 | ) |
| | | — | | | — | |
| | | — | | | — | |
| | | — | | | — | |
| | | (2,529,941 | ) | | (3,286,949 | ) |
| | | (4,562,939 | ) | | (10,049,192 | ) |
| | | | | | | |
| | | 3,062,307 | | | 1,018,532 | |
| | | | | | | |
| | | | | | | |
| | | 86,311,737 | | | 85,293,205 | |
| | $ | 89,374,044 | | $ | 86,311,737 | |
Statements of Changes in Net Assets - Capital Stock Activity
| | | Touchstone Anti-Benchmark® US Core Equity Fund | |
| | | For the Three
Months Ended
December 31,
2020(A) | | For the Year
Ended
September 30, 2020 | | For the Period
Ended
September 30,
2019(B) | |
| | | Shares | | Dollars | | Shares | | Dollars | | Shares | | Dollars | |
| Class A | | | | | | | | | | | | | | | | |
| Proceeds from Shares sold | | 7,778 | | $ | 109,618 | | — | | $ | — | | — | | $ | — | |
| Proceeds from Shares issued in connection with merger(C) | | 452,453 | | | 5,867,004 | | — | | | — | | — | | | — | |
| Reinvestment of distributions | | 3,187 | | | 44,558 | | — | | | — | | — | | | — | |
| Cost of Shares redeemed | | (23,051 | ) | | (310,179 | ) | — | | | — | | — | | | — | |
| Change from Class A Share Transactions | | 440,367 | | | 5,711,001 | | | | | | | | | | | |
| Class C | | | | | | | | | | | | — | | | | |
| Proceeds from Shares sold | | 216 | | | 2,621 | | — | | | — | | — | | | — | |
| Proceeds from Shares issued in connection with merger(C) | | 171,625 | | | 1,985,084 | | — | | | — | | — | | | — | |
| Reinvestment of distributions | | — | | | — | | — | | | — | | — | | | — | |
| Cost of Shares redeemed | | (16,048 | ) | | (196,557 | ) | — | | | — | | — | | | — | |
| Change from Class C Share Transactions | | 155,793 | | | 1,791,148 | | — | | | — | | — | | | — | |
| Class Y | | | | | | | | | | | | | | | | |
| Proceeds from Shares sold | | 5,349 | | | 72,146 | | 8,687 | | | 96,718 | | 4,904 | | | 51,823 | |
| Proceeds from Shares issued in connection with merger(C) | | 1,297,709 | | | 17,043,427 | | — | | | — | | — | | | — | |
| Net shares reduction due to reverse stock split(C) | | (1,492 | ) | | — | | — | | | — | | — | | | — | |
| Reinvestment of distributions | | 13,739 | | | 194,269 | | 440 | | | 5,090 | | 1 | | | 14 | |
| Cost of Shares redeemed | | (102,684 | ) | | (1,408,744 | ) | (330 | ) | | (3,598 | ) | — | | | — | |
| Change from Class Y Share Transactions | | 1,212,621 | | | 15,901,098 | | 8,797 | | | 98,210 | | 4,905 | | | 51,837 | |
| Institutional Class | | | | | | | | | | | | | | | | |
| Proceeds from Shares sold | | 235 | | | 3,121 | | — | | | — | | 2,500,250 | | | 25,002,500 | |
| Proceeds from Shares issued in connection with merger(C) | | 9,204 | | | 122,393 | | — | | | — | | — | | | — | |
| Net shares reduction due to reverse stock split(C) | | (315,728 | ) | | — | | — | | | — | | — | | | — | |
| Reinvestment of distributions | | — | | | — | | 113,294 | | | 1,302,941 | | 16,156 | | | 145,890 | |
| Cost of Shares redeemed | | (740,193 | ) | | (10,000,000 | ) | — | | | — | | — | | | — | |
| Change from Institutional Class Share Transactions | | (1,046,482 | ) | | (9,874,486 | ) | 113,294 | | | 1,302,941 | | 2,516,406 | | | 25,148,390 | |
| Change from Share Transactions | | 762,299 | | $ | 13,528,761 | | 122,091 | | $ | 1,401,151 | | 2,521,311 | | $ | 25,200,227 | |
| (A) | The Fund changed its year end from September 30 to December 31. |
| (B) | Represents the period from commencement of operations (November 19, 2018) through September 30, 2019. |
| (C) | See Note 9 in Notes to Financial Statements. |
See accompanying Notes to Financial Statements.
Statements of Changes in Net Assets - Capital Stock Activity (Continued)
| | Touchstone Dynamic Diversified Income Fund | | Touchstone Dynamic Global Allocation Fund | |
| | For the Year
Ended
December 31, 2020 | | For the Year
Ended
December 31, 2019 | | For the Year
Ended
December 31, 2020 | | For the Year
Ended
December 31, 2019 | |
| | Shares | | Dollars | | Shares | | Dollars | | Shares | | Dollars | | Shares | | Dollars | |
| | | | | | | | | | | | | | | | | | | | | |
| | 280,713 | | $ | 3,432,703 | | 960,372 | | $ | 12,295,904 | | 400,834 | | $ | 4,843,914 | | 1,896,533 | | $ | 21,505,108 | |
| | — | | | — | | 1,130,078 | | | 14,590,667 | | — | | | — | | — | | | — | |
| | 117,354 | | | 1,417,927 | | 130,247 | | | 1,694,254 | | 160,456 | | | 2,050,596 | | 218,338 | | | 2,603,372 | |
| | (639,326 | ) | | (7,835,654 | ) | (583,906 | ) | | (7,583,144 | ) | (777,518 | ) | | (9,250,675 | ) | (894,153 | ) | | (10,453,158 | ) |
| | (241,259 | ) | | (2,985,024 | ) | 1,636,791 | | | 20,997,681 | | (216,228 | ) | | (2,356,165 | ) | 1,220,718 | | | 13,655,322 | |
| | | | | | | | | | | | | | | | | | | | | |
| | 13,863 | | | 170,519 | | 18,487 | | | 243,914 | | 64,738 | | | 682,216 | | 13,313 | | | 163,460 | |
| | — | | | — | | 177,151 | | | 2,299,562 | | — | | | — | | — | | | — | |
| | 6,693 | | | 80,683 | | 10,130 | | | 132,764 | | 5,481 | | | 69,832 | | 12,023 | | | 141,221 | |
| | (196,152 | ) | | (2,382,694 | ) | (927,151 | ) | | (11,889,603 | ) | (282,171 | ) | | (3,264,988 | ) | (1,979,350 | ) | | (21,892,864 | ) |
| | (175,596 | ) | | (2,131,492 | ) | (721,383 | ) | | (9,213,363 | ) | (211,952 | ) | | (2,512,940 | ) | (1,954,014 | ) | | (21,588,183 | ) |
| | | | | | | | | | | | | | | | | | | | | |
| | 97,334 | | | 1,219,600 | | 469,453 | | | 6,056,807 | | 73,255 | | | 890,900 | | 53,199 | | | 628,091 | |
| | — | | | — | | 1,753,649 | | | 22,695,377 | | — | | | — | | — | | | — | |
| | — | | | — | | — | | | — | | — | | | — | | — | | | — | |
| | 26,539 | | | 317,677 | | 39,929 | | | 521,382 | | 10,235 | | | 131,691 | | 13,259 | | | 159,451 | |
| | (601,097 | ) | | (7,361,236 | ) | (1,581,018 | ) | | (20,508,602 | ) | (62,593 | ) | | (716,425 | ) | (247,933 | ) | | (2,903,873 | ) |
| | (477,224 | ) | | (5,823,959 | ) | 682,013 | | | 8,764,964 | | 20,897 | | | 306,166 | | (181,475 | ) | | (2,116,331 | ) |
| | | | | | | | | | | | | | | | | | | | | |
| | — | | | — | | — | | | — | | — | | | — | | — | | | — | |
| | — | | | — | | — | | | — | | — | | | — | | — | | | — | |
| | — | | | — | | — | | | — | | — | | | — | | — | | | — | |
| | — | | | — | | — | | | — | | — | | | — | | — | | | — | |
| | — | | | — | | — | | | — | | — | | | — | | — | | | — | |
| | — | | | — | | — | | | — | | — | | | — | | — | | | — | |
| | (894,079 | ) | $ | (10,940,475 | ) | 1,597,421 | | $ | 20,549,282 | | (407,283 | ) | $ | (4,562,939 | ) | (914,771 | ) | $ | (10,049,192 | ) |
Financial Highlights
Touchstone Anti-Benchmark® US Core Equity Fund—Class A
Selected Data for a Share Outstanding Throughout The Period
| | | Period Ended
December 31,
2020(A) | |
| Net asset value at beginning of period | | $ | 12.97 | |
| Income (loss) from investment operations: | | | | |
| Net investment income | | | 0.02 | |
| Net realized and unrealized gains on investments | | | 1.20 | |
| Total from investment operations | | | 1.22 | |
| Distributions from: | | | | |
| Net investment income | | | (0.15 | ) |
| Net asset value at end of period | | $ | 14.04 | |
| Total return(B) | | | 9.41 | %(C) |
| Ratios and supplemental data: | | | | |
| Net assets at end of period (000's) | | $ | 6,184 | |
| Ratio to average net assets: | | | | |
| Net expenses | | | 0.79 | %(D) |
| Gross expenses | | | 1.31 | %(D) |
| Net investment income | | | 0.70 | %(D) |
| Portfolio turnover rate | | | 54 | %(C)(E) |
Touchstone Anti-Benchmark® US Core Equity Fund—Class C
Selected Data for a Share Outstanding Throughout The Period
| | | Period Ended
December 31,
2020(A) | |
| Net asset value at beginning of period | | $ | 11.57 | |
| Income (loss) from investment operations: | | | | |
| Net investment loss | | | (— | )(F) |
| Net realized and unrealized gains on investments | | | 1.07 | |
| Total from investment operations | | | 1.07 | |
| Net asset value at end of period | | $ | 12.64 | |
| Total return(B) | | | 9.25 | %(C) |
| Ratios and supplemental data: | | | | |
| Net assets at end of period (000's) | | $ | 1,969 | |
| Ratio to average net assets: | | | | |
| Net expenses | | | 1.54 | %(D) |
| Gross expenses | | | 2.22 | %(D) |
| Net investment loss | | | (0.05 | %)(D) |
| Portfolio turnover rate | | | 54 | %(C)(E) |
| (A) | Represents the period from commencement of operations (October 2, 2020) through December 31, 2020. |
| (B) | Total return shown exclude the effect of applicable sales loads. If these charges were included, the returns would be lower. |
| (E) | Portfolio turnover excludes the purchases and sales of securities of the Touchstone Dynamic Equity Fund merger on October 2, 2020. (See Note 9 in the Notes to Financial Statements). If these transactions were included, portfolio turnover would have been higher. |
| (F) | Less than $0.005 per share. |
See accompanying Notes to Financial Statements.
Financial Highlights (Continued)
Touchstone Anti-Benchmark® US Core Equity Fund—Class Y
Selected Data for a Share Outstanding Throughout Each Period
| | | Three Months
Ended
December 31, 2020(A)(B) | | Year Ended
September 30,
2020(B) | Period Ended
September 30,
2019(B)(C) |
| Net asset value at beginning of period | | $ | 13.05 | | | $ | 11.88 | | $ | 11.22 | |
| Income (loss) from investment operations: | | | | | | | | | | | |
| Net investment income | | | 0.04 | | | | 0.29 | | | 0.10 | |
| Net realized and unrealized gains on investments | | | 1.30 | | | | 1.44 | | | 0.63 | |
| Total from investment operations | | | 1.34 | | | | 1.73 | | | 0.73 | |
| Distributions from: | | | | | | | | | | | |
| Net investment income | | | (0.19 | ) | | | (0.38 | ) | | (0.07 | ) |
| Realized capital gains | | | — | | | | (0.17 | ) | | — | |
| Return of capital | | | — | | | | (0.01 | ) | | — | |
| Total distributions | | | (0.19 | ) | | | (0.56 | ) | | (0.07 | ) |
| Net asset value at end of period | | $ | 14.20 | | | $ | 13.05 | | $ | 11.88 | |
| Total return | | | 10.23 | %(D) | | | 14.63 | % | | 6.57 | %(D) |
| Ratios and supplemental data: | | | | | | | | | | | |
| Net assets at end of period (000's) | | $ | 17,411 | | | $ | 159 | | $ | 52 | |
| Ratio to average net assets: | | | | | | | | | | | |
| Net expenses | | | 0.54 | %(E) | | | 0.54 | % | | 0.54 | %(E) |
| Gross expenses | | | 1.04 | %(E) | | | 9.63 | % | | 110.89 | %(E) |
| Net investment income | | | 0.92 | %(E) | | | 1.91 | % | | 2.10 | %(E) |
| Portfolio turnover rate | | | 54 | %(D)(F) | | | 73 | % | | 137 | %(D)(G) |
Touchstone Anti-Benchmark® US Core Equity Fund—Institutional Class
Selected Data for a Share Outstanding Throughout Each Period
| | | Three Months
Ended
December 31,
2020(A)(B) | | | Year Ended
September 30,
2020(B) | Period Ended
September 30,
2019(B)(C) |
| Net asset value at beginning of period | | $ | 13.22 | | | | $ | 12.03 | | $ | 11.36 | |
| Income (loss) from investment operations: | | | | | | | | | | | | |
| Net investment income | | | 0.04 | | | | | 0.25 | | | 0.22 | |
| Net realized and unrealized gains on investments | | | 1.31 | | | | | 1.53 | | | 0.52 | |
| Total from investment operations | | | 1.35 | | | | | 1.78 | | | 0.74 | |
| Distributions from: | | | | | | | | | | | | |
| Net investment income | | | (— | )(H) | | | | (0.41 | ) | | (0.07 | ) |
| Realized capital gains | | | — | | | | | (0.17 | ) | | — | |
| Return of capital | | | — | | | | | (0.01 | ) | | — | |
| Total distributions | | | — | | | | | (0.59 | ) | | (0.07 | ) |
| Net asset value at end of period | | $ | 14.57 | | | | $ | 13.22 | | $ | 12.03 | |
| Total return | | | 10.22 | %(D) | | | | 14.77 | % | | 6.59 | %(D) |
| Ratios and supplemental data: | | | | | | | | | | | | |
| Net assets at end of period (000's) | | $ | 23,061 | | | | $ | 30,585 | | $ | 26,648 | |
| Ratio to average net assets: | | | | | | | | | | | | |
| Net expenses | | | 0.44 | %(E) | | | | 0.44 | % | | 0.44 | %(E) |
| Gross expenses | | | 0.82 | %(E) | | | | 0.77 | % | | 0.85 | %(E) |
| Net investment income | | | 1.02 | %(E) | | | | 2.01 | % | | 2.21 | %(E) |
| Portfolio turnover rate | | | 54 | %(D)(F) | | | | 73 | % | | 137 | %(D)(G) |
| (A) | The Fund changed its fiscal year end from September 30 to December 31. |
| (B) | During the Three Months Ended December 31, 2020, the Fund effected the following reverse stock split effective the close of business October 2, 2020: 0.8911 for 1 for Class Y shares and 0.8799 for 1 for Institutional Class shares. All historical per share information has been retroactively adjusted to reflect this reverse stock split. |
| (C) | Represents the period from commencement of operations (November 19, 2018) through September 30, 2019. |
| (F) | Portfolio turnover excludes the purchases and sales of securities of the Touchstone Dynamic Equity Fund merger on October 2, 2020. (See Note 9 in the Notes to Financial Statements). If these transactions were included, portfolio turnover would have been higher. |
| (G) | Portfolio turnover excludes securities received from processing a subscription-in-kind. |
| (H) | Less than $0.005 per share. |
See accompanying Notes to Financial Statements
Financial Highlights (Continued)
| Touchstone Dynamic Diversified Income Fund—Class A | |
| Selected Data for a Share Outstanding Throughout Each Period | |
| | | Year Ended December 31, | |
| | | 2020 | | 2019 | | 2018 | | 2017 | | 2016 | |
| Net asset value at beginning of period | | $ | 13.18 | | $ | 12.12 | | $ | 13.23 | | $ | 12.73 | | $ | 12.15 | |
| Income (loss) from investment operations: | | | | | | | | | | | | | | | | |
| Net investment income | | | 0.42 | | | 0.53 | | | 0.47 | | | 0.44 | | | 0.48 | |
| Net realized and unrealized gains (losses) on investments | | | (0.13 | ) | | 1.07 | | | (1.07 | ) | | 0.53 | | | 0.58 | |
| Total from investment operations | | | 0.29 | | | 1.60 | | | (0.60 | ) | | 0.97 | | | 1.06 | |
| Distributions from: | | | | | | | | | | | | | | | | |
| Net investment income | | | (0.46 | ) | | (0.54 | ) | | (0.51 | ) | | (0.47 | ) | | (0.48 | ) |
| Net asset value at end of period | | $ | 13.01 | | $ | 13.18 | | $ | 12.12 | | $ | 13.23 | | $ | 12.73 | |
| Total return(A) | | | 2.52 | % | | 13.35 | % | | (4.66 | %) | | 7.74 | % | | 8.81 | % |
| Ratios and supplemental data: | | | | | | | | | | | | | | | | |
| Net assets at end of period (000's) | | $ | 46,997 | | $ | 50,821 | | $ | 26,892 | | $ | 31,264 | | $ | 28,316 | |
| Ratio to average net assets: | | | | | | | | | | | | | | | | |
| Net expenses(B) | | | 0.49 | % | | 0.49 | % | | 0.49 | % | | 0.49 | % | | 0.49 | % |
| Gross expenses(B) | | | 0.88 | % | | 0.92 | % | | 0.93 | % | | 0.90 | % | | 0.90 | % |
| Net investment income | | | 3.33 | % | | 4.10 | % | | 3.61 | % | | 3.44 | % | | 3.73 | % |
| Portfolio turnover rate | | | 32 | % | | 73 | %(C) | | 20 | % | | 25 | % | | 32 | % |
| Touchstone Dynamic Diversified Income Fund—Class C | |
| Selected Data for a Share Outstanding Throughout Each Period | |
| | | Year Ended December 31, | |
| | | 2020 | | 2019 | | 2018 | | 2017 | | 2016 | |
| Net asset value at beginning of period | | $ | 13.27 | | $ | 12.16 | | $ | 13.26 | | $ | 12.75 | | $ | 12.17 | |
| Income (loss) from investment operations: | | | | | | | | | | | | | | | | |
| Net investment income | | | 0.63 | | | 0.65 | | | 0.40 | | | 0.38 | | | 0.38 | |
| Net realized and unrealized gains (losses) on investments | | | (0.44 | ) | | 0.86 | | | (1.09 | ) | | 0.50 | | | 0.58 | |
| Total from investment operations | | | 0.19 | | | 1.51 | | | (0.69 | ) | | 0.88 | | | 0.96 | |
| Distributions from: | | | | | | | | | | | | | | | | |
| Net investment income | | | (0.36 | ) | | (0.40 | ) | | (0.41 | ) | | (0.37 | ) | | (0.38 | ) |
| Net asset value at end of period | | $ | 13.10 | | $ | 13.27 | | $ | 12.16 | | $ | 13.26 | | $ | 12.75 | |
| Total return(A) | | | 1.69 | % | | 12.51 | % | | (5.33 | %) | | 6.93 | % | | 7.98 | % |
| Ratios and supplemental data: | | | | | | | | | | | | | | | | |
| Net assets at end of period (000's) | | $ | 2,335 | | $ | 4,694 | | $ | 13,075 | | $ | 17,792 | | $ | 25,197 | |
| Ratio to average net assets: | | | | | | | | | | | | | | | | |
| Net expenses(B) | | | 1.24 | % | | 1.24 | % | | 1.24 | % | | 1.24 | % | | 1.24 | % |
| Gross expenses(B) | | | 2.05 | % | | 1.96 | % | | 1.72 | % | | 1.64 | % | | 1.63 | % |
| Net investment income | | | 2.58 | % | | 3.35 | % | | 2.86 | % | | 2.69 | % | | 2.98 | % |
| Portfolio turnover rate | | | 32 | % | | 73 | %(C) | | 20 | % | | 25 | % | | 32 | % |
| (A) | Total returns shown exclude the effect of applicable sales loads and fees. If these charges were included, the returns would be lower. |
| (B) | Ratio does not include expenses of the underlying funds. |
| (C) | Portfolio turnover excludes the purchases and sales of securities of the Touchstone Controlled Growth with Income Fund acquired on May 10, 2019. If these transactions were included, portfolio turnover would have been higher. |
| See accompanying Notes to Financial Statements. | |
Financial Highlights (Continued)
| Touchstone Dynamic Diversified Income Fund—Class Y | |
| Selected Data for a Share Outstanding Throughout Each Period | |
| | | Year Ended December 31, | |
| | | 2020 | | 2019 | | 2018 | | 2017 | | 2016 | |
| Net asset value at beginning of period | | $ | 13.21 | | $ | 12.15 | | $ | 13.26 | | $ | 12.75 | | $ | 12.17 | |
| Income (loss) from investment operations: | | | | | | | | | | | | | | | | |
| Net investment income | | | 0.53 | | | 0.47 | | | 0.56 | | | 0.54 | | | 0.55 | |
| Net realized and unrealized gains (losses) on investments | | | (0.21 | ) | | 1.16 | | | (1.13 | ) | | 0.47 | | | 0.54 | |
| Total from investment operations | | | 0.32 | | | 1.63 | | | (0.57 | ) | | 1.01 | | | 1.09 | |
| Distributions from: | | | | | | | | | | | | | | | | |
| Net investment income | | | (0.49 | ) | | (0.57 | ) | | (0.54 | ) | | (0.50 | ) | | (0.51 | ) |
| Net asset value at end of period | | $ | 13.04 | | $ | 13.21 | | $ | 12.15 | | $ | 13.26 | | $ | 12.75 | |
| Total return | | | 2.80 | % | | 13.58 | % | | (4.40 | %) | | 8.06 | % | | 9.06 | % |
| Ratios and supplemental data: | | | | | | | | | | | | | | | | |
| Net assets at end of period (000's) | | $ | 7,356 | | $ | 13,762 | | $ | 4,368 | | $ | 6,675 | | $ | 10,391 | |
| Ratio to average net assets: | | | | | | | | | | | | | | | | |
| Net expenses(A) | | | 0.24 | % | | 0.24 | % | | 0.24 | % | | 0.24 | % | | 0.24 | % |
| Gross expenses(A) | | | 0.82 | % | | 1.04 | % | | 1.03 | % | | 0.84 | % | | 0.73 | % |
| Net investment income | | | 3.58 | % | | 4.35 | % | | 3.86 | % | | 3.69 | % | | 3.98 | % |
| Portfolio turnover rate | | | 32 | % | | 73 | %(B) | | 20 | % | | 25 | % | | 32 | % |
| Touchstone Dynamic Global Allocation Fund—Class A | |
| Selected Data for a Share Outstanding Throughout Each Period | |
| | | Year Ended December 31, | |
| | | 2020 | | 2019 | | 2018 | | 2017 | | 2016 | |
| Net asset value at beginning of period | | $ | 12.06 | | $ | 10.63 | | $ | 12.56 | | $ | 11.56 | | $ | 12.01 | |
| Income (loss) from investment operations: | | | | | | | | | | | | | | | | |
| Net investment income | | | 0.16 | | | 0.21 | | | 0.20 | | | 0.21 | | | 0.28 | |
| Net realized and unrealized gains (losses) on investments | | | 1.41 | | | 1.68 | | | (1.16 | ) | | 1.39 | | | 0.06 | |
| Total from investment operations | | | 1.57 | | | 1.89 | | | (0.96 | ) | | 1.60 | | | 0.34 | |
| Distributions from: | | | | | | | | | | | | | | | | |
| Net investment income | | | (0.19 | ) | | (0.26 | ) | | (0.26 | ) | | (0.26 | ) | | (0.28 | ) |
| Realized capital gains | | | (0.20 | ) | | (0.20 | ) | | (0.71 | ) | | (0.34 | ) | | (0.51 | ) |
| Total distributions | | | (0.39 | ) | | (0.46 | ) | | (0.97 | ) | | (0.60 | ) | | (0.79 | ) |
| Net asset value at end of period | | $ | 13.24 | | $ | 12.06 | | $ | 10.63 | | $ | 12.56 | | $ | 11.56 | |
| Total return(C) | | | 13.09 | % | | 17.95 | % | | (7.91 | %) | | 13.96 | % | | 2.80 | % |
| Ratios and supplemental data: | | | | | | | | | | | | | | | | |
| Net assets at end of period (000's) | | $ | 81,624 | | $ | 77,001 | | $ | 54,871 | | $ | 67,562 | | $ | 62,689 | |
| Ratio to average net assets: | | | | | | | | | | | | | | | | |
| Net expenses(A) | | | 0.49 | % | | 0.49 | % | | 0.49 | % | | 0.49 | % | | 0.49 | % |
| Gross expenses(A) | | | 0.91 | % | | 0.94 | % | | 0.92 | % | | 0.91 | % | | 0.92 | % |
| Net investment income | | | 1.26 | % | | 1.77 | % | | 1.57 | % | | 1.72 | % | | 2.26 | % |
| Portfolio turnover rate | | | 33 | % | | 38 | % | | 40 | % | | 32 | % | | 39 | % |
| (A) | Ratio does not include expenses of the underlying funds. |
| (B) | Portfolio turnover excludes the purchases and sales of securities of the Touchstone Controlled Growth with Income Fund acquired on May 10, 2019. If these transactions were included, portfolio turnover would have been higher. |
| (C) | Total returns shown exclude the effect of applicable sales loads and fees. If these charges were included, the returns would be lower. |
See accompanying Notes to Financial Statements.
Financial Highlights (Continued)
| Touchstone Dynamic Global Allocation Fund—Class C | |
| Selected Data for a Share Outstanding Throughout Each Period | |
| | | Year Ended December 31, | |
| | | 2020 | | 2019 | | 2018 | | 2017 | | 2016 | |
| Net asset value at beginning of period | | $ | 11.80 | | $ | 10.38 | | $ | 12.28 | | $ | 11.31 | | $ | 11.77 | |
| Income (loss) from investment operations: | | | | | | | | | | | | | | | | |
| Net investment income | | | 0.25 | | | 0.25 | | | 0.11 | | | 0.12 | | | 0.19 | |
| Net realized and unrealized gains (losses) on investments | | | 1.20 | | | 1.51 | | | (1.13 | ) | | 1.35 | | | 0.05 | |
| Total from investment operations | | | 1.45 | | | 1.76 | | | (1.02 | ) | | 1.47 | | | 0.24 | |
| Distributions from: | | | | | | | | | | | | | | | | |
| Net investment income | | | (0.10 | ) | | (0.14 | ) | | (0.17 | ) | | (0.16 | ) | | (0.19 | ) |
| Realized capital gains | | | (0.20 | ) | | (0.20 | ) | | (0.71 | ) | | (0.34 | ) | | (0.51 | ) |
| Total distributions | | | (0.30 | ) | | (0.34 | ) | | (0.88 | ) | | (0.50 | ) | | (0.70 | ) |
| Net asset value at end of period | | $ | 12.95 | | $ | 11.80 | | $ | 10.38 | | $ | 12.28 | | $ | 11.31 | |
| Total return(A) | | | 12.28 | % | | 17.01 | % | | (8.55 | %) | | 13.10 | % | | 2.00 | % |
| Ratios and supplemental data: | | | | | | | | | | | | | | | | |
| Net assets at end of period (000's) | | $ | 3,015 | | $ | 5,250 | | $ | 24,897 | | $ | 33,039 | | $ | 44,946 | |
| Ratio to average net assets: | | | | | | | | | | | | | | | | |
| Net expenses(B) | | | 1.24 | % | | 1.24 | % | | 1.24 | % | | 1.24 | % | | 1.24 | % |
| Gross expenses(B) | | | 2.03 | % | | 1.90 | % | | 1.68 | % | | 1.66 | % | | 1.65 | % |
| Net investment income | | | 0.51 | % | | 1.02 | % | | 0.82 | % | | 0.97 | % | | 1.51 | % |
| Portfolio turnover rate | | | 33 | % | | 38 | % | | 40 | % | | 32 | % | | 39 | % |
| Touchstone Dynamic Global Allocation Fund—Class Y | |
| Selected Data for a Share Outstanding Throughout Each Period | |
| | | Year Ended December 31, | |
| | | 2020 | | 2019 | | 2018 | | 2017 | | 2016 | |
| Net asset value at beginning of period | | $ | 12.19 | | $ | 10.73 | | $ | 12.67 | | $ | 11.66 | | $ | 12.11 | |
| Income (loss) from investment operations: | | | | | | | | | | | | | | | | |
| Net investment income | | | 0.17 | | | 0.31 | | | 0.27 | | | 0.24 | | | 0.32 | |
| Net realized and unrealized gains (losses) on investments | | | 1.42 | | | 1.64 | | | (1.21 | ) | | 1.40 | | | 0.05 | |
| Total from investment operations | | | 1.59 | | | 1.95 | | | (0.94 | ) | | 1.64 | | | 0.37 | |
| Distributions from: | | | | | | | | | | | | | | | | |
| Net investment income | | | (0.21 | ) | | (0.29 | ) | | (0.29 | ) | | (0.29 | ) | | (0.31 | ) |
| Realized capital gains | | | (0.20 | ) | | (0.20 | ) | | (0.71 | ) | | (0.34 | ) | | (0.51 | ) |
| Total distributions | | | (0.41 | ) | | (0.49 | ) | | (1.00 | ) | | (0.63 | ) | | (0.82 | ) |
| Net asset value at end of period | | $ | 13.37 | | $ | 12.19 | | $ | 10.73 | | $ | 12.67 | | $ | 11.66 | |
| Total return | | | 13.23 | % | | 18.35 | % | | (7.69 | %) | | 14.21 | % | | 3.03 | % |
| Ratios and supplemental data: | | | | | | | | | | | | | | | | |
| Net assets at end of period (000's) | | $ | 4,735 | | $ | 4,060 | | $ | 5,525 | | $ | 12,758 | | $ | 14,678 | |
| Ratio to average net assets: | | | | | | | | | | | | | | | | |
| Net expenses(B) | | | 0.24 | % | | 0.24 | % | | 0.24 | % | | 0.24 | % | | 0.24 | % |
| Gross expenses(B) | | | 0.88 | % | | 0.97 | % | | 0.85 | % | | 0.78 | % | | 0.75 | % |
| Net investment income | | | 1.51 | % | | 2.02 | % | | 1.82 | % | | 1.97 | % | | 2.51 | % |
| Portfolio turnover rate | | | 33 | % | | 38 | % | | 40 | % | | 32 | % | | 39 | % |
| (A) | Total returns shown exclude the effect of applicable sales loads and fees. If these charges were included, the returns would be lower. |
| (B) | Ratio does not include expenses of the underlying funds. |
See accompanying Notes to Financial Statements.
Notes to Financial Statements
December 31, 2020
1. Organization
The Touchstone Strategic Trust (the “Trust”) is registered under the Investment Company Act of 1940, as amended (the “1940 Act”), as an open-end management investment company. The Trust was established as a Massachusetts business trust pursuant to an Agreement and Declaration of Trust dated November 18, 1982. The Trust consists of eighteen funds, including the following three funds (individually, a “Fund”, and collectively, the “Funds”):
Touchstone Anti-Benchmark® US Core Equity Fund (“Anti-Benchmark® US Core Equity Fund”) (formerly known as Touchstone Dynamic Equity Fund)
Touchstone Dynamic Diversified Income Fund (“Dynamic Diversified Income Fund”)
Touchstone Dynamic Global Allocation Fund (“Dynamic Global Allocation Fund”)
Each Fund is diversified. Additionally, the Dynamic Diversified Income Fund and Dynamic Global Allocation Fund (collectively, the “Allocation Funds”) are “Funds of Funds”, sub-advised by Wilshire Associates Incorporated, which seek to achieve their investment goals by primarily investing in a diversified portfolio of affiliated and unaffiliated underlying equity, fixed income and alternative funds. These underlying funds (“Underlying Funds”), in turn, invest in a variety of U.S. and foreign equity and fixed-income securities. Under normal circumstances, the Allocation Funds expect to invest their assets among equity, fixed-income and alternative funds in the following ranges:
| | Equity Fund
Allocation | Fixed-Income
Fund Allocation | Alternative
Fund Allocation |
| Dynamic Diversified Income Fund | 25-55% | 25-55% | 0-30% |
| Dynamic Global Allocation Fund | 45-75% | 25-55% | N/A |
| The investment goal of each of the Underlying Funds that the Allocation Funds invested in is as follows: | |
| Fund | Investment Goal |
| Touchstone Anti-Benchmark® International Core Equity Fund | Seeks capital appreciation. |
| Touchstone Credit Opportunities Fund | Seeks absolute total return, primarily from income and capital appreciation. |
| Touchstone Flexible Income Fund | Seeks total return through a combination of income and capital appreciation. |
| Touchstone Growth Opportunities Fund | Seeks long-term growth of capital. |
| Touchstone High Yield Fund | Seeks to achieve a high level of income as its main goal. Capital appreciation is a secondary consideration. |
| Touchstone Impact Bond Fund | Seeks current income. Capital appreciation is secondary goal. |
| Touchstone International Growth Fund | Seeks to achieve long-term capital appreciation. |
| Touchstone Mid Cap Fund | Seeks long-term capital growth. |
| Touchstone Sands Capital Emerging Markets Growth Fund | Seeks long-term capital appreciation. |
| Touchstone Sands Capital Select Growth Fund | Seeks long-term capital appreciation. |
| Touchstone Small Cap Value Fund | Seeks long-term capital growth. |
| Touchstone Ultra Short Duration Fixed Income Fund | Seeks maximum total return consistent with the preservation of capital. |
| Touchstone Value Fund | Seeks to provide investors with long-term capital growth. |
| Dreyfus Government Cash Management | Seeks as high a level of current income as is consistent with the preservation of capital and the maintenance of liquidity. |
| iShares Core MSCI Emerging Markets ETF | Seeks to track the investment results of an index composed of large-, mid- and small-capitalization emerging market equities. |
| iShares International Select Dividend ETF | Seeks to track the investment results of an index composed of relatively high dividend paying equities in non-U.S. developed markets. |
| iShares International Treasury Bond ETF | Seeks to track the investment results of an index composed of non-U.S. developed market government bonds. |
| iShares MSCI EAFE Value ETF | Seeks to track the investment results of an index composed of developed market equities, excluding the U.S. and Canada, that exhibit value characteristics. |
Notes to Financial Statements (Continued)
| Fund | Investment Goal |
| VanEck Vectors J.P. Morgan EM Local Currency Bond ETF | Seeks to replicate as closely as possible, before fees and expenses, the price and yield performance of the J.P. Morgan GBI-EMG Core Index (GBIEMCOR), which is comprised of bonds issued by emerging market governments and denominated in the local currency of the issuer. |
| Vanguard Emerging Markets Government Bond ETF | Seeks to track the performance of a benchmark index that measures the investment return of U.S. dollar-denominated bonds issued by governments and government related issuers in emerging market countries. |
| Vanguard Global ex-U.S. Real Estate ETF | Seeks to track the performance of a benchmark index that measures the investment return of international real estate stocks. |
| Vanguard High Dividend Yield ETF | Seeks to track the performance of a benchmark index that measures the investment return of common stocks of companies that are characterized by high dividend yields. |
| Vanguard REIT ETF | Seeks to provide a high level of income and moderate long-term capital appreciation by tracking the performance of a benchmark index that measures the performance of publicly traded equity REITs. |
| Vanguard Total International Bond ETF | Seeks to track the performance of a benchmark index that measures the investment return of investment-grade bonds issued outside of the United States. |
The Agreement and Declaration of Trust permits the Trust to issue an unlimited number of shares of beneficial interest of each Fund. The Anti-Benchmark® US Core Equity Fund offers the following classes of shares: Class A shares, Class C shares, Class Y shares and Institutional Class shares. The Allocation Funds offer the following classes of shares: Class A shares, Class C shares and Class Y shares. The assets of each Fund are segregated, and a shareholder’s interest is limited to the Fund in which shares are held. The Funds’ prospectus provides a description of each Fund’s investment goal, policies, and strategies along with information on the classes of shares currently being offered.
2. Significant Accounting Policies
The following is a summary of the Funds’ significant accounting policies:
Each Fund is an investment company that follows the accounting and reporting guidance of Accounting Standards Codification Topic 946 applicable to investment companies.
Security valuation and fair value measurements — U.S. generally accepted accounting principles (“U.S. GAAP”) defines fair value as the price the Funds would receive to sell an asset or pay to transfer a liability in an orderly transaction between market participants at the measurement date. All investments in securities are recorded at their fair value. The Funds define the term “market value”, as used throughout this report, as the estimated fair value. The Funds use various methods to measure fair value of their portfolio securities on a recurring basis. U.S. GAAP fair value measurement standards require disclosure of a hierarchy that prioritizes inputs to valuation methods. These inputs are summarized in the three broad levels listed below:
| ● | Level 1 – quoted prices in active markets for identical securities |
| ● | Level 2 – other significant observable inputs (including quoted prices for similar securities, interest rates, prepayment speeds, credit risk, etc.) |
| ● | Level 3 – significant unobservable inputs (including a Fund’s own assumptions in determining the fair value of investments) |
The inputs or methodology used for valuing securities are not necessarily an indication of the risk associated with investing in those securities.
The aggregate value by input level, as of December 31, 2020, for each Fund’s investments, is included in the Funds’ Portfolio of Investments, which also includes a breakdown of the Funds’ investments by sector allocation. The Funds did not hold or transfer Level 3 categorized securities during the year ended December 31, 2020.
Changes in valuation techniques may result in transfers into or out of an investment’s assigned level within the hierarchy.
The Funds’ portfolio securities are valued as of the close of the regular session of trading on the New York Stock Exchange (“NYSE”)(currently 4:00 p.m., Eastern time or at the time as of which the NYSE establishes official closing prices). Portfolio securities traded on stock exchanges are valued at the last reported sale price, official close price, or last bid price if no sales are reported. Portfolio securities quoted by NASDAQ are valued at the NASDAQ Official Closing Price (“NOCP”) or from the primary exchange on which the security trades. To the extent these securities are actively traded, they are categorized in Level 1 of the fair value hierarchy. Shares of mutual funds in which the Funds invest are valued at their respective net asset value (“NAV”) as reported by the Underlying Funds and are categorized in Level 1.
Securities mainly traded on a non-U.S. exchange or denominated in foreign currencies are generally valued according to the preceding closing values on that exchange, translated to U.S. dollars using currency exchange rates as of the close of regular trading on the NYSE, and are generally categorized in Level 1. However, if an event that may change the value of a security occurs after the time
Notes to Financial Statements (Continued)
that the closing value on the non-U.S. exchange was determined, but before the close of regular trading on the NYSE, the security may be priced based on fair value and is generally categorized in Level 2. This may cause the value of the security, if held on the books of a Fund, to be different from the closing value on the non-U.S. exchange and may affect the calculation of that Fund’s NAV. The Funds may use fair value pricing under the following circumstances, among others:
● If the value of a security has been materially affected by events occurring before the Fund’s pricing time but after the close of the primary markets on which the security is traded.
● If the exchange on which a portfolio security is principally traded closes early or if trading in a particular portfolio security was halted during the day and did not resume prior to the Fund’s NAV calculation.
● If a security is so thinly traded that reliable market quotations are unavailable due to infrequent trading.
● If the validity of market quotations is not reliable.
Securities held by the Funds that do not have readily available market quotations, significant observable inputs, or securities for which the available market quotations are not reliable, are priced at their estimated fair value using procedures approved by the Funds’ Board of Trustees (the “Board”) and are generally categorized in Level 3.
Allocation Funds — The Allocation Funds invest in securities of affiliated and unaffiliated funds, the Underlying Funds. The value of an investment in the Allocation Funds is based on the performance of the Underlying Funds in which they invest and the allocation of their assets among those funds. Because the Allocation Funds invest in mutual funds, shareholders of the Allocation Funds indirectly bear a proportionate share of the expenses charged by the Underlying Funds in which they invest as well as their share of the Allocation Funds’ fees and expenses. The principal risks of an investment in the Allocation Funds include the principal risks of investing in the Underlying Funds.
Investment companies — The Funds may invest in securities of other investment companies, including exchange-traded funds (“ETFs”), exchange-traded notes (“ETNs”), open-end funds and closed-end funds. Open-end funds are investment companies that issue new shares continuously and redeem shares daily. Closed-end funds are investment companies that typically issue a fixed number of shares that trade on a securities exchange or over-the-counter (“OTC”). An ETF is an investment company that typically seeks to track the performance of an index by holding in its portfolio shares of all the companies, or a representative sample of the companies, that are components of a particular index. An ETN is an investment company that typically seeks to track the performance of an index, similar to an ETF, but it does not hold any securities that it tracks. ETF and ETN shares are traded on a securities exchange based on their market value. The risks of investment in other investment companies typically reflect the risks of the types of securities in which the other investment companies invest. Investments in ETFs, ETNs and closed-end funds are subject to the additional risk that their shares may trade at a premium or discount to their NAV. Investments in ETNs are also subject to credit risk similar to other debt securities. When a Fund invests in another investment company, shareholders of the Fund indirectly bear their proportionate share of the other investment company’s fees and expenses, including operating, registration, trustee, licensing, and marketing, as well as their share of the Fund’s fees and expenses.
Real Estate Investment Trusts — The Funds may invest in real estate investment trusts (“REITs”) that involve risks not associated with investing in stocks. Risks associated with investments in REITs include declines in the value of real estate, general and economic conditions, changes in the value of the underlying property and defaults by borrowers. The value of assets in the real estate industry may go through cycles of relative underperformance and outperformance in comparison to equity securities markets in general. Dividend income is recorded using management’s estimate of the income included in distributions received from REIT investments. The actual amounts of income, return of capital and capital gains are only determined by each REIT after its fiscal year-end and may differ from the estimated amount. Estimates of income are adjusted in the Funds to the actual amounts when the amounts are determined.
Portfolio securities loaned — The Funds may lend their portfolio securities. Lending portfolio securities exposes the Funds to the risk that the borrower may fail to return the loaned securities or may not be able to provide additional collateral or that the Funds may experience delays in recovery of the loaned securities or loss of rights in the collateral if the borrower fails financially. To minimize these risks, the borrower must agree to maintain cash collateral with the Funds’ custodian. The loaned securities are secured by collateral valued at least equal, at all times, to the market value of the loaned securities plus accrued interest, if any. When the collateral falls below specified amounts, the lending agent will use its best effort to obtain additional collateral on the next business day to meet required amounts under the security lending agreement. The cash collateral is reinvested by the Funds’ custodian into an approved short-term investment vehicle. The approved short-term investment vehicle is subject to market risk.
| As of December 31, 2020, the following Funds loaned securities and received collateral as follows: | | | |
| Fund | | Security Type | | Market Value of
Securities Loaned* | | | Market Value of
Collateral Received** | | | Net
Amount*** | |
| Dynamic Diversified Income Fund | | Exchange-Traded Funds | | $ | 2,217,190 | | | $ | 2,288,940 | | | $ | 71,750 | |
| Dynamic Global Allocation Fund | | Exchange-Traded Funds | | | 4,297,340 | | | | 4,432,320 | | | | 134,980 | |
Notes to Financial Statements (Continued)
| * | The remaining contractual maturity is overnight for all securities. |
| ** | Gross amount of recognized liabilities for securities lending included in the Statements of Assets and Liabilities. |
| *** | Net amount represents the net amount payable due to the borrower in the event of default. |
All cash collateral is received, held, and administered by the Funds’ custodian for the benefit of the lending Fund in its custody account or other account established for the purpose of holding collateral in cash equivalents.
Funds participating in securities lending receive compensation in the form of fees. Securities lending income is derived from lending long securities from the Funds to creditworthy approved borrowers at rates that are determined based on daily trading volumes, float, short-term interest rates and market liquidity and is shown net of fees on the Statements of Operations. When a Fund lends securities, it retains the interest or dividends on the investment of any cash received as collateral, and the Fund continues to receive interest or dividends on the loaned securities.
Unrealized gain or loss on the market value of the loaned securities that may occur during the term of the loan is recognized by the Fund. The Fund has the right under the lending agreement to recover any loaned securities from the borrower on demand.
Share valuation — The NAV per share of each class of shares of each Fund is calculated daily by dividing the total value of a Fund’s assets attributable to that class, less liabilities attributable to that class, by the number of outstanding shares of that class.
The maximum offering price per share of Class A shares of the Funds is equal to the NAV per share plus a sales load equal to 5.26% of the NAV (or 5.00% of the offering price). There is no sales load on purchases when aggregate purchases in all Touchstone funds equal at least $1 million. The maximum offering price per share of Classes C, Y, and Institutional Class shares of the Funds is equal to the NAV per share.
The redemption price per share of each class of shares of the Funds is generally equal to the NAV per share. However, Class A redemptions that were part of a no-load purchase due to the aggregate purchase amount in all Touchstone Funds equaling at least $1 million where a Finder’s Fee was paid may be subject to a contingent deferred sales charge (“CDSC”) of up to 1.00% if redeemed within a one-year period from the date of purchase. Additionally, purchases of Class C shares of the Funds may be subject to a CDSC of 1.00% if redeemed within a one-year period from the date of purchase. The CDSC will be assessed on an amount equal to the lesser of (1) the NAV at the time of purchase of the shares being redeemed or (2) the NAV of such shares being redeemed.
Investment income — Dividend income from securities is recognized on the ex-dividend date, net of foreign withholding taxes, if any, which are reduced by any amounts reclaimable by the Funds, where applicable. Interest income from securities is recorded on the basis of interest accrued, premium amortized and discount accreted.
Distributions to shareholders — Each Fund intends to distribute to its shareholders substantially all of its income and capital gains. The Anti-Benchmark® US Core Equity Fund declares and distributes net investment income, if any, annually as a dividend to shareholders. The Allocation Funds each declare and distribute net investment income, if any, quarterly as a dividend to shareholders. Each Fund makes distributions of capital gains, if any, at least annually, net of applicable capital loss carryforwards. Income distributions and capital gain distributions are determined in accordance with income tax regulations. Recognition of the Funds’ net investment income from investments in Underlying Funds is affected by the timing of dividend declarations by the Underlying Funds.
Allocations — Investment income earned, realized capital gains and losses, and unrealized appreciation and depreciation for a Fund are allocated daily to each class of shares based upon its proportionate share of total net assets of the Fund. Class-specific expenses are charged directly to the class incurring the expense. Common expenses, which are not attributable to a specific class, are allocated daily to each class of shares based upon their proportionate share of total net assets of the Fund. Expenses not directly billed to a Fund are allocated proportionally among all Funds in the Trust, and, if applicable, Touchstone Funds Group Trust, Touchstone Institutional Funds Trust and Touchstone Variable Series Trust (collectively with the Trust, “Touchstone Fund Complex”), daily in relation to net assets of each Fund or another reasonable measure.
Security transactions — Security transactions are reflected for financial reporting purposes as of the trade date. Realized gains and losses on sales of portfolio securities are calculated using the identified cost basis.
Estimates — The preparation of financial statements in conformity with U.S. GAAP requires management to make estimates and assumptions that affect the reported amounts of assets and liabilities and disclosure of contingent assets and liabilities at the date of the financial statements and the reported amounts of income and expenses during the reporting period. Actual results could differ from those estimates.
LIBOR Transition — Many debt securities, derivatives and other financial instruments in which the Funds may invest, as well as any borrowings made by the Funds from banks or from other lenders, utilize the London Interbank Offered Rate (“LIBOR”) as the reference or benchmark index for interest rate calculations. LIBOR is a measure of the average interest rate at which major global banks can borrow from one another. Plans are underway to phase out the use of LIBOR by June 30, 2023. The ICE Benchmark Administration Limited, the administrator of LIBOR, is expected to cease publishing most LIBOR maturities, including some US LIBOR maturities, on December 31, 2021, and the remaining and most liquid US LIBOR maturities on June 30, 2023. Before
Notes to Financial Statements (Continued)
then, it is expected that market participants will transition to the use of different reference or benchmark indices. However, there is currently no definitive information regarding the future utilization of LIBOR or of any particular replacement index. As such, the potential effect of a transition away from LIBOR on the Funds’ investments cannot yet be determined.
3. Investment Transactions
Investment transactions (excluding short-term investments and U.S. Government securities) were as follows for the year ended December 31, 2020 for all Funds except the Anti-Benchmark® US Core Equity Fund which is for the three months ended December 31, 2020:
| | | Anti-Benchmark® US
Core Equity Fund* | | Dynamic Diversified
Income Fund | | Dynamic Global
Allocation Fund | |
| Purchases of investment securities | | $ | 23,051,485 | | $ | 18,552,341 | | $ | 27,043,516 | |
| Proceeds from sales and maturities | | $ | 34,319,239 | | $ | 29,355,432 | | $ | 31,840,406 | |
| *The costs of purchases and proceeds from sales on the Anti-Benchmark® US Core Equity Fund excludes the purchases and sales of securities of the Touchstone Dynamic Equity Fund (see Note 9). If these transactions were included, purchases and sales would have been higher. |
There were no purchases or proceeds from sales and maturities of U.S. Government securities by the Funds for the year or period ended December 31, 2020.
4. Transactions with Affiliates and Other Related Parties
Certain officers of the Trust are also officers of Touchstone Advisors, Inc. (the “Advisor”),Touchstone Securities, Inc. (the “Underwriter”), or The Bank of New York Mellon (“BNY Mellon”), the Sub-Administrator to the Funds. Such officers receive no compensation from the Trust. The Advisor and the Underwriter are each wholly-owned subsidiaries of Western & Southern Financial Group, Inc.
On behalf of the Funds, the Advisor pays each Independent Trustee a quarterly retainer plus additional retainers to the Lead Independent Trustee and the chairs of each standing committee. Interested Trustees do not receive compensation from the Funds. Each Independent Trustee also receives compensation for each Board meeting and committee meeting attended. Each standing committee chair receives additional compensation for each committee meeting that he or she oversees. The Advisor is reimbursed by the Funds for the Independent Trustees’ compensation and out-of-pocket expenses relating to their services. The Funds accrued Trustee-related expenses of $46,557 for the year ended December 31, 2020.
MANAGEMENT & EXPENSE LIMITATION AGREEMENTS
The Advisor provides general investment supervisory services for the Funds under the terms of an advisory agreement (the “Advisory Agreement”). Under the Advisory Agreement, each Fund pays the Advisor a fee, which is computed and accrued daily and paid monthly, at an annual rate based on average daily net assets of each Fund as shown in the table below.
| Anti-Benchmark® US Core Equity Fund | 0.35% on the first $1 billion |
| | 0.30% on such assets over $1 billion |
| Dynamic Diversified Income Fund | 0.20% on the first $1 billion |
| | 0.175% on the next $1 billion |
| | 0.15% on the next $1 billion |
| | 0.125% on such assets over $3 billion |
| Dynamic Global Allocation Fund | 0.25% on the first $1 billion |
| | 0.225% on the next $1 billion |
| | 0.20% on the next $1 billion |
| | 0.175% on such assets over $3 billion |
| The Advisor has entered into investment sub-advisory agreements with the following parties (each, a “Sub-Advisor”): |
| TOBAM S.A.S. | Wilshire Associates Incorporated |
| Anti-Benchmark® US Core Equity Fund | Dynamic Diversified Income Fund |
| | Dynamic Global Allocation Fund |
The Advisor pays sub-advisory fees to each Sub-Advisor from its advisory fee.
The Advisor entered into an expense limitation agreement (the “Expense Limitation Agreement”) to contractually limit the annual operating expenses of the Funds, excluding: dividend and interest expenses relating to short sales; interest; taxes; brokerage commissions and other transaction costs; portfolio transaction and investment related expenses, including expenses associated with the Funds’
Notes to Financial Statements (Continued)
liquidity providers; other expenditures which are capitalized in accordance with U.S. GAAP; the cost of “Acquired Fund Fees and Expenses”, if any; and other extraordinary expenses not incurred in the ordinary course of business. The maximum annual operating expense limit in any year with respect to the Funds is based on a percentage of the average daily net assets of the Funds.
The Advisor has agreed to waive a portion of its fees, and to reimburse certain fund expenses in order to maintain the following expense limitations for the Funds:
| | | | | Institutional | Termination |
| Fund | Class A | Class C | Class Y | Class | Date |
| Anti-Benchmark® US Core Equity Fund | 0.79% | 1.54% | 0.54% | 0.44% | October 29, 2021 |
| Dynamic Diversified Income Fund | 0.49% | 1.24% | 0.24% | — | April 30, 2021 |
| Dynamic Global Allocation Fund | 0.49% | 1.24% | 0.24% | — | April 30, 2021 |
The Expense Limitation Agreement can be terminated with respect to a Fund by a vote of the Funds’ Board if it deems the termination to be beneficial to the Fund’s shareholders.
During the year or period ended December 31, 2020, the Advisor or its affiliates waived investment advisory fees, administration fees or other operating expenses, including distribution fees of the Funds, as follows:
| Fund | | | Investment
Advisory
Fees
Waived | | | Administration
Fees Waived | | | Other
Operating
Expenses
Waived/
Reimbursed | | | Total | |
| Anti-Benchmark® US Core Equity Fund | | $ | — | | $ | — | | $ | 54,070 | | $ | 54,070 | |
| Dynamic Diversified Income Fund | | | 33,922 | | | 43,290 | | | 177,851 | | | 255,063 | |
| Dynamic Global Allocation Fund | | | 58,764 | | | 56,924 | | | 251,922 | | | 367,610 | |
Under the terms of the Expense Limitation Agreement, the Advisor is entitled to recover, subject to approval by the Funds’ Board, such amounts waived or reimbursed for a period of up to three years from the date on which the Advisor reduced its compensation or assumed expenses for the Funds. A Fund will make repayments to the Advisor only if such repayment does not cause the Fund’s operating expenses (after the repayment is taken into account) to exceed the Fund’s expense limit in place when such amounts were waived or reimbursed by the Advisor and the Fund’s current expense limitation.
| As of December 31, 2020, the Advisor may seek recoupment of previously waived fees and reimbursed expenses as follows: |
| | | | | | | | | | | | | | |
| Fund | | Expires on or
before
December 31,
2021 | | Expires on or
before
September 30,
2022 | | Expires on or
before
December 31,
2022 | | Expires on or
before
September 30,
2023 | | Expires on or
before
December 31,
2023 | | Total | |
| Anti-Benchmark® US Core Equity Fund | | $ | — | | $ | 99,022 | | $ | — | | $ | 102,369 | | $ | 49,914 | | $ | 251,305 | |
| Dynamic Diversified Income Fund | | | 151,287 | | | — | | | 226,860 | | | — | | | 107,402 | | | 485,549 | |
| Dynamic Global Allocation Fund | | | 296,428 | | | — | | | 273,307 | | | — | | | 189,693 | | | 759,428 | |
| | | | | | | | | | | | | | | | | | | | | | | | | |
The Advisor did not recoup any amounts it previously waived or reimbursed during the year or period ended December 31, 2020.
ADMINISTRATION AGREEMENT
The Advisor entered into an Administration Agreement with the Trust, whereby the Advisor is responsible for: supplying executive and regulatory compliance services; supervising the preparation of tax returns; coordinating the preparation of reports to shareholders and reports to, and filings with the SEC and state securities authorities, as well as materials for meetings of the Board; calculating the daily NAV per share; and maintaining the financial books and records of each Fund.
For its services, the Advisor’s annual administrative fee is
0.145% on the first $20 billion of the aggregate average daily net assets;
0.11% on the next $10 billion of aggregate average daily net assets;
0.09% on the next $10 billion of aggregate average daily net assets; and
0.07% on the aggregate average daily net assets over $40 billion.
The fee is computed and allocated among the Touchstone Fund Complex (excluding Touchstone Institutional Funds Trust) on the basis of relative daily net assets.
The Advisor has engaged BNY Mellon as the Sub-Administrator to the Trust. BNY Mellon provides administrative and accounting services to the Trust and is compensated directly by the Advisor, not the Trust.
Notes to Financial Statements (Continued)
TRANSFER AGENT AGREEMENT
Under the terms of the Transfer Agent Agreement between the Trust and BNY Mellon Investment Servicing (U.S.) Inc. (“Transfer Agent”), the Transfer Agent to the Funds, the Transfer Agent maintains the records of each shareholder’s account, answers shareholders’ inquiries concerning their accounts, processes purchases and redemptions of each Fund’s shares, acts as dividend and distribution disbursing agent, and performs other shareholder service functions. For these services, the Transfer Agent receives a monthly fee from each Fund. In addition, each Fund pays out-of-pocket expenses incurred by the Transfer Agent, including, but not limited to, postage and supplies.
The Funds may reimburse the Advisor for fees paid to intermediaries such as banks, broker-dealers, financial advisors or other financial institutions for sub-transfer agency, sub-administration and other services provided to investors whose shares of record are held in omnibus, other group accounts, retirement plans or accounts traded through registered securities clearing agents. These fees may vary based on, for example, the nature of services provided, but generally range up to 0.15% of the assets of the class serviced or maintained by the intermediary or up to $22 per sub-account maintained by the intermediary.
PLANS OF DISTRIBUTION AND SHAREHOLDER SERVICING FEE ARRANGEMENTS
The Trust has adopted distribution plans pursuant to Rule 12b-1 under the 1940 Act for each class of shares it offers that is subject to 12b-1 distribution fees. The plans allow each Fund to pay distribution and other fees for the sale and distribution of its shares and for services provided to shareholders. The fees charged to the Funds are limited to the actual expenses incurred. Under the Class A plan, each Fund offering Class A shares pays an annual fee of up to 0.25% of average daily net assets that are attributable to Class A shares. Under the Class C plan, each Fund offering Class C shares pays an annual fee not to exceed 1.00% of average daily net assets that are attributable to Class C shares (of which up to 0.75% is a distribution fee and up to 0.25% is a shareholder servicing fee).
UNDERWRITING AGREEMENT
The Underwriter is the Funds’ principal underwriter and, as such, acts as exclusive agent for distribution of the Funds’ shares. Under the terms of the Underwriting Agreement between the Trust and the Underwriter, the Underwriter earned underwriting and broker commissions on the sale of Class A shares of the Funds. W&S Brokerage Services, Inc., an affiliate of the Underwriter and the Advisor, also earned broker commissions on the sale of Class A shares of the Funds. Listed below are the total underwriting and broker commissions earned by the Underwriter and its affiliate during the year or period ended December 31, 2020:
| Fund | | | Amount | |
| Anti-Benchmark® US Core Equity Fund | | $ | 55 | |
| Dynamic Diversified Income Fund | | | 5,646 | |
| Dynamic Global Allocation Fund | | | 15,609 | |
| In addition, the Underwriter collected CDSC on the redemption of Class C shares of the Funds listed below during the year ended December 31, 2020: |
| Fund | | | Amount | |
| Dynamic Diversified Income Fund | | $ | 458 | |
| Dynamic Global Allocation Fund | | | 143 | |
INTERFUND TRANSACTIONS
Pursuant to Rule 17a-7 under the 1940 Act, the Funds may engage in purchase and sale transactions with funds that have a common investment advisor (or affiliated investment advisors), common Trustees and/or common Officers. During the year or period ended December 31, 2020, the Funds did not engage in any Rule 17a-7 transactions.
AFFILIATED INVESTMENTS
A summary of each Allocation Fund’s transactions in affiliated Underlying Funds during the year or period ended December 31, 2020 is as follows:
Notes to Financial Statements (Continued)
Dynamic Diversified Income Fund
| Underlying Fund* | | Market Value
12/31/2019 | | Purchases at
cost | | Proceeds
from sales | | Net Realized
Gain(Loss)** | | Net Change
in Unrealized
Appreciation
(Depreciation) | | Market Value
12/31/2020 | | Dividend
Income | | Shares
12/31/2020 | |
| Touchstone Credit Opportunities Fund | | $ | 11,938,401 | | $ | 1,601,587 | | $ | (4,817,273 | ) | $ | (36,124 | ) | $ | (94,271 | ) | $ | 8,592,320 | | $ | 559,074 | | | 856,662 | |
| Touchstone Flexible Income Fund | | | 6,085,449 | | | 2,927,167 | | | (2,397,595 | ) | | 14,420 | | | 203,785 | | | 6,775,101 | | | 328,881 | | | 602,231 | |
| Touchstone High Yield Fund | | | 6,972,306 | | | 2,140,295 | | | (3,514,486 | ) | | 28,006 | | | 77,856 | | | 5,703,977 | | | 287,096 | | | 671,847 | |
| Touchstone Impact Bond Fund | | | 15,100,379 | | | 3,130,183 | | | (5,943,735 | ) | | 264,415 | | | 378,278 | | | 12,929,520 | | | 298,457 | | | 1,196,070 | |
| Touchstone Value Fund | | | 5,712,569 | | | 3,175,659 | | | (2,973,122 | ) | | 7,081 | | | 223,524 | | | 6,045,381 | | | 209,191 | | | 622,593 | |
| Total: | | $ | 45,809,104 | | $ | 12,974,891 | | $ | (19,646,211 | ) | $ | 277,798 | | $ | 789,172 | | $ | 40,046,299 | | $ | 1,682,699 | | | | |
| *All affiliated fund investments are invested in the Institutional Class shares, unless otherwise indicated. |
| **Includes capital gain distributions. |
Dynamic Global Allocation Fund
| Underlying Fund* | | | Market Value
12/31/2019 | | | Purchases at
cost | | | Proceeds
from sales | | | Net Realized
Gain(Loss)** | | | Net Change
in Unrealized
Appreciation
(Depreciation) | | | Market Value
12/31/2020 | | | Dividend
Income | | | Shares
12/31/2020 | | |
| Touchstone Anti-Benchmark® International Core Equity Fund | | $ | 11,241,955 | | $ | 1,721,568 | | $ | (4,566,029 | ) | $ | 12,841 | | $ | 671,694 | | $ | 9,082,029 | | $ | 162,746 | | | 767,712 | | |
| Touchstone Credit Opportunities Fund | | | 3,269,914 | | | 1,063,214 | | | (1,573,834 | ) | | (16,765 | ) | | (24,225 | ) | | 2,718,304 | | | 169,269 | | | 271,017 | | |
| Touchstone Growth Opportunities Fund | | | 4,557,982 | | | 2,637,785 | | | (1,214,880 | ) | | 757,027 | | | 1,156,354 | | | 7,255,842 | | | — | | | 169,926 | | |
| Touchstone High Yield Fund | | | — | | | 2,542,406 | | | (157,540 | ) | | 5,226 | | | 294,087 | | | 2,684,179 | | | 86,387 | | | 316,158 | | |
| Touchstone Impact Bond Fund | | | 13,467,659 | | | 2,340,759 | | | (4,055,606 | ) | | 123,769 | | | 441,474 | | | 12,318,055 | | | 273,273 | | | 1,139,506 | | |
| Touchstone International Growth Opportunities Fund | | | 5,285,941 | | | 269,159 | | | (5,907,740 | ) | | (126,509 | ) | | 479,149 | | | — | | | — | | | — | | |
| Touchstone International Growth Fund | | | 1,767,953 | | | 4,559,878 | | | (2,217,368 | ) | | (490,919 | ) | | 875,581 | | | 4,495,125 | | | 3,804 | | | 295,537 | | |
| Touchstone Mid Cap Fund | | | 3,473,691 | | | 182,619 | | | (2,046,341 | ) | | 642,123 | | | (437,094 | ) | | 1,787,292 | | | 6,623 | | | 40,263 | | |
| Touchstone Sands Capital Emerging Markets Growth Fund | | | 1,717,650 | | | 876,835 | | | (603,713 | ) | | 104,649 | | | 710,919 | | | 2,806,340 | | | — | | | 128,026 | | |
| Touchstone Sands Capital Institutional Growth Fund | | | 3,687,506 | | | 1,724,794 | | | (5,864,234 | ) | | 922,847 | | | 64,513 | | | — | | | — | | | — | | |
| Touchstone Sands Capital Select Growth Fund | | | — | | | 3,991,588 | | | (13,908 | ) | | (723 | ) | | 1,704,323 | | | 5,681,280 | | | — | | | 278,904 | | |
| Touchstone Small Cap Value Fund | | | 4,405,863 | | | 509,018 | | | (2,766,349 | ) | | (690,087 | ) | | 323,150 | | | 1,781,595 | | | 12,616 | | | 66,453 | | |
| Touchstone Ultra Short Duration Fixed Income Fund | | | 4,247,529 | | | 640,159 | | | (1,358,375 | ) | | (19,373 | ) | | (8,536 | ) | | 3,501,404 | | | 68,619 | | | 379,350 | | |
| Touchstone Value Fund | | | 9,494,403 | | | 6,351,643 | | | (2,446,926 | ) | | 171,227 | | | 922,400 | | | 14,261,275 | | | 237,856 | | | 1,468,720 | | |
| | | $ | 66,618,046 | | $ | 29,411,425 | | $ | (34,792,843 | ) | $ | 1,395,333 | | $ | 7,173,789 | | $ | 68,372,720 | | $ | 1,021,193 | | | | | |
| *All affiliated fund investments are invested in the Institutional Class shares, unless otherwise indicated. |
| **Includes capital gain distributions. |
5. Liquidity
ReFlow Fund LLC — The Funds may participate in the ReFlow Fund LLC liquidity program (“ReFlow”), which is designed to provide an alternative liquidity source for funds experiencing redemptions. In order to pay cash to shareholders who redeem their shares on a given day, a fund typically must hold cash in its portfolio, liquidate portfolio securities, or borrow money. ReFlow provides participating funds with another source of cash by standing ready to purchase shares from a fund up to the amount of the fund’s net redemptions on a given day, cumulatively limited to 3% of the outstanding voting shares of a Fund. ReFlow then generally redeems those shares (in cash or in-kind) when the Fund experiences net sales, at the end of a maximum holding period determined by ReFlow, or at other times at ReFlow’s discretion. In return for this service, the Fund will pay a fee to ReFlow at a rate determined by a daily auction with other participating mutual funds.
During the year or period ended December 31, 2020, the Funds did not utilize ReFlow.
Interfund Lending — Pursuant to an Exemptive Order issued by the SEC on March 28, 2017, the Funds, along with certain other funds in the Touchstone Fund Complex, may participate in an interfund lending program. The interfund lending program provides an alternate credit facility that allows the Funds to lend to or borrow from other participating funds in the Touchstone Fund Complex, subject to the conditions of the Exemptive Order. The Funds may not borrow under the facility for leverage purposes and the loans’ duration may be no more than 7 days.
During the year or period ended December 31, 2020, the Funds did not utilize Interfund Lending.
6. Federal Tax Information
Federal Income Tax — It is each Fund’s policy to continue to comply with the special provisions of the Internal Revenue Code applicable to regulated investment companies. As provided therein, in any fiscal year in which a Fund so qualifies and distributes at least 90% of its investment company taxable income, the Fund (but not the shareholders) will be relieved of federal income tax
Notes to Financial Statements (Continued)
on the income distributed. It is each Fund’s policy to distribute all of its taxable income and accordingly, no provision for income taxes has been made.
In order to avoid imposition of the excise tax applicable to regulated investment companies, it is also each Fund’s intention to declare and pay as dividends in each calendar year at least 98% of its investment company taxable income (earned during the calendar year) and 98.2% of its net realized capital gains (earned during the twelve months ending October 31) plus undistributed amounts from prior years.
The tax character of distributions paid for the years ended December 31, 2020 and December 31, 2019 for all funds except for the Anti-Benchmark® US Core Equity Fund, which is for the three months ended December 31, 2020 and the years ended September 30, 2020 and 2019 is as follows:
| | | | Anti-Benchmark®
US Core Equity Fund | | | Dynamic Diversified
Income Fund | | | Dynamic Global Allocation Fund | |
| | | Three Months
Ended December 31, 2020 | | Year Ended
September 30, 2020 | | Period Ended
September 30, 2019(A) | | Year Ended
December 31, 2020 | | Year Ended
December 31, 2019 | | Year Ended
December 31, 2020 | | Year Ended
December 31, 2019 | |
| From ordinary income | | $ | 290,036 | | $ | 905,831 | | $ | 145,904 | | $ | 2,081,908 | | $ | 2,678,047 | | $ | 2,182,735 | | $ | 1,978,959 | |
| From long-term capital gains | | | — | | | 373,296 | | | — | | | — | | | — | | | 347,206 | | | 1,307,990 | |
| From return of capital | | | — | | | 28,904 | | | — | | | — | | | — | | | — | | | — | |
| Total distributions | | $ | 290,036 | | $ | 1,308,031 | | $ | 145,904 | | $ | 2,081,908 | | $ | 2,678,047 | | $ | 2,529,941 | | $ | 3,286,949 | |
(A) Represents the period from commencement of operations (November 19, 2018) through September 30, 2019.
The following information is computed on a tax basis for each item as of December 31, 2020:
| | | | Anti-Benchmark®
US Core Equity Fund | | | Dynamic Diversified
Income Fund | | | Dynamic Global
Allocation Fund | |
| Tax cost of portfolio investments | | $ | 42,001,976 | | $ | 58,199,777 | | $ | 84,906,958 | |
| Gross unrealized appreciation on investments | | | 7,541,549 | | | 1,609,262 | | | 9,385,146 | |
| Gross unrealized depreciation on investments | | | (825,384 | ) | | (865,671 | ) | | (393,282 | ) |
| Net unrealized appreciation (depreciation) on investments | | | 6,716,165 | | | 743,591 | | | 8,991,864 | |
| Undistributed ordinary income | | | 1,871,225 | | | 114,724 | | | — | |
| Undistributed long-term capital gains | | | 1,213,931 | | | — | | | — | |
| Capital Loss Carryforwards | | | (3,550,671 | ) | | (4,199,957 | ) | | — | |
| Other temporary differences | | | (67,027 | ) | | — | | | — | |
| Distributable earnings (deficit) | | $ | 6,183,623 | | $ | (3,341,642 | ) | $ | 8,991,864 | |
The difference between the tax cost of portfolio investments and the financial statement cost is primarily due to wash sale loss deferrals and a non-taxable distribution basis outstanding.
As of December 31, 2020, the Funds had the following capital loss carryforwards for federal income tax purposes:
| | | | No Expiration
Short Term | | | No Expiration
Long Term | | | Total | |
| Anti-Benchmark® US Core Equity Fund* | | $ | 536,249 | | $ | 3,014,422 | | $ | 3,550,671 | |
| Dynamic Diversified Income Fund | | | — | | | 4,199,957 | | | 4,199,957 | |
*Future utilization is limited under current tax law.
During the year ended December 31, 2020, the following Fund utilized capital loss carryforwards:
| Fund | | Utilized | |
| Anti Benchmark® US Core Equity Fund | $ | | 52,298 | |
| Dynamic Global Allocation Fund | | | 21,626 | |
The Funds have analyzed their tax positions taken or to be taken on federal income tax returns for all open tax years (tax years ended December 31, 2017 through 2020) and have concluded that no provision for income tax is required in their financial statements.
Certain reclassifications, the result of permanent differences between financial statement and income tax reporting requirements, have been made to the components of capital as presented on the Statements of Assets and Liabilities. These reclassifications have no impact on the net assets or NAV per share of the Funds. The following reclassifications, which are primarily attributed to adjustments
Notes to Financial Statements (Continued)
related to mergers, taxable overdistributions and prior year true-up adjustments have been made to the following Funds for the year ended December 31, 2020:
| Fund | | | Paid-In
Capital | | | Distributable
Earnings | |
| Anti-Benchmark® US Core Equity Fund | | $ | 5,637,827 | | $ | (5,637,827 | ) |
| Dynamic Global Allocation Fund | | | (399,013 | ) | | 399,013 | |
7. Commitments and Contingencies
The Funds indemnify the Trust’s officers and Trustees for certain liabilities that might arise from their performance of their duties to the Funds. Additionally, in the normal course of business, the Funds enter into contracts that contain a variety of representations and warranties and which provide general indemnifications. The Funds’ maximum exposure under these arrangements is unknown, as this would involve future claims that may be made against the Funds.
8. Principal Risks
Risks Associated with Credit — An issuer may be unable to make timely payments of either principal or interest. This may cause the issuer’s securities to decline in value. Credit risk is particularly relevant to those Funds that invest a significant amount of their assets in junk bonds or lower-rated securities.
Risks Associated with Interest Rate Changes — The price of debt securities is generally linked to the prevailing market interest rates. In general, when interest rates rise, the price of debt securities falls, and when interest rates fall, the price of debt securities rises. The price volatility of a debt security also depends on its maturity. Longer-term securities are generally more volatile, so the longer the average maturity or duration of these securities, the greater their price risk. Duration is a measure of the expected life, taking into account any prepayment or call features of the security, that is used to determine the price sensitivity of the security for a given change in interest rates. Specifically, duration is the change in the value of a fixed-income security that will result from a 1% change in interest rates, and generally is stated in years. For example, as a general rule a 1% rise in interest rates means a 1% fall in value for every year of duration. Maturity, on the other hand, is the date on which a fixed-income security becomes due for payment of principal. The negative impact on fixed income securities if interest rates increase as a result could negatively impact a Fund’s NAV.
Risks Associated with Health Crises — An outbreak of respiratory disease caused by COVID-19 was first detected in China in December 2019 and subsequently spread internationally. As of the date of issuance of these financial statements, COVID-19 has resulted in closing borders, enhanced health screenings, healthcare service preparation and delivery, quarantines, cancellations, disruptions to supply chains and customer activity, as well as general concern and uncertainty. The impact of COVID-19 may be short term or may last for an extended period of time and result in a substantial economic downturn. The impact of this outbreak, and other epidemics and pandemics that may arise in the future, could negatively affect the worldwide economy, as well as the economies of individual countries, individual companies and the market in general in significant and unforeseen ways. Any such impact could adversely affect a Fund’s performance, the performance of the securities in which a Fund invests and may lead to losses on your investment in a Fund.
Please see the Funds’ prospectus for a complete discussion of these and other risks.
9. Fund Reorganization
Anti-Benchmark® US Core Equity Fund:
The Trustees of the Touchstone Anti-Benchmark® US Core Equity Fund, a series of the Touchstone Funds Group Trust (“TFGT”), approved an Agreement and Plan of Reorganization providing for the transfer of all its assets and liabilities to the Touchstone Dynamic Equity Fund, a series of the Touchstone Strategic Trust (“TST”). The performance and accounting history of TFGT Touchstone Anti-Benchmark® US Core Equity Fund was assumed by Touchstone Dynamic Equity Fund. The tax-free reorganization took place on October 2, 2020. Effective October 5, 2020, the Dynamic Equity Fund was renamed the Touchstone Anti-Benchmark® US Core Equity Fund.
The following is a summary of shares outstanding, net assets, net asset value per share and unrealized depreciation immediately before and after the tax-free reorganization.
Notes to Financial Statements (Continued)
| | | | Before Reorganization | | | After Reorganization | |
| | | | Touchstone
Anti-Benchmark® US Core Equity Fund | | | Touchstone
Dynamic Equity Fund | | | Touchstone
Anti-Benchmark® US Core Equity Fund | |
| Class A | | | | | | | | | | |
| Shares | | | — | | | 452,453 | | | 452,453 | |
| Net Assets | | $ | — | | $ | 5,867,004 | | $ | 5,867,004 | |
| Net Asset Value | | $ | — | | $ | 12.97 | | $ | 12.97 | |
| Class C | | | | | | | | | | |
| Shares | | | — | | | 171,625 | | | 171,625 | |
| Net Assets | | $ | — | | $ | 1,985,084 | | $ | 1,985,084 | |
| Net Asset Value | | $ | — | | $ | 11.57 | | $ | 11.57 | |
| Class Y | | | | | | | | | | |
| Shares | | | 12,210 | (A) | | 1,297,709 | | | 1,309,919 | |
| Net Assets | | $ | 160,365 | | $ | 17,043,427 | | $ | 17,203,792 | |
| Net Asset Value | | $ | 13.13 | (A) | $ | 13.13 | | $ | 13.13 | |
| Institutional Class | | | | | | | | | | |
| Shares | | | 2,313,972 | (B) | | 9,204 | | | 2,323,176 | |
| Net Assets | | $ | 30,771,483 | | $ | 122,393 | | $ | 30,893,876 | |
| Net Asset Value | | $ | 13.30 | (B) | $ | 13.30 | | $ | 13.30 | |
| Fund Total | | | | | | | | | | |
| Shares Outstanding | | | 2,326,182 | | | 1,930,991 | | | 4,257,173 | |
| Net Assets | | $ | 30,931,848 | | $ | 25,017,908 | | $ | 55,949,756 | |
| Unrealized Appreciation (Depreciation) | | $ | 4,379,593 | | $ | 3,297,182 | | $ | 7,676,775 | |
| (A) | Reflects a 0.8911:1 reverse stock split which occurred on the date of the reorganization, October 2, 2020. |
| (B) | Reflects a 0.8799:1 reverse stock split which occurred on the date of the reorganization, October 2, 2020. |
Assuming this reorganization had been completed on January 1, 2020, the Anti-Benchmark® US Core Equity Fund’s results of operations for the year ended December 31, 2020 would have been as follows:
| Net investment income | $ | 581,213 | |
| Net realized and unrealized gain on investments | $ | 13,503,977 | |
| Net increase in asset from operations | $ | 14,085,190 | |
Because the combined investment portfolios have been managed as a single portfolio since the reorganization was completed, it is not practical to separate the amounts of revenue and earnings to the Anti-Benchmark® US Core Equity Fund that have been included in its statement of operations since the reorganization.
10. Subsequent Events
Subsequent events occurring after the date of this report have been evaluated for potential impact to this report through the date the financial statements were issued.
At a meeting of the Board of Trustees (the “Board”) of the Trust held on November 19, 2020, the Board approved the reorganization of the Dynamic Diversified Income Fund into the Touchstone Credit Opportunities Fund, a series of the Touchstone Funds Group Trust, subject to shareholder approval. The reorganization is expected to be completed on or about June 4, 2021.
There were no other subsequent events that necessitated recognition or disclosure in the Funds’ financial statements.
Report of Independent Registered Public Accounting Firm
To the Shareholders of Touchstone Anti-Benchmark® US Core Equity Fund (formerly known as Touchstone Dynamic Equity Fund), Touchstone Dynamic Diversified Income Fund and Touchstone Dynamic Global Allocation Fund and the Board of Trustees of Touchstone Strategic Trust
Opinion on the Financial Statements
We have audited the accompanying statements of assets and liabilities of Touchstone Anti-Benchmark® US Core Equity Fund, Touchstone Dynamic Diversified Income Fund and Touchstone Dynamic Global Allocation Fund (collectively referred to as the “Funds”) (three of the funds constituting the Touchstone Strategic Trust (the “Trust”)), including the portfolios of investments, as of December 31, 2020, and the related statements of operations and changes in net assets, and the financial highlights for each of the periods indicated in the table below and the related notes (collectively referred to as the “financial statements”). In our opinion, the financial statements present fairly, in all material respects, the financial position of each of the Funds (three of the funds constituting the Touchstone Strategic Trust) at December 31, 2020, and the results of their operations, changes in net assets and financial highlights for each of the periods indicated in the table below, in conformity with U.S. generally accepted accounting principles.
| Funds comprising the Touchstone Strategic Trust | Statement of Operations | Statements of changes in net assets | Financial Highlights |
Touchstone Dynamic Diversified Income Fund Touchstone Dynamic Global Allocation Fund | For the year ended December 31, 2020 | For each of the two years in the period ended December 31, 2020 | For each of the five years in the period ended December 31, 2020 |
| Touchstone Anti-Benchmark® US Core Equity Fund | For the period from October 1, 2020 through December 31, 2020 and for the year ended September 30, 2020 | For the period from October 1, 2020 to December 31, 2020, for the year ended September 30, 2020, and for the period from November 19, 2018 (commencement of operations) through September 30, 2019 |
Basis for Opinion
These financial statements are the responsibility of the Trust’s management. Our responsibility is to express an opinion on each of the Funds’ financial statements based on our audits. We are a public accounting firm registered with the Public Company Accounting Oversight Board (United States) (“PCAOB”) and are required to be independent with respect to the Trust in accordance with the U.S. federal securities laws and the applicable rules and regulations of the Securities and Exchange Commission and the PCAOB.
We conducted our audits in accordance with the standards of the PCAOB. Those standards require that we plan and perform the audit to obtain reasonable assurance about whether the financial statements are free of material misstatement, whether due to error or fraud. The Trust is not required to have, nor were we engaged to perform, an audit of the Trust’s internal control over financial reporting. As part of our audits we are required to obtain an understanding of internal control over financial reporting but not for the purpose of expressing an opinion on the effectiveness of the Trust’s internal control over financial reporting. Accordingly, we express no such opinion.
Report of Independent Registered Public Accounting Firm (Continued)
Our audits included performing procedures to assess the risks of material misstatement of the financial statements, whether due to error or fraud, and performing procedures that respond to those risks. Such procedures included examining, on a test basis, evidence regarding the amounts and disclosures in the financial statements. Our procedures included confirmation of securities owned as of December 31, 2020, by correspondence with the custodian, transfer agent, and brokers or by other appropriate auditing procedures where replies from brokers were not received. Our audits also included evaluating the accounting principles used and significant estimates made by management, as well as evaluating the overall presentation of the financial statements. We believe that our audits provide a reasonable basis for our opinion.

We have served as the auditor of one or more Touchstone Investments’ investment companies since 1999.
Cincinnati, Ohio
February 19, 2021
Other Items (Unaudited)
Qualified Dividend Income
Under the Jobs and Growth Tax Relief Reconciliation Act of 2003 (the “Act”), the following percentages of ordinary dividends paid during the fiscal year ended December 31, 2020 are designated as “qualified dividend income,” as defined in the Act, and are subject to reduced tax rates. The Funds intend to pass through the maximum allowable percentage for Form 1099 Div.
| Anti-Benchmark® US Core Equity Fund | 100.00% |
| Dynamic Diversified Income Fund | 12.57% |
| Dynamic Global Allocation Fund | 22.44% |
Dividend Received Deduction
For corporate shareholders, the following ordinary distributions paid during the fiscal year ended December 31, 2020 qualify for the corporate dividends received deduction. The Funds intend to pass through the maximum allowable percentage.
| Anti-Benchmark® US Core Equity Fund | 100.00% |
| Dynamic Diversified Income Fund | 7.65% |
| Dynamic Global Allocation Fund | 15.04% |
For the fiscal year ended December 31, 2020, the Funds designated long-term capital gains as follows:
| Anti-Benchmark® US Core Equity Fund | | $ | 1,213,931 |
| Dynamic Global Allocation Fund | | $ | 347,206 |
Foreign Tax Income & Foreign Tax Credit
Dynamic Diversified Income Fund and Dynamic Global Allocation Fund intend to pass through a foreign tax credit to their respective shareholders. For the fiscal year ended December 31, 2020, the total amount of foreign source income is $222,361 or $0.05 per share and $212,184 or $0.03 per share, respectively. The total amount of foreign taxes to be paid is $11,182 or $0.003 per share and $25,671 or $0.004 per share, respectively. Shareholders’ allocable share of the foreign tax credit will be reported on Form 1099 Div.
Proxy Voting Guidelines and Proxy Voting Records
The Sub-Advisors are responsible for exercising the voting rights associated with the securities purchased and held by the Funds. A description of the policies and procedures that the Sub-Advisors use in fulfilling this responsibility is available as an appendix to the most recent Statement of Additional Information, which can be obtained without charge by calling toll free 1.800.543.0407 or by visiting the Touchstone website at TouchstoneInvestments.com or on the Securities and Exchange Commission’s (the “Commission”) website sec.gov. Information regarding how those proxies were voted during the most recent twelve-month period ended June 30, which will be filed by August 31 of that year, is also available without charge by calling toll free 1.800.543.0407 or on the Commission’s website at sec.gov.
Quarterly Portfolio Disclosure
Each Fund’s holdings as of the end of the third month of every fiscal quarter will be disclosed on Form N-PORT within 60 days of the end of the fiscal quarter. The complete listing of each Fund’s portfolio holdings is available on the Commission’s website and will be made available to shareholders upon request by calling 1.800.543.0407.
Schedule of Shareholder Expenses
As a shareholder of the Funds, you incur two types of costs: (1) transaction costs, such as sales charges (loads); and (2) ongoing costs, including investment advisory fees; distribution (12b-1) fees; and other Fund expenses. This example is intended to help you understand your ongoing costs (in dollars) of investing in the Funds and to compare these costs with the ongoing costs of investing in other mutual funds.
The example is based on an investment of $1,000 invested at the beginning of the period and held for the entire period (July 1, 2020 through December 31, 2020).
Actual Expenses
The first line for each share class of a Fund in the table below provides information about actual account values and actual expenses. You may use the information in this line, together with the amount you invested, to estimate the expenses that you paid over the period. Simply divide your account value by $1,000 (for example, an $8,600 account value divided by $1,000 = 8.6), then multiply
Other Items (Unaudited) (Continued)
the result by the number in the first line under the heading entitled “Expenses Paid During the Six Months Ended December 31, 2020” to estimate the expenses you paid on your account during this period.
Hypothetical Example for Comparison Purposes
The second line for each share class of a Fund in the table below provides information about hypothetical account values and hypothetical expenses based on the Funds’ actual expense ratio and an assumed rate of return of 5% per year before expenses, which is not the Funds’ actual return. The hypothetical account values and expenses may not be used to estimate the actual ending account balance or expenses you paid for the period. You may use this information to compare the ongoing costs of investing in the Funds and other funds. To do so, compare this 5% hypothetical example with the 5% hypothetical examples that appear in the shareholder reports of the other funds.
Please note that the expenses shown in the table below are meant to highlight your ongoing costs only and do not reflect any transactional costs, such as sales charges (loads). Therefore, the second line for each share class of a Fund in the table below is useful in comparing ongoing costs only, and will not help you determine the relative total costs of owning different funds. In addition, if these transactional costs were included, your costs would have been higher.
| | | | | | Net Expense
Ratio Annualized December 31, 2020 | | | Beginning
Account Value
July 1, 2020 | | | Ending
Account Value December 31, 2020 | | | Expenses Paid
During the Six Months Ended December 31, 2020* | |
| Touchstone Anti-Benchmark® US Core Equity Fund | | | | | | | | | | | | | | | | |
| Class A(A) | | | Actual | | | | 0.79 | % | | $ | 1,000.00 | | | $ | 1,094.10 | | | $ | 2.06 | |
| Class A | | | Hypothetical | | | | 0.79 | % | | $ | 1,000.00 | | | $ | 1,021.17 | | | $ | 4.01 | |
| Class C(A) | | | Actual | | | | 1.54 | % | | $ | 1,000.00 | | | $ | 1,092.50 | | | $ | 4.01 | |
| Class C | | | Hypothetical | | | | 1.54 | % | | $ | 1,000.00 | | | $ | 1,017.39 | | | $ | 7.81 | |
| Class Y(B) | | | Actual | | | | 0.54 | % | | $ | 1,000.00 | | | $ | 1,193.20 | | | $ | 2.98 | |
| Class Y | | | Hypothetical | | | | 0.54 | % | | $ | 1,000.00 | | | $ | 1,022.42 | | | $ | 2.75 | |
| Institutional Class(B) | | | Actual | | | | 0.44 | % | | $ | 1,000.00 | | | $ | 1,193.00 | | | $ | 2.43 | |
| Institutional Class | | | Hypothetical | | | | 0.44 | % | | $ | 1,000.00 | | | $ | 1,022.92 | | | $ | 2.24 | |
| Touchstone Dynamic Diversified Income Fund** | | | | | | | | | | | | | | | | |
| Class A | | | Actual | | | | 0.49 | % | | $ | 1,000.00 | | | $ | 1,108.90 | | | $ | 2.60 | |
| Class A | | | Hypothetical | | | | 0.49 | % | | $ | 1,000.00 | | | $ | 1,022.67 | | | $ | 2.49 | |
| Class C | | | Actual | | | | 1.24 | % | | $ | 1,000.00 | | | $ | 1,104.10 | | | $ | 6.56 | |
| Class C | | | Hypothetical | | | | 1.24 | % | | $ | 1,000.00 | | | $ | 1,018.90 | | | $ | 6.29 | |
| Class Y | | | Actual | | | | 0.24 | % | | $ | 1,000.00 | | | $ | 1,110.40 | | | $ | 1.27 | |
| Class Y | | | Hypothetical | | | | 0.24 | % | | $ | 1,000.00 | | | $ | 1,023.93 | | | $ | 1.22 | |
| Touchstone Dynamic Global Allocation Fund** | | | | | | | | | | | | | | | | |
| Class A | | | Actual | | | | 0.49 | % | | $ | 1,000.00 | | | $ | 1,169.20 | | | $ | 2.67 | |
| Class A | | | Hypothetical | | | | 0.49 | % | | $ | 1,000.00 | | | $ | 1,022.67 | | | $ | 2.49 | |
| Class C | | | Actual | | | | 1.24 | % | | $ | 1,000.00 | | | $ | 1,165.20 | | | $ | 6.75 | |
| Class C | | | Hypothetical | | | | 1.24 | % | | $ | 1,000.00 | | | $ | 1,018.90 | | | $ | 6.29 | |
| Class Y | | | Actual | | | | 0.24 | % | | $ | 1,000.00 | | | $ | 1,170.70 | | | $ | 1.31 | |
| Class Y | | | Hypothetical | | | | 0.24 | % | | $ | 1,000.00 | | | $ | 1,023.93 | | | $ | 1.22 | |
| (A) | Represents the period from commencement of operations (October 2, 2020) through December 31, 2020. Expenses are equal to the Fund's annualized expense ratio, multiplied by the average account value over the period, multiplied by 91/366. |
| (B) | Expenses are equal to the Fund's annualized expense ratio, multiplied by the average account value over the period, multiplied by 92/366. |
| * | Expenses are equal to the Fund's annualized expense ratio, multiplied by the average account value over the period, multiplied by 184/366 (to reflect one-half year period). |
| ** | The annualized expense ratios for the Allocation Funds do not include fees and expenses of the Underlying Funds in which the Allocation Funds invest. |
Liquidity Risk Management
The Funds have adopted and implemented a written liquidity risk management program (the “LRM Program”) as required by Rule 22e-4 under the Investment Company Act of 1940. Rule 22e-4 requires that each Fund adopt a program that is reasonably designed to assess and manage the Funds’ liquidity risk, which is the risk that a Fund could not meet redemption requests without significant dilution of remaining investors’ interests in a Fund.
Assessment and management of a Fund’s liquidity risk under the LRM Program takes into consideration certain factors, such as a Fund’s investment strategy and the liquidity of its portfolio investments during normal and reasonably foreseeable stressed conditions, its short- and long-term cash-flow projections during both normal and reasonably foreseeable stressed conditions, and its cash and cash-equivalent holdings and access to other funding sources. As required by the rule, the LRM Program includes policies and
Other Items (Unaudited) (Continued)
procedures for classification of Fund portfolio holdings in four liquidity categories, maintaining certain levels of highly liquid investments, and limiting holdings of illiquid investments.
The Board of Trustees of the Trust approved the appointment of a LRM Program administrator responsible for administering the LRM Program and for carrying out the specific responsibilities set forth in the LRM Program, including reporting to the Board on at least an annual basis regarding the LRM Program’s operation, its adequacy, and the effectiveness of its implementation for the past year (the “Program Administrator Report”). The Board has reviewed the Program Administrator Report covering the period from May 17, 2019 through May 14, 2020, (the “Review Period”). The Program Administrator Report stated that during the Review Period the Program operated and was implemented effectively to manage the Funds’ liquidity risk.
Advisory and Sub-Advisory Agreement Approval Disclosure
At a meeting held on November 19, 2020, the Board of Trustees (the “Board” or “Trustees”) of the Touchstone Strategic Trust (the “Trust”), and by a separate vote, the Independent Trustees of the Trust, approved the continuance of the Investment Advisory Agreement between the Trust and the Advisor with respect to each Fund of the Trust, and the continuance of the Sub-Advisory Agreement between the Advisor and each Fund’s respective Sub-Advisor, except with respect to the Sub-Advisory Agreement for Touchstone Anti-Benchmark® US Core Equity Fund (formerly, Touchstone Dynamic Equity Fund), which was approved at a meeting held earlier in the year.
In determining whether to approve the continuation of the Investment Advisory Agreement and the Sub-Advisory Agreements, the Advisor furnished information necessary for a majority of the Independent Trustees to make the determination that the continuance of the Investment Advisory Agreement and each Sub-Advisory Agreement was in the best interests of the respective Funds and their shareholders. The information provided to the Board included: (1) industry data comparing advisory fees and total expense ratios of comparable funds; (2) comparative performance information; (3) the Advisor’s and its affiliates’ revenues and costs of providing services to the Funds; and (4) information about the Advisor’s and Sub-Advisors’ personnel. Prior to voting, the Independent Trustees reviewed the proposed continuance of the Investment Advisory Agreement and the Sub-Advisory Agreements with management and experienced independent legal counsel and received materials from such counsel discussing the legal standards for their consideration of the proposed continuation of the Investment Advisory Agreement and each Sub-Advisory Agreement. The Independent Trustees also reviewed the proposed continuation of the Investment Advisory Agreement and each Sub-Advisory Agreement with independent legal counsel in private sessions at which no representatives of management were present.
In approving the Funds’ Investment Advisory Agreement, the Board considered various factors, among them: (1) the nature, extent and quality of services provided to the Funds, including the personnel providing such services; (2) the Advisor’s compensation and profitability; (3) a comparison of fees and performance with comparable funds; (4) economies of scale; and (5) the terms of the Investment Advisory Agreement. The Board’s analysis of these factors is set forth below. The Independent Trustees were advised by independent legal counsel throughout the process.
Nature, Extent and Quality of Advisor Services. The Board considered the level and depth of knowledge of the Advisor, including the professional experience and qualifications of senior personnel. In evaluating the quality of services provided by the Advisor, the Board took into account its familiarity with the Advisor’s senior management through Board meetings, discussions and reports during the preceding year. The Board also took into account the Advisor’s compliance policies and procedures. The quality of administrative and other services, including the Advisor’s role in coordinating the activities of the Funds’ other service providers, was also considered. The Board also considered the Advisor’s relationship with its affiliates and the resources available to them, as well as any potential conflicts of interest.
The Board discussed the Advisor’s effectiveness in monitoring the performance of each Sub-Advisor, and the Advisor’s timeliness in responding to performance issues. The Board considered the Advisor’s process for monitoring each of the Sub-Advisors, which includes an examination of both qualitative and quantitative elements of the Sub-Advisor’s organization, personnel, procedures, investment discipline, infrastructure and performance. The Board considered that the Advisor conducts periodic compliance due diligence of each Sub-Advisor, during which the Advisor examines a wide variety of factors, such as the financial condition of the Sub-Advisor, the quality of the Sub-Advisor’s systems, the effectiveness of the Sub-Advisor’s disaster recovery programs, trade allocation and execution procedures, compliance with the Sub-Advisor’s policies and procedures, results of regulatory examinations and any other factors that might affect the quality of services that the Sub-Advisor provides to the applicable Fund(s). The Board noted that the Advisor’s compliance monitoring processes also include quarterly reviews of compliance certifications, and that any issues arising from such reviews and the Advisor’s compliance visits to the Sub-Advisors are reported to the Board.
The Trustees concluded that they were satisfied with the nature, extent and quality of services provided to each Fund by the Advisor under the Investment Advisory Agreement.
Advisor’s Compensation and Profitability. The Board took into consideration the financial condition and profitability of the Advisor and its affiliates and the direct and indirect benefits derived by the Advisor and its affiliates from the Advisor’s relationship with the Funds. The information considered by the Board included operating profit margin information for the Advisor’s business as a
Other Items (Unaudited) (Continued)
whole. The Board noted that the Advisor had waived a portion of advisory fees and administrative fees and/or reimbursed expenses in order to limit each Fund’s net operating expenses. The Board also noted that the Advisor pays the Sub-Advisors’ sub-advisory fees out of the advisory fees the Advisor receives from the Funds. The Board reviewed the profitability of the Advisor’s relationship with the Funds both before and after tax expenses, and also considered whether the Advisor has the financial wherewithal to continue to provide services to the Funds, noting the ongoing commitment of the Advisor’s parent company with respect to providing support and resources as needed. The Board considered that the Funds’ distributor, an affiliate of the Advisor, receives Rule 12b-1 distribution fees from the Funds and receives a portion of the sales charges on sales or redemptions of certain classes of shares. The Board also noted that the Advisor derives benefits to its reputation and other benefits from its association with the Funds.
The Board recognized that the Advisor should be entitled to earn a reasonable level of profits in exchange for the level of services it provides to each Fund and the entrepreneurial risk that it assumes as Advisor. Based upon their review, the Trustees concluded that the Advisor’s and its affiliates’ level of profitability, if any, from their relationship with each Fund was reasonable and not excessive.
Expenses and Performance. The Board compared the respective advisory fees and total expense ratios for each of the Funds with various comparative data, including the median and average advisory fees and total expense ratios of each Fund’s respective peer group. The Board also considered, among other data, the Funds’ respective performance results during the six-month, twelve-month and thirty-six-month periods ended September 30, 2020, as applicable, and noted that the Board reviews on a quarterly basis detailed information about each Fund’s performance results, portfolio composition and investment strategies. The Board also took into account current market conditions and their effect on the Funds’ performance.
The Board also considered the effect of each Fund’s growth and size on its performance and expenses. The Board noted that the Advisor had waived a portion of the fees and/or reimbursed expenses of the Funds in order to reduce the Funds’ respective operating expenses to targeted levels. The Board noted that the sub-advisory fees under the Sub-Advisory Agreement with respect to each Fund were paid by the Advisor out of the advisory fees it receives from the Fund and considered the impact of such sub-advisory fees on the profitability of the Advisor. In reviewing the respective total expense ratios and performance of each of the Funds, the Board also took into account the nature, extent and quality of the services provided to the Funds by the Advisor and its affiliates.
The Board considered, among other data, the specific factors and related conclusions set forth below with respect to each Fund:
Touchstone Anti-Benchmark® US Core Equity Fund. The Fund’s advisory fee and total expense ratio (net of applicable expense waivers and reimbursements) were each below the median of its peer group. The Board noted that the Advisor was currently waiving and/or reimbursing a portion of the Fund’s fees and/or expenses. The Fund’s performance for the six-month period ended September 30, 2020 was in the 3rd quintile, while the Fund’s performance for the twelve-month period ended September 30, 2020 was in the 2nd quintile of its peer group. The Board noted that the Fund had undergone a change in sub-advisor and principal investment strategy in October 2020. Based upon their review, the Trustees concluded that the Fund’s overall performance was satisfactory relative to the performance of funds with similar investment objectives and relevant indices, and that the advisory fee was reasonable in light of the services received by the Fund from the Advisor and the other factors considered.
Touchstone Dynamic Diversified Income Fund. The Fund’s advisory fee and total expense ratio (net of applicable expense waivers and reimbursements) were each below the median of its peer group. The Board noted that the Advisor was currently waiving and/or reimbursing a portion of the Fund’s fees and/or expenses. The Fund’s performance for the six-month period ended September 30, 2020 was in the 3rd quintile, while the Fund’s performance for each of the twelve- and thirty-six-month periods ended September 30, 2020 was in the 5th quintile of its peer group. The Board noted management’s discussion of the Fund’s performance and its recommendation that the Fund be merged into another Touchstone Fund. Based upon their review, the Trustees concluded that the Fund’s overall performance was satisfactory relative to the performance of funds with similar investment objectives and relevant indices, and that the advisory fee was reasonable in light of the services received by the Fund from the Advisor and the other factors considered.
Touchstone Dynamic Global Allocation Fund. The Fund’s advisory fee and total expense ratio (net of applicable expense waivers and reimbursements) were each above the median of its peer group. The Board noted that the Advisor was currently waiving and/or reimbursing a portion of the Fund’s fees and/or expenses. The Fund’s performance for each of the six-, twelve- and thirty-six-month periods ended September 30, 2020 was in the 1st quintile of its peer group. Based upon their review, the Trustees concluded that the Fund’s overall performance was satisfactory relative to the performance of funds with similar investment objectives and relevant indices, and that the advisory fee was reasonable in light of the services received by the Fund from the Advisor and the other factors considered.
Economies of Scale. The Board considered the effect of each Fund’s current size and potential growth on its performance and expenses. The Board took into account management’s discussion of the Funds’ advisory fee structure. The Board considered the effective advisory fees under the Investment Advisory Agreement as a percentage of assets at different asset levels and possible economies of scale that might be realized if the assets of each Fund increase. The Board noted that the advisory fee schedules for the Funds contain breakpoints that would reduce the respective advisory fee rate on assets above specified levels as the respective Fund’s assets increased.
Other Items (Unaudited) (Continued)
The Board also noted that if a Fund’s assets increase over time, the Fund also might realize other economies of scale if assets increase proportionally more than certain other expenses. The Board also considered the fact that, under the Investment Advisory Agreement, the advisory fee payable to the Advisor by a Fund was reduced by the total sub-advisory fee paid by the Advisor to the Fund’s Sub-Advisor.
Conclusion. In considering the renewal of the Funds’ Investment Advisory Agreement, the Board, including the Independent Trustees, did not identify any single factor as controlling, and each Trustee may have attributed different weights to the various factors. The Trustees evaluated all information available to them on a Fund-by-Fund basis, and their determinations were made separately with respect to each Fund. The Board reached the following conclusions regarding the Funds’ Investment Advisory Agreement with the Advisor, among others: (a) the Advisor demonstrated that it possesses the capability and resources to perform the duties required of it under the Investment Advisory Agreement; (b) the Advisor maintains an appropriate compliance program; (c) the overall performance of each Fund is satisfactory relative to the performance of funds with similar investment objectives and relevant indices; and (d) each Fund’s advisory fee is reasonable in light of the services received by the Fund from the Advisor and the other factors considered. Based on their conclusions, the Trustees determined with respect to each Fund that continuation of the Investment Advisory Agreement was in the best interests of the Fund and its shareholders.
In approving the Funds’ respective Sub-Advisory Agreements, the Board considered various factors with respect to each Fund and the applicable Sub-Advisory Agreement, among them: (1) the nature, extent and quality of services provided to the Fund, including the personnel providing such services; (2) the Sub-Advisor’s compensation; (3) a comparison of the sub-advisory fee and performance with comparable funds; and (4) the terms of the Sub-Advisory Agreement. The Board’s analysis of these factors is set forth below. The Independent Trustees were advised by independent legal counsel throughout the process.
Nature, Extent and Quality of Services Provided; Investment Personnel. The Board considered information provided by the Advisor regarding the services provided by each Sub-Advisor, including information presented periodically throughout the previous year. The Board noted that, on a periodic basis, the Board meets with portfolio managers of the Sub-Advisors to discuss their respective performance and investment processes and strategies. The Board considered each Sub-Advisor’s level of knowledge and investment style. The Board reviewed the experience and credentials of the applicable investment personnel who are responsible for managing the investment of portfolio securities with respect to the Funds. The Board also noted each Sub-Advisor’s brokerage practices.
Sub-Advisor’s Compensation, Profitability and Economies of Scale. The Board also took into consideration the financial condition of each Sub-Advisor and any indirect benefits derived by each Sub-Advisor and its affiliates from the Sub-Advisor’s relationship with the Funds. In considering the profitability to each Sub-Advisor of its relationship with the Fund(s), the Board noted the undertaking of the Advisor to maintain expense limitations for the Funds and also noted that the sub-advisory fees under the Sub-Advisory Agreements were paid by the Advisor out of the advisory fees that it receives under the Investment Advisory Agreement and are negotiated at arm’s-length. As a consequence, the profitability to each Sub-Advisor of its relationship with a Fund was not a substantial factor in the Board’s deliberations. For similar reasons, the Board did not consider the potential economies of scale in each Sub-Advisor’s management of the applicable Fund to be a substantial factor in its consideration, although the Board noted that the sub-advisory fee schedule for each Fund contained breakpoints that would reduce the sub-advisory fee rate on assets above specified levels as the applicable Fund’s assets increased.
Sub-Advisory Fees and Fund Performance. The Board considered that each Fund pays an advisory fee to the Advisor and that the Advisor pays the sub-advisory fee to the Sub-Advisor out of the advisory fees it receives from the respective Fund. The Board also compared the sub-advisory fees paid by the Advisor to fees charged by the Touchstone Dynamic Equity Fund’s Sub-Advisor to manage comparable institutional separate accounts. The Board considered the amount retained by the Advisor and the sub-advisory fee paid to each Sub-Advisor with respect to the various services provided by the Advisor and the Sub-Advisor. The Board also noted that the Advisor negotiated the sub-advisory fee with each of the Sub-Advisors at arm’s-length. The Board reviewed the sub-advisory fee for each Fund in relation to various comparative data, including the median and average sub-advisory fees of each Fund’s peer group, and considered the following information:
Touchstone Dynamic Diversified Income Fund. The Fund’s sub-advisory fee was at the median of its peer group. Based upon their review, the Trustees concluded that the sub-advisory fee was reasonable in light of the services received by the Fund from the Sub-Advisor and the other factors considered.
Touchstone Dynamic Global Allocation Fund. The Trustees considered the Fund’s sub-advisory fee relative to the fees paid by other funds to their sub-advisors. Based upon their review, the Trustees concluded that the sub-advisory fee was reasonable in light of the services received by the Fund from the Sub-Advisor and the other factors considered.
As noted above, the Board considered each Fund’s performance during the six-month, twelve-month and thirty-six-month periods ended September 30, 2020, as applicable, and as compared to each Fund’s peer group and noted that the Board reviews on a quarterly basis detailed information about each Fund’s performance results, portfolio composition and investment strategies. The Board also noted the Advisor’s expertise and resources in monitoring the performance, investment style and risk-adjusted performance of each
Other Items (Unaudited) (Continued)
Sub-Advisor. The Board also was mindful of the Advisor’s ongoing monitoring of each Sub-Advisor’s performance and the measures undertaken by the Advisor to address any underperformance.
Conclusion. In considering the renewal of the Sub-Advisory Agreement with respect to each Fund, the Board, including the Independent Trustees, did not identify any single factor as controlling, and each Trustee may have attributed different weights to the various factors. The Board reached the following conclusions regarding each Sub-Advisory Agreement, among others: (a) the Sub-Advisor is qualified to manage each Fund’s assets in accordance with the Fund’s investment goals and policies; (b) the Sub-Advisor maintains an appropriate compliance program; (c) the overall performance of each Fund is satisfactory relative to the performance of funds with similar investment objectives and relevant indices; (d) each Fund’s sub-advisory fee is reasonable in light of the services received by the Fund from the Sub-Advisor and the other factors considered; and (e) the Sub-Advisor’s investment strategies are appropriate for pursuing the investment goals of each Fund. Based on its conclusions, the Board determined that approval of the Sub-Advisory Agreement with respect to each Fund was in the best interests of the Fund and its shareholders.
Touchstone Anti-Benchmark® US Core Equity Fund
At a meeting held on May 21, 2020, Touchstone Advisors, Inc. (the “Advisor”) proposed the replacement of the current sub-advisor of the Touchstone Dynamic Equity Fund (now known as Touchstone Anti-Benchmark® US Core Equity Fund) (the “Fund”), Wells Capital Management, Inc. (“Wells”), to the Board of Trustees (the “Board”) of Touchstone Strategic Trust. The Board approved replacing Wells with TOBAM S.A.S. (“TOBAM”). In connection with this sub-advisor change, the Board also approved, among other things, changes to the Fund’s investment goal, principal investment strategies, benchmark and name. The Board also took into consideration that these changes would become effective following the reorganization of the Fund into the Touchstone Anti-Benchmark® US Core Equity Fund (the “TFGT Anti-Benchmark Fund”), a series of the Touchstone Funds Group Trust.
The Advisor provided the Board with various written materials in advance of the May 21, 2020 meeting to assist with the Board’s consideration of a new Sub-Advisory Agreement between the Advisor and TOBAM (the “New Sub-Advisory Agreement”). The Advisor provided written and oral information stating the basis for its recommendation to engage TOBAM. The information also included details regarding TOBAM’s: (a) investment philosophy and investment strategy; (b) investment management services proposed to be provided to the Fund; (c) investment management personnel; (d) operating history, infrastructure and financial condition; (e) proposed sub-advisory fee that would be paid to TOBAM by the Advisor; and (f) reputation, expertise and resources as an investment advisor. The Board then discussed the written materials that the Board received before the meeting and all other information that the Board received at the meeting.
The Board, including the Independent Trustees voting separately, unanimously determined that the proposal to approve the New Sub-Advisory Agreement for the Fund would be in the best interests of the Fund and its shareholders. In approving the New Sub-Advisory Agreement, the Board considered various factors, among them: (1) the nature, extent and quality of services to be provided to the Fund, including the investment personnel who would be providing such services; (2) TOBAM’s proposed compensation; (3) the performance of the Fund and that of the TFGT Anti-Benchmark US Fund managed by TOBAM using the same investment strategy that TOBAM proposes to use in managing the Fund; and (4) the terms of the New Sub-Advisory Agreement. The Board’s consideration of these factors is summarized below. The Independent Trustees were advised by independent legal counsel throughout the process.
Nature, Extent and Quality of Services to be Provided; Investment Personnel. The Board considered information provided by the Advisor regarding the services to be provided by TOBAM. The Board considered TOBAM’s level of knowledge and investment style. The Board reviewed the experience and credentials of the investment personnel who would be responsible for managing the investment of portfolio securities with respect to the Fund. The Board also noted that it is familiar with TOBAM, as TOBAM serves as a sub-advisor to the TFGT Anti-Benchmark US Fund, which it manages in accordance with its Anti-Benchmark US Core Equity strategy. The Board noted that TOBAM would utilize an identical strategy currently employed for the TFGT Anti-Benchmark US Fund in managing the Fund. The Board also noted that the investment team who would manage the Fund would be the same investment team who currently manage the TFGT Anti-Benchmark US Fund. The Board also took into consideration that the Advisor was satisfied with TOBAM’s in-house risk and compliance teams and its familiarity with TOBAM given TOBAM’s management of the TFGT Anti-Benchmark US Fund and the Touchstone Anti-Benchmark® International Core Equity Fund.
Anticipated Profitability and Potential Economies of Scale. The Board took into consideration the financial condition of TOBAM and any direct and indirect benefits to be derived by TOBAM from its relationship with the Fund. In considering the anticipated level of profitability to TOBAM, the Board noted the proposed contractual undertaking of the Advisor to maintain expense limitations for the Fund and also noted that the sub-advisory fee under the New Sub-Advisory Agreement would be paid by the Advisor out of the advisory fee that it receives from the Fund, and that the proposed sub-advisory fee was negotiated at arm’s length between the Advisor and TOBAM. As a consequence, the anticipated level of profitability to TOBAM from its relationship with the Fund was not a substantial factor in the Board’s deliberations. For similar reasons, the Board did not consider potential economies of scale in TOBAM’s management of the Fund to be a substantial factor in its consideration. The Board noted that in connection with the proposed change in sub-advisor the Advisor also proposed to reduce the Fund’s advisory fee at every level and the expense limitations on all of the Fund’s share classes.
Other Items (Unaudited) (Continued)
Proposed Sub-Advisory Fee. The Board considered that the Fund would pay an advisory fee to the Advisor and that the Advisor would pay the sub-advisory fee to TOBAM out of the advisory fee. The Board compared TOBAM’s proposed sub-advisory fee to the sub-advisory fee paid to Wells, noting that the proposed sub-advisory fee was lower than the current sub-advisory fee for assets less than $1.5 billion. The Board noted that the proposed sub-advisory fee to be paid to TOBAM for managing the Fund will be identical to the sub-advisory fee paid to TOBAM for managing the TFGT Anti-Benchmark US Fund. The Board considered the amount of the advisory fee to be retained by the Advisor and the amount to be paid to TOBAM with respect to the various services to be provided by the Advisor and TOBAM. Based upon their review, the Trustees concluded that the Fund’s proposed sub-advisory fee was reasonable in light of the services to be provided to the Fund by TOBAM.
Fund Performance. The Board considered TOBAM’s investment performance and the Fund’s investment performance under the management of Wells. The Trustees also took into consideration the investment performance of the TFGT Anti-Benchmark US Fund relative to that of the Fund and its benchmark index.
Conclusion. The Board reached the following conclusions regarding the New Sub-Advisory Agreement: (a) TOBAM is qualified to manage the Fund’s assets in accordance with the Fund’s new investment goal and principal investment strategies; (b) TOBAM maintains an appropriate compliance program; (c) the Fund’s proposed sub-advisory fee is reasonable in relation to the services to be provided to the Fund by TOBAM; and (d) TOBAM’s proposed investment strategies are appropriate for managing the Fund. In considering the approval of the New Sub-Advisory Agreement, the Board, including the Independent Trustees, did not identify any single factor as controlling, and each Trustee attributed different weights to the various factors. Based on its conclusions, the Board, including a majority of the Independent Trustees, determined that approval of the New Sub-Advisory Agreement was in the best interests of the Fund.
Management of the Trust (Unaudited)
Listed below is required information regarding the Trustees and Principal Officers of the Trust. The Trust’s Statement of Additional Information includes additional information about the Trustees and is available, without charge, upon request by calling 1.800.543.0407 or by visiting the Touchstone website at TouchstoneInvestments.com.
| Interested Trustee1: |
Name
Address
Year of Birth | Position(s) Held with Trust | Term of Office And Length of Time Served | Principal Occupation(s) During Past 5 Years | Number of Funds Overseen in the Touchstone Fund Complex2 | Other Directorships Held During the Past 5 Years3 |
Jill T. McGruder
Touchstone Advisors, Inc.
303 Broadway, Suite 1100
Cincinnati, Ohio 45202
Year of Birth: 1955 | Trustee | Until retirement at age 75 or until she resigns or is removed Trustee since 1999 | President, Director and CEO of IFS Financial Services, Inc. (a holding company) since 1999; and Senior Vice President and Chief Marketing Officer of Western & Southern Financial Group, Inc. (a financial services company) since 2016. | 37 | Director, Integrity Life Insurance Co. and National Integrity Life Insurance Co. since 2005; Director, Touchstone Securities (the Distributor) since 1999; Director, Touchstone Advisors (the Advisor) since 1999; Director, W&S Brokerage Services, Inc. since 1999; Director, W&S Financial Group Distributors, Inc. since 1999; Director, Insurance Profillment Solutions LLC since 2014; Director, Columbus Life Insurance Co. since 2016; Director, The Lafayette Life Insurance Co. since 2016; Director, Gerber Life Insurance Company since 2019; Director, Western & Southern Agency, Inc. since 2018; and Director, LL Global, Inc. (not-for-profit trade organization with operating divisions LIMRA and LOMA) since 2016. |
| Independent Trustees: | | | | | |
Karen Carnahan
c/o Touchstone Advisors, Inc.
303 Broadway, Suite 1100
Cincinnati, Ohio 45202
Year of Birth: 1954 | Trustee | Until retirement at age 75 or until she resigns or is removed Trustee since 2019 | Retired; formerly Chief Operating Officer of Shred-it (a business services company) from 2014 to 2015; formerly President & Chief Operating Officer of the document management division of Cintas Corporation (a business services company) from 2008 to 2014. | 37 | Director, Cintas Corporation since 2019; Director, Boys & Girls Club of West Chester/Liberty since 2016; and Board of Advisors, Best Upon Request since 2020. |
William C. Gale
c/o Touchstone Advisors, Inc.
303 Broadway, Suite 1100
Cincinnati, Ohio 45202
Year of Birth: 1952 | Trustee | Until retirement at age 75 or until he resigns or is removed Trustee since 2013 | Retired; formerly Senior Vice President and Chief Financial Officer of Cintas Corporation (a business services company) from 1995 to 2015. | 37 | None. |
Susan J. Hickenlooper
c/o Touchstone Advisors, Inc.
303 Broadway, Suite 1100
Cincinnati, Ohio 45202
Year of Birth: 1946 | Trustee | Until retirement at age 75 or until she resigns or is removed Trustee since 2009 | Retired from investment management. | 37 | Trustee, Episcopal Diocese of Southern Ohio from 2014 to 2018. |
Kevin A. Robie
c/o Touchstone Advisors, Inc.
303 Broadway, Suite 1100
Cincinnati, Ohio 45202
Year of Birth: 1956 | Trustee | Until retirement at age 75 or until he resigns or is removed Trustee since 2013 | Retired; formerly Vice President of Portfolio Management at Soin LLC (private multinational holding company and family office) from 2004 to 2020. | 37 | Director, SaverSystems, Inc. since 2015; Director, Buckeye EcoCare, Inc. from 2013 to 2018; Director, Turner Property Services Group, Inc. since 2017; Trustee, Dayton Region New Market Fund, LLC (private fund) since 2010; and Trustee, Entrepreneurs Center, Inc. (business incubator) since 2006. |
| Management of the Trust (Unaudited) (Continued) |
| Independent Trustees (Continued): |
Name
Address
Year of Birth | Position(s) Held with Trust | Term of Office And Length of Time Served | Principal Occupation(s) During Past 5 Years | Number of Funds Overseen in the Touchstone Fund Complex2 | Other Directorships Held During the Past 5 Years3 |
William
H. Zimmer III
c/o Touchstone Advisors, Inc.
303 Broadway, Suite 1100
Cincinnati, Ohio 45202
Year of Birth: 1953 | Trustee | Until retirement at age 75 or until he resigns or is removed Trustee since 2019 | Independent Treasury Consultant since 2014. | 37 | Director, Deaconess Associations, Inc. (healthcare) since 2001; Trustee, Huntington Funds (mutual funds) from 2006 to 2015; and Director, National Association of Corporate Treasurers from 2011 to 2015. |
| | | | | | |
1 Ms. McGruder, as a director of the Advisor and the Distributor, and an officer of affiliates of the Advisor and the Distributor, is an “interested person” of the Trust within the meaning of Section 2(a)(19) of the 1940 Act.
2 As of December 31, 2020, the Touchstone Fund Complex consists of 18 series of the Trust, 7 variable annuity series of Touchstone Variable Series Trust and 12 series of the Touchstone Funds Group Trust.
3 Each Trustee is also a Trustee of Touchstone Variable Series Trust and Touchstone Funds Group Trust.
| Principal Officers: |
Name
Address
Year of Birth | | Position(s) Held with Trust1 | Term of Office and Length of Time Served | | Principal Occupation(s) During Past 5 Years |
E. Blake Moore, Jr.
Touchstone Advisors, Inc.
303 Broadway, Suite 1100
Cincinnati, Ohio 45202
Year of Birth: 1958 | | President | Until resignation, removal or disqualification President since January 2021 | | Chief Executive Officer of Touchstone Advisors, Inc. and Touchstone Securities Inc. (since 2020); President, Foresters Investment Management Company, Inc. (2018 to 2020); President, North American Asset Management at Foresters Financial (2018 to 2020); Managing Director, Head of Americas at UBS Asset Management (2015 to 2017); and Executive Vice President, Head of Distribution at Mackenzie Investments (2011 to 2014). |
Timothy D. Paulin
Touchstone Advisors, Inc.
303 Broadway, Suite 1100
Cincinnati, Ohio 45202
Year of Birth: 1963 | | Vice President | Until resignation, removal or disqualification Vice President since 2010 | | Senior Vice President of Investment Research and Product Management of Touchstone Advisors, Inc. |
Timothy S. Stearns
Touchstone Advisors, Inc.
303 Broadway, Suite 1100
Cincinnati, Ohio 45202
Year of Birth: 1963 | | Chief Compliance Officer | Until resignation, removal or disqualification Chief Compliance Officer since 2013 | | Chief Compliance Officer of Touchstone Advisors, Inc. |
Terrie A. Wiedenheft
Touchstone Advisors, Inc.
303 Broadway, Suite 1100
Cincinnati, Ohio 45202
Year of Birth: 1962 | | Controller and Treasurer | Until resignation, removal or disqualification Controller and Treasurer since 2006 | | Senior Vice President, Chief Financial Officer, and Chief Operations Officer of IFS Financial Services, Inc. (a holding company). |
Meredyth A. Whitford-Schultz
Western & Southern Financial Group
400 Broadway
Cincinnati, Ohio 45202
Year of Birth: 1981 | | Secretary | Until resignation, removal or disqualification Secretary since 2018 | | Counsel - Securities/Mutual Funds of Western & Southern Financial Group (2015 to present); Associate at Morgan Lewis & Bockius LLP (law firm) (2014 to 2015); Associate at Bingham McCutchen LLP (law firm) (2008 to 2014). |
| | | | | | | |
1 Each officer also holds the same office with the Touchstone Variable Series Trust and Touchstone Funds Group Trust.
This page intentionally left blank.
This page intentionally left blank.
PRIVACY PROTECTION POLICY
We Respect Your Privacy
Thank you for your decision to invest with us. Touchstone and its affiliates have always placed a high value on the trust and confidence our clients place in us. We believe that confidence must be earned and validated through time. In today’s world, when technology allows the sharing of information at light speeds, trust must be reinforced by our sincere pledge to take the steps necessary to ensure that the information you share with us is treated with respect and confidentiality.
Our Pledge to Our Clients
| ● | We collect only the information we need to service your account and administer our business. |
| ● | We are committed to keeping your information confidential and we place strict limits and controls on the use and sharing of your information. |
| ● | We make every effort to ensure the accuracy of your information. |
We Collect the Following Nonpublic Personal Information About You:
| ● | Information we receive from you on or in applications or other forms, correspondence, or conversations, including, but not limited to, your name, address, phone number, social security number, assets, income and date of birth; and |
| ● | Information about your transactions with us, our affiliates, or others, including, but not limited to, your account number and balance, payment history, parties to transactions, cost basis information, and other financial information. |
Categories of Information We Disclose and Parties to Whom We Disclose
We do not disclose any nonpublic personal information about our current or former clients to nonaffiliated third parties, except as required or permitted by law.
We Place Strict Limits and Controls on the Use and Sharing of Your Information
| ● | We restrict access to nonpublic personal information about you to authorized employees who need the information to administer your business. |
| ● | We maintain physical, electronic and procedural safeguards that comply with federal standards to protect this information. |
| ● | We do not disclose any nonpublic personal information about our current or former clients to anyone, except as required or permitted by law or as described in this document. |
| ● | We will not sell your personal information to anyone. |
We May Provide Information to Service Your Account
Sometimes it is necessary to provide information about you to various companies such as transfer agents, custodians, broker-dealers and marketing service firms to facilitate the servicing of your account. These organizations have a legitimate business need to see some of your personal information in order for us to provide service to you. We may disclose to these various companies the information that we collect as described above. We require that these companies, including our own subsidiaries and affiliates, strictly maintain the confidentiality of this information and abide by all applicable laws. Companies within our corporate family that may receive this information are financial service providers and insurance companies. We do not permit these associated companies to sell the information for their own purposes, and we never sell our customer information.
This policy is applicable to the following affiliated companies: Touchstone Funds Group Trust, Touchstone Strategic Trust, Touchstone Variable Series Trust, Touchstone Institutional Funds Trust, Touchstone Securities, Inc.* and W&S Brokerage Services, Inc.
* Touchstone Securities, Inc. serves as the underwriter to the Touchstone Funds.
A Member of Western & Southern Financial Group®
The Privacy Protection Policy is not part of the Annual Report.

800.638.8194 Touchsoneinvestments.com

Go paperless, sign up today at:
www.touchsoneimvestments.com
Touchstone Investments
Distributor
Touchstone Securities, Inc.*
303 Broadway
Cincinnati, Ohio 45202-4203
800.638.8194
www.touchstoneinvestments.com
Investment Advisor
Touchstone Advisors, Inc.*
303 Broadway
Cincinnati, Ohio 45202-4203
Transfer Agent
BNY Mellon Investment Servicing (US) Inc.
4400 Computer Drive
Westborough, Massachusetts 01581
Shareholder Service
800.543.0407
* A Member of Western & Southern Financial Group
TSF--54CC-TST-AR-2012
Item 2. Code of Ethics.
| (a) | The registrant, as of the end of the period covered by this report, has adopted a code of ethics that applies to the registrant’s principal executive officer, principal financial officer, principal accounting officer or controller, or persons performing similar functions, regardless of whether these individuals are employed by the registrant or a third party. |
| (c) | There have been no amendments, during the period covered by this report, to a provision of the code of ethics that applies to the registrant’s principal executive officer, principal financial officer, principal accounting officer or controller, or persons performing similar functions, regardless of whether these individuals are employed by the registrant or a third party, and that relates to any element of the code of ethics description. |
| (d) | The registrant has not granted any waivers, including an implicit waiver, from a provision of the code of ethics that applies to the registrant’s principal executive officer, principal financial officer, principal accounting officer or controller, or persons performing similar functions, regardless of whether these individuals are employed by the registrant or a third party, that relates to one or more of the items set forth in paragraph (b) of this item’s instructions. |
| (f) | A copy of the code of ethics is attached hereto as Exhibit 13(a)(1). |
Item 3. Audit Committee Financial Expert.
The registrant’s Board of Trustees has determined that the registrant has at least one audit committee financial expert serving on its audit committee. Ms. Karen Carnahan is the registrant’s audit committee financial expert and is an independent trustee within the meaning of the Investment Company Act of 1940, as amended (the “1940 Act”).
Item 4. Principal Accountant Fees and Services.
Audit Fees
| (a) | Audit fees for Touchstone Strategic Trust (December Funds) totaled $55,100 and $55,000 for the fiscal years ended December 31, 2020 and December 31, 2019, respectively, including fees associated with the annual audits and filings of Form N-1A and Form N-CEN. |
Audit-Related Fees
| (b) | The aggregate fees billed in each of the last two fiscal years for assurance and related services by the principal accountant that are reasonably related to the performance of the audit of the registrant's financial statements and are not reported under paragraph (a) of this Item are $8,000 and $6,000 for the fiscal years ended December 31, 2020 and December 31, 2019, respectively. The fees for 2020 and 2019 are associated with filings of Form N-1A and Form N-14. |
Tax Fees
| (c) | The aggregate fees billed in each of the last two fiscal years for professional services rendered by the principal accountant for tax compliance, tax advice, and tax planning were $11,760 and $14,930 for the fiscal years ended December 31, 2020 and December 31, 2019, respectively. The fees relate to the preparation of federal income and excise tax returns and review of capital gains distribution calculations. |
All Other Fees
| | (d) | The aggregate fees billed in each of the last two fiscal years for products and services provided by the principal accountant, other than the services reported in paragraphs (a) through (c) of this Item are $1,639 and $2,625 for the fiscal years ended December 31, 2020 and December 31, 2019, respectively. The fees relate to the PFIC analyzer and Global Withholding Tax Reporter subscriptions. |
| (e)(1) | Disclose the audit committee's pre-approval policies and procedures described in paragraph (c)(7) of Rule 2-01 of Regulation S-X. |
The Audit Committee’s pre-approval policies describe the types of audit, audit-related, tax and other services that have the general pre-approval of the Audit Committee. The pre-approval policies provide that annual audit service fees, tax services not specifically granted pre-approval, services exceeding pre-approved cost levels and other services that have not received general pre-approval will be subject to specific pre-approval by the Audit Committee. The pre-approval policies further provide that the Committee may grant general pre-approval to other audit services (statutory audits and services associated with SEC registration statements, periodic reports and other documents filed with the SEC or other documents issued in connection with securities offerings), audit-related services (accounting consultations related to accounting, financial reporting or disclosure matters not classified as “audit services,” assistance with understanding and implementing new accounting and financial reporting guidance from rulemaking authorities, agreed-upon or expanded audit procedures related to accounting and/or billing records required to respond to or comply with financial, accounting or regulatory reporting matters and assistance with internal control reporting requirements under Form N-CSR), tax services that have historically been provided by the auditor that the Committee believes would not impair the independence of the auditor and are consistent with the SEC’s rules on auditor independence and permissible non-audit services classified as “all other services” that are routine and recurring services.
| (e)(2) | All of the services described in paragraphs (b) through (d) of Item 4 were approved by the Audit Committee. |
| (f) | The percentage of hours expended on the principal accountant's engagement to audit the registrant's financial statements for the most recent fiscal year that were attributed to work performed by persons other than the principal accountant's full-time, permanent employees was less than fifty percent. |
| (g) | The aggregate non-audit fees for Touchstone Strategic Trust and certain entities*, totaled approximately $766,767 and $731,002 for the fiscal years ended December 31, 2020 and December 31, 2019, respectively. |
| * | These include the advisors (excluding non-affiliated sub-advisors) and any entity controlling, controlled by or under common control with the advisors that provides ongoing services to the registrant (Funds). |
| (h) | The registrant's audit committee of the board of trustees has considered whether the provision of non-audit services that were rendered to the registrant's investment adviser (not including any sub-adviser whose role is primarily portfolio management and is subcontracted with or overseen by another investment adviser), and any entity controlling, controlled by, or under common control with the investment adviser that provides ongoing services to the registrant that were not pre-approved pursuant to paragraph (c)(7)(ii) of Rule 2-01 of Regulation S-X is compatible with maintaining the principal accountant's independence. |
Item 5. Audit Committee of Listed Registrants.
Not applicable.
Item 6. Investments.
| (a) | Schedule of Investments in securities of unaffiliated issuers as of the close of the reporting period is included as part of the report to shareholders filed under Item 1(a) of this form. |
Item 7. Disclosure of Proxy Voting Policies and Procedures for Closed-End Management Investment Companies.
Not applicable.
Item 8. Portfolio Managers of Closed-End Management Investment Companies.
Not applicable.
Item 9. Purchases of Equity Securities by Closed-End Management Investment Company and Affiliated Purchasers.
Not applicable.
Item 10. Submission of Matters to a Vote of Security Holders.
There have been no material changes to the procedures by which the shareholders may recommend nominees to the registrant’s board of trustees, where those changes were implemented after the registrant last provided disclosure in response to the requirements of Item 407(c)(2)(iv) of Regulation S-K (17 CFR 229.407) (as required by Item 22(b)(15) of Schedule 14A (17 CFR 240.14a-101)), or this Item.
Item 11. Controls and Procedures.
| (a) | The registrant’s principal executive and principal financial officers, or persons performing similar functions, have concluded that the registrant’s disclosure controls and procedures (as defined in Rule 30a-3(c) under the Investment Company Act of 1940, as amended (the “1940 Act”) (17 CFR 270.30a-3(c))) are effective, as of a date within 90 days of the filing date of the report that includes the disclosure required by this paragraph, based on their evaluation of these controls and procedures required by Rule 30a-3(b) under the 1940 Act (17 CFR 270.30a-3(b)) and Rules 13a-15(b) or 15d-15(b) under the Securities Exchange Act of 1934, as amended (17 CFR 240.13a-15(b) or 240.15d-15(b)). |
| (b) | There were no changes in the registrant’s internal control over financial reporting (as defined in Rule 30a-3(d) under the 1940 Act (17 CFR 270.30a-3(d))) that occurred during the period covered by this report that has materially affected, or is reasonably likely to materially affect, the registrant’s internal control over financial reporting. |
Item 12. Disclosure of Securities Lending Activities for Closed-End Management Investment Companies.
Not applicable.
Item 13. Exhibits.
SIGNATURES
Pursuant to the requirements of the Securities Exchange Act of 1934 and the Investment Company Act of 1940, the registrant has duly caused this report to be signed on its behalf by the undersigned, thereunto duly authorized.
| (Registrant) | Touchstone Strategic Trust | |
| By (Signature and Title)* | /s/ E. Blake Moore, Jr. | |
| | E. Blake Moore, Jr., President | |
| | (principal executive officer) | |
Pursuant to the requirements of the Securities Exchange Act of 1934 and the Investment Company Act of 1940, this report has been signed below by the following persons on behalf of the registrant and in the capacities and on the dates indicated.
| By (Signature and Title)* | /s/ E. Blake Moore, Jr. | |
| | E. Blake Moore, Jr., President | |
| | (principal executive officer) | |
| By (Signature and Title)* | /s/ Terrie A. Wiedenheft | |
| | Terrie A. Wiedenheft, Controller and Treasurer | |
| | (principal financial officer) | |
* Print the name and title of each signing officer under his or her signature.