UNITED STATES
SECURITIES AND EXCHANGE COMMISSION
Washington, D.C. 20549
FORM N-CSR
CERTIFIED SHAREHOLDER REPORT OF REGISTERED MANAGEMENT INVESTMENT COMPANIES
Investment Company Act file number 811-03651
Touchstone Strategic Trust-March Funds
(Exact name of registrant as specified in charter)
303 Broadway, Suite 1100
Cincinnati, Ohio 45202-4203
(Address of principal executive offices) (Zip code)
Jill T. McGruder
303 Broadway, Suite 1100
Cincinnati, Ohio 45202-4203
(Name and address of agent for service)
Registrant's telephone number, including area code:800-638-8194
Date of fiscal year end:March 31
Date of reporting period:March 31, 2020
Form N-CSR is to be used by management investment companies to file reports with the Commission not later than 10 days after the transmission to stockholders of any report that is required to be transmitted to stockholders under Rule 30e-1 under the Investment Company Act of 1940 (17 CFR 270.30e-1). The Commission may use the information provided on Form N-CSR in its regulatory, disclosure review, inspection, and policymaking roles.
A registrant is required to disclose the information specified by Form N-CSR, and the Commission will make this information public. A registrant is not required to respond to the collection of information contained in Form N-CSR unless the Form displays a currently valid Office of Management and Budget ("OMB") control number. Please direct comments concerning the accuracy of the information collection burden estimate and any suggestions for reducing the burden to Secretary, Securities and Exchange Commission, 100 F Street, NE, Washington, DC 20549. The OMB has reviewed this collection of information under the clearance requirements of 44 U.S.C. § 3507.
Item 1. Reports to Stockholders.
The Report to Shareholders is attached herewith.
March 31, 2020
Annual Report
Touchstone Strategic Trust
Touchstone Flexible Income Fund
Touchstone Focused Fund
Touchstone Global ESG Equity Fund (formerly known as Touchstone Sustainability and Impact Equity Fund)
Touchstone Growth Opportunities Fund
Touchstone Mid Cap Growth Fund
Touchstone Sands Capital Emerging Markets Growth Fund
IMPORTANT NOTE: Beginning on January 1, 2021, as permitted by regulations adopted by the Securities and Exchange Commission, paper copies of the Touchstone Funds’ annual and semi-annual shareholder reports will no longer be sent by mail, unless you specifically request paper copies of the shareholder reports from Touchstone Funds or from your financial intermediary, such as a broker-dealer or bank. Instead, annual and semi-annual shareholder reports will be available on the Touchstone Funds’ website (TouchstoneInvestments.com/Resources), and you will be notified by mail each time a report is posted and provided with a website link to access the report.
You may elect to receive all future annual and semi-annual shareholder reports in paper, free of charge. If you already elected to receive shareholder reports electronically, you will not be affected by this change and you need not take any action. To elect to receive paper copies of shareholder reports through the mail or otherwise change your delivery method, contact your financial intermediary or, if you hold your shares directly through Touchstone Funds, visit TouchstoneInvestments.com/Resources/Edelivery or call Touchstone Funds toll-free at 1.800.543.0407. Your election to receive shareholder reports in paper will apply to all Touchstone Funds that you hold through the financial intermediary, or directly with Touchstone.

Table of Contents
This report identifies the Funds' investments on March 31, 2020. These holdings are subject to change. Not all investments in each Fund performed the same, nor is there any guarantee that these investments will perform as well in the future. Market forecasts provided in this report may not occur.
Letter from the President
Dear Shareholder:
We are pleased to provide you with the Touchstone Strategic Trust Annual Report. Inside is key financial information, as well as manager commentaries for the Funds, for the 12 months ended March 31, 2020.
Trade-related rhetoric between the U.S. and China drove market volatility through the first nine months of the fiscal period. By the end of year, the U.S.-China trade discussions took a more constructive tone, culminating in an announcement of a “phase one” agreement in early 2020 to reduce some tariff levels. Aside from this conflict, the U.S. economy continued its steady pace, driven by strong employment data and solid consumer spending. Outside the U.S., economic growth in developed markets such as the U.K., European Union and Japan continued at a slow pace, while each of their central banks continued to maintain low-to-zero overnight rates. Outside of the U.S. and developed markets, emerging markets continued to show overall weakness, driven by the U.S.-China trade slowdown and lower-than-expected Indian economic growth. This already fragile, low-growth environment was upended in the first quarter of 2020 as COVID-19 swept the globe, bringing with it containment measures resulting in massive shutdowns of economic activity. In addition to the spread of the COVID-19 virus, geopolitical tensions between Russia and Saudi Arabia flooded the market with oil, pushing prices to lows unseen in nearly 20 years.
Equities recorded a significant decline in the first quarter of 2020, which drove the trailing 12-month return into negative territory, regardless of style and market capitalization. Atypical for such declines, U.S. growth stocks continued their dominance over value stocks as has been the case through most of the post-Credit Crisis bull market. Strong relative results from Information Technology (IT) and Healthcare stocks helped drive the growth style outperformance while Energy and Financials lagged. Large cap stocks declined less than mid and small cap stocks, bolstered by relatively stronger balance sheets and more stable profit outlooks.
Non-U.S. developed equity markets trailed U.S. markets over the past 12 months. Japan performed relatively well due to slow growth in COVID-19 cases and aggressive stimulus measures, while Europe was hit harder. Similar to the U.S., IT and Healthcare stocks were among the top relative contributors, while Energy and Financials lagged. In emerging markets, equities exhibited the same pattern as the U.S. and developed markets with IT leading the way and China being a surprising bright spot as signs of virus impact started to abate.
Within fixed income, U.S. Treasury prices benefited and yields compressed to cycle lows from U.S. Federal Reserve Board (Fed) actions and a flight to safety during the rapid selloff of risk assets in the first quarter of 2020. Meanwhile, credit-sensitive sectors saw the strong results of the first three quarters of the period nearly or completely erased as concerns over potential for rising defaults and technical selling pressures mounted. Spreads across investment grade credit, high yield credit, bank loans and collateralized loan obligations reached levels unseen since the 2008 Credit Crisis. The Fed acted during the volatility to provide liquidity and support market functioning, helping ease the volatility and negative sentiment that appeared in March 2020.
Periods such as these especially remind us of the essential role performed by the steady hands of financial professionals, the importance of trust in your investment strategy and the risks that accompany trying to time the market. Furthermore, we believe that environments that are more volatile create opportunities for active managers over the long-term. We greatly value your continued support. Thank you for including Touchstone as part of your investment plan.
Sincerely,

Jill T. McGruder
President
Touchstone Strategic Trust
Management's Discussion of Fund Performance (Unaudited)
Touchstone Flexible Income Fund
Sub-Advised by Bramshill Investments, LLC
Investment Philosophy
The Touchstone Flexible Income Fund seeks total return through a combination of income and capital appreciation by investing primarily in income producing securities. The Fund’s sub-advisor, Bramshill Investments, LLC, implements a tactical fixed-income strategy, actively managing the portfolio by rotating among asset classes and tactically hedging during various interest rate and market environments. The sub-advisor seeks to identify relative value across asset classes and capture opportunities primarily within the corporate, U.S. Treasury, municipal and preferred security markets. The Fund focuses on liquid securities with transparent pricing and actively-traded capital structures.
Fund Performance
The Touchstone Flexible Income Fund (Class A Shares) underperformed its benchmark, the Bloomberg Barclays U.S. Aggregate Bond Index, for the 12-month period ended March 31, 2020. The Fund’s total return was -3.33 percent (calculated excluding the maximum sales charge) while the total return of the benchmark was 8.93 percent.
Market Environment
The historic bull-run was full steam ahead for most of 2019, finishing out the decade producing some of the largest calendar year returns in recent memory across asset classes. In a banner year for risk assets, U.S. Treasuries still managed to produce solid gains. This was due to falling interest rates as uncertainty around trade negotiations with China rattled the U.S. Treasury market causing the yield curve to invert for most of the year. Later in the period the curve twisted back to a steeper shape as tensions eventually cooled and both sides resolved the dispute. Tariffs, concern over global growth, inflation consistently below the U.S. Federal Reserve Board’s (Fed) 2.0 percent target and modest but resilient U.S. growth, roughly 1.5 to 2.0 percent, kept a cap on interest rates providing an accommodative environment in terms of easy financial conditions.
Growth in the U.S. continued to show resilience with the economy expanding at near trend pace at about 1.5 to 2.0 percent. As stimulus from fiscal effects and tax cuts faded, the single most influential factor for maintaining the expansion at that pace continued to be the strength of labor markets and the consumer. The unemployment rate declined throughout the year ending at 3.5 percent, the lowest since the late 1960s. Negotiations between China and the U.S. were tumultuous with hostile rhetoric and tit-for-tat tariff retaliations causing markets to swing into volatile extremes. Markets remained on edge, uncertain of the policy that would eventually be set and the impact that it would have on business confidence/investment and ultimately the consumer. It wasn’t until the end of the fourth quarter of 2019 when developments came to light of a potential deal set to be the first of many and take place in multiple phases. Tensions cooled and PresidentTrump announced that the U.S. and China would sign a Phase OneTrade Agreement, which meant the pullback of additional December 15th tariffs on Chinese goods and implicit agreement to halt any future actions. It was the first sign of conciliation that could bring both sides to the table thus steadying nerves and restoring business confidence, and providing a boost to capital spending. Outside the U.S., most notably in Europe, countries experienced further declines in economic growth.
Going into calendar year 2020, stocks made new all-time highs, driven by an economy operating at full employment, absent inflationary pressures, an accommodative Fed, and waning concerns over trade negotiations. However, markets turned sharply lower in February when it became apparent that COVID-19 had arrived in the U.S. and containment was no longer possible. The rise of the virus impaired the economic backdrop for global growth and precipitated the sharpest and fastest decline ever for the economy and the stock market. Deleveraging and forced liquidations of stocks and bonds resulted in extreme volatility as investors sought the safety of cash above all else. Oil demand dried up, credit spreads showed signs of stress and massive stimulus measures were implemented across the world.
Portfolio Review
The Fund’s exposure to lower rated investment grade corporate bonds and preferred equities drove underperformance relative to the benchmark. The aforementioned COVID-19 pandemic sell-off in the final weeks of the 12-month period saw corporate bonds, investment grade and non-investment grade, decline and credit spreads widen to levels not seen since the Great Financial Crisis of 2008. Preferred equities were no exception, declining dramatically in mid-March before rebounding at the close of the 12-month period. In addition to the Fund’s credit exposure, the portfolio’s shorter duration relative to the benchmark also detracted from performance during much of the 12-month period. As the Fed cut rates beginning in mid-2019 despite a strong U.S. economy, longer-term U.S. Treasuries rallied as the yield curve shifted downward across all maturities.
From an asset sector perspective, the Fund modestly re-allocated within the preferred equity exposure. The Fund began the 12-month period with predominate exposure to preferred equity securities that are originally issued with a fixed coupon that transitions to a floating rate at a pre-determined rate in the near-term (usually three to five years following issuance). By favoring these so-called
Management's Discussion of Fund Performance (Unaudited) (Continued)
fixed-to-float preferred securities, the Fund was able to maintain a more defensive duration posture, shorter compared to the benchmark. Following the strong capital market returns experienced during calendar year 2019, we took profits in some preferred positions that had reached rich valuation levels. As calendar year 2020 began, the COVID-19 sell-off hit, overall rate levels shifted downward and credit spreads widened dramatically. As a result, we are finding valuation opportunities in fixed coupon preferreds, incrementally adding to the portfolio’s duration. Despite the modest changes to the Fund’s preferred exposure, the portfolio remains in high quality, larger issuers thus maintaining a high degree of liquidity.
The Fund’s bond holdings maintained a large allocation to short maturity, high quality investment grade structured securities such as Asset-Backed, Commercial and Residential Mortgage-Backed Securities. Our structured bond team was able to identify good relative valuation, highly-rated investment opportunities as corporate credit spreads remained at narrow levels for much of the 12-month period. As the market sell-off took place at the end of the period, we identified more corporate bond investment opportunities but did not make large, material re-allocations. A large allocation to cash and short-term U.S. Treasury securities for the 12-month period was a slight drag on performance, until the significant market sell-off in March 2020. With the sell-off and investors buying safe assets such as cash and U.S. Treasury securities across the yield curve, this allocation helped to off-set declines from the previously-mentioned credit exposures in the portfolio.
Outlook
We will deploy some of the Fund’s cash and U.S. Treasury exposure in the near-term as certain higher quality assets such as investment grade corporate bonds increase the yield on the portfolio. However, we also see a particular opportunity in lower tier investment grade debt, often crossover rated or BBB- to BB-rated within the capital structures of investment grade issuers. Our view is “post-corona” and following the current quarantines we believe there will be a longer “U” shaped type of recovery, while we must also be conscious of a potentially risky “L” shape recovery. We envision the corporate credit portion of the Fund to be positioned well, holding bonds of businesses which we believe will participate near-term in a recovery. We think these subordinated investments are trading at attractive prices and yields and are generally the preferred, or junior subordinated tranches of credits which have historically demonstrated solid liquidity. Following the Fed’s investment grade corporate bond buying program, these firms also have access to capital at the senior parts of their capital structures and solid balance sheets. We view these names as higher quality securities, relative to generic non-investment grade corporate bonds that are under duress due to the current risk-off environment, and therefore an opportunity.
Management's Discussion of Fund Performance (Unaudited) (Continued)
Comparison of the Change in Value of a $10,000 Investment in the
Touchstone Flexible Income Fund - Class A* and the Bloomberg Barclays U.S. Aggregate Bond Index

| * | The chart above represents performance of Class A shares only, which will vary from the performance of Class C shares, Class Y shares and Institutional Class shares based on the differences in sales loads and fees paid by shareholders in the different classes. The inception date of Institutional Class shares was September 10, 2012. Institutional Class shares performance information was calculated using the historical performance of Class Y shares for the periods prior to September 10, 2012. The returns have been restated for sales loads and fees applicable to Institutional Class shares. |
| ** | The average annual total returns shown above are adjusted for maximum sales loads and fees, if applicable. The maximum offering price per share of Class A shares is equal to the net asset value (“NAV”) per share plus a sales load equal to 2.04% of the NAV (or 2.00% of the offering price). Class C shares are subject to a contingent deferred sales charge (“CDSC”) of 1.00%. The CDSC will be assessed on an amount equal to the lesser of (1) the NAV at the time of purchase of the shares being redeemed or (2) the NAV of such shares being redeemed, if redeemed within a one-year period from the date of purchase. Class Y shares and Institutional Class shares are not subject to sales charges. |
The performance of the above Fund does not reflect the deduction of taxes that a shareholder would pay on Fund distributions or the redemption of Fund shares.
Note to Chart
Bloomberg Barclays U.S. Aggregate Bond Index is an unmanaged index comprised of U.S. investment grade, fixed rate bond market securities, including government, government agency, corporate and mortgage-backed securities between one and ten years.
Management's Discussion of Fund Performance (Unaudited)
Touchstone Focused Fund
Sub-Advised by Fort Washington Investment Advisors, Inc.
Investment Philosophy
The Touchstone Focused Fund seeks to provide investors with capital appreciation. The Fund seeks to invest in companies of all capitalizations that are trading below what is believed to be the estimate of their intrinsic value and have a sustainable competitive advantage or a high barrier to entry in place. The barrier(s) to entry can be created through a cost advantage, economies of scale, high customer loyalty or a government barrier (e.g. license or subsidy). Fort Washington believes that the strongest barrier to entry is the combination of economies of scale and high customer loyalty.
Fund Performance
The Touchstone Focused Fund (Class A Shares) underperformed its primary benchmark, the Russell 3000® Index, and its secondary benchmark, the S&P 500® Index, for the 12-month period ended March 31, 2020, although all posted negative returns. The Fund’s total return, was -9.14 percent (calculated excluding the maximum sales charge) while the total return of the Russell 3000® Index was -9.13 percent and the total return of the S&P 500® Index was -6.98 percent.
Market Environment
In the final three quarters of 2019, U.S. equities recorded a fairly steady climb higher primarily due to accommodative monetary policy from the U.S. Federal Reserve Board (Fed) and optimism late in the year around the phase one trade agreement between the U.S. and China. In the first quarter of 2020, U.S. equity markets pulled back significantly due to concerns over the global spread of the coronavirus and the oil price war between Russia and Saudi Arabia. Over the 12-month period ending March 31, 2020, the Energy sector was, by far, the worst performing sector in the primary benchmark. The Information Technology sector was the only sector with a positive return.
Portfolio Review
Within the Fund, the sectors where holdings outperformed relative to the primary benchmark were Consumer Discretionary, Health Care, Financials, and InformationTechnology. Sectors that lagged relative to the primary benchmark included Materials, Real Estate, Consumer Staples, Energy, and Communication Services. Industrials performed roughly in line with the primary benchmark. Stock selection was additive to relative performance led by stock picks within the Consumer Discretionary, Health Care, Financials and Information Technology sectors. Conversely, sector allocation decisions detracted primarily due to underweighting Information Technology and overweighting Financials.
The three stocks that contributed the most to performance were Microsoft Corp. (Information Technology sector), Amazon.com Inc. (Consumer Discretionary sector), and Bristol-Myers Squibb Co. (Health Care sector). Microsoft outperformed due to favorable performance in its legacy franchises and better than expected results in its cloud business. Amazon.com rose due to acceleration of growth in Prime and Amazon Web Services both before and through the outbreak of COVID-19. Bristol-Myers Squibb outperformed primarily due to positive developments in its non-small cell lung cancer business and favorable pipeline activity in recently acquired Celgene Corp.
Among the stocks that detracted from performance were Simon Property Group Inc. (Real Estate sector), Carnival Corp. (Consumer Discretionary sector), and Jones Lang LaSalle Inc. (Real Estate sector). Simon Property Group underperformed primarily due to a continuation of weak trends for mall-based retail tenants. Carnival underperformed primarily due to demand concerns amid the coronavirus outbreak. The Fund exited the position during the period. Jones Lang LaSalle underperformed as sentiment weakened amid concerns over the pandemic’s impact on commercial real estate.
From a market cap perspective, the Fund ended the period with no weight in smaller-cap stocks (companies with a market cap below $2 billion). The primary benchmark weight for this segment was 4.3 percent. The Fund remained underweight to mid-cap businesses which now comprise 10.3 percent of assets, compared to a primary benchmark weight of 11.8 percent. Last, the Fund continued to maintain an overweight to larger-cap businesses (companies with a market cap above $10 billion). The Fund’s weight to that segment is currently 89.6 percent which is higher than the primary benchmark weight of 83.9 percent. This allocation decision was positive to performance during the period as large-cap stocks outperformed small-cap stocks.
Investments made in international companies which comprised approximately 6.2 percent of assets at the end of the period outperformed the primary benchmark.
During the period, the Fund added UnitedHealth Group Inc. (Health Care sector), Netflix Inc. (Consumer Discretionary sector), Hubbell Inc. (Industrials sector), DuPont de Nemours Inc. (Materials sector),Trip.com Group Ltd. (Consumer Discretionary sector), Americold Realty Trust (Real Estate sector), Texas Instruments Inc. (Information Technology sector), Philip Morris International
Management's Discussion of Fund Performance (Unaudited) (Continued)
Inc. (Consumer Staples sector), Workday Inc. (InformationTechnology sector), first sold then bought back Starbucks Corp. (Consumer Discretionary sector), and Parker Hannifin Corp. (Industrials sector) to the portfolio. The Fund exited Dunkin Brands Group Inc. (Consumer Discretionary sector), Booking Holding Inc. (Consumer Discretionary sector), Simon Property Group Inc. (Real Estate sector), Biogen Inc. (Health Care sector), Halliburton Co. (Energy sector), Unilever NV (Consumer Staples sector), and Carnival Corp. (Consumer Discretionary sector).
As the period came to a close, the Fund had an overweight to the Communication Services, Financials, and Consumer Discretionary sectors and an underweight to the Consumer Staples, Health Care, Materials, and Energy sectors. The weight to the Real Estate, Industrials, and Information Technology sectors was roughly in line with the primary benchmark. The Fund held no positions in the Utilities sector.
Outlook
We believe the markets are approaching the near future with looming questions about the ongoing impact of the global pandemic and oil price war. Our current thinking about COVID-19 is characterized by several important themes. First is the precedent set by many past health contagions. While this novel virus certainly poses unique challenges, we believe the key is that the markets have recovered from every prior outbreak after temporary setbacks. While the hit to global economies has and will continue to be severe, we believe that the markets will bottom before the economy. In past health related downturns, the market has tended to look through near-term economic impact around the time travel restrictions are lifted and the new case ramp peaks. Also, U.S. economic fundamentals were solid and many global economies were showing signs of positive inflection before the turmoil. We believe the solid backdrop heading into the downturn combined with unprecedented government action suggest we may avoid worst case outcomes on the path to recovery. We have been keeping an eye on vaccines and, especially in the near term, treatments for COVID-19 patients. While we don’t expect any individual drug to be a miracle cure, we do anticipate steady progress, with new options being added and doctors learning which regimens are likely to work best for each patient. As of now, it is our working assumption that the economic impact of this virus will be contained to quarters as opposed to years.
With this framework in mind, our investment team has kept top down portfolio positioning relatively consistent through the outbreak while taking bottom-up opportunities amidst volatility. We have deployed or re-deployed capital at a measured pace. We have not implemented a defensive posture for overall portfolio construction as we believe the impact on most Fund holdings will be temporary rather than structural. We have been reducing position sizes in businesses that we view as more expensive, those that could have potential balance sheet issues, or those that are less likely to free up capital for more attractive business models. In our opinion, current events have demonstrated the importance of owning a portfolio of businesses that are supported by barriers to entry with strong balance sheets. History is littered with unexpected events that cause downturns in the markets. Our process seeks to consistently own high excess return on capital businesses that are mispriced.
Management's Discussion of Fund Performance (Unaudited) (Continued)
Comparison of the Change in Value of a $10,000 Investment in the
Touchstone Focused Fund - Class A*, the Russell 3000® Index and the S&P 500® Index

| * | The chart above represents performance of Class A shares only, which will vary from the performance of Class C shares, Class Y shares and Institutional Class shares based on the differences in sales loads and fees paid by shareholders in the different classes. The inception date of Class C shares was April 12, 2012. Class C shares performance information was calculated using the historical performance of Class Y shares for the periods prior to April 12, 2012. The returns have been restated for sales loads and fees applicable to Class C shares. |
| ** | The average annual total returns shown above are adjusted for maximum sales loads and fees, if applicable. The maximum offering price per share of Class A shares is equal to the net asset value (“NAV”) per share plus a sales load equal to 5.26% of the NAV (or 5.00% of the offering price). Class C shares are subject to a contingent deferred sales charge (“CDSC”) of 1.00%. The CDSC will be assessed on an amount equal to the lesser of (1) the NAV at the time of purchase of the shares being redeemed or (2) the NAV of such shares being redeemed, if redeemed within a one-year period from the date of purchase. Class Y shares and Institutional Class shares are not subject to sales charges. |
The performance of the above Fund does not reflect the deduction of taxes that a shareholder would pay on Fund distributions or the redemption of Fund shares.
Notes to Chart
Russell 3000®Index measures the performance of the 3,000 largest U.S. companies based on total market capitalization, which represents approximately 98% of the investable U.S. equity market.
S&P 500® Index is a group of 500 widely held stocks and is commonly regarded to be representative of the large capitalization stock universe.
The Frank Russell Company (FRC) is the source and owner of the Russell 3000® Index data contained or reflected in this material and all trademarks and copyrights related thereto. The material may contain confidential information and unauthorized use, disclosure, copying, dissemination or redistribution is strictly prohibited. This is a Touchstone Investments presentation of the data, and FRC is not responsible for the formatting or configuration of this material or for any inaccuracy in the presentation thereof.
Management's Discussion of Fund Performance (Unaudited)
Touchstone Global ESG Equity Fund*
Sub-Advised by Rockefeller & Co., LLC
Investment Philosophy
The Touchstone Global ESG Equity Fund (formerly known as Touchstone Sustainability and Impact Equity Fund) seeks long-term growth of capital. The Fund primarily invests in equity securities of U.S. and non-U.S. companies and generally focuses on larger, more established companies. The Fund selects investments based on an evaluation of a company’s sustainability and impact practices which considers environmental, social and governance (ESG) impacts and risks of a company, how well the company manages these impacts and risks and ascertains the company’s willingness and ability to take a leadership position in implementing best practices.
Fund Performance
The Touchstone Global ESG Equity Fund (Class A Shares) underperformed its benchmark, the MSCI All Country World Index, for the 12-month period ended March 31, 2020. The Fund’s total return was -13.61 percent (calculated excluding the maximum sales charge), while the total return of the benchmark was -11.26 percent.
Market Environment
The 12-month period ending March 31, 2020 started with a uniformly dovish tone from central banks in response to concerns of a global economic slowdown. The market in 2019 performed well on the back of a rebound from the selloff in late 2018 and accommodative monetary policies but was primarily driven by multiples expansion as opposed to earnings growth. We also experienced a significant bifurcation in the markets as stocks characterized as growth and bond proxies outperformed, while cyclical value stocks were overlooked by the market.
Moving to 2020, global equities, as represented by the MSCI All Country World Index, entered a bear market with a negative 21 percent total return during the first quarter of 2020. The Index hit its all-time peak on February 12, 2020, and then lost as much as one-third of its value during the depth of the sell-off. The global equity sell-offs were triggered by the COVID-19 pandemic, which first led to more than a month of lockdown across China, and then spread worldwide causing an unprecedented collapse in economic activity as governments sought to contain the outbreak through varying degrees of lockdowns. Financials markets were also roiled by a price war between Saudi Arabia and Russia over crude oil, which was already suffering from weak demand. The unprecedented nature of the COVID-19 crisis drove the U.S. Federal Reserve Board (Fed) to aggressively inject liquidity into financial markets, with asset purchases expanded to include investment grade corporate and municipal bonds. Congress also passed three rounds of stimulus adding up to more than $2 trillion of financial aid to individuals, municipalities and various industries. Similarly, policymakers around the globe also rolled out aggressive monetary and fiscal stimulus. The aggressive policy responses helped to arrest the market decline and led to a market rebound toward the end of the quarter.
Portfolio Review
The Fund’s sector allocation and stock selection detracted from relative performance during the period. An underweight in Information Technology and an overweight in Financials and Industrials were the largest detractors. European financials were a particularly large detractor, as Swedbank AB (Financials sector) was negatively impacted by anti-money laundering (AML) lapses in its Estonian operations. An underweight position in Apple Inc. (Information Technology sector), a large benchmark holding, was also a detractor from relative performance.
Communication Services was the largest contributing sector, with KDDI Corp. in Japan being the largest contributor within the sector. This was in part due to the significant market sell off in the first quarter of 2020. Most companies within the Communication Services sector were relative outperformers as their businesses are usually less cyclical.
The Fund made several changes during the 12-month period, including several in the first quarter of 2020 to adjust to the evolving macro environment. Specifically, the Fund took advantage of the market sell-offs to initiate new positions in several industry leaders, including Apple Inc., while also adding businesses with less economic cyclicality including GlaxoSmithKline PLC (Health Care sector), and Verizon Communications Inc. (Communication Services sector).
Apple appears to be well-positioned with its strong balance sheet and loyal customer base. The recent market downturn has afforded us the opportunity to purchase the shares at an attractive valuation especially considering the 5G handset cycle. We do not believe demand for its handsets will be impacted long-term despite the current challenging environment. We believe disruptions to the supply chain should be worked out and the new products will launch as planned. The company has significantly improved the environmental sustainability of its products. It provides a complete life cycle assessment of its products, and increasingly seeks opportunity in safer materials, while also procuring 100 percent of its energy from renewable sources. GlaxoSmithKline’s pharmaceutical and consumer healthcare businesses are also defensive in the current market environment. We also believe there are low expectations on its pipeline, coupled with a reasonable valuation for a non-cyclical business. Additionally, GlaxoSmithKline has ranked first on
Management's Discussion of Fund Performance (Unaudited) (Continued)
the Global Access to Medicines Index for the past seven years for its work in low and middle income countries on vaccine distribution and HIV/AIDS among other health issues. In early February, we initiated Fund positions in a number of stocks with less economic cyclicality as we believed with the market continuing to run higher in January, it was not taking into account the risk of a pandemic or economic slowdown. These new positions included Verizon, a telecommunications company, which we believed offered attractive risk-adjusted shareholder returns. The dividend yield of just under 5 percent is funded with just over half of free cash flow. We believe wireless service revenue should stabilize after turning positive in 2018 as the effects of unlimited pricing plans and embedded device subsidies have worked through the base, while competitive threats also appear to have settled. Verizon performs in-line or slightly above U.S. peers across a number of ESG material issues, particularly when it comes to employee satisfaction, diversity & inclusion, and corporate governance issues.
To fund these purchases, we exited several Fund positions that we believed would be materially impacted by the COVID-19 pandemic, in addition to stocks in industries that will potentially be structurally challenged for the foreseeable future. We reduced Fund exposure to the Financials sector by exiting several banks, including ING Groep NV. We believed an extended period of extremely low interest rates will likely pressure the company for a while. We also exited Royal Caribbean Cruises Ltd. and Southwest Airlines Co. (both Consumer Discretionary sector). While these have been long-term holdings in the Fund supported by our belief that aging demographics and changes in consumer preferences would manifest themselves in heightened demand for air travel and cruising, we believed both companies would be materially impacted by the COVID-19 pandemic.
Outlook
There is a tug of war between two major forces: the biggest public health and economic crisis in decades, and the most aggressive monetary and fiscal stimulus in modern history. The former led to a bear market selloff in a little over four weeks, and the latter has generated some optimism that led to a rebound in late March. We believe the initial shock-and-awe of both forces have been absorbed, and investors’ attention will shift to fundamentals and the post-lockdown. We believe most companies will be given a pass for the weak results in the first half of the year, and investors will instead focus on balance sheet strength and the recovery potential to separate the strong from the weak.
As for the market, the panic phase of selling is likely over. However, we believe the road to recovery will take time as the world adjusts to a “new normality” until effective vaccines become available in sufficient quantity. While we have shifted the Fund slightly away from more economically cyclical stocks to those less economically cyclical, we are optimistic about the opportunity given Fund’s positioning of investing in companies where we believe there is lower risk of structural impairment and an opportunity to come out of the pandemic stronger.
* Formerly known as Touchstone Sustainability and Impact Equity Fund.
Management's Discussion of Fund Performance (Unaudited) (Continued)
Comparison of the Change in Value of a $10,000 Investment in the Touchstone Global ESG Equity Fund
- Class A* and the MSCI All Country World Index

| | * | The chart above represents performance of Class A shares only, which will vary from the performance of Class C shares, Class Y shares and Institutional Class shares based on the differences in sales loads and fees paid by shareholders in the different classes. The inception date of Institutional Class shares was May 4, 2015. Institutional Class shares performance information was calculated using the historical performance of Class A shares for periods prior to May 4, 2015. The returns have been restated for sales loads and fees applicable to Institutional Class shares. |
| | | |
| ** | The average annual total returns shown above are adjusted for maximum sales loads and fees, if applicable. The maximum offering price per share of Class A shares is equal to the net asset value (“NAV”) per share plus a sales load equal to 5.26% of the NAV (or 5.00% of the offering price). Class C shares are subject to a contingent deferred sales charge (“CDSC”) of 1.00%. The CDSC will be assessed on an amount equal to the lesser of (1) the NAV at the time of purchase of the shares being redeemed or (2) the NAV of such shares being redeemed, if redeemed within a one-year period from the date of purchase. Class Y shares and Institutional Class shares are not subject to sales charges. |
The performance of the above Fund does not reflect the deduction of taxes that a shareholder would pay on Fund distributions or the redemption of Fund shares.
Notes to Chart
MSCI All Country World Index measures the equity market performance of developed and emerging markets.
MSCI makes no express or implied warranties or representations and shall have no liability whatsoever with respect to any MSCI data contained herein. The MSCI data may not be further redistributed or used to create indices or financial products. This report is not approved or produced by MSCI.
Management's Discussion of Fund Performance (Unaudited)
Touchstone Growth Opportunities Fund
Sub-Advised by Westfield Capital Management Company, L.P.
Investment Philosophy
The Touchstone Growth Opportunities Fund seeks long-term growth of capital by primarily investing in stocks of U.S. companies with large, medium and small market capitalizations. The Fund’s portfolio managers place focus on companies they believe to have demonstrated records of achievement with excellent prospects for earnings growth over a 1- to 3-year period. Westfield looks for companies that it believes are reasonably priced with high forecasted earnings potential.
Fund Performance
The Touchstone Growth Opportunities Fund (Class A Shares) outperformed its benchmark, the Russell 3000®Growth Index, for the 12-month period ended March 31, 2020. The Fund’s total return was 0.63 percent (calculated excluding the maximum sales charge), while the total return of the benchmark was -0.44 percent.
Market Environment
Throughout 2019, U.S. equity markets steadily advanced, closing out their best year since 2013 despite ongoing skepticism of the market’s strength. An accommodative U.S Federal Reserve Board (Fed) and easing trade tensions combined with continued U.S. consumer strength and low unemployment to fuel the market advance throughout the year. 2020 began with stocks making new all-time highs, driven by an economy operating at full employment, absent inflationary pressures, an accommodative Fed, and waning concerns over trade negotiations. However, markets turned sharply lower in February when it became apparent that COVID-19 had arrived in the U.S. and containment was no longer possible. The rise of the virus impaired the economic backdrop for global growth and precipitated the sharpest and fastest decline ever for the economy and the stock market. Deleveraging and forced liquidations of stocks and bonds resulted in extreme volatility as investors sought the safety of cash above all else. Oil demand dried up, credit spreads showed signs of stress, and massive stimulus measures were implemented across the world.
Within the benchmark, only the Information Technology sector generated positive returns. The Energy, Materials and Industrials sectors all declined more than ten percent.
Portfolio Review
The Fund’s relative outperformance was driven primarily by stock selection within the Health Care sector, which was broad based across industries. We continued to find opportunities within the Health Care sector that offer exciting, innovation-driven growth. We remained constructive on the group, broadly, and believe that there are attractive opportunities across a variety of sub-sectors including health care tools and equipment, medical technology, and therapeutics. The Medicines Company, a late-stage drug developer focused on cholesterol management therapies for cardiovascular disease and long-term high conviction holding of the Fund, was a key driver for both the sector and the Fund during the period. The stock climbed after the late November announcement that Novartis International AV was acquiring the company at a premium. The Fund also benefited from exposure to Vertex Pharmaceuticals Incorporated. Vertex increased following the announcement of an early approval for its triple combo therapy for the treatment of Cystic Fibrosis (“CF”), expanding its addressable market to nearly 90 percent of the existing CF population with little to no competition. We continue to believe that Vertex is one of the cleanest growth stories in large-cap biotechnology, and that its dominance in the CF space is only just getting reflected in its value. The Fund also benefited from exposure to health insurance services company Humana Inc., which was added to the Fund during the first quarter of 2020. Humana has been largely insulated from the global macroeconomic and employment disruptions caused by COVID-19, with much of its business tied to the sale of Medicare and state-based Medicaid services. We believe that Humana represents an opportunity to gain exposure to the growth in managed care and is well positioned in Medicare Advantage plans, which may be critical throughout the 2020 election.
The Consumer Discretionary sector also contributed to Fund performance. Stock selection drove the majority of the relative strength in the sector; however, the Fund’s underweight positioning also benefited relative results, in particular, the strategic avoidance of many traditional retailers and many travel/restaurant names. Throughout 2019, we maintained a generally cautious outlook toward the group, consistent with our long-held views that lack of pricing power, over capacity, and challenges competing with ecommerce juggernauts created a challenging environment for many industry players. More recently, the COVID-19 pandemic has brought substantial additional pressure to the group. Significant restrictions on consumer’s physical freedom, including “stay at home” orders impacting much of the country, have resulted in unprecedented store closures across most discretionary retail categories. The travel and leisure industry has been devastated with a nearly absolute shutdown of business travel, group meetings and inbound air traffic. Lastly, widespread layoffs and stock market wealth destruction has created an uncertain outlook for big ticket spending over the near to intermediate term. In regard to specific stock drivers, the Fund’s position in Amazon.com, Inc. added to relative performance during the period. We remain positive on Amazon.com as it continued to gain market share, generated impressive free cash flow
Management's Discussion of Fund Performance (Unaudited) (Continued)
and improved margins. Additionally, Amazon.com potentially benefits from the rapid transition to work-from-home operations and a shift in consumer traffic to predominantly online.
The Energy sector was the primary detractor from relative results during the period. An unprecedented combination of supply and demand issues led to a dramatic decline in energy commodities and stocks within the sector in the first quarter of 2020. The effects of COVID-19, the most disruptive event ever for Energy companies, has the potential for global demand to be down nearly 25 percent in the second quarter 2020. Contributing to the negative results in the sector is the ongoing conflict between Russia and Saudi Arabia, introducing additional long-term concerns to industry supply discipline. Given the macro uncertainty facing the sector, we decided to exit the Fund’s investments in the group, Marathon Petroleum Corporation and Pioneer Natural Resources Company, in March. We will continue to monitor the space and look to opportunistically reinvest in idiosyncratic growth stories that can benefit from future changes in supply or demand.
The Financials sector also detracted during the period. More recently, the sector faced headwinds due to rapidly falling interest rates, exacerbated in part by deleveraging and illiquidity, and additional signs of credit market stress. While there were some bright spots in the Fund during the period, like S&P Global, Inc., weakness in banks resulted in relative underperformance. Citigroup Inc. was the biggest source of relative weakness in the industry and sector. The stock traded down in the second half of the first quarter 2020 over general concerns on rates and credit as well as its exposure to international markets relative to peers - including 21 percent of total revenues derived from Asia. Despite the near-term weakness, we maintain conviction in the business as we believe the stock’s valuation is compelling even after fairly draconian new assumptions for low rates and higher credit costs. We believe valuation will rebound once investors have a better sense of the duration of the downturn.
Exposure to the Information Technology sector was the largest absolute change in Fund positioning during the period. In this environment, we believe that high quality businesses supported by strong cash flows and healthy revenue streams have the potential to better weather the storm. Additionally, we believe many technology companies may benefit from the rapid transition to work-from-home operations and a shift in consumer traffic to predominantly online. With that said, we continue to be selective in the space, focusing our attention on companies driving organic sales growth through innovate products and strong pipelines. It is important to remember that we take a bottom-up, fundamental approach when identifying securities for inclusion within the Fund and sector exposures are the result of our fundamental conviction in individual companies.
Outlook
While headlines continue to show spikes in reported infections, and another move lower is certainly possible, we do believe that the brunt of the risk repricing has already occurred. We could also point to signs that are typically evident during a “bottoming” process like panic selling, forced liquidations, and deleveraging by quantitative strategies but acknowledge we are in unchartered territory. Our view, and hope, is that the policies enacted in the U.S. will help the economy bridge the gap from now until workers can safely return to their jobs. When that happens, our expectation remains for recovery in economic activity, albeit at a measured pace until a viable therapeutic agent and, ultimately, a vaccine is mass produced. We remain committed to a balanced approach within the Fund and have exposure to both defensive stocks which provide a ballast during turbulent times, as well as those more economically sensitive names that we believe will benefit most when activity resumes to pre-crisis levels.
As a fundamental, bottom-up manager, macro-economic forecasts do not drive our stock selection process but do help to shape our investment themes. We continue to find exciting opportunities in areas that offer secular growth and innovation. In regard to specific sectors, we believe Health Care and Information Technology represent some of the top sectors of the market. In this environment, we believe that high quality businesses supported by strong cash flows and healthy revenue streams should be better able to weather the storm. Additionally, we believe that the Health Care and Information Technology sectors are both beneficiaries of some of the impacts from COVID-19.
Following the market sell-off, we are now beginning to see variations in price action which suggest that price discovery is once again taking place after a period where forced liquidations drove much of the market. Additionally, we have tried to be opportunistic during these dislocations, adding to high conviction holdings and swapping positions for stocks with what we believe are better risk-return profiles. We like the way the Fund is positioned. As a bottom-up, fundamental manager, we continue to focus on company fundamentals and look to buy stocks of quality U.S. companies at attractive valuations with strong growth prospects over time.
Management's Discussion of Fund Performance (Unaudited) (Continued)
Comparison of the Change in Value of a $10,000 Investment in the Touchstone Growth Opportunities
Fund - Class A* and the Russell 3000® Growth Index
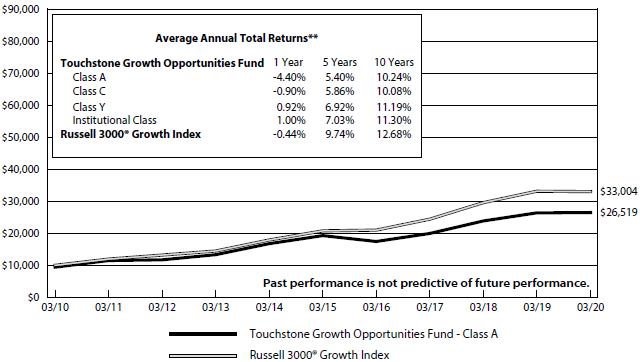
| | * | The chart above represents performance of Class A shares only, which will vary from the performance of Class C shares, Class Y shares and Institutional Class shares based on the differences in sales loads and fees paid by shareholders in the different classes. |
| | | |
| ** | The average annual total returns shown above are adjusted for maximum sales loads and fees, if applicable. The maximum offering price per share of Class A shares is equal to the net asset value (“NAV”) per share plus a sales load equal to 5.26% of the NAV (or 5.00% of the offering price). Class C shares are subject to a contingent deferred sales charge (“CDSC”) of 1.00%. The CDSC will be assessed on an amount equal to the lesser of (1) the NAV at the time of purchase of the shares being redeemed or (2) the NAV of such shares being redeemed, if redeemed within a one-year period from the date of purchase. Class Y shares and Institutional Class shares are not subject to sales charges. |
The performance of the above Fund does not reflect the deduction of taxes that a shareholder would pay on Fund distributions or the redemption of Fund shares.
Notes to Chart
Russell 3000® Growth Index measures the performance of those Russell 3000® companies with higher price-to-book ratios and higher forecasted growth values.
The Frank Russell Company (FRC) is the source and owner of the Index data contained or reflected in this material and all trademarks and copyrights related thereto. The material may contain confidential information and unauthorized use, disclosure, copying, dissemination or redistribution is strictly prohibited. This is a Touchstone Investments presentation of the data, and FRC is not responsible for the formatting or configuration of this material or for any inaccuracy in the presentation thereof.
Management's Discussion of Fund Performance (Unaudited)
Touchstone Mid Cap Growth Fund
Sub-Advised by Westfield Capital Management Company, L.P.
Investment Philosophy
The Touchstone Mid Cap Growth Fund seeks to increase the value of Fund shares by primarily investing in stocks of mid-cap U.S. companies. The Fund’s portfolio managers place focus on companies that they believe to have a demonstrated record of achievement with excellent prospects for earnings growth over a 1-to-3-year period. Westfield looks for companies that it believes are reasonably priced with high forecasted earnings potential.
Fund Performance
The Touchstone Mid Cap Growth Fund (Class A Shares) outperformed its benchmark, the Russell Midcap®Growth Index, for the 12-month period ended March 31, 2020, although both posted negative returns. The Fund’s total return was -8.78 percent (calculated excluding the maximum sales charge), while the total return of the benchmark was -9.45 percent.
Market Environment
Throughout 2019, U.S. equity markets steadily advanced, closing out their best year since 2013 despite ongoing skepticism of the market’s strength. An accommodative U.S Federal Reserve Board (Fed) and easing trade tensions combined with continued U.S. consumer strength and low unemployment to fuel the market advance throughout the year. 2020 began with stocks making new all-time highs, driven by an economy operating at full employment, absent inflationary pressures, an accommodative Fed, and waning concerns over trade negotiations. However, markets turned sharply lower in February when it became apparent that COVID-19 had arrived in the U.S. and containment was no longer possible. The rise of the virus impaired the economic backdrop for global growth and precipitated the sharpest and fastest decline ever for the economy and the stock market. Deleveraging and forced liquidations of stocks and bonds resulted in extreme volatility as investors sought the safety of cash above all else. Oil demand dried up, credit spreads showed signs of stress, and massive stimulus measures were implemented across the world.
Within the benchmark, only the Real Estate and Consumer Staples sectors generated positive returns. The Energy, Consumer Discretionary, Communication Services, Materials and Industrials sectors all declined more than ten percent.
Portfolio Review
Strong stock selection within the Health Care, Industrials, Financials, and Real Estate sectors contributed to the Fund’s relative results. Health Care posted the top relative and absolute results during the twelve months. Stock selection drove the majority of the relative strength in the Health Care sector; however, the Fund’s overweight positioning was also beneficial to relative results. We continued to find opportunities within the Health Care sector that offer exciting, innovation-driven growth. We remain constructive on the group broadly, and believe that there are attractive opportunities across a variety of sub-sectors including health care tools and equipment, medical technology, and therapeutics. The Medicines Company, a late-stage drug developer focused on cholesterol management therapies for cardiovascular disease and long-term high conviction holding of the Fund, was the key driver for both the sector and the Fund during the period. The stock was up after the late November announcement that Novartis International AG was acquiring the company at a premium. The Fund also benefited from exposure to DexCom, Inc., a leader in continuous glucose monitoring (CGM). We believe DexCom has further distanced itself from competitors with advancements in technology allowing its sensor to work with newer insulin pumps. We continue to see a strong growth runway for the company, positioning itself to capitalize on a growing total addressable market in the sensor space.
The Industrials sector was also a source of both relative and absolute strength for the Fund, driven by strong stock selection. This sector has been particularly impacted by slowing business activity and recession fears brought about by trade worries, slowing global growth and more recently COVID-19. Despite macroeconomic concerns, we believe exciting growth opportunities remain in the group, especially within certain segments such as domestic manufacturing, transportation, and machinery. Given the more recent change in economic backdrop, we have reduced exposure to the more cyclically sensitive Industrials stocks and added to more defensive investments. One notable investment within the sector is Teledyne Technologies, Inc., an aerospace & defense company which provides electronic and communication products for wireless and satellite systems. Management continued to execute at a high level and the long-term secular growth story remains intact in our view.
The Information Technology sector was the primary detractor from relative results during the period. Technology stocks outperformed the broader market during the period, led by strength within the semiconductors & semiconductor equipment and software industries. Within semiconductors, the performance shortfall stemmed from businesses the Fund didn’t own, while the Fund’s investments within the industry added to relative results. Despite relative strength from many holdings within software, returns for the group were held back by relative weakness within a few businesses. We believe companies in this sector are playing an increasingly important role across many different segments of the economy, some by driving forward the digital transformations of modern businesses while others provide key enabling technologies for future growth areas such as autonomous driving, artificial intelligence, and the
Management's Discussion of Fund Performance (Unaudited) (Continued)
internet of things. Many companies are also benefiting from the rapid transition to work-from-home operations and a shift in consumer traffic to predominantly online. We continue to seek out companies with advantaged exposure to some key growth areas whether it’s through a unique product pipeline, a large addressable market, or an advantaged competitive position. Palo Alto Networks, Inc., a provider of network security solutions, detracted from results after reporting disappointing product revenues for three consecutive quarters. The stock was sold in March as the risk of further downside remained due to an insufficient reset of investor expectations, in our opinion.
The Energy sector was also a source of relative weakness. An unprecedented combination of supply and demand issues led to a dramatic decline in energy commodities and stocks within the sector in the first quarter of 2020. The effects of COVID-19, the most disruptive event ever for Energy companies, has the potential for global demand to be down nearly 25 percent in the second quarter 2020. Contributing to the negative results in the sector was the ongoing conflict between Russia and Saudi Arabia, introducing additional long-term concerns to industry supply discipline. Given the macro uncertainty facing the sector, we decided to exit Fund investments in the group, Marathon Petroleum Corporation and Pioneer Natural Resources Company. We continue to monitor the space and look to opportunistically reinvest in idiosyncratic growth stories that can benefit from future changes in supply or demand.
Outlook
While headlines continue to show spikes in reported infections, and another move lower is certainly possible, we do believe that the brunt of the risk repricing has already occurred. We could also point to signs that are typically evident during a “bottoming” process like panic selling, forced liquidations, and deleveraging by quantitative strategies but acknowledge we are in unchartered territory. Our view, and hope, is that the policies enacted in the U.S. will help the economy bridge the gap from now until workers can safely return to their jobs. When that happens, our expectation remains for recovery in economic activity, albeit at a measured pace until a viable therapeutic agent and, ultimately, a vaccine is mass produced. We remain committed to a balanced approach within the Fund and have exposure to both defensive stocks which provide a ballast during turbulent times, as well as those more economically sensitive names that we believe will benefit most when activity resumes to pre-crisis levels.
As a fundamental, bottom-up manager, macro-economic forecasts do not drive our stock selection process but do help to shape our investment themes. We continue to find exciting opportunities in areas that offer secular growth and innovation. In regard to specific sectors, we believe Health Care and Information Technology represent some of the top sectors of the market. In this environment, we believe that high quality businesses supported by strong cash flows and healthy revenue streams should be better able to weather the storm. Additionally, we believe that the Health Care and Information Technology sectors are both beneficiaries of some of the impacts from COVID-19.
Following the market sell-off, we are now beginning to see variations in price action which suggest that price discovery is once again taking place after a period where forced liquidations drove much of the market. Additionally, we have tried to be opportunistic during these dislocations, adding to high-conviction holdings and swapping positions for stocks with what we believe are better risk-return profiles. We like the way the Fund is positioned. As a bottom-up, fundamental manager, we continue to focus on company fundamentals and look to buy stocks of quality U.S. companies at attractive valuations with strong growth prospects over time.
Management's Discussion of Fund Performance (Unaudited) (Continued)
Comparison of the Change in Value of a $10,000 Investment in the Touchstone Mid Cap Growth Fund - Class
A* and the Russell Midcap® Growth Index

| | * | The chart above represents performance of Class A shares only, which will vary from the performance of Class C shares, Class Y shares, Class R6 shares and Institutional Class shares based on the differences in sales loads and fees paid by shareholders in the different classes. The inception date of Class R6 shares and Institutional Class shares was February 10, 2020 and April 1, 2011, respectively. Institutional Class shares performance information was calculated using the historical performance of Class A shares for periods prior to April 1, 2011. Class R6 shares performance information was calculated using the historical performance of Institutional Class shares for periods prior to February 10, 2020. The returns have been restated for fees applicable to Class R6 and Institutional Class shares. |
| | | |
| ** | The average annual total returns shown above are adjusted for maximum sales loads and fees, if applicable. The maximum offering price per share of Class A shares is equal to the net asset value (“NAV”) per share plus a sales load equal to 5.26% of the NAV (or 5.00% of the offering price). Class C shares are subject to a contingent deferred sales charge (“CDSC”) of 1.00%. The CDSC will be assessed on an amount equal to the lesser of (1) the NAV at the time of purchase of the shares being redeemed or (2) the NAV of such shares being redeemed, if redeemed within a one-year period from the date of purchase. Class Y shares, Class R6 shares, and Institutional Class shares are not subject to sales charges. |
The performance of the above Fund does not reflect the deduction of taxes that a shareholder would pay on Fund distributions or the redemption of Fund shares.
Notes to Chart
Russell Midcap®Growth Index measures the performance of those Russell Midcap® companies with higher price-to-book ratios and higher forecasted growth values.
The Frank Russell Company (FRC) is the source and owner of the Index data contained or reflected in this material and all trademarks and copyrights related thereto. The material may contain confidential information and unauthorized use, disclosure, copying, dissemination or redistribution is strictly prohibited. This is a Touchstone Investments presentation of the data, and FRC is not responsible for the formatting or configuration of this material or for any inaccuracy in the presentation thereof.
Management's Discussion of Fund Performance (Unaudited)
Touchstone Sands Capital Emerging Markets Growth Fund
Sub-Advised by Sands Capital Management, LLC
Investment Philosophy
The Touchstone Sands Capital Emerging Markets Growth Fund seeks long-term capital appreciation. The Fund invests in equity and equity-related securities issued by companies located in Emerging or Frontier Market countries. The Fund’s sub-advisor, Sands Capital Management LLC, uses a “bottom-up” approach to investment selection, as opposed to sector or regional allocations, that focuses on a company’s long-term business fundamentals. Sands Capital seeks companies that have: sustainable above-average earnings growth; a leadership position in a promising business space; significant competitive advantages such as profitability, superior quality or distribution relative to competitors or strong brand and consumer loyalty; a clear mission in an understandable business model; financial strength; and a rational valuation in relation to competitors, the market and business prospects.
Fund Performance
The Touchstone Sands Capital Emerging Markets Growth Fund (Class A Shares) outperformed its benchmark, the MSCI Emerging Markets Index, for the 12-month period ended March 31, 2020, although both posted negative returns. The Fund’s total return was -13.19 percent (calculated excluding the maximum sales charge), while the total return of the benchmark was -17.69 percent.
Market Environment
Following a volatile six months, easing U.S./China trade tensions in the fourth quarter of 2019 resulted in a “risk on” environment for equities globally. This proved short lived, however, as the global coronavirus outbreak sank stocks around the world.
Only one constituent country—Taiwan—eked out a positive return for the period, with all other countries, except for China, falling by double digits. Seventeen constituents experienced drops of more than 30 percent, led by Argentina, which was down over 50 percent. India, Brazil, South Korea, and China were the largest detractors to emerging markets equity returns.
Information Technology was the only sector to produce a positive return, and was one of the top contributors, along with Health Care. The Financials and Energy sectors were the top benchmark detractors.
Portfolio Review
The Fund outperformed the benchmark during the 12-month period largely due to positive allocation and currency effects. Singapore and China were the largest relative contributors from a country perspective, and India was the primary country detractor, largely attributable to Financials and travel-related businesses. From a sector perspective, Communication Services and Consumer Discretionary were the top contributors, while Information Technology and Industrials were the top detractors.
The top five relative individual contributors to investment results were Sea Ltd., Alibaba Group Holding Ltd., Hansoh Pharmaceutical Group Co. Ltd., Anta Sports Products Ltd., and New Oriental Education & Technology Group Inc.
Sea Ltd.: The stock was bolstered by strong results from Sea’s core gaming and ecommerce businesses. Sea was relatively unaffected by the social distancing measures spurred by the coronavirus outbreak given the digital nature of its operations, and the additional free time for users to play games and shop online.
Hansoh Pharmaceutical: The stock rose during the period in response to positive clinical and business results. The Fund sold the business in the third quarter of 2019 due to valuation concerns.
Anta Sports Products: The stock rose as the company executed on its “multibrand, omnichannel, full coverage” strategy. While not immune to the coronavirus outbreak, our long-term thesis remains intact, and our recent consumer surveys strengthened our conviction in the Chinese sportswear industry and Anta’s brand strength.
The top five relative detractors were Trip.com Group Ltd., Bajaj Finance Ltd., Bandhan Bank Ltd., HDFC Bank Ltd., and MakeMyTrip Ltd.
Trip.com: The COVID-19 outbreak meaningfully affected Trip’s business, as all domestic and overseas travel was effectively halted. Despite the near-term headwind, we believe that travel will resume once the outbreak subsides, and we believe that the secular trend of bookings moving online will remain intact.
Bandhan Bank: The stock has been pressured by several factors, including political tensions, promoter stock ownership concerns, and general stress in the Indian financial sector. Despite these external pressures, we continue to favorably view Bandhan’s position as India’s largest microfinance lender by market share.
Management's Discussion of Fund Performance (Unaudited) (Continued)
HDFC Bank: The Indian financials sector has faced several quarters of lingering issues, but most recently, the Reserve Bank of India’s rescue of failing Yes Bank caused panic, threatening a bank run on other private lenders. This, coupled with the coronavirus outbreak, affected all of the Fund’s Indian financials businesses, despite their continued fundamental strength.
During the period, the Fund purchased Bandhan Bank, Hansoh Pharmaceutical, Globant SA, Localiza Rent-a-Car SA, PagSeguro Digital Ltd., Prosus NV,Titan Co. Ltd., and Vincom Retail JSC.The Fund sold Adani Ports, Eicher Motors Ltd., Hansoh Pharmaceutical, IndusInd Bank Ltd., ITC Ltd., Larsen & Toubro Ltd., Medy-Tox Inc., Maruti Suzuki India Ltd., Naspers Ltd., Sands China Ltd., and Zee Entertainment Enterprises Ltd.
The regional and sector exposures are largely a byproduct of the Fund’s bottom-up investment process. While general positioning remained directionally unchanged, below are some highlights from the past year:
| • | The Fund’s allocation to Emerging Asia fell in absolute and relative terms. However, this remains the Fund’s largest regional overweight. The reduction was largely due to exits, which included six Indian businesses. |
| • | Emerging Asia’s decrease was balanced in part by an absolute increase to Asia/Pacific ex-Japan. The Fund purchased no new businesses in this region, but raised the weights in existing holdings due to stronger conviction. Despite the increased weight, the region remains the Fund’s largest underweight. |
| • | The Fund’s allocation to Latin America also increased in absolute terms, resulting in an overweight to the region. Holdings in the region increased over the period from three to six. |
| • | From a sector perspective, the Fund’s largest overweights remained Consumer Discretionary, Communication Services, and Health Care, while the largest underweights remained Information Technology, Financials, and Energy. |
Outlook
We continue to monitor the effects of the global coronavirus outbreak on portfolio businesses and the broader economy. We believe that businesses that can survive and thrive are those that continue to invest in their people, processes, product/services, and brands. These businesses’ earnings will likely be higher over a five-year period, resulting in opportunities for active investors in leading, innovative growth businesses.
We believe powerful secular trends will continue beyond the outbreak, and these shifts will change how people bank, communicate, and shop. In some cases, the outbreak may even cause these trends to accelerate. Many of the businesses in the Fund’s portfolio have the potential to benefit from one or more of the following secular trends: 1) Rise of Internet Penetration; 2) Formalization of Retail; 3) Hard & Soft Infrastructure; and 4) Financial Penetration.
Rising internet connectivity and mobile device penetration are spurring broad-based economic activity in emerging markets. Commercial opportunities—including ecommerce, online travel, and ride sharing—are being enabled by new cloud, logistics, and enterprise solutions. The internet is changing how people consume information, leading to opportunities for advertisers and digital media providers. Potential portfolio beneficiaries include Alibaba Group Holding Ltd., MercadoLibre Inc., Sea Ltd., and Tencent Holdings Ltd.
The shift from fragmented industries to consolidated operators offers powerful opportunities in many emerging economies. Informal “mom and pop” vendors lack the product selection, quality, and shopping experience offered by formal competitors. Formal retailers with compelling brands and/or store formats have the opportunity to take share and consolidate the market, particularly as consumer incomes rise and demand increases for better quality and greater selection. Potential portfolio beneficiaries include Anta Sports Products Ltd., Asian Paints Ltd., CP All PLC, and Jubilant Foodworks Ltd.
Substantial infrastructure investment and development are required to enhance productivity and stimulate demand. We see several countries beginning to enact pro-growth policies that should help sustain future domestic growth. Opportunities exist in both hard infrastructure—such as new roads and airports, and in soft infrastructure, which includes education and health care. Potential portfolio beneficiaries include Apollo Hospitals Enterprise Ltd., Grupo Aeroportuario del Sureste, New Oriental Education & Technology Group Inc. and Wuxi Biologics Cayman Inc.
Approximately a third of the world’s adult population remains unbanked, and nearly all of them live in emerging markets. New technologies are enabling access to basic financial products and services. Businesses serving the needs of the growing middle class should benefit from increasing demand for consumer financing. Potential portfolio beneficiaries include AIA Group Ltd., Bajaj Finance Ltd., Bank Central Asia, and HDFC Bank Ltd.
Not all emerging markets are created equal. The opportunity set consists of companies from over 25 countries, each with distinct growth prospects, central bank policy, demographics, and economic composition/exposures.
Management's Discussion of Fund Performance (Unaudited) (Continued)
Selectivity matters, and we continue to believe that our criteria-driven approach enables us to navigate the complexities and nuances within emerging markets. Ultimately, we believe that stock prices follow earnings growth, and we seek to invest in those businesses capable of driving above-average growth across market cycles.
We don’t know what the next quarter or year will bring. However, we remain comfortable with accepting short-term volatility for long-term value-creation potential, and are confident that the businesses we own will continue to deliver above-average earnings growth over our investment horizon.
Comparison of the Change in Value of a $10,000 Investment in the Touchstone Sands Capital Emerging
Markets Growth Fund - Class A* and the MSCI Emerging Markets Index

* The chart above represents performance of Class A shares only, which will vary from the performance of Class C shares, Class Y shares and Institutional Class shares based on the differences in sales loads and fees paid by shareholders in the different classes. The inception date of Class A shares, Class C shares, Class Y shares and Institutional Class shares was November 16, 2018, November 16, 2018, May 9, 2014 and May 9, 2014, respectively. Class A shares and Class C shares performance information was calculated using the historical performance of Class Y shares for periods prior to November 16, 2018. The returns have been restated for sales loads and fees applicable to Class A and Class C shares. The returns of the index listed above are based on the inception date of the Fund.
| ** | The average annual total returns shown above are adjusted for maximum sales loads and fees, if applicable. The maximum offering price per share of Class A shares is equal to the net asset value (“NAV”) per share plus a sales load equal to 5.26% of the NAV (or 5.00% of the offering price). Class C shares are subject to a contingent deferred sales charge (“CDSC”) of 1.00%. The CDSC will be assessed on an amount equal to the lesser of (1) the NAV at the time of purchase of the shares being redeemed or (2) the NAV of such shares being redeemed, if redeemed within a one-year period from the date of purchase. Class Y shares and Institutional Class shares are not subject to sales charges. |
The performance of the above Fund does not reflect the deduction of taxes that a shareholder would pay on Fund distributions or the redemption of Fund shares.
Notes to Chart
MSCI Emerging Markets Index is a free float-adjusted market capitalization index that is designed to measure equity market performance of emerging markets.
MSCI makes no express or implied warranties or representations and shall have no liability whatsoever with respect to any MSCI data contained herein. The MSCI data may not be further redistributed or used to create indices or financial products. This report is not approved or produced by MSCI.
Tabular Presentation of Portfolios of Investments (Unaudited)
March 31, 2020
The tables below provide each Fund’s geographic allocation, sector allocation and/or credit quality. We hope it will be useful to shareholders as it summarizes key information about each Fund’s investments.
| Touchstone Flexible Income Fund | | | |
| Credit Quality* | | (% of Fixed Income Securities) | |
| AAA/Aaa | | | 57.5 | % |
| AA/Aa | | | 2.5 | |
| A/A | | | 9.5 | |
| BBB/Baa | | | 12.7 | |
| BB/Ba | | | 5.8 | |
| B/B | | | 5.1 | |
| Not Rated | | | 6.9 | |
| | | | 100.0 | % |
| Credit Quality* | | (% of Preferred Stocks) | |
| AAA/Aaa | | | 2.4 | |
| BBB/Baa | | | 37.4 | |
| BB/Ba | | | 50.2 | |
| Not Rated | | | 10.0 | |
| | | | 100.0 | % |
| Sector Allocation** | | (% of Net Assets) | |
| Fixed Income Securities | | | 64.3 | |
| Preferred Stocks | | | | |
| Financials | | | 14.0 | |
| Utilities | | | 3.8 | |
| Energy | | | 1.4 | |
| Investment Funds | | | 9.0 | |
| Purchased Call Options | | | 0.0 | |
| Short-Term Investment Funds | | | 5.9 | |
| Other Assets/Liabilities (Net) | | | 1.6 | |
| Total | | | 100.0 | % |
| Touchstone Focused Fund | | | |
| Sector Allocation** | | (% of Net Assets) | |
| Information Technology | | | 24.6 | % |
| Communication Services | | | 19.2 | |
| Financials | | | 15.5 | |
| Health Care | | | 12.2 | |
| Consumer Discretionary | | | 10.4 | |
| Industrials | | | 9.1 | |
| Real Estate | | | 3.7 | |
| Consumer Staples | | | 2.9 | |
| Energy | | | 1.7 | |
| Materials | | | 0.8 | |
| Short-Term Investment Fund | | | 0.0 | |
| Other Assets/Liabilities (Net) | | | (0.1 | ) |
| Total | | | 100.0 | % |
| Touchstone Global ESG Equity Fund | | | |
| Geographic Allocation | | (% of Net Assets) | |
| Common Stocks | | | | |
| United States | | | 48.4 | % |
| Japan | | | 9.2 | |
| France | | | 8.2 | |
| United Kingdom | | | 7.8 | |
| Germany | | | 7.7 | |
| Switzerland | | | 3.5 | |
| China | | | 2.8 | |
| Italy | | | 2.4 | |
| Canada | | | 2.1 | |
| Ireland | | | 1.5 | |
| Hong Kong | | | 1.3 | |
| Sweden | | | 1.2 | |
| South Korea | | | 0.8 | |
| Indonesia | | | 0.6 | |
| India | | | 0.5 | |
| Short-Term Investment Funds | | | 5.9 | |
| Other Assets/Liabilities (Net) | | | (3.9 | ) |
| Total | | | 100.0 | % |
* Credit quality ratings are from Standard & Poor's (“S&P”) and Moody's Investors Service (“Moody's”). If agency ratings differ, the higher rating will be used. Where no rating has been assigned, it may be for reasons unrelated to the creditworthiness of the issuer.
** Sector classifications are based upon the Global Industry Classification Standard (GICS®).
Tabular Presentation of Portfolios of Investments (Unaudited) (Continued)
| Touchstone Growth Opportunities Fund | | | |
| Sector Allocation* | | (% of Net Assets) | |
| Information Technology | | | 38.6 | % |
| Health Care | | | 17.5 | |
| Communication Services | | | 13.0 | |
| Consumer Discretionary | | | 12.0 | |
| Industrials | | | 9.0 | |
| Financials | | | 6.6 | |
| Consumer Staples | | | 1.4 | |
| Short-Term Investment Fund | | | 1.9 | |
| Other Assets/Liabilities (Net) | | | 0.0 | |
| Total | | | 100.0 | % |
| Touchstone Mid Cap Growth Fund | | | |
| Sector Allocation* | | (% of Net Assets) | |
| Information Technology | | | 34.7 | % |
| Health Care | | | 21.5 | |
| Industrials | | | 17.0 | |
| Consumer Discretionary | | | 11.3 | |
| Financials | | | 8.2 | |
| Real Estate | | | 4.6 | |
| Materials | | | 1.6 | |
| Short-Term Investment Funds | | | 1.6 | |
| Other Assets/Liabilities (Net) | | | (0.5 | ) |
| Total | | | 100.0 | % |
| Touchstone Sands Capital Emerging Markets Growth Fund | | | |
| Geographic Allocation | | (% of Net Assets) | |
| Common Stocks | | | | |
| China | | | 36.7 | % |
| India | | | 18.0 | |
| Singapore | | | 7.1 | |
| Argentina | | | 5.9 | |
| Russia | | | 5.2 | |
| Hong Kong | | | 4.3 | |
| Taiwan | | | 4.0 | |
| Brazil | | | 3.0 | |
| Indonesia | | | 2.4 | |
| Netherlands | | | 2.3 | |
| Thailand | | | 2.1 | |
| Cambodia | | | 1.4 | |
| Mexico | | | 1.3 | |
| Philippines | | | 0.9 | |
| Vietnam | | | 0.6 | |
| Short-Term Investment Fund | | | 3.7 | |
| Other Assets/Liabilities (Net) | | | 1.1 | |
| Total | | | 100.0 | % |
* Sector classifications are based upon the Global Industry Classification Standard (GICS®).
Portfolio of Investments
Touchstone Flexible Income Fund – March 31, 2020
| Principal | | | | | Market | |
| Amount | | | | | Value | |
| | | | | Corporate Bonds — 23.3% | | | | |
| | | | | Financials — 14.8% | | | | |
| $ | 4,019,000 | | | Ares Capital Corp., 3.250%, 7/15/25 | | $ | 3,189,714 | |
| | 7,778,000 | | | Citigroup, Inc., Ser Q, 5.950%(A) | | | 6,844,640 | |
| | 7,610,000 | | | Citigroup, Inc., Ser V, 4.700%(A) | | | 6,518,726 | |
| | 8,636,000 | | | Citizens Financial Group, Inc., Ser A, 5.500%(A) | | | 7,426,960 | |
| | 31,298,000 | | | Goldman Sachs Group, Inc. (The),Ser M, 5.375%(A) | | | 27,972,588 | |
| | 1,952,000 | | | Goldman Sachs Group, Inc. (The),Ser R, 4.950%(A) | | | 1,737,280 | |
| | 3,264,000 | | | Goldman Sachs Group, Inc.(The), 3.500%, 4/1/25 | | | 3,336,544 | |
| | 2,594,000 | | | JPMorgan Chase & Co., Ser I, (3M LIBOR +3.470%),5.240%(A)(B) | | | 2,315,819 | |
| | 1,278,000 | | | Lincoln National Corp., (3M LIBOR +2.040%),3.859%, 4/20/67(B) | | | 766,800 | |
| | 3,981,000 | | | Lincoln National Corp., (3M LIBOR +2.358%),4.049%, 5/17/66(B) | | | 2,468,220 | |
| | 9,072,000 | | | MetLife, Inc., Ser C, 5.250%(A) | | | 7,892,640 | |
| | 22,313,000 | | | Morgan Stanley, Ser J, 5.550%(A) | | | 19,412,310 | |
| | 3,458,000 | | | Oaktree Specialty Lending Corp., 3.500%, 2/25/25 | | | 3,101,607 | |
| | 2,706,000 | | | Reinsurance Group of America, Inc., (3M LIBOR+2.665%), 3.406%, 12/15/65(B) | | | 1,735,222 | |
| | | | | | | | 94,719,070 | |
| | | | | Consumer Discretionary — 3.7% | | | | |
| | 2,015,000 | | | Ford Motor Credit Co. LLC, 5.085%, 1/7/21 | | | 1,964,021 | |
| | 16,379,000 | | | General Motors Co., (3M LIBOR +0.900%),1.796%, 9/10/21(B) | | | 14,781,464 | |
| | 3,471,000 | | | General Motors Financial Co., Inc., Ser A, 5.750%(A) | | | 2,186,730 | |
| | 5,333,000 | | | Marriott Ownership Resorts, Inc., 144a,4.750%, 1/15/28 | | | 3,999,750 | |
| | 31,000 | | | Newell Brands, Inc., 3.400%, 4/1/21 | | | 30,770 | |
| | 635,000 | | | Wyndham Destinations, Inc., 5.750%, 4/1/27 | | | 530,225 | |
| | | | | | | | 23,492,960 | |
| | | | | Energy — 2.1% | | | | |
| | 5,552,000 | | | Energy Transfer Operating LP, Ser G, 7.125%(A) | | | 3,393,938 | |
| | 11,369,000 | | | MPLX LP, Ser B, 6.875%(A) | | | 6,935,090 | |
| | 7,547,000 | | | Occidental Petroleum Corp., 4.245%, 10/10/36# | | | 2,924,462 | |
| | | | | | | | 13,253,490 | |
| | | | | Materials — 1.7% | | | | |
| | 10,590,000 | | | Chevron Phillips Chemical Co. LLC / Chevron Phillips Chemical Co. LP, 144a, 5.125%, 4/1/25 | | | 10,891,718 | |
| | | | | Utilities — 0.7% | | | | |
| | 4,754,000 | | | Duke Energy Corp., 4.875%(A) | | | 3,993,360 | |
| | 1,312,000 | | | PPL Capital Funding, Inc., Ser A, (3M LIBOR +2.665%),4.040%, 3/30/67(B) | | | 839,680 | |
| | | | | | | | 4,833,040 | |
| | | | | Communication Services — 0.3% | | | | |
| | 2,826,000 | | | Diamond Sports Group LLC / Diamond Sports Finance Co., 144a, 5.375%, 8/15/26 | | | 2,296,182 | |
| | | | | Total Corporate Bonds | | $ | 149,486,460 | |
| | Shares | | | | | | | |
| | | | | Preferred Stocks — 19.2% | | | | |
| | | | | Financials — 14.0% | | | | |
| | 592,963 | | | AGNC Investment Corp., Ser F, 6.125%(A) | | | 10,525,093 | |
| | 189,858 | | | AllianzGI Convertible &, Income Fund, Ser A,5.625%(A) | | | 4,706,580 | |
| | 490,318 | | | Annaly Capital Management, Inc.,Ser I, 6.750%(A) | | | 8,732,564 | |
| | 158,294 | | | Apollo Global Management, Inc.,Ser A, 6.375%(A) | | | 3,734,155 | |
| | 509,316 | | | Ares Management Corp., Ser A, 7.000%(A) | | | 12,432,404 | |
| | 55,436 | | | Bank of America Corp., Ser CC, 6.200%(A) | | | 1,394,215 | |
| | 215,485 | | | Bank of America Corp., Ser EE, 6.000%(A) | | | 5,397,899 | |
| | 104,398 | | | Bank of America Corp., Ser GG, 6.000%(A) | | | 2,677,809 | |
| | 19,145 | | | Capital One Financial Corp., Ser F, 6.200%(A) | | | 459,863 | |
| | 328,432 | | | GMAC Capital Trust I, Ser 2, (3M LIBOR +5.785%),7.477%, 2/15/40(B) | | | 6,736,140 | |
| | 281,990 | | | Hartford Financial Services Group, Inc. (The), 7.875%,4/15/42 | | | 7,368,399 | |
| | 8,731 | | | JPMorgan Chase & Co., Ser BB, 6.150%(A) | | | 219,585 | |
| | 253,040 | | | National Rural Utilities Cooperative Finance Corp.,Ser US, 5.500%, 5/15/64 | | | 6,366,486 | |
| | 91,930 | | | Oaktree Capital Group LLC, Ser A, 6.625%(A) | | | 2,052,797 | |
| | 351,399 | | | Oaktree Capital Group LLC, Ser B, 6.550%(A) | | | 7,730,778 | |
| | 84,309 | | | PartnerRe Ltd., Ser H, (Bermuda), 7.250%(A) | | | 2,098,451 | |
| | 128,342 | | | Stifel Financial Corp., 5.200%, 10/15/47 | | | 2,845,342 | |
| | 85,385 | | | Wells Fargo & Co., Ser V, 6.000%(A) | | | 2,138,894 | |
| | 60,333 | | | Wells Fargo & Co., Ser W, 5.700%(A) | | | 1,493,242 | |
| | 20,195 | | | Wells Fargo & Co., Ser Z, 4.750%(A) | | | 424,095 | |
| | | | | | | | 89,534,791 | |
| | | | | Utilities — 3.8% | | | | |
| | 365,386 | | | Brookfield Renewable Partners LP, Ser 17, (Canada),5.250%(A) | | | 7,117,719 | |
| | 240,059 | | | Duke Energy Corp., Ser A, 5.750%(A) | | | 6,236,733 | |
| | 140,452 | | | Entergy Arkansas LLC, 4.900%, 12/1/52 | | | 3,522,536 | |
| | 97,586 | | | Entergy Arkansas LLC, 4.750%, 6/1/63 | | | 2,434,771 | |
| | 102,510 | | | Entergy Louisiana LLC, 4.875%, 9/1/66 | | | 2,541,223 | |
| | 72,249 | | | Entergy Louisiana LLC, 4.700%, 6/1/63 | | | 1,788,163 | |
| | 28,529 | | | Entergy Mississippi LLC, 4.900%, 10/1/66 | | | 706,378 | |
| | 670 | | | Entergy New Orleans LLC, 5.000%, 12/1/52 | | | 16,723 | |
| | | | | | | | 24,364,246 | |
| | | | | Energy — 1.4% | | | | |
| | 22,839 | | | Enbridge, Inc., Ser 1, (Canada), 5.949%(A) | | | 318,832 | |
| | 90,996 | | | Enbridge, Inc., Ser 5, (Canada), 5.375%(A) | | | 1,216,617 | |
| | 46,849 | | | Enbridge, Inc., Ser J, (Canada), 4.887%(A) | | | 585,613 | |
| | 32,865 | | | Enbridge, Inc., Ser L, (Canada), 4.959%(A) | | | 416,071 | |
| | 545,112 | | | Energy Transfer Operating LP, Ser E, 7.600%(A) | | | 6,775,742 | |
| | | | | | | | 9,312,875 | |
| | | | | Total Preferred Stocks | | $ | 123,211,912 | |
| | Principal | | | | | | | |
| | Amount | | | | | | | |
| | | | | Asset-Backed Securities — 15.2% | | | | |
| $ | 183,673 | | | Ally Auto Receivables Trust, Ser 2018-2, Class A3,2.920%, 11/15/22 | | | 184,588 | |
| | 989,152 | | | American Credit Acceptance Receivables Trust, Ser 2018-1, Class C, 144a, 3.550%, 4/10/24 | | | 987,353 | |
| | 3,820,743 | | | American Homes 4 Rent Trust, Ser 2014-SFR2, Class A, 144a, 3.786%, 10/17/36 | | | 3,839,201 | |
| | 1,700,000 | | | AmeriCredit Automobile Receivables, Ser 2015-4,Class D, 3.720%, 12/8/21 | | | 1,691,289 | |
| | 1,930,000 | | | AMMC CLO XII Ltd., Ser 2013-12A, Class X, (Cayman Islands), 144a, (3M LIBOR +0.650%),2.384%, 11/10/30(B) | | | 1,929,954 | |
Touchstone Flexible Income Fund (Continued)
| Principal | | | | | Market | |
| Amount | | | | | Value | |
| | | | | | | | | |
| | | | | Asset-Backed Securities — 15.2% (Continued) | | | | |
| $ | 753,730 | | | Arivo Acceptance Auto Loan Receivables Trust, Ser 2019-1, Class A, 144a, 2.990%, 7/15/24 | | $ | 739,385 | |
| | 6,628,584 | | | Barings BDC Static CLO Ltd., Ser 2019-1A, Class A1, (Cayman Islands), 144a, (3M LIBOR +1.020%),2.851%, 4/15/27(B) | | | 6,474,807 | |
| | 297,004 | | | BMW Vehicle Owner Trust, Ser 2019-A, Class A2, 2.050%, 5/25/22 | | | 297,854 | |
| | 300,072 | | | Canadian Pacer Auto Receivables Trust, Ser 2018-2A, Class A2B, (Canada), 144a, (1M LIBOR +0.180%),0.930%, 6/21/21(B) | | | 299,267 | |
| | 160,000 | | | Capital One Multi-Asset Execution Trust, Ser 2015-A2, Class A2, 2.080%, 3/15/23 | | | 159,895 | |
| | 915,304 | | | CarMax Auto Owner Trust, Ser 2017-3, Class A3, 1.970%, 4/15/22 | | | 915,657 | |
| | 595,371 | | | CarMax Auto Owner Trust, Ser 2018-1, Class A3, 2.480%, 11/15/22 | | | 593,962 | |
| | 18,263 | | | CCG Receivables Trust, Ser 2017-1, Class A2, 144a, 1.840%, 11/14/23 | | | 18,250 | |
| | 205,915 | | | Conseco Finance Corp., Ser 1998-4, Class A7,6.870%, 4/1/30(B)(C) | | | 208,725 | |
| | 1,103,248 | | | CPS Auto Receivables Trust, Ser 2016-B, Class C, 144a, 4.220%, 3/15/22 | | | 1,102,225 | |
| | 1,857,862 | | | CPS Auto Receivables Trust, Ser 2019-B, Class A, 144a, 2.890%, 5/16/22 | | | 1,849,742 | |
| | 4,136,873 | | | CPS Auto Receivables Trust, Ser 2019-C, Class A, 144a, 2.550%, 9/15/22 | | | 4,106,179 | |
| | 170,053 | | | CPS Auto Trust, Ser 2017-A, Class C, 144a, 3.310%, 12/15/22 | | | 169,540 | |
| | 392,279 | | | Credit Acceptance Auto Loan Trust, Ser 2017-3A, Class A, 144a, 2.650%, 6/15/26 | | | 390,157 | |
| | 45,923 | | | DT Auto Owner Trust, Ser 2019-1A, Class A, 144a, 3.080%, 9/15/22 | | | 45,853 | |
| | 1,572,224 | | | DT Auto Owner Trust, Ser 2019-2A, Class A, 144a, 2.850%, 9/15/22 | | | 1,567,316 | |
| | 1,023,482 | | | DT Auto Owner Trust, Ser 2019-3I, Class A, 2.550%, 8/15/22 | | | 1,018,659 | |
| | 4,563,051 | | | Finance of America HECM Buyout, Ser 2020-HB1,Class A, 144a, 2.012%, 2/25/30(B)(C) | | | 4,616,822 | |
| | 2,315,000 | | | Ford Credit Auto Lease Trust, Ser 2018-B, Class A3, 3.190%, 12/15/21 | | | 2,319,032 | |
| | 665,679 | | | Ford Credit Auto Owner Trust, Ser 2017-B, Class A3, 1.690%, 11/15/21 | | | 662,288 | |
| | 2,241,667 | | | Galaxy XX CLO Ltd., Ser 2015-20A, Class X, (Cayman Islands), 144a, (3M LIBOR +0.600%),2.419%, 4/20/31(B) | | | 2,241,245 | |
| | 2,887,952 | | | GLS Auto Receivables Issuer Trust, Ser 2019-2A, Class A, 144a, 3.060%, 4/17/23 | | | 2,823,187 | |
| | 2,091,315 | | | GLS Auto Receivables Issuer Trust, Ser 2019-4I, Class A, 2.470%, 11/15/23 | | | 1,955,887 | |
| | 243,250 | | | GM Financial Consumer Automobile Receivables Trust, Ser 2018-2, Class A3, 2.810%, 12/16/22 | | | 243,346 | |
| | 3,760,329 | | | Honda Auto Receivables Owner Trust, Ser 2018-3, Class A3, 2.950%, 8/22/22 | | | 3,794,923 | |
| | 774,131 | | | JFIN CLO 2014 Ltd., Ser 2014-1A, Class AR, (Cayman Islands), 144a, (3M LIBOR +0.950%), 2.769%, 4/21/25(B) | | | 756,547 | |
| | 875,000 | | | LCM Ltd., Ser 2019-30, (Cayman Islands), 144a, (3M LIBOR +0.750%), 2.569%, 4/20/31(B) | | | 874,993 | |
| | 1,750,000 | | | Madison Park Funding XXI Ltd., Ser 2016-21A, Class X, (Cayman Islands), 144a, (3M LIBOR +0.900%), 2.731%, 10/15/32(B) | | | 1,749,813 | |
| 1,250,000 | | | Marathon CLO VI Ltd., Ser 2014-6A, Class X, (Cayman Islands), 144a, (3M LIBOR +0.700%),2.407%, 5/13/28(B) | | | 1,249,935 | |
| | 434,779 | | | Mid-State Capital Corp. Trust, Ser 2005-1, Class M2, 7.079%, 1/15/40 | | | 459,336 | |
| | 3,326,656 | | | Nissan Auto Receivables Owner Trust, Ser 2018-A, Class A3, 2.650%, 5/16/22 | | | 3,337,869 | |
| | 6,000,000 | | | NRZ Advance Receivables Trust, Ser 2019-T1, Class AT1, 144a, 2.590%, 7/15/52 | | | 5,726,818 | |
| | 4,000,000 | | | NRZ Advance Receivables Trust, Ser 2019-T1, Class DT1, 144a, 3.330%, 7/15/52 | | | 3,841,906 | |
| | 1,000,000 | | | OZLM VI Ltd., Ser 2014-6A, Class XS, (Cayman Islands), 144a, (3M LIBOR +0.700%),2.536%, 4/17/31(B) | | | 999,993 | |
| | 1,890,210 | | | Pretium Mortgage Credit Partners LLC, Ser 2019-CFL1, Class A1, 144a, 3.721%, 1/25/59(B)(C) | | | 1,627,500 | |
| | 6,904,122 | | | PRPM LLC, Ser 2020-1A, Class A1, 144a, 2.981%, 2/25/25(B)(C) | | | 6,549,195 | |
| | 358,159 | | | Santander Drive Auto Receivables Trust, Ser 2018-1, Class B, 2.630%, 7/15/22 | | | 358,015 | |
| | 203,227 | | | Securitized Term Auto Receivables Trust, Ser 2018-1A, Class A3, (Canada), 144a, 3.068%, 1/25/22 | | | 203,408 | |
| | 2,545,455 | | | Sound Point CLO VI-R Ltd., Ser 2014-2RA, Class X, (Cayman Islands), 144a, (3M LIBOR +0.700%),2.519%, 10/20/31(B) | | | 2,545,437 | |
| | 87,549 | | | Tesla Auto Lease Trust, Ser 2018-A, Class D, 144a, 3.300%, 5/20/20 | | | 87,195 | |
| | 5,900,000 | | | Towd Point Mortgage Trust, Ser 2016-1, Class M1, 144a, 3.500%, 2/25/55(B)(C) | | | 5,597,593 | |
| | 5,894,353 | | | Towd Point Mortgage Trust, Ser 2017-6, Class A1, 144a, 2.750%, 10/25/57(B)(C) | | | 5,898,952 | |
| | 1,875,000 | | | Tryon Park CLO Ltd., Ser 2013-1A, Class XR, (Cayman Islands), 144a, (3M LIBOR +0.550%),2.381%, 4/15/29(B) | | | 1,874,983 | |
| | 1,786,674 | | | United Auto Credit Securitization Trust, Ser 2019-1, Class A, 144a, 2.820%, 7/12/21 | | | 1,784,558 | |
| | 1,137,788 | | | USAA Auto Owner Trust, Ser 2017-1, Class A4, 1.880%, 9/15/22 | | | 1,135,065 | |
| | 1,285,000 | | | World Financial Network Credit Card Master Trust, Ser 2015-B, Class A, 2.550%, 6/17/24 | | | 1,289,931 | |
| | 2,192,025 | | | World Omni Auto Receivables Trust, Ser 2018-B, Class A3, 2.870%, 7/17/23 | | | 2,172,120 | |
| | | | | Total Asset-Backed Securities | | $ | 97,367,750 | |
| | | | U.S. Treasury Obligations—14.7% | | | |
| | 18,724,000 | | | U.S. Treasury Note, 2.500%, 5/31/20 | | | 18,797,941 | |
| | 16,180,000 | | | U.S. Treasury Note, 2.625%, 7/31/20 | | | 16,320,311 | |
| | 58,331,000 | | | U.S. Treasury Note, 2.625%, 11/15/20 | | | 59,256,093 | |
| | | | | Total U.S. Treasury Obligations | | $ | 94,374,345 | |
| Shares | | | | | | |
| | | | | | | | | |
| | | | | Investment Funds — 9.0% | | | | |
| | 5,000,000 | | | Alerian MLP ETF | | | 17,200,000 | |
| | 669,927 | | | BlackRock Corporate High Yield Fund, Inc.± | | | 5,895,358 | |
| | 98,072 | | | BlackRock Credit Allocation Income Trust± | | | 1,143,520 | |
| | 123,428 | | | BlackRock Debt Strategies Fund, Inc.±† | | | 1,042,967 | |
| | 105,892 | | | BlackRock Ltd. Duration Income Trust± | | | 1,336,357 | |
| | 41,622 | | | BlackRock Municipal Income Trust±† | | | 539,421 | |
| | 307,115 | | | BlackRock MuniVest Fund, Inc.± | | | 2,487,631 | |
| | 101,443 | | | First Trust High Income Long/Short Fund± | | | 1,234,561 | |
| | 89,959 | | | Invesco Municipal Opportunity Trust± | | | 1,030,031 | |
Touchstone Flexible Income Fund(Continued)
| | | | | | Market | |
| Shares | | | | | Value | |
| | | | | | | | | |
| | | | | Investment Funds — 9.0% (Continued) | | | | |
| | 6,729 | | | Invesco Municipal Trust±† | | $ | 78,729 | |
| | 1,346,800 | | | Invesco Senior Income Trust± | | | 4,336,696 | |
| | 63,539 | | | Nuveen AMT-Free Quality Municipal Income Fund± | | | 860,318 | |
| | 1,479,116 | | | Nuveen Credit Strategies Income Fund± | | | 8,386,588 | |
| | 226,364 | | | Wells Fargo Income Opportunities Fund± | | | 1,444,202 | |
| | 280,052 | | | Western Asset High Income Fund II, Inc.± | | | 1,403,060 | |
| | 124,788 | | | Western Asset High Yield Defined Opportunity Fund,Inc.± | | | 1,538,636 | |
| | 1,873,035 | | | Western Asset High, Income Opportunity Fund Inc.± | | | 7,885,477 | |
| | | | | Total Investment Funds | | $ | 57,843,552 | |
| | Principal | | | | | | | |
| | Amount | | | | | | | |
| | | | | | | | | |
| | | | | Non-Agency Collateralized Mortgage Obligations — 4.9% | | | | |
| $ | 628,266 | | | American Home Mortgage Investment Trust, Ser 2004-4, Class 4A, (6M LIBOR +2.000%),3.533%, 2/25/45(B) | | | 604,295 | |
| | 4,245,729 | | | Bear Stearns ALT-A Trust, Ser 2004-12, Class 1M1, (1M LIBOR +0.930%), 1.877%, 1/25/35(B) | | | 3,526,599 | |
| | 80,604 | | | Bear Stearns Asset Backed Securities Trust, Ser 2003-AC7, Class A2, 5.750%, 1/25/34(B)(C) | | | 76,742 | |
| | 4,955,882 | | | Citigroup Mortgage Loan Trust, Inc., Ser 2018-RP1,Class A1, 144a, 3.000%, 9/25/64(B)(C) | | | 4,936,292 | |
| | 682,390 | | | GSR Mortgage Loan Trust, Ser 2005-AR4, Class 6A1, 4.655%, 7/25/35(B)(C) | | | 581,364 | |
| | 5,956 | | | Merrill Lynch Mortgage Investors Trust, Ser 2003-A1, Class 2A, (12M LIBOR +1.625%),3.162%, 12/25/32(B) | | | 5,037 | |
| | 4,047,147 | | | Metlife Securitization Trust, Ser 2017-1A, Class A, 144a, 3.000%, 4/25/55(B)(C) | | | 4,004,820 | |
| | 212,072 | | | Morgan Stanley Mortgage Loan Trust, Ser 2004-7AR, Class 2A6, 3.948%, 9/25/34(B)(C) | | | 188,294 | |
| | 2,196,295 | | | Morgan Stanley Mortgage Loan Trust, Ser 2005-5AR, Class 1M1, (1M LIBOR +0.750%),1.697%, 9/25/35(B) | | | 2,172,724 | |
| | 2,621,820 | | | New Residential Mortgage Loan Trust, Ser 2017-2A, Class A3, 144a, 4.000%, 3/25/57(B)(C) | | | 2,722,814 | |
| | 4,116,814 | | | New Residential Mortgage Trust, Ser 2018-1A, Class A1A, 144a, 4.000%, 12/25/57(B)(C) | | | 4,256,450 | |
| | 11,974 | | | RALI Trust, Ser 2004-QS6, Class A1, 5.000%, 5/25/19 | | | 11,543 | |
| | 3,995,100 | | | RMF Buyout Issuance Trust, Ser 2020-1, Class A, 144a,2.158%, 2/25/30(B)(C) | | | 3,812,356 | |
| | 4,426,981 | | | Sequoia Mortgage Trust, Ser 2013-9, Class B1, 144a, 3.500%, 7/25/43 | | | 4,204,108 | |
| | | | | Total Non-Agency Collateralized Mortgage Obligations | | $ | 31,103,438 | |
| | | | | | | | | |
| | | | | Commercial Mortgage-Backed Securities — 4.3% | | | | |
| | 30,100,000 | | | BANK, Ser 2020-BN26, Class XA, 1.357%, 3/15/63(B)(C)(D) | | | 2,665,858 | |
| | 10,000,000 | | | BXMT Ltd., Ser 2020-FL2, Class A, (Cayman Islands),144a, (1M LIBOR +0.900%), 1.700%, 2/16/37(B) | | | 8,553,850 | |
| | 3,672,651 | | | Harvest Commercial Capital Loan Trust, Ser 2019-1, Class A, 144a, 3.290%, 9/25/46(B)(C) | | | 3,393,836 | |
| | 6,808,229 | | | Velocity Commercial Capital Loan Trust, Ser 2019-2,Class A, 144a, 3.130%, 7/25/49(B)(C) | | | 6,216,323 | |
| | 6,711,807 | | | Velocity Commercial Capital Loan Trust, Ser 2020-1, Class AFX, 144a, 2.610%, 2/25/50(B)(C) | | | 6,265,304 | |
| | | | | Total Commercial Mortgage-Backed Securities | | $ | 27,095,171 | |
| | | | | Agency Collateralized Mortgage Obligations — 1.9% | | | | |
| 7,216,279 | | | GNMA, Ser 2012-147, Class IO, 0.560%, 4/16/54(B)(C)(D) | | | 220,535 | |
| | 30,353,276 | | | GNMA, Ser 2016-110, Class IO, 1.012%, 5/16/58(B)(C)(D) | | | 1,936,800 | |
| | 36,526,593 | | | GNMA, Ser 2016-158, Class IO, 0.898%, 6/16/58(B)(C)(D) | | | 2,184,217 | |
| | 41,682,319 | | | GNMA, Ser 2016-52, Class IO, 0.914%, 3/16/58(B)(C)(D) | | | 2,428,062 | |
| | 41,632,453 | | | GNMA, Ser 2017-76, Class IO, 0.952%, 12/16/56(B)(C)(D) | | | 2,675,164 | |
| | 47,444,336 | | | GNMA, Ser 2017-94, Class IO, 0.659%, 2/16/59(B)(C)(D) | | | 2,490,543 | |
| | | | | Total Agency Collateralized Mortgage Obligations | | $ | 11,935,321 | |
| | | Number | | | | | | | |
| | | of | | | Notional | | | | |
| | | Contracts | | | Amount | | | | |
| Purchased Call Option — 0.0% | | | | | | | | | | | | |
| Alerian MLP ETF, Strike @8.00, Exp 04/20 | | | 20,000 | | | $ | 6,880,000 | | | $ | — | |
| Shares | | | | | | |
| | | | | | | |
| | | | | Short-Term Investment Funds — 5.9% | | | | |
| | 37,877,306 | | | Dreyfus Government Cash Management,Institutional Shares, 0.29%∞Ω | | | 37,877,306 | |
| | 66,255 | | | Invesco Government & Agency Portfolio,Institutional Class, 0.43%**∞Ω | | | 66,255 | |
| | | | | Total Short-Term Investment Funds | | $ | 37,943,561 | | |
| | | | |
| Total Investment Securities — 98.4% | | | | |
| (Cost $687,436,547) | | $ | 630,361,510 | |
| | | | | |
| Other Assets in Excess of Liabilities — 1.6% | | | 10,573,285 | |
| Net Assets — 100.0% | | $ | 640,934,795 | |
| (A) | Perpetual Bond - A bond or preferred stock with no definite maturity date. |
| (B) | Variable rate security - Rate reflected is the rate in effect as of March 31, 2020. |
| (C) | Certain variable rate securities are not based on a published reference rate and spread but are determined by the issuer or agent and are based on current market conditions. These securities do not indicate a reference rate and spread in their description. |
| (D) | Interest only security - This type of security represents the right to receive the monthly interest payments on an underlying pool of mortgages. Payments of principal on the pool reduce the value of the “interest only” holding. |
| # | Zero coupon bond - Rate shown reflects effective yield to maturity at time of purchase. |
| ** | Represents collateral for securities loaned. |
| ± | Closed-End Fund. |
| † | All or a portion of the security is on loan. The total market value of the securities on loan as of March 31, 2020 was $66,471. |
| ∞ | Open-End Fund. |
| Ω | Represents the 7-day SEC yield as of March 31, 2020. |
Portfolio Abbreviations:
CLO - Collateralized Loan Obligation
ETF - Exchange-Traded Fund
GNMA - Government National Mortgage Association
LIBOR - London Interbank Offered Rate
LLC - Limited Liability Company
LP - Limited Partnership
144a - This is a restricted security that was sold in a transaction qualifying for the exemption under Rule 144a of the Securities Act of 1933. This security may be sold in transactions exempt from registration, normally to qualified institutional buyers. At March 31, 2020, these securities were valued at $140,123,112 or 21.9% of net assets. These securities were deemed liquid pursuant to procedures approved by the Board of Trustees.
Touchstone Flexible Income Fund(Continued)
Other Information:
The inputs or methodology used for valuing securities may not be an indication of the risk associated with investing in those securities. For more information on valuation inputs, and their aggregation into the levels used in the table below, please refer to the security valuation section in the accompanying Notes to Financial Statements.
Valuation inputs at Reporting Date:
| Description | | Level 1 | | | Level 2 | | | | Level 3 | | | | Total | |
| Corporate Bonds | | $ | — | | | $ | 149,486,460 | | | $ | — | | | $ | 149,486,460 | |
| Preferred Stocks | | | 123,211,912 | | | | — | | | | — | | | | 123,211,912 | |
| Asset-Backed Securities | | | — | | | | 97,367,750 | | | | — | | | | 97,367,750 | |
| U.S. Treasury Obligations | | | — | | | | 94,374,345 | | | | — | | | | 94,374,345 | |
| Investment Funds | | | 57,843,552 | | | | — | | | | — | | | | 57,843,552 | |
| Non-Agency Collateralized Mortgage Obligations | | | — | | | | 31,103,438 | | | | — | | | | 31,103,438 | |
| Commercial Mortgage-Backed Securities | | | — | | | | 27,095,171 | | | | — | | | | 27,095,171 | |
| Agency Collateralized Mortgage Obligations | | | — | | | | 11,935,321 | | | | — | | | | 11,935,321 | |
| Purchased Options Equity Contracts | | | — | | | | — | | | | — | | | | — | |
| Short-Term Investment Funds | | | 37,943,561 | | | | — | | | | — | | | | 37,943,561 | |
| Total | | $ | 218,999,025 | | | $ | 411,362,485 | | | $ | — | | | $ | 630,361,510 | |
See accompanying Notes to Financial Statements.
Portfolio of Investments
Touchstone Focused Fund –March 31, 2020
| | | | | | Market | |
| | | Shares | | | Value | |
| Common Stocks — 100.1% | | | | | | | | |
| Information Technology — 24.6% | | | | | | | | |
| Apple, Inc. | | | 159,817 | | | $ | 40,639,865 | |
| Avnet, Inc. | | | 277,874 | | | | 6,974,637 | |
| International Business Machines Corp. | | | 115,125 | | | | 12,770,816 | |
| Microsoft Corp. | | | 349,877 | | | | 55,179,102 | |
| Oracle Corp. | | | 432,705 | | | | 20,912,633 | |
| salesforce.com, Inc.* | | | 199,829 | | | | 28,771,379 | |
| Texas Instruments, Inc. | | | 102,479 | | | | 10,240,726 | |
| Workday, Inc. - Class A* | | | 61,016 | | | | 7,945,504 | |
| | | | | | | | 183,434,662 | |
| Communication Services — 19.2% | | | | | | | | |
| Alphabet, Inc. - Class A* | | | 4,209 | | | | 4,890,648 | |
| Alphabet, Inc. - Class C* | | | 34,961 | | | | 40,653,000 | |
| Baidu, Inc. (China) ADR* | | | 36,695 | | | | 3,698,489 | |
| Comcast Corp. - Class A | | | 658,008 | | | | 22,622,315 | |
| Facebook, Inc. - Class A* | | | 232,753 | | | | 38,823,200 | |
| Fox Corp. - Class A | | | 289,405 | | | | 6,838,640 | |
| Netflix, Inc.* | | | 35,828 | | | | 13,453,414 | |
| Walt Disney Co. (The) | | | 127,711 | | | | 12,336,883 | |
| | | | | | | | 143,316,589 | |
| Financials — 15.5% | | | | | | | | |
| Bank of America Corp. | | | 987,717 | | | | 20,969,232 | |
| Berkshire Hathaway, Inc. - Class B* | | | 350,946 | | | | 64,163,457 | |
| Goldman Sachs Group, Inc. (The) | | | 116,068 | | | | 17,942,952 | |
| Signature Bank/NewYork NY | | | 151,058 | | | | 12,143,553 | |
| | | | | | | | 115,219,194 | |
| Health Care — 12.2% | | | | | | | | |
| AmerisourceBergen Corp. | | | 86,652 | | | | 7,668,702 | |
| Bio-Rad Laboratories, Inc. - Class A* | | | 34,097 | | | | 11,953,044 | |
| Bristol-Myers Squibb Co. | | | 297,102 | | | | 16,560,466 | |
| Johnson & Johnson | | | 191,981 | | | | 25,174,469 | |
| Novartis AG (Switzerland) ADR | | | 128,455 | | | | 10,591,115 | |
| UnitedHealth Group, Inc. | | | 76,711 | | | | 19,130,189 | |
| | | | | | | | 91,077,985 | |
| Consumer Discretionary — 10.4% | | | | | | | | |
| Alibaba Group Holding Ltd. (China) ADR* | | | 65,390 | | | | 12,717,047 | |
| Amazon.com, Inc.* | | | 20,353 | | | | 39,682,651 | |
| JD.com, Inc. (China) ADR* | | | 221,263 | | | | 8,961,152 | |
| Starbucks Corp. | | | 95,848 | | | | 6,301,048 | |
| Trip.com Group Ltd. (China) ADR* | | | 214,783 | | | | 5,036,661 | |
| Yum China Holdings, Inc. (China) | | | 120,727 | | | | 5,146,592 | |
| | | | | | | | 77,845,151 | |
| Industrials — 9.1% | | | | | | | | |
| Deere & Co. | | | 97,091 | | | | 13,414,093 | |
| FedEx Corp. | | | 52,884 | | | | 6,412,714 | |
| General Electric Co. | | | 443,698 | | | | 3,522,962 | |
| Hubbell, Inc. | | | 100,662 | | | | 11,549,958 | |
| Parker-Hannifin Corp. | | | 34,802 | | | | 4,514,863 | |
| Union Pacific Corp. | | | 93,849 | | | | 13,236,463 | |
| United Technologies Corp.* | | | 163,548 | | | | 15,427,483 | |
| | | | | | | | 68,078,536 | |
| Real Estate — 3.7% | | | | | | | | |
| Americold Realty Trust REIT | | | 273,955 | | | | 9,325,428 | |
| Jones Lang LaSalle, Inc. | | | 181,925 | | | | 18,370,787 | |
| | | | | | | | 27,696,215 | |
| Consumer Staples — 2.9% | | | | | | | | |
| Monster Beverage Corp.* | | | 216,813 | | | | 12,197,899 | |
| Philip Morris International, Inc. | | | 131,288 | | | | 9,578,772 | |
| | | | | | | | 21,776,671 | |
| Energy — 1.7% | | | | | | | | |
| Exxon Mobil Corp. | | | 225,353 | | | | 8,556,653 | |
| Schlumberger Ltd. | | | 275,554 | | | | 3,717,223 | |
| | | | | | | | 12,273,876 | |
| Materials — 0.8% | | | | | | | | |
| DuPont de Nemours, Inc. | | | 174,580 | | | | 5,953,178 | |
| Total Common Stocks | | | | | | $ | 746,672,057 | |
| | | | | | | | | |
| Short-Term Investment Fund — 0.0% | | | | | | | | |
| Dreyfus Government Cash Management, InstitutionalShares, 0.29%∞Ω | | | 70 | | | $ | 70 | |
| | | | | | | | | |
| Total Investment Securities —100.1% | | | | | | | | |
| (Cost $596,127,272) | | | | | | $ | 746,672,127 | |
| Liabilities in Excess of Other Assets — (0.1%) | | | | | | | (621,749 | ) |
| | | | | | | | | |
| Net Assets — 100.0% | | | | | | $ | 746,050,378 | |
| * | Non-income producing security. | | | |
| ∞ | Open-End Fund. | | | |
| Ω | Represents the 7-day SEC yield as of March 31, 2020. | | | |
Portfolio Abbreviations:
ADR - American Depositary Receipt
REIT - Real Estate Investment Trust
Other Information:
The inputs or methodology used for valuing securities may not be an indication of the risk associated with investing in those securities. For more information on valuation inputs, and their aggregation into the levels used in the table below, please refer to the security valuation section in the accompanying Notes to Financial Statements.
| Valuation inputs at Reporting Date: |
| |
| Description | | | Level 1 | | | | Level 2 | | | | Level 3 | | | | Total | |
| Common Stocks | | $ | 746,672,057 | | | $ | — | | | $ | — | | | $ | 746,672,057 | |
| Short-Term Investment Fund | | | 70 | | | | — | | | | — | | | | 70 | |
| | | | | | | | | | | | | | | | | |
| Total | | $ | 746,672,127 | | | $ | — | | | $ | — | | | $ | 746,672,127 | |
See accompanying Notes to Financial Statements.
Portfolio of Investments
Touchstone Global ESG Equity Fund–March 31, 2020
| | | | | | Market | |
| | | Shares | | | Value | |
| Common Stocks — 98.0% | | | | | | | | |
| United States — 48.4% | | | | | | | | |
| Communication Services — 15.9% | | | | | | | | |
| Alphabet, Inc. - Class A* | | | 11,263 | | | $ | 13,087,043 | |
| Comcast Corp. - Class A | | | 416,360 | | | | 14,314,457 | |
| Facebook, Inc. - Class A* | | | 145,998 | | | | 24,352,466 | |
| Verizon Communications, Inc. | | | 390,842 | | | | 20,999,941 | |
| Walt Disney Co. (The) | | | 89,917 | | | | 8,685,982 | |
| | | | | | | | | |
| Consumer Discretionary — 3.0% | | | | | | | | |
| Amazon.com, Inc.* | | | 8,001 | | | | 15,599,710 | |
| | | | | | | | | |
| Consumer Staples — 0.5% | | | | | | | | |
| Walgreens Boots Alliance, Inc. | | | 55,769 | | | | 2,551,432 | |
| | | | | | | | | |
| Energy — 0.5% | | | | | | | | |
| ConocoPhillips | | | 81,965 | | | | 2,524,522 | |
| | | | | | | | | |
| Financials — 6.3% | | | | | | | | |
| Aflac, Inc. | | | 256,290 | | | | 8,775,370 | |
| Fifth Third Bancorp | | | 226,241 | | | | 3,359,679 | |
| First Horizon National Corp. | | | 295,977 | | | | 2,385,575 | |
| Progressive Corp. (The) | | | 237,992 | | | | 17,573,329 | |
| | | | | | | | | |
| Health Care — 7.6% | | | | | | | | |
| Alnylam Pharmaceuticals, Inc.* | | | 39,126 | | | | 4,258,865 | |
| Becton Dickinson & Co. | | | 38,234 | | | | 8,785,026 | |
| Cerner Corp. | | | 149,134 | | | | 9,393,951 | |
| Illumina, Inc.* | | | 18,653 | | | | 5,094,507 | |
| Ionis Pharmaceuticals, Inc.* | | | 75,746 | | | | 3,581,271 | |
| Neurocrine Biosciences, Inc.* | | | 34,765 | | | | 3,008,911 | |
| Regeneron Pharmaceuticals, Inc.* | | | 10,540 | | | | 5,146,577 | |
| | | | | | | | | |
| Industrials — 2.2% | | | | | | | | |
| Deere & Co. | | | 57,498 | | | | 7,943,924 | |
| Hexcel Corp. | | | 87,474 | | | | 3,253,158 | |
| | | | | | | | | |
| Information Technology — 12.4% | | | | | | | | |
| Apple, Inc. | | | 73,957 | | | | 18,806,526 | |
| Applied Materials, Inc. | | | 118,999 | | | | 5,452,534 | |
| Micron Technology, Inc.* | | | 170,282 | | | | 7,162,061 | |
| Microsoft Corp. | | | 150,615 | | | | 23,753,492 | |
| Visa, Inc. - Class A | | | 51,939 | | | | 8,368,412 | |
| Total United States | | | | | | | 248,218,721 | |
| | | | | | | | | |
| Japan — 9.2% | | | | | | | | |
| Communication Services — 2.9% | | | | | | | | |
| KDDI Corp. | | | 505,700 | | | | 14,937,667 | |
| | | | | | | | | |
| Consumer Discretionary — 2.0% | | | | | | | | |
| Sony Corp. | | | 168,500 | | | | 9,980,858 | |
| | | | | | | | | |
| Health Care — 0.9% | | | | | | | | |
| Eisai Co. Ltd. | | | 65,300 | | | | 4,776,527 | |
| | | | | | | | | |
| Industrials — 1.6% | | | | | | | | |
| Amada Holdings Co. Ltd. | | | 502,100 | | | | 3,935,419 | |
| Mitsubishi Electric Corp. | | | 335,900 | | | | 4,103,428 | |
| | | | | | | | | |
| Information Technology — 1.8% | | | | | | | | |
| Kyocera Corp. | | | 158,800 | | | | 9,370,914 | |
| Total Japan | | | | | | | 47,104,813 | |
| | | | | | | | | |
| France — 8.2% | | | | | | | | |
| Communication Services — 0.7% | | | | | | | | |
| Ubisoft Entertainment SA* | | | 51,939 | | | | 3,796,276 | |
| | | | | | | | | |
| Energy—2.5% | | | | | | | | |
| TOTAL SA† | | | 345,107 | | | | 13,003,224 | |
| | | | | | | | | |
| Industrials—5.0% | | | | | | | | |
| Cie de Saint-Gobain | | | 361,354 | | | | 8,670,847 | |
| Schneider Electric SE | | | 197,522 | | | | 16,695,136 | |
| Total France | | | | | | | 42,165,483 | |
| | | | | | | | | |
| United Kingdom — 7.8% | | | | | | | | |
| Consumer Staples — 0.5% | | | | | | | | |
| Reckitt Benckiser Group PLC | | | 34,171 | | | $ | 2,602,996 | |
| | | | | | | | | |
| Financials — 4.4% | | | | | | | | |
| Lloyds Banking Group PLC | | | 22,653,068 | | | | 8,856,267 | |
| Willis Towers Watson PLC | | | 79,589 | | | | 13,518,192 | |
| | | | | | | | | |
| Health Care — 2.9% | | | | | | | | |
| GlaxoSmithKline PLC ADR | | | 399,160 | | | | 15,124,172 | |
| Total United Kingdom | | | | | | | 40,101,627 | |
| | | | | | | | | |
| Germany — 7.7% | | | | | | | | |
| Consumer Discretionary — 0.8% | | | | | | | | |
| Continental AG | | | 56,166 | | | | 4,004,540 | |
| | | | | | | | | |
| Industrials — 2.7% | | | | | | | | |
| Deutsche Post AG | | | 386,844 | | | | 10,370,755 | |
| KION Group AG | | | 74,233 | | | | 3,194,836 | |
| | | | | | | | | |
| Materials — 1.6% | | | | | | | | |
| HeidelbergCement AG | | | 195,042 | | | | 8,332,796 | |
| | | | | | | | | |
| Real Estate — 2.6% | | | | | | | | |
| Vonovia SE | | | 270,020 | | | | 13,359,535 | |
| Total Germany | | | | | | | 39,262,462 | |
| | | | | | | | | |
| Switzerland — 3.5% | | | | | | | | |
| Health Care — 2.4% | | | | | | | | |
| Novartis AG | | | 149,448 | | | | 12,398,361 | |
| | | | | | | | | |
| Information Technology — 1.1% | | | | | | | | |
| TE Connectivity Ltd. | | | 86,167 | | | | 5,426,798 | |
| Total Switzerland | | | | | | | 17,825,159 | |
| | | | | | | | | |
| China — 2.8% | | | | | | | | |
| Communication Services — 1.9% | | | | | | | | |
| Tencent Holdings Ltd. | | | 199,300 | | | | 9,850,923 | |
| | | | | | | | | |
| Consumer Discretionary — 0.9% | | | | | | | | |
| Shenzhou International Group Holdings Ltd. | | | 449,500 | | | | 4,715,284 | |
| Total China | | | | | | | 14,566,207 | |
| | | | | | | | | |
| Italy — 2.4% | | | | | | | | |
| Utilities — 2.4% | | | | | | | | |
| Enel SpA | | | 1,759,732 | | | | 12,138,363 | |
| | | | | | | | | |
| Canada — 2.1% | | | | | | | | |
| Financials — 1.2% | | | | | | | | |
| Intact Financial Corp. | | | 67,258 | | | | 5,812,968 | |
| | | | | | | | | |
| Materials — 0.9% | | | | | | | | |
| Agnico Eagle Mines Ltd. | | | 120,162 | | | | 4,781,246 | |
| Total Canada | | | | | | | 10,594,214 | |
| | | | | | | | | |
| Ireland — 1.5% | | | | | | | | |
| Health Care — 1.5% | | | | | | | | |
| Medtronic PLC | | | 83,381 | | | | 7,519,298 | |
| | | | | | | | | |
| Hong Kong — 1.3% | | | | | | | | |
| Financials — 1.3% | | | | | | | | |
| AIA Group Ltd. | | | 752,400 | | | | 6,737,472 | |
| | | | | | | | | |
| Sweden — 1.2% | | | | | | | | |
| Financials — 1.2% | | | | | | | | |
| Swedbank AB - Class A† | | | 580,863 | | | | 6,406,473 | |
| | | | | | | | | |
| South Korea—0.8% | | | | | | | | |
| Communication Services — 0.8% | | | | | | | | |
| KT Corp. ADR* | | | 536,131 | | | | 4,171,099 | |
| | | | | | | | | |
| Indonesia — 0.6% | | | | | | | | |
| Financials — 0.6% | | | | | | | | |
| Bank Rakyat Indonesia Persero Tbk PT | | | 18,022,200 | | | | 3,305,365 | |
Touchstone Global ESG Equity Fund (Continued)
| | | | | | Market | |
| | | Shares | | | Value | |
| Common Stocks — 98.0% (Continued) | | | | | | | | |
| India — 0.5% | | | | | | | | |
| Financials — 0.5% | | | | | | | | |
| ICICI Bank Ltd. ADR | | | 327,090 | | | $ | 2,780,265 | |
| Total Common Stocks | | | | | | $ | 502,897,021 | |
| | | | | | | | | |
| Short-Term Investment Funds — 5.9% | | | | | | | | |
| Dreyfus Government Cash Management, Institutional | | | | | | | | |
| Shares, 0.29%∞Ω | | | 10,244,328 | | | | 10,244,328 | |
| Invesco Government & Agency Portfolio, Institutional | | | | | | | | |
| Class, 0.43%**∞Ω | | | 19,738,050 | | | | 19,738,050 | |
| Total Short-Term Investment Funds | | | | | | $ | 29,982,378 | |
| | | | | | | | | |
| Total Investment Securities —103.9% | | | | | | | | |
| (Cost $529,210,138) | | | | | | $ | 532,879,399 | |
| | | | | | | | | |
| Liabilities in Excess of Other Assets — (3.9%) | | | | | | | (19,781,326 | ) |
| | | | | | | | | |
| Net Assets — 100.0% | | | | | | $ | 513,098,073 | |
| * | Non-income producing security. |
| ** | Represents collateral for securities loaned. |
| † | All or a portion of the security is on loan. The total market value of the securities on loan as of March 31, 2020 was $19,177,539. |
| ∞ | Open-End Fund. |
| Ω | Represents the 7-day SEC yield as of March 31, 2020. |
Portfolio Abbreviations:
ADR - American Depositary Receipt
PLC - Public Limited Company
Other Information:
The inputs or methodology used for valuing securities may not be an indication of the risk associated with investing in those securities. For more information on valuation inputs, and their aggregation into the levels used in the table below, please refer to the security valuation section in the accompanying Notes to Financial Statements.
| Valuation inputs at Reporting Date: | |
| | |
| Description | | Level 1 | | | Level 2 | | | | Level 3 | | | Total | |
| Common Stocks | | | | | | | | | | | | | | | | |
| United States | | $ | 248,218,721 | | | $ | — | | | $ | — | | | $ | 248,218,721 | |
| Japan | | | — | | | | 47,104,813 | | | | — | | | | 47,104,813 | |
| France | | | — | | | | 42,165,483 | | | | — | | | | 42,165,483 | |
| United Kingdom | | | 28,642,364 | | | | 11,459,263 | | | | — | | | | 40,101,627 | |
| Germany | | | 13,359,535 | | | | 25,902,927 | | | | — | | | | 39,262,462 | |
| Switzerland | | | 17,825,159 | | | | — | | | | — | | | | 17,825,159 | |
| China | | | — | | | | 14,566,207 | | | | — | | | | 14,566,207 | |
| Italy | | | — | | | | 12,138,363 | | | | — | | | | 12,138,363 | |
| Canada | | | 10,594,214 | | | | — | | | | — | | | | 10,594,214 | |
| Ireland | | | 7,519,298 | | | | — | | | | — | | | | 7,519,298 | |
| Hong Kong | | | — | | | | 6,737,472 | | | | — | | | | 6,737,472 | |
| Sweden | | | — | | | | 6,406,473 | | | | — | | | | 6,406,473 | |
| South Korea | | | 4,171,099 | | | | — | | | | — | | | | 4,171,099 | |
| Indonesia | | | — | | | | 3,305,365 | | | | — | | | | 3,305,365 | |
| India | | | 2,780,265 | | | | — | | | | — | | | | 2,780,265 | |
| Short-Term Investment Funds | | | 29,982,378 | | | | — | | | | — | | | | 29,982,378 | |
| Total | | $ | 363,093,033 | | | $ | 169,786,366 | | | $ | — | | | $ | 532,879,399 | |
See accompanying Notes to Financial Statements.
Portfolio of Investments
Touchstone Growth Opportunities Fund – March 31, 2020
| | | | | | Market | |
| | | Shares | | | Value | |
| Common Stocks — 98.1% | | | | | | | | |
| Information Technology — 38.6% | | | | | | | | |
| Apple, Inc. | | | 44,092 | | | $ | 11,212,155 | |
| Applied Materials, Inc. | | | 49,670 | | | | 2,275,879 | |
| Broadcom, Inc. | | | 8,880 | | | | 2,105,448 | |
| Cisco Systems, Inc. | | | 69,520 | | | | 2,732,831 | |
| Cognizant Technology Solutions Corp. - Class A | | | 36,410 | | | | 1,691,973 | |
| Fidelity National Information Services, Inc. | | | 36,769 | | | | 4,472,581 | |
| Global Payments, Inc. | | | 21,467 | | | | 3,096,186 | |
| Microsoft Corp. | | | 55,959 | | | | 8,825,294 | |
| NVIDIA Corp. | | | 6,740 | | | | 1,776,664 | |
| PayPal Holdings, Inc.* | | | 34,580 | | | | 3,310,689 | |
| Proofpoint, Inc.* | | | 24,689 | | | | 2,532,845 | |
| salesforce.com, Inc.* | | | 28,888 | | | | 4,159,294 | |
| Science Applications International Corp. | | | 24,350 | | | | 1,817,240 | |
| ServiceNow, Inc.* | | | 14,231 | | | | 4,078,320 | |
| Visa, Inc. - Class A | | | 37,612 | | | | 6,060,046 | |
| Zendesk, Inc.* | | | 43,158 | | | | 2,762,544 | |
| | | | | | | | 62,909,989 | |
| Health Care — 17.5% | | | | | | | | |
| Amedisys, Inc.* | | | 8,554 | | | | 1,570,001 | |
| Ascendis Pharma A/S (Denmark) ADR* | | | 29,835 | | | | 3,359,719 | |
| Bio-Rad Laboratories, Inc. - Class A* | | | 8,975 | | | | 3,146,276 | |
| Bristol-Myers Squibb Co. | | | 59,896 | | | | 3,338,603 | |
| Humana, Inc. | | | 11,950 | | | | 3,752,539 | |
| Novartis AG (Switzerland) ADR | | | 45,730 | | | | 3,770,438 | |
| Seattle Genetics, Inc.* | | | 16,400 | | | | 1,892,232 | |
| Thermo Fisher Scientific, Inc. | | | 10,802 | | | | 3,063,447 | |
| Vertex Pharmaceuticals, Inc.* | | | 19,255 | | | | 4,581,727 | |
| | | | | | | | 28,474,982 | |
| Communication Services — 13.0% | | | | | | | | |
| Alphabet, Inc. - Class A* | | | 7,861 | | | | 9,134,089 | |
| Charter Communications, Inc. - Class A* | | | 7,888 | | | | 3,441,613 | |
| Facebook, Inc. - Class A* | | | 41,779 | | | | 6,968,737 | |
| T-Mobile US, Inc.* | | | 19,100 | | | | 1,602,490 | |
| | | | | | | | 21,146,929 | |
| Consumer Discretionary — 12.0% | | | | | | | | |
| Amazon.com, Inc.* | | | 5,433 | | | | 10,592,829 | |
| Home Depot, Inc. (The) | | | 25,684 | | | | 4,795,460 | |
| NIKE, Inc. - Class B | | | 30,930 | | | | 2,559,148 | |
| TopBuild Corp.* | | | 21,944 | | | | 1,572,068 | |
| | | | | | | | 19,519,505 | |
| Industrials — 9.0% | | | | | | | | |
| AMETEK, Inc. | | | 34,011 | | | | 2,449,472 | |
| Illinois Tool Works, Inc. | | | 15,664 | | | | 2,226,168 | |
| L3Harris Technologies, Inc. | | | 14,750 | | | | 2,656,770 | |
| Trane Technologies PLC | | | 29,946 | | | | 2,473,240 | |
| TransDigm Group, Inc. | | | 5,863 | | | | 1,877,274 | |
| Union Pacific Corp. | | | 20,917 | | | | 2,950,134 | |
| | | | | | | | 14,633,058 | |
| Financials — 6.6% | | | | | | | | |
| Blackstone Group, Inc. (The) - Class A | | | 36,522 | | | | 1,664,308 | |
| Citigroup, Inc. | | | 36,010 | | | | 1,516,741 | |
| LPL Financial Holdings, Inc. | | | 28,690 | | | | 1,561,597 | |
| S&P Global, Inc. | | | 13,236 | | | | 3,243,482 | |
| Willis Towers Watson PLC | | | 16,180 | | | | 2,748,173 | |
| | | | | | | | 10,734,301 | |
| Consumer Staples — 1.4% | | | | | | | | |
| Constellation Brands, Inc. - Class A | | | 16,520 | | | | 2,368,307 | |
| Total Common Stocks | | | | | | $ | 159,787,071 | |
| | | | | | | | | |
| Short-Term Investment Fund — 1.9% | | | | | | | | |
| Dreyfus Government Cash Management, Institutional | | | | | | | | |
| Shares, 0.29%∞Ω | | | 3,041,640 | | | $ | 3,041,640 | |
| | | | | | | | | |
| Total Investment Securities —100.0% | | | | | | | | |
| (Cost $142,346,995) | | | | | | $ | 162,828,711 | |
| | | | | | | | | |
| Other Assets in Excess of Liabilities — 0.0% | | | | | | | 15,446 | |
| | | | | | | | | |
| Net Assets — 100.0% | | | | | | $ | 162,844,157 | |
* Non-income producing security.
∞ Open-End Fund.
Ω Represents the 7-day SEC yield as of March 31, 2020.
Portfolio Abbreviations:
ADR - American Depositary Receipt
PLC - Public Limited Company
Other Information:
The inputs or methodology used for valuing securities may not be an indication of the risk associated with investing in those securities. For more information on valuation inputs, and their aggregation into the levels used in the table below, please refer to the security valuation section in the accompanying Notes to Financial Statements.
Valuation inputs at Reporting Date:
| Description | | Level 1 | | | Level 2 | | | Level 3 | | | Total | |
| Common Stocks | | $ | 159,787,071 | | | $ | — | | | $ | — | | | $ | 159,787,071 | |
| Short-Term Investment Fund | | | 3,041,640 | | | | — | | | | — | | | | 3,041,640 | |
| | | | | | | | | | | | | | | | | |
| Total | | $ | 162,828,711 | | | $ | — | | | $ | — | | | $ | 162,828,711 | |
See accompanying Notes to Financial Statements.
Portfolio of Investments
Touchstone Mid Cap Growth Fund – March 31, 2020
| | | | | | Market | |
| | | Shares | | | Value | |
| Common Stocks — 98.9% | | | | | | | | |
| Information Technology — 34.7% | | | | | | | | |
| Applied Materials, Inc. | | | 348,241 | | | $ | 15,956,403 | |
| Cognizant Technology Solutions Corp. - Class A | | | 408,690 | | | | 18,991,824 | |
| Fidelity National Information Services, Inc. | | | 215,140 | | | | 26,169,630 | |
| Fiserv, Inc.* | | | 267,860 | | | | 25,444,021 | |
| FleetCor Technologies, Inc.* | | | 66,585 | | | | 12,420,766 | |
| Fortinet, Inc.* | | | 260,802 | | | | 26,385,338 | |
| Global Payments, Inc. | | | 248,830 | | | | 35,888,751 | |
| Microchip Technology, Inc. | | | 201,277 | | | | 13,646,581 | |
| Micron Technology, Inc.* | | | 290,558 | | | | 12,220,870 | |
| NCR Corp.* | | | 400,948 | | | | 7,096,780 | |
| Nice Ltd. (Israel) ADR* | | | 138,373 | | | | 19,864,828 | |
| ServiceNow, Inc.* | | | 86,680 | | | | 24,840,756 | |
| Splunk, Inc.* | | | 227,350 | | | | 28,698,390 | |
| Square, Inc. - Class A* | | | 170,290 | | | | 8,919,790 | |
| SS&C Technologies Holdings, Inc. | | | 509,320 | | | | 22,318,402 | |
| Twilio, Inc. - Class A* | | | 187,160 | | | | 16,748,948 | |
| Xilinx, Inc. | | | 229,810 | | | | 17,911,391 | |
| Zendesk, Inc.* | | | 418,500 | | | | 26,788,185 | |
| | | | | | | | 360,311,654 | |
| Health Care — 21.5% | | | | | | | | |
| Ascendis Pharma A/S (Denmark) ADR* | | | 232,260 | | | | 26,154,799 | |
| BioMarin Pharmaceutical, Inc.* | | | 314,190 | | | | 26,549,055 | |
| Cooper Cos., Inc. (The) | | | 75,479 | | | | 20,807,296 | |
| DexCom, Inc.* | | | 111,680 | | | | 30,072,074 | |
| ICON PLC (Ireland)* | | | 141,440 | | | | 19,235,840 | |
| IDEXX Laboratories, Inc.* | | | 107,238 | | | | 25,977,333 | |
| Masimo Corp.* | | | 84,070 | | | | 14,890,478 | |
| Mettler-Toledo International, Inc.* | | | 28,194 | | | | 19,468,239 | |
| Seattle Genetics, Inc.* | | | 163,232 | | | | 18,833,708 | |
| STERIS PLC | | | 149,729 | | | | 20,957,568 | |
| | | | | | | | 222,946,390 | |
| Industrials — 17.0% | | | | | | | | |
| AMETEK, Inc. | | | 227,050 | | | | 16,352,141 | |
| CoStar Group, Inc.* | | | 21,168 | | | | 12,430,061 | |
| JB Hunt Transport Services, Inc. | | | 200,506 | | | | 18,492,668 | |
| L3Harris Technologies, Inc. | | | 157,097 | | | | 28,296,312 | |
| Rockwell Automation, Inc. | | | 114,295 | | | | 17,248,259 | |
| Teledyne Technologies, Inc.* | | | 69,189 | | | | 20,567,814 | |
| Trane Technologies PLC (Ireland) | | | 242,390 | | | | 20,018,990 | |
| TransDigm Group, Inc. | | | 54,366 | | | | 17,407,450 | |
| TransUnion | | | 229,811 | | | | 15,208,892 | |
| Waste Connections, Inc. | | | 124,570 | | | | 9,654,175 | |
| | | | | | | | 175,676,762 | |
| Consumer Discretionary — 11.3% | | | | | | | | |
| Carter's, Inc. | | | 174,893 | | | | 11,495,717 | |
| Eldorado Resorts, Inc.*† | | | 345,178 | | | | 4,970,563 | |
| Hilton Worldwide Holdings, Inc. | | | 324,000 | | | | 22,109,760 | |
| O'Reilly Automotive, Inc.* | | | 76,403 | | | | 23,001,123 | |
| Ross Stores, Inc. | | | 264,220 | | | | 22,979,213 | |
| Ulta Beauty, Inc.* | | | 101,035 | | | | 17,751,849 | |
| Yum China Holdings, Inc. (China) | | | 351,920 | | | | 15,002,350 | |
| | | | | | | | 117,310,575 | |
| Financials — 8.2% | | | | | | | | |
| Arthur J Gallagher & Co. | | | 230,120 | | | $ | 18,757,081 | |
| Brookfield Asset Management, Inc. (Canada) - Class A | | | 308,360 | | | | 13,644,930 | |
| MSCI, Inc. | | | 61,670 | | | | 17,820,163 | |
| Progressive Corp. (The) | | | 229,810 | | | | 16,969,170 | |
| Tradeweb Markets, Inc. - Class A | | | 420,960 | | | | 17,697,158 | |
| | | | | | | | 84,888,502 | |
| Real Estate — 4.6% | | | | | | | | |
| Alexandria Real Estate Equities, Inc. REIT | | | 119,350 | | | | 16,358,111 | |
| SBA Communications Corp. REIT | | | 115,980 | | | | 31,311,121 | |
| | | | | | | | 47,669,232 | |
| Materials — 1.6% | | | | | | | | |
| RPM International, Inc. | | | 283,200 | | | | 16,850,400 | |
| Total Common Stocks | | | | | | $ | 1,025,653,515 | |
| | | | | | | | | |
| Short-Term Investment Funds — 1.6% | | | | | | | | |
| Dreyfus Government Cash Management, InstitutionalShares, 0.29%∞Ω | | | 15,795,639 | | | | 15,795,639 | |
| Invesco Government & Agency Portfolio, InstitutionalClass, 0.43%**∞Ω | | | 1,119,300 | | | | 1,119,300 | |
| Total Short-Term Investment Funds | | | | | | $ | 16,914,939 | |
| | | | | | | | | |
| Total Investment Securities —100.5% | | | | | | | | |
| (Cost $967,849,005) | | | | | | $ | 1,042,568,454 | |
| | | | | | | | | |
| Liabilities in Excess of Other Assets — (0.5%) | | | | | | | (5,169,943 | ) |
| | | | | | | | | |
| Net Assets — 100.0% | | | | | | $ | 1,037,398,511 | |
| * | Non-income producing security. |
| ** | Represents collateral for securities loaned. |
| † | All or a portion of the security is on loan. The total market value of the securities on loan as of March 31, 2020 was $1,310,400. |
| ∞ | Open-End Fund. |
| Ω | Represents the 7-day SEC yield as of March 31, 2020. |
Portfolio Abbreviations:
ADR - American Depositary Receipt
PLC - Public Limited Company
REIT - Real Estate Investment Trust
Other Information:
The inputs or methodology used for valuing securities may not be an indication of the risk associated with investing in those securities. For more information on valuation inputs, and their aggregation into the levels used in the table below, please refer to the security valuation section in the accompanying Notes to Financial Statements.
Valuation inputs at Reporting Date:
| Description | | Level 1 | | | Level 2 | | | Level 3 | | | Total | |
| Common Stocks | | $ | 1,025,653,515 | | | $ | — | | | $ | — | | | $ | 1,025,653,515 | |
| Short-Term Investment Funds | | | 16,914,939 | | | | — | | | | — | | | | 16,914,939 | |
| | | | | | | | | | | | | | | | | |
| Total | | $ | 1,042,568,454 | | | $ | — | | | $ | — | | | $ | 1,042,568,454 | |
See accompanying Notes to Financial Statements.
Portfolio of Investments
Touchstone Sands Capital Emerging Markets Growth Fund – March 31, 2020
| | | | | | Market | |
| | | Shares | | | Value | |
| Common Stocks — 95.2% | | | | | | | | |
| China — 36.7% | | | | | | | | |
| Communication Services — 10.9% | | | | | | | | |
| Baidu, Inc. ADR* | | | 186,672 | | | $ | 18,814,671 | |
| Tencent Holdings Ltd. | | | 2,500,600 | | | | 123,598,690 | |
| Consumer Discretionary — 20.0% | | | | | | | | |
| Alibaba Group Holding Ltd. ADR* | | | 745,073 | | | | 144,901,797 | |
| ANTA Sports Products Ltd. | | | 6,531,500 | | | | 47,397,158 | |
| New Oriental Education & Technology Group, Inc. ADR* | | | 375,636 | | | | 40,658,841 | |
| Trip.com Group Ltd. (China) ADR* | | | 1,256,000 | | | | 29,453,200 | |
| Consumer Staples — 0.4% | | | | | | | | |
| Foshan Haitian Flavouring & Food Co. Ltd. - Class A | | | 263,895 | | | | 4,656,883 | |
| Health Care — 3.3% | | | | | | | | |
| BeiGene Ltd. ADR* | | | 106,500 | | | | 13,111,215 | |
| Wuxi Biologics, Inc., 144a* | | | 2,413,000 | | | | 30,806,360 | |
| Information Technology — 2.1% | | | | | | | | |
| Sunny Optical Technology Group Co. Ltd. | | | 2,100,200 | | | | 27,781,159 | |
| Total China | | | | | | | 481,179,974 | |
| India — 18.0% | | | | | | | | |
| Consumer Discretionary — 4.6% | | | | | | | | |
| Jubilant Foodworks Ltd. | | | 1,904,812 | | | | 36,902,387 | |
| MakeMyTrip Ltd.* | | | 927,866 | | | | 11,092,638 | |
| Titan Co. Ltd. | | | 983,584 | | | | 12,114,525 | |
| Consumer Staples — 0.9% | | | | | | | | |
| Britannia Industries Ltd. | | | 350,283 | | | | 12,388,570 | |
| Financials — 8.2% | | | | | | | | |
| Bajaj Finance Ltd. | | | 971,570 | | | | 28,396,125 | |
| Bandhan Bank Ltd., 144a | | | 4,077,750 | | | | 10,948,347 | |
| HDFC Bank Ltd. | | | 3,142,055 | | | | 35,807,304 | |
| Housing Development Finance Corp. Ltd. | | | 1,511,209 | | | | 32,618,459 | |
| Health Care — 2.7% | | | | | | | | |
| Apollo Hospitals Enterprise Ltd. | | | 2,346,134 | | | �� | 35,158,738 | |
| Materials — 1.6% | | | | | | | | |
| Asian Paints Ltd. | | | 940,011 | | | | 20,707,237 | |
| Total India | | | | | | | 236,134,330 | |
| Singapore — 7.1% | | | | | | | | |
| Communication Services — 7.1% | | | | | | | | |
| Sea Ltd. ADR* | | | 2,112,583 | | | | 93,608,553 | |
| Argentina — 5.9% | | | | | | | | |
| Consumer Discretionary — 4.4% | | | | | | | | |
| MercadoLibre, Inc.* | | | 117,965 | | | | 57,635,340 | |
| Information Technology — 1.5% | | | | | | | | |
| Globant SA* | | | 218,520 | | | | 19,203,537 | |
| Total Argentina | | | | | | | 76,838,877 | |
| Russia — 5.2% | | | | | | | | |
| Communication Services — 5.2% | | | | | | | | |
| Mail.Ru Group Ltd. GDR* | | | 813,900 | | | | 13,082,082 | |
| Yandex NV - Class A* | | | 1,609,300 | | | | 54,796,665 | |
| Total Russia | | | | | | | 67,878,747 | |
| Hong Kong — 4.3% | | | | | | | | |
| Financials — 3.3% | | | | | | | | |
| AIA Group Ltd. | | | 4,763,600 | | | | 42,656,327 | |
| Health Care — 1.0% | | | | | | | | |
| Hutchison China MediTech Ltd. ADR* | | | 746,262 | | | | 13,320,777 | |
| Total Hong Kong | | | | | | | 55,977,104 | |
| Taiwan — 4.0% | | | | | | | | |
| Information Technology — 4.0% | | | | | | | | |
| Taiwan Semiconductor Manufacturing Co. Ltd. ADR | | | 1,102,195 | | | $ | 52,673,899 | |
| Brazil — 3.0% | | | | | | | | |
| Consumer Staples — 0.9% | | | | | | | | |
| Raia Drogasil SA | | | 635,700 | | | | 12,393,220 | |
| Industrials — 0.6% | | | | | | | | |
| Localiza Rent a Car SA | | | 1,493,715 | | | | 7,551,797 | |
| Information Technology — 1.5% | | | | | | | | |
| Pagseguro Digital Ltd. - Class A* | | | 1,015,572 | | | | 19,631,007 | |
| Total Brazil | | | | | | | 39,576,024 | |
| Indonesia — 2.4% | | | | | | | | |
| Financials — 2.4% | | | | | | | | |
| Bank Central Asia Tbk PT | | | 18,505,600 | | | | 31,180,441 | |
| Netherlands — 2.3% | | | | | | | | |
| Consumer Discretionary — 2.3% | | | | | | | | |
| Prosus NV* | | | 428,800 | | | | 29,865,120 | |
| Thailand — 2.1% | | | | | | | | |
| Consumer Staples — 2.1% | | | | | | | | |
| CP ALL PCL | | | 15,212,800 | | | | 28,130,429 | |
| Cambodia — 1.4% | | | | | | | | |
| Consumer Discretionary — 1.4% | | | | | | | | |
| NagaCorp Ltd. | | | 18,327,000 | | | | 18,552,323 | |
| Mexico — 1.3% | | | | | | | | |
| Industrials — 1.3% | | | | | | | | |
| Grupo Aeroportuario del Sureste SAB de CV ADR | | | 176,565 | | | | 16,621,829 | |
| Philippines — 0.9% | | | | | | | | |
| Real Estate — 0.9% | | | | | | | | |
| SM Prime Holdings, Inc. | | | 22,439,900 | | | | 12,461,863 | |
| Vietnam — 0.6% | | | | | | | | |
| Real Estate — 0.6% | | | | | | | | |
| Vincom Retail JSC | | | 10,009,724 | | | | 7,970,134 | |
| Total Common Stocks | | | | | | $ | 1,248,649,647 | |
| | | | | | | | | |
| Short-Term Investment Fund — 3.7% | | | | | | | | |
| Dreyfus Government Cash Management, Institutional | | | | | | | | |
| Shares, 0.29%∞Ω | | | 48,039,318 | | | $ | 48,039,318 | |
| | | | | | | | | |
| Total Investment Securities —98.9% | | | | | | | | |
| (Cost $1,343,837,744) | | | | | | $ | 1,296,688,965 | |
| | | | | | | | | |
| Other Assets in Excess of Liabilities — 1.1% | | | | | | | 14,843,351 | |
| Net Assets — 100.0% | | | | | | $ | 1,311,532,316 | |
* Non-income producing security.
∞ Open-End Fund.
Ω Represents the 7-day SEC yield as of March 31, 2020.
Portfolio Abbreviations:
ADR - American Depositary Receipt GDR - Global Depositary Receipt PCL - Public Company Limited
144a - This is a restricted security that was sold in a transaction qualifying for the exemption under Rule 144a of the Securities Act of 1933. This security may be sold in transactions exempt from registration, normally to qualified institutional buyers. At March 31, 2020, these securities were valued at $41,754,707 or 3.2% of net assets. These securities were deemed liquid pursuant to procedures approved by the Board of Trustees.
Touchstone Sands Capital Emerging Markets Growth Fund (Continued)
Other Information:
The inputs or methodology used for valuing securities may not be an indication of the risk associated with investing in those securities. For more information on valuation inputs, and their aggregation into the levels used in the table below, please refer to the security valuation section in the accompanying Notes to Financial Statements.
| Valuation inputs at Reporting Date: | |
| | | | |
| Description | | Level 1 | | | Level 2 | | | Level 3 | | | Total | |
| Common Stocks | | | | | | | | | | | | | | | | |
| China | | $ | 251,596,607 | | | $ | 229,583,367 | | | $ | — | | | $ | 481,179,974 | |
| India | | | 31,799,875 | | | | 204,334,455 | | | | — | | | | 236,134,330 | |
| Singapore | | | 93,608,553 | | | | — | | | | — | | | | 93,608,553 | |
| Argentina | | | 76,838,877 | | | | — | | | | — | | | | 76,838,877 | |
| Russia | | | 54,796,665 | | | | 13,082,082 | | | | — | | | | 67,878,747 | |
| Hong Kong | | | 13,320,777 | | | | 42,656,327 | | | | — | | | | 55,977,104 | |
| Taiwan | | | 52,673,899 | | | | — | | | | — | | | | 52,673,899 | |
| Brazil | | | 39,576,024 | | | | — | | | | — | | | | 39,576,024 | |
| Indonesia | | | — | | | | 31,180,441 | | | | — | | | | 31,180,441 | |
| Netherlands | | | 29,865,120 | | | | — | | | | — | | | | 29,865,120 | |
| Thailand | | | — | | | | 28,130,429 | | | | — | | | | 28,130,429 | |
| Cambodia | | | — | | | | 18,552,323 | | | | — | | | | 18,552,323 | |
| Mexico | | | 16,621,829 | | | | — | | | | — | | | | 16,621,829 | |
| Philippines | | | — | | | | 12,461,863 | | | | — | | | | 12,461,863 | |
| Vietnam | | | — | | | | 7,970,134 | | | | — | | | | 7,970,134 | |
| Short-Term Investment Fund | | | 48,039,318 | | | | — | | | | — | | | | 48,039,318 | |
| Total | | $ | 708,737,544 | | | $ | 587,951,421 | | | $ | — | | | $ | 1,296,688,965 | |
See accompanying Notes to Financial Statements.
Statements of Assets and Liabilities
March 31, 2020
| | | | | | | | | | | | | | | | | | Touchstone | |
| | | Touchstone | | | | | | | | | Touchstone | | | Touchstone | | | Sands Capital | |
| | | Flexible | | | Touchstone | | | Touchstone | | | Growth | | | Mid Cap | | | Emerging | |
| | | Income | | | Focused | | | Global ESG | | | Opportunities | | | Growth | | | Markets | |
| | | Fund | | | Fund | | | Equity Fund | | | Fund | | | Fund | | | Growth Fund | |
| Assets | | | | | | | | | | | | | | | | | | | | | | | | |
| Investments, at cost | | $ | 687,436,547 | | | $ | 596,127,272 | | | $ | 529,210,138 | | | $ | 142,346,995 | | | $ | 967,849,005 | | | $ | 1,343,837,744 | |
| Investments, at market value(A) | | $ | 630,361,510 | | | $ | 746,672,127 | | | $ | 532,879,399 | | | $ | 162,828,711 | | | $ | 1,042,568,454 | | | $ | 1,296,688,965 | |
| Cash | | | 1,534,432 | | | | — | | | | 82,216 | | | | — | | | | — | | | | — | |
| Cash deposits held at prime broker | | | 18,970,693 | | | | — | | | | — | | | | — | | | | — | | | | — | |
| Foreign currency(B) | | | — | | | | — | | | | 4,967,328 | | | | — | | | | — | | | | 20,802,105 | |
| Dividends and interest receivable | | | 3,874,719 | | | | 656,439 | | | | 1,475,724 | | | | 37,641 | | | | 122,931 | | | | 672,297 | |
| Receivable for capital shares sold | | | 1,131,760 | | | | 115,193 | | | | 1,091,820 | | | | 220,393 | | | | 4,584,267 | | | | 20,783,473 | |
| Receivable for investments sold | | | 3,828,355 | | | | 4,065,748 | | | | 1,191,646 | | | | — | | | | — | | | | 3,184,996 | |
| Receivable for securities lending income | | | 8,490 | | | | — | | | | 5,351 | | | | — | | | | 980 | | | | — | |
| Tax reclaim receivable | | | — | | | | 79,318 | | | | 415,729 | | | | 28,694 | | | | 3,913 | | | | — | |
| Other assets | | | 29,548 | | | | 19,479 | | | | 22,501 | | | | 21,815 | | | | 30,127 | | | | 60,074 | |
| Total Assets | | | 659,739,507 | | | | 751,608,304 | | | | 542,131,714 | | | | 163,137,254 | | | | 1,047,310,672 | | | | 1,342,191,910 | |
| Liabilities | | | | | | | | | | | | | | | | | | | | | | | | |
| Bank overdrafts | | | — | | | | 1,293,264 | | | | — | | | | 3,556 | | | | 5,327 | | | | 58,293 | |
| Payable for return of collateral for securities on loan | | | 66,255 | | | | — | | | | 19,738,050 | | | | — | | | | 1,119,300 | | | | — | |
| Payable for capital shares redeemed | | | 6,469,593 | | | | 878,785 | | | | 3,548,884 | | | | 69,011 | | | | 7,305,350 | | | | 4,274,778 | |
| Payable for investments purchased | | | 11,477,294 | | | | 2,278,823 | | | | 4,933,848 | | | | — | | | | — | | | | 24,450,362 | |
| Payable to Investment Advisor | | | 333,817 | | | | 422,803 | | | | 298,336 | | | | 93,820 | | | | 661,664 | | | | 1,273,642 | |
| Payable to other affiliates | | | 102,888 | | | | 170,846 | | | | 148,608 | | | | 17,128 | | | | 208,492 | | | | 168,134 | |
| Payable to Trustees | | | 11,130 | | | | 11,130 | | | | 11,130 | | | | 11,130 | | | | 11,130 | | | | 11,130 | |
| Payable for professional services | | | 35,390 | | | | 31,632 | | | | 31,970 | | | | 25,253 | | | | 37,310 | | | | 53,220 | |
| Payable for reports to shareholders | | | 25,223 | | | | 27,117 | | | | 22,788 | | | | 12,388 | | | | 65,180 | | | | 31,974 | |
| Payable for transfer agent services | | | 262,064 | | | | 435,439 | | | | 284,067 | | | | 56,068 | | | | 490,636 | | | | 287,491 | |
| Other accrued expenses and liabilities | | | 21,058 | | | | 8,087 | | | | 15,960 | | | | 4,743 | | | | 7,772 | | | | 50,570 | |
| Total Liabilities | | | 18,804,712 | | | | 5,557,926 | | | | 29,033,641 | | | | 293,097 | | | | 9,912,161 | | | | 30,659,594 | |
| Net Assets | | $ | 640,934,795 | | | $ | 746,050,378 | | | $ | 513,098,073 | | | $ | 162,844,157 | | | $ | 1,037,398,511 | | | $ | 1,311,532,316 | |
| Net assets consist of: | | | | | | | | | | | | | | | | | | | | | | | | |
| Paid-in capital | | $ | 692,237,954 | | | $ | 571,005,238 | | | $ | 543,350,581 | | | $ | 143,943,338 | | | $ | 969,370,960 | | | $ | 1,424,235,919 | |
| Distributable earnings (deficit) | | | (51,303,159 | ) | | | 175,045,140 | | | | (30,252,508 | ) | | | 18,900,819 | | | | 68,027,551 | | | | (112,703,603 | ) |
| Net Assets | | $ | 640,934,795 | | | $ | 746,050,378 | | | $ | 513,098,073 | | | $ | 162,844,157 | | | $ | 1,037,398,511 | | | $ | 1,311,532,316 | |
| (A)Includes market value of securities on loan of: | | $ | 66,471 | | | $ | — | | | $ | 19,177,539 | | | $ | — | | | $ | 1,310,400 | | | $ | — | |
| (B)Cost of foreign currency: | | $ | — | | | $ | — | | | $ | 4,873,985 | | | $ | — | | | $ | — | | | $ | 20,805,434 | |
See accompanying Notes to Financial Statements.
Statements of Assets and Liabilities(Continued)
| | | | | | | | | | | | | | | | | | Touchstone | |
| | | Touchstone | | | | | | | | | Touchstone | | | Touchstone | | | Sands Capital | |
| | | Flexible | | | Touchstone | | | Touchstone | | | Growth | | | Mid Cap | | | Emerging | |
| | | Income | | | Focused | | | Global ESG | | | Opportunities | | | Growth | | | Markets | |
| | | Fund | | | Fund | | | Equity Fund | | | Fund | | | Fund | | | Growth Fund | |
| Pricing of Class A Shares | | | | | | | | | | | | | | | | | | | | | | | | |
| Net assets applicable to Class A shares | | $ | 99,460,149 | | | $ | 27,888,573 | | | $ | 347,021,337 | | | $ | 37,149,592 | | | $ | 234,306,537 | | | $ | 2,897,382 | |
| Shares of beneficial interest outstanding | | | | | | | | | | | | | | | | | | | | | | | | |
| (unlimited number of shares authorized, no par value) | | | 9,898,653 | | | | 765,221 | | | | 20,611,851 | | | | 1,329,421 | | | | 9,414,214 | | | | 255,123 | |
| Net asset value price per share* | | $ | 10.05 | | | $ | 36.45 | | | $ | 16.84 | | | $ | 27.94 | | | $ | 24.89 | | | $ | 11.36 | |
| Maximum sales charge - Class A shares | | | 2.00 | % | | | 5.00 | % | | | 5.00 | % | | | 5.00 | % | | | 5.00 | % | | | 5.00 | % |
| Maximum offering price per share | | | | | | | | | | | | | | | | | | | | | | | | |
| (100%/(100%-maximum sales charge) of net asset value adjusted to the nearest cent) - Class A shares | | $ | 10.26 | | | $ | 38.37 | | | $ | 17.73 | | | $ | 29.41 | | | $ | 26.20 | | | $ | 11.96 | |
| Pricing of Class C Shares | | | | | | | | | | | | | | | | | | | | | | | | |
| Net assets applicable to Class C shares | | $ | 50,767,013 | | | $ | 21,960,843 | | | $ | 8,098,605 | | | $ | 2,723,547 | | | $ | 20,917,541 | | | $ | 1,134,967 | |
| Shares of beneficial interest outstanding | | | | | | | | | | | | | | | | | | | | | | | | |
| (unlimited number of shares authorized, no par value) | | | 5,129,227 | | | | 644,694 | | | | 579,564 | | | | 128,542 | | | | 1,436,623 | | | | 100,802 | |
| Net asset value and offering price per share** | | $ | 9.90 | | | $ | 34.06 | | | $ | 13.97 | | | $ | 21.19 | | | $ | 14.56 | | | $ | 11.26 | |
| Pricing of Class Y Shares | | | | | | | | | | | | | | | | | | | | | | | | |
| Net assets applicable to Class Y shares | | $ | 464,910,048 | | | $ | 680,933,855 | | | $ | 136,238,641 | | | $ | 26,610,046 | | | $ | 424,403,332 | | | $ | 423,992,433 | |
| Shares of beneficial interest outstanding | | | | | | | | | | | | | | | | | | | | | | | | |
| (unlimited number of shares authorized, no par value) | | | 46,127,062 | | | | 18,492,573 | | | | 7,794,083 | | | | 914,151 | | | | 16,295,952 | | | | 37,268,302 | |
| Net asset value, offering price and redemption price per share | | $ | 10.08 | | | $ | 36.82 | | | $ | 17.48 | | | $ | 29.11 | | | $ | 26.04 | | | $ | 11.38 | |
| Pricing of Institutional Class Shares | | | | | | | | | | | | | | | | | | | | | | | | |
| Net assets applicable to Institutional Class shares | | $ | 25,797,585 | | | $ | 15,267,107 | | | $ | 21,739,490 | | | $ | 96,360,972 | | | $ | 357,769,259 | | | $ | 883,507,534 | |
| Shares of beneficial interest outstanding | | | | | | | | | | | | | | | | | | | | | | | | |
| (unlimited number of shares authorized, no par value) | | | 2,560,352 | | | | 412,805 | | | | 1,242,319 | | | | 3,257,764 | | | | 13,592,752 | | | | 77,292,464 | |
| Net asset value, offering price and redemption price per share | | $ | 10.08 | | | $ | 36.98 | | | $ | 17.50 | | | $ | 29.58 | | | $ | 26.32 | | | $ | 11.43 | |
| Pricing of Class R6 shares | | | | | | | | | | | | | | | | | | | | | | | | |
| Net assets applicable to Class R6 shares | | $ | — | | | $ | — | | | $ | — | | | $ | — | | | $ | 1,842 | | | $ | — | |
| Shares of beneficial interest outstanding | | | | | | | | | | | | | | | | | | | | | | | | |
| (unlimited number of shares authorized, no par value) | | | — | | | | — | | | | — | | | | — | | | | 70 | | | | — | |
| Net asset value, offering price and redemption price per share | | $ | — | | | $ | — | | | $ | — | | | $ | — | | | $ | 26.32 | | | $ | — | |
* There is no sales load on subscriptions of $1 million or more for all funds except for Flexible Income Fund. There is no sales load on subscriptions of $500,000 or more for Flexible Income Fund. Redemptions that were part of a $500,000 or $1 million or more subscription, as applicable, may be subject to a contingent deferred sales load if redeemed within a one-year period from the date of purchase.
** Redemption price per share varies by length of time shares are held due to the terms of the contingent deferred sales charge.
See accompanying Notes to Financial Statements.
Statements of Operations
For the Year Ended March 31, 2020
| | | | | | | | | | | | | | | | | | Touchstone | |
| | | Touchstone | | | | | | | | | Touchstone | | | Touchstone | | | Sands Capital | |
| | | Flexible | | | Touchstone | | | Touchstone | | | Growth | | | Mid Cap | | | Emerging | |
| | | Income | | | Focused | | | Global ESG | | | Opportunities | | | Growth | | | Markets | |
| | | Fund | | | Fund | | | Equity Fund | | | Fund | | | Fund | | | Growth Fund | |
| Investment Income | | | | | | | | | | | | | | | | | | | | | | | | |
| Dividends(A)(B) | | $ | 10,859,466 | | | $ | 14,306,998 | | | $ | 14,163,159 | | | $ | 1,686,190 | | | $ | 12,304,602 | | | $ | 22,743,170 | |
| Interest | | | 18,690,869 | | | | — | | | | — | | | | — | | | | 1,178 | | | | 2,177 | |
| Income from securities loaned | | | 38,198 | | | | 1,510 | | | | 87,711 | | | | 1,231 | | | | 8,553 | | | | 5,682 | |
| Total Investment Income | | | 29,588,533 | | | | 14,308,508 | | | | 14,250,870 | | | | 1,687,421 | | | | 12,314,333 | | | | 22,751,029 | |
| Expenses | | | | | | | | | | | | | | | | | | | | | | | | |
| Investment advisory fees | | | 4,050,402 | | | | 5,988,346 | | | | 4,604,435 | | | | 1,126,345 | | | | 8,709,971 | | | | 11,670,888 | |
| Administration fees | | | 1,029,617 | | | | 1,374,684 | | | | 1,027,143 | | | | 217,760 | | | | 1,780,632 | | | | 1,692,279 | |
| Compliance fees and expenses | | | 2,272 | | | | 2,272 | | | | 2,272 | | | | 2,272 | | | | 2,272 | | | | 2,272 | |
| Custody fees | | | 122,285 | | | | 23,785 | | | | 56,267 | | | | 20,168 | | | | 24,456 | | | | 406,173 | |
| Professional fees | | | 84,129 | | | | 48,184 | | | | 47,499 | | | | 28,424 | | | | 62,424 | | | | 117,948 | |
| Transfer Agent fees, Class A | | | 100,647 | | | | 27,494 | | | | 338,901 | | | | 50,609 | | | | 305,679 | | | | 2,312 | |
| Transfer Agent fees, Class C | | | 51,501 | | | | 26,579 | | | | 14,192 | | | | 3,592 | | | | 31,118 | | | | 713 | |
| Transfer Agent fees, Class Y | | | 439,666 | | | | 738,658 | | | | 155,059 | | | | 21,226 | | | | 556,700 | | | | 352,876 | |
| Transfer Agent fees, Institutional Class | | | 20,395 | | | | 7,418 | | | | 26,317 | | | | 26,226 | | | | 212,092 | | | | 270,188 | |
| Transfer Agent fees, Class R6 | | | — | | | | — | | | | — | | | | — | | | | 60 | | | | — | |
| Registration fees, Class A | | | 16,509 | | | | 16,469 | | | | 19,565 | | | | 14,037 | | | | 21,363 | | | | 12,066 | |
| Registration fees, Class C | | | 16,334 | | | | 14,390 | | | | 15,684 | | | | 11,184 | | | | 18,283 | | | | 7,925 | |
| Registration fees, Class Y | | | 41,383 | | | | 20,377 | | | | 21,837 | | | | 12,063 | | | | 35,174 | | | | 32,447 | |
| Registration fees, Institutional Class | | | 14,470 | | | | 11,702 | | | | 13,334 | | | | 18,831 | | | | 27,203 | | | | 35,359 | |
| Registration fees, Class R6 | | | — | | | | — | | | | — | | | | — | | | | 974 | | | | — | |
| Interest expense on securities sold short | | | 49,191 | | | | — | | | | — | | | | — | | | | — | | | | — | |
| Reports to Shareholders, Class A | | | 13,435 | | | | 6,426 | | | | 27,868 | | | | 8,994 | | | | 22,136 | | | | 8,112 | |
| Reports to Shareholders, Class C | | | 11,347 | | | | 7,924 | | | | 7,332 | | | | 6,334 | | | | 8,176 | | | | 7,957 | |
| Reports to Shareholders, Class Y | | | 31,209 | | | | 43,601 | | | | 25,561 | | | | 6,747 | | | | 82,984 | | | | 37,560 | |
| Reports to Shareholders, Institutional Class | | | 11,623 | | | | 6,994 | | | | 6,805 | | | | 5,559 | | | | 41,406 | | | | 28,316 | |
| Reports to Shareholders, Class R6 | | | — | | | | — | | | | — | | | | — | | | | 2,726 | | | | — | |
| Distribution expenses, Class A | | | 278,547 | | | | 102,414 | | | | 1,108,125 | | | | 109,450 | | | | 704,597 | | | | 4,800 | |
| Distribution and shareholder servicing expenses, | | | | | | | | | | | | | | | | | | | | | | | | |
| Class C | | | 583,995 | | | | 293,350 | | | | 126,557 | | | | 33,730 | | | | 288,608 | | | | 5,463 | |
| Trustee fees | | | 22,956 | | | | 22,956 | | | | 22,956 | | | | 22,956 | | | | 22,956 | | | | 22,956 | |
| Other expenses | | | 85,116 | | | | 267,803 | | | | 204,083 | | | | 61,047 | | | | 106,790 | | | | 94,679 | |
| Total Expenses | | | 7,077,029 | | | | 9,051,826 | | | | 7,871,792 | | | | 1,807,554 | | | | 13,068,780 | | | | 14,813,289 | |
| Fees waived and/or reimbursed by the Advisor and/or | | | | | | | | | | | | | | | | | | | | | | | | |
| Affiliates(C) | | | (597,358 | ) | | | (31,574 | ) | | | (166,173 | ) | | | (245,845 | ) | | | (3,760 | ) | | | (35,391 | ) |
| Fees recouped by the Advisor(C) | | | — | | | | 4,936 | | | | — | | | | — | | | | — | | | | 122,346 | |
| Net Expenses | | | 6,479,671 | | | | 9,025,188 | | | | 7,705,619 | | | | 1,561,709 | | | | 13,065,020 | | | | 14,900,244 | |
| Net Investment Income (Loss) | | | 23,108,862 | | | | 5,283,320 | | | | 6,545,251 | | | | 125,712 | | | | (750,687 | ) | | | 7,850,785 | |
| Realized and Unrealized Gains (Losses) on | | | | | | | | | | | | | | | | | | | | | | | | |
| Investments | | | | | | | | | | | | | | | | | | | | | | | | |
| Net realized gains (losses) on investments(D) | | | 29,950,763 | | | | 60,441,510 | | | | (16,711,987 | ) | | | 18,958,191 | | | | 79,103,794 | | | | (34,581,415 | ) |
| Net realized losses on futures contracts | | | (2,072,499 | ) | | | — | | | | — | | | | — | | | | — | | | | — | |
| Net realized gains on written options | | | 8,854 | | | | — | | | | — | | | | — | | | | — | | | | — | |
| Net realized losses on securities sold short | | | (7,591,713 | ) | | | — | | | | — | | | | — | | | | — | | | | — | |
| Net realized losses on foreign currency transactions | | | — | | | | — | | | | (2,855 | ) | | | — | | | | — | | | | (271,254 | ) |
| Net change in unrealized appreciation (depreciation) | | | | | | | | | | | | | | | | | | | | | | | | |
| on investments(E) | | | (70,415,772 | ) | | | (132,563,075 | ) | | | (67,730,389 | ) | | | (24,993,169 | ) | | | (175,573,455 | ) | | | (183,821,045 | ) |
| Net change in unrealized appreciation (depreciation) | | | | | | | | | | | | | | | | | | | | | | | | |
| on futures contracts | | | 1,580,368 | | | | — | | | | — | | | | — | | | | — | | | | — | |
| Net change in unrealized appreciation (depreciation) | | | | | | | | | | | | | | | | | | | | | | | | |
| on foreign currency transactions | | | — | | | | — | | | | (54,074 | ) | | | — | | | | — | | | | (27,603 | ) |
| Net Realized and Unrealized Gains (Losses) on | | | | | | | | | | | | | | | | | | | | | | | | |
| Investments | | | (48,539,999 | ) | | | (72,121,565 | ) | | | (84,499,305 | ) | | | (6,034,978 | ) | | | (96,469,661 | ) | | | (218,701,317 | ) |
| Change in Net Assets Resulting from Operations | | $ | (25,431,137 | ) | | $ | (66,838,245 | ) | | $ | (77,954,054 | ) | | $ | (5,909,266 | ) | | $ | (97,220,348 | ) | | $ | (210,850,532 | ) |
| (A)Net of foreign tax withholding of: | | $ | 9,544 | | | $ | 124,132 | | | $ | 1,072,610 | | | $ | 30,936 | | | $ | 17,402 | | | $ | 601,134 | |
| (B)Includes in-kind dividend income of $14,274,986 which was recorded at fair value of the shares on the ex-dividend date for the Sands Capital Emerging Markets Growth Fund. |
| (C)See Note 4 in Notes to Financial Statements. |
| (D)For the year ended March 31, 2020, the Growth Opportunities Fund had a redemption-in-kind of securities in the amount of $4,028,264. Net realized gains (losses) on investments includes the realized gain on the transaction of $1,383,255, which is not recognized as a realized gain by the Fund for tax purpose. |
| (E)Includes decrease in deferred foreign capital gains tax of: | | $ | — | | | $ | — | | | $ | — | | | $ | — | | | $ | — | | | $ | 932,552 | |
See accompanying Notes to Financial Statements.
Statements of Changes in Net Assets
| | | Touchstone | | | | | | | | | Touchstone | |
| | | Flexible Income
Fund | | | Touchstone
Focused Fund | | | Global ESG
Equity Fund | |
| | | For the | | | For the | | | For the | | | For the | | | For the | | | For the | |
| | | Year Ended | | | Year Ended | | | Year Ended | | | Year Ended | | | Year Ended | | | Year Ended | |
| | | March 31, 2020 | | | March 31, 2019 | | | March 31, 2020 | | | March 31, 2019 | | | March 31, 2020 | | | March 31, 2019 | |
| From Operations | | | | | | | | | | | | | | | | | | | | | | | | |
| Net investment income (loss) | | $ | 23,108,862 | | | $ | 30,334,850 | | | $ | 5,283,320 | | | $ | 6,178,665 | | | $ | 6,545,251 | | | $ | 5,625,010 | |
| Net realized gains (losses) on investments, futures | | | | | | | | | | | | | | | | | | | | | | | | |
| contracts, written options, swap agreements, | | | | | | | | | | | | | | | | | | | | | | | | |
| securities sold short, forward foreign currency | | | | | | | | | | | | | | | | | | | | | | | | |
| contracts and foreign currency transactions | | | 20,295,405 | | | | (14,009,240 | ) | | | 60,441,510 | | | | 48,864,054 | | | | (16,714,842 | ) | | | 42,318,124 | |
| Net change in unrealized appreciation | | | | | | | | | | | | | | | | | | | | | | | | |
| (depreciation) on investments, futures contracts, | | | | | | | | | | | | | | | | | | | | | | | | |
| and foreign currency transactions | | | (68,835,404 | ) | | | 9,474,241 | | | | (132,563,075 | ) | | | (19,682,696 | ) | | | (67,784,463 | ) | | | (52,195,692 | ) |
| Change in Net Assets from Operations | | | (25,431,137 | ) | | | 25,799,851 | | | | (66,838,245 | ) | | | 35,360,023 | | | | (77,954,054 | ) | | | (4,252,558 | ) |
| Distributions to Shareholders: | | | | | | | | | | | | | | | | | | | | | | | | |
| Distributed earnings, Class A | | | (3,713,589 | ) | | | (4,595,320 | ) | | | (2,238,206 | ) | | | (6,047,651 | ) | | | (10,328,942 | ) | | | (39,433,398 | ) |
| Distributed earnings, Class C | | | (1,561,503 | ) | | | (2,794,088 | ) | | | (1,800,403 | ) | | | (1,537,491 | ) | | | (254,893 | ) | | | (2,981,402 | ) |
| Distributed earnings, Class Y | | | (17,755,930 | ) | | | (23,651,685 | ) | | | (55,429,651 | ) | | | (42,711,920 | ) | | | (5,179,635 | ) | | | (17,812,087 | ) |
| Distributed earnings, Institutional Class | | | (1,621,646 | ) | | | (3,170,908 | ) | | | (1,430,465 | ) | | | (1,121,274 | ) | | | (1,003,582 | ) | | | (4,318,491 | ) |
| Total Distributions | | | (24,652,668 | ) | | | (34,212,001 | ) | | | (60,898,725 | ) | | | (51,418,336 | ) | | | (16,767,052 | ) | | | (64,545,378 | ) |
| Change in Net Assets from Share Transactions(A) | | | (5,366,375 | ) | | | (247,881,927 | ) | | | (124,573,848 | ) | | | (189,398,237 | ) | | | (104,176,982 | ) | | | 25,835,271 | |
| Total Increase (Decrease) in Net Assets | | | (55,450,180 | ) | | | (256,294,077 | ) | | | (252,310,818 | ) | | | (205,456,550 | ) | | | (198,898,088 | ) | | | (42,962,665 | ) |
| | | | | | | | | | | | | | | | | | | | | | | | | |
| Net Assets | | | | | | | | | | | | | | | | | | | | | | | | |
| Beginning of period | | | 696,384,975 | | | | 952,679,052 | | | | 998,361,196 | | | | 1,203,817,746 | | | | 711,996,161 | | | | 754,958,826 | |
| End of period | | $ | 640,934,795 | | | $ | 696,384,975 | | | $ | 746,050,378 | | | $ | 998,361,196 | | | $ | 513,098,073 | | | $ | 711,996,161 | |
(A)For details on share transaction by class, see Statements of Changes in Net Assets - Capital Stock Activity on pages 42-44.
See accompanying Notes to Financial Statements.
Statements of Changes in Net Assets (Continued)
| Touchstone | | | Touchstone | | | Touchstone | |
| Growth Opportunities | | | Mid Cap | | | Sands Capital Emerging | |
| Fund | | | Growth Fund | | | Markets Growth Fund | |
| For the | | | For the | | | For the | | | For the | | | For the | | | For the | |
| Year Ended | | | Year Ended | | | Year Ended | | | Year Ended | | | Year Ended | | | Year Ended | |
| March 31, 2020 | | | March 31, 2019 | | | March 31, 2020 | | | March 31, 2019 | | | March 31, 2020 | | | March 31, 2019 | |
| $ | 125,712 | | | $ | 190,894 | | | $ | (750,687 | ) | | $ | (2,239,317 | ) | | $ | 7,850,785 | | | $ | (2,567,590 | ) |
| | 18,958,191 | | | | 24,110,105 | | | | 79,103,794 | | | | 48,246,917 | | | | (34,852,669 | ) | | | (20,413,990 | ) |
| | (24,993,169 | ) | | | (16,138,816 | ) | | | (175,573,455 | ) | | | 61,192,656 | | | | (183,848,648 | ) | | | 11,131,509 | |
| | (5,909,266 | ) | | | 8,162,183 | | | | (97,220,348 | ) | | | 107,200,256 | | | | (210,850,532 | ) | | | (11,850,071 | ) |
| | (6,821,669 | ) | | | (3,565,267 | ) | | | (19,989,487 | ) | | | (14,077,353 | ) | | | (9,873 | ) | | | — | |
| | (613,758 | ) | | | (925,118 | ) | | | (3,056,878 | ) | | | (9,020,791 | ) | | | (2,577 | ) | | | — | |
| | (3,354,635 | ) | | | (4,049,458 | ) | | | (34,842,290 | ) | | | (29,241,070 | ) | | | (2,799,865 | ) | | | — | |
| | (9,684,009 | ) | | | (17,958,575 | ) | | | (29,719,195 | ) | | | (21,549,399 | ) | | | (6,684,482 | ) | | | — | |
| | (20,474,071 | ) | | | (26,498,418 | ) | | | (87,607,850 | ) | | | (73,888,613 | ) | | | (9,496,797 | ) | | | — | |
| | 27,850,599 | | | | (102,251,511 | ) | | | 124,630,719 | | | | 284,262,807 | | | | 687,708,219 | | | | 274,360,206 | |
| | 1,467,262 | | | | (120,587,746 | ) | | | (60,197,479 | ) | | | 317,574,450 | | | | 467,360,890 | | | | 262,510,135 | |
| | 161,376,895 | | | | 281,964,641 | | | | 1,097,595,990 | | | | 780,021,540 | | | | 844,171,426 | | | | 581,661,291 | |
| $ | 162,844,157 | | | $ | 161,376,895 | | | $ | 1,037,398,511 | | | $ | 1,097,595,990 | | | $ | 1,311,532,316 | | | $ | 844,171,426 | |
Statements of Changes in Net Assets - Capital Stock Activity
| | | | | | Touchstone | | | | | | | | | Touchstone | | | | |
| | | | | | Flexible Income Fund | | | | | | | | | Focused Fund | | | | |
| | | For the Year | | | For the Year | | | For the Year | | | For the Year | |
| | | Ended | | | Ended | | | Ended | | | Ended | |
| | | March 31, 2020 | | | March 31, 2019 | | | March 31, 2020 | | | March 31, 2019 | |
| | | Shares | | | Dollars | | | Shares | | | Dollars | | | Shares | | | Dollars | | | Shares | | | Dollars | |
| Class A | | | | | | | | | | | | | | | | | | | | | | | | | | | | | | | | |
| Proceeds from Shares issued | | | 1,969,290 | | | $ | 21,351,485 | | | | 1,702,051 | | | $ | 18,079,500 | | | | 123,655 | | | $ | 5,494,801 | | | | 303,350 | | | $ | 12,999,888 | |
| Reinvestment of distributions | | | 292,070 | | | | 3,150,421 | | | | 366,554 | | | | 3,904,389 | | | | 44,106 | | | | 1,944,038 | | | | 135,309 | | | | 5,442,939 | |
| Cost of Shares redeemed | | | (2,639,515 | ) | | | (28,391,878 | ) | | | (4,425,321 | ) | | | (47,409,661 | ) | | | (700,697 | ) | | | (30,599,001 | ) | | | (3,038,693 | ) | | | (121,370,943 | ) |
| Change from Class A Share Transactions | | | (378,155 | ) | | | (3,889,972 | ) | | | (2,356,716 | ) | | | (25,425,772 | ) | | | (532,936 | ) | | | (23,160,162 | ) | | | (2,600,034 | ) | | | (102,928,116 | ) |
| Class C | | | | | | | | | | | | | | | | | | | | | | | | | | | | | | | | |
| Proceeds from Shares issued | | | 1,208,385 | | | | 12,893,719 | | | | 452,578 | | | | 4,885,903 | | | | 41,324 | | | | 1,692,900 | | | | 102,760 | | | | 3,910,653 | |
| Reinvestment of distributions | | | 119,434 | | | | 1,270,064 | | | | 225,722 | | | | 2,369,234 | | | | 39,440 | | | | 1,622,944 | | | | 36,988 | | | | 1,407,007 | |
| Cost of Shares redeemed | | | (2,514,887 | ) | | | (26,729,797 | ) | | | (3,811,829 | ) | | | (40,183,323 | ) | | | (277,487 | ) | | | (11,261,327 | ) | | | (316,569 | ) | | | (12,745,519 | ) |
| Change from Class C Share Transactions | | | (1,187,068 | ) | | | (12,566,014 | ) | | | (3,133,529 | ) | | | (32,928,186 | ) | | | (196,723 | ) | | | (7,945,483 | ) | | | (176,821 | ) | | | (7,427,859 | ) |
| Class Y | | | | | | | | | | | | | | | | | | | | | | | | | | | | | | | | |
| Proceeds from Shares issued | | | 20,459,737 | | | | 222,117,191 | | | | 18,247,422 | | | | 195,823,059 | | | | 600,464 | | | | 26,350,973 | | | | 1,053,846 | | | | 46,002,011 | |
| Reinvestment of distributions | | | 1,516,299 | | | | 16,400,965 | | | | 2,050,335 | | | | 21,908,828 | | | | 1,186,386 | | | | 53,056,756 | | | | 995,011 | | | | 40,275,173 | |
| Cost of Shares redeemed | | | (18,501,937 | ) | | | (195,714,021 | ) | | | (35,608,601 | ) | | | (380,268,509 | ) | | | (3,696,500 | ) | | | (160,703,579 | ) | | | (3,995,235 | ) | | | (172,060,584 | ) |
| Change from Class Y Share Transactions | | | 3,474,099 | | | | 42,804,135 | | | | (15,310,844 | ) | | | (162,536,622 | ) | | | (1,909,650 | ) | | | (81,295,850 | ) | | | (1,946,378 | ) | | | (85,783,400 | ) |
| Institutional Class | | | | | | | | | | | | | | | | | | | | | | | | | | | | | | | | |
| Proceeds from Shares issued | | | 1,723,705 | | | | 18,730,017 | | | | 4,047,381 | | | | 43,141,969 | | | | 161,940 | | | | 7,140,567 | | | | 448,768 | | | | 19,693,152 | |
| Reinvestment of distributions | | | 129,615 | | | | 1,405,196 | | | | 275,960 | | | | 2,947,628 | | | | 31,825 | | | | 1,430,530 | | | | 27,623 | | | | 1,121,274 | |
| Cost of Shares redeemed | | | (4,778,658 | ) | | | (51,849,737 | ) | | | (6,822,189 | ) | | | (73,080,944 | ) | | | (459,600 | ) | | | (20,743,450 | ) | | | (314,123 | ) | | | (14,073,288 | ) |
| Change from Institutional Class Share Transactions | | | (2,925,338 | ) | | | (31,714,524 | ) | | | (2,498,848 | ) | | | (26,991,347 | ) | | | (265,835 | ) | | | (12,172,353 | ) | | | 162,268 | | | | 6,741,138 | |
| Change from Share Transactions | | | (1,016,462 | ) | | $ | (5,366,375 | ) | | | (23,299,937 | ) | | $ | (247,881,927 | ) | | | (2,905,144 | ) | | $ | (124,573,848 | ) | | | (4,560,965 | ) | | $ | (189,398,237 | ) |
See accompanying Notes to Financial Statements.
Statements of Changes in Net Assets - Capital Stock Activity (Continued)
| Touchstone Global | | | | | | Touchstone Growth | |
| ESG Equity Fund | | | | | | Opportunities Fund | |
| For the Year | | | For the Year | | | For the Year | | | For the Year | |
| Ended | | | Ended | | | Ended | | | Ended | |
| March 31, 2020 | | | March 31, 2019 | | | March 31, 2020 | | | March 31, 2019 | |
| Shares | | | Dollars | | | Shares | | | Dollars | | | Shares | | | Dollars | | | Shares | | | Dollars | |
| | | | | | | | | | | | | | | | | | | | | | | | | | | | | | | |
| | 493,946 | | | $ | 10,169,304 | | | | 1,392,791 | | | $ | 28,628,010 | | | | 61,496 | | | $ | 2,058,524 | | | | 176,314 | | | $ | 5,490,184 | |
| | 454,776 | | | | 9,783,738 | | | | 1,932,411 | | | | 37,482,138 | | | | 201,139 | | | | 6,464,623 | | | | 114,276 | | | | 3,342,578 | |
| | (2,689,637 | ) | | | (54,785,146 | ) | | | (3,021,622 | ) | | | (65,404,158 | ) | | | (229,675 | ) | | | (7,684,999 | ) | | | (210,808 | ) | | | (6,826,628 | ) |
| | (1,740,915 | ) | | | (34,832,104 | ) | | | 303,580 | | | | 705,990 | | | | 32,960 | | | | 838,148 | | | | 79,782 | | | | 2,006,134 | |
| | 39,062 | | | | 670,788 | | | | 120,812 | | | | 2,209,583 | | | | 15,450 | | | | 391,648 | | | | 13,543 | | | | 484,879 | |
| | 12,459 | | | | 220,907 | | | | 172,361 | | | | 2,792,251 | | | | 20,275 | | | | 495,111 | | | | 36,254 | | | | 850,868 | |
| | (368,405 | ) | | | (6,248,381 | ) | | | (1,405,396 | ) | | | (24,311,446 | ) | | | (54,735 | ) | | | (1,451,229 | ) | | | (222,708 | ) | | | (5,650,815 | ) |
| | (316,884 | ) | | | (5,356,686 | ) | | | (1,112,223 | ) | | | (19,309,612 | ) | | | (19,010 | ) | | | (564,470 | ) | | | (172,911 | ) | | | (4,315,068 | ) |
| | 2,590,628 | | | | 54,554,611 | | | | 4,383,342 | | | | 96,836,936 | | | | 445,257 | | | | 15,830,929 | | | | 112,147 | | | | 3,813,714 | |
| | 215,559 | | | | 4,821,697 | | | | 819,591 | | | | 16,471,978 | | | | 98,237 | | | | 3,286,034 | | | | 132,809 | | | | 4,009,404 | |
| | (5,034,185 | ) | | | (106,875,253 | ) | | | (3,525,483 | ) | | | (76,466,172 | ) | | | (922,991 | ) | | | (32,183,620 | ) | | | (362,870 | ) | | | (12,173,920 | ) |
| | (2,227,998 | ) | | | (47,498,945 | ) | | | 1,677,450 | | | | 36,842,742 | | | | (379,497 | ) | | | (13,066,657 | ) | | | (117,914 | ) | | | (4,350,802 | ) |
| | 369,505 | | | | 7,892,739 | | | | 757,385 | | | | 16,616,972 | | | | 1,759,821 | | | | 61,464,438 | | | | 750,211 | | | | 26,690,785 | |
| | 42,505 | | | | 951,605 | | | | 208,677 | | | | 4,204,447 | | | | 284,991 | | | | 9,684,009 | | | | 587,087 | | | | 17,953,552 | |
| | (1,315,432 | ) | | | (25,333,591 | ) | | | (673,399 | ) | | | (13,225,268 | ) | | | (873,870 | ) | | | (30,504,869 | ) | | | (4,703,861 | ) | | | (140,236,112 | ) |
| | (903,422 | ) | | | (16,489,247 | ) | | | 292,663 | | | | 7,596,151 | | | | 1,170,942 | | | | 40,643,578 | | | | (3,366,563 | ) | | | (95,591,775 | ) |
| | (5,189,219 | ) | | $ | (104,176,982 | ) | | | 1,161,470 | | | $ | 25,835,271 | | | | 805,395 | | | $ | 27,850,599 | | | | (3,577,606 | ) | | $ | (102,251,511 | ) |
Statements of Changes in Net Assets - Capital Stock Activity (Continued)
| | | Touchstone Mid Cap | | | Touchstone Sands Capital | |
| | | Growth Fund | | | Emerging Markets Growth Fund | |
| | | For the Year | | | For the Year | | | For the Year | | | For the Year | |
| | | Ended | | | Ended | | | Ended | | | Ended | |
| | | March 31, 2020(A) | | | March 31, 2019 | | | March 31, 2020 | | | March 31, 2019(B) | |
| | | Shares | | | Dollars | | | Shares | | | Dollars | | | Shares | | | Dollars | | | Shares | | | Dollars | |
| Class A | | | | | | | | | | | | | | | | | | | | | | | | | | | | | | | | |
| Proceeds from Shares issued | | | 2,138,686 | | | $ | 65,838,474 | | | | 2,530,737 | | | $ | 69,220,088 | | | | 301,881 | | | $ | 4,037,079 | | | | 103,927 | | | $ | 1,276,203 | |
| Reinvestment of distributions | | | 586,059 | | | | 18,135,023 | | | | 490,513 | | | | 12,478,658 | | | | 633 | | | | 9,119 | | | | — | | | | — | |
| Cost of Shares redeemed | | | (2,281,110 | ) | | | (69,290,691 | ) | | | (1,849,658 | ) | | | (53,198,198 | ) | | | (150,007 | ) | | | (1,979,207 | ) | | | (1,311 | ) | | | (15,793 | ) |
| Change from Class A Share Transactions | | | 443,635 | | | | 14,682,806 | | | | 1,171,592 | | | | 28,500,548 | | | | 152,507 | | | | 2,066,991 | | | | 102,616 | | | | 1,260,410 | |
| Class C | | | | | | | | | | | | | | | | | | | | | | | | | | | | | | | | |
| Proceeds from Shares issued | | | 232,703 | | | | 4,339,937 | | | | 333,219 | | | | 6,547,161 | | | | 101,370 | | | | 1,406,635 | | | | 4,716 | | | | 56,188 | |
| Reinvestment of distributions | | | 155,736 | | | | 2,823,487 | | | | 552,670 | | | | 8,704,555 | | | | 153 | | | | 2,194 | | | | — | | | | — | |
| Cost of Shares redeemed | | | (768,088 | ) | | | (14,216,136 | ) | | | (4,024,501 | ) | | | (69,115,679 | ) | | | (5,214 | ) | | | (65,430 | ) | | | (223 | ) | | | (2,537 | ) |
| Change from Class C Share Transactions | | | (379,649 | ) | | | (7,052,712 | ) | | | (3,138,612 | ) | | | (53,863,963 | ) | | | 96,309 | | | | 1,343,399 | | | | 4,493 | | | | 53,651 | |
| Class Y | | | | | | | | | | | | | | | | | | | | | | | | | | | | | | | | |
| Proceeds from Shares issued | | | 6,073,933 | | | | 187,749,638 | | | | 5,652,098 | | | | 167,673,486 | | | | 21,621,094 | | | | 290,726,041 | | | | 18,151,658 | | | | 223,814,446 | |
| Reinvestment of distributions | | | 998,794 | | | | 32,392,481 | | | | 1,026,643 | | | | 27,195,777 | | | | 167,769 | | | | 2,422,593 | | | | — | | | | — | |
| Cost of Shares redeemed | | | (5,609,694 | ) | | | (179,197,024 | ) | | | (4,765,491 | ) | | | (138,073,175 | ) | | | (8,698,323 | ) | | | (113,245,684 | ) | | | (9,251,596 | ) | | | (109,485,928 | ) |
| Change from Class Y Share Transactions | | | 1,463,033 | | | | 40,945,095 | | | | 1,913,250 | | | | 56,796,088 | | | | 13,090,540 | | | | 179,902,950 | | | | 8,900,062 | | | | 114,328,518 | |
| Institutional Class | | | | | | | | | | | | | | | | | | | | | | | | | | | | | | | | |
| Proceeds from Shares issued | | | 6,573,558 | | | | 212,452,733 | | | | 10,783,290 | | | | 331,066,959 | | | | 47,823,401 | | | | 639,645,558 | | | | 23,807,151 | | | | 295,926,159 | |
| Reinvestment of distributions | | | 769,260 | | | | 25,222,235 | | | | 797,551 | | | | 21,334,480 | | | | 340,034 | | | | 4,930,489 | | | | — | | | | — | |
| Cost of Shares redeemed | | | (5,111,765 | ) | | | (161,621,938 | ) | | | (3,465,413 | ) | | | (99,571,305 | ) | | | (10,574,079 | ) | | | (140,181,168 | ) | | | (11,615,625 | ) | | | (137,208,532 | ) |
| Change from Institutional Class Share Transactions | | | 2,231,053 | | | | 76,053,030 | | | | 8,115,428 | | | | 252,830,134 | | | | 37,589,356 | | | | 504,394,879 | | | | 12,191,526 | | | | 158,717,627 | |
| Class R6 | | | | | | | | | | | | | | | | | | | | | | | | | | | | | | | | |
| Proceeds from Shares issued | | | 70 | | | | 2,500 | | | | — | | | | — | | | | — | | | | — | | | | — | | | | — | |
| Change from Share Transactions | | | 3,758,142 | | | $ | 124,630,719 | | | | 8,061,658 | | | $ | 284,262,807 | | | | 50,928,712 | | | $ | 687,708,219 | | | | 21,198,697 | | | $ | 274,360,206 | |
| (A) | Represents the period from commencement of operations (February 10, 2020) through March 31, 2020 for Class R6. |
| (B) | Represents the period from commencement of operations (November 16, 2018) through March 31, 2019 for Class A and Class C. |
See accompanying Notes to Financial Statements.
Financial Highlights
Touchstone Flexible Income Fund—Class A
Selected Data for a Share Outstanding Throughout Each Period
| | | Year Ended March 31, | |
| | | 2020 | | | 2019 | | | 2018 | | | 2017 | | | 2016 | |
| Net asset value at beginning of period | | $ | 10.75 | | | $ | 10.81 | | | $ | 10.71 | | | $ | 10.58 | | | $ | 10.67 | |
| Income (loss) from investment operations: | | | | | | | | | | | | | | | | | | | | |
| Net investment income | | | 0.34 | | | | 0.39 | | | | 0.26 | | | | 0.30 | | | | 0.32 | |
| Net realized and unrealized gains (losses) on investments | | | (0.68 | ) | | | (0.01 | ) | | | 0.11 | | | | 0.11 | | | | (0.10 | ) |
| Total from investment operations | | | (0.34 | ) | | | 0.38 | | | | 0.37 | | | | 0.41 | | | | 0.22 | |
| Distributions from: | | | | | | | | | | | | | | | | | | | | |
| Net investment income | | | (0.36 | ) | | | (0.38 | ) | | | (0.27 | ) | | | (0.28 | ) | | | (0.31 | ) |
| Realized capital gains | | | — | | | | (0.06 | ) | | | — | | | | — | | | | — | |
| Total distributions | | | (0.36 | ) | | | (0.44 | ) | | | (0.27 | ) | | | (0.28 | ) | | | (0.31 | ) |
| Net asset value at end of period | | $ | 10.05 | | | $ | 10.75 | | | $ | 10.81 | | | $ | 10.71 | | | $ | 10.58 | |
| Total return(A) | | | (3.33 | %) | | | 3.59 | % | | | 3.46 | % | | | 3.93 | % | | | 2.13 | % |
| Ratios and supplemental data: | | | | | | | | | | | | | | | | | | | | |
| Net assets at end of period (000's) | | $ | 99,460 | | | $ | 110,460 | | | $ | 136,609 | | | $ | 49,544 | | | $ | 57,671 | |
| Ratio to average net assets: | | | | | | | | | | | | | | | | | | | | |
| Net expenses (including dividend and interest expense on securities sold short) | | | 1.05 | %(B) | | | 1.04 | % | | | 1.06 | %(B) | | | 1.10 | %(B) | | | 1.09 | % |
| Gross expenses (including dividend and interest expense on securities sold short) | | | 1.14 | %(C) | | | 1.11 | % | | | 1.14 | %(C) | | | 1.30 | %(C) | | | 1.32 | % |
| | | | | | | | | | | | | | | | | | | | |
| Net investment income | | | 3.12 | % | | | 3.50 | % | | | 2.60 | % | | | 2.74 | % | | | 3.19 | % |
| Portfolio turnover rate | | | 136 | % | | | 171 | % | | | 100 | %(D) | | | 127 | % | | | 122 | % |
Touchstone Flexible Income Fund—Class C
Selected Data for a Share Outstanding Throughout Each Period
| | | Year Ended March 31, | |
| | | 2020 | | | 2019 | | | 2018 | | | 2017 | | | 2016 | |
| Net asset value at beginning of period | | $ | 10.60 | | | $ | 10.67 | | | $ | 10.57 | | | $ | 10.44 | | | $ | 10.54 | |
| Income (loss) from investment operations: | | | | | | | | | | | | | | | | | | | | |
| Net investment income | | | 0.24 | | | | 0.30 | | | | 0.20 | | | | 0.20 | | | | 0.26 | |
| Net realized and unrealized gains (losses) on investments | | | (0.66 | ) | | | (0.01 | ) | | | 0.09 | | | | 0.13 | | | | (0.12 | ) |
| Total from investment operations | | | (0.42 | ) | | | 0.29 | | | | 0.29 | | | | 0.33 | | | | 0.14 | |
| Distributions from: | | | | | | | | | | | | | | | | | | | | |
| Net investment income | | | (0.28 | ) | | | (0.30 | ) | | | (0.19 | ) | | | (0.20 | ) | | | (0.24 | ) |
| Realized capital gains | | | — | | | | (0.06 | ) | | | — | | | | — | | | | — | |
| Total distributions | | | (0.28 | ) | | | (0.36 | ) | | | (0.19 | ) | | | (0.20 | ) | | | (0.24 | ) |
| Net asset value at end of period | | $ | 9.90 | | | $ | 10.60 | | | $ | 10.67 | | | $ | 10.57 | | | $ | 10.44 | |
| Total return(A) | | | (4.09 | %) | | | 2.77 | % | | | 2.73 | % | | | 3.22 | % | | | 1.32 | % |
| Ratios and supplemental data: | | | | | | | | | | | | | | | | | | | | |
| Net assets at end of period (000's) | | $ | 50,767 | | | $ | 66,926 | | | $ | 100,800 | | | $ | 55,043 | | | $ | 45,079 | |
| Ratio to average net assets: | | | | | | | | | | | | | | | | | | | | |
| Net expenses (including dividend and interest expense on securities sold short) | | | 1.80 | %(B) | | | 1.79 | % | | | 1.81 | %(B) | | | 1.85 | %(B) | | | 1.84 | % |
| Gross expenses (including dividend and interest expense on securities sold short) | | | 1.91 | %(C) | | | 1.86 | % | | | 1.89 | %(C) | | | 2.00 | %(C) | | | 2.05 | % |
| Net investment income | | | 2.37 | % | | | 2.75 | % | | | 1.85 | % | | | 1.99 | % | | | 2.44 | % |
| Portfolio turnover rate | | | 136 | % | | | 171 | % | | | 100 | %(D) | | | 127 | % | | | 122 | % |
| (A) | Total returns shown exclude the effect of applicable sales loads and fees. If these charges were included, the returns would be lower. |
| (B) | The ratio of net expenses to average net assets excluding dividend and interest expense on securities sold short for Class A was 1.04%, 1.06% and 1.09% and for Class C was 1.79%, 1.81% and 1.84% for the years ended March 31, 2020, 2018 and 2017, respectively. |
| (C) | The ratio of gross expenses to average net assets excluding dividend and interest expense on securities sold short for Class A was 1.13%, 1.14% and 1.29% and for Class C was 1.90%, 1.89% and 1.99% for the years ended March 31, 2020, 2018 and 2017, respectively. |
| (D) | Portfolio turnover excludes the purchases and sales of securities of the Sentinel Multi-Asset Income Fund acquired on October 27, 2017. If these transactions were included, portfolio turnover would have been higher. |
See accompanying Notes to Financial Statements.
Financial Highlights (Continued)
Touchstone Flexible Income Fund—Class Y
Selected Data for a Share Outstanding Throughout Each Period
| | | Year Ended March 31, | |
| | | 2020 | | | 2019 | | | 2018 | | | 2017 | | | 2016 | |
| Net asset value at beginning of period | | $ | 10.78 | | | $ | 10.85 | | | $ | 10.75 | | | $ | 10.61 | | | $ | 10.70 | |
| Income (loss) from investment operations: | | | | | | | | | | | | | | | | | | | | |
| Net investment income | | | 0.37 | | | | 0.42 | | | | 0.31 | | | | 0.32 | | | | 0.36 | |
| Net realized and unrealized gains (losses) on investments | | | (0.68 | ) | | | (0.02 | ) | | | 0.09 | | | | 0.13 | | | | (0.11 | ) |
| Total from investment operations | | | (0.31 | ) | | | 0.40 | | | | 0.40 | | | | 0.45 | | | | 0.25 | |
| Distributions from: | | | | | | | | | | | | | | | | | | | | |
| Net investment income | | | (0.39 | ) | | | (0.41 | ) | | | (0.30 | ) | | | (0.31 | ) | | | (0.34 | ) |
| Realized capital gains | | | — | | | | (0.06 | ) | | | — | | | | — | | | | — | |
| Total distributions | | | (0.39 | ) | | | (0.47 | ) | | | (0.30 | ) | | | (0.31 | ) | | | (0.34 | ) |
| Net asset value at end of period | | $ | 10.08 | | | $ | 10.78 | | | $ | 10.85 | | | $ | 10.75 | | | $ | 10.61 | |
| Total return | | | (3.07 | %) | | | 3.75 | % | | | 3.71 | % | | | 4.28 | % | | | 2.38 | % |
| Ratios and supplemental data: | | | | | | | | | | | | | | | | | | | | |
| Net assets at end of period (000's) | | $ | 464,910 | | | $ | 459,861 | | | $ | 628,693 | | | $ | 464,002 | | | $ | 358,423 | |
| Ratio to average net assets: | | | | | | | | | | | | | | | | | | | | |
| Net expenses (including dividend and interest expense on securities sold short) | | | 0.80 | %(A) | | | 0.79 | % | | | 0.82 | %(A) | | | 0.85 | %(A) | | | 0.84 | % |
| Gross expenses (including dividend and interest expense on securities sold short) | | | 0.87 | %(B) | | | 0.84 | % | | | 0.90 | %(B) | | | 1.00 | %(B) | | | 1.05 | % |
| Net investment income | | | 3.37 | % | | | 3.75 | % | | | 2.84 | % | | | 2.99 | % | | | 3.44 | % |
| Portfolio turnover rate | | | 136 | % | | | 171 | % | | | 100 | %(C) | | | 127 | % | | | 122 | % |
Touchstone Flexible Income Fund—Institutional Class
Selected Data for a Share Outstanding Throughout Each Period
| | | Year Ended March 31, | |
| | | 2020 | | | 2019 | | | 2018 | | | 2017 | | | 2016 | |
| Net asset value at beginning of period | | $ | 10.78 | | | $ | 10.84 | | | $ | 10.74 | | | $ | 10.60 | | | $ | 10.69 | |
| Income (loss) from investment operations: | | | | | | | | | | | | | | | | | | | | |
| Net investment income | | | 0.40 | | | | 0.44 | | | | 0.33 | | | | 0.33 | | | | 0.36 | |
| Net realized and unrealized gains (losses) on investments | | | (0.70 | ) | | | (0.02 | ) | | | 0.08 | | | | 0.13 | | | | (0.10 | ) |
| Total from investment operations | | | (0.30 | ) | | | 0.42 | | | | 0.41 | | | | 0.46 | | | | 0.26 | |
| Distributions from: | | | | | | | | | | | | | | | | | | | | |
| Net investment income | | | (0.40 | ) | | | (0.42 | ) | | | (0.31 | ) | | | (0.32 | ) | | | (0.35 | ) |
| Realized capital gains | | | — | | | | (0.06 | ) | | | — | | | | — | | | | — | |
| Total distributions | | | (0.40 | ) | | | (0.48 | ) | | | (0.31 | ) | | | (0.32 | ) | | | (0.35 | ) |
| Net asset value at end of period | | $ | 10.08 | | | $ | 10.78 | | | $ | 10.84 | | | $ | 10.74 | | | $ | 10.60 | |
| Total return | | | (3.02 | %) | | | 3.95 | % | | | 3.81 | % | | | 4.28 | % | | | 2.57 | % |
| Ratios and supplemental data: | | | | | | | | | | | | | | | | | | | | |
| Net assets at end of period (000's) | | $ | 25,798 | | | $ | 59,138 | | | $ | 86,578 | | | $ | 104,631 | | | $ | 82,286 | |
| Ratio to average net assets: | | | | | | | | | | | | | | | | | | | | |
| Net expenses (including dividend and interest expense on securities sold short) | | | 0.70 | %(A) | | | 0.69 | % | | | 0.72 | %(A) | | | 0.75 | %(A) | | | 0.74 | % |
| Gross expenses (including dividend and interest expense on securities sold short) | | | 0.88 | %(B) | | | 0.82 | % | | | 0.86 | %(B) | | | 0.92 | %(B) | | | 0.94 | % |
| Net investment income | | | 3.47 | % | | | 3.85 | % | | | 2.94 | % | | | 3.09 | % | | | 3.54 | % |
| Portfolio turnover rate | | | 136 | % | | | 171 | % | | | 100 | %(C) | | | 127 | % | | | 122 | % |
| (A) | The ratio of net expenses to average net assets excluding dividend and interest expense on securities sold short for Class Y was 0.79%, 0.82% and 0.84% and for Institutional Class was 0.69%, 0.72% and 0.74% for the years ended March 31, 2020, 2018 and 2017, respectively. |
| (B) | The ratio of gross expenses to average net assets excluding dividend and interest expense on securities sold short for Class Y was 0.86%, 0.90% and 0.99% and for Institutional Class was 0.87%, 0.86% and 0.91% for the years ended March 31, 2020, 2018 and 2017, respectively. |
| (C) | Portfolio turnover excludes the purchases and sales of securities of the Sentinel Multi-Asset Income Fund acquired on October 27, 2017. If these transactions were included, portfolio turnover would have been higher. |
See accompanying Notes to Financial Statements.
Financial Highlights (Continued)
Touchstone Focused Fund—Class A
Selected Data for a Share Outstanding Throughout Each Period
| | | Year Ended March 31, | |
| | | 2020 | | | 2019 | | | 2018 | | | 2017 | | | 2016 | |
| Net asset value at beginning of period | | $ | 42.68 | | | $ | 42.93 | | | $ | 41.47 | | | $ | 36.68 | | | $ | 37.19 | |
| Income (loss) from investment operations: | | | | | | | | | | | | | | | | | | | | |
| Net investment income(A) | | | 0.14 | | | | 0.14 | | | | 0.17 | | | | 0.15 | | | | 0.16 | |
| Net realized and unrealized gains (losses) on investments | | | (3.56 | ) | | | 1.39 | | | | 4.02 | | | | 5.12 | | | | 0.38 | |
| Total from investment operations | | | (3.42 | ) | | | 1.53 | | | | 4.19 | | | | 5.27 | | | | 0.54 | |
| Distributions from: | | | | | | | | | | | | | | | | | | | | |
| Net investment income | | | (0.10 | ) | | | (0.01 | ) | | | — | | | | (0.14 | ) | | | (0.20 | ) |
| Realized capital gains | | | (2.71 | ) | | | (1.77 | ) | | | (2.73 | ) | | | (0.34 | ) | | | (0.85 | ) |
| Total distributions | | | (2.81 | ) | | | (1.78 | ) | | | (2.73 | ) | | | (0.48 | ) | | | (1.05 | ) |
| Net asset value at end of period | | $ | 36.45 | | | $ | 42.68 | | | $ | 42.93 | | | $ | 41.47 | | | $ | 36.68 | |
| Total return(B) | | | (9.14 | %) | | | 3.82 | % | | | 10.13 | % | | | 14.45 | % | | | 1.47 | % |
| Ratios and supplemental data: | | | | | | | | | | | | | | | | | | | | |
| Net assets at end of period (000's) | | $ | 27,889 | | | $ | 55,399 | | | $ | 167,354 | | | $ | 425,366 | | | $ | 405,458 | |
| Ratio to average net assets: | | | | | | | | | | | | | | | | | | | | |
| Net expenses | | | 1.20 | %(C) | | | 1.20 | % | | | 1.20 | % | | | 1.20 | % | | | 1.20 | % |
| Gross expenses | | | 1.19 | % | | | 1.32 | % | | | 1.29 | % | | | 1.28 | % | | | 1.31 | % |
| Net investment income | | | 0.31 | % | | | 0.32 | % | | | 0.40 | % | | | 0.39 | % | | | 0.43 | % |
| Portfolio turnover rate | | | 13 | % | | | 12 | % | | | 8 | %(D) | | | 20 | % | | | 28 | % |
Touchstone Focused Fund—Class C
Selected Data for a Share Outstanding Throughout Each Period
| | | Year Ended March 31, | |
| | | 2020 | | | 2019 | | | 2018 | | | 2017 | | | 2016 | |
| Net asset value at beginning of period | | $ | 40.26 | | | $ | 40.89 | | | $ | 39.90 | | | $ | 35.54 | | | $ | 36.34 | |
| Income (loss) from investment operations: | | | | | | | | | | | | | | | | | | | | |
| Net investment loss(A) | | | (0.18 | ) | | | (0.18 | ) | | | (0.14 | ) | | | (0.13 | ) | | | (0.11 | ) |
| Net realized and unrealized gains (losses) on investments | | | (3.31 | ) | | | 1.32 | | | | 3.86 | | | | 4.94 | | | | 0.37 | |
| Total from investment operations | | | (3.49 | ) | | | 1.14 | | | | 3.72 | | | | 4.81 | | | | 0.26 | |
| Distributions from: | | | | | | | | | | | | | | | | | | | | |
| Net investment income | | | — | | | | — | | | | — | | | | (0.11 | ) | | | (0.21 | ) |
| Realized capital gains | | | (2.71 | ) | | | (1.77 | ) | | | (2.73 | ) | | | (0.34 | ) | | | (0.85 | ) |
| Total distributions | | | (2.71 | ) | | | (1.77 | ) | | | (2.73 | ) | | | (0.45 | ) | | | (1.06 | ) |
| Net asset value at end of period | | $ | 34.06 | | | $ | 40.26 | | | $ | 40.89 | | | $ | 39.90 | | | $ | 35.54 | |
| Total return(B) | | | (9.80 | %) | | | 3.03 | % | | | 9.34 | % | | | 13.56 | % | | | 0.73 | % |
| Ratios and supplemental data: | | | | | | | | | | | | | | | | | | | | |
| Net assets at end of period (000's) | | $ | 21,961 | | | $ | 33,875 | | | $ | 41,635 | | | $ | 53,776 | | | $ | 44,338 | |
| Ratio to average net assets: | | | | | | | | | | | | | | | | | | | | |
| Net expenses | | | 1.95 | % | | | 1.95 | % | | | 1.94 | % | | | 1.95 | % | | | 1.95 | % |
| Gross expenses | | | 1.98 | % | | | 1.95 | % | | | 1.94 | % | | | 1.97 | % | | | 2.00 | % |
| Net investment loss | | | (0.44 | %) | | | (0.43 | %) | | | (0.34 | %) | | | (0.36 | %) | | | (0.32 | %) |
| Portfolio turnover rate | | | 13 | % | | | 12 | % | | | 8 | %(D) | | | 20 | % | | | 28 | % |
| (A) | The net investment income (loss) per share was based on average shares outstanding for the period. |
| (B) | Total returns shown exclude the effect of applicable sales loads and fees. If these charges were included, the returns would be lower. |
| (C) | Net expenses include amounts recouped by the Advisor. |
| (D) | Portfolio turnover excludes securities delivered from processing a redemption-in-kind. |
See accompanying Notes to Financial Statements.
Financial Highlights (Continued)
Touchstone Focused Fund—Class Y
Selected Data for a Share Outstanding Throughout Each Period
| | | Year Ended March 31, | |
| | | 2020 | | | 2019 | | | 2018 | | | 2017 | | | 2016 | |
| Net asset value at beginning of period | | $ | 43.12 | | | $ | 43.50 | | | $ | 42.21 | | | $ | 37.29 | | | $ | 37.76 | |
| Income (loss) from investment operations: | | | | | | | | | | | | | | | | | | | | |
| Net investment income(A) | | | 0.26 | | | | 0.27 | | | | 0.31 | | | | 0.27 | | | | 0.26 | |
| Net realized and unrealized gains (losses) on investments | | | (3.58 | ) | | | 1.39 | | | | 4.08 | | | | 5.22 | | | | 0.39 | |
| Total from investment operations | | | (3.32 | ) | | | 1.66 | | | | 4.39 | | | | 5.49 | | | | 0.65 | |
| Distributions from: | | | | | | | | | | | | | | | | | | | | |
| Net investment income | | | (0.27 | ) | | | (0.27 | ) | | | (0.37 | ) | | | (0.23 | ) | | | (0.27 | ) |
| Realized capital gains | | | (2.71 | ) | | | (1.77 | ) | | | (2.73 | ) | | | (0.34 | ) | | | (0.85 | ) |
| Total distributions | | | (2.98 | ) | | | (2.04 | ) | | | (3.10 | ) | | | (0.57 | ) | | | (1.12 | ) |
| Net asset value at end of period | | $ | 36.82 | | | $ | 43.12 | | | $ | 43.50 | | | $ | 42.21 | | | $ | 37.29 | |
| Total return | | | (8.86 | %) | | | 4.13 | % | | | 10.43 | % | | | 14.77 | % | | | 1.75 | % |
| Ratios and supplemental data: | | | | | | | | | | | | | | | | | | | | |
| Net assets at end of period (000's) | | $ | 680,934 | | | $ | 879,704 | | | $ | 972,273 | | | $ | 974,660 | | | $ | 853,900 | |
| Ratio to average net assets: | | | | | | | | | | | | | | | | | | | | |
| Net expenses | | | 0.91 | % | | | 0.91 | % | | | 0.91 | % | | | 0.92 | % | | | 0.93 | % |
| Gross expenses | | | 0.91 | % | | | 0.91 | % | | | 0.91 | % | | | 0.92 | % | | | 0.94 | % |
| Net investment income | | | 0.60 | % | | | 0.61 | % | | | 0.69 | % | | | 0.68 | % | | | 0.70 | % |
| Portfolio turnover rate | | | 13 | % | | | 12 | % | | | 8 | %(B) | | | 20 | % | | | 28 | % |
Touchstone Focused Fund—Institutional Class
Selected Data for a Share Outstanding Throughout Each Period
| | | Year Ended March 31, | |
| | | 2020 | | | 2019 | | | 2018 | | | 2017 | | | 2016 | |
| Net asset value at beginning of period | | $ | 43.30 | | | $ | 43.68 | | | $ | 42.38 | | | $ | 37.45 | | | $ | 37.91 | |
| Income (loss) from investment operations: | | | | | | | | | | | | | | | | | | | | |
| Net investment income(A) | | | 0.30 | | | | 0.30 | | | | 0.34 | | | | 0.30 | | | | 0.31 | |
| Net realized and unrealized gains (losses) on investments | | | (3.60 | ) | | | 1.39 | | | | 4.11 | | | | 5.24 | | | | 0.39 | |
| Total from investment operations | | | (3.30 | ) | | | 1.69 | | | | 4.45 | | | | 5.54 | | | | 0.70 | |
| Distributions from: | | | | | | | | | | | | | | | | | | | | |
| Net investment income | | | (0.31 | ) | | | (0.30 | ) | | | (0.42 | ) | | | (0.27 | ) | | | (0.31 | ) |
| Realized capital gains | | | (2.71 | ) | | | (1.77 | ) | | | (2.73 | ) | | | (0.34 | ) | | | (0.85 | ) |
| Total distributions | | | (3.02 | ) | | | (2.07 | ) | | | (3.15 | ) | | | (0.61 | ) | | | (1.16 | ) |
| Net asset value at end of period | | $ | 36.98 | | | $ | 43.30 | | | $ | 43.68 | | | $ | 42.38 | | | $ | 37.45 | |
| Total return | | | (8.79 | %) | | | 4.20 | % | | | 10.54 | % | | | 14.84 | % | | | 1.89 | % |
| Ratios and supplemental data: | | | | | | | | | | | | | | | | | | | | |
| Net assets at end of period (000's) | | $ | 15,267 | | | $ | 29,382 | | | $ | 22,556 | | | $ | 41,389 | | | $ | 48,805 | |
| Ratio to average net assets: | | | | | | | | | | | | | | | | | | | | |
| Net expenses | | | 0.83 | % | | | 0.83 | % | | | 0.83 | % | | | 0.83 | % | | | 0.82 | % |
| Gross expenses | | | 0.92 | % | | | 0.92 | % | | | 0.92 | % | | | 0.88 | % | | | 0.90 | % |
| Net investment income | | | 0.68 | % | | | 0.69 | % | | | 0.77 | % | | | 0.76 | % | | | 0.81 | % |
| Portfolio turnover rate | | | 13 | % | | | 12 | % | | | 8 | %(B) | | | 20 | % | | | 28 | % |
| (A) | The net investment income per share was based on average shares outstanding for the period. |
| (B) | Portfolio turnover excludes securities delivered from processing a redemption-in-kind. |
See accompanying Notes to Financial Statements.
Financial Highlights (Continued)
Touchstone Global ESG Equity Fund—Class A
Selected Data for a Share Outstanding Throughout Each Period
| | | Year Ended March 31, | |
| | | 2020 | | | 2019 | | | 2018 | | | 2017 | | | 2016 | |
| Net asset value at beginning of period | | $ | 19.94 | | | $ | 22.01 | | | $ | 21.52 | | | $ | 18.98 | | | $ | 30.96 | |
| Income (loss) from investment operations: | | | | | | | | | | | | | | | | | | | | |
| Net investment income | | | 0.17 | (A) | | | 0.15 | | | | 0.03 | | | | 0.18 | | | | 0.06 | (A) |
| Net realized and unrealized gains (losses) on investments | | | (2.78 | ) | | | (0.29 | ) | | | 3.37 | | | | 2.47 | | | | (1.99 | ) |
| Total from investment operations | | | (2.61 | ) | | | (0.14 | ) | | | 3.40 | | | | 2.65 | | | | (1.93 | ) |
| Distributions from: | | | | | | | | | | | | | | | | | | | | |
| Net investment income | | | (0.15 | ) | | | (0.17 | ) | | | (0.17 | ) | | | (0.11 | ) | | | (0.03 | ) |
| Realized capital gains | | | (0.34 | ) | | | (1.76 | ) | | | (2.74 | ) | | | — | | | | (10.02 | ) |
| Total distributions | | | (0.49 | ) | | | (1.93 | ) | | | (2.91 | ) | | | (0.11 | ) | | | (10.05 | ) |
| Net asset value at end of period | | $ | 16.84 | | | $ | 19.94 | | | $ | 22.01 | | | $ | 21.52 | | | $ | 18.98 | |
| Total return(B) | | | (13.61 | %) | | | (0.37 | %) | | | 15.57 | % | | | 14.01 | % | | | (8.73 | %) |
| Ratios and supplemental data: | | | | | | | | | | | | | | | | | | | | |
| Net assets at end of period (000's) | | $ | 347,021 | | | $ | 445,608 | | | $ | 485,413 | | | $ | 113,062 | | | $ | 137,306 | |
| Ratio to average net assets: | | | | | | | | | | | | | | | | | | | | |
| Net expenses | | | 1.17 | % | | | 1.17 | % | | | 1.19 | % | | | 1.24 | % | | | 1.24 | % |
| Gross expenses | | | 1.18 | % | | | 1.17 | % | | | 1.22 | % | | | 1.36 | % | | | 1.39 | % |
| Net investment income | | | 0.84 | % | | | 0.70 | % | | | 0.58 | % | | | 0.83 | % | | | 0.31 | % |
| Portfolio turnover rate | | | 60 | % | | | 40 | % | | | 72 | %(C) | | | 53 | % | | | 304 | % |
Touchstone Global ESG Equity Fund—Class C
Selected Data for a Share Outstanding Throughout Each Period
| | | Year Ended March 31, | |
| | | 2020 | | | 2019 | | | 2018 | | | 2017 | | | 2016 | |
| Net asset value at beginning of period | | $ | 16.65 | | | $ | 18.68 | | | $ | 18.62 | | | $ | 16.47 | | | $ | 28.32 | |
| Income (loss) from investment operations: | | | | | | | | | | | | | | | | | | | | |
| Net investment income (loss) | | | — | (A)(D) | | | (0.06 | ) | | | (0.05 | ) | | | 0.01 | | | | (0.08 | )(A) |
| Net realized and unrealized gains (losses) on investments | | | (2.31 | ) | | | (0.21 | ) | | | 2.85 | | | | 2.15 | | | | (1.75 | ) |
| Total from investment operations | | | (2.31 | ) | | | (0.27 | ) | | | 2.80 | | | | 2.16 | | | | (1.83 | ) |
| Distributions from: | | | | | | | | | | | | | | | | | | | | |
| Net investment income | | | (0.03 | ) | | | — | | | | — | | | | (0.01 | ) | | | (10.02 | ) |
| Realized capital gains | | | (0.34 | ) | | | (1.76 | ) | | | (2.74 | ) | | | — | | | | — | |
| Total distributions | | | (0.37 | ) | | | (1.76 | ) | | | (2.74 | ) | | | (0.01 | ) | | | (10.02 | ) |
| Net asset value at end of period | | $ | 13.97 | | | $ | 16.65 | | | $ | 18.68 | | | $ | 18.62 | | | $ | 16.47 | |
| Total return(B) | | | (14.34 | %) | | | (1.18 | %) | | | 14.75 | % | | | 13.12 | % | | | (9.41 | %) |
| Ratios and supplemental data: | | | | | | | | | | | | | | | | | | | | |
| Net assets at end of period (000's) | | $ | 8,099 | | | $ | 14,926 | | | $ | 37,513 | | | $ | 48,055 | | | $ | 56,435 | |
| Ratio to average net assets: | | | | | | | | | | | | | | | | | | | | |
| Net expenses | | | 1.99 | % | | | 1.99 | % | | | 1.99 | % | | | 1.99 | % | | | 1.99 | % |
| Gross expenses | | | 2.14 | % | | | 2.03 | % | | | 2.05 | % | | | 2.12 | % | | | 2.15 | % |
| Net investment income (loss) | | | 0.02 | % | | | (0.12 | %) | | | (0.23 | %) | | | 0.08 | % | | | (0.44 | %) |
| Portfolio turnover rate | | | 60 | % | | | 40 | % | | | 72 | %(C) | | | 53 | % | | | 304 | % |
| (A) | The net investment income (loss) per share was based on average shares outstanding for the period. |
| (B) | Total returns shown exclude the effect of applicable sales loads and fees. If these charges were included, the returns would be lower. |
| (C) | Portfolio turnover excludes the purchases and sales of securities of the Sentinel Sustainable Core Opportunities Fund acquired on October 27, 2017. If these transactions were included, portfolio turnover would have been higher. |
| (D) | Less than $0.005 per share. |
See accompanying Notes to Financial Statements.
Financial Highlights (Continued)
Touchstone Global ESG Equity Fund—Class Y
Selected Data for a Share Outstanding Throughout Each Period
| | | Year Ended March 31, | |
| | | 2020 | | | 2019 | | | 2018 | | | 2017 | | | 2016 | |
| Net asset value at beginning of period | | $ | 20.66 | | | $ | 22.75 | | | $ | 22.11 | | | $ | 19.49 | | | $ | 31.49 | |
| Income (loss) from investment operations: | | | | | | | | | | | | | | | | | | | | |
| Net investment income | | | 0.24 | (A) | | | 0.21 | | | | 0.16 | | | | 0.20 | | | | 0.13 | (A) |
| Net realized and unrealized gains (losses) on investments | | | (2.88 | ) | | | (0.31 | ) | | | 3.41 | | | | 2.58 | | | | (2.06 | ) |
| Total from investment operations | | | (2.64 | ) | | | (0.10 | ) | | | 3.57 | | | | 2.78 | | | | (1.93 | ) |
| Distributions from: | | | | | | | | | | | | | | | | | | | | |
| Net investment income | | | (0.20 | ) | | | (0.23 | ) | | | (0.19 | ) | | | (0.16 | ) | | | (0.05 | ) |
| Realized capital gains | | | (0.34 | ) | | | (1.76 | ) | | | (2.74 | ) | | | — | | | | (10.02 | ) |
| Total distributions | | | (0.54 | ) | | | (1.99 | ) | | | (2.93 | ) | | | (0.16 | ) | | | (10.07 | ) |
| Net asset value at end of period | | $ | 17.48 | | | $ | 20.66 | | | $ | 22.75 | | | $ | 22.11 | | | $ | 19.49 | |
| Total return | | | (13.37 | %) | | | (0.09 | %) | | | 15.90 | % | | | 14.30 | % | | | (8.54 | %) |
| Ratios and supplemental data: | | | | | | | | | | | | | | | | | | | | |
| Net assets at end of period (000's) | | $ | 136,239 | | | $ | 207,080 | | | $ | 189,837 | | | $ | 112,790 | | | $ | 67,638 | |
| Ratio to average net assets: | | | | | | | | | | | | | | | | | | | | |
| Net expenses | | | 0.90 | % | | | 0.90 | % | | | 0.94 | % | | | 0.99 | % | | | 0.99 | % |
| Gross expenses | | | 0.94 | % | | | 0.93 | % | | | 0.99 | % | | | 1.09 | % | | | 1.14 | % |
| Net investment income | | | 1.11 | % | | | 0.97 | % | | | 0.82 | % | | | 1.08 | % | | | 0.56 | % |
| Portfolio turnover rate | | | 60 | % | | | 40 | % | | | 72 | %(B) | | | 53 | % | | | 304 | % |
Touchstone Global ESG Equity Fund—Institutional Class
Selected Data for a Share Outstanding Throughout Each Period
| | | | | | | | | | | | Period Ended | |
| | | Year Ended March 31, | | | March 31, | |
| | | | 2020 | | | | 2019 | | | | 2018 | | | | 2017 | | | | 2016(C) | |
| Net asset value at beginning of period | | $ | 20.68 | | | $ | 22.77 | | | $ | 22.13 | | | $ | 19.50 | | | $ | 31.44 | |
| Income (loss) from investment operations: | | | | | | | | | | | | | | | | | | | | |
| Net investment income | | | 0.24 | (A) | | | 0.22 | | | | 0.20 | | | | 0.19 | | | | 0.11 | (A) |
| Net realized and unrealized gains (losses) on investments | | | (2.88 | ) | | | (0.32 | ) | | | 3.38 | | | | 2.61 | | | | (1.98 | ) |
| Total from investment operations | | | (2.64 | ) | | | (0.10 | ) | | | 3.58 | | | | 2.80 | | | | (1.87 | ) |
| Distributions from: | | | | | | | | | | | | | | | | | | | | |
| Net investment income | | | (0.20 | ) | | | (0.23 | ) | | | (0.20 | ) | | | (0.17 | ) | | | (0.05 | ) |
| Realized capital gains | | | (0.34 | ) | | | (1.76 | ) | | | (2.74 | ) | | | — | | | | (10.02 | ) |
| Total distributions | | | (0.54 | ) | | | (1.99 | ) | | | (2.94 | ) | | | (0.17 | ) | | | (10.07 | ) |
| Net asset value at end of period | | $ | 17.50 | | | $ | 20.68 | | | $ | 22.77 | | | $ | 22.13 | | | $ | 19.50 | |
| Total return | | | (13.35 | %) | | | (0.10 | %) | | | 15.95 | % | | | 14.41 | % | | | (8.49 | %)(D) |
| Ratios and supplemental data: | | | | | | | | | | | | | | | | | | | | |
| Net assets at end of period (000's) | | $ | 21,739 | | | $ | 44,382 | | | $ | 42,196 | | | $ | 29,679 | | | $ | 6,843 | |
| Ratio to average net assets: | | | | | | | | | | | | | | | | | | | | |
| Net expenses | | | 0.89 | % | | | 0.89 | % | | | 0.89 | % | | | 0.89 | % | | | 0.89 | %(E) |
| Gross expenses | | | 0.95 | % | | | 0.93 | % | | | 1.01 | % | | | 1.11 | % | | | 1.48 | %(E) |
| Net investment income | | | 1.12 | % | | | 0.98 | % | | | 0.87 | % | | | 1.18 | % | | | 0.66 | %(E) |
| Portfolio turnover rate | | | 60 | % | | | 40 | % | | | 72 | %(B) | | | 53 | % | | | 304 | % |
| (A) | The net investment income per share was based on average shares outstanding for the period. |
| (B) | Portfolio turnover excludes the purchases and sales of securities of the Sentinel Sustainable Core Opportunities Fund acquired on October 27, 2017. If these transactions were included, portfolio turnover would have been higher. |
| (C) | Represents the period from commencement of operations (May 4, 2015) through March 31, 2016. |
| (D) | Not annualized. |
| (E) | Annualized. |
See accompanying Notes to Financial Statements.
Financial Highlights (Continued)
Touchstone Growth Opportunities Fund—Class A
Selected Data for a Share Outstanding Throughout Each Period
| | | Year Ended March 31, | |
| | | 2020 | | | 2019 | | | 2018 | | | 2017 | | | 2016 | |
| Net asset value at beginning of period | | $ | 32.71 | | | $ | 32.79 | | | $ | 30.20 | | | $ | 27.35 | | | $ | 33.29 | |
| Income (loss) from investment operations: | | | | | | | | | | | | | | | | | | | | |
| Net investment income (loss) | | | (0.04 | ) | | | (0.05 | ) | | | (0.11 | ) | | | (— | )(A) | | | (0.08 | ) |
| Net realized and unrealized gains (losses) on investments | | | 0.99 | | | | 3.10 | | | | 5.89 | | | | 3.86 | | | | (2.90 | ) |
| Total from investment operations | | | 0.95 | | | | 3.05 | | | | 5.78 | | | | 3.86 | | | | (2.98 | ) |
| Distributions from: | | | | | | | | | | | | | | | | | | | | |
| Realized capital gains | | | (5.72 | ) | | | (3.13 | ) | | | (3.19 | ) | | | (1.01 | ) | | | (2.96 | ) |
| Total distributions | | | (5.72 | ) | | | (3.13 | ) | | | (3.19 | ) | | | (1.01 | ) | | | (2.96 | ) |
| Net asset value at end of period | | $ | 27.94 | | | $ | 32.71 | | | $ | 32.79 | | | $ | 30.20 | | | $ | 27.35 | |
| Total return(B) | | | 0.63 | % | | | 10.40 | % | | | 19.51 | % | | | 14.38 | % | | | (9.12 | %) |
| Ratios and supplemental data: | | | | | | | | | | | | | | | | | | | | |
| Net assets at end of period (000's) | | $ | 37,150 | | | $ | 42,404 | | | $ | 39,901 | | | $ | 38,752 | | | $ | 38,297 | |
| Ratio to average net assets: | | | | | | | | | | | | | | | | | | | | |
| Net expenses (including liquidity provider expenses) | | | 1.25 | %(C) | | | 1.24 | % | | | 1.24 | % | | | 0.99 | % | | | 1.24 | % |
| Gross expenses (including liquidity provider expenses) | | | 1.41 | %(D) | | | 1.37 | % | | | 1.38 | % | | | 1.09 | % | | | 1.39 | % |
| Net investment income (loss) | | | (0.12 | %) | | | (0.17 | %) | | | (0.32 | %) | | | 1.08 | % | | | (0.01 | %) |
| Portfolio turnover rate | | | 101 | %(E) | | | 94 | %(E) | | | 86 | % | | | 53 | % | | | 90 | % |
Touchstone Growth Opportunities Fund — Class C
Selected Data for a Share Outstanding Throughout Each Period
| | | Year Ended March 31, | |
| | | 2020 | | | 2019 | | | 2018 | | | 2017 | | | 2016 | |
| Net asset value at beginning of period | | $ | 26.18 | | | $ | 27.08 | | | $ | 25.60 | | | $ | 23.51 | | | $ | 29.27 | |
| Income (loss) from investment operations: | | | | | | | | | | | | | | | | | | | | |
| Net investment loss | | | (0.23 | ) | | | (0.49 | ) | | | (0.29 | ) | | | (0.23 | ) | | | (0.24 | ) |
| Net realized and unrealized gains (losses) on investments | | | 0.96 | | | | 2.72 | | | | 4.96 | | | | 3.33 | | | | (2.56 | ) |
| Total from investment operations | | | 0.73 | | | | 2.23 | | | | 4.67 | | | | 3.10 | | | | (2.80 | ) |
| Distributions from: | | | | | | | | | | | | | | | | | | | | |
| Realized capital gains | | | (5.72 | ) | | | (3.13 | ) | | | (3.19 | ) | | | (1.01 | ) | | | (2.96 | ) |
| Net asset value at end of period | | $ | 21.19 | | | $ | 26.18 | | | $ | 27.08 | | | $ | 25.60 | | | $ | 23.51 | |
| Total return(B) | | | (0.09 | %) | | | 9.54 | % | | | 18.65 | % | | | 13.49 | % | | | (9.78 | %) |
| Ratios and supplemental data: | | | | | | | | | | | | | | | | | | | | |
| Net assets at end of period (000's) | | $ | 2,724 | | | $ | 3,863 | | | $ | 8,680 | | | $ | 8,574 | | | $ | 11,665 | |
| Ratio to average net assets: | | | | | | | | | | | | | | | | | | | | |
| Net expenses (including liquidity provider expenses) | | | 2.00 | %(C) | | | 1.99 | % | | | 1.99 | % | | | 1.99 | % | | | 1.99 | % |
| Gross expenses (including liquidity provider expenses) | | | 2.61 | %(D) | | | 2.32 | % | | | 2.29 | % | | | 2.26 | % | | | 2.20 | % |
| Net investment loss | | | (0.87 | %) | | | (0.92 | %) | | | (1.07 | %) | | | (0.76 | %) | | | (0.99 | %) |
| Portfolio turnover rate | | | 101 | %(E) | | | 94 | %(E) | | | 86 | % | | | 90 | % | | | 137 | % |
| (A) | Less than $0.005 per share. |
| (B) | Total returns shown exclude the effect of applicable sales loads and fees. If these charges were included, the returns would be lower. |
| (C) | The ratio of net expenses to average net assets excluding liquidity provider expenses for Class A was 1.24% and for Class C was 1.99% for the year ended March 31, 2020. |
| (D) | The ratio of gross expenses to average net assets excluding liquidity provider expenses for Class A was 1.40% and for Class C was 2.60% for the year ended March 31, 2020. |
| (E) | Portfolio turnover excludes securities delivered from processing redemptions-in-kind. |
See accompanying Notes to Financial Statements.
Financial Highlights (Continued)
Touchstone Growth Opportunities Fund—Class Y
Selected Data for a Share Outstanding Throughout Each Period
| | | Year Ended March 31, | |
| | | 2020 | | | 2019 | | | 2018 | | | 2017 | | | 2016 | |
| Net asset value at beginning of period | | $ | 33.78 | | | $ | 33.69 | | | $ | 30.87 | | | $ | 27.90 | | | $ | 33.81 | |
| Income (loss) from investment operations: | | | | | | | | | | | | | | | | | | | | |
| Net investment income (loss) | | | 0.04 | | | | 0.03 | | | | (0.02 | ) | | | 0.10 | | | | — | (A) |
| Net realized and unrealized gains (losses) on investments | | | 1.01 | | | | 3.19 | | | | 6.03 | | | | 3.91 | | | | (2.95 | ) |
| Total from investment operations | | | 1.05 | | | | 3.22 | | | | 6.01 | | | | 4.01 | | | | (2.95 | ) |
| Distributions from: | | | | | | | | | | | | | | | | | | | | |
| Net investment income | | | — | | | | — | (A) | | | — | | | | (0.03 | ) | | | — | |
| Realized capital gains | | | (5.72 | ) | | | (3.13 | ) | | | (3.19 | ) | | | (1.01 | ) | | | (2.96 | ) |
| Total distributions | | | (5.72 | ) | | | (3.13 | ) | | | (3.19 | ) | | | (1.04 | ) | | | (2.96 | ) |
| Net asset value at end of period | | $ | 29.11 | | | $ | 33.78 | | | $ | 33.69 | | | $ | 30.87 | | | $ | 27.90 | |
| Total return | | | 0.92 | % | | | 10.67 | % | | | 19.80 | % | | | 14.64 | % | | | (8.88 | %) |
| Ratios and supplemental data: | | | | | | | | | | | | | | | | | | | | |
| Net assets at end of period (000's) | | $ | 26,610 | | | $ | 43,703 | | | $ | 47,554 | | | $ | 47,222 | | | $ | 83,721 | |
| Ratio to average net assets: | | | | | | | | | | | | | | | | | | | | |
| Net expenses (including liquidity provider expenses) | | | 1.00 | %(B) | | | 0.99 | % | | | 0.99 | % | | | 0.99 | % | | | 0.99 | % |
| Gross expenses (including liquidity provider expenses) | | | 1.14 | %(C) | | | 1.08 | % | | | 1.07 | % | | | 1.07 | % | | | 1.07 | % |
| Net investment income (loss) | | | 0.13 | % | | | 0.08 | % | | | (0.07 | %) | | | 0.24 | % | | | 0.01 | % |
| Portfolio turnover rate | | | 101 | %(D) | | | 94 | %(D) | | | 86 | % | | | 90 | % | | | 137 | % |
Touchstone Growth Opportunities Fund—Institutional Class
Selected Data for a Share Outstanding Throughout Each Period
| | | Year Ended March 31, | |
| | | 2020 | | | 2019 | | | 2018 | | | 2017 | | | 2016 | |
| Net asset value at beginning of period | | $ | 34.22 | | | $ | 34.08 | | | $ | 31.16 | | | $ | 28.15 | | | $ | 34.05 | |
| Income (loss) from investment operations: | | | | | | | | | | | | | | | | | | | | |
| Net investment income | | | 0.06 | | | | 0.09 | | | | 0.01 | | | | 0.12 | | | | 0.01 | |
| Net realized and unrealized gains (losses) on investments | | | 1.02 | | | | 3.21 | | | | 6.10 | | | | 3.96 | | | | (2.95 | ) |
| Total from investment operations | | | 1.08 | | | | 3.30 | | | | 6.11 | | | | 4.08 | | | | (2.94 | ) |
| Distributions from: | | | | | | | | | | | | | | | | | | | | |
| Net investment income | | | — | | | | (0.03 | ) | | | — | | | | (0.06 | ) | | | — | |
| Realized capital gains | | | (5.72 | ) | | | (3.13 | ) | | | (3.19 | ) | | | (1.01 | ) | | | (2.96 | ) |
| Total distributions | | | (5.72 | ) | | | (3.16 | ) | | | (3.19 | ) | | | (1.07 | ) | | | (2.96 | ) |
| Net asset value at end of period | | $ | 29.58 | | | $ | 34.22 | | | $ | 34.08 | | | $ | 31.16 | | | $ | 28.15 | |
| Total return | | | 1.00 | % | | | 10.79 | % | | | 19.94 | % | | | 14.77 | % | | | (8.79 | %) |
| Ratios and supplemental data: | | | | | | | | | | | | | | | | | | | | |
| Net assets at end of period (000's) | | $ | 96,361 | | | $ | 71,406 | | | $ | 185,831 | | | $ | 150,038 | | | $ | 176,191 | |
| Ratio to average net assets: | | | | | | | | | | | | | | | | | | | | |
| Net expenses (including liquidity provider expenses) | | | 0.90 | %(B) | | | 0.89 | % | | | 0.89 | % | | | 0.89 | % | | | 0.89 | % |
| Gross expenses (including liquidity provider expenses) | | | 1.05 | %(C) | | | 1.01 | % | | | 1.01 | % | | | 1.00 | % | | | 0.98 | % |
| Net investment income | | | 0.23 | % | | | 0.18 | % | | | 0.03 | % | | | 0.34 | % | | | 0.11 | % |
| Portfolio turnover rate | | | 101 | %(D) | | | 94 | %(D) | | | 86 | % | | | 90 | % | | | 137 | % |
| (A) | Less than $0.005 per share. |
| (B) | The ratio of net expenses to average net assets excluding liquidity provider expenses for Class Y was 0.99% and for Institutional Class was 0.89% for the year ended March 31, 2020. |
| (C) | The ratio of gross expenses to average net assets excluding liquidity provider expenses for Class Y was 1.13% and for Institutional Class was 1.04% for the year ended March 31, 2020. |
| (D) | Portfolio turnover excludes securities delivered from processing redemptions-in-kind. |
See accompanying Notes to Financial Statements.
Financial Highlights(Continued)
Touchstone Mid Cap Growth Fund—Class A
Selected Data for a Share Outstanding Throughout Each Period
| | | Year Ended March 31, | |
| | | 2020 | | | 2019 | | | 2018 | | | 2017 | | | 2016 | |
| Net asset value at beginning of period | | $ | 29.26 | | | $ | 28.05 | | | $ | 25.91 | | | $ | 23.28 | | | $ | 27.06 | |
| Income (loss) from investment operations: | | | | | | | | | | | | | | | | | | | | |
| Net investment loss | | | (0.07 | ) | | | (0.09 | ) | | | (0.08 | )(A) | | | (0.06 | ) | | | (0.10 | ) |
| Net realized and unrealized gains (losses) on investments | | | (2.06 | ) | | | 3.36 | | | | 4.95 | | | | 3.31 | | | | (1.62 | ) |
| Total from investment operations | | | (2.13 | ) | | | 3.27 | | | | 4.87 | | | | 3.25 | | | | (1.72 | ) |
| Distributions from: | | | | | | | | | | | | | | | | | | | | |
| Net investment income | | | (0.01 | ) | | | — | | | | — | | | | — | | | | — | |
| Realized capital gains | | | (2.23 | ) | | | (2.06 | ) | | | (2.73 | ) | | | (0.62 | ) | | | (2.06 | ) |
| Total distributions | | | (2.24 | ) | | | (2.06 | ) | | | (2.73 | ) | | | (0.62 | ) | | | (2.06 | ) |
| Net asset value at end of period | | $ | 24.89 | | | $ | 29.26 | | | $ | 28.05 | | | $ | 25.91 | | | $ | 23.28 | |
| Total return(B) | | | (8.78 | %) | | | 12.77 | % | | | 19.28 | % | | | 14.13 | % | | | (6.34 | %) |
| Ratios and supplemental data: | | | | | | | | | | | | | | | | | | | | |
| Net assets at end of period (000's) | | $ | 234,307 | | | $ | 262,492 | | | $ | 218,727 | | | $ | 225,381 | | | $ | 226,201 | |
| Ratio to average net assets: | | | | | | | | | | | | | | | | | | | | |
| Net expenses | | �� | 1.25 | % | | | 1.27 | % | | | 1.29 | % | | | 1.30 | % | | | 1.31 | % |
| Gross expenses | | | 1.25 | % | | | 1.27 | % | | | 1.29 | % | | | 1.30 | % | | | 1.31 | % |
| Net investment loss | | | (0.24 | %) | | | (0.35 | %) | | | (0.29 | %) | | | (0.26 | %) | | | (0.42 | %) |
| Portfolio turnover rate | | | 82 | % | | | 71 | % | | | 76 | % | | | 95 | % | | | 92 | % |
Touchstone Mid Cap Growth Fund—Class C
Selected Data for a Share Outstanding Throughout Each Period
| | | Year Ended March 31, | |
| | | 2020 | | | 2019 | | | 2018 | | | 2017 | | | 2016 | |
| Net asset value at beginning of period | | $ | 18.08 | | | $ | 18.27 | | | $ | 17.84 | | | $ | 16.33 | | | $ | 19.78 | |
| Income (loss) from investment operations: | | | | | | | | | | | | | | | | | | | | |
| Net investment loss | | | (0.32 | ) | | | (0.49 | ) | | | (0.20 | )(A) | | | (0.22 | ) | | | (0.21 | ) |
| Net realized and unrealized gains (losses) on investments | | | (0.97 | ) | | | 2.36 | | | | 3.36 | | | | 2.35 | | | | (1.18 | ) |
| Total from investment operations | | | (1.29 | ) | | | 1.87 | | | | 3.16 | | | | 2.13 | | | | (1.39 | ) |
| Distributions from: | | | | | | | | | | | | | | | | | | | | |
| Realized capital gains | | | (2.23 | ) | | | (2.06 | ) | | | (2.73 | ) | | | (0.62 | ) | | | (2.06 | ) |
| Net asset value at end of period | | $ | 14.56 | | | $ | 18.08 | | | $ | 18.27 | | | $ | 17.84 | | | $ | 16.33 | |
| Total return(B) | | | (9.55 | %) | | | 11.91 | % | | | 18.38 | % | | | 13.28 | % | | | (7.02 | %) |
| Ratios and supplemental data: | | | | | | | | | | | | | | | | | | | | |
| Net assets at end of period (000's) | | $ | 20,918 | | | $ | 32,831 | | | $ | 90,502 | | | $ | 113,153 | | | $ | 127,852 | |
| Ratio to average net assets: | | | | | | | | | | | | | | | | | | | | |
| Net expenses | | | 2.07 | % | | | 2.04 | % | | | 2.04 | % | | | 2.06 | % | | | 2.06 | % |
| Gross expenses | | | 2.07 | % | | | 2.04 | % | | | 2.04 | % | | | 2.06 | % | | | 2.06 | % |
| Net investment loss | | | (1.06 | %) | | | (1.12 | %) | | | (1.04 | %) | | | (1.02 | %) | | | (1.17 | %) |
| Portfolio turnover rate | | | 82 | % | | | 71 | % | | | 76 | % | | | 95 | % | | | 92 | % |
| (A) | The net investment loss per share was based on average shares outstanding for the period. |
| (B) | Total returns shown exclude the effect of applicable sales loads and fees. If these charges were included, the returns would be lower. |
See accompanying Notes to Financial Statements.
Financial Highlights(Continued)
Touchstone Mid Cap Growth Fund—Class Y
Selected Data for a Share Outstanding Throughout Each Period
| | | Year Ended March 31, | |
| | | 2020 | | | 2019 | | | 2018 | | | 2017 | | | 2016 | |
| Net asset value at beginning of period | | $ | 30.50 | | | $ | 29.07 | | | $ | 26.70 | | | $ | 23.92 | | | $ | 27.71 | |
| Income (loss) from investment operations: | | | | | | | | | | | | | | | | | | | | |
| Net investment loss | | | (— | )(A) | | | (0.03 | ) | | | (0.01 | )(B) | | | (— | )(A) | | | (0.04 | ) |
| Net realized and unrealized gains (losses) on investments | | | (2.17 | ) | | | 3.52 | | | | 5.11 | | | | 3.40 | | | | (1.65 | ) |
| Total from investment operations | | | (2.17 | ) | | | 3.49 | | | | 5.10 | �� | | | 3.40 | | | | (1.69 | ) |
| Distributions from: | | | | | | | | | | | | | | | | | | | | |
| Net investment income | | | (0.06 | ) | | | — | | | | — | | | | — | | | | (0.04 | ) |
| Realized capital gains | | | (2.23 | ) | | | (2.06 | ) | | | (2.73 | ) | | | (0.62 | ) | | | (2.06 | ) |
| Total distributions | | | (2.29 | ) | | | (2.06 | ) | | | (2.73 | ) | | | (0.62 | ) | | | (2.10 | ) |
| Net asset value at end of period | | $ | 26.04 | | | $ | 30.50 | | | $ | 29.07 | | | $ | 26.70 | | | $ | 23.92 | |
| Total return | | | (8.58 | %) | | | 13.05 | % | | | 19.62 | % | | | 14.38 | % | | | (6.08 | %) |
| Ratios and supplemental data: | | | | | | | | | | | | | | | | | | | | |
| Net assets at end of period (000's) | | $ | 424,403 | | | $ | 452,407 | | | $ | 375,617 | | | $ | 311,865 | | | $ | 347,706 | |
| Ratio to average net assets: | | | | | | | | | | | | | | | | | | | | |
| Net expenses | | | 1.01 | % | | | 1.02 | % | | | 1.02 | % | | | 1.06 | % | | | 1.05 | % |
| Gross expenses | | | 1.01 | % | | | 1.02 | % | | | 1.02 | % | | | 1.06 | % | | | 1.05 | % |
| Net investment loss | | | (—% | )(A) | | | (0.10 | %) | | | (0.02 | %) | | | (0.02 | %) | | | (0.16 | %) |
| Portfolio turnover rate | | | 82 | % | | | 71 | % | | | 76 | % | | | 95 | % | | | 92 | % |
Touchstone Mid Cap Growth Fund—Institutional Class
Selected Data for a Share Outstanding Throughout Each Period
| | | Year Ended March 31, | |
| | | 2020 | | | 2019 | | | 2018 | | | 2017 | | | 2016 | |
| Net asset value at beginning of period | | $ | 30.79 | | | $ | 29.32 | | | $ | 26.90 | | | $ | 24.07 | | | $ | 27.85 | |
| Income (loss) from investment operations: | | | | | | | | | | | | | | | | | | | | |
| Net investment income (loss) | | | 0.01 | | | | (0.01 | ) | | | — | (A)(B) | | | 0.10 | | | | (0.02 | ) |
| Net realized and unrealized gains (losses) on investments | | | (2.18 | ) | | | 3.54 | | | | 5.15 | | | | 3.35 | | | | (1.65 | ) |
| Total from investment operations | | | (2.17 | ) | | | 3.53 | | | | 5.15 | | | | 3.45 | | | | (1.67 | ) |
| Distributions from: | | | | | | | | | | | | | | | | | | | | |
| Net investment income | | | (0.07 | ) | | | — | | | | — | | | | — | | | | (0.05 | ) |
| Realized capital gains | | | (2.23 | ) | | | (2.06 | ) | | | (2.73 | ) | | | (0.62 | ) | | | (2.06 | ) |
| Total distributions | | | (2.30 | ) | | | (2.06 | ) | | | (2.73 | ) | | | (0.62 | ) | | | (2.11 | ) |
| Net asset value at end of period | | $ | 26.32 | | | $ | 30.79 | | | $ | 29.32 | | | $ | 26.90 | | | $ | 24.07 | |
| Total return | | | (8.49 | %) | | | 13.10 | % | | | 19.62 | % | | | 14.50 | % | | | (5.97 | %) |
| Ratios and supplemental data: | | | | | | | | | | | | | | | | | | | | |
| Net assets at end of period (000's) | | $ | 357,769 | | | $ | 349,865 | | | $ | 95,176 | | | $ | 44,236 | | | $ | 84,152 | |
| Ratio to average net assets: | | | | | | | | | | | | | | | | | | | | |
| Net expenses | | | 0.94 | % | | | 0.97 | %(C) | | | 0.99 | % | | | 0.99 | % | | | 0.95 | % |
| Gross expenses | | | 0.94 | % | | | 0.97 | % | | | 0.99 | % | | | 1.00 | % | | | 0.95 | % |
| Net investment income (loss) | | | 0.06 | % | | | (0.06 | %) | | | 0.01 | % | | | 0.05 | % | | | (0.05 | %) |
| Portfolio turnover rate | | | 82 | % | | | 71 | % | | | 76 | % | | | 95 | % | | | 92 | % |
| (A) | Less than $0.005 per share or 0.005%. |
| (B) | The net investment income (loss) per share was based on average shares outstanding for the period. |
| (C) | Net expenses include amounts recouped by the Advisor. |
See accompanying Notes to Financial Statements.
Financial Highlights(Continued)
Touchstone Mid Cap Growth Fund—Class R6
Selected Data for a Share Outstanding Throughout The Period
| | | Period Ended | |
| | | March 31, 2020(A) | |
| Net asset value at beginning of period | | $ | 35.72 | (B) |
| Income (loss) from investment operations: | | | | |
| Net investment loss | | | (— | )(C) |
| Net realized and unrealized losses on investments | | | (9.40 | ) |
| Total from investment operations | | | (9.40 | ) |
| Net asset value at end of period | | $ | 26.32 | |
| Total return | | | (26.32 | %)(D) |
| Ratios and supplemental data: | | | | |
| Net assets at end of period (000's) | | $ | 2 | |
| Ratio to average net assets: | | | | |
| Net expenses | | | 0.89 | %(E) |
| Gross expenses | | | 1,279.20 | %(E) |
| Net investment income | | | (0.02 | %)(E) |
| Portfolio turnover rate | | | 82 | %(D) |
| (A) | Represents the period from commencement of operations (February 10, 2020) through March 31, 2020. |
| (B) | Net asset value at the beginning of period is based on the net asset value of Institutional Class shares on February 10, 2020. |
| (C) | Less than $0.0005 per share. |
| (D) | Not annualized. |
| (E) | Annualized. |
See accompanying Notes to Financial Statements.
Financial Highlights(Continued)
Touchstone Sands Capital Emerging Markets Growth Fund—Class A
Selected Data for a Share Outstanding Throughout Each Period
| | | Year Ended | | | Period Ended | |
| | | March 31, | | | March 31, | |
| | | | 2020 | | | | 2019(A) | |
| Net asset value at beginning of period | | $ | 13.15 | | | $ | 11.21 | (B) |
| Income (loss) from investment operations: | | | | | | | | |
| Net investment income (loss) | | | 0.05 | (C) | | | (0.01 | ) |
| Net realized and unrealized gains (losses) on investments | | | (1.77 | ) | | | 1.95 | |
| Total from investment operations | | | (1.72 | ) | | | 1.94 | |
| Distributions from: | | | | | | | | |
| Net investment income | | | (0.07 | ) | | | — | |
| Net asset value at end of period | | $ | 11.36 | | | $ | 13.15 | |
| Total return(D) | | | (13.19 | %) | | | 17.31 | %(E) |
| Ratios and supplemental data: | | | | | | | | |
| Net assets at end of period (000's) | | $ | 2,897 | | | $ | 1,349 | |
| Ratio to average net assets: | | | | | | | | |
| Net expenses | | | 1.60 | % | | | 1.60 | %(F) |
| Gross expenses | | | 2.62 | % | | | 4.89 | %(F) |
| Net investment income (loss) | | | 0.35 | % | | | (0.94 | %)(F) |
| Portfolio turnover rate | | | 20 | % | | | 31 | % |
Touchstone Sands Capital Emerging Markets Growth Fund—Class C
Selected Data for a Share Outstanding Throughout Each Period
| | | Year Ended | | | Period Ended | |
| | | March 31, | | | March 31, | |
| | | | 2020 | | | | 2019(A) | |
| Net asset value at beginning of period | | $ | 13.11 | | | $ | 11.21 | (B) |
| Income (loss) from investment operations: | | | | | | | | |
| Net investment loss | | | (0.05 | )(C) | | | (0.04 | ) |
| Net realized and unrealized gains (losses) on investments | | | (1.75 | ) | | | 1.94 | |
| Total from investment operations | | | (1.80 | ) | | | 1.90 | |
| Distributions from: | | | | | | | | |
| Net investment income | | | (0.05 | ) | | | — | |
| Net asset value at end of period | | $ | 11.26 | | | $ | 13.11 | |
| Total return(D) | | | (13.81 | %) | | | 16.95 | %(E) |
| Ratios and supplemental data: | | | | | | | | |
| Net assets at end of period (000's) | | $ | 1,135 | | | $ | 59 | |
| Ratio to average net assets: | | | | | | | | |
| Net expenses | | | 2.35 | % | | | 2.35 | %(F) |
| Gross expenses | | | 5.24 | % | | | 57.88 | %(F) |
| Net investment loss | | | (0.40 | %) | | | (1.69 | %)(F) |
| Portfolio turnover rate | | | 20 | % | | | 31 | % |
| (A) | Represents the period from commencement of operations (November 16, 2018) through March 31, 2019. |
| (B) | Net asset value at the beginning of period is based on the net asset value of Class Y shares on November 16, 2018. |
| (C) | The net investment income (loss) per share was based on average shares outstanding for the period. |
| (D) | Total returns shown exclude the effect of applicable sales loads and fees. If these charges were included, the returns would be lower. |
| (E) | Not annualized. |
| (F) | Annualized. |
See accompanying Notes to Financial Statements.
Financial Highlights(Continued)
Touchstone Sands Capital Emerging Markets Growth Fund—Class Y
Selected Data for a Share Outstanding Throughout Each Period
| | | Year Ended March 31, | |
| | | 2020 | | | 2019 | | | 2018 | | | 2017 | | | 2016 | |
| Net asset value at beginning of period | | $ | 13.16 | | | $ | 13.56 | | | $ | 10.70 | | | $ | 9.40 | | | $ | 10.37 | |
| Income (loss) from investment operations: | | | | | | | | | | | | | | | | | | | | |
| Net investment income (loss) | | | 0.08 | (A) | | | (0.03 | ) | | | (0.06 | ) | | | (0.03 | ) | | | (0.04 | ) |
| Net realized and unrealized gains (losses) on investments | | | (1.77 | ) | | | (0.37 | ) | | | 2.92 | | | | 1.33 | | | | (0.93 | ) |
| Total from investment operations | | | (1.69 | ) | | | (0.40 | ) | | | 2.86 | | | | 1.30 | | | | (0.97 | ) |
| Distributions from: | | | | | | | | | | | | | | | | | | | | |
| Net investment income | | | (0.09 | ) | | | — | | | | — | | | | — | | | | — | |
| Net asset value at end of period | | $ | 11.38 | | | $ | 13.16 | | | $ | 13.56 | | | $ | 10.70 | | | $ | 9.40 | |
| Total return | | | (12.96 | %) | | | (3.02 | %) | | | 26.82 | % | | | 13.83 | % | | | (9.35 | %) |
| Ratios and supplemental data: | | | | | | | | | | | | | | | | | | | | |
| Net assets at end of period (000's) | | $ | 423,992 | | | $ | 318,093 | | | $ | 207,209 | | | $ | 103,467 | | | $ | 58,106 | |
| Ratio to average net assets: | | | | | | | | | | | | | | | | | | | | |
| Net expenses | | | 1.33 | %(B) | | | 1.35 | %(B) | | | 1.47 | % | | | 1.49 | % | | | 1.49 | % |
| Gross expenses | | | 1.31 | % | | | 1.35 | % | | | 1.49 | % | | | 1.55 | % | | | 1.59 | % |
| Net investment income (loss) | | | 0.62 | % | | | (0.45 | %) | | | (0.73 | %) | | | (0.49 | %) | | | (0.52 | %) |
| Portfolio turnover rate | | | 20 | % | | | 31 | % | | | 27 | % | | | 49 | % | | | 32 | % |
Touchstone Sands Capital Emerging Markets Growth Fund—Institutional Class
Selected Data for a Share Outstanding Throughout Each Period
| | | Year Ended March 31, | |
| | | 2020 | | | 2019 | | | 2018 | | | 2017 | | | 2016 | |
| Net asset value at beginning of period | | $ | 13.21 | | | $ | 13.61 | | | $ | 10.73 | | | $ | 9.41 | | | $ | 10.37 | |
| Income (loss) from investment operations: | | | | | | | | | | | | | | | | | | | | |
| Net investment income (loss) | | | 0.09 | (A) | | | (0.03 | ) | | | (0.06 | ) | | | (0.03 | ) | | | (0.02 | ) |
| Net realized and unrealized gains (losses) on investments | | | (1.77 | ) | | | (0.37 | ) | | | 2.94 | | | | 1.35 | | | | (0.94 | ) |
| Total from investment operations | | | (1.68 | ) | | | (0.40 | ) | | | 2.88 | | | | 1.32 | | | | (0.96 | ) |
| Distributions from: | | | | | | | | | | | | | | | | | | | | |
| Net investment income | | | (0.10 | ) | | | — | | | | — | | | | — | | | | — | |
| Net asset value at end of period | | $ | 11.43 | | | $ | 13.21 | | | $ | 13.61 | | | $ | 10.73 | | | $ | 9.41 | |
| Total return | | | (12.87 | %) | | | (2.94 | %) | | | 26.84 | % | | | 14.03 | % | | | (9.26 | %) |
| Ratios and supplemental data: | | | | | | | | | | | | | | | | | | | | |
| Net assets at end of period (000's) | | $ | 883,508 | | | $ | 524,670 | | | $ | 374,452 | | | $ | 182,402 | | | $ | 101,401 | |
| Ratio to average net assets: | | | | | | | | | | | | | | | | | | | | |
| Net expenses | | | 1.25 | %(B) | | | 1.25 | % | | | 1.37 | % | | | 1.39 | % | | | 1.39 | % |
| Gross expenses | | | 1.24 | % | | | 1.27 | % | | | 1.41 | % | | | 1.46 | % | | | 1.51 | % |
| Net investment income (loss) | | | 0.70 | % | | | (0.35 | %) | | | (0.63 | %) | | | (0.39 | %) | | | (0.42 | %) |
| Portfolio turnover rate | | | 20 | % | | | 31 | % | | | 27 | % | | | 49 | % | | | 32 | % |
| (A) | The net investment income (loss) per share was based on average shares outstanding for the period. |
| (B) | Net expenses include amounts recouped by the Advisor. |
See accompanying Notes to Financial Statements.
Notes to Financial Statements
March 31, 2020
1. Organization
The Touchstone Strategic Trust (the “Trust”) is registered under the Investment Company Act of 1940, as amended (the “1940 Act”), as an open-end management investment company. The Trust was established as a Massachusetts business trust pursuant to an Agreement and Declaration of Trust dated November 18, 1982. The Trust consists of nineteen funds, including the following six funds (individually, a “Fund”, and collectively, the “Funds”):
Touchstone Flexible Income Fund (“Flexible Income Fund”)
Touchstone Focused Fund (“Focused Fund”)
Touchstone Global ESG Equity Fund (“Global ESG Equity Fund”)
Touchstone Growth Opportunities Fund (“Growth Opportunities Fund”)
Touchstone Mid Cap Growth Fund (“Mid Cap Growth Fund”)
Touchstone Sands Capital Emerging Markets Growth Fund (“Sands Capital Emerging Markets Growth Fund”)
Each Fund is diversified, with the exception of the Focused Fund, the Growth Opportunities Fund and the Sands Capital Emerging Markets Growth Fund, which are non-diversified.
The Agreement and Declaration of Trust permits the Trust to issue an unlimited number of shares of beneficial interest of each Fund. The table below indicates the classes of shares that each Fund is registered to offer:
| | | | | Institutional | |
| | Class A | Class C | Class Y | Class | Class R6 |
| Flexible Income Fund | X | X | X | X | |
| Focused Fund | X | X | X | X | |
| Global ESG Equity Fund | X | X | X | X | |
| Growth Opportunities Fund | X | X | X | X | |
| Mid Cap Growth Fund | X | X | X | X | X |
| Sands Capital Emerging Markets Growth Fund | X | X | X | X | |
The assets of each Fund are segregated, and a shareholder’s interest is limited to the Fund in which shares are held. The Funds’ prospectus provides a description of each Fund’s investment goal, policies, and strategies along with information on the classes of shares currently being offered.
2. Significant Accounting Policies
The following is a summary of the Funds’ significant accounting policies:
Each Fund is an investment company that follows the accounting and reporting guidance of Accounting Standards Codification Topic 946 applicable to investment companies.
Security valuation and fair value measurements— U.S. generally accepted accounting principles (“U.S. GAAP”) defines fair value as the price the Funds would receive to sell an asset or pay to transfer a liability in an orderly transaction between market participants at the measurement date. All investments in securities are recorded at their fair value. The Funds define the term “market value”, as used throughout this report, as the estimated fair value. The Funds use various methods to measure fair value of their portfolio securities on a recurring basis. U.S. GAAP fair value measurement standards require disclosure of a hierarchy that prioritizes inputs to valuation methods. These inputs are summarized in the three broad levels listed below:
| · | Level 1 – quoted prices in active markets for identical securities |
| · | Level 2 – other significant observable inputs (including quoted prices for similar securities, interest rates, prepayment speeds, credit risk, etc.) |
| • | Level 3 – significant unobservable inputs (including a Fund’s own assumptions in determining the fair value of investments) |
The inputs or methodology used for valuing securities are not necessarily an indication of the risk associated with investing in those securities.
The aggregate value by input level, as of March 31, 2020, for each Fund’s investments, is included in each Fund’s Portfolio of Investments, which also includes a breakdown of the Fund’s investments by geographic, portfolio or sector allocation. The Funds did not hold or transfer any Level 3 categorized securities during the year ended March 31, 2020.
Changes in valuation techniques may result in transfers into or out of an investment’s assigned level within the hierarchy.
The Funds’ portfolio securities are valued as of the close of the regular session of trading on the New York Stock Exchange (“NYSE”) (currently 4:00 p.m., Eastern Time or at the time as of which the NYSE establishes official closing prices). Portfolio securities traded on stock exchanges are valued at the last reported sale price, official close price, or last bid price if no sales are reported. Portfolio
Notes to Financial Statements(Continued)
securities quoted by NASDAQ are valued at the NASDAQ Official Closing Price (“NOCP”) or from the primary exchange on which the security trades. To the extent these securities are actively traded, they are categorized in Level 1 of the fair value hierarchy. Options and futures are valued at the last quoted sales price. If there is no such reported sale on the valuation date, long option positions are valued at the most recent bid price, and short option positions are valued at the most recent ask price on the valuation date and are categorized in Level 1. Shares of mutual funds in which the Funds invest are valued at their respective net asset value (“NAV”) as reported by the underlying funds (the “Underlying Funds”) and are categorized in Level 1.
Debt securities held by the Funds are valued at their evaluated bid by an independent pricing service or at their last broker-quoted bid prices as obtained from one or more of the major market makers for such securities. Independent pricing services use information provided by market makers or estimates of market values through accepted market modeling conventions. Observable inputs to the models may include prepayment speeds, pricing spread, yield, trade information, dealer quotes, market color, cash flow models, the securities’ terms and conditions, among others, and are generally categorized in Level 2. Investments in asset-backed and mortgage-backed securities are valued by independent pricing services using models that consider estimated cash flows of each tranche of the security, establish a benchmark yield and develop an estimated tranche specific spread to the benchmark yield based on the unique attributes of the tranche, and are generally categorized in Level 2. Debt securities with remaining maturities of 60 days or less may be valued at amortized cost, provided such amount approximates market value and are categorized in Level 2. While this method provides consistency in valuation (and may only be used if it approximates market value), it may result in periods during which fair value, as determined by amortized cost, is higher or lower than the price that would be received if the Fund sold the investment.
Foreign currency exchange contracts are valued at the mean between the bid and ask prices and are determined as of the close of regular trading on the NYSE. Interpolated values are derived when the settlement date of the contract is an interim date for which quotations are not available and categorized in Level 2.
Securities mainly traded on a non-U.S. exchange or denominated in foreign currencies are generally valued according to the preceding closing values on that exchange, translated to U.S. dollars using currency exchange rates as of the close of regular trading on the NYSE, and are generally categorized in Level 1. However, if an event that may change the value of a security occurs after the time that the closing value on the non-U.S. exchange was determined, but before the close of regular trading on the NYSE, the security may be priced based on fair value and is generally categorized in Level 2. This may cause the value of the security, if held on the books of a Fund to be different from the closing value on the non-U.S. exchange and may affect the calculation of that Fund’s NAV. The Funds may use fair value pricing under the following circumstances, among others:
| • | If the value of a security has been materially affected by events occurring before the Funds’ pricing time but after the close of the primary markets on which the security is traded. |
| • | If the exchange on which a portfolio security is principally traded closes early or if trading in a particular portfolio security was halted during the day and did not resume prior to the Funds’ NAV calculation. |
| • | If a security is so thinly traded that reliable market quotations are unavailable due to infrequent trading. |
| • | If the validity of market quotations is not reliable. |
Securities held by the Funds that do not have readily available market quotations, significant observable inputs, or securities for which the available market quotations are not reliable, are priced at their estimated fair value using procedures approved by the Funds’ Board of Trustees (the “Board”) and are generally categorized in Level 3.
Collateralized Loan Obligations —The Flexible Income Fund may invest in collateralized loan obligations (“CLOs”). CLOs are types of asset-backed securities. A CLO is an entity that is backed by syndicated bank loans. The cash flows of the CLO can be split into multiple segments, called “tranches,” which will vary in risk profile and yield. The riskiest segment is the subordinated or “equity” tranche. This tranche bears the greatest risk of defaults from the underlying assets in the CLO and serves to protect the other, more senior, tranches from default in all but the most severe circumstances. Since it is shielded from defaults by the more junior tranches, a “senior” tranche will typically have higher credit ratings and lower yields than their underlying securities, and often receive higher ratings from one or more of the nationally recognized rating agencies. Despite the protection from the more junior tranches, senior tranches can experience substantial losses due to actual defaults, increased sensitivity to future defaults and the disappearance of one or more protecting tranches as a result of changes in the credit profile of the underlying pool of assets.
Investment companies— The Funds may invest in securities of other investment companies, including exchange-traded funds (“ETFs”), open-end funds, and closed-end funds. Open-end funds are investment companies that issue new shares continuously and redeem shares daily. Closed-end funds are investment companies that typically issue a fixed number of shares that trade on a securities exchange or over-the-counter (“OTC”). An ETF is an investment company that typically seeks to track the performance of an index by holding in its portfolio shares of all the companies, or a representative sample of the companies, that are components of a particular index. ETF shares are traded on a securities exchange based on their market value. The risks of investment in other investment companies typically reflect the risks of the types of securities in which the other investment companies invest. Investments in ETFs and closed-end funds are subject to the additional risk that their shares may trade at a premium or discount to their NAV. When a Fund invests in another investment company, shareholders of the Fund indirectly bear their proportionate share of the
Notes to Financial Statements(Continued)
other investment company’s fees and expenses, including operating, registration, trustee, licensing, and marketing, as well as their share of the Fund’s fees and expenses.
Securities sold short —The Flexible Income Fund may engage in selling securities short, which obligates the Fund to replace a security borrowed by purchasing the same security at the current market value. The Fund would incur a loss if the price of the security increases between the date of the short sale and the date on which the Fund replaces the borrowed security. The Fund would realize a gain if the price of the security declines between those dates.
As of March 31, 2020, the Flexible Income Fund did not hold any securities sold short.
Options —The Flexible Income Fund may write or purchase financial option contracts primarily to hedge against changes in the value of equity securities (or securities that the Fund intends to purchase), against fluctuations in fair value caused by changes in prevailing market interest rates or foreign currency exchange rates and against changes in overall equity market volatility. In addition, the Fund may utilize options in an attempt to generate gains from option premiums or to reduce overall portfolio risk. The Fund’s option strategy primarily focuses on the use of writing and/or purchasing call or put options on equity indexes. When the Fund writes or purchases an option, an amount equal to the premium received or paid by the Fund is recorded as a liability or an asset and is subsequently adjusted to the current market value of the option written or purchased. Premiums received or paid from writing or purchasing options which expire unexercised are treated by the Fund on the expiration date as realized gains or losses. The difference between the premium and the amount paid or received on effecting a closing purchase or sale transaction, including brokerage commissions, is also treated as a realized gain or loss. If an option is exercised, the premium paid or received is added to the cost of the purchase or proceeds from the sale in determining whether the Fund has realized a gain or loss on investment transactions. The Fund, as writer of an option, may have no control over whether the underlying securities may be sold (call) or purchased (put) and as a result bears the market risk of an unfavorable change in the price of the security underlying the written option. The Fund, as purchaser of an option, bears the risk that the counterparties to the option may not have the ability to meet the terms of the option contracts.There is minimal counterparty credit risk involved in entering into option contracts since they are exchange-traded instruments and the exchange’s clearinghouse, as counterparty to all exchange-traded options, guarantees the options against default. The maximum risk of loss associated with writing put options is the notional amount as presented in the Portfolio of Investments. In certain circumstances, the maximum risk of loss amounts may be partially offset by recovery values of the respective referenced assets and upfront premium received upon entering into the contract. The maximum risk of loss associated with writing call options is potentially unlimited.
As of March 31, 2020, the Flexible Income Fund held purchased options with a fair value of $0.
Futures Contracts —The Flexible Income Fund may buy and sell futures contracts and related options to manage its exposure to changing interest rates and securities prices. Some strategies reduce the Fund’s exposure to price fluctuations, while others tend to increase its market exposure. Futures and options on futures can be volatile instruments and involve certain risks that could negatively impact the Fund’s return. In order to avoid leveraging and related risks, when the Fund purchases futures contracts, it will collateralize its position by depositing an amount of cash or liquid securities, equal to the market value of the futures positions held, less margin deposits, in a segregated account with its custodian or otherwise “cover” its position in a manner consistent with the 1940 Act or the rules of the Securities and Exchange Commission (the “SEC”) or interpretations thereunder. Collateral equal to the current fair value of the futures position will be determined on a daily basis.
When the contract is closed, the Fund records a realized gain or loss equal to the difference between the proceeds from (or cost of) the closing transactions and the Fund’s basis in the contract. Risks of entering into futures contracts include the possibility that a change in the value of the contract may not correlate with the changes in the value of the underlying instruments. Second, it is possible that a lack of liquidity for futures contracts could exist in the secondary market resulting in an inability to close a futures position prior to its maturity date. Third, the purchase of a futures contract involves the risk that the Fund could lose more than the original margin deposit required to initiate the futures transaction. Finally, the risk exists that losses could exceed amounts disclosed on the Statements of Assets and Liabilities. There is minimal counterparty credit risk involved in entering into futures contracts since they are exchange-traded instruments and the exchange’s clearinghouse, as counterparty to all exchange-traded futures, guarantees the futures against default.
As of March 31, 2020, the Flexible Income Fund did not hold any futures contracts.
Foreign currency translation —The books and records of the Funds are maintained in U.S. dollars and translated into U.S. dollars on the following basis:
| (1) | market value of investment securities, assets and liabilities at the current rate of exchange on the valuation date; and |
| (2) | purchases and sales of investment securities, income, and expenses at the relevant rates of exchange prevailing on the respective dates of such transactions. |
The Funds do not isolate that portion of gains and losses on investments in equity securities that is due to changes in the foreign exchange rates from that which is due to changes in market prices of equity securities.
Notes to Financial Statements(Continued)
Forward foreign currency contracts —A forward foreign currency contract is an agreement between two parties to buy and sell a specific currency at a price that is set on the date of the contract. The forward contract calls for delivery of the currency on a future date that is specified in the contract. Risks related to the use of forwards include the possible failure of counterparties to meet the terms of the forward agreement, the failure of the counterparties to timely post collateral, the risk that currency movements will not occur thereby reducing a Fund’s total return, and the potential for losses in excess of a Fund’s initial investment.
The market value of a forward foreign currency contract fluctuates with changes in foreign currency exchange rates. Forward foreign currency contracts are marked to market daily and the change in value is recorded by a Fund as an unrealized gain or loss. Realized gains or losses, equal to the difference between the value of the contract at the time it was opened and the value at the time it was closed, are recorded upon delivery or receipt of the currency.
As of March 31, 2020, there were no open forward foreign currency contracts.
Real Estate Investment Trusts —The Funds may invest in real estate investment trusts (“REITs”) that involve risks not associated with investing in stocks. Risks associated with investments in REITs include declines in the value of real estate, general and economic conditions, changes in the value of the underlying property and defaults by borrowers. The value of assets in the real estate industry may go through cycles of relative underperformance and outperformance in comparison to equity securities markets in general. Dividend income is recorded using management’s estimate of the income included in distributions received from REIT investments. The actual amounts of income, return of capital and capital gains are only determined by each REIT after its fiscal year-end and may differ from the estimated amount. Estimates of income are adjusted in the Funds to the actual amounts when the amounts are determined.
Master Limited Partnership —The Funds may invest in Master Limited Partnership (“MLP”) common units that represent limited partnership interests in the MLP. Common units are generally listed and traded on U.S. securities exchanges or OTC with their value fluctuating predominantly based on the success of the MLP. Unlike owners of common stock of a corporation, owners of MLP common units have limited voting rights and have no ability to annually elect directors. MLPs generally distribute all available cash flow (cash flow from operations less maintenance capital expenditures) in the form of quarterly distributions. Common unit holders have first priority to receive quarterly cash distributions up to the minimum quarterly distribution and have arrearage rights. Distributions received from MLPs generally are comprised of income and return of capital. Investment income and return of capital are recorded based on estimates made at the time distributions are received. The actual amounts of income and return of capital are only determined by each MLP after its fiscal year-end and may differ from the estimated amount. Estimates of income are adjusted in the Funds to the actual amounts when the amounts are determined. In the event of liquidation, common unit holders have preference over subordinated units, but not debt holders or preferred unit holders, to the remaining assets of the MLP.
Derivative instruments and hedging activities —The Flexible Income Fund may enter into an International Swaps and Derivatives Association, Inc. Master Agreement (“ISDA Master Agreement” or “MNA”) or similar agreement with certain counterparties. An ISDA Master Agreement is a bilateral agreement between the Fund and a counterparty that governs OTC derivatives and foreign exchange contracts, and typically contains, among other things, collateral posting terms and master netting provisions in the event of a default or termination. Under an ISDA Master Agreement, a party may, under certain circumstances, offset with the counterparty certain derivative financial instruments’ payables or receivables with collateral held or posted and create one single net payment. The provisions of the ISDA Master Agreement typically permit a single net payment in the event of default (close-out netting). These default events include bankruptcy or insolvency of the counterparty. Note, however, that bankruptcy or insolvency laws of a particular jurisdiction may impose restrictions on or prohibitions against the right of offset.
When entering into a derivative transaction, the Fund may be required to post and maintain collateral or margin (including both initial and maintenance margin). Collateral and margin requirements differ by type of derivative. Margin requirements are established by the broker or clearing house for exchange-traded and centrally cleared derivatives (financial futures contracts, options, and centrally cleared swaps). Brokers can ask for margining in excess of the clearing house’s minimum in certain circumstances. Collateral terms are contract specific for OTC derivatives (forward foreign currency contracts, options, and swaps). For derivatives traded under an ISDA Master Agreement, the collateral requirements are typically calculated by netting the marked-to-market amount for each transaction under such agreement and comparing that amount to the value of any collateral currently pledged by the Fund and the counterparty. For financial reporting purposes, cash collateral that has been pledged to cover obligations of the Fund and cash collateral received from the counterparty, if any, are reported separately on the Statements of Assets and Liabilities as cash deposits held at prime broker and due to prime broker, respectively. Non-cash collateral pledged by the Fund, if any, is noted in the Portfolio of Investments. To the extent amounts due to the Fund from its counterparties are not fully collateralized, contractually or otherwise, the Fund bears the risk of loss from counterparty non-performance.
Certain ISDA Master Agreements allow counterparties to OTC derivatives transactions to terminate derivative contracts prior to maturity in the event the Fund’s net assets decline by a stated percentage or the Fund fails to meet the terms of its ISDA Master Agreement, which would cause the Fund (counterparty) to accelerate payment of any net liability owed to the counterparty (Fund).
Notes to Financial Statements(Continued)
For financial reporting purposes, the Flexible Income Fund does not offset derivative assets and derivative liabilities that are subject to netting arrangements in the Statements of Assets and Liabilities.
As of March 31, 2020, the Flexible Income Fund did not hold any assets and liabilities that were subject to a MNA in the Statement of Assets and Liabilities.
The following table sets forth the effect of the Flexible Income Fund’s derivative financial instruments by primary risk exposure on the Statements of Operations for the year ended March 31, 2020:
| | | | | | | | Change in | |
| | | | | | | | Unrealized | |
| | | | | | | | Appreciation | |
| | | Derivatives not accounted for as | | Realized Gain (Loss) | | | (Depreciation) | |
| Fund | | hedging instruments under ASC 815 | | on Derivatives | | | on Derivatives | |
| Flexible Income Fund | | Purchased Options - Equity Contracts* | | $ | 7,881,801 | | | $ | — | |
| | | Futures - Interest Rate Contracts** | | | (2,072,499 | ) | | | 1,580,368 | |
| | | Written Options - Equity Contracts*** | | | 8,854 | | | | — | |
* Statements of Operations Location: Net realized gains (losses) on investments and Net change in unrealized appreciation (depreciation) on investments, respectively. **Statements of Operations Location: Net realized losses on futures contracts and Net change in unrealized appreciation (depreciation) on futures contracts, respectively.
***Statements of Operations Location: Net realized gains on written options.
For the year ended March 31, 2020, the average quarterly balance of outstanding derivative financial instruments for the Flexible Income Fund was as follows:
| | | Flexible Income
Fund | |
| Equity contracts: | | | | |
| Purchased Options - Cost | | $ | 229,398 | |
| Written Options - Premium received* | | $ | — | |
| Interest rate contracts: | | | | |
| Futures - Notional value | | $ | 10,967,429 | |
* The balance at each quarter end was zero.
Portfolio securities loaned —The Funds may lend their portfolio securities. Lending portfolio securities exposes the Funds to the risk that the borrower may fail to return the loaned securities or may not be able to provide additional collateral or that the Funds may experience delays in recovery of the loaned securities or loss of rights in the collateral if the borrower fails financially. To minimize these risks, the borrower must agree to maintain cash collateral with the Funds’ custodian. The loaned securities are secured by collateral valued at least equal, at all times, to the market value of the loaned securities plus accrued interest, if any. When the collateral falls below specified amounts, the lending agent will use its best effort to obtain additional collateral on the next business day to meet required amounts under the security lending agreement. The cash collateral is reinvested by the Funds’ custodian into an approved short-term investment vehicle. The approved short-term investment vehicle is subject to market risk.
As of March 31, 2020, the following Funds loaned securities and received collateral as follows:
| | | | | Market Value of
| | | Market Value of
| | | | |
| Fund | | Security Type | | Securities Loaned* | | | Collateral Received** | | | Net Amount*** | |
| Flexible Income Fund | | Investment Funds | | $ | 66,471 | | | $ | 66,255 | | | $ | (216 | ) |
| Global ESG Equity Fund | | Common Stocks | | | 19,177,539 | | | | 19,738,050 | | | | 560,511 | |
| Mid Cap Growth Fund | | Common Stocks | | | 1,310,400 | | | | 1,119,300 | | | | (191,100 | ) |
| * | The remaining contractual maturity is overnight for all securities. |
| ** | Gross amount of recognized liabilities for securities lending included in the Statements of Assets and Liabilities. |
| ***Net | amount represents the net amount payable due to (receive from) the borrower in the event of default. |
All cash collateral is received, held, and administered by the Funds’ custodian for the benefit of the lending Fund in its custody account or other account established for the purpose of holding collateral in cash equivalents.
Funds participating in securities lending receive compensation in the form of fees. Securities lending income is derived from lending long securities from the Funds to creditworthy approved borrowers at rates that are determined based on trading volumes, float, short-term interest rates and market liquidity and is shown net of fees on the Statements of Operations. When a Fund lends securities, it retains the interest or dividends on the investment of any cash received as collateral, and the Fund continues to receive interest or dividends on the loaned securities.
Notes to Financial Statements(Continued)
Unrealized gain or loss on the market value of the loaned securities that may occur during the term of the loan is recognized by the Fund. The Fund has the right under the lending agreement to recover any loaned securities from the borrower on demand.
Share valuation —The NAV per share of each class of shares of each Fund is calculated daily by dividing the total value of a Fund’s assets attributable to that class, less liabilities attributable to that class, by the number of outstanding shares of that class.
The maximum offering price per share of Class A shares of the equity funds (all funds except the Flexible Income Fund) is equal to the NAV per share plus a sales load equal to 5.26% of the NAV (or 5.00% of the offering price). The maximum offering price per share of Class A shares of the Flexible Income Fund is equal to the NAV per share plus a sales load equal to 2.04% of the NAV (or 2.00% of the offering price). There is no sales load on equity or fixed income fund purchases when aggregate purchases in all Touchstone funds equal at least $1 million or $500,000, respectively. The maximum offering price per share of Class C, Class Y, Institutional Class and R6 shares of the Funds is equal to the NAV per share.
The redemption price per share of each class of shares of the Funds is generally equal to the NAV per share. However, Class A redemptions that were part of a no-load purchase due to the aggregate purchase amount in all Touchstone funds equaling at least $1 million for equity funds or $500,000 for fixed income funds where a Finder’s Fee was paid may be subject to a contingent deferred sales charge (“CDSC”) of up to 1.00% or 0.50%, respectively, if redeemed within a one-year period from the date of purchase. Additionally, purchases of Class C shares of the Funds are subject to a CDSC of 1.00%. The CDSC will be assessed on an amount equal to the lesser of (1) the NAV at the time of purchase of the shares being redeemed or (2) the NAV of such shares being redeemed.
Investment income —Dividend income from securities is recognized on the ex-dividend date, net of foreign withholding taxes, if any, which are reduced by any amounts reclaimable by the Funds, where applicable. Interest income from securities is recorded on the basis of interest accrued, premium amortized and discount accreted. Realized gains and losses resulting from principal paydowns on mortgage-backed and asset-backed securities are included in interest income. Market discounts, original issue discounts and market premiums on debt securities are accreted/amortized to interest income over the life of the security, or to the appropriate call date, as applicable, with a corresponding adjustment in the cost basis of that security. In addition, it is the Funds’ policy to accrue for foreign capital gains taxes, if applicable, on certain foreign securities held by the Funds. An estimated foreign capital gains tax is recorded daily on net unrealized gains on these securities and is payable upon the sale of such securities when a gain is realized.
Distributions to shareholders —Each Fund intends to distribute to its shareholders substantially all of its income and capital gains. Each Fund, except for the Flexible Income Fund, declares and distributes net investment income, if any, annually, as a dividend to shareholders.The Flexible Income Fund declares and distributes net investment income, if any, monthly, as a dividend to shareholders. Each Fund makes distributions of capital gains, if any, at least annually, net of applicable capital loss carryforwards. Income distributions and capital gain distributions are determined in accordance with income tax regulations. Recognition of the Funds’ net investment income from investments in Underlying Funds is affected by the timing of dividend declarations by the Underlying Funds.
Allocations —Investment income earned, realized capital gains and losses, and unrealized appreciation and depreciation for a Fund are allocated daily to each class of shares based upon its proportionate share of total net assets of the Fund. Class-specific expenses are charged directly to the class incurring the expense. Common expenses, which are not attributable to a specific class, are allocated daily to each class of shares based upon their proportionate share of total net assets of the Fund. Expenses not directly billed to a Fund are allocated proportionally among all the Funds in the Trust, and, if applicable, Touchstone Funds Group Trust, Touchstone Institutional Funds Trust, and Touchstone Variable Series Trust (collectively with the Trust, “Touchstone Fund Complex”), daily in relation to net assets of each Fund or another reasonable measure.
Security transactions —Security transactions are reflected for financial reporting purposes as of the trade date. Realized gains and losses on sales of portfolio securities are calculated using the identified cost basis.
Estimates —The preparation of financial statements in conformity with U.S. GAAP requires management to make estimates and assumptions that affect the reported amounts of assets and liabilities and disclosure of contingent assets and liabilities at the date of the financial statements and the reported amounts of income and expenses during the reporting period. Actual results could differ from those estimates.
3. Investment Transactions
Investment transactions (excluding short-term investments and U.S. Government securities) were as follows for the year ended March 31, 2020:
Notes to Financial Statements(Continued)
| | | | | | | | | | | | | | | | | | Sands Capital | |
| | | Flexible | | | | | | | | | Growth | | | Mid Cap | | | Emerging | |
| | | Income | | | Focused | | | Global ESG | | | Opportunities | | | Growth | | | Markets | |
| | | Fund | | | Fund | | | Equity Fund | | | Fund* | | | Fund | | | Growth Fund | |
| Purchases of investment securities | | $ | 620,520,621 | | | $ | 122,721,863 | | | $ | 410,970,626 | | | $ | 159,008,265 | | | $ | 1,029,880,043 | | | $ | 877,021,684 | |
| Proceeds from sales and maturities | | $ | 614,437,373 | | | $ | 298,859,113 | | | $ | 530,479,548 | | | $ | 148,540,780 | | | $ | 974,136,632 | | | $ | 218,752,159 | |
* Growth Opportunities Fund had redemptions-in-kind out of the Fund of $4,182,052, which is excluded from the proceeds from sales and maturities. The redemptions were comprised of securities and cash in the amount of $4,028,264 and $153,788, respectively.
For the year ended March 31, 2020, purchases and proceeds from sales and maturities in U.S. Government securities were $96,499,739 and $116,471,047, respectively, for the Flexible Income Fund. There were no purchases or proceeds from sales and maturities of U.S. Government Securities by the remaining Funds for the year ended March 31, 2020.
4. Transactions with Affiliates and Other Related Parties
Certain officers of the Trust are also officers of Touchstone Advisors, Inc. (the “Advisor”), Touchstone Securities, Inc. (the “Underwriter”), or The Bank of New York Mellon (“BNY Mellon”), the Sub-Administrator to the Funds. Such officers receive no compensation from the Trust. The Advisor and the Underwriter are each wholly-owned subsidiaries of Western & Southern Financial Group, Inc. (“Western & Southern”).
On behalf of the Funds, the Advisor pays each Independent Trustee a quarterly retainer plus additional retainers to the Lead Independent Trustee and the chairs of each standing committee. Interested Trustees do not receive compensation from the Funds. Each Independent Trustee also receives compensation for each Board meeting and committee meeting attended. Each standing committee chair receives additional compensation for each committee meeting that he or she oversees. The Advisor is reimbursed by the Funds for the Independent Trustees’ compensation and out-of-pocket expenses relating to their services. The Funds accrued Trustee-related expenses of $137,736 for the year ended March 31, 2020.
MANAGEMENT & EXPENSE LIMITATION AGREEMENTS
The Advisor provides general investment supervisory services for the Funds, under the terms of an advisory agreement (“Advisory Agreement”). Under the Advisory Agreement, each Fund pays the Advisor a fee, which is computed and accrued daily and paid monthly, at an annual rate based on average daily net assets of each Fund as shown in the table below.
| Flexible Income Fund | 0.60% on the first $500 million |
| | 0.50% on such assets in excess of $500 million |
| Focused Fund | 0.70% on the first $100 million |
| | 0.65% on the next $400 million |
| | 0.60% on such assets in excess of $500 million |
| Global ESG Equity Fund | 0.65% on the first $1 billion |
| | 0.60% on such assets in excess of $1 billion |
| Growth Opportunities Fund | 0.75% on the first $500 million |
| | 0.70% on the next $500 million |
| | 0.65% on such assets in excess of $1 billion |
| Mid Cap Growth Fund* | 0.75% on the first $500 million |
| | 0.70% on the next $500 million |
| | 0.65% on the next $200 million |
| | 0.60% on such assets in excess of $1.2 billion |
| Sands Capital Emerging Markets Growth Fund | 1.00% |
*Prior to December 1, 2019, the fund paid 0.75% on the first $500 million, 0.70% on the next $500 million and 0.65% on such assets over $1 billon.
The Advisor has entered into investment sub-advisory agreements with the following parties (each, a “Sub-Advisor”):
| Bramshill Investments, LLC | Sands Capital Management, LLC |
| Flexible Income Fund | Sands Capital Emerging Markets Growth Fund |
| Fort Washington Investment Advisors, Inc.* | |
| Focused Fund | |
Notes to Financial Statements(Continued)
| Rockefeller & Co., LLC | Westfield Capital Management Company, L.P. |
| Global ESG Equity Fund | Growth Opportunities Fund |
| | Mid Cap Growth Fund |
*Affiliate of the Advisor and wholly-owned subsidiary of Western & Southern.
The Advisor pays sub-advisory fees to each Sub-Advisor from its advisory fee.
The Advisor entered into an expense limitation agreement (the “Expense Limitation Agreement”) to contractually limit the annual operating expenses of the Funds, excluding: dividend and interest expenses relating to short sales; interest; taxes; brokerage commissions and other transaction costs; portfolio transaction and investment related expenses, including expenses associated with the Funds’ liquidity providers; other expenditures which are capitalized in accordance with U.S. GAAP; the cost of “Acquired Fund Fees and Expenses”, if any; and other extraordinary expenses not incurred in the ordinary course of business. The maximum annual operating expense limit in any year with respect to the Funds is based on a percentage of the average daily net assets of the Funds. The Advisor has agreed to waive a portion of its fees and to reimburse certain fund expenses in order to maintain the following expense limitations for the Funds:
| | | | | | | | | | | | Institutional | | | | |
| | | Class A | | | Class C | | | Class Y | | | Class | | | Class R6 | |
| Flexible Income Fund | | | 1.04 | % | | | 1.79 | % | | | 0.79 | % | | | 0.69 | % | | | — | |
| Focused Fund | | | 1.20 | % | | | 1.95 | % | | | 0.95 | % | | | 0.83 | % | | | — | |
| Global ESG Equity Fund | | | 1.17 | % | | | 1.99 | % | | | 0.90 | % | | | 0.89 | % | | | — | |
| Growth Opportunities Fund | | | 1.24 | % | | | 1.99 | % | | | 0.99 | % | | | 0.89 | % | | | — | |
| Mid Cap Growth Fund | | | 1.39 | % | | | 2.14 | % | | | 1.14 | % | | | 0.99 | % | | | 0.89 | % |
| Sands Capital Emerging Markets Growth Fund | | | 1.60 | % | | | 2.35 | % | | | 1.35 | % | | | 1.25 | % | | | — | |
These expense limitations will remain in effect for all Funds through at least July 30, 2020, except for the Mid Cap Growth Fund Class R6 and the Sands Capital Emerging Markets Growth Fund. The expense limitation for the Mid Cap Growth Fund Class R6 and the Sands Capital Emerging Markets Growth Fund will remain in effect through at least February 28, 2021 and November 17, 2020, respectively. The expense limitation agreement can be terminated by a vote of the Funds’ Board if it deems the termination to be beneficial to the Funds’ shareholders.
During the year ended March 31, 2020, the Advisor or its affiliates waived investment advisory fees and administration fees or waived or reimbursed other operating expenses, including distribution fees of the Funds, as follows:
| | | | | | | | | Other Operating | | | | |
| | | Investment | | | | | | Expenses | | | | |
| | | Advisory | | | Administration | | | Reimbursed/ | | | | |
| Fund | | Fees Waived | | | Fees Waived | | | Waived | | | Total | |
| Flexible Income Fund | | $ | — | | | $ | 494,872 | | | $ | 102,486 | | | $ | 597,358 | |
| Focused Fund | | | — | | | | — | | | | 31,574 | | | | 31,574 | |
| Global ESG Equity Fund | | | — | | | | — | | | | 166,173 | | | | 166,173 | |
| Growth Opportunities Fund | | | — | | | | 133,269 | | | | 112,576 | | | | 245,845 | |
| Mid Cap Growth Fund | | | — | | | | — | | | | 3,760 | | | | 3,760 | |
| Sands Capital Emerging Markets Growth Fund | | | — | | | | — | | | | 35,391 | | | | 35,391 | |
Under the terms of the Expense Limitation Agreement, the Advisor is entitled to recover, subject to approval by the Funds’ Board, such amounts waived or reimbursed for a period of up to three years from the date on which the Advisor reduced its compensation or assumed expenses for the Funds. The Funds will make repayments to the Advisor only if such repayment does not cause the Funds’ operating expenses (after the repayment is taken into account) to exceed the Funds’ expense limit in place when such amounts were waived or reimbursed by the Advisor and the Funds’ current expense limitation.
As of March 31, 2020, the Advisor may seek recoupment of previously waived fees and reimbursed expenses as follows:
| | | Expires on or | | | Expires on or | | | Expires on or | | | | |
| | | before | | | before | | | before | | | | |
| Fund | | March 31, 2021 | | | March 31, 2022 | | | March 31, 2023 | | | Total | |
| Flexible Income Fund | | $ | 695,170 | | | $ | 474,385 | | | $ | 557,404 | | | $ | 1,726,959 | |
| Focused Fund | | | 23,561 | | | | 22,968 | | | | 22,297 | | | | 68,826 | |
| Global ESG Equity Fund | | | 161,406 | | | | 73,180 | | | | 107,012 | | | | 341,598 | |
| Growth Opportunities Fund | | | 267,156 | | | | 273,078 | | | | 198,248 | | | | 738,482 | |
| Mid Cap Growth Fund | | | — | | | | — | | | | 3,760 | | | | 3,760 | |
| Sands Capital Emerging Markets Growth Fund | | | 117,229 | | | | 98,432 | | | | 25,128 | | | | 240,789 | |
Notes to Financial Statements(Continued)
For the year ended March 31, 2020, the Advisor recouped previously waived fees or reimbursed expenses from the Focused Fund and Sands Capital Emerging Markets Growth Fund of $4,936 and $122,346, respectively.
ADMINISTRATION AGREEMENT
The Advisor entered into an Administration Agreement with the Trust, whereby the Advisor is responsible for: supplying executive and regulatory compliance services; supervising the preparation of tax returns; coordinating the preparation of reports to shareholders and reports to, and filings with, the SEC and state securities authorities, as well as materials for meetings of the Board; calculating the daily NAV per share; and maintaining the financial books and records of each Fund.
For its services, the Advisor’s annual administrative fee is:
0.145% on the first $20 billion of the aggregate average daily net assets;
0.11% on the next $10 billion of aggregate average daily net assets;
0.09% on the next $10 billion of aggregate average daily net assets; and
0.07% on the aggregate average daily net assets over $40 billion.
The fee is computed and allocated among the Touchstone Fund Complex (excluding Touchstone Institutional Funds Trust) on the basis of relative daily net assets.
The Advisor has engaged BNY Mellon as the Sub-Administrator to the Trust. BNY Mellon provides administrative and accounting services to the Trust and is compensated directly by the Advisor, not the Trust.
TRANSFER AGENT AGREEMENT
Under the terms of the Transfer Agent Agreement between the Trust and BNY Mellon, BNY Mellon maintains the records of each shareholder’s account, answers shareholders’ inquiries concerning their accounts, processes purchases and redemptions of each Fund’s shares, acts as dividend and distribution disbursing agent, and performs other shareholder service functions. For these services, BNY Mellon receives a monthly fee from each Fund. In addition, each Fund pays out-of-pocket expenses incurred by BNY Mellon, including, but not limited to, postage and supplies.
The Funds may reimburse the Advisor for fees paid to intermediaries such as banks, broker-dealers, financial advisors or other financial institutions for sub-transfer agency, sub-administration and other services provided to investors whose shares of record are held in omnibus, other group accounts, retirement plans or accounts traded through registered securities clearing agents. These fees, which are included in Transfer Agent fees in Statements of Operations, may vary based on, for example, the nature of services provided, but generally range up to 0.15% of the assets of the class serviced or maintained by the intermediary or up to $22 per sub-account maintained by the intermediary.
PLANS OF DISTRIBUTION AND SHAREHOLDER SERVICING FEE ARRANGEMENTS
The Trust has adopted distribution plans pursuant to Rule 12b-1 under the 1940 Act for each class of shares it offers that is subject to 12b-1 distribution fees. The plans allow each Fund to pay distribution and other fees for the sale and distribution of its shares and for services provided to shareholders. The fees charged to the Funds are limited to the actual expenses incurred. Under the Class A plan, each Fund offering Class A shares pays an annual fee not to exceed 0.25% of average daily net assets that are attributable to Class A shares. Under the Class C plan, each Fund offering Class C shares pays an annual fee not to exceed 1.00% of average daily net assets that are attributable to Class C shares (of which up to 0.75% is a distribution fee and up to 0.25% is a shareholder servicing fee).
UNDERWRITING AGREEMENT
The Underwriter is the Funds’ principal underwriter and, as such, acts as exclusive agent for distribution of the Funds’ shares. Under the terms of the Underwriting Agreement between the Trust and the Underwriter, the Underwriter earned underwriting and broker commissions on the sale of Class A shares of the Funds. W&S Brokerage Services, Inc., an affiliate of the Underwriter and the Advisor, also earned broker commissions on the sale of Class A shares of the Funds. Listed below are the total underwriting and broker commissions earned by the Underwriter and its affiliate during the year ended March 31, 2020:
| Fund | | Amount | |
| Flexible Income Fund | | $ | 6,228 | |
| Focused Fund | | | 8,353 | |
| Global ESG Equity Fund | | | 11,656 | |
| Growth Opportunities Fund | | | 4,606 | |
| Mid Cap Growth Fund | | | 33,865 | |
Notes to Financial Statements(Continued)
| Fund | | Amount | |
| Sands Capital Emerging Markets Growth Fund | | $ | 1,909 | |
In addition, the Underwriter collected CDSCs on the redemption of Class C shares of the Funds listed below during the year ended March 31, 2020:
| Fund | | Class C | |
| Flexible Income Fund | | $ | 250 | |
| Focused Fund | | | 1,094 | |
| Global ESG Equity Fund | | | 247 | |
| Growth Opportunities Fund | | | 22 | |
| Mid Cap Growth Fund | | | 59 | |
INTERFUND TRANSACTIONS
Pursuant to Rule 17a-7 under the 1940 Act, the Funds may engage in purchase and sale transactions with funds that have a common investment advisor (or affiliated investment advisors), common Trustees and/or common Officers. During the year ended March 31, 2020, the Funds did not engage in any Rule 17a-7 transactions.
5. Liquidity
ReFlow Fund LLC—The Funds may participate in the ReFlow Fund LLC liquidity program (“ReFlow”), which is designed to provide an alternative liquidity source for funds experiencing redemptions. In order to pay cash to shareholders who redeem their shares on a given day, a fund typically must hold cash in its portfolio, liquidate portfolio securities, or borrow money. ReFlow provides participating funds with another source of cash by standing ready to purchase shares from a fund up to the amount of the fund’s net redemptions on a given day, cumulatively limited to 3% of the outstanding voting shares of a Fund. ReFlow then generally redeems those shares (in cash or in-kind) when the Fund experiences net sales, at the end of a maximum holding period determined by ReFlow, or at other times at ReFlow’s discretion. In return for this service, the Fund will pay a fee to ReFlow at a rate determined by a daily auction with other participating mutual funds.
During the year ended March 31, 2020, the Growth Opportunities Fund utilized ReFlow. ReFlow purchased 121,612 shares of the Fund during the period and had redemptions-in-kind of $4,028,264. The resulting fee is included in “Other expenses” on the Statement of Operations.
Interfund Lending—Pursuant to an Exemptive Order issued by the SEC on March 28, 2017, the Funds, along with certain other funds in the Touchstone Fund Complex, may participate in an interfund lending program. The interfund lending program provides an alternate credit facility that allows the Funds to lend to or borrow from other participating funds in theTouchstone Fund Complex, subject to the conditions of the Exemptive Order. The Funds may not borrow under the facility for leverage purposes and the loans’ duration may be no more than 7 days.
During the year ended March 31, 2020, the following Funds participated as a lender in the interfund lending program. The daily average amount loaned, weighted average interest rate and interest income were as follows:
| | | Daily Average | | | Weighted Average | | | | |
| Fund | | Amount Loaned | | | Interest Rate | | | Interest Income* | |
| Mid Cap Growth Fund | | $ | 49,365 | | | | 2.28 | % | | $ | 1,178 | |
| Sands Capital Emerging Markets Growth Fund | | | 138,305 | | | | 1.15 | % | | | 2,177 | |
*Included in Interest in the Statements of Operations.
During the year ended March 31, 2020, the following Funds participated as a borrower in the interfund lending program. The daily average amount borrowed, weighted average interest rate and interest expense were as follows:
| | | Daily Average | | | Weighted Average | | | | |
| Fund | | Amount Borrowed | | | Interest Rate | | | Interest Expense* | |
| Flexible Income Fund | | $ | 268,238 | | | | 0.87 | % | | $ | 2,350 | |
| Focused Fund | | | 121,956 | | | | 1.43 | % | | | 1,844 | |
| Growth Opportunities Fund | | | 14,309 | | | | 2.93 | % | | | 425 | |
| Mid Cap Growth Fund | | | 68,437 | | | | 1.05 | % | | | 730 | |
*Included in Other expenses in the Statements of Operations.
Notes to Financial Statements(Continued)
6. Federal Tax Information
Federal Income Tax —It is each Fund’s policy to continue to comply with the special provisions of the Internal Revenue Code applicable to regulated investment companies. As provided therein, in any fiscal year in which a Fund so qualifies and distributes at least 90% of its investment company taxable income, the Fund (but not the shareholders) will be relieved of federal income tax on the income distributed. It is each Fund’s policy to distribute all of its taxable income and accordingly, no provision for income taxes has been made.
In order to avoid imposition of the excise tax applicable to regulated investment companies, it is also each Fund’s intention to declare and pay as dividends in each calendar year at least 98% of its investment company taxable income (earned during the calendar year) and 98.2% of its net realized capital gains (earned during the twelve months ending October 31) plus undistributed amounts from prior years.
The tax character of distributions paid for the years ended March 31, 2020 and March 31, 2019 are as follows:
| | | Flexible Income Fund | | | Focused Fund | | | Global ESG Equity Fund | |
| | | Year Ended | | | Year Ended | | | Year Ended | | | Year Ended | | | Year Ended | | | Year Ended | |
| | | March 31, | | | March 31, | | | March 31, | | | March 31, | | | March 31, | | | March 31, | |
| | | 2020 | | | 2019 | | | 2020 | | | 2019 | | | 2020 | | | 2019 | |
| From ordinary income | | $ | 24,652,668 | | | $ | 29,977,346 | | | $ | 5,500,849 | | | $ | 8,895,802 | | | $ | 5,563,150 | | | $ | 11,745,647 | |
| From long-term capital gains | | | — | | | | 4,234,655 | | | | 55,397,876 | | | | 42,522,534 | | | | 11,203,902 | | | | 52,799,731 | |
| Total distributions | | $ | 24,652,668 | | | $ | 34,212,001 | | | $ | 60,898,725 | | | $ | 51,418,336 | | | $ | 16,767,052 | | | $ | 64,545,378 | |
| | | | | | | | | | | | | | | Sands Capital Emerging | |
| | | Growth Opportunities Fund | | | Mid Cap Growth Fund | | | Markets Growth Fund | |
| | | Year Ended | | | Year Ended | | | Year Ended | | | Year Ended | | | Year Ended | | | Year Ended | |
| | | March 31, | | | March 31, | | | March 31, | | | March 31, | | | March 31, | | | March 31, | |
| | | 2020 | | | 2019 | | | 2020 | | | 2019 | | | 2020 | | | 2019 | |
| From ordinary income | | $ | 8,130,533 | | | $ | 190,894 | | | $ | 20,234,815 | | | $ | 13,059,653 | | | $ | 9,496,797 | | | $ | — | |
| From long-term capital gains | | | 12,343,538 | | | | 26,307,524 | | | | 67,373,035 | | | | 60,828,960 | | | | — | | | | — | |
| Total distributions | | $ | 20,474,071 | | | $ | 26,498,418 | | | $ | 87,607,850 | | | $ | 73,888,613 | | | $ | 9,496,797 | | | $ | — | |
The following information is computed on a tax basis for each item as of March 31, 2020:
| | | Flexible | | | Focused | | | Global | |
| | | Income Fund | | | Fund | | | ESG Equity Fund | |
| Tax cost of portfolio investments | | $ | 688,175,502 | | | $ | 596,451,353 | | | $ | 535,220,468 | |
| Gross unrealized appreciation on investments | | | 4,119,015 | | | | 227,794,169 | | | | 81,252,290 | |
| Gross unrealized depreciation on investments | | | (61,933,007 | ) | | | (77,573,395 | ) | | | (83,593,359 | ) |
| Net unrealized appreciation (depreciation) on investments | | | (57,813,992 | ) | | | 150,220,774 | | | | (2,341,069 | ) |
| Gross unrealized appreciation on foreign currency transactions | | | — | | | | — | | | | 100,366 | |
| Gross unrealized depreciation on foreign currency transactions | | | — | | | | — | | | | (166,344 | ) |
| Net unrealized depreciation on foreign currency transactions | | | — | | | | — | | | | (65,978 | ) |
| Qualified late-year losses | | | — | | | | — | | | | (28,211,789 | ) |
| Undistributed ordinary income | | | 6,510,833 | | | | 2,665,956 | | | | 366,328 | |
| Undistributed capital gains | | | — | | | | 22,158,410 | | | | — | |
| Distributable earnings (deficit) | | $ | (51,303,159 | ) | | $ | 175,045,140 | | | $ | (30,252,508 | ) |
Notes to Financial Statements(Continued)
| | | Growth | | | Mid Cap | | | Sands Capital | |
| | | Opportunities | | | Growth | | | Emerging Markets | |
| | | Fund | | | Fund | | | Growth Fund | |
| Tax cost of portfolio investments | | $ | 143,522,964 | | | $ | 974,462,773 | | | $ | 1,358,452,598 | |
| Gross unrealized appreciation on investments | | | 29,451,740 | | | | 172,571,208 | | | | 152,389,097 | |
| Gross unrealized depreciation on investments | | | (10,145,993 | ) | | | (104,465,527 | ) | | | (214,152,730 | ) |
| Net unrealized appreciation (depreciation) on investments | | | 19,305,747 | | | | 68,105,681 | | | | (61,763,633 | ) |
| Gross unrealized appreciation on foreign currency transactions | | | — | | | | — | | | | 10,101 | |
| Gross unrealized depreciation on foreign currency transactions | | | — | | | | — | | | | (40,287 | ) |
| Net unrealized depreciation on foreign currency transactions | | | — | | | | — | | | | (30,186 | ) |
| Qualified Late-Year Losses | | | (404,928 | ) | | | (16,568,767 | ) | | | (1,109,967 | ) |
| Capital loss carryforwards | | | — | | | | — | | | | (49,799,817 | ) |
| Undistributed capital gains | | | — | | | | 16,490,637 | | | | — | |
| Distributable earnings (deficit) | | $ | 18,900,819 | | | $ | 68,027,551 | | | $ | (112,703,603 | ) |
The difference between the tax cost of portfolio investments and the financial statement cost is primarily due to wash sale loss deferrals, trust preferred securities and investments in passive foreign investment company (“PFIC”) adjustments.
As of March 31, 2020, the Funds had the following capital loss carryforwards for federal income tax purposes:
| | | No Expiration | | | No Expiration | | | | |
| Fund | | Short Term | | | Long Term | | | Total | |
| Sands Capital Emerging Markets Growth Fund | | $ | 21,104,529 | | | $ | 28,695,288 | | | $ | 49,799,817 | |
The capital loss carryforwards may be utilized in future years to offset net realized capital gains, if any, prior to distributing such gains to shareholders.
During the year ended March 31, 2020, the following Funds utilized capital loss carryforwards:
| Fund | | Utilized | |
| Flexible Income Fund | | $ | 15,234,279 | |
Under current laws, certain capital losses realized after October 31 and ordinary losses realized after December 31 may be deferred (and certain ordinary losses after October and/or December 31 may be deferred) and treated as occurring on the first day of the following fiscal year. For the year ended March 31, 2020, the Funds elected to defer the following losses:
| | | Realized | | | Ordinary | | | | |
| Fund | | Capital Losses | | | Losses | | | Total | |
| Global ESG Equity Fund | | $ | 28,211,789 | | | $ | — | | | $ | 28,211,789 | |
| Growth Opportunities Fund | | | 404,928 | | | | — | | | | 404,928 | |
| Mid Cap Growth Fund | | | 15,247,986 | | | | 1,320,781 | | | | 16,568,767 | |
| Sands Capital Emerging Markets Growth Fund | | | — | | | | 1,109,967 | | | | 1,109,967 | |
The Funds have analyzed their tax positions taken or to be taken on federal income tax returns for all open tax years (tax years ended March 31, 2017 through 2020) and have concluded that no provision for income tax is required in their financial statements.
Certain reclassifications, the result of permanent differences between financial statement and income tax reporting requirements, have been made to the components of capital as presented on the Statements of Assets and Liabilities. These reclassifications have no impact on the net assets or NAV per share of the Funds. The following reclassifications, which are primarily attributed to the tax treatment of net operating losses, acquired wash sales from mergers, in-kind distributions for shareholder redemptions, deemed distributions on shareholder redemptions have been made to the following Funds for the year ended March 31, 2020:
| | | Paid-In | | | Distributable | |
| Fund | | Capital | | | Earnings | |
| Focused Fund | | $ | 6,871,143 | | | $ | (6,871,143 | ) |
| Growth Opportunities Fund | | | (6,795,128 | ) | | | 6,795,128 | |
| Mid Cap Growth Fund | | | 8,294,985 | | | | (8,294,985 | ) |
7. Commitments and Contingencies
The Funds indemnify the Trust’s officers and Trustees for certain liabilities that might arise from their performance of their duties to the Funds. Additionally, in the normal course of business, the Funds enter into contracts that contain a variety of representations
Notes to Financial Statements(Continued)
and warranties and which provide general indemnifications. The Funds’ maximum exposure under these arrangements is unknown, as this would involve future claims that may be made against the Funds.
8. Principal Risks
Risks Associated with Foreign Investments —Some of the Funds may invest in the securities of foreign issuers. Investing in securities issued by companies whose principal business activities are outside the U.S. may involve significant risks not present in domestic investments. For example, there is generally less publicly available information about foreign companies, particularly those not subject to the disclosure and reporting requirements of the U.S. securities laws. Foreign issuers are generally not bound by uniform accounting, auditing, and financial reporting requirements and standards of practice comparable to those applicable to domestic issuers. Investments in foreign securities also involve the risk of possible adverse changes in investment or exchange control regulations, expropriation or confiscatory taxation, limitations on the removal of funds or other assets of a Fund, political or financial instability or diplomatic and other developments which could affect such investments. Foreign stock markets, while growing in volume and sophistication, are generally not as developed as those in the U.S., and securities of some foreign issuers (particularly those located in developing countries) may be less liquid and more volatile than securities of comparable U.S. companies. In general, there is less overall governmental supervision and regulation of foreign securities markets, broker-dealers, and issuers than in the U.S.
Risks Associated with Sector Concentration —Certain Funds may invest a high percentage of their assets in specific sectors of the market in order to achieve a potentially greater investment return. As a result, these Funds may be more susceptible to economic, political, and regulatory developments in a particular sector of the market, positive or negative, and may experience increased volatility in the Funds’ NAVs and magnified effect on the total return.
Risks Associated with Credit —An issuer may be unable to make timely payments of either principal or interest. This may cause the issuer’s securities to decline in value. Credit risk is particularly relevant to those Funds that invest a significant amount of their assets in junk bonds or lower-rated securities.
Risks Associated with Interest Rate Changes —The price of debt securities is generally linked to the prevailing market interest rates. In general, when interest rates rise, the price of debt securities falls, and when interest rates fall, the price of debt securities rises. The price volatility of a debt security also depends on its maturity. Longer-term securities are generally more volatile, so the longer the average maturity or duration of these securities, the greater their price risk. Duration is a measure of the expected life, taking into account any prepayment or call features of the security, that is used to determine the price sensitivity of the security for a given change in interest rates. Specifically, duration is the change in the value of a fixed-income security that will result from a 1% change in interest rates, and generally is stated in years. For example, as a general rule a 1% rise in interest rates means a 1% fall in value for every year of duration. Maturity, on the other hand, is the date on which a fixed-income security becomes due for payment of principal. The negative impact on fixed income securities if interest rates increase as a result could negatively impact a Fund’s NAV.
Risks Associated with Health Crises —An outbreak of respiratory disease caused by a novel coronavirus was first detected in China in December 2019 and subsequently spread internationally. As of the date of issuance of these financial statements, this coronavirus has resulted in closing borders, enhanced health screenings, healthcare service preparation and delivery, quarantines, cancellations, disruptions to supply chains and customer activity, as well as general concern and uncertainty. The impact of this coronavirus may be short term or may last for an extended period of time and result in a substantial economic downturn. The impact of this outbreak, and other epidemics and pandemics that may arise in the future, could negatively affect the worldwide economy, as well as the economies of individual countries, individual companies and the market in general in significant and unforeseen ways. Any such impact could adversely affect a Fund’s performance, the performance of the securities in which a Fund invests and may lead to losses on your investment in a Fund.
Please see the Funds’ prospectus for a complete discussion of these and other risks.
9. Subsequent Events
Subsequent events occurring after the date of this report have been evaluated for potential impact to this report through the date the financial statements were issued. There were no subsequent events that necessitated recognition or disclosure in the Funds’ financial statements.
Report of Independent Registered Public Accounting Firm
To the Shareholders ofTouchstone Flexible Income Fund,Touchstone Focused Fund,Touchstone Global ESG Equity Fund (formerly known as Touchstone Sustainability and Impact Equity Fund), Touchstone Growth Opportunities Fund, Touchstone Mid Cap Growth Fund, and Touchstone Sands Capital Emerging Markets Growth Fund and the Board of Trustees of Touchstone Strategic Trust.
Opinion on the Financial Statements
We have audited the accompanying statements of assets and liabilities of Touchstone Flexible Income Fund, Touchstone Focused Fund, Touchstone Global ESG Equity Fund, Touchstone Growth Opportunities Fund, Touchstone Mid Cap Growth Fund, and Touchstone Sands Capital Emerging Markets Growth Fund (collectively referred to as the “Funds”) (six of the funds constituting theTouchstone StrategicTrust (the “Trust”)), including the portfolios of investments, as of March 31, 2020, and the related statements of operations for the year then ended, the statements of changes in net assets for each of the two years in the period then ended, the financial highlights for each of the five years in the period then ended and the related notes (collectively referred to as the “financial statements”). In our opinion, the financial statements present fairly, in all material respects, the financial position of each of the Funds (six of the funds constituting the Touchstone Strategic Trust) at March 31, 2020, the results of their operations, the changes in their net assets for each of the two years in the period then ended and their financial highlights for each of the five years in the period then ended, in conformity with U.S. generally accepted accounting principles.
Basis for Opinion
These financial statements are the responsibility of the Trust’s management. Our responsibility is to express an opinion on the Fund’s financial statements based on our audits. We are a public accounting firm registered with the Public Company Accounting Oversight Board (United States) (“PCAOB”) and are required to be independent with respect to the Trust in accordance with the U.S. federal securities laws and the applicable rules and regulations of the Securities and Exchange Commission and the PCAOB.
We conducted our audits in accordance with the standards of the PCAOB. Those standards require that we plan and perform the audit to obtain reasonable assurance about whether the financial statements are free of material misstatement, whether due to error or fraud. The Trust is not required to have, nor were we engaged to perform, an audit of the Trust’s internal control over financial reporting. As part of our audits we are required to obtain an understanding of internal control over financial reporting but not for the purpose of expressing an opinion on the effectiveness of the Trust’s internal control over financial reporting. Accordingly, we express no such opinion.
Our audits included performing procedures to assess the risks of material misstatement of the financial statements, whether due to error or fraud, and performing procedures that respond to those risks. Such procedures included examining, on a test basis, evidence regarding the amounts and disclosures in the financial statements. Our procedures included confirmation of securities owned as of March 31, 2020, by correspondence with the custodian, transfer agent, and brokers or by other appropriate auditing procedures where replies from brokers were not received. Our audits also included evaluating the accounting principles used and significant estimates made by management, as well as evaluating the overall presentation of the financial statements. We believe that our audits provide a reasonable basis for our opinion.

We have served as the auditor of one or more Touchstone Investments’ investment companies since 1999.
Cincinnati, Ohio
May 22, 2020
Other Items (Unaudited)
Qualified Dividend Income
Under the Jobs and Growth Tax Relief Reconciliation Act of 2003 (the “Act”), the following percentages of ordinary dividends paid during the fiscal year ended March 31, 2020 are designated as “qualified dividend income,” as defined in the Act, and are subject to reduced tax rates. The Funds intend to pass through the maximum allowable percentage for Form 1099 Div.
| Flexible Income Fund | | | 16.17 | % |
| Focused Fund | | | 100.00 | % |
| Global ESG Equity Fund | | | 100.00 | % |
| Growth Opportunities Fund | | | 100.00 | % |
| Mid Cap Growth Fund | | | 56.04 | % |
| Sands Capital Emerging Markets Growth Fund | | | 56.21 | % |
Dividend Received Deduction
For corporate shareholders, the following ordinary distributions paid during the current fiscal year ended March 31, 2020 qualify for the corporate dividends received deduction. The Funds intend to pass through the maximum allowable percentage.
| Flexible Income Fund | | | 15.64 | % |
| Focused Fund | | | 100.00 | % |
| Global ESG Equity Fund | | | 78.26 | % |
| Growth Opportunities Fund | | | 100.00 | % |
| Mid Cap Growth Fund | | | 52.51 | % |
For the fiscal year ended March 31, 2020, the Funds designated long-term capital gains as follows:
| Focused Fund | | | 61,531,108 | |
| Global ESG Equity Fund | | | 11,203,902 | |
| Growth Opportunities Fund | | | 12,343,538 | |
| Mid Cap Growth Fund | | | 77,620,227 | |
Foreign Tax Income & Foreign Tax Credit
The Sands Capital Emerging Markets Growth Fund intends to pass through a foreign tax credit to their shareholders. For the fiscal year ended March 31, 2020, the total amount of foreign source income was $22,723,357 or $0.20 per share. The total amount of foreign taxes to be paid was $573,652 or $0.005 per share. Shareholders’ allocable share of the foreign tax credit will be reported on Form 1099 Div.
Proxy Voting Guidelines and Proxy Voting Records
The Sub-Advisors are responsible for exercising the voting rights associated with the securities purchased and held by the Funds. A description of the policies and procedures that the Sub-Advisors use in fulfilling this responsibility is available as an appendix to the most recent Statement of Additional Information, which can be obtained without charge by calling toll free 1.800.543.0407 or by visiting the Touchstone website at TouchstoneInvestments.com or on the Securities and Exchange Commission’s (the “Commission”) website sec.gov. Information regarding how those proxies were voted during the most recent twelve-month period ended June 30, which will be filed by August 31 of that year, is also available without charge by calling toll free 1.800.543.0407 or on the Commission’s website at sec.gov.
Quarterly Portfolio Disclosure
Each Fund’s holdings as of the end of the third month of every fiscal quarter will be disclosed on Form N-PORT within 60 days of the end of the fiscal quarter. The complete listing of each Fund’s portfolio holdings is available on the Commission’s website and will be made available to shareholders upon request by calling 1.800.543.0407.
Schedule of Shareholder Expenses
As a shareholder of the Funds, you incur two types of costs: (1) transaction costs, including sales charges (loads) and (2) ongoing costs, including investment advisory fees; shareholder servicing fees; and other Fund expenses. This example is intended to help you understand your ongoing costs (in dollars) of investing in the Funds and to compare these costs with the ongoing costs of investing in other mutual funds.
Other Items (Unaudited) (Continued)
The example is based on an investment of $1,000 invested at the beginning of the period and held for the entire period (October 1, 2019 through March 31, 2020).
Actual Expenses
The first line for each share class of a Fund in the table below provides information about actual account values and actual expenses. You may use the information in this line, together with the amount you invested, to estimate the expenses that you paid over the period. Simply divide your account value by $1,000 (for example, an $8,600 account value divided by $1,000 = 8.6), then multiply the result by the number in the first line under the heading entitled “Expenses Paid During the Six Months Ended March 31, 2020” to estimate the expenses you paid on your account during this period.
Hypothetical Example for Comparison Purposes
The second line for each share class of a Fund in the table below provides information about hypothetical account values and hypothetical expenses based on the Funds’ actual expense ratio and an assumed rate of return of 5% per year before expenses, which is not the Funds’ actual return. The hypothetical account values and expenses may not be used to estimate the actual ending account balance or expenses you paid for the period. You may use this information to compare the ongoing costs of investing in the Funds and other funds. To do so, compare this 5% hypothetical example with the 5% hypothetical examples that appear in the shareholder reports of the other funds.
Please note that the expenses shown in the table are meant to highlight your ongoing costs only and do not reflect any transactional costs, such as sales charges (loads). Therefore, the second line of the table below is useful in comparing ongoing costs only, and willnot help you determine the relative total costs of owning different funds.
| | | | | | | | | | | | | | | Expenses | |
| | | | | | Net Expense | | | Beginning | | | Ending | | | Paid During | |
| | | | | | Ratio | | | Account | | | Account | | | the Six Months | |
| | | | | | Annualized | | | Value | | | Value | | | Ended | |
| | | | | | March 31, | | | October 1, | | | March 31, | | | March 31, | |
| | | | | | | | 2020 | | | | 2019 | | | | 2020 | | | | 2020* | |
| Touchstone Flexible Income Fund | | | | | | | | | | | | | | | |
| Class A | | | Actual | | | | 1.04 | % | | $ | 1,000.00 | | | $ | 941.40 | | | $ | 5.05 | |
| Class A | | | Hypothetical | | | | 1.04 | % | | $ | 1,000.00 | | | $ | 1,019.80 | | | $ | 5.25 | |
| Class C | | | Actual | | | | 1.79 | % | | $ | 1,000.00 | | | $ | 937.10 | | | $ | 8.67 | |
| Class C | | | Hypothetical | | | | 1.79 | % | | $ | 1,000.00 | | | $ | 1,016.05 | | | $ | 9.02 | |
| Class Y | | | Actual | | | | 0.79 | % | | $ | 1,000.00 | | | $ | 941.80 | | | $ | 3.84 | |
| Class Y | | | Hypothetical | | | | 0.79 | % | | $ | 1,000.00 | | | $ | 1,021.05 | | | $ | 3.99 | |
| Institutional Class | | | Actual | | | | 0.69 | % | | $ | 1,000.00 | | | $ | 942.20 | | | $ | 3.35 | |
| Institutional Class | | | Hypothetical | | | | 0.69 | % | | $ | 1,000.00 | | | $ | 1,021.55 | | | $ | 3.49 | |
| Touchstone Focused Fund | | | | | | | | | | | | | | | | | | | | |
| Class A | | | Actual | | | | 1.20 | % | | $ | 1,000.00 | | | $ | 898.10 | | | $ | 5.69 | |
| Class A | | | Hypothetical | | | | 1.20 | % | | $ | 1,000.00 | | | $ | 1,019.00 | | | $ | 6.06 | |
| Class C | | | Actual | | | | 1.95 | % | | $ | 1,000.00 | | | $ | 894.90 | | | $ | 9.24 | |
| Class C | | | Hypothetical | | | | 1.95 | % | | $ | 1,000.00 | | | $ | 1,015.25 | | | $ | 9.82 | |
| Class Y | | | Actual | | | | 0.90 | % | | $ | 1,000.00 | | | $ | 899.50 | | | $ | 4.27 | |
| Class Y | | | Hypothetical | | | | 0.90 | % | | $ | 1,000.00 | | | $ | 1,020.50 | | | $ | 4.55 | |
| Institutional Class | | | Actual | | | | 0.83 | % | | $ | 1,000.00 | | | $ | 899.80 | | | $ | 3.94 | |
| Institutional Class | | | Hypothetical | | | | 0.83 | % | | $ | 1,000.00 | | | $ | 1,020.85 | | | $ | 4.19 | |
| Touchstone Global ESG Equity Fund | | | | | | | | | | | | | | | | | | | | |
| Class A | | | Actual | | | | 1.17 | % | | $ | 1,000.00 | | | $ | 841.10 | | | $ | 5.39 | |
| Class A | | | Hypothetical | | | | 1.17 | % | | $ | 1,000.00 | | | $ | 1,019.15 | | | $ | 5.91 | |
| Class C | | | Actual | | | | 1.99 | % | | $ | 1,000.00 | | | $ | 837.50 | | | $ | 9.14 | |
| Class C | | | Hypothetical | | | | 1.99 | % | | $ | 1,000.00 | | | $ | 1,015.05 | | | $ | 10.02 | |
| Class Y | | | Actual | | | | 0.90 | % | | $ | 1,000.00 | | | $ | 841.90 | | | $ | 4.14 | |
| Class Y | | | Hypothetical | | | | 0.90 | % | | $ | 1,000.00 | | | $ | 1,020.50 | | | $ | 4.55 | |
| Institutional Class | | | Actual | | | | 0.89 | % | | $ | 1,000.00 | | | $ | 842.00 | | | $ | 4.10 | |
| Institutional Class | | | Hypothetical | | | | 0.89 | % | | $ | 1,000.00 | | | $ | 1,020.55 | | | $ | 4.50 | |
| Touchstone Growth Opportunities Fund | | | | | | | | | | | | | | | | | | | | |
| Class A | | | Actual | | | | 1.24 | % | | $ | 1,000.00 | | | $ | 950.70 | | | $ | 6.05 | |
| Class A | | | Hypothetical | | | | 1.24 | % | | $ | 1,000.00 | | | $ | 1,018.80 | | | $ | 6.26 | |
| Class C | | | Actual | | | | 1.99 | % | | $ | 1,000.00 | | | $ | 947.30 | | | $ | 9.69 | |
| Class C | | | Hypothetical | | | | 1.99 | % | | $ | 1,000.00 | | | $ | 1,015.05 | | | $ | 10.02 | |
| Class Y | | | Actual | | | | 0.99 | % | | $ | 1,000.00 | | | $ | 952.00 | | | $ | 4.83 | |
| Class Y | | | Hypothetical | | | | 0.99 | % | | $ | 1,000.00 | | | $ | 1,020.05 | | | $ | 5.00 | |
| Institutional Class | | | Actual | | | | 0.89 | % | | $ | 1,000.00 | | | $ | 952.40 | | | $ | 4.34 | |
Other Items (Unaudited) (Continued)
| | | | | | | | | | | | | | | Expenses | |
| | | | | | Net Expense | | | Beginning | | | Ending | | | Paid During | |
| | | | | | Ratio | | | Account | | | Account | | | the Six Months | |
| | | | | | Annualized | | | Value | | | Value | | | Ended | |
| | | | | | March 31, | | | October 1, | | | March 31, | | | March 31, | |
| | | | | | | | 2020 | | | | 2019 | | | | 2020 | | | | 2020* | |
| Institutional Class | | | Hypothetical | | | | 0.89 | % | | $ | 1,000.00 | | | $ | 1,020.55 | | | $ | 4.50 | |
| Touchstone Mid Cap Growth Fund | | | | | | | | | | | | | | | | | | | | |
| Class A | | | Actual | | | | 1.25 | % | | $ | 1,000.00 | | | $ | 864.90 | | | $ | 5.83 | |
| Class A | | | Hypothetical | | | | 1.25 | % | | $ | 1,000.00 | | | $ | 1,018.75 | | | $ | 6.31 | |
| Class C | | | Actual | | | | 2.00 | % | | $ | 1,000.00 | | | $ | 861.60 | | | $ | 9.31 | |
| Class C | | | Hypothetical | | | | 2.00 | % | | $ | 1,000.00 | | | $ | 1,015.00 | | | $ | 10.08 | |
| Class Y | | | Actual | | | | 0.87 | % | | $ | 1,000.00 | | | $ | 865.70 | | | $ | 4.06 | |
| Class Y | | | Hypothetical | | | | 0.87 | % | | $ | 1,000.00 | | | $ | 1,020.65 | | | $ | 4.39 | |
| Institutional Class | | | Actual | | | | 0.93 | % | | $ | 1,000.00 | | | $ | 866.40 | | | $ | 4.34 | |
| Institutional Class | | | Hypothetical | | | | 0.93 | % | | $ | 1,000.00 | | | $ | 1,020.35 | | | $ | 4.70 | |
| Class R6(A) | | | Actual | | | | 0.89 | % | | $ | 1,000.00 | | | $ | 736.80 | | | $ | 1.06 | |
| Class R6 | | | Hypothetical | | | | 0.89 | % | | $ | 1,000.00 | | | $ | 1,020.55 | | | $ | 4.50 | |
| Touchstone Sands Capital Emerging Markets Growth Fund | | | | | | | | | | | | | | | | | | | | |
| Class A | | | Actual | | | | 1.60 | % | | $ | 1,000.00 | | | $ | 882.80 | | | $ | 7.53 | |
| Class A | | | Hypothetical | | | | 1.60 | % | | $ | 1,000.00 | | | $ | 1,017.00 | | | $ | 8.07 | |
| Class C | | | Actual | | | | 2.35 | % | | $ | 1,000.00 | | | $ | 879.40 | | | $ | 11.04 | |
| Class C | | | Hypothetical | | | | 2.35 | % | | $ | 1,000.00 | | | $ | 1,013.25 | | | $ | 11.83 | |
| Class Y | | | Actual | | | | 1.35 | % | | $ | 1,000.00 | | | $ | 883.80 | | | $ | 6.36 | |
| Class Y | | | Hypothetical | | | | 1.35 | % | | $ | 1,000.00 | | | $ | 1,018.25 | | | $ | 6.81 | |
| Institutional Class | | | Actual | | | | 1.25 | % | | $ | 1,000.00 | | | $ | 884.00 | | | $ | 5.89 | |
| Institutional Class | | | Hypothetical | | | | 1.25 | % | | $ | 1,000.00 | | | $ | 1,018.75 | | | $ | 6.31 | |
| (A) | Represents the period from commencement of operations (February 10, 2020) through March 31, 2020. Expenses are equal to the Fund’s annualized expense ratio, multiplied by the average account value over the period, multiplied by 50/366. |
| * | Expenses are equal to the Fund’s annualized expense ratio, multiplied by the average account value over the period, multiplied by 183/366 (to reflect one-half year period). |
Advisory and Sub-Advisory Agreement Approval Disclosure
At a meeting held on November 21, 2019, the Board of Trustees (the “Board” or “Trustees”) of the Touchstone Strategic Trust (the “Trust”), and by a separate vote, the IndependentTrustees of theTrust, approved the continuance of the Investment Advisory Agreement between the Trust and the Advisor with respect to each Fund of the Trust, and the continuance of the Sub-Advisory Agreement between the Advisor and each Fund’s respective Sub-Advisor.
In determining whether to approve the continuation of the Investment Advisory Agreement and the Sub-Advisory Agreements, the Advisor furnished information necessary for a majority of the IndependentTrustees to make the determination that the continuance of the Investment Advisory Agreement and each Sub-Advisory Agreement was in the best interests of the respective Funds and their shareholders. The information provided to the Board included: (1) industry data comparing advisory fees and total expense ratios of comparable funds; (2) comparative performance information; (3) the Advisor’s and its affiliates’ revenues and costs of providing services to the Funds; and (4) information about the Advisor’s and Sub-Advisors’ personnel. Prior to voting, the IndependentTrustees reviewed the proposed continuance of the Investment Advisory Agreement and the Sub-Advisory Agreements with management and experienced independent legal counsel and received materials from such counsel discussing the legal standards for their consideration of the proposed continuation of the Investment Advisory Agreement and each Sub-Advisory Agreement. The Independent Trustees also reviewed the proposed continuation of the Investment Advisory Agreement and each Sub-Advisory Agreement with independent legal counsel in private sessions at which no representatives of management were present.
In approving the Funds’ Investment Advisory Agreement, the Board considered various factors, among them: (1) the nature, extent and quality of services provided to the Funds, including the personnel providing such services; (2) the Advisor’s compensation and profitability; (3) a comparison of fees and performance with comparable funds; (4) economies of scale; and (5) the terms of the Investment Advisory Agreement. The Board’s analysis of these factors is set forth below. The Independent Trustees were advised by independent legal counsel throughout the process.
Nature, Extent and Quality of Services Provided; Investment Personnel.The Board considered the level and depth of knowledge of the Advisor, including the professional experience and qualifications of senior personnel. In evaluating the quality of services provided by the Advisor, the Board took into account its familiarity with the Advisor’s senior management through Board meetings, discussions and reports during the preceding year. The Board also took into account the Advisor’s compliance policies and procedures. The quality of administrative and other services, including the Advisor’s role in coordinating the activities of the Funds’ other service
Other Items (Unaudited) (Continued)
providers, was also considered. The Board also considered the Advisor’s relationship with its affiliates and the resources available to them, as well as any potential conflicts of interest.
The Board discussed the Advisor’s effectiveness in monitoring the performance of each Sub-Advisor, including the Sub-Advisor that was an affiliate of the Advisor, and the Advisor’s timeliness in responding to performance issues. The Board considered the Advisor’s process for monitoring each of the Sub-Advisors, which includes an examination of both qualitative and quantitative elements of the Sub-Advisor’s organization, personnel, procedures, investment discipline, infrastructure and performance. The Board considered that the Advisor conducts periodic compliance due diligence of each Sub-Advisor, during which the Advisor examines a wide variety of factors, such as the financial condition of the Sub-Advisor, the quality of the Sub-Advisor’s systems, the effectiveness of the Sub-Advisor’s disaster recovery programs, trade allocation and execution procedures, compliance with the Sub-Advisor’s policies and procedures, results of regulatory examinations and any other factors that might affect the quality of services that the Sub-Advisor provides to the applicable Fund(s). The Board noted that the Advisor’s compliance monitoring processes also include quarterly reviews of compliance certifications, and that any issues arising from such certifications and the Advisor’s compliance visits to the Sub-Advisors are reported to the Board.
The Trustees concluded that they were satisfied with the nature, extent and quality of services provided to each Fund by the Advisor under the Investment Advisory Agreement.
Advisor’s Compensation and Profitability.The Board took into consideration the financial condition and profitability of the Advisor and its affiliates (including the Sub-Advisor to one of the Funds) and the direct and indirect benefits derived by the Advisor and its affiliates from the Advisor’s relationship with the Funds. The information considered by the Board included operating profit margin information for the Advisor’s business as a whole. The Board noted that the Advisor had waived a portion of advisory fees and administrative fees and/or reimbursed expenses in order to limit all but one of the Fund’s net operating expenses. The Board also noted that the Advisor pays the Sub-Advisors’ sub-advisory fees out of the advisory fees the Advisor receives from the Funds. The Board reviewed the profitability of the Advisor’s relationship with the Funds both before and after tax expenses, and also considered whether the Advisor has the financial wherewithal to continue to provide services to the Funds, noting the ongoing commitment of the Advisor’s parent company with respect to providing support and resources as needed. The Board considered that the Funds’ distributor, an affiliate of the Advisor, receives Rule 12b-1 distribution fees from the Funds and receives a portion of the sales charges on sales or redemptions of certain classes of shares. The Board also noted that the Advisor derives benefits to its reputation and other benefits from its association with the Funds.
The Board recognized that the Advisor should be entitled to earn a reasonable level of profits in exchange for the level of services it provides to each Fund and the entrepreneurial risk that it assumes as Advisor. Based upon their review, the Trustees concluded that the Advisor’s and its affiliates’ level of profitability, if any, from their relationship with each Fund was reasonable and not excessive.
Expenses and Performance.The Board compared the respective advisory fees and total expense ratios for each of the Funds with various comparative data, including the median and average advisory fees and total expense ratios of each Fund’s respective peer group. The Board also considered, among other data, the Funds’ respective performance results during the six-month, twelve-month, and thirty-six-month periods ended September 30, 2019 and noted that the Board reviews on a quarterly basis detailed information about each Fund’s performance results, portfolio composition and investment strategies. The Board also took into account current market conditions and their effect on the Funds’ performance.
The Board also considered the effect of each Fund’s growth and size on its performance and expenses. The Board noted that the Advisor had waived a portion of the fees and/or reimbursed expenses of all of the Funds in order to reduce such Funds’ respective operating expenses to targeted levels. The Board noted that the sub-advisory fees under the Sub-Advisory Agreement with respect to each Fund were paid by the Advisor out of the advisory fees it receives from the Fund and considered the impact of such sub-advisory fees on the profitability of the Advisor. In reviewing the respective expense ratios and performance of each of the Funds, the Board also took into account the nature, extent and quality of the services provided to the Funds by the Advisor and its affiliates.
The Board considered, among other data, the specific factors and related conclusions set forth below with respect to each Fund:
Touchstone Flexible Income Fund.The Fund’s advisory fee and total expense ratio (net of applicable expense waivers and reimbursements) were at the median and above the median, respectively, of its peer group. The Board noted that the Advisor was waiving a portion of the Fund’s fees and/or reimbursing a portion of the Fund’s operating expenses. The Fund’s performance for the six-month period ended September 30, 2019 was in the 5th quintile of its peer group, while the Fund’s performance for the twelve- and thirty-six-month periods ended September 30, 2019 was in the 4th quintile of its peer group. The Board noted management’s discussion of the Fund’s performance. Based upon their review, the Trustees concluded that the overall performance of the Fund was satisfactory relative to the performance of funds with similar investment objectives and relevant indices, and that the advisory fee was reasonable in light of the services received by the Fund from the Advisor and the other factors considered.
Other Items (Unaudited) (Continued)
Touchstone Focused Fund.The Fund’s advisory fee and total expense ratio (net of applicable expense waivers and reimbursements) were at the median and above the median, respectively, of its peer group. The Board noted that the Advisor was waiving a portion of the Fund’s fees and/or reimbursing a portion of the Fund’s operating expenses. The Fund’s performance for the six-, twelve- and thirty-six-month periods ended September 30, 2019 was in the 5th quintile of its peer group. The Board noted management’s discussion of the Fund’s performance. Based upon their review, the Trustees concluded that the overall performance of the Fund was satisfactory relative to the performance of funds with similar investment objectives and relevant indices, and that the advisory fee was reasonable in light of the services received by the Fund from the Advisor and the other factors considered.
Touchstone Global ESG Equity Fund. The Fund’s advisory fee and total expense ratio (net of applicable expense waivers and reimbursements) were each below the median of its peer group. The Board noted that the Advisor was waiving a portion of the Fund’s fees and/or reimbursing a portion of the Fund’s operating expenses. The Fund’s performance for the six- and thirty-six-month periods ended September 30, 2019 was in the 3rd quintile of its peer group, while the Fund’s performance for the twelve-month period ended September 30, 2019 was in the 5th quintile of its peer group. The Board noted management’s discussion of the Fund’s performance. Based upon their review, the Trustees concluded that the overall performance of the Fund was satisfactory relative to the performance of funds with similar investment objectives and relevant indices, and that the advisory fee was reasonable in light of the services received by the Fund from the Advisor and the other factors considered.
Touchstone Growth Opportunities Fund.The Fund’s advisory fee and total expense ratio (net of applicable expense waivers and reimbursements) were above the median and at the median, respectively, of its peer group. The Board noted that the Advisor was waiving a portion of the Fund’s fees and/or reimbursing a portion of the Fund’s operating expenses. The Fund’s performance for the six- and twelve-month periods ended September 30, 2019 was in the 2nd quintile of its peer group, while the Fund’s performance for the thirty-six-month period ended September 30, 2019 was in the 3rd quintile of its peer group. Based upon their review, the Trustees concluded that the overall performance of the Fund was satisfactory relative to the performance of funds with similar investment objectives and relevant indices, and that the advisory fee was reasonable in light of the services received by the Fund from the Advisor and the other factors considered.
Touchstone Mid Cap Growth Fund.The Fund’s advisory fee and total expense ratio (net of applicable expense waivers and reimbursements) were below the median and above the median, respectively, of its peer group. The Board noted that the Advisor was waiving a portion of the Fund’s fees and/or reimbursing a portion of the Fund’s operating expenses. The Fund’s performance for the six- and thirty-six-month periods ended September 30, 2019 was in the 2nd quintile of its peer group, while the Fund’s performance for the twelve-month period ended September 30, 2019 was in the 1st quintile of its peer group. Based upon their review, the Trustees concluded that the overall performance of the Fund was satisfactory relative to the performance of funds with similar investment objectives and relevant indices, and that the advisory fee was reasonable in light of the services received by the Fund from the Advisor and the other factors considered.
Touchstone Sands Capital Emerging Markets Growth Fund.The Fund’s advisory fee and total expense ratio (net of applicable expense waivers and reimbursements) were each above the median of its peer group. The Board noted that the Advisor was waiving a portion of the Fund’s fees and/or reimbursing a portion of the Fund’s operating expenses. The Fund’s performance for the six-month period ended September 30, 2019 was in the 2ndquintile of its peer group, while the Fund’s performance for the twelve- and thirty-six-month periods ended September 30, 2019 was in the 1st quintile of its peer group. Based upon their review, the Trustees concluded that the overall performance of the Fund was satisfactory relative to the performance of funds with similar investment objectives and relevant indices, and that the advisory fee was reasonable in light of the services received by the Fund from the Advisor and the other factors considered.
Economies of Scale.The Board considered the effect of each Fund’s current size and potential growth on its performance and expenses. The Board took into account management’s discussion of the Funds’ advisory fee structure. The Board considered the effective advisory fees under the Investment Advisory Agreement as a percentage of assets at different asset levels and possible economies of scale that might be realized if the assets of each Fund increase. The Board noted that the advisory fee schedule for each Fund, except the Touchstone Sands Capital Emerging Markets Growth Fund, contains breakpoints that would reduce the respective advisory fee rate on assets above specified levels as the applicable Fund’s assets increased and considered the necessity of adding breakpoints with respect to the Touchstone Sands Capital Emerging Markets Growth Fund. The Board determined that adding breakpoints at specified levels to the advisory fee schedule of theTouchstone Sands Capital Emerging Markets Growth Fund would not be appropriate at this time. The Board noted that if a Fund’s assets increase over time, the Fund might realize other economies of scale if assets increase proportionally more than certain other expenses. The Board also considered the fact that, under the Investment Advisory Agreement, the Advisor pays sub-advisory fees to each Sub-Advisor from its Advisory Fee.
Conclusion.In considering the renewal of the Funds’ Investment Advisory Agreement, the Board, including the IndependentTrustees, did not identify any single factor as controlling, and each Trustee may have attributed different weights to the various factors. The Trustees evaluated all information available to them on a Fund-by-Fund basis, and their determinations were made separately with respect to each Fund. The Board reached the following conclusions regarding the Funds’ Investment Advisory Agreement with the Advisor, among others: (a) the Advisor demonstrated that it possesses the capability and resources to perform the duties required
Other Items (Unaudited) (Continued)
of it under the Investment Advisory Agreement; (b) the Advisor maintains an appropriate compliance program; (c) the overall performance of each Fund is satisfactory relative to the performance of funds with similar investment objectives and relevant indices; and (d) each Fund’s advisory fee is reasonable in light of the services received by the Fund from the Advisor and other factors considered. Based on their conclusions, theTrustees determined with respect to each Fund that continuation of the Investment Advisory Agreement was in the best interests of the Fund and its shareholders.
In approving the Funds’ respective Sub-Advisory Agreements, the Board considered various factors with respect to each Fund and the applicable Sub-Advisory Agreement, among them: (1) the nature, extent and quality of services provided to the Fund, including the personnel providing such services; (2) the Sub-Advisor’s compensation; (3) a comparison of the sub-advisory fee and performance with comparable funds; and (4) the terms of the Sub-Advisory Agreement. The Board’s analysis of these factors is set forth below. The Independent Trustees were advised by independent legal counsel throughout the process.
Nature, Extent and Quality of Services Provided; Investment Personnel.The Board considered information provided by the Advisor regarding the services provided by each Sub-Advisor, including information presented periodically throughout the previous year. The Board noted the affiliation of one of the Sub-Advisors with the Advisor, noting any potential conflicts of interest. The Board also noted that, on a periodic basis, the Board meets with portfolio managers of the Sub-Advisors to discuss their respective performance and investment processes and strategies. The Board considered each Sub-Advisor’s level of knowledge and investment style. The Board reviewed the experience and credentials of the applicable investment personnel who are responsible for managing the investment of portfolio securities with respect to the Funds. The Board also noted each Sub-Advisor’s brokerage practices.
Sub-Advisor’s Compensation, Profitability and Economies of Scale.The Board also took into consideration the financial condition of each Sub-Advisor and any indirect benefits derived by each Sub-Advisor and its affiliates from the Sub-Advisor’s relationship with the Funds. In considering the profitability to each Sub-Advisor of its relationship with the Funds, the Board noted the undertaking of the Advisor to maintain expense limitations for the Funds and also noted that the sub-advisory fees under the Sub-Advisory Agreements were paid by the Advisor out of the advisory fees that it receives under the Investment Advisory Agreement and in addition, with respect to the unaffiliated Sub-Advisors, are negotiated at arm’s-length. As a consequence, the profitability to each Sub-Advisor of its relationship with a Fund was not a substantial factor in the Board’s deliberations. For similar reasons, the Board did not consider the potential economies of scale in each Sub-Advisor’s management of the applicable Fund to be a substantial factor in its consideration, although the Board noted that, with the exception of the Touchstone Sands Capital Emerging Markets Growth Fund, the sub-advisory fee schedule for all of the Funds contained breakpoints that would reduce the sub-advisory fee rate on assets above specified levels as the applicable Fund’s assets increased.
Sub-Advisory Fees and Fund Performance.The Board considered that each Fund pays an advisory fee to the Advisor and that the Advisor pays the sub-advisory fee to the Sub-Advisor out of the advisory fee it receives from the respective Fund. The Board also compared the sub-advisory fees paid by the Advisor to fees charged by the Sub-Advisor to manage comparable institutional separate accounts. The Board considered the amount retained by the Advisor and the sub-advisory fee paid to each Sub-Advisor with respect to the various services provided by the Advisor and the Sub-Advisor. The Board also noted that the Advisor negotiated the sub-advisory fee with each of the unaffiliated Sub-Advisors at arm’s-length. The Board reviewed the sub-advisory fee for each Fund in relation to various comparative data, including the median and average sub-advisory fees of each Fund’s peer group, and considered the following information:
Touchstone Flexible Income Fund.The Fund’s sub-advisory fee was above the median of its peer group. Based upon their review, the Trustees concluded that the sub-advisory fee was reasonable in light of the services received by the Fund from the Sub-Advisor and the other factors considered.
Touchstone Focused Fund.The Fund’s sub-advisory fee was above the median of its peer group. Based upon their review, the Trustees concluded that the sub-advisory fee was reasonable in light of the services received by the Fund from the Sub-Advisor and the other factors considered.
Touchstone Global ESG Equity Fund.The Fund’s sub-advisory fee was at the median of its peer group. Based upon their review, the Trustees concluded that the sub-advisory fee was reasonable in light of the services received by the Fund from the Sub-Advisor and the other factors considered.
Touchstone Growth Opportunities Fund.The Fund’s sub-advisory fee was above the median of its peer group. Based upon their review, theTrustees concluded that the sub-advisory fee was reasonable in light of the services received by the Fund from the Sub-Advisor and the other factors considered.
Touchstone Mid Cap Growth Fund.The Fund’s sub-advisory fee was at the median of its peer group. Based upon their review, the Trustees concluded that the sub-advisory fee was reasonable in light of the services received by the Fund from the Sub-Advisor and the other factors considered.
Other Items (Unaudited) (Continued)
Touchstone Sands Capital Emerging Markets Growth Fund.The Fund’s sub-advisory fee was above the median of its peer group. Based upon their review, the Trustees concluded that the sub-advisory fee was reasonable in light of the services received by the Fund from the Sub-Advisor and the other factors considered.
As noted above, the Board considered each Fund’s performance during the six-month, twelve-month, and thirty-six-month periods ended September 30, 2019 as compared to each Fund’s peer group and noted that the Board reviews on a quarterly basis detailed information about each Fund’s performance results, portfolio composition and investment strategies. The Board noted the Advisor’s expertise and resources in monitoring the performance, investment style and risk-adjusted performance of each Sub-Advisor. The Board also was mindful of the Advisor’s ongoing monitoring of each Sub-Advisor’s performance and the measures undertaken by the Advisor to address any underperformance.
Conclusion.In considering the renewal of the Sub-Advisory Agreement with respect to each Fund, the Board, including the Independent Trustees, did not identify any single factor as controlling, and each Trustee may have attributed different weights to the various factors. The Board reached the following conclusions regarding each Sub-Advisory Agreement, among others: (a) the Sub-Advisor is qualified to manage each Fund’s assets in accordance with the Fund’s investment goals and policies; (b) the Sub-Advisor maintains an appropriate compliance program; (c) the overall performance of each Fund is satisfactory relative to the performance of funds with similar investment objectives and relevant indices; (d) each Fund’s sub-advisory fees are reasonable in light of the services received by the Fund from the Sub-Advisor and the other factors considered; and (e) the Sub-Advisor’s investment strategies are appropriate for pursuing the investment goals of each Fund. Based on its conclusions, the Board determined that approval of the Sub-Advisory Agreement with respect to each Fund was in the best interests of the Fund and its shareholders.
Management of the Trust (Unaudited)
Listed below is required information regarding the Trustees and principal officers of the Trust. The Trust’s Statement of Additional Information includes additional information about theTrustees and is available, without charge, upon request by calling 1.800.543.0407 or by visiting the Touchstone website at TouchstoneInvestments.com.
Interested Trustee1:
| | | | | Number | |
| | | | | of Funds | |
| | | | | Overseen | |
| | | Term of | | in the | |
| Name | Position(s) | Office And | | Touchstone | Other |
| Address | Held with | Length of | Principal Occupation(s) | Fund | Directorships |
| Year of Birth | Trust | Time Served | During Past 5 Years | Complex2 | Held During the Past 5 Years3 |
Jill T. McGruder Touchstone Advisors, Inc.
303 Broadway Suite 1100 Cincinnati, Ohio 45202
Year of Birth: 1955 | Trustee and President | Until retirement at age 75 or until she resigns or is removed Trustee since 1999 | President, Director and CEO of IFS Financial Services, Inc. (a holding company) since 1999; and Senior Vice President and Chief Marketing Officer of Western & Southern Financial Group, Inc. (a financial services company) since 2016. | 40 | Director, Integrity Life Insurance Co. and National Integrity Life Insurance Co. since 2005;Director, Touchstone Securities (the Distributor) since 1999; Director, Touchstone Advisors (the Advisor) since 1999;Director, W&S Brokerage Services, Inc. since 1999; Director, W&S Financial Group Distributors, Inc. since 1999; Director,Insurance Profillment Solutions LLC since 2014; Director, Columbus Life Insurance Co. since 2016; Director,The Lafayette Life Insurance Co. since 2016; Director, Gerber Life Insurance Company since 2019; Director,Western & Southern Agency, Inc. since 2018; and Director, LL Global, Inc. (not-for-profit trade organization with operating divisions LIMRA and LOMA) since 2016. |
Independent Trustees:
Karen Carnahan
c/o Touchstone Advisors, Inc.
303 Broadway
Suite 1100
Cincinnati, Ohio 45202
Year of Birth: 1954
| Trustee
| Until retirement
at age 75 or until
she resigns or is
removed
Trustee since
2019
| Retired; formerly Chief Operating
Officer of Shred-it (a business
services company) from 2014 to
2015; formerly President & Chief
Operating Officer of the document
management division of Cintas
Corporation (a business services
company) from 2008 to 2014. | 40
| Director, Cintas Corporation since 2019; Director, Boys & Girls
Club of West Chester/Liberty since 2016; and Board of Advisors,
Best Upon Request since 2020.
|
| | | | | | |
Phillip R. Cox
c/o Touchstone Advisors, Inc.
303 Broadway
Suite 1100
Cincinnati, Ohio 45202
Year of Birth: 1947 | Trustee
| Until retirement
at age 75 or until
he resigns or is
removed
Trustee since
1999 | President and CEO of Cox Financial
Corp. (a financial services company)
since 1971.
| 40
| Director, Cincinnati Bell from 1994 to 2019; Director, Bethesda
Inc. (hospital) since 2005; Director, Timken Co. (manufacturing)
from 2004 to 2014; Director, TimkenSteel from 2014 to 2019;
Director, Diebold, Inc. (technology solutions) since 2004; and
Director, Ohio Business Alliance for Higher Education and the
Economy since 2005. |
| | | | | | |
William C. Gale
c/o Touchstone Advisors, Inc.
303 Broadway
Suite 1100
Cincinnati, Ohio 45202 | Trustee
| Until retirement
at age 75 or until
he resigns or is
removed
Trustee since | Retired; formerly Senior Vice
President and Chief Financial
Officer of Cintas Corporation (a
business services company) from
1995 to 2015. | 40
| None.
|
| Year of Birth: 1952 | | 2013 | | | |
| | | | | | |
Susan J. Hickenlooper, CFA
c/o Touchstone Advisors, Inc. | Trustee
| Until retirement
at age 75 or until | Retired from investment
management. | 40
| Trustee, Episcopal Diocese of Southern Ohio from 2014 to 2018.
|
303 Broadway
Suite 1100
Cincinnati, Ohio 45202
Year of Birth: 1946 |
| she resigns or is
removed
Trustee since
2009 |
|
|
|
| | | | | | |
Kevin A. Robie
c/o Touchstone Advisors, Inc.
303 Broadway
Suite 1100
Cincinnati, Ohio 45202
Year of Birth: 1956 | Trustee
| Until retirement
at age 75 or until
he resigns or is
removed
Trustee since
2013 | Retired; formerly Vice President of
Portfolio Management at Soin LLC
(private multinational holding
company and family office) from
2004 to 2020.
| 40
| Director, SaverSystems, Inc. since 2015; Director, Buckeye
EcoCare, Inc. from 2013 to 2018; Director, Turner Property
Services Group, Inc. since 2017; Trustee, Dayton Region New
Market Fund, LLC (private fund) since 2010; and Trustee,
Entrepreneurs Center, Inc. (business incubator) since 2006.
|
Management of the Trust (Unaudited) (Continued)
Independent Trustees (Continued):
| | | | | | |
| | | | | Number | |
| | | | | of Funds | |
| | | Term of | | Overseen | |
| Name | Position(s) | Office And | | in the | Touchstone Other |
| Address | Held with | Length of | Principal Occupation(s) | Fund | Directorships |
| Year of Birth | Trust | Time Served | During Past 5 Years | Complex2 | Held During the Past 5 Years3 |
William H. Zimmer III
c/o Touchstone Advisors, Inc.
303 Broadway
Suite 1100
Cincinnati, Ohio 45202 | Trustee
| Until retirement
at age 75 or until
he resigns or is
removed
Trustee since | Independent Treasury Consultant
since 2014.
| 40
| Director, Deaconess Associations, Inc. (healthcare) since 2001;
Trustee, Huntington Funds (mutual funds) from 2006 to 2015;
and Director, National Association of Corporate Treasurers from
2011 to 2015.
|
| Year of Birth: 1953 | | 2019 | | | |
| 1 | Ms. McGruder, as a director of the Advisor and the Distributor, and an officer of affiliates of the Advisor and the Distributor, is an “interested person” of the Trust within the meaning of Section 2(a)(19) of the 1940 Act. |
| 2 | As of March 31, 2020, the Touchstone Fund Complex consisted of 19 series of the Trust, 13 series of Touchstone Funds Group Trust, 1 series of Touchstone Institutional Funds Trust, and 7 variable annuity series of Touchstone Variable Series Trust. |
3Each Trustee is also a Trustee of Touchstone Funds Group Trust, Touchstone Institutional Funds Trust, and Touchstone Variable Series Trust.
Principal Officers:
| Name | Position(s) | | |
| Address | Held with | Term of Office and | Principal Occupation(s) |
| Year of Birth | Trust1 | Length of Time Served | During Past 5 Years |
Jill T. McGruder
Touchstone Advisors, Inc.
303 Broadway Suite 1100
Cincinnati, Ohio 45202
Year of Birth: 1955 | President
and Trustee
| Until resignation, removal or disqualification
President since 2006
| See biography above.
|
| | | | |
Steven M. Graziano
Touchstone Advisors, Inc.
303 Broadway Suite 1100
Cincinnati, Ohio 45202
Year of Birth: 1954 | Vice
President
| Until resignation, removal or disqualification
Vice President since 2009
| President of Touchstone Advisors, Inc.
|
| | | | |
Timothy D. Paulin
Touchstone Advisors, Inc. | Vice
President | Until resignation, removal or disqualification
Vice President since 2010 | Senior Vice President of Investment Research and Product
Management of Touchstone Advisors, Inc. |
| 303 Broadway Suite 1100 | | | |
| Cincinnati, Ohio 45202 | | | |
| Year of Birth: 1963 | | | |
| | | | |
Timothy S. Stearns
Touchstone Advisors, Inc.
303 Broadway Suite 1100
Cincinnati, Ohio 45202
Year of Birth: 1963 | Chief
Compliance
Officer
| Until resignation, removal or disqualification
Chief Compliance Officer since 2013
| Chief Compliance Officer of Touchstone Advisors, Inc.
|
| | | | |
Terrie A. Wiedenheft
Touchstone Advisors, Inc.
303 Broadway Suite 1100
Cincinnati, Ohio 45202
Year of Birth: 1962 | Controller
and
Treasurer
| Until resignation, removal or disqualification
Controller and Treasurer since 2006
| Senior Vice President, Chief Financial Officer and Chief
Operations Officer, of IFS Financial Services, Inc. (a holding
company).
|
| | | | |
Meredyth A. Whitford
Western & Southern
Financial Group
400 Broadway
Cincinnati, Ohio 45202 | Secretary
| Until resignation, removal or disqualification
Secretary since 2018
| Counsel - Securities/Mutual Funds of Western & Southern
Financial Group (since 2015); Associate at Morgan Lewis &
Bockius LLP (law firm) (2014 to 2015); Associate at
Bingham McCutchen LLP (law firm) (2008 to 2014.)
|
| Year of Birth: 1981 | | | |
1Each officer also holds the same office with Touchstone Funds Group Trust, Touchstone Institutional Funds Trust, and Touchstone Variable Series Trust.
PRIVACY PROTECTION POLICY
We Respect Your Privacy
Thank you for your decision to invest with us. Touchstone and its affiliates have always placed a high value on the trust and confidence our clients place in us. We believe that confidence must be earned and validated through time. In today’s world, when technology allows the sharing of information at light speeds, trust must be reinforced by our sincere pledge to take the steps necessary to ensure that the information you share with us is treated with respect and confidentiality.
Our Pledge to Our Clients
| • | We collect only the information we need to service your account and administer our business. |
| • | We are committed to keeping your information confidential and we place strict limits and controls on the use and sharing of your information. |
| • | We make every effort to ensure the accuracy of your information. |
We Collect the Following Nonpublic Personal Information About You:
| • | Information we receive from you on or in applications or other forms, correspondence, or conversations, including, but not limited to, your name, address, phone number, social security number, assets, income and date of birth; and |
| • | Information about your transactions with us, our affiliates, or others, including, but not limited to, your account number and balance, payment history, parties to transactions, cost basis information, and other financial information. |
Categories of Information We Disclose and Parties to Whom We Disclose
We do not disclose any nonpublic personal information about our current or former clients to nonaffiliated third parties, except as required or permitted by law.
We Place Strict Limits and Controls on the Use and Sharing of Your Information
| • | We restrict access to nonpublic personal information about you to authorized employees who need the information to administer your business. |
| • | We maintain physical, electronic and procedural safeguards that comply with federal standards to protect this information. |
| • | We do not disclose any nonpublic personal information about our current or former clients to anyone, except as required or permitted by law or as described in this document. |
| • | We will not sell your personal information to anyone. |
We May Provide Information to Service Your Account
Sometimes it is necessary to provide information about you to various companies such as transfer agents, custodians, broker-dealers and marketing service firms to facilitate the servicing of your account. These organizations have a legitimate business need to see some of your personal information in order for us to provide service to you. We may disclose to these various companies the information that we collect as described above. We require that these companies, including our own subsidiaries and affiliates, strictly maintain the confidentiality of this information and abide by all applicable laws. Companies within our corporate family that may receive this information are financial service providers and insurance companies. We do not permit these associated companies to sell the information for their own purposes, and we never sell our customer information.
This policy is applicable to the following affiliated companies: Touchstone Funds Group Trust, Touchstone Strategic Trust, Touchstone Variable Series Trust, Touchstone Institutional Funds Trust, Touchstone Securities, Inc.,* and W&S Brokerage Services, Inc.
* Touchstone Securities, Inc. serves as the underwriter to the Touchstone Funds.
A Member of Western & Southern Financial Group®
The Privacy Protection Policy is not part of the Annual Report.

800.638.8194 .. TouchstoneInvestments.com

Touchstone Investments
Distributor
Touchstone Securities,
Inc.* 303 Broadway
Cincinnati,
Ohio 45202-4203 800.638.8194
www.touchstoneinvestments.com
Investment Advisor
Touchstone Advisors, Inc.*
303 Broadway
Cincinnati, Ohio 45202-4203
Transfer Agent
BNY Mellon Investment Servicing (US) Inc.
4400 Computer Drive
Westborough, Massachusetts 01581
Shareholder Service
800.543.0407
* A Member of Western & Southern Financial Group
TSF-54-TST-AR-2003
Item 2. Code of Ethics.
| (a) | The registrant, as of the end of the period covered by this report, has adopted a code of ethics that applies to the registrant’s principal executive officer, principal financial officer, principal accounting officer or controller, or persons performing similar functions, regardless of whether these individuals are employed by the registrant or a third party. |
| (c) | There have been no amendments, during the period covered by this report, to a provision of the code of ethics that applies to the registrant’s principal executive officer, principal financial officer, principal accounting officer or controller, or persons performing similar functions, regardless of whether these individuals are employed by the registrant or a third party, and that relates to any element of the code of ethics description. |
| (d) | The registrant has not granted any waivers, including an implicit waiver, from a provision of the code of ethics that applies to the registrant’s principal executive officer, principal financial officer, principal accounting officer or controller, or persons performing similar functions, regardless of whether these individuals are employed by the registrant or a third party, that relates to one or more of the items set forth in paragraph (b) of this item’s instructions. |
| (f) | A copy of the code of ethics is attached hereto as Exhibit 13(a)(1). |
Item 3. Audit Committee Financial Expert.
The registrant’s Board of Trustees has determined that the registrant has at least one audit committee financial expert serving on its audit committee. Mr. William Gale is the registrant’s audit committee financial expert and is an independent trustee within the meaning of the Investment Company Act of 1940, as amended (the “1940 Act”).
Item 4. Principal Accountant Fees and Services.
Audit Fees
| (a) | Audit fees for Touchstone Strategic Trust (March Funds) totaled $116,800 and $109,000 for the fiscal years ended March 31, 2020 and March 31, 2019, respectively, including fees associated with the annual audits and filings of Form N-1A and Form N-CEN. |
Audit-Related Fees
| (b) | The aggregate fees billed in each of the last two fiscal years for assurance and related services by the principal accountant that are reasonably related to the performance of the audit of the registrant's financial statements and are not reported under paragraph (a) of this Item are $4,000 and $4,000 for the fiscal years ended March 31, 2020 and March 31, 2019 respectively. The fees for 2020 and 2019 relate to the review of Form N-1A filings. |
Tax Fees
| (c) | The Fees for tax compliance services totaled $62,045 and $85,723 for the fiscal years ended March 31, 2020 and March 31, 2019, respectively. The fees relate to the preparation of federal income and excise tax returns, review of capital gains distribution calculations and tax agent services. |
All Other Fees
| (d) | The aggregate fees billed for products and services provided by the principal accountant, other than the services reported in paragraphs (a) through (c) of this Item are $20,756 and $20,845 for the fiscal years ended March 31, 2020 and March 31, 2019, respectively. The fees relate to the PFIC Analyzer and Global Withholding Tax Reporter subscriptions. |
| (e)(1) | Disclose the audit committee's pre-approval policies and procedures described in paragraph (c)(7) of Rule 2-01 of Regulation S-X. |
The Audit Committee’s pre-approval policies describe the types of audit, audit-related, tax and other services that have the general pre-approval of the Audit Committee. The pre-approval policies provide that annual audit service fees, tax services not specifically granted pre-approval, services exceeding pre-approved cost levels and other services that have not received general pre-approval will be subject to specific pre-approval by the Audit Committee. The pre-approval policies further provide that the Committee may grant general pre-approval to other audit services (statutory audits and services associated with SEC registration statements, periodic reports and other documents filed with the SEC or other documents issued in connection with securities offerings), audit-related services (accounting consultations related to accounting, financial reporting or disclosure matters not classified as “audit services,” assistance with understanding and implementing new accounting and financial reporting guidance from rulemaking authorities, agreed-upon or expanded audit procedures related to accounting and/or billing records required to respond to or comply with financial, accounting or regulatory reporting matters and assistance with internal control reporting requirements Form N-CSR), tax services that have historically been provided by the auditor that the Committee believes would not impair the independence of the auditor and are consistent with the SEC’s rules on auditor independence and permissible non-audit services classified as “all other services” that are routine and recurring services.
| (e)(2) | All of the services described in paragraphs (b) through (d) of Item 4 were approved by the Audit Committee. |
| (f) | The percentage of hours expended on the principal accountant's engagement to audit the registrant's financial statements for the most recent fiscal year that were attributed to work performed by persons other than the principal accountant's full-time, permanent employees was less than fifty percent. |
| (g) | The aggregate non-audit fees for Touchstone Strategic Trust (March Funds) and certain entities*, totaled approximately $655,460 and $674,100 for the fiscal years ended March 31, 2020 and March 31, 2019, respectively. |
* These include the advisors (excluding non-affiliated sub-advisors) and any entity controlling, controlled by or under common control with the advisors that provides ongoing services to the registrant (Funds).
| (h) | The registrant's audit committee of the board of trustees has considered whether the provision of non-audit services that were rendered to the registrant's investment adviser (not including any sub-adviser whose role is primarily portfolio management and is subcontracted with or overseen by another investment adviser), and any entity controlling, controlled by, or under common control with the investment adviser that provides ongoing services to the registrant that were not pre-approved pursuant to paragraph (c)(7)(ii) of Rule 2-01 of Regulation S-X is compatible with maintaining the principal accountant's independence. |
Item 5. Audit Committee of Listed Registrants.
Not applicable.
Item 6. Investments.
| (a) | Schedule of Investments in securities of unaffiliated issuers as of the close of the reporting period is included as part of the report to shareholders filed under Item 1 of this form. |
Item 7. Disclosure of Proxy Voting Policies and Procedures for Closed-End Management Investment Companies.
Not applicable.
Item 8. Portfolio Managers of Closed-End Management Investment Companies.
Not applicable.
Item 9. Purchases of Equity Securities by Closed-End Management Investment Company and Affiliated Purchasers.
Not applicable.
Item 10. Submission of Matters to a Vote of Security Holders.
There have been no material changes to the procedures by which the shareholders may recommend nominees to the registrant’s board of trustees, where those changes were implemented after the registrant last provided disclosure in response to the requirements of Item 407(c)(2)(iv) of Regulation S-K (17 CFR 229.407) (as required by Item 22(b)(15) of Schedule 14A (17 CFR 240.14a-101)), or this Item.
Item 11. Controls and Procedures.
| (a) | The registrant’s principal executive and principal financial officers, or persons performing similar functions, have concluded that the registrant’s disclosure controls and procedures (as defined in Rule 30a-3(c) under the Investment Company Act of 1940, as amended (the “1940 Act”) (17 CFR 270.30a-3(c))) are effective, as of a date within 90 days of the filing date of the report that includes the disclosure required by this paragraph, based on their evaluation of these controls and procedures required by Rule 30a-3(b) under the 1940 Act (17 CFR 270.30a-3(b)) and Rules 13a-15(b) or 15d-15(b) under the Securities Exchange Act of 1934, as amended (17 CFR 240.13a-15(b) or 240.15d-15(b)). |
| (b) | There were no changes in the registrant’s internal control over financial reporting (as defined in Rule 30a-3(d) under the 1940 Act (17 CFR 270.30a-3(d))) that occurred during the period covered by this report that has materially affected, or is reasonably likely to materially affect, the registrant’s internal control over financial reporting. |
Item 12. Disclosure of Securities Lending Activities for Closed-End Management Investment Companies.
Not applicable.
Item 13. Exhibits.
SIGNATURES
Pursuant to the requirements of the Securities Exchange Act of 1934 and the Investment Company Act of 1940, the registrant has duly caused this report to be signed on its behalf by the undersigned, thereunto duly authorized.
(Registrant) Touchstone Strategic Trust
| By (Signature and Title)* | /s/ Jill T. McGruder |
| | Jill T. McGruder, President |
| | (principal executive officer) |
DateJune 2, 2020
Pursuant to the requirements of the Securities Exchange Act of 1934 and the Investment Company Act of 1940, this report has been signed below by the following persons on behalf of the registrant and in the capacities and on the dates indicated.
| By (Signature and Title)* | /s/ Jill T. McGruder |
| | Jill T. McGruder, President |
| | (principal executive officer) |
DateJune 2, 2020
| By (Signature and Title)* | /s/ Terrie A. Wiedenheft |
| | Terrie A. Wiedenheft, Controller and Treasurer |
| | (principal financial officer) |
DateJune 2, 2020
* Print the name and title of each signing officer under his or her signature.