UNITED STATES
SECURITIES AND EXCHANGE COMMISSION
Washington, D.C. 20549
FORM N-CSR
CERTIFIED SHAREHOLDER REPORT OF REGISTERED
MANAGEMENT INVESTMENT COMPANIES
Investment Company Act file number 811-03651
Touchstone Strategic Trust – June Funds
(Exact name of registrant as specified in charter)
303 Broadway, Suite 1100
Cincinnati, Ohio 45202-4203
(Address of principal executive offices) (Zip code)
Jill T. McGruder
303 Broadway, Suite 1100
Cincinnati, Ohio 45202-4203
(Name and address of agent for service)
Registrant's telephone number, including area code: 800-638-8194
Date of fiscal year end: June 30
Date of reporting period: June 30, 2020
Form N-CSR is to be used by management investment companies to file reports with the Commission not later than 10 days after the transmission to stockholders of any report that is required to be transmitted to stockholders under Rule 30e-1 under the Investment Company Act of 1940 (17 CFR 270.30e-1). The Commission may use the information provided on Form N-CSR in its regulatory, disclosure review, inspection, and policymaking roles.
A registrant is required to disclose the information specified by Form N-CSR, and the Commission will make this information public. A registrant is not required to respond to the collection of information contained in Form N-CSR unless the Form displays a currently valid Office of Management and Budget ("OMB") control number. Please direct comments concerning the accuracy of the information collection burden estimate and any suggestions for reducing the burden to Secretary, Securities and Exchange Commission, 450 Fifth Street, NW, Washington, DC 20549-0609. The OMB has reviewed this collection of information under the clearance requirements of 44 U.S.C. § 3507.
Item 1. Reports to Stockholders.
The Report to Shareholders is attached herewith.
June 30, 2020
Annual Report
| Touchstone Strategic Trust |
| Touchstone Balanced Fund |
| Touchstone International Equity Fund |
| Touchstone International Growth Opportunities Fund |
| Touchstone International Small Cap Fund |
| Touchstone Large Cap Focused Fund |
| Touchstone Large Cap Fund |
| Touchstone Large Company Growth Fund |
| Touchstone Ohio Tax-Free Bond Fund |
| Touchstone Small Company Fund |
| Touchstone Value Fund |
IMPORTANT NOTE: Beginning on January 1, 2021, as permitted by regulations adopted by the Securities and Exchange Commission, paper copies of the Touchstone Funds’ annual and semi-annual shareholder reports will no longer be sent by mail, unless you specifically request paper copies of the shareholder reports from Touchstone Funds or from your financial intermediary, such as a broker-dealer or bank. Instead, annual and semi-annual shareholder reports will be available on the Touchstone Funds’ website (TouchstoneInvestments.com/Resources), and you will be notified by mail each time a report is posted and provided with a website link to access the report.
You may elect to receive all future annual and semi-annual shareholder reports in paper, free of charge. If you already elected to receive shareholder reports electronically, you will not be affected by this change and you need not take any action. To elect to receive paper copies of shareholder reports through the mail or otherwise change your delivery method, contact your financial intermediary or, if you hold your shares directly through Touchstone Funds, visit TouchstoneInvestments.com/Resources/Edelivery or call Touchstone Funds toll-free at 1.800.543.0407. Your election to receive shareholder reports in paper will apply to all Touchstone Funds that you hold through the financial intermediary, or directly with Touchstone.

This report identifies the Funds’ investments on June 30, 2020. These holdings are subject to change. Not all investments in each Fund performed the same, nor is there any guarantee that these investments will perform as well in the future. Market forecasts provided in this report may not occur.
Letter from the President
Dear Shareholder:
We are pleased to provide you with the Touchstone Strategic Trust Annual Report. Inside you will find key financial information and manager commentaries for the Funds for the 12 months ended June 30, 2020.
Trade-related rhetoric between the U.S. and China drove market volatility throughout 2019. Trade discussions between the two nations took a more constructive tone by year end, culminating in an announcement of a “phase one” agreement in early 2020 to reduce some tariff levels. Aside from this conflict, the U.S. economy continued its steady pace, driven by strong employment data and solid consumer spending. Outside the U.S., economic growth in developed markets such as the U.K., European Union and Japan continued its slow pace, all while each of their respective central banks continued to maintain low-to-zero overnight rates. Outside of the U.S. and developed markets, emerging markets continued to show overall weakness, inhibited by the U.S.-China trade slowdown and lower-than-expected Indian economic growth. This already fragile, low-growth environment was upended in the first half of 2020 as COVID-19 swept the globe, bringing with it containment measures resulting in massive shutdowns of economic activity. Following an economic lockdown during most of March and April 2020, U.S. state governors began to slowly reopen their economies across the country. Although employment numbers and retail sales figures through the latter portion of the 12-month period rebounded strongly from their March 2020 lows, investor sentiment remains cautious, given concerns that the capital markets may be pricing in an overly optimistic economic rebound scenario.
Following strong gains in the second half of 2019, the S&P 500® Index experienced a significant whipsaw during the first half of 2020. A severe pullback during the first quarter was followed by a strong rebound late in the quarter which carried into the second quarter. However, U.S. equity performance varied widely primarily by style with growth equities far outperforming value equities during the 12-month period. U.S. growth stocks were predominately driven by Communication Services, Consumer Discretionary, Information Technology and Health Care stocks as companies comprising these sectors were least impacted or even benefited from the COVID-19 lockdowns. Conversely, U.S. value equities faced significant headwinds as the sudden drop in economic activity in the first half of 2020 adversely impacted cyclical sectors, including value equity-tilted ones such as Financials, Energy, Materials and Industrials. Compared to their mid cap and small cap peers, large cap stocks held up better largely due to their ability to weather challenging economic conditions. Technology behemoths such as Amazon, Microsoft, Facebook and Netflix drove the strong aforementioned growth equity returns as their businesses benefited from the COVID-19-induced lockdown impacting everyday life and working conditions.
Non-U.S. developed equity markets generally trailed the U.S. over the past 12 months. Japan performed relatively well with slow growth in COVID-19 cases and aggressive stimulus measures while Europe was hit harder by the pandemic. Similar to the U.S., Internet and Health Care stocks were among the top contributors in developed markets while Energy and Financials lagged. In emerging markets, equities exhibited the same pattern as the U.S. and developed markets with Internet stocks and Asia Pacific countries who experienced COVID-19 lockdowns earlier in the year, such as China, Taiwan and South Korea, leading the way. These Asia-Pacific countries experienced an abating COVID-19 virus by the second quarter and were able to reopen their economies earlier than were the U.S. and Europe.
Within fixed income, Treasury prices benefited and yields compressed to cycle lows from U.S. Federal Reserve Board (Fed) actions and a flight to safety during the rapid sell-off of risk assets in the first half of 2020. Meanwhile, credit-sensitive sectors saw the strong results of 2019 nearly or completely erased as concerns over the potential for rising defaults and technical selling pressures mounted. During the first quarter of 2020, spreads across investment grade credit, high yield credit, bank loans and collateralized loan obligations (CLOs) all reached levels unseen since the 2008 Credit Crisis. The Fed stepped in during the volatility to provide liquidity by slashing overnight rates to zero and providing support for the fixed income markets through new asset purchase programs. Those actions helped ease the volatility and negative sentiment that appeared in March, as credit spreads narrowed over the last three months of the period.
Times like these reaffirm our belief in the importance of the steady hands of financial professionals, the trust you must have in your investment strategy and understanding the risks of trying to time the market. Additionally, we believe that environments that are more volatile create more opportunity for active managers to add value, especially those that are Distinctively Active with high active share. We greatly value your continued support. Thank you for including Touchstone as part of your investment plan.
Sincerely,

Jill T. McGruder
President
Touchstone Strategic Trust
Management’s Discussion of Fund Performance (Unaudited)
Touchstone Balanced Fund
Sub-Advised by Fort Washington Investment Advisors, Inc.
Investment Philosophy
The Fund seeks to achieve its investment goal of providing investors with capital appreciation and current income by generally investing in a diversified portfolio comprising 60 percent equity securities and 40 percent fixed-income securities.
With respect to equities, the Fund invests primarily in issuers having a market capitalization, at the time of purchase, above $5 billion. Equity securities include common stock and preferred stock. With respect to fixed-income, the Fund will invest primarily in bonds, including mortgage-related securities, asset-backed securities, government securities (both U.S. government securities and foreign sovereign debt), and corporate debt securities.
Fund Performance
The Touchstone Balanced Fund (Class A Shares) outperformed both of its benchmarks, the S&P 500® Index and the Bloomberg Barclays U.S. Aggregate Bond Index, for the 12-month period ended June 30, 2020. The Fund’s total return was 10.09 percent (calculated excluding the maximum sales charge), while the total return of the S&P 500® Index was 7.51 percent and the total return of the Bloomberg Barclays U.S. Aggregate Bond Index was 8.74 percent.
Market Environment
Equity and credit markets ended 2019 producing some of the largest calendar year returns in recent memory. In a banner year for risk assets, U.S. Treasuries still managed to produce solid gains as well. This was due to falling interest rates as uncertainty around trade negotiations with China rattled the U.S. Treasury market causing the curve to invert for most of the year before twisting back to a steeper shape as tensions eventually cooled and both sides appeared to be headed toward resolving the dispute. Tariffs, concern over global growth, low inflation consistently below the U.S. Federal Reserve Board’s (Fed) target, and modest but resilient U.S. growth at roughly 1.5-2.0 percent, kept a cap on rates, providing an accommodative environment regarding financial conditions.
Given this backdrop, our outlook coming into 2020 was optimistic – fundamentals were strong, the consumer was in good shape, business earnings were healthy, and trade negotiations between China and the U.S. were turning a corner. Then risk assets hit an unexpected wall in March as fears surrounding the COVID-19 pandemic turned into a state of panic, bringing the risk-on bull market to a screeching halt. Economies around the world implemented quarantine measures and issued shelter in place orders to curb the spread of the virus. This brought activity to a grinding halt. Only recently have indicators started to provide a clear picture of how glib this slowdown is going to reverberate through the global economy. While it is uncertain what the time line is going to look like to get things back to normal and people back to work, markets have offered up some pain in terms of historic losses. Equities declined significantly and credit was hit hard with lack of liquidity in the markets intensifying the selloff. Spreads on High Yield and Investment Grade Credit hit levels that markets have not experienced since 2008.
Both the Fed and Congress have moved swiftly to help support the economy and credit markets, hopefully bridging the gap between now and when the economy and society can return to a sense of normalcy. The Fed has provided multiple credit facilities to different areas of the market to provide financing and liquidity in order to keep markets functioning and capital accessible. Congress has done its part fiscally, with the passage of the CARES Act, aimed at establishing support for both the consumer and businesses with extensions of unemployment insurance and the creation of the Paycheck Protection Program (PPP) that targets small business through SBA loans in order to continue to make payroll for existing employees and continue paying rent and utilities. However, both monetary and fiscal policy continue to be fluid and change rather quickly depending on what areas of the market and society are most in need of support. Both monetary and fiscal policies when fully implemented may total more than $5 trillion.
The support offered through these programs to limit the fallout has been well received by investors as the stock market reversed course on March 23. An added boost was received as businesses began to reopen in late April and the unemployment rate fell unexpectedly in May. The jobs report for May shocked economists and investors, when it showed that 2.5 million jobs had been created and the unemployment rate fell to 13.4 percent from 14.7 percent in April. It was followed by another encouraging report in June, which showed U.S. jobs gains accelerated to 4.8 million while the unemployment rate fell to 11.1 percent. The two-month cumulative increase in nonfarm payrolls recouped one third of the 22.2 million jobs lost in March and April. These data releases and hopes for a quick restart acted as a tailwind for risk assets to end the trailing twelve months.
Portfolio Review
Over the twelve-month period, the equity allocation of the Balanced Fund outperformed the S&P 500 Index, as sector allocation and security selection both contributed. Among the largest contributors to equity allocation was strong security selection within the Consumer Discretionary and Information Technology sectors.
Management’s Discussion of Fund Performance (Unaudited) (Continued)
The fixed income allocation of the Balanced Fund outperformed the Bloomberg Barclays U.S. Aggregate Bond Index in this period. The fixed income allocation was slightly overweight risk for most of the period with an overweight risk to Securitized Assets and a modest overweight to Investment Grade Credit. During the volatile market conditions experienced in March, we took advantage of spread widening in the extreme risk off environment. Credit spreads across sectors reached valuations well beyond levels seen in previous recessions. As a result, allocations were increased to Investment Grade Credit and re-allocated back into High Yield for the first time since October of 2017. In the second quarter of 2020, the Fund was able to recover some losses generated in the first quarter of 2020 as spreads tightened back in as markets responded to the sweeping policy efforts implemented by Congress and the Fed.
Outlook
We believe that the worst is likely behind us in terms of economic impact. The economy is beginning to reopen and activity has rebounded sharply with many indicators increasing at a faster rate than originally anticipated. Consensus expectations are for gross domestic product (GDP) to rebound to pre-virus levels around the end of 2021. In our judgement, a slightly more optimistic scenario is priced in given the recent strong data. Credit spreads and equity markets largely reflect this expectation. While significantly better than the worst levels of March, we do not view markets as overvalued.
As we started to see in June, reopening will bring an increase in virus cases. We believe some resurgence was expected by markets, but the ultimate market impact will be determined by the measures taken to contain the virus. Markets are not expecting broad-based shutdowns such as we saw in March/April. If re-opening the economy is impacted in a material way, similar to the measures taken previously, we believe markets will adjust their expectations for a rebound and valuations would suffer in another risk off move.
Asset valuations generally reflect the ongoing progress in reopening the economy. Risk remains elevated during this process and there will likely be volatility, but we think valuations are generally fair. As such, we are comfortable with the Fund’s portfolio position given valuations, policy support, and resumption of economic growth. We are targeting a slight overweight allocation to equities and overweight risk within fixed income with allocations to High Yield and Emerging Markets Debt.
Management’s Discussion of Fund Performance (Unaudited) (Continued)
Comparison of the Change in Value of a $10,000 Investment in the Touchstone Balanced Fund - Class A*, the S&P 500® Index and the Bloomberg Barclays U.S. Aggregate Bond Index

| * | The chart above represents performance of Class A shares only, which will vary from the performance of Class C shares and Class Y shares based on the differences in sales loads and fees paid by shareholders in the different classes. |
| ** | The average annual total returns shown above are adjusted for maximum sales loads and fees, if applicable. The maximum offering price per share of Class A shares is equal to the net asset value (“NAV”) per share plus a sales load equal to 5.26% of the NAV (or 5.00% of the offering price). Class C shares are subject to a contingent deferred sales charge (“CDSC”) of 1.00%. The CDSC will be assessed on an amount equal to the lesser of (1) the NAV at the time of purchase of the shares being redeemed or (2) the NAV of such shares being redeemed, if redeemed within a one-year period from the date of purchase. Class Y shares are not subject to sales charges. |
The performance of the above Fund does not reflect the deduction of taxes that a shareholder would pay on Fund distributions or the redemption of Fund shares.
Notes to Chart
S&P 500® Index is a group of 500 widely held stocks and is commonly regarded to be representative of the large capitalization stock universe.
Bloomberg Barclays U.S. Aggregate Bond Index is an unmanaged index comprised of U.S. investment grade, fixed rate bond market securities, including government, government agency, corporate and mortgage-backed securities between one and ten years.
Management’s Discussion of Fund Performance (Unaudited)
Touchstone International Equity Fund
Sub-Advised by Fort Washington Investment Advisors, Inc.
Investment Philosophy
The Fund seeks growth of capital by investing primarily in common stocks of established companies, located in or that conduct their business mainly in one or more foreign countries, which may include emerging markets. The investment philosophy focuses on quality at a reasonable price, where quality is defined based on the following five fundamental factors: business quality, valuation, growth, management and balance sheet strength.
Fund Performance
The Touchstone International Equity Fund (Class A Shares) underperformed its benchmark, the MSCI EAFE Index, for the 12-month period ended June 30, 2020. The Fund’s total return was -6.28 percent (calculated excluding maximum sales charge) while the benchmark’s total return was -5.13 percent.
Market Environment
The 12- month period ending June 30, 2020 was a rollercoaster ride for global equities, culminating in one of the quickest bear markets followed by one of the most dramatic recoveries in living memory. During the last six-months of 2019, many global equities climbed to new highs in response to progress in U.S. trade talks with China and better-than-expected economic news. The first half of 2020 brought much more angst and volatility as COVID-19 spread, sending shockwaves around the globe. In an effort to stem the spread of the virus, numerous countries went into lockdown and instituted social distancing rules, devastating global economies. From mid-February to late-March, the MSCI EAFE benchmark index plummeted, followed by one of the swiftest rebounds on record as investors increasingly turned optimistic on the back of the extraordinary fiscal and monetary support from governments around the world. However, over the entire 12-month period, the MSCI EAFE Index declined.
With this backdrop, Emerging Markets slightly outperformed Developed Markets and growth stocks trounced their value counterparts over the 12-month period. Classic defensive sectors such as Healthcare and Utilities outperformed cyclical sectors, such as Financial and Energy, within the benchmark. The Information Technology sector also performed well, as growth became increasingly harder to find and the work from home trend drove demand for software and hardware. Precious metals performed well for the second consecutive year while the U.S. dollar was more or less flat over the period.
Portfolio Review
The Fund’s underperformance was mainly due to poor stock selection in the Energy, Industrials, and Information Technology sectors. Positive contributing factors included being the Fund’s underweight to the lagging Financials sector, the Fund’s gold mining exposure, and solid stock selection in the Consumer Staples sector. By geography, holdings in Denmark and the Netherlands were the largest detractors to relative performance. A Fund underweight to the outperforming Japanese market was also a headwind. On the other hand, the Fund benefited from solid stock selection in the U.K. and Greater China and a slightly elevated cash position over much of the period. The main detractors from relative performance were the Fund’s oil services investments as well as individual holdings, ISS A/S (Denmark, Industrials sector), and JCDecaux SA (France, Communication Services sector).
We witnessed one of the most abrupt downward moves in oil markets in memory during the period. This was driven by the inability of the Organization of the Petroleum Exporting Countries (OPEC) and Russia to agree on supply constraints at the same time that the global pandemic was causing demand to implode. The sector’s downward revisions to capital expenditures are anticipated to put significant pressure on all oil services providers. Other Fund oil services holdings over the period included the Dutch domiciled Core Laboratories N.V. (Amsterdam, Energy sector), which focuses on helping oil producers maximize hydrocarbon recovery, as well as leading seismic providers, France-based CGG (France, Energy sector), and Norway-based TGS-Nopec Geophysical Company ASA (Norway, Energy sector). Core Laboratories has been particularly impacted by its exposure to the highly volatile U.S. shale market. While we believe oil services will face near term challenges in an environment of lower industry spending, we continue to prefer asset-light businesses that offer niche services with a proven history of performing through cycles.
ISS A/S is a leading global provider of facilities services, with strong market positions in Western Europe and Emerging Markets. The Danish-based company offers a full range of facilities services including cleaning, catering, security and property, and facility management. ISS entered the pandemic already in a relatively delicate position, having faced a handful of operational disappointments and sporting what looks like higher than optimal financial leverage. As a cleaning and integrated facilities service provider, ISS has been negatively impacted by government lockdowns as customer premises are vacated. Nonetheless, we believe the longer-term investment thesis remains unchanged as the company is well-positioned for the structural growth opportunities from increasing outsourcing penetration of cleaning services. The company’s low capital intensity, along with a management focus on enhancing margins and pursuing accretive growth opportunities continue to support our investment case.
Management’s Discussion of Fund Performance (Unaudited) (Continued)
JCDecaux SA is the global leader in the highly fragmented outdoor advertising market, with a total of more than 1.1 million advertising panels in over 75 countries. The outdoor signs of the French advertising group can be seen across big cities and at transport hubs around the world. Given the unprecedented nature of the COVID-19 crisis, the company’s advertising business finds itself on the front lines of the consumer and travel downturn. Outdoor advertisers also suffer from high operational leverage due to their fixed cost nature. Despite the current challenges, we believe JCDecaux has the strongest financial position among its peers and is well positioned to benefit from further consolidation opportunities in its industry. The increasing digitization of the company’s advertising panels has the potential to drive top-line growth over time.
The biggest positive contributors to relative performance over the period came from Barrick Gold Corp. (Canada, Materials sector), ConvaTec Group plc (U.K., Health Care sector), and Tencent Holdings Ltd. (China, Communication Services sector).
Barrick Gold Corp. is one of the world’s largest and most diversified gold producers, operating mines in North America, South America, Africa, and Australia/Pacific. It is a product of the strategic merger with Randgold Resources in 2018 that added world-class mines with costs at or below Barrick’s legacy portfolio. Led by its well-regarded CEO Mark Bristow, the company has among the strongest track records of value creation in the industry. We believe the fundamentals for gold mining stock remain supportive on the back of low/negative yields and as a hedge against potential inflationary pressures emanating from continuing easy monetary and fiscal policies around the world.
ConvaTec Group plc is a U.K.-based medical technology company focused on therapies for the management of chronic conditions, with leading market positions in advanced wound care, ostomy care, continence and critical care, and infusion devices. Originally spun out of Bristol-Myers Squibb, ConvaTec operates in a structurally growing area, but has lagged its key competitor due to a long period of underinvestment. However, the company is starting to demonstrate a turnaround with more consistent results and we see potential if the company’s new CEO can deliver on its transformation plans.
Tencent Holdings Ltd. operates the largest social networking site in China. Its core communication platforms WeChat and QQ have ensured user stickiness due to its strong network effects. Tencent’s expanding portfolio of platforms that provide services such as communication, gaming, cloud service, video content, and payments provides untapped monetization opportunities. The company has been a beneficiary of increased usage of internet services by consumers and businesses during the pandemic. Tencent’s core gaming business is also entering a strong product launch cycle, which we believe should support the acceleration of revenue growth.
The Fund had an active 12 months, adding 19 new names and exiting 20. Many of the additions were made in attempt to raise the overall quality and liquidity of the Fund’s holdings, taking advantage of COVID-related market volatility. A number of the eliminations were due to elevated stock valuations while a few names were sold due to deteriorating company fundamentals. Despite these changes, sector and country allocations did not change materially.
Outlook
Now several months into the greatest health and economic crises of our lifetimes, the future remains as uncertain as we can ever remember it being. Financial markets have largely shrugged off this uncertainty, however, thanks in large part to unprecedented degrees of fiscal and monetary policy response globally. While much of Asia and Europe appear to have the pandemic under control for now, a number of hot spots remain, including in regions of the U.S., and it remains to be seen how infection rates will respond to broader re-opening efforts or the return of cold weather in the northern hemisphere’s winter.
Travel and leisure continue to be disproportionately impacted, as any activities that require people to gather in numbers are likely to be limited or on hold altogether for the foreseeable future. Conventional wisdom clings to the hope for a vaccine in the coming year, though based on the track record in developing vaccines for a variety of other viruses in recent decades, this hope may disappoint. Therefore, we are left with a wide range of possible economic, financial, and even political outcomes, driven by the interaction of developments on the health front, ongoing policy responses and human psychology.
China, having gone through the crisis first, is ahead of the rest of the world in seeing life return to something approaching normal. A number of economic indicators, notably corporate profits, industrial production, car sales, and property transactions, are back to pre-Covid levels. Yet even in China, travel and leisure spending continues to lag. A more “vigorous” response to further outbreaks than is politically possible in the West should allow Chinese activity to continue its recovery in the coming months. China’s concerns are probably more on the trade and geopolitical fronts, with a combination of weak global demand and tensions with the U.S., among other countries, constraining growth.
Overall, Europe is now benefiting from a relatively prompt and comprehensive response to the pandemic. Anecdotal evidence and high frequency data have been encouraging so far, though even more than in the U.S. and China, travel and leisure spending remains almost unbelievably weak, due to the region’s dependence on international travelers. In an effort to not let the crisis go to waste, European leaders are pushing ahead with further integration of the Eurozone, planning to issue $750 billion euros of jointly backed bonds to fund a Europe Recovery Program which will primarily benefit Italy and Greece. Although not a done deal, European Union (EU) leaders are scheduled to meet later this summer to finalize plans and expectations are high.
Management’s Discussion of Fund Performance (Unaudited) (Continued)
The crisis has accentuated the lack of growth in developed international markets. As growth has become even more scarce and with interest rates close to zero or even negative, markets we believe are increasingly willing to put premium valuations on higher quality businesses exhibiting reliable revenue growth as well as on more speculative ideas with attractive if unquantifiable blue sky potential. Though this has been a trend for the last several years, it has created an even more dangerous dynamic for investors currently, since the range of potential economic outcomes is seemingly wider than ever. As investors, we are being forced to choose between buying expensive growth stocks or sticking with more mundane cyclicals that look reasonably valued with relatively optimistic expectations for economic recovery over the near term. In some ways, it is similar to what we witnessed over the second half of 2019, only now we are even less confident about the path of recovery. In addition, there are parts of the market which we might have once considered to be secular growth but are now dependent on a resumption of travel and mass gatherings. Some examples include outdoor advertising, catering and hotel brand franchising. Investing in a post-Covid world feels increasingly like playing three-dimensional chess.
Finally, we find ourselves in recent months pondering if the crisis and subsequent massive policy response around the world will not finally be the trigger that leads to a transition from disinflation, which has been the dominant economic force around the world for the past four decades, to a period characterized by reflation. Realistically, the near-term amount of slack in the global economy and the still healthy demand for risk-free assets, such as U.S. Treasuries, with low or even negative yields, suggest that it is too early to call for the end of deflation. We think it bears watching whether the unprecedented level of money supply growth and government spending can finally start to put upward pressure on prices other than just for financial assets.
Despite the distractions we hold steadfast to our philosophy that the way to build wealth over the long term is to identify attractively valued, well capitalized, high quality businesses, those that operate with high barriers to entry and can thus generate consistently above average returns on invested capital, run by sensible people who prioritize their responsibilities. Entering the second half of the year with a still relatively healthy cash position, we believe the Fund is well positioned to take advantage of the inevitable hiccups in the ongoing global recovery.
Management’s Discussion of Fund Performance (Unaudited) (Continued)
Comparison of the Change in Value of a $10,000 Investment in the Touchstone International Equity Fund - Class A* and the MSCI EAFE Index
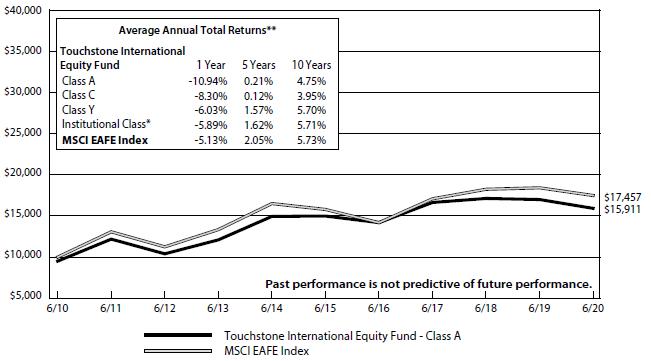
| * | The chart above represents performance of Class A shares only, which will vary from the performance of Class C shares, Class Y shares and Institutional Class shares based on the differences in sales loads and fees paid by shareholders in the different classes. The inception date of Institutional Class shares was October 30, 2017. Institutional Class shares performance information was calculated using the historical performance of Class A shares for the period prior to October 30, 2017. The returns have been restated for sales loads and fees applicable to Institutional Class shares. |
| ** | The average annual total returns shown above are adjusted for maximum sales loads and fees, if applicable. The maximum offering price per share of Class A shares is equal to the net asset value (“NAV”) per share plus a sales load equal to 5.26% of the NAV (or 5.00% of the offering price). Class C shares are subject to a contingent deferred sales charge (“CDSC”) of 1.00%. The CDSC will be assessed on an amount equal to the lesser of (1) the NAV at the time of purchase of the shares being redeemed or (2) the NAV of such shares being redeemed, if redeemed within a one-year period from the date of purchase. Class Y shares and Institutional Class shares are not subject to sales charges. |
The performance of the above Fund does not reflect the deduction of taxes that a shareholder would pay on Fund distributions or the redemption of Fund shares.
Notes to Chart
The MSCI EAFE Index is a free float-adjusted market capitalization index that is designed to measure developed market equity performance excluding the U.S. and Canada.
MSCI makes no express or implied warranties or representations and shall have no liability whatsoever with respect to any MSCI data contained herein. The MSCI data may not be further redistributed or used to create indices or financial products. This report is not approved or produced by MSCI.
Management’s Discussion of Fund Performance (Unaudited)
Touchstone International Growth Opportunities Fund
Sub-Advised by DSM Capital Partners LLC
Investment Philosophy
The Touchstone International Growth Opportunities Fund seeks long-term capital appreciation by primarily investing in international equity securities of companies believed to offer the best opportunity for reliable growth at attractive stock valuations. The Fund utilizes a bottom-up idea-driven growth style with a distinct valuation discipline. It seeks to identify companies which are believed to exhibit certain quality characteristics, including: predictable growth, solid fundamentals, attractive profitability and successful management.
Fund Performance
The Touchstone International Growth Opportunities Fund (Class A Shares) outperformed its benchmark, the MSCI All Country World Ex-USA Index, for the 12-month period ended June 30, 2020. The Fund’s total return was 5.07 percent (calculated excluding maximum sales charge) while the total return of the benchmark was -4.80 percent.
Market Environment
Prior to the COVID-19 pandemic, a period characterized by slow growth, low inflation, and low interest rates, translated into an earnings tailwind for the market through the second half of 2019. However, due to the speed and severity of the global economic downturn caused by COVID-19, this tailwind appeared to be disrupted in 2020. The virus observed no borders and caused the entire global economy to transition from a slow expansion to, quite likely, a deep recession in record time, which drove a market meltdown in the first quarter. Then, in anticipation of an improved outlook for the control and treatment of the virus, equity markets rallied through June 2020.
Portfolio Review
During the 12-month period, both stock selection and sector allocation contributed to the relative outperformance. The relative overweights to the Consumer Discretionary and Information Technology sectors and resulting underweights to Financials and Utilities also contributed. In terms of stock selection, the Consumer Staples and Communication Services sectors led contribution while Consumer Discretionary and Health Care were more challenged. Stock selection within Emerging Markets drove relative results on a regional basis though this was slightly offset by an overweight allocation, as Developed outperformed.
The holdings which contributed most to the Fund’s performance during the period were instant messaging and electronic game platform company, Tencent Holdings Ltd. (China, Communications sector); e-commerce company, JD.com (China, Consumer Discretionary sector); e-commerce and internet infrastructure services company, Alibaba Group Holding Ltd. (China, Consumer Discretionary sector); development company, NICE Ltd. (Israel, Information Technology sector); and educational services company, New Oriental Education & Technology Inc. (China, Consumer Discretionary sector).
The weakest contributors to the Fund’s performance during the period were airplane and military equipment company, Airbus SE (Germany, Industrials sector); aerospace and defense electrical systems company, Thales SA (France, Industrials sector), Coca-Cola bottler Coca-Cola HBC (Switzerland, Consumer Staples sector); internet payment software solutions company, Wirecard (Germany, Financial sector) and corporate banking services company, HDFC Bank (India, Financial sector).
The Fund’s positioning during the 12-month period has been consistent with DSM’s investment philosophy. The notable change was the decreased weight to Emerging Markets over the second half of 2019. The majority of the Fund’s portfolio was invested in the Communication Services, Consumer Discretionary, Consumer Staples, Financials, Health Care, Industrials and Information Technology sectors.
Outlook
There is little doubt that 2020 will be a recession year. However, we continue to believe that economic growth will restart in the U.S. in the second half of 2020, and globally in 2021. We believe that the economic outlook today is quite similar to the economic outlook after the 2008-2009 Great Financial Crisis. Prior to the COVID-19 pandemic, DSM Capital Partners had projected for many years that the global economic expansion, characterized by slow growth, low inflation, and low interest rates, would last longer than the majority of previous economic growth periods. As the world slowly recovers from this pandemic, we believe a similar outlook is warranted.
Despite some COVID-19 second-wave outbreaks, China is well into the process of restarting its economy. Absent a large occurrence, we believe the Chinese consumer will continue a slow return to pre-coronavirus spending patterns. In our view, the same is true of China’s industrial economy. Chinese manufacturing activity surprised recently with new orders expanding for the first time since
Management’s Discussion of Fund Performance (Unaudited) (Continued)
January. Unfortunately, the Japanese economy remains weak, as employment and exports continue to decline. On the other hand, industrial production has moved slightly higher perhaps providing the first glimmers of an economic recovery. If the coronavirus remains under control in Japan, we believe COVID-19 restrictions should continue to be lifted creating the potential for the economy to grow once again. That said, we believe Japan’s longer-term growth prospects remain limited.
Like Japan and China, Europe appears to have turned the corner in its battle against coronavirus. Recent Eurozone manufacturing statistics have improved and the European Central Bank (ECB) remains committed to providing large amounts of liquidity in order to prevent the economy from retreating. In recent weeks, European stocks have outperformed U.S. equities, however we do not believe this marks a lasting shift in market leadership from the U.S. to the European Union (EU) Intermediate-term growth prospects remain limited in Europe.
In our view, economic growth in the developed world has the potential to re-start over the second half of this year. However, given the ongoing growth of COVID-19 cases in many emerging markets including India and Latin America, strong and broad-based global growth may not be immediately forthcoming.
We continue to believe in our Growth philosophy. In our view, Value stocks will continue to face revenue and profit pressures from the ongoing evolution of digital/internet technologies, which weigh heavily on the traditional businesses that comprise much of these benchmark. We believe Value stocks are generally more cyclical, operate in industries that are more competitive, have greater capital requirements, and are more at risk of losing their way in an ever more digitally driven world. In addition, we think a pickup in inflation is needed to alleviate the pricing pressure found across the product lines of many companies in the Value benchmark, which we doubt will be forthcoming in the foreseeable future.
The Fund is more than half allocated to digital companies that utilize the internet to provide their services. We believe these businesses have strong balance sheets, cash flows, and management teams. In our view, they are unique, face few competitors, and are self-financing. These companies use technology to serve both business and consumer customers in a very broad range of industries, often globally. We believe this mix of businesses provides diversified economic and end market/customer exposure.
Our investment approach is built on the simple concept that “Earnings Win”. Over time, we believe that businesses appreciate in value as their earnings grow.
Management’s Discussion of Fund Performance (Unaudited) (Continued)
Comparison of the Change in Value of a $10,000 Investment in the Touchstone International Growth Opportunities Fund - Class A* and MSCI All Country World Ex USA Index
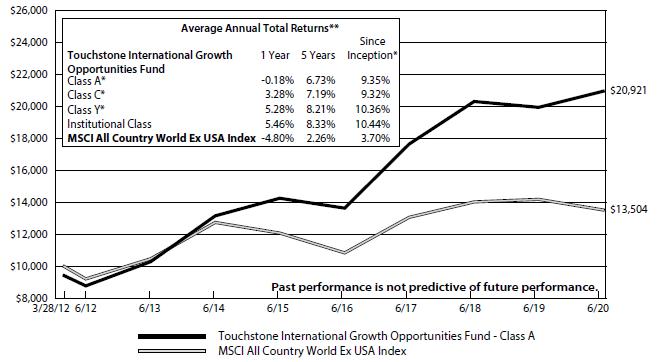
| * | The chart above represents performance of Class A shares only, which will vary from the performance of Class C shares, Class Y shares and Institutional Class shares based on the differences in sales loads and fees paid by shareholders in the different classes. The inception date of Class A shares, Class C shares, Class Y shares and Institutional Class shares was August 15, 2016, August 15, 2016, August 15, 2016 and March 28, 2012, respectively. Class A shares, Class C shares and Class Y shares performance information was calculated using the historical performance of Institutional Class shares for periods prior to August 15, 2016. The returns have been restated for sales loads and fees applicable to Class A, Class C and Class Y shares. The returns of the index listed above are based on the inception date of the Fund. |
| ** | The average annual total returns shown above are adjusted for maximum sales loads and fees, if applicable. The maximum offering price per share of Class A shares is equal to the net asset value (“NAV”) per share plus a sales load equal to 5.26% of the NAV (or 5.00% of the offering price). Class C shares are subject to a contingent deferred sales charge (“CDSC”) of 1.00%. The CDSC will be assessed on an amount equal to the lesser of (1) the NAV at the time of purchase of the shares being redeemed or (2) the NAV of such shares being redeemed, if redeemed within a one-year period from the date of purchase. Class Y shares and Institutional Class shares are not subject to sales charges. |
The performance of the above Fund does not reflect the deduction of taxes that a shareholder would pay on Fund distributions or the redemption of Fund shares.
Notes to Chart
MSCI All Country World Ex-USA Index is an unmanaged, capitalization-weighted index composed of companies representative of both developed and emerging markets excluding the United States.
MSCI makes no express or implied warranties or representations and shall have no liability whatsoever with respect to any MSCI data contained herein. The MSCI data may not be further redistributed or used to create indices or financial products. This report is not approved or produced by MSCI.
Management’s Discussion of Fund Performance (Unaudited)
Touchstone International Small Cap Fund
Sub-Advised by Russell Investments Implementation Services, LLC
Investment Philosophy
The Touchstone International Small Cap Fund seeks capital appreciation by primarily investing in equity securities of non-U.S. small-cap companies diversified across sectors and industries.
Fund Performance
The Touchstone International Small Cap Fund (Class A Shares) underperformed its benchmark, the S&P Developed Ex-U.S. Small Cap Index for the 12-month period ended June 30, 2020. The Fund’s total return was -17.86 percent (calculated excluding the maximum sales charge) while the total return of the benchmark was -3.75 percent.
Market Environment
Trade-related rhetoric between the U.S. and China drove market volatility throughout 2019. By the end of year, the U.S.-China trade discussions took a more constructive tone, culminating in an announcement of a “phase one” agreement in early 2020 to reduce some tariff levels. The U.S. economy continued its steady pace, driven by strong employment data and solid consumer spending. Outside the U.S., economic growth in developed markets such as the U.K., European Union and Japan continued their slow pace, all while each of their central banks continued to maintain low-to-zero overnight rates. Emerging markets continued to show overall weakness, driven by the U.S.-China trade slowdown and lower-than-expected Indian economic growth. This already fragile, low-growth environment was upended in the first half of 2020 as COVID-19 swept the globe, bringing with it containment measures resulting in massive shutdowns of economic activity.
In non-U.S. developed equity markets, Japan performed relatively well with slow growth in COVID-19 cases and aggressive stimulus measures while Europe was hit harder by the pandemic. Similar to the U.S., Information Technology and Health Care stocks were among the top contributors in developed markets while Energy and Financials lagged. In emerging markets, internet stocks and Asia Pacific countries who experienced COVID-19 lockdowns earlier in the year, such as China,Taiwan and South Korea, outperformed. These Asia Pacific countries experienced an abating COVID-19 virus and were able to re-open their economies earlier than the U.S. and Europe.
Overall, global stock markets declined during the period. U.S. large-cap stocks posted high single digit gains while their counterparts in developed and emerging markets declined. Small-cap stocks across the globe generally declined. From a style perspective, there was notable dispersion with growth stocks producing positive results while their value counterparts turned in double-digit percentage losses.
Portfolio Review
The following review reflects management by Copper Rock Capital Partners LLC, the Fund’s former sub-advisor, from the beginning of the 12-month period through May 21, 2020. Russell Investments Implementation Services, LLC (“Russell”) was appointed to serve as interim sub-advisor from May 22, 2020 through September 11, 2020.
The Fund’s underperformance was a result of poor stock selection across most sectors. The majority of underperformance came from stock selection in the Consumer Discretionary, Industrials and Financials sectors, while selection in the Materials, Health Care and Consumer Staples sectors also detracted. Stock selection in the Energy and Real Estate sectors benefited Fund performance. An overweight to the Information Technology and Health Care sectors and underweight to the Energy sector were positive contributors partially offsetting stock selection headwinds.
Among the individual stocks that contributed the most to performance during the period were Azbil Corp. and Dialog Semiconductor plc (both Information Technology sector) and Nichirei, Inc. (Consumer Staples sector). Azbil is the market leader in building automation systems. This company tends to have a very predictable and repeatable revenue and earnings stream as it offers maintenance contracts on many of the buildings it had a hand in constructing. Azbil is often referred to as the “Honeywell” of Japan, a reflection of Honeywell’s domination of building automation in the U.S. This stock performed well in a relative sense because of its high quality and predictable earnings stream as well as its debt-free balance sheet. Dialog Semiconductor manufactures power management integrated circuits for smartphones, tablets and other portable devices. It has benefited from a recovery in smart phone volumes, internal cost cutting measures and recent bolt on acquisitions. During the period, the stock performed well as estimates moved higher and valuations expanded closer to sector comparables. Nichirei produces and distributes frozen food and meat products. The company also provides cold storage logistic services for food distribution. Nichirei is a clear beneficiary of growth in the frozen food area, which is growing based upon demography and preference for easy to prepare meals. Sales are being positively impacted from people staying at home during the coronavirus outbreak. Capex for its cold storage business is peaking this year, which should lead to improved margins from efficiency and accelerating cash flows.
Management’s Discussion of Fund Performance (Unaudited) (Continued)
Among the individual stocks that detracted from Fund performance were Challenger Limited (Financials Sector), SSP Group plc and William Hill plc (both Consumer Discretionary sector). Challenger is an investment management firm that provides annuities and retirement income products for clients. We believe Challenger is uniquely positioned to provide solutions for guaranteed income to retirees post retirement through converting savings to annuities, which is a $67 billion annual market annually. Aging demography and favorable regulation should support a longer term growth opportunity. Challenger performed well during the period as the company outperformed its guidance; however, performance shifted as investors questioned the size of potential asset write-downs from declining equity and debt markets coupled with the likely interruption in writing new annuities in the depressed environment. SSP is a catering and concession services provider, primarily in airports and train stations in U.S. and Europe. The company had been gaining share within airports globally due to solid operating execution and strong local offerings. The unprecedented disruption to travel across the world due to COVID-19 is likely to have a dramatic impact on sales and profitability. William Hill specializes in betting parlors and online gaming. William Hill assets include a U.K. cash cow betting parlor business which funded the company’s nascent, yet fast growing U.S. online sports betting business. The company was executing well going into the coronavirus debacle. Once investors realized that the effect of the virus was going to likely be an extended shutdown of both U.K. betting parlors and U.S. casinos, the outlook for William Hill changed dramatically to the downside.
Outlook
The COVID-19 pandemic represents the greatest public health and economic crises of our lifetimes. Despite several months of the best efforts to contain the pandemic, the future remains uncertain. Although many countries appear to have the pandemic under control, including much of Asia and Europe, several hot spots remain. Given this backdrop, we expect a continuation of higher risks for companies whose business models rely on the resumption of travel and mass gatherings such as airlines, hotels, outdoor advertising and catering.
Management’s Discussion of Fund Performance (Unaudited) (Continued)
Comparison of the Change in Value of a $10,000 Investment in the Touchstone International Small Cap Fund - Class A* and the S&P Developed Ex-U.S. Small Cap Index
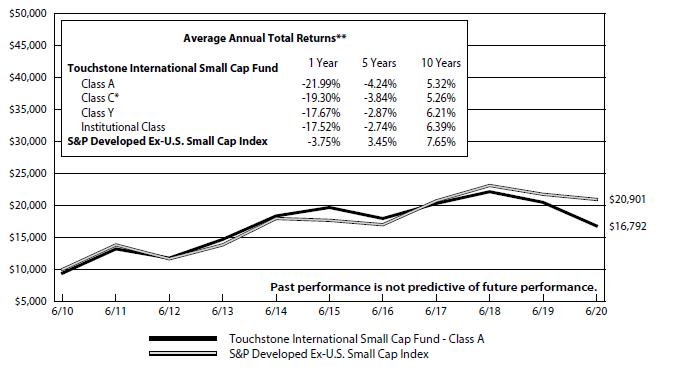
| * | The chart above represents performance of Class A shares only, which will vary from the performance of Class C shares, Class Y shares and Institutional Class shares based on the differences in sales loads and fees paid by shareholders in the different classes. The inception date of Class C shares was April 12, 2012. Class C shares performance was calculated using the historical performance of Class Y shares for the period prior to April 12, 2012. The returns have been restated for sales loads and fees applicable to Class C shares. |
| ** | The average annual total returns shown above are adjusted for maximum sales loads and fees, if applicable. The maximum offering price per share of Class A shares is equal to the net asset value (“NAV”) per share plus a sales load equal to 5.26% of the NAV (or 5.00% of the offering price). Class C shares are subject to a contingent deferred sales charge (“CDSC”) of 1.00%. The CDSC will be assessed on an amount equal to the lesser of (1) the NAV at the time of purchase of the shares being redeemed or (2) the NAV of such shares being redeemed, if redeemed within a one-year period from the date of purchase. Class Y shares and Institutional Class shares are not subject to sales charges. |
The performance of the above Fund does not reflect the deduction of taxes that a shareholder would pay on Fund distributions or the redemption of Fund shares.
Note to Chart
S&P Developed Ex-U.S. Small Cap Index is an unmanaged index of small-cap stocks from developed countries, excluding the United States.
Management’s Discussion of Fund Performance (Unaudited)
Touchstone Large Cap Focused Fund
Sub-Advised by Fort Washington Investment Advisors, Inc.
Investment Philosophy
The Fund seeks capital appreciation by investing in companies of all capitalizations that are trading below what is believed to be the estimate of their intrinsic value and have a sustainable competitive advantage or a high barrier to entry in place. The barrier(s) to entry can be created through a cost advantage, economies of scale, high customer loyalty or a government barrier (e.g. license or subsidy). Fort Washington believes that the strongest barrier to entry is the combination of economies of scale and high customer loyalty.
Fund Performance
The Touchstone Large Cap Focused Fund (Class A Shares) outperformed the S&P 500® Index for the 12-month period ended June 30, 2020. The Fund’s total return was 9.54 percent (excluding the maximum sales charge) while the return of its benchmark was 7.51 percent.
Market Environment
Over the last twelve month period, U.S. equities recorded positive returns despite a historically rapid bear market in the first quarter of 2020. In the third quarter of 2019, U.S. equity markets moved mildly higher primarily due the strength of the U.S. consumer. Stocks again moved higher in the fourth quarter primarily due to optimism around the phase one trade agreement between the U.S. and China. During the first quarter of 2020, U.S. equity markets pulled back significantly primarily due to concerns over the global spread of the coronavirus and the oil price war between Russia and Saudi Arabia. In the second quarter, investors responded favorably to massive economic support by global governments and started to price in a recovery from the pandemic.
Over the one year period ending June 30, 2020, benchmark performance was driven by the Information Technology sector. The Consumer Discretionary, Communication Services, and Health Care sectors also performed well. Sectors that underperformed the broader index the most included Energy, Financials, and Industrials.
Portfolio Review
The first half of 2020 (and the last six months of the fiscal year) has been a volatile time in U.S. equity markets as investors have contemplated the unique dynamics of the novel coronavirus pandemic. After one of the shortest bear markets in history, the second quarter saw a sharp rally as the market priced in an eventual recovery. In our view, the massive action by the U.S. government late in the first quarter took the tail risk of a collapsing financial system off the table which was the foundational element to the rebound in risk assets.
With this framework in mind, we have kept top down portfolio positioning relatively consistent while taking the opportunity to upgrade the Fund’s portfolio from a bottom up level amidst volatility. We have deployed or re-deployed capital at a measured pace consistently since the latter half of the first quarter. We have not implemented a defensive posture for overall portfolio construction as we believe the impact on most of the Fund’s portfolio has been and will be temporary rather than structural. The Fund consistently reduced position sizes in businesses that we view as more expensive, could have balance sheet issues, or are less compelling to free up capital for more attractive business models that have become buyable. We believe this episode has demonstrated the importance of owning a portfolio of businesses that are supported by barriers to entry with strong balance sheets and good valuations.
Within the Fund’s holdings, sectors that outperformed the benchmark included Consumer Discretionary, Financials, Health Care, Utilities, and Communication Services. Energy and Consumer Staples performed roughly in line with the benchmark. Real Estate, Materials, Information Technology, and Industrials underperformed. Sector allocation was positive due to the underweights in Energy and Consumer Staples.
The three stocks that contributed the most to performance were JD.com Inc. (Consumer Discretionary sector), Apple Inc. (Information Technology sector), and Microsoft Corp. (Information Technology sector). The three stocks that detracted the most from performance were Berkshire Hathaway Inc. Class B Shares (Financials sector), Jones Lang LaSalle Inc. (Real Estate sector), and Carnival Corp. (Consumer Discretionary sector).
Outlook
Looking forward, we recognize the potential for more pull backs as the reopening continues to unfold. While the trajectory of the virus is difficult to handicap, we view progress on testing, tracing, and isolation procedures into the Fall as a bridge to a vaccine that helps avoid the level of economic impact we saw in the Spring. Assuming a recessionary hit to earnings in 2020 and a subsequent U-shaped recovery over the next several years, we see the U.S. equity market as currently attractive.
Management’s Discussion of Fund Performance (Unaudited) (Continued)
Our process seeks to realize the longer-term benefits of consistently owning high excess return on capital businesses that are mispriced. The process seeks to weather the unavoidable and unpredictable near-term shocks on the path to achieving its objective.
Comparison of the Change in Value of a $10,000 Investment in the Touchstone Large Cap Focused Fund - Class A* and the S&P 500® Index
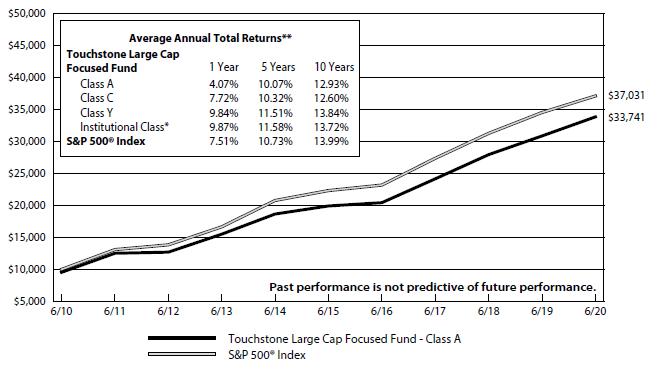
| * | The chart above represents performance of Class A shares only, which will vary from the performance of Class C shares, Class Y shares and Institutional Class shares based on the differences in sales loads and fees paid by shareholders in the different classes. The inception date of Institutional Class shares was December 23, 2014. Institutional Class shares performance was calculated using the historical performance of Class A shares for the period prior to December 23, 2014. The returns have been restated for sales loads and fees applicable to Institutional Class shares. |
| ** | The average annual total returns shown above are adjusted for maximum sales loads and fees, if applicable. The maximum offering price per share of Class A shares is equal to the net asset value (“NAV”) per share plus a sales load equal to 5.26% of the NAV (or 5.00% of the offering price). Class C shares are subject to a contingent deferred sales charge (“CDSC”) of 1.00%. The CDSC will be assessed on an amount equal to the lesser of (1) the NAV at the time of purchase of the shares being redeemed or (2) the NAV of such shares being redeemed, if redeemed within a one-year period from the date of purchase. Class Y shares and Institutional Class shares are not subject to sales charges. |
The performance of the above Fund does not reflect the deduction of taxes that a shareholder would pay on Fund distributions or the redemption of Fund shares.
Note to Chart
S&P 500® Index is a group of 500 widely held stocks and is commonly regarded to be representative of the large capitalization stock universe.
Management’s Discussion of Fund Performance (Unaudited)
Touchstone Large Cap Fund
Sub-Advised by The London Company
Investment Philosophy
The Touchstone Large Cap Fund seeks long-term capital growth by investing primarily in common stocks of large-cap U.S. listed companies. The Fund seeks to purchase financially stable large-cap companies that it believes are consistently generating high returns on unleveraged operating capital, run by shareholder-oriented management, and trading at a discount to the company’s respective private market values.
Fund Performance
The Touchstone Large Cap Fund (Class A Shares) underperformed its benchmark, the Russell 1000® Index, for the 12-month period ended June 30, 2020. The Fund’s total return was -1.18 percent (excluding the maximum sales charge) while the benchmark’s total return was 7.48 percent.
Market Environment
The major U.S. stock indices were led by large-cap growth stocks for the one-year period ending June 30, 2020. Returns of the broader market were more subdued, which belied the return of volatility, which contained two quarters of significant moves.
The prevailing event was the emergence of the coronavirus and fears over its impact on the economy. After reporting positive returns in the second half of 2019, the market declined in the first quarter of 2020 driven by fear of the coronavirus. This was followed by a rally as the U.S. economy started to reopen and investors looked past the valley of declining earnings.
The U.S. Federal Reserve Board (the Fed) was very active during the period. The Fed announced numerous plans to aid the economy, continued to add stimulus, and communicated a willingness to do more if needed. Chairman Powell made it clear that rates will likely remain low for quite some time. This was well received by the market.
Economic news improved later in the period following the low points reached in March and April. While overall spending was still down year over year, investors focused on the sequential progress off the lows. The biggest positive was improvement in the employment data in May and June. The unemployment rate fell to 11.1 percent in June. Job gains were widespread across industries as workers returned to their jobs following the reopening of many businesses. Retail sales bounced back in June reflecting some pent up demand as one-time checks and expanded unemployment insurance more than offset losses in income. In terms of the survey data, both the ISM manufacturing and non-manufacturing surveys rose over 50, suggesting economic expansion.
In terms of factor performance, as mentioned, Growth was the dominant factor in the period. Other positive factors included Momentum, Size, and Volatility. Quality factors had a mixed impact and Value and Yield factors underperformed.
Portfolio Review
Within the Fund, both sector allocation and stock selection detracted from relative performance. In terms of sector allocation, an overweight position to the Financials sector and underweight position to the Information Technology sector detracted from relative performance. This was partially offset by underweight positions to the Energy and Utilities sectors.
Among the individual stocks that contributed to Fund performance during the period were Apple Inc. (Information Technology sector), Alphabet Inc. (Communication Services sector), and Citrix Systems Inc. (Information Technology sector).Technology ecosystem creator, Apple, held up well in the first quarter and then rallied in the second quarter reflecting strength in services sales and solid iPhone results. Operating cash flow grew while the balance sheet was strong with over $80 billion in net cash and investments. The company increased its dividend and added to its share repurchase authorization late in the period. Despite Alphabet’s quarterly report being weaker than expected in the December quarter, the advertising and consumer technology solutions provider outperformed the broader market. Alphabet reported a deceleration in U.S. growth with some of the weaker sales attributed to the hardware business. Alphabet provided more financial information about operations such as YouTube and Google Cloud. Though advertising spending will likely come down, Google is more diversified with YouTube & Cloud. Those businesses account for more than 40 percent of incremental growth. The company continued to invest in its strong ecosystems (search, cloud, and hardware) with a larger focus on privacy and security. Alphabet has a solid balance sheet and significant market share. Citrix Systems, a provider of network security solutions, has been a major beneficiary of the work-from-home situation required by the COVID outbreak as its software products allowed workers to securely access applications from almost anywhere. As such, in the early stages of the COVID outbreak in 2020, the stock outperformed. However, as the economy moved toward reopening and workers returning to the office, the stock generated positive absolute performance, but lagged on a relative basis during the second quarter. We believe the company’s products will continue to become more and more relevant in the workplace in the coming years.
Management’s Discussion of Fund Performance (Unaudited) (Continued)
Among the stocks that detracted from Fund performance were Carnival Corp. (Consumer Discretionary sector), Berkshire Hathaway Inc. (Financials sector), and Southwest Airlines Co. (Industrials sector). Cruise operator, Carnival Corporation, was down significantly as the spread of coronavirus became a problem in early 2020. As the stock negatively reacted to the virus, it fell enough to hit our soft stop loss in late February. Initially, we maintained the position believing that the stock price more than accounted for the risks. As time passed, we realized that operating profits were likely to fall over the next year while capital spending would continue to be funded by additional debt. We grew more concerned that greater debt could limit Carnival’s financial flexibility and weaken the downside protection story. Therefore, we sold the stock in mid/late March. Berkshire Hathaway has historically been less volatile due to the nature of its diversified business and its large cash position; this helped the stock outperform in the first quarter of 2020 and drove underperformance in the second quarter. In addition, we believe that investors were frustrated that the company did not capitalize on the spike in volatility to make any acquisitions or opportunistically repurchase its own shares. We continue to have strong confidence in the capital allocation abilities of Buffett and his disciples. Southwest Airlines sold off in 2020 as the travel industry came to a standstill. While we still view Southwest as a best-in-class airline that will survive, we exited the Fund’s position during the second quarter as our thesis was no longer intact. We thought that with the company now burdened with debt and demand potentially severely impaired for the foreseeable future, it no longer fit the Fund’s approach.
During the 12-month period, we were more active during this time of volatility and traded around names to adhere to the Fund’s investment discipline. New positions included Pfizer Inc. (Health Care sector), Citrix Systems Inc. and Texas Instruments Inc. (Information Technology sector), Air Products & Chemicals Inc. (Materials sector), and Store Capital Corp. (Real Estate sector). Fund positions that were sold included Carnival Corp. (Consumer Discretionary sector), Alleghany Corp. (Financials sector), General Dynamics Corp. and Southwest Airlines Co. (Industrials sector), and Albemarle Corp. (Materials sector).
Outlook
U.S. stocks rebounded strongly in the second quarter of 2020, following the weak first quarter caused by business disruption from the pandemic. Investors turned more optimistic during the last quarter of the period, driven by improving economic data, falling unemployment, corporate commentary suggesting stabilization in end demand, and hope around potential vaccines and treatments to fight COVID-19. We are encouraged by the improvement in the economic data, but we are not sure how the pandemic will unfold or what long-term impacts will emerge from the crisis. The state of public health is most important and it may be a while before we have adequate testing and a vaccine that can significantly reduce the health risk to the average person. With the heightened uncertainty on the health side, we recognize economic data could change quickly in the near term. In that environment, we think we will see significant price volatility.
While business closures and social distancing seemed to get the virus under control by the middle of the second quarter, sadly the virus began to pick up steam again late in the period. A significant resurgence in the virus could lead to reopening plans being either paused or rolled back. Another risk is the reduction in expanded unemployment benefits, which are set to expire at the end of July. We think the U.S. government will pass another round of stimulus, but the level of benefits to the end consumer is uncertain. Longer term, we remain optimistic about the prospects for the U.S. economy.
With regard to monetary policy, we think the Fed will remain accommodative and Fed Chair Powell made it clear that the federal funds rate will likely remain low for quite some time. The Fed’s Open Market Committee members suggest rates will remain close to zero until the end of 2022. We believe quantitative easing will likely continue while the various facilities to help maintain liquidity throughout the economy will remain in place. The Fed significantly expanded its balance sheet during the quarter ending June with roughly $7 trillion in assets. Its balance sheet will likely expand more over the next few quarters.
In terms of the equity market, we continue to believe in quality attributes and strong company fundamentals. Valuation for the broader market is roughly back above its long-term average. Low interest rates argue for higher multiples, but multiple expansion from here may be limited. While we believe the risks and rewards are somewhat balanced as they relate to stocks overall, we always remain cautious and focus on limiting downside in each holding.
We believe the Fund provides the opportunity to own a group of competitively advantaged businesses (judged by return on capital), with strong balance sheets (lower net debt/ebidta), at a valuation slightly less than the broader market. Typically, a higher quality portfolio of companies will trade at a premium to the market.
Finally, we believe in the quality of the Fund’s holdings for the next few years, even if the market trades modestly higher. In an environment of possibly lower expected returns and greater volatility, we believe the Fund is positioned well.
Management’s Discussion of Fund Performance (Unaudited) (Continued)
Comparison of the Change in Value of a $10,000 Investment in the Touchstone Large Cap Fund - Class A* and the Russell 1000® Index

| * | The chart above represents performance of Class A shares only, which will vary from the performance of Class C shares, Class Y shares and Institutional Class shares based on the differences in sales loads and fees paid by shareholders in the different classes. The inception date of the Fund was July 9, 2014. The returns of the index listed above are based on the inception date of the Fund. |
| ** | The average annual total returns shown above are adjusted for maximum sales loads and fees, if applicable. The maximum offering price per share of Class A shares is equal to the net asset value (“NAV”) per share plus a sales load equal to 5.26% of the NAV (or 5.00% of the offering price). Class C shares are subject to a contingent deferred sales charge (“CDSC”) of 1.00%. The CDSC will be assessed on an amount equal to the lesser of (1) the NAV at the time of purchase of the shares being redeemed or (2) the NAV of such shares being redeemed, if redeemed within a one-year period from the date of purchase. Class Y shares and Institutional Class shares are not subject to sales charges. |
The performance of the above Fund does not reflect the deduction of taxes that a shareholder would pay on Fund distributions or the redemption of Fund shares.
Note to Chart
Russell 1000® Index measures the performance of the 1,000 largest companies in the Russell 3000® Index.
The Frank Russell Company (FRC) is the source and owner of the data contained or reflected in this material and all trademarks and copyrights related thereto. The material may contain confidential information and unauthorized use, disclosure, copying, dissemination or redistribution is strictly prohibited. This is a Touchstone Investments presentation of the data, and FRC is not responsible for the formatting or configuration of this material or for any inaccuracy in the presentation thereof.
Management’s Discussion of Fund Performance (Unaudited)
Touchstone Large Company Growth Fund
Sub-Advised by DSM Capital Partners LLC
Investment Philosophy
The Touchstone Large Company Growth Fund seeks long-term capital appreciation by primarily investing in U.S. equity securities of large capitalization companies believed to offer the best opportunity for reliable growth at attractive stock valuations. The Fund utilizes a bottom-up idea-driven growth style with a distinct valuation discipline. It seeks to identify companies which are believed to exhibit certain quality characteristics, including: solid fundamentals, attractive profitability and successful management.
Fund Performance
The Touchstone Large Company Growth Fund (A Class shares) underperformed its benchmark, the Russell 1000® Growth Index, for the 12-month period ended June 30, 2020. The Fund’s total return was 20.07 percent (calculated excluding the maximum sales charge), while the total return of the benchmark was 23.28 percent.
Market Environment
Prior to the COVID-19 pandemic, a period characterized by slow growth, low inflation, and low interest rates, translated into an earnings tailwind for the market through the second half of 2019. However, due to the speed and severity of the global economic downturn caused by COVID-19, this tailwind appeared to be disrupted in 2020. The virus observed no borders and caused the entire global economy to transition from a slow expansion to, quite likely, a deep recession in record time, which drove a market meltdown in the first quarter. Then, in anticipation of an improved outlook for the control and treatment of the virus, equity markets rallied through June 2020. Equity markets tend to discount future earnings and cash flows over the next decade or more. Accordingly, the markets recovered before the U.S. economy.
Portfolio Review
During the 12-month period the Fund’s underperformance versus the benchmark was primarily due to weak stock selection in the Information Technology and Health Care sectors. This was partially offset by the Fund’s stock selection in the Communication Services sector and underweight allocation to the Industrials sector.
The holdings which contributed most to the Fund’s performance during the period were application software/cloud storage company, Microsoft Corp. (Information Technology sector); application software development company, Adobe Inc.(Information Technology sector); digital and mobile payments company, PayPal Holdings Inc. (Information Technology sector); instant messaging and electronic game platform company Tencent Holdings Ltd. (Communication Services sector); and e-commerce and cloud services company, Amazon.com Inc. (Consumer Discretionary sector).
The weakest contributors to the Fund’s performance during the period were animal health medicines and vaccines company, Elanco Animal Health Inc. (Health Care sector); global cruise operator, Royal Caribbean Cruises Ltd. (Consumer Discretionary sector); business outsourcing solutions company, Automatic Data Processing Inc. (Information Technology sector), online travel agent, Booking Holdings (Consumer Discretionary sector); and medical devices company, Boston Scientific Corp. (Health Care sector).
There were no meaningful changes made to the Fund’s positioning during the 12-month period. The majority of the Fund’s portfolio was invested in the Communication Services, Consumer Discretionary, Health Care and Information Technology sectors.
Outlook
There is little doubt that 2020 will be a recession year. However, we continue to believe that economic growth will restart in the U.S. in the second half of 2020, and globally in 2021. We believe that the economic outlook today is quite similar to the economic outlook after the 2008-2009 Great Financial Crisis. Prior to the COVID-19 pandemic, DSM Capital Partners had projected for many years that the global economic expansion, characterized by slow growth, low inflation, and low interest rates, would last longer than the majority of previous economic growth periods. As the world slowly recovers from this pandemic, we believe a similar outlook is warranted.
We continue to believe in our Growth philosophy. In our view, Value stocks will continue to face revenue and profit pressures from the ongoing evolution of digital/internet technologies, which weigh heavily on the traditional businesses that comprise much of these benchmark. We believe Value stocks are generally more cyclical, operate in industries that are more competitive, have greater capital requirements, and are more at risk of losing their way in an ever more digitally driven world. In addition, we think a pickup in inflation is needed to alleviate the pricing pressure found across the product lines of many companies in the Value benchmark, which we doubt will be forthcoming in the foreseeable future.
Management’s Discussion of Fund Performance (Unaudited) (Continued)
The Fund is primarily invested in digital companies that utilize the internet to provide their services. We believe these businesses have strong balance sheets, cash flows, and management teams. In our view, they are unique, face few competitors, and are self-financing. These companies use technology to serve both business and consumer customers in a very broad range of industries, often globally. We believe this mix of businesses provides diversified economic and end market/customer exposure.
Our investment approach is built on the simple concept that “Earnings Win”. Over time, we believe that businesses appreciate in value as their earnings grow.
Comparison of the Change in Value of a $10,000 Investment in the Touchstone Large Company Growth Fund-Class A*, the Russell 1000® Growth Index and the S&P 500® Index
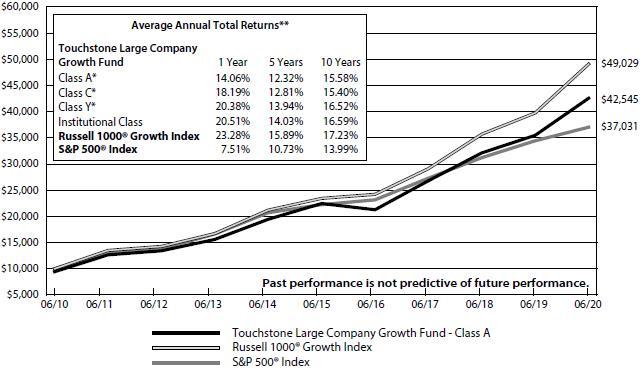
| * | The chart above represents performance of Class A shares only, which will vary from the performance of Class C shares, Class Y shares and Institutional Class shares based on the differences in sales loads and fees paid by shareholders in the different classes. The inception date of Class A shares, Class C shares and Class Y shares was August 15, 2016. Class A shares, Class C shares and Class Y shares performance information was calculated using the historical performance of Institutional Class shares for periods prior to August 15, 2016. The returns have been restated for sales loads and fees applicable to Class A, Class C and Class Y shares. |
| ** | The average annual total returns shown above are adjusted for maximum sales loads and fees, if applicable. The maximum offering price per share of Class A shares is equal to the net asset value (“NAV”) per share plus a sales load equal to 5.26% of the NAV (or 5.00% of the offering price). Class C shares are subject to a contingent deferred sales charge (“CDSC”) of 1.00%. The CDSC will be assessed on an amount equal to the lesser of (1) the NAV at the time of purchase of the shares being redeemed or (2) the NAV of such shares being redeemed, if redeemed within a one-year period from the date of purchase. Class Y shares and Institutional Class shares are not subject to sales charges. |
The performance of the above Fund does not reflect the deduction of taxes that a shareholder would pay on Fund distributions or the redemption of Fund shares.
Note to Chart
Russell 1000® Growth Index measures the performance of those Russell 1000 companies with higher price-to-book ratios and higher forecasted growth values.
The Frank Russell Company (FRC) is the source and owner of the data contained or reflected in this material and all trademarks and copyrights related thereto. The material may contain confidential information and unauthorized use, disclosure, copying, dissemination or redistribution is strictly prohibited. This is a Touchstone Investments presentation of the data, and FRC is not responsible for the formatting or configuration of this material or for any inaccuracy in the presentation thereof.
S&P 500® Index is a group of 500 widely held stocks and is commonly regarded to be representative of the large capitalization stock universe.
Management’s Discussion of Fund Performance (Unaudited)
Touchstone Ohio Tax-Free Bond Fund
Sub-Advised by Fort Washington Investment Advisors, Inc.
Investment Philosophy
The Touchstone Ohio Tax-Free Bond Fund seeks the highest level of interest income exempt from federal income and Ohio personal income tax, consistent with the protection of capital. It invests primarily in high-quality, long-term Ohio Municipal obligations.
Fund Performance
The Touchstone Ohio Tax-Free Bond Fund (Class A Shares) underperformed its benchmark, the Bloomberg Barclays Municipal Bond Index, for the 12-month period ended June 30, 2020. The Fund’s total return was 4.38 percent (calculated excluding the maximum sales charge) while the total return of the benchmark was 4.45 percent.
Market Environment
The economy showed modest growth during the first half of the fiscal year generating job growth of 200,000 per month with the unemployment rate reaching a low of 3.5 percent while inflation remained subdued. All this changed rather abruptly in March 2020 with the outbreak of the Coronavirus. The impact was nearly immediate as large portions of the economy shut down with many regions of the country (and world) effectively under shelter-in-place orders as many businesses closed completely. The impact was unprecedented, leading to a sharp drop in employment with job loss exceeding 20 million in April alone while the unemployment rate rose to 14.7 percent. By the end of the fiscal year, the economy showed signs of a rebound with employment rising by 7.5 million jobs in May and June as businesses began to reopen following the worst of the pandemic.
As the lender of last resort, the U.S. Federal Reserve Board (Fed) reacted quickly to the economic slowdown and illiquidity in the bond market by aggressively lowering interest rates on two occasions in March 2020. The rate cuts were accompanied by a number of other programs aimed at jump-starting the economy while improving market liquidity. Those programs included buying massive amounts of U.S. Treasury and mortgage-backed securities to inject liquidity into the economy. This was followed up with an unprecedented program to buy corporate bonds. In addition, the federal government stepped up to pass the CARES Act to provide stimulus aimed at supporting various sectors of the economy directly impacted by the pandemic. This included an increase in unemployment payments and an extension of benefits, loans to small businesses allowing them to pay employees and aid to municipalities and other not-for-profit entities to help cover costs associated with COVID-19. Taken together, the actions by the Fed and the government stimulus helped to stabilize both the markets and the economy though the situation remains fluid with new challenges on a near daily basis. Over the fiscal year period, U.S. Treasury yields reached all-time lows in 10- and 30-year maturities with yields declining by an average of 1.1 percent across the curve. Short maturities declined the most in reaction to the Fed actions to lower the fed funds rate to near zero. It is likely that interest rates will remain near current lows, as the Fed has committed to maintaining the fed funds at current levels through 2021.
At the beginning of the fiscal year, the municipal market was well supported as the market experienced strong investor demand with modest new issue supply. The positive tone continued until early March 2020, when concerns regarding the Coronavirus began to exert pressure on the credit markets including municipal bonds. Investors reacted negatively, withdrawing money from municipal mutual funds and more broadly exiting the market. This caused a wave of selling pressure that led to extreme bouts of volatility and general instability in the market during late March and April 2020. Gradually, investors began to recognize the value in the sector and began to buy bonds and mutual funds, which helped the market to stabilize. Over the last month of the fiscal year, investor demand turned more positive aided by maturing bonds and coupon payments, which supplied investors with fresh money to invest in municipal bonds. The positive tone that developed helped to push yields lower across the curve with yields on high quality municipal bonds declining by an average of 80 basis points (bps). The 15-20- year maturity segment performing best while wider credit spreads negatively impacted the total returns of lower rated bonds.
Portfolio Review
In managing the Fund, we put greater emphasis on high-quality Ohio municipal bonds in the 20-year maturity range, where we feel the market offers the best combination of tax-free yield and total return. We believe this strategy can help the Fund maintain a shorter duration relative to the broader market and reduce volatility associated with longer term bonds. Although the Fund underperformed during the period, this strategy worked particularly well as this maturity segment outperformed all other maturities. Higher quality bonds outperformed the broader market given the widening of credit spreads over the period. This also had a positive impact on Fund performance as the allocation to higher quality, general obligation debt in Ohio performed better than broader market general obligation bonds. In addition, specific selections in the Health Care and Education sectors, where the Fund has an overweight allocation, outperformed the broader market sectors. Despite the support of these tailwinds, the Fund slightly underperformed as a result of operating expenses incurred in managing the Fund. This presented a headwind relative to its unmanaged benchmark, an index whose performance does not reflect fees and in which investing is not possible.
Management’s Discussion of Fund Performance (Unaudited) (Continued)
No significant changes were made to the portfolio during the fiscal year period. The Fund maintained an overweight position in Health Care and Education sectors, which aided performance as specific selections within these sectors outperformed the broader Index. The Fund currently has a duration shorter than the Index, which is typical given our strategy that emphasizes bonds in 15-20 year maturities, however, we currently have cash to deploy, which has further reduced portfolio duration. We will look for opportunities in our preferred maturity range, which is likely to extend the duration slightly from the current 4.5 years.
Outlook
The macro environment remains difficult for municipalities. Revenues are down given the loss of jobs and the general decline in economic activity, which have negatively affected income and sales taxes. At the same time, costs have increased as municipalities gear up to address added expenses associated with COVID-19 and the social unrest throughout the country. These factors will weigh on budgets and force municipalities to cut costs to trim deficits. At the same time, there has been a huge amount of stimulus from both the federal government and Fed to support the economy and stabilize the markets. The CARES Act provided $150 billion in aid to municipalities and not for profit entities (hospitals and universities) to cope with the added costs associated with COVID-19. It also seems likely that additional stimulus will be forthcoming but the timing and amount remains to be seen. The state of Ohio and many individual municipalities within the State entered the downturn from a position of strength, which should help them to weather the pandemic better than many.
Valuations remain attractive in the market though absolute yields are low and reflect the low interest rate environment that is likely to last for quite a while. In managing the Fund, we continue to look for better quality credits with an emphasis in the 15-20 year maturity range, however wider credit spreads may present opportunities as well.
Management’s Discussion of Fund Performance (Unaudited) (Continued)
Comparison of the Change in Value of a $10,000 Investment in the Touchstone Ohio Tax-Free Bond Fund - Class A* and the Bloomberg Barclays Municipal Bond Index
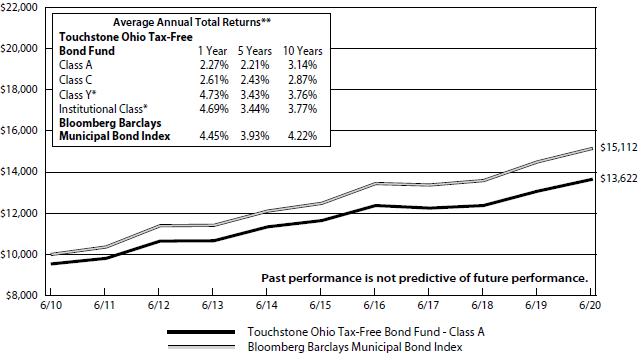
| * | The chart above represents performance of Class A shares only, which will vary from the performance of Class C shares, Class Y shares and Institutional Class shares based on the difference in sales loads and fees paid by shareholders in the different classes. The inception date of Class Y shares and Institutional Class shares was August 30, 2016. Class Y shares and Institutional Class shares performance information was calculated using the historical performance of Class A shares for the periods prior to August 30, 2016. The returns have been restated for sales loads and fees applicable to Class Y shares and Institutional Class shares. |
| ** | The average annual total returns shown above are adjusted for maximum sales loads and fees, if applicable. Effective June 30, 2020, the maximum offering price per share of Class A shares is equal to the net asset value (“NAV”) per share plus a sales load equal to 3.36% of the NAV (or 3.25% of the offering price). Prior to June 30, 2020, the maximum offering price per share of Class A shares was equal to the NAV per share plus a sales load equal to 2.04% of the NAV (or 2.00% of the offering price). Class C shares are subject to a contingent deferred sales charge (“CDSC”) of 1.00%. The CDSC will be assessed on an amount equal to the lesser of (1) the NAV at the time of purchase of the shares being redeemed or (2) the NAV of such shares being redeemed, if redeemed within a one-year period from the date of purchase. Class Y shares and Institutional Class shares are not subject to sales charges. |
The performance of the above Fund does not reflect the deduction of taxes that a shareholder would pay on Fund distributions or the redemption of Fund shares.
Note to Chart
Bloomberg Barclays Municipal Bond Index is a widely recognized unmanaged index of municipal bonds with maturities of at least one year.
Management’s Discussion of Fund Performance (Unaudited)
Touchstone Small Company Fund
Sub-Advised by Fort Washington Investment Advisors, Inc.
Investment Philosophy
The Fund seeks to provide investors with growth of capital by investing primarily in common stocks of small companies that the sub-advisor believes are high quality, have superior business models, solid management teams, sustainable growth potential and are attractively valued.
Fund Performance
The Touchstone Small Company Fund (Class A Shares) underperformed its benchmark, the Russell 2000® Index for the 12-month period ended June 30, 2020. The Fund’s total return was -10.82 percent (calculated excluding the maximum sales charge) while the total return of the benchmark was -6.63 percent.
Market Environment
Small-cap equities declined for the year ended June 30, 2020. There was significant volatility over the time period. Over the second half of calendar year 2019, we believe three factors impacted small-cap equity markets: trade tensions with China; future interest rate expectations; and the stage of the United States economic and corporate earnings cycle. Overall, small-cap corporate earnings were flat in calendar year 2019 compared to 2018. At the beginning of calendar year 2020, a potential trade deal with China was welcomed by equity markets and the U.S. Federal Reserve Board (Fed) seemed on hold after three interest rate reductions through October 2019. The economic environment seemed stable with the potential for accelerating corporate earnings growth in 2020. However, the COVID-19 global pandemic, health care crisis, and impact on the global economy roiled equity markets in the first quarter of 2020. We believe unprecedented fiscal and monetary policy action and stimulus stabilized credit and equity markets, sparking a rally in the second quarter of 2020.
From a sector perspective for the year ended June 30, 2020, there was significant divergence in performance. Health Care, Information Technology and Consumer Staples had positive returns with Health Care posting notably stronger returns. Among the most challenged sectors were Energy, Financials, and Communication Services. The Energy sector saw material weakness with strong headwinds in both supply and demand.
Portfolio Review
During the 12-month period the Fund’s underperformance versus the benchmark was primarily due to weak stock selection in the Health Care, Industrials, Consumer Staples and Consumer Discretionary sectors. Also detracting were overweight allocations to the Industrials, Consumer Staples and Consumer Discretionary sectors. This was partially offset by the Fund’s stock selection in the Communication Services, Financials, and Information Technology sectors, underweight allocations to the Energy and Financials sectors as well as an overweight to Information Technology.
Among Fund contributors were 1-800-FLOWERS.COM Inc. and TopBuild Corp. 1-800-FLOWERS.COM (Consumer Discretionary sector) is a provider of floral, gourmet food, and gift baskets for many occasions. The stock outperformed after strong December holiday sales and earnings, and its ability to operate its ecommerce business through the COVID-19 crisis. TopBuild Corp. (Consumer Discretionary sector), a provider of insulation and building products to the construction industry, outperformed as lower mortgage rates and the potential population shift from urban to suburban residential real estate could drive higher than expected future earnings.
Among the Fund’s bottom five performers were Consumer stocks. Aaron’s Inc., an operator of rent-to-own stores and a virtual lease to own product for third party retailers, underperformed due to operational challenges impacting company-owned store profitability and the uncertain economic impact of COVID-19 on its core customers. Funko Inc., a provider of pop culture consumer products, underperformed after missing its holiday sales and earnings forecasts and facing inventory management challenges. Designer Brands Inc., a leading footwear retailer in the United States and Canada, underperformed due to the impact of trade tensions and tariffs and then closure of its retail store locations due to the COVID-19 pandemic. Lastly, Chef’s Warehouse Inc., a distributor of specialty foods, underperformed due to the closure of restaurants, its core customer, the most impactful being its large exposure to the New York metro area, which suffered significantly from the impact of COVID-19. The Fund sold these four holdings.
Industrials stock selection was negative for the year and sector allocation was positive. There were no Industrials stocks in the Fund’s top five; however, there was one holding in the Fund’s bottom five. Skywest Inc., a regional airline operator, underperformed due to the COVID-19 impact on the airline industry. We believe the company’s liquidity position, including government grants and loan programs, will allow it to get through the pandemic’s impact on the airline industry and gain market share in the future.
Management’s Discussion of Fund Performance (Unaudited) (Continued)
The Information Technology sector stock selection was positive for the 12-month period and sector allocation was positive. The Fund was overweight to this outperforming sector. Three of the Fund’s top five performers were Information Technology stocks. Cerence Inc. is a provider of software to the automotive industry that powers voice interactions between automobiles, drivers and passengers, and the connected digital world. We believe the stock appreciated due to increasing investor understanding of its dominant market share and visibility into long-term secular growth well above auto industry sales. This was highlighted by the announcement of the largest contracts in the company’s history with major global auto manufacturers. Cerence was a spin-off from Nuance Communications Inc., another top five performer. Nuance is a provider of software that powers voice interactions to the Health Care and Enterprise markets. We believe the stock outperformed due to its focused execution on these attractive secular growth markets. Cogent Communications (Communication Services sector) is a provider of Internet access services and data transport through its fiber optic network to corporations and over-the-top (OTT) providers such as Netflix Inc. Work-from-home and stay-in-place orders are a boon for both corporate and OTT Internet traffic.
At the end of June, the Fund was overweight to Industrials, Health Care, Information Technology, Consumer Discretionary, and Communication Services. The Fund was underweight to Financials, Real Estate, Consumer Staples, Energy, Materials, and Utilities.
Outlook
As we look forward, the shape of the economic recovery remains uncertain and will play out unevenly across sectors, in our view. As we write this, additional “Phase 4” fiscal stimulus policy actions are anticipated in the third quarter of 2020. COVID-19 new cases and hospitalizations were in decline until mid-June, but started to increase into the end of the second quarter and start of the third quarter and seem to be flattening the economic recovery trajectory near term. We continue to place a premium on free cash flow conversion and capital deployment optionality. Those remain key to downside protection analysis, balanced against analyzing the revenue growth and profit margin recovery potential in 2021 and beyond.
Overall, we remain focused on executing our fundamental stock selection and portfolio management process. We believe that stocks experience a four stage investment cycle and our research process is focused on the dynamics that apply to each stage of the investment cycle. We believe success is driven by the ability to successfully identify a stock’s current stage and the potential for it to transition to a different stage of its investment cycle.
Management’s Discussion of Fund Performance (Unaudited) (Continued)
Comparison of the Change in Value of a $10,000 Investment in the Touchstone Small Company Fund - Class A* and the Russell 2000® Index
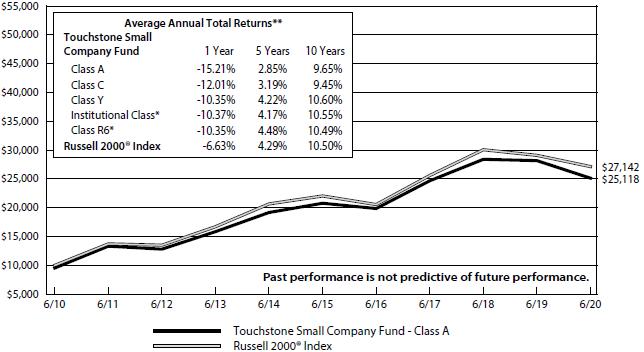
| * | The chart above represents performance of Class A shares only, which will vary from the performance of Class C shares, Class Y shares, Institutional Class shares and Class R6 shares based on the differences in sales loads and fees paid by shareholders in the different classes. The inception date of Institutional Class shares and Class R6 shares was October 30, 2017 and December 23, 2014, respectively. Institutional Class shares and Class R6 shares performance was calculated using the historical performance of Class A shares for the periods prior to October 30, 2017 and December 23, 2014, respectively. The returns have been restated for sales loads and fees applicable to Institutional Class and Class R6 shares. |
| ** | The average annual total returns shown above are adjusted for maximum sales loads and fees, if applicable. The maximum offering price per share of Class A shares is equal to the net asset value (“NAV”) per share plus a sales load equal to 5.26% of the NAV (or 5.00% of the offering price). Class C shares are subject to a contingent deferred sales charge (“CDSC”) of 1.00%. The CDSC will be assessed on an amount equal to the lesser of (1) the NAV at the time of purchase of the shares being redeemed or (2) the NAV of such shares being redeemed, if redeemed within a one-year period from the date of purchase. Class Y shares, Institutional Class shares and Class R6 shares are not subject to sales charges. |
The performance of the above Fund does not reflect the deduction of taxes that a shareholder would pay on Fund distributions or the redemption of Fund shares.
Notes to Chart
Russell 2000® Index measures the performance of the small-cap segment of the U.S. equity universe.
The Frank Russell Company (FRC) is the source and owner of the data contained or reflected in this material and all trademarks and copyrights related thereto. The material may contain confidential information and unauthorized use, disclosure, copying, dissemination or redistribution is strictly prohibited. This is a Touchstone Investments presentation of the data, and FRC is not responsible for the formatting or configuration of this material or for any inaccuracy in the presentation thereof.
Management’s Discussion of Fund Performance (Unaudited)
Touchstone Value Fund
Sub-Advised by Barrow, Hanley, Mewhinney & Strauss, LLC
Investment Philosophy
The Touchstone Value Fund seeks long-term capital growth by primarily investing in equity securities of large- and mid-cap companies believed to be undervalued. The Fund uses traditional methods of stock selection — research and analysis — to identify companies that have price-to-earnings and price-to-book ratios below the market, that also have above-average dividend yields. Stock selection is driven by fundamental analysis on individual companies rather than by broad market themes.
Fund Performance
The Touchstone Value Fund (Class A Shares) underperformed its benchmark, the Russell 1000® Value Index, for the 12-month period ended June 30, 2020. The Fund’s total return was -9.83 percent (calculated excluding the maximum sales charge), while the total return of the benchmark was -8.84 percent for the same period.
Market Environment
The market rose steadily during the second half of 2019 and through the end of February of this year. The COVID-19 pandemic and collapse in oil prices sent the market on a wild ride. The first quarter of 2020 saw the fastest 30 percent stock decline in history followed by the largest 50-day increase on record, driving the S&P 500 to its best quarter in more than two decades. Overall, the S&P 500 increased modestly over the past year, slightly below its long term average return.
The most significant driver of higher stock prices has been the U.S. Federal Reserve Board (Fed). The Fed moved rapidly to inject record amounts of liquidity into the system in an attempt to counter the depressive economic effects of the coronavirus. Stock and bond investors responded positively, as risk assets were once again bid up in equity markets and bond issuers rushed to issue record amounts of new bonds at low rates.
From a style perspective, U.S. market was dominated by growth, which outperformed value by a margin not seen since the dot-com tech bubble. This pattern of growth dominance is a long-standing phenomenon that has pushed valuation disparities to multi-decade extremes. Sector performance was mixed, with those sectors most exposed to the headwinds of COVID-19, Consumer Discretionary, Energy, and Financials, lagging the market during the quarter while Information Technology, Health Care and Consumer Staples outperformed.
Portfolio Review
During the 12-month period, the Fund’s stock selection within the Consumer Discretionary, Energy, Information Technology and Health Care sectors contributed most to relative performance. Stock selection and allocation to Industrials and Consumer Staples detracted from relative performance, as did an overweight to the Energy sector; yet the negative effect was mitigated by stock selection within the sector.
Among the individual stocks that contributed to performance were Dollar General Corp., Lowe’s, Inc. (both Consumer Discretionary sector) and Microsoft Corp. (Information Technology Sector).
Dollar General Corp. was the top contributor to performance over the past 12 months. We have long maintained that Dollar General’s business would likely strengthen in a recession and early indications are that this is what is happening, particularly as COVID-19 has driven consumers to stock up on household basics. While any period of stocking up is unlikely to last, we believe that Dollar General will continue to gain shoppers during this period, many of whom are shopping the stores for the first time. We believe earnings should grow in excess of 10 percent in 2020 and should accelerate further into 2021 and beyond.
In contrast to concerns that a slower economy would dent the home improvement market, same store sales for Lowe’s Companies, Inc. accelerated dramatically in the first half of 2020, resulting in the stock being a top contributor for the past 12 months. Lowe’s has been able to turn stronger sales into much higher margins and has capitalized on the increase of online demand in a way that they have not been able to do in years past, delivering 80 percent growth online. Despite tailwinds to home improvement that we believe will last for some time and strong evidence that Lowe’s transformation efforts are producing a permanently improved business, the stock traded at a discount to the S&P 500 versus an approximate 10 percent premium historically.
Microsoft Corp. was also a top contributor over the last 12 months as the company continued to successfully pivot to the cloud, making gains in a duopolistic cloud infrastructure business and moving away from low-return businesses. Our initial purchase was made during the Great Financial Crisis when the stock traded around 10 times earnings per share, and while we have used it consistently as a source of funds, the current valuation premium to the market made it a prime candidate for a sale to fund purchases of much less expensive businesses. Therefore, we exited the Fund’s position in the second quarter of 2020.
Management’s Discussion of Fund Performance (Unaudited) (Continued)
Among the individual stocks that detracted from performance were Sprint AeroSystems, Inc. (Industrials sector), EOG Resources, Inc. (Energy sector) and Simon Property Group, Inc. (Real Estate sector).
Spirit AeroSystems Holdings, Inc. was the largest detractor from performance over the 12-month period. The company is an aero structure manufacturer providing fuselage, wings, and nacelles, whose major customers include Boeing and Airbus. During 2019, the company was impacted by the grounding of the Boeing 737 MAX which is a large component of the company’s revenue and earnings. After consideration, the risk/reward was no longer compelling when factoring in multiple risks including the decline in new airplane deliveries due to COVID-19, the timing of the 737 MAX recertification and increasing financial leverage from acquisitions expected to close in late 2020. Accordingly, Spirit AeroSystems was eliminated from the Fund’s portfolio during the second quarter of 2020.
EOG Resources, Inc. also detracted from performance over the 12-month period due to the COVID-19-induced hit to the Energy sector. After a strong fourth quarter in 2019 for both the price of oil and the Energy sector, concerns regarding an oversupply of oil surfaced early in 2020 as new fields from offshore Norway, Brazil, and Guyana were expected to start up and add an additional 2 million barrels-per-day (bl/d) of production. Meanwhile, the U.S. was expected to increase production up to 800,000 bl/d, leaving 2020 supply in a massive surplus situation. Finally, the economic fallout from COVID-19 meant demand destruction for gasoline, diesel, jet fuel, and other refined products. Without a plan to cut production from Organization of the Petroleum Exporting Countries OPEC+ (OPEC plus Russia) or by the U.S., oil prices plummeted. Ultimately, we sold the stock in the first quarter of 2020 due to concerns over the levels of debt coming due in 2020-2021 and the outlook for production declines in both years.
Another stock negatively impacted by COVID-19 was Simon Property Group, Inc., which was a top detractor over the past 12 months. The original thesis for Simon Property was based on its strong balance sheet and $1.5 billion in annual free cash flow generation leading Simon Property to have the capital flexibility to undertake highly accretive redevelopment of its high-quality mall assets, leading to improved earnings growth. With the recent events of COVID-19, this thesis has been put on hold as they announced the indefinite closure of all assets on March 18th. When society returns to its normal course of business, the retail environment is still uncertain based on the wreckage that COVID-19 has caused. Based on our analysis, Simon Property could withstand a decline in occupancy to approximately 62 percent, from a 95 percent level pre-COVID, before they breach any debt covenants. While we believe the stock is already reflecting a significant negative outcome for Simon Property given its high-quality assets, balance sheet and liquidity strength, the length and severity of the pandemic and the economic aftermath leave many unknowns. Therefore, the stock was sold from the Fund’s portfolio during the second quarter of 2020.
There were several changes in the portfolio during the 12-month period. We continued to find attractive opportunities within the Financials sector, adding Citigroup Inc., Goldman Sachs Group, Inc. and Willis Towers Watson plc in place of State Street Corporation which was eliminated in the third quarter of 2019 after our buy thesis was compromised. Due to the decrease in oil demand and associated complications caused by the global pandemic, we reduced the Fund’s exposure to the Energy sector by eliminating BP plc, EOG Resources, Inc. and Schlumberger from the portfolio. We also increased the Fund’s allocation to the Industrials sector as the market downturn produced an attractive entry point for several names (AECOM, Quanta Services and Stanley Black & Decker, Inc.). The Fund has remained underweight the “bond proxy” sectors of Real Estate, Consumer Staples and Utilities. As a fundamental investor, our sector allocation will always be a residual of our individual stock selection process.
The largest new holdings in the portfolio were J.B. Hunt Transport Services, Inc., Stanley Black & Decker, Inc., Lennar Corporation, Goldman Sachs Group, Inc., and Deere & Company. The largest eliminated holdings were Microsoft Corp., Johnson Controls International plc, Dominion Energy, Inc., BP plc, and General Electric Company.
Outlook
The outlook for equity markets remain uncertain in these unprecedented times. The rapid rise in stock prices has left Wall Street well out in front of Main Street, where unemployment remains high (and dependent on further government stimulus), bankruptcy filings are at their fastest pace in years, and many companies are unable (unwilling) to provide any forward guidance.
One aspect of the forecast that seems likely is that the Fed will keep pumping up financial assets in the hope of fueling economic growth. Such a gargantuan level of deficit spending required bond investors to have enormous patience with mounting government debt. Given the extremely depressed conditions created by the pandemic, bond investors have (thus far) been willing to accept low interest rates and low inflation expectations. Economic recession are, of course, followed by recoveries, and unless one is willing to “fight the Fed,” the longer-term outlook for the economy and equity markets should be positive. It is for this reason, among others, that we stay fully invested in and do not try to “time the market.” Instead, we focus on a much smaller group of companies which meet our fundamental value criteria; thus, there are always opportunities, regardless of overall market conditions and valuations.
We remain confident that our conservative, defensive style of investing is a good one by focusing on undervalued companies with strong fundamentals and a meaningful and growing dividend. We believe the Fund is well positioned going forward.
Management’s Discussion of Fund Performance (Unaudited) (Continued)
Comparison of the Change in Value of a $10,000 Investment in the Touchstone Value Fund - Class A* and the Russell 1000® Value Index
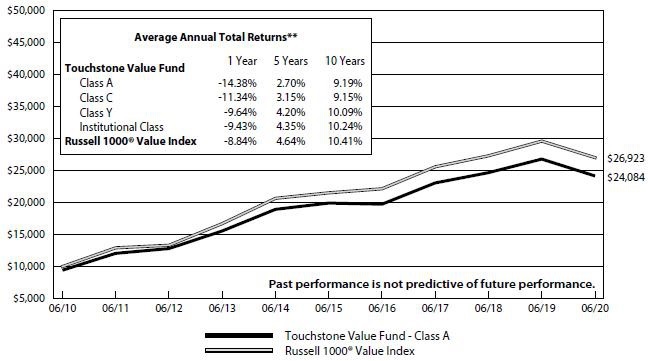
| * | The chart above represents performance of Class A shares only, which will vary from the performance of Class C shares, Class Y shares and Institutional Class shares based on the differences in sales loads and fees paid by shareholders in the different classes. |
| ** | The average annual total returns shown above are adjusted for maximum sales loads and fees, if applicable. The maximum offering price per share of Class A shares is equal to the net asset value (“NAV”) per share plus a sales load equal to 5.26% of the NAV (or 5.00% of the offering price). Class C shares are subject to a contingent deferred sales charge (“CDSC”) of 1.00%. The CDSC will be assessed on an amount equal to the lesser of (1) the NAV at the time of purchase of the shares being redeemed or (2) the NAV of such shares being redeemed, if redeemed within a one-year period from the date of purchase. Class Y shares and Institutional Class shares are not subject to sales charges. |
The performance of the above Fund does not reflect the deduction of taxes that a shareholder would pay on Fund distributions or the redemption of Fund shares.
Note to Chart
Russell 1000® Value Index measures those Russell 1000 companies with lower price-to-book ratios and lower expected growth values.
The Frank Russell Company (FRC) is the source and owner of the data contained or reflected in this material and all trademarks and copyrights related thereto. The material may contain confidential information and unauthorized use, disclosure, copying, dissemination or redistribution is strictly prohibited. This is a Touchstone Investments presentation of the data, and FRC is not responsible for the formatting or configuration of this material or for any inaccuracy in the presentation thereof.
Tabular Presentation of Portfolios of Investments (Unaudited)
June 30, 2020
The tables below provide each Fund’s geographic allocation, sector allocation and/or credit quality. We hope it will be useful to shareholders as it summarizes key information about each Fund’s investments.
| Touchstone Balanced Fund | | | |
| Credit Quality* | | (% of Fixed Income Securities) | |
| AAA/Aaa | | | 37.6 | % |
| AA/Aa | | | 6.0 | |
| A/A | | | 9.8 | |
| BBB/Baa | | | 25.1 | |
| BB/Ba | | | 9.8 | |
| B/B | | | 5.0 | |
| Not Rated | | | 6.7 | |
| | | | 100.0 | % |
| Sector Allocation** | | (% of Net Assets) | |
| Fixed Income Securities | | | 35.0 | % |
| Common Stocks | | | | |
| Information Technology | | | 17.8 | |
| Consumer Discretionary | | | 8.8 | |
| Health Care | | | 8.5 | |
| Communication Services | | | 8.5 | |
| Industrials | | | 7.6 | |
| Financials | | | 5.9 | |
| Consumer Staples | | | 2.9 | |
| Energy | | | 1.1 | |
| Materials | | | 0.5 | |
| Real Estate | | | 0.4 | |
| Exchange-Traded Fund | | | 1.4 | |
| Short-Term Investment Fund | | | 1.5 | |
| Other Assets/Liabilities (Net) | | | 0.1 | |
| Total | | | 100.0 | % |
| Touchstone International Equity Fund | | | |
| Geographic Allocation | | (% of Net Assets) | |
| Common Stocks | | | | |
| United Kingdom | | | 14.7 | % |
| Germany | | | 11.5 | |
| Switzerland | | | 9.8 | |
| France | | | 9.4 | |
| Japan | | | 7.3 | |
| Canada | | | 5.2 | |
| China | | | 4.9 | |
| South Korea | | | 3.1 | |
| India | | | 2.9 | |
| Denmark | | | 2.7 | |
| Luxembourg | | | 2.6 | |
| Hong Kong | | | 2.4 | |
| Mexico | | | 2.3 | |
| Ireland | | | 2.3 | |
| Brazil | | | 2.1 | |
| Taiwan | | | 2.0 | |
| Greece | | | 1.9 | |
| Norway | | | 1.9 | |
| United States | | | 1.5 | |
| Short-Term Investment Funds | | | 15.9 | |
| Other Assets/Liabilities (Net) | | | (6.4 | ) |
| Total | | | 100.0 | % |
| * | Credit quality ratings are from Standard & Poor’s (“S&P”) and Moody’s Investors Service (“Moody’s”). If agency ratings differ, the higher rating will be used. Where no rating has been assigned, it may be for reasons unrelated to the creditworthiness of the issuer. |
| ** | Sector classifications are based upon the Global Industry Classification Standard (GICS®). |
Tabular Presentation of Portfolios of Investments (Unaudited) (Continued)
| Touchstone International Growth Opportunities Fund | | | |
| Geographic Allocation | | (% of Net Assets) | |
| Common Stocks | | | | |
| China | | | 36.5 | % |
| Germany | | | 12.3 | |
| Switzerland | | | 10.0 | |
| France | | | 8.3 | |
| Canada | | | 6.2 | |
| United Kingdom | | | 6.1 | |
| United States | | | 5.3 | |
| Japan | | | 4.6 | |
| Israel | | | 3.9 | |
| Italy | | | 3.1 | |
| Spain | | | 2.4 | |
| Argentina | | | 1.1 | |
| Short-Term Investment Fund | | | 0.4 | |
| Other Assets/Liabilities (Net) | | | (0.2 | ) |
| Total | | | 100.0 | % |
| Touchstone International Small Cap Fund |
| Geographic Allocation | | (% of Net Assets) | |
| Common Stocks | | | | |
| Japan | | | 26.9 | % |
| United Kingdom | | | 16.6 | |
| Australia | | | 7.9 | |
| Germany | | | 7.5 | |
| Denmark | | | 5.7 | |
| Netherlands | | | 5.6 | |
| Sweden | | | 4.1 | |
| Italy | | | 3.7 | |
| France | | | 3.6 | |
| Singapore | | | 2.9 | |
| Canada | | | 2.4 | |
| Switzerland | | | 2.1 | |
| Austria | | | 1.7 | |
| Spain | | | 1.6 | |
| Luxembourg | | | 1.1 | |
| Hong Kong | | | 1.1 | |
| Ireland | | | 0.8 | |
| China | | | 0.7 | |
| Israel | | | 0.4 | |
| Argentina | | | 0.4 | |
| Belgium | | | 0.3 | |
| Norway | | | 0.2 | |
| Finland | | | 0.1 | |
| Malta | | | 0.0 | |
| Egypt | | | 0.0 | |
| Faroe Islands | | | 0.0 | |
| Liechtenstein | | | 0.0 | |
| Exchange-Traded Fund | | | 1.1 | |
| Rights | | | 0.0 | |
| Short-Term Investment Fund | | | 0.5 | |
| Other Assets/Liabilities (Net) | | | 1.0 | |
| Total | | | 100.0 | % |
Tabular Presentation of Portfolios of Investments (Unaudited) (Continued)
| Touchstone Large Cap Focused Fund | | | |
| Sector Allocation* | | (% of Net Assets) | |
| Information Technology | | | 28.7 | % |
| Communication Services | | | 17.2 | |
| Consumer Discretionary | | | 13.6 | |
| Health Care | | | 11.8 | |
| Financials | | | 10.2 | |
| Industrials | | | 9.2 | |
| Consumer Staples | | | 3.9 | |
| Energy | | | 2.5 | |
| Real Estate | | | 1.4 | |
| Materials | | | 1.0 | |
| Exchange-Traded Fund | | | 0.6 | |
| Short-Term Investment Funds | | | 0.7 | |
| Other Assets/Liabilities (Net) | | | (0.8 | ) |
| Total | | | 100.0 | % |
| Touchstone Large Cap Fund | | | |
| Sector Allocation* | | (% of Net Assets) | |
| Information Technology | | | 23.0 | % |
| Financials | | | 15.8 | |
| Consumer Discretionary | | | 15.7 | |
| Communication Services | | | 11.0 | |
| Materials | | | 9.0 | |
| Consumer Staples | | | 7.0 | |
| Industrials | | | 6.1 | |
| Health Care | | | 4.2 | |
| Real Estate | | | 2.8 | |
| Energy | | | 2.3 | |
| Short-Term Investment Fund | | | 3.6 | |
| Other Assets/Liabilities (Net) | | | (0.5 | ) |
| Total | | | 100.0 | % |
| Touchstone Large Company Growth Fund |
| Sector Allocation* | | (% of Net Assets) | |
| Information Technology | | | 47.4 | % |
| Communication Services | | | 19.7 | |
| Health Care | | | 13.8 | |
| Consumer Discretionary | | | 12.4 | |
| Financials | | | 2.7 | |
| Consumer Staples | | | 1.7 | |
| Short-Term Investment Fund | | | 2.4 | |
| Other Assets/Liabilities (Net) | | | (0.1 | ) |
| Total | | | 100.0 | % |
| Touchstone Ohio Tax-Free Bond Fund | | | |
| Credit Quality** | | (% of Fixed Income Securities) | |
| AAA/Aaa | | | 8.8 | % |
| AA/Aa | | | 70.7 | |
| A/A | | | 15.0 | |
| BBB/Baa | | | 4.7 | |
| Not Rated | | | 0.8 | |
| Total | | | 100.0 | % |
| Portfolio Allocation | | (% of Net Assets) | |
| Fixed Rate Revenue Bonds | | | 65.7 | % |
| General Obligation Bonds | | | 19.3 | |
| Pre-refunded/Escrowed to Maturity | | | 12.1 | |
| Variable Rate Demand Notes | | | 3.2 | |
| Other Assets/Liabilities (Net) | | | (0.3 | ) |
| Total | | | 100.0 | % |
| * | Sector classifications are based upon the Global Industry Classification Standard (GICS®). |
| ** | Credit quality ratings are from Standard & Poor’s (“S&P”) and Moody’s Investors Service (“Moody’s”). If agency ratings differ, the higher rating will be used. Where no rating has been assigned, it may be for reasons unrelated to the creditworthiness of the issuer. |
Tabular Presentation of Portfolios of Investments (Unaudited) (Continued)
| Touchstone Small Company Fund | | | |
| Sector Allocation* | | (% of Net Assets) | |
| Health Care | | | 22.1 | % |
| Information Technology | | | 21.7 | |
| Industrials | | | 19.9 | |
| Consumer Discretionary | | | 14.7 | |
| Financials | | | 9.1 | |
| Real Estate | | | 4.8 | |
| Communication Services | | | 3.5 | |
| Short-Term Investment Fund | | | 4.9 | |
| Other Assets/Liabilities (Net) | | | (0.7 | ) |
| Total | | | 100.0 | % |
| Touchstone Value Fund | | | |
| Sector Allocation* | | (% of Net Assets) | |
| Financials | | | 22.7 | % |
| Industrials | | | 16.3 | |
| Consumer Discretionary | | | 12.9 | |
| Health Care | | | 10.6 | |
| Information Technology | | | 10.2 | |
| Energy | | | 8.4 | |
| Materials | | | 6.8 | |
| Utilities | | | 3.4 | |
| Communication Services | | | 2.4 | |
| Real Estate | | | 2.1 | |
| Consumer Staples | | | 2.0 | |
| Short-Term Investment Fund | | | 2.3 | |
| Other Assets/Liabilities (Net) | | | (0.1 | ) |
| Total | | | 100.0 | % |
| * | Sector classifications are based upon the Global Industry Classification Standard (GICS®). |
Portfolio of Investments
Touchstone Balanced Fund – June 30, 2020
| | | | | | Market | |
| | | Shares | | | Value | |
| Common Stocks — 62.0% | | | | | | | | |
| | | | | | | | | |
| Information Technology — 17.8% | | | | | | | | |
| Accenture PLC - Class A | | | 23,766 | | | $ | 5,103,035 | |
| Apple, Inc. | | | 48,000 | | | | 17,510,400 | |
| International Business Machines Corp. | | | 15,869 | | | | 1,916,499 | |
| Microsoft Corp. | | | 89,192 | | | | 18,151,464 | |
| Oracle Corp. | | | 30,647 | | | | 1,693,860 | |
| salesforce.com, Inc.* | | | 8,675 | | | | 1,625,088 | |
| SS&C Technologies Holdings, Inc. | | | 38,795 | | | | 2,191,142 | |
| Texas Instruments, Inc. | | | 60,000 | | | | 7,618,200 | |
| Visa, Inc. - Class A | | | 53,000 | | | | 10,238,010 | |
| Workday, Inc. - Class A* | | | 17,462 | | | | 3,271,680 | |
| | | | | | | | 69,319,378 | |
| | | | | | | | | |
| Consumer Discretionary — 8.8% | | | | | | | | |
| Alibaba Group Holding Ltd. (China) ADR* | | | 14,912 | | | | 3,216,518 | |
| Amazon.com, Inc.* | | | 4,914 | | | | 13,556,842 | |
| Home Depot, Inc. (The) | | | 6,400 | | | | 1,603,264 | |
| JD.com, Inc. (China) ADR* | | | 59,294 | | | | 3,568,313 | |
| Marriott International, Inc. - Class A | | | 12,326 | | | | 1,056,708 | |
| McDonald’s Corp. | | | 20,469 | | | | 3,775,916 | |
| Starbucks Corp. | | | 43,131 | | | | 3,174,010 | |
| TJX Cos., Inc. (The) | | | 36,654 | | | | 1,853,226 | |
| Trip.com Group Ltd. (China) ADR* | | | 90,880 | | | | 2,355,610 | |
| | | | | | | | 34,160,407 | |
| | | | | | | | | |
| Health Care — 8.5% | | | | | | | | |
| Alcon, Inc. (Switzerland)* | | | 5,751 | | | | 329,647 | |
| AmerisourceBergen Corp. | | | 23,954 | | | | 2,413,845 | |
| Amgen, Inc. | | | 15,000 | | | | 3,537,900 | |
| Becton Dickinson and Co. | | | 13,000 | | | | 3,110,510 | |
| Bristol-Myers Squibb Co. | | | 52,454 | | | | 3,084,295 | |
| CVS Health Corp. | | | 10,000 | | | | 649,700 | |
| HCA Healthcare, Inc. | | | 38,268 | | | | 3,714,292 | |
| Johnson & Johnson | | | 42,167 | | | | 5,929,945 | |
| Merck & Co., Inc. | | | 31,591 | | | | 2,442,932 | |
| Stryker Corp. | | | 10,047 | | | | 1,810,369 | |
| UnitedHealth Group, Inc. | | | 20,000 | | | | 5,899,000 | |
| | | | | | | | 32,922,435 | |
| | | | | | | | | |
| Communication Services — 8.5% | | | | | | | | |
| Alphabet, Inc. - Class C* | | | 6,669 | | | | 9,427,365 | |
| AT&T, Inc. | | | 28,740 | | | | 868,810 | |
| Comcast Corp. - Class A | | | 120,000 | | | | 4,677,600 | |
| Facebook, Inc. - Class A* | | | 33,974 | | | | 7,714,476 | |
| Fox Corp. - Class A | | | 66,476 | | | | 1,782,886 | |
| Netflix, Inc.* | | | 7,763 | | | | 3,532,476 | |
| Verizon Communications, Inc. | | | 38,782 | | | | 2,138,052 | |
| Walt Disney Co. (The) | | | 24,772 | | | | 2,762,326 | |
| | | | | | | | 32,903,991 | |
| | | | | | | | | |
| Industrials — 7.6% | | | | | | | | |
| Boeing Co. (The) | | | 10,646 | | | | 1,951,412 | |
| Canadian National Railway Co. (Canada) | | | 32,000 | | | | 2,834,240 | |
| Deere & Co. | | | 10,917 | | | | 1,715,606 | |
| FedEx Corp. | | | 8,072 | | | | 1,131,856 | |
| General Dynamics Corp. | | | 14,000 | | | | 2,092,440 | |
| Honeywell International, Inc. | | | 35,000 | | | | 5,060,650 | |
| Hubbell, Inc. | | | 32,347 | | | | 4,055,020 | |
| Parker-Hannifin Corp. | | | 14,919 | | | | 2,734,205 | |
| Raytheon Technologies Corp. | | | 57,094 | | | | 3,518,132 | |
| Union Pacific Corp. | | | 7,637 | | | | 1,291,188 | |
| Verisk Analytics, Inc. | | | 20,000 | | | | 3,404,000 | |
| | | | | | | | 29,788,749 | |
| | | | | | | | | |
| Financials — 5.9% | | | | | | | | |
| American Express Co. | | | 20,384 | | | | 1,940,557 | |
| Berkshire Hathaway, Inc. - Class B* | | | 40,421 | | | | 7,215,553 | |
| CME Group, Inc. | | | 10,160 | | | | 1,651,406 | |
| Goldman Sachs Group, Inc. (The) | | | 19,828 | | | | 3,918,409 | |
| JPMorgan Chase & Co. | | | 39,000 | | | | 3,668,340 | |
| S&P Global, Inc. | | | 5,996 | | | | 1,975,562 | |
| Signature Bank/NewYork NY | | | 25,618 | | | | 2,739,077 | |
| | | | | | | | 23,108,904 | |
| | | | | | | | | |
| Consumer Staples — 2.9% | | | | | | | | |
| Kraft Heinz Co. (The) | | | 30,000 | | | | 956,700 | |
| Monster Beverage Corp.* | | | 36,008 | | | | 2,496,075 | |
| PepsiCo, Inc. | | | 8,485 | | | | 1,122,226 | |
| Philip Morris International, Inc. | | | 55,035 | | | | 3,855,752 | |
| Procter & Gamble Co. (The) | | | 12,856 | | | | 1,537,192 | |
| Unilever NV (United Kingdom) | | | 24,070 | | | | 1,282,209 | |
| | | | | | | | 11,250,154 | |
| | | | | | | | | |
| Energy — 1.1% | | | | | | | | |
| Chevron Corp. | | | 20,000 | | | | 1,784,600 | |
| Exxon Mobil Corp. | | | 38,000 | | | | 1,699,360 | |
| Schlumberger Ltd. | | | 37,700 | | | | 693,303 | |
| | | | | | | | 4,177,263 | |
| | | | | | | | | |
| Materials — 0.5% | | | | | | | | |
| Corteva, Inc. | | | 1 | | | | 27 | |
| Dow, Inc. | | | 1 | | | | 41 | |
| DuPont de Nemours, Inc. | | | 40,197 | | | | 2,135,666 | |
| | | | | | | | 2,135,734 | |
| | | | | | | | | |
| Real Estate — 0.4% | | | | | | | | |
| Jones Lang LaSalle, Inc. | | | 16,454 | | | | 1,702,331 | |
| Total Common Stocks | | | | | | $ | 241,469,346 | |
| Principal | | | | | | |
| Amount | | | | | | |
| | | | | Corporate Bonds — 16.9% | | | | |
| | | | | | | | | |
| | | | | Financials — 3.3% | | | | |
| $ | 316,000 | | | Ally Financial, Inc., 5.750%, 11/20/25 | | | 338,132 | |
| | 282,000 | | | American Financial Group, Inc., 5.250%, 4/2/30 | | | 334,913 | |
| | 386,000 | | | Ares Capital Corp., 3.250%, 7/15/25 | | | 374,618 | |
| | 355,000 | | | Bank of America Corp., 3.705%, 4/24/28 | | | 401,280 | |
| | 535,000 | | | Bank of America Corp. MTN, 4.000%, 1/22/25 | | | 590,830 | |
| | 390,000 | | | Bank of Montreal (Canada), 3.803%, 12/15/32 | | | 419,761 | |
| | 435,000 | | | Barclays PLC (United Kingdom), 4.610%, 2/15/23 | | | 458,016 | |
| | 245,000 | | | Berkshire Hathaway Finance Corp., 4.250%, 1/15/49 | | | 314,011 | |
| | 330,000 | | | Citigroup, Inc., 3.200%, 10/21/26 | | | 361,722 | |
| | 197,000 | | | Citigroup, Inc., 4.750%, 5/18/46 | | | 250,585 | |
| | 304,000 | | | Cooke Omega Investments, Inc. / Alpha VesselCo Holdings, Inc. (Canada), 144a, 8.500%, 12/15/22 | | | 302,480 | |
| | 466,000 | | | Corestates Capital III, 144a, (3M LIBOR +0.570%), 0.962%, 2/15/27(A) | | | 403,251 | |
| | 177,000 | | | Credit Acceptance Corp., 6.625%, 3/15/26 | | | 177,717 | |
| | 97,000 | | | goeasy Ltd. (Canada), 144a, 5.375%, 12/1/24 | | | 94,090 | |
| | 440,000 | | | Goldman Sachs Group, Inc. (The), (3M LIBOR +1.000%), 2.020%, 7/24/23(A) | | | 440,881 | |
| | 150,000 | | | Goldman Sachs Group, Inc. (The), 3.691%, 6/5/28 | | | 168,032 | |
| | 350,000 | | | Goldman Sachs Group, Inc. (The), 5.250%, 7/27/21 | | | 367,502 | |
| | 335,000 | | | HSBC Holdings PLC (United Kingdom), 3.900%, 5/25/26 | | | 371,922 | |
| | 280,000 | | | Huntington Bancshares, Inc., 2.550%, 2/4/30 | | | 289,445 | |
| | 413,000 | | | JPMorgan Chase & Co., 2.956%, 5/13/31 | | | 438,021 | |
| | 425,000 | | | JPMorgan Chase & Co., 3.509%, 1/23/29 | | | 474,734 | |
Touchstone Balanced Fund (Continued)
| Principal | | | | | Market | |
| Amount | | | | | Value | |
| | | | Corporate Bonds — 16.9% (Continued) | | | |
| | | | | | | |
| | | | | Financials — (Continued) | | | | |
| $ | 416,000 | | | Lloyds Banking Group PLC (United Kingdom), 3.574%, 11/7/28 | | $ | 452,134 | |
| | 276,000 | | | Mastercard, Inc., 3.300%, 3/26/27 | | | 312,596 | |
| | 470,000 | | | Morgan Stanley, 3.950%, 4/23/27 | | | 528,975 | |
| | 125,000 | | | Navient Corp., 5.500%, 1/25/23 | | | 119,844 | |
| | 45,000 | | | Navient Corp., 5.875%, 10/25/24 | | | 42,272 | |
| | 126,000 | | | Navient Corp., 7.250%, 9/25/23 | | | 123,151 | |
| | 278,000 | | | New York Life Global Funding, 144a, 3.000%, 1/10/28 | | | 307,934 | |
| | 300,000 | | | Northwestern Mutual Life Insurance Co. (The), 144a, 3.850%, 9/30/47 | | | 343,038 | |
| | 348,000 | | | NTC Capital I, Ser A, (3M LIBOR +0.520%), 1.739%, 1/15/27(A) | | | 318,840 | |
| | 370,000 | | | PNC Bank NA, 2.700%, 11/1/22 | | | 387,080 | |
| | 408,000 | | | PNC Capital Trust, (3M LIBOR +0.570%), 0.920%, 6/1/28(A) | | | 351,157 | |
| | 156,000 | | | Prime Security Services Borrower LLC / Prime Finance, Inc., 144a, 5.750%, 4/15/26 | | | 161,772 | |
| | 164,000 | | | Quicken Loans, Inc., 144a, 5.250%, 1/15/28 | | | 169,228 | |
| | 76,000 | | | Springleaf Finance Corp., 8.875%, 6/1/25 | | | 81,248 | |
| | 159,000 | | | State Street Corp., 144a, (SOFR +2.690%), 2.825%, 3/30/23(A) | | | 164,977 | |
| | 434,000 | | | Toronto-Dominion Bank (The) (Canada) MTN, 1.150%, 6/12/25 | | | 439,202 | |
| | 513,000 | | | Truist Bank, Ser A, (3M LIBOR +0.670%), 1.060%, 5/15/27(A) | | | 443,938 | |
| | 380,000 | | | Truist Financial Corp. MTN, 2.850%, 10/26/24 | | | 409,618 | |
| | 270,000 | | | Wells Fargo & Co., 4.125%, 8/15/23 | | | 293,226 | |
| | 63,000 | | | Wells Fargo & Co. MTN, 4.100%, 6/3/26 | | | 71,046 | |
| | | | | | | | 12,893,219 | |
| | | | | | | | | |
| | | | | Communication Services — 1.9% | | | | |
| | 99,000 | | | Altice France SA (France), 144a, 7.375%, 5/1/26 | | | 103,237 | |
| | 552,000 | | | AT&T, Inc., 3.800%, 3/15/22 | | | 581,192 | |
| | 18,000 | | | AT&T, Inc., 4.500%, 5/15/35 | | | 21,361 | |
| | 42,000 | | | CCO Holdings LLC / CCO Holdings Capital Corp., 144a, 4.500%, 8/15/30 | | | 42,840 | |
| | 164,000 | | | CCO Holdings LLC / CCO Holdings Capital Corp., 144a, 4.750%, 3/1/30 | | | 167,803 | |
| | 150,000 | | | CCO Holdings LLC / CCO Holdings Capital Corp., 144a, 5.125%, 5/1/27 | | | 155,190 | |
| | 334,000 | | | CCO Holdings LLC / CCO Holdings Capital Corp., 144a, 5.375%, 6/1/29 | | | 352,370 | |
| | 33,000 | | | CenturyLink, Inc., 144a, 4.000%, 2/15/27 | | | 32,051 | |
| | 102,000 | | | CenturyLink, Inc., Ser S, 6.450%, 6/15/21 | | | 104,316 | |
| | 155,000 | | | Charter Communications Operating LLC / Charter Communications Operating Capital, 6.484%, 10/23/45 | | | 204,948 | |
| | 257,000 | | | Comcast Corp., 4.000%, 3/1/48 | | | 312,505 | |
| | 152,000 | | | CommScope, Inc., 144a, 5.500%, 3/1/24 | | | 153,520 | |
| | 24,000 | | | CommScope, Inc., 144a, 7.125%, 7/1/28 | | | 23,942 | |
| | 267,000 | | | Cox Communications, Inc., 144a, 3.350%, 9/15/26 | | | 295,253 | |
| | 200,000 | | | CSC Holdings LLC, 144a, 5.750%, 1/15/30 | | | 208,300 | |
| | 148,000 | | | Deutsche Telekom International Finance BV (Germany), 8.750%, 6/15/30 | | | 231,525 | |
| | 115,000 | | | Diamond Sports Group LLC / Diamond Sports Finance Co., 144a, 5.375%, 8/15/26 | | | 83,231 | |
| | 73,000 | | | DISH DBS Corp., 5.875%, 7/15/22 | | | 74,226 | |
| | 384,000 | | | DISH DBS Corp., 6.750%, 6/1/21 | | | 391,200 | |
| | 52,000 | | | EW Scripps Co. (The), 144a, 5.125%, 5/15/25 | | | 49,400 | |
| | 254,000 | | | Front Range BidCo, Inc., 144a, 4.000%, 3/1/27 | | | 241,696 | |
| | 202,000 | | | GrubHub Holdings, Inc., 144a, 5.500%, 7/1/27 | | | 206,798 | |
| | 48,000 | | | Lamar Media Corp., 144a, 4.875%, 1/15/29 | | | 48,240 | |
| | 33,000 | | | Level 3 Financing, Inc., 5.625%, 2/1/23 | | | 33,023 | |
| | 57,000 | | | Level 3 Financing, Inc., 144a, 4.625%, 9/15/27 | | | 57,428 | |
| | 39,000 | | | Match Group, Inc., 144a, 4.625%, 6/1/28 | | | 39,341 | |
| | 27,000 | | | MDC Partners, Inc., 144a, 6.500%, 5/1/24 | | | 25,110 | |
| | 50,000 | | | Meredith Corp., 144a, 6.500%, 7/1/25 | | | 49,500 | |
| | 205,000 | | | Netflix, Inc., 4.875%, 4/15/28 | | | 219,200 | |
| | 54,000 | | | Netflix, Inc., 144a, 5.375%, 11/15/29 | | | 59,141 | |
| | 180,000 | | | Nexstar Broadcasting, Inc., 144a, 5.625%, 8/1/24 | | | 181,350 | |
| | 88,000 | | | Outfront Media Capital LLC / Outfront Media Capital Corp., 144a, 6.250%, 6/15/25 | | | 88,576 | |
| | 273,000 | | | Photo Holdings Merger Sub, Inc., 144a, 8.500%, 10/1/26 | | | 257,644 | |
| | 90,000 | | | Qualitytech LP / QTS Finance Corp., 144a, 4.750%, 11/15/25 | | | 91,846 | |
| | 20,000 | | | Sinclair Television Group, Inc., 144a, 5.125%, 2/15/27 | | | 18,200 | |
| | 34,000 | | | Sinclair Television Group, Inc., 144a, 5.625%, 8/1/24 | | | 32,640 | |
| | 115,000 | | | Sirius XM Radio, Inc., 144a, 5.500%, 7/1/29 | | | 121,051 | |
| | 181,000 | | | TEGNA, Inc., 144a, 5.000%, 9/15/29 | | | 169,447 | |
| | 138,000 | | | Telecom Italia Capital SA (Italy), 6.000%, 9/30/34 | | | 150,006 | |
| | 78,000 | | | Telecom Italia Capital SA (Italy), 6.375%, 11/15/33 | | | 87,945 | |
| | 65,000 | | | T-Mobile USA, Inc., 4.500%, 2/1/26 | | | 65,778 | |
| | 41,000 | | | T-Mobile USA, Inc., 4.750%, 2/1/28 | | | 43,312 | |
| | 444,000 | | | T-Mobile USA, Inc., 144a, 3.875%, 4/15/30 | | | 494,154 | |
| | 85,000 | | | VeriSign, Inc., 4.750%, 7/15/27 | | | 89,292 | |
| | 130,000 | | | Verizon Communications, Inc., 4.672%, 3/15/55 | | | 176,720 | |
| | 285,000 | | | Verizon Communications, Inc., 5.012%, 4/15/49 | | | 397,487 | |
| | 380,000 | | | ViacomCBS, Inc., 4.950%, 5/19/50 | | | 423,255 | |
| | | | | | | | 7,456,590 | |
| | | | | | | | | |
| | | | | Industrials — 1.8% | | | | |
| | 31,000 | | | AECOM Global II LLC / URS Fox US LP, 5.000%, 4/1/22 | | | 31,543 | |
| | 94,965 | | | Air Canada 2015-1 Class A Pass Through Trust (Canada), 144a, 3.600%, 3/15/27 | | | 86,831 | |
| | 181,000 | | | Amsted Industries, Inc., 144a, 5.625%, 7/1/27 | | | 186,656 | |
| | 355,000 | | | Bemis Co., Inc., 2.630%, 6/19/30 | | | 363,976 | |
| | 106,000 | | | Boeing Co. (The), 5.040%, 5/1/27 | | | 116,898 | |
| | 212,000 | | | Boeing Co. (The), 5.805%, 5/1/50 | | | 250,369 | |
| | 418,000 | | | Burlington Northern Santa Fe LLC, 5.750%, 5/1/40 | | | 589,677 | |
| | 50,000 | | | BWX Technologies, Inc., 144a, 4.125%, 6/30/28 | | | 49,875 | |
| | 192,000 | | | Carrier Global Corp., 144a, 3.577%, 4/5/50 | | | 188,988 | |
| | 233,000 | | | Cascades, Inc./Cascades USA, Inc. (Canada), 144a, 5.375%, 1/15/28 | | | 236,495 | |
| | 462,000 | | | CRH America Finance, Inc. (Ireland), 144a, 4.500%, 4/4/48 | | | 504,834 | |
| | 377,000 | | | Eagle Materials, Inc., 4.500%, 8/1/26 | | | 391,835 | |
| | 166,000 | | | Embraer Netherlands Finance BV (Brazil), 5.050%, 6/15/25 | | | 146,993 | |
| | 167,000 | | | Embraer Netherlands Finance BV (Brazil), 5.400%, 2/1/27 | | | 147,795 | |
| | 280,000 | | | FedEx Corp., 5.100%, 1/15/44 | | | 326,684 | |
| | 124,000 | | | Fortress Transportation & Infrastructure Investors LLC, 144a, 6.750%, 3/15/22 | | | 119,097 | |
| | 212,000 | | | General Electric Co., 4.125%, 10/9/42 | | | 202,406 | |
| | 405,000 | | | John Deere Capital Corp. MTN, 2.450%, 1/9/30 | | | 439,234 | |
| | 122,000 | | | Moog, Inc., 144a, 4.250%, 12/15/27 | | | 118,340 | |
| | 69,000 | | | New Enterprise Stone & Lime Co., Inc., 144a, 6.250%, 3/15/26 | | | 69,345 | |
| | 210,000 | | | Norfolk Southern Corp., 4.837%, 10/1/41 | | | 272,510 | |
| | 228,000 | | | Otis Worldwide Corp., 144a, 3.112%, 2/15/40 | | | 232,339 | |
| | 73,000 | | | Owens-Brockway Glass Container, Inc., 144a, 6.625%, 5/13/27 | | | 75,920 | |
Touchstone Balanced Fund (Continued)
| Principal | | | | | Market | |
| Amount | | | | | Value | |
| | | | | Corporate Bonds — 16.9% (Continued) | | | | |
| | | | | | | | | |
| | | | | Industrials — (Continued) | | | | |
| $ | 165,000 | | | Plastipak Holdings, Inc., 144a, 6.250%, 10/15/25 | | $ | 160,050 | |
| | 373,000 | | | Roper Technologies, Inc., 2.950%, 9/15/29 | | | 407,436 | |
| | 20,000 | | | Standard Industries, Inc., 144a, 5.000%, 2/15/27 | | | 20,250 | |
| | 101,000 | | | TransDigm, Inc., 144a, 6.250%, 3/15/26 | | | 100,750 | |
| | 15,000 | | | TransDigm, Inc., 144a, 8.000%, 12/15/25 | | | 15,765 | |
| | 51,000 | | | Trivium Packaging Finance BV (Netherlands), 144a, 5.500%, 8/15/26 | | | 51,446 | |
| | 330,000 | | | Vulcan Materials Co., 4.500%, 4/1/25 | | | 366,223 | |
| | 71,000 | | | WESCO Distribution, Inc., 144a, 7.250%, 6/15/28 | | | 75,082 | |
| | 50,000 | | | XPO Logistics, Inc., 144a, 6.250%, 5/1/25 | | | 52,375 | |
| | 134,000 | | | XPO Logistics, Inc., 144a, 6.750%, 8/15/24 | | | 140,378 | |
| | 460,000 | | | Xylem, Inc., 1.950%, 1/30/28 | | | 463,945 | |
| | | | | | | | 7,002,340 | |
| | | | | | | | | |
| | | | | Health Care — 1.8% | | | | |
| | 114,000 | | | Abbott Laboratories, 3.750%, 11/30/26 | | | 132,636 | |
| | 365,000 | | | AbbVie, Inc., 4.450%, 5/14/46 | | | 445,383 | |
| | 260,000 | | | AbbVie, Inc., 144a, 3.800%, 3/15/25 | | | 288,474 | |
| | 322,000 | | | AbbVie, Inc., 144a, 5.000%, 12/15/21 | | | 338,294 | |
| | 103,000 | | | Acadia Healthcare Co., Inc., 5.125%, 7/1/22 | | | 103,031 | |
| | 320,000 | | | Alcon Finance Corp. (Switzerland), 144a, 3.800%, 9/23/49 | | | 353,364 | |
| | 129,000 | | | AMN Healthcare, Inc., 144a, 5.125%, 10/1/24 | | | 129,000 | |
| | 302,000 | | | Bausch Health Cos, Inc., 144a, 6.125%, 4/15/25 | | | 306,309 | |
| | 98,000 | | | Bausch Health Cos, Inc., 144a, 6.250%, 2/15/29 | | | 98,490 | |
| | 97,000 | | | Becton Dickinson and Co., (3M LIBOR +1.030%), 1.348%, 6/6/22(A) | | | 97,247 | |
| | 193,000 | | | Becton Dickinson and Co., 4.685%, 12/15/44 | | | 237,664 | |
| | 299,000 | | | Bristol-Myers Squibb Co., 144a, 5.000%, 8/15/45 | | | 417,377 | |
| | 312,000 | | | Cigna Corp., 4.375%, 10/15/28 | | | 369,249 | |
| | 160,000 | | | CommonSpirit Health, 4.187%, 10/1/49 | | | 162,945 | |
| | 475,000 | | | CVS Health Corp., 4.300%, 3/25/28 | | | 555,545 | |
| | 230,000 | | | CVS Health Corp., 5.125%, 7/20/45 | | | 296,355 | |
| | 70,000 | | | DaVita, Inc., 5.125%, 7/15/24 | | | 71,225 | |
| | 69,000 | | | DaVita, Inc., 144a, 4.625%, 6/1/30 | | | 68,669 | |
| | 399,000 | | | DH Europe Finance II Sarl, 3.250%, 11/15/39 | | | 440,775 | |
| | 49,000 | | | Encompass Health Corp., 4.500%, 2/1/28 | | | 46,997 | |
| | 66,000 | | | HCA, Inc., 3.500%, 9/1/30 | | | 63,569 | |
| | 212,000 | | | HCA, Inc., 5.375%, 2/1/25 | | | 227,105 | |
| | 29,000 | | | Herbalife Nutrition Ltd. / HLF Financing, Inc., 144a, 7.875%, 9/1/25 | | | 29,942 | |
| | 158,000 | | | HLF Financing Sarl LLC / Herbalife International, Inc., 144a, 7.250%, 8/15/26 | | | 158,790 | |
| | 22,000 | | | LifePoint Health, Inc., 144a, 6.750%, 4/15/25 | | | 22,715 | |
| | 145,000 | | | MEDNAX, Inc., 144a, 5.250%, 12/1/23 | | | 144,275 | |
| | 320,000 | | | Mylan, Inc., 4.550%, 4/15/28 | | | 367,659 | |
| | 172,000 | | | Select Medical Corp., 144a, 6.250%, 8/15/26 | | | 173,883 | |
| | 76,000 | | | Teleflex, Inc., 4.875%, 6/1/26 | | | 78,280 | |
| | 22,000 | | | Teleflex, Inc., 144a, 4.250%, 6/1/28 | | | 22,550 | |
| | 121,000 | | | Tenet Healthcare Corp., 5.125%, 5/1/25 | | | 116,790 | |
| | 69,000 | | | Tenet Healthcare Corp., 144a, 7.500%, 4/1/25 | | | 73,399 | |
| | 410,000 | | | UnitedHealth Group, Inc., 3.500%, 8/15/39 | | | 476,761 | |
| | | | | | | | 6,914,747 | |
| | | | | | | | | |
| | | | | Consumer Staples — 1.6% | | | | |
| | 221,000 | | | Albertsons Cos, Inc. / Safeway, Inc. / New Albertsons LP / Albertsons LLC, 144a, 4.625%, 1/15/27 | | | 221,000 | |
| | 191,000 | | | American Builders & Contractors Supply Co., Inc., 144a, 4.000%, 1/15/28 | | | 185,608 | |
| | 514,000 | | | Anheuser-Busch Cos, LLC / Anheuser-Busch InBev Worldwide, Inc., (Belgium), 4.900%, 2/1/46 | | | 628,974 | |
| | 193,000 | | | Cardtronics, Inc. / Cardtronics USA, Inc., 144a, 5.500%, 5/1/25 | | | 187,210 | |
| | 185,000 | | | Carriage Services, Inc., 144a, 6.625%, 6/1/26 | | | 194,481 | |
| | 354,000 | | | Cimpress PLC (Ireland), 144a, 7.000%, 6/15/26 | | | 326,565 | |
| | 380,000 | | | Grupo Bimbo SAB de CV (Mexico), 144a, 4.500%, 1/25/22 | | | 398,060 | |
| | 475,000 | | | Imperial Brands Finance PLC (United Kingdom), 144a, 4.250%, 7/21/25 | | | 522,783 | |
| | 33,000 | | | JBS USA LUX SA / JBS USA Finance, Inc., 144a, 5.875%, 7/15/24 | | | 33,454 | |
| | 264,000 | | | JBS USA LUX SA / JBS USA Food Co. / JBS USA Finance, Inc., 144a, 5.500%, 1/15/30 | | | 270,600 | |
| | 93,000 | | | Kraft Heinz Foods Co., 144a, 3.875%, 5/15/27 | | | 97,184 | |
| | 167,000 | | | Kroger Co. (The), 5.000%, 4/15/42 | | | 210,289 | |
| | 35,000 | | | Lamb Weston Holdings, Inc., 144a, 4.875%, 5/15/28 | | | 37,083 | |
| | 400,000 | | | Mars, Inc., 144a, 3.875%, 4/1/39 | | | 481,442 | |
| | 234,000 | | | Mattel, Inc., 144a, 6.750%, 12/31/25 | | | 242,775 | |
| | 114,000 | | | Mondelez International, Inc., 3.625%, 5/7/23 | | | 122,773 | |
| | 207,000 | | | Performance Food Group, Inc., 144a, 5.500%, 6/1/24 | | | 204,930 | |
| | 26,000 | | | Performance Food Group, Inc., 144a, 6.875%, 5/1/25 | | | 26,845 | |
| | 219,000 | | | Pilgrim’s Pride Corp., 144a, 5.750%, 3/15/25 | | | 218,361 | |
| | 24,000 | | | Post Holdings, Inc., 144a, 5.000%, 8/15/26 | | | 24,090 | |
| | 121,000 | | | QVC, Inc., 4.750%, 2/15/27 | | | 117,007 | |
| | 351,000 | | | Reynolds American, Inc. (United Kingdom), 4.450%, 6/12/25 | | | 395,487 | |
| | 292,000 | | | Staples, Inc., 144a, 7.500%, 4/15/26 | | | 229,439 | |
| | 228,000 | | | Starbucks Corp., 3.350%, 3/12/50 | | | 232,212 | |
| | 107,000 | | | Superior Plus LP / Superior General Partner, Inc. (Canada), 144a, 7.000%, 7/15/26 | | | 112,082 | |
| | 210,000 | | | Sysco Corp., 5.950%, 4/1/30 | | | 263,782 | |
| | 85,000 | | | US Foods, Inc., 144a, 6.250%, 4/15/25 | | | 86,488 | |
| | 35,000 | | | Yum! Brands, Inc., 144a, 7.750%, 4/1/25 | | | 37,756 | |
| | | | | | | | 6,108,760 | |
| | | | | | | | �� | |
| | | | | Consumer Discretionary — 1.5% | | | | |
| | 197,000 | | | 1011778 BC ULC / New Red Finance, Inc. (Canada), 144a, 5.000%, 10/15/25 | | | 195,840 | |
| | 40,000 | | | Adient US LLC, 144a, 7.000%, 5/15/26 | | | 41,400 | |
| | 7,000 | | | American Axle & Manufacturing, Inc., 6.625%, 10/15/22 | | | 7,083 | |
| | 242,000 | | | Ashtead Capital, Inc. (United Kingdom), 144a, 4.375%, 8/15/27 | | | 248,742 | |
| | 137,000 | | | Avis Budget Car Rental LLC / Avis Budget Finance, Inc., 144a, 5.250%, 3/15/25 | | | 109,600 | |
| | 162,000 | | | Beacon Roofing Supply, Inc., 144a, 4.875%, 11/1/25 | | | 144,585 | |
| | 112,000 | | | Carnival Corp., 144a, 11.500%, 4/1/23 | | | 121,520 | |
| | 82,000 | | | Churchill Downs, Inc., 144a, 4.750%, 1/15/28 | | | 79,130 | |
| | 13,000 | | | Colt Merger Sub, Inc., 144a, 5.750%, 7/1/25 | | | 13,074 | |
| | 22,000 | | | Colt Merger Sub, Inc., 144a, 6.250%, 7/1/25 | | | 21,862 | |
| | 29,000 | | | Dana, Inc., 5.625%, 6/15/28 | | | 28,788 | |
| | 63,000 | | | Ford Motor Co., 9.000%, 4/22/25 | | | 68,179 | |
| | 200,000 | | | Ford Motor Credit Co. LLC, 4.271%, 1/9/27 | | | 186,438 | |
| | 190,000 | | | Ford Motor Credit Co. LLC, 4.542%, 8/1/26 | | | 180,025 | |
| | 180,000 | | | Ford Motor Credit Co. LLC, 5.584%, 3/18/24 | | | 181,746 | |
| | 200,000 | | | Ford Motor Credit Co. LLC MTN, 4.389%, 1/8/26 | | | 190,436 | |
| | 150,000 | | | General Motors Financial Co., Inc., 3.950%, 4/13/24 | | | 155,175 | |
| | 108,000 | | | Goodyear Tire & Rubber Co. (The), 5.125%, 11/15/23 | | | 103,410 | |
| | 31,000 | | | Group 1 Automotive, Inc., 5.000%, 6/1/22 | | | 30,807 | |
| | 285,000 | | | Home Depot, Inc. (The), 5.950%, 4/1/41 | | | 429,678 | |
| | 444,000 | | | Hyundai Capital America, 144a, 2.650%, 2/10/25 | | | 445,860 | |
| | 178,000 | | | JB Poindexter & Co., Inc., 144a, 7.125%, 4/15/26 | | | 179,780 | |
| | 166,000 | | | Lennar Corp., 4.750%, 4/1/21 | | | 168,005 | |
Touchstone Balanced Fund (Continued)
| Principal | | | | | Market | |
| Amount | | | | | Value | |
| | | | | Corporate Bonds — 16.9% (Continued) | | | | |
| | | | | | | | | |
| | | | | Consumer Discretionary — (Continued) | | | | |
| $ | 109,000 | | | Lennar Corp., 4.750%, 5/30/25 | | $ | 116,358 | |
| | 415,000 | | | Lowe’s Cos, Inc., 4.500%, 4/15/30 | | | 509,119 | |
| | 48,000 | | | Marriott International, Inc., 4.625%, 6/15/30 | | | 49,806 | |
| | 59,000 | | | Marriott International, Inc., 5.750%, 5/1/25 | | | 64,095 | |
| | 112,000 | | | Meritage Homes Corp., 6.000%, 6/1/25 | | | 119,164 | |
| | 27,000 | | | Meritor, Inc., 144a, 6.250%, 6/1/25 | | | 27,270 | |
| | 33,000 | | | Navistar International Corp., 144a, 9.500%, 5/1/25 | | | 35,361 | |
| | 149,000 | | | Quad/Graphics, Inc., 7.000%, 5/1/22 | | | 129,630 | |
| | 52,000 | | | Royal Caribbean Cruises Ltd., 144a, 11.500%, 6/1/25 | | | 54,259 | |
| | 54,000 | | | Sabre GLBL, Inc., 144a, 5.375%, 4/15/23 | | | 50,411 | |
| | 64,000 | | | Taylor Morrison Communities, Inc., 144a, 5.875%, 6/15/27 | | | 66,287 | |
| | 169,000 | | | Taylor Morrison Communities, Inc. / Taylor Morrison Holdings II, Inc., 144a, 5.625%, 3/1/24 | | | 173,225 | |
| | 50,000 | | | TRI Pointe Group, Inc., 5.700%, 6/15/28 | | | 50,750 | |
| | 200,000 | | | United Rentals North America, Inc., 3.875%, 11/15/27 | | | 199,500 | |
| | 222,000 | | | United Rentals North America, Inc., 5.875%, 9/15/26 | | | 232,656 | |
| | 19,000 | | | Vail Resorts, Inc., 144a, 6.250%, 5/15/25 | | | 19,879 | |
| | 394,000 | | | Walmart, Inc., 2.850%, 7/8/24 | | | 428,770 | |
| | 68,000 | | | Wyndham Hotels & Resorts, Inc., 144a, 5.375%, 4/15/26 | | | 65,450 | |
| | | | | | | | 5,723,153 | |
| | | | | | | | | |
| | | | | Information Technology — 1.3% | | | | |
| | 899,000 | | | Apple, Inc., 2.750%, 1/13/25 | | | 975,832 | |
| | 110,000 | | | Apple, Inc., 4.650%, 2/23/46 | | | 151,487 | |
| | 36,000 | | | Boxer Parent Co., Inc., 144a, 7.125%, 10/2/25 | | | 37,746 | |
| | 132,000 | | | Camelot Finance SA, 144a, 4.500%, 11/1/26 | | | 132,000 | |
| | 153,000 | | | CDK Global, Inc., 4.875%, 6/1/27 | | | 156,970 | |
| | 398,000 | | | Fiserv, Inc., 3.500%, 7/1/29 | | | 447,400 | |
| | 430,000 | | | Global Payments, Inc., 2.650%, 2/15/25 | | | 455,501 | |
| | 404,000 | | | Hewlett Packard Enterprise Co., 4.650%, 10/1/24 | | | 453,653 | |
| | 310,000 | | | Intuit, Inc., 0.950%, 7/15/25 | | | 310,671 | |
| | 52,000 | | | j2 Cloud Services LLC / j2 Global Co.-Obligor, Inc., 144a, 6.000%, 7/15/25 | | | 52,910 | |
| | 50,000 | | | Microchip Technology, Inc., 144a, 4.250%, 9/1/25 | | | 50,318 | |
| | 210,000 | | | Microsoft Corp., 3.500%, 2/12/35 | | | 256,145 | |
| | 9,000 | | | NCR Corp., 144a, 8.125%, 4/15/25 | | | 9,540 | |
| | 430,000 | | | NXP BV / NXP Funding LLC (Netherlands), 144a, 5.350%, 3/1/26 | | | 511,137 | |
| | 85,000 | | | Open Text Corp. (Canada), 144a, 3.875%, 2/15/28 | | | 81,839 | |
| | 351,000 | | | Oracle Corp., 2.650%, 7/15/26 | | | 379,670 | |
| | 155,000 | | | SS&C Technologies, Inc., 144a, 5.500%, 9/30/27 | | | 157,269 | |
| | 297,000 | | | Visa, Inc., 4.150%, 12/14/35 | | | 379,918 | |
| | 58,000 | | | Western Digital Corp., 4.750%, 2/15/26 | | | 59,940 | |
| | | | | | | | 5,059,946 | |
| | | | | | | | | |
| | | | | Real Estate — 1.1% | | | | |
| | 234,000 | | | American Homes 4 Rent LP REIT, 4.250%, 2/15/28 | | | 250,251 | |
| | 207,000 | | | CoreCivic, Inc. REIT, 5.000%, 10/15/22 | | | 202,860 | |
| | 403,000 | | | Crown Castle International Corp. REIT, 3.650%, 9/1/27 | | | 450,364 | |
| | 67,000 | | | Diversified Healthcare Trust REIT, 9.750%, 6/15/25 | | | 71,941 | |
| | 322,000 | | | Equinix, Inc. REIT, 2.900%, 11/18/26 | | | 347,090 | |
| | 107,000 | | | GEO Group, Inc. (The) REIT, 5.875%, 1/15/22 | | | 100,045 | |
| | 109,000 | | | GLP Capital LP / GLP Financing II, Inc. REIT, 5.375%, 4/15/26 | | | 119,092 | |
| | 396,000 | | | Healthcare Realty Trust, Inc. REIT, 2.400%, 3/15/30 | | | 376,762 | |
| | 311,000 | | | Iron Mountain US Holdings, Inc. REIT, 144a, 5.375%, 6/1/26 | | | 312,555 | |
| | 41,000 | | | Iron Mountain, Inc. REIT, 5.750%, 8/15/24 | | | 41,394 | |
| | 103,000 | | | Iron Mountain, Inc. REIT, 144a, 5.250%, 7/15/30 | | | 101,455 | |
| | 207,000 | | | MGM Growth Properties Operating Partnership LP / MGP Finance Co.-Issuer, Inc. REIT, 5.625%, 5/1/24 | | | 214,249 | |
| | 288,000 | | | Mid-America Apartments LP, REIT, 3.750%, 6/15/24 | | | 309,865 | |
| | 141,000 | | | MPT Operating Partnership LP / MPT Finance Corp. REIT, 5.250%, 8/1/26 | | | 146,288 | |
| | 296,000 | | | Realty Income Corp. REIT, 3.250%, 1/15/31 | | | 320,244 | |
| | 149,000 | | | Sabra Health Care LP REIT, 5.125%, 8/15/26 | | | 151,066 | |
| | 29,000 | | | SBA Communications Corp. REIT, 144a, 3.875%, 2/15/27 | | | 28,891 | |
| | 147,000 | | | STORE Capital Corp. REIT, 4.500%, 3/15/28 | | | 149,757 | |
| | 250,000 | | | STORE Capital Corp. REIT, 4.625%, 3/15/29 | | | 255,631 | |
| | 487,000 | | | VEREIT Operating Partnership LP REIT, 4.600%, 2/6/24 | | | 519,584 | |
| | | | | | | | 4,469,384 | |
| | | | | | | | | |
| | | | | Utilities — 1.0% | | | | |
| | 258,000 | | | American Water Capital Corp., 6.593%, 10/15/37 | | | 384,584 | |
| | 141,000 | | | Calpine Corp., 144a, 5.250%, 6/1/26 | | | 142,369 | |
| | 20,000 | | | Clearway Energy Operating LLC, 144a, 4.750%, 3/15/28 | | | 20,399 | |
| | 84,000 | | | DPL, Inc., 4.350%, 4/15/29 | | | 85,082 | |
| | 22,000 | | | DPL, Inc., 144a, 4.125%, 7/1/25 | | | 22,006 | |
| | 452,000 | | | DTE Energy Co. Ser D, 3.700%, 8/1/23 | | | 485,670 | |
| | 237,000 | | | Duke Energy Progress LLC, 4.150%, 12/1/44 | | | 289,272 | |
| | 238,000 | | | Edison International, 4.125%, 3/15/28 | | | 251,726 | |
| | 388,000 | | | Electricite de France SA (France), 144a, 4.500%, 9/21/28 | | | 451,799 | |
| | 76,000 | | | Oncor Electric Delivery Co. LLC, 3.800%, 9/30/47 | | | 92,581 | |
| | 577,000 | | | Pacific Gas and Electric Co., 3.500%, 8/1/50 | | | 557,659 | |
| | 125,000 | | | PacifiCorp., 5.750%, 4/1/37 | | | 171,508 | |
| | 19,000 | | | PG&E Corp., 5.250%, 7/1/30 | | | 19,108 | |
| | 65,000 | | | Rockpoint Gas Storage Canada Ltd. (Canada), 144a, 7.000%, 3/31/23 | | | 59,569 | |
| | 145,000 | | | Talen Energy Supply LLC, 144a, 7.250%, 5/15/27 | | | 144,275 | |
| | 68,000 | | | Talen Energy Supply LLC, 144a, 7.625%, 6/1/28 | | | 68,000 | |
| | 277,000 | | | Virginia Electric & Power Co., 3.300%, 12/1/49 | | | 306,977 | |
| | 745,000 | | | WEC Energy Group, Inc., (3M LIBOR +2.113%), 2.505%, 5/15/67(A) | | | 588,550 | |
| | | | | | | | 4,141,134 | |
| | | | | | | | | |
| | | | | Energy — 1.0% | | | | |
| | 375,000 | | | Aker BP ASA (Norway), 144a, 3.000%, 1/15/25 | | | 365,218 | |
| | 202,000 | | | Boardwalk Pipelines LP, 4.450%, 7/15/27 | | | 212,135 | |
| | 270,000 | | | Canadian Natural Resources Ltd. (Canada), 6.250%, 3/15/38 | | | 321,120 | |
| | 280,000 | | | Cenovus Energy, Inc. (Canada), 5.250%, 6/15/37 | | | 242,135 | |
| | 350,000 | | | Cheniere Corpus Christi Holdings LLC, 7.000%, 6/30/24 | | | 398,209 | |
| | 116,000 | | | Delek Logistics Partners LP / Delek Logistics Finance Corp., 6.750%, 5/15/25 | | | 107,300 | |
| | 10,000 | | | Endeavor Energy Resources LP / EER Finance, Inc., 144a, 6.625%, 7/15/25 | | | 10,078 | |
| | 243,000 | | | Energy Transfer Partners LP, 4.950%, 6/15/28 | | | 260,956 | |
| | 121,000 | | | Genesis Energy LP / Genesis Energy Finance Corp., 6.000%, 5/15/23 | | | 108,900 | |
| | 154,000 | | | Montage Resources Corp., 8.875%, 7/15/23 | | | 121,660 | |
| | 449,000 | | | MPLX LP, (3M LIBOR +0.900%), 1.213%, 9/9/21(A) | | | 445,441 | |
| | 6,000 | | | Murphy Oil Corp., 6.375%, 12/1/42 | | | 4,655 | |
| | 89,000 | | | NGPL PipeCo LLC, 144a, 7.768%, 12/15/37 | | | 108,624 | |
| | 277,000 | | | NuStar Logistics LP, 5.625%, 4/28/27 | | | 267,305 | |
| | 49,000 | | | Occidental Petroleum Corp., 4.200%, 3/15/48 | | | 33,183 | |
| | 77,000 | | | Occidental Petroleum Corp., 8.500%, 7/15/27 | | | 76,904 | |
Touchstone Balanced Fund (Continued)
| Principal | | | | | Market | |
| Amount | | | | | Value | |
| | | | | Corporate Bonds — 16.9% (Continued) | | | | |
| | | | | | | | | |
| | | | | Energy — (Continued) | | | | |
| $ | 96,000 | | | ONEOK, Inc., 6.350%, 1/15/31 | | $ | 112,374 | |
| | 206,000 | | | PDC Energy, Inc., 5.750%, 5/15/26 | | | 187,460 | |
| | 70,000 | | | Sunoco LP / Sunoco Finance Corp., 6.000%, 4/15/27 | | | 69,300 | |
| | 158,000 | | | Tallgrass Energy Partners LP / Tallgrass Energy Finance Corp., 144a, 5.500%, 9/15/24 | | | 142,685 | |
| | 169,000 | | | TerraForm Power Operating LLC, 144a, 4.750%, 1/15/30 | | | 171,535 | |
| | | | | | | | 3,767,177 | |
| | | | | | | | | |
| | | | | Materials — 0.6% | | | | |
| | 229,000 | | | Alcoa Nederland Holding BV, 144a, 7.000%, 9/30/26 | | | 234,725 | |
| | 13,000 | | | Arconic Corp., 144a, 6.000%, 5/15/25 | | | 13,439 | |
| | 250,000 | | | Braskem America Finance Co. (Brazil), 144a, 7.125%, 7/22/41 | | | 255,675 | |
| | 87,000 | | | Commercial Metals Co., 5.750%, 4/15/26 | | | 89,175 | |
| | 113,000 | | | CVR Partners LP / CVR Nitrogen Finance Corp., 144a, 9.250%, 6/15/23 | | | 110,740 | |
| | 280,000 | | | Ecolab, Inc., 4.800%, 3/24/30 | | | 354,810 | |
| | 76,000 | | | FMG Resources August 2006 Pty Ltd. (Australia), 144a, 4.750%, 5/15/22 | | | 77,465 | |
| | 172,000 | | | Freeport-McMoRan, Inc., 3.875%, 3/15/23 | | | 172,000 | |
| | 251,000 | | | Freeport-McMoRan, Inc., 5.000%, 9/1/27 | | | 252,177 | |
| | 101,000 | | | Hudbay Minerals, Inc. (Peru), 144a, 7.625%, 1/15/25 | | | 95,950 | |
| | 22,000 | | | Minerals Technologies, Inc., 144a, 5.000%, 7/1/28 | | | 22,330 | |
| | 106,000 | | | Novelis Corp., 144a, 5.875%, 9/30/26 | | | 105,867 | |
| | 114,000 | | | Nufarm Australia Ltd. / Nufarm Americas, Inc. (Australia), 144a, 5.750%, 4/30/26 | | | 110,010 | |
| | 398,000 | | | Sherwin-Williams Co. (The), 4.500%, 6/1/47 | | | 484,515 | |
| | 15,000 | | | WR Grace & Co., 144a, 4.875%, 6/15/27 | | | 15,195 | |
| | | | | | | | 2,394,073 | |
| | | | | Total Corporate Bonds | | $ | 65,930,523 | |
| | | | | | | | | |
| | | | | U.S. Treasury Obligations — 8.0% | | | | |
| | 1,975,000 | | | U.S. Treasury Bond, 1.250%, 5/15/50 | | | 1,897,620 | |
| | 795,000 | | | U.S. Treasury Bond, 2.000%, 2/15/50 | | | 910,461 | |
| | 2,435,000 | | | U.S. Treasury Bond, 2.250%, 8/15/49 | | | 2,928,373 | |
| | 8,930,000 | | | U.S. Treasury Note, 0.375%, 3/31/22 | | | 8,961,743 | |
| | 266,000 | | | U.S. Treasury Note, 0.625%, 5/15/30 | | | 265,262 | |
| | 1,225,000 | | | U.S. Treasury Note, 1.500%, 10/31/24 | | | 1,291,275 | |
| | 9,570,000 | | | U.S. Treasury Note, 1.500%, 11/30/24 | | | 10,095,976 | |
| | 4,890,000 | | | U.S. Treasury Note, 1.750%, 12/31/20 | | | 4,927,821 | |
| | | | | Total U.S. Treasury Obligations | | $ | 31,278,531 | |
| | | | | | | | | |
| | | | | Asset-Backed Securities — 3.6% | | | | |
| | 388,436 | | | Adams Outdoor Advertising LP, Ser 2018-1, Class A, 144a, 4.810%, 11/15/48 | | | 394,875 | |
| | 250,000 | | | Apidos CLO XVIII (Cayman Islands), Ser 2015-23A, Class AR, 144a, (3M LIBOR + 1.220%), 2.821%, 4/15/33(A) | | | 243,323 | |
| | 450,000 | | | Apidos CLO XVIII (Cayman Islands), Ser 2018-18A, Class A1, 144a, (3M LIBOR + 1.140%), 2.238%, 10/22/30(A) | | | 440,117 | |
| | 575,000 | | | Benefit Street Partners CLO XIX Ltd. (Cayman Islands), Ser 2019-19A, Class B, 144a, (3M LIBOR + 2.000%), 3.878%, 1/15/33(A) | | | 554,052 | |
| | 465,000 | | | CIFC Funding Ltd. (Cayman Islands), Ser 2016-1A, Class A1R, 144a, (3M LIBOR + 1.350%), 2.459%, 10/21/31(A) | | | 454,785 | |
| | 193,050 | | | Domino’s Pizza Master Issuer LLC, Ser 2017-1A, Class A2II, 144a, 3.082%, 7/25/47 | | | 197,177 | |
| | 864,063 | | | Driven Brands Funding LLC, Ser 2019-1A, Class A2, 144a, 4.641%, 4/20/49 | | | 914,161 | |
| | 730,183 | | | Elara HGV Timeshare Issuer LLC, Ser 2019-A, Class B, 144a, 2.910%, 1/25/34 | | | 671,855 | |
| | 489,173 | | | GLS Auto Receivables Issuer Trust, Ser 2019-3A, Class A, 144a, 2.580%, 7/17/23 | | | 494,464 | |
| | 910,000 | | | Hertz Vehicle Financing II LP, Ser 2016-2A, Class B, 144a, 3.940%, 3/25/22 | | | 872,525 | |
| | 1,082,686 | | | Hertz Vehicle Financing II LP, Ser 2016-4A, Class A, 144a, 2.650%, 7/25/22 | | | 1,065,945 | |
| | 696,500 | | | Jack In The Box Funding LLC, Ser 2019-1A, Class A2I, 144a, 3.982%, 8/25/49 | | | 717,722 | |
| | 378,000 | | | Jersey Mike’s Funding, Ser 2019-1A, Class A2, 144a, 4.433%, 2/15/50 | | | 372,039 | |
| | 826,625 | | | Jimmy Johns Funding LLC, Ser 2017-1A, Class A2I, 144a, 3.610%, 7/30/47 | | | 810,779 | |
| | 291,083 | | | Kabbage Funding LLC, Ser 2019-1, Class A, 144a, 3.825%, 3/15/24 | | | 287,316 | |
| | 850,000 | | | Madison Park Funding XXXV Ltd. (Cayman Islands), Ser 2015-18A, Class BR, 144a, (3M LIBOR + 1.600%), 2.709%, 10/21/30(A) | | | 821,828 | |
| | 465,000 | | | Madison Park Funding XXXV Ltd. (Cayman Islands), Ser 2019-35A, Class A2A, 144a, (3M LIBOR + 1.650%), 2.785%, 4/20/31(A) | | | 459,466 | |
| | 575,000 | | | OHA Loan Funding Ltd. (Cayman Islands), Ser 2015-1A, Class B1R2, 144a, (3M LIBOR + 1.900%), 2.292%, 11/15/32(A) | | | 562,524 | |
| | 915,000 | | | STWD Ltd. (Cayman Islands), Ser 2019-FL1, Class A, 144a, (1M LIBOR + 1.080%), 1.265%, 7/15/38(A) | | | 894,787 | |
| | 640,808 | | | Towd Point Mortgage Trust, Ser 2019-1, Class A1, 144a, 3.750%, 3/25/58(A)(B) | | | 689,779 | |
| | 465,000 | | | Voya CLO Ltd. (Cayman Islands), Ser 2019-2A, Class A, 144a, (3M LIBOR + 1.270%), 2.405%, 7/20/32(A) | | | 455,253 | |
| | 1,316,250 | | | Wendy’s Funding LLC, Ser 2018-1A, Class A2I, 144a, 3.573%, 3/15/48 | | | 1,364,227 | |
| | 360,000 | | | Westlake Automobile Receivables Trust, Ser 2017-1A, Class E, 144a, 5.050%, 8/15/24 | | | 361,305 | |
| | | | | Total Asset-Backed Securities | | $ | 14,100,304 | |
| | | | | | | | | |
| | | | | U.S. Government Mortgage-Backed Obligations — 3.2% | | | | |
| | 2,686 | | | FHLMC, Pool #G08062, 5.000%, 6/1/35 | | | 3,083 | |
| | 379,268 | | | FHLMC, Pool #G08637, 4.000%, 4/1/45 | | | 409,730 | |
| | 68 | | | FHLMC, Pool #G18091, 6.000%, 12/1/20 | | | 68 | |
| | 4,250 | | | FHLMC, Pool #P00020, 6.500%, 10/1/22 | | | 4,265 | |
| | 1,778,158 | | | FHLMC, Pool #Q02664, 4.500%, 8/1/41 | | | 1,977,650 | |
| | 2,673,946 | | | FHLMC, Pool #Q29056, 4.000%, 10/1/44 | | | 2,908,849 | |
| | 1,282,507 | | | FHLMC, Pool #Q29260, 4.000%, 10/1/44 | | | 1,407,142 | |
| | 30 | | | FNMA, Pool #687301, 6.000%, 11/1/32 | | | 33 | |
| | 1,122 | | | FNMA, Pool #690305, 5.500%, 3/1/33 | | | 1,235 | |
| | 514,645 | | | FNMA, Pool #725423, 5.500%, 5/1/34 | | | 590,241 | |
| | 472,916 | | | FNMA, Pool #725610, 5.500%, 7/1/34 | | | 541,797 | |
| | 62,537 | | | FNMA, Pool #748895, 6.000%, 12/1/33 | | | 67,059 | |
| | 253,023 | | | FNMA, Pool #AD9193, 5.000%, 9/1/40 | | | 289,372 | |
| | 617,243 | | | FNMA, Pool #AH8925, 4.500%, 3/1/41 | | | 686,833 | |
| | 336,708 | | | FNMA, Pool #AL5718, 3.500%, 9/1/44 | | | 368,057 | |
| | 510,703 | | | FNMA, Pool #AR9195, 3.000%, 3/1/43 | | | 552,234 | |
| | 1,458,253 | | | FNMA, Pool #BC1809, 3.500%, 5/1/46 | | | 1,559,518 | |
| | 910,716 | | | GNMA, Pool #5175, 4.500%, 9/20/41 | | | 1,000,347 | |
| | | | | Total U.S. Government Mortgage-Backed Obligations | | $ | 12,367,513 | |
| | | | | | | | | |
| | | | | Non-Agency Collateralized Mortgage Obligations — 1.6% | | | | |
| | 403,520 | | | Agate Bay Mortgage Trust, Ser 2013-1, Class B3, 144a, 3.604%, 7/25/43(A)(B) | | | 403,135 | |
Touchstone Balanced Fund (Continued)
| Principal | | | | | Market | |
| Amount | | | | | Value | |
| | | | | Non-Agency Collateralized Mortgage Obligations — 1.6% (Continued) | | | | |
| $ | 866,350 | | | Agate Bay Mortgage Trust, Ser 2015-4, Class B2, 144a, 3.571%, 6/25/45(A)(B) | | $ | 871,891 | |
| | 743,945 | | | Agate Bay Mortgage Trust, Ser 2015-7, Class B1, 144a, 3.746%, 10/25/45(A)(B) | | | 765,535 | |
| | 755,679 | | | CSMC Trust, Ser 2013-IVR3, Class B2, 144a, 3.435%, 5/25/43(A)(B) | | | 756,229 | |
| | 699,307 | | | CSMC Trust, Ser 2015-1, Class B3, 144a, 3.944%, 1/25/45(A)(B) | | | 692,815 | |
| | 790,593 | | | CSMC Trust, Ser 2015-WIN1, Class B3, 144a, 3.861%, 12/25/44(A)(B) | | | 788,575 | |
| | 648,322 | | | CSMC Trust, Ser 2018-RPL9, Class A, 144a, 3.850%, 9/25/57(A)(B) | | | 688,058 | |
| | 739,682 | | | JP Morgan Mortgage Trust, Ser 2017-1, Class B2, 144a, 3.520%, 1/25/47(A)(B) | | | 745,614 | |
| | 589,629 | | | Sequoia Mortgage Trust, Ser 2015-2, Class A19, 144a, 3.500%, 5/25/45(A)(B) | | | 610,165 | |
| | | | | Total Non-Agency Collateralized Mortgage Obligations | | $ | 6,322,017 | |
| | | | | | Shares | | | | |
| Exchange-Traded Fund — 1.4% | | | | | | |
| | | | | iShares JP Morgan USD Emerging Markets Bond ETF | | | 49,202 | | | $ | 5,373,842 | |
| Principal | | | | | | |
| Amount | | | | | | |
| | | | | Commercial Mortgage-Backed Securities — 1.1% | | | | |
| $ | 825,000 | | | BANK, Ser 2018-BN14, Class A3, 3.966%, 9/15/60 | | | 956,494 | |
| | 915,000 | | | BHMS, Ser 2018-ATLS, Class A, 144a, (1M LIBOR + 1.250%), 1.435%, 7/15/35(A) | | | 866,899 | |
| | 700,000 | | | GS Mortgage Securities Trust, Ser 2017-FARM, Class B, 144a, 3.659%, 1/10/43(A)(B) | | | 733,169 | |
| | 500,000 | | | JP Morgan Chase Commercial Mortgage Securities Trust, Ser 2018-MINN, Class A, 144a, (1M LIBOR + 1.020%), 2.020%, 11/15/35(A) | | | 465,799 | |
| | 825,000 | | | SG Commercial Mortgage Securities Trust, Ser 2019-787E, Class A, 144a, 4.163%, 2/15/41 | | | 879,546 | |
| | 278,624 | | | Wells Fargo Commercial Mortgage Trust, Ser 2018-BXI, Class C, 144a, (1M LIBOR + 1.156%), 1.341%, 12/15/36(A) | | | 269,760 | |
| | | | | Total Commercial Mortgage-Backed Securities | | $ | 4,171,667 | |
| | | | | | | | | |
| | | | | Agency Collateralized Mortgage Obligations — 0.5% | | | | |
| | 902,511 | | | FHLMC REMIC, Ser 3859, Class JB, 5.000%, 5/15/41 | | | 1,019,266 | |
| | 500,349 | | | GNMA, Ser 2010-169, Class AW, 4.500%, 12/20/40 | | | 552,784 | |
| | 7,177,183 | | | GNMA, Ser 2012-147, Class IO, 0.559%, 4/16/54(A)(B)(C) | | | 215,827 | |
| | | | | Total Agency Collateralized Mortgage Obligations | | $ | 1,787,877 | |
| | | | | | | | | |
| | | | | Sovereign Government Obligations — 0.1% | | | | |
| | 238,000 | | | Colombia Government International Bond, 5.000%, 6/15/45 | | | 269,535 | |
| | 200,000 | | | Mexico Government International Bond, 4.500%, 1/31/50 | | | 206,300 | |
| | | | | Total Sovereign Government Obligations | | $ | 475,835 | |
| | | | | | Market | |
| | | Shares | | | Value | |
| Short-Term Investment Fund — 1.5% | | | | | | | | |
| Dreyfus Government Cash Management, Institutional Shares, 0.09%∞Ω | | | 5,675,351 | | | $ | 5,675,351 | |
| | | | | | | | | |
| Total Investment Securities — 99.9% | | | | | | | | |
| (Cost $262,806,592) | | | | | | $ | 388,952,806 | |
| | | | | | | | | |
| Other Assets in Excess of Liabilities — 0.1% | | | | | | | 440,073 | |
| Net Assets — 100.0% | | | | | | $ | 389,392,879 | |
| (A) | Variable rate security - Rate reflected is the rate in effect as of June 30, 2020. |
| | | |
| (B) | Certain variable rate securities are not based on a published reference rate and spread but are determined by the issuer or agent and are based on current market conditions. These securities do not indicate a reference rate and spread in their description. |
| | | |
| (C) | Interest only security - This type of security represents the right to receive the monthly interest payments on an underlying pool of mortgages. Payments of principal on the pool reduce the value of the “interest only” holding. |
| | | |
| * | Non-income producing security. |
| | | |
| ∞ | Open-End Fund. |
| | | |
| Ω | Represents the 7-day SEC yield as of June 30, 2020. |
Portfolio Abbreviations:
ADR - American Depositary Receipt
CLO - Collateralized Loan Obligation
ETF - Exchange-Traded Fund
FHLMC - Federal Home Loan Mortgage Corporation
FNMA - Federal National Mortgage Association
GNMA - Government National Mortgage Association
LIBOR - London Interbank Offered Rate
LLC - Limited Liability Company
LP - Limited Partnership
MTN - Medium Term Note
PLC - Public Limited Company
REIT - Real Estate Investment Trust
REMIC - Real Estate Mortgage Investment Conduit
SOFR - Secured Overnight Financing Rate
USD - United States Dollar
144a - This is a restricted security that was sold in a transaction qualifying for the exemption under Rule 144a of the Securities Act of 1933. This security may be sold in transactions exempt from registration, normally to qualified institutional buyers. At June 30, 2020, these securities were valued at $44,999,294 or 11.6% of net assets. These securities were deemed liquid pursuant to procedures approved by the Board of Trustees.
Touchstone Balanced Fund (Continued)
Other Information:
The inputs or methodology used for valuing securities may not be an indication of the risk associated with investing in those securities. For more information on valuation inputs, and their aggregation into the levels used in the table below, please refer to the security valuation section in the accompanying Notes to Financial Statements.
| Valuation inputs at Reporting Date: |
| Description | | Level 1 | | | Level 2 | | | Level 3 | | | Total | |
| Asset: | | | | | | | | | | | | | | | | |
| Common Stocks | | $ | 241,469,346 | | | $ | — | | | $ | — | | | $ | 241,469,346 | |
| Corporate Bonds | | | — | | | | 65,930,523 | | | | — | | | | 65,930,523 | |
| U.S. Treasury Obligations | | | — | | | | 31,278,531 | | | | — | | | | 31,278,531 | |
| Asset-Backed Securities | | | — | | | | 14,100,304 | | | | — | | | | 14,100,304 | |
| U.S. Government Mortgage-Backed Obligations | | | — | | | | 12,367,513 | | | | — | | | | 12,367,513 | |
| Non-Agency Collateralized Mortgage Obligations | | | — | | | | 6,322,017 | | | | — | | | | 6,322,017 | |
| Exchange-Traded Fund | | | 5,373,842 | | | | — | | | | — | | | | 5,373,842 | |
| Commercial Mortgage-Backed Securities | | | — | | | | 4,171,667 | | | | — | | | | 4,171,667 | |
| Agency Collateralized Mortgage Obligations | | | — | | | | 1,787,877 | | | | — | | | | 1,787,877 | |
| Sovereign Government Obligations | | | — | | | | 475,835 | | | | — | | | | 475,835 | |
| Short-Term Investment Fund | | | 5,675,351 | | | | — | | | | — | | | | 5,675,351 | |
| Other Financial Instruments* | | | | | | | | | | | | | | | | |
| Futures Interest Rate Contracts | | | 27,555 | | | | — | | | | — | | | | 27,555 | |
| Total Assets | | $ | 252,546,094 | | | $ | 136,434,267 | | | $ | — | | | $ | 388,980,361 | |
| Liabilities: | | | | | | | | | | | | | | | | |
| Other Financial Instruments* | | | | | | | | | | | | | | | | |
| Futures Interest Rate Contracts | | $ | (8,625 | ) | | $ | — | | | $ | — | | | $ | (8,625 | ) |
| Total | | $ | 252,537,469 | | | $ | 136,434,267 | | | $ | — | | | $ | 388,971,736 | |
*Other Financial Instruments are derivative instruments not reflected in total investments. Amounts shown represents unrealized appreciation (depreciation) on futures interest rate contracts.
Futures Contracts
At June 30, 2020, $127,016 was segregated with the broker as collateral for futures contracts. The Fund had the following futures contracts, brokered by Wells Fargo, open at June 30, 2020:
| | | | | | | | | | | Unrealized | |
| | | | | Number of | | | | | | Appreciation/ | |
| Description | | Expiration Date | | Contracts | | | Notional Value | | | (Depreciation) | |
| Short Futures: | | | | | | | | | | | | | | |
| Ultra Long U.S. Treasury Bond Futures | | 09/21/2020 | | | 18 | | | $ | 3,918,136 | | | $ | (8,625 | ) |
| | | | | | | | | | | | | | | |
| Long Futures: | | | | | | | | | | | | | | |
| 5-Year U.S. Treasury Note Futures | | 09/30/2020 | | | 134 | | | | 16,822,256 | | | | 27,555 | |
| | | | | | | | | | | | | | | |
| | | | | | | | | | | | | $ | 18,930 | |
See accompanying Notes to Financial Statements.
Portfolio of Investments
Touchstone International Equity Fund – June 30, 2020
| | | | | | Market | |
| | | Shares | | | Value | |
| Common Stocks — 90.5% | | | | | | | | |
| | | | | | | | | |
| United Kingdom — 14.7% | | | | | | | | |
| | | | | | | | | |
| Consumer Discretionary — 3.4% | | | | | | | | |
| Compass Group PLC | | | 190,000 | | | $ | 2,614,107 | |
| InterContinental Hotels Group PLC | | | 32,500 | | | | 1,434,717 | |
| | | | | | | | | |
| Consumer Staples — 1.7% | | | | | | | | |
| Reckitt Benckiser Group PLC | | | 22,000 | | | | 2,023,965 | |
| | | | | | | | | |
| Health Care — 2.6% | | | | | | | | |
| ConvaTec Group PLC, 144a | | | 1,250,000 | | | | 3,018,869 | |
| | | | | | | | | |
| Industrials — 2.5% | | | | | | | | |
| Bunzl PLC | | | 110,000 | | | | 2,950,541 | |
| | | | | | | | | |
| Information Technology — 1.8% | | | | | | | | |
| Spectris PLC | | | 68,000 | | | | 2,123,815 | |
| | | | | | | | | |
| Real Estate — 2.7% | | | | | | | | |
| Foxtons Group PLC* | | | 1,750,000 | | | | 834,844 | |
| Savills PLC | | | 225,000 | | | | 2,294,773 | |
| Total United Kingdom | | | | | | | 17,295,631 | |
| | | | | | | | | |
| Germany — 11.5% | | | | | | | | |
| | | | | | | | | |
| Health Care — 3.4% | | | | | | | | |
| Fresenius SE & Co. KGaA* | | | 80,000 | | | | 3,976,231 | |
| | | | | | | | | |
| Industrials — 5.2% | | | | | | | | |
| Brenntag AG | | | 66,000 | | | | 3,499,327 | |
| Norma Group SE | | | 101,000 | | | | 2,703,473 | |
| | | | | | | | | |
| Information Technology — 2.9% | | | | | | | | |
| SAP SE | | | 24,300 | | | | 3,396,885 | |
| Total Germany | | | | | | | 13,575,916 | |
| | | | | | | | | |
| Switzerland — 9.8% | | | | | | | | |
| | | | | | | | | |
| Consumer Staples — 3.3% | | | | | | | | |
| Nestle SA | | | 35,000 | | | | 3,880,472 | |
| | | | | | | | | |
| Health Care — 4.4% | | | | | | | | |
| Novartis AG | | | 28,000 | | | | 2,439,390 | |
| Roche Holding AG | | | 7,900 | | | | 2,736,951 | |
| | | | | | | | | |
| Industrials — 2.1% | | | | | | | | |
| Adecco Group AG | | | 53,000 | | | | 2,498,187 | |
| Total Switzerland | | | | | | | 11,555,000 | |
| | | | | | | | | |
| France — 9.4% | | | | | | | | |
| | | | | | | | | |
| Communication Services — 2.9% | | | | | | | | |
| JCDecaux SA* | | | 182,000 | | | | 3,399,821 | |
| | | | | | | | | |
| Consumer Discretionary — 4.4% | | | | | | | | |
| Cie Generale des Etablissements Michelin SCA† | | | 28,000 | | | | 2,918,527 | |
| LVMH Moet Hennessy Louis Vuitton SE | | | 5,200 | | | | 2,295,776 | |
| | | | | | | | | |
| Energy — 2.1% | | | | | | | | |
| TOTAL SA† | | | 64,500 | | | | 2,487,019 | |
| Total France | | | | | | | 11,101,143 | |
| | | | | | | | | |
| Japan — 7.3% | | | | | | | | |
| | | | | | | | | |
| Communication Services — 2.2% | | | | | | | | |
| Nippon Telegraph & Telephone Corp. | | | 112,000 | | | | 2,609,539 | |
| | | | | | | | | |
| Consumer Discretionary — 2.7% | | | | | | | | |
| USS Co. Ltd. | | | 199,000 | | | | 3,190,042 | |
| | | | | | | | | |
| Industrials — 2.4% | | | | | | | | |
| FANUC Corp. | | | 15,500 | | | | 2,778,685 | |
| Total Japan | | | | | | | 8,578,266 | |
| | | | | | | | | |
| Canada — 5.2% | | | | | | | | |
| | | | | | | | | |
| Materials — 5.2% | | | | | | | | |
| Barrick Gold Corp. | | | 135,000 | | | | 3,632,550 | |
| Pretium Resources, Inc.*† | | | 300,000 | | | | 2,520,000 | |
| Total Canada | | | | | | | 6,152,550 | |
| | | | | | | | | |
| China — 4.9% | | | | | | | | |
| | | | | | | | | |
| Communication Services — 2.5% | | | | | | | | |
| Tencent Holdings Ltd. | | | 47,000 | | | | 3,011,662 | |
| | | | | | | | | |
| Consumer Discretionary — 2.4% | | | | | | | | |
| Alibaba Group Holding Ltd. ADR* | | | 13,000 | | | | 2,804,100 | |
| Total China | | | | | | | 5,815,762 | |
| | | | | | | | | |
| South Korea — 3.1% | | | | | | | | |
| | | | | | | | | |
| Information Technology — 3.1% | | | | | | | | |
| Samsung Electronics Co. Ltd. | | | 82,000 | | | | 3,629,946 | |
| | | | | | | | | |
| India — 2.9% | | | | | | | | |
| | | | | | | | | |
| Consumer Discretionary — 0.4% | | | | | | | | |
| PC Jeweller Ltd.* | | | 2,200,000 | | | | 488,669 | |
| | | | | | | | | |
| Financials — 2.5% | | | | | | | | |
| Indian Energy Exchange Ltd., 144a | | | 1,200,000 | | | | 2,866,800 | |
| Total India | | | | | | | 3,355,469 | |
| | | | | | | | | |
| Denmark — 2.7% | | | | | | | | |
| | | | | | | | | |
| Industrials — 2.7% | | | | | | | | |
| ISS A/S* | | | 198,000 | | | | 3,143,943 | |
| | | | | | | | | |
| Luxembourg — 2.6% | | | | | | | | |
| | | | | | | | | |
| Industrials — 2.6% | | | | | | | | |
| Befesa SA, 144a | | | 80,000 | | | | 3,119,712 | |
| | | | | | | | | |
| Hong Kong — 2.4% | | | | | | | | |
| | | | | | | | | |
| Consumer Discretionary — 2.4% | | | | | | | | |
| Galaxy Entertainment Group Ltd. | | | 410,000 | | | | 2,812,497 | |
| | | | | | | | | |
| Mexico — 2.3% | | | | | | | | |
| | | | | | | | | |
| Consumer Staples — 2.3% | | | | | | | | |
| Gruma SAB de CV - Class B | | | 255,000 | | | | 2,764,067 | |
| | | | | | | | | |
| Ireland — 2.3% | | | | | | | | |
| | | | | | | | | |
| Health Care — 2.3% | | | | | | | | |
| Medtronic PLC | | | 30,000 | | | | 2,751,000 | |
| | | | | | | | | |
| Brazil — 2.1% | | | | | | | | |
| | | | | | | | | |
| Consumer Staples — 2.1% | | | | | | | | |
| Ambev SA ADR | | | 930,000 | | | | 2,455,200 | |
| | | | | | | | | |
| Taiwan — 2.0% | | | | | | | | |
| | | | | | | | | |
| Information Technology — 2.0% | | | | | | | | |
| Taiwan Semiconductor Manufacturing Co. Ltd. ADR | | | 41,000 | | | | 2,327,570 | |
| | | | | | | | | |
| Greece — 1.9% | | | | | | | | |
| | | | | | | | | |
| Consumer Discretionary — 1.9% | | | | | | | | |
| OPAP SA | | | 235,000 | | | | 2,229,670 | |
| | | | | | | | | |
| Norway — 1.9% | | | | | | | | |
| | | | | | | | | |
| Energy — 1.9% | | | | | | | | |
| TGS NOPEC Geophysical Co. ASA | | | 150,000 | | | | 2,212,731 | |
| | | | | | | | | |
| United States — 1.5% | | | | | | | | |
| | | | | | | | | |
| Information Technology — 1.5% | | | | | | | | |
| Mastercard, Inc. - Class A | | | 6,000 | | | | 1,774,200 | |
| Total Common Stocks | | | | | | $ | 106,650,273 | |
| | | | | | | | | |
| Short-Term Investment Funds — 15.9% | | | | | | | | |
| Dreyfus Government Cash Management, Institutional Shares, 0.09%∞Ω | | | 10,626,667 | | | | 10,626,667 | |
| Invesco Government & Agency Portfolio, Institutional Class, 0.09%**∞Ω | | | 8,134,603 | | | | 8,134,603 | |
| Total Short-Term Investment Funds | | | | | | $ | 18,761,270 | |
Touchstone International Equity Fund (Continued)
| | | Market | |
| | | Value | |
| Total Investment Securities — 106.4% | | | | |
| (Cost $125,854,841) | | $ | 125,411,543 | |
| | | | | |
| Liabilities in Excess of Other Assets — (6.4%) | | | (7,553,994 | ) |
| | | | | |
| Net Assets — 100.0% | | $ | 117,857,549 | |
| * | Non-income producing security. |
| ** | Represents collateral for securities loaned. |
| † | All or a portion of the security is on loan. The total market value of the securities on loan as of June 30, 2020 was $7,818,356. |
| Ω | Represents the 7-day SEC yield as of June 30, 2020. |
Portfolio Abbreviations:
ADR - American Depositary Receipt
PLC - Public Limited Company
144a - This is a restricted security that was sold in a transaction qualifying for the exemption under Rule 144a of the Securities Act of 1933. This security may be sold in transactions exempt from registration, normally to qualified institutional buyers. At June 30, 2020, these securities were valued at $9,005,381 or 7.6% of net assets. These securities were deemed liquid pursuant to procedures approved by the Board of Trustees.
Other Information:
The inputs or methodology used for valuing securities may not be an indication of the risk associated with investing in those securities. For more information on valuation inputs, and their aggregation into the levels used in the table below, please refer to the security valuation section in the accompanying Notes to Financial Statements.
Valuation inputs at Reporting Date:
| Description | | Level 1 | | | Level 2 | | | Level 3 | | | Total | |
| Common Stocks | | | | | | | | | | | | | | | | |
| United Kingdom | | $ | 834,844 | | | $ | 16,460,787 | | | $ | — | | | $ | 17,295,631 | |
| Germany | | | — | | | | 13,575,916 | | | | — | | | | 13,575,916 | |
| Switzerland | | | — | | | | 11,555,000 | | | | — | | | | 11,555,000 | |
| France | | | — | | | | 11,101,143 | | | | — | | | | 11,101,143 | |
| Japan | | | — | | | | 8,578,266 | | | | — | | | | 8,578,266 | |
| Canada | | | 6,152,550 | | | | — | | | | — | | | | 6,152,550 | |
| China | | | 2,804,100 | | | | 3,011,662 | | | | — | | | | 5,815,762 | |
| South Korea | | | — | | | | 3,629,946 | | | | — | | | | 3,629,946 | |
| India | | | — | | | | 3,355,469 | | | | — | | | | 3,355,469 | |
| Denmark | | | — | | | | 3,143,943 | | | | — | | | | 3,143,943 | |
| Luxembourg | | | — | | | | 3,119,712 | | | | — | | | | 3,119,712 | |
| Hong Kong | | | — | | | | 2,812,497 | | | | — | | | | 2,812,497 | |
| Mexico | | | 2,764,067 | | | | — | | | | — | | | | 2,764,067 | |
| Ireland | | | 2,751,000 | | | | — | | | | — | | | | 2,751,000 | |
| Brazil | | | 2,455,200 | | | | — | | | | — | | | | 2,455,200 | |
| Taiwan | | | 2,327,570 | | | | — | | | | — | | | | 2,327,570 | |
| Greece | | | 2,229,670 | | | | — | | | | — | | | | 2,229,670 | |
| Norway | | | — | | | | 2,212,731 | | | | — | | | | 2,212,731 | |
| United States | | | 1,774,200 | | | | — | | | | — | | | | 1,774,200 | |
| Short-Term Investment Funds | | | 18,761,270 | | | | — | | | | — | | | | 18,761,270 | |
| Total | | $ | 42,854,471 | | | $ | 82,557,072 | | | $ | — | | | $ | 125,411,543 | |
See accompanying Notes to Financial Statements.
Portfolio of Investments
Touchstone International Growth Opportunities Fund – June 30, 2020
| | | | | | Market | |
| | | Shares | | | Value | |
| Common Stocks — 99.8% | | | | | | | | |
| | | | | | | | | |
| China — 36.5% | | | | | | | | |
| | | | | | | | | |
| Communication Services — 7.9% | | | | | | | | |
| Tencent Holdings Ltd. | | | 38,725 | | | $ | 2,481,417 | |
| | | | | | | | | |
| Consumer Discretionary — 20.4% | | | | | | | | |
| Alibaba Group Holding Ltd. ADR* | | | 11,895 | | | | 2,565,751 | |
| ANTA Sports Products Ltd. | | | 50,000 | | | | 444,854 | |
| JD.com, Inc. ADR* | | | 27,405 | | | | 1,649,233 | |
| New Oriental Education & Technology Group, Inc. ADR* | | | 13,330 | | | | 1,735,966 | |
| | | | | | | | | |
| Consumer Staples — 6.8% | | | | | | | | |
| Kweichow Moutai Co. Ltd. - Class A | | | 2,700 | | | | 560,703 | |
| Wuliangye Yibin Co. Ltd. - Class A | | | 63,728 | | | | 1,548,395 | |
| | | | | | | | | |
| Financials — 1.4% | | | | | | | | |
| Ping An Insurance Group Co. of China Ltd. - Class H | | | 44,500 | | | | 443,620 | |
| Total China | | | | | | | 11,429,939 | |
| | | | | | | | | |
| Germany — 12.3% | | | | | | | | |
| | | | | | | | | |
| Communication Services — 2.7% | | | | | | | | |
| Stroeer SE & Co. KGaA | | | 12,480 | | | | 842,176 | |
| | | | | | | | | |
| Consumer Discretionary — 3.2% | | | | | | | | |
| adidas AG* | | | 3,817 | | | | 1,006,359 | |
| | | | | | | | | |
| Information Technology — 6.4% | | | | | | | | |
| Netcompany Group A/S, 144a* | | | 5,585 | | | | 366,299 | |
| SAP SE | | | 11,640 | | | | 1,627,150 | |
| Total Germany | | | | | | | 3,841,984 | |
| | | | | | | | | |
| Switzerland — 10.0% | | | | | | | | |
| | | | | | | | | |
| Financials — 3.8% | | | | | | | | |
| Partners Group Holding AG | | | 1,317 | | | | 1,199,382 | |
| | | | | | | | | |
| Health Care — 6.2% | | | | | | | | |
| Alcon, Inc.* | | | 10,750 | | | | 617,687 | |
| Sonova Holding AG | | | 3,109 | | | | 622,345 | |
| Straumann Holding AG | | | 790 | | | | 682,945 | |
| Total Switzerland | | | | | | | 3,122,359 | |
| | | | | | | | | |
| France — 8.3% | | | | | | | | |
| | | | | | | | | |
| Consumer Discretionary — 2.5% | | | | | | | | |
| Kering SA | | | 1,455 | | | | 795,477 | |
| | | | | | | | | |
| Information Technology — 5.8% | | | | | | | | |
| Capgemini SE | | | 15,735 | | | | 1,815,843 | |
| Total France | | | | | | | 2,611,320 | |
| | | | | | | | | |
| Canada — 6.2% | | | | | | | | |
| | | | | | | | | |
| Consumer Discretionary — 2.8% | | | | | | | | |
| Dollarama, Inc. | | | 26,385 | | | | 877,686 | |
| | | | | | | | | |
| Industrials — 3.4% | | | | | | | | |
| Canadian Pacific Railway Ltd. | | | 4,230 | | | | 1,080,088 | |
| Total Canada | | | | | | | 1,957,774 | |
| | | | | | | | | |
| United Kingdom — 6.1% | | | | | | | | |
| | | | | | | | | |
| Health Care — 4.4% | | | | | | | | |
| AstraZeneca PLC | | | 13,170 | | | | 1,370,660 | |
| | | | | | | | | |
| Information Technology — 1.7% | | | | | | | | |
| Endava PLC ADR* | | | 11,155 | | | | 538,786 | |
| Total United Kingdom | | | | | | | 1,909,446 | |
| | | | | | | | | |
| United States — 5.3% | | | | | | | | |
| | | | | | | | | |
| Communication Services — 3.4% | | | | | | | | |
| Alphabet, Inc. - Class A* | | | 350 | | | | 496,317 | |
| Facebook, Inc. - Class A* | | | 2,425 | | | | 550,645 | |
| | | | | | | | | |
| Information Technology — 1.9% | | | | | | | | |
| Microsoft Corp. | | | 2,955 | | | | 601,372 | |
| Total United States | | | | | | | 1,648,334 | |
| | | | | | | | | |
| Japan — 4.6% | | | | | | | | |
| | | | | | | | | |
| Communication Services — 1.4% | | | | | | | | |
| Kakaku.com, Inc. | | | 17,200 | | | | 438,157 | |
| | | | | | | | | |
| Industrials — 3.2% | | | | | | | | |
| Recruit Holdings Co. Ltd. | | | 29,700 | | | | 1,021,389 | |
| Total Japan | | | | | | | 1,459,546 | |
| | | | | | | | | |
| Israel—3.9% | | | | | | | | |
| | | | | | | | | |
| Information Technology — 3.9% | | | | | | | | |
| Nice Ltd. ADR* | | | 6,435 | | | | 1,217,759 | |
| | | | | | | | | |
| Italy — 3.1% | | | | | | | | |
| | | | | | | | | |
| Information Technology — 3.1% | | | | | | | | |
| Nexi SpA, 144a* | | | 57,100 | | | | 990,145 | |
| | | | | | | | | |
| Spain — 2.4% | | | | | | | | |
| | | | | | | | | |
| Health Care — 2.4% | | | | | | | | |
| Grifols SA | | | 24,595 | | | | 747,886 | |
| | | | | | | | | |
| Argentina — 1.1% | | | | | | | | |
| | | | | | | | | |
| Information Technology — 1.1% | | | | | | | | |
| Globant SA* | | | 2,285 | | | | 342,407 | |
| Total Common Stocks | | | | | | $ | 31,278,899 | |
| | | | | | | | | |
| Short-Term Investment Fund — 0.4% | | | | | | | | |
| Dreyfus Government Cash Management, Institutional Shares, 0.09%∞Ω | | | 126,099 | | | $ | 126,099 | |
| | | | | | | | | |
| Total Investment Securities —100.2% | | | | | | | | |
| (Cost $22,387,075) | | | | | | $ | 31,404,998 | |
| | | | | | | | | |
| Liabilities in Excess of Other Assets — (0.2%) | | | | | | | (72,617 | ) |
| | | | | | | | | |
| Net Assets — 100.0% | | | | | | $ | 31,332,381 | |
| * | Non-income producing security. |
| Ω | Represents the 7-day SEC yield as of June 30, 2020. |
Portfolio Abbreviations:
ADR - American Depositary Receipt
PLC - Public Limited Company
144a - This is a restricted security that was sold in a transaction qualifying for the exemption under Rule 144a of the Securities Act of 1933. This security may be sold in transactions exempt from registration, normally to qualified institutional buyers. At June 30, 2020, these securities were valued at $1,356,444 or 4.3% of net assets. These securities were deemed liquid pursuant to procedures approved by the Board of Trustees.
Touchstone International Growth Opportunities Fund (Continued)
Other Information:
The inputs or methodology used for valuing securities may not be an indication of the risk associated with investing in those securities. For more information on valuation inputs, and their aggregation into the levels used in the table below, please refer to the security valuation section in the accompanying Notes to Financial Statements.
Valuation inputs at Reporting Date:
| Description | | Level 1 | | | Level 2 | | | Level 3 | | | Total | |
| Common Stocks | | | | | | | | | | | | | | | | |
| China | | $ | 5,950,950 | | | $ | 5,478,989 | | | $ | — | | | $ | 11,429,939 | |
| Germany | | | 366,299 | | | | 3,475,685 | | | | — | | | | 3,841,984 | |
| Switzerland | | | — | | | | 3,122,359 | | | | — | | | | 3,122,359 | |
| France | | | — | | | | 2,611,320 | | | | — | | | | 2,611,320 | |
| Canada | | | 1,957,774 | | | | — | | | | — | | | | 1,957,774 | |
| United Kingdom | | | 538,786 | | | | 1,370,660 | | | | — | | | | 1,909,446 | |
| United States | | | 1,648,334 | | | | — | | | | — | | | | 1,648,334 | |
| Japan | | | — | | | | 1,459,546 | | | | — | | | | 1,459,546 | |
| Israel | | | 1,217,759 | | | | — | | | | — | | | | 1,217,759 | |
| Italy | | | — | | | | 990,145 | | | | — | | | | 990,145 | |
| Spain | | | — | | | | 747,886 | | | | — | | | | 747,886 | |
| Argentina | | | 342,407 | | | | — | | | | — | | | | 342,407 | |
| Short-Term Investment Fund | | | 126,099 | | | | — | | | | — | | | | 126,099 | |
| Total | | $ | 12,148,408 | | | $ | 19,256,590 | | | $ | — | | | $ | 31,404,998 | |
See accompanying Notes to Financial Statements.
Portfolio of Investments
Touchstone International Small Cap Fund – June 30, 2020
| | | | | | Market | |
| | | Shares | | | Value | |
| Common Stocks — 97.4% | | | | | | | | |
| | | | | | | | | |
| Japan — 26.9% | | | | | | | | |
| | | | | | | | | |
| Communication Services — 1.0% | | | | | | | | |
| Ateam, Inc. | | | 2,100 | | | $ | 16,827 | |
| Avex, Inc. | | | 1,600 | | | | 12,657 | |
| Capcom Co. Ltd. | | | 16,400 | | | | 600,300 | |
| COOKPAD, Inc.* | | | 5,100 | | | | 14,941 | |
| Daiichikosho Co. Ltd. | | | 400 | | | | 11,967 | |
| Gree, Inc. | | | 3,500 | | | | 15,044 | |
| Gurunavi, Inc. | | | 2,500 | | | | 17,186 | |
| Itokuro, Inc.* | | | 1,100 | | | | 13,549 | |
| Kamakura Shinsho Ltd. | | | 1,200 | | | | 12,579 | |
| Marvelous, Inc. | | | 2,700 | | | | 17,592 | |
| Mixi, Inc. | | | 900 | | | | 15,918 | |
| ZIGExN Co. Ltd. | | | 4,300 | | | | 13,524 | |
| | | | | | | | | |
| Consumer Discretionary — 2.5% | | | | | | | | |
| Aisan Industry Co. Ltd. | | | 2,900 | | | | 14,249 | |
| Aoyama Trading Co. Ltd. | | | 19,700 | | | | 134,455 | |
| Atom Corp. | | | 1,800 | | | | 13,693 | |
| Belluna Co. Ltd. | | | 3,100 | | | | 17,522 | |
| BRONCO BILLY Co. Ltd. | | | 600 | | | | 13,483 | |
| Chiyoda Co. Ltd. | | | 1,500 | | | | 16,432 | |
| Colowide Co. Ltd. | | | 1,000 | | | | 13,651 | |
| Daido Metal Co. Ltd. | | | 2,900 | | | | 14,737 | |
| Daikyonishikawa Corp. | | | 2,800 | | | | 12,597 | |
| Daisyo Corp. | | | 1,100 | | | | 12,989 | |
| Eagle Industry Co. Ltd. | | | 2,200 | | | | 14,775 | |
| Fuji Co. Ltd. | | | 800 | | | | 13,922 | |
| Fuji Kyuko Co. Ltd. | | | 400 | | | | 12,511 | |
| Fujita Kanko, Inc. | | | 4,500 | | | | 71,146 | |
| Genki Sushi Co. Ltd. | | | 600 | | | | 12,889 | |
| G-Tekt Corp. | | | 1,400 | | | | 13,585 | |
| H2O Retailing Corp. | | | 1,900 | | | | 12,712 | |
| Istyle, Inc.* | | | 4,800 | | | | 11,990 | |
| Kasai Kogyo Co. Ltd. | | | 3,200 | | | | 13,549 | |
| Kisoji Co. Ltd. | | | 600 | | | | 13,620 | |
| KNT-CT Holdings Co. Ltd.* | | | 1,300 | | | | 12,025 | |
| KYB Corp.* | | | 700 | | | | 13,125 | |
| Kyoritsu Maintenance Co. Ltd. | | | 400 | | | | 13,684 | |
| Mars Group Holdings Corp. | | | 1,000 | | | | 15,079 | |
| Matsuya Co. Ltd. | | | 2,500 | | | | 15,918 | |
| Mitsuba Corp.* | | | 9,900 | | | | 42,703 | |
| NHK Spring Co. Ltd. | | | 2,200 | | | | 14,308 | |
| Nihon Tokushu Toryo Co. Ltd. | | | 1,800 | | | | 16,563 | |
| Onward Holdings Co. Ltd. | | | 15,400 | | | | 45,514 | |
| Pacific Industrial Co. Ltd. | | | 1,600 | | | | 14,109 | |
| Pepper Food Service Co. Ltd.* | | | 17,600 | | | | 87,312 | |
| Plenus Co. Ltd. | | | 800 | | | | 13,282 | |
| Press Kogyo Co. Ltd. | | | 6,500 | | | | 17,663 | |
| Renaissance, Inc. | | | 1,400 | | | | 13,041 | |
| Resorttrust, Inc. | | | 1,200 | | | | 15,574 | |
| Riken Corp. | | | 600 | | | | 16,658 | |
| Ringer Hut Co. Ltd. | | | 600 | | | | 13,046 | |
| Rinnai Corp. | | | 8,200 | | | | 686,694 | |
| Royal Holdings Co. Ltd. | | | 800 | | | | 13,934 | |
| Sac’s Bar Holdings, Inc. | | | 4,800 | | | | 26,862 | |
| St Marc Holdings Co. Ltd. | | | 800 | | | | 12,343 | |
| Sumitomo Riko Co. Ltd. | | | 2,700 | | | | 15,680 | |
| Sushiro Global Holdings Ltd. | | | 600 | | | | 13,304 | |
| Tachi-S Co. Ltd. | | | 3,000 | | | | 24,210 | |
| Taiho Kogyo Co. Ltd. | | | 12,900 | | | | 63,436 | |
| Tokyo Dome Corp. | | | 1,800 | | | | 12,935 | |
| Toyo Tire Corp. | | | 1,000 | | | | 13,495 | |
| TPR Co. Ltd. | | | 1,200 | | | | 14,971 | |
| TSI Holdings Co. Ltd. | | | 3,600 | | | | 15,474 | |
| Unipres Corp. | | | 1,500 | | | | 13,155 | |
| WATAMI Co. Ltd. | | | 1,400 | | | | 12,363 | |
| Yomiuri Land Co. Ltd. | | | 400 | | | | 13,198 | |
| Yondoshi Holdings, Inc. | | | 800 | | | | 13,192 | |
| Yonex Co. Ltd. | | | 3,100 | | | | 16,874 | |
| Yorozu Corp. | | | 1,300 | | | | 12,823 | |
| | | | | | | | | |
| Consumer Staples — 2.8% | | | | | | | | |
| euglena Co. Ltd.* | | | 2,200 | | | | 15,942 | |
| Ministop Co. Ltd. | | | 1,000 | | | | 14,021 | |
| Nichirei Corp. | | | 50,500 | | | | 1,471,555 | |
| Nishimoto Co. Ltd. | | | 800 | | | | 15,817 | |
| Sundrug Co. Ltd. | | | 15,500 | | | | 512,984 | |
| Yokohama Reito Co. Ltd. | | | 1,800 | | | | 14,921 | |
| | | | | | | | | |
| Financials — 2.1% | | | | | | | | |
| Aichi Bank Ltd. (The) | | | 1,400 | | | | 36,213 | |
| Akita Bank Ltd. (The) | | | 3,100 | | | | 41,764 | |
| Aomori Bank Ltd. (The) | | | 3,300 | | | | 68,765 | |
| Awa Bank Ltd. (The) | | | 700 | | | | 15,771 | |
| Bank of Iwate Ltd. (The) | | | 1,600 | | | | 38,777 | |
| Bank of Nagoya Ltd. (The) | | | 2,200 | | | | 47,306 | |
| Bank of Okinawa Ltd. (The) | | | 500 | | | | 14,416 | |
| Bank of Saga Ltd. (The) | | | 3,800 | | | | 41,413 | |
| Bank of the Ryukyus Ltd. | | | 2,300 | | | | 20,488 | |
| Chugoku Bank Ltd. (The) | | | 1,700 | | | | 15,773 | |
| Chukyo Bank Ltd. (The) | | | 700 | | | | 13,961 | |
| Daishi Hokuetsu Financial Group, Inc. | | | 1,600 | | | | 32,462 | |
| Ehime Bank Ltd. (The) | | | 1,400 | | | | 15,155 | |
| Hiroshima Bank Ltd. (The) | | | 3,400 | | | | 16,083 | |
| Hokkoku Bank Ltd. (The) | | | 3,000 | | | | 79,771 | |
| Hokuhoku Financial Group, Inc. | | | 8,200 | | | | 68,114 | |
| Hyakugo Bank Ltd. (The) | | | 5,300 | | | | 16,175 | |
| Hyakujushi Bank Ltd. (The) | | | 2,100 | | | | 37,945 | |
| Ichiyoshi Securities Co. Ltd. | | | 3,700 | | | | 15,674 | |
| Iyo Bank Ltd. (The) | | | 2,700 | | | | 16,527 | |
| Juroku Bank Ltd. (The) | | | 800 | | | | 14,580 | |
| Keiyo Bank Ltd. (The) | | | 9,800 | | | | 47,327 | |
| Kiyo Bank Ltd. (The) | | | 900 | | | | 13,703 | |
| Kyokuto Securities Co. Ltd. | | | 3,200 | | | | 15,193 | |
| Kyushu Financial Group, Inc. | | | 3,600 | | | | 15,245 | |
| Miyazaki Bank Ltd. (The) | | | 5,000 | | | | 110,809 | |
| Musashino Bank Ltd. (The) | | | 2,100 | | | | 30,105 | |
| Nanto Bank Ltd. (The) | | | 700 | | | | 13,629 | |
| Nishi-Nippon Financial Holdings, Inc. | | | 2,500 | | | | 16,897 | |
| North Pacific Bank Ltd. | | | 12,300 | | | | 23,779 | |
| Ogaki Kyoritsu Bank Ltd. (The) | | | 900 | | | | 19,035 | |
| Oita Bank Ltd. (The) | | | 600 | | | | 13,274 | |
| San ju San Financial Group, Inc. | | | 2,200 | | | | 27,030 | |
| San-In Godo Bank Ltd. (The) | | | 23,400 | | | | 118,105 | |
| Senshu Ikeda Holdings, Inc. | | | 49,700 | | | | 74,160 | |
| Shiga Bank Ltd. (The) | | | 800 | | | | 17,817 | |
| Shikoku Bank Ltd. (The) | | | 4,900 | | | | 35,797 | |
| Toho Bank Ltd. (The) | | | 19,300 | | | | 40,053 | |
| Tokyo Kiraboshi Financial Group, Inc. | | | 11,500 | | | | 117,838 | |
| TOMONY Holdings, Inc. | | | 11,000 | | | | 35,378 | |
| Towa Bank Ltd. (The) | | | 6,300 | | | | 40,878 | |
| Yamagata Bank Ltd. (The) | | | 2,400 | | | | 29,660 | |
| Yamaguchi Financial Group, Inc. | | | 2,700 | | | | 16,592 | |
Touchstone International Small Cap Fund (Continued)
| | | | | | Market | |
| | | Shares | | | Value | |
| Common Stocks — 97.4% (Continued) | | | | | | | | |
| | | | | | | | | |
| Japan — (Continued) | | | | | | | | |
| | | | | | | | | |
| Financials — (Continued) | | | | | | | | |
| Yamanashi Chuo Bank Ltd. (The) | | | 5,200 | | | $ | 41,165 | |
| | | | | | | | | |
| Health Care — 1.6% | | | | | | | | |
| AnGes, Inc.* | | | 800 | | | | 16,522 | |
| Mani, Inc. | | | 600 | | | | 15,928 | |
| Ship Healthcare Holdings, Inc. | | | 26,500 | | | | 1,109,055 | |
| | | | | | | | | |
| Industrials — 7.1% | | | | | | | | |
| Asahi Diamond Industrial Co. Ltd. | | | 3,300 | | | | 15,032 | |
| Bando Chemical Industries Ltd. | | | 2,600 | | | | 15,823 | |
| Hisaka Works Ltd. | | | 2,100 | | | | 14,537 | |
| Iino Kaiun Kaisha Ltd. | | | 4,900 | | | | 15,493 | |
| Jamco Corp. | | | 2,200 | | | | 15,795 | |
| Kamigumi Co. Ltd. | | | 54,218 | | | | 1,066,278 | |
| Komori Corp. | | | 2,200 | | | | 14,412 | |
| Konoike Transport Co. Ltd. | | | 1,300 | | | | 14,065 | |
| Kyudenko Corp. | | | 32,100 | | | | 947,519 | |
| Nishi-Nippon Railroad Co. Ltd. | | | 500 | | | | 13,567 | |
| NS United Kaiun Kaisha Ltd. | | | 1,100 | | | | 15,219 | |
| Penta-Ocean Construction Co. Ltd. | | | 195,800 | | | | 1,057,399 | |
| Shima Seiki Manufacturing Ltd. | | | 1,000 | | | | 14,303 | |
| Sohgo Security Services Co. Ltd. | | | 22,800 | | | | 1,064,611 | |
| TechnoPro Holdings, Inc. | | | 16,800 | | | | 969,857 | |
| Tonami Holdings Co. Ltd. | | | 200 | | | | 10,510 | |
| | | | | | | | | |
| Information Technology — 7.7% | | | | | | | | |
| Anritsu Corp. | | | 53,800 | | | | 1,278,138 | |
| Azbil Corp. | | | 46,800 | | | | 1,430,420 | |
| Digital Garage, Inc. | | | 28,200 | | | | 903,388 | |
| DKK Co. Ltd. | | | 600 | | | | 14,512 | |
| Infomart Corp. | | | 1,700 | | | | 11,765 | |
| Japan Cash Machine Co. Ltd. | | | 2,800 | | | | 15,321 | |
| Lasertec Corp. | | | 3,000 | | | | 283,592 | |
| Maxell Holdings Ltd. | | | 1,500 | | | | 14,021 | |
| Money Forward, Inc.* | | | 200 | | | | 11,078 | |
| NET One Systems Co. Ltd. | | | 400 | | | | 13,351 | |
| Nihon Unisys Ltd. | | | 55,500 | | | | 1,744,989 | |
| | | | | | | | | |
| Materials — 1.8% | | | | | | | | |
| Denka Co. Ltd. | | | 600 | | | | 14,706 | |
| Tokuyama Corp. | | | 56,800 | | | | 1,343,917 | |
| | | | | | | | | |
| Real Estate — 0.3% | | | | | | | | |
| AEON REIT Investment Corp. REIT | | | 14 | | | | 14,885 | |
| Comforia Residential REIT, Inc. REIT | | | 5 | | | | 14,914 | |
| Industrial & Infrastructure Fund Investment Corp. REIT | | | 9 | | | | 14,530 | |
| Invesco Office J-Reit, Inc. REIT | | | 106 | | | | 13,781 | |
| Japan Excellent, Inc. REIT | | | 12 | | | | 13,949 | |
| Japan Logistics Fund, Inc. REIT | | | 5 | | | | 13,580 | |
| LaSalle Logiport REIT | | | 10 | | | | 15,402 | |
| MCUBS MidCity Investment Corp. REIT | | | 20 | | | | 14,572 | |
| Mitsui Fudosan Logistics Park, Inc. REIT | | | 3 | | | | 13,413 | |
| Mori Hills REIT Investment Corp. REIT | | | 11 | | | | 13,856 | |
| Nippon Accommodations Fund, Inc. REIT | | | 2 | | | | 11,565 | |
| NIPPON REIT Investment Corp. REIT | | | 4 | | | | 12,930 | |
| Premier Investment Corp. REIT | | | 14 | | | | 15,554 | |
| Total Japan | | | | | | | 19,885,034 | |
| | | | | | | | | |
| United Kingdom — 16.6% | | | | | | | | |
| | | | | | | | | |
| Communication Services — 0.1% | | | | | | | | |
| Ascential PLC, 144a | | | 4,475 | | | | 16,053 | |
| Daily Mail & General Trust PLC - Class A | | | 1,626 | | | | 13,882 | |
| Future PLC | | | 1,011 | | | | 15,957 | |
| Rightmove PLC | | | 2,316 | | | | 15,655 | |
| | | | | | | | | |
| Consumer Discretionary — 4.6% | | | | | | | | |
| B&M European Value Retail SA | | | 3,424 | | | | 16,854 | |
| Bellway PLC | | | 501 | | | | 15,780 | |
| Coats Group PLC | | | 25,203 | | | | 17,542 | |
| Dixons Carphone PLC | | | 17,954 | | | | 19,954 | |
| Domino’s Pizza Group PLC | | | 3,445 | | | | 13,223 | |
| Dunelm Group PLC | | | 91,569 | | | | 1,349,032 | |
| Games Workshop Group PLC | | | 182 | | | | 18,085 | |
| Greggs PLC | | | 45,142 | | | | 905,371 | |
| J D Wetherspoon PLC | | | 1,212 | | | | 15,078 | |
| Marston’s PLC | | | 18,635 | | | | 12,273 | |
| Moneysupermarket.com Group PLC | | | 3,686 | | | | 14,786 | |
| Playtech PLC | | | 4,993 | | | | 17,446 | |
| Redrow PLC | | | 177,454 | | | | 946,375 | |
| SSP Group PLC | | | 7,105 | | | | 22,643 | |
| Trainline PLC, 144a* | | | 2,402 | | | | 12,945 | |
| Vistry Group PLC | | | 1,635 | | | | 14,402 | |
| WH Smith PLC | | | 1,277 | | | | 17,386 | |
| William Hill PLC | | | 9,761 | | | | 13,791 | |
| | | | | | | | | |
| Consumer Staples — 1.3% | | | | | | | | |
| Tate & Lyle PLC | | | 117,664 | | | | 972,696 | |
| | | | | | | | | |
| Financials — 3.5% | | | | | | | | |
| Ashmore Group PLC | | | 211,209 | | | | 1,090,570 | |
| Beazley PLC | | | 3,315 | | | | 16,806 | |
| Hiscox Ltd. | | | 1,716 | | | | 16,749 | |
| Intermediate Capital Group PLC | | | 85,537 | | | | 1,364,642 | |
| Metro Bank PLC* | | | 55,324 | | | | 71,744 | |
| OneSavings Bank PLC | | | 4,845 | | | | 15,927 | |
| TP ICAP PLC | | | 3,466 | | | | 15,053 | |
| | | | | | | | | |
| Health Care — 2.1% | | | | | | | | |
| Dechra Pharmaceuticals PLC | | | 43,787 | | | | 1,542,298 | |
| Genus PLC | | | 362 | | | | 15,847 | |
| | | | | | | | | |
| Industrials — 3.3% | | | | | | | | |
| Firstgroup PLC* | | | 23,032 | | | | 14,431 | |
| Grafton Group PLC | | | 2,003 | | | | 16,381 | |
| Hays PLC | | | 11,494 | | | | 17,020 | |
| HomeServe PLC | | | 86,607 | | | | 1,400,173 | |
| Howden Joinery Group PLC | | | 128,774 | | | | 881,609 | |
| National Express Group PLC | | | 6,064 | | | | 14,114 | |
| Redde Northgate PLC | | | 6,757 | | | | 13,893 | |
| Royal Mail PLC | | | 6,974 | | | | 15,718 | |
| Signature Aviation PLC | | | 5,768 | | | | 16,489 | |
| Travis Perkins PLC | | | 1,170 | | | | 16,312 | |
| | | | | | | | | |
| Information Technology — 1.5% | | | | | | | | |
| Avast PLC, 144a | | | 2,425 | | | | 15,849 | |
| Dialog Semiconductor PLC* | | | 23,222 | | | | 1,061,447 | |
| Spirent Communications PLC | | | 4,823 | | | | 14,430 | |
| | | | | | | | | |
| Real Estate — 0.2% | | | | | | | | |
| Assura PLC REIT | | | 15,869 | | | | 15,399 | |
| Hammerson PLC REIT | | | 51,564 | | | | 51,104 | |
| NewRiver PLC REIT | | | 57,597 | | | | 44,864 | |
| RDI PLC REIT | | | 19,584 | | | | 20,020 | |
| Tritax Big Box PLC REIT | | | 9,247 | | | | 16,613 | |
| UNITE Group PLC (The) REIT* | | | 1,707 | | | | 19,877 | |
| Total United Kingdom | | | | | | | 12,292,588 | |
| | | | | | | | | |
| Australia — 7.9% | | | | | | | | |
| | | | | | | | | |
| Communication Services — 0.1% | | | | | | | | |
| carsales.com Ltd. | | | 1,431 | | | | 17,714 | |
Touchstone International Small Cap Fund (Continued)
| | | | | | Market | |
| | | Shares | | | Value | |
| Common Stocks — 97.4% (Continued) | | | | | | | | |
| | | | | | | | | |
| Australia — (Continued) | | | | | | | | |
| | | | | | | | | |
| Communication Services — (Continued) | | | | | | | | |
| Domain Holdings Australia Ltd. | | | 7,277 | | | $ | 16,977 | |
| Nine Entertainment Co. Holdings Ltd. | | | 15,594 | | | | 15,038 | |
| Vocus Group Ltd.* | | | 7,770 | | | | 15,966 | |
| | | | | | | | | |
| Consumer Discretionary — 0.2% | | | | | | | | |
| AP Eagers Ltd. | | | 3,721 | | | | 17,563 | |
| Bapcor Ltd. | | | 3,918 | | | | 16,159 | |
| Corporate Travel Management Ltd. | | | 1,885 | | | | 12,835 | |
| Domino’s Pizza Enterprises Ltd. | | | 380 | | | | 18,217 | |
| GUD Holdings Ltd. | | | 2,315 | | | | 18,512 | |
| IDP Education Ltd. | | | 1,367 | | | | 14,815 | |
| InvoCare Ltd. | | | 2,037 | | | | 14,813 | |
| JB Hi-Fi Ltd. | | | 628 | | | | 18,789 | |
| Star Entertainment Grp Ltd. (The) | | | 7,904 | | | | 15,705 | |
| Webjet Ltd. | | | 5,510 | | | | 12,883 | |
| | | | | | | | | |
| Consumer Staples — 0.0% | | | | | | | | |
| GrainCorp Ltd. - Class A* | | | 5,457 | | | | 15,582 | |
| Metcash Ltd. | | | 8,885 | | | | 16,764 | |
| | | | | | | | | |
| Financials — 0.1% | | | | | | | | |
| Bank of Queensland Ltd. | | | 4,805 | | | | 20,647 | |
| nib holdings Ltd. | | | 5,082 | | | | 16,219 | |
| Steadfast Group Ltd. | | | 7,097 | | | | 16,629 | |
| | | | | | | | | |
| Health Care — 2.0% | | | | | | | | |
| Ansell Ltd. | | | 57,183 | | | | 1,453,590 | |
| Mesoblast Ltd.* | | | 6,229 | | | | 14,327 | |
| | | | | | | | | |
| Industrials — 0.1% | | | | | | | | |
| ALS Ltd. | | | 3,228 | | | | 14,740 | |
| Atlas Arteria Ltd. | | | 3,317 | | | | 15,318 | |
| Cleanaway Waste Management Ltd. | | | 11,939 | | | | 18,331 | |
| Downer EDI Ltd. | | | 5,368 | | | | 16,431 | |
| Qube Holdings Ltd. | | | 8,458 | | | | 17,158 | |
| | | | | | | | | |
| Information Technology — 1.8% | | | | | | | | |
| Afterpay Ltd.* | | | 3,302 | | | | 142,606 | |
| Altium Ltd. | | | 621 | | | | 14,070 | |
| Appen Ltd. | | | 46,938 | | | | 1,114,461 | |
| Hansen Technologies Ltd. | | | 7,186 | | | | 14,531 | |
| IRESS Ltd. | | | 2,050 | | | | 15,669 | |
| nearmap Ltd.* | | | 11,816 | | | | 18,684 | |
| NEXTDC Ltd.* | | | 2,425 | | | | 16,680 | |
| | | | | | | | | |
| Materials — 1.7% | | | | | | | | |
| Mineral Resources Ltd. | | | 83,775 | | | | 1,240,503 | |
| Orora Ltd. | | | 7,248 | | | | 12,815 | |
| Pact Group Holdings Ltd.* | | | 10,915 | | | | 16,662 | |
| Saracen Mineral Holdings Ltd.* | | | 4,183 | | | | 15,932 | |
| | | | | | | | | |
| Real Estate — 1.9% | | | | | | | | |
| Abacus Property Group REIT | | | 9,132 | | | | 17,057 | |
| Charter Hall Group REIT | | | 191,683 | | | | 1,298,551 | |
| Charter Hall Retail REIT | | | 7,231 | | | | 16,834 | |
| Charter Hall Social Infrastructure REIT | | | 9,754 | | | | 15,966 | |
| National Storage REIT | | | 12,951 | | | | 16,574 | |
| Shopping Centres Australasia Property Group REIT | | | 10,279 | | | | 15,497 | |
| Total Australia | | | | | | | 5,864,814 | |
| | | | | | | | | |
| Germany — 7.5% | | | | | | | | |
| | | | | | | | | |
| Communication Services — 0.0% | | | | | | | | |
| ProSiebenSat.1 Media SE* | | | 1,192 | | | | 14,245 | |
| Scout24 AG, 144a | | | 203 | | | | 15,706 | |
| | | | | | | | | |
| Consumer Discretionary — 0.1% | | | | | | | | |
| HelloFresh SE* | | | 353 | | | | 18,884 | |
| zooplus AG* | | | 97 | | | | 15,911 | |
| | | | | | | | | |
| Health Care — 1.4% | | | | | | | | |
| CompuGroup Medical SE & Co. KgaA | | | 13,008 | | | | 1,024,476 | |
| MorphoSys AG* | | | 116 | | | | 14,707 | |
| | | | | | | | | |
| Industrials — 1.8% | | | | | | | | |
| Rheinmetall AG | | | 14,974 | | | | 1,301,200 | |
| | | | | | | | | |
| Real Estate — 4.2% | | | | | | | | |
| alstria office AG REIT* | | | 65,605 | | | | 976,412 | |
| Grand City Properties SA | | | 46,451 | | | | 1,074,330 | |
| TAG Immobilien AG | | | 44,722 | | | | 1,068,141 | |
| Total Germany | | | | | | | 5,524,012 | |
| | | | | | | | | |
| Denmark — 5.7% | | | | | | | | |
| | | | | | | | | |
| Consumer Staples — 2.3% | | | | | | | | |
| Royal Unibrew A/S* | | | 20,946 | | | | 1,746,099 | |
| | | | | | | | | |
| Health Care — 1.6% | | | | | | | | |
| ALK-Abello A/S* | | | 4,333 | | | | 1,159,889 | |
| Ambu A/S | | | 465 | | | | 14,700 | |
| | | | | | | | | |
| Industrials — 1.8% | | | | | | | | |
| ROCKWOOL International A/S - Class B | | | 4,888 | | | | 1,330,290 | |
| Total Denmark | | | | | | | 4,250,978 | |
| | | | | | | | | |
| Netherlands — 5.6% | | | | | | | | |
| | | | | | | | | |
| Energy — 1.5% | | | | | | | | |
| SBM Offshore NV | | | 73,812 | | | | 1,087,659 | |
| | | | | | | | | |
| Financials — 3.5% | | | | | | | | |
| ASR Nederland NV | | | 39,112 | | | | 1,201,383 | |
| Euronext NV., 144a | | | 13,874 | | | | 1,391,179 | |
| | | | | | | | | |
| Health Care — 0.6% | | | | | | | | |
| Argenx SE* | | | 93 | | | | 20,934 | |
| Pharming Group NV* | | | 346,407 | | | | 453,794 | |
| Total Netherlands | | | | | | | 4,154,949 | |
| | | | | | | | | |
| Sweden — 4.1% | | | | | | | | |
| | | | | | | | | |
| Communication Services — 0.1% | | | | | | | | |
| Embracer Group AB* | | | 1,200 | | | | 16,862 | |
| Modern Times Group MTG AB - Class B* | | | 1,428 | | | | 15,565 | |
| Nordic Entertainment Group AB - Class B* | | | 532 | | | | 16,362 | |
| | | | | | | | | |
| Consumer Discretionary — 0.3% | | | | | | | | |
| Betsson AB | | | 2,252 | | | | 15,700 | |
| Betsson AB* | | | 2,252 | | | | 694 | |
| Boozt AB, 144a* | | | 2,093 | | | | 20,620 | |
| Dometic Group AB, 144a* | | | 1,799 | | | | 16,257 | |
| Dustin Group AB, 144a | | | 2,826 | | | | 15,431 | |
| Evolution Gaming Group AB, 144a | | | 263 | | | | 15,621 | |
| LeoVegas AB, 144a | | | 3,426 | | | | 15,387 | |
| NetEnt AB | | | 3,645 | | | | 28,068 | |
| New Wave Group AB - Class B* | | | 11,172 | | | | 37,552 | |
| Pandox AB* | | | 1,441 | | | | 16,726 | |
| SkiStar AB | | | 1,529 | | | | 15,670 | |
| Thule Group AB, 144a | | | 698 | | | | 17,723 | |
| | | | | | | | | |
| Financials — 0.0% | | | | | | | | |
| Collector AB* | | | 11,741 | | | | 17,123 | |
| | | | | | | | | |
| Health Care — 0.1% | | | | | | | | |
| Arjo AB - Class B | | | 2,810 | | | | 15,689 | |
| Hansa Biopharma AB* | | | 1,109 | | | | 20,676 | |
| Oncopeptides AB, 144a* | | | 1,045 | | | | 14,687 | |
| Vitrolife AB* | | | 774 | | | | 17,294 | |
| | | | | | | | | |
| Industrials — 2.2% | | | | | | | | |
| Adapteo Oyj* | | | 1,877 | | | | 16,022 | |
Touchstone International Small Cap Fund (Continued)
| | | | | | Market | |
| | | Shares | | | Value | |
| Common Stocks — 97.4% (Continued) | | | | | | | | |
| | | | | | | | | |
| Sweden — (Continued) | | | | | | | | |
| | | | | | | | | |
| Industrials — (Continued) | | | | | | | | |
| AF Poyry AB* | | | 733 | | | $ | 15,850 | |
| Alimak Group AB, 144a | | | 1,444 | | | | 15,656 | |
| Indutrade AB* | | | 39,766 | | | | 1,577,200 | |
| Loomis AB* | | | 626 | | | | 14,954 | |
| Nobina AB, 144a* | | | 2,599 | | | | 15,575 | |
| | | | | | | | | |
| Materials — 0.0% | | | | | | | | |
| BillerudKorsnas AB | | | 1,164 | | | | 16,707 | |
| | | | | | | | | |
| Real Estate — 1.4% | | | | | | | | |
| Kungsleden AB | | | 135,433 | | | | 1,013,618 | |
| Samhallsbyggnadsbolaget i Norden AB | | | 7,832 | | | | 20,123 | |
| Total Sweden | | | | | | | 3,055,412 | |
| | | | | | | | | |
| Italy — 3.7% | | | | | | | | |
| | | | | | | | | |
| Financials — 0.0% | | | | | | | | |
| Unione di Banche Italiane SpA* | | | 5,627 | | | | 18,470 | |
| | | | | | | | | |
| Materials — 2.0% | | | | | | | | |
| Buzzi Unicem SpA | | | 68,690 | | | | 1,484,234 | |
| | | | | | | | | |
| Utilities — 1.7% | | | | | | | | |
| Iren SpA | | | 491,117 | | | | 1,219,569 | |
| Total Italy | | | | | | | 2,722,273 | |
| | | | | | | | | |
| France — 3.6% | | | | | | | | |
| | | | | | | | | |
| Health Care — 1.9% | | | | | | | | |
| Korian SA* | | | 38,681 | | | | 1,419,715 | |
| Orpea | | | 128 | | | | 14,784 | |
| | | | | | | | | |
| Industrials — 1.7% | | | | | | | | |
| Elis SA* | | | 1,302 | | | | 15,275 | |
| Nexans SA* | | | 25,934 | | | | 1,206,612 | |
| Rexel SA* | | | 1,548 | | | | 17,742 | |
| | | | | | | | | |
| Utilities — 0.0% | | | | | | | | |
| Rubis SCA | | | 320 | | | | 15,428 | |
| Total France | | | | | | | 2,689,556 | |
| | | | | | | | | |
| Singapore — 2.9% | | | | | | | | |
| | | | | | | | | |
| Information Technology — 1.5% | | | | | | | | |
| Venture Corp. Ltd. | | | 96,100 | | | | 1,123,092 | |
| | | | | | | | | |
| Real Estate — 1.4% | | | | | | | | |
| Mapletree Commercial Trust REIT | | | 717,730 | | | | 1,004,252 | |
| Total Singapore | | | | | | | 2,127,344 | |
| | | | | | | | | |
| Canada — 2.4% | | | | | | | | |
| | | | | | | | | |
| Real Estate — 0.8% | | | | | | | | |
| Real Matters, Inc.* | | | 29,312 | | | | 571,731 | |
| | | | | | | | | |
| Utilities — 1.6% | | | | | | | | |
| Capital Power Corp. | | | 56,425 | | | | 1,162,914 | |
| Total Canada | | | | | | | 1,734,645 | |
| | | | | | | | | |
| Switzerland — 2.1% | | | | | | | | |
| | | | | | | | | |
| Communication Services — 0.1% | | | | | | | | |
| APG SGA SA* | | | 83 | | | | 15,506 | |
| TX Group AG | | | 213 | | | | 15,804 | |
| | | | | | | | | |
| Consumer Discretionary — 0.0% | | | | | | | | |
| Autoneum Holding AG* | | | 171 | | | | 16,695 | |
| | | | | | | | | |
| Consumer Staples — 0.0% | | | | | | | | |
| Zur Rose Group AG* | | | 74 | | | | 20,249 | |
| | | | | | | | | |
| Financials — 0.1% | | | | | | | | |
| Banque Cantonale Vaudoise | | | 160 | | | | 15,581 | |
| Helvetia Holding AG | | | 176 | | | | 16,486 | |
| St Galler Kantonalbank AG | | | 35 | | | | 15,670 | |
| Valiant Holding AG | | | 168 | | | | 15,676 | |
| | | | | | | | | |
| Health Care — 1.6% | | | | | | | | |
| Ascom Holding AG* | | | 2,066 | | | | 19,097 | |
| Basilea Pharmaceutica AG* | | | 284 | | | | 14,670 | |
| Coltene Holding AG | | | 201 | | | | 15,126 | |
| Idorsia Ltd.* | | | 474 | | | | 15,235 | |
| Siegfried Holding AG | | | 2,495 | | | | 1,135,406 | |
| | | | | | | | | |
| Industrials — 0.2% | | | | | | | | |
| Belimo Holding AG | | | 2 | | | | 14,801 | |
| Bobst Group SA | | | 259 | | | | 15,338 | |
| Burckhardt Compression Holding AG | | | 77 | | | | 18,865 | |
| DKSH Holding AG | | | 279 | | | | 17,975 | |
| Feintool International Holding AG* | | | 328 | | | | 16,736 | |
| Flughafen Zurich AG* | | | 120 | | | | 15,673 | |
| Interroll Holding AG | | | 7 | | | | 14,126 | |
| Komax Holding AG* | | | 107 | | | | 17,419 | |
| Rieter Holding AG | | | 167 | | | | 15,441 | |
| Stadler Rail AG | | | 375 | | | | 15,476 | |
| VAT Group AG, 144a | | | 87 | | | | 15,980 | |
| | | | | | | | | |
| Information Technology — 0.1% | | | | | | | | |
| Kudelski SA | | | 4,817 | | | | 17,490 | |
| Logitech International SA | | | 259 | | | | 16,972 | |
| | | | | | | | | |
| Materials — 0.0% | | | | | | | | |
| SIG Combibloc Group AG | | | 907 | | | | 14,758 | |
| | | | | | | | | |
| Real Estate — 0.0% | | | | | | | | |
| IWG PLC | | | 5,694 | | | | 18,718 | |
| Total Switzerland | | | | | | | 1,576,969 | |
| | | | | | | | | |
| Austria — 1.7% | | | | | | | | |
| | | | | | | | | |
| Industrials — 1.7% | | | | | | | | |
| ANDRITZ AG* | | | 33,558 | | | | 1,223,555 | |
| | | | | | | | | |
| Spain — 1.6% | | | | | | | | |
| | | | | | | | | |
| Consumer Staples — 1.6% | | | | | | | | |
| Viscofan SA | | | 17,850 | | | | 1,165,165 | |
| | | | | | | | | |
| Health Care — 0.0% | | | | | | | | |
| Pharma Mar SA | | | 2,396 | | | | 20,620 | |
| | | | | | | | | |
| Real Estate — 0.0% | | | | | | | | |
| Merlin Properties Socimi SA REIT | | | 1,894 | | | | 15,783 | |
| Total Spain | | | | | | | 1,201,568 | |
| | | | | | | | | |
| Luxembourg — 1.1% | | | | | | | | |
| | | | | | | | | |
| Materials — 1.1% | | | | | | | | |
| APERAM SA | | | 30,154 | | | | 840,852 | |
| | | | | | | | | |
| Hong Kong — 1.1% | | | | | | | | |
| | | | | | | | | |
| Materials — 1.1% | | | | | | | | |
| Nine Dragons Paper Holdings Ltd. | | | 873,000 | | | | 798,183 | |
| | | | | | | | | |
| Ireland — 0.8% | | | | | | | | |
| | | | | | | | | |
| Consumer Staples — 0.8% | | | | | | | | |
| Greencore Group PLC | | | 377,213 | | | | 587,995 | |
| | | | | | | | | |
| China — 0.7% | | | | | | | | |
| | | | | | | | | |
| Industrials — 0.7% | | | | | | | | |
| Ever Sunshine Lifestyle Services Group Ltd. | | | 342,955 | | | | 534,991 | |
| | | | | | | | | |
| Israel — 0.4% | | | | | | | | |
| | | | | | | | | |
| Consumer Staples — 0.0% | | | | | | | | |
| Rami Levy Chain Stores Hashikma Marketing 2006 Ltd. | | | 241 | | | | 13,367 | |
| | | | | | | | | |
| Financials — 0.2% | | | | | | | | |
| Clal Insurance Enterprises Holdings Ltd.* | | | 6,987 | | | | 58,680 | |
| FIBI Holdings Ltd. | | | 564 | | | | 13,762 | |
Touchstone International Small Cap Fund (Continued)
| | | | | | Market | |
| | | Shares | | | Value | |
| Common Stocks — 97.4% (Continued) | | | | | | | | |
| | | | | | | | | |
| Israel — (Continued) | | | | | | | | |
| | | | | | | | | |
| Financials — (Continued) | | | | | | | | |
| IDI Insurance Co. Ltd. | | | 498 | | | $ | 11,624 | |
| Menora Mivtachim Holdings Ltd. | | | 1,141 | | | | 11,481 | |
| Migdal Insurance & Financial Holdings Ltd. | | | 127,384 | | | | 66,467 | |
| | | | | | | | | |
| Industrials — 0.0% | | | | | | | | |
| Kornit Digital Ltd.* | | | 300 | | | | 16,014 | |
| | | | | | | | | |
| Information Technology — 0.1% | | | | | | | | |
| Hilan Ltd.* | | | 382 | | | | 15,464 | |
| Ituran Location and Control Ltd. | | | 908 | | | | 14,546 | |
| Radware Ltd.* | | | 639 | | | | 15,074 | |
| | | | | | | | | |
| Materials — 0.0% | | | | | | | | |
| Hadera Paper Ltd.* | | | 918 | | | | 28,182 | |
| | | | | | | | | |
| Real Estate — 0.1% | | | | | | | | |
| Property & Building Corp. Ltd. | | | 403 | | | | 24,166 | |
| Reit 1 Ltd. REIT | | | 3,460 | | | | 12,694 | |
| Total Israel | | | | | | | 301,521 | |
| | | | | | | | | |
| Argentina — 0.4% | | | | | | | | |
| Information Technology — 0.4% | | | | | | | | |
| Globant SA* | | | 1,764 | | | | 264,335 | |
| | | | | | | | | |
| Belgium — 0.3% | | | | | | | | |
| | | | | | | | | |
| Communication Services — 0.0% | | | | | | | | |
| Kinepolis Group NV* | | | 418 | | | | 18,936 | |
| | | | | | | | | |
| Consumer Staples — 0.0% | | | | | | | | |
| Ontex Group NV* | | | 989 | | | | 14,538 | |
| | | | | | | | | |
| Energy — 0.0% | | | | | | | | |
| Euronav NV | | | 1,529 | | | | 12,345 | |
| | | | | | | | | |
| Health Care — 0.1% | | | | | | | | |
| AGFA-Gevaert NV* | | | 3,782 | | | | 15,808 | |
| Biocartis NV, 144a* | | | 2,793 | | | | 14,578 | |
| | | | | | | | | |
| Industrials — 0.0% | | | | | | | | |
| bpost SA* | | | 2,384 | | | | 16,114 | |
| | | | | | | | | |
| Real Estate — 0.2% | | | | | | | | |
| Aedifica SA REIT | | | 148 | | | | 16,207 | |
| Befimmo SA REIT | | | 376 | | | | 16,860 | |
| Cofinimmo SA REIT | | | 114 | | | | 15,721 | |
| Intervest Offices & Warehouses NV REIT | | | 652 | | | | 16,802 | |
| Montea C.V.A REIT | | | 161 | | | | 16,196 | |
| Retail Estates NV REIT* | | | 257 | | | | 17,343 | |
| Warehouses De Pauw CVA REIT | | | 570 | | | | 15,660 | |
| | | | | | | | | |
| Utilities — 0.0% | | | | | | | | |
| Elia Group SA/NV | | | 132 | | | | 14,360 | |
| Total Belgium | | | | | | | 221,468 | |
| | | | | | | | | |
| Norway — 0.2% | | | | | | | | |
| | | | | | | | | |
| Consumer Discretionary — 0.0% | | | | | | | | |
| Europris ASA, 144a | | | 3,636 | | | | 17,627 | |
| | | | | | | | | |
| Energy — 0.0% | | | | | | | | |
| Frontline Ltd. | | | 1,904 | | | | 13,258 | |
| | | | | | | | | |
| Financials — 0.1% | | | | | | | | |
| Protector Forsikring ASA* | | | 4,336 | | | | 16,555 | |
| Sbanken ASA, 144a* | | | 2,523 | | | | 16,522 | |
| SpareBank 1 Nord Norge | | | 2,561 | | | | 16,621 | |
| SpareBank 1 SMN | | | 2,089 | | | | 17,084 | |
| | | | | | | | | |
| Industrials — 0.1% | | | | | | | | |
| NEL ASA* | | | 11,345 | | | | 22,596 | |
| Stolt-Nielsen Ltd. | | | 1,710 | | | | 15,620 | |
| Wallenius Wilhelmsen ASA* | | | 10,046 | | | | 13,207 | |
| | | | | | | | | |
| Materials — 0.0% | | | | | | | | |
| Borregaard ASA | | | 1,516 | | | | 16,161 | |
| Total Norway | | | | | | | 165,251 | |
| | | | | | | | | |
| Finland — 0.1% | | | | | | | | |
| | | | | | | | | |
| Communication Services — 0.0% | | | | | | | | |
| Rovio Entertainment Oyj, 144a | | | 2,526 | | | | 15,588 | |
| | | | | | | | | |
| Financials — 0.0% | | | | | | | | |
| Aktia Bank Oyj* | | | 1,647 | | | | 16,321 | |
| | | | | | | | | |
| Industrials — 0.1% | | | | | | | | |
| Finnair Oyj* | | | 5,037 | | | | 4,471 | |
| Valmet OYJ | | | 611 | | | | 16,014 | |
| | | | | | | | | |
| Information Technology — 0.0% | | | | | | | | |
| F-Secure Oyj* | | | 4,707 | | | | 15,207 | |
| Total Finland | | | | | | | 67,601 | |
| | | | | | | | | |
| Malta — 0.0% | | | | | | | | |
| | | | | | | | | |
| Consumer Discretionary — 0.0% | | | | | | | | |
| Kindred Group PLC SDR | | | 2,882 | | | | 17,399 | |
| | | | | | | | | |
| Egypt — 0.0% | | | | | | | | |
| | | | | | | | | |
| Materials — 0.0% | | | | | | | | |
| Centamin PLC | | | 6,848 | | | | 15,632 | |
| | | | | | | | | |
| Faroe Islands — 0.0% | | | | | | | | |
| | | | | | | | | |
| Consumer Staples — 0.0% | | | | | | | | |
| Bakkafrost* | | | 245 | | | | 15,491 | |
| | | | | | | | | |
| Liechtenstein — 0.0% | | | | | | | | |
| | | | | | | | | |
| Financials — 0.0% | | | | | | | | |
| Liechtensteinische Landesbank AG | | | 249 | | | | 15,296 | |
| Total Common Stocks | | | | | | $ | 72,149,712 | |
| | | | | | | | | |
| Exchange-Traded Fund — 1.1% | | | | | | | | |
| | | | | | | | | |
| United States — 1.1% | | | | | | | | |
| iShares MSCI EAFE Small-Cap ETF | | | 16,038 | | | $ | 859,958 | |
| | | Number | | | | |
| | | of | | | | |
| | | Rights | | | | |
| Rights — 0.0% | | | | | | | | |
| | | | | | | | | |
| Finland — 0.0% | | | | | | | | |
| | | | | | | | | |
| Industrials — 0.0% | | | | | | | | |
| Finnair Oyj* | | | 5,037 | | | $ | 12,224 | |
| | | | | | | | | |
| Short-Term Investment Fund — 0.5% | | | | | | | | |
| Dreyfus Government Cash Management, Institutional Shares, 0.09%∞Ω | | | 343,376 | | | $ | 343,376 | |
| | | | | | | | | |
Total Investment Securities — 99.0%
(Cost $65,573,753) | | | | | | $ | 73,365,270 | |
| | | | | | | | | |
| Other Assets in Excess of Liabilities — 1.0% | | | | | | | 709,774 | |
| | | | | | | | | |
| Net Assets — 100.0% | | | | | | $ | 74,075,044 | |
| * | Non-income producing security. |
| Ω | Represents the 7-day SEC yield as of June 30, 2020. |
Touchstone International Small Cap Fund (Continued)
Portfolio Abbreviations:
ETF - Exchange-Traded Fund
PLC - Public Limited Company
REIT - Real Estate Investment Trust
SDR - Special Drawing Rights
144a - This is a restricted security that was sold in a transaction qualifying for the exemption under Rule 144a of the Securities Act of 1933. This security may be sold in transactions exempt from registration, normally to qualified institutional buyers. At June 30, 2020, these securities were valued at $1,678,984 or 2.3% of net assets. These securities were deemed liquid pursuant to procedures approved by the Board of Trustees.
Other Information:
The inputs or methodology used for valuing securities may not be an indication of the risk associated with investing in those securities. For more information on valuation inputs, and their aggregation into the levels used in the table below, please refer to the security valuation section in the accompanying Notes to Financial Statements.
Valuation inputs at Reporting Date:
| Description | | Level 1 | | | Level 2 | | | Level 3 | | | Total | |
| Common Stocks | | | | | | | | | | | | | | | | |
| Japan | | $ | 13,549 | | | $ | 19,871,485 | | | $ | — | | | $ | 19,885,034 | |
| United Kingdom | | | 62,556 | | | | 12,230,032 | | | | — | | | | 12,292,588 | |
| Australia | | | — | | | | 5,864,814 | | | | — | | | | 5,864,814 | |
| Germany | | | 1,040,387 | | | | 4,483,625 | | | | — | | | | 5,524,012 | |
| Denmark | | | — | | | | 4,250,978 | | | | — | | | | 4,250,978 | |
| Netherlands | | | 3,046,356 | | | | 1,108,593 | | | | — | | | | 4,154,949 | |
| Sweden | | | 36,268 | | | | 3,019,144 | | | | — | | | | 3,055,412 | |
| Italy | | | — | | | | 2,722,273 | | | | — | | | | 2,722,273 | |
| France | | | — | | | | 2,689,556 | | | | — | | | | 2,689,556 | |
| Singapore | | | — | | | | 2,127,344 | | | | — | | | | 2,127,344 | |
| Canada | | | 1,734,645 | | | | — | | | | — | | | | 1,734,645 | |
| Switzerland | | | 94,747 | | | | 1,482,222 | | | | — | | | | 1,576,969 | |
| Austria | | | — | | | | 1,223,555 | | | | — | | | | 1,223,555 | |
| Spain | | | 1,185,785 | | | | 15,783 | | | | — | | | | 1,201,568 | |
| Luxembourg | | | 840,852 | | | | — | | | | — | | | | 840,852 | |
| Hong Kong | | | — | | | | 798,183 | | | | — | | | | 798,183 | |
| Ireland | | | 587,995 | | | | — | | | | — | | | | 587,995 | |
| China | | | — | | | | 534,991 | | | | — | | | | 534,991 | |
| Israel | | | 45,634 | | | | 255,887 | | | | — | | | | 301,521 | |
| Argentina | | | 264,335 | | | | — | | | | — | | | | 264,335 | |
| Belgium | | | — | | | | 221,468 | | | | — | | | | 221,468 | |
| Norway | | | 16,555 | | | | 148,696 | | | | — | | | | 165,251 | |
| Finland | | | 20,792 | | | | 46,809 | | | | — | | | | 67,601 | |
| Malta | | | — | | | | 17,399 | | | | — | | | | 17,399 | |
| Egypt | | | — | | | | 15,632 | | | | — | | | | 15,632 | |
| Faroe Islands | | | — | | | | 15,491 | | | | — | | | | 15,491 | |
| Liechtenstein | | | 15,296 | | | | — | | | | — | | | | 15,296 | |
| Exchange-Traded Fund | | | 859,958 | | | | — | | | | — | | | | 859,958 | |
| Rights Finland | | | — | | | | 12,224 | | | | — | | | | 12,224 | |
| Short-Term Investment Fund | | | 343,376 | | | | — | | | | — | | | | 343,376 | |
| Total | | $ | 10,209,086 | | | $ | 63,156,184 | | | $ | — | | | $ | 73,365,270 | |
See accompanying Notes to Financial Statements.
Portfolio of Investments
Touchstone Large Cap Focused Fund – June 30, 2020
| | | | | | Market | |
| | | Shares | | | Value | |
| Common Stocks — 99.5% | | | | | | | | |
| | | | | | | | | |
| Information Technology — 28.7% | | | | | | | | |
| Apple, Inc. | | | 313,352 | | | $ | 114,310,810 | |
| Cisco Systems, Inc. | | | 516,190 | | | | 24,075,102 | |
| International Business Machines Corp. | | | 126,938 | | | | 15,330,302 | |
| Microsoft Corp. | | | 658,018 | | | | 133,913,243 | |
| Oracle Corp. | | | 509,934 | | | | 28,184,052 | |
| salesforce.com, Inc.* | | | 223,368 | | | | 41,843,527 | |
| SS&C Technologies Holdings, Inc. | | | 271,618 | | | | 15,340,985 | |
| Texas Instruments, Inc. | | | 213,715 | | | | 27,135,394 | |
| Visa, Inc. - Class A | | | 242,025 | | | | 46,751,969 | |
| Workday, Inc. - Class A* | | | 127,620 | | | | 23,910,883 | |
| | | | | | | | 470,796,267 | |
| | | | | | | | | |
| Communication Services — 17.2% | | | | | | | | |
| Alphabet, Inc. - Class C* | | | 63,799 | | | | 90,186,904 | |
| AT&T, Inc. | | | 330,323 | | | | 9,985,664 | |
| Baidu, Inc. (China) ADR* | | | 20,518 | | | | 2,459,903 | |
| Comcast Corp. - Class A | | | 947,256 | | | | 36,924,039 | |
| Facebook, Inc. - Class A* | | | 348,792 | | | | 79,200,199 | |
| Fox Corp. - Class A | | | 543,444 | | | | 14,575,168 | |
| Netflix, Inc.* | | | 64,980 | | | | 29,568,499 | |
| Walt Disney Co. (The) | | | 173,087 | | | | 19,300,931 | |
| | | | | | | | 282,201,307 | |
| | | | | | | | | |
| Consumer Discretionary — 13.6% | | | | | | | | |
| Alibaba Group Holding Ltd. (China) ADR* | | | 127,227 | | | | 27,442,864 | |
| Amazon.com, Inc.* | | | 35,503 | | | | 97,946,387 | |
| Home Depot, Inc. (The) | | | 55,322 | | | | 13,858,714 | |
| JD.com, Inc. (China) ADR* | | | 466,788 | | | | 28,091,302 | |
| McDonald’s Corp. | | | 69,539 | | | | 12,827,859 | |
| Starbucks Corp. | | | 294,972 | | | | 21,706,990 | |
| TJX Cos, Inc. (The) | | | 97,431 | | | | 4,926,111 | |
| Trip.com Group Ltd. (China) ADR* | | | 620,366 | | | | 16,079,887 | |
| | | | | | | | 222,880,114 | |
| | | | | | | | | |
| Health Care — 11.8% | | | | | | | | |
| AmerisourceBergen Corp. | | | 146,959 | | | | 14,809,058 | |
| Amgen, Inc. | | | 28,979 | | | | 6,834,987 | |
| Becton Dickinson and Co. | | | 82,860 | | | | 19,825,912 | |
| Bristol-Myers Squibb Co. | | | 451,467 | | | | 26,546,260 | |
| HCA Healthcare, Inc. | | | 260,397 | | | | 25,274,133 | |
| Johnson & Johnson | | | 331,738 | | | | 46,652,315 | |
| Merck & Co., Inc. | | | 149,633 | | | | 11,571,120 | |
| UnitedHealth Group, Inc. | | | 140,161 | | | | 41,340,487 | |
| | | | | | | | 192,854,272 | |
| | | | | | | | | |
| Financials — 10.2% | | | | | | | | |
| Berkshire Hathaway, Inc. - Class B* | | | 360,724 | | | | 64,392,841 | |
| CME Group, Inc. | | | 68,884 | | | | 11,196,405 | |
| Goldman Sachs Group, Inc. (The) | | | 168,905 | | | | 33,379,006 | |
| JPMorgan Chase & Co. | | | 325,000 | | | | 30,569,500 | |
| Signature Bank/NewYork NY | | | 250,616 | | | | 26,795,863 | |
| | | | | | | | 166,333,615 | |
| | | | | | | | | |
| Industrials — 9.2% | | | | | | | | |
| Boeing Co. (The) | | | 34,536 | | | | 6,330,449 | |
| Deere & Co. | | | 168,320 | | | | 26,451,488 | |
| FedEx Corp. | | | 22,077 | | | | 3,095,637 | |
| Honeywell International, Inc. | | | 107,698 | | | | 15,572,054 | |
| Hubbell, Inc. | | | 220,002 | | | | 27,579,451 | |
| Parker-Hannifin Corp. | | | 104,544 | | | | 19,159,779 | |
| Raytheon Technologies Corp. | | | 392,445 | | | | 24,182,461 | |
| Union Pacific Corp. | | | 162,317 | | | | 27,442,935 | |
| | | | | | | | 149,814,254 | |
| | | | | | | | | |
| Consumer Staples — 3.9% | | | | | | | | |
| Monster Beverage Corp.* | | | 314,464 | | | | 21,798,645 | |
| Philip Morris International, Inc. | | | 373,434 | | | | 26,162,786 | |
| Procter & Gamble Co. (The) | | | 75,579 | | | | 9,036,981 | |
| Unilever NV (United Kingdom) | | | 135,253 | | | | 7,204,927 | |
| | | | | | | | 64,203,339 | |
| | | | | | | | | |
| Energy — 2.5% | | | | | | | | |
| Chevron Corp. | | | 172,149 | | | | 15,360,855 | |
| Exxon Mobil Corp. | | | 455,000 | | | | 20,347,600 | |
| Schlumberger Ltd. | | | 248,127 | | | | 4,563,056 | |
| | | | | | | | 40,271,511 | |
| | | | | | | | | |
| Real Estate — 1.4% | | | | | | | | |
| Jones Lang LaSalle, Inc. | | | 227,906 | | | | 23,579,155 | |
| | | | | | | | | |
| Materials — 1.0% | | | | | | | | |
| DuPont de Nemours, Inc. | | | 306,133 | | | | 16,264,846 | |
| Total Common Stocks | | | | | | $ | 1,629,198,680 | |
| | | | | | | | | |
| Exchange Traded Fund — 0.6% | | | | | | | | |
| Utilities Select Sector SPDR Fund† | | | 180,301 | | | $ | 10,174,385 | |
| | | | | | | | | |
| Short-Term Investment Funds — 0.7% | | | | | | | | |
| Dreyfus Government Cash Management, Institutional Shares, 0.09%∞Ω | | | 578,285 | | | $ | 578,285 | |
| Invesco Government & Agency Portfolio, Institutional Class, 0.09%**∞Ω | | | 10,626,001 | | | | 10,626,001 | |
| Total Short-Term Investment Funds | | | | | | $ | 11,204,286 | |
| | | | | | | | | |
Total Investment Securities — 100.8%
(Cost $973,253,578) | | | | | | $ | 1,650,577,351 | |
| | | | | | | | | |
| Liabilities in Excess of Other Assets — (0.8%) | | | | | | | (12,755,654 | ) |
| | | | | | | | | |
| Net Assets — 100.0% | | | | | | $ | 1,637,821,697 | |
| * | Non-income producing security. |
| ** | Represents collateral for securities loaned. |
| † | All or a portion of the security is on loan. The total market value of the securities on loan as of June 30, 2020 was $10,174,385 |
| Ω | Represents the 7-day SEC yield as of June 30, 2020. |
Portfolio Abbreviations:
ADR - American Depositary Receipt
SPDR - Standard & Poor’s Depositary Receipt
Other Information:
The inputs or methodology used for valuing securities may not be an indication of the risk associated with investing in those securities. For more information on valuation inputs, and their aggregation into the levels used in the table below, please refer to the security valuation section in the accompanying Notes to Financial Statements.
Valuation inputs at Reporting Date:
| Description | | Level 1 | | | Level 2 | | | Level 3 | | | Total | |
| Common Stocks | | $ | 1,629,198,680 | | | $ | — | | | $ | — | | | $ | 1,629,198,680 | |
| Exchanged Traded Fund | | | 10,174,385 | | | | — | | | | — | | | | 10,174,385 | |
| Short-Term Investment Funds | | | 11,204,286 | | | | — | | | | — | | | | 11,204,286 | |
| Total | | $ | 1,650,577,351 | | | $ | — | | | $ | — | | | $ | 1,650,577,351 | |
See accompanying Notes to Financial Statements.
Portfolio of Investments
Touchstone Large Cap Fund – June 30, 2020
| | | | | | Market | |
| | | Shares | | | Value | |
| Common Stocks — 96.9% | | | | | | | | |
| | | | | | | | | |
| Information Technology — 23.0% | | | | | | | | |
| Apple, Inc. | | | 59,681 | | | $ | 21,771,629 | |
| Cisco Systems, Inc. | | | 175,861 | | | | 8,202,157 | |
| Citrix Systems, Inc. | | | 70,357 | | | | 10,406,504 | |
| Texas Instruments, Inc. | | | 80,280 | | | | 10,193,152 | |
| Visa, Inc. - Class A | | | 66,468 | | | | 12,839,624 | |
| | | | | | | | 63,413,066 | |
| | | | | | | | | |
| Financials — 15.8% | | | | | | | | |
| Berkshire Hathaway, Inc. - Class B* | | | 93,490 | | | | 16,688,900 | |
| BlackRock, Inc. | | | 17,344 | | | | 9,436,697 | |
| Charles Schwab Corp. (The) | | | 158,048 | | | | 5,332,540 | |
| Progressive Corp. (The) | | | 101,744 | | | | 8,150,712 | |
| Wells Fargo & Co. | | | 154,817 | | | | 3,963,315 | |
| | | | | | | | 43,572,164 | |
| | | | | | | | | |
| Consumer Discretionary — 15.7% | | | | | | | | |
| CarMax, Inc.* | | | 115,891 | | | | 10,378,039 | |
| Dollar Tree, Inc.* | | | 69,768 | | | | 6,466,098 | |
| Home Depot, Inc. (The) | | | 44,792 | | | | 11,220,844 | |
| Lowe’s Cos., Inc. | | | 38,389 | | | | 5,187,122 | |
| O’Reilly Automotive, Inc.* | | | 23,885 | | | | 10,071,588 | |
| | | | | | | | 43,323,691 | |
| | | | | | | | | |
| Communication Services — 11.0% | | | | | | | | |
| Alphabet, Inc. - Class C* | | | 10,745 | | | | 15,189,240 | |
| Fox Corp. - Class A | | | 223,715 | | | | 6,000,036 | |
| Verizon Communications, Inc. | | | 166,826 | | | | 9,197,117 | |
| | | | | | | | 30,386,393 | |
| | | | | | | | | |
| Materials — 9.0% | | | | | | | | |
| Air Products & Chemicals, Inc. | | | 38,781 | | | | 9,364,060 | |
| Martin Marietta Materials, Inc. | | | 38,968 | | | | 8,049,620 | |
| NewMarket Corp. | | | 18,205 | | | | 7,290,738 | |
| | | | | | | | 24,704,418 | |
| | | | | | | | | |
| Consumer Staples — 7.0% | | | | | | | | |
| Altria Group, Inc. | | | 205,067 | | | | 8,048,880 | |
| Nestle SA (Switzerland) ADR | | | 100,414 | | | | 11,089,722 | |
| | | | | | | | 19,138,602 | |
| | | | | | | | | |
| Industrials — 6.1% | | | | | | | | |
| FedEx Corp. | | | 53,191 | | | | 7,458,442 | |
| Norfolk Southern Corp. | | | 53,183 | | | | 9,337,339 | |
| | | | | | | | 16,795,781 | |
| | | | | | | | | |
| Health Care — 4.2% | | | | | | | | |
| Bristol-Myers Squibb Co. | | | 90,148 | | | | 5,300,702 | |
| Pfizer, Inc. | | | 190,546 | | | | 6,230,854 | |
| | | | | | | | 11,531,556 | |
| | | | | | | | | |
| Real Estate — 2.8% | | | | | | | | |
| STORE Capital Corp. REIT | | | 327,590 | | | | 7,799,918 | |
| | | | | | | | | |
| Energy — 2.3% | | | | | | | | |
| Chevron Corp. | | | 70,383 | | | | 6,280,275 | |
| Total Common Stocks | | | | | | $ | 266,945,864 | |
| | | | | | | | | |
| Short-Term Investment Fund — 3.6% | | | | | | | | |
| Dreyfus Government Cash Management, Institutional Shares, 0.09%∞Ω | | | 9,867,418 | | | $ | 9,867,418 | |
| | | | | | | | | |
Total Investment Securities — 100.5%
(Cost $220,202,313) | | | | | | $ | 276,813,282 | |
| | | | | | | | | |
| Liabilities in Excess of Other Assets — (0.5%) | | | | | | | (1,247,751 | ) |
| | | | | | | | | |
| Net Assets — 100.0% | | | | | | $ | 275,565,531 | |
| * | Non-income producing security. |
| Ω | Represents the 7-day SEC yield as of June 30, 2020. |
Portfolio Abbreviations:
ADR - American Depositary Receipt
REIT - Real Estate Investment Trust
Other Information:
The inputs or methodology used for valuing securities may not be an indication of the risk associated with investing in those securities. For more information on valuation inputs, and their aggregation into the levels used in the table below, please refer to the security valuation section in the accompanying Notes to Financial Statements.
Valuation inputs at Reporting Date:
| Description | | Level 1 | | | Level 2 | | | Level 3 | | | Total | |
| Common Stocks | | $ | 266,945,864 | | | $ | — | | | $ | — | | | $ | 266,945,864 | |
| Short-Term Investment Fund | | | 9,867,418 | | | | — | | | | — | | | | 9,867,418 | |
| Total | | $ | 276,813,282 | | | $ | — | | | $ | — | | | $ | 276,813,282 | |
See accompanying Notes to Financial Statements.
Portfolio of Investments
Touchstone Large Company Growth Fund – June 30, 2020
| | | | | | Market | |
| | | Shares | | | Value | |
| Common Stocks — 97.7% | | | | | | | | |
| | | | | | | | | |
| Information Technology — 47.4% | | | | | | | | |
| Adobe, Inc.* | | | 45,875 | | | $ | 19,969,846 | |
| Automatic Data Processing, Inc. | | | 52,705 | | | | 7,847,247 | |
| EPAM Systems, Inc.* | | | 42,215 | | | | 10,638,602 | |
| Global Payments, Inc. | | | 29,020 | | | | 4,922,372 | |
| GoDaddy, Inc. - Class A* | | | 43,750 | | | | 3,208,188 | |
| Intuit, Inc. | | | 30,685 | | | | 9,088,590 | |
| Mastercard, Inc. - Class A | | | 16,475 | | | | 4,871,658 | |
| Microsoft Corp. | | | 113,875 | | | | 23,174,701 | |
| PayPal Holdings, Inc.* | | | 80,575 | | | | 14,038,582 | |
| Visa, Inc. - Class A | | | 49,475 | | | | 9,557,086 | |
| | | | | | | | 107,316,872 | |
| | | | | | | | | |
| Communication Services — 19.7% | | | | | | | | |
| Alphabet, Inc. - Class A* | | | 10,585 | | | | 15,010,059 | |
| Facebook, Inc. - Class A* | | | 43,275 | | | | 9,826,454 | |
| Sirius XM Holdings, Inc. | | | 959,025 | | | | 5,629,477 | |
| Tencent Holdings Ltd. (China) ADR | | | 219,825 | | | | 14,068,800 | |
| | | | | | | | 44,534,790 | |
| | | | | | | | | |
| Health Care — 13.8% | | | | | | | | |
| Abbott Laboratories | | | 44,925 | | | | 4,107,493 | |
| Becton Dickinson and Co. | | | 11,100 | | | | 2,655,897 | |
| Boston Scientific Corp.* | | | 87,450 | | | | 3,070,370 | |
| Elanco Animal Health, Inc.* | | | 88,700 | | | | 1,902,615 | |
| Neurocrine Biosciences, Inc.* | | | 30,325 | | | | 3,699,650 | |
| UnitedHealth Group, Inc. | | | 22,900 | | | | 6,754,355 | |
| Varian Medical Systems, Inc.* | | | 27,320 | | | | 3,347,246 | |
| Zoetis, Inc. | | | 42,550 | | | | 5,831,052 | |
| | | | | | | | 31,368,678 | |
| | | | | | | | | |
| Consumer Discretionary — 12.4% | | | | | | | | |
| Alibaba Group Holding Ltd. (China) ADR* | | | 61,200 | | | | 13,200,840 | |
| Amazon.com, Inc.* | | | 3,900 | | | | 10,759,398 | |
| Burlington Stores, Inc.* | | | 21,150 | | | | 4,165,070 | |
| | | | | | | | 28,125,308 | |
| | | | | | | | | |
| Financials — 2.7% | | | | | | | | |
| Aon PLC - Class A | | | 31,400 | | | | 6,047,640 | |
| | | | | | | | | |
| Consumer Staples — 1.7% | | | | | | | | |
| Monster Beverage Corp.* | | | 55,300 | | | | 3,833,396 | |
| Total Common Stocks | | | | | | $ | 221,226,684 | |
| | | | | | | | | |
| Short-Term Investment Fund — 2.4% | | | | | | | | |
| Dreyfus Government Cash Management, Institutional Shares, 0.09%∞Ω | | | 5,364,412 | | | $ | 5,364,412 | |
| | | | | | | | | |
Total Investment Securities — 100.1%
(Cost $118,826,101) | | | | | | $ | 226,591,096 | |
| | | | | | | | | |
| Liabilities in Excess of Other Assets — (0.1%) | | | | | | | (223,796 | ) |
| | | | | | | | | |
| Net Assets — 100.0% | | | | | | $ | 226,367,300 | |
| * | Non-income producing security. |
| Ω | Represents the 7-day SEC yield as of June 30, 2020. |
Portfolio Abbreviations:
ADR - American Depositary Receipt
PLC - Public Limited Company
Other Information:
The inputs or methodology used for valuing securities may not be an indication of the risk associated with investing in those securities. For more information on valuation inputs, and their aggregation into the levels used in the table below, please refer to the security valuation section in the accompanying Notes to Financial Statements.
Valuation inputs at Reporting Date:
| Description | | Level 1 | | | Level 2 | | | Level 3 | | | Total | |
| Common Stocks | | $ | 221,226,684 | | | $ | — | | | $ | — | | | $ | 221,226,684 | |
| Short-term Investment Fund | | | 5,364,412 | | | | — | | | | — | | | | 5,364,412 | |
| Total | | $ | 226,591,096 | | | $ | — | | | $ | — | | | $ | 226,591,096 | |
See accompanying Notes to Financial Statements.
Portfolio of Investments
Touchstone Ohio Tax-Free Bond Fund – June 30, 2020
| Principal | | | | | Interest | | | Maturity | | | Market | |
| Amount | | | | | Rate | | | Date | | | Value | |
| | | | | Fixed Rate Revenue Bonds — 65.7% | | | | | | | | | | | | |
| $ | 500,000 | | | New Albany OH Cmnty Auth (Ref) Ser C | | | 5.000 | % | | | 10/01/24 | | | $ | 549,465 | |
| | 375,000 | | | Univ of Akron OH (Ref) Ser A | | | 5.000 | | | | 01/01/28 | | | | 418,418 | |
| | 750,000 | | | Cleveland OH Income Tax Rev (Ref Sub Lien) Ser B 2 | | | 5.000 | | | | 10/01/29 | | | | 893,467 | |
| | 500,000 | | | Hamilton Co OH Hosp Facs Rev (Uc Hlth) | | | 5.000 | | | | 02/01/30 | | | | 558,910 | |
| | 1,000,000 | | | Butler Co OH Hosp Facs (Ref Cincinnati Children’s Hosp) | | | 5.000 | | | | 05/15/30 | | | | 1,318,420 | |
| | 1,000,000 | | | Hamilton Co OH Student Rev (Ref Stratford Heights Proj) | | | 5.000 | | | | 06/01/30 | | | | 1,003,580 | |
| | 200,000 | | | Dayton OH Wtr Sys Rev | | | 4.000 | | | | 12/01/30 | | | | 233,950 | |
| | 1,000,000 | | | Green OH Cmnty Learning Ctr (Ref) | | | 4.000 | | | | 12/01/30 | | | | 1,072,150 | |
| | 500,000 | | | Butler Co OH Hosp Facs (Kettering Health Network Oblig) | | | 5.250 | | | | 04/01/31 | | | | 513,545 | |
| | 1,000,000 | | | Wright OH St Univ (Gen Recpts) Ser A | | | 5.000 | | | | 05/01/31 | | | | 1,021,030 | |
| | 750,000 | | | Middleburg Heights OH Hosp Rev (Facs Southwest Gen) | | | 5.125 | | | | 08/01/31 | | | | 778,080 | |
| | 1,000,000 | | | Cuyahoga Co OH COP (Convention Hotel Proj) | | | 5.000 | | | | 12/01/32 | | | | 1,083,300 | |
| | 1,060,000 | | | OH St EDR (Enterprise Bd Fd) Ser 7 | | | 4.750 | | | | 12/01/32 | | | | 1,078,423 | |
| | 500,000 | | | OH St Univ Ser A | | | 4.000 | | | | 12/01/32 | | | | 557,295 | |
| | 150,000 | | | OH Univ Gen Recpts Athens (Ref) Ser A | | | 5.000 | | | | 12/01/32 | | | | 185,256 | |
| | 390,000 | | | Port Of Gtr Cincinnati Dev Aut | | | 4.000 | | | | 12/01/32 | | | | 460,414 | |
| | 300,000 | | | Port Of Gtr Cincinnati Dev Aut (Ref St.Xavier High Sch Inc Pro) | | | 4.000 | | | | 04/01/33 | | | | 330,300 | |
| | 265,000 | | | OH St Hgr Edl Fac Commis (Ref Xavier Univ) Ser C | | | 5.000 | | | | 05/01/33 | | | | 293,776 | |
| | 1,080,000 | | | Hamilton Co OH Hosp Facs Rev (Ref Cincinnati Childrens Hosp) | | | 5.000 | | | | 05/15/33 | | | | 1,216,955 | |
| | 970,000 | | | Franklin Co OH Sales Tax Rev (Various Purpose) | | | 4.000 | | | | 06/01/33 | | | | 1,155,900 | |
| | 1,000,000 | | | Hamilton Co OH EDR (Ref King Highland Cmnty Urban) | | | 5.000 | | | | 06/01/33 | | | | 1,181,050 | |
| | 2,000,000 | | | Cincinnati OH EDR (U Square The Loop Proj) | | | 5.000 | | | | 11/01/33 | | | | 2,117,960 | |
| | 525,000 | | | OH St Univ Ser A | | | 4.000 | | | | 12/01/33 | | | | 581,275 | |
| | 265,000 | | | Cleveland OH Wtr Rev (Ref) Ser Y | | | 4.000 | | | | 01/01/34 | | | | 287,443 | |
| | 500,000 | | | OH St Hgr Edl Fac Commis (Ref Univ Findlay Proj) | | | 5.000 | | | | 03/01/34 | | | | 537,990 | |
| | 625,000 | | | Hamilton Co OH Hosp Facs Rev (Ref Cincinnati Childrens Hosp) | | | 5.000 | | | | 05/15/34 | | | | 703,187 | |
| | 500,000 | | | Cuyahoga Co OH Sales Tax Rev (Ref) | | | 5.000 | | | | 12/01/34 | | | | 584,085 | |
| | 570,000 | | | Miami Univ OH (Ref) | | | 5.000 | | | | 09/01/35 | | | | 687,312 | |
| | 1,085,000 | | | Cincinnati OH Urban Redev Rev (Mercer Commons Phase 2 Proj) Ser B | | | 5.000 | | | | 11/01/35 | | | | 1,285,855 | |
| | 500,000 | | | Polaris Career Ctr OH COP | | | 5.000 | | | | 11/01/35 | | | | 597,100 | |
| | 200,000 | | | Clermont Co OH Port Auth Lease (W Clermont Local Sch Dist Proj) | | | 5.000 | | | | 12/01/35 | | | | 237,462 | |
| | 290,000 | | | OH St Hgr Edl Fac Commis (University Of Dayton 2018 Pro) Ser A | | | 4.000 | | | | 12/01/35 | | | | 314,633 | |
| | 500,000 | | | OH St Hgr Edl Fac Commis (Ref Higher Eductnl Fac John Ca) | | | 5.000 | | | | 04/01/36 | | | | 551,725 | |
| | 550,000 | | | Franklin Co OH Hosp Facs Rev (Ref Nationwide Childrens Hosp) | | | 4.000 | | | | 11/01/36 | | | | 629,354 | |
| | 1,000,000 | | | OH St Parks & Recreation Cap (Lease Approp Impt Fund Projs S) | | | 5.000 | | | | 12/01/36 | | | | 1,257,070 | |
| | 500,000 | | | Cleveland OH Arpt Sys Rev (Ser B) | | | 5.000 | | | | 01/01/37 | | | | 596,070 | |
| | 1,000,000 | | | Univ Of Cincinnati OH Recpts (Ref ) Ser A | | | 5.000 | | | | 06/01/37 | | | | 1,242,670 | |
| | 340,000 | | | Confluence Cmnty Auth OH (Stadium & Sports Proj) | | | 4.000 | | | | 05/01/39 | | | | 390,276 | |
| | 160,000 | | | Warren Co. OH Hlth Care Facs (Ref Otterbein Homes Ser A) | | | 4.000 | | | | 07/01/39 | | | | 171,491 | |
| | 250,000 | | | OH St Hgr Edl Fac Commis (Denison Univ Proj) | | | 5.000 | | | | 11/01/39 | | | | 316,223 | |
| | 1,000,000 | | | OH St Hosp Fac Rev (Cleveland Clinic Hlth Sys Obli) | | | 4.000 | | | | 01/01/40 | | | | 1,139,240 | |
| | 500,000 | | | Hamilton Co. Oh Hosp Facs Rev (Ref Trihealth Inc Obligated Gr) | | | 5.000 | | | | 08/15/40 | | | | 619,380 | |
| | 245,000 | | | Hamilton Co OH Hosp Facs Rev (Uc Hlth) | | | 5.000 | | | | 09/15/40 | | | | 296,296 | |
| | 1,000,000 | | | Allen Co. Oh Hosp Facs Rev (Ref Bon Secours Mercy Health I) | | | 4.000 | | | | 12/01/40 | | | | 1,138,630 | |
| | 315,000 | | | Akron OH Income Tax Rev | | | 4.000 | | | | 12/01/41 | | | | 354,873 | |
| | | | | Total Fixed Rate Revenue Bonds | | | | | | | | | | $ | 32,541,284 | |
| | | | | | | | | | | | | | | | | |
| | | | | General Obligation Bonds — 19.3% | | | | | | | | | | | | |
| | 835,000 | | | Licking Heights OH LSD UTGO | | | 6.400 | | | | 12/01/28 | | | | 1,071,739 | |
| | 1,000,000 | | | Toledo OH CSD (Ref Sch Facs Impt) UTGO | | | 5.000 | | | | 12/01/32 | | | | 1,135,410 | |
| | 300,000 | | | Upper Arlington OH (Ref Various Purpose) LTGO | | | 4.000 | | | | 12/01/32 | | | | 339,879 | |
| | 345,000 | | | Bowling Green OH CSD (Ref) UTGO | | | 5.000 | | | | 12/01/34 | | | | 411,830 | |
| | 700,000 | | | Miami Vly Career Tech Center O UTGO | | | 4.000 | | | | 12/01/34 | | | | 821,674 | |
| | 500,000 | | | Three Rivers OH LSD (Ref) UTGO | | | 5.000 | | | | 12/01/34 | | | | 587,155 | |
| | 500,000 | | | Cuyahoga Co. Oh (Ser A) LTGO | | | 3.000 | | | | 12/01/35 | | | | 538,100 | |
| | 500,000 | | | Dublin OH (Ser A) LTGO | | | 5.000 | | | | 12/01/35 | | | | 637,575 | |
Touchstone Ohio Tax-Free Bond Fund (Continued)
| Principal | | | | | Interest | | | Maturity | | | Market | |
| Amount | | | | | Rate | | | Date | | | Value | |
| | | | | General Obligation Bonds — 19.3% (Continued) | | | | | | | | | | | | |
| $ | 435,000 | | | Miami Trace OH LSD UTGO | | | 5.000 | % | | | 12/01/35 | | | $ | 524,036 | |
| | 200,000 | | | Milford OH Exempt Vlg Sch Dist (Ref) UTGO | | | 5.000 | | | | 12/01/35 | | | | 238,106 | |
| | 500,000 | | | Lakewood OH (Ref) LTGO | | | 5.000 | | | | 12/01/36 | | | | 614,430 | |
| | 500,000 | | | Greene Co OH Votech Sch Dist (Sch Facs Construction & Impt) UTGO | | | 4.000 | | | | 12/01/37 | | | | 585,585 | |
| | 1,000,000 | | | Hamilton Co OH (Ref ) LTGO Ser A | | | 5.000 | | | | 12/01/37 | | | | 1,244,810 | |
| | 300,000 | | | Lexington OH LSD (Ser A) UTGO | | | 4.000 | | | | 10/01/39 | | | | 351,429 | |
| | 400,000 | | | Athens OH CSD (Ser A) UTGO | | | 4.000 | | | | 12/01/40 | | | | 464,736 | |
| | | | | Total General Obligation Bonds | | | | | | | | | | $ | 9,566,494 | |
| | | | | | | | | | | | | | | | | |
| | | | | Pre-refunded/Escrowed to Maturity(A) — 12.1% | | | | | | | | | | | | |
| | 350,000 | | | Montgomery Co OH Rev (Prerefunded Catholic Hlth Initiatives) Pre-refunded @ $100 | | | 5.250 | | | | 05/01/29 | | | | 403,326 | |
| | 650,000 | | | Montgomery Co OH Rev (Unrefunded Catholic Hlth Initiatives) Pre-refunded @ $100 | | | 5.250 | | | | 05/01/29 | | | | 737,679 | |
| | 345,000 | | | Univ of Toledo OH Ser B Pre-refunded @ $100 | | | 5.000 | | | | 06/01/29 | | | | 359,138 | |
| | 1,000,000 | | | Kent OH St Univ Rev (Gen Recpts) Ser A Pre-refunded @ $100 | | | 4.500 | | | | 05/01/32 | | | | 1,076,990 | |
| | 1,000,000 | | | Hamilton Co OH Hlth Care Facs (Christ Hosp Proj) Pre-refunded @ $100 | | | 5.250 | | | | 06/01/32 | | | | 1,093,790 | |
| | 250,000 | | | Lakewood OH CSD (Sch Facs Impt) UTGO Ser A Pre-refunded @ $100 | | | 5.000 | | | | 11/01/33 | | | | 276,650 | |
| | 475,000 | | | Cincinnati OH Wtr Sys Rev Ser A Pre-refunded @ $100 | | | 5.000 | | | | 12/01/35 | | | | 591,617 | |
| | 1,250,000 | | | Brecksville-Broadview Heights OH CSD (Sch Facs Impt) UTGO (Pre-refunded @ $100) | | | 5.000 | | | | 12/01/38 | | | | 1,448,462 | |
| | | | | Total Pre-refunded/Escrowed to Maturity | | | | | | | | | | $ | 5,987,652 | |
| | | | | | | | | | | | | | | | | |
| | | | | Variable Rate Demand Notes(B)(C)(D) — 3.2% | | | | | | | | | | | | |
| | 750,000 | | | Allen Co OH Hosp Facs Rev (Adj Catholic Healthcare C) (LOC: Union Bank NA) | | | 0.040 | | | | 06/01/34 | | | | 750,000 | |
| | 500,000 | | | OH St Hgr Edl Fac Commis (Hosp Cleveland Clinic Hlth Sys) (LIQ: Bank of NY Mellon Trust) | | | 0.030 | | | | 01/01/39 | | | | 500,000 | |
| | 300,000 | | | OH St Hgr Edl Fac Commis (Variable Cleveland Clinic Hosp) Ser B 3 (LIQ: U.S. Bank N.A.) | | | 0.020 | | | | 01/01/39 | | | | 300,000 | |
| | | | | Total Variable Rate Demand Notes | | | | | | | | | | $ | 1,550,000 | |
| | | | | | | | | | | | | | | | | |
| | | | | | | | | | | | | | | | | |
| | | | | Total Investment Securities — 100.3%
(Cost $45,968,818) | | | | | | | | | | $ | 49,645,430 | |
| | | | | | | | | | | | | | | | | |
| | | | | Liabilities in Excess of Other Assets — (0.3%) | | | | | | | | | | | (135,756 | ) |
| | | | | | | | | | | | | | | | | |
| | | | | Net Assets — 100.0% | | | | | | | | | | $ | 49,509,674 | |
| (A) | Bonds denoted as pre-refunded are anticipated to be redeemed prior to their scheduled maturity. The dates indicated are the stipulated pre-refunded dates. |
| (B) | Certain variable rate securities are not based on a published reference rate and spread but are determined by the issuer or agent and are based on current market conditions. These securities do not indicate a reference rate and spread in their description. |
| (C) | Floating and variable rate demand notes (“put bonds”) earn interest at a coupon rate which fluctuates at specified intervals, usually daily, monthly or semi-annually. The interest rates shown are the coupon rates in effect at June 30, 2020. Put bonds may be redeemed at the discretion of the holder on specified dates prior to maturity. Mandatory put bonds are automatically redeemed at a specified put date unless action is taken by the holder to prevent redemption. |
| (D) | Demand Feature - Maturities shown are the final maturities, not the date on which principal could be recovered through the demand feature. |
As of June 30, 2020, the Touchstone Ohio Tax-Free Bond Fund was invested exclusively in debt obligations issued by the State of Ohio and its political subdivisions, agencies, authorities and instrumentalities and by other issuers, the interest from which is exempt from Ohio personal income tax. The Touchstone Ohio Tax-Free Bond Fund is a non-diversified Fund under the Investment Company Act of 1940. Thus, the Fund may invest in fewer issuers than those of a diversified fund. As of June 30, 2020, there were no investments of 10% or greater in any one issuer held by the Fund.
Portfolio Abbreviations:
COP – Certificates of Participation
CSD – City School District
EDR – Economic Development Revenue
LIQ - Liquidity Agreement
LOC – Letter of Credit
LSD – Local School District
LTGO – Limited Tax General Obligation
UTGO – Unlimited Tax General Obligation
Other Information:
The inputs or methodology used for valuing securities may not be an indication of the risk associated with investing in those securities. For more information on valuation inputs, and their aggregation into the levels used in the table below, please refer to the security valuation section in the accompanying Notes to Financial Statements.
Valuation inputs at Reporting Date:
| Description | | Level 1 | | | Level 2 | | | Level 3 | | | Total | |
| Municipal Bonds | | $ | — | | | $ | 49,645,430 | | | $ | — | | | $ | 49,645,430 | |
See accompanying Notes to Financial Statements.
Portfolio of Investments
Touchstone Small Company Fund – June 30, 2020
| | | | | | Market | |
| | | Shares | | | Value | |
| Common Stocks — 95.8% | | | | | | | | |
| | | | | | | | | |
| Health Care — 22.1% | | | | | | | | |
| Addus HomeCare Corp.* | | | 91,300 | | | $ | 8,450,728 | |
| Bio-Rad Laboratories, Inc. - Class A* | | | 17,364 | | | | 7,839,672 | |
| Bio-Techne Corp. | | | 30,476 | | | | 8,047,797 | |
| Chemed Corp. | | | 18,428 | | | | 8,312,318 | |
| Encompass Health Corp. | | | 134,200 | | | | 8,311,006 | |
| Ensign Group, Inc. (The) | | | 202,000 | | | | 8,453,700 | |
| Globus Medical, Inc. - Class A* | | | 182,951 | | | | 8,728,592 | |
| Haemonetics Corp.* | | | 166,948 | | | | 14,951,863 | |
| HMS Holdings Corp.* | | | 256,300 | | | | 8,301,557 | |
| Integra LifeSciences Holdings Corp.* | | | 174,789 | | | | 8,213,335 | |
| NuVasive, Inc.* | | | 150,230 | | | | 8,361,802 | |
| Omnicell, Inc.* | | | 121,242 | | | | 8,562,110 | |
| Premier, Inc. - Class A* | | | 417,513 | | | | 14,312,346 | |
| Providence Service Corp. (The)* | | | 107,672 | | | | 8,496,397 | |
| Tactile Systems Technology, Inc.* | | | 200,435 | | | | 8,304,022 | |
| Vericel Corp.* | | | 649,400 | | | | 8,974,708 | |
| Vocera Communications, Inc.* | | | 453,900 | | | | 9,622,680 | |
| | | | | | | | 156,244,633 | |
| | | | | | | | | |
| Information Technology — 21.7% | | | | | | | | |
| 8x8, Inc.* | | | 470,961 | | | | 7,535,376 | |
| Aspen Technology, Inc.* | | | 79,106 | | | | 8,196,173 | |
| Cerence, Inc.* | | | 194,827 | | | | 7,956,735 | |
| Envestnet, Inc.* | | | 118,800 | | | | 8,736,552 | |
| ExlService Holdings, Inc.* | | | 129,424 | | | | 8,205,482 | |
| J2 Global, Inc.* | | | 230,319 | | | | 14,558,464 | |
| KBR, Inc. | | | 360,156 | | | | 8,121,518 | |
| MAXIMUS, Inc. | | | 116,201 | | | | 8,186,360 | |
| Nice Ltd. ADR (Israel)* | | | 41,320 | | | | 7,819,397 | |
| Nuance Communications, Inc.* | | | 310,818 | | | | 7,865,249 | |
| Onto Innovation, Inc.* | | | 527,778 | | | | 17,965,563 | |
| Qualys, Inc.* | | | 71,987 | | | | 7,488,088 | |
| SPS Commerce, Inc.* | | | 107,500 | | | | 8,075,400 | |
| Tower Semiconductor Ltd. (Israel)* | | | 451,800 | | | | 8,624,862 | |
| Verint Systems, Inc.* | | | 359,177 | | | | 16,227,617 | |
| WNS Holdings Ltd. ADR (India)* | | | 150,500 | | | | 8,274,490 | |
| | | | | | | | 153,837,326 | |
| | | | | | | | | |
| Industrials — 19.9% | | | | | | | | |
| Aerojet Rocketdyne Holdings, Inc.* | | | 204,200 | | | | 8,094,488 | |
| ASGN, Inc.* | | | 127,823 | | | | 8,523,238 | |
| Clean Harbors, Inc.* | | | 241,994 | | | | 14,514,800 | |
| Comfort Systems USA, Inc. | | | 209,825 | | | | 8,550,369 | |
| Crane Co. | | | 142,652 | | | | 8,482,088 | |
| Curtiss-Wright Corp. | | | 180,200 | | | | 16,088,256 | |
| ITT, Inc. | | | 141,044 | | | | 8,284,925 | |
| John Bean Technologies Corp. | | | 107,500 | | | | 9,247,150 | |
| Quanta Services, Inc. | | | 457,845 | | | | 17,961,259 | |
| RBC Bearings, Inc.* | | | 59,100 | | | | 7,921,764 | |
| Rexnord Corp. | | | 300,120 | | | | 8,748,498 | |
| SkyWest, Inc. | | | 233,601 | | | | 7,620,065 | |
| Watts Water Technologies, Inc. - Class A | | | 102,933 | | | | 8,337,573 | |
| Woodward, Inc. | | | 105,418 | | | | 8,175,166 | |
| | | | | | | | 140,549,639 | |
| | | | | | | | | |
| Consumer Discretionary — 14.7% | | | | | | | | |
| Aritzia, Inc. (Canada)* | | | 577,108 | | | | 8,081,042 | |
| Bloomin’ Brands, Inc. | | | 713,474 | | | | 7,605,633 | |
| Fox Factory Holding Corp.* | | | 102,300 | | | | 8,451,003 | |
| frontdoor, Inc.* | | | 396,767 | | | | 17,588,681 | |
| Oxford Industries, Inc. | | | 176,300 | | | | 7,758,963 | |
| Skyline Champion Corp.* | | | 321,900 | | | | 7,835,046 | |
| Steven Madden Ltd. | | | 302,117 | | | | 7,459,269 | |
| Strategic Education, Inc. | | | 100,900 | | | | 15,503,285 | |
| Texas Roadhouse, Inc. | | | 138,459 | | | | 7,278,790 | |
| TopBuild Corp.* | | | 65,326 | | | | 7,432,139 | |
| Zumiez, Inc.* | | | 318,600 | | | | 8,723,268 | |
| | | | | | | | 103,717,119 | |
| | | | | | | | | |
| Financials — 9.1% | | | | | | | | |
| Evercore, Inc. - Class A | | | 278,900 | | | | 16,432,788 | |
| Glacier Bancorp, Inc. | | | 222,214 | | | | 7,841,932 | |
| TCF Financial Corp. | | | 497,986 | | | | 14,650,748 | |
| Webster Financial Corp. | | | 297,314 | | | | 8,506,153 | |
| Western Alliance Bancorp | | | 223,896 | | | | 8,478,941 | |
| WSFS Financial Corp. | | | 306,206 | | | | 8,788,112 | |
| | | | | | | | 64,698,674 | |
| | | | | | | | | |
| Real Estate — 4.8% | | | | | | | | |
| Corporate Office Properties Trust REIT | | | 703,457 | | | | 17,825,600 | |
| Healthcare Realty Trust, Inc. REIT | | | 280,200 | | | | 8,207,058 | |
| STAG Industrial, Inc. REIT | | | 268,700 | | | | 7,878,284 | |
| | | | | | | | 33,910,942 | |
| | | | | | | | | |
| Communication Services — 3.5% | | | | | | | | |
| Cargurus, Inc.* | | | 317,500 | | | | 8,048,625 | |
| Cogent Communications Holdings, Inc. | | | 103,475 | | | | 8,004,826 | |
| QuinStreet, Inc.* | | | 842,871 | | | | 8,816,431 | |
| | | | | | | | 24,869,882 | |
| Total Common Stocks | | | | | | $ | 677,828,215 | |
| | | | | | | | | |
| Short-Term Investment Fund — 4.9% | | | | | | | | |
| Dreyfus Government Cash Management, Institutional Shares, 0.09%∞Ω | | | 34,501,867 | | | $ | 34,501,867 | |
| | | | | | | | | |
| Total Investment Securities — 100.7% | | | | | | | | |
| (Cost $604,172,067) | | | | | | $ | 712,330,082 | |
| | | | | | | | | |
| Liabilities in Excess of Other Assets — (0.7%) | | | | | | | (5,130,915 | ) |
| | | | | | | | | |
| Net Assets — 100.0% | | | | | | $ | 707,199,167 | |
| * | Non-income producing security. |
| Ω | Represents the 7-day SEC yield as of June 30, 2020. |
Portfolio Abbreviations:
ADR - American Depositary Receipt
REIT - Real Estate Investment Trust
Other Information:
The inputs or methodology used for valuing securities may not be an indication of the risk associated with investing in those securities. For more information on valuation inputs, and their aggregation into the levels used in the table below, please refer to the security valuation section in the accompanying Notes to Financial Statements.
Valuation inputs at Reporting Date:
| Description | | Level 1 | | | Level 2 | | | Level 3 | | | Total | |
| Common Stocks | | $ | 677,828,215 | | | $ | — | | | $ | — | | | $ | 677,828,215 | |
| Short-term Investment Fund | | | 34,501,867 | | | $ | — | | | $ | — | | | $ | 34,501,867 | |
| Total | | $ | 712,330,082 | | | $ | — | | | $ | — | | | $ | 712,330,082 | |
See accompanying Notes to Financial Statements.
Portfolio of Investments
Touchstone Value Fund – June 30, 2020
| | | | | | Market | |
| | | Shares | | | Value | |
| Common Stocks — 97.8% | | | | | | | | |
| | | | | | | | | |
| Financials — 22.7% | | | | | | | | |
| American Express Co. | | | 35,097 | | | $ | 3,341,234 | |
| American International Group, Inc. | | | 286,503 | | | | 8,933,164 | |
| Chubb Ltd. | | | 54,360 | | | | 6,883,063 | |
| Citigroup, Inc. | | | 70,224 | | | | 3,588,446 | |
| Goldman Sachs Group, Inc. (The) | | | 32,133 | | | | 6,350,123 | |
| JPMorgan Chase & Co. | | | 57,051 | | | | 5,366,217 | |
| New York Community Bancorp, Inc. | | | 396,430 | | | | 4,043,586 | |
| Northern Trust Corp. | | | 54,018 | | | | 4,285,788 | |
| US Bancorp | | | 180,363 | | | | 6,640,966 | |
| Wells Fargo & Co. | | | 180,511 | | | | 4,621,082 | |
| Willis Towers Watson PLC | | | 20,587 | | | | 4,054,610 | |
| | | | | | | | 58,108,279 | |
| | | | | | | | | |
| Industrials — 16.3% | | | | | | | | |
| AECOM* | | | 88,916 | | | | 3,341,463 | |
| Deere & Co. | | | 40,365 | | | | 6,343,360 | |
| General Dynamics Corp. | | | 20,206 | | | | 3,019,989 | |
| Jacobs Engineering Group, Inc. | | | 22,321 | | | | 1,892,821 | |
| JB Hunt Transport Services, Inc. | | | 59,851 | | | | 7,202,469 | |
| Quanta Services, Inc. | | | 40,163 | | | | 1,575,595 | |
| Raytheon Technologies Corp. | | | 93,445 | | | | 5,758,081 | |
| Stanley Black & Decker, Inc. | | | 50,992 | | | | 7,107,265 | |
| Westinghouse Air Brake Technologies Corp. | | | 92,597 | | | | 5,330,809 | |
| | | | | | | | 41,571,852 | |
| | | | | | | | | |
| Consumer Discretionary — 12.9% | | | | | | | | |
| Advance Auto Parts, Inc. | | | 59,341 | | | | 8,453,126 | |
| Aramark | | | 313,618 | | | | 7,078,358 | |
| Dollar General Corp. | | | 16,832 | | | | 3,206,664 | |
| Lennar Corp. - Class A | | | 104,164 | | | | 6,418,586 | |
| Lowe’s Cos., Inc. | | | 58,933 | | | | 7,963,027 | |
| | | | | | | | 33,119,761 | |
| | | | | | | | | |
| Health Care — 10.6% | | | | | | | | |
| Anthem, Inc. | | | 21,080 | | | | 5,543,618 | |
| CVS Health Corp. | | | 125,459 | | | | 8,151,071 | |
| Medtronic PLC | | | 74,026 | | | | 6,788,184 | |
| UnitedHealth Group, Inc. | | | 22,692 | | | | 6,693,005 | |
| | | | | | | | 27,175,878 | |
| | | | | | | | | |
| Information Technology — 10.2% | | | | | | | | |
| Broadcom, Inc. | | | 23,582 | | | | 7,442,715 | |
| Cognizant Technology Solutions Corp. - Class A | | | 109,150 | | | | 6,201,903 | |
| Oracle Corp. | | | 47,900 | | | | 2,647,433 | |
| QUALCOMM, Inc. | | | 47,806 | | | | 4,360,385 | |
| Texas Instruments, Inc. | | | 42,885 | | | | 5,445,108 | |
| | | | | | | | 26,097,544 | |
| | | | | | | | | |
| Energy — 8.4% | | | | | | | | |
| Chevron Corp. | | | 66,228 | | | | 5,909,524 | |
| Hess Corp. | | | 76,317 | | | | 3,953,984 | |
| Phillips 66 | | | 115,112 | | | | 8,276,553 | |
| Valero Energy Corp. | | | 55,347 | | | | 3,255,511 | |
| | | | | | | | 21,395,572 | |
| | | | | | | | | |
| Materials — 6.8% | | | | | | | | |
| Air Products & Chemicals, Inc. | | | 25,180 | | | | 6,079,963 | |
| Corteva, Inc. | | | 247,082 | | | | 6,619,327 | |
| DuPont de Nemours, Inc. | | | 90,612 | | | | 4,814,216 | |
| | | | | | | | 17,513,506 | |
| | | | | | | | | |
| Utilities — 3.4% | | | | | | | | |
| Edison International | | | 51,182 | | | | 2,779,694 | |
| Exelon Corp. | | | 159,735 | | | | 5,796,783 | |
| | | | | | | | 8,576,477 | |
| | | | | | | | | |
| Communication Services — 2.4% | | | | | | | | |
| Comcast Corp. - Class A | | | 154,817 | | | | 6,034,767 | |
| | | | | | | | | |
| Real Estate — 2.1% | | | | | | | | |
| MGM Growth Properties LLC - Class A REIT | | | 197,180 | | | | 5,365,268 | |
| | | | | | | | | |
| Consumer Staples — 2.0% | | | | | | | | |
| Coca-Cola European Partners PLC (United Kingdom) | | | 134,173 | | | | 5,066,372 | |
| Total Common Stocks | | | | | | $ | 250,025,276 | |
| | | | | | | | | |
| Short-Term Investment Fund — 2.3% | | | | | | | | |
| Dreyfus Government Cash Management, Institutional Shares, 0.09%∞Ω | | | 5,972,889 | | | $ | 5,972,889 | |
| | | | | | | | | |
Total Investment Securities — 100.1%
(Cost $233,459,641) | | | | | | $ | 255,998,165 | |
| | | | | | | | | |
| Liabilities in Excess of Other Assets — (0.1%) | | | | | | | (282,703 | ) |
| | | | | | | | | |
| Net Assets — 100.0% | | | | | | $ | 255,715,462 | |
| * | Non-income producing security. |
| Ω | Represents the 7-day SEC yield as of June 30, 2020. |
Portfolio Abbreviations:
PLC - Public Limited Company
REIT - Real Estate Investment Trust
Other Information:
The inputs or methodology used for valuing securities may not be an indication of the risk associated with investing in those securities. For more information on valuation inputs, and their aggregation into the levels used in the table below, please refer to the security valuation section in the accompanying Notes to Financial Statements.
Valuation inputs at Reporting Date:
| Description | | Level 1 | | | Level 2 | | | Level 3 | | | Total | |
| Common Stocks | | $ | 250,025,276 | | | $ | — | | | $ | — | | | $ | 250,025,276 | |
| Short-Term Investment Fund | | | 5,972,889 | | | | — | | | | — | | | | 5,972,889 | |
| Total | | $ | 255,998,165 | | | $ | — | | | $ | — | | | $ | 255,998,165 | |
See accompanying Notes to Financial Statements.
This page intentionally left blank.
Statements of Assets and Liabilities
June 30, 2020
| | | | | | | | | Touchstone | | | | | | | | | | |
| | | | | | Touchstone | | | International | | | Touchstone | | | Touchstone | | | | |
| | | Touchstone | | | International | | | Growth | | | International | | | Large Cap | | | Touchstone | |
| | | Balanced | | | Equity | | | Opportunities | | | Small Cap | | | Focused | | | Large Cap | |
| | | Fund | | | Fund | | | Fund | | | Fund | | | Fund | | | Fund | |
| Assets | | | | | | | | | | | | | | | | | | | | | | | | |
| Investments, at cost | | $ | 262,806,592 | | | $ | 125,854,841 | | | $ | 22,387,075 | | | $ | 65,573,753 | | | $ | 973,253,578 | | | $ | 220,202,313 | |
| Investments, at market value (A) | | $ | 388,952,806 | | | $ | 125,411,543 | | | $ | 31,404,998 | | | $ | 73,365,270 | | | $ | 1,650,577,351 | | | $ | 276,813,282 | |
| Cash | | | 1 | | | | — | | | | — | | | | — | | | | 1 | | | | — | |
| Cash deposits held at prime broker (B) | | | 127,016 | | | | — | | | | — | | | | — | | | | — | | | | — | |
| Foreign currency (C) | | | — | | | | 24,071 | | | | — | | | | 58,978 | | | | — | | | | — | |
| Dividends and interest receivable | | | 1,020,439 | | | | 134,702 | | | | 2,893 | | | | 178,430 | | | | 911,572 | | | | 408,043 | |
| Receivable for capital shares sold | | | 589,480 | | | | 37,182 | | | | 290 | | | | 6,443 | | | | 607,969 | | | | 601,823 | |
| Receivable for investments sold | | | 103,402 | | | | 321,552 | | | | — | | | | 681,462 | | | | 1,616,071 | | | | — | |
| Receivable for variation margin on futures contracts | | | 14,375 | | | | — | | | | — | | | | — | | | | — | | | | — | |
| Receivable for securities lending income | | | 23 | | | | 1,028 | | | | — | | | | 53 | | | | 4,330 | | | | — | |
| Tax reclaim receivable | | | 1,273 | | | | 397,654 | | | | 13,684 | | | | 128,154 | | | | 7,150 | | | | — | |
| Other assets | | | 8,558 | | | | 6,187 | | | | 8,230 | | | | 12,324 | | | | 17,353 | | | | 8,021 | |
| Total Assets | | | 390,817,373 | | | | 126,333,919 | | | | 31,430,095 | | | | 74,431,114 | | | | 1,653,741,797 | | | | 277,831,169 | |
| | | | | | | | | | | | | | | | | | | | | | | | | |
| Liabilities | | | | | | | | | | | | | | | | | | | | | | | | |
| Bank overdrafts | | | — | | | | 8,032 | | | | 111 | | | | — | | | | — | | | | 1,267,161 | |
| Due to prime broker (C) | | | — | | | | — | | | | 3 | | | | — | | | | — | | | | — | |
| Dividends payable | | | — | | | | — | | | | — | | | | — | | | | — | | | | — | |
| Payable for return of collateral for securities on loan | | | — | | | | 8,134,603 | | | | — | | | | — | | | | 10,626,001 | | | | — | |
| Payable for capital shares redeemed | | | 378,271 | | | | 48,681 | | | | 15,000 | | | | 125,519 | | | | 2,278,357 | | | | 675,907 | |
| Payable for investments purchased | | | 515,535 | | | | — | | | | — | | | | — | | | | 1,108,142 | | | | — | |
| Payable to Investment Advisor | | | 159,376 | | | | 71,792 | | | | 6,514 | | | | 55,236 | | | | 788,335 | | | | 129,387 | |
| Payable to other affiliates | | | 118,625 | | | | 23,601 | | | | 783 | | | | 7,531 | | | | 355,185 | | | | 9,919 | |
| Payable to Trustees | | | 11,130 | | | | 11,130 | | | | 11,130 | | | | 11,130 | | | | 11,130 | | | | 11,130 | |
| Payable for transfer agent services | | | 184,368 | | | | 101,060 | | | | 7,596 | | | | 82,548 | | | | 660,045 | | | | 129,059 | |
| Payable for reports to shareholders | | | 10,626 | | | | 12,314 | | | | 9,301 | | | | 11,840 | | | | 23,633 | | | | 14,042 | |
| Payable for professional services | | | 33,592 | | | | 45,777 | | | | 38,280 | | | | 36,285 | | | | 45,794 | | | | 25,572 | |
| Other accrued expenses and liabilities | | | 12,971 | | | | 19,380 | | | | 8,996 | | | | 25,981 | | | | 23,478 | | | | 3,461 | |
| Total Liabilities | | | 1,424,494 | | | | 8,476,370 | | | | 97,714 | | | | 356,070 | | | | 15,920,100 | | | | 2,265,638 | |
| Net Assets | | $ | 389,392,879 | | | $ | 117,857,549 | | | $ | 31,332,381 | | | $ | 74,075,044 | | | $ | 1,637,821,697 | | | $ | 275,565,531 | |
| | | | | | | | | | | | | | | | | | | | | | | | | |
| Net assets consist of: | | | | | | | | | | | | | | | | | | | | | | | | |
| Paid-in capital | | $ | 257,769,099 | | | $ | 125,339,127 | | | $ | 28,018,333 | | | $ | 87,207,531 | | | $ | 936,863,655 | | | $ | 219,192,966 | |
| Distributable earnings | | | 131,623,780 | | | | (7,481,578 | ) | | | 3,314,048 | | | | (13,132,487 | ) | | | 700,958,042 | | | | 56,372,565 | |
| Net Assets | | $ | 389,392,879 | | | $ | 117,857,549 | | | $ | 31,332,381 | | | $ | 74,075,044 | | | $ | 1,637,821,697 | | | $ | 275,565,531 | |
| (A) Includes market value of securities on loan of: | | $ | — | | | $ | 7,818,356 | | | $ | — | | | $ | — | | | $ | 10,174,385 | | | $ | — | |
| (B) Represents segregated cash for futures contracts. | | | | | | | | | | | | | | | | | | | | | | | | |
| (C) Cost of foreign currency: | | $ | — | | | $ | 24,216 | | | $ | — | | | $ | 59,472 | | | $ | — | | | $ | — | |
See accompanying Notes to Financial Statements.
Statements of Assets and Liabilities (Continued)
| Touchstone | | | Touchstone | | | Touchstone | | | | |
| Large Company | | | Ohio Tax-Free | | | Small | | | Touchstone | |
| Growth | | | Bond | | | Company | | | Value | |
| Fund | | | Fund | | | Fund | | | Fund | |
| | | | | | | | | | | | | | | |
| $ | 118,826,101 | | | $ | 45,968,818 | | | $ | 604,172,067 | | | $ | 233,459,641 | |
| $ | 226,591,096 | | | $ | 49,645,430 | | | $ | 712,330,082 | | | $ | 255,998,165 | |
| | — | | | | 43,895 | | | | 969,633 | | | | — | |
| | — | | | | — | | | | — | | | | — | |
| | — | | | | — | | | | 37 | | | | — | |
| | 47,961 | | | | 308,306 | | | | 384,791 | | | | 425,895 | |
| | 505,225 | | | | 47,587 | | | | 231,526 | | | | 85,877 | |
| | — | | | | — | | | | 6,461,263 | | | | — | |
| | — | | | | — | | | | — | | | | — | |
| | 40 | | | | — | | | | — | | | | — | |
| | 4,088 | | | | — | | | | 1,397 | | | | — | |
| | 11,979 | | | | 3,944 | | | | 14,843 | | | | 17,298 | |
| | 227,160,389 | | | | 50,049,162 | | | | 720,393,572 | | | | 256,527,235 | |
| | | | | | | | | | | | | | | |
| | — | | | | — | | | | — | | | | — | |
| | — | | | | — | | | | — | | | | — | |
| | — | | | | 17,614 | | | | — | | | | — | |
| | — | | | | — | | | | — | | | | — | |
| | 107,379 | | | | 107,076 | | | | 1,248,978 | | | | 514,402 | |
| | 492,522 | | | | 330,465 | | | | 10,721,603 | | | | — | |
| | 94,193 | | | | 14,745 | | | | 408,688 | | | | 126,242 | |
| | 9,187 | | | | 2,415 | | | | 143,359 | | | | 10,803 | |
| | 11,130 | | | | 11,130 | | | | 11,130 | | | | 11,130 | |
| | 41,004 | | | | 13,516 | | | | 585,871 | | | | 104,585 | |
| | 9,858 | | | | 9,405 | | | | 33,804 | | | | 15,317 | |
| | 24,959 | | | | 26,157 | | | | 32,107 | | | | 25,398 | |
| | 2,857 | | | | 6,965 | | | | 8,865 | | | | 3,896 | |
| | 793,089 | | | | 539,488 | | | | 13,194,405 | | | | 811,773 | |
| $ | 226,367,300 | | | $ | 49,509,674 | | | $ | 707,199,167 | | | $ | 255,715,462 | |
| | | | | | | | | | | | | | | |
| $ | 95,527,102 | | | $ | 45,876,730 | | | $ | 647,082,678 | | | $ | 231,297,953 | |
| | 130,840,198 | | | | 3,632,944 | | | | 60,116,489 | | | | 24,417,509 | |
| $ | 226,367,300 | | | $ | 49,509,674 | | | $ | 707,199,167 | | | $ | 255,715,462 | |
| $ | — | | | $ | — | | | $ | — | | | $ | — | |
| | | | | | | | | | | | | | | |
| $ | — | | | $ | — | | | $ | 37 | | | $ | — | |
Statements of Assets and Liabilities (Continued)
| | | | | | | | | Touchstone | | | | | | | | | | |
| | | | | | Touchstone | | | International | | | Touchstone | | | Touchstone | | | | |
| | | Touchstone | | | International | | | Growth | | | International | | | Large Cap | | | Touchstone | |
| | | Balanced | | | Equity | | | Opportunities | | | Small Cap | | | Focused | | | Large Cap | |
| | | Fund | | | Fund | | | Fund | | | Fund | | | Fund | | | Fund | |
| Pricing of Class A Shares | | | | | | | | | | | | | | | | | | | | | | | | |
| Net assets applicable to Class A shares | | $ | 250,297,640 | | | $ | 77,744,158 | | | $ | 776,624 | | | $ | 1,217,659 | | | $ | 1,120,305,427 | | | $ | 2,989,018 | |
| Shares of beneficial interest outstanding (unlimited number of shares authorized, no par value) | | | 11,581,636 | | | | 5,581,901 | | | | 34,720 | | | | 100,322 | | | | 26,482,408 | | | | 229,167 | |
| Net asset value price per share* | | $ | 21.61 | | | $ | 13.93 | | | $ | 22.37 | | | $ | 12.14 | | | $ | 42.30 | | | $ | 13.04 | |
| Maximum sales charge - Class A shares | | | 5.00 | % | | | 5.00 | % | | | 5.00 | % | | | 5.00 | % | | | 5.00 | % | | | 5.00 | % |
| Maximum offering price per share (100%/(100%-maximum sales charge) of net asset value adjusted to the nearest cent) - Class A shares | | $ | 22.75 | | | $ | 14.66 | | | $ | 23.55 | | | $ | 12.78 | | | $ | 44.53 | | | $ | 13.73 | |
| | | | | | | | | | | | | | | | | | | | | | | | | |
| Pricing of Class C Shares | | | | | | | | | | | | | | | | | | | | | | | | |
| Net assets applicable to Class C shares | | $ | 44,173,855 | | | $ | 2,073,255 | | | $ | 403,234 | | | $ | 607,704 | | | $ | 37,450,384 | | | $ | 5,376,117 | |
| Shares of beneficial interest outstanding (unlimited number of shares authorized, no par value) | | | 2,033,711 | | | | 159,607 | | | | 18,617 | | | | 51,525 | | | | 956,379 | | | | 420,318 | |
| Net asset value and offering price per share** | | $ | 21.72 | | | $ | 12.99 | | | $ | 21.66 | | | $ | 11.79 | | | $ | 39.16 | | | $ | 12.79 | |
| | | | | | | | | | | | | | | | | | | | | | | | | |
| Pricing of Class Y Shares | | | | | | | | | | | | | | | | | | | | | | | | |
| Net assets applicable to Class Y shares | | $ | 94,921,384 | | | $ | 23,835,234 | | | $ | 867,389 | | | $ | 68,423,461 | | | $ | 352,102,804 | | | $ | 206,798,216 | |
| Shares of beneficial interest outstanding (unlimited number of shares authorized, no par value) | | | 4,429,742 | | | | 1,735,525 | | | | 38,510 | | | | 5,503,742 | | | | 8,348,084 | | | | 15,822,483 | |
| Net asset value, offering price and redemption price per share | | $ | 21.43 | | | $ | 13.73 | | | $ | 22.52 | | | $ | 12.43 | | | $ | 42.18 | | | $ | 13.07 | |
| | | | | | | | | | | | | | | | | | | | | | | | | |
| Pricing of Institutional Class Shares | | | | | | | | | | | | | | | | | | | | | | | | |
| Net assets applicable to Institutional Class shares | | $ | — | | | $ | 14,204,902 | | | $ | 29,285,134 | | | $ | 3,826,220 | | | $ | 127,963,082 | | | $ | 60,402,180 | |
| Shares of beneficial interest outstanding (unlimited number of shares authorized, no par value) | | | — | | | | 1,036,392 | | | | 1,294,031 | | | | 305,616 | | | | 3,029,118 | | | | 4,613,598 | |
| Net asset value, offering price and redemption price per share | | $ | — | | | $ | 13.71 | | | $ | 22.63 | | | $ | 12.52 | | | $ | 42.24 | | | $ | 13.09 | |
| | | | | | | | | | | | | | | | | | | | | | | | | |
| Pricing of Class R6 Shares | | | | | | | | | | | | | | | | | | | | | | | | |
| Net assets applicable to Class R6 shares | | $ | — | | | $ | — | | | $ | — | | | $ | — | | | $ | — | | | $ | — | |
| Shares of beneficial interest outstanding (unlimited number of shares authorized, no par value) | | | — | | | | — | | | | — | | | | — | | | | — | | | | — | |
| Net asset value, offering price and redemption price per share | | $ | — | | | $ | — | | | $ | — | | | $ | — | | | $ | — | | | $ | — | |
* There is no sales load on subscriptions of $1 million or more for all funds except for Ohio Tax-Free Bond Fund. There is no sales load on subscriptions of $500,000 or more for Ohio Tax-Free Bond Fund. Redemptions that were part of a $500,000 or $1 million or more subscription, as applicable, may be subject to a contingent deferred sales load if redeemed within a one-year period from the date of purchase.
** Redemption price per share varies by length of time shares are held due to the terms of the contingent deferred sales charge.
See accompanying Notes to Financial Statements.
Statements of Assets and Liabilities (Continued)
| Touchstone | | | Touchstone | | | Touchstone | | | | |
| Large Company | | | Ohio Tax-Free | | | Small | | | Touchstone | |
| Growth | | | Bond | | | Company | | | Value | |
| Fund | | | Fund | | | Fund | | | Fund | |
| | | | | | | | | | | | | | | |
| $ | 2,111,755 | | | $ | 32,059,768 | | | $ | 420,822,345 | | | $ | 24,567,194 | |
| | | | | | | | | | | | | | | |
| | 44,494 | | | | 2,709,340 | | | | 103,600,986 | | | | 3,090,244 | |
| $ | 47.46 | | | $ | 11.83 | | | $ | 4.06 | | | $ | 7.95 | |
| | 5.00 | % | | | 3.25 | % | | | 5.00 | % | | | 5.00 | % |
| | | | | | | | | | | | | | | |
| $ | 49.96 | | | $ | 12.23 | | | $ | 4.27 | | | $ | 8.37 | |
| | | | | | | | | | | | | | | |
| $ | 592,112 | | | $ | 2,049,835 | | | $ | 21,204,284 | | | $ | 2,175,280 | |
| | | | | | | | | | | | | | | |
| | 12,893 | | | | 172,922 | | | | 10,673,565 | | | | 274,407 | |
| $ | 45.93 | | | $ | 11.85 | | | $ | 1.99 | | | $ | 7.93 | |
| | | | | | | | | | | | | | | |
| $ | 24,062,294 | | | $ | 2,615,529 | | | $ | 189,336,205 | | | $ | 75,027,894 | |
| | | | | | | | | | | | | | | |
| | 501,658 | | | | 220,774 | | | | 41,838,529 | | | | 9,397,532 | |
| | | | | | | | | | | | | | | |
| $ | 47.97 | | | $ | 11.85 | | | $ | 4.53 | | | $ | 7.98 | |
| | | | | | | | | | | | | | | |
| $ | 199,601,139 | | | $ | 12,784,542 | | | $ | 11,269,286 | | | $ | 153,945,094 | |
| | | | | | | | | | | | | | | |
| | 4,142,874 | | | | 1,079,591 | | | | 2,495,354 | | | | 19,344,811 | |
| | | | | | | | | | | | | | | |
| $ | 48.18 | | | $ | 11.84 | | | $ | 4.52 | | | $ | 7.96 | |
| | | | | | | | | | | | | | | |
| $ | — | | | $ | — | | | $ | 64,567,047 | | | $ | — | |
| | | | | | | | | | | | | | | |
| | — | | | | — | | | | 15,406,274 | | | | — | |
| | | | | | | | | | | | | | | |
| $ | — | | | $ | — | | | $ | 4.19 | | | $ | — | |
Statements of Operations
For the Year Ended June 30, 2020
| | | | | | | | | Touchstone | | | | | | | | | | |
| | | | | | Touchstone | | | International | | | Touchstone | | | Touchstone | | | | |
| | | Touchstone | | | International | | | Growth | | | International | | | Large Cap | | | Touchstone | |
| | | Balanced | | | Equity | | | Opportunities | | | Small Cap | | | Focused | | | Large Cap | |
| | | Fund | | | Fund | | | Fund | | | Fund | | | Fund | | | Fund | |
| Investment Income | | | | | | | | | | | | | | | | | | | | | | | | |
| Dividends(A) | | $ | 4,227,996 | | | $ | 2,493,225 | | | $ | 307,084 | | | $ | 1,952,873 | | | $ | 27,845,718 | | | $ | 5,927,049 | |
| Interest | | | 3,859,877 | | | | — | | | | — | | | | — | | | | — | | | | | |
| Income from securities loaned | | | 1,382 | | | | 17,863 | | | | 12,846 | | | | 85,528 | | | | 64,883 | | | | 725 | |
| Total Investment Income | | | 8,089,255 | | | | 2,511,088 | | | | 319,930 | | | | 2,038,401 | | | | 27,910,601 | | | | 5,927,774 | |
| Expenses | | | | | | | | | | | | | | | | | | | | | | | | |
| Investment advisory fees | | | 1,887,829 | | | | 943,728 | | | | 261,806 | | | | 1,256,743 | | | | 10,024,992 | | | | 1,730,730 | |
| Administration fees | | | 518,471 | | | | 195,487 | | | | 47,452 | | | | 191,819 | | | | 2,428,748 | | | | 418,260 | |
| Compliance fees and expenses | | | 2,347 | | | | 2,347 | | | | 2,347 | | | | 2,347 | | | | 2,347 | | | | 2,347 | |
| Custody fees | | | 43,474 | | | | 32,688 | | | | 17,280 | | | | 94,255 | | | | 29,150 | | | | 13,908 | |
| Professional fees | | | 39,224 | | | | 53,730 | | | | 39,612 | | | | 44,910 | | | | 63,372 | | | | 27,634 | |
| Transfer Agent fees, Class A | | | 169,714 | | | | 99,975 | | | | 1,533 | | | | 3,570 | | | | 600,358 | | | | 3,035 | |
| Transfer Agent fees, Class C | | | 31,793 | | | | 5,257 | | | | 450 | | | | 1,639 | | | | 33,728 | | | | 2,644 | |
| Transfer Agent fees, Class Y | | | 62,367 | | | | 27,938 | | | | 3,218 | | | | 94,879 | | | | 379,531 | | | | 167,417 | |
| Transfer Agent fees, Institutional Class | | | — | | | | 278 | | | | 8,629 | | | | 20,807 | | | | 55,498 | | | | 5,715 | |
| Transfer Agent fees, Class R6 | | | — | | | | — | | | | — | | | | — | | | | — | | | | — | |
| Registration Fees, Class A | | | 26,478 | | | | 25,584 | | | | 14,789 | | | | 15,430 | | | | 34,022 | | | | 19,264 | |
| Registration Fees, Class C | | | 17,159 | | | | 10,620 | | | | 4,547 | | | | 10,960 | | | | 15,727 | | | | 11,366 | |
| Registration Fees, Class Y | | | 22,131 | | | | 17,142 | | | | 11,255 | | | | 19,193 | | | | 20,767 | | | | 26,706 | |
| Registration Fees, Institutional Class | | | — | | | | 6,906 | | | | 7,505 | | | | 20,031 | | | | 32,339 | | | | 14,885 | |
| Registration Fees, Class R6 | | | — | | | | — | | | | — | | | | — | | | | — | | | | — | |
| Reports to Shareholders, Class A | | | 11,364 | | | | 10,859 | | | | 4,961 | | | | 4,979 | | | | 23,269 | | | | 5,271 | |
| Reports to Shareholders, Class C | | | 7,307 | | | | 5,395 | | | | 4,878 | | | | 5,175 | | | | 7,803 | | | | 5,456 | |
| Reports to Shareholders, Class Y | | | 10,564 | | | | 6,861 | | | | 5,214 | | | | 10,061 | | | | 20,735 | | | | 18,381 | |
| Reports to Shareholders, Institutional Class | | | — | | | | 5,173 | | | | 4,907 | | | | 5,841 | | | | 14,463 | | | | 5,327 | |
| Reports to Shareholders, Class R6 | | | — | | | | — | | | | — | | | | — | | | | — | | | | — | |
| Distribution expenses, Class A | | | 615,775 | | | | 222,645 | | | | 2,022 | | | | 4,568 | | | | 2,846,910 | | | | 8,020 | |
| Distribution and shareholder servicing expenses, Class C | | | 395,438 | | | | 28,521 | | | | 2,690 | | | | 10,691 | | | | 406,720 | | | | 66,195 | |
| Trustee fees | | | 23,537 | | | | 23,537 | | | | 23,537 | | | | 23,537 | | | | 23,537 | | | | 23,537 | |
| Other expenses | | | 127,690 | | | | 90,701 | | | | 28,029 | | | | 97,364 | | | | 674,641 | | | | 91,277 | |
| Total Expenses | | | 4,012,662 | | | | 1,815,372 | | | | 496,661 | | | | 1,938,799 | | | | 17,738,657 | | | | 2,667,375 | |
| Fees waived by the Advisor and/or Affiliates(B) | | | (240,184 | ) | | | (178,164 | ) | | | (198,001 | ) | | | (248,131 | ) | | | (1,862,662 | ) | | | (414,100 | ) |
| Net Expenses | | | 3,772,478 | | | | 1,637,208 | | | | 298,660 | | | | 1,690,668 | | | | 15,875,995 | | | | 2,253,275 | |
| Net Investment Income (Loss) | | | 4,316,777 | | | | 873,880 | | | | 21,270 | | | | 347,733 | | | | 12,034,606 | | | | 3,674,499 | |
| Realized and Unrealized Gains (Losses) on Investments | | | | | | | | | | | | | | | | | | | | | | | | |
| Net realized gains (losses) on investments(C) | | | 42,305,516 | | | | (1,068,213 | ) | | | (793,490 | ) | | | (6,905,684 | ) | | | 346,567,982 | | | | 144,355 | |
| Net realized gains (losses) on foreign currency transactions | | | — | | | | (80,783 | ) | | | 4,844 | | | | (4,021 | ) | | | — | | | | — | |
| Net realized losses on futures contracts | | | (340,462 | ) | | | — | | | | — | | | | — | | | | — | | | | — | |
| Net change in unrealized appreciation (depreciation) on investments | | | (12,002,059 | ) | | | (8,850,963 | ) | | | 1,743,709 | | | | (18,564,444 | ) | | | (208,421,193 | ) | | | (5,779,963 | ) |
| Net change in unrealized appreciation (depreciation) on foreign currency transactions | | | — | | | | 6,629 | | | | 16 | | | | (2,897 | ) | | | — | | | | — | |
| Net change in unrealized appreciation (depreciation) on futures contracts | | | 18,930 | | | | — | | | | — | | | | — | | | | — | | | | — | |
| Net Realized and Unrealized Gains (Losses) on Investments | | | 29,981,925 | | | | (9,993,330 | ) | | | 955,079 | | | | (25,477,046 | ) | | | 138,146,789 | | | | (5,635,608 | ) |
| Change in Net Assets Resulting from Operations | | $ | 34,298,702 | | | $ | (9,119,450 | ) | | $ | 976,349 | | | $ | (25,129,313 | ) | | $ | 150,181,395 | | | $ | (1,961,109 | ) |
| (A)Net of foreign tax withholding of: | | $ | 35,700 | | | $ | 262,244 | | | $ | 21,926 | | | $ | 176,088 | | | $ | 58,343 | | | $ | 41,385 | |
| (B)See Note 4 in Notes to Financial Statements. | | | | | | | | | | | | | | | | | | | | | | | | |
| (C)For the year ended June 30, 2020, Large Cap Focused Fund had redemptions-in- kind of securities in the amount of $185,676,263. Net realized gains (losses) on investments includes the realized gain on the transactions of $161,037,407, which will not be recognized by the Fund for tax purposes. |
See accompanying Notes to Financial Statements.
Statements of Operations (Continued)
| Touchstone | | | Touchstone | | | | | | | |
| Large Company | | | Ohio | | | Touchstone | | | Touchstone | |
| Growth | | | Tax-Free Bond | | | Small Company | | | Value | |
| Fund | | | Fund | | | Fund | | | Fund | |
| | | | | | | | | | | | | | | |
| $ | 987,851 | | | $ | 187 | | | $ | 7,360,992 | | | $ | 7,597,745 | |
| | — | | | | 1,661,584 | | | | — | | | | — | |
| | 1,753 | | | | — | | | | 42,166 | | | | 431 | |
| | 989,604 | | | | 1,661,771 | | | | 7,403,158 | | | | 7,598,176 | |
| | | | | | | | | | | | | | | |
| | 1,308,574 | | | | 245,618 | | | | 5,948,726 | | | | 2,018,396 | |
| | 302,427 | | | | 71,229 | | | | 1,288,115 | | | | 450,258 | |
| | 2,347 | | | | 2,347 | | | | 2,347 | | | | 2,347 | |
| | 12,560 | | | | 4,226 | | | | 42,135 | | | | 11,535 | |
| | 27,819 | | | | 26,782 | | | | 38,916 | | | | 29,700 | |
| | 1,616 | | | | 16,538 | | | | 612,410 | | | | 30,569 | |
| | 398 | | | | 1,118 | | | | 37,571 | | | | 1,625 | |
| | 18,124 | | | | 2,433 | | | | 270,048 | | | | 76,190 | |
| | 64,172 | | | | 700 | | | | 6,735 | | | | 98,619 | |
| | — | | | | — | | | | 615 | | | | — | |
| | 14,361 | | | | 11,306 | | | | 32,012 | | | | 13,828 | |
| | 7,233 | | | | 5,809 | | | | 15,915 | | | | 10,619 | |
| | 18,664 | | | | 5,240 | | | | 23,001 | | | | 18,225 | |
| | 19,542 | | | | 4,574 | | | | 10,847 | | | | 21,949 | |
| | — | | | | — | | | | 14,402 | | | | — | |
| | 4,754 | | | | 5,474 | | | | 38,598 | | | | 7,836 | |
| | 4,875 | | | | 4,922 | | | | 7,609 | | | | 5,170 | |
| | 5,426 | | | | 4,951 | | | | 37,742 | | | | 11,008 | |
| | 6,359 | | | | 4,940 | | | | 6,730 | | | | 12,221 | |
| | — | | | | — | | | | 8,136 | | | | — | |
| | 4,234 | | | | 80,398 | | | | 1,261,088 | | | | 74,343 | |
| | | | | | | | | | | | | | | |
| | 4,415 | | | | 24,077 | | | | 275,545 | | | | 29,323 | |
| | 23,537 | | | | 23,537 | | | | 23,537 | | | | 23,537 | |
| | 28,165 | | | | 32,554 | | | | 228,123 | | | | 49,660 | |
| | 1,879,602 | | | | 578,773 | | | | 10,230,903 | | | | 2,996,958 | |
| | (334,988 | ) | | | (185,516 | ) | | | (828,925 | ) | | | (627,311 | ) |
| | 1,544,614 | | | | 393,257 | | | | 9,401,978 | | | | 2,369,647 | |
| | (555,010 | ) | | | 1,268,514 | | | | (1,998,820 | ) | | | 5,228,529 | |
| | | | | | | | | | | | | | | |
| | 28,792,111 | | | | (25,576 | ) | | | (12,277,476 | ) | | | 4,605,555 | |
| | — | | | | — | | | | 404,039 | | | | — | |
| | — | | | | — | | | | — | | | | — | |
| | 11,444,230 | | | | 861,083 | | | | (82,101,153 | ) | | | (33,559,870 | ) |
| | | | | | | | | | | | | | | |
| | — | | | | — | | | | — | | | | — | |
| | | | | | | | | | | | | | | |
| | — | | | | — | | | | — | | | | — | |
| | | | | | | | | | | | | | | |
| | 40,236,341 | | | | 835,507 | | | | (93,974,590 | ) | | | (28,954,315 | ) |
| $ | 39,681,331 | | | $ | 2,104,021 | | | $ | (95,973,410 | ) | | $ | (23,725,786 | ) |
| $ | — | | | $ | — | | | $ | — | | | $ | — | |
Statements of Changes in Net Assets
| | | | | | | | | Touchstone | |
| | | | | | Touchstone | | | International | |
| | | Touchstone | | | International | | | Growth | |
| | | Balanced Fund | | | Equity Fund | | | Opportunities Fund | |
| | | For the Year | | | For the Year | | | For the Year | | | For the Year | | | For the Year | | | For the Year | |
| | | Ended | | | Ended | | | Ended | | | Ended | | | Ended | | | Ended | |
| | | June 30, | | | June 30, | | | June 30, | | | June 30, | | | June 30, | | | June 30, | |
| | | 2020 | | | 2019 | | | 2020 | | | 2019 | | | 2020 | | | 2019 | |
| From Operations | | | | | | | | | | | | | | | | | | | | | | | | |
| Net investment income (loss) | | $ | 4,316,777 | | | $ | 4,592,005 | | | $ | 873,880 | | | $ | 2,132,436 | | | $ | 21,270 | | | $ | 5,340 | |
| Net realized gains (losses) on investments, foreign currency transactions and futures contracts | | | 41,965,054 | | | | 11,328,793 | | | | (1,148,996 | ) | | | 987,326 | | | | (788,646 | ) | | | (4,917,129 | ) |
| Net change in unrealized appreciation (depreciation) on investments, foreign currency transactions and futures contracts | | | (11,983,129 | ) | | | 14,547,961 | | | | (8,844,334 | ) | | | (5,801,966 | ) | | | 1,743,725 | | | | 3,313,241 | |
| Change in Net Assets from Operations | | | 34,298,702 | | | | 30,468,759 | | | | (9,119,450 | ) | | | (2,682,204 | ) | | | 976,349 | | | | (1,598,548 | ) |
| | | | | | | | | | | | | | | | | | | | | | | | | |
| Distributions to Shareholders: | | | | | | | | | | | | | | | | | | | | | | | | |
| Distributed earnings, Class A | | | (29,089,903 | ) | | | (14,828,141 | ) | | | (4,839,678 | ) | | | (13,527,353 | ) | | | — | | | | (96,098 | ) |
| Distributed earnings, Class C | | | (4,497,775 | ) | | | (2,152,416 | ) | | | (132,585 | ) | | | (697,755 | ) | | | — | | | | (23,263 | ) |
| Distributed earnings, Class Y | | | (8,553,810 | ) | | | (3,937,083 | ) | | | (2,047,719 | ) | | | (5,855,380 | ) | | | — | | | | (327,855 | ) |
| Distributed earnings, Institutional Class | | | — | | | | — | | | | (585,637 | ) | | | (322,138 | ) | | | (2,978 | ) | | | (4,250,657 | ) |
| Total Distributions | | | (42,141,488 | ) | | | (20,917,640 | ) | | | (7,605,619 | ) | | | (20,402,626 | ) | | | (2,978 | ) | | | (4,697,873 | ) |
| | | | | | | | | | | | | | | | | | | | | | | | | |
| Change in Net Assets from Share Transactions(A) | | | 58,180,563 | | | | 20,066,055 | | | | (20,781,556 | ) | | | (6,377,476 | ) | | | (4,362,971 | ) | | | 6,952,126 | |
| | | | | | | | | | | | | | | | | | | | | | | | | |
| Total Increase (Decrease) in Net Assets | | | 50,337,777 | | | | 29,617,174 | | | | (37,506,625 | ) | | | (29,462,306 | ) | | | (3,389,600 | ) | | | 655,705 | |
| | | | | | | | | | | | | | | | | | | | | | | | | |
| Net Assets | | | | | | | | | | | | | | | | | | | | | | | | |
| Beginning of period | | | 339,055,102 | | | | 309,437,928 | | | | 155,364,174 | | | | 184,826,480 | | | | 34,721,981 | | | | 34,066,276 | |
| End of period | | $ | 389,392,879 | | | $ | 339,055,102 | | | $ | 117,857,549 | | | $ | 155,364,174 | | | $ | 31,332,381 | | | $ | 34,721,981 | |
(A) For details on share transactions by class, see Statements of Changes in Net Assets - Capital Stock Activity on pages 72 - 75.
See accompanying Notes to Financial Statements.
Statements of Changes in Net Assets (Continued)
| Touchstone | | | Touchstone | | | | | | | | | Touchstone | |
| International | | | Large Cap | | | Touchstone | | | Large Company | |
| Small Cap Fund | | | Focused Fund | | | Large Cap Fund | | | Growth Fund | |
| For the Year | | | For the Year | | | For the Year | | | For the Year | | | For the Year | | | For the Year | | | For the Year | | | For the Year | |
| Ended | | | Ended | | | Ended | | | Ended | | | Ended | | | Ended | | | Ended | | | Ended | |
| June 30, | | | June 30, | | | June 30, | | | June 30, | | | June 30, | | | June 30, | | | June 30, | | | June 30, | |
| 2020 | | | 2019 | | | 2020 | | | 2019 | | | 2020 | | | 2019 | | | 2020 | | | 2019 | |
| | | | | | | | | | | | | | | | | | | | | | | | | | | | | | | |
| $ | 347,733 | | | $ | 2,399,320 | | | $ | 12,034,606 | | | $ | 15,868,059 | | | $ | 3,674,499 | | | $ | 2,836,859 | | | $ | (555,010 | ) | | $ | (552,404 | ) |
| | | | | | | | | | | | | | | | | | | | | | | | | | | | | | | |
| | (6,909,705 | ) | | | (11,891,504 | ) | | | 346,567,982 | | | | 252,285,256 | | | | 144,355 | | | | 41,233,499 | | | | 28,792,111 | | | | 16,773,549 | |
| | | | | | | | | | | | | | | | | | | | | | | | | | | | | | | |
| | (18,567,341 | ) | | | (15,254,858 | ) | | | (208,421,193 | ) | | | (98,767,694 | ) | | | (5,779,963 | ) | | | (21,949,713 | ) | | | 11,444,230 | | | | 5,681,900 | |
| | (25,129,313 | ) | | | (24,747,042 | ) | | | 150,181,395 | | | | 169,385,621 | | | | (1,961,109 | ) | | | 22,120,645 | | | | 39,681,331 | | | | 21,903,045 | |
| | | | | | | | | | | | | | | | | | | | | | | | | | | | | | | |
| | (44,657 | ) | | | (348,193 | ) | | | (131,578,336 | ) | | | (118,892,191 | ) | | | (218,888 | ) | | | (17,881 | ) | | | (108,767 | ) | | | (73,858 | ) |
| | (23,075 | ) | | | (157,413 | ) | | | (4,739,957 | ) | | | (6,543,243 | ) | | | (440,616 | ) | | | — | | | | (31,405 | ) | | | (12,084 | ) |
| | (2,154,457 | ) | | | (9,166,622 | ) | | | (46,568,506 | ) | | | (41,722,772 | ) | | | (14,927,652 | ) | | | (2,046,031 | ) | | | (1,238,482 | ) | | | (1,058,842 | ) |
| | (1,263,401 | ) | | | (10,641,767 | ) | | | (12,116,401 | ) | | | (7,761,439 | ) | | | (5,380,266 | ) | | | (635,594 | ) | | | (14,021,254 | ) | | | (12,527,470 | ) |
| | (3,485,590 | ) | | | (20,313,995 | ) | | | (195,003,200 | ) | | | (174,919,645 | ) | | | (20,967,422 | ) | | | (2,699,506 | ) | | | (15,399,908 | ) | | | (13,672,254 | ) |
| | | | | | | | | | | | | | | | | | | | | | | | | | | | | | | |
| | (98,758,703 | ) | | | (69,390,792 | ) | | | (49,295,124 | ) | | | 10,391,963 | | | | 14,194,362 | | | | (102,688,339 | ) | | | (23,706,216 | ) | | | (26,431,941 | ) |
| | | | | | | | | | | | | | | | | | | | | | | | | | | | | | | |
| | (127,373,606 | ) | | | (114,451,829 | ) | | | (94,116,929 | ) | | | 4,857,939 | | | | (8,734,169 | ) | | | (83,267,200 | ) | | | 575,207 | | | | (18,201,150 | ) |
| | | | | | | | | | | | | | | | | | | | | | | | | | | | | | | |
| | 201,448,650 | | | | 315,900,479 | | | | 1,731,938,626 | | | | 1,727,080,687 | | | | 284,299,700 | | | | 367,566,900 | | | | 225,792,093 | | | | 243,993,243 | |
| $ | 74,075,044 | | | $ | 201,448,650 | | | $ | 1,637,821,697 | | | $ | 1,731,938,626 | | | $ | 275,565,531 | | | $ | 284,299,700 | | | $ | 226,367,300 | | | $ | 225,792,093 | |
Statements of Changes in Net Assets (Continued)
| | | Touchstone | | | | | | | | | | | | | |
| | | Ohio Tax-Free | | | Touchstone | | | Touchstone | |
| | | Bond Fund | | | Small Company Fund | | | Value Fund | |
| | | For the Year | | | For the Year | | | For the Year | | | For the Year | | | For the Year | | | For the Year | |
| | | Ended | | | Ended | | | Ended | | | Ended | | | Ended | | | Ended | |
| | | June 30, | | | June 30, | | | June 30, | | | June 30, | | | June 30, | | | June 30, | |
| | | 2020 | | | 2019 | | | 2020 | | | 2019 | | | 2020 | | | 2019 | |
| From Operations | | | | | | | | | | | | | | | | | | | | | | | | |
| Net investment income (loss) | | $ | 1,268,514 | | | $ | 1,350,638 | | | $ | (1,998,820 | ) | | $ | (2,201,712 | ) | | $ | 5,228,529 | | | $ | 6,831,156 | |
| Net realized gains (losses) on investments | | | (25,576 | ) | | | 27,980 | | | | (11,873,437 | ) | | | 115,229,557 | | | | 4,605,555 | | | | 61,453,118 | |
| Net change in unrealized appreciation (depreciation) on investments | | | 861,083 | | | | 1,201,309 | | | | (82,101,153 | ) | | | (133,934,390 | ) | | | (33,559,870 | ) | | | (35,563,563 | ) |
| Change in Net Assets from Operations | | | 2,104,021 | | | | 2,579,927 | | | | (95,973,410 | ) | | | (20,906,545 | ) | | | (23,725,786 | ) | | | 32,720,711 | |
| | | | | | | | | | | | | | | | | | | | | | | | | |
| Distributions to Shareholders: | | | | | | | | | | | | | | | | | | | | | | | | |
| Distributed earnings, Class A | | | (833,284 | ) | | | (971,245 | ) | | | (31,748,103 | ) | | | (70,438,346 | ) | | | (2,056,786 | ) | | | (4,381,019 | ) |
| Distributed earnings, Class C | | | (44,602 | ) | | | (90,903 | ) | | | (3,292,320 | ) | | | (18,479,476 | ) | | | (185,828 | ) | | | (387,177 | ) |
| Distributed earnings, Class Y | | | (75,132 | ) | | | (131,661 | ) | | | (14,318,842 | ) | | | (40,694,612 | ) | | | (5,870,992 | ) | | | (10,881,469 | ) |
| Distributed earnings, Institutional Class | | | (343,542 | ) | | | (156,784 | ) | | | (472,170 | ) | | | (92,997 | ) | | | (14,575,885 | ) | | | (26,051,472 | ) |
| Distributed earnings, Class R6 | | | — | | | | — | | | | (6,772,410 | ) | | | (15,325,342 | ) | | | — | | | | — | |
| Total Distributions | | | (1,296,560 | ) | | | (1,350,593 | ) | | | (56,603,845 | ) | | | (145,030,773 | ) | | | (22,689,491 | ) | | | (41,701,137 | ) |
| | | | | | | | | | | | | | | | | | | | | | | | | |
| Change in Net Assets from Share Transactions(A) | | | 1,487,589 | | | | (261,058 | ) | | | (235,099,173 | ) | | | 42,507,413 | | | | (35,622,508 | ) | | | (38,343,157 | ) |
| | | | | | | | | | | | | | | | | | | | | | | | | |
| Total Increase (Decrease) in Net Assets | | | 2,295,050 | | | | 968,276 | | | | (387,676,428 | ) | | | (123,429,905 | ) | | | (82,037,785 | ) | | | (47,323,583 | ) |
| | | | | | | | | | | | | | | | | | | | | | | | | |
| Net Assets | | | | | | | | | | | | | | | | | | | | | | | | |
| Beginning of period | | | 47,214,624 | | | | 46,246,348 | | | | 1,094,875,595 | | | | 1,218,305,500 | | | | 337,753,247 | | | | 385,076,830 | |
| End of period | | $ | 49,509,674 | | | $ | 47,214,624 | | | $ | 707,199,167 | | | $ | 1,094,875,595 | | | $ | 255,715,462 | | | $ | 337,753,247 | |
(A) For details on share transactions by class, see Statements of Changes in Net Assets - Capital Stock Activity on pages 75 - 76.
See accompanying Notes to Financial Statements.
This page intentionally left blank.
Statements of Changes in Net Assets - Capital Stock Activity
| | | Touchstone Balanced Fund | | | Touchstone International Equity Fund | |
| | | For the | | | For the | | | For the | | | For the | |
| | | Year Ended | | | Year Ended | | | Year Ended | | | Year Ended | |
| | | June 30, 2020 | | | June 30, 2019 | | | June 30, 2020 | | | June 30, 2019 | |
| | | Shares | | | Dollars | | | Shares | | | Dollars | | | Shares | | | Dollars | | | Shares | | | Dollars | |
| Class A | | | | | | | | | | | | | | | | | | | | | | | | | | | | | | | | |
| Proceeds from Shares issued | | | 1,071,065 | | | $ | 23,146,193 | | | | 1,062,296 | | | $ | 22,451,293 | | | | 295,634 | | | $ | 4,268,954 | | | | 557,676 | | | $ | 8,907,754 | |
| Reinvestment of distributions | | | 1,325,400 | | | | 27,861,603 | | | | 692,449 | | | | 14,214,633 | | | | 293,411 | | | | 4,629,085 | | | | 906,752 | | | | 13,019,094 | |
| Cost of Shares redeemed | | | (1,817,914 | ) | | | (39,245,858 | ) | | | (1,851,939 | ) | | | (39,879,250 | ) | | | (1,836,149 | ) | | | (27,342,281 | ) | | | (1,156,806 | ) | | | (18,660,524 | ) |
| Change from Class A Share Transactions | | | 578,551 | | | | 11,761,938 | | | | (97,194 | ) | | | (3,213,324 | ) | | | (1,247,104 | ) | | | (18,444,242 | ) | | | 307,622 | | | | 3,266,324 | |
| Class C | | | | | | | | | | | | | | | | | | | | | | | | | | | | | | | | |
| Proceeds from Shares issued | | | 888,630 | | | | 19,494,979 | | | | 260,512 | | | | 5,744,940 | | | | 11,691 | | | | 164,188 | | | | 19,926 | | | | 345,863 | |
| Reinvestment of distributions | | | 179,350 | | | | 3,786,820 | | | | 99,216 | | | | 2,033,028 | | | | 8,823 | | | | 128,355 | | | | 50,627 | | | | 679,647 | |
| Cost of Shares redeemed | | | (576,807 | ) | | | (12,235,340 | ) | | | (655,564 | ) | | | (13,909,549 | ) | | | (119,310 | ) | | | (1,595,439 | ) | | | (205,583 | ) | | | (2,981,700 | ) |
| Change from Class C Share Transactions | | | 491,173 | | | | 11,046,459 | | | | (295,836 | ) | | | (6,131,581 | ) | | | (98,796 | ) | | | (1,302,896 | ) | | | (135,030 | ) | | | (1,956,190 | ) |
| Class Y | | | | | | | | | | | | | | | | | | | | | | | | | | | | | | | | |
| Proceeds from Shares issued | | | 1,883,944 | | | | 39,791,844 | | | | 2,282,410 | | | | 49,201,431 | | | | 339,363 | | | | 4,856,858 | | | | 896,199 | | | | 14,089,717 | |
| Reinvestment of distributions | | | 407,750 | | | | 8,502,103 | | | | 192,346 | | | | 3,917,535 | | | | 129,700 | | | | 2,019,569 | | | | 408,231 | | | | 5,783,890 | |
| Cost of Shares redeemed | | | (616,752 | ) | | | (12,921,781 | ) | | | (1,151,266 | ) | | | (23,708,006 | ) | | | (1,461,821 | ) | | | (21,458,191 | ) | | | (1,778,878 | ) | | | (28,226,702 | ) |
| Change from Class Y Share Transactions | | | 1,674,942 | | | | 35,372,166 | | | | 1,323,490 | | | | 29,410,960 | | | | (992,758 | ) | | | (14,581,764 | ) | | | (474,448 | ) | | | (8,353,095 | ) |
| Institutional Class | | | | | | | | | | | | | | | | | | | | | | | | | | | | | | | | |
| Proceeds from Shares issued | | | — | | | | — | | | | — | | | | — | | | | 972,020 | | | | 14,827,692 | | | | 22,018 | | | | 393,073 | |
| Reinvestment of distributions | | | — | | | | — | | | | — | | | | — | | | | 37,466 | | | | 585,849 | | | | 22,774 | | | | 322,139 | |
| Cost of Shares redeemed | | | — | | | | — | | | | — | | | | — | | | | (141,192 | ) | | | (1,866,195 | ) | | | (2,829 | ) | | | (49,727 | ) |
| Change from Institutional Class Share Transactions | | | — | | | | — | | | | — | | | | — | | | | 868,294 | | | | 13,547,346 | | | | 41,963 | | | | 665,485 | |
| Change from Share Transactions | | | 2,744,666 | | | $ | 58,180,563 | | | | 930,460 | | | $ | 20,066,055 | | | | (1,470,364 | ) | | $ | (20,781,556 | ) | | | (259,893 | ) | | $ | (6,377,476 | ) |
See accompanying Notes to Financial Statements.
Statements of Changes in Net Assets - Capital Stock Activity (Continued)
| Touchstone International Growth Opportunities Fund | | | Touchstone International Small Cap Fund | |
| For the | | | For the | | | For the | | | For the | |
| Year Ended | | | Year Ended | | | Year Ended | | | Year Ended | |
| June 30, 2020 | | | June 30, 2019 | | | June 30, 2020 | | | June 30, 2019 | |
| Shares | | | Dollars | | | Shares | | | Dollars | | | Shares | | | Dollars | | | Shares | | | Dollars | |
| | | | | | | | | | | | | | | | | | | | | | | |
| | 12,111 | | | $ | 260,627 | | | | 16,945 | | | $ | 375,240 | | | | 13,847 | | | $ | 186,958 | | | | 43,026 | | | $ | 688,045 | |
| | — | | | | — | | | | 5,357 | | | | 96,098 | | | | 2,617 | | | | 40,348 | | | | 19,506 | | | | 263,989 | |
| | (13,111 | ) | | | (266,084 | ) | | | (23,131 | ) | | | (521,732 | ) | | | (94,098 | ) | | | (1,249,948 | ) | | | (540,066 | ) | | | (8,195,037 | ) |
| | | | | | | | | | | | | | | | | | | | | | | | | | | | | | | |
| | (1,000 | ) | | | (5,457 | ) | | | (829 | ) | | | (50,394 | ) | | | (77,634 | ) | | | (1,022,642 | ) | | | (477,534 | ) | | | (7,243,003 | ) |
| | | | | | | | | | | | | | | | | | | | | | | | | | | | | | | |
| | 11,876 | | | | 249,101 | | | | 4,796 | | | | 102,072 | | | | 2,512 | | | | 35,699 | | | | 9,015 | | | | 135,668 | |
| | — | | | | — | | | | 1,323 | | | | 23,263 | | | | 1,348 | | | | 20,276 | | | | 10,792 | | | | 143,043 | |
| | (2,187 | ) | | | (46,547 | ) | | | (14,809 | ) | | | (322,477 | ) | | | (58,076 | ) | | | (772,605 | ) | | | (56,187 | ) | | | (820,298 | ) |
| | | | | | | | | | | | | | | | | | | | | | | | | | | | | | | |
| | 9,689 | | | | 202,554 | | | | (8,690 | ) | | | (197,142 | ) | | | (54,216 | ) | | | (716,630 | ) | | | (36,380 | ) | | | (541,587 | ) |
| | | | | | | | | | | | | | | | | | | | | | | | | | | | | | | |
| | 83,502 | | | | 1,764,656 | | | | 103,079 | | | | 2,090,608 | | | | 330,175 | | | | 4,285,139 | | | | 514,728 | | | | 7,770,651 | |
| | — | | | | — | | | | 18,202 | | | | 327,855 | | | | 131,537 | | | | 2,074,335 | | | | 645,591 | | | | 8,930,258 | |
| | (154,441 | ) | | | (3,112,215 | ) | | | (192,606 | ) | | | (3,806,371 | ) | | | (1,288,529 | ) | | | (17,812,382 | ) | | | (2,717,834 | ) | | | (42,233,109 | ) |
| | | | | | | | | | | | | | | | | | | | | | | | | | | | | | | |
| | (70,939 | ) | | | (1,347,559 | ) | | | (71,325 | ) | | | (1,387,908 | ) | | | (826,817 | ) | | | (11,452,908 | ) | | | (1,557,515 | ) | | | (25,532,200 | ) |
| | | | | | | | | | | | | | | | | | | | | | | | | | | | | | | |
| | 49,235 | | | | 1,015,777 | | | | 527,744 | | | | 12,739,115 | | | | 329,792 | | | | 4,185,464 | | | | 1,910,429 | | | | 29,584,745 | |
| | 130 | | | | 2,978 | | | | 234,396 | | | | 4,238,825 | | | | 79,609 | | | | 1,263,401 | | | | 764,467 | | | | 10,631,410 | |
| | (219,872 | ) | | | (4,231,264 | ) | | | (411,764 | ) | | | (8,390,370 | ) | | | (6,499,974 | ) | | | (91,015,388 | ) | | | (4,852,742 | ) | | | (76,290,157 | ) |
| | | | | | | | | | | | | | | | | | | | | | | | | | | | | | | |
| | (170,507 | ) | | | (3,212,509 | ) | | | 350,376 | | | | 8,587,570 | | | | (6,090,573 | ) | | | (85,566,523 | ) | | | (2,177,846 | ) | | | (36,074,002 | ) |
| | (232,757 | ) | | $ | (4,362,971 | ) | | | 269,532 | | | $ | 6,952,126 | | | | (7,049,240 | ) | | $ | (98,758,703 | ) | | | (4,249,275 | ) | | $ | (69,390,792 | ) |
Statements of Changes in Net Assets - Capital Stock Activity (Continued)
| | | Touchstone Large Cap Focused Fund | | | Touchstone Large Cap Fund | |
| | | For the | | | For the | | | For the | | | For the | |
| | | Year Ended | | | Year Ended | | | Year Ended | | | Year Ended | |
| | | June 30, 2020 | | | June 30, 2019 | | | June 30, 2020 | | | June 30, 2019 | |
| | | Shares | | | Dollars | | | Shares | | | Dollars | | | Shares | | | Dollars | | | Shares | | | Dollars | |
| Class A | | | | | | | | | | | | | | | | | | | | | | | | | | | | | | | | |
| Proceeds from Shares issued | | | 1,093,228 | | | $ | 45,630,547 | | | | 1,405,226 | | | $ | 58,296,751 | | | | 61,831 | | | $ | 840,848 | | | | 131,766 | | | $ | 1,800,763 | |
| Reinvestment of distributions | | | 2,871,516 | | | | 120,183,045 | | | | 2,715,786 | | | | 106,532,964 | | | | 13,629 | | | | 193,756 | | | | 1,281 | | | | 15,801 | |
| Cost of Shares redeemed | | | (4,469,691 | ) | | | (185,302,273 | ) | | | (4,961,303 | ) | | | (210,066,892 | ) | | | (134,518 | ) | | | (1,853,321 | ) | | | (69,014 | ) | | | (944,786 | ) |
| Change from Class A Share Transactions | | | (504,947 | ) | | | (19,488,681 | ) | | | (840,291 | ) | | | (45,237,177 | ) | | | (59,058 | ) | | | (818,717 | ) | | | 64,033 | | | | 871,778 | |
| Class C | | | | | | | | | | | | | | | | | | | | | | | | | | | | | | | | |
| Proceeds from Shares issued | | | 82,067 | | | | 3,184,364 | | | | 157,729 | | | | 6,280,274 | | | | 23,690 | | | | 316,151 | | | | 114,719 | | | | 1,531,304 | |
| Reinvestment of distributions | | | 117,565 | | | | 4,539,194 | | | | 171,149 | | | | 6,291,421 | | | | 30,317 | | | | 420,803 | | | | — | | | | — | |
| Cost of Shares redeemed | | | (422,583 | ) | | | (16,633,766 | ) | | | (786,837 | ) | | | (30,193,725 | ) | | | (165,774 | ) | | | (2,198,939 | ) | | | (184,467 | ) | | | (2,443,682 | ) |
| Change from Class C Share Transactions | | | (222,951 | ) | | | (8,910,208 | ) | | | (457,959 | ) | | | (17,622,030 | ) | | | (111,767 | ) | | | (1,461,985 | ) | | | (69,748 | ) | | | (912,378 | ) |
| Class Y | | | | | | | | | | | | | | | | | | | | | | | | | | | | | | | | |
| Proceeds from Shares issued | | | 1,636,808 | | | | 67,768,500 | | | | 2,348,057 | | | | 98,974,817 | | | | 1,724,859 | | | | 21,568,055 | | | | 1,044,064 | | | | 13,855,912 | |
| Reinvestment of distributions | | | 993,280 | | | | 41,493,721 | | | | 870,960 | | | | 34,044,871 | | | | 1,020,838 | | | | 14,562,437 | | | | 161,741 | | | | 1,995,885 | |
| Cost of Shares redeemed | | | (3,836,605 | ) | | | (158,226,210 | ) | | | (2,685,332 | ) | | | (114,700,906 | ) | | | (2,034,074 | ) | | | (27,404,668 | ) | | | (3,524,466 | ) | | | (47,963,236 | ) |
| Change from Class Y Share Transactions | | | (1,206,517 | ) | | | (48,963,989 | ) | | | 533,685 | | | | 18,318,782 | | | | 711,623 | | | | 8,725,824 | | | | (2,318,661 | ) | | | (32,111,439 | ) |
| Institutional Class | | | | | | | | | | | | | | | | | | | | | | | | | | | | | | | | |
| Proceeds from Shares issued | | | 6,111,185 | | | | 255,066,019 | | | | 3,230,674 | | | | 137,634,347 | | | | 1,656,126 | | | | 23,370,143 | | | | 826,367 | | | | 11,434,220 | |
| Reinvestment of distributions | | | 288,925 | | | | 12,103,812 | | | | 198,310 | | | | 7,761,448 | | | | 321,896 | | | | 4,601,323 | | | | 42,766 | | | | 528,158 | |
| Cost of Shares redeemed | | | (5,690,923 | ) | | | (239,102,077 | ) | | | (2,176,132 | ) | | | (90,463,407 | ) | | | (1,546,062 | ) | | | (20,222,226 | ) | | | (6,046,153 | ) | | | (82,498,678 | ) |
| Change from Institutional Class Share Transactions | | | 709,187 | | | | 28,067,754 | | | | 1,252,852 | | | | 54,932,388 | | | | 431,960 | | | | 7,749,240 | | | | (5,177,020 | ) | | | (70,536,300 | ) |
| Change from Share Transactions | | | (1,225,228 | ) | | $ | (49,295,124 | ) | | | 488,287 | | | $ | 10,391,963 | | | | 972,758 | | | $ | 14,194,362 | | | | (7,501,396 | ) | | $ | (102,688,339 | ) |
See accompanying Notes to Financial Statements.
Statements of Changes in Net Assets - Capital Stock Activity (Continued)
| Touchstone Large Company Growth Fund | | | Touchstone Ohio Tax-Free Bond Fund | |
| For the | | | For the | | | For the | | | For the | |
| Year Ended | | | Year Ended | | | Year Ended | | | Year Ended | |
| June 30, 2020 | | | June 30, 2019 | | | June 30, 2020 | | | June 30, 2019 | |
| Shares | | | Dollars | | | Shares | | | Dollars | | | Shares | | | Dollars | | | Shares | | | Dollars | |
| | | | | | | | | | | | | | | | | | | | | | | |
| | 27,584 | | | $ | 1,175,940 | | | | 51,395 | | | $ | 2,152,550 | | | | 106,958 | | | $ | 1,258,988 | | | | 290,571 | | | $ | 3,284,978 | |
| | 2,596 | | | | 108,767 | | | | 2,021 | | | | 73,858 | | | | 54,876 | | | | 644,729 | | | | 64,092 | | | | 728,125 | |
| | (19,213 | ) | | | (848,637 | ) | | | (102,561 | ) | | | (4,230,513 | ) | | | (334,608 | ) | | | (3,920,411 | ) | | | (626,127 | ) | | | (7,087,256 | ) |
| | | | | | | | | | | | | | | | | | | | | | | | | | | | | | | |
| | 10,967 | | | | 436,070 | | | | (49,145 | ) | | | (2,004,105 | ) | | | (172,774 | ) | | | (2,016,694 | ) | | | (271,464 | ) | | | (3,074,153 | ) |
| | | | | | | | | | | | | | | | | | | | | | | | | | | | | | | |
| | 3,214 | | | | 136,311 | | | | 17,107 | | | | 576,349 | | | | 2,012 | | | | 23,216 | | | | 85,728 | | | | 968,365 | |
| | 768 | | | | 31,234 | | | | 337 | | | | 12,084 | | | | 3,086 | | | | 36,303 | | | | 5,682 | | | | 64,504 | |
| | (615 | ) | | | (27,011 | ) | | | (13,711 | ) | | | (512,697 | ) | | | (68,781 | ) | | | (806,395 | ) | | | (328,141 | ) | | | (3,722,309 | ) |
| | | | | | | | | | | | | | | | | | | | | | | | | | | | | | | |
| | 3,367 | | | | 140,534 | | | | 3,733 | | | | 75,736 | | | | (63,683 | ) | | | (746,876 | ) | | | (236,731 | ) | | | (2,689,440 | ) |
| | | | | | | | | | | | | | | | | | | | | | | | | | | | | | | |
| | 225,624 | | | | 10,088,751 | | | | 177,376 | | | | 7,212,602 | | | | 53,795 | | | | 632,460 | | | | 231,046 | | | | 2,594,686 | |
| | 29,287 | | | | 1,238,247 | | | | 22,207 | | | | 816,318 | | | | 3,770 | | | | 44,349 | | | | 8,367 | | | | 94,690 | |
| | (210,527 | ) | | | (9,205,265 | ) | | | (126,685 | ) | | | (5,088,215 | ) | | | (97,210 | ) | | | (1,137,457 | ) | | | (384,632 | ) | | | (4,349,670 | ) |
| | | | | | | | | | | | | | | | | | | | | | | | | | | | | | | |
| | 44,384 | | | | 2,121,733 | | | | 72,898 | | | | 2,940,705 | | | | (39,645 | ) | | | (460,648 | ) | | | (145,219 | ) | | | (1,660,294 | ) |
| | | | | | | | | | | | | | | | | | | | | | | | | | | | | | | |
| | 621,303 | | | | 27,092,012 | | | | 762,108 | | | | 30,157,517 | | | | 537,246 | | | | 6,309,218 | | | | 759,782 | | | | 8,629,842 | |
| | 310,297 | | | | 13,168,983 | | | | 320,166 | | | | 11,801,332 | | | | 27,077 | | | | 318,450 | | | | 11,514 | | | | 131,506 | |
| | (1,547,054 | ) | | | (66,665,548 | ) | | | (1,716,589 | ) | | | (69,403,126 | ) | | | (164,375 | ) | | | (1,915,861 | ) | | | (141,067 | ) | | | (1,598,519 | ) |
| | | | | | | | | | | | | | | | | | | | | | | | | | | | | | | |
| | (615,454 | ) | | | (26,404,553 | ) | | | (634,315 | ) | | | (27,444,277 | ) | | | 399,948 | | | | 4,711,807 | | | | 630,229 | | | | 7,162,829 | |
| | (556,736 | ) | | $ | (23,706,216 | ) | | | (606,829 | ) | | $ | (26,431,941 | ) | | | 123,846 | | | $ | 1,487,589 | | | | (23,185 | ) | | $ | (261,058 | ) |
Statements of Changes in Net Assets - Capital Stock Activity (Continued)
| | | Touchstone Small Company Fund | | | Touchstone Value Fund | |
| | | For the | | | For the | | | For the | | | For the | |
| | | Year Ended | | | Year Ended | | | Year Ended | | | Year Ended | |
| | | June 30, 2020 | | | June 30, 2019 | | | June 30, 2020 | | | June 30, 2019 | |
| | | Shares | | | Dollars | | | Shares | | | Dollars | | | Shares | | | Dollars | | | Shares | | | Dollars | |
| Class A | | | | | | | | | | | | | | | | | | | | | | | | | | | | | | | | |
| Proceeds from Shares issued | | | 5,229,849 | | | $ | 22,478,782 | | | | 16,731,844 | | | $ | 80,853,774 | | | | 208,759 | | | $ | 1,790,085 | | | | 342,319 | | | $ | 3,126,791 | |
| Proceeds from Shares issued in connection with reorganization(A) | | | — | | | | — | | | | 3,572,822 | | | | 21,326,954 | | | | — | | | | — | | | | — | | | | — | |
| Reinvestment of distributions | | | 6,439,957 | | | | 30,074,578 | | | | 14,442,575 | | | | 65,858,483 | | | | 210,421 | | | | 1,942,246 | | | | 471,809 | | | | 4,130,251 | |
| Cost of Shares redeemed | | | (30,257,387 | ) | | | (132,023,765 | ) | | | (32,140,085 | ) | | | (163,567,335 | ) | | | (833,351 | ) | | | (7,537,550 | ) | | | (1,036,154 | ) | | | (9,313,809 | ) |
| Change from Class A Share Transactions | | | (18,587,581 | ) | | | (79,470,405 | ) | | | 2,607,156 | | | | 4,471,876 | | | | (414,171 | ) | | | (3,805,219 | ) | | | (222,026 | ) | | | (2,056,767 | ) |
| Class C | | | | | | | | | | | | | | | | | | | | | | | | | | | | | | | | |
| Proceeds from Shares issued | | | 1,006,615 | | | | 2,036,014 | | | | 1,559,656 | | | | 4,910,361 | | | | 68,628 | | | | 635,575 | | | | 181,399 | | | | 1,683,899 | |
| Proceeds from Shares issued in connection with reorganization(A) | | | — | | | | — | | | | 1,917,820 | | | | 6,665,795 | | | | — | | | | — | | | | — | | | | — | |
| Reinvestment of distributions | | | 1,402,573 | | | | 3,211,891 | | | | 7,546,781 | | | | 18,036,807 | | | | 17,964 | | | | 167,755 | | | | 38,060 | | | | 330,556 | |
| Cost of Shares redeemed | | | (7,363,570 | ) | | | (16,728,640 | ) | | | (25,485,447 | ) | | | (64,901,221 | ) | | | (150,811 | ) | | | (1,236,808 | ) | | | (250,222 | ) | | | (2,284,487 | ) |
| Change from Class C Share Transactions | | | (4,954,382 | ) | | | (11,480,735 | ) | | | (14,461,190 | ) | | | (35,288,258 | ) | | | (64,219 | ) | | | (433,478 | ) | | | (30,763 | ) | | | (270,032 | ) |
| Class Y | | | | | | | | | | | | | | | | | | | | | | | | | | | | | | | | |
| Proceeds from Shares issued | | | 9,218,953 | | | | 44,364,273 | | | | 16,511,884 | | | | 94,236,360 | | | | 2,623,997 | | | | 22,752,238 | | | | 2,222,254 | | | | 20,763,333 | |
| Proceeds from Shares issued in connection with reorganization(A) | | | — | | | | — | | | | 11,284,528 | | | | 73,494,700 | | | | — | | | | — | | | | — | | | | — | |
| Reinvestment of distributions | | | 2,704,570 | | | | 14,036,717 | | | | 7,860,688 | | | | 39,597,755 | | | | 623,279 | | | | 5,737,361 | | | | 1,206,086 | | | | 10,617,220 | |
| Cost of Shares redeemed | | | (31,239,620 | ) | | | (151,096,957 | ) | | | (37,969,485 | ) | | | (216,189,336 | ) | | | (3,688,022 | ) | | | (32,340,885 | ) | | | (1,823,552 | ) | | | (16,924,844 | ) |
| Change from Class Y Share Transactions | | | (19,316,097 | ) | | | (92,695,967 | ) | | | (2,312,385 | ) | | | (8,860,521 | ) | | | (440,746 | ) | | | (3,851,286 | ) | | | 1,604,788 | | | | 14,455,709 | |
| Institutional Class | | | | | | | | | | | | | | | | | | | | | | | | | | | | | | | | |
| Proceeds from Shares issued | | | 2,365,997 | | | | 11,430,932 | | | | 609,671 | | | | 3,527,675 | | | | 5,719,683 | | | | 50,154,102 | | | | 3,608,349 | | | | 34,039,839 | |
| Proceeds from Shares issued in connection with reorganization(A) | | | — | | | | — | | | | 556,531 | | | | 3,625,412 | | | | — | | | | — | | | | — | | | | — | |
| Reinvestment of distributions | | | 91,153 | | | | 472,170 | | | | 17,201 | | | | 86,450 | | | | 1,545,141 | | | | 14,277,687 | | | | 2,943,095 | | | | 25,920,663 | |
| Cost of Shares redeemed | | | (378,369 | ) | | | (1,974,306 | ) | | | (768,175 | ) | | | (4,851,081 | ) | | | (10,077,773 | ) | | | (91,964,314 | ) | | | (10,819,317 | ) | | | (110,432,569 | ) |
| Change from Institutional Class Share Transactions | | | 2,078,781 | | | | 9,928,796 | | | | 415,228 | | | | 2,388,456 | | | | (2,812,949 | ) | | | (27,532,525 | ) | | | (4,267,873 | ) | | | (50,472,067 | ) |
| Class R6 | | | | | | | | | | | | | | | | | | | | | | | | | | | | | | | | |
| Proceeds from Shares issued | | | 4,043,763 | | | | 18,024,523 | | | | 21,896,944 | | | | 120,345,208 | | | | — | | | | — | | | | — | | | | — | |
| Reinvestment of distributions | | | 862,270 | | | | 4,147,518 | | | | 1,780,528 | | | | 8,323,538 | | | | — | | | | — | | | | — | | | | — | |
| Cost of Shares redeemed | | | (17,268,992 | ) | | | (83,552,903 | ) | | | (9,403,473 | ) | | | (48,872,886 | ) | | | — | | | | — | | | | — | | | | — | |
| Change from Class R6 Share Transactions | | | (12,362,959 | ) | | | (61,380,862 | ) | | | 14,273,999 | | | | 79,795,860 | | | | — | | | | — | | | | — | | | | — | |
| Change from Share Transactions | | | (53,142,238 | ) | | $ | (235,099,173 | ) | | | 522,808 | | | $ | 42,507,413 | | | | (3,732,085 | ) | | $ | (35,622,508 | ) | | | (2,915,874 | ) | | $ | (38,343,157 | ) |
(A) See Note 9 in Notes to Financial Statements.
See accompanying Notes to Financial Statements.
Financial Highlights
Touchstone Balanced Fund—Class A
Selected Data for a Share Outstanding Throughout Each Period
| | | | | | | | | Seven Months | | | | | | | | | | |
| | | | | | | | | Ended | | | | | | | | | | |
| | | Year Ended June 30, | | | June 30, | | | Year Ended November 30, | |
| | | | 2020 | | | | 2019 | | | | 2018(A) | | | | 2017 | | | | 2016 | | | | 2015 | |
| Net asset value at beginning of period | | $ | 22.18 | | | $ | 21.54 | | | $ | 22.40 | | | $ | 19.68 | | | $ | 19.87 | | | $ | 20.98 | |
| Income (loss) from investment operations: | | | | | | | | | | | | | | | | | | | | | | | | |
| Net investment income | | | 0.27 | | | | 0.32 | | | | 0.16 | | | | 0.21 | | | | 0.23 | (B) | | | 0.43 | (B) |
| Net realized and unrealized gains (losses) on investments | | | 1.85 | | | | 1.73 | | | | 0.22 | | | | 2.89 | | | | 0.66 | | | | (0.35 | ) |
| Total from investment operations | | | 2.12 | | | | 2.05 | | | | 0.38 | | | | 3.10 | | | | 0.89 | | | | 0.08 | |
| Distributions from: | | | | | | | | | | | | | | | | | | | | | | | | |
| Net investment income | | | (0.28 | ) | | | (0.34 | ) | | | (0.18 | ) | | | (0.25 | ) | | | (0.44 | ) | | | (0.30 | ) |
| Realized capital gains | | | (2.41 | ) | | | (1.07 | ) | | | (1.06 | ) | | | (0.13 | ) | | | (0.64 | ) | | | (0.89 | ) |
| Total distributions | | | (2.69 | ) | | | (1.41 | ) | | | (1.24 | ) | | | (0.38 | ) | | | (1.08 | ) | | | (1.19 | ) |
| Net asset value at end of period | | $ | 21.61 | | | $ | 22.18 | | | $ | 21.54 | | | $ | 22.40 | | | $ | 19.68 | | | $ | 19.87 | |
| Total return(C) | | | 10.09 | % | | | 10.13 | % | | | 1.72 | %(D) | | | 15.95 | % | | | 4.75 | % | | | 0.56 | % |
| Ratios and supplemental data: | | | | | | | | | | | | | | | | | | | | | | | | |
| Net assets at end of period (000’s) | | $ | 250,298 | | | $ | 244,037 | | | $ | 239,056 | | | $ | 258,279 | | | $ | 264,910 | | | $ | 263,276 | |
| Ratio to average net assets: | | | | | | | | | | | | | | | | | | | | | | | | |
| Net expenses | | | 1.01 | % | | | 1.01 | % | | | 1.01 | %(E) | | | 1.03 | % | | | 1.01 | % | | | 1.04 | % |
| Gross expenses | | | 1.07 | % | | | 1.09 | % | | | 1.07 | %(E) | | | 1.04 | % | | | 1.01 | % | | | 1.04 | % |
| Net investment income | | | 1.25 | % | | | 1.49 | % | | | 1.24 | %(E) | | | 0.99 | % | | | 1.20 | % | | | 2.17 | %(F) |
| Portfolio turnover rate | | | 135 | % | | | 81 | % | | | 119 | %(D) | | | 46 | % | | | 45 | % | | | 86 | % |
Touchstone Balanced Fund—Class C
Selected Data for a Share Outstanding Throughout Each Period
| | | | | | | | | Seven Months | | | | | | | | | | |
| | | | | | | | | Ended | | | | | | | | | | |
| | | Year Ended June 30, | | | June 30, | | | Year Ended November 30, | |
| | | | 2020 | | | | 2019 | | | | 2018(A) | | | | 2017 | | | | 2016 | | | | 2015 | |
| Net asset value at beginning of period | | $ | 22.29 | | | $ | 21.63 | | | $ | 22.46 | | | $ | 19.73 | | | $ | 19.93 | | | $ | 21.04 | |
| Income (loss) from investment operations: | | | | | | | | | | | | | | | | | | | | | | | | |
| Net investment income | | | 0.11 | | | | 0.15 | | | | 0.06 | | | | 0.04 | | | | 0.08 | (B) | | | 0.28 | (B) |
| Net realized and unrealized gains (losses) on investments | | | 1.86 | | | | 1.75 | | | | 0.22 | | | | 2.91 | | | | 0.66 | | | | (0.35 | ) |
| Total from investment operations | | | 1.97 | | | | 1.90 | | | | 0.28 | | | | 2.95 | | | | 0.74 | | | | (0.07 | ) |
| Distributions from: | | | | | | | | | | | | | | | | | | | | | | | | |
| Net investment income | | | (0.13 | ) | | | (0.17 | ) | | | (0.05 | ) | | | (0.09 | ) | | | (0.30 | ) | | | (0.15 | ) |
| Realized capital gains | | | (2.41 | ) | | | (1.07 | ) | | | (1.06 | ) | | | (0.13 | ) | | | (0.64 | ) | | | (0.89 | ) |
| Total distributions | | | (2.54 | ) | | | (1.24 | ) | | | (1.11 | ) | | | (0.22 | ) | | | (0.94 | ) | | | (1.04 | ) |
| Net asset value at end of period | | $ | 21.72 | | | $ | 22.29 | | | $ | 21.63 | | | $ | 22.46 | | | $ | 19.73 | | | $ | 19.93 | |
| Total return(C) | | | 9.23 | % | | | 9.33 | % | | | 1.25 | %(D) | | | 15.09 | % | | | 3.91 | % | | | (0.23 | %) |
| Ratios and supplemental data: | | | | | | | | | | | | | | | | | | | | | | | | |
| Net assets at end of period (000’s) | | $ | 44,174 | | | $ | 34,380 | | | $ | 39,769 | | | $ | 42,800 | | | $ | 43,066 | | | $ | 35,344 | |
| Ratio to average net assets: | | | | | | | | | | | | | | | | | | | | | | | | |
| Net expenses | | | 1.78 | % | | | 1.78 | % | | | 1.78 | %(E) | | | 1.79 | % | | | 1.78 | % | | | 1.82 | % |
| Gross expenses | | | 1.88 | % | | | 1.89 | % | | | 1.86 | %(E) | | | 1.81 | % | | | 1.78 | % | | | 1.82 | % |
| Net investment income | | | 0.48 | % | | | 0.72 | % | | | 0.47 | %(E) | | | 0.23 | % | | | 0.43 | % | | | 1.39 | %(F) |
| Portfolio turnover rate | | | 135 | % | | | 81 | % | | | 119 | %(D) | | | 46 | % | | | 45 | % | | | 86 | % |
| (A) | The Fund changed its fiscal year end from November 30 to June 30. |
| (B) | The net investment income per share was based on average shares outstanding for the period. |
| (C) | Total returns shown exclude the effect of applicable sales loads and fees. If these charges were included, the returns would be lower. |
| (F) | Includes the impact of special dividends resulting from an acquisition of Covidien plc by Medtronic, Inc. on January 26, 2015 through the formation of a new holding company, Medtronic plc, incorporated in Ireland. These special dividends enhanced the ratios of net investment income for Class A and Class C shares by 0.86% for the fiscal year ended November 30, 2015. |
See accompanying Notes to Financial Statements.
Financial Highlights (Continued)
Touchstone Balanced Fund—Class Y
Selected Data for a Share Outstanding Throughout Each Period
| | | | | | | | | Seven Months | | | | | | | | | | |
| | | | | | | | | Ended | | | | | | | | | | |
| | | Year Ended June 30, | | | June 30, | | | Year Ended November 30, | |
| | | | 2020 | | | | 2019 | | | | 2018(A) | | | | 2017(B) | | | | 2016 | | | | 2015 | |
| Net asset value at beginning of period | | $ | 22.01 | | | $ | 21.39 | | | $ | 22.26 | | | $ | 19.57 | | | $ | 19.78 | | | $ | 20.90 | |
| Income (loss) from investment operations: | | | | | | | | | | | | | | | | | | | | | | | | |
| Net investment income | | | 0.32 | | | | 0.35 | | | | 0.19 | | | | 0.28 | | | | 0.27 | (C) | | | 0.47 | (C) |
| Net realized and unrealized gains (losses) on investments | | | 1.84 | | | | 1.72 | | | | 0.22 | | | | 2.84 | | | | 0.65 | | | | (0.34 | ) |
| Total from investment operations | | | 2.16 | | | | 2.07 | | | | 0.41 | | | | 3.12 | | | | 0.92 | | | | 0.13 | |
| Distributions from: | | | | | | | | | | | | | | | | | | | | | | | | |
| Net investment income | | | (0.33 | ) | | | (0.38 | ) | | | (0.22 | ) | | | (0.30 | ) | | | (0.49 | ) | | | (0.36 | ) |
| Realized capital gains | | | (2.41 | ) | | | (1.07 | ) | | | (1.06 | ) | | | (0.13 | ) | | | (0.64 | ) | | | (0.89 | ) |
| Total distributions | | | (2.74 | ) | | | (1.45 | ) | | | (1.28 | ) | | | (0.43 | ) | | | (1.13 | ) | | | (1.25 | ) |
| Net asset value at end of period | | $ | 21.43 | | | $ | 22.01 | | | $ | 21.39 | | | $ | 22.26 | | | $ | 19.57 | | | $ | 19.78 | |
| Total return | | | 10.35 | % | | | 10.33 | % | | | 1.86 | %(D) | | | 16.20 | % | | | 4.94 | % | | | 0.79 | % |
| Ratios and supplemental data: | | | | | | | | | | | | | | | | | | | | | | | | |
| Net assets at end of period (000’s) | | $ | 94,921 | | | $ | 60,638 | | | $ | 30,612 | | | $ | 31,215 | | | $ | 14,477 | | | $ | 12,589 | |
| Ratio to average net assets: | | | | | | | | | | | | | | | | | | | | | | | | |
| Net expenses | | | 0.81 | % | | | 0.81 | % | | | 0.81 | %(E) | | | 0.78 | % | | | 0.81 | % | | | 0.81 | % |
| Gross expenses | | | 0.87 | % | | | 0.88 | % | | | 0.90 | %(E) | | | 0.80 | % | | | 0.81 | % | | | 0.81 | % |
| Net investment income | | | 1.45 | % | | | 1.69 | % | | | 1.44 | %(E) | | | 1.25 | % | | | 1.41 | % | | | 2.39 | %(F) |
| Portfolio turnover rate | | | 135 | % | | | 81 | % | | | 119 | %(D) | | | 46 | % | | | 45 | % | | | 86 | % |
| (A) | The Fund changed its fiscal year end from November 30 to June 30. |
| (B) | Effective October 28, 2017, Class I shares of the Sentinel Balanced Fund (the “Predecessor Fund”) were reorganized into Class Y shares of the Fund. |
| (C) | The net investment income per share was based on average shares outstanding for the period. |
| (F) | Includes the impact of special dividends resulting from an acquisition of Covidien plc by Medtronic, Inc. on January 26, 2015 through the formation of a new holding company, Medtronic plc, incorporated in Ireland. These special dividends enhanced the ratios of net investment income for Class Y shares by 0.86% for the fiscal year ended November 30, 2015. |
See accompanying Notes to Financial Statements.
Financial Highlights (Continued)
Touchstone International Equity Fund—Class A
Selected Data for a Share Outstanding Throughout Each Period
| | | | | | | | | Seven Months | | | | | | | | | | |
| | | | | | | | | Ended | | | | | | | | | | |
| | | Year Ended June 30, | | | June 30, | | | Year Ended November 30, | |
| | | | 2020 | | | | 2019 | | | | 2018(A) | | | | 2017 | | | | 2016 | | | | 2015 | |
| Net asset value at beginning of period | | $ | 15.65 | | | $ | 18.15 | | | $ | 19.64 | | | $ | 15.52 | | | $ | 16.92 | | | $ | 19.61 | |
| Income (loss) from investment operations: | | | | | | | | | | | | | | | | | | | | | | | | |
| Net investment income | | | 0.08 | (B) | | | 0.20 | (B) | | | 0.36 | (C) | | | 0.17 | | | | 0.18 | (B) | | | 0.13 | (B) |
| Net realized and unrealized gains (losses) on investments | | | (0.98 | ) | | | (0.57 | ) | | | (0.94 | ) | | | 4.05 | | | | (0.97 | ) | | | 0.47 | |
| Total from investment operations | | | (0.90 | ) | | | (0.37 | ) | | | (0.58 | ) | | | 4.22 | | | | (0.79 | ) | | | 0.60 | |
| Distributions from: | | | | | | | | | | | | | | | | | | | | | | | | |
| Net investment income | | | (0.19 | ) | | | (0.26 | ) | | | (0.21 | ) | | | (0.10 | ) | | | (0.12 | ) | | | (0.34 | ) |
| Realized capital gains | | | (0.63 | ) | | | (1.87 | ) | | | (0.70 | ) | | | — | | | | (0.49 | ) | | | (2.95 | ) |
| Total distributions | | | (0.82 | ) | | | (2.13 | ) | | | (0.91 | ) | | | (0.10 | ) | | | (0.61 | ) | | | (3.29 | ) |
| Net asset value at end of period | | $ | 13.93 | | | $ | 15.65 | | | $ | 18.15 | | | $ | 19.64 | | | $ | 15.52 | | | $ | 16.92 | |
| Total return(D) | | | (6.28 | %) | | | (0.78 | %) | | | (3.23 | %)(E) | | | 27.39 | % | | | (4.81 | %) | | | 4.49 | % |
| Ratios and supplemental data: | | | | | | | | | | | | | | | | | | | | | | | | |
| Net assets at end of period (000’s) | | $ | 77,744 | | | $ | 106,870 | | | $ | 118,391 | | | $ | 129,139 | | | $ | 114,616 | | | $ | 113,212 | |
| Ratio to average net assets: | | | | | | | | | | | | | | | | | | | | | | | | |
| Net expenses | | | 1.29 | % | | | 1.30 | % | | | 1.23 | %(F) | | | 1.37 | % | | | 1.36 | % | | | 1.41 | % |
| Gross expenses | | | 1.40 | % | | | 1.37 | % | | | 1.30 | %(F) | | | 1.39 | % | | | 1.36 | % | | | 1.41 | % |
| Net investment income | | | 0.57 | % | | | 1.26 | % | | | 3.22 | %(C)(F) | | | 0.92 | % | | | 1.11 | % | | | 0.76 | % |
| Portfolio turnover rate | | | 45 | % | | | 43 | % | | | 26 | %(E) | | | 37 | % | | | 36 | % | | | 55 | % |
Touchstone International Equity Fund— Class C
Selected Data for a Share Outstanding Throughout Each Period
| | | | | | | | | Seven Months | | | | | | | | | | |
| | | | | | | | | Ended | | | | | | | | | | |
| | | Year Ended June 30, | | | June 30, | | | Year Ended November 30, | |
| | | | 2020 | | | | 2019 | | | | 2018(A) | | | | 2017 | | | | 2016 | | | | 2015 | |
| Net asset value at beginning of period | | $ | 14.64 | | | $ | 17.12 | | | $ | 18.46 | | | $ | 14.66 | | | $ | 16.06 | | | $ | 18.71 | |
| Income (loss) from investment operations: | | | | | | | | | | | | | | | | | | | | | | | | |
| Net investment income (loss) | | | (0.09 | )(B) | | | 0.03 | (B) | | | 0.26 | (C) | | | (0.06 | ) | | | (0.01 | )(B) | | | (0.10 | )(B) |
| Net realized and unrealized gains (losses) on investments | | | (0.93 | ) | | | (0.54 | ) | | | (0.90 | ) | | | 3.86 | | | | (0.90 | ) | | | 0.47 | |
| Total from investment operations | | | (1.02 | ) | | | (0.51 | ) | | | (0.64 | ) | | | 3.80 | | | | (0.91 | ) | | | 0.37 | |
| Distributions from: | | | | | | | | | | | | | | | | | | | | | | | | |
| Net investment income | | | — | | | | (0.10 | ) | | | — | | | | — | | | | — | | | | (0.07 | ) |
| Realized capital gains | | | (0.63 | ) | | | (1.87 | ) | | | (0.70 | ) | | | — | | | | (0.49 | ) | | | (2.95 | ) |
| Total distributions | | | (0.63 | ) | | | (1.97 | ) | | | (0.70 | ) | | | — | | | | (0.49 | ) | | | (3.02 | ) |
| Net asset value at end of period | | $ | 12.99 | | | $ | 14.64 | | | $ | 17.12 | | | $ | 18.46 | | | $ | 14.66 | | | $ | 16.06 | |
| Total return(D) | | | (7.41 | %) | | | (1.87 | %) | | | (3.72 | %)(E) | | | 25.92 | % | | | (5.82 | %) | | | 3.14 | % |
| Ratios and supplemental data: | | | | | | | | | | | | | | | | | | | | | | | | |
| Net assets at end of period (000’s) | | $ | 2,073 | | | $ | 3,783 | | | $ | 6,737 | | | $ | 6,924 | | | $ | 5,876 | | | $ | 4,732 | |
| Ratio to average net assets: | | | | | | | | | | | | | | | | | | | | | | | | |
| Net expenses | | | 2.49 | % | | | 2.34 | % | | | 2.18 | %(F) | | | 2.45 | % | | | 2.49 | % | | | 2.70 | % |
| Gross expenses | | | 2.74 | % | | | 2.42 | % | | | 2.25 | %(F) | | | 2.49 | % | | | 2.49 | % | | | 2.70 | % |
| Net investment income (loss) | | | (0.63 | %) | | | 0.21 | % | | | 2.27 | %(C)(F) | | | (0.16 | %) | | | (0.04 | %) | | | (0.60 | %) |
| Portfolio turnover rate | | | 45 | % | | | 43 | % | | | 26 | %(E) | | | 37 | % | | | 36 | % | | | 55 | % |
| (A) | The Fund changed its fiscal year end from November 30 to June 30. |
| (B) | The net investment income (loss) per share was based on average shares outstanding for the period. |
| (C) | Reflects the impact of a special dividend that resulted in a one-time increase to net investment income. If the special dividend had not occurred, the ratio of net investment income to average net assets would have been lower by 1.54% for Class A and Class C shares and the net investment income per share would have been lower by $0.17 and $0.16 for Class A and Class C shares, respectively. |
| (D) | Total returns shown exclude the effect of applicable sales loads and fees. If these charges were included, the returns would be lower. |
See accompanying Notes to Financial Statements.
Financial Highlights (Continued)
Touchstone International Equity Fund—Class Y
Selected Data for a Share Outstanding Throughout Each Period
| | | | | | | | | Seven Months | | | | | | | | | | |
| | | | | | | | | Ended | | | | | | | | | | |
| | | Year Ended June 30, | | | June 30, | | | Year Ended November 30, | |
| | | | 2020 | | | | 2019 | | | | 2018(A) | | | | 2017(B) | | | | 2016 | | | | 2015 | |
| Net asset value at beginning of period | | $ | 15.44 | | | $ | 17.93 | | | $ | 19.45 | | | $ | 15.40 | | | $ | 16.79 | | | $ | 19.53 | |
| Income (loss) from investment operations: | | | | | | | | | | | | | | | | | | | | | | | | |
| Net investment income | | | 0.13 | (C) | | | 0.25 | (C) | | | 0.40 | (D) | | | 0.25 | | | | 0.23 | (C) | | | 0.18 | (C) |
| Net realized and unrealized gains (losses) on investments | | | (0.97 | ) | | | (0.57 | ) | | | (0.93 | ) | | | 3.98 | | | | (0.95 | ) | | | 0.47 | |
| Total from investment operations | | | (0.84 | ) | | | (0.32 | ) | | | (0.53 | ) | | | 4.23 | | | | (0.72 | ) | | | 0.65 | |
| Distributions from: | | | | | | | | | | | | | | | | | | | | | | | | |
| Net investment income | | | (0.24 | ) | | | (0.30 | ) | | | (0.29 | ) | | | (0.18 | ) | | | (0.18 | ) | | | (0.44 | ) |
| Realized capital gains | | | (0.63 | ) | | | (1.87 | ) | | | (0.70 | ) | | | — | | | | (0.49 | ) | | | (2.95 | ) |
| Total distributions | | | (0.87 | ) | | | (2.17 | ) | | | (0.99 | ) | | | (0.18 | ) | | | (0.67 | ) | | | (3.39 | ) |
| Net asset value at end of period | | $ | 13.73 | | | $ | 15.44 | | | $ | 17.93 | | | $ | 19.45 | | | $ | 15.40 | | | $ | 16.79 | |
| Total return | | | (6.03 | %) | | | (0.47 | %) | | | (3.05 | %)(E) | | | 27.78 | % | | | (4.41 | %) | | | 4.89 | % |
| Ratios and supplemental data: | | | | | | | | | | | | | | | | | | | | | | | | |
| Net assets at end of period (000’s) | | $ | 23,835 | | | $ | 42,120 | | | $ | 57,438 | | | $ | 63,320 | | | $ | 40,528 | | | $ | 14,967 | |
| Ratio to average net assets: | | | | | | | | | | | | | | | | | | | | | | | | |
| Net expenses | | | 0.99 | % | | | 0.99 | % | | | 0.99 | %(F) | | | 1.01 | % | | | 0.99 | % | | | 1.02 | % |
| Gross expenses | | | 1.15 | % | | | 1.12 | % | | | 1.09 | %(F) | | | 1.03 | % | | | 0.99 | % | | | 1.02 | % |
| Net investment income | | | 0.87 | % | | | 1.57 | % | | | 3.47 | %(D)(F) | | | 1.28 | % | | | 1.45 | % | | | 1.05 | % |
| Portfolio turnover rate | | | 45 | % | | | 43 | % | | | 26 | %(E) | | | 37 | % | | | 36 | % | | | 55 | % |
Touchstone International Equity Fund—Institutional Class
Selected Data for a Share Outstanding Throughout Each Period
| | | | | | | | | Seven Months | | | | |
| | | | | | | | | Ended | | | Period Ended | |
| | | Year Ended June 30, | | | June 30, | | | November 30, | |
| | | | 2020 | | | | 2019 | | | | 2018(A) | | | | 2017(G) | |
| Net asset value at beginning of period | | $ | 15.42 | | | $ | 17.92 | | | $ | 19.46 | | | $ | 18.91 | |
| Income (loss) from investment operations: | | | | | | | | | | | | | | | | |
| Net investment income | | | 0.14 | (C) | | | 0.26 | (C) | | | 0.56 | (D) | | | 0.02 | |
| Net realized and unrealized gains (losses) on investments | | | (0.95 | ) | | | (0.57 | ) | | | (1.09 | ) | | | 0.53 | |
| Total from investment operations | | | (0.81 | ) | | | (0.31 | ) | | | (0.53 | ) | | | 0.55 | |
| Distributions from: | | | | | | | | | | | | | | | | |
| Net investment income | | | (0.27 | ) | | | (0.32 | ) | | | (0.31 | ) | | | — | |
| Realized capital gains | | | (0.63 | ) | | | (1.87 | ) | | | (0.70 | ) | | | — | |
| Total distributions | | | (0.90 | ) | | | (2.19 | ) | | | (1.01 | ) | | | — | |
| Net asset value at end of period | | $ | 13.71 | | | $ | 15.42 | | | $ | 17.92 | | | $ | 19.46 | |
| Total return | | | (5.89 | %) | | | (0.39 | %) | | | (3.02 | %)(E) | | | 2.91 | %(E) |
| Ratios and supplemental data: | | | | | | | | | | | | | | | | |
| Net assets at end of period (000’s) | | $ | 14,205 | | | $ | 2,592 | | | $ | 2,260 | | | $ | 3 | |
| Ratio to average net assets: | | | | | | | | | | | | | | | | |
| Net expenses | | | 0.89 | % | | | 0.89 | % | | | 0.89 | %(F) | | | 0.89 | %(F) |
| Gross expenses | | | 1.12 | % | | | 1.38 | % | | | 1.63 | %(F) | | | 1921.18 | %(F) |
| Net investment income | | | 0.97 | % | | | 1.67 | % | | | 3.57 | %(D)(F) | | | 1.40 | %(F) |
| Portfolio turnover rate | | | 45 | % | | | 43 | % | | | 26 | %(E) | | | 37 | % |
| (A) | The Fund changed its fiscal year end from November 30 to June 30. |
| (B) | Effective October 28, 2017, Class I shares of the Sentinel Balanced Fund (the “Predecessor Fund”) were reorganized into Class Y shares of the Fund. |
| (C) | The net investment income per share was based on average shares outstanding for the period. |
| (D) | Reflects the impact of a special dividend that resulted in a one-time increase to net investment income. If the special dividend had not occurred, the ratio of net investment income to average net assets would have been lower by 1.54% for Class Y and Institutional Class shares and the net investment income per share would have been lower by $0.17 and $0.16 for Class Y and Institutional Class shares, respectively . |
| (G) | Represents the period from commencement of operations (October 30, 2017) through November 30, 2017. |
See accompanying Notes to Financial Statements.
Financial Highlights (Continued)
Touchstone International Growth Opportunities Fund—Class A
Selected Data for a Share Outstanding Throughout Each Period
| | | | | | | | | | | | Period Ended | |
| | | Year Ended June 30, | | | June 30, | |
| | | | 2020 | | | | 2019 | | | | 2018 | | | | 2017(A) | |
| Net asset value at beginning of period | | $ | 21.29 | | | $ | 25.12 | | | $ | 22.25 | | | $ | 18.74 | (B) |
| Income (loss) from investment operations: | | | | | | | | | | | | | | | | |
| Net investment loss | | | (0.06 | )(C) | | | (0.07 | )(C) | | | (0.01 | ) | | | (0.01 | ) |
| Net realized and unrealized gains (losses) on investments | | | 1.14 | | | | (0.91 | ) | | | 3.34 | | | | 3.52 | |
| Total from investment operations | | | 1.08 | | | | (0.98 | ) | | | 3.33 | | | | 3.51 | |
| Distributions from: | | | | | | | | | | | | | | | | |
| Realized capital gains | | | — | | | | (2.85 | ) | | | (0.46 | ) | | | — | |
| Net asset value at end of period | | $ | 22.37 | | | $ | 21.29 | | | $ | 25.12 | | | $ | 22.25 | |
| Total return(D) | | | 5.07 | % | | | (1.78 | %) | | | 15.00 | % | | | 18.73 | %(E) |
| Ratios and supplemental data: | | | | | | | | | | | | | | | | |
| Net assets at end of period (000’s) | | $ | 777 | | | $ | 760 | | | $ | 918 | | | $ | 140 | |
| Ratio to average net assets: | | | | | | | | | | | | | | | | |
| Net expenses | | | 1.24 | % | | | 1.24 | % | | | 1.36 | % | | | 1.41 | %(F) |
| Gross expenses | | | 4.17 | % | | | 4.36 | % | | | 3.75 | % | | | 42.93 | %(F) |
| Net investment loss | | | (0.26 | %) | | | (0.31 | %) | | | (0.05 | %) | | | (0.35 | %)(F) |
| Portfolio turnover rate | | | 74 | % | | | 103 | % | | | 109 | % | | | 72 | %(G) |
Touchstone International Growth Opportunities Fund—Class C
Selected Data for a Share Outstanding Throughout Each Period
| | | | | | | | | | | | Period Ended | |
| | | Year Ended June 30, | | | June 30, | |
| | | | 2020 | | | | 2019 | | | | 2018 | | | | 2017(A) | |
| Net asset value at beginning of period | | $ | 20.77 | | | $ | 24.76 | | | $ | 22.10 | | | $ | 18.74 | (B) |
| Income (loss) from investment operations: | | | | | | | | | | | | | | | | |
| Net investment loss | | | (0.21 | )(C) | | | (0.23 | )(C) | | | (0.11 | ) | | | (0.19 | ) |
| Net realized and unrealized gains (losses) on investments | | | 1.10 | | | | (0.91 | ) | | | 3.23 | | | | 3.55 | |
| Total from investment operations | | | 0.89 | | | | (1.14 | ) | | | 3.12 | | | | 3.36 | |
| Distributions from: | | | | | | | | | | | | | | | | |
| Realized capital gains | | | — | | | | (2.85 | ) | | | (0.46 | ) | | | — | |
| Net asset value at end of period | | $ | 21.66 | | | $ | 20.77 | | | $ | 24.76 | | | $ | 22.10 | |
| Total return(D) | | | 4.28 | % | | | (2.52 | %) | | | 14.14 | % | | | 17.93 | %(E) |
| Ratios and supplemental data: | | | | | | | | | | | | | | | | |
| Net assets at end of period (000’s) | | $ | 403 | | | $ | 185 | | | $ | 436 | | | $ | 3 | |
| Ratio to average net assets: | | | | | | | | | | | | | | | | |
| Net expenses | | | 1.99 | % | | | 1.99 | % | | | 2.10 | % | | | 2.16 | %(F) |
| Gross expenses | | | 5.96 | % | | | 6.35 | % | | | 5.06 | % | | | 237.46 | %(F) |
| Net investment loss | | | (1.01 | %) | | | (1.06 | %) | | | (0.79 | %) | | | (1.11 | %)(F) |
| Portfolio turnover rate | | | 74 | % | | | 103 | % | | | 109 | % | | | 72 | %(G) |
| (A) | Represents the period from commencement of operations (August 15, 2016) through June 30, 2017. |
| (B) | Net asset value at the beginning of period is based on the net asset value of Institutional Class shares on August 15, 2016. |
| (C) | The net investment income (loss) per share was based on average shares outstanding for the period. |
| (D) | Total returns shown exclude the effect of applicable sales loads and fees. If these charges were included, the returns would be lower. |
| (G) | Portfolio turnover excludes the purchases and sales of the DSM Global Growth & Income Fund merger on August 15, 2016. If these transactions were included, portfolio turnover would have been higher. |
See accompanying Notes to Financial Statements.
Financial Highlights (Continued)
Touchstone International Growth Opportunities Fund—Class Y
Selected Data for a Share Outstanding Throughout Each Period
| | | | | | | | | | | | Period Ended | |
| | | Year Ended June 30, | | | June 30, | |
| | | | 2020 | | | | 2019 | | | | 2018 | | | | 2017(A) | |
| Net asset value at beginning of period | | $ | 21.39 | | | $ | 25.19 | | | $ | 22.25 | | | $ | 18.74 | (B) |
| Income (loss) from investment operations: | | | | | | | | | | | | | | | | |
| Net investment income (loss) | | | (— | )(C)(D) | | | (0.01 | )(D) | | | 0.02 | | | | (— | )(C) |
| Net realized and unrealized gains (losses) on investments | | | 1.13 | | | | (0.92 | ) | | | 3.38 | | | | 3.51 | |
| Total from investment operations | | | 1.13 | | | | (0.93 | ) | | | 3.40 | | | | 3.51 | |
| Distributions from: | | | | | | | | | | | | | | | | |
| Net investment income | | | — | | | | (0.02 | ) | | | — | | | | — | |
| Realized capital gains | | | — | | | | (2.85 | ) | | | (0.46 | ) | | | — | |
| Total distributions | | | — | | | | (2.87 | ) | | | (0.46 | ) | | | — | |
| Net asset value at end of period | | $ | 22.52 | | | $ | 21.39 | | | $ | 25.19 | | | $ | 22.25 | |
| Total return | | | 5.28 | % | | | (1.53 | %) | | | 15.32 | % | | | 18.73 | %(E) |
| Ratios and supplemental data: | | | | | | | | | | | | | | | | |
| Net assets at end of period (000’s) | | $ | 867 | | | $ | 2,341 | | | $ | 4,553 | | | $ | 161 | |
| Ratio to average net assets: | | | | | | | | | | | | | | | | |
| Net expenses | | | 0.99 | % | | | 0.99 | % | | | 1.03 | % | | | 1.16 | %(F) |
| Gross expenses | | | 2.50 | % | | | 1.89 | % | | | 1.81 | % | | | 51.68 | %(F) |
| Net investment income (loss) | | | (0.01 | %) | | | (0.06 | %) | | | 0.28 | % | | | (0.10 | %)(F) |
| Portfolio turnover rate | | | 74 | % | | | 103 | % | | | 109 | % | | | 72 | %(G) |
Touchstone International Growth Opportunities Fund—Institutional Class
Selected Data for a Share Outstanding Throughout Each Period
| | | Year Ended June 30, | |
| | | 2020 | | | 2019 | | | 2018 | | | 2017 | | | 2016 | |
| Net asset value at beginning of period | | $ | 21.46 | | | $ | 25.27 | | | $ | 22.30 | | | $ | 17.60 | | | $ | 19.75 | |
| Income (loss) from investment operations: | | | | | | | | | | | | | | | | | | | | |
| Net investment income (loss) | | | 0.02 | (D) | | | 0.01 | (D) | | | 0.07 | | | | (0.02 | ) | | | (0.04 | )(D) |
| Net realized and unrealized gains (losses) on investments | | | 1.15 | | | | (0.93 | ) | | | 3.36 | | | | 5.15 | | | | (0.73 | ) |
| Total from investment operations | | | 1.17 | | | | (0.92 | ) | | | 3.43 | | | | 5.13 | | | | (0.77 | ) |
| Distributions from: | | | | | | | | | | | | | | | | | | | | |
| Net investment income | | | (— | )(C) | | | (0.04 | ) | | | — | | | | — | | | | — | |
| Realized capital gain | | | — | | | | (2.85 | ) | | | (0.46 | ) | | | (0.43 | ) | | | (1.38 | ) |
| Total distributions | | | — | | | | (2.89 | ) | | | (0.46 | ) | | | (0.43 | ) | | | (1.38 | ) |
| Net asset value at end of period | | $ | 22.63 | | | $ | 21.46 | | | $ | 25.27 | | | $ | 22.30 | | | $ | 17.60 | |
| Total return | | | 5.46 | % | | | (1.46 | %) | | | 15.42 | % | | | 29.63 | % | | | (4.06 | %) |
| Ratios and supplemental data: | | | | | | | | | | | | | | | | | | | | |
| Net assets at end of period (000’s) | | $ | 29,285 | | | $ | 31,435 | | | $ | 28,159 | | | $ | 23,956 | | | $ | 6,418 | |
| Ratio to average net assets: | | | | | | | | | | | | | | | | | | | | |
| Net expenses | | | 0.89 | % | | | 0.89 | % | | | 1.02 | % | | | 1.06 | % | | | 1.15 | %(H) |
| Gross expenses | | | 1.35 | % | | | 1.30 | % | | | 1.31 | % | | | 1.82 | % | | | 4.12 | % |
| Net investment income (loss) | | | 0.09 | % | | | 0.04 | % | | | 0.28 | % | | | (0.14 | %) | | | (0.23 | %) |
| Portfolio turnover rate | | | 74 | % | | | 103 | % | | | 109 | % | | | 72 | %(G) | | | 57 | % |
| (A) | Represents the period from commencement of operations (August 15, 2016) through June 30, 2017. |
| (B) | Net asset value at the beginning of period is based on the net asset value of Institutional Class shares on August 15, 2016. |
| (C) | Less than $0.005 per share. |
| (D) | The net investment income (loss) per share was based on average shares outstanding for the period. |
| (G) | Portfolio turnover excludes the purchases and sales of the DSM Global Growth & Income Fund merger on August 15, 2016. If these transactions were included, portfolio turnover would have been higher. |
| (H) | Expense cap was lowered to 1.10% from 1.20% on January 1, 2016. |
See accompanying Notes to Financial Statements.
Financial Highlights (Continued)
| Touchstone International Small Cap Fund—Class A | | | | | | | | | | | | |
| Selected Data for a Share Outstanding Throughout Each Period | | | | | | | | | | | | |
| | | Year Ended June 30, | |
| | | 2020 | | | 2019 | | | 2018 | | | 2017 | | | 2016 | |
| Net asset value at beginning of period | | $ | 15.11 | | | $ | 17.89 | | | $ | 16.78 | | | $ | 14.98 | | | $ | 16.52 | |
| Income (loss) from investment operations: | | | | | | | | | | | | | | | | | | | | |
| Net investment income (loss) | | | (— | )(A)(B) | | | 0.85 | | | | 0.18 | | | | 0.10 | | | | 0.09 | |
| Net realized and unrealized gains (losses) on investments | | | (2.62 | ) | | | (2.35 | ) | | | 1.32 | | | | 1.84 | | | | (1.53 | ) |
| Total from investment operations | | | (2.62 | ) | | | (1.50 | ) | | | 1.50 | | | | 1.94 | | | | (1.44 | ) |
| Distributions from: | | | | | | | | | | | | | | | | | | | | |
| Net investment income | | | (0.35 | ) | | | (0.18 | ) | | | (0.39 | ) | | | (0.14 | ) | | | (0.10 | ) |
| Realized capital gains | | | — | | | | (1.10 | ) | | | — | | | | — | | | | — | |
| Total distributions | | | (0.35 | ) | | | (1.28 | ) | | | (0.39 | ) | | | (0.14 | ) | | | (0.10 | ) |
| Net asset value at end of period | | $ | 12.14 | | | $ | 15.11 | | | $ | 17.89 | | | $ | 16.78 | | | $ | 14.98 | |
| Total return(C) | | | (17.86 | %) | | | (7.42 | %) | | | 8.85 | % | | | 13.13 | % | | | (8.77 | %) |
| Ratios and supplemental data: | | | | | | | | | | | | | | | | | | | | |
| Net assets at end of period (000’s) | | $ | 1,218 | | | $ | 2,688 | | | $ | 11,727 | | | $ | 16,529 | | | $ | 23,095 | |
| Ratio to average net assets: | | | | | | | | | | | | | | | | | | | | |
| Net expenses (including liquidity provider expenses)(D) | | | 1.56 | % | | | 1.55 | % | | | 1.55 | % | | | 1.55 | % | | | 1.55 | % |
| Gross expenses (including liquidity provider expenses)(E) | | | 2.86 | % | | | 2.00 | % | | | 1.74 | % | | | 1.71 | % | | | 1.66 | % |
| Net investment income (loss) | | | (0.02 | %) | | | 0.70 | % | | | 0.51 | % | | | 0.56 | % | | | 0.59 | % |
| Portfolio turnover rate | | | 107 | % | | | 91 | % | | | 94 | % | | | 89 | % | | | 90 | % |
| Touchstone International Small Cap Fund—Class C | | | | | | | | | | | | |
| Selected Data for a Share Outstanding Throughout Each Period | | | | | | | | | | | | |
| | | Year Ended June 30, | |
| | | 2020 | | | 2019 | | | 2018 | | | 2017 | | | 2016 | |
| Net asset value at beginning of period | | $ | 14.74 | | | $ | 17.58 | | | $ | 16.47 | | | $ | 14.67 | | | $ | 16.28 | |
| Income (loss) from investment operations: | | | | | | | | | | | | | | | | | | | | |
| Net investment loss | | | (0.10 | )(B) | | | (0.10 | ) | | | (0.11 | ) | | | (0.12 | ) | | | (0.04 | ) |
| Net realized and unrealized gains (losses) on investments | | | (2.57 | ) | | | (1.49 | ) | | | 1.44 | | | | 1.92 | | | | (1.49 | ) |
| Total from investment operations | | | (2.67 | ) | | | (1.59 | ) | | | 1.33 | | | | 1.80 | | | | (1.53 | ) |
| Distributions from: | | | | | | | | | | | | | | | | | | | | |
| Net investment income | | | (0.28 | ) | | | (0.15 | ) | | | (0.22 | ) | | | — | | | | (0.08 | ) |
| Realized capital gains | | | — | | | | (1.10 | ) | | | — | | | | — | | | | — | |
| Total distributions | | | (0.28 | ) | | | (1.25 | ) | | | (0.22 | ) | | | — | | | | (0.08 | ) |
| Net asset value at end of period | | $ | 11.79 | | | $ | 14.74 | | | $ | 17.58 | | | $ | 16.47 | | | $ | 14.67 | |
| Total return(C) | | | (18.50 | %) | | | (8.11 | %) | | | 8.04 | % | | | 12.27 | % | | | (9.43 | %) |
| Ratios and supplemental data: | | | | | | | | | | | | | | | | | | | | |
| Net assets at end of period (000’s) | | $ | 608 | | | $ | 1,559 | | | $ | 2,498 | | | $ | 2,818 | | | $ | 4,294 | |
| Ratio to average net assets: | | | | | | | | | | | | | | | | | | | | |
| Net expenses (including liquidity provider expenses)(D) | | | 2.31 | % | | | 2.30 | % | | | 2.30 | % | | | 2.30 | % | | | 2.30 | % |
| Gross expenses (including liquidity provider expenses)(E) | | | 3.96 | % | | | 3.10 | % | | | 2.81 | % | | | 2.73 | % | | | 2.62 | % |
| Net investment loss | | | (0.77 | %) | | | (0.05 | %) | | | (0.25 | %) | | | (0.19 | %) | | | (0.16 | %) |
| Portfolio turnover rate | | | 107 | % | | | 91 | % | | | 94 | % | | | 89 | % | | | 90 | % |
| (A) | Less than $0.005 per share. |
| (B) | The net investment income (loss) per share was based on average shares outstanding for the period. |
| (C) | Total returns shown exclude the effect of applicable sales loads and fees. If these charges were included, the returns would be lower. |
| (D) | The ratio of net expenses to average net assets excluding liquidity provider expenses was for Class A was 1.55% and for Class C was 2.30% for the year ended June 30, 2020. |
| (E) | The ratio of gross expenses to average net assets excluding liquidity provider expenses for Class A was 2.85% and for Class C was 3.95% for the year ended June 30, 2020. |
See accompanying Notes to Financial Statements.
Financial Highlights (Continued)
| Touchstone International Small Cap Fund—Class Y | | | | | | | | | | | | |
| Selected Data for a Share Outstanding Throughout Each Period | | | | | | | | | | | | |
| | | Year Ended June 30, | |
| | | 2020 | | | 2019 | | | 2018 | | | 2017 | | | 2016 | |
| Net asset value at beginning of period | | $ | 15.45 | | | $ | 18.28 | | | $ | 17.21 | | | $ | 15.39 | | | $ | 16.94 | |
| Income (loss) from investment operations: | | | | | | | | | | | | | | | | | | | | |
| Net investment income | | | 0.03 | (A) | | | 0.14 | | | | 0.13 | | | | 0.17 | | | | 0.13 | |
| Net realized and unrealized gains (losses) on investments | | | (2.68 | ) | | | (1.64 | ) | | | 1.46 | | | | 1.85 | | | | (1.57 | ) |
| Total from investment operations | | | (2.65 | ) | | | (1.50 | ) | | | 1.59 | | | | 2.02 | | | | (1.44 | ) |
| Distributions from: | | | | | | | | | | | | | | | | | | | | |
| Net investment income | | | (0.37 | ) | | | (0.23 | ) | | | (0.52 | ) | | | (0.20 | ) | | | (0.11 | ) |
| Realized capital gains | | | — | | | | (1.10 | ) | | | — | | | | — | | | | — | |
| Total distributions | | | (0.37 | ) | | | (1.33 | ) | | | (0.52 | ) | | | (0.20 | ) | | | (0.11 | ) |
| Net asset value at end of period | | $ | 12.43 | | | $ | 15.45 | | | $ | 18.28 | | | $ | 17.21 | | | $ | 15.39 | |
| Total return | | | (17.67 | %) | | | (7.17 | %) | | | 9.17 | % | | | 13.39 | % | | | (8.56 | %) |
| Ratios and supplemental data: | | | | | | | | | | | | | | | | | | | | |
| Net assets at end of period (000’s) | | $ | 68,423 | | | $ | 97,799 | | | $ | 144,173 | | | $ | 146,744 | | | $ | 166,801 | |
| Ratio to average net assets: | | | | | | | | | | | | | | | | | | | | |
| Net expenses (including liquidity provider expenses)(B) | | | 1.31 | % | | | 1.30 | % | | | 1.30 | %(C) | | | 1.30 | % | | | 1.30 | % |
| Gross expenses (including liquidity provider expenses)(D) | | | 1.44 | % | | | 1.33 | % | | | 1.30 | % | | | 1.32 | % | | | 1.32 | % |
| Net investment income | | | 0.23 | % | | | 0.95 | % | | | 0.75 | % | | | 0.81 | % | | | 0.84 | % |
| Portfolio turnover rate | | | 107 | % | | | 91 | % | | | 94 | % | | | 89 | % | | | 90 | % |
| Touchstone International Small Cap Fund—Institutional Class | | | | | | | | | |
| Selected Data for a Share Outstanding Throughout Each Period | | | | | | | | | | | | |
| | | Year Ended June 30, | |
| | | 2020 | | | 2019 | | | 2018 | | | 2017 | | | 2016 | |
| Net asset value at beginning of period | | $ | 15.54 | | | $ | 18.37 | | | $ | 17.31 | | | $ | 15.48 | | | $ | 17.02 | |
| Income (loss) from investment operations: | | | | | | | | | | | | | | | | | | | | |
| Net investment income | | | 0.05 | (A) | | | 0.04 | | | | 0.12 | | | | 0.16 | | | | 0.12 | |
| Net realized and unrealized gains (losses) on investments | | | (2.69 | ) | | | (1.53 | ) | | | 1.50 | | | | 1.90 | | | | (1.55 | ) |
| Total from investment operations | | | (2.64 | ) | | | (1.49 | ) | | | 1.62 | | | | 2.06 | | | | (1.43 | ) |
| Distributions from: | | | | | | | | | | | | | | | | | | | | |
| Net investment income | | | (0.38 | ) | | | (0.24 | ) | | | (0.56 | ) | | | (0.23 | ) | | | (0.11 | ) |
| Realized capital gains | | | — | | | | (1.10 | ) | | | — | | | | — | | | | — | |
| Total distributions | | | (0.38 | ) | | | (1.34 | ) | | | (0.56 | ) | | | (0.23 | ) | | | (0.11 | ) |
| Net asset value at end of period | | $ | 12.52 | | | $ | 15.54 | | | $ | 18.37 | | | $ | 17.31 | | | $ | 15.48 | |
| Total return | | | (17.52 | %) | | | (7.11 | %) | | | 9.25 | % | | | 13.56 | % | | | (8.43 | %) |
| Ratios and supplemental data: | | | | | | | | | | | | | | | | | | | | |
| Net assets at end of period (000’s) | | $ | 3,826 | | | $ | 99,402 | | | $ | 157,502 | | | $ | 148,937 | | | $ | 197,693 | |
| Ratio to average net assets: | | | | | | | | | | | | | | | | | | | | |
| Net expenses (including liquidity provider expenses)(B) | | | 1.19 | % | | | 1.18 | % | | | 1.18 | % | | | 1.18 | % | | | 1.18 | % |
| Gross expenses (including liquidity provider expenses)(D) | | | 1.40 | % | | | 1.26 | % | | | 1.22 | % | | | 1.23 | % | | | 1.23 | % |
| Net investment income | | | 0.35 | % | | | 1.07 | % | | | 0.87 | % | | | 0.93 | % | | | 0.96 | % |
| Portfolio turnover rate | | | 107 | % | | | 91 | % | | | 94 | % | | | 89 | % | | | 90 | % |
| (A) | The net investment income per share was based on average shares outstanding for the period. |
| (B) | The ratio of net expenses to average net assets excluding liquidity provider expenses was for Class Y was 1.30% and for Institutional Class was 1.18% for the year ended June 30, 2020. |
| (C) | Net expenses include amounts recouped by the Advisor. |
| (D) | The ratio of gross expenses to average net assets excluding liquidity provider expenses was for Class Y was 1.43% and for Institutional Class was 1.39% for the year ended June 30, 2020. |
See accompanying Notes to Financial Statements.
Financial Highlights (Continued)
| Touchstone Large Cap Focused Fund—Class A | | | | | | | | | | | | | | | |
| Selected Data for a Share Outstanding Throughout Each Period | | | | | | | | | | | | |
| | | | | | Seven Months | | | | | | | |
| | | | | | | | | Ended | | | | | | | | | | |
| | | Year Ended June 30, | | | June 30, | | | Year Ended November 30, | |
| | | 2020 | | | 2019 | | | 2018(A) | | | 2017 | | | 2016 | | | 2015 | |
| Net asset value at beginning of period | | $ | 43.37 | | | $ | 43.80 | | | $ | 48.75 | | | $ | 42.28 | | | $ | 43.08 | | | $ | 42.79 | |
| Income (loss) from investment operations: | | | | | | | | | | | | | | | | | | | | | | | | |
| Net investment income | | | 0.27 | | | | 0.38 | (B) | | | 0.23 | | | | 0.45 | | | | 0.53 | (B) | | | 1.01 | (B) |
| Net realized and unrealized gains (losses) on investments | | | 3.78 | | | | 3.72 | | | | 1.85 | | | | 8.99 | | | | 2.43 | | | | (0.25 | ) |
| Total from investment operations | | | 4.05 | | | | 4.10 | | | | 2.08 | | | | 9.44 | | | | 2.96 | | | | 0.76 | |
| Distributions from: | | | | | | | | | | | | | | | | | | | | | | | | |
| Net investment income | | | (0.27 | ) | | | (0.27 | ) | | | (0.07 | ) | | | (0.51 | ) | | | (1.08 | ) | | | (0.45 | ) |
| Realized capital gains | | | (4.85 | ) | | | (4.26 | ) | | | (6.96 | ) | | | (2.46 | ) | | | (2.68 | ) | | | (0.02 | ) |
| Total distributions | | | (5.12 | ) | | | (4.53 | ) | | | (7.03 | ) | | | (2.97 | ) | | | (3.76 | ) | | | (0.47 | ) |
| Net asset value at end of period | | $ | 42.30 | | | $ | 43.37 | | | $ | 43.80 | | | $ | 48.75 | | | $ | 42.28 | | | $ | 43.08 | |
| Total return(C) | | | 9.54 | % | | | 10.51 | % | | | 4.74 | %(D) | | | 23.67 | % | | | 7.53 | % | | | 1.79 | % |
| Ratios and supplemental data: | | | | | | | | | | | | | | | | | | | | | | | | |
| Net assets at end of period (000’s) | | $ | 1,120,305 | | | $ | 1,170,490 | | | $ | 1,218,721 | | | $ | 1,321,506 | | | $ | 1,350,861 | | | $ | 1,416,147 | |
| Ratio to average net assets: | | | | | | | | | | | | | | | | | | | | | | | | |
| Net expenses (including liquidity provider expenses)(E) | | | 1.01 | % | | | 0.97 | % | | | 0.97 | %(F) | | | 1.02 | % | | | 1.00 | % | | | 0.99 | % |
| Gross expenses (including liquidity provider expenses)(G) | | | 1.10 | % | | | 1.09 | % | | | 1.09 | %(F) | | | 1.02 | % | | | 1.00 | % | | | 0.99 | % |
| Net investment income | | | 0.66 | % | | | 0.88 | % | | | 0.88 | %(F) | | | 0.98 | % | | | 1.32 | % | | | 2.36 | %(H) |
| Portfolio turnover rate | | | 29 | %(I) | | | 15 | %(I) | | | 9 | %(D)(I) | | | 12 | %(I) | | | 8 | % | | | 11 | % |
| (A) | The Fund changed its fiscal year end from November 30 to June 30. |
| (B) | The net investment income per share was based on average shares outstanding for the period. |
| (C) | Total returns shown exclude the effect of applicable sales loads and fees. If these charges were included, the returns would be lower. |
| (E) | The ratio of net expenses to average net assets excluding liquidity provider expenses was 0.98%, 0.96%, 0.95% and 1.02% for the years ended June 30, 2020 and 2019, the seven months ended June 30, 2018 and the year ended November 30, 2017, respectively. |
| (G) | The ratio of gross expenses to average net assets excluding liquidity provider expenses was 1.07%, 1.08%, 1.07% and 1.02% for the years ended June 30, 2020 and 2019, the seven months ended June 30, 2018 and the year ended November 30, 2017, respectively. |
| (H) | Includes the impact of special dividends resulting from an acquisition of Covidien plc by Medtronic, Inc. on January 26, 2015 through the formation of a new holding company, Medtronic plc, incorporated in Ireland. These special dividends enhanced the ratios of net investment income for Class A shares by 1.22% for the fiscal year ended November 30, 2015. |
| (I) | Portfolio turnover excludes securities delivered from processing redemptions-in-kind. |
See accompanying Notes to Financial Statements.
Financial Highlights (Continued)
| Touchstone Large Cap Focused Fund—Class C | | | | | | | | | | | | | | | |
| Selected Data for a Share Outstanding Throughout Each Period | | | | | | | | | | | | |
| | | | | | | | | Seven Months | | | | | | | | | | |
| | | | | | | | | Ended | | | | | | | | | | |
| | | Year Ended June 30, | | | June 30, | | | Year Ended November 30, | |
| | | 2020 | | | 2019 | | | 2018(A) | | | 2017 | | | 2016 | | | 2015 | |
| Net asset value at beginning of period | | $ | 40.56 | | | $ | 41.29 | | | $ | 46.48 | | | $ | 40.44 | | | $ | 41.36 | | | $ | 41.15 | |
| Income (loss) from investment operations: | | | | | | | | | | | | | | | | | | | | | | | | |
| Net investment income (loss) | | | (0.19 | ) | | | 0.03 | (B) | | | 0.03 | | | | — | (C) | | | 0.21 | (B) | | | 0.64 | (B) |
| Net realized and unrealized gains (losses) on investments | | | 3.64 | | | | 3.50 | | | | 1.74 | | | | 8.67 | | | | 2.33 | | | | (0.24 | ) |
| Total from investment operations | | | 3.45 | | | | 3.53 | | | | 1.77 | | | | 8.67 | | | | 2.54 | | | | 0.40 | |
| Distributions from: | | | | | | | | | | | | | | | | | | | | | | | | |
| Net investment income | | | — | | | | — | | | | — | | | | (0.17 | ) | | | (0.78 | ) | | | (0.17 | ) |
| Realized capital gains | | | (4.85 | ) | | | (4.26 | ) | | | (6.96 | ) | | | (2.46 | ) | | | (2.68 | ) | | | (0.02 | ) |
| Total distributions | | | (4.85 | ) | | | (4.26 | ) | | | (6.96 | ) | | | (2.63 | ) | | | (3.46 | ) | | | (0.19 | ) |
| Net asset value at end of period | | $ | 39.16 | | | $ | 40.56 | | | $ | 41.29 | | | $ | 46.48 | | | $ | 40.44 | | | $ | 41.36 | |
| Total return(D) | | | 8.69 | % | | | 9.61 | % | | | 4.24 | %(E) | | | 22.69 | % | | | 6.71 | % | | | 0.98 | % |
| Ratios and supplemental data: | | | | | | | | | | | | | | | | | | | | | | | | |
| Net assets at end of period (000’s) | | $ | 37,450 | | | $ | 47,838 | | | $ | 67,599 | | | $ | 74,122 | | | $ | 83,246 | | | $ | 89,890 | |
| Ratio to average net assets: | | | | | | | | | | | | | | | | | | | | | | | | |
| Net expenses (including liquidity provider expenses)(F) | | | 1.82 | % | | | 1.79 | % | | | 1.78 | %(G) | | | 1.82 | % | | | 1.79 | % | | | 1.78 | % |
| Gross expenses (including liquidity provider expenses)(H) | | | 1.94 | % | | | 1.90 | % | | | 1.89 | %(G) | | | 1.82 | % | | | 1.79 | % | | | 1.78 | % |
| Net investment income (loss) | | | (0.15 | %) | | | 0.07 | % | | | 0.07 | %(G) | | | 0.18 | % | | | 0.54 | % | | | 1.57 | %(I) |
| Portfolio turnover rate | | | 29 | %(J) | | | 15 | %(J) | | | 9 | %(E)(J) | | | 12 | %(J) | | | 8 | % | | | 11 | % |
| (A) | The Fund changed its fiscal year end from November 30 to June 30. |
| (B) | The net investment income per share was based on average shares outstanding for the period. |
| (C) | Less than $0.005 per share. |
| (D) | Total returns shown exclude the effect of applicable sales loads and fees. If these charges were included, the returns would be lower. |
| (F) | The ratio of net expenses to average net assets excluding liquidity provider expenses was 1.79%, 1.78%, 1.76% and 1.82% for the years ended June 30, 2020 and 2019, the seven months ended June 30, 2018 and the year ended November 30, 2017, respectively. |
| (H) | The ratio of gross expenses to average net assets excluding liquidity provider expenses was 1.91%, 1.89%, 1.87% and 1.82% for the years ended June 30, 2020 and 2019, the seven months ended June 30, 2018 and the year ended November 30, 2017, respectively. |
| (I) | Includes the impact of special dividends resulting from an acquisition of Covidien plc by Medtronic, Inc. on January 26, 2015 through the formation of a new holding company, Medtronic plc, incorporated in Ireland. These special dividends enhanced the ratios of net investment income for Class C shares by 1.22% for the fiscal year ended November 30, 2015. |
| (J) | Portfolio turnover excludes securities delivered from processing redemptions-in-kind. |
See accompanying Notes to Financial Statements.
Financial Highlights (Continued)
| Touchstone Large Cap Focused Fund— Class Y | | | | | | | | | | | | | | | |
| Selected Data for a Share Outstanding Throughout Each Period | | | | | | | | | | | | |
| | | | | | | | | Seven Months | | | | | | | | | | |
| | | | | | | | | Ended | | | | | | | | | | |
| | | Year Ended June 30, | | | June 30, | | | Year Ended November 30, | |
| | | 2020 | | | 2019 | | | 2018(A) | | | 2017(B) | | | 2016 | | | 2015 | |
| Net asset value at beginning of period | | $ | 43.24 | | | $ | 43.68 | | | $ | 48.72 | | | $ | 42.26 | | | $ | 43.06 | | | $ | 42.76 | |
| Income (loss) from investment operations: | | | | | | | | | | | | | | | | | | | | | | | | |
| Net investment income | | | 0.40 | | | | 0.48 | (C) | | | 0.29 | | | | 0.56 | | | | 0.64 | (C) | | | 1.12 | (C) |
| Net realized and unrealized gains (losses) on investments | | | 3.76 | | | | 3.71 | | | | 1.84 | | | | 8.99 | | | | 2.43 | | | | (0.25 | ) |
| Total from investment operations | | | 4.16 | | | | 4.19 | | | | 2.13 | | | | 9.55 | | | | 3.07 | | | | 0.87 | |
| Distributions from: | | | | | | | | | | | | | | | | | | | | | | | | |
| Net investment income | | | (0.37 | ) | | | (0.37 | ) | | | (0.21 | ) | | | (0.63 | ) | | | (1.19 | ) | | | (0.55 | ) |
| Realized capital gains | | | (4.85 | ) | | | (4.26 | ) | | | (6.96 | ) | | | (2.46 | ) | | | (2.68 | ) | | | (0.02 | ) |
| Total distributions | | | (5.22 | ) | | | (4.63 | ) | | | (7.17 | ) | | | (3.09 | ) | | | (3.87 | ) | | | (0.57 | ) |
| Net asset value at end of period | | $ | 42.18 | | | $ | 43.24 | | | $ | 43.68 | | | $ | 48.72 | | | $ | 42.26 | | | $ | 43.06 | |
| Total return | | | 9.84 | % | | | 10.81 | % | | | 4.85 | %(D) | | | 24.03 | % | | | 7.84 | % | | | 2.07 | % |
| Ratios and supplemental data: | | | | | | | | | | | | | | | | | | | | | | | | |
| Net assets at end of period (000’s) | | $ | 352,103 | | | $ | 413,137 | | | $ | 394,077 | | | $ | 438,732 | | | $ | 552,611 | | | $ | 689,502 | |
| Ratio to average net assets: | | | | | | | | | | | | | | | | | | | | | | | | |
| Net expenses (including liquidity provider expenses)(E) | | | 0.75 | % | | | 0.73 | % | | | 0.74 | %(F) | | | 0.74 | % | | | 0.72 | % | | | 0.71 | % |
| Gross expenses (including liquidity provider expenses)(G) | | | 0.91 | % | | | 0.89 | % | | | 0.90 | %(F) | | | 0.75 | % | | | 0.72 | % | | | 0.71 | % |
| Net investment income | | | 0.92 | % | | | 1.13 | % | | | 1.11 | %(F) | | | 1.26 | % | | | 1.60 | % | | | 2.63 | %(H) |
| Portfolio turnover rate | | | 29 | %(I) | | | 15 | %(I) | | | 9 | %(D)(I) | | | 12 | %(I) | | | 8 | % | | | 11 | % |
| (A) | The Fund changed its fiscal year end from November 30 to June 30. |
| (B) | Effective October 28, 2017, Class I shares of the Sentinel International Equity Fund (the “Predecessor Fund”) were reorganized into Class Y shares of the Fund. |
| (C) | The net investment income per share was based on average shares outstanding for the period. |
| (E) | The ratio of net expenses to average net assets excluding liquidity provider expenses was 0.72%, 0.72%, 0.72% and 0.74% for the years ended June 30, 2020 and 2019, the seven months ended June 30, 2018 and the year ended November 30, 2017, respectively. |
| (G) | The ratio of gross expenses to average net assets excluding liquidity provider expenses was 0.88%, 0.88%, 0.88% and 0.75% for the years ended June 30, 2020 and 2019, the seven months ended June 30, 2018 and the year ended November 30, 2017, respectively. |
| (H) | Includes the impact of special dividends resulting from an acquisition of Covidien plc by Medtronic, Inc. on January 26, 2015 through the formation of a new holding company, Medtronic plc, incorporated in Ireland. These special dividends enhanced the ratios of net investment income for Class Y shares by 1.22%, for the fiscal year ended November 30, 2015. |
| (I) | Portfolio turnover excludes securities delivered from processing redemptions-in-kind. |
See accompanying Notes to Financial Statements.
Financial Highlights (Continued)
Touchstone Large Cap Focused Fund— Institutional Class
Selected Data for a Share Outstanding Throughout Each Period
| | | | | | | | | Seven Months | | | | | | | | | | |
| | | | | | | | | Ended | | | | | | | | | Period Ended | |
| | | Year Ended June 30, | | | June 30, | | | Year Ended November 30, | | | November 30, | |
| | | 2020 | | | 2019 | | | 2018(A) | | | 2017(B) | | | 2016 | | | 2015(C) | |
| Net asset value at beginning of period | | $ | 43.31 | | | $ | 43.75 | | | $ | 48.81 | | | $ | 42.32 | | | $ | 43.11 | | | $ | 43.01 | |
| Income (loss) from investment operations: | | | | | | | | | | | | | | | | | | | | | | | | |
| Net investment income | | | 0.35 | | | | 0.51 | (D) | | | 0.34 | | | | 0.61 | | | | 0.70 | (D) | | | 1.07 | (D) |
| Net realized and unrealized gains (losses) on investments | | | 3.83 | | | | 3.71 | | | | 1.80 | | | | 9.01 | | | | 2.41 | | | | (0.51 | ) |
| Total from investment operations | | | 4.18 | | | | 4.22 | | | | 2.14 | | | | 9.62 | | | | 3.11 | | | | 0.56 | |
| Distributions from: | | | | | | | | | | | | | | | | | | | | | | | | |
| Net investment income | | | (0.40 | ) | | | (0.40 | ) | | | (0.24 | ) | | | (0.67 | ) | | | (1.22 | ) | | | (0.46 | ) |
| Realized capital gains | | | (4.85 | ) | | | (4.26 | ) | | | (6.96 | ) | | | (2.46 | ) | | | (2.68 | ) | | | — | |
| Total distributions | | | (5.25 | ) | | | (4.66 | ) | | | (7.20 | ) | | | (3.13 | ) | | | (3.90 | ) | | | (0.46 | ) |
| Net asset value at end of period | | $ | 42.24 | | | $ | 43.31 | | | $ | 43.75 | | | $ | 48.81 | | | $ | 42.32 | | | $ | 43.11 | |
| Total return | | | 9.87 | % | | | 10.87 | % | | | 4.93 | %(E) | | | 24.14 | % | | | 7.92 | % | | | 1.31 | %(E) |
| Ratios and supplemental data: | | | | | | | | | | | | | | | | | | | | | | | | |
| Net assets at end of period (000’s) | | $ | 127,963 | | | $ | 100,473 | | | $ | 46,683 | | | $ | 44,738 | | | $ | 29,927 | | | $ | 18,225 | |
| Ratio to average net assets: | | | | | | | | | | | | | | | | | | | | | | | | |
| Net expenses (including liquidity provider expenses)(F) | | | 0.71 | % | | | 0.66 | % | | | 0.67 | %(G) | | | 0.68 | % | | | 0.65 | % | | | 0.61 | %(G) |
| Gross expenses (including liquidity provider expenses)(H) | | | 0.88 | % | | | 0.85 | % | | | 0.88 | %(G) | | | 0.70 | % | | | 0.72 | % | | | 1.76 | %(G) |
| Net investment income | | | 0.96 | % | | | 1.20 | % | | | 1.18 | %(G) | | | 1.32 | % | | | 1.72 | % | | | 2.65 | %(G)(I) |
| Portfolio turnover rate | | | 29 | %(J) | | | 15 | %(J) | | | 9 | %(E)(J) | | | 12 | %(J) | | | 8 | % | | | 11 | % |
| (A) | The Fund changed its fiscal year end from November 30 to June 30. |
| (B) | Effective October 30, 2017, Class R6 shares of the Predecessor Fund were reorganized into Institutional Class shares of the Fund. |
| (C) | Represents the period from commencement of operations (December 23, 2014) through November 30, 2015. |
| (D) | The net investment income per share was based on average shares outstanding for the period. |
| (F) | The ratio of net expenses to average net assets excluding liquidity provider expenses was 0.68%, 0.65%, 0.65% and 0.68% for the years ended June 30, 2020 and 2019, the seven months ended June 30, 2018 and the year ended November 30, 2017, respectively. |
| (H) | The ratio of gross expenses to average net assets excluding liquidity provider expenses was 0.85%, 0.84%, 0.86% and 0.70% for the years ended June 30, 2020 and 2019, the seven months ended June 30, 2018 and the year ended November 30, 2017, respectively. |
| (I) | Includes the impact of special dividends resulting from an acquisition of Covidien plc by Medtronic, Inc. on January 26, 2015 through the formation of a new holding company, Medtronic plc, incorporated in Ireland. These special dividends enhanced the ratios of net investment income for Institutional Class shares by 1.30%, for the fiscal year ended November 30, 2015. |
| (J) | Portfolio turnover excludes securities delivered from processing redemptions-in-kind. |
See accompanying Notes to Financial Statements.
Financial Highlights (Continued)
Touchstone Large Cap Fund—Class A
Selected Data for a Share Outstanding Throughout Each Period
| | | Year Ended June 30, | |
| | | 2020 | | | 2019 | | | 2018 | | | 2017 | | | 2016 | |
| Net asset value at beginning of period | | $ | 14.11 | | | $ | 13.27 | | | $ | 11.96 | | | $ | 10.49 | | | $ | 10.65 | |
| Income (loss) from investment operations: | | | | | | | | | | | | | | | | | | | | |
| Net investment income | | | 0.15 | | | | 0.09 | (A) | | | 0.09 | | | | 0.06 | | | | 0.08 | |
| Net realized and unrealized gains (losses) on investments | | | (0.24 | ) | | | 0.83 | | | | 1.27 | | | | 1.49 | | | | (0.18 | ) |
| Total from investment operations | | | (0.09 | ) | | | 0.92 | | | | 1.36 | | | | 1.55 | | | | (0.10 | ) |
| Distributions from: | | | | | | | | | | | | | | | | | | | | |
| Net investment income | | | (0.11 | ) | | | (0.08 | ) | | | (0.05 | ) | | | (0.08 | ) | | | (0.06 | ) |
| Realized capital gains | | | (0.87 | ) | | | — | | | | — | | | | — | | | | — | |
| Total distributions | | | (0.98 | ) | | | (0.08 | ) | | | (0.05 | ) | | | (0.08 | ) | | | (0.06 | ) |
| Net asset value at end of period | | $ | 13.04 | | | $ | 14.11 | | | $ | 13.27 | | | $ | 11.96 | | | $ | 10.49 | |
| Total return(B) | | | (1.18 | )% | | | 7.04 | % | | | 11.35 | % | | | 14.82 | % | | | (0.92 | %) |
| Ratios and supplemental data: | | | | | | | | | | | | | | | | | | | | |
| Net assets at end of period (000’s) | | $ | 2,989 | | | $ | 4,067 | | | $ | 2,975 | | | $ | 5,368 | | | $ | 3,657 | |
| Ratio to average net assets: | | | | | | | | | | | | | | | | | | | | |
| Net expenses | | | 1.03 | % | | | 1.11 | % | | | 1.12 | % | | | 1.12 | % | | | 1.12 | % |
| Gross expenses | | | 1.91 | % | | | 1.67 | % | | | 1.50 | % | | | 1.57 | % | | | 1.68 | % |
| Net investment income | | | 1.03 | % | | | 0.63 | % | | | 0.48 | % | | | 0.56 | % | | | 0.87 | % |
| Portfolio turnover rate | | | 20 | % | | | 19 | %(C) | | | 10 | % | | | 23 | % | | | 33 | % |
Touchstone Large Cap Fund—Class C
Selected Data for a Share Outstanding Throughout Each Period
| | | Year Ended June 30, | |
| | | 2020 | | | 2019 | | | 2018 | | | 2017 | | | 2016 | |
| Net asset value at beginning of period | | $ | 13.85 | | | $ | 13.04 | | | $ | 11.80 | | | $ | 10.37 | | | $ | 10.60 | |
| Income (loss) from investment operations: | | | | | | | | | | | | | | | | | | | | |
| Net investment income (loss) | | | 0.01 | | | | (0.02 | )(A) | | | (0.04 | ) | | | (0.02 | ) | | | 0.02 | |
| Net realized and unrealized gains (losses) on investments | | | (0.20 | ) | | | 0.83 | | | | 1.28 | | | | 1.47 | | | | (0.20 | ) |
| Total from investment operations | | | (0.19 | ) | | | 0.81 | | | | 1.24 | | | | 1.45 | | | | (0.18 | ) |
| Distributions from: | | | | | | | | | | | | | | | | | | | | |
| Net investment income | | | — | | | | — | | | | — | | | | (0.02 | ) | | | (0.05 | ) |
| Realized capital gains | | | (0.87 | ) | | | — | | | | — | | | | — | | | | — | |
| Total distributions | | | (0.87 | ) | | | — | | | | — | | | | (0.02 | ) | | | (0.05 | ) |
| Net asset value at end of period | | $ | 12.79 | | | $ | 13.85 | | | $ | 13.04 | | | $ | 11.80 | | | $ | 10.37 | |
| Total return(B) | | | (1.89 | %) | | | 6.21 | % | | | 10.51 | % | | | 13.98 | % | | | (1.72 | %) |
| Ratios and supplemental data: | | | | | | | | | | | | | | | | | | | | |
| Net assets at end of period (000’s) | | $ | 5,376 | | | $ | 7,372 | | | $ | 7,849 | | | $ | 8,102 | | | $ | 6,124 | |
| Ratio to average net assets: | | | | | | | | | | | | | | | | | | | | |
| Net expenses | | | 1.78 | % | | | 1.86 | % | | | 1.87 | % | | | 1.87 | % | | | 1.87 | % |
| Gross expenses | | | 2.09 | % | | | 2.13 | % | | | 2.12 | % | | | 2.12 | % | | | 2.39 | % |
| Net investment income (loss) | | | 0.27 | % | | | (0.12 | %) | | | (0.27 | %) | | | (0.19 | %) | | | 0.12 | % |
| Portfolio turnover rate | | | 20 | % | | | 19 | %(C) | | | 10 | % | | | 23 | % | | | 33 | % |
| (A) | The net investment income per share was based on average shares outstanding for the period. |
| (B) | Total returns shown exclude the effect of applicable sales loads and fees. If these charges were included, the returns would be lower. |
| (C) | Portfolio turnover excludes securities delivered from processing redemptions-in-kind. |
See accompanying Notes to Financial Statements.
Financial Highlights (Continued)
Touchstone Large Cap Fund—Class Y
Selected Data for a Share Outstanding Throughout Each Period
| | | Year Ended June 30, | |
| | | 2020 | | | 2019 | | | 2018 | | | 2017 | | | 2016 | |
| Net asset value at beginning of period | | $ | 14.14 | | | $ | 13.31 | | | $ | 12.00 | | | $ | 10.52 | | | $ | 10.67 | |
| Income (loss) from investment operations: | | | | | | | | | | | | | | | | | | | | |
| Net investment income | | | 0.17 | | | | 0.12 | (A) | | | 0.10 | | | | 0.09 | | | | 0.11 | |
| Net realized and unrealized gains (losses) on investments | | | (0.22 | ) | | | 0.84 | | | | 1.30 | | | | 1.49 | | | | (0.19 | ) |
| Total from investment operations | | | (0.05 | ) | | | 0.96 | | | | 1.40 | | | | 1.58 | | | | (0.08 | ) |
| Distributions from: | | | | | | | | | | | | | | | | | | | | |
| Net investment income | | | (0.15 | ) | | | (0.13 | ) | | | (0.09 | ) | | | (0.10 | ) | | | (0.07 | ) |
| Realized capital gains | | | (0.87 | ) | | | — | | | | — | | | | — | | | | — | |
| Total distributions | | | (1.02 | ) | | | (0.13 | ) | | | (0.09 | ) | | | (0.10 | ) | | | (0.07 | ) |
| Net asset value at end of period | | $ | 13.07 | | | $ | 14.14 | | | $ | 13.31 | | | $ | 12.00 | | | $ | 10.52 | |
| Total return | | | (0.93 | %) | | | 7.31 | % | | | 11.62 | % | | | 15.13 | % | | | (0.70 | %) |
| Ratios and supplemental data: | | | | | | | | | | | | | | | | | | | | |
| Net assets at end of period (000’s) | | $ | 206,798 | | | $ | 213,650 | | | $ | 231,984 | | | $ | 222,080 | | | $ | 208,463 | |
| Ratio to average net assets: | | | | | | | | | | | | | | | | | | | | |
| Net expenses | | | 0.78 | % | | | 0.86 | % | | | 0.87 | % | | | 0.87 | % | | | 0.87 | % |
| Gross expenses | | | 0.90 | % | | | 0.99 | % | | | 0.99 | % | | | 1.01 | % | | | 1.04 | % |
| Net investment income | | | 1.28 | % | | | 0.88 | % | | | 0.73 | % | | | 0.81 | % | | | 1.11 | % |
| Portfolio turnover rate | | | 20 | % | | | 19 | %(B) | | | 10 | % | | | 23 | % | | | 33 | % |
Touchstone Large Cap Fund—Institutional Class
Selected Data for a Share Outstanding Throughout Each Period
| | | Year Ended June 30, | |
| | | 2020 | | | 2019 | | | 2018 | | | 2017 | | | 2016 | |
| Net asset value at beginning of period | | $ | 14.16 | | | $ | 13.33 | | | $ | 12.02 | | | $ | 10.53 | | | $ | 10.68 | |
| Income (loss) from investment operations: | | | | | | | | | | | | | | | | | | | | |
| Net investment income | | | 0.15 | | | | 0.14 | (A) | | | 0.10 | | | | 0.11 | | | | 0.13 | |
| Net realized and unrealized gains (losses) on investments | | | (0.19 | ) | | | 0.83 | | | | 1.31 | | | | 1.49 | | | | (0.20 | ) |
| Total from investment operations | | | (0.04 | ) | | | 0.97 | | | | 1.41 | | | | 1.60 | | | | (0.07 | ) |
| Distributions from: | | | | | | | | | | | | | | | | | | | | |
| Net investment income | | | (0.16 | ) | | | (0.14 | ) | | | (0.10 | ) | | | (0.11 | ) | | | (0.08 | ) |
| Realized capital gains | | | (0.87 | ) | | | — | | | | — | | | | — | | | | — | |
| Total distributions | | | (1.03 | ) | | | (0.14 | ) | | | (0.10 | ) | | | (0.11 | ) | | | (0.08 | ) |
| Net asset value at end of period | | $ | 13.09 | | | $ | 14.16 | | | $ | 13.33 | | | $ | 12.02 | | | $ | 10.53 | |
| Total return | | | (0.83 | %) | | | 7.43 | % | | | 11.70 | % | | | 15.31 | % | | | (0.66 | %) |
| Ratios and supplemental data: | | | | | | | | | | | | | | | | | | | | |
| Net assets at end of period (000’s) | | $ | 60,402 | | | $ | 59,211 | | | $ | 124,759 | | | $ | 97,888 | | | $ | 87,032 | |
| Ratio to average net assets: | | | | | | | | | | | | | | | | | | | | |
| Net expenses | | | 0.68 | % | | | 0.77 | % | | | 0.77 | % | | | 0.77 | % | | | 0.77 | % |
| Gross expenses | | | 0.84 | % | | | 0.92 | % | | | 0.91 | % | | | 0.91 | % | | | 0.93 | % |
| Net investment income | | | 1.38 | % | | | 0.98 | % | | | 0.83 | % | | | 0.91 | % | | | 1.21 | % |
| Portfolio turnover rate | | | 20 | % | | | 19 | %(B) | | | 10 | % | | | 23 | % | | | 33 | % |
| (A) | The net investment income per share was based on average shares outstanding for the period. |
| (B) | Portfolio turnover excludes securities delivered from processing redemptions-in-kind. |
See accompanying Notes to Financial Statements.
Financial Highlights (Continued)
Touchstone Large Company Growth Fund—Class A
Selected Data for a Share Outstanding Throughout Each Period
| | | | | | | | | | | | Period Ended | |
| | | Year Ended June 30, | | | June 30, | |
| | | 2020 | | | 2019 | | | 2018 | | | 2017(A) | |
| Net asset value at beginning of period | | $ | 42.50 | | | $ | 41.33 | | | $ | 35.52 | | | $ | 31.38 | (B) |
| Income (loss) from investment operations: | | | | | | | | | | | | | | | | |
| Net investment loss | | | (0.08 | ) | | | (0.56 | ) | | | (0.24 | ) | | | (0.19 | )(C) |
| Net realized and unrealized gains on investments | | | 8.19 | | | | 4.42 | | | | 7.19 | | | | 5.41 | |
| Total from investment operations | | | 8.11 | | | | 3.86 | | | | 6.95 | | | | 5.22 | |
| Distributions from: | | | | | | | | | | | | | | | | |
| Realized capital gains | | | (3.15 | ) | | | (2.69 | ) | | | (1.14 | ) | | | (1.08 | ) |
| Net asset value at end of period | | $ | 47.46 | | | $ | 42.50 | | | $ | 41.33 | | | $ | 35.52 | |
| Total return(D) | | | 20.07 | % | | | 10.39 | % | | | 19.75 | % | | | 17.31 | %(E) |
| Ratios and supplemental data: | | | | | | | | | | | | | | | | |
| Net assets at end of period (000’s) | | $ | 2,112 | | | $ | 1,425 | | | $ | 3,417 | | | $ | 140 | |
| Ratio to average net assets: | | | | | | | | | | | | | | | | |
| Net expenses | | | 1.07 | % | | | 1.23 | % | | | 1.23 | % | | | 1.23 | %(F) |
| Gross expenses | | | 2.28 | % | | | 2.01 | % | | | 1.67 | % | | | 11.14 | %(F) |
| Net investment loss | | | (0.60 | %) | | | (0.59 | %) | | | (0.63 | %) | | | (0.68 | %)(F) |
| Portfolio turnover rate | | | 30 | % | | | 41 | % | | | 44 | % | | | 55 | % |
Touchstone Large Company Growth Fund—Class C
Selected Data for a Share Outstanding Throughout Each Period
| | | | | | | | | | | | Period Ended | |
| | | Year Ended June 30, | | | June 30, | |
| | | 2020 | | | 2019 | | | 2018 | | | 2017(A) | |
| Net asset value at beginning of period | | $ | 41.52 | | | $ | 40.74 | | | $ | 35.29 | | | $ | 31.38 | (B) |
| Income (loss) from investment operations: | | | | | | | | | | | | | | | | |
| Net investment loss | | | (0.31 | ) | | | (0.40 | ) | | | (0.30 | ) | | | (0.38 | )(C) |
| Net realized and unrealized gains on investments | | | 7.87 | | | | 3.87 | | | | 6.89 | | | | 5.37 | |
| Total from investment operations | | | 7.56 | | | | 3.47 | | | | 6.59 | | | | 4.99 | |
| Distributions from: | | | | | | | | | | | | | | | | |
| Realized capital gains | | | (3.15 | ) | | | (2.69 | ) | | | (1.14 | ) | | | (1.08 | ) |
| Net asset value at end of period | | $ | 45.93 | | | $ | 41.52 | | | $ | 40.74 | | | $ | 35.29 | |
| Total return(D) | | | 19.19 | % | | | 9.55 | % | | | 18.88 | % | | | 16.52 | %(E) |
| Ratios and supplemental data: | | | | | | | | | | | | | | | | |
| Net assets at end of period (000’s) | | $ | 592 | | | $ | 396 | | | $ | 236 | | | $ | 31 | |
| Ratio to average net assets: | | | | | | | | | | | | | | | | |
| Net expenses | | | 1.82 | % | | | 1.98 | % | | | 1.98 | % | | | 1.98 | %(F) |
| Gross expenses | | | 4.64 | % | | | 4.38 | % | | | 8.12 | % | | | 257.02 | %(F) |
| Net investment loss | | | (1.35 | %) | | | (1.34 | %) | | | (1.38 | %) | | | (1.43 | %)(F) |
| Portfolio turnover rate | | | 30 | % | | | 41 | % | | | 44 | % | | | 55 | % |
| (A) | Represents the period from commencement of operations (August 15, 2016) through June 30, 2017. |
| (B) | Net asset value at the beginning of period is based on the net asset value of Institutional Class shares on August 15, 2016. |
| (C) | The net investment loss per share was based on average shares outstanding for the period. |
| (D) | Total returns shown exclude the effect of applicable sales loads and fees. If these charges were included, the returns would be lower. |
See accompanying Notes to Financial Statements.
Financial Highlights (Continued)
Touchstone Large Company Growth Fund—Class Y
Selected Data for a Share Outstanding Throughout Each Period
| | | | | | | | | | | | Period Ended | |
| | | Year Ended June 30, | | | June 30, | |
| | | 2020 | | | 2019 | | | 2018 | | | 2017(A) | |
| Net asset value at beginning of period | | $ | 42.82 | | | $ | 41.53 | | | $ | 35.60 | | | $ | 31.38 | (B) |
| Income (loss) from investment operations: | | | | | | | | | | | | | | | | |
| Net investment loss | | | (0.12 | ) | | | (0.12 | ) | | | (0.13 | ) | | | (0.12 | )(C) |
| Net realized and unrealized gains on investments | | | 8.42 | | | | 4.10 | | | | 7.20 | | | | 5.42 | |
| Total from investment operations | | | 8.30 | | | | 3.98 | | | | 7.07 | | | | 5.30 | |
| Distributions from: | | | | | | | | | | | | | | | | |
| Realized capital gains | | | (3.15 | ) | | | (2.69 | ) | | | (1.14 | ) | | | (1.08 | ) |
| Net asset value at end of period | | $ | 47.97 | | | $ | 42.82 | | | $ | 41.53 | | | $ | 35.60 | |
| Total return | | | 20.38 | % | | | 10.66 | % | | | 20.02 | % | | | 17.57 | %(D) |
| Ratios and supplemental data: | | | | | | | | | | | | | | | | |
| Net assets at end of period (000’s) | | $ | 24,062 | | | $ | 19,580 | | | $ | 15,961 | | | $ | 9,938 | |
| Ratio to average net assets: | | | | | | | | | | | | | | | | |
| Net expenses | | | 0.82 | % | | | 0.98 | % | | | 0.98 | % | | | 0.98 | %(E) |
| Gross expenses | | | 1.04 | % | | | 1.16 | % | | | 1.12 | % | | | 1.12 | %(E) |
| Net investment loss | | | (0.35 | %) | | | (0.34 | %) | | | (0.38 | %) | | | (0.42 | %)(E) |
| Portfolio turnover rate | | | 30 | % | | | 41 | % | | | 44 | % | | | 55 | % |
Touchstone Large Company Growth Fund—Institutional Class
Selected Data for a Share Outstanding Throughout Each Period
| | | Year Ended June 30, | |
| | | 2020 | | | 2019 | | | 2018 | | | 2017 | | | 2016 | |
| Net asset value at beginning of period | | $ | 42.95 | | | $ | 41.61 | | | $ | 35.63 | | | $ | 29.15 | | | $ | 33.17 | |
| Income (loss) from investment operations: | | | | | | | | | | | | | | | | | | | | |
| Net investment loss | | | (0.12 | ) | | | (0.10 | ) | | | (0.11 | ) | | | (0.12 | )(C) | | | (0.14 | )(C) |
| Net realized and unrealized gains (losses) on investments | | | 8.50 | | | | 4.13 | | | | 7.23 | | | | 7.68 | | | | (1.45 | ) |
| Total from investment operations | | | 8.38 | | | | 4.03 | | | | 7.12 | | | | 7.56 | | | | (1.59 | ) |
| Distributions from: | | | | | | | | | | | | | | | | | | | | |
| Realized capital gains | | | (3.15 | ) | | | (2.69 | ) | | | (1.14 | ) | | | (1.08 | ) | | | (2.43 | ) |
| Proceeds from redemption fees collected | | | — | | | | — | | | | — | | | | — | | | | — | (F) |
| Net asset value at end of period | | $ | 48.18 | | | $ | 42.95 | | | $ | 41.61 | | | $ | 35.63 | | | $ | 29.15 | |
| Total return | | | 20.51 | % | | | 10.74 | % | | | 20.17 | % | | | 26.67 | % | | | (5.08 | %) |
| Ratios and supplemental data: | | | | | | | | | | | | | | | | | | | | |
| Net assets at end of period (000’s) | | $ | 199,601 | | | $ | 204,391 | | | $ | 224,379 | | | $ | 189,444 | | | $ | 180,104 | |
| Ratio to average net assets: | | | | | | | | | | | | | | | | | | | | |
| Net expenses | | | 0.73 | % | | | 0.88 | % | | | 0.88 | % | | | 0.89 | % | | | 0.95 | % |
| Gross expenses | | | 0.86 | % | | | 0.99 | % | | | 0.98 | % | | | 1.02 | % | | | 1.00 | % |
| Net investment loss | | | (0.25 | %) | | | (0.24 | %) | | | (0.28 | %) | | | (0.39 | %) | | | (0.46 | %) |
| Portfolio turnover rate | | | 30 | % | | | 41 | % | | | 44 | % | | | 55 | % | | | 57 | % |
| (A) | Represents the period from commencement of operations (August 15, 2016) through June 30, 2017. |
| (B) | Net asset value at the beginning of period is based on the net asset value of Institutional Class shares on August 15, 2016. |
| (C) | The net investment loss per share was based on average shares outstanding for the period. |
| (F) | Proceeds from redemption fees are related to the DSM Large Cap Growth Fund, the Predecessor Fund, and are less than $0.005 per share. |
See accompanying Notes to Financial Statements.
Financial Highlights (Continued)
Touchstone Ohio Tax-Free Bond Fund—Class A
Selected Data for a Share Outstanding Throughout Each Period
| | | Year Ended June 30, | |
| | | 2020 | | | 2019 | | | 2018 | | | 2017 | | | 2016 | |
| Net asset value at beginning of period | | $ | 11.63 | | | $ | 11.33 | | | $ | 11.55 | | | $ | 12.04 | | | $ | 11.70 | |
| Income (loss) from investment operations: | | | | | | | | | | | | | | | | | | | | |
| Net investment income | | | 0.30 | | | | 0.32 | | | | 0.33 | | | | 0.35 | | | | 0.36 | |
| Net realized and unrealized gains (losses) on investments | | | 0.21 | | | | 0.30 | | | | (0.22 | ) | | | (0.47 | ) | | | 0.36 | |
| Total from investment operations | | | 0.51 | | | | 0.62 | | | | 0.11 | | | | (0.12 | ) | | | 0.72 | |
| Distributions from: | | | | | | | | | | | | | | | | | | | | |
| Net investment income | | | (0.30 | ) | | | (0.32 | ) | | | (0.33 | ) | | | (0.35 | ) | | | (0.36 | ) |
| Realized capital gains | | | (0.01 | ) | | | — | | | | — | | | | (0.02 | ) | | | (0.02 | ) |
| Total distributions | | | (0.31 | ) | | | (0.32 | ) | | | (0.33 | ) | | | (0.37 | ) | | | (0.38 | ) |
| Net asset value at end of period | | $ | 11.83 | | | $ | 11.63 | | | $ | 11.33 | | | $ | 11.55 | | | $ | 12.04 | |
| Total return(A) | | | 4.38 | % | | | 5.60 | % | | | 0.99 | % | | | (1.03 | %) | | | 6.25 | % |
| Ratios and supplemental data: | | | | | | | | | | | | | | | | | | | | |
| Net assets at end of period (000’s) | | $ | 32,060 | | | $ | 33,515 | | | $ | 35,728 | | | $ | 42,818 | | | $ | 52,599 | |
| Ratio to average net assets: | | | | | | | | | | | | | | | | | | | | |
| Net expenses | | | 0.85 | % | | | 0.85 | % | | | 0.85 | % | | | 0.85 | % | | | 0.85 | % |
| Gross expenses | | | 1.18 | % | | | 1.15 | % | | | 1.13 | % | | | 1.13 | % | | | 1.13 | % |
| Net investment income | | | 2.53 | % | | | 2.85 | % | | | 2.91 | % | | | 2.98 | % | | | 3.05 | % |
| Portfolio turnover rate | | | 33 | % | | | 53 | % | | | 47 | % | | | 34 | % | | | 27 | % |
Touchstone Ohio Tax-Free Bond Fund—Class C
Selected Data for a Share Outstanding Throughout Each Period
| | | Year Ended June 30, | |
| | | 2020 | | | 2019 | | | 2018 | | | 2017 | | | 2016 | |
| Net asset value at beginning of period | | $ | 11.65 | | | $ | 11.33 | | | $ | 11.57 | | | $ | 12.06 | | | $ | 11.72 | |
| Income (loss) from investment operations: | | | | | | | | | | | | | | | | | | | | |
| Net investment income | | | 0.21 | | | | 0.23 | | | | 0.25 | | | | 0.26 | | | | 0.27 | |
| Net realized and unrealized gains (losses) on investments | | | 0.21 | | | | 0.33 | | | | (0.24 | ) | | | (0.47 | ) | | | 0.36 | |
| Total from investment operations | | | 0.42 | | | | 0.56 | | | | 0.01 | | | | (0.21 | ) | | | 0.63 | |
| Distributions from: | | | | | | | | | | | | | | | | | | | | |
| Net investment income | | | (0.21 | ) | | | (0.24 | ) | | | (0.25 | ) | | | (0.26 | ) | | | (0.27 | ) |
| Realized capital gains | | | (0.01 | ) | | | — | | | | — | | | | (0.02 | ) | | | (0.02 | ) |
| Total distributions | | | (0.22 | ) | | | (0.24 | ) | | | (0.25 | ) | | | (0.28 | ) | | | (0.29 | ) |
| Net asset value at end of period | | $ | 11.85 | | | $ | 11.65 | | | $ | 11.33 | | | $ | 11.57 | | | $ | 12.06 | |
| Total return(A) | | | 3.61 | % | | | 4.97 | % | | | 0.06 | % | | | (1.77 | %) | | | 5.45 | % |
| Ratios and supplemental data: | | | | | | | | | | | | | | | | | | | | |
| Net assets at end of period (000’s) | | $ | 2,050 | | | $ | 2,756 | | | $ | 5,363 | | | $ | 6,515 | | | $ | 7,320 | |
| Ratio to average net assets: | | | | | | | | | | | | | | | | | | | | |
| Net expenses | | | 1.60 | % | | | 1.60 | % | | | 1.60 | % | | | 1.60 | % | | | 1.60 | % |
| Gross expenses | | | 2.32 | % | | | 2.08 | % | | | 2.01 | % | | | 2.03 | % | | | 2.09 | % |
| Net investment income | | | 1.78 | % | | | 2.10 | % | | | 2.16 | % | | | 2.23 | % | | | 2.30 | % |
| Portfolio turnover rate | | | 33 | % | | | 53 | % | | | 47 | % | | | 34 | % | | | 27 | % |
(A) Total returns shown exclude the effect of applicable sales loads and fees. If these charges were included, the returns would be lower.
See accompanying Notes to Financial Statements.
Financial Highlights (Continued)
Touchstone Ohio Tax-Free Bond Fund—Class Y
Selected Data for a Share Outstanding Throughout Each Period
| | | | | | | | | | | | Period Ended | |
| | | Year Ended June 30, | | | June 30, | |
| | | 2020 | | | 2019 | | | 2018 | | | 2017(A) | |
| Net asset value at beginning of period | | $ | 11.64 | | | $ | 11.33 | | | $ | 11.56 | | | $ | 12.00 | (B) |
| Income (loss) from investment operations: | | | | | | | | | | | | | | | | |
| Net investment income | | | 0.33 | | | | 0.35 | | | | 0.29 | | | | 0.38 | |
| Net realized and unrealized gains (losses) on investments | | | 0.22 | | | | 0.31 | | | | (0.16 | ) | | | (0.49 | ) |
| Total from investment operations | | | 0.55 | | | | 0.66 | | | | 0.13 | | | | (0.11 | ) |
| Distributions from: | | | | | | | | | | | | | | | | |
| Net investment income | | | (0.33 | ) | | | (0.35 | ) | | | (0.36 | ) | | | (0.31 | ) |
| Realized capital gains | | | (0.01 | ) | | | — | | | | — | | | | (0.02 | ) |
| Total distributions | | | (0.34 | ) | | | (0.35 | ) | | | (0.36 | ) | | | (0.33 | ) |
| Net asset value at end of period | | $ | 11.85 | | | $ | 11.64 | | | $ | 11.33 | | | $ | 11.56 | |
| Total return | | | 4.73 | % | | | 5.96 | % | | | 1.15 | % | | | (0.90 | %)(C) |
| Ratios and supplemental data: | | | | | | | | | | | | | | | | |
| Net assets at end of period (000’s) | | $ | 2,616 | | | $ | 3,031 | | | $ | 4,596 | | | $ | 2 | |
| Ratio to average net assets: | | | | | | | | | | | | | | | | |
| Net expenses | | | 0.60 | % | | | 0.60 | % | | | 0.60 | % | | | 0.60 | %(D) |
| Gross expenses | | | 1.31 | % | | | 1.05 | % | | | 1.16 | % | | | 298.27 | %(D) |
| Net investment income | | | 2.78 | % | | | 3.10 | % | | | 3.16 | % | | | 4.00 | %(D) |
| Portfolio turnover rate | | | 33 | % | | | 53 | % | | | 47 | % | | | 34 | % |
Touchstone Ohio Tax-Free Bond Fund—Institutional Class
Selected Data for a Share Outstanding Throughout Each Period
| | | | | | | | | | | | Period Ended | |
| | | Year Ended June 30, | | | June 30, | |
| | | 2020 | | | 2019 | | | 2018 | | | 2017(A) | |
| Net asset value at beginning of period | | $ | 11.64 | | | $ | 11.33 | | | $ | 11.56 | | | $ | 12.00 | (B) |
| Income (loss) from investment operations: | | | | | | | | | | | | | | | | |
| Net investment income | | | 0.33 | | | | 0.36 | | | | 0.30 | | | | 0.39 | |
| Net realized and unrealized gains (losses) on investments | | | 0.21 | | | | 0.31 | | | | (0.16 | ) | | | (0.50 | ) |
| Total from investment operations | | | 0.54 | | | | 0.67 | | | | 0.14 | | | | (0.11 | ) |
| Distributions from: | | | | | | | | | | | | | | | | |
| Net investment income | | | (0.33 | ) | | | (0.36 | ) | | | (0.37 | ) | | | (0.31 | ) |
| Realized capital gains | | | (0.01 | ) | | | — | | | | — | | | | (0.02 | ) |
| Total distributions | | | (0.34 | ) | | | (0.36 | ) | | | (0.37 | ) | | | (0.33 | ) |
| Net asset value at end of period | | $ | 11.84 | | | $ | 11.64 | | | $ | 11.33 | | | $ | 11.56 | |
| Total return | | | 4.69 | % | | | 6.05 | % | | | 1.18 | % | | | (0.90 | %)(C) |
| Ratios and supplemental data: | | | | | | | | | | | | | | | | |
| Net assets at end of period (000’s) | | $ | 12,785 | | | $ | 7,913 | | | $ | 560 | | | $ | 2 | |
| Ratio to average net assets: | | | | | | | | | | | | | | | | |
| Net expenses | | | 0.55 | % | | | 0.55 | % | | | 0.55 | % | | | 0.55 | %(D) |
| Gross expenses | | | 0.91 | % | | | 0.96 | % | | | 2.54 | % | | | 298.26 | %(D) |
| Net investment income | | | 2.83 | % | | | 3.15 | % | | | 3.21 | % | | | 4.04 | %(D) |
| Portfolio turnover rate | | | 33 | % | | | 53 | % | | | 47 | % | | | 34 | % |
| (A) | Represents the period from commencement of operations (August 31, 2016) through December 31, 2017. |
| (B) | Net asset value at the beginning of period is based on the net asset value of Class A shares on August 31, 2016. |
See accompanying Notes to Financial Statements.
Financial Highlights (Continued)
Touchstone Small Company Fund—Class A
Selected Data for a Share Outstanding Throughout Each Period
| | | | | | | | | Seven Months | | | | | | | | | | |
| | | | | | | | | Ended | | | | | | | | | | |
| | | Year Ended June 30, | | | June 30, | | | Year Ended November 30, | |
| | | 2020 | | | 2019 | | | 2018(A) | | | 2017 | | | 2016 | | | 2015 | |
| Net asset value at beginning of period | | $ | 4.83 | | | $ | 5.53 | | | $ | 5.64 | | | $ | 5.19 | | | $ | 5.58 | | | $ | 7.19 | |
| Income (loss) from investment operations: | | | | | | | | | | | | | | | | | | | | | | | | |
| Net investment loss | | | (0.02 | ) | | | (0.01 | ) | | | (0.01 | ) | | | (0.02 | ) | | | (0.02 | )(B) | | | (0.03 | )(B) |
| Net realized and unrealized gains (losses) on investments | | | (0.47 | ) | | | (0.07 | ) | | | 0.37 | | | | 0.89 | | | | 0.57 | | | | 0.26 | |
| Total from investment operations | | | (0.49 | ) | | | (0.08 | ) | | | 0.36 | | | | 0.87 | | | | 0.55 | | | | 0.23 | |
| Distributions from: | | | | | | | | | | | | | | | | | | | | | | | | |
| Realized capital gains | | | (0.28 | ) | | | (0.62 | ) | | | (0.47 | ) | | | (0.42 | ) | | | (0.94 | ) | | | (1.84 | ) |
| Net asset value at end of period | | $ | 4.06 | | | $ | 4.83 | | | $ | 5.53 | | | $ | 5.64 | | | $ | 5.19 | | | $ | 5.58 | |
| Total return(C) | | | (10.82 | %) | | | (0.73 | %) | | | 6.89 | %(D) | | | 17.95 | % | | | 12.52 | % | | | 5.32 | % |
| Ratios and supplemental data: | | | | | | | | | | | | | | | | | | | | | | | | |
| Net assets at end of period (000’s) | | $ | 420,822 | | | $ | 589,664 | | | $ | 661,866 | | | $ | 677,055 | | | $ | 685,807 | | | $ | 596,864 | |
| Ratio to average net assets: | | | | | | | | | | | | | | | | | | | | | | | | |
| Net expenses | | | 1.15 | % | | | 1.12 | % | | | 1.10 | %(E) | | | 1.18 | % | | | 1.22 | % | | | 1.25 | % |
| Gross expenses | | | 1.24 | % | | | 1.20 | % | | | 1.18 | %(E) | | | 1.18 | % | | | 1.22 | % | | | 1.25 | % |
| Net investment loss | | | (0.32 | %) | | | (0.26 | %) | | | (0.26 | %)(E) | | | (0.49 | %) | | | (0.38 | %) | | | (0.61 | %) |
| Portfolio turnover rate | | | 81 | % | | | 94 | %(F)(G) | | | 30 | %(D) | | | 82 | % | | | 61 | % | | | 70 | % |
Touchstone Small Company Fund—Class C
Selected Data for a Share Outstanding Throughout Each Period
| | | | | | | | | Seven Months | | | | | | | | | | |
| | | | | | | | | Ended | | | | | | | | | | |
| | | Year Ended June 30, | | | June 30, | | | Year Ended November 30, | |
| | | 2020 | | | 2019 | | | 2018(A) | | | 2017 | | | 2016 | | | 2015 | |
| Net asset value at beginning of period | | $ | 2.52 | | | $ | 3.23 | | | $ | 3.50 | | | $ | 3.39 | | | $ | 4.01 | | | $ | 5.72 | |
| Income (loss) from investment operations: | | | | | | | | | | | | | | | | | | | | | | | | |
| Net investment loss | | | (0.05 | ) | | | (0.05 | ) | | | (0.02 | ) | | | (0.10 | ) | | | (0.03 | )(B) | | | (0.05 | )(B) |
| Net realized and unrealized gains (losses) on investments | | | (0.20 | ) | | | (0.04 | ) | | | 0.22 | | | | 0.63 | | | | 0.35 | | | | 0.18 | |
| Total from investment operations | | | (0.25 | ) | | | (0.09 | ) | | | 0.20 | | | | 0.53 | | | | 0.32 | | | | 0.13 | |
| Distributions from: | | | | | | | | | | | | | | | | | | | | | | | | |
| Realized capital gains | | | (0.28 | ) | | | (0.62 | ) | | | (0.47 | ) | | | (0.42 | ) | | | (0.94 | ) | | | (1.84 | ) |
| Net asset value at end of period | | $ | 1.99 | | | $ | 2.52 | | | $ | 3.23 | | | $ | 3.50 | | | $ | 3.39 | | | $ | 4.01 | |
| Total return(C) | | | (11.22 | %) | | | (1.65 | %) | | | 6.51 | %(D) | | | 17.36 | % | | | 11.48 | % | | | 4.72 | % |
| Ratios and supplemental data: | | | | | | | | | | | | | | | | | | | | | | | | |
| Net assets at end of period (000’s) | | $ | 21,204 | | | $ | 39,390 | | | $ | 97,136 | | | $ | 104,051 | | | $ | 110,842 | | | $ | 108,192 | |
| Ratio to average net assets: | | | | | | | | | | | | | | | | | | | | | | | | |
| Net expenses | | | 1.95 | % | | | 1.88 | % | | | 1.85 | %(E) | | | 1.92 | % | | | 1.95 | % | | | 1.94 | % |
| Gross expenses | | | 2.07 | % | | | 1.96 | % | | | 1.93 | %(E) | | | 1.92 | % | | | 1.95 | % | | | 1.94 | % |
| Net investment loss | | | (1.12 | %) | | | (1.01 | %) | | | (1.02 | %)(E) | | | (1.23 | %) | | | (1.10 | %) | | | (1.30 | %) |
| Portfolio turnover rate | | | 81 | % | | | 94 | %(F)(G) | | | 30 | %(D) | | | 82 | % | | | 61 | % | | | 70 | % |
| (A) | The Fund changed its fiscal year end from November 30 to June 30. |
| (B) | The net investment income (loss) per share was based on average shares outstanding for the period. |
| (C) | Total returns shown exclude the effect of applicable sales loads and fees. If these charges were included, the returns would be lower. |
| (F) | Portfolio turnover excludes the purchases and sales of securities by the Touchstone Small Cap Growth Fund acquired on September 21, 2018 (See Note 9 in the Notes to Financial Statements). If these transactions were included, portfolio turnover would have been higher. |
| (G) | Portfolio turnover excludes securities delivered from processing redemptions-in-kind. |
See accompanying Notes to Financial Statements.
Financial Highlights (Continued)
Touchstone Small Company Fund—Class Y
Selected Data for a Share Outstanding Throughout Each Period
| | | | | | Seven Months | | | | |
| | | | | | Ended | | | | |
| | | Year Ended June 30, | | | June 30, | | | Year Ended November 30, | |
| | | 2020 | | | 2019 | | | 2018(A) | | | 2017(B) | | | 2016 | | | 2015 | |
| Net asset value at beginning of period | | $ | 5.33 | | | $ | 6.04 | | | $ | 6.10 | | | $ | 5.56 | | | $ | 5.89 | | | $ | 7.48 | |
| Income (loss) from investment operations: | | | | | | | | | | | | | | | | | | | | | | | | |
| Net investment loss | | | (— | )(C) | | | (— | )(C) | | | (— | )(C) | | | (0.06 | ) | | | (— | )(C)(D) | | | (0.01 | )(D) |
| Net realized and unrealized gains (losses) on investments | | | (0.52 | ) | | | (0.09 | ) | | | 0.41 | | | | 1.02 | | | | 0.61 | | | | 0.28 | |
| Total from investment operations | | | (0.52 | ) | | | (0.09 | ) | | | 0.41 | | | | 0.96 | | | | 0.61 | | | | 0.27 | |
| Distributions from: | | | | | | | | | | | | | | | | | | | | | | | | |
| Net investment income | | | — | | | | (—)(C) | | | | — | | | | — | | | | — | | | | (0.02 | ) |
| Realized capital gains | | | (0.28 | ) | | | (0.62 | ) | | | (0.47 | ) | | | (0.42 | ) | | | (0.94 | ) | | | (1.84 | ) |
| Total distributions | | | (0.28 | ) | | | (0.62 | ) | | | (0.47 | ) | | | (0.42 | ) | | | (0.94 | ) | | | (1.86 | ) |
| Net asset value at end of period | | $ | 4.53 | | | $ | 5.33 | | | $ | 6.04 | | | $ | 6.10 | | | $ | 5.56 | | | $ | 5.89 | |
| Total return | | | (10.35 | %) | | | (0.79 | %) | | | 7.21 | %(E) | | | 18.41 | % | | | 12.95 | % | | | 5.71 | % |
| Ratios and supplemental data: | | | | | | | | | | | | | | | | | | | | | | | | |
| Net assets at end of period (000’s) | | $ | 189,336 | | | $ | 326,021 | | | $ | 383,050 | | | $ | 388,404 | | | $ | 257,483 | | | $ | 220,543 | |
| Ratio to average net assets: | | | | | | | | | | | | | | | | | | | | | | | | |
| Net expenses | | | 0.89 | % | | | 0.87 | % | | | 0.84 | %(F) | | | 0.85 | % | | | 0.89 | % | | | 0.87 | % |
| Gross expenses | | | 0.98 | % | | | 0.95 | % | | | 0.92 | %(F) | | | 0.85 | % | | | 0.89 | % | | | 0.87 | % |
| Net investment income (loss) | | | (0.06 | %) | | | 0.00 | %(C) | | | (0.01 | %)(F) | | | (0.16 | %) | | | (0.04 | %) | | | (0.24 | %) |
| Portfolio turnover rate | | | 81 | % | | | 94 | %(G)(H) | | | 30 | %(E) | | | 82 | % | | | 61 | % | | | 70 | % |
Touchstone Small Company Fund— Institutional Class
Selected Data for a Share Outstanding Throughout Each Period
| | | | | | | | | Seven Months | | | | |
| | | | | | | | | Ended | | | Period Ended | |
| | | Year Ended June 30, | | | June 30, | | | November 30, | |
| | | 2020 | | | 2019 | | | 2018(A) | | | 2017(I) | |
| Net asset value at beginning of period | | $ | 5.32 | | | $ | 6.04 | | | $ | 6.10 | | | $ | 5.80 | |
| Income (loss) from investment operations: | | | | | | | | | | | | | | | | |
| Net investment income (loss) | | | — | (C) | | | — | (C) | | | — | (C) | | | (— | )(C) |
| Net realized and unrealized gains (losses) on investments | | | (0.52 | ) | | | (0.10 | ) | | | 0.41 | | | | 0.30 | |
| Total from investment operations | | | (0.52 | ) | | | (0.10 | ) | | | 0.41 | | | | 0.30 | |
| Distributions from: | | | | | | | | | | | | | | | | |
| Net investment income | | | — | | | | (— | )(C) | | | — | | | | — | |
| Realized capital gains | | | (0.28 | ) | | | (0.62 | ) | | | (0.47 | ) | | | — | |
| Total distributions | | | (0.28 | ) | | | (0.62 | ) | | | (0.47 | ) | | | — | |
| Net asset value at end of period | | $ | 4.52 | | | $ | 5.32 | | | $ | 6.04 | | | $ | 6.10 | |
| Total return | | | (10.37 | %) | | | (0.91 | %) | | | 7.21 | %(E) | | | 5.17 | %(E) |
| Ratios and supplemental data: | | | | | | | | | | | | | | | | |
| Net assets at end of period (000’s) | | $ | 11,269 | | | $ | 2,216 | | | $ | 8 | | | $ | 3 | |
| Ratio to average net assets: | | | | | | | | | | | | | | | | |
| Net expenses | | | 0.79 | % | | | 0.79 | % | | | 0.79 | %(F) | | | 0.79 | %(F) |
| Gross expenses | | | 1.13 | % | | | 2.52 | % | | | 275.86 | %(F) | | | 2069.15 | %(F) |
| Net investment income (loss) | | | 0.05 | % | | | 0.08 | % | | | 0.05 | %(F) | | | (0.70 | %)(F) |
| Portfolio turnover rate | | | 81 | % | | | 94 | %(G)(H) | | | 30 | %(E) | | | 82 | % |
| (A) | The Fund changed its fiscal year end from November 30 to June 30. |
| (B) | Effective October 28, 2017, Class I shares of the Sentinel Small Company Fund (the “Predecessor Fund”) were reorganized into Class Y shares of the Fund. |
| (C) | Less than $0.005 per share or 0.005%. |
| (D) | The net investment income (loss) per share was based on average shares outstanding for the period. |
| (G) | Portfolio turnover excludes the purchases and sales of securities by the Touchstone Small Cap Growth Fund acquired on September 21, 2018 (See Note 9 in the Notes to Financial Statements). If these transactions were included, portfolio turnover would have been higher. |
| (H) | Portfolio turnover excludes securities delivered from processing redemptions-in-kind. |
| (I) | Represents the period from commencement of operations (October 30, 2017) through November 30, 2017. |
See accompanying Notes to Financial Statements.
Financial Highlights (Continued)
Touchstone Small Company Fund—Class R6
Selected Data for a Share Outstanding Throughout Each Period
| | | | | | | | | Seven Months | | | | | | | | | | |
| | | | | | | | | Ended | | | | | | | | | Period Ended | |
| | | Year Ended June 30, | | | June 30, | | | Year Ended November 30, | | | November 30, | |
| | | 2020 | | | 2019 | | | 2018(A) | | | 2017 | | | 2016 | | | 2015(B) | |
| Net asset value at beginning of period | | $ | 4.95 | | | $ | 5.65 | | | $ | 5.73 | | | $ | 5.24 | | | $ | 5.60 | | | $ | 5.44 | |
| Income (loss) from investment operations: | | | | | | | | | | | | | | | | | | | | | | | | |
| Net investment income (loss) | | | 0.01 | | | | 0.01 | | | | — | (C) | | | (0.03 | ) | | | 0.01 | (D) | | | (0.01 | )(D) |
| Net realized and unrealized gains (losses) on investments | | | (0.49 | ) | | | (0.08 | ) | | | 0.39 | | | | 0.94 | | | | 0.57 | | | | 0.17 | |
| Total from investment operations | | | (0.48 | ) | | | (0.07 | ) | | | 0.39 | | | | 0.91 | | | | 0.58 | | | | 0.16 | |
| Distributions from: | | | | | | | | | | | | | | | | | | | | | | | | |
| Net investment income | | | — | | | | (0.01 | ) | | | — | | | | — | | | | — | | | | — | |
| Realized capital gains | | | (0.28 | ) | | | (0.62 | ) | | | (0.47 | ) | | | (0.42 | ) | | | (0.94 | ) | | | — | |
| Total distributions | | | (0.28 | ) | | | (0.63 | ) | | | (0.47 | ) | | | (0.42 | ) | | | (0.94 | ) | | | — | |
| Net asset value at end of period | | $ | 4.19 | | | $ | 4.95 | | | $ | 5.65 | | | $ | 5.73 | | | $ | 5.24 | | | $ | 5.60 | |
| Total return | | | (10.35 | %) | | | (0.59 | %) | | | 7.33 | %(E) | | | 18.58 | % | | | 13.07 | % | | | 2.94 | %(E) |
| Ratios and supplemental data: | | | | | | | | | | | | | | | | | | | | | | | | |
| Net assets at end of period (000’s) | | $ | 64,567 | | | $ | 137,585 | | | $ | 76,246 | | | $ | 67,052 | | | $ | 13,000 | | | $ | 599 | |
| Ratio to average net assets: | | | | | | | | | | | | | | | | | | | | | | | | |
| Net expenses | | | 0.76 | % | | | 0.73 | % | | | 0.73 | %(F) | | | 0.75 | % | | | 0.73 | % | | | 0.73 | %(F) |
| Gross expenses | | | 0.88 | % | | | 0.84 | % | | | 0.84 | %(F) | | | 0.77 | % | | | 0.99 | % | | | 2.96 | %(F) |
| Net investment income (loss) | | | 0.07 | % | | | 0.14 | % | | | 0.10 | %(F) | | | (0.07 | %) | | | 0.16 | % | | | (0.18 | %)(F) |
| Portfolio turnover rate | | | 81 | % | | | 94 | %(G)(H) | | | 30 | %(E) | | | 82 | % | | | 61 | % | | | 70 | % |
| (A) | The Fund changed its fiscal year end from November 30 to June 30. |
| (B) | Represents the period from commencement of operations (December 23, 2014) through November 30, 2015. |
| (C) | Less than $0.005 per share. |
| (D) | The net investment income (loss) per share was based on average shares outstanding for the period. |
| (G) | Portfolio turnover excludes the purchases and sales of securities by the Touchstone Small Cap Growth Fund acquired on September 21, 2018 (See Note 9 in the Notes to Financial Statements). If these transactions were included, portfolio turnover would have been higher. |
| (H) | Portfolio turnover excludes securities delivered from processing redemptions-in-kind. |
See accompanying Notes to Financial Statements.
Financial Highlights (Continued)
Touchstone Value Fund—Class A
Selected Data for a Share Outstanding Throughout Each Period
| | | Year Ended June 30, | |
| | | 2020 | | | 2019 | | | 2018 | | | 2017 | | | 2016 | |
| Net asset value at beginning of period | | $ | 9.41 | | | $ | 9.92 | | | $ | 10.13 | | | $ | 8.84 | | | $ | 9.78 | |
| Income (loss) from investment operations: | | | | | | | | | | | | | | | | | | | | |
| Net investment income | | | 0.13 | | | | 0.16 | | | | 0.14 | | | | 0.19 | | | | 0.16 | |
| Net realized and unrealized gains (losses) on investments | | | (0.98 | ) | | | 0.57 | | | | 0.55 | | | | 1.30 | | | | (0.27 | ) |
| Total from investment operations | | | (0.85 | ) | | | 0.73 | | | | 0.69 | | | | 1.49 | | | | (0.11 | ) |
| Distributions from: | | | | | | | | | | | | | | | | | | | | |
| Net investment income | | | (0.12 | ) | | | (0.16 | ) | | | (0.14 | ) | | | (0.18 | ) | | | (0.16 | ) |
| Realized capital gains | | | (0.49 | ) | | | (1.08 | ) | | | (0.76 | ) | | | (0.02 | ) | | | (0.67 | ) |
| Total distributions | | | (0.61 | ) | | | (1.24 | ) | | | (0.90 | ) | | | (0.20 | ) | | | (0.83 | ) |
| Net asset value at end of period | | $ | 7.95 | | | $ | 9.41 | | | $ | 9.92 | | | $ | 10.13 | | | $ | 8.84 | |
| Total return(A) | | | (9.83 | %) | | | 8.53 | % | | | 6.92 | % | | | 16.92 | % | | | (0.89 | %) |
| Ratios and supplemental data: | | | | | | | | | | | | | | | | | | | | |
| Net assets at end of period (000’s) | | $ | 24,567 | | | $ | 32,964 | | | $ | 36,968 | | | $ | 43,607 | | | $ | 47,939 | |
| Ratio to average net assets: | | | | | | | | | | | | | | | | | | | | |
| Net expenses | | | 1.08 | % | | | 1.08 | % | | | 1.08 | % | | | 1.08 | % | | | 1.08 | % |
| Gross expenses | | | 1.26 | % | | | 1.26 | % | | | 1.26 | % | | | 1.24 | % | | | 1.28 | % |
| Net investment income | | | 1.37 | % | | | 1.67 | % | | | 1.42 | % | | | 1.86 | % | | | 1.71 | % |
| Portfolio turnover rate | | | 57 | % | | | 37 | %(B) | | | 24 | % | | | 29 | % | | | 19 | %(C) |
Touchstone Value Fund—Class C
Selected Data for a Share Outstanding Throughout Each Period
| | | Year Ended June 30, | |
| | | 2020 | | | 2019 | | | 2018 | | | 2017 | | | 2016 | |
| Net asset value at beginning of period | | $ | 9.38 | | | $ | 9.89 | | | $ | 10.10 | | | $ | 8.81 | | | $ | 9.75 | |
| Income (loss) from investment operations: | | | | | | | | | | | | | | | | | | | | |
| Net investment income | | | 0.06 | | | | 0.09 | | | | 0.08 | | | | 0.12 | | | | 0.09 | |
| Net realized and unrealized gains (losses) on investments | | | (0.97 | ) | | | 0.56 | | | | 0.54 | | | | 1.29 | | | | (0.27 | ) |
| Total from investment operations | | | (0.91 | ) | | | 0.65 | | | | 0.62 | | | | 1.41 | | | | (0.18 | ) |
| Distributions from: | | | | | | | | | | | | | | | | | | | | |
| Net investment income | | | (0.05 | ) | | | (0.08 | ) | | | (0.07 | ) | | | (0.10 | ) | | | (0.09 | ) |
| Realized capital gains | | | (0.49 | ) | | | (1.08 | ) | | | (0.76 | ) | | | (0.02 | ) | | | (0.67 | ) |
| Total distributions | | | (0.54 | ) | | | (1.16 | ) | | | (0.83 | ) | | | (0.12 | ) | | | (0.76 | ) |
| Net asset value at end of period | | $ | 7.93 | | | $ | 9.38 | | | $ | 9.89 | | | $ | 10.10 | | | $ | 8.81 | |
| Total return(A) | | | (10.49 | %) | | | 7.72 | % | | | 6.12 | % | | | 16.06 | % | | | (1.65 | %) |
| Ratios and supplemental data: | | | | | | | | | | | | | | | | | | | | |
| Net assets at end of period (000’s) | | $ | 2,175 | | | $ | 3,175 | | | $ | 3,654 | | | $ | 4,503 | | | $ | 5,624 | |
| Ratio to average net assets: | | | | | | | | | | | | | | | | | | | | |
| Net expenses | | | 1.83 | % | | | 1.83 | % | | | 1.83 | % | | | 1.83 | % | | | 1.83 | % |
| Gross expenses | | | 2.43 | % | | | 2.35 | % | | | 2.21 | % | | | 2.12 | % | | | 2.16 | % |
| Net investment income | | | 0.62 | % | | | 0.92 | % | | | 0.68 | % | | | 1.11 | % | | | 0.96 | % |
| Portfolio turnover rate | | | 57 | % | | | 37 | %(B) | | | 24 | % | | | 29 | % | | | 19 | %(C) |
| | (A) | Total returns shown exclude the effect of applicable sales loads and fees. If these charges were included, the returns would be lower. |
| | (B) | Portfolio turnover excludes securities delivered from processing redemptions-in-kind. |
| | (C) | Portfolio turnover excludes securities received from processing a subscription-in-kind. |
See accompanying Notes to Financial Statements.
Financial Highlights (Continued)
Touchstone Value Fund—Class Y
Selected Data for a Share Outstanding Throughout Each Period
| | | Year Ended June 30, | |
| | | 2020 | | | 2019 | | | 2018 | | | 2017 | | | 2016 | |
| Net asset value at beginning of period | | $ | 9.45 | | | $ | 9.96 | | | $ | 10.17 | | | $ | 8.87 | | | $ | 9.81 | |
| Income (loss) from investment operations: | | | | | | | | | | | | | | | | | | | | |
| Net investment income | | | 0.15 | | | | 0.19 | | | | 0.17 | | | | 0.20 | | | | 0.18 | |
| Net realized and unrealized gains (losses) on investments | | | (0.98 | ) | | | 0.57 | | | | 0.55 | | | | 1.32 | | | | (0.27 | ) |
| Total from investment operations | | | (0.83 | ) | | | 0.76 | | | | 0.72 | | | | 1.52 | | | | (0.09 | ) |
| Distributions from: | | | | | | | | | | | | | | | | | | | | |
| Net investment income | | | (0.15 | ) | | | (0.19 | ) | | | (0.17 | ) | | | (0.20 | ) | | | (0.18 | ) |
| Realized capital gains | | | (0.49 | ) | | | (1.08 | ) | | | (0.76 | ) | | | (0.02 | ) | | | (0.67 | ) |
| Total distributions | | | (0.64 | ) | | | (1.27 | ) | | | (0.93 | ) | | | (0.22 | ) | | | (0.85 | ) |
| Net asset value at end of period | | $ | 7.98 | | | $ | 9.45 | | | $ | 9.96 | | | $ | 10.17 | | | $ | 8.87 | |
| Total return | | | (9.64 | %) | | | 8.82 | % | | | 7.19 | % | | | 17.28 | % | | | (0.64 | %) |
| Ratios and supplemental data: | | | | | | | | | | | | | | | | | | | | |
| Net assets at end of period (000’s) | | $ | 75,028 | | | $ | 92,928 | | | $ | 81,988 | | | $ | 83,974 | | | $ | 76,852 | |
| Ratio to average net assets: | | | | | | | | | | | | | | | | | | | | |
| Net expenses | | | 0.80 | % | | | 0.79 | % | | | 0.81 | % | | | 0.83 | % | | | 0.83 | % |
| Gross expenses | | | 0.96 | % | | | 0.94 | % | | | 0.95 | % | | | 0.97 | % | | | 0.99 | % |
| Net investment income | | | 1.64 | % | | | 1.96 | % | | | 1.70 | % | | | 2.11 | % | | | 1.96 | % |
| Portfolio turnover rate | | | 57 | % | | | 37 | %(A) | | | 24 | % | | | 29 | % | | | 19 | %(B) |
Touchstone Value Fund—Institutional Class
Selected Data for a Share Outstanding Throughout Each Period
| | | Year Ended June 30, | |
| | | 2020 | | | 2019 | | | 2018 | | | 2017 | | | 2016 | |
| Net asset value at beginning of period | | $ | 9.42 | | | $ | 9.93 | | | $ | 10.14 | | | $ | 8.85 | | | $ | 9.79 | |
| Income (loss) from investment operations: | | | | | | | | | | | | | | | | | | | | |
| Net investment income | | | 0.16 | | | | 0.20 | | | | 0.19 | | | | 0.22 | | | | 0.19 | |
| Net realized and unrealized gains (losses) on investments | | | (0.97 | ) | | | 0.57 | | | | 0.55 | | | | 1.31 | | | | (0.27 | ) |
| Total from investment operations | | | (0.81 | ) | | | 0.77 | | | | 0.74 | | | | 1.53 | | | | (0.08 | ) |
| Distributions from: | | | | | | | | | | | | | | | | | | | | |
| Net investment income | | | (0.16 | ) | | | (0.20 | ) | | | (0.19 | ) | | | (0.22 | ) | | | (0.19 | ) |
| Realized capital gains | | | (0.49 | ) | | | (1.08 | ) | | | (0.76 | ) | | | (0.02 | ) | | | (0.67 | ) |
| Total distributions | | | (0.65 | ) | | | (1.28 | ) | | | (0.95 | ) | | | (0.24 | ) | | | (0.86 | ) |
| Net asset value at end of period | | $ | 7.96 | | | $ | 9.42 | | | $ | 9.93 | | | $ | 10.14 | | | $ | 8.85 | |
| Total return | | | (9.43 | %) | | | 8.96 | % | | | 7.34 | % | | | 17.38 | % | | | (0.49 | %) |
| Ratios and supplemental data: | | | | | | | | | | | | | | | | | | | | |
| Net assets at end of period (000’s) | | $ | 153,945 | | | $ | 208,686 | | | $ | 262,467 | | | $ | 249,035 | | | $ | 219,824 | |
| Ratio to average net assets: | | | | | | | | | | | | | | | | | | | | |
| Net expenses | | | 0.68 | % | | | 0.68 | % | | | 0.68 | % | | | 0.68 | % | | | 0.68 | % |
| Gross expenses | | | 0.90 | % | | | 0.89 | % | | | 0.87 | % | | | 0.86 | % | | | 0.87 | % |
| Net investment income | | | 1.77 | % | | | 2.07 | % | | | 1.82 | % | | | 2.26 | % | | | 2.11 | % |
| Portfolio turnover rate | | | 57 | % | | | 37 | %(A) | | | 24 | % | | | 29 | % | | | 19 | %(B) |
| (A) | Portfolio turnover excludes securities delivered from processing redemptions-in-kind. |
| (B) | Portfolio turnover excludes securities received from processing a subscription-in-kind. |
See accompanying Notes to Financial Statements.
Notes to Financial Statements
June 30, 2020
1.Organization
The Touchstone Strategic Trust (the “Trust”) is registered under the Investment Company Act of 1940, as amended (the “1940 Act”), as an open-end management investment company. The Trust was established as a Massachusetts business trust pursuant to a Agreement and Declaration of Trust dated November 18, 1982. The Trust consists of nineteen funds, including the following ten funds (individually, a “Fund”, and collectively, the “Funds”):
Touchstone Balanced Fund (“Balanced Fund”)
Touchstone International Equity Fund (“International Equity Fund”)
Touchstone International Growth Opportunities Fund (“International Growth Opportunities Fund”)
Touchstone International Small Cap Fund (“International Small Cap Fund”)
Touchstone Large Cap Focused Fund (“Large Cap Focused Fund”)
Touchstone Large Cap Fund (“Large Cap Fund”)
Touchstone Large Company Growth Fund (“Large Company Growth Fund”)
Touchstone Ohio Tax-Free Bond Fund (“Ohio Tax-Free Bond Fund”)
Touchstone Small Company Fund (“Small Company Fund”)
Touchstone Value Fund (“Value Fund”)
Each Fund is diversified, with the exception of the International Growth Opportunities Fund, the Large Cap Focused Fund, the Large Cap Fund, the Large Company Growth Fund and the Ohio Tax-Free Bond Fund, which are non-diversified.
The Agreement and Declaration of Trust permits the Trust to issue an unlimited number of shares of beneficial interest of each Fund. The table below indicates the classes of shares that each Fund is registered to offer:
| | Class A | Class C | Class Y | Institutional Class | Class R6 |
| Balanced Fund | X | X | X | | |
| International Equity Fund | X | X | X | X | |
| International Growth Opportunities Fund | X | X | X | X | |
| International Small Cap Fund | X | X | X | X | |
| Large Cap Focused Fund | X | X | X | X | |
| Large Cap Fund | X | X | X | X | |
| Large Company Growth Fund | X | X | X | X | |
| Ohio Tax-Free Bond Fund | X | X | X | X | |
| Small Company Fund | X | X | X | X | X |
| Value Fund | X | X | X | X | |
The assets of each Fund are segregated, and a shareholder’s interest is limited to the Fund in which shares are held. The Funds’ prospectus provides a description of each Fund’s investment goal, policies, and strategies along with information on the classes of shares currently being offered.
2. Significant Accounting Policies
The following is a summary of the Funds’ significant accounting policies:
Each Fund is an investment company that follows the accounting and reporting guidance of Accounting Standards Codification Topic 946 applicable to investment companies.
Security valuation and fair value measurements — U.S. generally accepted accounting principles (“U.S. GAAP”) defines fair value as the price the Funds would receive to sell an asset or pay to transfer a liability in an orderly transaction between market participants at the measurement date. All investments in securities are recorded at their fair value. The Funds define the term “market value”, as used throughout this report, as the estimated fair value. The Funds use various methods to measure fair value of their portfolio securities on a recurring basis. U.S. GAAP fair value measurement standards require disclosure of a hierarchy that prioritizes inputs to valuation methods. These inputs are summarized in the three broad levels listed below:
| | · | Level 1 – quoted prices in active markets for identical securities |
| | · | Level 2 – other significant observable inputs (including quoted prices for similar securities, interest rates, prepayment speeds, credit risk, etc.) |
| | · | Level 3 – significant unobservable inputs (including a Fund’s own assumptions in determining the fair value of investments) |
The inputs or methodology used for valuing securities are not necessarily an indication of the risk associated with investing in those securities.
Notes to Financial Statements (Continued)
The aggregate value by input level, as of June 30, 2020, for each Fund’s investments, is included in each Fund’s Portfolio of Investments, which also includes a breakdown of the Fund’s investments by geographic, portfolio or sector allocation. The Funds did not hold or transfer any Level 3 categorized securities during the year ended June 30, 2020.
Changes in valuation techniques may result in transfers into or out of an investment’s assigned level within the hierarchy.
The Funds’ portfolio securities are valued as of the close of the regular session of trading on the New York Stock Exchange (“NYSE”) (currently 4:00 p.m., Eastern Time or at the time as of which the NYSE establishes official closing prices). Portfolio securities traded on stock exchanges are valued at the last reported sale price, official close price, or last bid price if no sales are reported. Portfolio securities quoted by NASDAQ are valued at the NASDAQ Official Closing Price (“NOCP”) or from the primary exchange on which the security trades. To the extent these securities are actively traded, they are categorized in Level 1 of the fair value hierarchy. Options and futures are valued at the last quoted sales price. If there is no such reported sale on the valuation date, long option positions are valued at the most recent bid price, and short option positions are valued at the most recent ask price on the valuation date and are categorized in Level 1.Shares of mutual funds in which the Funds invest are valued at their respective net asset value (“NAV”) as reported by the underlying funds and are categorized in Level 1.
Debt securities held by the Funds are valued at their evaluated bid by an independent pricing service or at their last broker-quoted bid prices as obtained from one or more of the major market makers for such securities. Independent pricing services use information provided by market makers or estimates of market values through accepted market modeling conventions. Observable inputs to the models may include prepayment speeds, pricing spread, yield, trade information, dealer quotes, market color, cash flow models, the securities’ terms and conditions, among others, and are generally categorized in Level 2. Investments in asset-backed and mortgage-backed securities are valued by independent pricing services using models that consider estimated cash flows of each tranche of the security, establish a benchmark yield and develop an estimated tranche specific spread to the benchmark yield based on the unique attributes of the tranche, and are generally categorized in Level 2. Debt securities with remaining maturities of 60 days or less may be valued at amortized cost, provided such amount approximates market value and are categorized in Level 2. While this method provides consistency in valuation (and may only be used if it approximates market value), it may result in periods during which fair value, as determined by amortized cost, is higher or lower than the price that would be received if the Fund sold the investment.
Securities mainly traded on a non-U.S. exchange or denominated in foreign currencies are generally valued according to the preceding closing values on that exchange, translated to U.S. dollars using currency exchange rates as of the close of regular trading on the NYSE, and are generally categorized in Level 1. However, if an event that may change the value of a security occurs after the time that the closing value on the non-U.S. exchange was determined, but before the close of regular trading on the NYSE, the security may be priced based on fair value and is generally categorized in Level 2. This may cause the value of the security, if held on the books of a Fund, to be different from the closing value on the non-U.S. exchange and may affect the calculation of that Fund’s NAV. The Funds may use fair value pricing under the following circumstances, among others:
| · | If the value of a security has been materially affected by events occurring before the Funds’ pricing time but after the close of the primary markets on which the security is traded. |
| · | If the exchange on which a portfolio security is principally traded closes early or if trading in a particular portfolio security was halted during the day and did not resume prior to the Funds’ NAV calculation. |
| · | If a security is so thinly traded that reliable market quotations are unavailable due to infrequent trading. |
| · | If the validity of market quotations is not reliable. |
Securities held by the Funds that do not have readily available market quotations, significant observable inputs, or securities for which the available market quotations are not reliable, are priced at their estimated fair value using procedures approved by the Board and are generally categorized in Level 3.
Collateralized Loan Obligations — The Balanced Fund may invest in collateralized loan obligations (“CLOs”). CLOs are types of asset-backed securities. A CLO is an entity that is backed by syndicated bank loans. The cash flows of the CLO can be split into multiple segments, called “tranches,” which will vary in risk profile and yield. The riskiest segment is the subordinated or “equity” tranche. This tranche bears the greatest risk of defaults from the underlying assets in the CLO and serves to protect the other, more senior, tranches from default in all but the most severe circumstances. Since it is shielded from defaults by the more junior tranches, a “senior” tranche will typically have higher credit ratings and lower yields than their underlying securities, and often receive higher ratings from one or more of the nationally recognized rating agencies. Despite the protection from the more junior tranches, senior tranches can experience substantial losses due to actual defaults, increased sensitivity to future defaults and the disappearance of one or more protecting tranches as a result of changes in the credit profile of the underlying pool of assets.
Investment companies — The Funds may invest in securities of other investment companies, including exchange-traded funds (“ETFs”), open-end funds and closed-end funds. Open-end funds are investment companies that issue new shares continuously and redeem shares daily. Closed-end funds are investment companies that typically issue a fixed number of shares that trade on a securities exchange or over-the-counter (“OTC”). An ETF is an investment company that typically seeks to track the performance of an index by holding in its portfolio shares of all the companies, or a representative sample of the companies, that are components
Notes to Financial Statements (Continued)
of a particular index. ETF shares are traded on a securities exchange based on their market value. The risks of investment in other investment companies typically reflect the risks of the types of securities in which the other investment companies invest. Investments in ETFs and closed-end funds are subject to the additional risk that their shares may trade at a premium or discount to their NAV. When a Fund invests in another investment company, shareholders of the Fund indirectly bear their proportionate share of the other investment company’s fees and expenses, including operating, registration, trustee, licensing and marketing, as well as their share of the Fund’s fees and expenses.
Futures Contracts — The Balanced Fund may buy and sell futures contracts and related options to manage its exposure to changing interest rates and securities prices. Some strategies reduce the Fund’s exposure to price fluctuations, while others tend to increase its market exposure. Futures and options on futures can be volatile instruments and involve certain risks that could negatively impact the Fund’s return. In order to avoid leveraging and related risks, when the Fund purchases futures contracts, it will collateralize its position by depositing an amount of cash or liquid securities, equal to the market value of the futures positions held, less margin deposits, in a segregated account with its custodian or otherwise “cover” its position in a manner consistent with the 1940 Act, or the rules of the Securities and Exchange Commission (the “SEC”) or interpretations thereunder. Collateral equal to the current fair value of the futures position will be determined on a daily basis.
When the contract is closed, the Fund records a realized gain or loss equal to the difference between the proceeds from (or cost of) the closing transactions and the Fund’s basis in the contract. Risks of entering into futures contracts include the possibility that a change in the value of the contract may not correlate with the changes in the value of the underlying instruments. Second, it is possible that a lack of liquidity for futures contracts could exist in the secondary market resulting in an inability to close a futures position prior to its maturity date. Third, the purchase of a futures contract involves the risk that the Fund could lose more than the original margin deposit required to initiate the futures transaction. Finally, the risk exists that losses could exceed amounts disclosed on the Statements of Assets and Liabilities. There is minimal counterparty credit risk involved in entering into futures contracts since they are exchange-traded instruments and the exchange’s clearinghouse, as counterparty to all exchange-traded futures, guarantees the futures against default.
As of June 30, 2020, the Balanced Fund held futures contracts as shown on the Portfolio of Investments and had cash in the amount of $127,016 held as collateral to cover futures contracts.
Foreign currency translation — The books and records of the Funds are maintained in U.S. dollars and translated into U.S. dollars on the following basis:
| (1) | market value of investment securities, assets and liabilities at the current rate of exchange on the valuation date; and |
| (2) | purchases and sales of investment securities, income, and expenses at the relevant rates of exchange prevailing on the respective date of such transactions. |
The Funds do not isolate that portion of gains and losses on investments in equity securities that is due to changes in the foreign exchange rates from that which is due to changes in market prices of equity securities.
Real Estate Investment Trusts — The Funds may invest in real estate investment trusts (“REITs”) that involve risks not associated with investing in stocks. Risks associated with investments in REITs include declines in the value of real estate, general and economic conditions, changes in the value of the underlying property and defaults by borrowers. The value of assets in the real estate industry may go through cycles of relative underperformance and outperformance in comparison to equity securities markets in general. Dividend income is recorded using management’s estimate of the income included in distributions received from REIT investments. The actual amounts of income, return of capital and capital gains are only determined by each REIT after its fiscal year-end and may differ from the estimated amount. Estimates of income are adjusted in the Funds to the actual amounts when the amounts are determined.
Derivative instruments and hedging activities — The Balanced Fund may enter into an International Swaps and Derivatives Association, Inc. Master Agreement (“ISDA Master Agreement” or “MNA”) or similar agreement with certain counterparties. An ISDA Master Agreement is a bilateral agreement between a Fund and a counterparty that governs OTC derivatives and foreign exchange contracts, and typically contains, among other things, collateral posting terms and master netting provisions in the event of a default or termination. Under an ISDA Master Agreement, a party may, under certain circumstances, offset with the counterparty certain derivative financial instruments’ payables or receivables with collateral held or posted and create one single net payment. The provisions of the ISDA Master Agreement typically permit a single net payment in the event of default (close-out netting). These default events include bankruptcy or insolvency of the counterparty. Note, however, that bankruptcy or insolvency laws of a particular jurisdiction may impose restrictions on or prohibitions against the right of offset.
When entering into a derivative transaction, a Fund may be required to post and maintain collateral or margin (including both initial and maintenance margin). Collateral and margin requirements differ by type of derivative. Margin requirements are established by the broker or clearing house for exchange-traded and centrally cleared derivatives (financial futures contracts, options, and centrally cleared swaps). Brokers can ask for margining in excess of the clearing house’s minimum in certain circumstances. Collateral terms
Notes to Financial Statements (Continued)
are contract specific for OTC derivatives (forward foreign currency contracts, options, and swaps). For derivatives traded under an ISDA Master Agreement, the collateral requirements are typically calculated by netting the marked-to-market amount for each transaction under such agreement and comparing that amount to the value of any collateral currently pledged by the Fund and the counterparty. For financial reporting purposes, cash collateral that has been pledged to cover obligations of the Fund and cash collateral received from the counterparty, if any, are reported separately on the Statements of Assets and Liabilities as cash deposits held at prime broker and due to prime broker, respectively. Non-cash collateral pledged by the Fund, if any, is noted in the Portfolio of Investments. To the extent amounts due to the Fund from its counterparties are not fully collateralized, contractually or otherwise, the Fund bears the risk of loss from counterparty non-performance.
Certain ISDA Master Agreements allow counterparties to OTC derivatives transactions to terminate derivative contracts prior to maturity in the event the Funds’ net assets decline by a stated percentage or the Fund fails to meet the terms of its ISDA Master Agreement, which would cause the Fund (counterparty) to accelerate payment of any net liability owed to the counterparty (Fund).
For financial reporting purposes, the Balanced Fund does not offset derivative assets and derivative liabilities that are subject to netting arrangements in the Statements of Assets and Liabilities.
As of June 30, 2020, the Balanced Fund did not hold any assets and liabilities that were subject to a MNA.
The following table sets forth the fair value of the Balanced Fund derivative financial instruments by primary risk exposure as of June 30, 2020:
| | | Derivatives not accounted for as hedging | | Asset | | | Liability | |
| Fund | | instruments under ASC 815 | | | Derivatives | | | | Derivatives | |
| Balanced Fund | | Futures Contracts – Interest Rate Contracts* | | $ | 27,555 | | | $ | 8,625 | |
* Statements of Assets and Liabilities Location: Receivable and Payable for variation margin on futures contracts. Only current day’s variation margin is reported within the payable/receivable on the Statement of Assets and Liabilities. Includes cumulative appreciation/(depreciation) on futures contracts as reported on the Portfolio of Investments and within the components of net assets section of the Statement of Assets and Liabilities.
The following table sets forth the effect of the Balanced Fund derivative financial instruments by primary risk exposure on the Statements of Operations for the year ended June 30, 2020:
| | | | | | | | Change in | |
| | | | | | | | Unrealized | |
| | | | | Realized Gain | | | Appreciation | |
| | | Derivatives not accounted for as hedging | | (Loss) | | | (Depreciation) | |
| Fund | | instruments under ASC 815 | | on Derivatives | | | on Derivatives | |
| Balanced Fund | | Futures - Interest Rate Contracts* | | $ | (340,462 | ) | | $ | 18,930 | |
* Statements of Operations Location: Net realized losses on futures contracts and Net change in unrealized appreciation (depreciation) on futures contracts, respectively.
For the year ended June 30, 2020, the average quarterly balances of outstanding derivative financial instruments were as follows:
| | | Balanced Fund | |
| Interest rate contracts: | | | |
| Futures Contracts - Notional value | | $ | 4,148,078 | |
Portfolio securities loaned — The Funds may lend their portfolio securities. Lending portfolio securities exposes the Funds to the risk that the borrower may fail to return the loaned securities or may not be able to provide additional collateral or that the Funds may experience delays in recovery of the loaned securities or loss of rights in the collateral if the borrower fails financially. To minimize these risks, the borrower must agree to maintain cash collateral with the Funds’ custodian. The loaned securities are secured by collateral valued at least equal, at all times, to the market value of the loaned securities plus accrued interest, if any. When the collateral falls below specified amounts, the lending agent will use its best effort to obtain additional collateral on the next business day to meet required amounts under the security lending agreement. The cash collateral is reinvested by the Funds’ custodian into an approved short-term investment vehicle. The approved short-term investment vehicle is subject to market risk.
As of June 30, 2020, the following Funds loaned securities and received collateral as follows:
| | | | | Market Value of | | | Market Value of | | | | |
| Fund | | Security Type | | Securities Loaned* | | | Collateral Received** | | | Net Amount*** | |
| International Equity Fund | | Common Stocks | | $ | 7,818,356 | | | $ | 8,134,603 | | | $ | 316,247 | |
| Large Cap Focused Fund | | Exchange-Traded Fund | | | 10,174,385 | | | | 10,626,001 | | | | 451,616 | |
Notes to Financial Statements (Continued)
* The remaining contractual maturity is overnight for all securities.
** Gross amount of recognized liabilities for securities lending included in the Statements of Assets and Liabilities.
*** Net amount represents the net amount payable due to the borrower in the event of default.
All cash collateral is received, held, and administered by the Funds’ custodian for the benefit of the lending Fund in its custody account or other account established for the purpose of holding collateral in cash equivalents.
Funds participating in securities lending receive compensation in the form of fees. Securities lending income is derived from lending long securities from the Funds to creditworthy approved borrowers at rates that are determined based on trading volumes, float, short-term interest rates and market liquidity and is shown net of fees on the Statements of Operations. When a Fund lends securities, it retains the interest or dividends on the investment of any cash received as collateral, and the Fund continues to receive interest or dividends on the loaned securities.
Unrealized gain or loss on the market value of the loaned securities that may occur during the term of the loan is recognized by the Fund. The Fund has the right under the lending agreement to recover any loaned securities from the borrower on demand.
When-issued or delayed delivery transactions — Each Fund may purchase or sell securities on a when-issued or delayed delivery basis. These transactions involve a commitment by the Fund to purchase or sell securities for a predetermined price or yield, with payment and delivery taking place beyond the customary settlement period. When delayed delivery purchases are outstanding, the Fund will set aside liquid assets in an amount sufficient to meet the purchase price. When purchasing a security on a delayed delivery basis, the Fund assumes the rights and risks of ownership of the security, including the risk of price and yield fluctuations, and takes such fluctuations into account when determining NAV. The Fund may dispose of or renegotiate a delayed delivery transaction after it is entered into, and may sell when-issued securities before they are delivered, which may result in a capital gain or loss. When the Fund has sold a security on a delayed delivery basis, the Fund does not participate in future gains and losses with respect to the security.
Share valuation — The NAV per share of each class of shares of each Fund is calculated daily by dividing the total value of a Fund’s assets attributable to that class, less liabilities attributable to that class, by the number of outstanding shares of that class.
The maximum offering price per share of Class A shares of the equity funds (all of the Funds except the Ohio Tax-Free Bond Fund) is equal to the NAV per share plus a sales load equal to 5.26% of the NAV (or 5.00% of the offering price). Effective June 30, 2020, the maximum offering price per share of Class A shares of the fixed income fund (the Ohio Tax-Free Bond Fund) is equal to the NAV per share plus a sales load equal to 3.36% of the NAV (or 3.25% of the offering price). Prior to June 30, 2020 the maximum offering price per share of Class A shares of the fixed income fund was equal to the NAV per share plus a sales load equal to 2.04% of the NAV (or 2.00% of the offering price). There is no sales load on fund purchases of Class A shares when aggregate purchases in all Touchstone funds equal the maximum breakpoint which is at least $1 million for equity funds or $500,000 for fixed income funds. The maximum offering price per share of Classes C, Y, Institutional Class and R6 shares of the Funds is equal to the NAV per share.
The redemption price per share of each class of shares of the Funds is generally equal to the NAV per share. However, Class A redemptions that were part of a no-load purchase due to the aggregate purchase amount in all Touchstone Funds equaling at least the maximum breakpoint where a Finder’s Fee was paid may be subject to a contingent deferred sales charge (“CDSC”) of up to 1.00% or 0.50% for equity or fixed income funds, respectively, if redeemed within a one-year period from the date of purchase. Additionally, purchases of Class C shares of the Funds are subject to a CDSC of 1.00% if redeemed within a one-year period from the date of purchase. The CDSC will be assessed on an amount equal to the lesser of (1) the NAV at the time of purchase of the shares being redeemed or (2) the NAV of such shares being redeemed.
Investment income — Dividend income from securities is recognized on the ex-dividend date, net of foreign withholding taxes, if any, which are reduced by any amounts reclaimable by the Funds, where applicable. Interest income from securities is recorded on the basis of interest accrued, premium amortized and discount accreted. Realized gains and losses resulting from principal paydowns on mortgage-backed and asset-backed securities are included in interest income. Market discounts, original issue discounts and market premiums on debt securities are accreted/amortized to interest income over the life of the security or to the appropriate call date, as applicable, with a corresponding adjustment in the cost basis of that security. In addition, it is the Funds’ policy to accrue for foreign capital gains taxes, if applicable, on certain foreign securities held by the Funds. An estimated foreign capital gains tax is recorded daily on net unrealized gains on these securities and is payable upon the sale of such securities when a gain is realized.
Distributions to shareholders — Each Fund intends to distribute to its shareholders substantially all of its income and capital gains. Each Fund, except the Balanced Fund, Ohio Tax-Free Bond Fund and the Value Fund, declares and distributes net investment income, if any, annually, as a dividend to shareholders. The Balanced Fund and Value Fund declare and distribute net investment income, if any, quarterly as a dividend to shareholders. The Ohio Tax-Free Bond Fund declares distributions from net investment income on a daily basis and distributes as a dividend to shareholders on a monthly basis. Each Fund makes distributions of capital gains, if any, at least annually, net of applicable capital loss carryforwards. Income distributions and capital gain distributions are
Notes to Financial Statements (Continued)
determined in accordance with income tax regulations. Recognition of the Funds’ net investment income from investments in underlying funds is affected by the timing of dividend declarations by the underlying funds.
Allocations — Investment income earned, realized capital gains and losses, and unrealized appreciation and depreciation for a Fund are allocated daily to each class of shares based upon its proportionate share of total net assets of the Fund. Class-specific expenses are charged directly to the class incurring the expense. Common expenses, which are not attributable to a specific class, are allocated daily to each class of shares based upon their proportionate share of total net assets of the Fund. Expenses not directly billed to a Fund are allocated proportionally among all Funds in the Trust, and, if applicable, Touchstone Funds Group Trust, Touchstone Institutional Funds Trust, and Touchstone Variable Series Trust (collectively with the Trust, “Touchstone Fund Complex”), daily in relation to net assets of each Fund or another reasonable measure.
Security transactions — Security transactions are reflected for financial reporting purposes as of the trade date. Realized gains and losses on sales of portfolio securities are calculated using the identified cost basis.
Estimates — The preparation of financial statements in conformity with U.S. GAAP requires management to make estimates and assumptions that affect the reported amounts of assets and liabilities and disclosure of contingent assets and liabilities at the date of the financial statements and the reported amounts of income and expenses during the reporting period. Actual results could differ from those estimates.
LIBOR Transition — Many debt securities, derivatives and other financial instruments in which the Funds may invest, as well as any borrowings made by the Funds from banks or from other lenders, utilize the London Interbank Offered Rate (“LIBOR”) as the reference or benchmark index for interest rate calculations. LIBOR is a measure of the average interest rate at which major global banks can borrow from one another. Plans are underway to phase out the use of LIBOR by the end of 2021. Before then, it is expected that market participants will transition to the use of different reference or benchmark indices. However, there is currently no definitive information regarding the future utilization of LIBOR or of any particular replacement index. As such, the potential effect of a transition away from LIBOR on the Funds’ investments cannot yet be determined.
3. Investment Transactions
Investment transactions (excluding short-term investments and U.S. Government securities) were as follows for the year ended June 30, 2020:
| | | | | | | | | International | | | | | | | |
| | | | | | International | | | Growth | | | International | | | Large Cap | |
| | | Balanced | | | Equity | | | Opportunities | | | Small Cap | | | Focused | |
| | | Fund | | | Fund | | | Fund | | | Fund | | | Fund* | |
| Purchases of investment securities | | $ | 130,621,068 | | | $ | 56,497,754 | | | $ | 24,138,729 | | | $ | 138,482,865 | | | $ | 477,002,381 | |
| Proceeds from sales and maturities | | $ | 100,096,159 | | | $ | 83,568,611 | | | $ | 28,351,852 | | | $ | 237,959,918 | | | $ | 517,922,725 | |
| | | | | | Large | | | Ohio | | | | | | | |
| | | | | | Company | | | Tax-Free | | | Small | | | | |
| | | Large Cap | | | Growth | | | Bond | | | Company | | | Value | |
| | | Fund | | | Fund | | | Fund | | | Fund | | | Fund | |
| Purchases of investment securities | | $ | 56,499,799 | | | $ | 61,728,508 | | | $ | 17,971,344 | | | $ | 685,801,061 | | | $ | 171,442,617 | |
| Proceeds from sales and maturities | | $ | 77,830,440 | | | $ | 105,735,247 | | | $ | 15,971,191 | | | $ | 975,590,648 | | | $ | 222,516,014 | |
*Large Cap Focused Fund had redemptions-in-kind which resulted in redemptions out of the Fund of $206,747,919. The redemptions were comprised of securities and cash in the amount of $185,676,263, which is excluded from the proceeds from sales and maturities, and $21,071,656, respectively.
For the year ended June 30, 2020, purchases and proceeds from sales and maturities in U.S. Government Securities were $356,736,359 and $370,413,366, respectively, for the Balanced Fund. There were no purchases or proceeds from sales and maturities of U.S. Government securities by the other Funds for the year ended June 30, 2020.
4. Transactions with Affiliates and Other Related Parties
Certain officers of the Trust are also officers of Touchstone Advisors, Inc. (the “Advisor”), Touchstone Securities, Inc. (the “Underwriter”), or The Bank of New York Mellon (“BNY Mellon”), the Sub-Administrator to the Funds. Such officers receive no compensation from the Trust. The Advisor and the Underwriter are each wholly-owned subsidiaries of Western & Southern Financial Group, Inc. (“Western & Southern”).
On behalf of the Funds, the Advisor pays each Independent Trustee a quarterly retainer plus additional retainers to the Lead Independent Trustee and the chairs of each standing committee. Interested Trustees do not receive compensation from the Funds. Each Independent Trustee also receives compensation for each Board meeting and committee meeting attended. Each standing committee chair receives additional compensation for each committee meeting that he or she oversees. The Advisor is reimbursed by the Funds for the Independent
Notes to Financial Statements (Continued)
Trustees’ compensation and out-of-pocket expenses relating to their services. The Funds accrued Trustee-related expenses of $235,370 for the year ended June 30, 2020.
MANAGEMENT & EXPENSE LIMITATION AGREEMENTS
The Advisor provides general investment supervisory services for the Funds, under the terms of an advisory agreement (the “Advisory Agreement”). Under the Advisory Agreement, each Fund pays the Advisor a fee, which is computed and accrued daily and paid monthly, at an annual rate based on average daily net assets of each Fund as shown in the table below.
| Balanced Fund | 0.55% on the first $200 million |
| | 0.50% on the next $200 million |
| | 0.45% on the next $600 million |
| | 0.40% on the next $1 billion |
| | 0.35% on such assets over $2 billion |
| International Equity Fund | 0.70% on the first $500 million |
| | 0.65% on the next $300 million |
| | 0.60% on the next $200 million |
| | 0.50% on the next $1 billion |
| | 0.40% on such assets over $2 billion |
| International Growth Opportunities Fund | 0.80% |
| International Small Cap Fund | 0.95% on the first $300 million |
| | 0.90% on the next $200 million |
| | 0.85% on the next $250 million |
| | 0.80% on the next $250 million |
| | 0.75% on the next $500 million |
| | 0.70% on the next $500 million |
| | 0.65% on such assets over $2 billion |
| Large Cap Focused Fund | 0.70% on the first $500 million |
| | 0.65% on the next $300 million |
| | 0.60% on the next $200 million |
| | 0.50% on the next $1 billion |
| | 0.40% on such assets over $2 billion |
| Large Cap Fund | 0.60% on the first $500 million |
| | 0.54% on the next $500 million |
| | 0.50% on such assets over $1 billion |
| Large Company Growth Fund* | 0.60% |
| Ohio Tax-Free Bond Fund | 0.50% on the first $100 million |
| | 0.45% on the next $100 million |
| | 0.40% on the next $100 million |
| | 0.375% on such assets over $300 million |
| Small Company Fund | 0.70% on the first $500 million |
| | 0.65% on the next $300 million |
| | 0.60% on the next $200 million |
| | 0.50% on the next $1 billion |
| | 0.40% on such assets over $2 billion |
| Value Fund | 0.65% |
* Prior to September 1, 2019, the Fund paid 0.75% on the first $500 million, 0.725% on the next $1.5 billion and 0.70% on such assets over $2 billion.
| The Advisor has entered into investment sub-advisory agreements with the following parties (each, a “Sub-Advisor”): |
| |
| Barrow, Hanley, Mewhinney & Strauss, LLC | London Company of Virginia d/b/a The London Company |
| Value Fund | Large Cap Fund |
| Russell Investments Implementation Services, LLC* | Fort Washington Investment Advisors, Inc.** |
| International Small Cap Fund | Balanced Fund |
| DSM Capital Partners LLC | International Equity Fund |
| International Growth Opportunities Fund | Large Cap Focused Fund |
Notes to Financial Statements (Continued)
| Large Company Growth Fund | Ohio Tax-Free Bond Fund |
| | Small Company Fund |
*Effective May 22, 2020, Russell Investments Implementation Services, LLC became the interim sub-advisor of the International Small Cap Fund until September 11, 2020. Prior to May 22, 2020, Copper Rock Capital Partners LLC was the sub-advisor. Please see Note 10 for information regarding this change.
**Affiliate of the Advisor and wholly-owned subsidiary of Western & Southern.
The Advisor pays sub-advisory fees to each Sub-Advisor from its advisory fee.
The Advisor entered into an expense limitation agreement (the “Expense Limitation Agreement”) to contractually limit the annual operating expenses of the Funds, excluding: dividend and interest expenses relating to short sales; interest; taxes; brokerage commissions and other transaction costs; portfolio transaction and investment related expenses, including expenses associated with the Funds’ liquidity providers; other expenditures which are capitalized in accordance with U.S. GAAP; the cost of “Acquired Fund Fees and Expenses”, if any; and other extraordinary expenses not incurred in the ordinary course of business. The maximum annual operating expense limit in any year with respect to the Funds is based on a percentage of the average daily net assets of the Funds. The Advisor has agreed to waive a portion of its fees, and to reimburse certain fund expenses in order to maintain the following expense limitations for the Funds:
| | | | | | | | | | | | Institutional | | | | |
| | | Class A | | | Class C | | | Class Y | | | Class | | | Class R6 | |
| Balanced Fund | | | 1.01 | % | | | 1.78 | % | | | 0.81 | % | | | — | | | | — | |
| International Equity Fund | | | 1.36 | % | | | 2.49 | % | | | 0.99 | % | | | 0.89 | % | | | — | |
| International Growth Opportunities Fund | | | 1.24 | % | | | 1.99 | % | | | 0.99 | % | | | 0.89 | % | | | — | |
| International Small Cap Fund | | | 1.55 | % | | | 2.30 | % | | | 1.30 | % | | | 1.18 | % | | | — | |
| Large Cap Focused Fund* | | | 1.00 | % | | | 1.79 | % | | | 0.72 | % | | | 0.69 | % | | | — | |
| Large Cap Fund | | | 1.03 | % | | | 1.78 | % | | | 0.78 | % | | | 0.68 | % | | | — | |
| Large Company Growth Fund** | | | 1.04 | % | | | 1.79 | % | | | 0.79 | % | | | 0.69 | % | | | — | |
| Ohio Tax-Free Bond Fund | | | 0.85 | % | | | 1.60 | % | | | 0.60 | % | | | 0.55 | % | | | — | |
| Small Company Fund*** | | | 1.22 | % | | | 1.95 | % | | | 0.89 | % | | | 0.79 | % | | | 0.79 | % |
| Value Fund | | | 1.08 | % | | | 1.83 | % | | | 0.83 | % | | | 0.68 | % | | | — | |
*Prior to October 30, 2019, the expense limitation for Institutional Class shares was 0.65%.
**Prior to September 1, 2019, the expense limitations for Classes A, C, Y and Institutional Class shares were 1.23%, 1.98%, 0.98% and 0.88%, respectively.
***Prior to October 30, 2019, the expense limitation for R6 Class shares was 0.73%.
These expense limitations will remain in effect for all Funds through at least October 30, 2020. The Expense limitation agreement can be terminated by a vote of the Funds’ Board if it deems the termination to be beneficial to the Funds’ shareholders.
During the year ended June 30, 2020, the Advisor or its affiliates waived investment advisory fees, administration fees or other operating expenses, including distribution fees, of the Funds as follows:
| | | Investment | | | | | | Other Operating | | | | |
| | | Advisory | | | Administration | | | Expenses | | | | |
| Fund | | Fees Waived | | | Fees Waived | | | Waived | | | Total | |
| Balanced Fund | | $ | — | | | $ | — | | | $ | 240,184 | | | $ | 240,184 | |
| International Equity Fund | | | — | | | | 142,336 | | | | 35,828 | | | | 178,164 | |
| International Growth Opportunities Fund | | | 81,352 | | | | 47,452 | | | | 69,197 | | | | 198,001 | |
| International Small Cap Fund | | | — | | | | 139,194 | | | | 108,937 | | | | 248,131 | |
| Large Cap Focused Fund | | | — | | | | 1,498,210 | | | | 364,452 | | | | 1,862,662 | |
| Large Cap Fund | | | — | | | | 346,199 | | | | 67,901 | | | | 414,100 | |
| Large Company Growth Fund | | | — | | | | 189,967 | | | | 145,021 | | | | 334,988 | |
| Ohio Tax-Free Bond Fund | | | 64,883 | | | | 71,229 | | | | 49,404 | | | | 185,516 | |
| Small Company Fund | | | — | | | | 751,543 | | | | 77,382 | | | | 828,925 | |
| Value Fund | | | 23,622 | | | | 450,258 | | | | 153,431 | | | | 627,311 | |
Under the terms of the Expense Limitation Agreement, the Advisor is entitled to recover, subject to approval by the Funds’ Board, such amounts waived or reimbursed for a period of up to three years from the date on which the Advisor reduced its compensation or assumed expenses for the Funds. The Fund will make repayments to the Advisor only if such repayment does not cause the Fund’s operating expenses (after the repayment is taken into account) to exceed the Fund’s expense limit in place when such amounts were waived or reimbursed by the Advisor and the Fund’s current expense limitation.
Notes to Financial Statements (Continued)
As of June 30, 2020, the Advisor may seek recoupment of previously waived fees and reimbursed expenses as follows:
| | | Expires | | | Expires | | | Expires | | | Expires | | | | |
| | | on or | | | on or | | | on or | | | on or | | | | |
| | | before | | | before | | | before | | | before | | | | |
| | | November 30, | | | June 30, | | | June 30, | | | June 30, | | | | |
| Fund | | 2020 | | | 2021 | | | 2022 | | | 2023 | | | Total | |
| Balanced Fund | | $ | 3,422 | | | $ | 16,819 | | | $ | 36,339 | | | $ | 44,186 | | | $ | 100,766 | |
| International Equity Fund | | | 33,634 | | | | 98,681 | | | | 158,366 | | | | 174,004 | | | | 464,685 | |
| International Growth Opportunities Fund | | | — | | | | 106,252 | | | | 185,823 | | | | 193,290 | | | | 485,365 | |
| International Small Cap Fund | | | — | | | | 72,874 | | | | 142,116 | | | | 232,873 | | | | 447,863 | |
| Large Cap Focused Fund | | | 90,753 | | | | 1,304,229 | | | | 2,201,447 | | | | 1,851,991 | | | | 5,448,420 | |
| Large Cap Fund | | | — | | | | 449,854 | | | | 440,511 | | | | 393,233 | | | | 1,283,598 | |
| Large Company Growth Fund | | | — | | | | 249,815 | | | | 259,049 | | | | 326,338 | | | | 835,202 | |
| Ohio Tax-Free Bond Fund | | | — | | | | 129,632 | | | | 143,581 | | | | 157,632 | | | | 430,845 | |
| Small Company Fund | | | 29,439 | | | | 596,684 | | | | 1,008,474 | | | | 818,548 | | | | 2,453,145 | |
| Value Fund | | | — | | | | 680,915 | | | | 645,575 | | | | 606,669 | | | | 1,933,159 | |
The Advisor did not recoup any amounts it previously waived or reimbursed during the year ended June 30, 2020.
ADMINISTRATION AGREEMENT
The Advisor entered into an Administration Agreement with the Trust, whereby the Advisor is responsible for: supplying executive and regulatory compliance services; supervising the preparation of tax returns; coordinating the preparation of reports to shareholders and reports to and filings with the SEC and state securities authorities, as well as materials for meetings of the Board; calculating the daily NAV per share; and maintaining the financial books and records of each Fund.
For its services, the Advisor’s annual administrative fee is:
0.145% on the first $20 billion of the aggregate average daily net assets;
0.11% on the next $10 billion of aggregate average daily net assets;
0.09% on the next $10 billion of aggregate average daily net assets; and
0.07% on the aggregate average daily net assets over $40 billion.
The fee is computed and allocated among the Touchstone Fund Complex (excluding Touchstone Institutional Funds Trust) on the basis of relative daily net assets.
The Advisor has engaged BNY Mellon as the Sub-Administrator to the Trust. BNY Mellon provides administrative and accounting services to the Trust and is compensated directly by the Advisor, not the Trust.
TRANSFER AGENT AGREEMENT
Under the terms of the Transfer Agent Agreement between the Trust and BNY Mellon Investment Servicing (U.S.) Inc. (“Transfer Agent”), the Transfer Agent to the Funds, the Transfer Agent maintains the records of each shareholder’s account, answers shareholders’ inquiries concerning their accounts, processes purchases and redemptions of each Fund’s shares, acts as dividend and distribution disbursing agent, and performs other shareholder service functions. For these services, the Transfer Agent receives a monthly fee from each Fund. In addition, each Fund pays out-of-pocket expenses incurred by the Transfer Agent, including, but not limited to, postage and supplies.
The Funds may reimburse the Advisor for fees paid to intermediaries such as banks, broker-dealers, financial advisors or other financial institutions for sub-transfer agency, sub-administration and other services provided to investors whose shares of record are held in omnibus, other group accounts, retirement plans or accounts traded through registered securities clearing agents. These fees may vary based on, for example, the nature of services provided, but generally range up to 0.15% of the assets of the class serviced or maintained by the intermediary or up to $22 per sub-account maintained by the intermediary.
PLANS OF DISTRIBUTION AND SHAREHOLDER SERVICING FEE ARRANGEMENTS
The Trust has adopted distribution plans pursuant to Rule 12b-1 under the 1940 Act for each class of shares it offers that is subject to 12b-1 distribution fees. The plans allow each Fund to pay distribution and other fees for the sale and distribution of its shares and for services provided to shareholders. The fees charged to the Funds are limited to the actual expenses incurred. Under the Class A plan, each Fund offering Class A shares pays an annual fee not to exceed 0.25% of average daily net assets that are attributable to Class A shares. Under the Class C plan, each Fund offering Class C shares pays an annual fee not to exceed 1.00% of average daily net assets that are attributable to Class C shares (of which up to 0.75% is a distribution fee and up to 0.25% is a shareholder servicing fee).
Notes to Financial Statements (Continued)
UNDERWRITING AGREEMENT
The Underwriter is the Funds’ principal underwriter and, as such, acts as exclusive agent for distribution of the Funds’ shares. Under the terms of the Underwriting Agreement between the Trust and the Underwriter, the Underwriter earned underwriting and broker commissions on the sale of Class A shares of the Funds. W&S Brokerage Services, Inc., an affiliate of the Underwriter and the Advisor, also earned broker commissions on the sale of Class A shares of the Funds. Listed below are the total underwriting and broker commissions earned by the Underwriter and its affiliate during the year ended June 30, 2020:
| Fund | | Amount | |
| Balanced Fund | | $ | 25,282 | |
| International Equity Fund | | | 2,634 | |
| International Growth Opportunities Fund | | | 483 | |
| International Small Cap Fund | | | 715 | |
| Large Cap Focused Fund | | | 13,612 | |
| Large Cap Fund | | | 1,134 | |
| Large Company Growth Fund | | | 961 | |
| Ohio Tax-Free Bond Fund | | | 375 | |
| Small Company Fund | | | 10,336 | |
In addition, the Underwriter collected CDSC on the redemption of Class A and Class C shares of the Funds listed below during the year ended June 30, 2020:
| Fund | | Class A | | | Class C | |
| Balanced Fund | | $ | 27 | | | $ | 3,273 | |
| International Equity Fund | | | 55 | | | | 85 | |
| International Small Cap Fund | | | — | | | | 30 | |
| Large Cap Focused Fund | | | 189 | | | | 504 | |
| Small Company Fund | | | 180 | | | | 662 | |
INTERFUND TRANSACTIONS
Pursuant to Rule 17a-7 under the 1940 Act, the Funds may engage in purchase and sale transactions with funds that have a common investment advisor (or affiliated investment advisors), common Trustees and/or common Officers. During the year ended June 30, 2020, the Funds did not engage in any Rule 17a-7 transactions.
5. Liquidity
ReFlow Fund LLC — The Funds may participate in the ReFlow Fund LLC liquidity program (“ReFlow”), which is designed to provide an alternative liquidity source for funds experiencing redemptions. In order to pay cash to shareholders who redeem their shares on a given day, a fund typically must hold cash in its portfolio, liquidate portfolio securities, or borrow money. ReFlow provides participating funds with another source of cash by standing ready to purchase shares from a fund up to the amount of the fund’s net redemptions on a given day, cumulatively limited to 3% of the outstanding voting shares of a Fund. ReFlow then generally redeems those shares (in cash or in-kind) when the Fund experiences net sales, at the end of a maximum holding period determined by ReFlow, or at other times at ReFlow’s discretion. In return for this service, the Fund will pay a fee to ReFlow at a rate determined by a daily auction with other participating mutual funds.
During the year ended June 30, 2020, the Large Cap Focused Fund utilized ReFlow. ReFlow purchased 4,923,198 shares of the Large Cap Focused Fund during the period and had redemptions-in-kind of $185,676,263. The resulting fee is recorded in Other expenses on the Statements of Operations.
Interfund Lending — Pursuant to an Exemptive Order issued by the SEC on March 28, 2017, the Funds, along with certain other funds in the Touchstone Fund Complex, may participate in an interfund lending program. The interfund lending program provides an alternate credit facility that allows the Funds to lend to or borrow from other participating funds in the Touchstone Fund Complex, subject to the conditions of the Exemptive Order. The Funds may not borrow under the facility for leverage purposes and the loans’ duration may be no more than 7 days.
During the year ended June 30, 2020, the following Funds participated as a borrower in the interfund lending program. The daily average amount borrowed, weighted average interest rate and interest expense were as follows:
| | | Daily Average | | | Weighted Average | | | Interest | |
| Fund | | Amount Borrowed | | | Interest Rate | | | Expense* | |
| International Small Cap Fund | | $ | 505,134 | | | | 1.89 | % | | $ | 10,777 | |
| Large Cap Focused Fund | | | 415,192 | | | | 1.99 | % | | | 9,354 | |
| Large Company Growth Fund | | | 167,233 | | | | 1.81 | % | | | 3,475 | |
Notes to Financial Statements (Continued)
| | | Daily Average | | | Weighted Average | | | Interest | |
| Fund | | Amount Borrowed | | | Interest Rate | | | Expense* | |
| Small Company Fund | | $ | 210,703 | | | | 2.15 | % | | $ | 4,596 | |
*Included in Other expenses in the Statements of Operations.
6. Federal Tax Information
Federal Income Tax — It is each Fund’s policy to continue to comply with the special provisions of the Internal Revenue Code applicable to regulated investment companies. As provided therein, in any fiscal year in which a Fund so qualifies and distributes at least 90% of its investment company taxable income, the Fund (but not the shareholders) will be relieved of federal income tax on the income distributed. It is each Fund’s policy to distribute all of its taxable and tax-exempt income and accordingly, no provision for income taxes has been made.
In order to avoid imposition of the excise tax applicable to regulated investment companies, it is also each Fund’s intention to declare and pay as dividends in each calendar year at least 98% of its investment company taxable income (earned during the calendar year) and 98.2% of its net realized capital gains (earned during the twelve months ending October 31) plus undistributed amounts from prior years.
The tax character of distributions paid is as follows:
| | | Balanced Fund | | | International Equity Fund | | | International Growth Opportunities Fund | |
| | | Year Ended | | | Year Ended | | | Year Ended | | | Year Ended | | | Year Ended | | | Year Ended | |
| | | June 30, | | | June 30, | | | June 30, | | | June 30, | | | June 30, | | | June 30, | |
| | | 2020 | | | 2019 | | | 2020 | | | 2019 | | | 2020 | | | 2019 | |
| From ordinary income | | $ | 6,480,488 | | | $ | 5,073,305 | | | $ | 1,923,637 | | | $ | 2,842,238 | | | $ | 2,978 | | | $ | 425,814 | |
| From long-term capital gains | | | 35,661,000 | | | | 15,844,335 | | | | 5,681,982 | | | | 17,560,388 | | | | — | | | | 4,272,059 | |
| Total Distributions | | $ | 42,141,488 | | | $ | 20,917,640 | | | $ | 7,605,619 | | | $ | 20,402,626 | | | $ | 2,978 | | | $ | 4,697,873 | |
| | | International Small Cap Fund | | | Large Cap Focused Fund | | | Large Cap Fund | |
| | | Year Ended | | | Year Ended | | | Year Ended | | | Year Ended | | | Year Ended | | | Year Ended | |
| | | June 30, | | | June 30, | | | June 30, | | | June 30, | | | June 30, | | | June 30, | |
| | | 2020 | | | 2019 | | | 2020 | | | 2019 | | | 2020 | | | 2019 | |
| From ordinary income | | $ | 3,485,590 | | | $ | 3,700,412 | | | $ | 12,128,375 | | | $ | 22,680,841 | | | $ | 3,199,658 | | | $ | 2,699,506 | |
| From long-term capital gains | | | — | | | | 16,613,583 | | | | 182,874,825 | | | | 152,239,077 | | | | 17,767,764 | | | | — | |
| Total Distributions | | $ | 3,485,590 | | | $ | 20,313,995 | | | $ | 195,003,200 | | | $ | 174,919,918 | | | $ | 20,967,422 | | | $ | 2,699,506 | |
| | | Large Company Growth Fund | | | Ohio Tax-Free Bond Fund | | | Small Company Fund | |
| | | Year Ended | | | Year Ended | | | Year Ended | | | Year Ended | | | Year Ended | | | Year Ended | |
| | | June 30, | | | June 30, | | | June 30, | | | June 30, | | | June 30, | | | June 30, | |
| | | 2020 | | | 2019 | | | 2020 | | | 2019 | | | 2020 | | | 2019 | |
| From ordinary income | | $ | — | | | $ | 716,305 | | | $ | 148 | | | $ | 615 | | | $ | — | | | $ | 34,623,870 | |
| From tax-exempt income | | | — | | | | — | | | | 1,274,837 | | | | 1,353,201 | | | | — | | | | — | |
| From long-term capital gains | | | 15,399,908 | | | | 12,955,949 | | | | 28,458 | | | | — | | | | 56,603,845 | | | | 110,406,903 | |
| Total Distributions | | $ | 15,399,908 | | | $ | 13,672,254 | | | $ | 1,303,443 | | | $ | 1,353,816 | | | $ | 56,603,845 | | | $ | 145,030,773 | |
| | | Value Fund | |
| | | Year Ended | | | Year Ended | |
| | | June 30, | | | June 30, | |
| | | 2020 | | | 2019 | |
| From ordinary income | | $ | 5,160,391 | | | $ | 9,739,930 | |
| From long-term capital gains | | | 17,529,100 | | | | 31,961,207 | |
| Total Distributions | | $ | 22,689,491 | | | $ | 41,701,137 | |
The following information is computed on a tax basis for each item as of June 30, 2020:
| | | | | | | | | International | | | | | | Large | |
| | | | | | International | | | Growth | | | International | | | Cap | |
| | | Balanced | | | Equity | | | Opportunities | | | Small Cap | | | Focused | |
| | | Fund | | | Fund | | | Fund | | | Fund | | | Fund | |
| Tax cost of portfolio investments | | $ | 263,136,175 | | | $ | 126,345,319 | | | $ | 22,655,993 | | | $ | 67,007,208 | | | $ | 973,977,522 | |
| Gross unrealized appreciation on investments | | | 131,984,394 | | | | 23,276,019 | | | | 9,502,332 | | | | 11,265,310 | | | | 721,809,606 | |
| Gross unrealized depreciation on investments | | | (6,167,763 | ) | | | (24,209,795 | ) | | | (753,327 | ) | | | (4,907,248 | ) | | | (45,209,777 | ) |
Notes to Financial Statements (Continued)
| | | | | | | | | International | | | | | | Large | |
| | | | | | International | | | Growth | | | International | | | Cap | |
| | | Balanced | | | Equity | | | Opportunities | | | Small Cap | | | Focused | |
| | | Fund | | | Fund | | | Fund | | | Fund | | | Fund | |
| Net unrealized appreciation (depreciation) on investments | | $ | 125,816,631 | | | $ | (933,776 | ) | | $ | 8,749,005 | | | $ | 6,358,062 | | | $ | 676,599,829 | |
| Gross unrealized appreciation on foreign currency transactions | | | — | | | | 7,644 | | | | 221 | | | | 2,297 | | | | — | |
| Gross unrealized depreciation on foreign currency transactions | | | — | | | | (177 | ) | | | — | | | | (3,911 | ) | | | — | |
| Other temporary differences | | | (520,401 | ) | | | — | | | | — | | | | — | | | | — | |
| Undistributed ordinary income | | | 3,125,123 | | | | — | | | | 26,106 | | | | — | | | | 2,867,438 | |
| Qualified late-year losses | | | — | | | | (6,555,269 | ) | | | — | | | | — | | | | — | |
| Capital Loss Carryforwards | | | — | | | | — | | | | (5,461,284 | ) | | | (19,488,935 | ) | | | — | |
| Undistributed long-term capital gains | | | 3,202,427 | | | | — | | | | — | | | | — | | | | 21,490,775 | |
| Distributable earnings (deficit) | | $ | 131,623,780 | | | $ | (7,481,578 | ) | | $ | 3,314,048 | | | $ | (13,132,487 | ) | | $ | 700,958,042 | |
| | | | | | Large | | | Ohio | | | | | | | |
| | | Large | | | Company | | | Tax-Free | | | | | | | |
| | | Cap | | | Growth | | | Bond | | | Small Company | | | Value | |
| | | Fund | | | Fund | | | Fund | | | Fund | | | Fund | |
| Tax cost of portfolio investments | | $ | 220,974,813 | | | $ | 119,451,591 | | | $ | 45,968,818 | | | $ | 629,353,225 | | | $ | 234,820,527 | |
| Gross unrealized appreciation on investments | | | 73,452,123 | | | | 109,146,428 | | | | 3,676,777 | | | | 131,853,094 | | | | 38,387,599 | |
| Gross unrealized depreciation on investments | | | (17,613,654 | ) | | | (2,006,923 | ) | | | (165 | ) | | | (48,876,237 | ) | | | (17,209,961 | ) |
| Net unrealized appreciation (depreciation) on investments | | | 55,838,469 | | | | 107,139,505 | | | | 3,676,612 | | | | 82,976,857 | | | | 21,177,638 | |
| Undistributed ordinary income | | | 2,250,087 | | | | — | | | | — | | | | — | | | | 68,138 | |
| Other temporary differences | | | — | | | | — | | | | (17,614 | ) | | | — | | | | — | |
| Qualified late-year losses | | | (1,715,991 | ) | | | (243,154 | ) | | | (26,054 | ) | | | (798,949 | ) | | | — | |
| Capital Loss Carryforwards | | | — | | | | — | | | | — | | | | (22,061,419 | ) | | | — | |
| Undistributed long-term capital gains | | | — | | | | 23,943,847 | | | | — | | | | — | | | | 3,171,733 | |
| Distributable earnings (deficit) | | $ | 56,372,565 | | | $ | 130,840,198 | | | $ | 3,632,944 | | | $ | 60,116,489 | | | $ | 24,417,509 | |
The difference between the tax cost of portfolio investments and the financial statement cost is primarily due to wash sale loss deferrals, investments in passive foreign investment company (“PFIC”) adjustments, basis adjustments on securities no longer treated as PFICs and nontaxable distribution basis outstanding.
As of June 30, 2020, the Funds had the following capital loss carryforwards for federal income tax purposes:
| | | No Expiration | | | No Expiration | | | | |
| | | | Short Term | | | Long Term | | | Total | |
| International Growth Opportunities Fund | | $ | 5,461,284 | | | — | | $ | 5,461,284 | |
| International Small Cap Fund | | | 19,488,935 | | | — | | | 19,488,935 | |
| Small Company Fund | | | 22,061,419 | | | — | | | 22,061,419 | |
The capital loss carryforwards may be utilized in future years to offset net realized capital gains, if any, prior to distributing such gains to shareholders.
Under current laws, certain capital losses realized after October 31 and ordinary losses realized after December 31 may be deferred (and certain ordinary losses after October and/or December 31 may be deferred) and treated as occurring on the first day of the following fiscal year. For the year ended June 30, 2020, the Funds elected to defer the following losses:
| | | Realized | | | Ordinary | | | | |
| Fund | | Capital Losses | | | Losses | | | Total | |
| International Equity Fund | | $ | 6,541,665 | | | $ | 13,604 | | | $ | 6,555,269 | |
| Large Cap Fund | | | 1,715,991 | | | | — | | | | 1,715,991 | |
| Large Company Growth Fund | | | — | | | | 243,154 | | | | 243,154 | |
| Ohio Tax-Free Bond Fund | | | 26,054 | | | | — | | | | 26,054 | |
| Small Company Fund | | | — | | | | 798,949 | | | | 798,949 | |
Notes to Financial Statements (Continued)
The Funds have analyzed their tax positions taken or to be taken on federal income tax returns for all open tax years (tax years ended June 30, 2017 through 2020) and have concluded that no provision for income tax is required in their financial statements.
Certain reclassifications, the result of permanent differences between financial statement and income tax reporting requirements, have been made to the components of capital as presented on the Statements of Assets and Liabilities. These reclassifications have no impact on the net assets or NAV per share of the Funds. The following reclassifications, which are primarily attributed to the write-off of net operating loss, redemptions in-kind, and deemed distributions on shareholder redemptions, and differing tax and GAAP distribution requirements, have been made to the following Funds for the year ended June 30, 2020:
| | | Paid-In | | | Distributable | |
| Fund | | Capital | | | Earnings | |
| International Small Cap Fund | | $ | (4,949,324 | ) | | $ | 4,949,324 | |
| Large Cap Focused Fund | | | 197,282,702 | | | | (197,282,702 | ) |
| Large Company Growth Fund | | | 2,068,919 | | | | (2,068,919 | ) |
| Small Company Fund | | | (1,283,175 | ) | | | 1,283,175 | |
7. Commitments and Contingencies
The Funds indemnify the Trust’s officers and Trustees for certain liabilities that might arise from their performance of their duties to the Funds. Additionally, in the normal course of business, the Funds enter into contracts that contain a variety of representations and warranties and which provide general indemnifications. The Funds’ maximum exposure under these arrangements is unknown, as this would involve future claims that may be made against the Funds.
8. Principal Risks
Risks Associated with Foreign Investments — Some of the Funds may invest in the securities of foreign issuers. Investing in securities issued by companies whose principal business activities are outside the U.S. may involve significant risks not present in domestic investments. For example, there is generally less publicly available information about foreign companies, particularly those not subject to the disclosure and reporting requirements of the U.S. securities laws. Foreign issuers are generally not bound by uniform accounting, auditing, and financial reporting requirements and standards of practice comparable to those applicable to domestic issuers. Investments in foreign securities also involve the risk of possible adverse changes in investment or exchange control regulations, expropriation or confiscatory taxation, limitations on the removal of funds or other assets of a Fund, political or financial instability or diplomatic and other developments which could affect such investments. Foreign stock markets, while growing in volume and sophistication, are generally not as developed as those in the U.S., and securities of some foreign issuers (particularly those located in developing countries) may be less liquid and more volatile than securities of comparable U.S. companies. In general, there is less overall governmental supervision and regulation of foreign securities markets, broker-dealers, and issuers than in the U.S.
Risks Associated with Sector Concentration — Certain Funds may invest a high percentage of their assets in specific sectors of the market in order to achieve a potentially greater investment return. As a result, these Funds may be more susceptible to economic, political, and regulatory developments in a particular sector of the market, positive or negative, and may experience increased volatility on the Funds’ NAVs and magnified effect on the total return.
Risks Associated with Credit — An issuer may be unable to make timely payments of either principal or interest. This may cause the issuer’s securities to decline in value. Credit risk is particularly relevant to those Funds that invest a significant amount of their assets in junk bonds or lower-rated securities.
Risks Associated with Interest Rate Changes — The price of debt securities is generally linked to the prevailing market interest rates. In general, when interest rates rise, the price of debt securities falls, and when interest rates fall, the price of debt securities rises. The price volatility of a debt security also depends on its maturity. Longer-term securities are generally more volatile, so the longer the average maturity or duration of these securities, the greater their price risk. Duration is a measure of the expected life, taking into account any prepayment or call features of the security, that is used to determine the price sensitivity of the security for a given change in interest rates. Specifically, duration is the change in the value of a fixed-income security that will result from a 1% change in interest rates, and generally is stated in years. For example, as a general rule a 1% rise in interest rates means a 1% fall in value for every year of duration. Maturity, on the other hand, is the date on which a fixed-income security becomes due for payment of principal. The negative impact on fixed income securities if interest rates increase as a result could negatively impact a Fund’s NAV.
Risks Associated with Health Crises — An outbreak of respiratory disease caused by a novel coronavirus was first detected in China in December 2019 and subsequently spread internationally. As of the date of issuance of these financial statements, this coronavirus has resulted in closing borders, enhanced health screenings, healthcare service preparation and delivery, quarantines, cancellations, disruptions to supply chains and customer activity, as well as general concern and uncertainty. The impact of this coronavirus may be short term or may last for an extended period of time and result in a substantial economic downturn. The impact of this outbreak, and other epidemics and pandemics that may arise in the future, could negatively affect the worldwide economy, as well as the economies of individual countries, individual companies and the market in general in significant and unforeseen ways. Any such impact could adversely affect a Fund’s performance, the performance of the securities in which a Fund invests and may lead to losses on your investment in a Fund.
Notes to Financial Statements (Continued)
Please see the Funds’ prospectus for a complete discussion of these and other risks.
9. Fund Reorganizations
Small Company Fund Reorganization:
The shareholders of the Touchstone Small Cap Growth Fund, a series of the Trust, approved an Agreement and Plan of Reorganization providing for the transfer of all assets and liabilities of the Touchstone Small Cap Growth Fund to the Touchstone Small Company Fund. The tax-free reorganization took place on September 21, 2018.
The following is a summary of shares outstanding, net assets, net asset value per share and unrealized appreciation immediately before and after the tax-free reorganization.
| | | | | | | | | After | |
| | | Before Reorganization | | | Reorganization | |
| | | Touchstone | | | Touchstone | | | Touchstone | |
| | | | Small Cap | | | | Small Company | | | | Small Company | |
| | | | Growth Fund | | | | Fund | | | | Fund | |
| Class A | | | | | | | | | | | | |
| Shares | | | 3,572,822 | (A) | | | 113,082,178 | | | | 116,655,000 | |
| Net Assets | | $ | 21,326,954 | | | $ | 675,012,128 | | | $ | 696,339,082 | |
| Net Asset Value | | $ | 5.97 | (A) | | $ | 5.97 | | | $ | 5.97 | |
| Class C | | | | | | | | | | | | |
| Shares | | | 1,917,820 | (B) | | | 29,092,599 | | | | 31,010,419 | |
| Net Assets | | $ | 6,665,795 | | | $ | 101,117,364 | | | $ | 107,783,159 | |
| Net Asset Value | | $ | 3.48 | (B) | | $ | 3.48 | | | $ | 3.48 | |
| Class Y | | | | | | | | | | | | |
| Shares | | | 11,284,528 | (C) | | | 65,216,246 | | | | 76,500,774 | |
| Net Assets | | $ | 73,494,700 | | | $ | 424,748,096 | | | $ | 498,242,796 | |
| Net Asset Value | | $ | 6.51 | (C) | | $ | 6.51 | | | $ | 6.51 | |
| Institutional Class | | | | | | | | | | | | |
| Shares | | | 556,531 | (D) | | | 74,162 | | | | 630,693 | |
| Net Assets | | $ | 3,625,412 | | | $ | 483,116 | | | $ | 4,108,528 | |
| Net Asset Value | | $ | 6.51 | (D) | | $ | 6.51 | | | $ | 6.51 | |
| Class R6 | | | | | | | | | | | | |
| Shares | | | — | | | | 13,592,489 | | | | 13,592,489 | |
| Net Assets | | $ | — | | | $ | 82,888,657 | | | $ | 82,888,657 | |
| Net Asset Value | | $ | — | | | $ | 6.10 | | | $ | 6.10 | |
| Fund Total | | | | | | | | | | | | |
| Shares Outstanding | | | 20,075,021 | | | | 221,057,674 | | | | 238,389,375 | |
| Net Assets | | $ | 105,112,861 | | | $ | 1,284,249,361 | | | $ | 1,389,362,222 | |
| Unrealized Appreciation (Depreciation) | | $ | 24,471,563 | | | $ | 345,400,026 | | | $ | 369,871,589 | |
(A) Reflects a 0.8051:1 stock split which occurred on the date of reorganization, September 21, 2018.
(B) Reflects a 1.0348:1 reverse stock split which occurred on the date of reorganization, September 21, 2018.
(C) Reflects a 0.8586:1 stock split which occurred on the date of reorganization, September 21, 2018.
(D) Reflects a 0.8691:1 stock split which occurred on the date of reorganization, September 21, 2018.
Assuming the reorganization had been completed on July 1, 2018, the Small Company Fund’s results of operations for the year ended June 30, 2019 would have been as follows:
| Net investment loss | | $ | (2,507,344 | ) |
| Net realized and unrealized gain (loss) on investments | | $ | (10,037,911 | ) |
| Net decrease in net assets resulting from operations | | $ | (12,545,255 | ) |
Because the combined investment portfolios have been managed as a single portfolio since the reorganization was completed, it is not practical to separate the amounts of revenue and earnings to the Small Company Fund that have been included in its statement of operations since the reorganization.
Notes to Financial Statements (Continued)
10. Subsequent Events
Subsequent events occurring after the date of this report have been evaluated for potential impact to this report through the date the financial statements were issued.
At a meeting of the Board of Trustees (the “Board”) of the Trust held on May 21, 2020, the Board approved the reorganization of the International Growth Opportunities Fund into the International Small Cap Fund. The reorganization will be completed on or about September 11, 2020. In addition, effective September 12, 2020, the International Small Cap Fund will be renamed the Touchstone International Growth Fund. Concurrent with the change, DSM Capital Partners LLC will replace the previous sub-advisor and the Principal Investment Strategies and Principal Risks will change to reflect those of Touchstone International Growth Fund’s investment strategy.
There were no other subsequent events that necessitated recognition or disclosure in the Funds’ financial statements.
Report of Independent Registered Public Accounting Firm
To the Shareholders of Touchstone Balanced Fund, Touchstone International Equity Fund, Touchstone International Growth Opportunities Fund, Touchstone International Small Cap Fund, Touchstone Large Cap Focused Fund, Touchstone Large Cap Fund, Touchstone Large Company Growth Fund, Touchstone Ohio Tax-Free Bond Fund, Touchstone Small Company Fund and Touchstone Value Fund and the Board of Trustees of Touchstone Strategic Trust.
Opinion on the Financial Statements
We have audited the accompanying statements of assets and liabilities of Touchstone Balanced Fund, Touchstone International Equity Fund, Touchstone International Growth Opportunities Fund, Touchstone International Small Cap Fund, Touchstone Large Cap Focused Fund, Touchstone Large Cap Fund, Touchstone Large Company Growth Fund, Touchstone Ohio Tax-Free Bond Fund, Touchstone Small Company Fund and Touchstone Value Fund (collectively referred to as the “Funds”), (ten of the funds constituting the Touchstone Strategic Trust (the “Trust”)), including the portfolios of investments, as of June 30, 2020, and the related statements of operations and changes in net assets, and the financial highlights for each of the periods indicated in the table below and the related notes (collectively referred to as the “financial statements”). In our opinion, the financial statements present fairly, in all material respects, the financial position of each of the Funds (ten of the funds constituting Touchstone Strategic Trust) at June 30, 2020, and the results of their operations, changes in net assets and financial highlights for each of the periods indicated in the table below, in conformity with U.S. generally accepted accounting principles.
| Individual funds constituting | | | Statement of | | | Statements of | | |
| Touchstone Strategic Trust | | | operations | | | changes in net assets | | Financial highlights |
Touchstone Balanced Fund
Touchstone International Equity Fund
Touchstone Large Cap Focused Fund
Touchstone Small Company Fund | | | For the year ended June 30, 2020 | | | For each of the two years in the period ended June 30, 2020 | | For each of the two years in the period ended June 30, 2020, the seven months ended June 30, 2018 and the year ended November 30, 2017 |
Touchstone International Growth Opportunities Fund
Touchstone Large Company Growth Fund | | | For the year ended June 30, 2020 | | | For each of the two years in the period ended June 30, 2020 | | For each of the four years in the period ended June 30, 2020 |
Touchstone International Small Cap Fund
Touchstone Large Cap Fund
Touchstone Ohio Tax-Free Bond Fund
Touchstone Value Fund | | | For the year ended June 30, 2020 | | | For each of the two years in the period ended June 30, 2020 | | For each of the five years in the period ended June 30, 2020 |
The financial highlights for each of the two years in the period ended November 30, 2016 of Touchstone Balanced Fund, Touchstone International Equity Fund, Touchstone Large Cap Focused Fund and Touchstone Small Company Fund were audited by other auditors, whose report dated January 19, 2017 expressed an unqualified opinion on those financial highlights. The financial highlights for the year ended June 30, 2016 of Touchstone International Growth Opportunities Fund and Touchstone Large Company Growth Fund were audited by other auditors, whose report dated August 25, 2016 expressed an unqualified opinion on those financial highlights.
Basis for Opinion
These financial statements are the responsibility of the Trust’s management. Our responsibility is to express an opinion on each of the Funds’ financial statements based on our audits. We are a public accounting firm registered with the Public Company Accounting Oversight Board (United States) (“PCAOB”) and are required to be independent with respect to the Trust in accordance with the U.S. federal securities laws and the applicable rules and regulations of the Securities and Exchange Commission and the PCAOB.
We conducted our audits in accordance with the standards of the PCAOB. Those standards require that we plan and perform the audit to obtain reasonable assurance about whether the financial statements are free of material misstatement, whether due to error or fraud. The Trust is not required to have, nor were we engaged to perform, an audit of the Trust’s internal control over financial reporting. As part of our audits we are required to obtain an understanding of internal control over financial reporting but not for the purpose of expressing an opinion on the effectiveness of the Trust’s internal control over financial reporting. Accordingly, we express no such opinion.
Report of Independent Registered Public Accounting Firm (Continued)
Our audits included performing procedures to assess the risks of material misstatement of the financial statements, whether due to error or fraud, and performing procedures that respond to those risks. Such procedures included examining, on a test basis, evidence regarding the amounts and disclosures in the financial statements. Our procedures included confirmation of securities owned as of June 30, 2020, by correspondence with the custodian, transfer agent and brokers or by other appropriate auditing procedures where replies from brokers were not received. Our audits also included evaluating the accounting principles used and significant estimates made by management, as well as evaluating the overall presentation of the financial statements. We believe that our audits provide a reasonable basis for our opinion.

We have served as the auditor of one or more Touchstone Investments’ investment companies since 1999.
Cincinnati, Ohio
August 21, 2020
Other Items (Unaudited)
Qualified Dividend Income
Under the Jobs and Growth Tax Relief Reconciliation Act of 2003 (the “Act”), the following percentages of ordinary dividends paid during the fiscal year ended June 30, 2020 are designated as “qualified dividend income,” as defined in the Act, and are subject to reduced tax rates in 2015. The Funds intend to pass through the maximum allowable percentage for Form 1099Div.
| Balanced Fund | | | 48.83 | % |
| International Equity Fund | | | 100.00 | % |
| International Growth Opportunities Fund | | | 100.00 | % |
| International Small Cap Fund | | | 100.00 | % |
| Large Cap Focused Fund | | | 100.00 | % |
| Large Cap Fund | | | 100.00 | % |
| Value Fund | | | 100.00 | % |
Dividend Received Deduction
For corporate shareholders, the following ordinary distributions paid during the current fiscal year ended June 30, 2020 qualify for the corporate dividends received deduction. The Funds intend to pass through the maximum allowable percentage.
| Balanced Fund | | | 45.26 | % |
| International Growth Opportunities Fund | | | 6.41 | % |
| Large Cap Focused Fund | | | 100.00 | % |
| Large Cap Fund | | | 100.00 | % |
| Value Fund | | | 100.00 | % |
For the fiscal year ended June 30, 2020, the Funds designated long-term capital gains as follows:
| Balanced Fund | | $ | 38,393,376 | |
| International Equity Fund | | $ | 5,681,982 | |
| Large Cap Focused Fund | | $ | 214,853,340 | |
| Large Cap Fund | | $ | 17,767,764 | |
| Large Company Growth Fund | | $ | 29,066,589 | |
| Ohio Tax-Free Bond Fund | | $ | 28,458 | |
| Small Company Fund | | $ | 56,687,660 | |
| Value Fund | | $ | 17,529,100 | |
Of the dividends paid from net investment income during the most-recent fiscal year, 99.99% was designated as exempt interest dividends for federal income tax purposes for the Ohio Tax-Free Bond Fund.
Foreign Tax Income & Foreign Tax Credit
The International Equity Fund, International Growth Opportunities Fund, and International Small Cap Fund intend to pass through a foreign tax credit to the shareholders. For the fiscal year ended June 30, 2020, the total amount of foreign source income is $2,656,631 or $0.31 per share for the International Equity Fund, $324,119 or $0.23 per share for the International Growth Opportunities Fund, and $2,022,172 or $0.34 per share for the International Small Cap Fund. The total amount of foreign taxes to be paid is $190,284 or $0.02 per share per share for the International Equity Fund, $15,382 or $0.01 per share for the International Growth Opportunities Fund, and $150,918 or $0.03 per share for the International Small Cap Fund. Shareholder’s allocable share of the foreign tax credit will be reported on Form 1099 Div.
Proxy Voting Guidelines and Proxy Voting Records
The Sub-Advisors are responsible for exercising the voting rights associated with the securities purchased and held by the Funds. A description of the policies and procedures that the Sub-Advisors use in fulfilling this responsibility is available as an appendix to the most recent Statement of Additional Information, which can be obtained without charge by calling toll free 1.800.543.0407 or by visiting the Touchstone website at TouchstoneInvestments.com or on the Securities and Exchange Commission’s (the “Commission”) website sec.gov. Information regarding how those proxies were voted during the most recent twelve-month period ended June 30, which will be filed by August 31 of that year, is also available without charge by calling toll free 1.800.543.0407 or on the Commission’s website at sec.gov.
Other Items (Unaudited) (Continued)
Quarterly Portfolio Disclosure
Each Fund’s holdings as of the end of the third month of every fiscal quarter will be disclosed on Form N-PORT within 60 days of the end of the fiscal quarter. The complete listing of each Fund’s portfolio holdings is available on the Commission’s website and will be made available to shareholders upon request by calling 1.800.543.0407.
Schedule of Shareholder Expenses
As a shareholder of the Funds, you incur two types of costs: (1) transaction costs, such as sales charges (loads); and (2) ongoing costs, including investment advisory fees; distribution (12b-1) fees; and other Fund expenses. This example is intended to help you understand your ongoing costs (in dollars) of investing in the Funds and to compare these costs with the ongoing costs of investing in other mutual funds.
The example is based on an investment of $1,000 invested at the beginning of the period and held for the entire period (January 1, 2020 through June 30, 2020).
Actual Expenses
The first line for each share class of a Fund in the table below provides information about actual account values and actual expenses. You may use the information in this line, together with the amount you invested, to estimate the expenses that you paid over the period. Simply divide your account value by $1,000 (for example, an $8,600 account value divided by $1,000 = 8.6), then multiply the result by the number in the first line under the heading entitled “Expenses Paid During the Six Months Ended June 30, 2020” to estimate the expenses you paid on your account during this period.
Hypothetical Example for Comparison Purposes
The second line for each share class of a Fund in the table below provides information about hypothetical account values and hypothetical expenses based on the Funds’ actual expense ratio and an assumed rate of return of 5% per year before expenses, which is not the Funds’ actual return. The hypothetical account values and expenses may not be used to estimate the actual ending account balance or expenses you paid for the period. You may use this information to compare the ongoing costs of investing in the Funds and other funds. To do so, compare this 5% hypothetical example with the 5% hypothetical examples that appear in the shareholder reports of the other funds.
Please note that the expenses shown in the table are meant to highlight your ongoing costs only and do not reflect any transactional costs, such as sales charges (loads). Therefore, the second line for each share class of a Fund in the table below is useful in comparing ongoing costs only, and will not help you determine the relative total costs of owning different funds. In addition, if these transactional costs were included, your costs would have been higher.
| | | | | | | | | | | | | | Expenses | |
| | | | | Net Expense | | | Beginning | | | Ending | | | Paid During | |
| | | | | Ratio | | | Account | | | Account | | | the Six Months | |
| | | | | Annualized | | | Value | | | Value | | | Ended | |
| | | | | June 30, | | | January 1, | | | June 30, | | | June 30, | |
| | | | | 2020 | | | 2020 | | | 2020 | | | 2020* | |
| Touchstone Balanced Fund | | | | | | | | | | | | | | | | | | |
| Class A | | Actual | | | 1.01 | % | | $ | 1,000.00 | | | $ | 1,020.60 | | | $ | 5.07 | |
| Class A | | Hypothetical | | | 1.01 | % | | $ | 1,000.00 | | | $ | 1,019.84 | | | $ | 5.07 | |
| Class C | | Actual | | | 1.78 | % | | $ | 1,000.00 | | | $ | 1,016.60 | | | $ | 8.92 | |
| Class C | | Hypothetical | | | 1.78 | % | | $ | 1,000.00 | | | $ | 1,016.01 | | | $ | 8.92 | |
| Class Y | | Actual | | | 0.81 | % | | $ | 1,000.00 | | | $ | 1,021.50 | | | $ | 4.07 | |
| Class Y | | Hypothetical | | | 0.81 | % | | $ | 1,000.00 | | | $ | 1,020.84 | | | $ | 4.07 | |
| Touchstone International Equity Fund | | | | | | | | | | | | | | | | | | |
| Class A | | Actual | | | 1.28 | % | | $ | 1,000.00 | | | $ | 867.40 | | | $ | 5.94 | |
| Class A | | Hypothetical | | | 1.28 | % | | $ | 1,000.00 | | | $ | 1,018.50 | | | $ | 6.42 | |
| Class C | | Actual | | | 2.49 | % | | $ | 1,000.00 | | | $ | 862.00 | | | $ | 11.53 | |
| Class C | | Hypothetical | | | 2.49 | % | | $ | 1,000.00 | | | $ | 1,012.48 | | | $ | 12.46 | |
| Class Y | | Actual | | | 0.99 | % | | $ | 1,000.00 | | | $ | 868.40 | | | $ | 4.60 | |
| Class Y | | Hypothetical | | | 0.99 | % | | $ | 1,000.00 | | | $ | 1,019.94 | | | $ | 4.97 | |
| Institutional Class | | Actual | | | 0.89 | % | | $ | 1,000.00 | | | $ | 869.40 | | | $ | 4.14 | |
| Institutional Class | | Hypothetical | | | 0.89 | % | | $ | 1,000.00 | | | $ | 1,020.44 | | | $ | 4.47 | |
| Touchstone International Growth Opportunities Fund | | | | | | | | | | | | | | | | |
| Class A | | Actual | | | 1.24 | % | | $ | 1,000.00 | | | $ | 996.40 | | | $ | 6.16 | |
| Class A | | Hypothetical | | | 1.24 | % | | $ | 1,000.00 | | | $ | 1,018.70 | | | $ | 6.22 | |
| Class C | | Actual | | | 1.99 | % | | $ | 1,000.00 | | | $ | 992.70 | | | $ | 9.86 | |
Other Items (Unaudited) (Continued)
| | | | | | | | | | | | | | Expenses | |
| | | | | Net Expense | | | Beginning | | | Ending | | | Paid During | |
| | | | | Ratio | | | Account | | | Account | | | the Six Months | |
| | | | | Annualized | | | Value | | | Value | | | Ended | |
| | | | | June 30, | | | January 1, | | | June 30, | | | June 30, | |
| | | | | 2020 | | | 2020 | | | 2020 | | | 2020* | |
| Class C | | Hypothetical | | | 1.99 | % | | $ | 1,000.00 | | | $ | 1,014.97 | | | $ | 9.97 | |
| Class Y | | Actual | | | 0.99 | % | | $ | 1,000.00 | | | $ | 997.30 | | | $ | 4.92 | |
| Class Y | | Hypothetical | | | 0.99 | % | | $ | 1,000.00 | | | $ | 1,019.94 | | | $ | 4.97 | |
| Institutional Class | | Actual | | | 0.89 | % | | $ | 1,000.00 | | | $ | 997.80 | | | $ | 4.42 | |
| Institutional Class | | Hypothetical | | | 0.89 | % | | $ | 1,000.00 | | | $ | 1,020.44 | | | $ | 4.47 | |
| Touchstone International Small Cap Fund | | | | | | | | | | | | | | | | | | |
| Class A | | Actual | | | 1.56 | % | | $ | 1,000.00 | | | $ | 790.40 | | | $ | 6.94 | ** |
| Class A | | Hypothetical | | | 1.56 | % | | $ | 1,000.00 | | | $ | 1,017.11 | | | $ | 7.82 | ** |
| Class C | | Actual | | | 2.31 | % | | $ | 1,000.00 | | | $ | 786.50 | | | $ | 10.26 | ** |
| Class C | | Hypothetical | | | 2.31 | % | | $ | 1,000.00 | | | $ | 1,013.38 | | | $ | 11.56 | ** |
| Class Y | | Actual | | | 1.31 | % | | $ | 1,000.00 | | | $ | 790.70 | | | $ | 5.83 | ** |
| Class Y | | Hypothetical | | | 1.31 | % | | $ | 1,000.00 | | | $ | 1,018.35 | | | $ | 6.57 | ** |
| Institutional Class | | Actual | | | 1.19 | % | | $ | 1,000.00 | | | $ | 791.90 | | | $ | 5.30 | ** |
| Institutional Class | | Hypothetical | | | 1.19 | % | | $ | 1,000.00 | | | $ | 1,018.95 | | | $ | 5.97 | ** |
| Touchstone Large Cap Focused Fund | | | | | | | | | | | | | | | | | | |
| Class A | | Actual | | | 1.01 | % | | $ | 1,000.00 | | | $ | 989.00 | | | $ | 4.99 | *** |
| Class A | | Hypothetical | | | 1.01 | % | | $ | 1,000.00 | | | $ | 1,019.84 | | | $ | 5.07 | *** |
| Class C | | Actual | | | 1.81 | % | | $ | 1,000.00 | | | $ | 1,015.86 | | | $ | 9.07 | *** |
| Class C | | Hypothetical | | | 1.81 | % | | $ | 1,000.00 | | | $ | 985.40 | | | $ | 8.93 | *** |
| Class Y | | Actual | | | 0.74 | % | | $ | 1,000.00 | | | $ | 990.60 | | | $ | 3.66 | *** |
| Class Y | | Hypothetical | | | 0.74 | % | | $ | 1,000.00 | | | $ | 1,021.18 | | | $ | 3.72 | *** |
| Institutional Class | | Actual | | | 0.71 | % | | $ | 1,000.00 | | | $ | 990.60 | | | $ | 3.51 | *** |
| Institutional Class | | Hypothetical | | | 0.71 | % | | $ | 1,000.00 | | | $ | 1,021.33 | | | $ | 3.57 | *** |
| Touchstone Large Cap Fund | | | | | | | | | | | | | | | | | | |
| Class A | | Actual | | | 1.03 | % | | $ | 1,000.00 | | | $ | 910.60 | | | $ | 4.89 | |
| Class A | | Hypothetical | | | 1.03 | % | | $ | 1,000.00 | | | $ | 1,019.74 | | | $ | 5.17 | |
| Class C | | Actual | | | 1.78 | % | | $ | 1,000.00 | | | $ | 907.70 | | | $ | 8.44 | |
| Class C | | Hypothetical | | | 1.78 | % | | $ | 1,000.00 | | | $ | 1,016.01 | | | $ | 8.92 | |
| Class Y | | Actual | | | 0.78 | % | | $ | 1,000.00 | | | $ | 912.10 | | | $ | 3.71 | |
| Class Y | | Hypothetical | | | 0.78 | % | | $ | 1,000.00 | | | $ | 1,020.98 | | | $ | 3.92 | |
| Institutional Class | | Actual | | | 0.68 | % | | $ | 1,000.00 | | | $ | 912.20 | | | $ | 3.23 | |
| Institutional Class | | Hypothetical | | | 0.68 | % | | $ | 1,000.00 | | | $ | 1,021.48 | | | $ | 3.42 | |
| Touchstone Large Company Growth Fund | | | | | | | | | | | | | | | | | | |
| Class A | | Actual | | | 1.04 | % | | $ | 1,000.00 | | | $ | 1,089.50 | | | $ | 5.40 | |
| Class A | | Hypothetical | | | 1.04 | % | | $ | 1,000.00 | | | $ | 1,019.69 | | | $ | 5.22 | |
| Class C | | Actual | | | 1.79 | % | | $ | 1,000.00 | | | $ | 1,085.60 | | | $ | 9.28 | |
| Class C | | Hypothetical | | | 1.79 | % | | $ | 1,000.00 | | | $ | 1,015.96 | | | $ | 8.97 | |
| Class Y | | Actual | | | 0.79 | % | | $ | 1,000.00 | | | $ | 1,091.00 | | | $ | 4.11 | |
| Class Y | | Hypothetical | | | 0.79 | % | | $ | 1,000.00 | | | $ | 1,020.93 | | | $ | 3.97 | |
| Institutional Class | | Actual | | | 0.69 | % | | $ | 1,000.00 | | | $ | 1,091.50 | | | $ | 3.59 | |
| Institutional Class | | Hypothetical | | | 0.69 | % | | $ | 1,000.00 | | | $ | 1,021.43 | | | $ | 3.47 | |
| Touchstone Ohio Tax-Free Bond Fund | | | | | | | | | | | | | | | | | | |
| Class A | | Actual | | | 0.85 | % | | $ | 1,000.00 | | | $ | 1,024.50 | | | $ | 4.28 | |
| Class A | | Hypothetical | | | 0.85 | % | | $ | 1,000.00 | | | $ | 1,020.64 | | | $ | 4.27 | |
| Class C | | Actual | | | 1.60 | % | | $ | 1,000.00 | | | $ | 1,020.70 | | | $ | 8.04 | |
| Class C | | Hypothetical | | | 1.60 | % | | $ | 1,000.00 | | | $ | 1,016.91 | | | $ | 8.02 | |
| Class Y | | Actual | | | 0.60 | % | | $ | 1,000.00 | | | $ | 1,026.70 | | | $ | 3.02 | |
| Class Y | | Hypothetical | | | 0.60 | % | | $ | 1,000.00 | | | $ | 1,021.88 | | | $ | 3.02 | |
| Institutional Class | | Actual | | | 0.55 | % | | $ | 1,000.00 | | | $ | 1,026.00 | | | $ | 2.77 | |
| Institutional Class | | Hypothetical | | | 0.55 | % | | $ | 1,000.00 | | | $ | 1,022.13 | | | $ | 2.77 | |
Other Items (Unaudited) (Continued)
| | | | | | | | | | | | | | Expenses | |
| | | | | Net Expense | | | Beginning | | | Ending | | | Paid During | |
| | | | | Ratio | | | Account | | | Account | | | the Six Months | |
| | | | | Annualized | | | Value | | | Value | | | Ended | |
| | | | | June 30, | | | January 1, | | | June 30, | | | June 30, | |
| | | | | 2020 | | | 2020 | | | 2020 | | | 2020* | |
| Touchstone Small Company Fund | | | | | | | | | | | | | | | | | | |
| Class A | | Actual | | | 1.16 | % | | $ | 1,000.00 | | | $ | 844.10 | | | $ | 5.32 | |
| Class A | | Hypothetical | | | 1.16 | % | | $ | 1,000.00 | | | $ | 1,019.10 | | | $ | 5.82 | |
| Class C | | Actual | | | 1.95 | % | | $ | 1,000.00 | | | $ | 843.20 | | | $ | 8.94 | |
| Class C | | Hypothetical | | | 1.95 | % | | $ | 1,000.00 | | | $ | 1,015.17 | | | $ | 9.77 | |
| Class Y | | Actual | | | 0.89 | % | | $ | 1,000.00 | | | $ | 844.80 | | | $ | 4.08 | |
| Class Y | | Hypothetical | | | 0.89 | % | | $ | 1,000.00 | | | $ | 1,020.44 | | | $ | 4.47 | |
| Institutional Class | | Actual | | | 0.79 | % | | $ | 1,000.00 | | | $ | 846.40 | | | $ | 3.63 | |
| Institutional Class | | Hypothetical | | | 0.79 | % | | $ | 1,000.00 | | | $ | 1,020.93 | | | $ | 3.97 | |
| Class R6 | | Actual | | | 0.79 | % | | $ | 1,000.00 | | | $ | 846.70 | | | $ | 3.63 | |
| Class R6 | | Hypothetical | | | 0.79 | % | | $ | 1,000.00 | | | $ | 1,020.93 | | | $ | 3.97 | |
| Touchstone Value Fund | | | | | | | | | | | | | | | | | | |
| Class A | | Actual | | | 1.08 | % | | $ | 1,000.00 | | | $ | 825.40 | | | $ | 4.90 | |
| Class A | | Hypothetical | | | 1.08 | % | | $ | 1,000.00 | | | $ | 1,019.49 | | | $ | 5.42 | |
| Class C | | Actual | | | 1.83 | % | | $ | 1,000.00 | | | $ | 822.80 | | | $ | 8.29 | |
| Class C | | Hypothetical | | | 1.83 | % | | $ | 1,000.00 | | | $ | 1,015.76 | | | $ | 9.17 | |
| Class Y | | Actual | | | 0.82 | % | | $ | 1,000.00 | | | $ | 826.30 | | | $ | 3.72 | |
| Class Y | | Hypothetical | | | 0.82 | % | | $ | 1,000.00 | | | $ | 1,020.79 | | | $ | 4.12 | |
| Institutional Class | | Actual | | | 0.68 | % | | $ | 1,000.00 | | | $ | 827.50 | | | $ | 3.09 | |
| Institutional Class | | Hypothetical | | | 0.68 | % | | $ | 1,000.00 | | | $ | 1,021.48 | | | $ | 3.42 | |
*Expenses are equal to the Fund’s annualized expense ratio, multiplied by the average account value over the period, multiplied by 182/366 (to reflect the one-half period).
**Excluding liquidity provider expenses, your actual cost of investment in Class A, Class C, Class Y and Institutional Class would be $6.90, $10.22, $5.79 and $5.26, respectively, and your hypothetical cost of investment in Class A, Class C, Class Y and Institutional Class would be $7.77, $11.51, $6.52, and $5.92, respectively.
***Excluding liquidity provider expenses, your actual cost of investment in Class A, Class C, Class Y and Institutional Class would be $4.90, $8.84, $3.56 and $3.42, respectively, and your hypothetical cost of investment in Class A, Class C, Class Y and Institutional Class would be $4.97, $8.97, $3.62, and $3.47, respectively.
Liquidity Risk Management
The Funds have adopted and implemented a written liquidity risk management program (the “LRM Program”) as required by Rule 22e-4 under the Investment Company Act of 1940. Rule 22e-4 requires that each Fund adopt a program that is reasonably designed to assess and manage the Funds’ liquidity risk, which is the risk that a Fund could not meet redemption requests without significant dilution of remaining investors’ interests in a Fund.
Assessment and management of a Fund’s liquidity risk under the LRM Program takes into consideration certain factors, such as a Fund’s investment strategy and the liquidity of its portfolio investments during normal and reasonably foreseeable stressed conditions, its short- and long-term cash-flow projections during both normal and reasonably foreseeable stressed conditions, and its cash and cash-equivalent holdings and access to other funding sources. As required by the rule, the LRM Program includes policies and procedures for classification of Fund portfolio holdings in four liquidity categories, maintaining certain levels of highly liquid investments, and limiting holdings of illiquid investments.
The Board of Trustees of the Trust approved the appointment of a LRM Program administrator responsible for administering the LRM Program and for carrying out the specific responsibilities set forth in the LRM Program, including reporting to the Board on at least an annual basis regarding the LRM Program’s operation, its adequacy, and the effectiveness of its implementation for the past year (the “Program Administrator Report”). The Board has reviewed the Program Administrator Report covering the period from May 17, 2019 through May 14, 2020 (the “Review Period”). The Program Administrator Report stated that during the Review Period the Program operated and was implemented effectively to manage the Funds’ liquidity risk.
Basis for Board’s Approval of Sub-Advisory Agreement
Touchstone International Small Cap Fund
At a meeting held on May 21, 2020,Touchstone Advisors, Inc. (the “Advisor”) proposed the replacement of the then-current sub-advisor of the Touchstone International Small Cap Fund (the “Fund”), Copper Rock Capital Partners LLC (“Copper Rock”), to the Board of Trustees (the “Board”) of Touchstone Strategic Trust (the “Trust”). The Board approved replacing Copper Rock with DSM Capital Partners LLC (“DSM”). In connection with this sub-advisor change, the Board also approved changes to the Fund’s investment goal, principal investment strategies, benchmark and name (the “Repurposing”). The Board also took into consideration that these
Other Items (Unaudited) (Continued)
changes would become effective concurrently with the reorganization of the Touchstone International Growth Opportunities Fund (“International Growth Opportunities Fund”), another series of the Trust into the Fund.
The Advisor provided the Board with various written materials in advance of the May 21, 2020 meeting to assist with the Board’s consideration of a new Sub-Advisory Agreement between the Advisor and DSM (the “New Sub-Advisory Agreement”).The Advisor provided written and oral information stating the basis for its recommendation to engage DSM. The information also included details regarding DSM’s: (a) investment philosophy and investment strategy; (b) investment management services proposed to be provided to the Fund; (c) investment management personnel; (d) operating history, infrastructure and financial condition; (e) proposed sub-advisory fee that would be paid to DSM by the Advisor; and (f) reputation, expertise and resources as an investment advisor. The Board then discussed the written materials that the Board received before the meeting and all other information that the Board received at the meeting.
The Board, including the Independent Trustees voting separately, unanimously determined that the proposal to approve the New Sub-Advisory Agreement for the Fund would be in the best interests of the Fund and its shareholders. In approving the New Sub-Advisory Agreement, the Board considered various factors, among them: (1) the nature, extent and quality of services to be provided to the Fund, including the investment personnel who would be providing such services; (2) DSM’s proposed compensation; (3) the performance of the Fund and that of the International Growth Fund managed by DSM using the same investment strategy that DSM proposes to use in managing the Fund; and (4) the terms of the New Sub-Advisory Agreement. The Board’s consideration of these factors is summarized below. The Independent Trustees were advised by independent legal counsel throughout the process.
Nature, Extent and Quality of Services to be Provided; Investment Personnel. The Board considered information provided by the Advisor regarding the services to be provided by DSM. The Board considered DSM’s level of knowledge and investment style. The Board reviewed the experience and credentials of the investment personnel who would be responsible for managing the investment of portfolio securities with respect to the Fund. The Board also noted that it is familiar with DSM, as DSM serves as a sub-advisor to the International Growth Opportunities Fund, which it manages in accordance with its International Growth strategy. The Board noted that DSM would utilize the identical strategy currently employed for the International Growth Opportunities Fund in managing the Fund. The Board also noted that the portfolio manager who would manage the Fund would be the same portfolio manager who currently manages the International Growth Opportunities Fund. The Board also took into consideration that the Advisor was satisfied with DSM’s in-house risk and compliance teams and its familiarity with DSM given DSM’s management of other Touchstone funds.
Anticipated Profitability. The Board took into consideration the financial condition of DSM and any direct and indirect benefits to be derived by DSM from its relationship with the Fund. In considering the anticipated level of profitability to DSM, the Board noted the proposed contractual undertaking of the Advisor to maintain expense limitations for the Fund and also noted that the sub-advisory fee under the New Sub-Advisory Agreement would be paid by the Advisor out of the advisory fee that it receives from the Fund, and that the proposed sub-advisory fee was negotiated at arm’s length between the Advisor and DSM. As a consequence, the anticipated level of profitability to DSM from its relationship with the Fund was not a substantial factor in the Board’s deliberations. For similar reasons, the Board did not consider potential economies of scale in DSM’s management of the Fund to be a substantial factor in its consideration. The Board noted that in connection with the proposed change in sub-advisor the Advisor also proposed to reduce the Fund’s advisory fee on assets below $750 million and the expense limitations on all of its share classes.
Proposed Sub-Advisory Fee. The Board considered that the Fund would pay an advisory fee to the Advisor and that the Advisor would pay a sub-advisory fee to DSM out of the advisory fee. The Board compared DSM’s proposed sub-advisory fee to the sub-advisory fee paid to Copper Rock, noting that the proposed sub-advisory fee was lower than the current sub-advisory fee on assets below $1 billion. The Board noted that the proposed sub-advisory fee to be paid to DSM for managing the Fund will be identical to the sub-advisory fee paid to DSM for managing the International Growth Opportunities Fund. The Board considered the amount of the advisory fee to be retained by the Advisor and the amount to be paid to DSM with respect to the various services to be provided by the Advisor and DSM. Based upon their review, the Trustees concluded that the Fund’s proposed sub-advisory fee was reasonable in light of the services to be provided to the Fund by DSM.
Fund Performance.The Board considered DSM’s investment performance and the Fund’s investment performance under the management of Copper Rock. The Trustees also took into consideration the investment performance of the International Growth Opportunities Fund relative to that of the Fund and its benchmark index.
Conclusion. The Board reached the following conclusions regarding the New Sub-Advisory Agreement: (a) DSM is qualified to manage the Fund’s assets in accordance with the Fund’s new investment goal and principal investment strategies; (b) DSM maintains an appropriate compliance program; (c) the Fund’s proposed sub-advisory fee is reasonable in relation to the services to be provided to the Fund by DSM; and (d) DSM’s proposed investment strategies are appropriate for managing the Fund. In considering the approval of the New Sub-Advisory Agreement, the Board, including the Independent Trustees, did not identify any single factor as controlling, and each Trustee attributed different weights to the various factors. Based on its conclusions, the Board, including a majority of the Independent Trustees, determined that approval of the New Sub-Advisory Agreement was in the best interests of the Fund.
Other Items (Unaudited) (Continued)
Basis for Board’s Approval of Interim Sub-Advisory Agreement
Touchstone International Small Cap Fund
In connection with the approval of DSM as the sub-advisor to the Fund at the Meeting, the Advisor also proposed to the Board the appointment of Russell Implementation Services, Inc. (“Russell”), as the interim sub-advisor to the Fund. The Board approved the appointment of Russell as the interim sub-advisor, effective on May 22, 2020 through the effective date of the Repurposing.
The Advisor and Russell provided the Board with various written materials in advance of the Meeting to assist with the Board’s consideration of Russell as the Fund’s interim sub-advisor. The Advisor provided written and oral information stating the basis for its recommendation to engage Russell as an interim sub-advisor. The information also included details regarding Russell’s: (a) investment philosophy and investment process; (b) investment management services proposed to be provided to the Fund; (c) investment management personnel; (d) operating history, infrastructure and financial condition; (e) proposed interim sub-advisory fee that would be paid to Russell by the Advisor; and (f) reputation, expertise and resources as an interim investment advisor. The Board then discussed the written materials that the Board received before the Meeting and all other information that the Board received at the Meeting.
The Board, including the Independent Trustees of the Trust, voting separately, unanimously determined that the proposal to approve the Interim Sub-Advisory Agreement for the Fund would be in the best interests of the Fund and its shareholders. In approving the Interim Sub-Advisory Agreement, the Board considered various factors, among them: (1) the nature, extent, and quality of services to be provided by Russell to the Fund, including the investment personnel who would be providing such services; (2) Russell’s proposed compensation; (3) Russell’s past performance; and (4) the terms of the Interim Sub-Advisory Agreement. The Board’s analysis of these factors is set forth below. The Independent Trustees were advised by independent legal counsel throughout the process.
Nature, Extent and Quality of Services Provided; Investment Personnel. The Board considered information provided by the Advisor regarding the services to be provided by Russell. The Board considered Russell’s level of knowledge and investment style. The Board reviewed the experience and credentials of the investment personnel who would be responsible for managing the investment of portfolio securities with respect to the Fund. The Board also took into consideration that the Advisor was satisfied with Russell’s in-house risk and compliance teams.
Russell’s Compensation. The Board took into consideration the financial condition of Russell and any direct and indirect benefits to be derived by Russell’s relationship with the Fund. In considering the anticipated level of profitability to Russell, the Board noted the proposed contractual undertaking of the Advisor to maintain expense limitations for the Fund and also noted that the interim sub-advisory fee under the Interim Sub-Advisory Agreement would be paid by the Advisor out of the advisory fee that it receives from the Fund, and that the interim sub-advisory fee was negotiated at arm’s length between the Advisor and Russell. As a consequence, the anticipated level of profitability to Russell from its relationship with the Fund was not a substantial factor in the Board’s deliberations. For similar reasons, the Board did not consider potential economies of scale in Russell’s management of the Fund to be a substantial factor in its consideration.
Interim Sub-Advisory Fee and Fund Performance. The Board considered that the Fund would pay an advisory fee to the Advisor and that the Advisor would pay an interim sub-advisory fee to Russell out of that advisory fee. The Board also compared Russell’s proposed interim sub-advisory fee to the sub-advisory fees paid to Copper Rock, noting that the proposed interim sub-advisory fee schedule to Russell was significantly less than Copper Rock’s sub-advisory fee schedule. The Board considered the amount of the advisory fee to be retained by the Advisor and the amount to be paid to Russell, with respect to the various services to be provided by the Advisor and Russell. The Board also noted that the Advisor negotiated the interim sub-advisory fee with Russell at arm’s length.
The Board also considered Russell’s investment performance and the Fund’s performance record under Copper Rock’s management. The Trustees also noted that Russell has extensive experience providing transition services, including interim management, to the Touchstone Funds complex during sub-advisor transitions and that the Advisor was satisfied with Russell’s management of those funds. Based upon their review, the Trustees concluded that the Fund’s proposed interim sub-advisory fee was reasonable in light of the services to be received by the Fund from Russell.
Conclusion. The Board reached the following conclusions regarding the Interim Sub-Advisory Agreement: (a) Russell is qualified to manage the Fund’s assets in accordance with the Fund’s investment goal and policies; (b) Russell maintains an appropriate compliance program; (c) the Fund’s proposed interim sub-advisory fee is reasonable in relation to the fees of similar funds and the services to be provided by Russell; and (d) Russell’s proposed investment strategies are appropriate for pursuing the investment goal of the Fund. In considering the approval of the Interim Sub-Advisory Agreement, the Board, including the Independent Trustees, did not identify any single factor as controlling, and each Trustee attributed different weights to the various factors. Based on its conclusions, the Board determined that approval of the Interim Sub-Advisory Agreement was in the best interests of the Fund and its shareholders.
Management of the Trust (Unaudited)
Listed below is required information regarding the Trustees and Principal Officers of the Trust. The Trust’s Statement of Additional Information includes additional information about the Trustees and is available, without charge, upon request by calling 1.800.543.0407 or by visiting the Touchstone website at Touchstone Investments.com.
| Interested Trustee1: | | | | | | | | |
| | | | | | | | | Number | | |
| | | | | | | | | of Funds | | |
| | | | | | | | | Overseen | | |
| | | | | Term of | | | | in the | | |
| Name | | Position(s) | | Office And | | | | Touchstone | | Other |
| Address | | Held with | | Length of | | Principal Occupation(s) | | Fund | | Directorships |
| Year of Birth | | Trust | | Time Served | | During Past 5Years | | Complex2 | | Held During the Past 5 Years3 |
Jill T. McGruder
Touchstone Advisors, Inc.
303 Broadway
Suite 1100
Cincinnati, Ohio 45202
Year of Birth: 1955 | | Trustee and President | | Until retirement at age 75 or until she resigns or is removed Trustee since 1999 | | President, Director and CEO of IFS Financial Services, Inc. (a holding company) since 1999; and Senior Vice President and Chief Marketing Officer of Western & Southern Financial Group, Inc. (a financial services company) since 2016. | | 40 | | Director, Integrity Life Insurance Co. and National Integrity Life Insurance Co. since 2005; Director, Touchstone Securities (the Distributor) since 1999; Director, Touchstone Advisors (the Advisor) since 1999; Director, W&S Brokerage Services, Inc. since 1999; Director, W&S Financial Group Distributors, Inc. since 1999; Director, Insurance Profillment Solutions LLC since 2014; Director, Columbus Life Insurance Co. since 2016; Director, The Lafayette Life Insurance Co. since 2016; Director, Gerber Life Insurance Company since 2019; Director, Western & Southern Agency, Inc. since 2018; and Director, LL Global, Inc. (not-for-profit trade organization with operating divisions LIMRA and LOMA) since 2016. |
| Independent Trustees: |
Karen Carnahan
c/o Touchstone Advisors, Inc.
303 Broadway
Suite 1100
Cincinnati, Ohio 45202
Year of Birth: 1954 | | Trustee | | Until retirement at age 75 or until she resigns or is removed Trustee since 2019 | | Retired; formerly Chief Operating Officer of Shred-it (a business services company) from 2014 to 2015; formerly President & Chief Operating Officer of the document management division of Cintas Corporation (a business services company) from 2008 to 2014. | | 40 | | Director, Cintas Corporation since 2019; Director, Boys & Girls Club of West Chester/Liberty since 2016; and Board of Advisors, Best Upon Request since 2020. |
Phillip R. Cox
c/o Touchstone Advisors, Inc.
303 Broadway
Suite 1100
Cincinnati, Ohio 45202
Year of Birth: 1947 | | Trustee | | Until retirement at age 75 or until he resigns or is removed Trustee since 1999 | | President and CEO of Cox Financial Corp. (a financial services company) since 1971. | | 40 | | Director, Cincinnati Bell from 1994 to 2019; Director, Bethesda Inc. (hospital) since 2005; Director, Timken Co. (manufacturing) from 2004 to 2014; Director, TimkenSteel from 2014 to 2019; Director, Diebold, Inc. (technology solutions) since 2004; and Director, Ohio Business Alliance for Higher Education and the Economy since 2005. |
William C. Gale
c/o Touchstone Advisors, Inc.
303 Broadway
Suite 1100
Cincinnati, Ohio 45202
Year of Birth: 1952 | | Trustee | | Until retirement at age 75 or until he resigns or is removed Trustee since 2013 | | Retired; formerly Senior Vice President and Chief Financial Officer (from 1995 to 2015) of Cintas Corporation (a business services company). | | 40 | | None. |
Susan J. Hickenlooper, CFA
c/o Touchstone Advisors, Inc.
303 Broadway
Suite 1100
Cincinnati, Ohio 45202
Year of Birth: 1946 | | Trustee | | Until retirement at age 75 or until she resigns or is removed Trustee since 2009 | | Retired from investment management. | | 40 | | Trustee, Episcopal Diocese of Southern Ohio from 2014 to 2018. |
Kevin A. Robie
c/o Touchstone Advisors, Inc.
303 Broadway
Suite 1100
Cincinnati, Ohio 45202
Year of Birth: 1956 | | Trustee | | Until retirement at age 75 or until he resigns or is removed Trustee since 2013 | | Retired; formerly Vice President of Portfolio Management at Soin LLC (private multinational holding company and family office) from 2004 to 2020. | | 40 | | Director, SaverSystems, Inc. since 2015; Director, Buckeye EcoCare, Inc. from 2013 to 2018; Director, Turner Property Services Group, Inc. since 2017; Trustee, Dayton Region New Market Fund, LLC (private fund) since 2010; and Trustee, Entrepreneurs Center, Inc. (business incubator) since 2006. |
Management of the Trust (Unaudited) (Continued)
| Independent Trustees (Continued): |
| | | | | | | | | Number | | |
| | | | | | | | | of Funds | | |
| | | | | | | | | Overseen | | |
| | | | | Term of | | | | in the | | |
| Name | | Position(s) | | Office And | | | | Touchstone | | Other |
| Address | | Held with | | Length of | | Principal Occupation(s) | | Fund | | Directorships |
| Year of Birth | | Trust | | Time Served | | During Past 5Years | | Complex2 | | Held During the Past 5 Years3 |
William H. Zimmer III
c/o Touchstone Advisors, Inc.
303 Broadway Suite 1100
Cincinnati, Ohio 45202
Year of Birth: 1953 | | Trustee | | Until retirement at age 75 or until he resigns or is removed Trustee since 2019 | | Independent Treasury Consultant since 2014. | | 40 | | Director, Deaconess Associations, Inc. (healthcare) since 2001; Trustee, Huntington Funds (mutual funds) from 2006 to 2015; and Director, National Association of Corporate Treasurers from 2011 to 2015. |
| 1 | Ms. McGruder, as a director of the Advisor and the Distributor, and an officer of affiliates of the Advisor and the Distributor, is an “interested person” of the Trust within the meaning of Section 2(a) (19) of the 1940 Act. |
| 2 | As of June 30, 2020, the Touchstone Fund Complex consists of 19 series of the Trust, 13 series of Touchstone Funds Group Trust, 1 series of Touchstone Institutional Funds Trust, and 7 variable annuity series of Touchstone Variable Series Trust. |
| 3 | Each Trustee is also a Trustee of Touchstone Funds Group Trust, Touchstone Institutional Funds Trust, and Touchstone Variable Series Trust. |
| Principal Officers: | | | | | | |
| Name | | Position(s) | | | | |
| Address | | Held with | | Term of Office and | | Principal Occupation(s) |
| Year of Birth | | Trust1 | | Length of Time Served | | During Past 5 Years |
Jill T. McGruder
Touchstone Advisors, Inc.
303 Broadway Suite 1100
Cincinnati, Ohio 45202
Year of Birth: 1955 | | President and Trustee | | Until resignation, removal or disqualification President since 2006 | | See biography above. |
Steven M. Graziano
Touchstone Advisors, Inc.
303 Broadway Suite 1100
Cincinnati, Ohio 45202
Year of Birth: 1954 | | Vice President | | Until resignation, removal or disqualification Vice President since 2009 | | President of Touchstone Advisors, Inc. |
Timothy D. Paulin
Touchstone Advisors, Inc.
303 Broadway Suite 1100
Cincinnati, Ohio 45202
Year of Birth: 1963 | | Vice President | | Until resignation, removal or disqualification Vice President since 2010 | | Senior Vice President of Investment Research and Product Management of Touchstone Advisors, Inc. |
Timothy S. Stearns
Touchstone Advisors, Inc.
303 Broadway Suite 1100
Cincinnati, Ohio 45202
Year of Birth: 1963 | | Chief Compliance Officer | | Until resignation, removal or disqualification Chief Compliance Officer since 2013 | | Chief Compliance Officer of Touchstone Advisors, Inc. |
Terrie A. Wiedenheft
Touchstone Advisors, Inc.
303 Broadway Suite 1100
Cincinnati, Ohio 45202
Year of Birth: 1962 | | Controller and Treasurer | | Until resignation, removal or disqualification Controller and Treasurer since 2006 | | Senior Vice President, Chief Financial Officer and Chief Operations Officer, of IFS Financial Services, Inc. (a holding company). |
Meredyth A. Whitford
Western & Southern
Financial Group
400 Broadway
Cincinnati, Ohio 45202
Year of Birth: 1981 | | Secretary | | Until resignation, removal or disqualification Secretary since 2018 | | Counsel - Securities/Mutual Funds of Western & Southern Financial Group (2015 to present); Associate at Morgan Lewis & Bockius LLP (law firm) (2014 to 2015); Associate at Bingham McCutchen LLP (law firm) (2008 to 2014) |
1 Each officer also holds the same office with Touchstone Funds Group Trust, Touchstone Institutional Funds Trust, and Touchstone Variable Series Trust.
This page intentionally left blank.
This page intentionally left blank.
PRIVACY PROTECTION POLICY
We Respect Your Privacy
Thank you for your decision to invest with us. Touchstone and its affiliates have always placed a high value on the trust and confidence our clients place in us. We believe that confidence must be earned and validated through time. In today’s world, when technology allows the sharing of information at light speeds, trust must be reinforced by our sincere pledge to take the steps necessary to ensure that the information you share with us is treated with respect and confidentiality.
Our Pledge to Our Clients
| · | We collect only the information we need to service your account and administer our business. |
| · | We are committed to keeping your information confidential and we place strict limits and controls on the use and sharing of your information. |
| · | We make every effort to ensure the accuracy of your information. |
We Collect the Following Nonpublic Personal Information About You:
| · | Information we receive from you on or in applications or other forms, correspondence, or conversations, including, but not limited to, your name, address, phone number, social security number, assets, income and date of birth; and |
| · | Information about your transactions with us, our affiliates, or others, including, but not limited to, your account number and balance, payment history, parties to transactions, cost basis information, and other financial information. |
Categories of Information We Disclose and Parties to Whom We Disclose
We do not disclose any nonpublic personal information about our current or former clients to nonaffiliated third parties, except as required or permitted by law.
We Place Strict Limits and Controls on the Use and Sharing of Your Information
| · | We restrict access to nonpublic personal information about you to authorized employees who need the information to administer your business. |
| · | We maintain physical, electronic and procedural safeguards that comply with federal standards to protect this information. |
| · | We do not disclose any nonpublic personal information about our current or former clients to anyone, except as required or permitted by law or as described in this document. |
| · | We will not sell your personal information to anyone. |
We May Provide Information to Service Your Account
Sometimes it is necessary to provide information about you to various companies such as transfer agents, custodians, broker-dealers and marketing service firms to facilitate the servicing of your account. These organizations have a legitimate business need to see some of your personal information in order for us to provide service to you. We may disclose to these various companies the information that we collect as described above. We require that these companies, including our own subsidiaries and affiliates, strictly maintain the confidentiality of this information and abide by all applicable laws. Companies within our corporate family that may receive this information are financial service providers and insurance companies. We do not permit these associated companies to sell the information for their own purposes, and we never sell our customer information.
This policy is applicable to the following affiliated companies: Touchstone Funds Group Trust, Touchstone Strategic Trust, Touchstone Variable Series Trust, Touchstone Institutional Funds Trust, Touchstone Securities, Inc.,* and W&S Brokerage Services, Inc.
* Touchstone Securities, Inc. serves as the underwriter to the Touchstone Funds.
Member of Western & Southern Financial Group®
The Privacy Protection Policy is not part of the Annual Report.


Touchstone Investments
Distributor
Touchstone Securities, Inc.*
303 Broadway
Cincinnati, Ohio 45202-4203
800.638.8194
www.touchstoneinvestments.com
Investment Advisor
Touchstone Advisors, Inc.*
303 Broadway
Cincinnati, Ohio 45202-4203
Transfer Agent
BNY Mellon Investment Servicing (US) Inc.
4400 Computer Drive
Westborough, Massachusetts 01581
Shareholder Service
800.543.0407
* A Member of Western & Southern Financial Group
TSF-54BB-TST-AR-2006
Item 2. Code of Ethics.
| (a) | The registrant, as of the end of the period covered by this report, has adopted a code of ethics that applies to the registrant’s principal executive officer, principal financial officer, principal accounting officer or controller, or persons performing similar functions, regardless of whether these individuals are employed by the registrant or a third party. |
| (c) | There have been no amendments, during the period covered by this report, to a provision of the code of ethics that applies to the registrant’s principal executive officer, principal financial officer, principal accounting officer or controller, or persons performing similar functions, regardless of whether these individuals are employed by the registrant or a third party, and that relates to any element of the code of ethics description. |
| (d) | The registrant has not granted any waivers, including an implicit waiver, from a provision of the code of ethics that applies to the registrant’s principal executive officer, principal financial officer, principal accounting officer or controller, or persons performing similar functions, regardless of whether these individuals are employed by the registrant or a third party, that relates to one or more of the items set forth in paragraph (b) of this item’s instructions. |
| (f) | A copy of the code of ethics is attached hereto as Exhibit 13(a)(1). |
Item 3. Audit Committee Financial Expert.
The registrant’s Board of Trustees has determined that the registrant has at least one audit committee financial expert serving on its audit committee. Mr. William Gale is the registrant’s audit committee financial expert and is an independent trustee within the meaning of the Investment Company Act of 1940, as amended (the “1940 Act”).
Item 4. Principal Accountant Fees and Services.
Audit Fees
| (a) | Audit fees for Touchstone Strategic Trust (June Funds) totaled $203,400 and $217,100 for the fiscal years ended June 30, 2020 and June 30, 2019, respectively. The fees relate to the annual audit or for services normally provided by Ernst & Young LLP in connection with statutory and regulatory filings or engagements. |
Audit-Related Fees
| (b) | The aggregate fees billed in each of the last two fiscal years for assurance and related services by the principal accountant that are reasonably related to the performance of the audit of the registrant's financial statements and are not reported under paragraph (a) of this Item are $8,000 and $0 for the fiscal years ended June 30, 2020 and June 30, 2019, respectively. The fees for the June 30, 2020 fiscal year relate to the review of Form N-14 filings. |
Tax Fees
| (c) | The aggregate fees billed in each of the last two fiscal years for professional services rendered by the principal accountant for tax compliance, tax advice, and tax planning were $69,985 and $88,085 for the fiscal years ended June 30, 2020 and June 30, 2019, respectively. The fees relate to the preparation of federal income and excise tax returns, review of capital gains distribution calculations and tax agent services. |
All Other Fees
| (d) | The aggregate fees billed in each of the last two fiscal years for products and services provided by the principal accountant, other than the services reported in paragraphs (a) through (c) of this Item are $40,675 and $28,089 for the fiscal years ended June 30, 2020 and June 30, 2019, respectively. The fees relate to the PFIC Analyzer and Global Withholding Tax Reporter subscriptions. |
| (e)(1) | Disclose the audit committee's pre-approval policies and procedures described in paragraph (c)(7) of Rule 2-01 of Regulation S-X. |
The Audit Committee’s pre-approval policies describe the types of audit, audit-related, tax and other services that have the general pre-approval of the Audit Committee. The pre-approval policies provide that annual audit service fees, tax services not specifically granted pre-approval, services exceeding pre-approved cost levels and other services that have not received general pre-approval will be subject to specific pre-approval by the Audit Committee. The pre-approval policies further provide that the Committee may grant general pre-approval to other audit services (statutory audits and services associated with SEC registration statements, periodic reports and other documents filed with the SEC or other documents issued in connection with securities offerings), audit-related services (accounting consultations related to accounting, financial reporting or disclosure matters not classified as “audit services,” assistance with understanding and implementing new accounting and financial reporting guidance from rulemaking authorities, agreed-upon or expanded audit procedures related to accounting and/or billing records required to respond to or comply with financial, accounting or regulatory reporting matters and assistance with internal control reporting requirements under Form N-CSR), tax services that have historically been provided by the auditor that the Committee believes would not impair the independence of the auditor and are consistent with the SEC’s rules on auditor independence and permissible non-audit services classified as “all other services” that are routine and recurring services.
| (e)(2) | All services described in paragraphs (b) through (d) of Item 4 were approved by the Audit Committee. |
| (f) | The percentage of hours expended on the principal accountant's engagement to audit the registrant's financial statements for the most recent fiscal year that were attributed to work performed by persons other than the principal accountant's full-time, permanent employees was less than fifty percent. |
| (g) | The aggregate non-audit fees for Touchstone Strategic Trust (June Funds) and certain entities*, totaled approximately $890,010 and $680,755 for the fiscal years ended June 30, 2020 and June 30, 2019, respectively. |
* These include the advisors (excluding sub-advisors) and any entity controlling, controlled by or under common control with the advisors that provides ongoing services to the registrant (Funds).
| (h) | The registrant's audit committee of the board of trustees has considered whether the provision of non-audit services that were rendered to the registrant's investment adviser (not including any sub-adviser whose role is primarily portfolio management and is subcontracted with or overseen by another investment adviser), and any entity controlling, controlled by, or under common control with the investment adviser that provides ongoing services to the registrant that were not pre-approved pursuant to paragraph (c)(7)(ii) of Rule 2-01 of Regulation S-X is compatible with maintaining the principal accountant's independence. |
Item 5. Audit Committee of Listed Registrants.
Not applicable.
Item 6. Investments.
| (a) | Schedule of Investments in securities of unaffiliated issuers as of the close of the reporting period is included as part of the report to shareholders filed under Item 1 of this form. |
Item 7. Disclosure of Proxy Voting Policies and Procedures for Closed-End Management Investment Companies.
Not applicable.
Item 8. Portfolio Managers of Closed-End Management Investment Companies.
Not applicable.
Item 9. Purchases of Equity Securities by Closed-End Management Investment Company and Affiliated Purchasers.
Not applicable.
Item 10. Submission of Matters to a Vote of Security Holders.
There have been no material changes to the procedures by which the shareholders may recommend nominees to the registrant’s board of trustees, where those changes were implemented after the registrant last provided disclosure in response to the requirements of Item 407(c)(2)(iv) of Regulation S-K (17 CFR 229.407) (as required by Item 22(b)(15) of Schedule 14A (17 CFR 240.14a-101)), or this Item.
Item 11. Controls and Procedures.
| (a) | The registrant’s principal executive and principal financial officers, or persons performing similar functions, have concluded that the registrant’s disclosure controls and procedures (as defined in Rule 30a-3(c) under the Investment Company Act of 1940, as amended (the “1940 Act”) (17 CFR 270.30a-3(c))) are effective, as of a date within 90 days of the filing date of the report that includes the disclosure required by this paragraph, based on their evaluation of these controls and procedures required by Rule 30a-3(b) under the 1940 Act (17 CFR 270.30a-3(b)) and Rules 13a-15(b) or 15d-15(b) under the Securities Exchange Act of 1934, as amended (17 CFR 240.13a-15(b) or 240.15d-15(b)). |
| (b) | There were no changes in the registrant’s internal control over financial reporting (as defined in Rule 30a-3(d) under the 1940 Act (17 CFR 270.30a-3(d))) that occurred during the period covered by this report that has materially affected, or is reasonably likely to materially affect, the registrant’s internal control over financial reporting. |
Item 12. Disclosure of Securities Lending Activities for Closed-End Management Investment Companies.
Not applicable.
Item 13. Exhibits.
SIGNATURES
Pursuant to the requirements of the Securities Exchange Act of 1934 and the Investment Company Act of 1940, the registrant has duly caused this report to be signed on its behalf by the undersigned, thereunto duly authorized.
(Registrant) Touchstone Strategic Trust
By (Signature and Title)* /s/ Jill T. McGruder
Jill T. McGruder, President
(principal executive officer)
Date September 1, 2020
Pursuant to the requirements of the Securities Exchange Act of 1934 and the Investment Company Act of 1940, this report has been signed below by the following persons on behalf of the registrant and in the capacities and on the dates indicated.
By (Signature and Title)* /s/ Jill T. McGruder
Jill T. McGruder, President
(principal executive officer)
Date September 1, 2020
By (Signature and Title)* /s/ Terrie A. Wiedenheft ��
Terrie A. Wiedenheft, Controller and Treasurer
(principal financial officer)
Date September 1, 2020
* Print the name and title of each signing officer under his or her signature.