UNITED STATES
SECURITIES AND EXCHANGE COMMISSION
Washington, D.C. 20549
FORM N-CSR
CERTIFIED SHAREHOLDER REPORT OF REGISTERED MANAGEMENT
INVESTMENT COMPANIES
Investment Company Act file number 811-03651
Touchstone Strategic Trust– June Funds
(Exact name of registrant as specified in charter)
303 Broadway, Suite 1100
Cincinnati, Ohio 45202-4203
(Address of principal executive offices) (Zip code)
Jill T. McGruder
303 Broadway, Suite 1100
Cincinnati, Ohio 45202-4203
(Name and address of agent for service)
Registrant's telephone number, including area code:800-638-8194
Date of fiscal year end:June 30
Date of reporting period:June 30, 2019
Form N-CSR is to be used by management investment companies to file reports with the Commission not later than 10 days after the transmission to stockholders of any report that is required to be transmitted to stockholders under Rule 30e-1 under the Investment Company Act of 1940 (17 CFR 270.30e-1). The Commission may use the information provided on Form N-CSR in its regulatory, disclosure review, inspection, and policymaking roles.
A registrant is required to disclose the information specified by Form N-CSR, and the Commission will make this information public. A registrant is not required to respond to the collection of information contained in Form N-CSR unless the Form displays a currently valid Office of Management and Budget ("OMB") control number. Please direct comments concerning the accuracy of the information collection burden estimate and any suggestions for reducing the burden to Secretary, Securities and Exchange Commission, 450 Fifth Street, NW, Washington, DC 20549-0609. The OMB has reviewed this collection of information under the clearance requirements of 44 U.S.C. § 3507.
Item 1. Reports to Stockholders.
The Report to Shareholders is attached herewith.
June 30, 2019
Annual Report
| Touchstone Strategic Trust |
| Touchstone Balanced Fund |
| Touchstone Credit Opportunities Fund |
| Touchstone International Equity Fund |
| Touchstone International Growth Opportunities Fund |
| Touchstone International Small Cap Fund |
| Touchstone Large Cap Focused Fund |
| Touchstone Large Cap Fund |
| Touchstone Large Company Growth Fund |
| Touchstone Ohio Tax-Free Bond Fund |
| Touchstone Small Company Fund |
| Touchstone Value Fund |
IMPORTANT NOTE: Beginning on January 1, 2021, as permitted by regulations adopted by the Securities and Exchange Commission, paper copies of the Touchstone Funds’ annual and semi-annual shareholder reports will no longer be sent by mail, unless you specifically request paper copies of the shareholder reports from Touchstone Funds or from your financial intermediary, such as a broker-dealer or bank. Instead, annual and semi-annual shareholder reports will be available on the Touchstone Funds’ website (TouchstoneInvestments.com/Resources), and you will be notified by mail each time a report is posted and provided with a website link to access the report.
You may elect to receive all future annual and semi-annual shareholder reports in paper, free of charge. If you already elected to receive shareholder reports electronically, you will not be affected by this change and you need not take any action. To elect to receive paper copies of shareholder reports through the mail or otherwise change your delivery method, contact your financial intermediary or, if you hold your shares directly through Touchstone Funds, visit TouchstoneInvestments.com/Resources/Edelivery or call Touchstone Funds toll-free at 1.800.543.0407. Your election to receive shareholder reports in paper will apply to all Touchstone Funds that you hold through the financial intermediary, or directly with Touchstone.

Table of Contents
This report identifies the Funds' investments on June 30, 2019. These holdings are subject to change. Not all investments in each Fund performed the same, nor is there any guarantee that these investments will perform as well in the future. Market forecasts provided in this report may not occur.
Letter from the President
Dear Shareholder:
We are pleased to provide you with the Touchstone Strategic Trust Annual Report. Inside is key financial information, as well as manager commentaries for the Funds, for the 12 months ended June 30, 2019.
Over the past year, the post-crisis equity bull market was resilient once again. Global stocks declined from peak levels into correction territory before returning back to near-peak levels. Central banks, especially the U.S. Federal Reserve Board (Fed), appeared to be the primary driver of the sentiment supporting the markets. The weakness in late 2018 was partially attributable to the Fed’s hawkish positioning amid a softening global economic backdrop. In contrast, a chorus of neutral-to-dovish policy pronouncements and the potential for stimulus from the big three central banks (U.S., EU and Japan), as well as fiscal stimulus in China, supported a risk rally during the first half of 2019.
During the period, investors found footing on the hope of stimulus to climb a “wall of worry” that included: the U.S. and China “trade war,” geopolitical instability in Europe and the outlook of slowing global growth. U.S. economic data was generally strong until the tail end of 2018 when some indicators – including home and auto sales, and consumer confidence – suggested a slowdown was emerging. Decelerating growth in major economies outside the U.S. became more evident as well, though none entered recessionary territory. Mounting economic growth worries combined with the Fed’s pace of interest rate hikes pressured risk assets. The Fed responded with a pause to its monetary policy normalization which continued through the second quarter of 2019. This policy sentiment shift inspired a rally in the market to start 2019 and created one of the best quarters of the last decade for domestic stocks. The first quarter of 2019 erased the drawdown at the close of 2018 and led to continued gains in the second quarter.
In the U.S., growth-oriented stocks continued to lead equity markets over their value-oriented counterparts, while large capitalization stocks outperformed small- and mid-capitalization stocks. Outside the U.S., emerging market and developed market equities exhibited the same peak-trough-recovery pattern as U.S. equities, but finished slightly down in U.S. dollar terms due to dollar strength during the period.
The Fed’s rate hikes pushed short-term rates higher over 2018 while rates on longer maturities fell. The result was a significantly flatter yield curve, giving rise to fears throughout the year of a yield curve inversion, which historically has been a leading indicator of recessions. In 2019, these concerns were realized as there was a brief inversion during the first quarter, despite the broader risk rally. Demand for U.S. Treasuries remained strong given the weaker economic environment and relatively high yields compared to many developed sovereign issuers in 2019. From a credit rating perspective, spreads reflected the risk appetite of investors during the period, widening in the latter half of 2018 followed by narrowing in 2019. This narrowing was a tailwind for most investment-grade and high yield corporate bonds. Floating rate securities underperformed their fixed coupon peers given the potential for a rate cut as the Fed became more dovish.
Periods such as these help remind us of the importance of the steady hands of financial professionals, the confidence you must have in your investment strategy and the risks of trying to time the market. Furthermore, we believe that more volatile environments create more opportunity for active managers, especially those who are distinctively active that seek to add value.
Letter from the President(Continued)
We greatly value your continued support. Thank you for including Touchstone as part of your investment plan.
Sincerely,

Jill T. McGruder
President
Touchstone Strategic Trust
Management's Discussion of Fund Performance(Unaudited)
Touchstone Balanced Fund
Sub-Advised by Fort Washington Investment Advisors, Inc.
Investment Philosophy
The Fund seeks to achieve its investment goal of providing investors with capital appreciation and current income by generally investing in a diversified portfolio comprising 60 percent equity securities and 40 percent fixed-income securities.
With respect to equities, the Fund invests primarily in issuers having a market capitalization, at the time of purchase, above $5 billion. Equity securities include common stock and preferred stock. With respect to fixed-income, the Fund invests primarily in bonds, including mortgage-related securities, asset-backed securities, government securities (both U.S. government securities and foreign sovereign debt), and corporate debt securities.
Fund Performance
The Touchstone Balanced Fund (Class A Shares) underperformed its first benchmark, the S&P 500 Index, and outperformed its second benchmark, the Bloomberg Barclays U.S. Aggregate Bond Index, for the 12-month period ended June 30, 2019. The Fund’s total return was 10.13 percent (calculated excluding the maximum sales charge), while the total return of the S&P 500 Index was 10.42 percent and the total return of the Bloomberg Barclays U.S. Aggregate Bond Index was 7.87 percent.
Market Environment
Over the twelve month period, U.S. equities recorded positive returns primarily due to strong U.S. corporate earnings, moderate growth across global economies and mostly accommodative U.S. Federal Reserve Board (Fed) policy. In the third quarter of 2018, the U.S. equity market moved higher driven primarily by strong corporate earnings and economic growth. Volatility returned in the fourth quarter with all sectors within the S&P 500 Index, except Utilities, recording negative returns. U.S. equity markets then had a strong first quarter, as fears that dragged the market lower in the fourth quarter of 2018 were somewhat relieved. In the second quarter of 2019, U.S. equity markets continued to move higher as the Fed and other central banks sent signals about accommodative policy and investors perceived less risk from U.S.-China trade tensions. Over the one year period ended June 30, 2019, sectors that outperformed the broader index the most during the year were Utilities, Consumer Staples and Information Technology.
Over the latter half of 2018, credit spreads widened and U.S. Treasury yields increased during the risk-off environment. Many of the factors that drove the risk-off move in the fourth quarter abated – escalation of the trade war with China, rising interest rates led by the Federal Open Market Committee (FOMC), and general fear of a slowdown in global growth – causing credit to recover the majority of losses early in 2019. Despite the pause in tighter policy, the Fed continued to communicate a relatively positive outlook for the U.S. economy, citing a robust labor market, modest wage growth and core inflation well below the 2 percent target to start the year. However, after recognizing a deceleration in growth and tighter financial conditions, the Fed made a pivot in their policy during the second quarter of 2019 to being more dovish with the very real possibility of a rate cut in July. The yield curve responded by inverting, with yields for 6-month U.S. Treasuries posting higher than that of the 10-year U.S. Treasury, an omen that many believe to be a precursor to a recession. At the end of the second quarter, the curve remained inverted, with the 10-year U.S. Treasury yielding 2.00 percent down from 2.70 percent to start 2019.
Portfolio Review
Among the equity sectors within the Fund that outperformed their respective sectors within the benchmark were Industrials, Information Technology, Financials and Consumer Discretionary. Real Estate, Materials and
Management's Discussion of Fund Performance(Unaudited) (Continued)
Consumer Staples were among the underperforming sectors. Overall, stock selection within the Fund drove the relative outperformance within the equity allocation. Among the stocks that contributed the most to performance were Visa Inc. (Information Technology sector), Microsoft Corp. (Information Technology sector) and McDonald’s Corp. (Consumer Discretionary sector). Schlumberger Ltd. (Energy sector), EOG Resources Inc. (Energy sector) and The Kraft Heinz Co. (Consumer Staples sector) were among the stocks that detracted the most.
With credit spreads tightening during the period, the Fund’s typical overweight to risk assets was beneficial to performance. The Fund’s allocation to U.S. dollar denominated Emerging Markets debt also contributed. Securitized assets, Mortgage-Backed Securities, Asset-Backed Securities and Commercial Mortgage-Backed Securities underperformed U.S. Treasuries making that allocation a relative detractor.
Outlook
Overall, our outlook supports the Fund’s overweight to risk assets driven by U.S. economic growth, stable inflation, amicable resolutions to trade disputes and relatively accommodative central bank policy both domestically and abroad. Broad financial conditions eased after tightening earlier in the year with the rally in equities and credit spreads in conjunction with the Fed’s dovish pivot on rates. As a result, financial conditions are now neutral-to-growth with the possibility of becoming a tailwind if the FOMC cuts rates in July as the market is anticipating. Trade disputes, specifically between the U.S. and China, appear to be coming to an amicable agreement, and if one is reached within the next quarter, markets should respond positively to risk assets, benefiting positioning of the Fund.
Traditional, absolute equity valuation measures have adjusted over the recent months and we believe they are fair on a historical basis. Relative to U.S. Treasuries, we believe they are undervalued. Earnings growth has been strong and valuations have become more attractive, providing opportunity for price appreciation.
Within fixed income, the level of interest rates primarily reflects significant easing, especially in the front end of the yield curve. It also reflects the uncertainty surrounding trade policy, global economic outlook and tighter financial conditions. In the near term, we believe downward pressure on interest rates should continue to persist in a slow global growth and low yield environment, likely with higher volatility. We believe the risks to higher interest rates include higher than expected growth and an acceleration in inflation. The fixed income portion of the Fund is duration and yield curve neutral versus the benchmark. We believe the yield curve is likely to steepen further from here given any dovish action by the Fed. We believe Treasury Inflation Protected Securities (TIPS), Emerging Markets debt and certain securitized subsectors offer attractive risk/reward profiles while High Yield remains relatively unattractive.
Management's Discussion of Fund Performance(Unaudited) (Continued)
Comparison of the Change in Value of a $10,000 Investment in the Touchstone Balanced Fund - Class A*, the S&P 500® Index and the Bloomberg Barclays U.S. Aggregate Bond Index
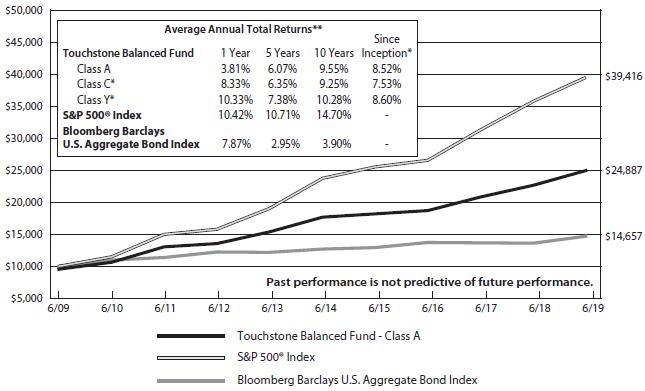
| * | The chart above represents performance of Class A shares only, which will vary from the performance of Class C shares and Class Y shares based on the differences in sales loads and fees paid by shareholders in the different classes. The inception date of Class A shares, Class C shares and Class Y shares was November 15, 1938, May 4, 1998 and August 27, 2007, respectively. Class C shares and Class Y shares performance information was calculated using the historical performance of Class A shares for periods prior to May 4, 1998 and August 27, 2007, respectively. The returns have been restated for sales loads and fees applicable to Class C and Class Y shares. The launch date of the S&P 500® Index and the Bloomberg Barclays U.S. Aggregate Bond Index was after the inception date of the Fund, therefore there is no return for inception. |
| ** | The average annual total returns shown above are adjusted for maximum sales loads and fees, if applicable. Effective August 17, 2018, the maximum offering price per share of Class A shares is equal to the net asset value (“NAV”) per share plus a sales load equal to 5.26% of the NAV (or 5.00% of the offering price). Prior to August 17, 2018, the maximum offering price per share of Class A shares was equal to the NAV per share plus a sales load equal to 6.10% of the NAV (or 5.75% of the offering price). Prior to October 28, 2017, the maximum offering price per share of Class A shares was equal to the NAV per share plus a sales load equal to 5.26% of the NAV (or 5.00% of the offering price). Class C shares are subject to a contingent deferred sales charge (“CDSC”) of 1.00%. The CDSC will be assessed on an amount equal to the lesser of (1) the NAV at the time of purchase of the shares being redeemed or (2) the NAV of such shares being redeemed, if redeemed within a one-year period from the date of purchase. Class Y shares are not subject to sales charges. |
The performance of the above Fund does not reflect the deduction of taxes that a shareholder would pay on Fund distributions or the redemption of Fund shares.
Notes to Chart
S&P 500® Index is a group of 500 widely held stocks and is commonly regarded to be representative of the large capitalization stock universe.
Bloomberg Barclays U.S. Aggregate Bond Index is an unmanaged index comprised of U.S. investment grade, fixed rate bond market securities, including government, government agency, corporate and mortgage-backed securities between one and ten years.
Management's Discussion of Fund Performance(Unaudited)
Touchstone Credit Opportunities Fund
Sub-Advised by Ares Capital Management II LLC
Investment Philosophy
The Touchstone Credit Opportunities Fund employs a flexible investment approach by allocating assets among core investments and opportunistic investments as market conditions change. It invests in several broad investment categories, including high yield bonds, bank loans, special situations, structured credit and hedges.
Fund Performance
The Touchstone Credit Opportunities Fund (Class A Shares) outperformed its benchmark, the ICE BofA Merrill Lynch 3-Month U.S. Treasury Bill Index, for the 12-month period ended June 30, 2019. The Fund’s total return was 6.69 percent (calculated excluding the maximum sales charge), while the total return of the benchmark was 2.31 percent.
Market Environment
Over the 12 months ending June 30, 2019, the capital markets environment was positive overall as a shift in central bank policy and healthy corporate fundamentals outweighed bouts of geopolitical and trade tension related volatility. Accommodative central bank policy returned in 2019 and contributed to renewed interest from both issuers and investors for the high yield bond asset class. The U.S. Federal Reserve Board’s (Fed) pause on future rate increases and revitalized stimulative effort by the European Central Bank (ECB) shaped investor sentiment during the first quarter of 2019 creating a tailwind for high yield bond prices; the asset class had its strongest quarter in over 15 years. Corporate fundamentals, although decelerating, remained healthy with key credit metrics supporting the benign default environment; and high yield and bank loan default rates remained well below historical averages. Multiple bouts of volatility occurred during the period, notably during the fourth quarter as credit spreads shifted from post-crisis tights to multi-year highs. In October 2018, the International Monetary Fund cut its global economic growth forecast citing the U.S.-China trade war and pressures on the emerging markets from rising rates. Combined with a Fed rate hike many viewed as a misstep, risk-off sentiment engulfed capital markets and led to a spread widening event despite metrics such as net leverage and interest coverage being stable to improving at the time. Capital markets experienced additional volatility in May 2019, as trade tensions influenced investor sentiment and weighed on asset prices.
Portfolio Review
From an asset class perspective, the Fund benefited from an overweight to high yield bonds during the period as the shift in rate policy has been a tailwind for high yield bond prices year-to-date. Within the high yield allocation, an underweight to Energy was critical during fourth quarter 2018’s spread widening as the segment underperformed amid a material decline in oil prices. The Fund’s bank loan allocation provided benefits during bouts of volatility in the last twelve months and was one of the few asset classes to generate a positive return in 2018. The Fund’s Structured Credit allocation continued to serve as an income enhancing tool with total return benefits coming from two Collateralized Loan Obligation (CLO) equity positions.
While focused on idiosyncratic risk, the Fund’s duration positioning during the period was generally supportive to returns due to the impact of central bank actions on demand for mid to long duration assets compared to the benchmark.
Over the course of the last 12 months, the Fund’s allocation to bank loans varied. The Fund took advantage of a technical dislocation in December, then ramped up its allocation as attractive bank loans were identified which lagged the initial January rally. The allocation to high yield bonds varied as the Fund traded around wavering demand and yield/spread trends in the asset class which have unfolded during the period. Allocations
Management's Discussion of Fund Performance(Unaudited) (Continued)
to Stressed/Distressed and Hedges positions were roughly flat during the period amid an overall positive macroeconomic and capital markets backdrop. The number of cash bond shorts were increased during the period as idiosyncratic opportunities were discovered in the Energy and Automotive industries.
Outlook
From a macro perspective, we believe several factors have impacted sentiment and asset prices year-to-date and will continue to do so moving forward. Trade tensions, central bank actions and macroeconomic data all swayed the sentiment of an increasingly anxious market during the second quarter and contributed to a volatile market backdrop. The potential of these factors to be a future source of volatility remains as trade discussion between the U.S. and China evolve, central banks attempt to engineer a smooth landing and data releases provide further insight to the go-forward direction of the global economy.
Corporate fundamentals are top of mind as well given our focus on bottom-up credit selection and the start of earnings season. We will continue to take a proactive approach to position sizing prior to earnings announcements in addition to utilizing the Fund’s flexibility for tactical opportunities both long and short.
Thematically, we continue to target bonds and loans trading at a discount or having an event-driven catalyst, such as mergers and acquisitions or a pay down of near-term maturities. In addition, we continue to take a tactical approach to Energy and trade around the price of oil and in companies in which we have a high conviction.
We believe these factors present challenges and opportunities from a portfolio construction perspective. We are consistently optimizing the portfolio in an attempt to cushion against market drawdowns and seeking to take advantage of relative value opportunities across the sub-investment grade credit market.
Management's Discussion of Fund Performance(Unaudited) (Continued)
Comparison of the Change in Value of a $10,000 Investment in the Touchstone Credit Opportunities Fund - Class A* and the ICE BofA Merrill Lynch 3-Month U.S. Treasury Bill Index
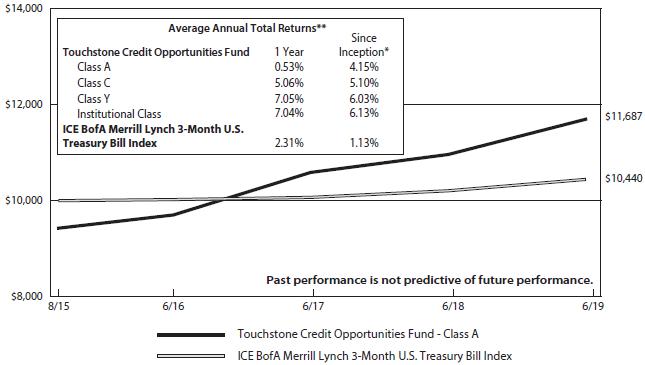
| * | The chart above represents performance of Class A shares only, which will vary from the performance of Class C shares, Class Y shares and Institutional Class shares based on the differences in sales loads and fees paid by shareholders in the different classes. The inception date of the Fund was August 31, 2015. The returns of the index listed above are based on the inception date of the Fund. |
| ** | The average annual total returns shown above are adjusted for maximum sales loads and fees, if applicable. Effective August 17, 2018, the maximum offering price per share of Class A shares is equal to the net asset value (“NAV”) per share plus a sales load equal to 5.26% of the NAV (or 5.00% of the offering price). Prior to August 17, 2018, the maximum offering price per share of Class A shares was equal to the NAV per share plus a sales load equal to 6.10% of the NAV (or 5.75% of the offering price). Class C shares are subject to a contingent deferred sales charge (“CDSC”) of 1.00%. The CDSC will be assessed on an amount equal to the lesser of (1) the NAV at the time of purchase of the shares being redeemed or (2) the NAV of such shares being redeemed, if redeemed within a one-year period from the date of purchase. Class Y shares and Institutional Class shares are not subject to sales charges. |
The performance of the above Fund does not reflect the deduction of taxes that a shareholder would pay on Fund distributions or the redemption of Fund shares.
Note to Chart
ICE BofA Merrill Lynch 3-Month U.S. Treasury Bill Index is an unmanaged index of Treasury securities maturing in 90 days that assumes reinvestment of all income.
Management's Discussion of Fund Performance(Unaudited)
Touchstone International Equity Fund
Sub-Advised by Fort Washington Investment Advisors, Inc.
Investment Philosophy
The Touchstone International Equity Fund invests primarily in common stocks of established large capitalization companies located in or that conduct their business mainly in one or more foreign countries, which may include emerging markets. The process starts with a regular quantitative screening or bottom up identification of companies that meet the investment profile of high returns on capital, operating margins and strong cash flow generation. These means of identifying companies narrows the investable universe. The Fund analyzes companies based on the following five fundamental factors: business quality, valuation, growth, management and balance sheet strength, focusing on quality at a reasonable price. This approach to portfolio construction seeks to result in a concentrated, high-conviction portfolio.
Fund Performance
The Touchstone International Equity Fund (Class A Shares) underperformed its benchmark, the MSCI EAFE Index, for the 12-month period ended June 30, 2019. The Fund’s total return was -0.78 percent (calculated excluding the maximum sales charge), while the total return of the benchmark was 1.08 percent.
Market Environment
The 12-month period ended June 30, 2019 was more volatile than it appeared from such a modest benchmark return. The benchmark was led by the Health Care and Consumer Staples sectors, as investors sought more defensive names while most economically sensitive cyclical sectors underperformed. The Energy sector was weaker driven by lower oil prices on slowing global demand despite rising geopolitical tensions in the Middle East. Broader market angst was driven by persistent concerns over escalating global trade tensions and slowing economic growth coupled with the backdrop of tightening monetary conditions in late 2018. As the period ended, the shift in policy stance by the U.S. Federal Reserve Board (Fed) and the European Central Bank was enough to lift global equities.
Portfolio Review
The Fund’s underperformance was mainly due to poor stock selection in the Financials, Energy, and Communications Services sectors. Conversely, gold miners within the Materials sector were among the bright spots for stock selection over the 12-month period. Geographically, the Fund’s positions in India and the Netherlands detracted most from relative performance whereas the Fund benefited from being underweight the lagging Japanese market as well as solid stock picking in the UK, Switzerland and Brazil.
Top detractors from relative performance over the fiscal year included PC Jeweller Ltd. (India, Consumer Discretionary sector), ITV plc (UK, Communication Services sector) and Indivior plc (UK, Health Care sector). The stock price of PC Jeweller, one of India’s leading branded jewelry makers and retailers, has been on a roller coaster ride for the past two years. The Indian jewelry market has been going through a structural transition as organized retailers such as PC Jeweller gain market share from the highly fragmented unorganized retailers. Market sentiment, however, continues to be negatively impacted by various, ultimately unfounded short seller rumors last year, as well as overall weakness among Indian smaller capitalization stocks. In addition the stock corrected sharply following a run up in price during the first quarter based on speculation of interest in the company from an offshore investor. We believe that there is a dramatic disconnect between the current valuation and the company’s underlying business, a disconnect which has been compounded by a number of sell side firms suspending coverage of the stock, though it will undoubtedly require a couple of quarters of solid business execution to help restore confidence among investors.
Management's Discussion of Fund Performance(Unaudited) (Continued)
ITV plc is the dominant advertising funded provider of free-to-air broadcasting services in the UK. It operates the largest commercial channel in the UK as well as a portfolio of digital channels. The company operates primarily in the UK, although its production arm develops content for local broadcasters in Australia, France, Germany, the Nordic regions and the U.S. The company generates about half of the group revenue from selling its high-quality content to third parties, helping the company combat the secular shift away from traditional TV viewing and therefore downward pressure on TV advertising. Nevertheless, ITV’s core business is highly operationally geared and the stock price continues to be negatively impacted by Brexit-fueled economic uncertainty, further weighing on advertising. In our opinion, however, the current depressed market price has largely factored in these concerns, as the stock price trades on a single digit price to earnings (P/E) multiple and is supported by a dividend yield above 7 percent.
Indivior plc is a specialty pharmaceutical company and a global leader in the treatment of opioid dependence, which has reached crisis proportions in the U.S. and other developed countries. The company was formed by a demerger from its parent, Reckitt Benckiser. While Indivior has been successful at releasing new formulations of its products, generic competition remains a persistent concern. Moreover, its stock price came under pressure following legal charges in the U.S. that the company deceived doctors and government health programs about the merit of its opioid addiction treatment Suboxone. While the company denied the allegations, investors took flight on uncertainty over potential liabilities.
The top contributors to relative performance over the fiscal year were Nestle S.A. (Switzerland, Consumer Staples sector), Novartis International AG (Switzerland, Health Care sector) and Qualicorp SA (Brazil, Health Care sector).
Nestle SA, the Swiss-based multinational, is the largest food and beverage manufacturer in the world measured by revenues, selling a vast portfolio of products across numerous categories and operating in almost every country on the planet. Under the leadership of CEO Mark Schneider, the company continues to successfully optimize its portfolio towards consumer relevant brands and drive differentiated innovation. Its stock price has been well supported as the company further demonstrates that it is on track to deliver on its mid-term targets of solid organic growth, improvement across key financial metrics, and a more shareholder friendly capital allocation policy.
Novartis, also based in Switzerland, is one of the world’s leading pharmaceutical companies, with an attractive portfolio and pipeline in several therapeutic areas as well as a track record of successfully managing through significant patent expirations. Management continues to optimize the portfolio, including the successful spinoff of its eye care division Alcon during the early part of 2019. Its stock price benefited from increasing confidence in accelerating revenue growth, improving operating margins and having a keen focus on returns to shareholders.
Qualicorp is one of Brazil’s leading health insurance brokers and third-party health benefits plan administrators. The company effectively acts as middle man between health plan operators and affinity groups that wish to offer health insurance to their members. It is well positioned to benefit from positive long-term trends in the Brazilian healthcare market, including the shift to an older demographic as retirees typically lose their corporate sponsored health benefits when they leave their jobs. The company operates an asset-light model and does not assume any underwriting or reimbursement risks. The stock price was well supported in the second quarter on undemanding valuation, a sharp drop in Brazilian interest rates and insider accumulation of the company’s stock.
During the 12- month period, the Fund sold out of 14 holdings and added 14 new ones. Most sales were a result of valuations that exceeded our comfort level, while a few reflected reduced confidence in our investment theses due to deteriorating fundamentals. New positions consisted of a variety of businesses with many opportunistically
Management's Discussion of Fund Performance(Unaudited) (Continued)
purchased during weakness, and even included returning to former holdings Samsung Electronics (Korea, Information Technology sector) and Fresenius SE (Germany, Health Care sector).
Outlook
Over the past 12 months the world economy has slowed considerably, as the benefits of tax reform in the U.S. have given way to fears of an unraveling of the process of globalization which has been such a boom in recent decades to corporate shareholders and consumers, if not necessarily to workers in developed economies. In addition to this new structural risk, the global economy has entered a period of cyclical slowdown, notably in the automotive and semiconductor industries, as broad measures of manufacturing activity have entered a period of outright contraction in recent months and inventories remain unusually high. Uncertainty surrounding Brexit, ongoing trade tensions between the U.S. and China, as well as geopolitical tensions in the Persian Gulf have further added to the headwinds facing markets.
Despite all this, the combination of slowing growth, falling global interest rates and the resulting pivot by the Fed to an easing bias has wound up being net-net quite supportive of equity prices, which have significantly adjusted over the past few months. Growth stocks in particular have gotten a boost such that the valuation gap between traditional value sectors of the market and their growth counterparts is at or near a record high.
Nonetheless, on the whole we think that now is an opportune time to cautiously increase exposure to what we believe are the cheaper, more cyclical parts of the market, since we’re reasonably optimistic about medium term prospects for the global economy. We remain concerned longer term about rising debt levels and other symptoms of an unbalanced global economy, we believe the current slowdown is likely to turn out to be a run-of-the-mill inventory correction rather than something more serious. While valuations overall look pretty full, if we’re right and the global economy doesn’t soon enter a recession, we may look back on this period and wonder what the markets were so worried about. We believe that an emphasis on owning high quality businesses with strong balance sheets will allow us to weather even the worst financial storm.
Management's Discussion of Fund Performance(Unaudited) (Continued)
Comparison of the Change in Value of a $10,000 Investment in the Touchstone International Equity Fund - Class A* and the MSCI EAFE Index
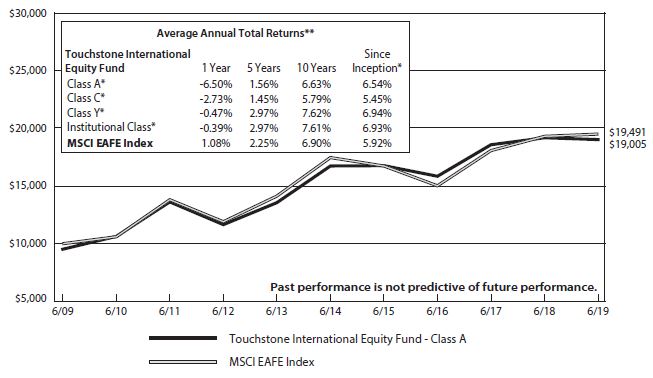
| * | The chart above represents performance of Class A shares only, which will vary from the performance of Class C shares, Class Y shares and Institutional Class shares based on the differences in sales loads and fees paid by shareholders in the different classes. The inception date of Class A shares, Class C shares, Class Y shares and Institutional Class shares was March 1, 1993, May 4, 1998, August 27, 2007 and October 30, 2017, respectively. Class C shares, Class Y and Institutional Class shares performance information was calculated using the historical performance of Class A shares for periods prior to May 4, 1998, August 27, 2007 and October 30, 2017, respectively. The returns have been restated for sales loads and fees applicable to Class C, Class Y and Institutional Class shares. The returns of the index listed above are based on the inception date of the Fund. |
| ** | The average annual total returns shown above are adjusted for maximum sales loads and fees, if applicable. Effective August 17, 2018, the maximum offering price per share of Class A shares is equal to the net asset value (“NAV”) per share plus a sales load equal to 5.26% of the NAV (or 5.00% of the offering price). Prior to August 17, 2018, the maximum offering price per share of Class A shares was equal to the NAV per share plus a sales load equal to 6.10% of the NAV (or 5.75% of the offering price). Prior to October 28, 2017, the maximum offering price per share of Class A shares was equal to the NAV per share plus a sales load equal to 5.26% of the NAV (or 5.00% of the offering price). Class C shares are subject to a contingent deferred sales charge (“CDSC”) of 1.00%. The CDSC will be assessed on an amount equal to the lesser of (1) the NAV at the time of purchase of the shares being redeemed or (2) the NAV of such shares being redeemed, if redeemed within a one-year period from the date of purchase. Class Y shares and Institutional Class shares are not subject to sales charges. |
The performance of the above Fund does not reflect the deduction of taxes that a shareholder would pay on Fund distributions or the redemption of Fund shares.
Notes to Chart
The MSCI EAFE Index is a free float-adjusted market capitalization index that is designed to measure developed market equity performance excluding the U.S. and Canada.
MSCI makes no express or implied warranties or representations and shall have no liability whatsoever with respect to any MSCI data contained herein. The MSCI data may not be further redistributed or used to create indices or financial products. This report is not approved or produced by MSCI.
Management's Discussion of Fund Performance(Unaudited)
Touchstone International Growth Opportunities Fund
Sub-Advised by DSM Capital Partners LLC
Investment Philosophy
The Touchstone International Growth Opportunities Fund seeks long-term capital appreciation by primarily investing in international equity securities of companies believed to offer the best opportunity for reliable growth. The Fund utilizes a bottom-up idea-driven growth style with a distinct valuation discipline. It seeks to identify companies which are believed to exhibit certain quality characteristics, including: predictable growth, solid fundamentals, attractive profitability and successful management.
Fund Performance
The Touchstone International Growth Opportunities Fund (Class A shares) underperformed its benchmark, the MSCI All Country World Ex USA Index for the 12-month period ended June 30, 2019. The Fund’s total return was -1.78 percent (calculated excluding maximum sales charge), while the total return of the benchmark was 1.29 percent.
Market Environment
The global equity markets managed a modest gain over the 12-month period despite a myriad of challenges including: a U.S.-China trade war, slowing global economic growth, political turmoil in the European Union due to Brexit, the ‘yellow vest’ protests in Paris and political problems in Italy.
During the second half of 2018, global equity markets declined due to investor concerns that an ongoing trade war between China and America would cause a global recession. The trade war has morphed into a trade dispute, and is no longer viewed as a market-shattering event. As a result, with the global economy continuing to grow, investor uncertainty has normalized and global markets have mostly recovered from the declines.
Portfolio Review
During the 12-month period ended June 30, 2019, stock selection and overweight exposure in the Communication Services sector, an overweight allocation to Emerging Markets, weak performance and an overweight exposure to Chinese positions drove the underperformance.
The holdings which contributed most to the Fund’s performance during the period were Wuliangye Yibin Company Limited (China, Consumer Staples), Globant (Argentina, Information Technology), HDFC Bank Limited (India, Financials), Magazine Luiza (Brazil, Consumer Discretionary) and Sonova Holding AG (Switzerland, Health Care).
The weakest contributors to the Fund’s performance during the period were Sina Weibo (China, Communication Services), Ctrip.com International Ltd. (China, Consumer Discretionary), YY Inc. (China, Communication Services), Ubisoft Entertainment SA (France, Communication Services) and AMS AG (Switzerland, Information Technology).
There were no meaningful changes made to the Fund’s positioning during the 12-month period. The majority of the portfolio was invested in the Communication Services, Consumer Discretionary, Consumer Staples, Financials, Health Care, Industrials and Information Technology sectors.
Outlook
We have projected for many years that the current global economic cycle will be longer than the majority of previous economic growth periods. Fears of trade wars, and of weak economic growth have shaken investor confidence. The economic outlook appears uncertain to many investors. However, over time, investors adjust
Management's Discussion of Fund Performance(Unaudited) (Continued)
to unexpected events, such as trade disputes, and the market—driven by solid fundamentals—moves higher. As we have stated time and time again, “Bull markets climb a wall of worry” and we continue to expect that global equity markets will trend higher.
As the U.S. economy continues to grow, the strong dollar, in combination with productivity-enhancing/technology-focused investments, should support both low inflation and accelerating wages. Recently, wage gains have been reported at 3.1 percent, a level few economists thought would be reached again. Given the combination of low inflation, low interest rates, the possibility of Federal Reserve rate cuts, and lower tax rates, we believe it is unlikely that the U.S. economy will slip into a recession over the next few years.
Certainly, some global economic indicators have been softer recently, particularly in Europe. Global growth has weakened due to China’s economic slowdown, the trade disputes and perhaps from recent U.S. Federal Reserve Board tightening. At this time central banks in the U.S., Europe and China are considering easing or have already begun to lower rates. When combined with the pro-growth fiscal policies of the world’s two largest economies, the U.S. and China, global economic growth may stabilize and over time, perhaps even accelerate. Admittedly, it is possible that our earlier expectations of global gross domestic product (GDP) growth in excess of 3 percent in 2019 may be a bit too optimistic. However, we continue to believe that the economic impact of the Chinese – American trade dispute, political discord in France and Italy and potential economic risks associated with Brexit are likely to slow global growth rather than create a global recession.
Recently, the U.S. and China agreed to continue their trade discussions. The most contentious issues between the two, such as technology theft and required technology transfer, remain unresolved. On the other hand, China did at least partially open more of its economic sectors to foreign investors, including autos, transportation, infrastructure, telecom, financial industries and “culture.” In addition, China has agreed to purchase more American agricultural products, which may generate some votes for President Trump in critical swing states. In return the U.S. agreed to lift sanctions on Huawei and to hold off on implementing additional tariffs. Investors found this outcome to be bullish, and the U.S. equity market reached an all-time high. Although the U.S. and China may have made some progress, we believe these trade issues will persist into the foreseeable future. However, with the trade situation now the norm rather than the exception, we expect investors will be less emotional and reactive to the “trade war” news flow. In addition, reflective of China’s softening economic growth, housing prices and transactions have slowed throughout much of the country and may continue to decline over the remainder of the year.
The Fund remains focused on earnings, as we believe strong and growing earnings, when combined with reasonable valuations, are the key to driving stock prices higher over time. Further, the businesses we identity for the Fund are continuously subject to analysis by our investment team. The Fund’s portfolio holdings remain characterized by strong balance sheets and strong free cash flow, and we continue to project a solid earnings growth rate with valuations that remain attractive.
Management's Discussion of Fund Performance(Unaudited) (Continued)
Comparison of the Change in Value of a $10,000 Investment in the Touchstone International Growth Opportunities Fund - Class A*, MSCI All Country World Ex USA Index
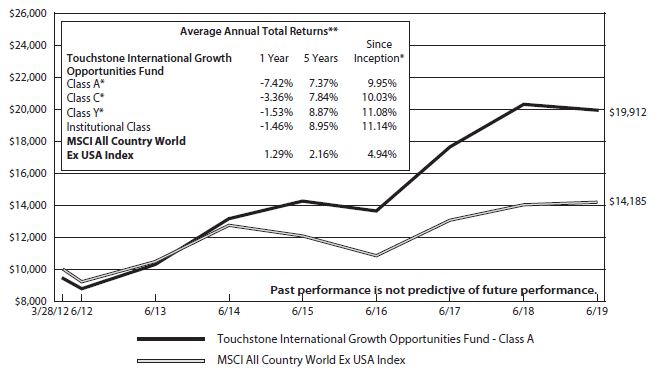
| * | The chart above represents performance of Class A shares only, which will vary from the performance of Class C shares, Class Y shares and Institutional Class shares based on the differences in sales loads and fees paid by shareholders in the different classes. The inception date of Class A shares, Class C shares, Class Y shares and Institutional Class shares was August 15, 2016, August 15, 2016, August 15, 2016 and March 28, 2012, respectively. Class A shares, Class C shares and Class Y shares performance information was calculated using the historical performance of Institutional Class shares for periods prior to August 15, 2016. The returns have been restated for sales loads and fees applicable to Class A, Class C and Class Y shares. The returns of the index listed above are based on the inception date of the Fund. |
| ** | The average annual total returns shown above are adjusted for maximum sales loads and fees, if applicable. Effective August 17, 2018, the maximum offering price per share of Class A shares is equal to the net asset value (“NAV”) per share plus a sales load equal to 5.26% of the NAV (or 5.00% of the offering price). Prior to August 17, 2018, the maximum offering price per share of Class A shares was equal to the NAV per share plus a sales load equal to 6.10% of the NAV (or 5.75% of the offering price). Class C shares are subject to a contingent deferred sales charge (“CDSC”) of 1.00%. The CDSC will be assessed on an amount equal to the lesser of (1) the NAV at the time of purchase of the shares being redeemed or (2) the NAV of such shares being redeemed, if redeemed within a one-year period from the date of purchase. Class Y shares and Institutional Class shares are not subject to sales charges. |
The performance of the above Fund does not reflect the deduction of taxes that a shareholder would pay on Fund distributions or the redemption of Fund shares.
Notes to Chart
MSCI All Country World Ex-U.S. Index is an unmanaged, capitalization-weighted index composed of companies representative of both developed and emerging markets excluding the United States. Investing in an index is not possible.
MSCI makes no express or implied warranties or representations and shall have no liability whatsoever with respect to any MSCI data contained herein. The MSCI data may not be further redistributed or used to create indices or financial products. This report is not approved or produced by MSCI.
Management's Discussion of Fund Performance(Unaudited)
Touchstone International Small Cap Fund
Sub-Advised by Copper Rock Capital Partners LLC
Investment Philosophy
The Touchstone International Small Cap Fund seeks capital appreciation by primarily investing in equity securities of non-U.S. small-cap companies diversified across sectors and industries. The Fund’s investment process seeks to add value through bottom-up stock selection and in-depth fundamental research and searches for companies believed to have strong management, superior earnings growth prospects and attractive relative valuations.
Fund Performance
The Touchstone International Small Cap Fund (Class A Shares) underperformed its benchmark, the S&P Developed Ex-U.S. Small Cap Index for the 12-month period ended June 30, 2019. The Fund’s total return was -7.42 percent (calculated excluding the maximum sales charge), while the total return of the benchmark was -5.74 percent.
Market Environment
Over much of 2018, investors witnessed a normalization of monetary policy and ongoing strained trade relations between the U.S. and China. With this, they saw fading economic momentum which grew more apparent as the year played out. The hawkish tone of major central banks became more subdued in late 2018 and into 2019 as fears over a global slowdown negatively impacted markets in the final quarter of 2018. This signaling of a shift to more accommodative monetary policy by the U.S. Federal Reserve Board (Fed) and similar signals and measures from policy makers of other major economies spurred a strong rebound in equities across the globe in the first half of 2019.
Overall, global stock markets were mixed during the period. U.S. mid- and large-cap stocks posted high single digit or greater gains while their counterparts in developed and emerging markets advanced only slightly into positive territory. Small-cap stocks across the globe generally declined.
Portfolio Review
From a sector standpoint, stock selection in the Information Technology, Consumer Discretionary, Consumer Staples and Financials sectors benefited Fund performance. The majority of underperformance came from stock selection in the Materials sector, while the Industrials and the Health Care sectors also lagged.
Among the individual stocks that contributed to performance during the period were Charter Hall Group (Real Estate sector), Globant SA and Nihon Unisys, Ltd. (both Information Technology sector). Charter Hall Group is a property related funds manager, which runs and collects fees off of multiple property funds as well as running an investment portfolio of direct property investments. The company owns more than 300 properties across Australia. The company continued execution of its growth plan which incorporates the ongoing acquisition of commercial properties in Australia. The company’s portfolio is well balanced with office buildings, industrial, and retail. The company has shown a skill at wisely investing in a property market where others have stumbled, especially in retail complexes. This, along with the firm’s attractive yield, has delivered growth and income to investors. Globant SA is a Luxembourg-based company that engages in the provision of information technology services and offers application development and maintenance, testing, and infrastructure management. Globant SA continued to benefit from the trend in digital transformations. Due to management’s strong execution, the company reported another notable outperformance of expectations and raised guidance in the second quarter of 2019. Nihon is an IT services company that is well-positioned to benefit from robust software spending from Japanese corporates improving labor productivity in the face of a shrinking labor force. The Japanese government has passed legislation to provide subsidies and special depreciation to facilitate technology adoption
Management's Discussion of Fund Performance(Unaudited) (Continued)
for small and medium sized enterprises. Nihon also benefited from the strong growth in cashless payments. The stock performed well on the back of an impressive earnings report which showed faster growth than the company’s forecast and above analyst consensus. The strong execution was achieved by the combination of top line growth and margin expansion in the second quarter of 2019.
Among the individual stocks that detracted from Fund performance were AMG Advanced Metallurgical Group (Materials sector), Orion Corp. (Consumer Staples sector) and Premier Oil plc (Energy sector). AMG Advanced Materials produces specialty metals and metallurgical vacuum furnace systems. Key to the thesis is its low cost production of lithium, a critical component for batteries in electric vehicles. Capital expenditures peaked in 2017 and cash flow inflected higher. The stock peaked last year and has since declined on slowing macroeconomic activity, global trade war concerns and the subsequent decline in prices for lithium and vanadium. Orion sells snacks in China, Korea, Russia, and Vietnam. Sales to China grew in 2018 after geopolitical disagreements between China and South Korea created a very difficult period in 2017. However, sales for the first two months of 2019 came in below the market consensus, driving the stock price down. While sales are expected to bounce back in March, we decided to exit the stock due to the uncertainty. Premier Oil plc is a U.K. based company engaging in the exploration and production of oil and gas. The stock declined largely from the overhang of Brexit fears and declining oil prices.
Outlook
The Fed and European Central Bank pivot to more dovish statements while the monetary policy is encouraging. However, we expect continued elevated volatility as markets look for clues about the trajectory of global economic momentum and digest developments about Brexit, trade disputes, and the rising populist movement in Europe. Meanwhile, the Bank of Japan is continuing its stance towards ultra-loose monetary policy.
From a sector standpoint, the Fund is overweight in the Information Technology, Consumer Staples and Healthcare sectors. We have a preference for later cycle technology such as software and services, which benefits from strong corporate cash flows being reinvested into cybersecurity and productivity given emerging threats and cost pressures from strong wage growth. However, we have added back exposure to semiconductors, as we are seeing the first signs of stabilization and feel that we are nearing an inflection point for improving fundamentals. The Fund is overweight in the Consumer Staples sector given the visibility of earnings and tailwinds from falling commodity prices. The Fund is overweight in the Healthcare sector as we see structural growth opportunities across the value chain of drug discovery, distribution, generics and services.
The Fund is underweight in the Energy, Industrials and Materials sectors given difficult earnings comparisons from 2018 coupled with concern about earnings risk amidst deceleration in global economic momentum and trade war rhetoric. The Fund is underweight in the Financials sector as loan demand is decelerating and a flat/inverted yield curve continues to negatively impact earnings momentum. Lastly, the Fund remains underweight in the Consumer Discretionary sector given the tug of war between structural headwinds (the “Amazon Effect”) and a favorable consumption backdrop given strong employment and wage growth.
We believe the era of multiple expansion is over and that we are in the later stages of a bull market, with flatter overall market returns, higher individual stock volatility, and equity market returns driven by earnings growth and dividends. As such, we believe this economic backdrop argues for more structural growth leadership with an importance on assured earnings growth and valuation sensitivity. That said, we feel the Fund is appropriately positioned for this stage of the peaking economic cycle, and that the markets will recommit to rewarding stocks for their fundamental drivers and ability to deliver on earnings.
Management's Discussion of Fund Performance(Unaudited) (Continued)
Comparison of the Change in Value of a $10,000 Investment in the Touchstone International Small Cap Fund - Class A* and the S&P Developed Ex-U.S. Small Cap Index
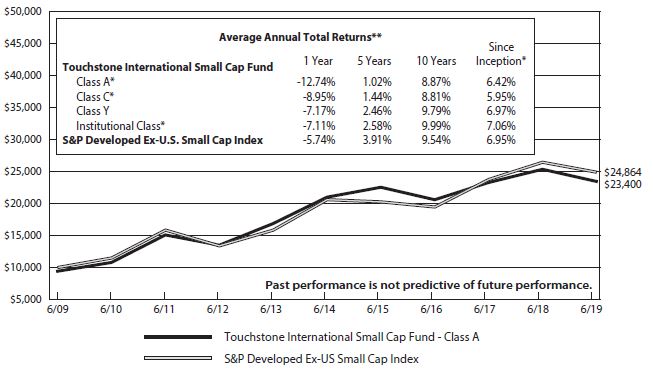
| * | The chart above represents performance of Class A shares only, which will vary from the performance of Class C shares, Class Y shares and Institutional Class shares based on the differences in sales loads and fees paid by shareholders in the different classes. The inception date of Class A shares, Class C shares, Class Y shares and Institutional Class shares was July 31, 2003, April 12, 2012, December 31, 1996 and December 20, 2006, respectively. Class A shares, Class C shares and Institutional Class shares performance was calculated using the historical performance of Class Y shares for the periods prior to July 31, 2003, April 12, 2012 and December 20, 2006, respectively. The returns have been restated for sales loads and fees applicable to Class A, Class C and Institutional Class shares. The returns of the index listed above are based on the inception date of the Fund. |
| ** | The average annual total returns shown above are adjusted for maximum sales loads and fees, if applicable. Effective August 17, 2018, the maximum offering price per share of Class A shares is equal to the net asset value (“NAV”) per share plus a sales load equal to 5.26% of the NAV (or 5.00% of the offering price). Prior to August 17, 2018, the maximum offering price per share of Class A shares was equal to the NAV per share plus a sales load equal to 6.10% of the NAV (or 5.75% of the offering price). Class C shares are subject to a contingent deferred sales charge (“CDSC”) of 1.00%. The CDSC will be assessed on an amount equal to the lesser of (1) the NAV at the time of purchase of the shares being redeemed or (2) the NAV of such shares being redeemed, if redeemed within a one-year period from the date of purchase. Class Y shares and Institutional Class shares are not subject to sales charges. |
The performance of the above Fund does not reflect the deduction of taxes that a shareholder would pay on Fund distributions or the redemption of Fund shares.
Note to Chart
S&P Developed Ex-U.S. Small Cap Index is an unmanaged index of small-cap stocks from developed countries, excluding the United States.
Management's Discussion of Fund Performance(Unaudited)
Touchstone Large Cap Focused Fund
Sub-Advised by Fort Washington Investment Advisors, Inc.
Investment Philosophy
The Fund seeks to invest in companies of large capitalizations that are trading below what is believed to be the estimate of their intrinsic value and have a sustainable competitive advantage or a high barrier to entry in place. The barrier(s) to entry can be created through a cost advantage, economies of scale, high customer loyalty or a government barrier (e.g. license or subsidy). Fort Washington believes that the strongest barrier to entry is the combination of economies of scale and high customer loyalty.
Fund Performance
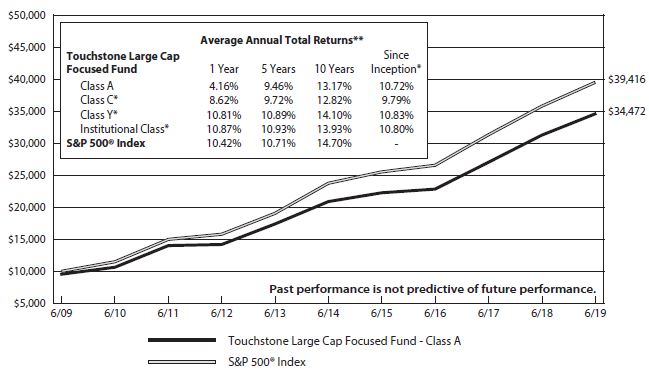
The Touchstone Large Cap Focused Fund (Class A Shares) outperformed the S&P 500® Index for the 12-month period ended June 30, 2019. The Fund’s total return was 10.51 percent (calculated excluding the maximum sales charge), while the return of its benchmark was 10.42 percent.
Market Environment
During the twelve month period ended June 30, 2019, U.S. equities recorded positive returns primarily due to strong U.S. corporate earnings, moderate growth across global economies and mostly accommodative U.S. Federal Reserve Board (Fed) policy. In the third quarter of 2018, the U.S. equity market moved higher driven primarily by strong corporate earnings and economic growth. Volatility returned in the fourth quarter with all sectors within the S&P 500® Index except Utilities recording negative returns. U.S. equity markets then had a strong first quarter as fears that dragged the market lower in the fourth quarter were somewhat relieved. In the second quarter of 2019, U.S. equity markets continued to move higher as the Fed and other central banks signaled accommodative policy and investors perceived less risk from U.S.-China trade tensions. Over the twelve-month period ended June 30, 2019, sectors that outperformed the Index the most included Health Care, Consumer Staples, Utilities, Real Estate and Information Technology.
Portfolio Review
The sectors within the Fund that outperformed relative to the benchmark included Industrials, Information Technology, Financials, Consumer Discretionary and Energy. The Real Estate, Materials, Consumer Staples, Communication Services and Health Care sectors underperformed.
Overall, stock selection within the Fund drove the relative outperformance. Three stocks that contributed to performance were Visa Inc. (Information Technology sector), Microsoft Corp. (Information Technology sector) and Merck&Co. (Health Care sector). Three stocks that detracted from performance were Baidu Inc. (Communication Services sector), JD.com Inc. (Consumer Discretionary sector) and Kraft Heinz Co. (Consumer Staples sector).
Outlook
We continue to view the U.S. equity market as healthy, albeit later in the cycle. Our view is that the strong first half of 2019 performance by U.S. equities has been driven by broad participation across the market cap spectrum. The typical signs we monitor as indicators of near term recession risk – credit, asset bubbles, and inflation – do not signal a reason to get defensive heading into the second half of the year. We believe the equity market is trading close to fair value and we believe returns to anchor around the cost of capital going forward, although we respect the view that investors could get excited and pull forward future returns.
At the end of the fiscal year, the Fund continues to be positioned for the later stage of the market cycle. This is evident in our emphasis on stocks that are priced in the Franchise Value layer. The Fund also has a large
Management's Discussion of Fund Performance(Unaudited) (Continued)
percentage of businesses with high returns on capital and higher barriers to entry. Additionally, the team continues to emphasize high quality companies as we look for businesses that are mispriced by the market. The weighted average excess return on capital of the Fund’s portfolio remains at an all-time high and considerably above the market average. We believe all of these elements are prudent and positions the Fund well.
Management's Discussion of Fund Performance(Unaudited) (Continued)
Comparison of the Change in Value of a $10,000 Investment in the Touchstone Large Cap Focused Fund - Class A* and the S&P 500® Index
| * | The chart above represents performance of Class A shares only, which will vary from the performance of Class C shares, Class Y shares and Institutional Class shares based on the differences in sales loads and fees paid by shareholders in the different classes. The inception date of Class A shares, Class C shares, Class Y shares and Institutional Class shares was January 12, 1934, May 4, 1998, May 4, 2007 and December 23, 2014, respectively. Class C shares, Class Y shares and Institutional Class shares performance was calculated using the historical performance of Class A shares for the periods prior to May 4, 1998, May 4, 2007 and December 23, 2014, respectively. The returns have been restated for sales loads and fees applicable to Class C, Class Y and Institutional Class shares. The launch date of the S&P 500® Index was after the inception date of the Fund, therefore there is no return for inception. |
| ** | The average annual total returns shown above are adjusted for maximum sales loads and fees, if applicable. Effective August 17, 2018, the maximum offering price per share of Class A shares is equal to the net asset value (“NAV”) per share plus a sales load equal to 5.26% of the NAV (or 5.00% of the offering price). Prior to August 17, 2018, the maximum offering price per share of Class A shares was equal to the NAV per share plus a sales load equal to 6.10% of the NAV (or 5.75% of the offering price). Prior to October 28, 2017, the maximum offering price per share of Class A shares was equal to the NAV per share plus a sales load equal to 5.26% of the NAV (or 5.00% of the offering price). Class C shares are subject to a contingent deferred sales charge (“CDSC”) of 1.00%. The CDSC will be assessed on an amount equal to the lesser of (1) the NAV at the time of purchase of the shares being redeemed or (2) the NAV of such shares being redeemed, if redeemed within a one-year period from the date of purchase. Class Y shares and Institutional Class shares are not subject to sales charges. |
The performance of the above Fund does not reflect the deduction of taxes that a shareholder would pay on Fund distributions or the redemption of Fund shares.
Note to Chart
S&P 500® Index is a group of 500 widely held stocks and is commonly regarded to be representative of the large capitalization stock universe.
Management's Discussion of Fund Performance (Unaudited)
Touchstone Large Cap Fund
Sub-Advised by The London Company
Investment Philosophy
The Touchstone Large Cap Fund seeks long-term capital growth by investing primarily in common stocks of large-cap U.S. listed companies. The Fund seeks to purchase financially stable large-cap companies that it believes are consistently generating high returns on unleveraged operating capital, run by shareholder-oriented management, and trading at a discount to the company’s respective private market values.
Fund Performance
The Touchstone Large Cap Fund (Class A Shares) underperformed its benchmark, the Russell 1000® Index, for the 12-month period ended June 30, 2019. The Fund’s total return was 7.04 percent (excluding the maximum sales charge), while the benchmark���s total return was 10.02 percent.
Market Environment
During the 12-month period, the U.S. stock market continued higher, but experienced a notable return of volatility with each quarter having greater than 10 percent positive or negative returns.
During the first half of the period, investors were concerned about the prospect of increasing rate hikes from the U.S. Federal Reserve Board ( Fed), which increased the target of the Fed funds rate 0.25 percent in September 2018 and then again in December 2018 to a range of 2.25 to 2.50 percent. Concerns over slowing global growth, the projected path of higher interest rates and tariffs led to a broad sell off in the fourth quarter of 2018. In this part of the period, quality, yield, and value factors were all positive factors for market performance, which was a tailwind for relative performance.
As the market’s focus shifted from concern over impending rate hikes to a belief there could be more accommodative Fed policy and potential for a trade deal, the market rallied strongly in the first half of 2019. During this part of the period, growth drove the market while value and yield factors were headwinds for relative performance. The significant outperformance of growth stocks over value stocks continued as investors maintained their preference for cyclical sectors over defensive sectors.
Overall, among the top performing sectors of the benchmark were Information Technology and Utilities while the Materials and Energy sectors lagged for the 12-month period ended June 30, 2019.
Portfolio Review
Within the Fund, stock selection detracted from relative performance as did sector allocation, but to a lesser degree. At the sector level, an underweight to the Information Technology sector and an overweight to the Materials sector had a negative impact on relative performance. This was partially offset by the positive impact from an underweight to the Energy sector.
Among the individual stocks that contributed to Fund performance during the period were Progressive Corp. (Financials sector), Visa Inc. (Information Technology sector), Norfolk Southern Corp. (Industrials sector), Dollar Tree Inc. (Consumer Discretionary sector) and Nestle (Consumer Staples sector). Progressive Corp., an insurance provider, significantly outperformed during the period as the company began to gain market share while posting strong premium growth. Progressive has shown improving top line growth in both auto and home policy segments. Both digital and agency platforms are growing and taking market share. Visa, a global payments technology company, was driven by strength in service revenue and data processing. Growth in global payment, the shift to credit and electronic commerce should be tailwinds for the long term. Visa produced strong cash flow and returned significant cash to shareholders. Norfolk Southern is a railway transportation
Management's Discussion of Fund Performance(Unaudited) (Continued)
provider. The company gained throughout the period due to solid earnings and positive sentiment following its Investor Day, where its turnaround plan and Precision Scheduled Railroading Plan was unveiled. Dollar Tree was up in the period with most of its relative gain occurring in the fourth quarter of 2018 following reports of two different activist investors purchasing the stock, as well as optimism around the potential stabilization of the Family Dollar division. Key performance indicators at Family Dollar were slightly negative in the most recent quarter while same store sales at Dollar Tree stores were positive. Separately, management disclosed the goal of renovating at least 1,000 Family Dollar stores in 2019 and also was incrementally more positive on resuming share repurchases in 2019. Nestle, a multinational packaged food company, was added to the Fund’s portfolio during the fourth quarter of 2018. The company continued to benefit from its strong brands in large and growing markets.
Among the stocks that detracted from Fund performance were Altria Group Inc. (Consumer Staples sector), Carnival Corp. (Consumer Discretionary sector), Charles Schwab Corp. (Financials sector), Albemarle Corp. (Materials sector) and FedEx Corp. (Industrials sector). FedEx, a global integrated freight and delivery business, was weak as the company deals with slowing European trade, lingering effects from the cyberattack at a subsidiary and a mix shift to lower-profit services in its Express business. Our longer-term thesis regarding the wide moat nature of the business remains intact. Valuation remained comfortably below historical averages. Altria, the owner of multiple tobacco operating companies, sold off in the second quarter of 2019 along with all the tobacco stocks on worse than expected volume. In addition, concerns around the regulatory outlook for Juul, with negative commentary from former FDA Commissioner Scott Gottlieb, added to pressure on the stock. In our view, sentiment has swung far too negative on Altria, as reflected in the valuation, and we believe the 6.5 percent dividend is solid and attractive. Carnival, a cruise ship operator, sold off sharply after it reported quarterly results above expectations but lowered guidance for the year. The stock has been under pressure this year due to concerns about softening European yields and increasing capacity in the face of a weakening economic outlook in Europe. While near-term pressures may continue, we view the dramatic market reaction as overdone with the stock trading near an attractive valuation. Long term we continue to believe Carnival will benefit from significant barriers to entry, limited competition and increasing demand from both an aging demographic and international travelers. Charles Schwab Corp., a provider of diversified financial services, continued to face headwinds related to client cash “sorting”—moving cash into higher yielding alternatives to traditional cash allocations. Furthermore, the company was hit by the dual headwinds of falling interest rates (which compresses interest margin) and high equity valuations (which reduces client cash balances). Long term, we remain confident in the company’s ability to drive asset accumulation due to its strong value proposition to clients. Albemarle Corp., a specialty chemical company, lagged during the period due to weakness in the lithium spot market. While we are cognizant of the risk to profits if this environment persists, we note that recent results illustrated the resilience of Albemarle’s business due to diversification and emphasis on long-term contracts. Despite the weak spot market, Albemarle posted higher lithium pricing year over year. While the near term may continue to be volatile, we remain confident in the long-term outlook for the business.
During the 12-month period, we were more active during periods of volatility and traded stocks to adhere to our investment discipline. New positions included Martin Marietta Materials Inc. (Materials sector), Nestle (Consumer Staples sector), Charles Schwab (Financials sector), and Fox Corporation (Consumer Discretionary sector). Positions exited during the period were Nike Inc. (Consumer Discretionary sector), Bank of America Corp. (Financials sector), Deere & Co. (Industrials sector), and Coca Cola Company (Consumer Staples sector).
We initiated a position in Martin Marietta reflecting our positive view of the aggregates industry (oligopoly with pricing power), strong return on capital and double digit operating margins. Looking ahead, we believe volume growth should be solid reflecting the strong U.S. economy and need for greater infrastructure spending. Incremental margins are quite high in the aggregates business, so any upside to volume could lead to margin
Management's Discussion of Fund Performance(Unaudited) (Continued)
improvement. Nestle is the largest food company in the world with scale and brand advantages. The company is well diversified among geographies with roughly 60 percent of sales occurring in developed markets and 40 percent in emerging markets, where growth and margins are higher. The company is exposed to many large Consumer Staples categories and it also has a valuable stake in L’Oreal (23 percent of shares – worth over $30B). New management seems intent on optimizing the business. Schwab is one of the largest retail brokers in the United States, with a best-in-class platform that combines superior service with highly competitive pricing. Client assets of the company’s platform now exceed $4 trillion. Most of the company’s revenue is generated from the interest rate spread earned on client cash and fees earned on assets through internal or externally managed funds. Going forward, we believe the company will put a larger emphasis on returning capital to shareholders via dividends and buybacks. In January, the company announced a new $4 billion share repurchase plan and increased the dividend 31 percent. Fox Corporation was created in a spin-off after legacy 21st Century Fox merged with Disney in March of 2019. Fox Corp. owns two of the five most watched television networks (Fox Broadcast and Fox News). The company is focused on news and sports, which command live viewership and large audiences. While viewership among consumers is moving to watching shows on delay, we believe Fox is less susceptible to this risk as the demand for live news and sporting events remains strong.
Outlook
We maintain a mixed view of stocks and expect continued volatility in the months ahead. On the positive side, the U.S. economy remains in solid shape driven by the strength of the consumer, reflecting low unemployment and rising wages. Low inflation, relatively low interest rates and a possibly more dovish Fed are other positive factors. We continue to expect annualized real gross domestic product (GDP) growth in the 2 percent range.
Potential risks include a slowing economy, talk of higher tariffs, rising debt levels and investor expectations for interest rate cuts that may not come to fruition. While there was no recent change in interest rates, notes from the latest Federal Open Market Committee meeting point to members now leaning toward one rate cut of roughly 25 basis point over the next year. Investors appear to be expecting more rate cuts over the same period. This difference in market expectations vs. potential Fed actions could lead to greater volatility in stock prices.
Valuation for the broader market, measured by the Russell 3000® Index, is a bit above its long-term average, so multiple expansion from here may be limited. While we believe the risks and rewards are somewhat balanced as they relate to stocks overall, we remain cautious and focus on limiting downside in each holding. Fortunately, we are still finding high conviction investment ideas to populate the Fund.
Management's Discussion of Fund Performance(Unaudited) (Continued)
Comparison of the Change in Value of a $10,000 Investment in the Touchstone Large Cap Fund - Class A* and the Russell 1000® Index
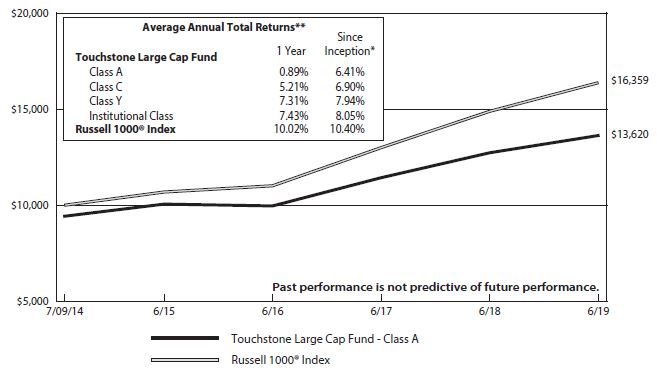
| * | The chart above represents performance of Class A shares only, which will vary from the performance of Class C shares, Class Y shares and Institutional Class shares based on the differences in sales loads and fees paid by shareholders in the different classes. The inception date of the Fund was July 9, 2014. The returns of the index listed above are based on the inception date of the Fund. |
| ** | The average annual total returns shown above are adjusted for maximum sales loads and fees, if applicable. Effective August 17, 2018, the maximum offering price per share of Class A shares is equal to the net asset value (“NAV”) per share plus a sales load equal to 5.26% of the NAV (or 5.00% of the offering price). Prior to August 17, 2018, the maximum offering price per share of Class A shares was equal to the NAV per share plus a sales load equal to 6.10% of the NAV (or 5.75% of the offering price). Class C shares are subject to a contingent deferred sales charge (“CDSC”) of 1.00%. The CDSC will be assessed on an amount equal to the lesser of (1) the NAV at the time of purchase of the shares being redeemed or (2) the NAV of such shares being redeemed, if redeemed within a one-year period from the date of purchase. Class Y shares and Institutional Class shares are not subject to sales charges. |
The performance of the above Fund does not reflect the deduction of taxes that a shareholder would pay on Fund distributions or the redemption of Fund shares.
Note to Chart
Russell 1000® Index measures the performance of the 1,000 largest companies in the Russell 3000® Index.
The Frank Russell Company (FRC) is the source and owner of the data contained or reflected in this material and all trademarks and copyrights related thereto. The material may contain confidential information and unauthorized use, disclosure, copying, dissemination or redistribution is strictly prohibited. This is a Touchstone Investments presentation of the data, and FRC is not responsible for the formatting or configuration of this material or for any inaccuracy in the presentation thereof.
Management's Discussion of Fund Performance(Unaudited)
Touchstone Large Company Growth Fund
Sub-Advised by DSM Capital Partners LLC
Investment Philosophy
The Touchstone Large Company Growth Fund seeks long-term capital appreciation by primarily investing in U.S. equity securities of large capitalization companies believed to offer the best opportunity for reliable growth at attractive stock valuations. The Fund utilizes a bottom-up idea-driven growth style with a distinct valuation discipline. It seeks to identify companies which are believed to exhibit certain quality characteristics, including: predictable growth, solid fundamentals, attractive profitability and successful management.
Fund Performance
The Touchstone Large Company Growth Fund (Class A shares) underperformed its benchmarks, the Russell 1000® Growth Index and the S&P 500® Index, for the 12-month period ended June 30, 2019. The Fund’s total return was 10.39 percent (calculated excluding the maximum sales charge), while the total return of the Russell 1000® Growth index was 11.56 percent and the total return of the S&P 500®Index was 10.42 percent.
Market Environment
The stock market appreciated over the 12-month period despite a myriad of challenges including: a U.S.-China trade war, slowing global economic growth, political turmoil in the European Union due to Brexit, the ‘yellow vest’ protests in Paris and political problems in Italy. Earnings remained strong in the face of these challenges, and as sentiment depressed valuations, opportunities were created for investors during the volatile period.
During the second half of 2018, global equity markets declined due to investor concerns that an ongoing trade war between China and America would cause a global recession. The trade war has morphed into a trade dispute. As a result, with the global economy continuing to grow, investor uncertainty has normalized and global markets have moved substantially higher.
Portfolio Review
During the 12-month period ended June 30, 2019, the Fund’s underperformance versus the benchmark was primarily due to weak stock selection in the Consumer Discretionary and Communication Services sectors, as well as an overweight allocation to Communication Services. This was partially offset by the Fund’s stock selection in the Information Technology and Health Care sectors.
The holdings which contributed most to the Fund’s performance during the period were Microsoft Corporation (Information Technology), Visa Inc. (Information Technology), PayPal Holdings Inc. (Information Technology), MSCI Inc. (Financials) and Adobe Inc. (Information Technology).
The weakest contributors to the Fund’s performance during the period were Electronic Arts Inc. (Communication Services), Alibaba Group Holding Limited (Consumer Discretionary), Booking Holdings Inc. (Consumer Discretionary), Charles Schwab Corporation (Financials) and Palo Alto Networks Inc. (Information Technology).
There were no meaningful changes made to the Fund’s positioning during the 12-month period. The majority of the portfolio was invested in the Communication Services, Consumer Discretionary, Consumer Staples, Financials, Health Care and Information Technology sectors.
Management's Discussion of Fund Performance(Unaudited) (Continued)
Outlook
We have projected for many years that the current global economic cycle will be longer than the majority of previous economic growth periods. Fears of trade wars, and of weak economic growth have shaken investor confidence. The economic outlook appears uncertain to many investors. However, over time investors adjust to unexpected events, such as trade disputes, and the market, driven by solid fundamentals, moves higher. As we have stated time and time again, “Bull markets climb a wall of worry” and we continue to expect that global equity markets will trend higher.
As the U.S. economy continues to grow, the strong dollar, in combination with productivity-enhancing/ technology-focused investments, should support both low inflation and accelerating wages. Recently, wage gains have been reported at 3.1 percent, a level few economists thought would be reached again. Given the combination of low inflation, low interest rates, the possibility of Federal Reserve rate cuts, and lower tax rates, we believe it is unlikely that the U.S. economy will slip into a recession over the next few years.
Certainly, some global economic indicators have been softer recently, particularly in Europe. Global growth has weakened due to China’s economic slowdown, the trade disputes and perhaps from recent U.S. Federal Reserve tightening. At this time central banks in the U.S., Europe and China are considering easing or have already begun to lower rates. When combined with the pro-growth fiscal policies of the world’s two largest economies, the U.S. and China, global economic growth may stabilize and over time, perhaps even accelerate. Admittedly, it is possible that our earlier expectations of global gross domestic product (GDP) growth in excess of 3 percent in 2019 may be a bit optimistic. However, we continue to believe that the economic impact of the Chinese – American trade war, political discord in France and Italy and potential economic risks associated with Brexit are likely to slow global growth rather than create a global recession.
Recently, the U.S. and China agreed to continue their trade discussions. In fact, nothing has substantively changed, except that the trade situation is now stable rather than escalating. The most contentious issues between the two, such as technology theft and required technology transfer, remain unresolved. On the other hand, China did at least partially open more of its economic sectors to foreign investors, including autos, transportation, infrastructure, telecom, financial industries and “culture.” In addition, China agreed to purchase more American agricultural products, which may generate some votes for President Trump in critical swing states. In return the U.S. agreed to lift sanctions on Huawei and to hold off on implementing additional tariffs. Investors found this outcome to be bullish, and the U.S. equity market has reached an all-time high. Although the U.S. and China may have made some progress, we believe these trade issues will persist into the foreseeable future. However, with the trade situation now the norm rather than the exception, we expect investors will be less emotional and reactive to the “trade war” news flow. As an aside, reflective of China’s softening economic growth, housing prices and transactions have slowed throughout much of the country and may continue to decline over the remainder of the year.
The Fund remains focused on earnings, as we believe strong and growing earnings, when combined with reasonable valuations, are the key to driving stock prices higher over time. Further, the businesses we identity for the Fund are continuously subject to analysis by our investment team. The Fund’s portfolio holdings remain characterized by strong balance sheets and strong free cash flow, and we continue to project a solid earnings growth rate with valuations that remain attractive.
Management's Discussion of Fund Performance(Unaudited) (Continued)
Comparison of the Change in Value of a $10,000 Investment in the Touchstone Large Company Growth Fund- Class A*, the Russell 1000®Growth Index and the S&P 500® Index
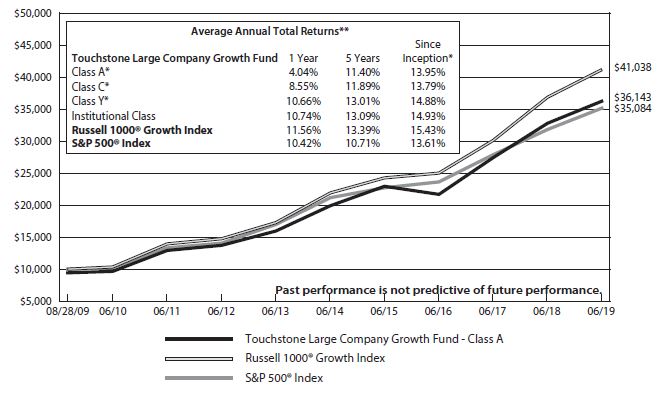
| * | The chart above represents performance of Class A shares only, which will vary from the performance of Class C shares, Class Y shares and Institutional Class shares based on the differences in sales loads and fees paid by shareholders in the different classes. The inception date of Class A shares, Class C shares, Class Y shares and Institutional Class shares was August 15, 2016, August 15, 2016, August 15, 2016 and August 28, 2009, respectively. Class A shares, Class C shares and Class Y shares performance information was calculated using the historical performance of Institutional Class shares for periods prior to August 15, 2016. The returns have been restated for sales loads and fees applicable to Class A, Class C and Class Y shares. The returns of the indexes listed above are based on the inception date of the Fund. |
| ** | The average annual total returns shown above are adjusted for maximum sales loads and fees, if applicable. Effective August 17, 2018, the maximum offering price per share of Class A shares is equal to the net asset value (“NAV”) per share plus a sales load equal to 5.26% of the NAV (or 5.00% of the offering price). Prior to August 17, 2018, the maximum offering price per share of Class A shares was equal to the NAV per share plus a sales load equal to 6.10% of the NAV (or 5.75% of the offering price). Class C shares are subject to a contingent deferred sales charge (“CDSC”) of 1.00%. The CDSC will be assessed on an amount equal to the lesser of (1) the NAV at the time of purchase of the shares being redeemed or (2) the NAV of such shares being redeemed, if redeemed within a one-year period from the date of purchase. Class Y shares and Institutional Class shares are not subject to sales charges. |
The performance of the above Fund does not reflect the deduction of taxes that a shareholder would pay on Fund distributions or the redemption of Fund shares.
Note to Chart
Russell 1000® Growth Index measures the performance of those Russell 1000 companies with higher price-to-book ratios and higher forecasted growth values.
The Frank Russell Company (FRC) is the source and owner of the data contained or reflected in this material and all trademarks and copyrights related thereto. The material may contain confidential information and unauthorized use, disclosure, copying, dissemination or redistribution is strictly prohibited. This is a Touchstone Investments presentation of the data, and FRC is not responsible for the formatting or configuration of this material or for any inaccuracy in the presentation thereof.
S&P 500® Index is a group of 500 widely held stocks and is commonly regarded to be representative of the large capitalization stock universe.
Management's Discussion of Fund Performance(Unaudited)
Touchstone Ohio Tax-Free Bond Fund
Sub-Advised by Fort Washington Investment Advisors, Inc.
Investment Philosophy
The Touchstone Ohio Tax-Free Bond Fund seeks the highest level of interest income exempt from federal income and Ohio personal income taxes, consistent with the protection of capital. It invests primarily in high-quality, long-term Ohio Municipal obligations.
Fund Performance
The Touchstone Ohio Tax-Free Bond Fund (Class A Shares) underperformed its benchmark, the Bloomberg Barclays Municipal Bond Index, for the 12-month period ended June 30, 2019. The Fund’s total return was 5.60 percent (calculated excluding the maximum sales charge), while the total return of the benchmark was 6.71 percent.
Market Environment
Growth in the broader economy was solid during much of the fiscal year. Gross domestic product (GDP) reported gains of 3 percent on average while inflation was at, or slightly below, the U.S. Federal Reserve Board’s (Fed) target of 2 percent. Employment was strong with the unemployment rate declining while wages grew. This fueled consumer spending. Business investment contributed to growth as well. Cross currents began to emerge in the final quarter of 2018 causing an increase in market volatility. More specifically, concerns about slowing global growth, escalating trade disputes and a shutdown of the U.S. government in December/January caused a sharp selloff in the equity and corporate bond markets. Much of the damage was reversed in the first quarter of 2019 as stock prices rebounded and credit spreads tightened.
The Fed raised rates in September and December 2018 by a total of 0.50 percent to bring the fed funds rate to a range of 2.25 to 2.50 percent. During this period, the Treasury yield curve flattened with interest rates on short maturities rising while yields on longer bond maturities declined. As the fiscal year progressed, the slowdown in the global economy worsened and the on again, off again trade dispute with China and others resumed, as President Trump signaled new tariffs for Chinese and Mexican goods. This reinforced the view that the economy was slowing. Markets saw Fed policy as too tight and began to “price in” a reduction in the federal funds rate. As this view gained traction, the Treasury yield curve inverted with short-term interest rates trading at yields above longer term maturities. On average, interest rates declined 0.55 percent over the period, with the middle of the curve (two to 10 years) declining the most.
While the municipal market performed well during the 12-month period ended June 30, 2019, it underperformed relative to both the Treasury and corporate bond markets. Performance was driven by strong investor demand and limited new issue supply. The Tax Cuts and Jobs Act (TCJA) reduced overall tax rates but also limited deductions for state and local taxes, which in turn helped stimulate demand for municipal bonds, especially in high tax states where the impact was felt the most. The TCJA also impacted the supply side as the tax law eliminated the ability of municipalities to refinance outstanding debt with tax free bonds in advance of the call or maturity date. This has reduced new issue supply by 25 to 30 percent since the law took effect.
Portfolio Review
In managing the Fund, we put greater emphasis on high-quality Ohio municipal bonds in the 20-year maturity range. That is where we feel the market offers the best combination of tax-free yield and total return. We believe this strategy can help the Fund maintain a shorter duration relative to the broader market and reduce volatility associated with longer-term bonds. Given the net decline in interest rates over the period, the Fund’s total return was negatively impacted as longer duration bonds outperformed the broader municipal market. From
Management's Discussion of Fund Performance(Unaudited) (Continued)
a sector perspective, the Fund benefited from overweight positions in Health Care bonds and Education bonds as both sectors outperformed the broader Index.
Outlook
Despite slowing in the broader economy, fundamentals within the municipal sector remain good. Many large, high tax states saw a windfall in personal income tax collections during the recent tax season. This helped many states and municipalities close budget gaps or, in the case of Illinois, allowed them to make a full pension payment. Sales tax receipts have been good as well. If the economy continues to slow, municipal revenues will slow also, but the recent trend has been a positive for the sector and allowed some municipalities to build reserves should conditions worsen. The state of Ohio and smaller municipalities throughout the state have had solid metrics for some time. We would expect that to continue. In addition, investor interest in the municipal market is likely to remain strong given the tax deduction limitations imposed under the TCJA. At this time there doesn’t appear to be any catalyst for the market.
We believe the Fund is properly positioned and we are not expecting sharp movement in either direction for interest rates in the 10-year and longer segment of the yield curve. In this environment we would expect to earn the coupon for the remainder of the year.
Management's Discussion of Fund Performance(Unaudited) (Continued)
Comparison of the Change in Value of a $10,000 Investment in the Touchstone Ohio Tax-Free Bond Fund - Class A* and the Bloomberg Barclays Municipal Bond Index
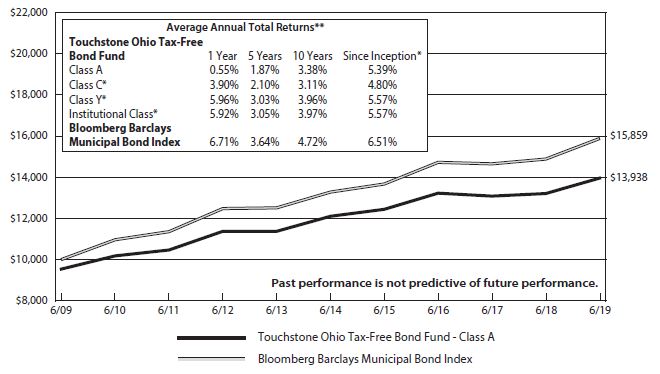
| * | The chart above represents performance of Class A shares only, which will vary from the performance of Class C shares, Class Y shares and Institutional Class shares based on the difference in sales loads and fees paid by shareholders in the different classes. The inception date of Class A shares, Class C shares, Class Y shares and Institutional Class shares was April 1, 1985, November 1, 1993, August 30, 2016 and August 30, 2016, respectively. Class C shares, Class Y shares and Institutional Class shares performance information was calculated using the historical performance of Class A shares for the periods prior to November 1, 1993, August 30, 2016 and August 30, 2016, respectively. The returns have been restated for sales loads and fees applicable to Class C shares, Class Y shares and Institutional Class shares. The returns of the index listed above are based on the inception of the Fund. |
| ** | The average annual total returns shown above are adjusted for maximum sales loads and fees, if applicable. Effective August 17, 2018, the maximum offering price per share of Class A shares is equal to the net asset value (“NAV”) per share plus a sales load equal to 2.04% of the NAV (or 2.00% of the offering price). Prior to August 17, 2018, the maximum offering price per share of Class A shares was equal to the NAV per share plus a sales load equal to 4.99% of the NAV (or 4.75% of the offering price). Class C shares are subject to a contingent deferred sales charge (“CDSC”) of 1.00%. The CDSC will be assessed on an amount equal to the lesser of (1) the NAV at the time of purchase of the shares being redeemed or (2) the NAV of such shares being redeemed, if redeemed within a one-year period from the date of purchase. Class Y shares and Institutional Class shares are not subject to sales charges. |
The performance of the above Fund does not reflect the deduction of taxes that a shareholder would pay on Fund distributions or the redemption of Fund shares.
Note to Chart
Bloomberg Barclays Municipal Bond Index is a widely recognized unmanaged index of municipal bonds with maturities of at least one year.
Management's Discussion of Fund Performance(Unaudited)
Touchstone Small Company Fund
Sub-Advised by Fort Washington Investment Advisors, Inc.
Investment Philosophy
The Fund seeks to provide investors with growth of capital by investing primarily in common stocks of small companies that the sub-advisor believes are high quality, have superior business models, solid management teams, sustainable growth potential and are attractively valued.
Fund Performance
The Touchstone Small Company Fund (Class A Shares) outperformed its benchmark, the Russell 2000® Index for the 12-month period ended June 30, 2019. The Fund’s total return was -0.73 percent (calculated excluding the maximum sales charge), while the total return of the benchmark was -3.31 percent.
Market Environment
Small-cap equities experienced significant volatility during the period. We believe changing expectations in three main areas and their impact on corporate earnings were driving market volatility. These three focus areas are the economic cycle, interest rates and trade with China.
Starting with China, in the quarter ended December 2018, global trade war concerns intensified, and as a result, emerging and developed economies overseas experienced a significant deceleration in economic conditions and stock market valuations. Positive updates on trade negotiations in the March 2019 quarter sparked the rally, before giving way to a breakdown in negotiations and additional tariffs in May 2019, and a resumption of trade talks after the G-20 Summit in June 2019. While near-term trade war escalations have been averted, the situation is fluid.
Turning our attention to interest rates, in the span of less than six months, market expectations moved from higher expected rates, to the U.S. Federal Reserve Board (Fed) on hold, to now expecting interest rate cuts.
In contrast to the significant volatility in trade and interest rate expectations, United States economic conditions have been solid and steady. Gross domestic product (GDP) grew three percent in each of the period’s first three quarters compared to the prior year, unemployment remains low and inflation benign. The economic backdrop for corporate and consumer spending has remained positive.
At the sector level, there has been a significant divergence in performance over the year ended June 30, 2019. The outperforming market sectors were Utilities, Information Technology, Real Estate and Industrials. The Utilities and Information Technology sectors were particularly strong as each posted double-digit performance. The underperforming market sectors were Energy, Materials, Consumer Staples, Health Care, Consumer Discretionary, and Financials. The economically sensitive Energy and Materials sectors were notably weaker.
Portfolio Review
Among the Fund’s top performing sectors were Industrials, Information Technology, Energy and Health Care. Stock selection drove the Industrials and Health Care sectors’ outperformance, while a low allocation to the Energy sector benefitted performance. Among the Fund’s bottom performing sectors were Financials, Utilities and Real Estate, due principally to negative stock selection.
The Fund’s largest sector exposure for the year was Information Technology. Two of the Fund’s top ten performing stocks for the year were in this sector, Live Ramp Holdings Inc. and Verint Systems Inc. Live Ramp Holdings is a provider of marketing services and data connectivity used by global brands and marketing technology companies. The company, formerly known as Acxiom Corp., sold the Acxiom Marketing Solutions business to The Interpublic Group of Companies for $2.3 billion, which was significantly higher than market expectations. The remaining
Management's Discussion of Fund Performance(Unaudited) (Continued)
company is focused on the Live Ramp business, a fast growing, high gross margin software-as-a-service (SaaS) business model that the market reacted favorably to as a stand-alone company. Verint provides software focused on actionable intelligence in two target areas – enterprise solutions and cyber security solutions. Both businesses experienced accelerated organic growth over the last year, which combined with margin expansion from their shared services model to drive double-digit earnings growth. The market reacted favorably to three year targets that pointed to continued elevated revenue growth, margin expansion and double-digit earnings growth. Information Technology sector holdings that detracted from performance in the last year were Plantronics Inc. and Avaya Holdings Corp. Both companies provide products and services in the unified communications market. Plantronics provides voice and video endpoints, while Avaya builds the software and services infrastructure. We believe that their underperformance was driven by concerns about their respective competitive positions given secular changes in the communications market toward emerging cloud based solutions. We believe these competitive concerns were exacerbated by the fact that both companies have above average debt leverage on their balance sheets.
The Fund’s second largest sector exposure for the year was Industrials. Woodward Inc. and Esterline Technologies Corp. were the Fund’s top performing Industrials stocks. Woodward provides control system solutions to the aerospace and industrial markets. The company’s aerospace segment experienced a significant acceleration in growth driven by higher content in next generation aircraft and record margins. The Industrials sector benefitted from the astute acquisition of L’Orange, which has proven significantly more accretive than expected. Esterline was also a provider of products and solutions to the aerospace and industrial markets. The company was acquired by Transdigm Group Inc. for a substantial premium. Industrials holdings that detracted from performance in the last year were Mobile Mini Inc. and Terex Corp. The Mobile Mini underperformance was surprising, as the largest portable storage solutions provider in the United Sates delivered record earnings in 2018 and had a positive outlook for 2019 with revenue growth, margin expansion and free cash generation expected to outperform its target evergreen model. We believe the underperformance is tied to economic cycle concerns, particularly in retail and construction end markets, the largest end markets it services. Similarly, Terex, a manufacturer of aerial work platforms, cranes and materials processing machinery, underperformed due to cycle concerns. We exited the stock on deteriorating business model concerns.
Outlook
Although the backdrop in the U.S. has been stable, we believe U.S. companies will have a more difficult time outperforming their prior year earnings results. As a result, we are emphasizing companies with attractive cash flow conversion and balance sheet strength.
Overall, we remain focused on executing our fundamental stock selection and portfolio management process. We believe that stocks experience a four stage investment cycle and our research process is focused on the dynamics that apply to each stage of the investment cycle. We believe that excess returns and lower volatility are driven by the ability to successfully identify a stock’s current stage and the potential for it to transition to a different stage of its investment cycle, thus capturing upside potential and reducing downside risk.
Management's Discussion of Fund Performance(Unaudited) (Continued)
Comparison of the Change in Value of a $10,000 Investment in the Touchstone Small Company Fund - Class A* and the Russell 2000® Index
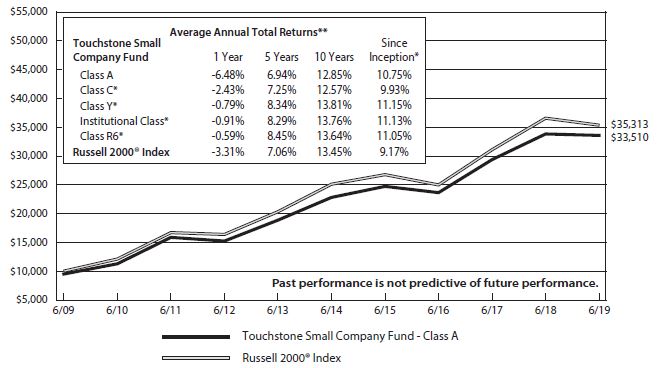
| * | The chart above represents performance of Class A shares only, which will vary from the performance of Class C shares, Class Y shares, Institutional Class shares and Class R6 shares based on the differences in sales loads and fees paid by shareholders in the different classes. The inception date of Class A shares, Class C shares, Class Y shares, Institutional Class shares and Class R6 shares was March 1, 1993, July 9, 2001, May 4, 2007, October 30, 2017 and December 23, 2014, respectively. Class C shares, Class Y shares, Institutional Class shares and Class R6 shares performance was calculated using the historical performance of Class A shares for the periods prior to July 9, 2001, May 4, 2007, October 30, 2017 and December 23, 2014, respectively. The returns have been restated for sales loads and fees applicable to Class C, Class Y, Institutional Class and Class R6 shares. The returns of the index listed above are based on the inception date of the Fund. |
| ** | The average annual total returns shown above are adjusted for maximum sales loads and fees, if applicable. Effective August 17, 2018, the maximum offering price per share of Class A shares is equal to the net asset value (“NAV”) per share plus a sales load equal to 5.26% of the NAV (or 5.00% of the offering price). Prior to August 17, 2018, the maximum offering price per share of Class A shares was equal to the NAV per share plus a sales load equal to 6.10% of the NAV (or 5.75% of the offering price). Prior to October 28, 2017, the maximum offering price per share of Class A shares was equal to the NAV per share plus a sales load equal to 5.26% of the NAV (or 5.00% of the offering price). Class C shares are subject to a contingent deferred sales charge (“CDSC”) of 1.00%. The CDSC will be assessed on an amount equal to the lesser of (1) the NAV at the time of purchase of the shares being redeemed or (2) the NAV of such shares being redeemed, if redeemed within a one-year period from the date of purchase. Class Y shares, Institutional Class shares and Class R6 shares are not subject to sales charges. |
The performance of the above Fund does not reflect the deduction of taxes that a shareholder would pay on Fund distributions or the redemption of Fund shares.
Notes to Chart
Russell 2000®Index measures the performance of the small-cap segment of the U.S. equity universe.
The Frank Russell Company (FRC) is the source and owner of the data contained or reflected in this material and all trademarks and copyrights related thereto. The material may contain confidential information and unauthorized use, disclosure, copying, dissemination or redistribution is strictly prohibited. This is a Touchstone Investments presentation of the data, and FRC is not responsible for the formatting or configuration of this material or for any inaccuracy in the presentation thereof.
Management's Discussion of Fund Performance(Unaudited)
Touchstone Value Fund
Sub-Advised by Barrow, Hanley, Mewhinney & Strauss, LLC
Investment Philosophy
The Touchstone Value Fund seeks long-term growth by primarily investing in equity securities of large- and mid-cap companies believed to be undervalued. The Fund uses traditional methods of stock selection — research and analysis — to identify companies that have price-to-earnings and price-to-book ratios below the market, that also have above-average dividend yields, that focus on companies that are out of favor due to internal or external challenges judged to be short-term in nature. Stock selection is driven by fundamental analysis on individual companies rather than by broad market themes.
Fund Performance
The Touchstone Value Fund (Class A Shares) outperformed its benchmark, the Russell 1000® Value Index, for the 12-month period ended June 30, 2019. The Fund’s total return was 8.53 percent (calculated excluding the maximum sales charge), while the total return of the benchmark was 8.46 percent.
Market Environment
Markets over the past year took equity investors on a wild ride. After a reasonable third quarter last year markets took a nose dive in the fourth quarter only to rebound strongly through the first half of 2019. While the roller coaster ride may initially have been thrilling, equity investors now sit at the top of the ride, trying not to look down. For those who did look down, there was plenty to fear as political and trade uncertainties threatened to remake decades-old global trading patterns and supply chains, and in the process negatively impact economic growth and earnings forecasts for companies around the globe. An additional glance down would also reveal a familiar, but nevertheless unexpected driver of the roller coaster – the U.S. Federal Reserve Board (Fed). It is hard to overstate the influence of the Fed on the direction and trajectory of equity markets over the past year. When the Fed signaled further rate hikes and a normalization of interest rates late last year, stocks declined. When the Fed turned dovish and economic readings softened, expectations changed dramatically.
Looking closely at the sector returns within the Fund’s benchmark over the past year, the defensive Utilities, Health Care and Consumer Staples sectors outperformed, along with the perennially popular Information Technology sector, while the Energy and Materials sectors fell amid fears of a global economic slowdown.
Portfolio Review
During the 12-month period, the Fund’s stock selection within the Information Technology, Consumer Discretionary and Materials sectors contributed most to relative performance. Stock selection in Consumer Staples detracted from relative performance, as did an overweight to the Energy sector; yet the negative effect was mitigated by stock selection within the sector.
Among the individual stocks that contributed to performance were Air Products and Chemicals, Inc. (Materials Sector), Dollar General Corp. (Consumer Discretionary sector) and Qualcomm Inc. (Information Technology sector). Air Products and Chemicals, Inc. was a positive contributor during the 12-month period as the stock strengthened further following the sell-off in the fourth quarter of 2018. APD continues to realize benefits from accelerating new project backlogs and pricing. Dollar General Corp. outperformed in the 12-month period after delivering two consecutive quarters of comparable sales growth during the first half of 2019 and greater than expected profits. A series of operating initiatives – ranging from highly profitable remodel formats to plans to self-distribute the company’s fresh and frozen merchandise – began to drive top line growth and should result in margin expansion as the company enters 2020. Qualcomm Inc., is the leader in mobile processors, and modems along with a successful technology licensing business. The stock outperformed over the 12-month
Management's Discussion of Fund Performance(Unaudited) (Continued)
period as Qualcomm and Apple settled a two-year licensing dispute. Partially offsetting the good news of an Apple resolution was a legal setback, as a judge ruled against Qualcomm in the Federal Trade Commission’s case against the company.
Among the individual stocks that detracted from performance were State Street Corp. (Financials sector), Phillips 66 (Energy sector) and CVS Health Corp. (Health Care sector). State Street services and manages assets on behalf of institutional clients. The company operates in more than 100 markets worldwide and has approximately $33 trillion assets under custody and administration as well as $2.8 trillion of primarily passive assets under management. In June 2018, State Street announced plans to acquire Charles River Development. Our initial take on the deal was that State Street would have a competitive advantage over peers with its fully integrated front-to-back office client servicing platform. Upon further diligence, we now view the Charles River transaction as more defensive in nature. Although trading at only eight times earnings, pricing pressure trends in State Street’s asset servicing business are more secular than cyclical, which limits earnings visibility. Phillips 66 is a well-diversified downstream company that should benefit from the long-term demand for petrochemicals and refined products while it takes advantages of North American crude differentials. We remain optimistic, despite the stock weighing on performance over the 12-month period. As one of the largest distillate producers also leveraged to medium/sour crude discounts, we believe the company should be able to utilize the prospects of good refining fundamentals. Further, the company’s Chevron Phillips Chemical Company joint venture and midstream operations will benefit from the growing natural gas liquids supply and the need for energy infrastructure in the U.S. CVS Health Corp. was also a detractor during the past year. Within the Health Care sector, Pharmacy Benefit Management (Caremark), and Health Insurance (Aetna) businesses, CVS is one of the largest U.S. diversified healthcare companies. CVS was a modest detractor in the quarter, as the market is still uncertain about long-term earnings growth potential. Given its top-tier scale and market position in each of its businesses, it appears unlikely that CVS will fail to grow earnings in line with the industry. Further, the acquisition of Aetna could prove to be a master stroke, giving CVS an avenue to deploy retail boxes for chronic disease management services (particularly for the government market) to reduce medical costs, improve health outcomes, improve patient experience, and receive bonus payments – all of which can be reinvested to enhance growth and market share.
There were several changes in the portfolio during the 12-month period. Within Financials, we sold many of the large money-centered banks that have enjoyed the rise in interest rates and concomitant net interest margin expansion, as well as an easier regulatory environment. In their place, we have purchased several companies that we believe will outperform as we enter the later stages of the credit cycle (U.S. Bancorp, Northern Trust Corp. and Chubb Ltd. to name a few). Additionally, we have reduced the Fund’s position in Health Care as we have sold several pharmaceutical stocks (Pfizer, Merck) as those holdings have reached our valuation targets. We added UnitedHealth Group, a stock the Fund has owned previously, and that sold-off this year as political rhetoric over health care spending has overtaken the fundamentals of the company. We have remained underweight the “bond proxy” sectors of Real Estate, Consumer Staples and Utilities. As a bottom-up investor, sector allocation will always be a residual of individual stock selection process.
Outlook
Investors are questioning whether there is another, higher high to be fueled by Fed-engineered low rates. Many signals indicate that we are in the latter stages of this decade-long bull market, and yet we still have a major macro focus – interest rates – driving equity market returns and investor psychology. One might have made the same observation at any time during the past several years – and we probably did as well. It is for this reason, among others, that we stay fully invested in and do not try to “time the market.” Instead, we focus on a much smaller group of companies which meet our fundamental value criteria; thus, there are always opportunities, regardless of overall market conditions and valuations.
Management's Discussion of Fund Performance(Unaudited) (Continued)
We remain confident that our conservative, defensive style of investing is a good one. Importantly, our investment process has historically provided downside protection by focusing on undervalued companies with strong fundamentals and a meaningful and growing dividend. If markets fall or produce modest returns compared to the past, we believe the Fund is well positioned going forward.
Management's Discussion of Fund Performance(Unaudited) (Continued)
Comparison of the Change in Value of a $10,000 Investment in the Touchstone Value Fund - Class A* and the Russell 1000®Value Index
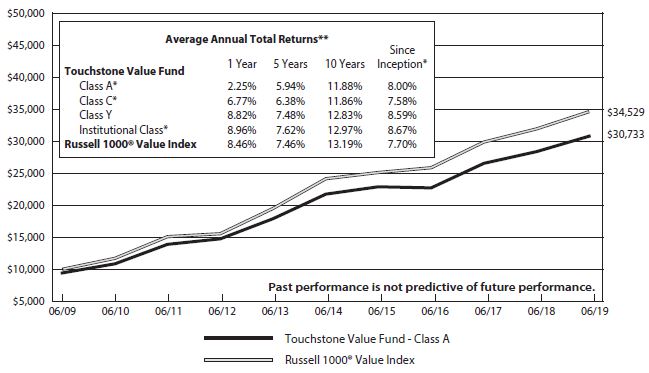
| * | The chart above represents performance of Class A shares only, which will vary from the performance of Class C shares, Class Y shares and Institutional Class shares based on the differences in sales loads and fees paid by shareholders in the different classes. The inception date of Class A shares, Class C shares, Class Y shares and Institutional Class shares was July 31, 2003, April 12, 2012, September 10, 1998 and December 20, 2006, respectively. Class A shares, Class C shares and Institutional Class shares performance was calculated using the historical performance of Class Y shares for the periods prior to July 31, 2003, April 12, 2012 and December 20, 2006, respectively. The returns have been restated for sales loads and fees applicable to Class A, Class C and Institutional Class shares. The returns of the index listed above are based on the inception date of the Fund. |
| ** | The average annual total returns shown above are adjusted for maximum sales loads and fees, if applicable. Effective August 17, 2018, the maximum offering price per share of Class A shares is equal to the net asset value (“NAV”) per share plus a sales load equal to 5.26% of the NAV (or 5.00% of the offering price). Prior to August 17, 2018, the maximum offering price per share of Class A shares was equal to the NAV per share plus a sales load equal to 6.10% of the NAV (or 5.75% of the offering price). Class C shares are subject to a contingent deferred sales charge (“CDSC”) of 1.00%. The CDSC will be assessed on an amount equal to the lesser of (1) the NAV at the time of purchase of the shares being redeemed or (2) the NAV of such shares being redeemed, if redeemed within a one-year period from the date of purchase. Class Y shares and Institutional Class shares are not subject to sales charges. |
The performance of the above Fund does not reflect the deduction of taxes that a shareholder would pay on Fund distributions or the redemption of Fund shares.
Note to Chart
Russell 1000® Value Index measures those Russell 1000 companies with lower price-to-book ratios and lower expected growth values.
The Frank Russell Company (FRC) is the source and owner of the data contained or reflected in this material and all trademarks and copyrights related thereto. The material may contain confidential information and unauthorized use, disclosure, copying, dissemination or redistribution is strictly prohibited. This is a Touchstone Investments presentation of the data, and FRC is not responsible for the formatting or configuration of this material or for any inaccuracy in the presentation thereof.
Tabular Presentation of Portfolios of Investments (Unaudited)
June 30, 2019
The tables below provide each Fund’s geographic allocation, credit quality and/or sector allocation. We hope it will be useful to shareholders as it summarizes key information about each Fund’s investments.
Touchstone Balanced Fund
Credit Quality* | | (% of Fixed Income Securities) | |
| AAA/Aaa | | | 53.7 | % |
| AA/Aa | | | 4.2 | |
| A/A | | | 11.6 | |
| BBB/Baa | | | 24.2 | |
| BB/Ba | | | 0.4 | |
| Not Rated | | | 5.9 | |
| | | | 100.0 | % |
| Sector Allocation** | | | (% of Net Assets) | |
| Fixed Income Securities | | | 29.9 | |
| Common Stocks | | | | |
| Information Technology | | | 14.4 | |
| Health Care | | | 10.7 | |
| Financials | | | 9.3 | |
| Industrials | | | 7.3 | |
| Consumer Discretionary | | | 7.3 | |
| Communication Services | | | 6.2 | |
| Consumer Staples | | | 5.7 | |
| Energy | | | 3.4 | |
| Materials | | | 1.3 | |
| Real Estate | | | 0.6 | |
| Exchange-Traded Fund | | | 1.6 | |
| Short-Term Investment Fund | | | 2.1 | |
| Other Assets/Liabilities (Net) | | | 0.2 | |
| Total | | | 100.0 | % |
Touchstone Credit Opportunities Fund
| Credit Quality* | | (% of Fixed Income Securities) | |
| BBB/Baa | | | 3.1 | % |
| BB/Ba | | | 46.0 | |
| B/B | | | 37.5 | |
| CCC | | | 7.8 | |
| Not Rated | | | 3.7 | |
| Cash equivalents | | | 1.9 | |
| | | | 100.0 | % |
| Sector Allocation** | | | (% of Net Assets) | |
| Long Positions | | | | |
| Corporate Bonds | | | | |
| Communication Services | | | 16.5 | % |
| Industrials | | | 13.8 | |
| Energy | | | 10.1 | |
| Consumer Discretionary | | | 10.0 | |
| Health Care | | | 5.9 | |
| Information Technology | | | 4.4 | |
| Materials | | | 4.3 | |
| Real Estate | | | 4.1 | |
| Consumer Staples | | | 3.9 | |
| Financials | | | 2.9 | |
| Utilities | | | 1.8 | |
| Bank Loans | | | 14.4 | |
| Asset-Backed Securities | | | 5.2 | |
| Common Stocks | | | 0.5 | |
| Purchased Call Options | | | 0.0 | |
| Purchased Put Options | | | 0.1 | |
| Short-Term Investment Funds | | | 4.9 | |
| Other Assets/Liabilities (Net) | | | (1.8 | ) |
| | | | 101.0 | % |
| Short Positions | | | | |
| Corporate Bonds | | | (1.0 | ) |
| Written Call Options | | | (0.0 | ) |
| | | | (1.0 | ) |
| Total | | | 100.0 | % |
| * | Credit quality ratings are from Standard & Poor’s (“S&P”) and Moody’s Investors Service (“Moody’s”). If agency ratings differ, the higher rating will be used. Where no rating has been assigned, it may be for reasons unrelated to the creditworthiness of the issuer. |
| ** | Sector classifications are based upon the Global Industry Classification Standard (GICS®). |
Tabular Presentation of Portfolios of Investments (Unaudited) (Continued)
Touchstone International Equity Fund
| Geographic Allocation | | (% of Net Assets) | |
| Common Stocks | | | | |
| United Kingdom | | | 19.9 | % |
| Germany | | | 12.4 | |
| Switzerland | | | 8.4 | |
| Canada | | | 6.1 | |
| France | | | 5.9 | |
| India | | | 5.3 | |
| Japan | | | 4.9 | |
| China | | | 3.8 | |
| Ireland | | | 3.4 | |
| Denmark | | | 3.4 | |
| Greece | | | 3.2 | |
| Mexico | | | 2.5 | |
| Norway | | | 2.4 | |
| Netherlands | | | 2.3 | |
| South Korea | | | 2.2 | |
| Hong Kong | | | 2.1 | |
| Luxembourg | | | 1.8 | |
| United States | | | 1.4 | |
| Australia | | | 1.1 | |
| Short-Term Investment Funds | | | 7.0 | |
| Other Assets/Liabilities (Net) | | | 0.5 | |
| Total | | | 100.0 | % |
Touchstone International Growth Opportunities Fund
| Geographic Allocation | | (% of Net Assets) | |
| Common Stocks | | | | |
| China | | | 40.9 | % |
| France | | | 12.7 | |
| Switzerland | | | 8.3 | |
| Germany | | | 5.1 | |
| India | | | 5.0 | |
| Japan | | | 4.5 | |
| Singapore | | | 4.2 | |
| Israel | | | 3.8 | |
| Brazil | | | 3.6 | |
| Sweden | | | 3.2 | |
| Argentina | | | 2.9 | |
| United Kingdom | | | 2.1 | |
| Russia | | | 1.9 | |
| Canada | | | 1.3 | |
| Short-Term Investment Funds | | | 1.8 | |
| Other Assets/Liabilities (Net) | | | (1.3 | ) |
| Total | | | 100.0 | % |
Tabular Presentation of Portfolios of Investments (Unaudited) (Continued)
Touchstone International Small Cap Fund
| Geographic Allocation | | (% of Net Assets) | |
| Common Stocks | | | | |
| Japan | | | 23.1 | % |
| United Kingdom | | | 11.1 | |
| Germany | | | 7.4 | |
| Australia | | | 6.8 | |
| Canada | | | 6.8 | |
| France | | | 6.2 | |
| Switzerland | | | 4.3 | |
| Italy | | | 3.7 | |
| Sweden | | | 3.5 | |
| Netherlands | | | 3.3 | |
| Denmark | | | 3.3 | |
| Ireland | | | 2.9 | |
| Norway | | | 2.5 | |
| Singapore | | | 1.4 | |
| India | | | 1.3 | |
| Spain | | | 1.3 | |
| Argentina | | | 1.2 | |
| Finland | | | 1.2 | |
| South Korea | | | 1.0 | |
| Luxembourg | | | 1.0 | |
| Taiwan | | | 0.9 | |
| China | | | 0.9 | |
| Hong Kong | | | 0.7 | |
| Exchange-Traded Fund | | | 2.5 | |
| Short-Term Investment Funds | | | 8.6 | |
| Other Assets/Liabilities (Net) | | | (6.9 | ) |
| Total | | | 100.0 | % |
Touchstone Large Cap Focused Fund
| Sector Allocation* | | (% of Net Assets) | |
| Information Technology | | | 22.5 | % |
| Consumer Discretionary | | | 14.4 | |
| Financials | | | 13.2 | |
| Health Care | | | 12.2 | |
| Communication Services | | | 11.0 | |
| Industrials | | | 7.7 | |
| Consumer Staples | | | 6.7 | |
| Energy | | | 3.8 | |
| Real Estate | | | 2.3 | |
| Materials | | | 0.8 | |
| Exchange-Traded Funds | | | 5.2 | |
| Short-Term Investment Funds | | | 0.3 | |
| Other Assets/Liabilities (Net) | | | (0.1 | ) |
| Total | | | 100.0 | % |
Touchstone Large Cap Fund
| Sector Allocation* | | | (% of Net Assets) | |
| Financials | | | 22.4 | % |
| Consumer Discretionary | | | 20.4 | |
| Information Technology | | | 13.2 | |
| Industrials | | | 12.1 | |
| Communication Services | | | 9.3 | |
| Materials | | | 7.9 | |
| Consumer Staples | | | 7.3 | |
| Energy | | | 3.2 | |
| Health Care | | | 1.5 | |
| Short-Term Investment Fund | | | 2.7 | |
| Other Assets/Liabilities (Net) | | | 0.0 | |
| Total | | | 100.0 | % |
| * | Sector classifications are based upon the Global Industry Classification Standard (GICS®). |
Tabular Presentation of Portfolios of Investments (Unaudited) (Continued)
Touchstone Large Company Growth Fund
| Sector Allocation* | | (% of Net Assets) | |
| Information Technology | | | 41.0 | % |
| Communication Services | | | 20.0 | |
| Consumer Discretionary | | | 17.4 | |
| Health Care | | | 15.4 | |
| Consumer Staples | | | 3.8 | |
| Financials | | | 2.1 | |
| Short-Term Investment Fund | | | 0.1 | |
| Other Assets/Liabilities (Net) | | | 0.2 | |
| Total | | | 100.0 | % |
Touchstone Ohio Tax-Free Bond Fund
| Credit Quality** | | (% of Fixed Income Securities) | |
| AAA/Aaa | | | 9.0 | % |
| AA/Aa | | | 69.8 | |
| A/A | | | 15.3 | |
| BBB/Baa | | | 5.0 | |
| Not Rated | | | 0.9 | |
| Total | | | 100.0 | % |
| |
| Portfolio Allocation | | (% of Net Assets) | |
| Fixed Rate Revenue Bonds | | | 69.6 | % |
| General Obligation Bonds | | | 21.6 | |
| Pre-refunded/Escrowed to Maturity | | | 8.5 | |
| Variable Rate Demand Notes | | | 0.2 | |
| Other Assets/Liabilities (Net) | | | 0.1 | |
| Total | | | 100.0 | % |
Touchstone Small Company Fund
| Sector Allocation* | | (% of Net Assets) | |
| Industrials | | | 23.0 | % |
| Health Care | | | 21.3 | |
| Information Technology | | | 19.8 | |
| Consumer Discretionary | | | 19.2 | |
| Financials | | | 8.6 | |
| Communication Services | | | 3.4 | |
| Real Estate | | | 1.2 | |
| Consumer Staples | | | 0.7 | |
| Short-Term Investment Funds | | | 3.9 | |
| Other Assets/Liabilities (Net) | | | (1.1 | ) |
| Total | | | 100.0 | % |
Touchstone Value Fund
| Sector Allocation* | | (% of Net Assets) | |
| Financials | | | 18.9 | % |
| Energy | | | 13.5 | |
| Information Technology | | | 12.8 | |
| Consumer Discretionary | | | 12.0 | |
| Health Care | | | 11.4 | |
| Industrials | | | 11.4 | |
| Materials | | | 7.7 | |
| Utilities | | | 4.3 | |
| Communication Services | | | 3.8 | |
| Consumer Staples | | | 1.9 | |
| Short-Term Investment Fund | | | 2.1 | |
| Other Assets/Liabilities (Net) | | | 0.2 | |
| Total | | | 100.0 | % |
| * | Sector classifications are based upon the Global Industry Classification Standard (GICS®). |
| | |
| ** | Credit quality ratings are from Standard & Poor’s (“S&P”) and Moody’s Investors Service (“Moody’s”). If agency ratings differ, the higher rating will be used. Where no rating has been assigned, it may be for reasons unrelated to the creditworthiness of the issuer. |
Portfolio of Investments
Touchstone Balanced Fund– June 30, 2019
| | | | | | Market | |
| | | Shares | | | Value | |
| | | | | | | |
| Common Stocks — 66.2% | | | | | | | | |
| | | | | | | | | |
| Information Technology — 14.4% | | | | | | | | |
| Accenture PLC (Ireland) - Class A | | | 30,000 | | | $ | 5,543,100 | |
| Apple, Inc. | | | 48,000 | | | | 9,500,160 | |
| Microsoft Corp. | | | 123,000 | | | | 16,477,080 | |
| Oracle Corp. | | | 11,308 | | | | 644,217 | |
| salesforce.com, Inc.* | | | 3,733 | | | | 566,408 | |
| Texas Instruments, Inc. | | | 60,000 | | | | 6,885,600 | |
| Visa, Inc. - Class A | | | 53,000 | | | | 9,198,150 | |
| | | | | | | | 48,814,715 | |
| | | | | | | | | |
| Health Care — 10.7% | | | | | | | | |
| Alcon, Inc. (Switzerland)* | | | 5,751 | | | | 356,850 | |
| AmerisourceBergen Corp. | | | 23,954 | | | | 2,042,318 | |
| Amgen, Inc. | | | 15,000 | | | | 2,764,200 | |
| Becton Dickinson and Co. | | | 13,000 | | | | 3,276,130 | |
| Biogen, Inc.* | | | 5,000 | | | | 1,169,350 | |
| Bristol-Myers Squibb Co. | | | 45,000 | | | | 2,040,750 | |
| CVS Health Corp. | | | 10,000 | | | | 544,900 | |
| Johnson & Johnson | | | 23,000 | | | | 3,203,440 | |
| Merck & Co., Inc. | | | 70,000 | | | | 5,869,500 | |
| Novartis AG (Switzerland) ADR | | | 28,756 | | | | 2,625,710 | |
| Stryker Corp. | | | 15,000 | | | | 3,083,700 | |
| UnitedHealth Group, Inc. | | | 20,000 | | | | 4,880,200 | |
| Zoetis, Inc. | | | 40,000 | | | | 4,539,600 | |
| | | | | | | | 36,396,648 | |
| | | | | | | | | |
| Financials — 9.3% | | | | | | | | |
| American Express Co. | | | 25,000 | | | | 3,086,000 | |
| Berkshire Hathaway, Inc. - Class B* | | | 27,693 | | | | 5,903,317 | |
| CME Group, Inc. | | | 18,000 | | | | 3,493,980 | |
| JPMorgan Chase & Co. | | | 39,000 | | | | 4,360,200 | |
| Morgan Stanley | | | 100,000 | | | | 4,381,000 | |
| PNC Financial Services Group, Inc. (The) | | | 27,000 | | | | 3,706,560 | |
| S&P Global, Inc. | | | 20,000 | | | | 4,555,800 | |
| Signature Bank/NewYork NY | | | 17,239 | | | | 2,083,161 | |
| | | | | | | | 31,570,018 | |
| | | | | | | | | |
| Industrials — 7.3% | | | | | | | | |
| Boeing Co. (The) | | | 20,000 | | | | 7,280,200 | |
| Canadian National Railway Co. (Canada) | | | 32,000 | | | | 2,959,360 | |
| General Dynamics Corp. | | | 14,000 | | | | 2,545,480 | |
| Honeywell International, Inc. | | | 35,000 | | | | 6,110,650 | |
| Resideo Technologies, Inc.* | | | 5,833 | | | | 127,859 | |
| United Technologies Corp. | | | 22,000 | | | | 2,864,400 | |
| Verisk Analytics, Inc. | | | 20,000 | | | | 2,929,200 | |
| | | | | | | | 24,817,149 | |
| | | | | | | | | |
| Consumer Discretionary — 7.3% | | | | | | | | |
| Amazon.com, Inc.* | | | 1,301 | | | | 2,463,613 | |
| Carnival Corp. | | | 18,121 | | | | 843,533 | |
| Garrett Motion, Inc. (Switzerland)* | | | 3,500 | | | | 53,725 | |
| Home Depot, Inc. (The) | | | 8,683 | | | | 1,805,804 | |
| JD.com, Inc. (China) ADR* | | | 59,294 | | | | 1,796,015 | |
| Marriott International, Inc. - Class A | | | 31,100 | | | | 4,363,019 | |
| McDonald’s Corp. | | | 33,000 | | | | 6,852,780 | |
| Starbucks Corp. | | | 20,393 | | | | 1,709,545 | |
| TJX Cos., Inc. (The) | | | 90,000 | | | | 4,759,200 | |
| | | | | | | | 24,647,234 | |
| | | | | | | | | |
| Communication Services — 6.2% | | | | | | | | |
| Alphabet, Inc. - Class C* | | | 6,000 | | | | 6,485,460 | |
| AT&T, Inc. | | | 28,740 | | | | 963,077 | |
| Comcast Corp. - Class A | | | 120,000 | | | | 5,073,600 | |
| Facebook, Inc. - Class A* | | | 22,420 | | | | 4,327,060 | |
| Verizon Communications, Inc. | | | 75,000 | | | | 4,284,750 | |
| | | | | | | | 21,133,947 | |
| | | | | | | | | |
| Consumer Staples — 5.7% | | | | | | | | |
| Kraft Heinz Co. (The) | | | 30,000 | | | | 931,200 | |
| Monster Beverage Corp.* | | | 18,792 | | | | 1,199,493 | |
| PepsiCo, Inc. | | | 40,000 | | | | 5,245,200 | |
| Philip Morris International, Inc. | | | 40,000 | | | | 3,141,200 | |
| Procter & Gamble Co. (The) | | | 40,000 | | | | 4,386,000 | |
| Unilever NV (United Kingdom) | | | 70,000 | | | | 4,250,400 | |
| | | | | | | | 19,153,493 | |
| | | | | | | | | |
| Energy — 3.4% | | | | | | | | |
| Chevron Corp. | | | 20,000 | | | | 2,488,800 | |
| EOG Resources, Inc. | | | 25,000 | | | | 2,329,000 | |
| Exxon Mobil Corp. | | | 38,000 | | | | 2,911,940 | |
| Marathon Petroleum Corp. | | | 40,000 | | | | 2,235,200 | |
| Schlumberger Ltd. | | | 37,700 | | | | 1,498,198 | |
| | | | | | | | 11,463,138 | |
| | | | | | | | | |
| Materials — 1.3% | | | | | | | | |
| Corteva, Inc.* | | | 12,820 | | | | 379,087 | |
| Dow, Inc. | | | 12,820 | | | | 632,154 | |
| DuPont de Nemours, Inc. | | | 12,820 | | | | 962,398 | |
| Linde PLC (United Kingdom) | | | 12,000 | | | | 2,409,600 | |
| | | | | | | | 4,383,239 | |
| | | | | | | | | |
| Real Estate — 0.6% | | | | | | | | |
| Jones Lang LaSalle, Inc. | | | 7,564 | | | | 1,064,179 | |
| Simon Property Group, Inc. REIT | | | 6,587 | | | | 1,052,339 | |
| | | | | | | | 2,116,518 | |
| Total Common Stocks | | | | | | $ | 224,496,099 | |
| Principal | | | | | | | |
| Amount | | | | | | | |
| | | | | | | | | |
| | | | | Corporate Bonds — 11.1% | | | | |
| | | | | | | | | |
| | | | | Financials — 3.2% | | | | |
| $ | 207,000 | | | Allstate Corp. (The), Ser B,5.750%, 8/15/53 | | | 216,980 | |
| | 440,000 | | | American Express Co.,3.000%, 10/30/24 | | | 451,031 | |
| | 355,000 | | | Bank of America Corp.,3.705%, 4/24/28 | | | 372,999 | |
| | 535,000 | | | Bank of America Corp. MTN,4.000%, 1/22/25 | | | 562,717 | |
| | 390,000 | | | Bank of Montreal (Canada),3.803%, 12/15/32 | | | 395,503 | |
Touchstone Balanced Fund (Continued)
| Principal | | | | | Market | |
| Amount | | | | | Value | |
| | | | | | | |
| | | | | Corporate Bonds — 11.1% (Continued) | | | | |
| | | | | | | | | |
| | | | | Financials — (Continued) | | | | |
| $ | 449,000 | | | Bank of New York Mellon Corp. (The) MTN, 2.950%, 1/29/23 | | $ | 458,400 | |
| | 435,000 | | | Barclays PLC (United Kingdom), 4.610%, 2/15/23 | | | 450,085 | |
| | 380,000 | | | BB&T Corp. MTN, 2.850%, 10/26/24 | | | 389,498 | |
| | 330,000 | | | Citigroup, Inc., 3.200%, 10/21/26 | | | 336,548 | |
| | 197,000 | | | Citigroup, Inc., 4.750%, 5/18/46 | | | 222,819 | |
| | 305,000 | | | Credit Suisse AG/New York NY (Switzerland) MTN, 3.625%, 9/9/24 | | | 321,276 | |
| | 345,000 | | | Fifth Third Bancorp, 2.875%, 7/27/20 | | | 346,584 | |
| | 440,000 | | | Goldman Sachs Group, Inc. (The), (3M LIBOR +1.000%), 3.581%, 7/24/23(A) | | | 440,749 | |
| | 150,000 | | | Goldman Sachs Group, Inc. (The), 3.691%, 6/5/28 | | | 154,915 | |
| | 350,000 | | | Goldman Sachs Group, Inc. (The), 5.250%, 7/27/21 | | | 369,934 | |
| | 335,000 | | | HSBC Holdings PLC (United Kingdom), 3.900%, 5/25/26 | | | 349,926 | |
| | 562,000 | | | Huntington Bancshares, Inc., 4.000%, 5/15/25 | | | 599,593 | |
| | 270,000 | | | JPMorgan Chase & Co., 3.250%, 9/23/22 | | | 277,379 | |
| | 350,000 | | | JPMorgan Chase & Co., (3M LIBOR +0.730%), 3.322%, 4/23/24(A) | | | 349,068 | |
| | 425,000 | | | JPMorgan Chase & Co., 3.509%, 1/23/29 | | | 441,845 | |
| | 416,000 | | | Lloyds Banking Group PLC (United Kingdom), 3.574%, 11/7/28 | | | 416,427 | |
| | 470,000 | | | Morgan Stanley, 3.950%, 4/23/27 | | | 491,608 | |
| | 278,000 | | | New York Life Global Funding, 144a, 3.000%, 1/10/28 | | | 284,307 | |
| | 300,000 | | | Northwestern Mutual Life Insurance Co. (The), 144a, 3.850%, 9/30/47 | | | 309,697 | |
| | 370,000 | | | PNC Bank NA, 2.700%, 11/1/22 | | | 373,708 | |
| | 380,000 | | | SunTrust Banks, Inc., 4.000%, 5/1/25 | | | 406,896 | |
| | 476,000 | | | SunTrust Capital I, Ser A, (3M LIBOR +0.670%), 3.190%, 5/15/27(A) | | | 436,730 | |
| | 285,000 | | | Wells Fargo & Co., 2.100%, 7/26/21 | | | 283,455 | |
| | 270,000 | | | Wells Fargo & Co., 4.125%, 8/15/23 | | | 285,146 | |
| | 63,000 | | | Wells Fargo & Co. MTN, 4.100%, 6/3/26 | | | 66,813 | |
| | | | | | | | 10,862,636 | |
| | | | | | | | | |
| | | | | Industrials — 1.2% | | | | |
| | 100,755 | | | Air Canada 2015-1 Class A Pass Through Trust (Canada), 144a, 3.600%, 3/15/27 | | | 103,767 | |
| | 402,000 | | | Avolon Holdings Funding Ltd. (Cayman Islands), 144a, 3.625%, 5/1/22 | | | 407,467 | |
| | 418,000 | | | Burlington Northern Santa Fe LLC, 5.750%, 5/1/40 | | | 550,962 | |
| | 370,000 | | | CRH America Finance, Inc., 144a, 4.500%, 4/4/48 | | | 364,884 | |
| | 377,000 | | | Eagle Materials, Inc., 4.500%, 8/1/26 | | | 384,975 | |
| | 166,000 | | | Embraer Netherlands Finance BV (Netherlands), 5.050%, 6/15/25 | | | 179,074 | |
| 167,000 | | | Embraer Netherlands Finance BV (Netherlands), 5.400%, 2/1/27 | | | 185,205 | |
| | 280,000 | | | FedEx Corp., 5.100%, 1/15/44 | | | 308,054 | |
| | 212,000 | | | General Electric Co., 4.125%, 10/9/42 | | | 195,260 | |
| | 210,000 | | | Norfolk Southern Corp., 4.837%, 10/1/41 | | | 243,181 | |
| | 408,000 | | | Parker-Hannifin Corp., 4.000%, 6/14/49 | | | 431,699 | |
| | 330,000 | | | Vulcan Materials Co., 4.500%, 4/1/25 | | | 351,778 | |
| | 400,000 | | | Wabtec Corp., 4.950%, 9/15/28 | | | 428,888 | |
| | | | | | | | 4,135,194 | |
| | | | | | | | | |
| | | | | Information Technology — 1.0% | | | | |
| | 899,000 | | | Apple, Inc., 2.750%, 1/13/25 | | | 919,065 | |
| | 110,000 | | | Apple, Inc., 4.650%, 2/23/46 | | | 130,469 | |
| | 400,000 | | | Broadcom, Inc., 144a, 3.125%, 4/15/21 | | | 402,590 | |
| | 384,000 | | | International Business Machines Corp., 2.800%, 5/13/21 | | | 388,623 | |
| | 210,000 | | | Microsoft Corp., 3.500%, 2/12/35 | | | 224,070 | |
| | 430,000 | | | NXP BV / NXP Funding LLC (Netherlands), 144a, 5.350%, 3/1/26 | | | 476,186 | |
| | 351,000 | | | Oracle Corp., 2.650%, 7/15/26 | | | 352,605 | |
| | 297,000 | | | Visa, Inc., 4.150%, 12/14/35 | | | 341,319 | |
| | | | | | | | 3,234,927 | |
| | | | | | | | | |
| | | | | Consumer Staples — 0.9% | | | | |
| | 380,000 | | | Anheuser-Busch Cos LLC / Anheuser-Busch InBev Worldwide, Inc., 4.900%, 2/1/46 | | | 423,104 | |
| | 242,000 | | | Ashtead Capital, Inc., 144a, 4.375%, 8/15/27 | | | 242,303 | |
| | 205,000 | | | General Mills, Inc., 3.200%, 4/16/21 | | | 208,110 | |
| | 380,000 | | | Grupo Bimbo SAB de CV (Mexico), 144a, 4.500%, 1/25/22 | | | 393,169 | |
| | 475,000 | | | Imperial Brands Finance PLC (United Kingdom), 144a, 4.250%, 7/21/25 | | | 498,449 | |
| | 340,000 | | | Kraft Heinz Foods Co., 6.875%, 1/26/39 | | | 408,322 | |
| | 167,000 | | | Kroger Co. (The), 5.000%, 4/15/42 | | | 173,941 | |
| | 400,000 | | | Mars, Inc., 144a, 3.875%, 4/1/39 | | | 423,551 | |
| | 351,000 | | | Reynolds American, Inc., 4.450%, 6/12/25 | | | 372,200 | |
| | | | | | | | 3,143,149 | |
| | | | | | | | | |
| | | | | Energy — 0.9% | | | | |
| | 224,000 | | | Boardwalk Pipelines LP, 4.450%, 7/15/27 | | | 229,041 | |
| | 331,000 | | | Buckeye Partners LP, 3.950%, 12/1/26 | | | 293,344 | |
| | 270,000 | | | Canadian Natural Resources Ltd. (Canada), 6.250%, 3/15/38 | | | 333,372 | |
| | 333,000 | | | Cenovus Energy, Inc. (Canada), 4.250%, 4/15/27 | | | 344,946 | |
| | 350,000 | | | Cheniere Corpus Christi Holdings LLC, 7.000%, 6/30/24 | | | 402,535 | |
| | 301,000 | | | Columbia Pipeline Group, Inc., 4.500%, 6/1/25 | | | 323,939 | |
| | 243,000 | | | Energy Transfer Partners LP, 4.950%, 6/15/28 | | | 265,677 | |
Touchstone Balanced Fund (Continued)
| Principal | | | | | Market | |
| Amount | | | | | Value | |
| | | | | | | |
| | | | | Corporate Bonds — 11.1% (Continued) | | | | |
| | | | | | | | | |
| | | | | Energy — (Continued) | | | | |
| | | | | | | | | |
| $ | 106,000 | | | Midcontinent Express Pipeline LLC, 144a, 6.700%, 9/15/19 | | $ | 106,493 | |
| | 89,000 | | | NGPL PipeCo LLC, 144a, 7.768%, 12/15/37 | | | 113,030 | |
| | 307,000 | | | Petroleos Mexicanos (Mexico), 4.500%, 1/23/26 | | | 281,881 | |
| | 100,000 | | | Shell International Finance BV (Netherlands), 1.875%, 5/10/21 | | | 99,557 | |
| | 309,000 | | | Woodside Finance Ltd. (Australia), 144a, 4.500%, 3/4/29 | | | 326,518 | |
| | | | | | | | 3,120,333 | |
| | | | | | | | | |
| | | | | Communication Services — 0.9% | | | | |
| | 205,000 | | | Activision Blizzard, Inc., 4.500%, 6/15/47 | | | 212,351 | |
| | 552,000 | | | AT&T, Inc., 3.800%, 3/15/22 | | | 572,665 | |
| | 88,000 | | | AT&T, Inc., 4.350%, 6/15/45 | | | 87,972 | |
| | 18,000 | | | AT&T, Inc., 4.500%, 5/15/35 | | | 18,843 | |
| | 155,000 | | | Charter Communications Operating LLC / Charter Communications Operating Capital, 6.484%, 10/23/45 | | | 182,638 | |
| | 257,000 | | | Comcast Corp., 4.000%, 3/1/48 | | | 271,859 | |
| | 267,000 | | | Cox Communications, Inc., 144a, 3.350%, 9/15/26 | | | 269,615 | |
| | 148,000 | | | Deutsche Telekom International Finance BV (Netherlands), 8.750%, 6/15/30 | | | 213,116 | |
| | 392,000 | | | Tencent Holdings Ltd. (Cayman Islands), 144a, 3.975%, 4/11/29 | | | 409,607 | |
| | 130,000 | | | Verizon Communications, Inc., 4.672%, 3/15/55 | | | 147,417 | |
| | 285,000 | | | Verizon Communications, Inc., 5.012%, 4/15/49 | | | 339,432 | |
| | 287,000 | | | Warner Media LLC, 3.800%, 2/15/27 | | | 286,809 | |
| | | | | | | | 3,012,324 | |
| | | | | | | | | |
| | | | | Health Care — 0.9% | | | | |
| | 114,000 | | | Abbott Laboratories, 3.750%, 11/30/26 | | | 123,256 | |
| | 365,000 | | | AbbVie, Inc., 4.450%, 5/14/46 | | | 358,464 | |
| | 260,000 | | | Allergan Funding SCS (Luxembourg), 3.800%, 3/15/25 | | | 269,821 | |
| | 322,000 | | | Allergan Sales LLC, 144a, 5.000%, 12/15/21 | | | 336,724 | |
| | 299,000 | | | Celgene Corp., 5.000%, 8/15/45 | | | 354,848 | |
| | 312,000 | | | Cigna Corp., 144a, 4.375%, 10/15/28 | | | 336,606 | |
| | 475,000 | | | CVS Health Corp., 4.300%, 3/25/28 | | | 500,877 | |
| | 230,000 | | | CVS Health Corp., 5.125%, 7/20/45 | | | 245,275 | |
| | 327,000 | | | Express Scripts Holding Co., 3.300%, 2/25/21 | | | 331,341 | |
| | | | | | | | 2,857,212 | |
| | | | | | | | | |
| | | | | Real Estate — 0.8% | | | | |
| | 390,000 | | | Boston Properties LP REIT, 3.200%, 1/15/25 | | | 398,124 | |
| 403,000 | | | Crown Castle International Corp. REIT, 3.650%, 9/1/27 | | | 415,007 | |
| | 288,000 | | | Mid-America Apartments LP, REIT, 3.750%, 6/15/24 | | | 299,735 | |
| | 149,000 | | | Sabra Health Care LP REIT, 5.125%, 8/15/26 | | | 155,102 | |
| | 110,000 | | | SL Green Operating Partnership LP REIT, 3.250%, 10/15/22 | | | 111,468 | |
| | 244,000 | | | Spirit Realty LP REIT, 4.450%, 9/15/26 | | | 255,491 | |
| | 795,000 | | | VEREIT Operating Partnership LP REIT, 4.600%, 2/6/24 | | | 844,182 | |
| | 309,000 | | | Welltower, Inc. REIT, 4.250%, 4/1/26 | | | 329,300 | |
| | | | | | | | 2,808,409 | |
| | | | | | | | | |
| | | | | Consumer Discretionary — 0.6% | | | | |
| | 89,000 | | | AutoNation, Inc., 5.500%, 2/1/20 | | | 90,290 | |
| | 406,000 | | | Dollar General Corp., 3.250%, 4/15/23 | | | 417,045 | |
| | 227,000 | | | Ford Motor Credit Co. LLC, 5.584%, 3/18/24 | | | 243,657 | |
| | 150,000 | | | General Motors Financial Co., Inc., 3.950%, 4/13/24 | | | 153,249 | |
| | 279,000 | | | General Motors Financial Co., Inc., 4.350%, 4/9/25 | | | 287,812 | |
| | 285,000 | | | Home Depot, Inc. (The), 5.950%, 4/1/41 | | | 386,389 | |
| | 394,000 | | | Walmart, Inc., 2.850%, 7/8/24 | | | 407,062 | |
| | | | | | | | 1,985,504 | |
| | | | | | | | | |
| | | | | Utilities — 0.5% | | | | |
| | 98,000 | | | American Water Capital Corp., 6.593%, 10/15/37 | | | 134,044 | |
| | 105,000 | | | DTE Energy Co., 3.700%, 8/1/23 | | | 109,564 | |
| | 237,000 | | | Duke Energy Progress LLC, 4.150%, 12/1/44 | | | 256,527 | |
| | 372,000 | | | Electricite de France SA (France), 144a, 4.500%, 9/21/28 | | | 407,964 | |
| | 298,000 | | | NextEra Energy Capital Holdings, Inc., 5.650%, 5/1/79 | | | 307,383 | |
| | 76,000 | | | Oncor Electric Delivery Co. LLC, 3.800%, 9/30/47 | | | 79,480 | |
| | 125,000 | | | PacifiCorp., 5.750%, 4/1/37 | | | 159,990 | |
| | 259,000 | | | WEC Energy Group, Inc., (3M LIBOR +2.113%), 4.631%, 5/15/67(A) | | | 213,675 | |
| | | | | | | | 1,668,627 | |
| | | | | | | | | |
| | | | | Materials — 0.2% | | | | |
| | 250,000 | | | Braskem America Finance Co., 144a, 7.125%, 7/22/41 | | | 294,675 | |
| | 398,000 | | | Sherwin-Williams Co. (The), 4.500%, 6/1/47 | | | 424,505 | |
| | | | | | | | 719,180 | |
| | | | | Total Corporate Bonds | | $ | 37,547,495 | |
Touchstone Balanced Fund (Continued)
| Principal | | | | | Market | |
| Amount | | | | | Value | |
| | | | | | | |
| | | | | U.S. Treasury Obligations — 8.0% | | | | |
| $ | 351,000 | | | U.S. Treasury Bond, 3.000%, 8/15/48 | | $ | 384,948 | |
| | 3,380,000 | | | U.S. Treasury Bond, 3.000%, 2/15/49 | | | 3,712,191 | |
| | 6,745,380 | | | U.S. Treasury Inflation Indexed Bonds, 0.875%, 1/15/29 | | | 7,099,924 | |
| | 340,000 | | | U.S. Treasury Note, 2.125%, 3/31/24 | | | 345,684 | |
| | 397,000 | | | U.S. Treasury Note, 2.125%, 5/31/26 | | | 403,637 | |
| | 6,234,000 | | | U.S. Treasury Note, 2.250%, 4/30/21 | | | 6,286,356 | |
| | 158,000 | | | U.S. Treasury Note, 2.375%, 5/15/29 | | | 163,277 | |
| | 8,296,000 | | | U.S. Treasury Note, 2.500%, 3/31/23 | | | 8,527,381 | |
| | 58,000 | | | U.S. Treasury Note, 2.625%, 2/15/29 | | | 61,163 | |
| | | | | Total U.S. Treasury Obligations | | $ | 26,984,561 | |
| | | | | | | | | |
| | | | | U.S. Government Mortgage-Backed Obligations — 5.8% | | | | |
| | 3,318 | | | FHLMC, Pool #G08062, 5.000%, 6/1/35 | | | 3,630 | |
| | 517,304 | | | FHLMC, Pool #G08637, 4.000%, 4/1/45 | | | 541,412 | |
| | 359 | | | FHLMC, Pool #G18091, 6.000%, 12/1/20 | | | 362 | |
| | 6,435 | | | FHLMC, Pool #P00020, 6.500%, 10/1/22 | | | 6,444 | |
| | 2,244,869 | | | FHLMC, Pool #Q02664, 4.500%, 8/1/41 | | | 2,412,668 | |
| | 3,150,604 | | | FHLMC, Pool #Q29056, 4.000%, 10/1/44 | | | 3,298,415 | |
| | 1,540,619 | | | FHLMC, Pool #Q29260, 4.000%, 10/1/44 | | | 1,613,843 | |
| | 26 | | | FNMA, Pool #255358, 5.000%, 9/1/19 | | | 26 | |
| | 31 | | | FNMA, Pool #687301, 6.000%, 11/1/32 | | | 34 | |
| | 1,191 | | | FNMA, Pool #690305, 5.500%, 3/1/33 | | | 1,270 | |
| | 619,434 | | | FNMA, Pool #725423, 5.500%, 5/1/34 | | | 688,023 | |
| | 592,295 | | | FNMA, Pool #725610, 5.500%, 7/1/34 | | | 657,894 | |
| | 66,682 | | | FNMA, Pool #748895, 6.000%, 12/1/33 | | | 70,131 | |
| | 334,537 | | | FNMA, Pool #AD9193, 5.000%, 9/1/40 | | | 363,550 | |
| | 738,230 | | | FNMA, Pool #AH8925, 4.500%, 3/1/41 | | | 792,902 | |
| | 895,130 | | | FNMA, Pool #AL2860, 3.000%, 12/1/42 | | | 912,758 | |
| | 404,680 | | | FNMA, Pool #AL5718, 3.500%, 9/1/44 | | | 421,403 | |
| | 585,913 | | | FNMA, Pool #AR9195, 3.000%, 3/1/43 | | | 597,446 | |
| | 1,144,917 | | | FNMA, Pool #AS4707, 3.500%, 4/1/45 | | | 1,187,847 | |
| | 1,360,459 | | | FNMA, Pool #AS8703, 2.500%, 2/1/32 | | | 1,371,388 | |
| | 1,747,741 | | | FNMA, Pool #AZ7347, 3.000%, 11/1/45 | | | 1,772,793 | |
| | 1,833,536 | | | FNMA, Pool #BC1809, 3.500%, 5/1/46 | | | 1,890,520 | |
| | 1,108,609 | | | GNMA, Pool #5175, 4.500%, 9/20/41 | | | 1,182,800 | |
| | | | | Total U.S. Government Mortgage-Backed Obligations | | $ | 19,787,559 | |
| | | | | | | | | |
| | | | | Asset-Backed Securities — 2.2% | | | | |
| | 396,660 | | | Adams Outdoor Advertising LP, Ser 2018-1, Class A, 144a, 4.810%, 11/15/48 | | | 422,032 | |
| | 450,000 | | | Apidos CLO XVIII (Cayman Islands), Ser 2018-18A, Class A1, 144a, (3M LIBOR + 1.140%), 3.732%, 10/22/30(A) | | | 449,754 | |
| | 1,350,000 | | | Hertz Vehicle Financing II LP, Ser 2016-4A, Class A, 144a, 2.650%, 7/25/22 | | | 1,350,659 | |
| 700,000 | | | Jack In The Box Funding LLC, Ser 2019-1A, Class A2I, 144a, 3.982%, 8/25/49 | | | 700,000 | |
| | 835,125 | | | Jimmy Johns Funding LLC, Ser 2017-1A, Class A2I, 144a, 3.610%, 7/30/47 | | | 843,376 | |
| | 450,000 | | | Kabbage Funding LLC, Ser 2019-1, Class A, 144a, 3.825%, 3/15/24 | | | 456,345 | |
| | 465,000 | | | Madison Park Funding XXXV Ltd. (Cayman Islands), Ser 2019-35A, Class A2A, 144a, (3M LIBOR + 1.650%), 4.174%, 4/20/31(A) | | | 464,979 | |
| | 759,578 | | | Towd Point Mortgage Trust, Ser 2019-1, Class A1, 144a, 3.750%, 3/25/58(A)(B) | | | 793,211 | |
| | 465,000 | | | Voya CLO Ltd. (Cayman Islands), Ser 2019-2A, Class A, 144a, (3M LIBOR + 1.270%), 3.523%, 7/20/32(A) | | | 465,000 | |
| | 1,329,750 | | | Wendy’s Funding LLC, Ser 2018-1A, Class A2I, 144a, 3.573%, 3/15/48 | | | 1,337,383 | |
| | | | | Total Asset-Backed Securities | | $ | 7,282,739 | |
| | | Shares | | | | |
| | | | | | | |
| Exchange-Traded Fund — 1.6% | | | | | | |
| iShares JP Morgan USD Emerging Markets Bond ETF | | | 49,202 | | | $ | 5,574,094 | |
| Principal | | | | | | |
| Amount | | | | | | |
| | | | | | | |
| | | | | Non-Agency Collateralized Mortgage Obligations — 1.5% | | | | |
| $ | 447,059 | | | Agate Bay Mortgage Trust, Ser 2013-1, Class B3, 144a, 3.608%, 7/25/43(A)(B) | | | 449,115 | |
| | 766,669 | | | Agate Bay Mortgage Trust, Ser 2015-7, Class B1, 144a, 3.764%, 10/25/45(A)(B) | | | 797,204 | |
| | 767,976 | | | CSMC Trust, Ser 2015-1, Class B3, 144a, 3.942%, 1/25/45(A)(B) | | | 775,150 | |
| | 870,902 | | | CSMC Trust, Ser 2015-WIN1, Class B3, 144a, 3.862%, 12/25/44(A)(B) | | | 892,314 | |
| | 774,800 | | | CSMC Trust, Ser 2018-RPL9, Class A, 144a, 3.850%, 9/25/57(A)(B) | | | 800,842 | |
| | 720,173 | | | PMT Loan Trust, Ser 2013-J1, Class A11, 144a, 3.500%, 9/25/43(A)(B) | | | 730,522 | |
| | 790,716 | | | Sequoia Mortgage Trust 2015-2, Ser 2015-2, Class A19, 144a, 3.500%, 5/25/45(A)(B) | | | 790,564 | |
| | | | | Total Non-Agency Collateralized Mortgage Obligations | | $ | 5,235,711 | |
| | | | | | | | | |
| | | | | Agency Collateralized Mortgage Obligations — 0.9% | | | | |
| | 1,093,972 | | | FHLMC REMIC, Ser 3859 Class JB, 5.000%, 5/15/41 | | | 1,201,444 | |
Touchstone Balanced Fund (Continued)
| Principal | | | | | Market | |
| Amount | | | | | Value | |
| | | | | | | |
| | | | | Agency Collateralized Mortgage Obligations — 0.9% (Continued) | | | | |
| $ | 900,000 | | | FNMA REMIC, Ser 2013-111, Class BA, 3.000%, 11/25/33 | | $ | 925,905 | |
| | 694,347 | | | GNMA, Ser 2010-169, Class AW, 4.500%, 12/20/40 | | | 736,216 | |
| | 7,340,216 | | | GNMA, Ser 2012-147, Class IO, 0.561%, 4/16/54(A)(B)(C) | | | 250,033 | |
| | | | | Total Agency Collateralized Mortgage Obligations | | $ | 3,113,598 | |
| | | | | | | | | |
| | | | | Commercial Mortgage-Backed Security — 0.2% | | | | |
| | 700,000 | | | GS Mortgage Securities Trust, Ser 2017-FARM, Class B, 144a, 3.659%, 1/10/43(A)(B) | | $ | 721,457 | |
| | | | | | | | | |
| | | | | Sovereign Government Obligations — 0.2% | | | | |
| | 238,000 | | | Colombia Government International Bond, 5.000%, 6/15/45 | | | 262,633 | |
| | 417,000 | | | Province of Ontario Canada, 1.875%, 5/21/20 | | | 416,025 | |
| | | | | Total Sovereign Government Obligations | | $ | 678,658 | |
| | | Shares | | | | |
| | | | | | | |
| Short-Term Investment Fund — 2.1% | | | | | | | | |
| Dreyfus Government Cash Management, Institutional Shares, 2.25%∞Ω | | | 6,946,215 | | | $ | 6,946,215 | |
| | | | | | | | | |
| Total Investment Securities — 99.8% | | | | | | | | |
| (Cost $200,219,913) | | | | | | $ | 338,368,186 | |
| | | | | | | | | |
| Other Assets in Excess of Liabilities — 0.2% | | | | | | | 686,916 | |
| | | | | | | | | |
| Net Assets — 100.0% | | | | | | $ | 339,055,102 | |
| (A) | Variable rate security - Rate reflected is the rate in effect as of June 30, 2019. |
| (B) | Certain variable rate securities are not based on a published reference rate and spread but are determined by the issuer or agent and are based on current market conditions. These securities do not indicate a reference rate and spread in their description. |
| (C) | Interest only security - This type of security represents the right to receive the monthly interest payments on an underlying pool of mortgages. Payments of principal on the pool reduce the value of the “interest only” holding. |
| * | Non-income producing security. |
| Ω | Represents the 7-day SEC yield as of June 30, 2019. |
Portfolio Abbreviations:
ADR - American Depositary Receipt
CLO - Collateralized Loan Obligation
ETF - Exchange-Traded Fund
FHLMC - Federal Home Loan Mortgage Corporation
FNMA - Federal National Mortgage Association
GNMA - Government National Mortgage Association
LIBOR - London Inter Bank Offered Rate
LLC - Limited Liability Company
LP - Limited Partnership
MTN - Medium Term Note
PLC - Public Limited Company
REIT - Real Estate Investment Trust
REMIC - Real Estate Mortgage Investment Conduit
USD - United States Dollar
144a - This is a restricted security that was sold in a transaction qualifying for the exemption under Rule 144a of the Securities Act of 1933. This security may be sold in transactions exempt from registration, normally to qualified institutional buyers. At June 30, 2019, these securities were valued at $19,747,509 or 5.8% of net assets. These securities were deemed liquid pursuant to procedures approved by the Board of Trustees.
Touchstone Balanced Fund (Continued)
Other Information:
The inputs or methodology used for valuing securities may not be an indication of the risk associated with investing in those securities. For more information on valuation inputs, and their aggregation into the levels used in the table below, please refer to the security valuation section in the accompanying Notes to Financial Statements.
Valuation inputs at Reporting Date:
| Description | | Level 1 | | | Level 2 | | | Level 3 | | | Total | |
| Common Stocks | | $ | 224,496,099 | | | $ | — | | | $ | — | | | $ | 224,496,099 | |
| Corporate Bonds | | | — | | | | 37,547,495 | | | | — | | | | 37,547,495 | |
| U.S. Treasury Obligations | | | — | | | | 26,984,561 | | | | — | | | | 26,984,561 | |
| U.S. Government Mortgage-Backed Obligations | | | — | | | | 19,787,559 | | | | — | | | | 19,787,559 | |
| Asset-Backed Securities | | | — | | | | 7,282,739 | | | | — | | | | 7,282,739 | |
| Exchange-Traded Fund | | | 5,574,094 | | | | — | | | | — | | | | 5,574,094 | |
| Non-Agency Collateralized Mortgage Obligations | | | — | | | | 5,235,711 | | | | — | | | | 5,235,711 | |
| Agency Collateralized Mortgage Obligations | | | — | | | | 3,113,598 | | | | — | | | | 3,113,598 | |
| Commercial Mortgage-Backed Security | | | — | | | | 721,457 | | | | — | | | | 721,457 | |
| Sovereign Government Obligations | | | — | | | | 678,658 | | | | — | | | | 678,658 | |
| Short-Term Investment Fund | | | 6,946,215 | | | | — | | | | — | | | | 6,946,215 | |
| Total | | $ | 237,016,408 | | | $ | 101,351,778 | | | $ | — | | | $ | 338,368,186 | |
See accompanying Notes to Financial Statements.
Portfolio of Investments
Touchstone Credit Opportunities Fund – June 30, 2019
| Principal | | | | | Market | |
| Amount | | | | | Value | |
| | | | | | | |
| | | | | Corporate Bonds — 77.7% | | | | |
| | | | | | | | | |
| | | | | Communication Services — 16.5% | | | | |
| $ | 80,000 | | | Altice Luxembourg SA (Luxembourg), 144a, 7.625%, 2/15/25 | | $ | 75,250 | |
| | 320,000 | | | AMC Networks, Inc., 4.750%, 8/1/25 | | | 323,200 | |
| | 300,000 | | | Cablevision Systems Corp., 5.875%, 9/15/22 | | | 315,000 | |
| | 315,000 | | | CCO Holdings LLC / CCO Holdings Capital Corp., 144a, 5.000%, 2/1/28(A) | | | 321,678 | |
| | 190,000 | | | CCO Holdings LLC / CCO Holdings Capital Corp., 144a, 5.125%, 5/1/27 | | | 196,718 | |
| | 110,000 | | | CommScope LLC, 144a, 5.500%, 3/1/24 | | | 112,888 | |
| | 130,000 | | | CommScope LLC, 144a, 6.000%, 3/1/26(A) | | | 133,250 | |
| | 382,000 | | | CSC Holdings LLC, 144a, 5.375%, 7/15/23 | | | 392,505 | |
| | 170,000 | | | Cumulus Media New Holdings, Inc., 144a, 6.750%, 7/1/26 | | | 169,541 | |
| | 133,000 | | | Digicel Group Ltd. (Bermuda), 144a, 8.250%, 9/30/20 | | | 96,593 | |
| | 230,000 | | | Frontier Communications Corp., 11.000%, 9/15/25 | | | 142,600 | |
| | 175,000 | | | Frontier Communications Corp., 144a, 8.500%, 4/1/26 | | | 169,750 | |
| | 183,000 | | | Go Daddy Operating Co. LLC / GD Finance Co., Inc., 144a, 5.250%, 12/1/27 | | | 189,405 | |
| | 285,000 | | | Gray Television, Inc., 144a, 5.125%, 10/15/24 | | | 290,344 | |
| | 164,000 | | | Inmarsat Finance PLC (United Kingdom), 144a, 4.875%, 5/15/22 | | | 165,025 | |
| | 240,000 | | | Inmarsat Finance PLC (United Kingdom), 144a, 6.500%, 10/1/24 | | | 251,100 | |
| | 450,000 | | | Intelsat Jackson Holdings SA (Luxembourg), 5.500%, 8/1/23 | | | 410,625 | |
| | 63,000 | | | Intelsat Jackson Holdings SA (Luxembourg), 144a, 8.000%, 2/15/24 | | | 65,678 | |
| | 75,000 | | | Intelsat Luxembourg SA (Luxembourg), 8.125%, 6/1/23 | | | 57,938 | |
| | 242,000 | | | Lee Enterprises, Inc., 144a, 9.500%, 3/15/22 | | | 246,235 | |
| | 215,000 | | | Level 3 Financing, Inc., 5.250%, 3/15/26 | | | 222,525 | |
| | 500,000 | | | Level 3 Financing, Inc., 5.375%, 1/15/24 | | | 511,250 | |
| | 430,000 | | | Netflix, Inc., 4.875%, 4/15/28 | | | 443,437 | |
| | 404,000 | | | Nexstar Broadcasting, Inc., 144a, 5.625%, 8/1/24 | | | 418,528 | |
| | 95,000 | | | Nexstar Escrow, Inc., 144a, 5.625%, 7/15/27 | | | 97,256 | |
| | 266,000 | | | Qwest Corp., 6.875%, 9/15/33 | | | 265,716 | |
| | 262,000 | | | Sinclair Television Group, Inc., 144a, 5.125%, 2/15/27 | | | 256,760 | |
| | 300,000 | | | Sinclair Television Group, Inc., 144a, 5.625%, 8/1/24 | | | 306,750 | |
| | 300,000 | | | Sirius XM Radio, Inc., 144a, 5.375%, 7/15/26(A) | | | 310,875 | |
| | 175,000 | | | Sirius XM Radio, Inc., 144a, 5.500%, 7/1/29 | | | 179,410 | |
| | 443,000 | | | Sprint Corp., 7.625%, 2/15/25 | | | 471,795 | |
| | 210,000 | | | Sprint Corp., 7.625%, 3/1/26 | | | 223,860 | |
| | 350,000 | | | T-Mobile USA, Inc., 4.750%, 2/1/28 | | | 360,097 | |
| | 633,000 | | | Townsquare Media, Inc., 144a, 6.500%, 4/1/23 | | | 623,505 | |
| | 500,000 | | | Virgin Media Secured Finance PLC (United Kingdom), 144a, 5.500%, 8/15/26 | | | 518,125 | |
| | 425,000 | | | Zayo Group LLC / Zayo Capital, Inc., 6.375%, 5/15/25 | | | 433,479 | |
| | | | | | | | 9,768,691 | |
| | | | | | | | | |
| | | | | Industrials — 13.8% | | | | |
| | 122,000 | | | Air Medical Group Holdings, Inc., 144a, 6.375%, 5/15/23† | | | 109,190 | |
| | 369,000 | | | Avolon Holdings Funding Ltd. (Cayman Islands), 144a, 5.125%, 10/1/23 | | | 390,586 | |
| | 154,000 | | | Berry Global Escrow Corp., 144a, 4.875%, 7/15/26 | | | 157,273 | |
| | 450,000 | | | Berry Global, Inc., 144a, 4.500%, 2/15/26 | | | 443,250 | |
| | 175,000 | | | Bombardier, Inc. (Canada), 144a, 6.000%, 10/15/22 | | | 175,751 | |
| | 289,000 | | | Bombardier, Inc. (Canada), 144a, 7.500%, 12/1/24 | | | 294,780 | |
| | 104,000 | | | Bombardier, Inc. (Canada), 144a, 7.875%, 4/15/27 | | | 104,130 | |
| | 250,000 | | | Builders FirstSource, Inc., 144a, 5.625%, 9/1/24 | | | 257,667 | |
| | 44,000 | | | Builders FirstSource, Inc., 144a, 6.750%, 6/1/27 | | | 46,420 | |
| | 580,000 | | | BWAY Holding Co., 144a, 5.500%, 4/15/24 | | | 580,290 | |
| | 201,000 | | | BWX Technologies, Inc., 144a, 5.375%, 7/15/26 | | | 207,522 | |
| | 226,000 | | | Clean Harbors, Inc., 144a, 4.875%, 7/15/27 | | | 229,695 | |
| | 197,000 | | | Crown Americas LLC / Crown Americas Capital Corp. V, 4.250%, 9/30/26 | | | 200,940 | |
| | 30,000 | | | DAE Funding LLC, 144a, 4.500%, 8/1/22 | | | 30,450 | |
| | 280,000 | | | DAE Funding LLC, 144a, 5.750%, 11/15/23 | | | 294,000 | |
| | 152,000 | | | GFL Environmental, Inc. (Canada), 144a, 5.375%, 3/1/23 | | | 150,480 | |
| | 160,000 | | | GFL Environmental, Inc. (Canada), 144a, 7.000%, 6/1/26 | | | 163,800 | |
Touchstone Credit Opportunities Fund(Continued)
| Principal | | | | | Market | |
| Amount | | | | | Value | |
| | | | | | | |
| | | | | Corporate Bonds — 77.7% (Continued) | | | | |
| | | | | | | | | |
| | | | | Industrials — (Continued) | | | | |
| $ | 32,000 | | | GFL Environmental, Inc. (Canada), 144a, 8.500%, 5/1/27 | | $ | 34,440 | |
| | 465,000 | | | Hillman Group, Inc. (The), 144a, 6.375%, 7/15/22 | | | 412,687 | |
| | 100,000 | | | IAA, Inc., 144a, 5.500%, 6/15/27 | | | 104,000 | |
| | 280,000 | | | JELD-WEN, Inc., 144a, 4.875%, 12/15/27 | | | 270,900 | |
| | 411,000 | | | OI European Group BV (Netherlands), 144a, 4.000%, 3/15/23 | | | 413,055 | |
| | 362,000 | | | RBS Global, Inc. / Rexnord LLC, 144a, 4.875%, 12/15/25 | | | 366,525 | |
| | 474,000 | | | Sensata Technologies BV (Netherlands), 144a, 5.000%, 10/1/25 | | | 494,145 | |
| | 506,000 | | | Summit Materials LLC / Summit Materials Finance Corp., 144a, 5.125%, 6/1/25 | | | 507,265 | |
| | 405,000 | | | TransDigm, Inc., 144a, 6.250%, 3/15/26 | | | 426,262 | |
| | 593,000 | | | Tutor Perini Corp., 144a, 6.875%, 5/1/25 | | | 567,797 | |
| | 375,000 | | | United Rentals North America, Inc., 5.875%, 9/15/26 | | | 399,375 | |
| | 311,000 | | | XPO Logistics, Inc., 144a, 6.750%, 8/15/24 | | | 331,604 | |
| | | | | | | | 8,164,279 | |
| | | | | | | | | |
| | | | | Energy — 10.1% | | | | |
| | 278,000 | | | Carrizo Oil &Gas, Inc., 6.250%, 4/15/23† | | | 268,270 | |
| | 282,000 | | | Centennial Resource Production LLC, 144a, 5.375%, 1/15/26 | | | 267,900 | |
| | 77,000 | | | Centennial Resource Production LLC, 144a, 6.875%, 4/1/27 | | | 77,770 | |
| | 469,000 | | | CITGO Petroleum Corp., 144a, 6.250%, 8/15/22 | | | 469,000 | |
| | 170,000 | | | Covey Park Energy LLC / Covey Park Finance Corp., 144a, 7.500%, 5/15/25 | | | 122,400 | |
| | 159,000 | | | CrownRock LP / CrownRock Finance, Inc., 144a,5.625%, 10/15/25 | | | 159,398 | |
| | 579,000 | | | Exterran Energy Solutions LP / EES Finance Corp., 8.125%, 5/1/25 | | | 588,409 | |
| | 125,000 | | | Extraction Oil & Gas, Inc., 144a, 5.625%, 2/1/26 | | | 100,938 | |
| | 133,000 | | | Extraction Oil& Gas, Inc., 144a, 7.375%, 5/15/24 | | | 113,715 | |
| | 191,000 | | | FTS International, Inc., 6.250%, 5/1/22 | | | 177,153 | |
| | 219,000 | | | Great Western Petroleum LLC / Great Western Finance Corp., 144a, 9.000%, 9/30/21 | | | 177,938 | |
| | 211,000 | | | Hess Infrastructure Partners LP / Hess Infrastructure Partners Finance Corp., 144a, 5.625%, 2/15/26 | | | 217,066 | |
| | 211,000 | | | Laredo Petroleum, Inc., 6.250%, 3/15/23† | | | 196,293 | |
| | 171,002 | | | Murray Energy Corp., 144a, 12.000%, 4/15/24(B) | | | 34,628 | |
| | 253,000 | | | NGL Energy Partners LP / NGL Energy Finance Corp., 6.125%, 3/1/25 | | | 250,470 | |
| | 99,000 | | | Parsley Energy LLC / Parsley Finance Corp., 144a, 5.375%, 1/15/25 | | | 101,475 | |
| | 500,000 | | | Parsley Energy LLC / Parsley Finance Corp., 144a, 6.250%, 6/1/24 | | | 520,000 | |
| | 195,000 | | | Rowan Cos., Inc., 7.375%, 6/15/25 | | | 151,125 | |
| | 329,000 | | | Seven Generations Energy Ltd. (Canada), 144a, 5.375%, 9/30/25 | | | 316,662 | |
| | 166,000 | | | SRC Energy, Inc., 6.250%, 12/1/25 | | | 151,060 | |
| | 207,000 | | | Summit Midstream Holdings LLC / Summit Midstream Finance Corp., 5.500%, 8/15/22 | | | 198,720 | |
| | 233,000 | | | Summit Midstream Holdings LLC / Summit Midstream Finance Corp., 5.750%, 4/15/25 | | | 203,875 | |
| | 89,000 | | | Targa Resources Partners LP / Targa Resources Partners Finance Corp., 5.875%, 4/15/26 | | | 94,340 | |
| | 233,000 | | | TerraForm Power Operating LLC, 144a, 4.250%, 1/31/23 | | | 232,709 | |
| | 190,000 | | | TerraForm Power Operating LLC, 144a, 5.000%, 1/31/28 | | | 190,713 | |
| | 338,000 | | | Transocean Poseidon Ltd. (Cayman Islands), 144a, 6.875%, 2/1/27 | | | 357,224 | |
| | 89,000 | | | Transocean Sentry Ltd. (Cayman Islands), 144a, 5.375%, 5/15/23 | | | 89,111 | |
| | 271,000 | | | Vine Oil & Gas LP / Vine Oil & Gas Finance Corp., 144a, 9.750%, 4/15/23 | | | 175,473 | |
| | | | | | | | 6,003,835 | |
| | | | | | | | | |
| | | | | Consumer Discretionary — 10.0% | | | | |
| | 311,000 | | | Allison Transmission, Inc., 144a, 4.750%, 10/1/27 | | | 308,667 | |
| | 139,000 | | | Boyd Gaming Corp., 6.375%, 4/1/26 | | | 147,045 | |
| | 409,000 | | | Cedar Fair LP / Canada’s Wonderland Co. / Magnum Management Corp., 5.375%, 6/1/24 | | | 420,247 | |
| | 242,000 | | | Century Communities, Inc., 144a, 6.750%, 6/1/27 | | | 245,327 | |
| | 248,000 | | | Delphi Technologies PLC (Jersey), 144a, 5.000%, 10/1/25 | | | 221,340 | |
| | 185,000 | | | Enterprise Development Authority (The), 144a, 12.000%, 7/15/24 | | | 200,725 | |
| | 31,000 | | | Group 1 Automotive, Inc., 144a, 5.250%, 12/15/23 | | | 31,736 | |
| | 660,000 | | | IRB Holding Corp., 144a, 6.750%, 2/15/26 | | | 656,700 | |
| | 33,000 | | | JELD-WEN, Inc., 144a, 4.625%, 12/15/25 | | | 32,381 | |
| | 120,000 | | | L Brands, Inc., 6.750%, 7/1/36 | | | 103,200 | |
| | 140,000 | | | L Brands, Inc., 6.875%, 11/1/35 | | | 124,510 | |
Touchstone Credit Opportunities Fund (Continued)
| Principal | | | | | Market | |
| Amount | | | | | Value | |
| | | | | | | |
| | | | | Corporate Bonds — 77.7% (Continued) | | | | |
| | | | | | | | | |
| | | | | Consumer Discretionary — (Continued) | | | | |
| $ | 79,000 | | | L Brands, Inc., 7.500%, 6/15/29 | | $ | 78,992 | |
| | 300,000 | | | Live Nation Entertainment, Inc., 144a, 4.875%, 11/1/24 | | | 308,625 | |
| | 80,000 | | | Live Nation Entertainment, Inc., 144a, 5.625%, 3/15/26 | | | 83,900 | |
| | 299,000 | | | Newell Brands, Inc., 4.200%, 4/1/26 | | | 297,156 | |
| | 228,000 | | | Panther BF Aggregator 2 LP / Panther Finance Co., Inc., 144a, 6.250%, 5/15/26 | | | 236,835 | |
| | 184,000 | | | Panther BF Aggregator 2 LP / Panther Finance Co., Inc., 144a, 8.500%, 5/15/27 | | | 189,520 | |
| | 229,000 | | | Penske Automotive Group, Inc., 5.500%, 5/15/26 | | | 238,733 | |
| | 714,000 | | | Sabre GLBL, Inc., 144a, 5.250%, 11/15/23(A) | | | 735,420 | |
| | 559,000 | | | Scientific Games International, Inc., 144a, 5.000%, 10/15/25 | | | 564,590 | |
| | 419,000 | | | Six Flags Entertainment Corp., 144a, 4.875%, 7/31/24 | | | 425,547 | |
| | 250,000 | | | Six Flags Entertainment Corp., 144a, 5.500%, 4/15/27 | | | 260,000 | |
| | | | | | | | 5,911,196 | |
| | | | | | | | | |
| | | | | Health Care — 5.9% | | | | |
| | 106,000 | | | Acadia Healthcare Co., Inc., 5.125%, 7/1/22 | | | 106,530 | |
| | 353,000 | | | Acadia Healthcare Co., Inc., 5.625%, 2/15/23 | | | 358,736 | |
| | 18,000 | | | Acadia Healthcare Co., Inc., 6.500%, 3/1/24 | | | 18,765 | |
| | 639,000 | | | ASP AMC Merger Sub, Inc., 144a, 8.000%, 5/15/25 | | | 381,802 | |
| | 267,000 | | | Bausch Health Cos, Inc. (Canada), 144a, 5.500%, 3/1/23 | | | 269,136 | |
| | 27,000 | | | Bausch Health Cos, Inc. (Canada), 144a, 5.750%, 8/15/27 | | | 28,376 | |
| | 100,000 | | | Bausch Health Cos, Inc. (Canada), 144a, 6.125%, 4/15/25 | | | 102,122 | |
| | 583,000 | | | BioScrip, Inc, 8.875%, 2/15/21† | | | 590,287 | |
| | 131,000 | | | Centene Corp., 4.750%, 1/15/25 | | | 135,220 | |
| | 95,000 | | | Centene Corp., 6.125%, 2/15/24(A) | | | 99,513 | |
| | 19,000 | | | HCA, Inc., 5.625%, 9/1/28 | | | 20,568 | |
| | 291,000 | | | HCA, Inc., 5.875%, 2/1/29 | | | 319,009 | |
| | 100,000 | | | HCA, Inc., 7.690%, 6/15/25 | | | 117,500 | |
| | 222,000 | | | Hill-Rom Holdings, Inc., 144a, 5.000%, 2/15/25 | | | 228,660 | |
| | 100,000 | | | Molina Healthcare, Inc., 144a, 4.875%, 6/15/25 | | | 101,500 | |
| | 157,000 | | | RegionalCare Hospital Partners Holdings, Inc., 144a, 8.250%, 5/1/23 | | | 167,107 | |
| | 251,000 | | | Sotera Health Holdings LLC, 144a, 6.500%, 5/15/23 | | | 254,137 | |
| | 220,000 | | | Tenet Healthcare Corp., 4.625%, 7/15/24 | | | 222,750 | |
| | | | | | | | 3,521,718 | |
| | | | | | | | | |
| | | | | Information Technology — 4.4% | | | | |
| | 385,000 | | | Dell International LLC / EMC Corp., 144a, 6.020%, 6/15/26 | | | 424,725 | |
| | 290,000 | | | Genesys Telecommunications Laboratories, Inc./Greeneden Lux 3 SARL/Greeneden US Ho, 144a, 10.000%, 11/30/24 | | | 315,012 | |
| | 250,000 | | | IQVIA, Inc., 144a, 5.000%, 10/15/26 | | | 258,125 | |
| | 526,000 | | | NCR Corp., 5.000%, 7/15/22 | | | 530,450 | |
| | 231,000 | | | Nielsen Co. Luxembourg SARL (The) (Luxembourg), 144a, 5.000%, 2/1/25(A) | | | 226,958 | |
| | 239,000 | | | Nielsen Finance LLC / Nielsen Finance Co., 144a, 5.000%, 4/15/22 | | | 238,403 | |
| | 401,000 | | | Nuance Communications, Inc., 5.625%, 12/15/26(A) | | | 418,163 | |
| | 200,000 | | | Solera LLC / Solera Finance, Inc., 144a, 10.500%, 3/1/24 | | | 216,250 | |
| | | | | | | | 2,628,086 | |
| | | | | | | | | |
| | | | | Materials — 4.3% | | | | |
| | 145,000 | | | Ardagh Packaging Finance PLC / Ardagh Holdings USA, Inc. (Ireland), 144a, 6.000%, 2/15/25 | | | 150,256 | |
| | 214,000 | | | Constellium NV (Netherlands), 144a, 5.750%, 5/15/24 | | | 219,350 | |
| | 145,000 | | | Constellium NV (Netherlands), 144a, 5.875%, 2/15/26 | | | 148,988 | |
| | 135,000 | | | First Quantum Minerals Ltd. (Canada), 144a, 6.875%, 3/1/26 | | | 125,213 | |
| | 55,000 | | | First Quantum Minerals Ltd. (Canada), 144a, 7.250%, 4/1/23 | | | 53,556 | |
| | 110,000 | | | Freeport-McMoRan, Inc., 3.875%, 3/15/23 | | | 110,000 | |
| | 150,000 | | | Freeport-McMoRan, Inc., 5.400%, 11/14/34(A) | | | 143,625 | |
| | 105,000 | | | Freeport-McMoRan, Inc., 5.450%, 3/15/43(A) | | | 96,075 | |
| | 93,000 | | | HB Fuller Co., 4.000%, 2/15/27 | | | 85,560 | |
| | 107,000 | | | Kraton Polymers LLC / Kraton Polymers Capital Corp., 144a, 7.000%, 4/15/25 | | | 108,338 | |
| | 594,000 | | | New Gold, Inc. (Canada), 144a, 6.250%, 11/15/22 | | | 553,905 | |
| | 461,000 | | | Novelis Corp., 144a, 5.875%, 9/30/26 | | | 466,762 | |
| | 227,000 | | | Tronox Finance PLC (United Kingdom), 144a, 5.750%, 10/1/25 | | | 220,190 | |
| | 65,000 | | | Tronox, Inc., 144a, 6.500%, 4/15/26 | | | 64,431 | |
| | | | | | | | 2,546,249 | |
| | | | | | | | | |
| | | | | Real Estate — 4.1% | | | | |
| | 90,000 | | | Brookfield Property REIT, Inc. / BPR Cumulus LLC / BPR Nimbus LLC / GGSI Sellco LL, 144a, 5.750%, 5/15/26 | | | 92,700 | |
Touchstone Credit Opportunities Fund (Continued)
| Principal | | | | | Market | |
| Amount | | | | | Value | |
| | | | | | | |
| | | | | Corporate Bonds — 77.7% (Continued) | | | | |
| | | | | | | | | |
| | | | | Real Estate — (Continued) | | | | |
| $ | 521,000 | | | ESH Hospitality, Inc. REIT, 144a, 5.250%, 5/1/25 | | $ | 533,374 | |
| | 285,000 | | | GEO Group, Inc. (The) REIT, 5.125%, 4/1/23 | | | 255,075 | |
| | 95,000 | | | GEO Group, Inc. (The) REIT, 6.000%, 4/15/26 | | | 82,622 | |
| | 351,000 | | | Iron Mountain, Inc. REIT, 144a, 5.250%, 3/15/28 | | | 351,439 | |
| | 500,000 | | | MGM Growth Properties Operating Partnership LP / MGP Finance Co.-Issuer, Inc., 4.500%, 9/1/26 | | | 513,124 | |
| | 411,000 | | | Realogy Group LLC / Realogy Co.-Issuer Corp., 144a, 4.875%, 6/1/23† | | | 369,900 | |
| | 226,000 | | | WeWork Cos., Inc., 144a, 7.875%, 5/1/25 | | | 222,972 | |
| | | | | | | | 2,421,206 | |
| | | | | | | | | |
| | | | | Consumer Staples — 3.9% | | | | |
| | 282,000 | | | B&G Foods, Inc., 5.250%, 4/1/25(A) | | | 284,820 | |
| | 100,000 | | | Clearwater Seafoods, Inc. (Canada), 144a, 6.875%, 5/1/25 | | | 100,000 | |
| | 506,000 | | | Core & Main LP, 144a, 6.125%, 8/15/25 | | | 511,060 | |
| | 350,000 | | | Cott Holdings, Inc., 144a, 5.500%, 4/1/25 | | | 356,562 | |
| | 365,000 | | | First Quality Finance Co., Inc., 144a, 5.000%, 7/1/25 | | | 367,737 | |
| | 359,000 | | | H&E Equipment Services, Inc., 5.625%, 9/1/25 | | | 369,231 | |
| | 303,000 | | | Simmons Foods, Inc., 144a, 5.750%, 11/1/24 | | | 275,730 | |
| | 70,000 | | | Simmons Foods, Inc., 144a, 7.750%, 1/15/24 | | | 75,425 | |
| | | | | | | | 2,340,565 | |
| | | | | | | | | |
| | | | | Financials — 2.9% | | | | |
| | 180,000 | | | Acrisure LLC / Acrisure Finance, Inc., 144a, 7.000%, 11/15/25 | | | 162,450 | |
| | 382,000 | | | Acrisure LLC / Acrisure Finance, Inc., 144a, 8.125%, 2/15/24 | | | 394,415 | |
| | 298,000 | | | Alliant Holdings Intermediate LLC / Alliant Holdings Co.-Issuer, 144a, 8.250%, 8/1/23 | | | 305,361 | |
| | 617,000 | | | Blue Racer Midstream LLC / Blue Racer Finance Corp., 144a, 6.125%, 11/15/22(A) | | | 625,484 | |
| | 207,000 | | | Quicken Loans, Inc., 144a, 5.250%, 1/15/28 | | | 205,965 | |
| | | | | | | | 1,693,675 | |
| | | | | | | | | |
| | | | | Utilities — 1.8% | | | | |
| | 176,000 | | | NextEra Energy Operating Partners LP, 144a, 4.250%, 7/15/24 | | | 177,104 | |
| | 135,000 | | | NGL Energy Partners LP / NGL Energy Finance Corp., 7.500%, 11/1/23 | | | 141,075 | |
| | 200,000 | | | Vistra Energy Corp., 7.625%, 11/1/24 | | | 211,496 | |
| | 337,000 | | | Vistra Operations Co. LLC, 144a, 5.000%, 7/31/27 | | | 349,216 | |
| | 151,000 | | | Vistra Operations Co. LLC, 144a, 5.500%, 9/1/26 | | | 159,494 | |
| | | | | | | | 1,038,385 | |
| | | | | Total Corporate Bonds | | $ | 46,037,885 | |
| | | | | | | | | |
| | | | | Bank Loans(C) — 14.4% | | | | |
| | | | | | | | | |
| | | | | Consumer Discretionary — 3.6% | | | | |
| | 103,760 | | | Boyd Gaming Corporation, Refinancing Term B Loan (LIBOR +2.250%), 4.622%, 9/15/23 | | | 103,101 | |
| | 186,369 | | | GO Wireless, Inc., Senior Lien Term Loan (LIBOR +6.500%) 8.902%, 12/22/24(D) | | | 180,778 | |
| | 114,196 | | | GOBP Holdings, Inc., First Lien Initial Term Loan (LIBOR + 3.750%), 6.138%, 10/22/25 | | | 114,053 | |
| | 439,152 | | | Golden Nugget, Inc., B Team Loan (LIBOR +2.750%), 5.149%, 10/4/23(D) | | | 435,111 | |
| | 120,033 | | | Hillman Group Inc. (The), Initial Term Loan (LIBOR +4.000%), 6.402%, 5/31/25(D) | | | 115,382 | |
| | 226,067 | | | IRB Holding Corp., Team B Loan (LIBOR +3.250%), 5.644%, 2/5/25 | | | 222,994 | |
| | 125,117 | | | Jeld-Wen, Inc., Term B-4 Loan (LIBOR +2.000%), 4.330%, 12/14/24 | | | 124,366 | |
| | 219,430 | | | LBM Borrower LLC, Tranche C Term Loan (LIBOR +3.750%), 6.152%, 8/19/22 | | | 218,835 | |
| | 224,432 | | | Navistar Inc., Tranche B Term Loan (LIBOR +3.500%), 5.910%, 11/6/24 | | | 223,660 | |
| | 326,114 | | | Petco Animal Supplies Inc., Term Loan (LIBOR +3.250%), 5.833%, 1/26/23 | | | 252,106 | |
| | 176,600 | | | PetSmart, Inc., Tranche B-2 Loan (LIBOR +3.000%), 3/11/22,(D) | | | 171,689 | |
| | | | | | | | 2,162,075 | |
| | | | | | | | | |
| | | | | Energy — 3.4% | | | | |
| | 259,338 | | | BCP Raptor LLC, Initial Term Loan (LIBOR +4.250%), 6.652%, 6/24/24 | | | 245,723 | |
| | 266,298 | | | Blackstone CQP Holdco LP, Initial Term Loan (LIBOR +3.500%), 9/30/24,(D) | | | 266,565 | |
| | 269,722 | | | Brazos Delaware II LLC, Initial Term Loan (LIBOR +4.000%), 6.383%, 5/21/25 | | | 253,202 | |
| | 94,557 | | | California Resources Corp., Term Loan (LIBOR +10.375%), 12.777%, 12/31/21 | | | 95,787 | |
| | 96,739 | | | California Resources Corp., Term Loan (LIBOR +4.750%), 7.152%, 12/31/22 | | | 92,317 | |
| | 87,560 | | | Equitrans Midstream Corp., Term Loan (LIBOR +4.500%), 6.902%, 1/31/24 | | | 87,944 | |
| | 29,296 | | | FTS International Inc., Initial Term Loan (LIBOR +4.750%), 7.152%, 4/16/21 | | | 29,215 | |
Touchstone Credit Opportunities Fund (Continued)
| Principal | | | | | Market | |
| Amount | | | | | Value | |
| | | | | | | |
| | | | | Bank Loans(C) — 14.4% (Continued) | | | | |
| | | | | | | | | |
| | | | | Energy — (Continued) | | | | |
| $ | 212,475 | | | Gulf Finance LLC, Tranche B Term Loan (LIBOR +5.250%), 7.649%, 8/25/23 | | $ | 173,078 | |
| | 143,959 | | | Murray Energy Corporation, Superpriority Term B-2 Loan (LIBOR +7.250%), 9.772%, 10/17/22 | | | 95,553 | |
| | 200,764 | | | Traverse Midstream Partners LLC, Advance (LIBOR +4.000%), 6.590%, 9/27/24 | | | 198,182 | |
| | 370,724 | | | Ultra Resources, Inc., Senior Secured Term Loan (LIBOR +3.750%), 6.180%, 4/12/24 | | | 281,131 | |
| | 178,467 | | | Woodford Express LLC, Initial Term Loan (LIBOR +5.000%), 7.402%, 1/27/25 | | | 175,046 | |
| | | | | | | | 1,993,743 | |
| | | | | | | | | |
| | | | | Industrials — 2.1% | | | | |
| | 260,034 | | | Air Medical Group Holdings Inc., 2018 Term Loan (LIBOR +3.250%), 5.644%, 4/28/22 | | | 244,479 | |
| | 89,103 | | | Builders FirstSource Inc., 2017 Initial Term Loan (LIBOR +3.000%), 5.330%, 2/29/24 | | | 88,714 | |
| | 123,572 | | | Cumulus Media New Holdings Inc., Exit Term Loan (LIBOR +4.500%), 6.910%, 5/13/22(D) | | | 123,417 | |
| | 543,363 | | | Forterra Finance LLC, Replacement Term Loan (LIBOR +3.000%), 5.402%, 10/25/23 | | | 500,650 | |
| | 237,115 | | | Sequa Mezzanine Holdings LLC, Initial Term Loan (First Lien) (LIBOR +5.000%), 7.560%, 11/28/21 | | | 231,583 | |
| | 91,750 | | | TransDigm, Inc., 2018 New Tranche E Term Loans (LIBOR +2.500%), 4.830%, 5/30/25 | | | 89,533 | |
| | | | | | | | 1,278,376 | |
| | | | | | | | | |
| | | | | Communication Services — 1.8% | | | | |
| | 42,151 | | | Applied Systems Inc, Second Lien Initial Term Loan (LIBOR +7.000%), 9.330%, 9/19/25 | | | 42,519 | |
| | 148,992 | | | CenturyLink, Inc., Initial Team B Loan (LIBOR +2.750%), 5.152%, 1/31/25 | | | 145,350 | |
| | 159,872 | | | Frontier Communications Corp., Term B-1 Loan (LIBOR +3.750%), 6.160%, 6/17/24(D) | | | 156,542 | |
| | 57,000 | | | Intelsat Jackson Holdings SA, Tranche B-3 Term Loan (LIBOR +3.750%), 6.154%, 11/27/23 | | | 56,359 | |
| | 79,594 | | | Nielsen Finance LLC, Class B-4 Team Loan (LIBOR +2.000%), 4.412%, 10/4/23 | | | 78,773 | |
| | 111,150 | | | Perforce Software, Inc., First Lien Term Loan (LIBOR +4.500%), 7/1/26,(D) | | | 110,872 | |
| | 510,031 | | | Sprint Communications, Inc., 2018 Incremental Term Loan (LIBOR +3.000%), 5.438%, 2/2/24 | | | 504,773 | |
| | | | | | | | 1,095,188 | |
| | | | | | | | | |
| | | | | Information Technology — 1.6% | | | | |
| | 134,147 | | | Diebold Nixdorf Inc., Term Loan A1 (LIBOR +9.250%), 11.688%, 8/31/22 | | | 141,385 | |
| | 185,697 | | | Evergreen Skills Lux SARL, First Lien Initial Term Loan (Luxembourg) (LIBOR +4.750%), 7.189%, 4/28/21 | | | 159,777 | |
| | 103,353 | | | Infoblox, Inc., Refinancing Term Loan (LIBOR +4.500%), 6.902%, 11/7/23 | | | 103,180 | |
| | 186,173 | | | Iron Mountain Information Management LLC, Term Loan A (LIBOR +1.750%), 4.171%, 6/5/23 | | | 180,821 | |
| | 345,485 | | | MA Financeco LLC, Tranche B-2 Term Loan (LIBOR +2.250%), 4.652%, 11/19/21 | | | 341,312 | |
| | | | | | | | 926,475 | |
| | | | | | | | | |
| | | | | Real Estate — 0.7% | | | | |
| | 402,970 | | | Brookfield Property Reit Inc., Initial Term B Loan (LIBOR +2.500%), 4.902%, 8/27/25(D) | | | 392,940 | |
| | | | | | | | | |
| | | | | Health Care — 0.6% | | | | |
| | 117,372 | | | General Nutrition Center, Inc., First in last Out Term Loan (LIBOR +7.000%), 9.410%, 12/31/22(D) | | | 118,399 | |
| | 222,740 | | | LifePoint Health, Inc., First Lien Term B Loan (LIBOR +4.500%), 6.904%, 11/16/25(D) | | | 221,268 | |
| | | | | | | | 339,667 | |
| | | | | | | | | |
| | | | | Financials — 0.4% | | | | |
| | 227,946 | | | Asurion LLC, Second Lien Replacement B-2 Term Loan (LIBOR +6.500%), 8.902%, 8/4/25 | | | 230,938 | |
| | | | | | | | | |
| | | | | Utilities — 0.1% | | | | |
| | 53,945 | | | Vistra Operations Company LLC, 2018 Incremental Term Loan (LIBOR +2.000%), 4.397%, 12/31/25 | | | 53,857 | |
| | | | | | | | | |
| | | | | Consumer Staples — 0.1% | | | | |
| | 46,417 | | | Energizer Holdings, Inc., Term B Loan (LIBOR+2.250%), 4.750%, 12/17/25 | | | 46,214 | |
| | | | | Total Bank Loans | | $ | 8,519,473 | |
| | | | | | | | | |
| | | | | Asset-Backed Securities — 5.2% | | | | |
| | 250,000 | | | Cedar Funding XI CLO Ltd., Ser 2019-11A, Class E, (Cayman Islands), 144a, (3M LIBOR +6.850%), 9.375%, 5/29/32(E) | | | 248,212 | |
Touchstone Credit Opportunities Fund (Continued)
| Principal | | | | | Market | |
| Amount | | | | | Value | |
| | | | | | | | | |
| | | | | Asset-Backed Securities — 5.2% (Continued) | | | | |
| $ | 250,000 | | | Dryden 45 Senior Loan Fund, Ser 2016-45A, Class ER, (Cayman Islands), 144a, (3M LIBOR +5.850%), 8.447%, 10/15/30(E) | | $ | 236,934 | |
| | 250,000 | | | LCM Ltd., Ser 2019-30, (Cayman Islands), 144a, (3M LIBOR +6.950%), 9.521%, 4/20/31(E) | | | 250,163 | |
| | 300,000 | | | Madison Park Funding XII Ltd., Ser 2014-12A, Class SUB, (Cayman Islands), 144a, 7/20/26(F) | | | 136,058 | |
| | 250,000 | | | Madison Park Funding XXXI Ltd., Ser 2018-31A, Class SUB, (Cayman Islands), 144a, 1/23/48(F) | | | 204,403 | |
| | 250,000 | | | Madison Park Funding XXXIV Ltd., Ser 2019-34A, Class E, (Cayman Islands), 144a, (3M LIBOR +6.750%), 9.330%, 4/25/31(E) | | | 249,355 | |
| | 250,000 | | | Mariner CLO 7 Ltd., Ser 2019-1A, Class E, (Cayman Islands), 144a, (3M LIBOR +6.890%), 9.435%, 4/30/32(E) | | | 247,610 | |
| | 500,000 | | | Oaktree CLO Ltd., Ser 2018-1A, Class SUB, (Cayman Islands), 144a, 10/20/30(F) | | | 466,584 | |
| | 250,000 | | | Oaktree CLO Ltd., Ser 2019-2A, Class D, (Cayman Islands), 144a, (3M LIBOR +6.770%), 9.246%, 4/15/31(E) | | | 243,521 | |
| | 500,000 | | | OZLM XXI, Ser 2017-21A, Class SUB, (Cayman Islands), 144a, 1/20/31(F) | | | 416,021 | |
| | 250,000 | | | Venture XVIII CLO Ltd., Ser 2014-18A, Class SUB, (Cayman Islands), 144a, 10/15/29(F) | | | 146,883 | |
| | 250,000 | | | Wellfleet CLO Ltd., Ser 2018-3A, Class SUB, (Cayman Islands), 144a, 1/20/32(F) | | | 233,411 | |
| | | | | Total Asset-Backed Securities | | $ | 3,079,155 | |
| | Shares | | | | | | | |
| | | | | | | | | |
| | | | | Common Stocks — 0.5% | | | | |
| | | | | | | | | |
| | | | | Information Technology — 0.0% | | | | |
| | 8,386 | | | Aquity Holdings, Inc. New Escrow(G)* | | | 23,397 | |
| | | | | | | | | |
| | | | | Health Care — 0.0% | | | | |
| | 3,069 | | | Envigo RMS Holding Corp. Class B(G)(H)* | | | — | |
| | | | | | | | | |
| | | | | Energy — 0.1% | | | | |
| | 74,381 | | | Trident, Class A Templar Restructure(H)* | | | 55,785 | |
| | 12,726 | | | Trident, Templar Restructure(H)* | | | — | |
| | | | | | | | 55,785 | |
| | | | | | | | | |
| | | | | Communication Services — 0.4% | | | | |
| | 13,299 | | | Cumulus Media, Inc. - Class A* | | | 246,697 | |
| | | | | Total Common Stocks | | $ | 325,879 | |
| | | Number | | | | | | | |
| | | of | | | Notional | | | Market | |
| | | Contracts | | | Amount | | | Value | |
| | | | | | | | | | |
| Purchased Options — 0.0% | | | | | | | | | | | | |
| | | | | | | | | | | | | |
| Purchased Call Options — 0.0% | | | | | | | | | | | | |
| Chicago Board Options Exchange Volatility Index, Strike @20.00, Exp 7/19(A) | | | 64 | | | $ | 96,512 | | | $ | 2,880 | |
| | | | | | | | | | | | | |
| Purchased Put Options — 0.0% | | | | | | | | | | | | |
| Invesco Senior Loan ETF, Strike @22.00, Exp 10/19(A) | | | 1,833 | | | | 4,153,578 | | | | 27,495 | |
| SPDR S&P 500 ETF Trust, Strike @270.00, Exp 7/19(A) | | | 100 | | | | 2,930,300 | | | | 3,100 | |
| Total Purchased Put Options | | | | | | | | | | | 30,595 | |
| Total Purchased Options | | | | | | | | | | $ | 33,475 | |
| Shares | | | | | | |
| | | | | | | | | |
| | | | | Short-Term Investment Funds — 4.9% | | | | |
| | 1,533,307 | | | Dreyfus Government Cash Management, Institutional Shares, 2.25%∞Ω | | | 1,533,307 | |
| | 1,399,650 | | | Invesco Government & Agency Portfolio, Institutional Class, 2.19%**∞Ω | | | 1,399,650 | |
| | | | | Total Short-Term Investment Funds | | $ | 2,932,957 | |
| | | | | | | | | |
| Total Long Positions — 102.8% | | | | |
| (Cost $60,603,101) | | $ | 60,928,824 | |
| | Principal | | | | | | | |
| | Amount | | | | | | | |
| | | | | | | | | |
| | | | | Securities Sold Short — (1.1%) | | | | |
| | | | | | | | | |
| | | | | Corporate Bond — (1.0%) | | | | |
| | | | | | | | | |
| | | | | Energy — (0.5%) | | | | |
| $ | (200,000 | ) | | California Resources Corp., 144a, 8.000%, 12/15/22 | | $ | (150,750 | ) |
| | (250,000 | ) | | Chaparral Energy, Inc., 144a, 8.750%, 7/15/23 | | | (155,000 | ) |
| | | | | | | | (305,750 | ) |
| | | | | | | | | |
| | | | | Consumer Discretionary — (0.5%) | | | | |
| | (300,000 | ) | | Goodyear Tire & Rubber Co. (The), 4.875%, 3/15/27 | | | (285,000 | ) |
| | | | | Total Corporate Bond | | $ | (590,750 | ) |
| | | | | |
| Total Securities Sold Short | | | | |
| (Proceeds $586,836) | | $ | (590,750 | ) |
Touchstone Credit Opportunities Fund (Continued)
| | | Number | | | | | | | |
| | | of | | | Notional | | | Market | |
| | | Contracts | | | Amount | | | Value | |
| | | | | | | | | | | | | |
| Written Options — (0.0%) | | | | | | | | | | | | |
| | | | | | | | | | | | | |
| Written Call Options — (0.0%) | | | | | | | | | | | | |
| Chicago Board Options Exchange Volatility Index, Strike @25.00, Exp 7/19 | | | (64 | ) | | $ | (96,512 | ) | | $ | (1,280 | ) |
| | | | | | | | | | | | | |
| Total Written Options | | | | | | | | | | | | |
| (Premiums received $1,278) | | | | | | | | | | $ | (1,280 | ) |
| | | | | | | | | | | | | |
| Total — 101.8% | | | | | | | | | | $ | 60,336,794 | |
| | | | | | | | | | | | | |
| Liabilities in Excess of Other Assets — (1.8%) | | | | | | | | | | | (1,096,698 | ) |
| | | | | | | | | | | | | |
| Net Assets — 100.0% | | | | | | | | | | $ | 59,240,096 | |
| (A) | All or a portion of these securities are pledged as collateral for securities sold short and written options. The total value of the securities pledged as collateral as of June 30, 2019 was $2,158,558. |
| | |
| (B) | Represents a payment-in-kind (“PIK”) security, which may pay interest in additional principal amounts. |
| | |
| (C) | Bank loans pay interest at rates which adjust periodically unless otherwise indicated. The interest rates shown are the current interest rates as of June 30, 2019. |
| | |
| (D) | All or a portion of this position has not settled. Full contract rates do not take effect until settlement date. |
| | |
| (E) | Variable rate security - Rate reflected is the rate in effect as of June 30, 2019. |
| | |
| (F) | Security has no stated coupon and is considered an equity position in the collateralized loan obligation (“CLO”). CLO equity investments are entitled to recurring distributions which are generally equal to the excess cash flow generated from the underlying investments after payment of the contractual payments to debt holders and fund expenses. |
| | |
| (G) | Level 3- For more information on valuation inputs, and their aggregation into the levels used in the table below, please refer to the security valuation section in the accompanying Notes to Portfolios of Investments. |
| | |
| (H) | This is a restricted security that cannot be sold to qualified institutional buyers. At June 30, 2019, these securities were valued at $55,785 or 0.0% of net assets. |
| | |
| * | Non-income producing security. |
| | |
| ** | Represents collateral for securities loaned. |
| | |
| † | All or a portion of the security is on loan. The total market value of the securities on loan as of June 30, 2019 was $1,346,199. |
| | |
| ∞ | Open-End Fund. |
| | |
| Ω | Represents the 7-day SEC yield as of June 30, 2019. |
Portfolio Abbreviations:
CLO - Collateralized Loan Obligation
ETF - Exchange-Traded Fund
LIBOR - London Interbank Offered Rate
LLC - Limited Liability Company
LP - Limited Partnership
PLC - Public Limited Company
REIT - Real Estate Investment Trust
SPDR - Standard & Poor’s Depositary Receipt
144a - This is a restricted security that was sold in a transaction qualifying for the exemption under Rule 144a of the Securities Act of 1933. This security may be sold in transactions exempt from registration, normally to qualified institutional buyers. At June 30, 2019, these securities were valued at $35,109,661 or 59.3% of net assets. These securities were deemed liquid pursuant to procedures approved by the Board of Trustees.
Touchstone Credit Opportunities Fund (Continued)
Other Information:
The inputs or methodology used for valuing securities may not be an indication of the risk associated with investing in those securities. For more information on valuation inputs, and their aggregation into the levels used in the table below, please refer to the security valuation section in the accompanying Notes to Financial Statements.
Valuation inputs at Reporting Date:
| Description | | Level 1 | | | Level 2 | | | Level 3 | | | Total | |
| | | | | | | | | | | | | |
| Assets: | | | | | | | | | | | | | | | | |
| Corporate Bonds | | $ | — | | | $ | 46,037,885 | | | $ | — | | | $ | 46,037,885 | |
| Bank Loans | | | — | | | | 8,519,473 | | | | — | | | | 8,519,473 | |
| Asset-Backed Securities | | | — | | | | 3,079,155 | | | | — | | | | 3,079,155 | |
| Common Stocks | | | — | | | | 302,482 | | | | 23,397 | | | | 325,879 | |
| Purchased Call Options Equity Contracts | | | 2,880 | | | | — | | | | — | | | | 2,880 | |
| Purchased Put Options Equity Contracts | | | 30,595 | | | | — | | | | — | | | | 30,595 | |
| Short-Term Investment Funds | | | 2,932,957 | | | | — | | | | — | | | | 2,932,957 | |
| Total Assets | | $ | 2,966,432 | | | $ | 57,938,995 | | | $ | 23,397 | | | $ | 60,928,824 | |
| | | | | | | | | | | | | | | | | |
| Liabilities: | | | | | | | | | | | | | | | | |
| Securities Sold Short | | | | | | | | | | | | | | | | |
| Corporate Bonds | | $ | — | | | $ | (590,750 | ) | | $ | — | | | $ | (590,750 | ) |
| Written Call Options Equity Contracts | | | (1,280 | ) | | | — | | | | — | | | | (1,280 | ) |
| Total Liabilities | | $ | (1,280 | ) | | $ | (590,750 | ) | | $ | — | | | $ | (592,030 | ) |
| Total | | $ | 2,965,152 | | | $ | 57,348,245 | | | $ | 23,397 | | | $ | 60,336,794 | |
Measurements Using Unobservable Inputs (Level 3)
| | | Common | |
| Assets | | Stocks | |
| | | | |
| Beginning balance, June 30, 2018 | | $ | — | |
| Transfer into Level 3 | | | 23,397 | |
| Net realized gain (loss) | | | — | |
| Change in unrealized appreciation (depreciation) | | | — | |
| Ending balance, June 30, 2019 | | $ | 23,397 | |
| Net Change in Unrealized Appreciation/Depreciation for Investments in Securities still held at June 30, 2019 | | $ | — | |
| Common | | | | | Valuation | | | Unobservable | |
| Stocks | | Fair Value | | | Technique | | | Input | |
| | | | | | | | | | | | |
| Aquity Holdings, Inc. New Escrow | | $ | 23,397 | | | | Cost | | | | NewIssuer | |
See accompanying Notes to Financial Statements.
Portfolio of Investments
Touchstone International Equity Fund — June 30, 2019
| | | | | Market | |
| | Shares | | | Value | |
| | | | | | | | | |
| Common Stocks — 92.5% | | | | | | | | |
| | | | | | | | | |
| United Kingdom — 19.9% | | | | | | | | |
| | | | | | | | | |
| Communication Services — 1.8% | | | | | | | | |
| ITV PLC | | | 2,030,000 | | | $ | 2,784,040 | |
| | | | | | | | | |
| Consumer Discretionary — 8.8% | | | | | | | | |
| BCA Marketplace PLC | | | 2,180,000 | | | | 6,727,433 | |
| Compass Group PLC | | | 117,000 | | | | 2,803,783 | |
| InterContinental Hotels Group PLC | | | 62,000 | | | | 4,077,736 | |
| | | | | | | | | |
| Consumer Staples — 2.7% | | | | | | | | |
| Reckitt Benckiser Group PLC | | | 54,000 | | | | 4,261,393 | |
| | | | | | | | | |
| Health Care — 2.0% | | | | | | | | |
| ConvaTec Group PLC, 144a | | | 1,670,000 | | | | 3,094,305 | |
| | | | | | | | | |
| Industrials — 1.5% | | | | | | | | |
| Experian PLC | | | 77,000 | | | | 2,332,297 | |
| | | | | | | | | |
| Real Estate — 3.1% | | | | | | | | |
| Foxtons Group PLC* | | | 1,750,000 | | | | 1,177,879 | |
| Savills PLC | | | 328,000 | | | | 3,730,061 | |
| Total United Kingdom | | | | | | | 30,988,927 | |
| | | | | | | | | |
| Germany — 12.4% | | | | | | | | |
| | | | | | | | | |
| Consumer Discretionary — 0.9% | | | | | | | | |
| Continental AG | | | 10,000 | | | | 1,457,990 | |
| | | | | | | | | |
| Health Care — 3.0% | | | | | | | | |
| Fresenius SE & Co. KGaA | | | 85,000 | | | | 4,608,439 | |
| | | | | | | | | |
| Industrials — 4.3% | | | | | | | | |
| Brenntag AG | | | 105,000 | | | | 5,152,085 | |
| Norma Group SE | | | 37,000 | | | | 1,533,129 | |
| | | | | | | | | |
| Information Technology — 4.2% | | | | | | | | |
| SAP SE | | | 36,000 | | | | 4,935,306 | |
| Siltronic AG | | | 22,000 | | | | 1,607,041 | |
| Total Germany | | | | | | | 19,293,990 | |
| | | | | | | | | |
| Switzerland — 8.4% | | | | | | | | |
| | | | | | | | | |
| Consumer Staples — 2.9% | | | | | | | | |
| Nestle SA | | | 44,000 | | | | 4,554,979 | |
| | | | | | | | | |
| Health Care — 2.5% | | | | | | | | |
| Novartis AG | | | 42,000 | | | | 3,834,255 | |
| | | | | | | | | |
| Industrials — 3.0% | | | | | | | | |
| Adecco Group AG | | | 77,000 | | | | 4,627,499 | |
| Total Switzerland | | | | | | | 13,016,733 | |
| | | | | | | | | |
| Canada — 6.1% | | | | | | | | |
| | | | | | | | | |
| Information Technology — 2.0% | | | | | | | | |
| BlackBerry Ltd.* | | | 419,000 | | | | 3,125,740 | |
| | | | | | | | | |
| Materials — 4.1% | | | | | | | | |
| Barrick Gold Corp. | | | 205,288 | | | | 3,240,276 | |
| Pretium Resources, Inc*† | | | 310,000 | | | | 3,103,100 | |
| Total Canada | | | | | | | 9,469,116 | |
| | | | | | | | | |
| France — 5.9% | | | | | | | | |
| | | | | | | | | |
| Communication Services — 5.9% | | | | | | | | |
| Eutelsat Communications SA | | | 235,000 | | | | 4,393,072 | |
| JCDecaux SA | | | 155,000 | | | | 4,695,313 | |
| Total France | | | | | | | 9,088,385 | |
| | | | | | | | | |
| India — 5.3% | | | | | | | | |
| | | | | | | | | |
| Consumer Discretionary — 0.9% | | | | | | | | |
| PC Jeweller Ltd. | | | 2,200,000 | | | | 1,442,612 | |
| | | | | | | | | |
| Financials — 4.4% | | | | | | | | |
| Indian Energy Exchange Ltd., 144a | | | 1,340,000 | | | | 2,797,349 | |
| Shriram Transport Finance Co. Ltd. | | | 255,000 | | | | 3,991,312 | |
| Total India | | | | | | | 8,231,273 | |
| | | | | | | | | |
| Japan — 4.9% | | | | | | | | |
| | | | | | | | | |
| Consumer Discretionary — 2.8% | | | | | | | | |
| USS Co. Ltd. | | | 222,000 | | | | 4,385,615 | |
| | | | | | | | | |
| Industrials — 2.1% | | | | | | | | |
| FANUC Corp. | | | 17,500 | | | | 3,251,723 | |
| Total Japan | | | | | | | 7,637,338 | |
| | | | | | | | | |
| China — 3.8% | | | | | | | | |
| | | | | | | | | |
| Communication Services — 1.7% | | | | | | | | |
| Tencent Holdings Ltd. | | | 60,000 | | | | 2,714,365 | |
| | | | | | | | | |
| Consumer Discretionary — 2.1% | | | | | | | | |
| Alibaba Group Holding Ltd. ADR* | | | 19,000 | | | | 3,219,550 | |
| Total China | | | | | | | 5,933,915 | |
| | | | | | | | | |
| Ireland — 3.4% | | | | | | | | |
| | | | | | | | | |
| Health Care — 3.4% | | | | | | | | |
| Medtronic PLC (Ireland) | | | 53,500 | | | | 5,210,365 | |
| | | | | | | | | |
| Denmark — 3.4% | | | | | | | | |
| | | | | | | | | |
| Industrials — 3.4% | | | | | | | | |
| ISS A/S | | | 172,000 | | | | 5,200,038 | |
| | | | | | | | | |
| Greece — 3.2% | | | | | | | | |
| | | | | | | | | |
| Consumer Discretionary — 3.2% | | | | | | | | |
| OPAP SA | | | 448,000 | | | | 5,017,795 | |
| | | | | | | | | |
| Mexico — 2.5% | | | | | | | | |
| | | | | | | | | |
| Consumer Staples — 2.5% | | | | | | | | |
| Gruma SAB de CV - Class B | | | 410,000 | | | | 3,856,750 | |
Touchstone International Equity Fund (Continued)
| | | | | | Market | |
| | | Shares | | | Value | |
| | | | | | | |
| Common Stocks — 92.5% (Continued) | | | | | | | | |
| | | | | | | | | |
| Norway — 2.4% | | | | | | | | |
| | | | | | | | | |
| Energy — 2.4% | | | | | | | | |
| TGS NOPEC Geophysical Co. ASA | | | 134,000 | | | $ | 3,770,785 | |
| | | | | | | | | |
| Netherlands — 2.3% | | | | | | | | |
| | | | | | | | | |
| Energy — 2.3% | | | | | | | | |
| Core Laboratories NV | | | 68,000 | | | | 3,555,040 | |
| | | | | | | | | |
| South Korea — 2.2% | | | | | | | | |
| | | | | | | | | |
| Information Technology — 2.2% | | | | | | | | |
| Samsung Electronics Co. Ltd. | | | 84,000 | | | | 3,420,509 | |
| | | | | | | | | |
| Hong Kong — 2.1% | | | | | | | | |
| | | | | | | | | |
| Consumer Discretionary — 2.1% | | | | | | | | |
| Galaxy Entertainment Group Ltd. | | | 490,000 | | | | 3,296,230 | |
| | | | | | | | | |
| Luxembourg — 1.8% | | | | | | | | |
| | | | | | | | | |
| Industrials — 1.8% | | | | | | | | |
| Befesa SA, 144a | | | 72,000 | | | | 2,865,492 | |
| | | | | | | | | |
| United States — 1.4% | | | | | | | | |
| | | | | | | | | |
| Information Technology — 1.4% | | | | | | | | |
| Mastercard, Inc. - Class A | | | 8,000 | | | | 2,116,240 | |
| | | | | | | | | |
| Australia — 1.1% | | | | | | | | |
| | | | | | | | | |
| Materials — 1.1% | | | | | | | | |
| Northern Star Resources Ltd. | | | 210,000 | | | | 1,722,804 | |
| Total Common Stocks | | | | | | $ | 143,691,725 | |
| | | | | | | | | |
| Short-Term Investment Funds — 7.0% | | | | | | | | |
| Dreyfus Government Cash Management, Institutional Shares, 2.25%∞Ω | | | 10,842,559 | | | | 10,842,559 | |
| Invesco Government & Agency Portfolio, Institutional Class, 2.19%**∞Ω | | | 114,450 | | | | 114,450 | |
| Total Short-Term Investment Funds | | | | | | $ | 10,957,009 | |
| | | | | | | | | |
| Total Investment Securities —99.5% | | | | | | | | |
| (Cost $146,241,069) | | | | | | $ | 154,648,734 | |
| | | | | | | | | |
| Other Assets in Excess of Liabilities — 0. 5% | | | | | | | 715,440 | |
| | | | | | | | | |
| Net Assets — 100.0% | | | | | | $ | 155,364,174 | |
| * | Non-income producing security. |
| | |
| ** | Represents collateral for securities loaned. |
| | |
| † | All or a portion of the security is on loan. The total market value of the securities on loan as of June 30, 2019 was $109,109. |
| | |
| ∞ | Open-End Fund. |
| | |
| Ω | Represents the 7-day SEC yield as of June 30, 2019. |
Portfolio Abbreviations:
ADR - American Depositary Receipt
PLC - Public Limited Company
144a - This is a restricted security that was sold in a transaction qualifying for the exemption under Rule 144a of the Securities Act of 1933. This security may be sold in transactions exempt from registration, normally to qualified institutional buyers. At June 30, 2019, these securities were valued at $8,757,146 or 5.6% of net assets. These securities were deemed liquid pursuant to procedures approved by the Board of Trustees.
Touchstone International Equity Fund (Continued)
Other Information:
The inputs or methodology used for valuing securities may not be an indication of the risk associated with investing in those securities. For more information on valuation inputs, and their aggregation into the levels used in the table below, please refer to the security valuation section in the accompanying Notes to Financial Statements.
Valuation inputs at Reporting Date:
| Description | | Level 1 | | | Level 2 | | | Level 3 | | | Total | |
| Common Stocks | | | | | | | | | | | | | | | | |
| United Kingdom | | $ | 14,970,488 | | | $ | 16,018,439 | | | $ | — | | | $ | 30,988,927 | |
| Germany | | | 9,206,599 | | | | 10,087,391 | | | | — | | | | 19,293,990 | |
| Switzerland | | | — | | | | 13,016,733 | | | | — | | | | 13,016,733 | |
| Canada | | | 9,469,116 | | | | — | | | | — | | | | 9,469,116 | |
| France | | | 9,088,385 | | | | — | | | | — | | | | 9,088,385 | |
| India | | | — | | | | 8,231,273 | | | | — | | | | 8,231,273 | |
| Japan | | | — | | | | 7,637,338 | | | | — | | | | 7,637,338 | |
| China | | | 3,219,550 | | | | 2,714,365 | | | | — | | | | 5,933,915 | |
| Ireland | | | 5,210,365 | | | | — | | | | — | | | | 5,210,365 | |
| Denmark | | | — | | | | 5,200,038 | | | | — | | | | 5,200,038 | |
| Greece | | | 5,017,795 | | | | — | | | | — | | | | 5,017,795 | |
| Mexico | | | 3,856,750 | | | | — | | | | — | | | | 3,856,750 | |
| Norway | | | — | | | | 3,770,785 | | | | — | | | | 3,770,785 | |
| Netherlands | | | 3,555,040 | | | | — | | | | — | | | | 3,555,040 | |
| South Korea | | | — | | | | 3,420,509 | | | | — | | | | 3,420,509 | |
| Hong Kong | | | — | | | | 3,296,230 | | | | — | | | | 3,296,230 | |
| Luxembourg | | | 2,865,492 | | | | — | | | | — | | | | 2,865,492 | |
| United States | | | 2,116,240 | | | | — | | | | — | | | | 2,116,240 | |
| Australia | | | — | | | | 1,722,804 | | | | — | | | | 1,722,804 | |
| Short-Term Investment Funds | | | 10,957,009 | | | | — | | | | — | | | | 10,957,009 | |
| Total | | $ | 79,532,829 | | | $ | 75,115,905 | | | $ | — | | | $ | 154,648,734 | |
See accompanying Notes to Financial Statements.
Portfolio of Investments
Touchstone International Growth Opportunities Fund – June 30, 2019
| | | | | | Market | |
| | | Shares | | | Value | |
| | | | | | | |
| Common Stocks — 99.5% | | | | | | | | |
| | | | | | | | | |
| China — 40.9% | | | | | | | | |
| | | | | | | | | |
| Communication Services — 12.9% | | | | | | | | |
| 58.com, Inc. ADR* | | | 7,735 | | | $ | 480,885 | |
| Autohome, Inc. ADR* | | | 12,940 | | | | 1,107,923 | |
| Tencent Holdings Ltd. | | | 53,525 | | | | 2,421,440 | |
| Tencent Music Entertainment Group ADR* | | | 31,885 | | | | 477,956 | |
| | | | | | | | | |
| Consumer Discretionary — 15.6% | | | | | | | | |
| Alibaba Group Holding Ltd. ADR* | | | 17,950 | | | | 3,041,628 | |
| New Oriental Education & Technology Group, Inc. ADR* | | | 19,430 | | | | 1,876,549 | |
| Tongcheng-Elong Holdings Ltd.*† | | | 246,000 | | | | 488,305 | |
| | | | | | | | | |
| Consumer Staples — 9.9% | | | | | | | | |
| Dali Foods Group Co. Ltd., 144a | | | 1,160,500 | | | | 770,047 | |
| Kweichow Moutai Co. Ltd. - Class A | | | 8,000 | | | | 1,148,989 | |
| Wuliangye Yibin Co. Ltd. - Class A | | | 88,728 | | | | 1,528,217 | |
| | | | | | | | | |
| Financials — 1.5% | | | | | | | | |
| Ping An Insurance Group Co. of China Ltd. - Class H | | | 42,700 | | | | 513,462 | |
| | | | | | | | | |
| Industrials — 1.0% | | | | | | | | |
| 51job, Inc. ADR* | | | 4,650 | | | | 351,075 | |
| Total China | | | | | | | 14,206,476 | |
| | | | | | | | | |
| France — 12.7% | | | | | | | | |
| | | | | | | | | |
| Consumer Discretionary — 1.4% | | | | | | | | |
| Kering SA | | | 840 | | | | 496,781 | |
| | | | | | | | | |
| Industrials — 7.9% | | | | | | | | |
| Airbus SE | | | 3,385 | | | | 479,050 | |
| Safran SA | | | 8,990 | | | | 1,315,163 | |
| Thales SA | | | 7,735 | | | | 955,443 | |
| | | | | | | | | |
| Information Technology — 3.4% | | | | | | | | |
| Capgemini SE | | | 9,345 | | | | 1,161,975 | |
| Total France | | | | | | | 4,408,412 | |
| | | | | | | | | |
| Switzerland — 8.3% | | | | | | | | |
| | | | | | | | | |
| Consumer Staples — 2.9% | | | | | | | | |
| Coca-Cola HBC AG | | | 26,540 | | | | 1,002,552 | |
| | | | | | | | | |
| Health Care — 5.4% | | | | | | | | |
| Medacta Group SA, 144a* | | | 7,775 | | | | 702,474 | |
| Sonova Holding AG | | | 5,205 | | | | 1,184,651 | |
| Total Switzerland | | | | | | | 2,889,677 | |
| | | | | | | | | |
| Germany — 5.1% | | | | | | | | |
| | | | | | | | | |
| Information Technology — 5.1% | | | | | | | | |
| SAP SE | | | 6,000 | | | | 822,551 | |
| Wirecard AG | | | 5,630 | | | | 947,797 | |
| Total Germany | | | | | | | 1,770,348 | |
| | | | | | | | | |
| India — 5.0% | | | | | | | | |
| | | | | | | | | |
| Financials — 5.0% | | | | | | | | |
| HDFC Bank Ltd. ADR | | | 13,275 | | | | 1,726,281 | |
| | | | | | | | | |
| Japan — 4.5% | | | | | | | | |
| | | | | | | | | |
| Industrials — 4.5% | | | | | | | | |
| Recruit Holdings Co. Ltd. | | | 46,100 | | | | 1,543,515 | |
| | | | | | | | | |
| Singapore — 4.2% | | | | | | | | |
| | | | | | | | | |
| Financials — 4.2% | | | | | | | | |
| DBS Group Holdings Ltd. | | | 75,100 | | | | 1,442,676 | |
| | | | | | | | | |
| Israel — 3.8% | | | | | | | | |
| | | | | | | | | |
| Information Technology — 3.8% | | | | | | | | |
| Nice Ltd. ADR* | | | 9,615 | | | | 1,317,255 | |
| | | | | | | | | |
| Brazil — 3.6% | | | | | | | | |
| | | | | | | | | |
| Consumer Discretionary — 2.0% | | | | | | | | |
| Magazine Luiza SA | | | 12,500 | | | | 679,534 | |
| | | | | | | | | |
| Information Technology — 1.6% | | | | | | | | |
| Pagseguro Digital Ltd. - Class A* | | | 14,650 | | | | 570,911 | |
| Total Brazil | | | | | | | 1,250,445 | |
| | | | | | | | | |
| Sweden — 3.2% | | | | | | | | |
| | | | | | | | | |
| Information Technology — 3.2% | | | | | | | | |
| Hexagon AB | | | 19,855 | | | | 1,104,011 | |
| | | | | | | | | |
| Argentina — 2.9% | | | | | | | | |
| | | | | | | | | |
| Information Technology — 2.9% | | | | | | | | |
| Globant SA* | | | 10,115 | | | | 1,022,121 | |
| | | | | | | | | |
| United Kingdom — 2.1% | | | | | | | | |
| | | | | | | | | |
| Health Care — 2.1% | | | | | | | | |
| AstraZeneca PLC | | | 8,990 | | | | 734,948 | |
| | | | | | | | | |
| Russia — 1.9% | | | | | | | | |
| | | | | | | | | |
| Communication Services — 1.9% | | | | | | | | |
| Yandex NV - Class A* | | | 17,380 | | | | 660,440 | |
| | | | | | | | | |
| Canada — 1.3% | | | | | | | | |
| | | | | | | | | |
| Industrials — 1.3% | | | | | | | | |
| Canadian Pacific Railway Ltd. | | | 1,980 | | | | 465,775 | |
| Total Common Stocks | | | | | | $ | 34,542,380 | |
Touchstone International Growth Opportunities Fund (Continued)
| | | | | | Market | |
| | | Shares | | | Value | |
| | | | | | | | | |
| Short-Term Investment Funds — 1.8% | | | | | | | | |
| Dreyfus Government Cash Management, Institutional Shares, 2.25%∞Ω | | | 204,458 | | | $ | 204,458 | |
| Invesco Government & Agency Portfolio, Institutional Class, 2.19%**∞Ω | | | 411,312 | | | | 411,312 | |
| Total Short-Term Investment Funds | | | | | | $ | 615,770 | |
| | | | | | | | | |
| Total Investment Securities —101.3% | | | | | | | | |
| (Cost $27,883,935) | | | | | | $ | 35,158,150 | |
| | | | | | | | | |
| Liabilities in Excess of Other Assets — (1.3%) | | | | | | | (436,169 | ) |
| | | | | | | | | |
| Net Assets — 100.0% | | | | | | $ | 34,721,981 | |
| * | Non-income producing security. |
| ** | Represents collateral for securities loaned. |
| † | All or a portion of the security is on loan. The total market value of the securities on loan as of June 30, 2019 was $390,644. |
| Ω | Represents the 7-day SEC yield as of June 30, 2019. |
Portfolio Abbreviations:
ADR - American Depositary Receipt
PLC - Public Limited Company
144a - This is a restricted security that was sold in a transaction qualifying for the exemption under Rule 144a of the Securities Act of 1933. This security may be sold in transactions exempt from registration, normally to qualified institutional buyers. At June 30, 2019, these securities were valued at $1,472,521 or 4.2% of net assets. These securities were deemed liquid pursuant to procedures approved by the Board of Trustees.
Other Information:
The inputs or methodology used for valuing securities may not be an indication of the risk associated with investing in those securities. For more information on valuation inputs, and their aggregation into the levels used in the table below, please refer to the security valuation section in the accompanying Notes to Financial Statements.
Valuation inputs at Reporting Date:
| Description | | Level 1 | | | Level 2 | | | Level 3 | | | Total | |
| Common Stocks | | | | | | | | | | | | | | | | |
| China | | $ | 7,336,016 | | | $ | 6,870,460 | | | $ | — | | | $ | 14,206,476 | |
| France | | | 1,658,756 | | | | 2,749,656 | | | | — | | | | 4,408,412 | |
| Switzerland | | | 702,474 | | | | 2,187,203 | | | | — | | | | 2,889,677 | |
| Germany | | | 947,797 | | | | 822,551 | | | | — | | | | 1,770,348 | |
| India | | | 1,726,281 | | | | — | | | | — | | | | 1,726,281 | |
| Japan | | | — | | | | 1,543,515 | | | | — | | | | 1,543,515 | |
| Singapore | | | — | | | | 1,442,676 | | | | — | | | | 1,442,676 | |
| Israel | | | 1,317,255 | | | | — | | | | — | | | | 1,317,255 | |
| Brazil | | | 1,250,445 | | | | — | | | | — | | | | 1,250,445 | |
| Sweden | | | — | | | | 1,104,011 | | | | — | | | | 1,104,011 | |
| Argentina | | | 1,022,121 | | | | — | | | | — | | | | 1,022,121 | |
| United Kingdom | | | — | | | | 734,948 | | | | — | | | | 734,948 | |
| Russia | | | 660,440 | | | | — | | | | — | | | | 660,440 | |
| Canada | | | 465,775 | | | | — | | | | — | | | | 465,775 | |
| Short-Term Investment Funds | | | 615,770 | | | | — | | | | — | | | | 615,770 | |
| Total | | $ | 17,703,130 | | | $ | 17,455,020 | | | $ | — | | | $ | 35,158,150 | |
See accompanying Notes to Financial Statements.
Portfolio of Investments
Touchstone International Small Cap Fund – June 30, 2019
| | | | | | Market | |
| | | Shares | | | Value | |
| | | | | | | | | |
| Common Stocks — 95.8% | | | | | | | | |
| | | | | | | | | |
| Japan — 23.1% | | | | | | | | |
| | | | | | | | | |
| Communication Services — 1.0% | | | | | | | | |
| Fuji Media Holdings, Inc. | | | 146,900 | | | $ | 2,051,861 | |
| | | | | | | | | |
| Consumer Discretionary — 2.8% | | | | | | | | |
| Kyoritsu Maintenance Co. Ltd. | | | 50,900 | | | | 2,383,273 | |
| Marui Group Co. Ltd. | | | 163,100 | | | | 3,326,120 | |
| | | | | | | | | |
| Consumer Staples — 3.9% | | | | | | | | |
| Morinaga & Co. Ltd. | | | 53,500 | | | | 2,609,265 | |
| Morinaga Milk Industry Co. Ltd. | | | 66,000 | | | | 2,613,383 | |
| Nippon Suisan Kaisha Ltd. | | | 406,600 | | | | 2,523,573 | |
| | | | | | | | | |
| Financials — 2.5% | | | | | | | | |
| Aruhi Corp.† | | | 133,800 | | | | 2,630,684 | |
| Zenkoku Hosho Co. Ltd. | | | 62,000 | | | | 2,384,287 | |
| | | | | | | | | |
| Health Care — 2.3% | | | | | | | | |
| Rohto Pharmaceutical Co. Ltd. | | | 75,800 | | | | 2,063,767 | |
| Ship Healthcare Holdings, Inc. | | | 59,100 | | | | 2,556,718 | |
| | | | | | | | | |
| Industrials — 4.2% | | | | | | | | |
| Japan Airport Terminal Co. Ltd. | | | 53,300 | | | | 2,279,581 | |
| Kamigumi Co. Ltd. | | | 86,100 | | | | 2,041,749 | |
| Seino Holdings Co. Ltd. | | | 143,500 | | | | 1,916,544 | |
| TechnoPro Holdings, Inc. | | | 42,800 | | | | 2,284,727 | |
| | | | | | | | | |
| Information Technology — 5.5% | | | | | | | | |
| Advantest Corp. | | | 59,800 | | | | 1,646,347 | |
| Azbil Corp. | | | 83,300 | | | | 2,039,772 | |
| Digital Garage, Inc. | | | 57,700 | | | | 1,833,252 | |
| GMO internet, Inc. | | | 128,200 | | | | 2,330,565 | |
| Nihon Unisys Ltd. | | | 96,500 | | | | 3,246,250 | |
| | | | | | | | | |
| Materials — 0.9% | | | | | | | | |
| Sumitomo Bakelite Co. Ltd. | | | 51,200 | | | | 1,832,917 | |
| Total Japan | | | | | | | 46,594,635 | |
| | | | | | | | | |
| United Kingdom — 11.1% | | | | | | | | |
| | | | | | | | | |
| Communication Services — 1.1% | | | | | | | | |
| Euromoney Institutional Investor PLC | | | 128,271 | | | | 2,120,929 | |
| | | | | | | | | |
| Consumer Discretionary — 1.1% | | | | | | | | |
| SSP Group PLC | | | 265,602 | | | | 2,314,869 | |
| | | | | | | | | |
| Consumer Staples — 1.4% | | | | | | | | |
| Britvic PLC | | | 257,616 | | | | 2,906,561 | |
| | | | | | | | | |
| Financials — 1.2% | | | | | | | | |
| Intermediate Capital Group PLC | | | 135,269 | | | | 2,372,700 | |
| | | | | | | | | |
| Health Care — 2.5% | | | | | | | | |
| Abcam PLC | | | 107,347 | | | | 2,009,435 | |
| Dechra Pharmaceuticals PLC | | | 85,534 | | | | 2,985,340 | |
| | | | | | | | | |
| Industrials — 1.7% | | | | | | | | |
| HomeServe PLC | | | 114,025 | | | | 1,718,848 | |
| Pagegroup PLC | | | 252,489 | | | | 1,643,465 | |
| | | | | | | | | |
| Information Technology — 2.1% | | | | | | | | |
| Electrocomponents PLC | | | 192,576 | | | | 1,547,108 | |
| Spectris PLC | | | 73,639 | | | | 2,689,817 | |
| Total United Kingdom | | | | | | | 22,309,072 | |
| | | | | | | | | |
| Germany — 7.4% | | | | | | | | |
| | | | | | | | | |
| Communication Services — 1.4% | | | | | | | | |
| Stroeer SE & Co. KGaA | | | 37,801 | | | | 2,839,061 | |
| | | | | | | | | |
| Consumer Discretionary — 1.2% | | | | | | | | |
| HUGO BOSS AG | | | 35,508 | | | | 2,366,460 | |
| | | | | | | | | |
| Health Care — 1.3% | | | | | | | | |
| Evotec SE* | | | 94,644 | | | | 2,649,814 | |
| | | | | | | | | |
| Industrials — 1.5% | | | | | | | | |
| Rheinmetall AG | | | 24,061 | | | | 2,948,942 | |
| | | | | | | | | |
| Information Technology — 1.2% | | | | | | | | |
| Dialog Semiconductor PLC* | | | 58,246 | | | | 2,343,783 | |
| | | | | | | | | |
| Real Estate — 0.8% | | | | | | | | |
| TAG Immobilien AG | | | 74,293 | | | | 1,716,032 | |
| Total Germany | | | | | | | 14,864,092 | |
| | | | | | | | | |
| Australia — 6.8% | | | | | | | | |
| | | | | | | | | |
| Energy — 1.7% | | | | | | | | |
| Beach Energy Ltd. | | | 1,181,095 | | | | 1,661,102 | |
| WorleyParsons Ltd. | | | 176,035 | | | | 1,829,934 | |
| | | | | | | | | |
| Health Care — 1.4% | | | | | | | | |
| Ansell Ltd. | | | 144,288 | | | | 2,724,441 | |
| | | | | | | | | |
| Industrials — 1.5% | | | | | | | | |
| Cleanaway Waste Management Ltd. | | | 1,897,733 | | | | 3,110,312 | |
| | | | | | | | | |
| Materials — 0.8% | | | | | | | | |
| Regis Resources Ltd. | | | 404,318 | | | | 1,501,341 | |
| | | | | | | | | |
| Real Estate — 1.4% | | | | | | | | |
| Charter Hall Group REIT | | | 368,863 | | | | 2,808,860 | |
| Total Australia | | | | | | | 13,635,990 | |
| | | | | | | | | |
| Canada — 6.8% | | | | | | | | |
| | | | | | | | | |
| Consumer Staples — 1.3% | | | | | | | | |
| Premium Brands Holdings Corp.† | | | 38,737 | | | | 2,647,741 | |
| | | | | | | | | |
| Energy — 0.9% | | | | | | | | |
| Parkland Fuel Corp. | | | 53,423 | | | | 1,695,029 | |
| | | | | | | | | |
| Industrials — 2.3% | | | | | | | | |
| Badger Daylighting Ltd.† | | | 59,903 | | | | 2,185,610 | |
| Boyd Group Income Fund | | | 19,335 | | | | 2,443,101 | |
| | | | | | | | | |
| Real Estate — 1.0% | | | | | | | | |
| Colliers International Group, Inc. | | | 28,686 | | | | 2,050,987 | |
Touchstone International Small Cap Fund (Continued)
| | | | | | Market | |
| | | Shares | | | Value | |
| | | | | | | | | |
| Common Stocks — 95.8% (Continued) | | | | | | | | |
| | | | | | | | | |
| Canada — (Continued) | | | | | | | | |
| | | | | | | | | |
| Utilities — 1.3% | | | | | | | | |
| Capital Power Corp.† | | | 112,513 | | | $ | 2,590,407 | |
| Total Canada | | | | | | | 13,612,875 | |
| | | | | | | | | |
| France — 6.2% | | | | | | | | |
| | | | | | | | | |
| Communication Services — 1.3% | | | | | | | | |
| Lagardere SCA | | | 98,798 | | | | 2,572,659 | |
| | | | | | | | | |
| Health Care — 1.2% | | | | | | | | |
| Korian SA | | | 62,102 | | | | 2,362,817 | |
| | | | | | | | | |
| Industrials — 1.1% | | | | | | | | |
| Rexel SA | | | 177,299 | | | | 2,250,343 | |
| | | | | | | | | |
| Information Technology — 2.6% | | | | | | | | |
| Alten SA | | | 23,734 | | | | 2,844,528 | |
| SOITEC* | | | 22,852 | | | | 2,500,001 | |
| Total France | | | | | | | 12,530,348 | |
| | | | | | | | | |
| Switzerland — 4.3% | | | | | | | | |
| | | | | | | | | |
| Communication Services — 0.7% | | | | | | | | |
| Sunrise Communications Group AG, 144a† | | | 19,976 | | | | 1,491,972 | |
| | | | | | | | | |
| Consumer Discretionary — 1.1% | | | | | | | | |
| Forbo Holding AG | | | 1,206 | | | | 2,129,705 | |
| | | | | | | | | |
| Industrials — 2.5% | | | | | | | | |
| OC Oerlikon Corp. AG | | | 192,467 | | | | 2,351,916 | |
| Wizz Air Holdings PLC, 144a* | | | 64,509 | | | | 2,793,814 | |
| Total Switzerland | | | | | | | 8,767,407 | |
| | | | | | | | | |
| Italy — 3.7% | | | | | | | | |
| | | | | | | | | |
| Health Care — 1.1% | | | | | | | | |
| Amplifon SpA | | | 90,907 | | | | 2,130,034 | |
| | | | | | | | | |
| Materials — 1.2% | | | | | | | | |
| Buzzi Unicem SpA | | | 120,828 | | | | 2,453,274 | |
| | | | | | | | | |
| Utilities — 1.4% | | | | | | | | |
| Italgas SpA | | | 431,479 | | | | 2,898,670 | |
| Total Italy | | | | | | | 7,481,978 | |
| | | | | | | | | |
| Sweden — 3.5% | | | | | | | | |
| | | | | | | | | |
| Consumer Discretionary — 1.2% | | | | | | | | |
| Dometic Group AB, 144a | | | 242,600 | | | | 2,432,579 | |
| | | | | | | | | |
| Industrials — 1.3% | | | | | | | | |
| Loomis AB | | | 76,574 | | | | 2,632,464 | |
| | | | | | | | | |
| Real Estate — 1.0% | | | | | | | | |
| Hemfosa Fastigheter AB | | | 215,602 | | | | 2,038,972 | |
| Total Sweden | | | | | | | 7,104,015 | |
| | | | | | | | | |
| Netherlands — 3.3% | | | | | | | | |
| | | | | | | | | |
| Financials — 2.3% | | | | | | | | |
| ASR Nederland NV | | | 59,750 | | | | 2,427,725 | |
| Euronext NV, 144a | | | 27,911 | | | | 2,112,137 | |
| | | | | | | | | |
| Materials — 1.0% | | | | | | | | |
| AMG Advanced Metallurgical Group NV† | | | 67,855 | | | | 2,105,300 | |
| Total Netherlands | | | | | | | 6,645,162 | |
| | | | | | | | | |
| Denmark — 3.3% | | | | | | | | |
| | | | | | | | | |
| Financials — 1.5% | | | | | | | | |
| Topdanmark A/S | | | 54,205 | | | | 3,059,152 | |
| | | | | | | | | |
| Industrials — 1.0% | | | | | | | | |
| Dfds A/S | | | 46,567 | | | | 1,977,735 | |
| | | | | | | | | |
| Information Technology — 0.8% | | | | | | | | |
| SimCorp A/S | | | 15,710 | | | | 1,520,761 | |
| Total Denmark | | | | | | | 6,557,648 | |
| | | | | | | | | |
| Ireland — 2.9% | | | | | | | | |
| | | | | | | | | |
| Consumer Staples — 1.5% | | | | | | | | |
| Greencore Group PLC | | | 1,060,033 | | | | 2,948,154 | |
| | | | | | | | | |
| Health Care — 1.4% | | | | | | | | |
| UDG Healthcare PLC | | | 282,902 | | | | 2,869,897 | |
| Total Ireland | | | | | | | 5,818,051 | |
| | | | | | | | | |
| Norway — 2.5% | | | | | | | | |
| | | | | | | | | |
| Consumer Staples — 1.2% | | | | | | | | |
| Leroy Seafood Group ASA | | | 354,636 | | | | 2,349,434 | |
| | | | | | | | | |
| Financials — 1.3% | | | | | | | | |
| Storebrand ASA | | | 361,050 | | | | 2,657,336 | |
| Total Norway | | | | | | | 5,006,770 | |
| | | | | | | | | |
| Singapore — 1.4% | | | | | | | | |
| | | | | | | | | |
| Industrials — 1.4% | | | | | | | | |
| ComfortDelGro Corp. Ltd. | | | 1,445,300 | | | | 2,842,315 | |
| | | | | | | | | |
| India — 1.3% | | | | | | | | |
| | | | | | | | | |
| Information Technology — 1.3% | | | | | | | | |
| WNS Holdings Ltd. ADR* | | | 45,541 | | | | 2,696,027 | |
| | | | | | | | | |
| Spain — 1.3% | | | | | | | | |
| | | | | | | | | |
| Health Care — 1.3% | | | | | | | | |
| Almirall SA | | | 139,949 | | | | 2,584,369 | |
| | | | | | | | | |
| Argentina — 1.2% | | | | | | | | |
| | | | | | | | | |
| Information Technology — 1.2% | | | | | | | | |
| Globant SA* | | | 24,613 | | | | 2,487,144 | |
Touchstone International Small Cap Fund (Continued)
| | | | | | Market | |
| | | Shares | | | Value | |
| | | | | | | | | |
| Common Stocks — 95.8% (Continued) | | | | | | | | |
| | | | | | | | | |
| Finland — 1.2% | | | | | | | | |
| | | | | | | | | |
| Materials — 1.2% | | | | | | | | |
| Huhtamaki OYJ | | | 56,807 | | | $ | 2,335,764 | |
| | | | | | | | | |
| South Korea — 1.0% | | | | | | | | |
| | | | | | | | | |
| Financials — 1.0% | | | | | | | | |
| Meritz Securities Co. Ltd. | | | 416,321 | | | | 1,933,802 | |
| | | | | | | | | |
| Luxembourg — 1.0% | | | | | | | | |
| | | | | | | | | |
| Real Estate — 1.0% | | | | | | | | |
| Grand City Properties SA | | | 84,099 | | | | 1,923,423 | |
| | | | | | | | | |
| Taiwan — 0.9% | | | | | | | | |
| | | | | | | | | |
| Information Technology — 0.9% | | | | | | | | |
| Chipbond Technology Corp. | | | 982,000 | | | | 1,914,870 | |
| | | | | | | | | |
| China — 0.9% | | | | | | | | |
| | | | | | | | | |
| Consumer Discretionary — 0.9% | | | | | | | | |
| Li Ning Co. Ltd. | | | 772,000 | | | | 1,825,646 | |
| | | | | | | | | |
| Hong Kong — 0.7% | | | | | | | | |
| | | | | | | | | |
| Consumer Discretionary — 0.7% | | | | | | | | |
| Xinyi Glass Holdings Ltd. | | | 1,398,000 | | | | 1,468,535 | |
| Total Common Stocks | | | | | | $ | 192,939,938 | |
| | | | | | | | | |
| Exchange-Traded Fund — 2.5% | | | | | | | | |
| | | | | | | | | |
| United States — 2.5% | | | | | | | | |
| iShares MSCI EAFE Small-Cap ETF | | | 87,472 | | | $ | 5,020,893 | |
| | | | | | | | | |
| Short-Term Investment Funds — 8.6% | | | | | | | | |
| Dreyfus Government Cash Management, Institutional Shares, 2.25%∞Ω | | | 4,640,185 | | | | 4,640,185 | |
| Invesco Government & Agency Portfolio, Institutional Class, 2.19%**∞Ω | | | 12,761,400 | | | | 12,761,400 | |
| Total Short-Term Investment Funds | | | | | | $ | 17,401,585 | |
| | | | | | | | | |
| Total Investment Securities —106.9% | | | | | | | | |
| (Cost $189,006,455) | | | | | | $ | 215,362,416 | |
| | | | | | | | | |
| Liabilities in Excess of Other Assets — (6.9%) | | | | | | | (13,913,766 | ) |
| | | | | | | | | |
| Net Assets — 100.0% | | | | | | $ | 201,448,650 | |
| * | Non-income producing security. |
| ** | Represents collateral for securities loaned. |
| † | All or a portion of the security is on loan. The total market value of the securities on loan as of June 30, 2019 was $12,229,101. |
| Ω | Represents the 7-day SEC yield as of June 30, 2019. |
Portfolio Abbreviations:
ADR - American Depositary Receipt
ETF - Exchange-Traded Fund
PLC - Public Limited Company
REIT- Real Estate Investment Trust
144a - This is a restricted security that was sold in a transaction qualifying for the exemption under Rule 144a of the Securities Act of 1933. This security may be sold in transactions exempt from registration, normally to qualified institutional buyers. At June 30, 2019, these securities were valued at $8,830,502 or 4.4% of net assets. These securities were deemed liquid pursuant to procedures approved by the Board of Trustees.
Touchstone International Small Cap Fund (Continued)
Other Information:
The inputs or methodology used for valuing securities may not be an indication of the risk associated with investing in those securities. For more information on valuation inputs, and their aggregation into the levels used in the table below, please refer to the security valuation section in the accompanying Notes to Financial Statements.
Valuation inputs at Reporting Date:
| Description | | Level 1 | | | Level 2 | | | Level 3 | | | Total | |
| Common Stocks | | | | | | | | | | | | | | | | |
| Japan | | $ | — | | | $ | 46,594,635 | | | $ | — | | | $ | 46,594,635 | |
| United Kingdom | | | 5,849,212 | | | | 16,459,860 | | | | — | | | | 22,309,072 | |
| Germany | | | 2,839,061 | | | | 12,025,031 | | | | — | | | | 14,864,092 | |
| Australia | | | — | | | | 13,635,990 | | | | — | | | | 13,635,990 | |
| Canada | | | 13,612,875 | | | | — | | | | — | | | | 13,612,875 | |
| France | | | 7,780,004 | | | | 4,750,344 | | | | — | | | | 12,530,348 | |
| Switzerland | | | — | | | | 8,767,407 | | | | — | | | | 8,767,407 | |
| Italy | | | 2,898,670 | | | | 4,583,308 | | | | — | | | | 7,481,978 | |
| Sweden | | | — | | | | 7,104,015 | | | | — | | | | 7,104,015 | |
| Netherlands | | | 2,112,137 | | | | 4,533,025 | | | | — | | | | 6,645,162 | |
| Denmark | | | — | | | | 6,557,648 | | | | — | | | | 6,557,648 | |
| Ireland | | | 2,948,154 | | | | 2,869,897 | | | | — | | | | 5,818,051 | |
| Norway | | | — | | | | 5,006,770 | | | | — | | | | 5,006,770 | |
| Singapore | | | — | | | | 2,842,315 | | | | — | | | | 2,842,315 | |
| India | | | 2,696,027 | | | | — | | | | — | | | | 2,696,027 | |
| Spain | | | 2,584,369 | | | | — | | | | — | | | | 2,584,369 | |
| Argentina | | | 2,487,144 | | | | — | | | | — | | | | 2,487,144 | |
| Finland | | | 2,335,764 | | | | — | | | | — | | | | 2,335,764 | |
| South Korea | | | — | | | | 1,933,802 | | | | — | | | | 1,933,802 | |
| Luxembourg | | | — | | | | 1,923,423 | | | | — | | | | 1,923,423 | |
| Taiwan | | | — | | | | 1,914,870 | | | | — | | | | 1,914,870 | |
| China | | | — | | | | 1,825,646 | | | | — | | | | 1,825,646 | |
| Hong Kong | | | — | | | | 1,468,535 | | | | — | | | | 1,468,535 | |
| Exchange-Traded Fund | | | 5,020,893 | | | | — | | | | — | | | | 5,020,893 | |
| Short-Term Investment Funds | | | 17,401,585 | | | | — | | | | — | | | | 17,401,585 | |
| Total | | $ | 70,565,895 | | | $ | 144,796,521 | | | $ | — | | | $ | 215,362,416 | |
See accompanying Notes to Financial Statements.
Portfolio of Investments
Touchstone Large Cap Focused Fund – June 30, 2019
| | | | | | Market | |
| | | Shares | | | Value | |
| | | | | | | |
| Common Stocks — 94.6% | | | | | | | | |
| | | | | | | | | |
| Information Technology — 22.5% | | | | | | | | |
| Accenture PLC (Ireland) - Class A | | | 207,346 | | | $ | 38,311,320 | |
| Apple, Inc. | | | 340,315 | | | | 67,355,145 | |
| Cisco Systems, Inc. | | | 584,365 | | | | 31,982,296 | |
| Microsoft Corp. | | | 754,986 | | | | 101,137,925 | |
| Oracle Corp. | | | 413,559 | | | | 23,560,456 | |
| salesforce.com, Inc.* | | | 166,328 | | | | 25,236,947 | |
| Texas Instruments, Inc. | | | 164,701 | | | | 18,901,087 | |
| Visa, Inc. - Class A | | | 475,920 | | | | 82,595,916 | |
| | | | | | | | 389,081,092 | |
| | | | | | | | | |
| Consumer Discretionary — 14.4% | | | | | | | | |
| Alibaba Group Holding Ltd. (China) ADR* | | | 101,940 | | | | 17,273,733 | |
| Amazon.com, Inc.* | | | 31,842 | | | | 60,296,966 | |
| Booking Holdings, Inc.* | | | 7,878 | | | | 14,768,965 | |
| Carnival Corp. | | | 231,991 | | | | 10,799,181 | |
| Garrett Motion, Inc. (Switzerland)* | | | 23,988 | | | | 368,216 | |
| Home Depot, Inc. (The) | | | 73,353 | | | | 15,255,223 | |
| JD.com, Inc. (China) ADR* | | | 466,788 | | | | 14,139,009 | |
| Marriott International, Inc. - Class A | | | 50,834 | | | | 7,131,502 | |
| McDonald’s Corp. | | | 186,095 | | | | 38,644,488 | |
| Starbucks Corp. | | | 227,521 | | | | 19,073,085 | |
| TJX Cos, Inc. (The) | | | 646,278 | | | | 34,175,181 | |
| Yum China Holdings, Inc. (China) | | | 362,791 | | | | 16,760,944 | |
| | | | | | | | 248,686,493 | |
| | | | | | | | | |
| Financials — 13.2% | | | | | | | | |
| American Express Co. | | | 94,758 | | | | 11,696,928 | |
| Berkshire Hathaway, Inc. - Class B* | | | 260,086 | | | | 55,442,533 | |
| CME Group, Inc. | | | 182,926 | | | | 35,507,766 | |
| Goldman Sachs Group, Inc. (The) | | | 108,370 | | | | 22,172,502 | |
| JPMorgan Chase & Co. | | | 325,000 | | | | 36,335,000 | |
| PNC Financial Services Group, Inc. (The) | | | 262,000 | | | | 35,967,360 | |
| S&P Global, Inc. | | | 61,119 | | | | 13,922,297 | |
| Signature Bank/NewYork NY | | | 140,934 | | | | 17,030,465 | |
| | | | | | | | 228,074,851 | |
| | | | | | | | | |
| Health Care — 12.2% | | | | | | | | |
| Alcon, Inc. (Switzerland)* | | | 38,333 | | | | 2,378,563 | |
| AmerisourceBergen Corp. | | | 312,267 | | | | 26,623,884 | |
| Amgen, Inc. | | | 91,644 | | | | 16,888,156 | |
| Becton Dickinson and Co. | | | 82,860 | | | | 20,881,549 | |
| Biogen, Inc.* | | | 54,698 | | | | 12,792,221 | |
| Bristol-Myers Squibb Co. | | | 371,691 | | | | 16,856,187 | |
| Johnson & Johnson | | | 100,337 | | | | 13,974,937 | |
| Merck & Co., Inc. | | | 356,127 | | | | 29,861,249 | |
| Novartis AG (Switzerland) ADR | | | 191,666 | | | | 17,501,022 | |
| Stryker Corp. | | | 48,156 | | | | 9,899,910 | |
| UnitedHealth Group, Inc. | | | 106,499 | | | | 25,986,821 | |
| Zoetis, Inc. | | | 155,835 | | | | 17,685,714 | |
| | | | | | | | 211,330,213 | |
| | | | | | | | | |
| Communication Services — 11.0% | | | | | | | | |
| Alphabet, Inc. - Class C* | | | 57,000 | | | | 61,611,870 | |
| AT&T, Inc. | | | 140,021 | | | | 4,692,104 | |
| Baidu, Inc. (China) ADR* | | | 106,623 | | | | 12,513,275 | |
| Comcast Corp. - Class A | | | 947,256 | | | | 40,049,984 | |
| Facebook, Inc. - Class A* | | | 270,892 | | | | 52,282,156 | |
| Verizon Communications, Inc. | | | 327,594 | | | | 18,715,445 | |
| | | | | | | | 189,864,834 | |
| | | | | | | | | |
| Industrials — 7.7% | | | | | | | | |
| Boeing Co. (The) | | | 43,983 | | | | 16,010,252 | |
| Canadian National Railway Co. (Canada) | | | 217,247 | | | | 20,091,003 | |
| Deere & Co. | | | 123,002 | | | | 20,382,661 | |
| FedEx Corp. | | | 19,742 | | | | 3,241,439 | |
| Honeywell International, Inc. | | | 137,162 | | | | 23,947,114 | |
| Resideo Technologies, Inc.* | | | 39,981 | | | | 876,384 | |
| United Technologies Corp. | | | 208,281 | | | | 27,118,186 | |
| Verisk Analytics, Inc. | | | 148,725 | | | | 21,782,264 | |
| | | | | | | | 133,449,303 | |
| | | | | | | | | |
| Consumer Staples — 6.7% | | | | | | | | |
| Estee Lauder Cos., Inc. (The) - Class A | | | 120,785 | | | | 22,116,941 | |
| Kraft Heinz Co. (The) | | | 183,288 | | | | 5,689,260 | |
| Monster Beverage Corp.* | | | 170,309 | | | | 10,870,823 | |
| PepsiCo, Inc. | | | 116,115 | | | | 15,226,160 | |
| Philip Morris International, Inc. | | | 275,000 | | | | 21,595,750 | |
| Procter & Gamble Co. (The) | | | 173,277 | | | | 18,999,823 | |
| Unilever NV (United Kingdom) | | | 370,454 | | | | 22,493,967 | |
| | | | | | | | 116,992,724 | |
| | | | | | | | | |
| Energy — 3.8% | | | | | | | | |
| Chevron Corp. | | | 172,149 | | | | 21,422,222 | |
| Exxon Mobil Corp. | | | 455,000 | | | | 34,866,650 | |
| Schlumberger Ltd. | | | 248,127 | | | | 9,860,567 | |
| | | | | | | | 66,149,439 | |
| | | | | | | | | |
| Real Estate — 2.3% | | | | | | | | |
| Jones Lang LaSalle, Inc. | | | 162,650 | | | | 22,883,229 | |
| Simon Property Group, Inc. REIT | | | 108,196 | | | | 17,285,393 | |
| | | | | | | | 40,168,622 | |
| | | | | | | | | |
| Materials — 0.8% | | | | | | | | |
| Corteva, Inc.* | | | 90,104 | | | | 2,664,375 | |
| Dow, Inc. | | | 90,104 | | | | 4,443,028 | |
| DuPont de Nemours, Inc. | | | 90,104 | | | | 6,764,107 | |
| | | | | | | | 13,871,510 | |
| Total Common Stocks | | | | | | $ | 1,637,669,081 | |
| | | | | | | | | |
| Exchange-Traded Funds — 5.2% | | | | | | | | |
| SPDR S&P 500 ETF Trust | | | 230,000 | | | | 67,390,000 | |
| Utilities Select Sector SPDR Fund | | | 385,000 | | | | 22,957,550 | |
| Total Exchange-Traded Funds | | | | | | $ | 90,347,550 | |
Touchstone Large Cap Focused Fund (Continued)
| | | | | | Market | |
| | | Shares | | | Value | |
| | | | | | | |
| Short-Term Investment Fund — 0.3% | | | | | | | | |
| Dreyfus Government Cash Management, Institutional Shares, 2.25%∞Ω | | | 5,066,322 | | | $ | 5,066,322 | |
| | | | | | | | | |
| Total Investment Securities —100.1% | | | | | | | | |
| (Cost $847,337,987) | | | | | | $ | 1,733,082,953 | |
| | | | | | | | | |
| Liabilities in Excess of Other Assets — (0.1%) | | | | | | | (1,144,327 | ) |
| | | | | | | | | |
| Net Assets — 100.0% | | | | | | $ | 1,731,938,626 | |
| * | Non-income producing security. |
| Ω | Represents the 7-day SEC yield as of June 30, 2019. |
Portfolio Abbreviations:
ADR - American Depositary Receipt
ETF - Exchange-Traded Fund
PLC - Public Limited Company
REIT - Real Estate Investment Trust
SPDR - Standard & Poor’s Depositary Receipt
Other Information:
The inputs or methodology used for valuing securities may not be an indication of the risk associated with investing in those securities. For more information on valuation inputs, and their aggregation into the levels used in the table below, please refer to the security valuation section in the accompanying Notes to Financial Statements.
Valuation inputs at Reporting Date:
| Description | | Level 1 | | | Level 2 | | | Level 3 | | | Total | |
| | | | | | | | | | | | | | | | | |
| Common Stocks | | $ | 1,637,669,081 | | | $ | — | | | $ | — | | | $ | 1,637,669,081 | |
| Exchange-Traded Funds | | | 90,347,550 | | | | — | | | | — | | | | 90,347,550 | |
| Short-Term Investment Fund | | | 5,066,322 | | | | — | | | | — | | | | 5,066,322 | |
| Total | | $ | 1,733,082,953 | | | $ | — | | | $ | — | | | $ | 1,733,082,953 | |
See accompanying Notes to Financial Statements.
Portfolio of Investments
Touchstone Large Cap Fund – June 30, 2019
| | | | | | Market | |
| | | Shares | | | Value | |
| | | | | | | |
| Common Stocks — 97.3% | | | | | | | | |
| | | | | | | | | |
| Financials — 22.4% | | | | | | | | |
| Alleghany Corp.* | | | 13,809 | | | $ | 9,405,448 | |
| Berkshire Hathaway, Inc. - Class B* | | | 96,322 | | | | 20,532,961 | |
| BlackRock, Inc. | | | 21,728 | | | | 10,196,950 | |
| Charles Schwab Corp. (The) | | | 162,845 | | | | 6,544,741 | |
| Progressive Corp. (The) | | | 120,904 | | | | 9,663,857 | |
| Wells Fargo & Co. | | | 158,601 | | | | 7,504,999 | |
| | | | | | | | 63,848,956 | |
| | | | | | | | | |
| Consumer Discretionary — 20.4% | | | | | | | | |
| CarMax, Inc.* | | | 152,232 | | | | 13,218,305 | |
| Carnival Corp. | | | 184,346 | | | | 8,581,306 | |
| Dollar Tree, Inc.* | | | 125,893 | | | | 13,519,649 | |
| Home Depot, Inc. (The) | | | 45,662 | | | | 9,496,326 | |
| Lowe’s Cos., Inc. | | | 39,535 | | | | 3,989,477 | |
| O’Reilly Automotive, Inc.* | | | 24,574 | | | | 9,075,670 | |
| | | | | | | | 57,880,733 | |
| | | | | | | | | |
| Information Technology — 13.2% | | | | | | | | |
| Apple, Inc. | | | 80,041 | | | | 15,841,715 | |
| Cisco Systems, Inc. | | | 181,179 | | | | 9,915,927 | |
| Visa, Inc. - Class A | | | 68,453 | | | | 11,880,018 | |
| | | | | | | | 37,637,660 | |
| | | | | | | | | |
| Industrials — 12.1% | | | | | | | | |
| FedEx Corp. | | | 54,814 | | | | 8,999,911 | |
| General Dynamics Corp. | | | 39,797 | | | | 7,235,890 | |
| Norfolk Southern Corp. | | | 54,437 | | | | 10,850,927 | |
| Southwest Airlines Co. | | | 143,715 | | | | 7,297,848 | |
| | | | | | | | 34,384,576 | |
| | | | | | | | | |
| Communication Services — 9.3% | | | | | | | | |
| Alphabet, Inc. - Class C* | | | 12,510 | | | | 13,522,184 | |
| Fox Corp. - Class A | | | 230,510 | | | | 8,445,886 | |
| Verizon Communications, Inc. | | | 80,438 | | | | 4,595,423 | |
| | | | | | | | 26,563,493 | |
| | | | | | | | | |
| Materials — 7.9% | | | | | | | | |
| Albemarle Corp. | | | 81,219 | | | | 5,718,630 | |
| Martin Marietta Materials, Inc. | | | 40,138 | | | | 9,236,155 | |
| NewMarket Corp. | | | 18,748 | | | | 7,516,823 | |
| | | | | | | | 22,471,608 | |
| | | | | | | | | |
| Consumer Staples — 7.3% | | | | | | | | |
| Altria Group, Inc. | | | 211,258 | | | | 10,003,066 | |
| Nestle SA (Switzerland) ADR | | | 103,446 | | | | 10,696,316 | |
| | | | | | | | 20,699,382 | |
| | | | | | | | | |
| Energy — 3.2% | | | | | | | | |
| Chevron Corp. | | | 72,500 | | | | 9,021,900 | |
| | | | | | | | | |
| Health Care — 1.5% | | | | | | | | |
| Bristol-Myers Squibb Co. | | | 92,862 | | | | 4,211,292 | |
| Total Common Stocks | | | | | | $ | 276,719,600 | |
| | | | | | | | | |
| Short-Term Investment Fund — 2.7% | | | | | | | | |
| Dreyfus Government Cash Management, Institutional Shares, 2.25%∞Ω | | | 7,516,389 | | | $ | 7,516,389 | |
| | | | | | | | | |
| Total Investment Securities —100.0% | | | | | | | | |
| (Cost $221,845,057) | | | | | | $ | 284,235,989 | |
| | | | | | | | | |
| Other Assets in Excess of Liabilities — 0.0% | | | | | | | 63,711 | |
| | | | | | | | | |
| Net Assets — 100.0% | | | | | | $ | 284,299,700 | |
| * | Non-income producing security. |
| Ω | Represents the 7-day SEC yield as of June 30, 2019. |
Portfolio Abbreviations:
ADR - American Depositary Receipt
Other Information:
The inputs or methodology used for valuing securities may not be an indication of the risk associated with investing in those securities. For more information on valuation inputs, and their aggregation into the levels used in the table below, please refer to the security valuation section in the accompanying Notes to Financial Statements.
Valuation inputs at Reporting Date:
| Description | | Level 1 | | | Level 2 | | | Level 3 | | | Total | |
| Common Stocks | | $ | 276,719,600 | | | $ | — | | | $ | — | | | $ | 276,719,600 | |
| Short-Term Investment Fund | | | 7,516,389 | | | | — | | | | — | | | | 7,516,389 | |
| Total | | $ | 284,235,989 | | | $ | — | | | $ | — | | | $ | 284,235,989 | |
See accompanying Notes to Financial Statements.
Portfolio of Investments
Touchstone Large Company Growth Fund–June 30, 2019
| | | | | | Market | |
| | | Shares | | | Value | |
| | | | | | | | | |
| Common Stocks — 99.7% | | | | | | | | |
| | | | | | | | | |
| Information Technology — 41.0% | | | | | | | | |
| Adobe, Inc.* | | | 59,400 | | | $ | 17,502,210 | |
| Automatic Data Processing, Inc. | | | 62,075 | | | | 10,262,860 | |
| EPAM Systems, Inc.* | | | 22,200 | | | | 3,842,820 | |
| Global Payments, Inc. | | | 31,595 | | | | 5,059,307 | |
| Intuit, Inc. | | | 23,100 | | | | 6,036,723 | |
| Microsoft Corp. | | | 146,600 | | | | 19,638,536 | |
| Palo Alto Networks, Inc.* | | | 28,500 | | | | 5,807,160 | |
| PayPal Holdings, Inc.* | | | 90,875 | | | | 10,401,553 | |
| Visa, Inc. - Class A | | | 80,250 | | | | 13,927,388 | |
| | | | | | | | 92,478,557 | |
| | | | | | | | | |
| Communication Services — 20.0% | | | | | | | | |
| Alphabet, Inc. - Class A* | | | 13,735 | | | | 14,872,258 | |
| Facebook, Inc. - Class A* | | | 65,775 | | | | 12,694,575 | |
| Sirius XM Holdings, Inc. | | | 786,650 | | | | 4,389,507 | |
| Tencent Holdings Ltd. (China) ADR | | | 291,400 | | | | 13,188,764 | |
| | | | | | | | 45,145,104 | |
| | | | | | | | | |
| Consumer Discretionary — 17.4% | | | | | | | | |
| Alibaba Group Holding Ltd.(China) ADR* | | | 82,975 | | | | 14,060,114 | |
| Amazon.com, Inc.* | | | 5,550 | | | | 10,509,646 | |
| Booking Holdings, Inc.* | | | 3,060 | | | | 5,736,613 | |
| Burlington Stores, Inc.* | | | 23,225 | | | | 3,951,734 | |
| Royal Caribbean Cruises Ltd. | | | 41,400 | | | | 5,018,094 | |
| | | | | | | | 39,276,201 | |
| | | | | | | | | |
| Health Care — 15.4% | | | | | | | | |
| Abbott Laboratories | | | 65,700 | | | | 5,525,370 | |
| Becton Dickinson and Co. | | | 28,500 | | | | 7,182,285 | |
| Elanco Animal Health, Inc.* | | | 177,100 | | | | 5,985,980 | |
| Neurocrine Biosciences, Inc.* | | | 26,375 | | | | 2,226,841 | |
| Thermo Fisher Scientific, Inc. | | | 17,100 | | | | 5,021,928 | |
| Zoetis, Inc. | | | 78,000 | | | | 8,852,220 | |
| | | | | | | | 34,794,624 | |
| | | | | | | | | |
| Consumer Staples — 3.8% | | | | | | | | |
| Monster Beverage Corp.* | | | 135,150 | | | | 8,626,624 | |
| | | | | | | | | |
| Financials — 2.1% | | | | | | | | |
| MSCI, Inc. | | | 19,650 | | | | 4,692,223 | |
| Total Common Stocks | | | | | | $ | 225,013,333 | |
| | | | | | | |
| Short-Term Investment Fund — 0.1% | | | | | | | | |
| Dreyfus Government Cash Management, Institutional Shares, 2.25%∞Ω | | | 287,362 | | | $ | 287,362 | |
| | | | | | | | | |
| Total Investment Securities —99.8% | | | | | | | | |
| (Cost $128,979,930) | | | | | | $ | 225,300,695 | |
| | | | | | | | | |
| Other Assets in Excess of Liabilities — 0.2% | | | | | | | 491,398 | |
| | | | | | | | | |
| Net Assets — 100.0% | | | | | | $ | 225,792,093 | |
| * | Non-income producing security. |
| Ω | Represents the 7-day SEC yield as of June 30, 2019. |
Portfolio Abbreviations:
ADR - American Depositary Receipt
Other Information:
The inputs or methodology used for valuing securities may not be an indication of the risk associated with investing in those securities. For more information on valuation inputs, and their aggregation into the levels used in the table below, please refer to the security valuation section in the accompanying Notes to Financial Statements.
Valuation inputs at Reporting Date:
| Description | | Level 1 | | | Level 2 | | | Level 3 | | | Total | |
| Common Stocks | | $ | 225,013,333 | | | $ | — | | | $ | — | | | $ | 225,013,333 | |
| Short-term Investment Fund | | | 287,362 | | | | — | | | | — | | | | 287,362 | |
| Total | | $ | 225,300,695 | | | $ | — | | | $ | — | | | $ | 225,300,695 | |
See accompanying Notes to Financial Statements.
Portfolio of Investments
Touchstone Ohio Tax-Free Bond Fund–June 30, 2019
| Principal | | | | | Interest | | | Maturity | | Market | |
| Amount | | | | | Rate | | | Date | | Value | |
| | | | | | | | | | | | |
| | | | | Fixed Rate Revenue Bonds — 69.6% | | | | | | | | | | |
| $ | 500,000 | | | New Albany OH Cmnty Auth (Ref) Ser C | | | 5.000 | % | | 10/01/24 | | $ | 554,500 | |
| | 375,000 | | | Univ of Akron OH (Ref) Ser A | | | 5.000 | | | 01/01/28 | | | 428,873 | |
| | 650,000 | | | Montgomery Co OH Rev (Unrefunded Catholic Hlth Initiatives) | | | 5.250 | | | 05/01/29 | | | 749,840 | |
| | 750,000 | | | Cleveland OH Income Tax Rev (Ref Sub Lien) Ser B 2 | | | 5.000 | | | 10/01/29 | | | 888,952 | |
| | 500,000 | | | Hamilton Co OH Hosp Facs Rev (Uc Hlth) | | | 5.000 | | | 02/01/30 | | | 563,325 | |
| | 1,000,000 | | | Butler Co OH Hosp Facs (Ref Cincinnati Children’s Hosp) | | | 5.000 | | | 05/15/30 | | | 1,297,170 | |
| | 1,000,000 | | | Hamilton Co OH Student Rev (Ref Stratford Heights Proj) | | | 5.000 | | | 06/01/30 | | | 1,031,270 | |
| | 200,000 | | | Dayton OH Wtr Sys Rev | | | 4.000 | | | 12/01/30 | | | 225,988 | |
| | 1,000,000 | | | Green OH Cmnty Learning Ctr (Ref) | | | 4.000 | | | 12/01/30 | | | 1,074,650 | |
| | 500,000 | | | Butler Co OH Hosp Facs (Kettering Health Network Oblig) | | | 5.250 | | | 04/01/31 | | | 527,710 | |
| | 1,000,000 | | | Wright OH St Univ (Gen Recpts) Ser A | | | 5.000 | | | 05/01/31 | | | 1,049,150 | |
| | 750,000 | | | Middleburg Heights OH Hosp Rev (Facs Southwest Gen) | | | 5.125 | | | 08/01/31 | | | 799,312 | |
| | 1,000,000 | | | Kent OH St Univ Rev (Gen Recpts) Ser A | | | 4.500 | | | 05/01/32 | | | 1,068,860 | |
| | 1,000,000 | | | Hamilton Co OH Hlth Care Facs (Christ Hosp Proj) | | | 5.250 | | | 06/01/32 | | | 1,091,350 | |
| | 1,000,000 | | | Cuyahoga Co OH COP (Convention Hotel Proj) | | | 5.000 | | | 12/01/32 | | | 1,124,200 | |
| | 1,060,000 | | | OH St EDR (Enterprise Bd Fd) Ser 7 | | | 4.750 | | | 12/01/32 | | | 1,106,905 | |
| | 500,000 | | | OH St Univ Ser A | | | 4.000 | | | 12/01/32 | | | 544,060 | |
| | 150,000 | | | OH Univ Gen Recpts Athens (Ref) Ser A | | | 5.000 | | | 12/01/32 | | | 180,458 | |
| | 390,000 | | | Port Of Gtr Cincinnati Dev Aut | | | 4.000 | | | 12/01/32 | | | 440,150 | |
| | 265,000 | | | OH St Hgr Edl Fac Commis (Ref Xavier Univ) Ser C | | | 5.000 | | | 05/01/33 | | | 298,917 | |
| | 1,080,000 | | | Hamilton Co OH Hosp Facs Rev (Ref Cincinnati Childrens Hosp) | | | 5.000 | | | 05/15/33 | | | 1,222,106 | |
| | 970,000 | | | Franklin Co OH Sales Tax Rev (Various Purpose) | | | 4.000 | | | 06/01/33 | | | 1,106,285 | |
| | 1,000,000 | | | Hamilton Co OH EDR (Ref King Highland Cmnty Urban) | | | 5.000 | | | 06/01/33 | | | 1,156,770 | |
| | 2,000,000 | | | Cincinnati OH EDR (U Square The Loop Proj) | | | 5.000 | | | 11/01/33 | | | 2,150,640 | |
| | 525,000 | | | OH St Univ Ser A | | | 4.000 | | | 12/01/33 | | | 569,982 | |
| | 265,000 | | | Cleveland OH Wtr Rev (Ref) Ser Y | | | 4.000 | | | 01/01/34 | | | 284,009 | |
| | 500,000 | | | OH St Hgr Edl Fac Commis (Ref Univ Findlay Proj) | | | 5.000 | | | 03/01/34 | | | 561,025 | |
| | 625,000 | | | Hamilton Co OH Hosp Facs Rev (Ref Cincinnati Childrens Hosp) | | | 5.000 | | | 05/15/34 | | | 705,025 | |
| | 500,000 | | | Cuyahoga Co OH Sales Tax Rev (Ref) | | | 5.000 | | | 12/01/34 | | | 579,160 | |
| | 215,000 | | | Miami Co OH Hosp Facs Rev (Ref & Impt Kettering Health Ne) | | | 5.000 | | | 08/01/35 | | | 255,940 | |
| | 570,000 | | | Miami Univ OH (Ref) | | | 5.000 | | | 09/01/35 | | | 675,547 | |
| | 1,085,000 | | | Cincinnati OH Urban Redev Rev (Mercer Commons Phase 2 Proj) Ser B | | | 5.000 | | | 11/01/35 | | | 1,259,446 | |
| | 500,000 | | | Polaris Career Ctr OH COP | | | 5.000 | | | 11/01/35 | | | 582,315 | |
| | 475,000 | | | Cincinnati OH Wtr Sys Rev Ser A | | | 5.000 | | | 12/01/35 | | | 561,849 | |
| | 200,000 | | | Clermont Co OH Port Auth Lease (W Clermont Local Sch Dist Proj) | | | 5.000 | | | 12/01/35 | | | 231,342 | |
| | 290,000 | | | OH St Hgr Edl Fac Commis (University Of Dayton 2018 Pro) Ser A | | | 4.000 | | | 12/01/35 | | | 321,068 | |
| | 500,000 | | | OH St Hgr Edl Fac Commis (Ref Higher Eductnl Fac John Ca) | | | 5.000 | | | 04/01/36 | | | 560,620 | |
| | 550,000 | | | Franklin Co OH Hosp Facs Rev (Ref Nationwide Childrens Hosp) | | | 4.000 | | | 11/01/36 | | | 602,399 | |
| | 1,000,000 | | | OH St Parks & Recreation Cap (Lease Approp Impt Fund Projs S) | | | 5.000 | | | 12/01/36 | | | 1,227,530 | |
| | 500,000 | | | Cleveland OH Arpt Sys Rev (Ser B) | | | 5.000 | | | 01/01/37 | | | 600,950 | |
| | 1,000,000 | | | Univ Of Cincinnati OH Recpts (Ref ) Ser A | | | 5.000 | | | 06/01/37 | | | 1,209,960 | |
| | 250,000 | | | OH St Hgr Edl Fac Commis (Denison Univ Proj) | | | 5.000 | | | 11/01/39 | | | 307,418 | |
| | 1,000,000 | | | OH St Hosp Fac Rev (Cleveland Clinic Hlth Sys Obli) | | | 4.000 | | | 01/01/40 | | | 1,099,230 | |
| | | | | Total Fixed Rate Revenue Bonds | | | | | | | | $ | 32,876,256 | |
| | | | | | | | | | | | | | | |
| | | | | General Obligation Bonds — 21.6% | | | | | | | | | | |
| | 840,000 | | | Licking Heights OH LSD UTGO | | | 6.400 | | | 12/01/28 | | | 1,060,416 | |
| | 1,000,000 | | | Toledo OH CSD (Ref Sch Facs Impt) UTGO | | | 5.000 | | | 12/01/32 | | | 1,129,800 | |
| | 300,000 | | | Upper Arlington OH (Ref Various Purpose) LTGO | | | 4.000 | | | 12/01/32 | | | 330,414 | |
| | 345,000 | | | Bowling Green OH CSD (Ref) UTGO | | | 5.000 | | | 12/01/34 | | | 401,035 | |
| | 700,000 | | | Miami Vly Career Tech Center O UTGO | | | 4.000 | | | 12/01/34 | | | 785,939 | |
| | 500,000 | | | Three Rivers OH LSD (Ref) UTGO | | | 5.000 | | | 12/01/34 | | | 576,380 | |
Touchstone Ohio Tax-Free Bond Fund(Continued)
| Principal | | | | | Interest | | | Maturity | | Market | |
| Amount | | | | | Rate | | | Date | | Value | |
| | | | | | | | | | | | |
| | | | | General Obligation Bonds — 21.6% (Continued) | | | | | | | | | | |
| $ | 500,000 | | | Dublin OH (Ser A) LTGO | | | 5.000 | % | | 12/01/35 | | $ | 621,670 | |
| | 435,000 | | | Miami Trace OH LSD UTGO | | | 5.000 | | | 12/01/35 | | | 508,815 | |
| | 200,000 | | | Milford OH Exempt Vlg Sch Dist (Ref) UTGO | | | 5.000 | | | 12/01/35 | | | 232,784 | |
| | 500,000 | | | Lakewood OH (Ref) LTGO | | | 5.000 | | | 12/01/36 | | | 591,595 | |
| | 500,000 | | | Greene Co OH Votech Sch Dist (Sch Facs Construction & Impt) UTGO | | | 4.000 | | | 12/01/37 | | | 558,485 | |
| | 1,000,000 | | | Hamilton Co OH (Ref) LTGO Ser A | | | 5.000 | | | 12/01/37 | | | 1,204,480 | |
| | 1,250,000 | | | Brecksville-Broadview Heights OH CSD (Sch Facs Impt) UTGO | | | 5.000 | | | 12/01/38 | | | 1,408,862 | |
| | 300,000 | | | Lexington OH LSD (Ser A) UTGO | | | 4.000 | | | 10/01/39 | | | 331,890 | |
| | 400,000 | | | Athens OH CSD (Ser A) UTGO | | | 4.000 | | | 12/01/40 | | | 443,400 | |
| | | | | Total General Obligation Bonds | | | | | | | | $ | 10,185,965 | |
| | | | | | | | | | | | | | | |
| | | | | Pre-refunded/Escrowed to Maturity(A) — 8.5% | | | | | | | | | | |
| | 350,000 | | | Montgomery Co OH Rev (Prerefunded Catholic Hlth Initiatives) Pre-refunded @ $100 | | | 5.250 | | | 05/01/29 | | | 402,367 | |
| | 345,000 | | | Univ of Toledo OH Ser B Pre-refunded @ $100 | | | 5.000 | | | 06/01/29 | | | 369,319 | |
| | 500,000 | | | Franklin Co OH Hosp Rev (Nationwide Childrens Hosp Impt) Pre-refunded @ $100 | | | 4.750 | | | 11/01/29 | | | 505,495 | |
| | 895,000 | | | Milton Union OH Exempt Vlg Sch Dist (Sch Impt) Pre-refunded @ $100 | | | 4.875 | | | 12/01/29 | | | 907,969 | |
| | 1,500,000 | | | Cincinnati OH CSD (Ref Sch Impt) LTGO Pre-refunded @ $100 | | | 5.000 | | | 06/01/31 | | | 1,550,940 | |
| | 250,000 | | | Lakewood OH CSD (Sch Facs Impt) UTGO Ser A Pre-refunded @ $100 | | | 5.000 | | | 11/01/33 | | | 280,310 | |
| | | | | Total Pre-refunded/Escrowed to Maturity | | | | | | | | $ | 4,016,400 | |
| | | | | | | | | | | | | | | |
| | | | | Variable Rate Demand Notes(B)(C) — 0.2% | | | | | | | | | | |
| | | | | | | | | | | | | | | |
| | 100,000 | | | OH St Hgr Edl Fac Commis (Variable Cleveland Clinic Hosp) Ser B 3 (LIQ: U.S. Bank N.A.)(D) | | | 1.340 | | | 01/01/39 | | $ | 100,000 | |
| | | | | | | | | | | | | | | |
| | | | | Total Investment Securities —99.9% | | | | | | | | | | |
| | | | | (Cost $44,363,092) | | | | | | | | $ | 47,178,621 | |
| | | | | | | | | | | | | | | |
| | | | | Other Assets in Excess of Liabilities — 0.1% | | | | | | | | | 36,003 | |
| | | | | | | | | | | | | | | |
| | | | | Net Assets — 100.0% | | | | | | | | $ | 47,214,624 | |
| (A) | Bonds denoted as pre-refunded are anticipated to be redeemed prior to their scheduled maturity. The dates indicated are the stipulated pre-refunded dates. |
| (B) | Floating and variable rate demand notes (“put bonds”) earn interest at a coupon rate which fluctuates at specified intervals, usually daily, monthly or semi-annually. The interest rates shown are the coupon rates in effect at June 30, 2019. Put bonds may be redeemed at the discretion of the holder on specified dates prior to maturity. Mandatory put bonds are automatically redeemed at a specified put date unless action is taken by the holder to prevent redemption. |
| (C) | Demand Feature - Maturities shown are the final maturities, not the date on which principal could be recovered through the demand feature. |
| (D) | Certain variable rate securities are not based on a published reference rate and spread but are determined by the issuer or agent and are based on current market conditions. These securities do not indicate a reference rate and spread in their description. |
Touchstone Ohio Tax-Free Bond Fund (Continued)
As of June 30, 2019, the Touchstone Ohio Tax-Free Bond Fund was invested exclusively in debt obligations issued by the State of Ohio and its political subdivisions, agencies, authorities and instrumentalities and by other issuers, the interest from which is exempt from Ohio personal income tax. The Touchstone Ohio Tax-Free Bond Fund is a non-diversified Fund under the Investment Company Act of 1940. Thus, the Fund may invest in fewer issuers than those of a diversified fund. As of June 30, 2019, there were no investments of 10% or greater in any one issuer held by the Fund.
Portfolio Abbreviations:
COP - Certificates of Participation
CSD - City School District
EDR - Economic Development Revenue
��
LIQ - Liquidity Agreement
LSD - Local School District
LTGO - Limited Tax General Obligation
UTGO - Unlimited Tax General Obligation
Other Information:
The inputs or methodology used for valuing securities may not be an indication of the risk associated with investing in those securities. For more information on valuation inputs, and their aggregation into the levels used in the table below, please refer to the security valuation section in the accompanying Notes to Financial Statements.
Valuation inputs at Reporting Date:
| Description | | Level 1 | | | Level 2 | | | Level 3 | | | Total | |
| Municipal Bonds | | $ | — | | | $ | 47,178,621 | | | $ | — | | | $ | 47,178,621 | |
See accompanying Notes to Financial Statements.
Portfolio of Investments
Touchstone Small Company Fund– June 30, 2019
| | | | | | Market | |
| | | Shares | | | Value | |
| | | | | | | | | |
| Common Stocks — 97.2% | | | | | | | | |
| | | | | | | | | |
| Industrials — 23.0% | | | | | | | | |
| Applied Industrial Technologies, Inc. | | | 226,000 | | | $ | 13,905,780 | |
| ASGN, Inc.* | | | 118,723 | | | | 7,194,614 | |
| Clean Harbors, Inc.* | | | 190,794 | | | | 13,565,453 | |
| Crane Co. | | | 164,752 | | | | 13,746,907 | |
| Curtiss-Wright Corp. | | | 110,700 | | | | 14,073,291 | |
| EnerSys, Inc. | | | 341,734 | | | | 23,408,779 | |
| Hillenbrand, Inc. | | | 342,112 | | | | 13,537,372 | |
| ITT, Inc. | | | 378,544 | | | | 24,787,061 | |
| Mobile Mini, Inc. | | | 443,442 | | | | 13,493,940 | |
| Quanta Services, Inc. | | | 622,445 | | | | 23,771,175 | |
| Regal Beloit Corp. | | | 165,735 | | | | 13,542,207 | |
| Rexnord Corp.* | | | 463,220 | | | | 13,998,508 | |
| SkyWest, Inc. | | | 370,301 | | | | 22,466,162 | |
| Watts Water Technologies, Inc. - Class A | | | 151,300 | | | | 14,098,134 | |
| WESCO International, Inc.* | | | 255,236 | | | | 12,927,703 | |
| Woodward, Inc. | | | 117,918 | | | | 13,343,601 | |
| | | | | | | | 251,860,687 | |
| | | | | | | | | |
| Health Care — 21.3% | | | | | | | | |
| Allscripts Healthcare Solutions, Inc.* | | | 1,259,349 | | | | 14,646,229 | |
| AngioDynamics, Inc.* | | | 617,720 | | | | 12,162,907 | |
| Bio-Rad Laboratories, Inc. - Class A* | | | 40,164 | | | | 12,554,865 | |
| Bio-Techne Corp. | | | 62,576 | | | | 13,046,470 | |
| Chemed Corp. | | | 37,828 | | | | 13,649,856 | |
| Encompass Health Corp. | | | 219,400 | | | | 13,901,184 | |
| Globus Medical, Inc. - Class A* | | | 542,251 | | | | 22,937,217 | |
| Haemonetics Corp.* | | | 115,048 | | | | 13,844,876 | |
| Inogen, Inc.* | | | 164,350 | | | | 10,972,006 | |
| Integra LifeSciences Holdings Corp.* | | | 264,259 | | | | 14,758,865 | |
| NuVasive, Inc.* | | | 230,230 | | | | 13,477,664 | |
| Omnicell, Inc.* | | | 155,242 | | | | 13,355,469 | |
| Orthofix Medical, Inc.* | | | 250,785 | | | | 13,261,511 | |
| Premier, Inc. - Class A* | | | 360,650 | | | | 14,105,021 | |
| Providence Service Corp. (The)* | | | 208,744 | | | | 11,969,381 | |
| Tactile Systems Technology, Inc.* | | | 240,535 | | | | 13,691,252 | |
| Vericel Corp.* | | | 583,500 | | | | 11,022,315 | |
| | | | | | | | 233,357,088 | |
| | | | | | | | | |
| Information Technology — 19.8% | | | | | | | | |
| 8x8, Inc.* | | | 560,461 | | | | 13,507,110 | |
| Aspen Technology, Inc.* | | | 104,806 | | | | 13,025,290 | |
| Avaya Holdings Corp.* | | | 1,254,507 | | | | 14,941,178 | |
| Bottomline Technologies de, Inc.* | | | 300,249 | | | | 13,283,016 | |
| Carbonite, Inc.* | | | 521,395 | | | | 13,577,126 | |
| Envestnet, Inc.* | | | 189,200 | | | | 12,935,604 | |
| ExlService Holdings, Inc.* | | | 100,624 | | | | 6,654,265 | |
| j2 Global, Inc. | | | 247,619 | | | | 22,010,853 | |
| KBR, Inc. | | | 268,856 | | | | 6,705,269 | |
| MAXIMUS, Inc. | | | 176,601 | | | | 12,810,637 | |
| Nice Ltd. ADR (Israel)* | | | 92,520 | | | | 12,675,240 | |
| Nuance Communications, Inc.* | | | 818,218 | | | | 13,066,941 | |
| Plantronics, Inc. | | | 298,017 | | | | 11,038,550 | |
| Qualys, Inc.* | | | 74,687 | | | | 6,503,744 | |
| Rogers Corp.* | | | 48,300 | | | | 8,335,614 | |
| Rudolph Technologies, Inc.* | | | 362,356 | | | | 10,011,896 | |
| Tower Semiconductor Ltd. (Israel)* | | | 398,103 | | | | 6,278,084 | |
| Verint Systems, Inc.* | | | 359,177 | | | | 19,316,539 | |
| | | | | | | | 216,676,956 | |
| | | | | | | | | |
| Consumer Discretionary — 19.2% | | | | | | | | |
| Aaron’s, Inc. | | | 226,826 | | | | 13,929,385 | |
| Adtalem Global Education, Inc.* | | | 313,416 | | | | 14,119,391 | |
| BJ’s Restaurants, Inc. | | | 314,900 | | | | 13,836,706 | |
| Bloomin’ Brands, Inc. | | | 1,139,703 | | | | 21,551,784 | |
| Brunswick Corp. | | | 308,100 | | | | 14,138,709 | |
| Designer Brands, Inc. - Class A | | | 452,771 | | | | 8,679,620 | |
| frontdoor, Inc.* | | | 321,500 | | | | 14,001,325 | |
| G-III Apparel Group Ltd.* | | | 502,100 | | | | 14,771,782 | |
| Movado Group, Inc. | | | 491,500 | | | | 13,270,500 | |
| Oxford Industries, Inc. | | | 180,000 | | | | 13,644,000 | |
| Steven Madden Ltd. | | | 425,600 | | | | 14,449,120 | |
| Stoneridge, Inc.* | | | 440,000 | | | | 13,882,000 | |
| Texas Roadhouse, Inc. | | | 245,659 | | | | 13,184,519 | |
| TopBuild Corp.* | | | 159,826 | | | | 13,227,200 | |
| YETI Holdings, Inc.*† | | | 468,800 | | | | 13,571,760 | |
| | | | | | | | 210,257,801 | |
| | | | | | | | | |
| Financials — 8.6% | | | | | | | | |
| Chemical Financial Corp. | | | 549,486 | | | | 22,589,369 | |
| Glacier Bancorp, Inc. | | | 324,314 | | | | 13,150,933 | |
| Webster Financial Corp. | | | 471,114 | | | | 22,505,116 | |
| Western Alliance Bancorp* | | | 506,896 | | | | 22,668,389 | |
| WSFS Financial Corp. | | | 321,006 | | | | 13,257,548 | |
| | | | | | | | 94,171,355 | |
| | | | | | | | | |
| Communication Services — 3.4% | | | | | | | | |
| Cogent Communications Holdings, Inc. | | | 219,475 | | | | 13,028,036 | |
| QuinStreet, Inc.* | | | 799,500 | | | | 12,672,075 | |
| Yelp, Inc.* | | | 345,200 | | | | 11,798,936 | |
| | | | | | | | 37,499,047 | |
| | | | | | | | | |
| Real Estate — 1.2% | | | | | | | | |
| Corporate Office Properties Trust REIT | | | 481,157 | | | | 12,688,109 | |
| | | | | | | | | |
| Consumer Staples — 0.7% | | | | | | | | |
| Chefs’ Warehouse, Inc. (The)* | | | 202,421 | | | | 7,098,904 | |
| Total Common Stocks | | | | | | $ | 1,063,609,947 | |
| | | | | | | | | |
| Short-Term Investment Funds — 3.9% | | | | | | | | |
| Dreyfus Government Cash Management, Institutional Shares, 2.25%∞Ω | | | 29,952,870 | | | $ | 29,952,870 | |
| Invesco Government & Agency Portfolio, Institutional Class, 2.19%**∞Ω | | | 12,979,203 | | | | 12,979,203 | |
| Total Short-Term Investment Funds | | | | | | $ | 42,932,073 | |
Touchstone Small Company Fund(Continued)
| | | Market | |
| | | Value | |
| | | | |
| Total Investment Securities —101.1% | | | | |
| (Cost $916,282,852) | | $ | 1,106,542,020 | |
| | | | | |
| Liabilities in Excess of Other Assets — (1.1%) | | | (11,666,425 | ) |
| | | | | |
| Net Assets — 100.0% | | $ | 1,094,875,595 | |
| * | Non-income producing security. |
| ** | Represents collateral for securities loaned. |
| † | All or a portion of the security is on loan. The total market value of the securities on loan as of June 30, 2019 was $12,870,562. |
| Ω | Represents the 7-day SEC yield as of June 30, 2019. |
Portfolio Abbreviations:
ADR - American Depositary Receipt
REIT - Real Estate Investment Trust
Other Information:
The inputs or methodology used for valuing securities may not be an indication of the risk associated with investing in those securities. For more information on valuation inputs, and their aggregation into the levels used in the table below, please refer to the security valuation section in the accompanying Notes to Financial Statements.
Valuation inputs at Reporting Date:
| Description | | Level 1 | | | Level 2 | | | Level 3 | | | Total | |
| | | | | | | | | | | | | | | | | |
| Common Stocks | | $ | 1,063,609,947 | | | $ | — | | | $ | — | | | $ | 1,063,609,947 | |
| Short-Term Investment Funds | | | 42,932,073 | | | | — | | | | — | | | | 42,932,073 | |
| Total | | $ | 1,106,542,020 | | | $ | — | | | $ | — | | | $ | 1,106,542,020 | |
See accompanying Notes to Financial Statements.
Portfolio of Investments
Touchstone Value Fund – June 30, 2019
| | | | | | Market | |
| | | Shares | | | Value | |
| | | | | | | |
| Common Stocks — 97.7% | | | | | | | | |
| | | | | | | | | |
| Financials — 18.9% | | | | | | | | |
| American Express Co. | | | 66,431 | | | $ | 8,200,243 | |
| American International Group, Inc. | | | 202,154 | | | | 10,770,765 | |
| Chubb Ltd. (Switzerland) | | | 23,562 | | | | 3,470,447 | |
| JPMorgan Chase & Co. | | | 92,186 | | | | 10,306,395 | |
| New York Community Bancorp, Inc. | | | 261,375 | | | | 2,608,522 | |
| Northern Trust Corp. | | | 64,316 | | | | 5,788,440 | |
| State Street Corp. | | | 98,140 | | | | 5,501,728 | |
| US Bancorp | | | 133,223 | | | | 6,980,885 | |
| Wells Fargo & Co. | | | 212,464 | | | | 10,053,796 | |
| | | | | | | | 63,681,221 | |
| | | | | | | | | |
| Energy — 13.5% | | | | | | | | |
| BP PLC (United Kingdom) ADR | | | 220,376 | | | | 9,189,679 | |
| Chevron Corp. | | | 42,239 | | | | 5,256,221 | |
| EOG Resources, Inc. | | | 76,246 | | | | 7,103,077 | |
| Hess Corp. | | | 102,351 | | | | 6,506,453 | |
| Phillips 66 | | | 112,472 | | | | 10,520,631 | |
| Schlumberger Ltd. | | | 89,247 | | | | 3,546,676 | |
| Valero Energy Corp. | | | 42,103 | | | | 3,604,438 | |
| | | | | | | | 45,727,175 | |
| | | | | | | | | |
| Information Technology — 12.8% | | | | | | | | |
| Broadcom, Inc. | | | 15,098 | | | | 4,346,110 | |
| Microsoft Corp. | | | 82,495 | | | | 11,051,030 | |
| Oracle Corp. | | | 192,927 | | | | 10,991,051 | |
| QUALCOMM, Inc. | | | 135,383 | | | | 10,298,585 | |
| Texas Instruments, Inc. | | | 56,149 | | | | 6,443,659 | |
| | | | | | | | 43,130,435 | |
| | | | | | | | | |
| Consumer Discretionary — 12.0% | | | | | | | | |
| Advance Auto Parts, Inc. | | | 51,319 | | | | 7,910,311 | |
| Aramark | | | 245,451 | | | | 8,850,963 | |
| Dollar General Corp. | | | 92,298 | | | | 12,474,998 | |
| Lowe’s Cos., Inc. | | | 112,700 | | | | 11,372,557 | |
| | | | | | | | 40,608,829 | |
| | | | | | | | | |
| Health Care — 11.4% | | | | | | | | |
| Anthem, Inc. | | | 26,394 | | | | 7,448,651 | |
| Cigna Corp. | | | 13,674 | | | | 2,154,339 | |
| CVS Health Corp. | | | 130,184 | | | | 7,093,726 | |
| Medtronic PLC (Ireland) | | | 114,288 | | | | 11,130,508 | |
| Sanofi (France) ADR | | | 150,785 | | | | 6,524,467 | |
| UnitedHealth Group, Inc. | | | 17,411 | | | | 4,248,458 | |
| | | | | | | | 38,600,149 | |
| | | | | | | | | |
| Industrials — 11.4% | | | | | | | | |
| General Dynamics Corp. | | | 16,123 | | | | 2,931,484 | |
| General Electric Co. | | | 726,435 | | | | 7,627,567 | |
| Jacobs Engineering Group, Inc. | | | 50,549 | | | | 4,265,830 | |
| Johnson Controls International PLC | | | 243,380 | | | | 10,054,028 | |
| United Technologies Corp. | | | 64,291 | | | | 8,370,688 | |
| Wabtec Corp. | | | 73,872 | | | | 5,301,055 | |
| | | | | | | | 38,550,652 | |
| | | | | | | |
| Materials — 7.7% | | | | | | | | |
| Air Products & Chemicals, Inc. | | | 63,621 | | | | 14,401,886 | |
| Corteva, Inc.* | | | 86,187 | | | | 2,548,550 | |
| Dow, Inc. | | | 50,415 | | | | 2,485,964 | |
| DuPont de Nemours, Inc. | | | 86,187 | | | | 6,470,058 | |
| | | | | | | | 25,906,458 | |
| | | | | | | | | |
| Utilities — 4.3% | | | | | | | | |
| Dominion Energy, Inc. | | | 123,161 | | | | 9,522,809 | |
| Exelon Corp. | | | 105,941 | | | | 5,078,812 | |
| | | | | | | | 14,601,621 | |
| | | | | | | | | |
| Communication Services — 3.8% | | | | | | | | |
| Comcast Corp. - Class A | | | 304,026 | | | | 12,854,219 | |
| | | | | | | | | |
| Consumer Staples — 1.9% | | | | | | | | |
| Philip Morris International, Inc. | | | 81,715 | | | | 6,417,079 | |
| Total Common Stocks | | | | | | $ | 330,077,838 | |
| | | | | | | | | |
| Short-Term Investment Fund — 2.1% | | | | | | | | |
| Dreyfus Government Cash Management, Institutional Shares, 2.25%∞Ω | | | 7,147,310 | | | $ | 7,147,310 | |
| | | | | | | | | |
| Total Investment Securities —99.8% | | | | | | | | |
| (Cost $281,126,754) | | | | | | $ | 337,225,148 | |
| | | | | | | | | |
| Other Assets in Excess of Liabilities — 0.2% | | | | | | | 528,099 | |
| | | | | | | | | |
| Net Assets — 100.0% | | | | | | $ | 337,753,247 | |
| * | Non-income producing security. |
| Ω | Represents the 7-day SEC yield as of June 30, 2019. |
Portfolio Abbreviations:
ADR - American Depositary Receipt
PLC - Public Limited Company
Touchstone Value Fund (Continued)
Other Information:
The inputs or methodology used for valuing securities may not be an indication of the risk associated with investing in those securities. For more information on valuation inputs, and their aggregation into the levels used in the table below, please refer to the security valuation section in the accompanying Notes to Financial Statements.
Valuation inputs at Reporting Date:
| Description | | Level 1 | | | Level 2 | | | Level 3 | | | Total | |
| Common Stocks | | $ | 330,077,838 | | | $ | — | | | $ | — | | | $ | 330,077,838 | |
| Short-Term Investment Fund | | | 7,147,310 | | | | — | | | | — | | | | 7,147,310 | |
| Total | | $ | 337,225,148 | | | $ | — | | | $ | — | | | $ | 337,225,148 | |
See accompanying Notes to Financial Statements.
This page intentionally left blank.
Statements of Assets and Liabilities
June 30, 2019
| | | | | | | | | | | | Touchstone | |
| | | | | | Touchstone | | | Touchstone | | | International | |
| | | Touchstone | | | Credit | | | International | | | Growth | |
| | | Balanced | | | Opportunities | | | Equity | | | Opportunities | |
| | | Fund | | | Fund | | | Fund | | | Fund | |
| | | | | | | | | | | | | | | | | |
| Assets | | | | | | | | | | | | | | | | |
| Investments, at cost | | $ | 200,219,913 | | | $ | 60,603,101 | | | $ | 146,241,069 | | | $ | 27,883,935 | |
| Investments, at market value(A) | | $ | 338,368,186 | | | $ | 60,928,824 | | | $ | 154,648,734 | | | $ | 35,158,150 | |
| Cash | | | 341 | | | | 12,643 | | | | 28 | | | | 15 | |
| Foreign currency(B) | | | — | | | | 23,963 | | | | 58,211 | | | | 19,586 | |
| Dividends and interest receivable | | | 775,615 | | | | 763,823 | | | | 458,670 | | | | 21,301 | |
| Receivable for capital shares sold | | | 754,904 | | | | 54,026 | | | | 354,312 | | | | 83 | |
| Receivable for investments sold | | | 988,550 | | | | 1,191,688 | | | | — | | | | — | |
| Receivable for securities lending income | | | 8 | | | | 2,740 | | | | 238 | | | | 2,882 | |
| Tax reclaim receivable | | | 1,053 | | | | — | | | | 384,736 | | | | 6,925 | |
| Other assets | | | 17,988 | | | | 6,886 | | | | 17,306 | | | | 7,792 | |
| Total Assets | | | 340,906,645 | | | | 62,984,593 | | | | 155,922,235 | | | | 35,216,734 | |
| | | | | | | | | | | | | | | | | |
| Liabilities | | | | | | | | | | | | | | | | |
| Written options, at market value(C) | | | — | | | | 1,280 | | | | — | | | | — | |
| Securities sold short(D) | | | — | | | | 590,750 | | | | — | | | | — | |
| Interest payable on securities sold short | | | — | | | | 15,505 | | | | — | | | | — | |
| Bank overdrafts | | | — | | | | — | | | | — | | | | — | |
| Due to prime broker | | | — | | | | 213,827 | | | | — | | | | — | |
| Dividends payable | | | — | | | | — | | | | — | | | | — | |
| Payable for return of collateral for securities on loan | | | — | | | | 1,399,650 | | | | 114,450 | | | | 411,312 | |
| Payable for capital shares redeemed | | | 227,329 | | | | 84,103 | | | | 154,155 | | | | 15,587 | |
| Payable for investments purchased | | | 1,212,646 | | | | 1,345,168 | | | | — | | | | — | |
| Payable to Investment Advisor | | | 144,595 | | | | 4,630 | | | | 90,018 | | | | 3,796 | |
| Payable to other affiliates | | | 91,100 | | | | 345 | | | | 40,345 | | | | 345 | |
| Payable to Trustees | | | 8,524 | | | | 8,524 | | | | 8,524 | | | | 8,524 | |
| Payable to Transfer Agent | | | 111,889 | | | | 3,848 | | | | 80,909 | | | | 3,942 | |
| Payable for reports to shareholders | | | 8,812 | | | | 5,979 | | | | 13,578 | | | | 6,244 | |
| Payable for professional services | | | 32,741 | | | | 42,333 | | | | 38,891 | | | | 36,729 | |
| Other accrued expenses and liabilities | | | 13,907 | | | | 28,555 | | | | 17,191 | | | | 8,274 | |
| Total Liabilities | | | 1,851,543 | | | | 3,744,497 | | | | 558,061 | | | | 494,753 | |
| Net Assets | | $ | 339,055,102 | | | $ | 59,240,096 | | | $ | 155,364,174 | | | $ | 34,721,981 | |
| | | | | | | | | | | | | | | | | |
| Net assets consist of: | | | | | | | | | | | | | | | | |
| Paid-in capital | | $ | 199,588,536 | | | $ | 58,641,589 | | | $ | 146,120,683 | | | $ | 32,381,304 | |
| Distributable earnings | | | 139,466,566 | | | | 598,507 | | | | 9,243,491 | | | | 2,340,677 | |
| Net Assets | | $ | 339,055,102 | | | $ | 59,240,096 | | | $ | 155,364,174 | | | $ | 34,721,981 | |
| (A) Includes market value of securities on loan of: | | $ | — | | | $ | 1,346,199 | | | $ | 109,109 | | | $ | 390,644 | |
| (B) Cost of foreign currency: | | $ | — | | | $ | 22,323 | | | $ | 58,252 | | | $ | 19,566 | |
| (C) Premiums received for written options: | | $ | — | | | $ | 1,278 | | | $ | — | | | $ | — | |
| (D) Proceeds received for securities sold short: | | $ | — | | | $ | 586,836 | | | $ | — | | | $ | — | |
See accompanying Notes to Financial Statements.
Statements of Assets and Liabilities(Continued)
| Touchstone | | | Touchstone | | | | | | Touchstone | | | Touchstone | | | Touchstone | | | | |
| International | | | Large Cap | | | Touchstone | | | Large Company | | | Ohio Tax-Free | | | Small | | | Touchstone | |
| Small Cap | | | Focused | | | Large Cap | | | Growth | | | Bond | | | Company | | | Value | |
| Fund | | | Fund | | | Fund | | | Fund | | | Fund | | | Fund | | | Fund | |
| | | | | | | | | | | | | | | | | | | | |
| $ | 189,006,455 | | | $ | 847,337,987 | | | $ | 221,845,057 | | | $ | 128,979,930 | | | $ | 44,363,092 | | | $ | 916,282,852 | | | $ | 281,126,754 | |
| $ | 215,362,416 | | | $ | 1,733,082,953 | | | $ | 284,235,989 | | | $ | 225,300,695 | | | $ | 47,178,621 | | | $ | 1,106,542,020 | | | $ | 337,225,148 | |
| | — | | | | 2,019 | | | | — | | | | — | | | | 21,040 | | | | — | | | | — | |
| | 368,307 | | | | — | | | | — | | | | — | | | | — | | | | — | | | | — | |
| | 423,754 | | | | 1,094,065 | | | | 269,383 | | | | 81,268 | | | | 284,911 | | | | 441,097 | | | | 611,077 | |
| | 5,973 | | | | 774,695 | | | | 101,516 | | | | 255,000 | | | | 204,628 | | | | 651,048 | | | | 647,106 | |
| | 1,269,545 | | | | — | | | | — | | | | 360,520 | | | | — | | | | 4,150,761 | | | | — | |
| | 26,418 | | | | 3,366 | | | | — | | | | 191 | | | | — | | | | 2,166 | | | | 227 | |
| | 204,555 | | | | 141,926 | | | | — | | | | 4,088 | | | | — | | | | 8,004 | | | | — | |
| | 16,148 | | | | 34,479 | | | | 11,591 | | | | 14,992 | | | | 5,369 | | | | 31,560 | | | | 13,735 | |
| | 217,677,116 | | | | 1,735,133,503 | | | | 284,618,479 | | | | 226,016,754 | | | | 47,694,569 | | | | 1,111,826,656 | | | | 338,497,293 | |
| | | | | | | | | | | | | | | | | | | | | | | | | | | |
| | — | | | | — | | | | — | | | | — | | | | — | | | | — | | | | — | |
| | — | | | | — | | | | — | | | | — | | | | — | | | | — | | | | — | |
| | — | | | | — | | | | — | | | | — | | | | — | | | | — | | | | — | |
| | — | | | | — | | | | — | | | | — | | | | — | | | | 41 | | | | — | |
| | — | | | | — | | | | — | | | | — | | | | — | | | | — | | | | — | |
| | — | | | | — | | | | — | | | | — | | | | 24,497 | | | | — | | | | — | |
| | 12,761,400 | | | | — | | | | — | | | | — | | | | — | | | | 12,979,203 | | | | — | |
| | 438,233 | | | | 1,466,416 | | | | 34,104 | | | | 7,752 | | | | 47,791 | | | | 2,149,118 | | | | 452,687 | |
| | 2,695,933 | | | | — | | | | — | | | | — | | | | 332,013 | | | | 447,854 | | | | — | |
| | 151,281 | | | | 821,220 | | | | 138,148 | | | | 127,728 | | | | 11,192 | | | | 572,440 | | | | 149,820 | |
| | 24,703 | | | | 318,515 | | | | 4,898 | | | | 15,723 | | | | 7,702 | | | | 188,108 | | | | 8,527 | |
| | 8,524 | | | | 8,524 | | | | 8,524 | | | | 8,524 | | | | 8,524 | | | | 8,524 | | | | 8,524 | |
| | 63,549 | | | | 449,528 | | | | 82,235 | | | | 26,642 | | | | 8,049 | | | | 495,712 | | | | 73,039 | |
| | 14,895 | | | | 29,928 | | | | 15,933 | | | | 7,467 | | | | 6,572 | | | | 47,516 | | | | 16,668 | |
| | 42,086 | | | | 54,034 | | | | 30,052 | | | | 26,381 | | | | 25,715 | | | | 45,303 | | | | 29,617 | |
| | 27,862 | | | | 46,712 | | | | 4,885 | | | | 4,444 | | | | 7,890 | | | | 17,242 | | | | 5,164 | |
| | 16,228,466 | | | | 3,194,877 | | | | 318,779 | | | | 224,661 | | | | 479,945 | | | | 16,951,061 | | | | 744,046 | |
| $ | 201,448,650 | | | $ | 1,731,938,626 | | | $ | 284,299,700 | | | $ | 225,792,093 | | | $ | 47,214,624 | | | $ | 1,094,875,595 | | | $ | 337,753,247 | |
| | | | | | | | | | | | | | | | | | | | | | | | | | | |
| $ | 190,915,558 | | | $ | 788,876,077 | | | $ | 204,998,604 | | | $ | 117,164,399 | | | $ | 44,389,141 | | | $ | 883,465,026 | | | $ | 266,920,461 | |
| | 10,533,092 | | | | 943,062,549 | | | | 79,301,096 | | | | 108,627,694 | | | | 2,825,483 | | | | 211,410,569 | | | | 70,832,786 | |
| $ | 201,448,650 | | | $ | 1,731,938,626 | | | $ | 284,299,700 | | | $ | 225,792,093 | | | $ | 47,214,624 | | | $ | 1,094,875,595 | | | $ | 337,753,247 | |
| $ | 12,229,101 | | | $ | — | | | $ | — | | | $ | — | | | $ | — | | | $ | 12,870,562 | | | $ | — | |
| $ | 368,506 | | | $ | — | | | $ | — | | | $ | — | | | $ | — | | | $ | — | | | $ | — | |
| $ | — | | | $ | — | | | $ | — | | | $ | — | | | $ | — | | | $ | — | | | $ | — | |
| $ | — | | | $ | — | | | $ | — | | | $ | — | | | $ | — | | | $ | — | | | $ | — | |
Statements of Assets and Liabilities(Continued)
| | | | | | | | | | | | Touchstone | |
| | | | | | Touchstone | | | Touchstone | | | International | |
| | | Touchstone | | | Credit | | | International | | | Growth | |
| | | Balanced | | | Opportunities | | | Equity | | | Opportunities | |
| | | Fund | | | Fund | | | Fund | | | Fund | |
| | | | | | | | | | | | | |
| Pricing of Class A Shares | | | | | | | | | | | | | | | | |
| Net assets applicable to Class A shares | | $ | 244,036,890 | | | $ | 225,933 | | | $ | 106,869,803 | | | $ | 760,351 | |
| Shares of beneficial interest outstanding (unlimited number of shares authorized, no par value) | | | 11,003,085 | | | | 22,698 | | | | 6,829,005 | | | | 35,720 | |
| Net asset value price per share* | | $ | 22.18 | | | $ | 9.95 | | | $ | 15.65 | | | $ | 21.29 | |
| Maximum sales charge - Class A shares | | | 5.00 | % | | | 5.00 | % | | | 5.00 | % | | | 5.00 | % |
| Maximum offering price per share (100%/(100%-maximum sales charge) of net asset value adjusted to the nearest cent) - Class A shares | | $ | 23.35 | | | $ | 10.47 | | | $ | 16.47 | | | $ | 22.41 | |
| | | | | | | | | | | | | | | | | |
| Pricing of Class C Shares | | | | | | | | | | | | | | | | |
| Net assets applicable to Class C shares | | $ | 34,379,937 | | | $ | 127,101 | | | $ | 3,782,572 | | | $ | 185,435 | |
| Shares of beneficial interest outstanding (unlimited number of shares authorized, no par value) | | | 1,542,538 | | | | 12,738 | | | | 258,403 | | | | 8,928 | |
| Net asset value and offering price per share** | | $ | 22.29 | | | $ | 9.98 | | | $ | 14.64 | | | $ | 20.77 | |
| | | | | | | | | | | | | | | | | |
| Pricing of Class Y Shares | | | | | | | | | | | | | | | | |
| Net assets applicable to Class Y shares | | $ | 60,638,275 | | | $ | 11,355,992 | | | $ | 42,120,138 | | | $ | 2,340,845 | |
| Shares of beneficial interest outstanding (unlimited number of shares authorized, no par value) | | | 2,754,800 | | | | 1,141,045 | | | | 2,728,283 | | | | 109,449 | |
| Net asset value, offering price and redemption price per share | | $ | 22.01 | | | $ | 9.95 | | | $ | 15.44 | | | $ | 21.39 | |
| | | | | | | | | | | | | | | | | |
| Pricing of Institutional Class Shares | | | | | | | | | | | | | | | | |
| Net assets applicable to Institutional Class shares | | $ | — | | | $ | 47,531,070 | | | $ | 2,591,661 | | | $ | 31,435,350 | |
| Shares of beneficial interest outstanding (unlimited number of shares authorized, no par value) | | | — | | | | 4,775,830 | | | | 168,098 | | | | 1,464,538 | |
| Net asset value, offering price and redemption price per share | | $ | — | | | $ | 9.95 | | | $ | 15.42 | | | $ | 21.46 | |
| | | | | | | | | | | | | | | | | |
| Pricing of Class R6 Shares | | | | | | | | | | | | | | | | |
| Net assets applicable to Class R6 shares | | $ | — | | | $ | — | | | $ | — | | | $ | — | |
| Shares of beneficial interest outstanding (unlimited number of shares authorized, no par value) | | | — | | | | — | | | | — | | | | — | |
| Net asset value, offering price and redemption price per share | | $ | — | | | $ | — | | | $ | — | | | $ | — | |
* There is no sales load on subscriptions of $1 million or more for all funds except for Ohio Tax-Free Bond Fund. There is no sales load on subscriptions of $500,000 or more for Ohio Tax-Free Bond Fund. Redemptions that were part of a $500,000 or $1million or more subscription, as applicable, may be subject to a contingent deferred sales load if redeemed within a one-year period from the date of purchase.
** Redemption price per share varies by length of time shares are held due to the terms of the contingent deferred sales charge.
See accompanying Notes to Financial Statements.
Statements of Assets and Liabilities(Continued)
| Touchstone | | | Touchstone | | | | | | Touchstone | | | Touchstone | | | Touchstone | | | | |
| International | | | Large Cap | | | Touchstone | | | Large Company | | | Ohio Tax-Free | | | Small | | | Touchstone | |
| Small Cap | | | Focused | | | Large Cap | | | Growth | | | Bond | | | Company | | | Value | |
| Fund | | | Fund | | | Fund | | | Fund | | | Fund | | | Fund | | | Fund | |
| | | | | | | | | | | | | | | | | | | | |
| $ | 2,688,382 | | | $ | 1,170,490,488 | | | $ | 4,066,697 | | | $ | 1,424,857 | | | $ | 33,515,013 | | | $ | 589,663,721 | | | $ | 32,963,991 | |
| | | | | | | | | | | | | | | | | | | | | | | | | | | |
| | 177,956 | | | | 26,987,355 | | | | 288,225 | | | | 33,527 | | | | 2,882,114 | | | | 122,188,567 | | | | 3,504,415 | |
| $ | 15.11 | | | $ | 43.37 | | | $ | 14.11 | | | $ | 42.50 | | | $ | 11.63 | | | $ | 4.83 | | | $ | 9.41 | |
| | 5.00 | % | | | 5.00 | % | | | 5.00 | % | | | 5.00 | % | | | 2.00 | % | | | 5.00 | % | | | 5.00 | % |
| | | | | | | | | | | | | | | | | | | | | | | | | | | |
| $ | 15.91 | | | $ | 45.65 | | | $ | 14.85 | | | $ | 44.74 | | | $ | 11.87 | | | $ | 5.08 | | | $ | 9.91 | |
| | | | | | | | | | | | | | | | | | | | | | | | | | | |
| $ | 1,558,764 | | | $ | 47,838,268 | | | $ | 7,371,581 | | | $ | 395,535 | | | $ | 2,755,593 | | | $ | 39,389,933 | | | $ | 3,174,754 | |
| | | | | | | | | | | | | | | | | | | | | | | | | | | |
| | 105,741 | | | | 1,179,330 | | | | 532,085 | | | | 9,526 | | | | 236,605 | | | | 15,627,947 | | | | 338,626 | |
| $ | 14.74 | | | $ | 40.56 | | | $ | 13.85 | | | $ | 41.52 | | | $ | 11.65 | | | $ | 2.52 | | | $ | 9.38 | |
| | | | | | | | | | | | | | | | | | | | | | | | | | | |
| $ | 97,799,057 | | | $ | 413,136,943 | | | $ | 213,650,094 | | | $ | 19,580,281 | | | $ | 3,030,639 | | | $ | 326,020,766 | | | $ | 92,928,339 | |
| | | | | | | | | | | | | | | | | | | | | | | | | | | |
| | 6,330,559 | | | | 9,554,601 | | | | 15,110,860 | | | | 457,274 | | | | 260,419 | | | | 61,154,626 | | | | 9,838,278 | |
| $ | 15.45 | | | $ | 43.24 | | | $ | 14.14 | | | $ | 42.82 | | | $ | 11.64 | | | $ | 5.33 | | | $ | 9.45 | |
| | | | | | | | | | | | | | | | | | | | | | | | | | | |
| $ | 99,402,447 | | | $ | 100,472,927 | | | $ | 59,211,328 | | | $ | 204,391,420 | | | $ | 7,913,379 | | | $ | 2,216,417 | | | $ | 208,686,163 | |
| | 6,396,189 | | | | 2,319,931 | | | | 4,181,638 | | | | 4,758,328 | | | | 679,643 | | | | 416,573 | | | | 22,157,760 | |
| $ | 15.54 | | | $ | 43.31 | | | $ | 14.16 | | | $ | 42.95 | | | $ | 11.64 | | | $ | 5.32 | | | $ | 9.42 | |
| | | | | | | | | | | | | | | | | | | | | | | | | | | |
| $ | — | | | $ | — | | | $ | — | | | $ | — | | | $ | — | | | $ | 137,584,758 | | | $ | — | |
| | | | | | | | | | | | | | | | | | | | | | | | | | | |
| | — | | | | — | | | | — | | | | — | | | | — | | | | 27,769,233 | | | | — | |
| $ | — | | | $ | — | | | $ | — | | | $ | — | | | $ | — | | | $ | 4.95 | | | $ | — | |
Statements of Operations
For the Year Ended June 30, 2019
| | | | | | | | | | | | Touchstone | |
| | | | | | Touchstone | | | Touchstone | | | International | |
| | | Touchstone | | | Credit | | | International | | | Growth | |
| | | Balanced | | | Opportunities | | | Equity | | | Opportunities | |
| | | Fund | | | Fund | | | Fund | | | Fund | |
| Investment Income | | | | | | | | | | | | | | | | |
| Dividends(A) | | $ | 4,643,620 | | | $ | 71,705 | | | $ | 4,096,828 | | | $ | 325,732 | |
| Interest | | | 3,362,878 | | | | 3,657,214 | | | | — | | | | — | |
| Income from securities loaned | | | 196 | | | | 28,941 | | | | 38,730 | | | | 8,379 | |
| Total Investment Income | | | 8,006,694 | | | | 3,757,860 | | | | 4,135,558 | | | | 334,111 | |
| Expenses | | | | | | | | | | | | | | | | |
| Investment advisory fees | | | 1,701,922 | | | | 490,905 | | | | 1,132,809 | | | | 288,306 | |
| Administration fees | | | 464,558 | | | | 77,626 | | | | 234,653 | | | | 52,255 | |
| Compliance fees and expenses | | | 2,471 | | | | 2,471 | | | | 2,471 | | | | 2,471 | |
| Custody fees | | | 26,317 | | | | 39,120 | | | | 36,887 | | | | 16,440 | |
| Professional fees | | | 41,631 | | | | 43,758 | | | | 63,612 | | | | 50,559 | |
| Transfer Agent fees, Class A | | | 193,841 | | | | 317 | | | | 137,548 | | | | 1,295 | |
| Transfer Agent fees, Class C | | | 30,148 | | | | 80 | | | | 9,458 | | | | 369 | |
| Transfer Agent fees, Class Y | | | 47,488 | | | | 6,303 | | | | 45,025 | | | | 3,698 | |
| Transfer Agent fees, Institutional Class | | | — | | | | 81 | | | | 117 | | | | 8,067 | |
| Transfer Agent fees, Class R6 | | | — | | | | — | | | | — | | | | — | |
| Pricing Expense | | | 33,531 | | | | 48,881 | | | | 3,828 | | | | 7,343 | |
| Registration Fees, Class A | | | 21,203 | | | | 4,191 | | | | 21,125 | | | | 15,965 | |
| Registration Fees, Class C | | | 13,590 | | | | 3,477 | | | | 7,073 | | | | 4,763 | |
| Registration Fees, Class Y | | | 15,106 | | | | 7,791 | | | | 17,944 | | | | 10,951 | |
| Registration Fees, Institutional Class | | | — | | | | 3,314 | | | | 3,617 | | | | 5,670 | |
| Registration Fees, Class R6 | | | — | | | | — | | | | — | | | | — | |
| Interest expense on securities sold short | | | — | | | | 55,895 | | | | — | | | | — | |
| Reports to Shareholders, Class A | | | 11,378 | | | | 3,720 | | | | 12,730 | | | | 3,748 | |
| Reports to Shareholders, Class C | | | 8,321 | | | | 3,679 | | | | 6,986 | | | | 3,680 | |
| Reports to Shareholders, Class Y | | | 7,771 | | | | 4,621 | | | | 11,133 | | | | 4,165 | |
| Reports to Shareholders, Institutional Class | | | — | | | | 3,677 | | | | 6,333 | | | | 3,697 | |
| Reports to Shareholders, Class R6 | | | — | | | | — | | | | — | | | | — | |
| Distribution expenses, Class A | | | 582,465 | | | | 351 | | | | 269,697 | | | | 1,833 | |
| Distribution and shareholder servicing expenses, Class C | | | 364,554 | | | | 772 | | | | 51,955 | | | | 2,145 | |
| Trustee fees | | | 15,541 | | | | 16,083 | | | | 15,541 | | | | 16,083 | |
| Other expenses | | | 94,585 | | | | 15,954 | | | | 70,947 | | | | 15,070 | |
| Total Expenses | | | 3,676,421 | | | | 833,067 | | | | 2,161,489 | | | | 518,573 | |
| Fees waived by the Advisor and/or Affiliates(B) | | | (261,732 | ) | | | (173,250 | ) | | | (158,367 | ) | | | (189,802 | ) |
| Net Expenses | | | 3,414,689 | | | | 659,817 | | | | 2,003,122 | | | | 328,771 | |
| Net Investment Income (Loss) | | | 4,592,005 | | | | 3,098,043 | | | | 2,132,436 | | | | 5,340 | |
| Realized and Unrealized Gains (Losses) on Investments | | | | | | | | | | | | | | | | |
| Net realized gains (losses) on investments(C) | | | 11,194,244 | | | | 193,421 | | | | 1,113,278 | | | | (4,915,275 | ) |
| Net realized gains (losses) on foreign currency transactions | | | — | | | | 87 | | | | (125,952 | ) | | | (1,854 | ) |
| Net realized on futures contracts | | | 134,549 | | | | — | | | | — | | | | — | |
| Net realized gains on written options | | | — | | | | 40,637 | | | | — | | | | — | |
| Net realized gains on securities sold short | | | — | | | | 19,186 | | | | — | | | | — | |
| Net realized gains on swap agreements | | | — | | | | 10,278 | | | | — | | | | — | |
| Net change in unrealized appreciation (depreciation) on investments(D)(E) | | | 14,547,961 | | | | 553,543 | | | | (5,813,976 | ) | | | 3,313,116 | |
| Net change in unrealized appreciation (depreciation) on foreign currency transactions | | | — | | | | (7,111 | ) | | | 12,010 | | | | 125 | |
| Net change in unrealized appreciation (depreciation) on securities sold short | | | — | | | | (5,664 | ) | | | — | | | | — | |
| Net change in unrealized appreciation (depreciation) on written options | | | — | | | | 1,416 | | | | — | | | | — | |
| Net Realized and Unrealized Gains (Losses) on Investments | | | 25,876,754 | | | | 805,793 | | | | (4,814,640 | ) | | | (1,603,888 | ) |
| Change in Net Assets Resulting from Operations | | $ | 30,468,759 | | | $ | 3,903,836 | | | $ | (2,682,204 | ) | | $ | (1,598,548 | ) |
| (A)Net of foreign tax withholding of: | | $ | 37,237 | | | $ | — | | | $ | 322,197 | | | $ | 23,043 | |
(B) See Note 4 in Notes to Financial Statements.
(C)For the year ended June 30, 2019, Large Cap Focused Fund, Large Cap Fund, Small Company Fund and the Value Fund had redemptions-in-kind of securities in the amount of $65,726,118, $39,892,784, $2,695,518, and $63,282,300 respectively. Net realized gains (losses) on investments includes the realized gain on the transactions of $57,173,491, $12,036,019, $71,802, and $22,735,531 respectively, which will not be recognized by the Fund for tax purposes.
(D)Includes change in deferred foreign capital gains tax of $11,192 for the International Growth Opportunities Fund.
(E)Change in unrealized appreciation (depreciation) on investments does not include net appreciation of $24,471,563 for the Small Company Fund in connection with the Fund’s merger. See Note 9 in the Notes to Financial Statements.
See accompanying Notes to Financial Statements.
Statements of Operations (Continued)
| Touchstone | | | Touchstone | | | | | | Touchstone | | | Touchstone | | | | | | | |
| International | | | Large Cap | | | Touchstone | | | Large Company | | | Ohio | | | Touchstone | | | Touchstone | |
| Small Cap | | | Focused | | | Large Cap | | | Growth | | | Tax-Free Bond | | | Small Company | | | Value | |
| Fund | | | Fund | | | Fund | | | Fund | | | Fund | | | Fund | | | Fund | |
| | | | | | | | | | | | | | | | | | | | |
| $ | 5,279,942 | | | $ | 31,770,497 | | | $ | 5,623,059 | | | $ | 1,389,189 | | | $ | 722 | | | $ | 10,255,752 | | | $ | 9,432,176 | |
| | — | | | | 680 | | | | — | | | | — | | | | 1,761,122 | | | | 23,274 | | | | — | |
| | 146,779 | | | | 37,956 | | | | — | | | | 14,428 | | | | — | | | | 74,776 | | | | 3,216 | |
| | 5,426,721 | | | | 31,809,133 | | | | 5,623,059 | | | | 1,403,617 | | | | 1,761,844 | | | | 10,353,802 | | | | 9,435,392 | |
| | 2,290,234 | | | | 10,211,605 | | | | 2,233,703 | | | | 1,639,534 | | | | 238,065 | | | | 7,622,197 | | | | 2,230,056 | |
| | 349,668 | | | | 2,482,865 | | | | 467,497 | | | | 316,977 | | | | 69,039 | | | | 1,731,937 | | | | 497,474 | |
| | 2,471 | | | | 2,471 | | | | 2,471 | | | | 2,471 | | | | 2,471 | | | | 2,471 | | | | 2,471 | |
| | 77,035 | | | | 27,076 | | | | 21,305 | | | | 11,694 | | | | 4,933 | | | | 25,017 | | | | 13,238 | |
| | 56,156 | | | | 92,564 | | | | 38,320 | | | | 31,973 | | | | 26,773 | | | | 72,497 | | | | 38,000 | |
| | 11,605 | | | | 706,104 | | | | 2,956 | | | | 2,685 | | | | 17,950 | | | | 825,397 | | | | 39,203 | |
| | 2,643 | | | | 50,710 | | | | 3,182 | | | | 403 | | | | 2,330 | | | | 84,110 | | | | 2,803 | |
| | 123,319 | | | | 428,873 | | | | 188,911 | | | | 18,156 | | | | 1,490 | | | | 463,154 | | | | 74,667 | |
| | 49,826 | | | | 36,236 | | | | 8,956 | | | | 85,339 | | | | 243 | | | | 654 | | | | 109,862 | |
| | — | | | | — | | | | — | | | | — | | | | — | | | | 331 | | | | — | |
| | 23,934 | | | | 2,712 | | | | 1,322 | | | | 1,137 | | | | 13,283 | | | | 2,582 | | | | 1,826 | |
| | 16,000 | | | | 29,908 | | | | 9,980 | | | | 10,856 | | | | 6,831 | | | | 24,584 | | | | 15,947 | |
| | 10,008 | | | | 14,883 | | | | 11,764 | | | | 4,475 | | | | 5,019 | | | | 14,446 | | | | 8,902 | |
| | 15,740 | | | | 42,913 | | | | 23,145 | | | | 14,705 | | | | 4,669 | | | | 27,986 | | | | 15,990 | |
| | 17,834 | | | | 7,371 | | | | 13,508 | | | | 16,851 | | | | 3,479 | | | | 9,185 | | | | 16,035 | |
| | — | | | | — | | | | — | | | | — | | | | — | | | | 26,460 | | | | — | |
| | — | | | | — | | | | — | | | | — | | | | — | | | | — | | | | — | |
| | 4,911 | | | | 24,417 | | | | 4,160 | | | | 3,952 | | | | 4,331 | | | | 34,096 | | | | 6,529 | |
| | 4,217 | | | | 10,221 | | | | 4,303 | | | | 3,671 | | | | 3,816 | | | | 14,586 | | | | 4,218 | |
| | 12,844 | | | | 22,121 | | | | 17,746 | | | | 4,591 | | | | 3,709 | | | | 35,020 | | | | 8,159 | |
| | 6,423 | | | | 9,760 | | | | 4,177 | | | | 4,828 | | | | 3,656 | | | | 7,016 | | | | 9,935 | |
| | — | | | | — | | | | — | | | | — | | | | — | | | | 7,065 | | | | — | |
| | 14,717 | | | | 2,934,783 | | | | 7,991 | | | | 5,287 | | | | 85,157 | | | | 1,558,983 | | | | 85,732 | |
| | 18,750 | | | | 596,512 | | | | 79,663 | | | | 3,496 | | | | 42,899 | | | | 750,073 | | | | 30,668 | |
| | 16,083 | | | | 15,541 | | | | 16,083 | | | | 16,083 | | | | 16,083 | | | | 15,541 | | | | 16,083 | |
| | 74,433 | | | | 392,875 | | | | 84,839 | | | | 24,689 | | | | 18,897 | | | | 208,600 | | | | 43,578 | |
| | 3,198,851 | | | | 18,142,521 | | | | 3,245,982 | | | | 2,223,853 | | | | 575,123 | | | | 13,563,988 | | | | 3,271,376 | |
| | (171,450 | ) | | | (2,201,447 | ) | | | (459,782 | ) | | | (267,832 | ) | | | (163,917 | ) | | | (1,008,474 | ) | | | (667,140 | ) |
| | 3,027,401 | | | | 15,941,074 | | | | 2,786,200 | | | | 1,956,021 | | | | 411,206 | | | | 12,555,514 | | | | 2,604,236 | |
| | 2,399,320 | | | | 15,868,059 | | | | 2,836,859 | | | | (552,404 | ) | | | 1,350,638 | | | | (2,201,712 | ) | | | 6,831,156 | |
| | | | | | | | | | | | | | | | | | | | | | | | | | | |
| | (11,779,027 | ) | | | 252,285,256 | | | | 41,233,499 | | | | 16,773,549 | | | | 27,980 | | | | 115,229,557 | | | | 61,453,118 | |
| | (112,477 | ) | | | — | | | | — | | | | — | | | | — | | | | — | | | | — | |
| | — | | | | — | | | | — | | | | — | | | | — | | | | — | | | | — | |
| | — | | | | — | | | | — | | | | — | | | | — | | | | — | | | | — | |
| | — | | | | — | | | | — | | | | — | | | | — | | | | — | | | | — | |
| | — | | | | — | | | | — | | | | — | | | | — | | | | — | | | | — | |
| | (15,259,100 | ) | | | (98,767,694 | ) | | | (21,949,713 | ) | | | 5,681,900 | | | | 1,201,309 | | | | (133,934,390 | ) | | | (35,563,563 | ) |
| | 4,242 | | | | — | | | | — | | | | — | | | | — | | | | — | | | | — | |
| | — | | | | — | | | | — | | | | — | | | | — | | | | — | | | | — | |
| | — | | | | — | | | | — | | | | — | | | | — | | | | — | | | | — | |
| | (27,146,362 | ) | | | 153,517,562 | | | | 19,283,786 | | | | 22,455,449 | | | | 1,229,289 | | | | (18,704,833 | ) | | | 25,889,555 | |
| $ | (24,747,042 | ) | | $ | 169,385,621 | | | $ | 22,120,645 | | | $ | 21,903,045 | | | $ | 2,579,927 | | | $ | (20,906,545 | ) | | $ | 32,720,711 | |
| $ | 503,560 | | | $ | 242,399 | | | $ | 38,725 | | | $ | 22,970 | | | $ | — | | | $ | 31,154 | | | $ | 41,386 | |
Statements of Changes in Net Assets
| | | Touchstone Balanced Fund | |
| | | | | | For the | | | | |
| | | For the Year | | | Seven Months | | | For the Year | |
| | | Ended | | | Ended | | | Ended | |
| | | June 30, | | | June 30, | | | November 30, | |
| | | 2019 | | | 2018(A) | | | 2017(B) | |
| From Operations | | | | | | | | | | | | |
| Net investment income | | $ | 4,592,005 | | | $ | 2,180,528 | | | $ | 3,034,376 | |
| Net realized gains on investments, foreign currency transactions, futures contracts, written options, securities sold short and swap agreements | | | 11,328,793 | | | | 6,347,607 | | | | 15,905,893 | |
| Net change in unrealized appreciation (depreciation) on investments, foreign currency transactions, securities sold short, written options and unfunded loan commitments | | | 14,547,961 | | | | (3,085,132 | ) | | | 30,193,699 | |
| Change in Net Assets from Operations | | | 30,468,759 | | | | 5,443,003 | | | | 49,133,968 | |
| | | | | | | | | | | | | |
| Distributions to Shareholders from(C): | | | | | | | | | | | | |
| Distributed earnings, Class A | | | (14,828,141 | ) | | | — | | | | — | |
| Distributed earnings, Class C | | | (2,152,416 | ) | | | — | | | | — | |
| Distributed earnings, Class Y | | | (3,937,083 | ) | | | — | | | | — | |
| Distributed earnings, Institutional Class | | | — | | | | — | | | | — | |
| Net investment income, Class A | | | — | | | | (2,042,843 | ) | | | (3,241,942 | ) |
| Net investment income, Class C | | | — | | | | (98,271 | ) | | | (199,892 | ) |
| Net investment income, Class Y | | | — | | | | (306,197 | ) | | | (283,053 | ) |
| Net investment income, Institutional Class | | | — | | | | — | | | | — | |
| Net realized gains, Class A | | | — | | | | (11,994,902 | ) | | | (1,736,894 | ) |
| Net realized gains, Class C | | | — | | | | (1,997,013 | ) | | | (284,357 | ) |
| Net realized gains, Class Y | | | — | | | | (1,470,918 | ) | | | (102,948 | ) |
| Net realized gains, Institutional Class | | | — | | | | — | | | | — | |
| Total Distributions | | | (20,917,640 | ) | | | (17,910,144 | ) | | | (5,849,086 | ) |
| | | | | | | | | | | | | |
| Net Increase (Decrease) from Share Transactions(D) | | | 20,066,055 | | | | (10,388,249 | ) | | | (33,445,071 | ) |
| | | | | | | | | | | | | |
| Total Increase (Decrease) in Net Assets | | | 29,617,174 | | | | (22,855,390 | ) | | | 9,839,811 | |
| | | | | | | | | | | | | |
| Net Assets | | | | | | | | | | | | |
| Beginning of period | | | 309,437,928 | | | | 332,293,318 | | | | 322,453,507 | |
| End of period | | $ | 339,055,102 | | | $ | 309,437,928 | | | $ | 332,293,318 | |
| | | | | | | | | | | | | |
| Undistributed Net Investment Income(C) | | | N/A | | | $ | 224,126 | | | $ | 306,053 | |
(A)The Fund changed its fiscal year end from November 30 to June 30.
(B)See Note 9 in Notes to Financial Statements.
(C)The presentation of Distributions to Shareholders and Undistributed Net Investment Income have been updated to reflect the changes prescribed in amendments to Regulation S-X, effective November 5, 2018. The presentation for the seven months ended June 30, 2018, year ended June 30, 2018 and year ended November 30, 2017 was not impacted.
(D)For details on share transactions by class, see Statements of Changes in Net Assets - Capital Stock Activity on pages 92 - 94.
See accompanying Notes to Financial Statements.
Statements of Changes in Net Assets (Continued)
| Touchstone | | | | | | | | | | |
| Credit Opportunities Fund | | | Touchstone International Equity Fund | |
| | | | | | | | | | For the | | | | |
| For the Year | | | For the Year | | | For the Year | | | Seven Months | | | For the Year | |
| Ended | | | Ended | | | Ended | | | Ended | | | Ended | |
| June 30, | | | June 30, | | | June 30, | | | June 30, | | | November 30, | |
| 2019 | | | 2018 | | | 2019 | | | 2018(A) | | | 2017(B) | |
| | | | | | | | | | | | | | | | | | | |
| $ | 3,098,043 | | | $ | 2,745,337 | | | $ | 2,132,436 | | | $ | 3,776,017 | | | $ | 1,894,495 | |
| | | | | | | | | | | | | | | | | | | |
| | 263,609 | | | | 883,277 | | | | 987,326 | | | | 15,613,501 | | | | 7,249,972 | |
| | | | | | | | | | | | | | | | | | | |
| | 542,184 | | | | (1,700,810 | ) | | | (5,801,966 | ) | | | (25,665,271 | ) | | | 35,716,910 | |
| | 3,903,836 | | | | 1,927,804 | | | | (2,682,204 | ) | | | (6,275,753 | ) | | | 44,861,377 | |
| | | | | | | | | | | | | | | | | | | |
| | (9,474 | ) | | | — | | | | (13,527,353 | ) | | | — | | | | — | |
| | (5,380 | ) | | | — | | | | (697,755 | ) | | | — | | | | — | |
| | (291,730 | ) | | | — | | | | (5,855,380 | ) | | | — | | | | — | |
| | (3,272,520 | ) | | | — | | | | (322,138 | ) | | | — | | | | — | |
| | — | | | | (4,696 | ) | | | — | | | | (1,381,745 | ) | | | (764,365 | ) |
| | — | | | | (971 | ) | | | — | | | | — | | | | — | |
| | — | | | | (19,128 | ) | | | — | | | | (927,040 | ) | | | (486,213 | ) |
| | — | | | | (2,779,367 | ) | | | — | | | | (52 | ) | | | — | |
| | — | | | | (1,263 | ) | | | — | | | | (4,565,200 | ) | | | — | |
| | — | | | | (590 | ) | | | — | | | | (262,489 | ) | | | — | |
| | — | | | | (8,581 | ) | | | — | | | | (2,274,644 | ) | | | — | |
| | — | | | | (1,323,281 | ) | | | — | | | | (117 | ) | | | — | |
| | (3,579,104 | ) | | | (4,137,877 | ) | | | (20,402,626 | ) | | | (9,411,287 | ) | | | (1,250,578 | ) |
| | | | | | | | | | | | | | | | | | | |
| | 6,580,821 | | | | 1,013,131 | | | | (6,377,476 | ) | | | 1,127,073 | | | | (5,244,715 | ) |
| | | | | | | | | | | | | | | | | | | |
| | 6,905,553 | | | | (1,196,942 | ) | | | (29,462,306 | ) | | | (14,559,967 | ) | | | 38,366,084 | |
| | | | | | | | | | | | | | | | | | | |
| | 52,334,543 | | | | 53,531,485 | | | | 184,826,480 | | | | 199,386,447 | | | | 161,020,363 | |
| $ | 59,240,096 | | | $ | 52,334,543 | | | $ | 155,364,174 | | | $ | 184,826,480 | | | $ | 199,386,447 | |
| | | | | | | | | | | | | | | | | | | |
| | N/A | | | $ | 15,138 | | | | N/A | | | $ | 1,889,327 | | | $ | 1,037,307 | |
Statements of Changes in Net Assets(Continued)
| | | Touchstone | | | | | | | |
| | | International | | | Touchstone | |
| | | Growth | | | International | |
| | | Opportunities Fund | | | Small Cap Fund | |
| | | For the Year | | | For the Year | | | For the Year | | | For the Year | |
| | | Ended | | | Ended | | | Ended | | | Ended | |
| | | June 30, | | | June 30, | | | June 30, | | | June 30, | |
| | | | 2019 | | | | 2018 | | | | 2019 | | | | 2018 | |
| From Operations | | | | | | | | | | | | | | | | |
| Net investment income | | $ | 5,340 | | | $ | 79,627 | | | $ | 2,399,320 | | | $ | 2,676,704 | |
| Net realized gains (losses) on investments and foreign currency transactions | | | (4,917,129 | ) | | | 5,136,283 | | | | (11,891,504 | ) | | | 35,096,340 | |
| Net change in unrealized appreciation (depreciation) on investments and foreign currency transactions | | | 3,313,241 | | | | (1,526,328 | ) | | | (15,254,858 | ) | | | (6,560,538 | ) |
| Change in Net Assets from Operations | | | (1,598,548 | ) | | | 3,689,582 | | | | (24,747,042 | ) | | | 31,212,506 | |
| | | | | | | | | | | | | | | | | |
| Distributions to Shareholders from(C): | | | | | | | | | | | | | | | | |
| Distributed earnings, Class A | | | (96,098 | ) | | | — | | | | (348,193 | ) | | | — | |
| Distributed earnings, Class C | | | (23,263 | ) | | | — | | | | (157,413 | ) | | | — | |
| Distributed earnings, Class Y | | | (327,855 | ) | | | — | | | | (9,166,622 | ) | | | — | |
| Distributed earnings, Institutional Class | | | (4,250,657 | ) | | | — | | | | (10,641,767 | ) | | | — | |
| Net investment income, Class A | | | — | | | | — | | | | — | | | | (224,474 | ) |
| Net investment income, Class C | | | — | | | | — | | | | — | | | | (35,220 | ) |
| Net investment income, Class Y | | | — | | | | — | | | | — | | | | (4,356,261 | ) |
| Net investment income, Institutional Class | | | — | | | | — | | | | — | | | | (5,229,613 | ) |
| Net realized gains, Class A | | | — | | | | (10,467 | ) | | | — | | | | — | |
| Net realized gains, Class C | | | — | | | | (4,915 | ) | | | — | | | | — | |
| Net realized gains, Class Y | | | — | | | | (5,274 | ) | | | — | | | | — | |
| Net realized gains, Institutional Class | | | — | | | | (500,804 | ) | | | — | | | | — | |
| Total Distributions | | | (4,697,873 | ) | | | (521,460 | ) | | | (20,313,995 | ) | | | (9,845,568 | ) |
| | | | | | | | | | | | | | | | | |
| Net Increase (Decrease) from Share Transactions(D) | | | 6,952,126 | | | | 6,637,894 | | | | (69,390,792 | ) | | | (20,494,615 | ) |
| | | | | | | | | | | | | | | | | |
| Total Increase (Decrease) in Net Assets | | | 655,705 | | | | 9,806,016 | | | | (114,451,829 | ) | | | 872,323 | |
| | | | | | | | | | | | | | | | | |
| Net Assets | | | | | | | | | | | | | | | | |
| Beginning of period | | | 34,066,276 | | | | 24,260,260 | | | | 315,900,479 | | | | 315,028,156 | |
| End of period | | $ | 34,721,981 | | | $ | 34,066,276 | | | $ | 201,448,650 | | | $ | 315,900,479 | |
| | | | | | | | | | | | | | | | | |
| Undistributed (Distributions in excess of) Net Investment Income(C) | | | N/A | | | $ | 77,010 | | | | N/A | | | $ | (2,101,065 | ) |
(A) The Fund changed its fiscal year end from November 30 to June 30.
(B) See Note 9 in Notes to Financial Statements.
(C) The presentation of Distributions to Shareholders and Undistributed (Distributions in excess of) Net Investment Income have been updated to reflect the changes prescribed in amendments to Regulation S-X, effective November 5, 2018. The presentation for the seven months ended June 30, 2018, year ended June 30, 2018 and year ended November 30, 2017 was not impacted.
(D) For details on share transactions by class, see Statements of Changes in Net Assets - Capital Stock Activity on pages 95 - 97.
See accompanying Notes to Financial Statements.
Statements of Changes in Net Assets(Continued)
| Touchstone Large Cap Focused Fund | | | Touchstone Large Cap Fund | |
| | | | For the | | | | | | | | | | |
| For the Year | | | Seven Months | | | For the Year | | | For the Year | | | For the Year | |
| Ended | | | Ended | | | Ended | | | Ended | | | Ended | |
| June 30, | | | June 30, | | | November 30, | | | June 30, | | | June 30, | |
| 2019 | | | 2018(A) | | | 2017(B) | | | 2019 | | | 2018 | |
| | | | | | | | | | | | | | | | | | | |
| $ | 15,868,059 | | | $ | 9,480,909 | | | $ | 20,628,747 | | | $ | 2,836,859 | | | $ | 2,650,765 | |
| | | | | | | | | | | | | | | | | | | |
| | 252,285,256 | | | | 131,863,649 | | | | 326,286,157 | | | | 41,233,499 | | | | 4,594,631 | |
| | | | | | | | | | | | | | | | | | | |
| | (98,767,694 | ) | | | (54,861,111 | ) | | | 77,569,795 | | | | (21,949,713 | ) | | | 30,816,488 | |
| | 169,385,621 | | | | 86,483,447 | | | | 424,484,699 | | | | 22,120,645 | | | | 38,061,884 | |
| | | | | | | | | | | | | | | | | | | |
| | (118,892,191 | ) | | | — | | | | — | | | | (17,881 | ) | | | — | |
| | (6,543,243 | ) | | | — | | | | — | | | | — | | | | — | |
| | (41,722,772 | ) | | | — | | | | — | | | | (2,046,031 | ) | | | — | |
| | (7,761,439 | ) | | | — | | | | — | | | | (635,594 | ) | | | — | |
| | — | | | | (1,856,543 | ) | | | (15,710,842 | ) | | | — | | | | (15,190 | ) |
| | — | | | | — | | | | (349,488 | ) | | | — | | | | — | |
| | — | | | | (1,927,798 | ) | | | (7,901,170 | ) | | | — | | | | (1,521,043 | ) |
| | — | | | | (218,011 | ) | | | (519,211 | ) | | | — | | | | (811,456 | ) |
| | — | | | | (183,755,594 | ) | | | (77,329,736 | ) | | | — | | | | — | |
| | — | | | | (10,906,303 | ) | | | (5,018,041 | ) | | | — | | | | — | |
| | — | | | | (64,798,741 | ) | | | (31,927,617 | ) | | | — | | | | — | |
| | — | | | | (6,199,833 | ) | | | (1,506,542 | ) | | | — | | | | — | |
| | (174,919,645 | ) | | | (269,662,823 | ) | | | (140,262,647 | ) | | | (2,699,506 | ) | | | (2,347,689 | ) |
| | | | | | | | | | | | | | | | | | | |
| | 10,391,963 | | | | 31,161,686 | | | | (421,767,332 | ) | | | (102,688,339 | ) | | | (1,585,818 | ) |
| | | | | | | | | | | | | | | | | | | |
| | 4,857,939 | | | | (152,017,690 | ) | | | (137,545,280 | ) | | | (83,267,200 | ) | | | 34,128,377 | |
| | | | | | | | | | | | | | | | | | | |
| | 1,727,080,687 | | | | 1,879,098,377 | | | | 2,016,643,657 | | | | 367,566,900 | | | | 333,438,523 | |
| $ | 1,731,938,626 | | | $ | 1,727,080,687 | | | $ | 1,879,098,377 | | | $ | 284,299,700 | | | $ | 367,566,900 | |
| | | | | | | | | | | | | | | | | | | |
| | N/A | | | $ | 5,226,183 | | | $ | 2,586,763 | | | | N/A | | | $ | 1,637,893 | |
Statements of Changes in Net Assets(Continued)
| | | Touchstone | | | Touchstone | |
| | | Large Company | | | Ohio Tax-Free | |
| | | Growth Fund | | | Bond Fund | |
| | | For the Year | | | For the Year | | | For the Year | | | For the Year | |
| | | Ended | | | Ended | | | Ended | | | Ended | |
| | | June 30, | | | June 30, | | | June 30, | | | June 30, | |
| | | 2019 | | | 2018 | | | 2019 | | | 2018 | |
| From Operations | | | | | | | | | | | | | | | | |
| Net investment income (loss) | | $ | (552,404 | ) | | $ | (664,338 | ) | | $ | 1,350,638 | | | $ | 1,331,678 | |
| Net realized gains (losses) on investments | | | 16,773,549 | | | | 11,427,420 | | | | 27,980 | | | | 22,620 | |
| Net change in unrealized appreciation (depreciation) on investments | | | 5,681,900 | | | | 28,941,080 | | | | 1,201,309 | | | | (945,346 | ) |
| Change in Net Assets from Operations | | | 21,903,045 | | | | 39,704,162 | | | | 2,579,927 | | | | 408,952 | |
| | | | | | | | | | | | | | | | | |
| Distributions to Shareholders from(C): | | | | | | | | | | | | | | | | |
| Distributed earnings, Class A | | | (73,858 | ) | | | — | | | | (971,245 | ) | | | — | |
| Distributed earnings, Class C | | | (12,084 | ) | | | — | | | | (90,903 | ) | | | — | |
| Distributed earnings, Class Y | | | (1,058,842 | ) | | | — | | | | (131,661 | ) | | | — | |
| Distributed earnings, Institutional Class | | | (12,527,470 | ) | | | — | | | | (156,784 | ) | | | — | |
| Distributed earnings, Class R6 | | | — | | | | — | | | | — | | | | — | |
| Net investment income, Class A | | | — | | | | — | | | | — | | | | (1,129,730 | ) |
| Net investment income, Class C | | | — | | | | — | | | | — | | | | (123,927 | ) |
| Net investment income, Class Y | | | — | | | | — | | | | — | | | | (63,307 | ) |
| Net investment income, Institutional Class | | | — | | | | — | | | | — | | | | (14,365 | ) |
| Net realized gains, Class A | | | — | | | | (79,495 | ) | | | — | | | | — | |
| Net realized gains, Class C | | | — | | | | (4,037 | ) | | | — | | | | — | |
| Net realized gains, Class Y | | | — | | | | (334,448 | ) | | | — | | | | — | |
| Net realized gains, Institutional Class | | | — | | | | (5,903,548 | ) | | | — | | | | — | |
| Net realized gains, Class R6 | | | — | | | | — | | | | — | | | | — | |
| Total Distributions | | | (13,672,254 | ) | | | (6,321,528 | ) | | | (1,350,593 | ) | | | (1,331,329 | ) |
| | | | | | | | | | | | | | | | | |
| Net Increase (Decrease) from Share Transactions(D) | | | (26,431,941 | ) | | | 11,058,131 | | | | (261,058 | ) | | | (2,169,116 | ) |
| | | | | | | | | | | | | | | | | |
| Total Increase (Decrease) in Net Assets | | | (18,201,150 | ) | | | 44,440,765 | | | | 968,276 | | | | (3,091,493 | ) |
| | | | | | | | | | | | | | | | | |
| Net Assets | | | | | | | | | | | | | | | | |
| Beginning of period | | | 243,993,243 | | | | 199,552,478 | | | | 46,246,348 | | | | 49,337,841 | |
| End of period | | $ | 225,792,093 | | | $ | 243,993,243 | | | $ | 47,214,624 | | | $ | 46,246,348 | |
| | | | | | | | | | | | | | | | | |
| Undistributed (Distributions in excess of) Net Investment Income(C) | | | N/A | | | $ | — | | | | N/A | | | $ | (18,071 | ) |
(A)The Fund changed its fiscal year end from November 30 to June 30.
(B)See Note 9 in Notes to Financial Statements.
(C)The presentation of Distributions to Shareholders and Undistributed (Distributions in excess of) Net Investment Income have been updated to reflect the changes prescribed in amendments to Regulation S-X, effective November 5, 2018. The presentation for the seven months ended June 30, 2018, year ended June 30, 2018 and year ended November 30, 2017 was not impacted.
(D)For details on share transactions by class, see Statements of Changes in Net Assets - Capital Stock Activity on pages 97 -100.
See accompanying Notes to Financial Statements.
Statements of Changes in Net Assets (Continued)
| | | | | | | | | | Touchstone | |
| Touchstone Small Company Fund | | | Value Fund | |
| | | | For the | | | | | | | | | | |
| For the Year | | | Seven Months | | | For the Year | | | For the Year | | | For the Year | |
| Ended | | | Ended | | | Ended | | | Ended | | | Ended | |
| June 30, | | | June 30, | | | November 30, | | | June 30, | | | June 30, | |
| 2019 | | | 2018(A) | | | 2017(B) | | | 2019 | | | 2018 | |
| | | | | | | | | | | | | | |
| $ | (2,201,712 | ) | | $ | (1,601,393 | ) | | $ | (5,229,124 | ) | | $ | 6,831,156 | | | $ | 6,774,255 | |
| | 115,229,557 | | | | 59,511,081 | | | | 125,291,363 | | | | 61,453,118 | | | | 27,488,737 | |
| | | | | | | | | | | | | | | | | | | |
| | (133,934,390 | ) | | | 25,431,940 | | | | 72,290,088 | | | | (35,563,563 | ) | | | (7,210,659 | ) |
| | (20,906,545 | ) | | | 83,341,628 | | | | 192,352,327 | | | | 32,720,711 | | | | 27,052,333 | |
| | | | | | | | | | | | | | | | | | | |
| | (70,438,346 | ) | | | — | | | | — | | | | (4,381,019 | ) | | | — | |
| | (18,479,476 | ) | | | — | | | | — | | | | (387,177 | ) | | | — | |
| | (40,694,612 | ) | | | — | | | | — | | | | (10,881,469 | ) | | | — | |
| | (92,997 | ) | | | — | | | | — | | | | (26,051,472 | ) | | | — | |
| | (15,325,342 | ) | | | — | | | | — | | | | — | | | | — | |
| | — | | | | — | | | | — | | | | — | | | | (552,960 | ) |
| | — | | | | — | | | | — | | | | — | | | | (28,376 | ) |
| | — | | | | — | | | | — | | | | — | | | | (1,461,974 | ) |
| | — | | | | — | | | | — | | | | — | | | | (4,807,215 | ) |
| | — | | | | (55,816,413 | ) | | | (54,250,628 | ) | | | — | | | | (2,904,492 | ) |
| | — | | | | (13,671,576 | ) | | | (13,229,732 | ) | | | — | | | | (312,663 | ) |
| | — | | | | (29,679,392 | ) | | | (20,710,154 | ) | | | — | | | | (6,143,348 | ) |
| | — | | | | (203 | ) | | | — | | | | — | | | | (18,521,160 | ) |
| | — | | | | (5,534,630 | ) | | | (1,025,672 | ) | | | — | | | | — | |
| | (145,030,773 | ) | | | (104,702,214 | ) | | | (89,216,186 | ) | | | (41,701,137 | ) | | | (34,732,188 | ) |
| | | | | | | | | | | | | | | | | | | |
| | 42,507,413 | | | | 3,102,430 | | | | 66,295,636 | | | | (38,343,157 | ) | | | 11,638,173 | |
| | | | | | | | | | | | | | | | | | | |
| | (123,429,905 | ) | | | (18,258,156 | ) | | | 169,431,777 | | | | (47,323,583 | ) | | | 3,958,318 | |
| | | | | | | | | | | | | | | | | | | |
| | 1,218,305,500 | | | | 1,236,563,656 | | | | 1,067,131,879 | | | | 385,076,830 | | | | 381,118,512 | |
| $ | 1,094,875,595 | | | $ | 1,218,305,500 | | | $ | 1,236,563,656 | | | $ | 337,753,247 | | | $ | 385,076,830 | |
| | | | | | | | | | | | | | | | | | | |
| | N/A | | | $ | — | | | $ | — | | | | N/A | | | $ | 90,275 | |
Statements of Changes in Net Assets - Capital Stock Activity
| | | | | | | | | Touchstone Balanced Fund | | | | | | | |
| | | For the | | | For the Seven Months | | | For the Year | |
| | | Year Ended | | | Ended | | | Ended | |
| | | June 30, 2019 | | | June 30, 2018(A) | | | November 30, 2017(B) | |
| | | Shares | | | Dollars | | | Shares | | | Dollars | | | Shares | | | Dollars | |
| Class A | | | | | | | | | | | | | | | | | | | | | | | | |
| Proceeds from Shares issued | | | 1,062,296 | | | $ | 22,451,293 | | | | 511,448 | | | $ | 11,135,471 | | | | 1,213,883 | | | $ | 25,250,539 | |
| Reinvestment of distributions | | | 692,449 | | | | 14,214,633 | | | | 624,673 | | | | 13,440,191 | | | | 232,528 | | | | 4,719,857 | |
| Cost of Shares redeemed | | | (1,851,939 | ) | | | (39,879,250 | ) | | | (1,566,532 | ) | | | (34,116,123 | ) | | | (3,376,990 | ) | | | (71,336,387 | ) |
| Change from Class A Share Transactions | | | (97,194 | ) | | | (3,213,324 | ) | | | (430,411 | ) | | | (9,540,461 | ) | | | (1,930,579 | ) | | | (41,365,991 | ) |
| Class C | | | | | | | | | | | | | | | | | | | | | | | | |
| Proceeds from Shares issued | | | 260,512 | | | | 5,744,940 | | | | 103,613 | | | | 2,254,694 | | | | 380,017 | | | | 7,809,067 | |
| Reinvestment of distributions | | | 99,216 | | | | 2,033,028 | | | | 91,678 | | | | 1,983,483 | | | | 22,578 | | | | 454,129 | |
| Cost of Shares redeemed | | | (655,564 | ) | | | (13,909,549 | ) | | | (262,440 | ) | | | (5,705,271 | ) | | | (679,379 | ) | | | (14,377,072 | ) |
| Change from Class C Share Transactions | | | (295,836 | ) | | | (6,131,581 | ) | | | (67,149 | ) | | | (1,467,094 | ) | | | (276,784 | ) | | | (6,113,876 | ) |
| Class Y(C) | | | | | | | | | | | | | | | | | | | | | | | | |
| Proceeds from Shares issued | | | 2,282,410 | | | | 49,201,431 | | | | 191,050 | | | | 4,149,196 | | | | 1,036,380 | | | | 21,843,739 | |
| Reinvestment of distributions | | | 192,346 | | | | 3,917,535 | | | | 79,069 | | | | 1,689,671 | | | | 15,954 | | | | 323,761 | |
| Cost of Shares redeemed | | | (1,151,266 | ) | | | (23,708,006 | ) | | | (240,934 | ) | | | (5,219,561 | ) | | | (390,115 | ) | | | (8,132,704 | ) |
| Change from Class Y Share Transactions | | | 1,323,490 | | | | 29,410,960 | | | | 29,185 | | | | 619,306 | | | | 662,219 | | | | 14,034,796 | |
| Institutional Class | | | | | | | | | | | | | | | | | | | | | | | | |
| Proceeds from Shares issued | | | — | | | | — | | | | — | | | | — | | | | — | | | | — | |
| Reinvestment of distributions | | | — | | | | — | | | | — | | | | — | | | | — | | | | — | |
| Cost of Shares redeemed | | | — | | | | — | | | | — | | | | — | | | | — | | | | — | |
| Change from Institutional Class Share Transactions | | | — | | | | — | | | | — | | | | — | | | | — | | | | — | |
| Change from Share Transactions | | | 930,460 | | | $ | 20,066,055 | | | | (468,375 | ) | | $ | (10,388,249 | ) | | | (1,545,144 | ) | | $ | (33,445,071 | ) |
| (A) | The Fund changed its fiscal year from November 30 to June 30. |
| (B) | See Note 9 in Notes to Financial Statements. |
| (C) | Effective October 28, 2017, Class I shares of the Sentinel Balanced Fund (the “Predecessor Fund”) were reorganized into Class Y shares of the Touchstone Balanced Fund. |
See accompanying Notes to Financial Statements.
Statements of Changes in Net Assets - Capital Stock Activity (Continued)
| Touchstone Credit Opportunities Fund | |
| For the | | | For the | |
| Year Ended | | | Year Ended | |
| June 30, 2019 | | | June 30, 2018 | |
| Shares | | | Dollars | | | Shares | | | Dollars | |
| | | | | | | | | | | |
| | 16,091 | | | $ | 158,403 | | | | 11,643 | | | $ | 118,995 | |
| | 806 | | | | 7,849 | | | | 558 | | | | 5,652 | |
| | (9,561 | ) | | | (94,507 | ) | | | (1,170 | ) | | | (11,882 | ) |
| | 7,336 | | | | 71,745 | | | | 11,031 | | | | 112,765 | |
| | | | | | | | | | | | | | | |
| | 12,217 | | | | 121,216 | | | | — | | | | — | |
| | 554 | | | | 5,381 | | | | 152 | | | | 1,561 | |
| | (2,267 | ) | | | (22,317 | ) | | | — | | | | — | |
| | 10,504 | | | | 104,280 | | | | 152 | | | | 1,561 | |
| | | | | | | | | | | | | | | |
| | 1,205,335 | | | | 11,677,641 | | | | 22,305 | | | | 226,981 | |
| | 29,642 | | | | 291,729 | | | | 2,719 | | | | 27,709 | |
| | (138,508 | ) | | | (1,372,382 | ) | | | (10,727 | ) | | | (108,970 | ) |
| | 1,096,469 | | | | 10,596,988 | | | | 14,297 | | | | 145,720 | |
| | | | | | | | | | | | | | | |
| | 451,288 | | | | 4,456,115 | | | | 621,437 | | | | 6,398,512 | |
| | 337,575 | | | | 3,272,520 | | | | 402,090 | | | | 4,102,648 | |
| | (1,206,092 | ) | | | (11,920,827 | ) | | | (936,639 | ) | | | (9,748,075 | ) |
| | | | | | | | | | | | | | | |
| | (417,229 | ) | | | (4,192,192 | ) | | | 86,888 | | | | 753,085 | |
| | 697,080 | | | $ | 6,580,821 | | | | 112,368 | | | $ | 1,013,131 | |
Statements of Changes in Net Assets - Capital Stock Activity (Continued)
| | | Touchstone International Equity Fund | |
| | | For the | | | For the Seven Months | | | For the Year | |
| | | Year Ended | | | Ended | | | Ended | |
| | | June 30, 2019 | | | June 30, 2018(A) | | | November 30, 2017(B) | |
| | | Shares | | | Dollars | | | Shares | | | Dollars | | | Shares | | | Dollars | |
| Class A | | | | | | | | | | | | | | | | | | | | | | | | |
| Proceeds from Shares issued | | | 557,676 | | | $ | 8,907,754 | | | | 473,654 | | | $ | 9,152,679 | | | | 1,311,801 | | | $ | 23,285,877 | |
| Reinvestment of distributions | | | 906,752 | | | | 13,019,094 | | | | 293,806 | | | | 5,682,188 | | | | 44,226 | | | | 688,604 | |
| Cost of Shares redeemed | | | (1,156,806 | ) | | | (18,660,524 | ) | | | (822,238 | ) | | | (15,736,184 | ) | | | (2,162,637 | ) | | | (38,654,321 | ) |
| Change from Class A Share Transactions | | | 307,622 | | | | 3,266,324 | | | | (54,778 | ) | | | (901,317 | ) | | | (806,610 | ) | | | (14,679,840 | ) |
| Class C | | | | | | | | | | | | | | | | | | | | | | | | |
| Proceeds from Shares issued | | | 19,926 | | | | 345,863 | | | | 70,047 | | | | 1,268,035 | | | | 133,628 | | | | 2,213,614 | |
| Reinvestment of distributions | | | 50,627 | | | | 679,647 | | | | 13,759 | | | | 252,206 | | | | — | | | | — | |
| Cost of Shares redeemed | | | (205,583 | ) | | | (2,981,700 | ) | | | (65,387 | ) | | | (1,176,556 | ) | | | (159,419 | ) | | | (2,683,483 | ) |
| Change from Class C Share Transactions | | | (135,030 | ) | | | (1,956,190 | ) | | | 18,419 | | | | 343,685 | | | | (25,791 | ) | | | (469,869 | ) |
| Class Y(C) | | | | | | | | | | | | | | | | | | | | | | | | |
| Proceeds from Shares issued | | | 896,199 | | | | 14,089,717 | | | | 807,622 | | | | 15,303,803 | | | | 2,569,654 | | | | 45,276,408 | |
| Reinvestment of distributions | | | 408,231 | | | | 5,783,890 | | | | 164,684 | | | | 3,143,813 | | | | 30,455 | | | | 468,087 | |
| Cost of Shares redeemed | | | (1,778,878 | ) | | | (28,226,702 | ) | | | (1,024,275 | ) | | | (19,283,081 | ) | | | (1,976,731 | ) | | | (35,842,676 | ) |
| Change from Class Y Share Transactions | | | (474,448 | ) | | | (8,353,095 | ) | | | (51,969 | ) | | | (835,465 | ) | | | 623,378 | | | | 9,901,819 | |
| Institutional Class(D) | | | | | | | | | | | | | | | | | | | | | | | | |
| Proceeds from Shares issued | | | 22,018 | | | | 393,073 | | | | 125,960 | | | | 2,520,019 | | | | 167 | | | | 3,175 | |
| Reinvestment of distributions | | | 22,774 | | | | 322,139 | | | | 9 | | | | 169 | | | | — | | | | — | |
| Cost of Shares redeemed | | | (2,829 | ) | | | (49,727 | ) | | | (1 | ) | | | (18 | ) | | | — | | | | — | |
| Change from Institutional Class Share Transactions | | | 41,963 | | | | 665,485 | | | | 125,968 | | | | 2,520,170 | | | | 167 | | | | 3,175 | |
| Change from Share Transactions | | | (259,893 | ) | | $ | (6,377,476 | ) | | | 37,640 | | | $ | 1,127,073 | | | | (208,856 | ) | | $ | (5,244,715 | ) |
| (A) | The Fund changed its fiscal year from November 30 to June 30. |
| (B) | See Note 9 in Notes to Financial Statements. |
| (C) | Effective October 28, 2017, Class I shares of the Sentinel International Equity Fund (the “Predecessor Fund”) were reorganized into Class Y shares of the Touchstone International Equity Fund. |
| (D) | The International Equity Fund began issuing Institutional Class shares on October 30, 2017. |
See accompanying Notes to Financial Statements.
Statements of Changes in Net Assets - Capital Stock Activity (Continued)
| Touchstone International Growth Opportunities Fund | | | Touchstone International Small Cap Fund | |
| For the | | | For the | | | For the | | | For the | |
| Year Ended | | | Year Ended | | | Year Ended | | | Year Ended | |
| June 30, 2019 | | | June 30, 2018 | | | June 30, 2019 | | | June 30, 2018 | |
| Shares | | | Dollars | | | Shares | | | Dollars | | | Shares | | | Dollars | | | Shares | | | Dollars | |
| | | | | | | | | | | | | | | | | | | | | | | |
| | 16,945 | | | $ | 375,240 | | | | 38,090 | | | $ | 957,819 | | | | 43,026 | | | $ | 688,045 | | | | 345,684 | | | $ | 6,430,894 | |
| | 5,357 | | | | 96,098 | | | | 421 | | | | 10,400 | | | | 19,506 | | | | 263,989 | | | | 9,187 | | | | 169,676 | |
| | (23,131 | ) | | | (521,732 | ) | | | (8,258 | ) | | | (209,568 | ) | | | (540,066 | ) | | | (8,195,037 | ) | | | (684,584 | ) | | | (12,593,056 | ) |
| | (829 | ) | | | (50,394 | ) | | | 30,253 | | | | 758,651 | | | | (477,534 | ) | | | (7,243,003 | ) | | | (329,713 | ) | | | (5,992,486 | ) |
| | | | | | | | | | | | | | | | | | | | | | | | | | | | | | | |
| | 4,796 | | | | 102,072 | | | | 17,363 | | | | 432,259 | | | | 9,015 | | | | 135,668 | | | | 29,552 | | | | 533,110 | |
| | 1,323 | | | | 23,263 | | | | 201 | | | | 4,915 | | | | 10,792 | | | | 143,043 | | | | 1,567 | | | | 28,533 | |
| | (14,809 | ) | | | (322,477 | ) | | | (79 | ) | | | (1,996 | ) | | | (56,187 | ) | | | (820,298 | ) | | | (60,140 | ) | | | (1,082,759 | ) |
| | (8,690 | ) | | | (197,142 | ) | | | 17,485 | | | | 435,178 | | | | (36,380 | ) | | | (541,587 | ) | | | (29,021 | ) | | | (521,116 | ) |
| | | | | | | | | | | | | | | | | | | | | | | | | | | | | | | |
| | 103,079 | | | | 2,090,608 | | | | 185,801 | | | | 4,785,015 | | | | 514,728 | | | | 7,770,651 | | | | 1,072,936 | | | | 20,052,296 | |
| | 18,202 | | | | 327,855 | | | | 214 | | | | 5,274 | | | | 645,591 | | | | 8,930,258 | | | | 221,715 | | | | 4,176,429 | |
| | (192,606 | ) | | | (3,806,371 | ) | | | (12,498 | ) | | | (325,519 | ) | | | (2,717,834 | ) | | | (42,233,109 | ) | | | (1,932,134 | ) | | | (36,110,600 | ) |
| | (71,325 | ) | | | (1,387,908 | ) | | | 173,517 | | | | 4,464,770 | | | | (1,557,515 | ) | | | (25,532,200 | ) | | | (637,483 | ) | | | (11,881,875 | ) |
| | | | | | | | | | | | | | | | | | | | | | | | | | | | | | | |
| | 527,744 | | | | 12,739,115 | | | | 28,498 | | | | 703,725 | | | | 1,910,429 | | | | 29,584,745 | | | | 4,228,129 | | | | 79,770,190 | |
| | 234,396 | | | | 4,238,825 | | | | 20,134 | | | | 498,928 | | | | 764,467 | | | | 10,631,410 | | | | 274,388 | | | | 5,194,163 | |
| | (411,764 | ) | | | (8,390,370 | ) | | | (8,538 | ) | | | (223,358 | ) | | | (4,852,742 | ) | | | (76,290,157 | ) | | | (4,534,311 | ) | | | (87,063,491 | ) |
| | | | | | | | | | | | | | | | | | | | | | | | | | | | | | | |
| | 350,376 | | | | 8,587,570 | | | | 40,094 | | | | 979,295 | | | | (2,177,846 | ) | | | (36,074,002 | ) | | | (31,794 | ) | | | (2,099,138 | ) |
| | 269,532 | | | $ | 6,952,126 | | | | 261,349 | | | $ | 6,637,894 | | | | (4,249,275 | ) | | $ | (69,390,792 | ) | | | (1,028,011 | ) | | $ | (20,494,615 | ) |
Statements of Changes in Net Assets - Capital Stock Activity (Continued)
| | | Touchstone Large Cap Focused Fund | |
| | | For the | | | For the Seven Months | | | For the Year | |
| | | Year Ended | | | Ended | | | Ended | |
| | | June 30, 2019 | | | June 30, 2018(A) | | | November 30, 2017(B) | |
| | | Shares | | | Dollars | | | Shares | | | Dollars | | | Shares | | | Dollars | |
| Class A | | | | | | | | | | | | | | | | | | | | | | | | |
| Proceeds from Shares issued | | | 1,405,226 | | | $ | 58,296,751 | | | | 815,107 | | | $ | 35,628,247 | | | | 1,459,660 | | | $ | 63,541,135 | |
| Reinvestment of distributions | | | 2,715,786 | | | | 106,532,964 | | | | 3,889,740 | | | | 165,033,926 | | | | 1,998,894 | | | | 82,231,470 | |
| Cost of Shares redeemed | | | (4,961,303 | ) | | | (210,066,892 | ) | | | (3,982,603 | ) | | | (177,279,849 | ) | | | (8,302,661 | ) | | | (368,083,987 | ) |
| Change from Class A Share Transactions | | | (840,291 | ) | | | (45,237,177 | ) | | | 722,244 | | | | 23,382,324 | | | | (4,844,107 | ) | | | (222,311,382 | ) |
| Class C | | | | | | | | | | | | | | | | | | | | | | | | |
| Proceeds from Shares issued | | | 157,729 | | | | 6,280,274 | | | | 50,250 | | | | 2,070,075 | | | | 211,838 | | | | 8,585,918 | |
| Reinvestment of distributions | | | 171,149 | | | | 6,291,421 | | | | 260,648 | | | | 10,467,621 | | | | 130,769 | | | | 5,107,041 | |
| Cost of Shares redeemed | | | (786,837 | ) | | | (30,193,725 | ) | | | (268,366 | ) | | | (11,164,662 | ) | | | (806,388 | ) | | | (34,030,006 | ) |
| Change from Class C Share Transactions | | | (457,959 | ) | | | (17,622,030 | ) | | | 42,532 | | | | 1,373,034 | | | | (463,781 | ) | | | (20,337,047 | ) |
| Class Y(C) | | | | | | | | | | | | | | | | | | | | | | | | |
| Proceeds from Shares issued | | | 2,348,057 | | | | 98,974,817 | | | | 1,429,384 | | | | 64,702,421 | | | | 2,583,052 | | | | 111,976,965 | |
| Reinvestment of distributions | | | 870,960 | | | | 34,044,871 | | | | 1,306,403 | | | | 55,221,657 | | | | 781,425 | | | | 32,153,805 | |
| Cost of Shares redeemed | | | (2,685,332 | ) | | | (114,700,906 | ) | | | (2,719,325 | ) | | | (118,462,809 | ) | | | (7,436,364 | ) | | | (331,943,211 | ) |
| Change from Class Y Share Transactions | | | 533,685 | | | | 18,318,782 | | | | 16,462 | | | | 1,461,269 | | | | (4,071,887 | ) | | | (187,812,441 | ) |
| Institutional Class(D) | | | | | | | | | | | | | | | | | | | | | | | | |
| Proceeds from Shares issued | | | 3,230,674 | | | | 137,634,347 | | | | 3,028,530 | | | | 135,629,681 | | | | 1,083,816 | | | | 49,314,099 | |
| Reinvestment of distributions | | | 198,310 | | | | 7,761,448 | | | | 151,651 | | | | 6,417,844 | | | | 48,834 | | | | 2,025,753 | |
| Cost of Shares redeemed | | | (2,176,132 | ) | | | (90,463,407 | ) | | | (3,029,751 | ) | | | (137,102,466 | ) | | | (923,130 | ) | | | (42,646,314 | ) |
| Change from Institutional Class Share Transactions | | | 1,252,852 | | | | 54,932,388 | | | | 150,430 | | | | 4,945,059 | | | | 209,520 | | | | 8,693,538 | |
| Change from Share Transactions | | | 488,287 | | | $ | 10,391,963 | | | | 931,668 | | | $ | 31,161,686 | | | | (9,170,255 | ) | | $ | (421,767,332 | ) |
| (A) | The Fund changed its fiscal year from November 30 to June 30. |
| (B) | See Note 9 in Notes to Financial Statements. |
| (C) | Effective October 28, 2017, Class I shares of the Sentinel Common Stock Fund (the “Predecessor Fund”) were reorganized into Class Y shares of the Touchstone Large Cap Focused Fund. |
| (D) | Effective October 30, 2017, Class R6 shares of the Sentinel Common Stock Fund (the “Predecessor Fund”) were reorganized into Institutional Class shares of the Touchstone Large Cap Focused Fund. |
See accompanying Notes to Financial Statements.
Statements of Changes in Net Assets - Capital Stock Activity (Continued)
| Touchstone Large Cap Fund | | | Touchstone Large Company Growth Fund | |
| For the | | | For the | | | For the | | | For the | |
| Year Ended | | | Year Ended | | | Year Ended | | | Year Ended | |
| June 30, 2019 | | | June 30, 2018 | | | June 30, 2019 | | | June 30, 2018 | |
| Shares | | | Dollars | | | Shares | | | Dollars | | | Shares | | | Dollars | | | Shares | | | Dollars | |
| | | | | | | | | | | | | | | | | | | | | | | |
| | 131,766 | | | $ | 1,800,763 | | | | 95,560 | | | $ | 1,247,461 | | | | 51,395 | | | $ | 2,152,550 | | | | 123,690 | | | $ | 4,870,568 | |
| | 1,281 | | | | 15,801 | | | | 1,038 | | | | 13,968 | | | | 2,021 | | | | 73,858 | | | | 2,033 | | | | 79,495 | |
| | (69,014 | ) | | | (944,786 | ) | | | (321,234 | ) | | | (4,203,183 | ) | | | (102,561 | ) | | | (4,230,513 | ) | | | (46,986 | ) | | | (1,908,742 | ) |
| | 64,033 | | | | 871,778 | | | | (224,636 | ) | | | (2,941,754 | ) | | | (49,145 | ) | | | (2,004,105 | ) | | | 78,737 | | | | 3,041,321 | |
| | | | | | | | | | | | | | | | | | | | | | | | | | | | | | | |
| | 114,719 | | | | 1,531,304 | | | | 71,811 | | | | 933,646 | | | | 17,107 | | | | 576,349 | | | | 4,822 | | | | 193,954 | |
| | — | | | | — | | | | — | | | | — | | | | 337 | | | | 12,084 | | | | 104 | | | | 4,037 | |
| | (184,467 | ) | | | (2,443,682 | ) | | | (156,637 | ) | | | (2,005,538 | ) | | | (13,711 | ) | | | (512,697 | ) | | | — | | | | — | |
| | (69,748 | ) | | | (912,378 | ) | | | (84,826 | ) | | | (1,071,892 | ) | | | 3,733 | | | | 75,736 | | | | 4,926 | | | | 197,991 | |
| | | | | | | | | | | | | | | | | | | | | | | | | | | | | | | |
| | 1,044,064 | | | | 13,855,912 | | | | 1,543,884 | | | | 20,431,285 | | | | 177,376 | | | | 7,212,602 | | | | 137,093 | | | | 5,592,515 | |
| | 161,741 | | | | 1,995,885 | | | | 109,646 | | | | 1,478,024 | | | | 22,207 | | | | 816,318 | | | | 8,523 | | | | 334,448 | |
| | (3,524,466 | ) | | | (47,963,236 | ) | | | (2,732,808 | ) | | | (35,729,564 | ) | | | (126,685 | ) | | | (5,088,215 | ) | | | (40,424 | ) | | | (1,666,941 | ) |
| | (2,318,661 | ) | | | (32,111,439 | ) | | | (1,079,278 | ) | | | (13,820,255 | ) | | | 72,898 | | | | 2,940,705 | | | | 105,192 | | | | 4,260,022 | |
| | | | | | | | | | | | | | | | | | | | | | | | | | | | | | | |
| | 826,367 | | | | 11,434,220 | | | | 1,489,272 | | | | 19,874,004 | | | | 762,108 | | | | 30,157,517 | | | | 926,758 | | | | 37,540,549 | |
| | 42,766 | | | | 528,158 | | | | 58,429 | | | | 788,793 | | | | 320,166 | | | | 11,801,332 | | | | 143,468 | | | | 5,638,302 | |
| | (6,046,153 | ) | | | (82,498,678 | ) | | | (335,590 | ) | | | (4,414,714 | ) | | | (1,716,589 | ) | | | (69,403,126 | ) | | | (994,504 | ) | | | (39,620,054 | ) |
| | | | | | | | | | | | | | | | | | | | | | | | | | | | | | | |
| | (5,177,020 | ) | | | (70,536,300 | ) | | | 1,212,111 | | | | 16,248,083 | | | | (634,315 | ) | | | (27,444,277 | ) | | | 75,722 | | | | 3,558,797 | |
| | (7,501,396 | ) | | $ | (102,688,339 | ) | | | (176,629 | ) | | $ | (1,585,818 | ) | | | (606,829 | ) | | $ | (26,431,941 | ) | | | 264,577 | | | $ | 11,058,131 | |
Statements of Changes in Net Assets - Capital Stock Activity (Continued)
| | | Touchstone Ohio Tax-Free Bond Fund | |
| | | For the | | | For the | |
| | | Year Ended | | | Year Ended | |
| | | June 30, 2019 | | | June 30, 2018 | |
| | | Shares | | | Dollars | | | Shares | | | Dollars | |
| Class A | | | | | | | | | | | | | | | | |
| Proceeds from Shares issued | | $ | 290,571 | | | $ | 3,284,978 | | | | 407,502 | | | $ | 4,689,822 | |
| Proceeds from Shares issued in connection with merger(B) | | | — | | | | — | | | | — | | | | — | |
| Reinvestment of distributions | | | 64,092 | | | | 728,125 | | | | 70,240 | | | | 804,607 | |
| Cost of Shares redeemed | | | (626,127 | ) | | | (7,087,256 | ) | | | (1,030,455 | ) | | | (11,842,288 | ) |
| Change from Class A Share Transactions | | | (271,464 | ) | | | (3,074,153 | ) | | | (552,713 | ) | | | (6,347,859 | ) |
| Class C | | | | | | | | | | | | | | | | |
| Proceeds from Shares issued | | | 85,728 | | | | 968,365 | | | | 24,400 | | | | 279,406 | |
| Proceeds from Shares issued in connection with merger(B) | | | — | | | | — | | | | — | | | | — | |
| Reinvestment of distributions | | | 5,682 | | | | 64,504 | | | | 8,628 | | | | 99,015 | |
| Cost of Shares redeemed | | | (328,141 | ) | | | (3,722,309 | ) | | | (122,815 | ) | | | (1,417,373 | ) |
| Change from Class C Share Transactions | | | (236,731 | ) | | | (2,689,440 | ) | | | (89,787 | ) | | | (1,038,952 | ) |
| Class Y(C) | | | | | | | | | | | | | | | | |
| Proceeds from Shares issued | | | 231,046 | | | | 2,594,686 | | | | 411,840 | | | | 4,721,220 | |
| Proceeds from Shares issued in connection with merger(B) | | | — | | | | — | | | | — | | | | — | |
| Reinvestment of distributions | | | 8,367 | | | | 94,690 | | | | 4,519 | | | | 51,370 | |
| Cost of Shares redeemed | | | (384,632 | ) | | | (4,349,670 | ) | | | (10,935 | ) | | | (124,361 | ) |
| Change from Class Y Share Transactions | | | (145,219 | ) | | | (1,660,294 | ) | | | 405,424 | | | | 4,648,229 | |
| Institutional Class(D) | | | | | | | | | | | | | | | | |
| Proceeds from Shares issued | | | 759,782 | | | | 8,629,842 | | | | 58,836 | | | | 681,123 | |
| Proceeds from Shares issued in connection with merger(B) | | | — | | | | — | | | | — | | | | — | |
| Reinvestment of distributions | | | 11,514 | | | | 131,506 | | | | 1,256 | | | | 14,365 | |
| Cost of Shares redeemed | | | (141,067 | ) | | | (1,598,519 | ) | | | (10,892 | ) | | | (126,022 | ) |
| Change from Institutional Class Share Transactions | | | 630,229 | | | | 7,162,829 | | | | 49,200 | | | | 569,466 | |
| Class R6 | | | | | | | | | | | | | | | | |
| Proceeds from Shares issued | | | — | | | | — | | | | — | | | | — | |
| Reinvestment of distributions | | | — | | | | — | | | | — | | | | — | |
| Cost of Shares redeemed | | | — | | | | — | | | | — | | | | — | |
| Change from Class R6 Share Transactions | | | — | | | | — | | | | — | | | | — | |
| Change from Share Transactions | | | (23,185 | ) | | $ | (261,058 | ) | | | (187,876 | ) | | $ | (2,169,116 | ) |
| (A) | The Fund changed its fiscal year from November 30 to June 30. |
| (B) | See Note 9 in Notes to Financial Statements. |
| (C) | Effective October 28, 2017, Class I shares of the Sentinel Small Company Fund (the “Predecessor Fund”) were reorganized into Class Y shares of the Touchstone Small Company Fund. |
| (D) | The Small Company Fund began issuing Institutional Class shares on October 30, 2017. |
See accompanying Notes to Financial Statements.
Statements of Changes in Net Assets - Capital Stock Activity (Continued)
| | | | | | | Touchstone Small Company Fund | | | | | | | |
| For the | | | For the Seven Months | | | For the Year | |
| Year Ended | | | Ended | | | Ended | |
| June 30, 2019 | | | June 30, 2018(A) | | | November 30, 2017(B) | |
| Shares | | | Dollars | | | Shares | | | Dollars | | | Shares | | | Dollars | |
| | | | | | | | | | | | | | | | | |
| $ | 16,731,844 | | | $ | 80,853,774 | | | | 5,895,776 | | | $ | 31,725,207 | | | | 12,736,974 | | | $ | 64,922,273 | |
| | | | | | | | | | | | | | | | | | | | | | | |
| | 3,572,822 | | | | 21,326,954 | | | | — | | | | — | | | | — | | | | — | |
| | 14,442,575 | | | | 65,858,483 | | | | 9,931,506 | | | | 51,941,762 | | | | 10,260,090 | | | | 50,274,442 | |
| | (32,140,085 | ) | | | (163,567,335 | ) | | | (16,353,009 | ) | | | (88,164,421 | ) | | | (35,156,499 | ) | | | (181,071,810 | ) |
| | 2,607,156 | | | | 4,471,876 | | | | (525,727 | ) | | | (4,497,452 | ) | | | (12,159,435 | ) | | | (65,875,095 | ) |
| | | | | | | | | | | | | | | | | | | | | | | |
| | 1,559,656 | | | | 4,910,361 | | | | 1,201,762 | | | | 3,809,548 | | | | 4,275,835 | | | | 13,492,231 | |
| | | | | | | | | | | | | | | | | | | | | | | |
| | 1,917,820 | | | | 6,665,795 | | | | — | | | | — | | | | — | | | | — | |
| | 7,546,781 | | | | 18,036,807 | | | | 4,368,606 | | | | 13,367,905 | | | | 4,154,959 | | | | 12,714,176 | |
| | (25,485,447 | ) | | | (64,901,221 | ) | | | (5,246,225 | ) | | | (16,802,180 | ) | | | (11,339,284 | ) | | | (36,511,088 | ) |
| | (14,461,190 | ) | | | (35,288,258 | ) | | | 324,143 | | | | 375,273 | | | | (2,908,490 | ) | | | (10,304,681 | ) |
| | | | | | | | | | | | | | | | | | | | | | | |
| | 16,511,884 | | | | 94,236,360 | | | | 10,885,478 | | | | 63,650,858 | | | | 33,014,830 | | | | 182,189,524 | |
| | | | | | | | | | | | | | | | | | | | | | | |
| | 11,284,528 | | | | 73,494,700 | | | | — | | | | — | | | | — | | | | — | |
| | 7,860,688 | | | | 39,597,755 | | | | 4,412,737 | | | | 25,152,605 | | | | 3,158,900 | | | | 16,678,996 | |
| | (37,969,485 | ) | | | (216,189,336 | ) | | | (15,544,983 | ) | | | (91,507,813 | ) | | | (18,800,069 | ) | | | (104,298,111 | ) |
| | (2,312,385 | ) | | | (8,860,521 | ) | | | (246,768 | ) | | | (2,704,350 | ) | | | 17,373,661 | | | | 94,570,409 | |
| | | | | | | | | | | | | | | | | | | | | | | |
| | 609,671 | | | | 3,527,675 | | | | 878 | | | | 5,183 | | | | 431 | | | | 2,500 | |
| | | | | | | | | | | | | | | | | | | | | | | |
| | 556,531 | | | | 3,625,412 | | | | — | | | | — | | | | — | | | | — | |
| | 17,201 | | | | 86,450 | | | | 36 | | | | 203 | | | | — | | | | — | |
| | (768,175 | ) | | | (4,851,081 | ) | | | — | | | | — | | | | — | | | | — | |
| | 415,228 | | | | 2,388,456 | | | | 914 | | | | 5,386 | | | | 431 | | | | 2,500 | |
| | | | | | | | | | | | | | | | | | | | | | | |
| | 21,896,944 | | | | 120,345,208 | | | | 2,887,650 | | | | 16,010,197 | | | | 11,135,743 | | | | 58,124,146 | |
| | 1,780,528 | | | | 8,323,538 | | | | 1,038,392 | | | | 5,534,630 | | | | 206,788 | | | | 1,025,672 | |
| | (9,403,473 | ) | | | (48,872,886 | ) | | | (2,127,109 | ) | | | (11,621,254 | ) | | | (2,126,522 | ) | | | (11,247,315 | ) |
| | 14,273,999 | | | | 79,795,860 | | | | 1,798,933 | | | | 9,923,573 | | | | 9,216,009 | | | | 47,902,503 | |
| | 522,808 | | | $ | 42,507,413 | | | | 1,351,495 | | | $ | 3,102,430 | | | | 11,522,176 | | | $ | 66,295,636 | |
Statements of Changes in Net Assets - Capital Stock Activity (Continued)
| | | Touchstone Value Fund | |
| | | For the | | | For the | |
| | | Year Ended | | | Year Ended | |
| | | June 30, 2019 | | | June 30, 2018 | |
| | | Shares | | | Dollars | | | Shares | | | Dollars | |
| Class A | | | | | | | | | | | | | | | | |
| Proceeds from Shares issued | | | 342,319 | | | $ | 3,126,791 | | | | 220,556 | | | $ | 2,207,890 | |
| Reinvestment of distributions | | | 471,809 | | | | 4,130,251 | | | | 327,947 | | | | 3,256,583 | |
| Cost of Shares redeemed | | | (1,036,154 | ) | | | (9,313,809 | ) | | | (1,125,388 | ) | | | (11,384,407 | ) |
| Change from Class A Share Transactions | | | (222,026 | ) | | | (2,056,767 | ) | | | (576,885 | ) | | | (5,919,934 | ) |
| Class C | | | | | | | | | | | | | | | | |
| Proceeds from Shares issued | | | 181,399 | | | | 1,683,899 | | | | 12,381 | | | | 124,927 | |
| Reinvestment of distributions | | | 38,060 | | | | 330,556 | | | | 27,913 | | | | 275,950 | |
| Cost of Shares redeemed | | | (250,222 | ) | | | (2,284,487 | ) | | | (116,542 | ) | | | (1,169,914 | ) |
| Change from Class C Share Transactions | | | (30,763 | ) | | | (270,032 | ) | | | (76,248 | ) | | | (769,037 | ) |
| Class Y | | | | | | | | | | | | | | | | |
| Proceeds from Shares issued | | | 2,222,254 | | | | 20,763,333 | | | | 1,420,393 | | | | 14,432,337 | |
| Reinvestment of distributions | | | 1,206,086 | | | | 10,617,220 | | | | 729,059 | | | | 7,268,521 | |
| Cost of Shares redeemed | | | (1,823,552 | ) | | | (16,924,844 | ) | | | (2,172,809 | ) | | | (22,089,267 | ) |
| Change from Class Y Share Transactions | | | 1,604,788 | | | | 14,455,709 | | | | (23,357 | ) | | | (388,409 | ) |
| Institutional Class | | | | | | | | | | | | | | | | |
| Proceeds from Shares issued | | | 3,608,349 | | | | 34,039,839 | | | | 4,724,179 | | | | 47,634,334 | |
| Reinvestment of distributions | | | 2,943,095 | | | | 25,920,663 | | | | 2,318,457 | | | | 23,063,384 | |
| Cost of Shares redeemed | | | (10,819,317 | ) | | | (110,432,569 | ) | | | (5,164,702 | ) | | | (51,982,165 | ) |
| Change from Institutional Class Share Transactions | | | (4,267,873 | ) | | | (50,472,067 | ) | | | 1,877,934 | | | | 18,715,553 | |
| Change from Share Transactions | | | (2,915,874 | ) | | $ | (38,343,157 | ) | | | 1,201,444 | | | $ | 11,638,173 | |
See accompanying Notes to Financial Statements.
Financial Highlights
Touchstone Balanced Fund—Class A
Selected Data for a Share Outstanding Throughout Each Period
| | | Year | | | Seven Months | | | | | | | | | | | | | |
| | | Ended | | | Ended | | | | | | | | | | | | | |
| | | June 30, | | | June 30, | | | Year Ended November 30, |
| | | | 2019 | | | | 2018(A) | | | | 2017 | | | | 2016 | | | | 2015 | | | | 2014 | |
| Net asset value at beginning of period | | $ | 21.54 | | | $ | 22.40 | | | $ | 19.68 | | | $ | 19.87 | | | $ | 20.98 | | | $ | 20.23 | |
| Income (loss) from investment operations: | | | | | | | | | | | | | | | | | | | | | | | | |
| Net investment income | | | 0.32 | | | | 0.16 | | | | 0.21 | | | | 0.23 | (B) | | | 0.43 | (B) | | | 0.26 | (B) |
| Net realized and unrealized gains (losses) on investments | | | 1.73 | | | | 0.22 | | | | 2.89 | | | | 0.66 | | | | (0.35 | ) | | | 1.50 | |
| Total from investment operations | | | 2.05 | | | | 0.38 | | | | 3.10 | | | | 0.89 | | | | 0.08 | | | | 1.76 | |
| Distributions from: | | | | | | | | | | | | | | | | | | | | | | | | |
| Net investment income | | | (0.34 | ) | | | (0.18 | ) | | | (0.25 | ) | | | (0.44 | ) | | | (0.30 | ) | | | (0.26 | ) |
| Realized capital gains | | | (1.07 | ) | | | (1.06 | ) | | | (0.13 | ) | | | (0.64 | ) | | | (0.89 | ) | | | (0.75 | ) |
| Total distributions | | | (1.41 | ) | | | (1.24 | ) | | | (0.38 | ) | | | (1.08 | ) | | | (1.19 | ) | | | (1.01 | ) |
| Net asset value at end of period | | $ | 22.18 | | | $ | 21.54 | | | $ | 22.40 | | | $ | 19.68 | | | $ | 19.87 | | | $ | 20.98 | |
| Total return(C) | | | 10.13 | % | | | 1.72 | %(D) | | | 15.95 | % | | | 4.75 | % | | | 0.56 | % | | | 9.10 | % |
| Ratios and supplemental data: | | | | | | | | | | | | | | | | | | | | | | | | |
| Net assets at end of period (000’s) | | $ | 244,037 | | | $ | 239,056 | | | $ | 258,279 | | | $ | 264,910 | | | $ | 263,276 | | | $ | 278,385 | |
| Ratio to average net assets: | | | | | | | | | | | | | | | | | | | | | | | | |
| Net expenses | | | 1.01 | % | | | 1.01 | %(E) | | | 1.03 | % | | | 1.01 | % | | | 1.04 | % | | | 1.07 | % |
| Gross expenses | | | 1.09 | % | | | 1.07 | %(E) | | | 1.04 | % | | | 1.01 | % | | | 1.04 | % | | | 1.07 | % |
| Net investment income | | | 1.49 | % | | | 1.24 | %(E) | | | 0.99 | % | | | 1.20 | % | | | 2.17 | %(F) | | | 1.29 | % |
| Portfolio turnover rate | | | 81 | % | | | 119 | %(D) | | | 46 | % | | | 45 | % | | | 86 | % | | | 94 | % |
Touchstone Balanced Fund—Class C
Selected Data for a Share Outstanding Throughout Each Period
| | | Year | | | Seven Months | | | | | | | | | | | | | |
| | | Ended | | | Ended | | | | | | | | | | | | | |
| | | June 30, | | | June 30, | | | Year Ended November 30, |
| | | 2019 | | | 2018(A) | | | 2017 | | | 2016 | | | 2015 | | | 2014 | |
| Net asset value at beginning of period | | $ | 21.63 | | | $ | 22.46 | | | $ | 19.73 | | | $ | 19.93 | | | $ | 21.04 | | | $ | 20.27 | |
| Income (loss) from investment operations: | | | | | | | | | | | | | | | | | | | | | | | | |
| Net investment income | | | 0.15 | | | | 0.06 | | | | 0.04 | | | | 0.08 | (B) | | | 0.28 | (B) | | | 0.11 | (B) |
| Net realized and unrealized gains (losses) on investments | | | 1.75 | | | | 0.22 | | | | 2.91 | | | | 0.66 | | | | (0.35 | ) | | | 1.51 | |
| Total from investment operations | | | 1.90 | | | | 0.28 | | | | 2.95 | | | | 0.74 | | | | (0.07 | ) | | | 1.62 | |
| Distributions from: | | | | | | | | | | | | | | | | | | | | | | | | |
| Net investment income | | | (0.17 | ) | | | (0.05 | ) | | | (0.09 | ) | | | (0.30 | ) | | | (0.15 | ) | | | (0.10 | ) |
| Realized capital gains | | | (1.07 | ) | | | (1.06 | ) | | | (0.13 | ) | | | (0.64 | ) | | | (0.89 | ) | | | (0.75 | ) |
| Total distributions | | | (1.24 | ) | | | (1.11 | ) | | | (0.22 | ) | | | (0.94 | ) | | | (1.04 | ) | | | (0.85 | ) |
| Net asset value at end of period | | $ | 22.29 | | | $ | 21.63 | | | $ | 22.46 | | | $ | 19.73 | | | $ | 19.93 | | | $ | 21.04 | |
| Total return(C) | | | 9.33 | % | | | 1.25 | %(D) | | | 15.09 | % | | | 3.91 | % | | | (0.23 | %) | | | 8.34 | % |
| Ratios and supplemental data: | | | | | | | | | | | | | | | | | | | | | | | | |
| Net assets at end of period (000’s) | | $ | 34,380 | | | $ | 39,769 | | | $ | 42,800 | | | $ | 43,066 | | | $ | 35,344 | | | $ | 32,002 | |
| Ratio to average net assets: | | | | | | | | | | | | | | | | | | | | | | | | |
| Net expenses | | | 1.78 | % | | | 1.78 | %(E) | | | 1.79 | % | | | 1.78 | % | | | 1.82 | % | | | 1.82 | % |
| Gross expenses | | | 1.89 | % | | | 1.86 | %(E) | | | 1.81 | % | | | 1.78 | % | | | 1.82 | % | | | 1.82 | % |
| Net investment income | | | 0.72 | % | | | 0.47 | %(E) | | | 0.23 | % | | | 0.43 | % | | | 1.39 | %(F) | | | 0.53 | % |
| Portfolio turnover rate | | | 81 | % | | | 119 | %(D) | | | 46 | % | | | 45 | % | | | 86 | % | | | 94 | % |
| (A) | The Fund changed its fiscal year end from November 30 to June 30. |
| (B) | The net investment income per share was based on average shares outstanding for the period. |
| (C) | Total returns shown exclude the effect of applicable sales loads and fees. If these charges were included, the returns would be lower. |
| (D) | Not annualized. |
| (E) | Annualized. |
| (F) | Includes the impact of special dividends resulting from an acquisition of Covidien plc by Medtronic, Inc. on January 26, 2015 through the formation of a new holding company, Medtronic plc, incorporated in Ireland. These special dividends enhanced the ratios of net investment income for Class A and Class C shares by 0.86% for the fiscal year ended November 30, 2015. |
See accompanying Notes to Financial Statements.
Financial Highlights(Continued)
Touchstone Balanced Fund—Class Y
Selected Data for a Share Outstanding Throughout Each Period
| | | Year | | | Seven Months | | | | | | | | | | | | | |
| | | Ended | | | Ended | | | | | | | | | | | | | |
| | | June 30, | | | June 30, | | | Year Ended June 30, |
| | | | 2019 | | | | 2018(A) | | | | 2017(B) | | | | 2016 | | | | 2015 | | | | 2014 | |
| Net asset value at beginning of period | | $ | 21.39 | | | $ | 22.26 | | | $ | 19.57 | | | $ | 19.78 | | | $ | 20.90 | | | $ | 20.15 | |
| Income (loss) from investment operations: | | | | | | | | | | | | | | | | | | | | | | | | |
| Net investment income | | | 0.35 | | | | 0.19 | | | | 0.28 | | | | 0.27 | (C) | | | 0.47 | (C) | | | 0.31 | (C) |
| Net realized and unrealized gains (losses) on investments | | | 1.72 | | | | 0.22 | | | | 2.84 | | | | 0.65 | | | | (0.34 | ) | | | 1.50 | |
| Total from investment operations | | | 2.07 | | | | 0.41 | | | | 3.12 | | | | 0.92 | | | | 0.13 | | | | 1.81 | |
| Distributions from: | | | | | | | | | | | | | | | | | | | | | | | | |
| Net investment income | | | (0.38 | ) | | | (0.22 | ) | | | (0.30 | ) | | | (0.49 | ) | | | (0.36 | ) | | | (0.31 | ) |
| Realized capital gains | | | (1.07 | ) | | | (1.06 | ) | | | (0.13 | ) | | | (0.64 | ) | | | (0.89 | ) | | | (0.75 | ) |
| Total distributions | | | (1.45 | ) | | | (1.28 | ) | | | (0.43 | ) | | | (1.13 | ) | | | (1.25 | ) | | | (1.06 | ) |
| Net asset value at end of period | | $ | 22.01 | | | $ | 21.39 | | | $ | 22.26 | | | $ | 19.57 | | | $ | 19.78 | | | $ | 20.90 | |
| Total return | | | 10.33 | % | | | 1.86 | %(D) | | | 16.20 | % | | | 4.94 | % | | | 0.79 | % | | | 9.43 | % |
| Ratios and supplemental data: | | | | | | | | | | | | | | | | | | | | | | | | |
| Net assets at end of period (000’s) | | $ | 60,638 | | | $ | 30,612 | | | $ | 31,215 | | | $ | 14,477 | | | $ | 12,589 | | | $ | 17,062 | |
| Ratio to average net assets: | | | | | | | | | | | | | | | | | | | | | | | | |
| Net expenses | | | 0.81 | % | | | 0.81 | %(E) | | | 0.78 | % | | | 0.81 | % | | | 0.81 | % | | | 0.80 | % |
| Gross expenses | | | 0.88 | % | | | 0.90 | %(E) | | | 0.80 | % | | | 0.81 | % | | | 0.81 | % | | | 0.80 | % |
| Net investment income | | | 1.69 | % | | | 1.44 | %(E) | | | 1.25 | % | | | 1.41 | % | | | 2.39 | %(F) | | | 1.55 | % |
| Portfolio turnover rate | | | 81 | % | | | 119 | %(D) | | | 46 | % | | | 45 | % | | | 86 | % | | | 94 | % |
| (A) | The Fund changed its fiscal year end from November 30 to June 30. |
| (B) | Effective October 28, 2017, Class I shares of the Sentinel Balanced Fund (the “Predecessor Fund”) were reorganized into Class Y shares of the Fund. |
| (C) | The net investment income per share was based on average shares outstanding for the period. |
| (D) | Not annualized. |
| (E) | Annualized. |
| (F) | Includes the impact of special dividends resulting from an acquisition of Covidien plc by Medtronic, Inc. on January 26, 2015 through the formation of a new holding company, Medtronic plc, incorporated in Ireland. These special dividends enhanced the ratios of net investment income for Class Y shares by 0.86% for the fiscal year ended November 30, 2015. |
See accompanying Notes to Financial Statements.
Financial Highlights(Continued)
Touchstone Credit Opportunities Fund—Class A
Selected Data for a Share Outstanding Throughout Each Period
| | | | | | | | | | | | Period Ended | |
| | | Year Ended June 30, | | | June 30, | |
| | | 2019 | | | 2018 | | | 2017 | | | 2016(A) | |
| Net asset value at beginning of period | | $ | 9.96 | | | $ | 10.41 | | | $ | 10.05 | | | $ | 10.00 | |
| Income (loss) from investment operations: | | | | | | | | | | | | | | | | |
| Net investment income | | | 0.52 | | | | 0.49 | | | | 0.45 | | | | 0.22 | |
| Net realized and unrealized gains (losses) on investments | | | 0.12 | | | | (0.13 | ) | | | 0.45 | | | | 0.07 | |
| Total from investment operations | | | 0.64 | | | | 0.36 | | | | 0.90 | | | | 0.29 | |
| Distributions from: | | | | | | | | | | | | | | | | |
| Net investment income | | | (0.54 | ) | | | (0.53 | ) | | | (0.47 | ) | | | (0.23 | ) |
| Realized capital gains | | | (0.11 | ) | | | (0.28 | ) | | | (0.07 | ) | | | (0.01 | ) |
| Total distributions | | | (0.65 | ) | | | (0.81 | ) | | | (0.54 | ) | | | (0.24 | ) |
| Net asset value at end of period | | $ | 9.95 | | | $ | 9.96 | | | $ | 10.41 | | | $ | 10.05 | |
| Total return(B) | | | 6.69 | % | | | 3.50 | % | | | 9.08 | % | | | 2.95 | %(C) |
| Ratios and supplemental data: | | | | | | | | | | | | | | | | |
| Net assets at end of period (000’s) | | $ | 226 | | | $ | 153 | | | $ | 45 | | | $ | 43 | |
| Ratio to average net assets: | | | | | | | | | | | | | | | | |
| Net expenses (including dividend and interestexpense on securities sold short)(D) | | | 1.55 | % | | | 1.76 | % | | | 1.87 | % | | | 1.73 | %(E) |
| Gross expenses (including dividend and interestexpense on securities sold short)(F) | | | 7.56 | % | | | 10.00 | % | | | 16.01 | % | | | 38.32 | %(E) |
| Net investment income | | | 5.46 | % | | | 5.00 | % | | | 4.44 | % | | | 3.53 | %(E) |
| Portfolio turnover rate | | | 94 | % | | | 70 | % | | | 84 | % | | | 91 | %(C) |
Touchstone Credit Opportunities Fund—Class C
Selected Data for a Share Outstanding Throughout Each Period
| | | | | | | | | | | | Period Ended | |
| | | Year Ended June 30, | | | June 30, | |
| | | 2019 | | | 2018 | | | 2017 | | | 2016(A) | |
| Net asset value at beginning of period | | $ | 10.00 | | | $ | 10.44 | | | $ | 10.08 | | | $ | 10.00 | |
| Income (loss) from investment operations: | | | | | | | | | | | | | | | | |
| Net investment income | | | 0.43 | | | | 0.44 | | | | 0.34 | | | | 0.17 | |
| Net realized and unrealized gains (losses) on investments | | | 0.14 | | | | (0.15 | ) | | | 0.48 | | | | 0.08 | |
| Total from investment operations | | | 0.57 | | | | 0.29 | | | | 0.82 | | | | 0.25 | |
| Distributions from: | | | | | | | | | | | | | | | | |
| Net investment income | | | (0.48 | ) | | | (0.45 | ) | | | (0.39 | ) | | | (0.16 | ) |
| Realized capital gains | | | (0.11 | ) | | | (0.28 | ) | | | (0.07 | ) | | | (0.01 | ) |
| Total distributions | | | (0.59 | ) | | | (0.73 | ) | | | (0.46 | ) | | | (0.17 | ) |
| Net asset value at end of period | | $ | 9.98 | | | $ | 10.00 | | | $ | 10.44 | | | $ | 10.08 | |
| Total return(B) | | | 5.97 | % | | | 2.69 | % | | | 8.31 | % | | | 2.59 | %(C) |
| Ratios and supplemental data: | | | | | | | | | | | | | | | | |
| Net assets at end of period (000’s) | | $ | 127 | | | $ | 22 | | | $ | 22 | | | $ | 6 | |
| Ratio to average net assets: | | | | | | | | | | | | | | | | |
| Net expenses (including dividend and interestexpense on securities sold short)(D) | | | 2.26 | % | | | 2.51 | % | | | 2.62 | % | | | 2.48 | %(E) |
| Gross expenses (including dividend and interestexpense on securities sold short)(F) | | | 11.81 | % | | | 34.60 | % | | | 73.30 | % | | | 276.34 | %(E) |
| Net investment income | | | 4.75 | % | | | 4.25 | % | | | 3.69 | % | | | 2.79 | %(E) |
| Portfolio turnover rate | | | 94 | % | | | 70 | % | | | 84 | % | | | 91 | %(C) |
| (A) | Represents the period from commencement of operations (September 1, 2015) through June 30, 2016. |
| (B) | Total returns shown exclude the effect of applicable sales loads and fees. If these charges were included, the returns would be lower. |
| (C) | Not annualized. |
| (D) | The ratio of net expenses to average net assets excluding dividend and interest expense on securities sold short for Class A was 1.45%, 1.69%, 1.69% and 1.69% and for Class C was 2.16%, 2.44%, 2.44% and 2.44% for the years ended June 30, 2019, 2018, 2017 and for the period ended June 30, 2016, respectively. |
| (E) | Annualized. |
| (F) | The ratio of gross expenses to average net assets excluding dividend and interest expense on securities sold short for Class A was 7.46%, 9.93%, 15.83% and 38.28% and for Class C was 11.71%, 34.53%, 73.12% and 276.30% for the years ended June 30, 2019, 2018, 2017 and for the period ended June 30, 2016, respectively. |
See accompanying Notes to Financial Statements.
Financial Highlights(Continued)
Touchstone Credit Opportunities Fund—Class Y
Selected Data for a Share Outstanding Throughout Each Period
| | | | | | | | | | | | Period Ended | |
| | | Year Ended June 30, | | | June 30, | |
| | | 2019 | | | 2018 | | | 2017 | | | 2016(A) | |
| Net asset value at beginning of period | | $ | 9.96 | | | $ | 10.41 | | | $ | 10.04 | | | $ | 10.00 | |
| Income (loss) from investment operations: | | | | | | | | | | | | | | | | |
| Net investment income | | | 0.60 | | | | 0.50 | | | | 0.39 | | | | 0.31 | |
| Net realized and unrealized gains (losses) on investments | | | 0.06 | | | | (0.12 | ) | | | 0.54 | | | | (0.02 | ) |
| Total from investment operations | | | 0.66 | | | | 0.38 | | | | 0.93 | | | | 0.29 | |
| Distributions from: | | | | | | | | | | | | | | | | |
| Net investment income | | | (0.56 | ) | | | (0.55 | ) | | | (0.49 | ) | | | (0.24 | ) |
| Realized capital gains | | | (0.11 | ) | | | (0.28 | ) | | | (0.07 | ) | | | (0.01 | ) |
| Total distributions | | | (0.67 | ) | | | (0.83 | ) | | | (0.56 | ) | | | (0.25 | ) |
| Net asset value at end of period | | $ | 9.95 | | | $ | 9.96 | | | $ | 10.41 | | | $ | 10.04 | |
| Total return | | | 7.05 | % | | | 3.73 | % | | | 9.39 | % | | | 3.04 | %(B) |
| Ratios and supplemental data: | | | | | | | | | | | | | | | | |
| Net assets at end of period (000’s) | | $ | 11,356 | | | $ | 444 | | | $ | 315 | | | $ | 3 | |
| Ratio to average net assets: | | | | | | | | | | | | | | | | |
| Net expenses (including dividend and interestexpense on securities sold short)(C) | | | 1.09 | % | | | 1.51 | % | | | 1.62 | % | | | 1.48 | %(D) |
| Gross expenses (including dividend and interestexpense on securities sold short)(E) | | | 1.71 | % | | | 4.29 | % | | | 8.25 | % | | | 355.77 | %(D) |
| Net investment income | | | 5.93 | % | | | 5.25 | % | | | 4.69 | % | | | 3.79 | %(D) |
| Portfolio turnover rate | | | 94 | % | | | 70 | % | | | 84 | % | | | 91 | %(B) |
Touchstone Credit Opportunities Fund—Institutional Class
Selected Data for a Share Outstanding Throughout Each Period
| | | | | | | | | | | | Period Ended | |
| | | Year Ended June 30, | | | June 30, | |
| | | 2019 | | | 2018 | | | 2017 | | | 2016(A) | |
| Net asset value at beginning of period | | $ | 9.96 | | | $ | 10.41 | | | $ | 10.05 | | | $ | 10.00 | |
| Income (loss) from investment operations: | | | | | | | | | | | | | | | | |
| Net investment income | | | 0.58 | | | | 0.55 | | | | 0.50 | | | | 0.28 | |
| Net realized and unrealized gains (losses) on | | | | | | | | | | | | | | | | |
| investments | | | 0.09 | | | | (0.16 | ) | | | 0.43 | | | | 0.03 | |
| Total from investment operations | | | 0.67 | | | | 0.39 | | | | 0.93 | | | | 0.31 | |
| Distributions from: | | | | | | | | | | | | | | | | |
| Net investment income | | | (0.57 | ) | | | (0.56 | ) | | | (0.50 | ) | | | (0.25 | ) |
| Realized capital gains | | | (0.11 | ) | | | (0.28 | ) | | | (0.07 | ) | | | (0.01 | ) |
| Total distributions | | | (0.68 | ) | | | (0.84 | ) | | | (0.57 | ) | | | (0.26 | ) |
| Net asset value at end of period | | $ | 9.95 | | | $ | 9.96 | | | $ | 10.41 | | | $ | 10.05 | |
| Total return | | | 7.04 | % | | | 3.85 | % | | | 9.47 | % | | | 3.22 | %(B) |
| Ratios and supplemental data: | | | | | | | | | | | | | | | | |
| Net assets at end of period (000’s) | | $ | 47,531 | | | $ | 51,715 | | | $ | 53,150 | | | $ | 54,411 | |
| Ratio to average net assets: | | | | | | | | | | | | | | | | |
| Net expenses (including dividend and interestexpense on securities sold short)(C) | | | 1.24 | % | | | 1.41 | % | | | 1.52 | % | | | 1.38 | %(D) |
| Gross expenses (including dividend and interestexpense on securities sold short)(E) | | | 1.50 | % | | | 1.59 | % | | | 1.69 | % | | | 1.65 | %(D) |
| Net investment income | | | 5.78 | % | | | 5.35 | % | | | 4.79 | % | | | 3.88 | %(D) |
| Portfolio turnover rate | | | 94 | % | | | 70 | % | | | 84 | % | | | 91 | %(B) |
| (A) | Represents the period from commencement of operations (September 1, 2015) through June 30, 2016. |
| (C) | The ratio of net expenses to average net assets excluding dividend and interest expense on securities sold short for Class Y was 0.99%, 1.44%, 1.44% and 1.44% and for Institutional Class was 1.14%, 1.34%, 1.34% and 1.34% for the years ended June 30, 2019, 2018, 2017 and for the period ended June 30, 2016, respectively. |
| (E) | The ratio of gross expenses to average net assets excluding dividend and interest expense on securities sold short for Class Y was 1.61%, 4.22%, 8.07% and 355.73% and for Institutional Class was 1.40%, 1.52%, 1.51% and 1.61% for the years ended June 30, 2019, 2018, 2017 and for the period ended June 30, 2016, respectively. |
See accompanying Notes to Financial Statements.
Financial Highlights(Continued)
Touchstone International Equity Fund—Class A
Selected Data for a Share Outstanding Throughout Each Period
| | | Year | | | Seven Months | | | | | | | | | | | | | |
| | | Ended | | | Ended | | | | | | | | | | | | | |
| | | June 30, | | | June 30, | | | Year Ended November 30, | |
| | | | 2019 | | | | 2018(A) | | | | 2017 | | | | 2016 | | | | 2015 | | | | 2014 | |
| Net asset value at beginning of period | | $ | 18.15 | | | $ | 19.64 | | | $ | 15.52 | | | $ | 16.92 | | | $ | 19.61 | | | $ | 20.18 | |
| Income (loss) from investment operations: | | | | | | | | | | | | | | | | | | | | | | | | |
| Net investment income | | | 0.20 | (B) | | | 0.36 | (C) | | | 0.17 | | | | 0.18 | (B) | | | 0.13 | (B) | | | 0.25 | (B) |
| Net realized and unrealized gains (losses) on investments | | | (0.57 | ) | | | (0.94 | ) | | | 4.05 | | | | (0.97 | ) | | | 0.47 | | | | (0.61 | ) |
| Total from investment operations | | | (0.37 | ) | | | (0.58 | ) | | | 4.22 | | | | (0.79 | ) | | | 0.60 | | | | (0.36 | ) |
| Distributions from: | | | | | | | | | | | | | | | | | | | | | | | | |
| Net investment income | | | (0.26 | ) | | | (0.21 | ) | | | (0.10 | ) | | | (0.12 | ) | | | (0.34 | ) | | | (0.21 | ) |
| Realized capital gains | | | (1.87 | ) | | | (0.70 | ) | | | — | | | | (0.49 | ) | | | (2.95 | ) | | | — | |
| Total distributions | | | (2.13 | ) | | | (0.91 | ) | | | (0.10 | ) | | | (0.61 | ) | | | (3.29 | ) | | | (0.21 | ) |
| Net asset value at end of period | | $ | 15.65 | | | $ | 18.15 | | | $ | 19.64 | | | $ | 15.52 | | | $ | 16.92 | | | $ | 19.61 | |
| Total return(D) | | | (0.78 | %) | | | (3.23 | %)(E) | | | 27.39 | % | | | (4.81 | %) | | | 4.49 | % | | | (1.81 | %) |
| Ratios and supplemental data: | | | | | | | | | | | | | | | | | | | | | | | | |
| Net assets at end of period (000’s) | | $ | 106,870 | | | $ | 118,391 | | | $ | 129,139 | | | $ | 114,616 | | | $ | 113,212 | | | $ | 115,216 | |
| Ratio to average net assets: | | | | | | | | | | | | | | | | | | | | | | | | |
| Net expenses | | | 1.30 | % | | | 1.23 | %(F) | | | 1.37 | % | | | 1.36 | % | | | 1.41 | % | | | 1.41 | % |
| Gross expenses | | | 1.37 | % | | | 1.30 | %(F) | | | 1.39 | % | | | 1.36 | % | | | 1.41 | % | | | 1.41 | % |
| Net investment income | | | 1.26 | % | | | 3.22 | %(C)(F) | | | 0.92 | % | | | 1.11 | % | | | 0.76 | % | | | 1.22 | % |
| Portfolio turnover rate | | | 43 | % | | | 26 | %(E) | | | 37 | % | | | 36 | % | | | 55 | % | | | 50 | % |
Touchstone International Equity Fund — Class C
Selected Data for a Share Outstanding Throughout Each Period
| | | Year | | | Seven Months | | | | | | | | | | | | | |
| | | Ended | | | Ended | | | | | | | | | | | | | |
| | | June 30, | | | June 30, | | | Year Ended November 30, | |
| | | | 2019 | | | | 2018(A) | | | | 2017 | | | | 2016 | | | | 2015 | | | | 2014 | |
| Net asset value at beginning of period | | $ | 17.12 | | | $ | 18.46 | | | $ | 14.66 | | | $ | 16.06 | | | $ | 18.71 | | | $ | 19.34 | |
| Income (loss) from investment operations: | | | | | | | | | | | | | | | | | | | | | | | | |
| Net investment income (loss) | | | 0.03 | (B) | | | 0.26 | (C) | | | (0.06 | ) | | | (0.01 | )(B) | | | (0.10 | )(B) | | | (0.04 | )(B) |
| Net realized and unrealized gains (losses) on investments | | | (0.54 | ) | | | (0.90 | ) | | | 3.86 | | | | (0.90 | ) | | | 0.47 | | | | (0.59 | ) |
| Total from investment operations | | | (0.51 | ) | | | (0.64 | ) | | | 3.80 | | | | (0.91 | ) | | | 0.37 | | | | (0.63 | ) |
| Distributions from: | | | | | | | | | | | | | | | | | | | | | | | | |
| Net investment income | | | (0.10 | ) | | | — | | | | — | | | | — | | | | (0.07 | ) | | | — | |
| Realized capital gains | | | (1.87 | ) | | | (0.70 | ) | | | — | | | | (0.49 | ) | | | (2.95 | ) | | | — | |
| Total distributions | | | (1.97 | ) | | | (0.70 | ) | | | — | | | | (0.49 | ) | | | (3.02 | ) | | | — | |
| Net asset value at end of period | | $ | 14.64 | | | $ | 17.12 | | | $ | 18.46 | | | $ | 14.66 | | | $ | 16.06 | | | $ | 18.71 | |
| Total return(D) | | | (1.87 | %) | | | (3.72 | %)(E) | | | 25.92 | % | | | (5.82 | %) | | | 3.14 | % | | | (3.26 | %) |
| Ratios and supplemental data: | | | | | | | | | | | | | | | | | | | | | | | | |
| Net assets at end of period (000’s) | | $ | 3,783 | | | $ | 6,737 | | | $ | 6,924 | | | $ | 5,876 | | | $ | 4,732 | | | $ | 3,581 | |
| Ratio to average net assets: | | | | | | | | | | | | | | | | | | | | | | | | |
| Net expenses | | | 2.34 | % | | | 2.18 | %(F) | | | 2.45 | % | | | 2.49 | % | | | 2.70 | % | | | 2.86 | % |
| Gross expenses | | | 2.42 | % | | | 2.25 | %(F) | | | 2.49 | % | | | 2.49 | % | | | 2.70 | % | | | 2.86 | % |
| Net investment income (loss) | | | 0.21 | % | | | 2.27 | %(C)(F) | | | (0.16 | %) | | | (0.04 | %) | | | (0.60 | %) | | | (0.23 | %) |
| Portfolio turnover rate | | | 43 | % | | | 26 | %(E) | | | 37 | % | | | 36 | % | | | 55 | % | | | 50 | % |
| (A) | The Fund changed its fiscal year end from November 30 to June 30. |
| (B) | The net investment income (loss) per share was based on average shares outstanding for the period. |
| (C) | Reflects the impact of a special dividend that resulted in a one-time increase to net investment income. If the special dividend had not occurred, the ratio of net investment income to average net assets would have been lower by 1.54% for Class A and Class C shares and the net investment income per share would have been lower by $0.17 and $0.16 for Class A and Class C shares, respectively. |
| (D) | Total returns shown exclude the effect of applicable sales loads and fees. If these charges were included, the returns would be lower. |
See accompanying Notes to Financial Statements.
Financial Highlights(Continued)
Touchstone International Equity Fund—Class Y
Selected Data for a Share Outstanding Throughout Each Period
| | | Year | | | Seven Months | | | | | | | | | | | | | |
| | | Ended | | | Ended | | | | | | | | | | | | | |
| | | June 30, | | | June 30, | | | Year Ended November 30, |
| | | 2019 | | | 2018(A) | | | 2017(B) | | | 2016 | | | 2015 | | | 2014 | |
| Net asset value at beginning of period | | $ | 17.93 | | | $ | 19.45 | | | $ | 15.40 | | | $ | 16.79 | | | $ | 19.53 | | | $ | 20.13 | |
| Income (loss) from investment operations: | | | | | | | | | | | | | | | | | | | | | | | | |
| Net investment income | | | 0.25 | (C) | | | 0.40 | (D) | | | 0.25 | | | | 0.23 | (C) | | | 0.18 | (C) | | | 0.38 | (C) |
| Net realized and unrealized gains | | | | | | | | | | | | | | | | | | | | | | | | |
| (losses) on investments | | | (0.57 | ) | | | (0.93 | ) | | | 3.98 | | | | (0.95 | ) | | | 0.47 | | | | (0.65 | ) |
| Total from investment operations | | | (0.32 | ) | | | (0.53 | ) | | | 4.23 | | | | (0.72 | ) | | | 0.65 | | | | (0.27 | ) |
| Distributions from: | | | | | | | | | | | | | | | | | | | | | | | | |
| Net investment income | | | (0.30 | ) | | | (0.29 | ) | | | (0.18 | ) | | | (0.18 | ) | | | (0.44 | ) | | | (0.33 | ) |
| Realized capital gains | | | (1.87 | ) | | | (0.70 | ) | | | — | | | | (0.49 | ) | | | (2.95 | ) | | | — | |
| Total distributions | | | (2.17 | ) | | | (0.99 | ) | | | (0.18 | ) | | | (0.67 | ) | | | (3.39 | ) | | | (0.33 | ) |
| Net asset value at end of period | | $ | 15.44 | | | $ | 17.93 | | | $ | 19.45 | | | $ | 15.40 | | | $ | 16.79 | | | $ | 19.53 | |
| Total return | | | (0.47 | %) | | | (3.05 | %)(E) | | | 27.78 | % | | | (4.41 | %) | | | 4.89 | % | | | (1.39 | %) |
| Ratios and supplemental data: | | $ | 42,120 | | | $ | 57,438 | | | $ | 63,320 | | | $ | 40,528 | | | $ | 14,967 | | | $ | 10,997 | |
| Net assets at end of period (000’s) | | | | | | | | | | | | | | | | | | | | | | | | |
| Ratio to average net assets: | | | | | | | | | | | | | | | | | | | | | | | | |
| Net expenses | | | 0.99 | % | | | 0.99 | %(F) | | | 1.01 | % | | | 0.99 | % | | | 1.02 | % | | | 0.92 | % |
| Gross expenses | | | 1.12 | % | | | 1.09 | %(F) | | | 1.03 | % | | | 0.99 | % | | | 1.02 | % | | | 0.92 | % |
| Net investment income | | | 1.57 | % | | | 3.47 | %(D)(F) | | | 1.28 | % | | | 1.45 | % | | | 1.05 | % | | | 1.91 | % |
| Portfolio turnover rate | | | 43 | % | | | 26 | %(E) | | | 37 | % | | | 36 | % | | | 55 | % | | | 50 | % |
Touchstone International Equity Fund—Institutional Class
Selected Data for a Share Outstanding Throughout Each Period
| | | Year | | | Seven Months | | | | |
| | | Ended | | | Ended | | | Period Ended | |
| | | June 30, | | | June 30, | | | November 30, | |
| | | 2019 | | | 2018(A) | | | 2017(G) | |
| Net asset value at beginning of period | | $ | 17.92 | | | | $ | 19.46 | | | | $ | 18.91 | |
| Income (loss) from investment operations: | | | | | | | | | | | | | | |
| Net investment income | | | 0.26 | (C) | | | | 0.56 | (D) | | | | 0.02 | |
| Net realized and unrealized gains (losses) on investments | | | (0.57 | ) | | | | (1.09 | ) | | | | 0.53 | |
| Total from investment operations | | | (0.31 | ) | | | | (0.53 | ) | | | | 0.55 | |
| Distributions from: | | | | | | | | | | | | | | |
| Net investment income | | | (0.32 | ) | | | | (0.31 | ) | | | | — | |
| Realized capital gains | | | (1.87 | ) | | | | (0.70 | ) | | | | — | |
| Total distributions | | | (2.19 | ) | | | | (1.01 | ) | | | | — | |
| Net asset value at end of period | | $ | 15.42 | | | | $ | 17.92 | | | | $ | 19.46 | |
| Total return | | | (0.39 | %) | | | | (3.02 | %)(E) | | | | 2.91 | %(E) |
| Ratios and supplemental data: | | | | | | | | | | | | | | |
| Net assets at end of period (000’s) | | $ | 2,592 | | | | $ | 2,260 | | | | $ | 3 | |
| Ratio to average net assets: | | | | | | | | | | | | | | |
| Net expenses | | | 0.89 | % | | | | 0.89 | %(F) | | | | 0.89 | %(F) |
| Gross expenses | | | 1.38 | % | | | | 1.63 | %(F) | | | | 1921.18 | %(F) |
| Net investment income | | | 1.67 | % | | | | 3.57 | %(D)(F) | | | | 1.40 | %(F) |
| Portfolio turnover rate | | | 43 | % | | | | 26 | %(E) | | | | 37 | %(E) |
| (A) | The Fund changed its fiscal year end from November 30 to June 30. |
| (B) | Effective October 28, 2017, Class I shares of the Sentinel Balanced Fund (the “Predecessor Fund”) were reorganized into Class Y shares of the Fund. |
| (C) | The net investment income per share was based on average shares outstanding for the period. |
| (D) | Reflects the impact of a special dividend that resulted in a one-time increase to net investment income. If the special dividend had not occurred, the ratio of net investment income to average net assets would have been lower by 1.54% for Class Y and Institutional Class shares and the net investment income per share would have been lower by $0.17 and $0.16 for Class Y and Institutional Class shares, respectively . |
| (E) | Not annualized. |
| (F) | Annualized. |
| (G) | Represents the period from commencement of operations (October 30, 2017) through November 30, 2017. |
See accompanying Notes to Financial Statements.
Financial Highlights(Continued)
Touchstone International Growth Opportunities Fund—Class A
Selected Data for a Share Outstanding Throughout Each Period
| | | | | | | | | Period Ended | |
| | | Year Ended June 30, | | | June 30, | |
| | | | 2019 | | | | 2018 | | | | 2017(A) | |
| Net asset value at beginning of period | | $ | 25.12 | | | $ | 22.25 | | | $ | 18.74 | (B) |
| Income (loss) from investment operations: | | | | | | | | | | | | |
| Net investment loss | | | (0.07 | )(C) | | | (0.01 | ) | | | (0.01 | ) |
| Net realized and unrealized gains (losses) on investments | | | (0.91 | ) | | | 3.34 | | | | 3.52 | |
| Total from investment operations | | | (0.98 | ) | | | 3.33 | | | | 3.51 | |
| Distributions from: | | | | | | | | | | | | |
| Realized capital gains | | | (2.85 | ) | | | (0.46 | ) | | | — | |
| Net asset value at end of period | | $ | 21.29 | | | $ | 25.12 | | | $ | 22.25 | |
| Total return(D) | | | (1.78 | %) | | | 15.00 | % | | | 18.73 | %(E) |
| Ratios and supplemental data: | | | | | | | | | | | | |
| Net assets at end of period (000’s) | | $ | 760 | | | $ | 918 | | | $ | 140 | |
| Ratio to average net assets: | | | | | | | | | | | | |
| Net expenses | | | 1.24 | % | | | 1.36 | % | | | 1.41 | %(F) |
| Gross expenses | | | 4.36 | % | | | 3.75 | % | | | 42.93 | %(F) |
| Net investment loss | | | (0.31 | %) | | | (0.05 | %) | | | (0.35 | %)(F) |
| Portfolio turnover rate | | | 103 | % | | | 109 | % | | | 72 | %(G) |
Touchstone International Growth Opportunities Fund—Class C
Selected Data for a Share Outstanding Throughout Each Period
| | | | | | Period Ended | |
| | | Year Ended June 30, | | | June 30, | |
| | | | 2019 | | | | 2018 | | | | 2017(A) | |
| Net asset value at beginning of period | | $ | 24.76 | | | $ | 22.10 | | | $ | 18.74 | (B) |
| Income (loss) from investment operations: | | | | | | | | | | | | |
| Net investment loss | | | (0.23 | )(C) | | | (0.11 | ) | | | (0.19 | ) |
| Net realized and unrealized gains (losses) on investments | | | (0.91 | ) | | | 3.23 | | | | 3.55 | |
| Total from investment operations | | | (1.14 | ) | | | 3.12 | | | | 3.36 | |
| Distributions from: | | | | | | | | | | | | |
| Realized capital gains | | | (2.85 | ) | | | (0.46 | ) | | | — | |
| Net asset value at end of period | | $ | 20.77 | | | $ | 24.76 | | | $ | 22.10 | |
| Total return(D) | | | (2.52 | %) | | | 14.14 | % | | | 17.93 | %(E) |
| Ratios and supplemental data: | | | | | | | | | | | | |
| Net assets at end of period (000’s) | | $ | 185 | | | $ | 436 | | | $ | 3 | |
| Ratio to average net assets: | | | | | | | | | | | | |
| Net expenses | | | 1.99 | % | | | 2.10 | % | | | 2.16 | %(F) |
| Gross expenses | | | 6.35 | % | | | 5.06 | % | | | 237.46 | %(F) |
| Net investment loss | | | (1.06 | %) | | | (0.79 | %) | | | (1.11 | %)(F) |
| Portfolio turnover rate | | | 103 | % | | | 109 | % | | | 72 | %(G) |
| (A) | Represents the period from commencement of operations (August 15, 2016) through June 30, 2017. |
| (B) | Net asset value at the beginning of period is based on the net asset value of Institutional Class shares on August 15, 2016. |
| (C) | The net investment income (loss) per share was based on average shares outstanding for the period. |
| (D) | Total returns shown exclude the effect of applicable sales loads and fees. If these charges were included, the returns would be lower. |
| (E) | Not annualized. |
| (F) | Annualized. |
| (G) | Portfolio turnover excludes the purchases and sales of the DSM Global Growth & Income Fund merger on August 15, 2016. If these transactions were included, portfolio turnover would have been higher. |
See accompanying Notes to Financial Statements.
Financial Highlights(Continued)
Touchstone International Growth Opportunities Fund—Class Y
Selected Data for a Share Outstanding Throughout Each Period
| | | | | | | | | Period Ended | |
| | | Year Ended June 30, | | | June 30, | |
| | | | 2019 | | | | 2018 | | | | 2017(A) | |
| Net asset value at beginning of period | | $ | 25.19 | | | $ | 22.25 | | | $ | 18.74 | (B) |
| Income (loss) from investment operations: | | | | | | | | | | | | |
| Net investment income (loss) | | | (0.01 | )(C) | | | 0.02 | | | | (—) | (D) |
| Net realized and unrealized gains (losses) on investments | | | (0.92 | ) | | | 3.38 | | | | 3.51 | |
| Total from investment operations | | | (0.93 | ) | | | 3.40 | | | | 3.51 | |
| Distributions from: | | | | | | | | | | | | |
| Net investment income | | | (0.02 | ) | | | — | | | | — | |
| Realized capital gains | | | (2.85 | ) | | | (0.46 | ) | | | — | |
| Total distributions | | | (2.87 | ) | | | (0.46 | ) | | | — | |
| Net asset value at end of period | | $ | 21.39 | | | $ | 25.19 | | | $ | 22.25 | |
| Total return | | | (1.53 | %) | | | 15.32 | % | | | 18.73 | %(E) |
| Ratios and supplemental data: | | | | | | | | | | | | |
| Net assets at end of period (000’s) | | $ | 2,341 | | | $ | 4,553 | | | $ | 161 | |
| Ratio to average net assets: | | | | | | | | | | | | |
| Net expenses | | | 0.99 | % | | | 1.03 | % | | | 1.16 | %(F) |
| Gross expenses | | | 1.89 | % | | | 1.81 | % | | | 51.68 | %(F) |
| Net investment income (loss) | | | (0.06 | %) | | | 0.28 | % | | | (0.10 | %)(F) |
| Portfolio turnover rate | | | 103 | % | | | 109 | % | | | 72 | %(G) |
Touchstone International Growth Opportunities Fund—Institutional Class
Selected Data for a Share Outstanding Throughout Each Period
| | | Year Ended June 30, | |
| | | 2019 | | | 2018 | | | 2017 | | | 2016 | | | 2015 | |
| Net asset value at beginning of period | | $ | 25.27 | | | $ | 22.30 | | | $ | 17.60 | | | $ | 19.75 | | | $ | 20.26 | |
| Income (loss) from investment operations: | | | | | | | | | | | | | | | | | | | | |
| Net investment income (loss) | | | 0.01 | (C) | | | 0.07 | | | | (0.02 | ) | | | (0.04 | )(C) | | | (0.02 | )(C) |
| Net realized and unrealized gains (losses) on investments | | | (0.93 | ) | | | 3.36 | | | | 5.15 | | | | (0.73 | ) | | | 1.56 | |
| Total from investment operations | | | (0.92 | ) | | | 3.43 | | | | 5.13 | | | | (0.77 | ) | | | 1.54 | |
| Distributions from: | | | | | | | | | | | | | | | | | | | | |
| Net investment income | | | (0.04 | ) | | | — | | | | — | | | | — | | | | (0.06 | ) |
| Realized capital gain | | | (2.85 | ) | | | (0.46 | ) | | | (0.43 | ) | | | (1.38 | ) | | | (1.99 | ) |
| Total distributions | | | (2.89 | ) | | | (0.46 | ) | | | (0.43 | ) | | | (1.38 | ) | | | (2.05 | ) |
| Net asset value at end of period | | $ | 21.46 | | | $ | 25.27 | | | $ | 22.30 | | | $ | 17.60 | | | $ | 19.75 | |
| Total return | | | (1.46 | %) | | | 15.42 | % | | | 29.63 | % | | | (4.06 | %) | | | 8.52 | % |
| Ratios and supplemental data: | | | | | | | | | | | | | | | | | | | | |
| Net assets at end of period (000’s) | | $ | 31,435 | | | $ | 28,159 | | | $ | 23,956 | | | $ | 6,418 | | | $ | 6,040 | |
| Ratio to average net assets: | | | | | | | | | | | | | | | | | | | | |
| Net expenses | | | 0.89 | % | | | 1.02 | % | | | 1.06 | % | | | 1.15 | %(H) | | | 1.20 | % |
| Gross expenses | | | 1.30 | % | | | 1.31 | % | | | 1.82 | % | | | 4.12 | % | | | 4.54 | % |
| Net investment income (loss) | | | 0.04 | % | | | 0.28 | % | | | (0.14 | %) | | | (0.23 | %) | | | (0.10 | %) |
| Portfolio turnover rate | | | 103 | % | | | 109 | % | | | 72 | %(G) | | | 57 | % | | | 91 | % |
| (A) | Represents the period from commencement of operations (August 15, 2016) through June 30, 2017. |
| (B) | Net asset value at the beginning of period is based on the net asset value of Institutional Class shares on August 15, 2016. |
| (C) | The net investment income (loss) per share was based on average shares outstanding for the period. |
| (D) | Less than $0.005 per share. |
| (E) | Not annualized. |
| (F) | Annualized. |
| (G) | Portfolio turnover excludes the purchases and sales of the DSM Global Growth & Income Fund merger on August 15, 2016. If these transactions were included, portfolio turnover would have been higher. |
| (H) | Expense cap was lowered to 1.10% from 1.20% on January 1, 2016. |
See accompanying Notes to Financial Statements.
Financial Highlights(Continued)
Touchstone International Small Cap Fund—Class A
Selected Data for a Share Outstanding Throughout Each Period
| | | Year Ended June 30, | |
| | | 2019 | | | 2018 | | | 2017 | | | 2016 | | | 2015 | |
| Net asset value at beginning of period | | $ | 17.89 | | | $ | 16.78 | | | $ | 14.98 | | | $ | 16.52 | | | $ | 15.48 | |
| Income (loss) from investment operations: | | | | | | | | | | | | | | | | | | | | |
| Net investment income | | | 0.85 | | | | 0.18 | | | | 0.10 | | | | 0.09 | | | | 0.11 | |
| Net realized and unrealized gains (losses) on investments | | | (2.35 | ) | | | 1.32 | | | | 1.84 | | | | (1.53 | ) | | | 1.00 | |
| Total from investment operations | | | (1.50 | ) | | | 1.50 | | | | 1.94 | | | | (1.44 | ) | | | 1.11 | |
| Distributions from: | | | | | | | | | | | | | | | | | | | | |
| Net investment income | | | (0.18 | ) | | | (0.39 | ) | | | (0.14 | ) | | | (0.10 | ) | | | (0.07 | ) |
| Realized capital gains | | | (1.10 | ) | | | — | | | | — | | | | — | | | | — | |
| Total distributions | | | (1.28 | ) | | | — | | | | — | | | | — | | | | — | |
| Net asset value at end of period | | $ | 15.11 | | | $ | 17.89 | | | $ | 16.78 | | | $ | 14.98 | | | $ | 16.52 | |
| Total return(A) | | | (7.42 | %) | | | 8.85 | % | | | 13.13 | % | | | (8.77 | %) | | | 7.29 | % |
| Ratios and supplemental data: | | | | | | | | | | | | | | | | | | | | |
| Net assets at end of period (000’s) | | $ | 2,688 | | | $ | 11,727 | | | $ | 16,529 | | | $ | 23,095 | | | $ | 24,635 | |
| Ratio to average net assets: | | | | | | | | | | | | | | | | | | | | |
| Net expenses | | | 1.55 | % | | | 1.55 | % | | | 1.55 | % | | | 1.55 | % | | | 1.55 | % |
| Gross expenses | | | 2.00 | % | | | 1.74 | % | | | 1.71 | % | | | 1.66 | % | | | 1.84 | % |
| Net investment income | | | 0.70 | % | | | 0.51 | % | | | 0.56 | % | | | 0.59 | % | | | 0.90 | % |
| Portfolio turnover rate | | | 91 | % | | | 94 | % | | | 89 | % | | | 90 | % | | | 84 | % |
Touchstone International Small Cap Fund—Class C
Selected Data for a Share Outstanding Throughout Each Period
| | | Year Ended June 30, | |
| | | 2019 | | | 2018 | | | 2017 | | | 2016 | | | 2015 | |
| Net asset value at beginning of period | | $ | 17.58 | | | $ | 16.47 | | | $ | 14.67 | | | $ | 16.28 | | | $ | 15.33 | |
| Income (loss) from investment operations: | | | | | | | | | | | | | | | | | | | | |
| Net investment income (loss) | | | (0.10 | ) | | | (0.11 | ) | | | (0.12 | ) | | | (0.04 | ) | | | 0.06 | |
| Net realized and unrealized gains (losses) on investments | | | (1.49 | ) | | | 1.44 | | | | 1.92 | | | | (1.49 | ) | | | 0.92 | |
| Total from investment operations | | | (1.59 | ) | | | 1.33 | | | | 1.80 | | | | (1.53 | ) | | | 0.98 | |
| Distributions from: | | | | | | | | | | | | | | | | | | | | |
| Net investment income | | | (0.15 | ) | | | (0.22 | ) | | | — | | | | (0.08 | ) | | | (0.03 | ) |
| Realized capital gains | | | (1.10 | ) | | | — | | | | — | | | | — | | | | — | |
| Total distributions | | | (1.25 | ) | | | — | | | | — | | | | — | | | | — | |
| Net asset value at end of period | | $ | 14.74 | | | $ | 17.58 | | | $ | 16.47 | | | $ | 14.67 | | | $ | 16.28 | |
| Total return(A) | | | (8.11 | %) | | | 8.04 | % | | | 12.27 | % | | | (9.43 | %) | | | 6.44 | % |
| Ratios and supplemental data: | | | | | | | | | | | | | | | | | | | | |
| Net assets at end of period (000’s) | | $ | 1,559 | | | $ | 2,498 | | | $ | 2,818 | | | $ | 4,294 | | | $ | 4,120 | |
| Ratio to average net assets: | | | | | | | | | | | | | | | | | | | | |
| Net expenses | | | 2.30 | % | | | 2.30 | % | | | 2.30 | % | | | 2.30 | % | | | 2.30 | % |
| Gross expenses | | | 3.10 | % | | | 2.81 | % | | | 2.73 | % | | | 2.62 | % | | | 2.92 | % |
| Net investment income (loss) | | | (0.05 | %) | | | (0.25 | %) | | | (0.19 | %) | | | (0.16 | %) | | | 0.15 | % |
| Portfolio turnover rate | | | 91 | % | | | 94 | % | | | 89 | % | | | 90 | % | | | 84 | % |
| (A) | Total returns shown exclude the effect of applicable sales loads and fees. If these charges were included, the returns would be lower. |
See accompanying Notes to Financial Statements.
Financial Highlights(Continued)
Touchstone International Small Cap Fund—Class Y
Selected Data for a Share Outstanding Throughout Each Period
| | | Year Ended June 30, | |
| | | 2019 | | | 2018 | | | 2017 | | | 2016 | | | 2015 | |
| Net asset value at beginning of period | | $ | 18.28 | | | $ | 17.21 | | | $ | 15.39 | | | $ | 16.94 | | | $ | 15.86 | |
| Income (loss) from investment operations: | | | | | | | | | | | | | | | | | | | | |
| Net investment income | | | 0.14 | | | | 0.13 | | | | 0.17 | | | | 0.13 | | | | 0.14 | |
| Net realized and unrealized gains (losses) on investments | | | (1.64 | ) | | | 1.46 | | | | 1.85 | | | | (1.57 | ) | | | 1.04 | |
| Total from investment operations | | | (1.50 | ) | | | 1.59 | | | | 2.02 | | | | (1.44 | ) | | | 1.18 | |
| Distributions from: | | | | | | | | | | | | | | | | | | | | |
| Net investment income | | | (0.23 | ) | | | (0.52 | ) | | | (0.20 | ) | | | (0.11 | ) | | | (0.10 | ) |
| Realized capital gains | | | (1.10 | ) | | | — | | | | — | | | | ��� | | | | — | |
| Total distributions | | | (1.33 | ) | | | — | | | | — | | | | — | | | | — | |
| Net asset value at end of period | | $ | 15.45 | | | $ | 18.28 | | | $ | 17.21 | | | $ | 15.39 | | | $ | 16.94 | |
| Total return | | | (7.17 | %) | | | 9.17 | % | | | 13.39 | % | | | (8.56 | %) | | | 7.54 | % |
| Ratios and supplemental data: | | | | | | | | | | | | | | | | | | | | |
| Net assets at end of period (000’s) | | $ | 97,799 | | | $ | 144,173 | | | $ | 146,744 | | | $ | 166,801 | | | $ | 172,477 | |
| Ratio to average net assets: | | | | | | | | | | | | | | | | | | | | |
| Net expenses | | | 1.30 | % | | | 1.30 | %(A) | | | 1.30 | % | | | 1.30 | % | | | 1.30 | % |
| Gross expenses | | | 1.33 | % | | | 1.30 | % | | | 1.32 | % | | | 1.32 | % | | | 1.38 | % |
| Net investment income | | | 0.95 | % | | | 0.75 | % | | | 0.81 | % | | | 0.84 | % | | | 1.15 | % |
| Portfolio turnover rate | | | 91 | % | | | 94 | % | | | 89 | % | | | 90 | % | | | 84 | % |
Touchstone International Small Cap Fund—Institutional Class
Selected Data for a Share Outstanding Throughout Each Period
| | | Year Ended June 30, | |
| | | 2019 | | | 2018 | | | 2017 | | | 2016 | | | 2015 | |
| Net asset value at beginning of period | | $ | 18.37 | | | $ | 17.31 | | | $ | 15.48 | | | $ | 17.02 | | | $ | 15.94 | |
| Income (loss) from investment operations: | | | | | | | | | | | | | | | | | | | | |
| Net investment income | | | 0.04 | | | | 0.12 | | | | 0.16 | | | | 0.12 | | | | 0.18 | |
| Net realized and unrealized gains (losses) on investments | | | (1.53 | ) | | | 1.50 | | | | 1.90 | | | | (1.55 | ) | | | 1.02 | |
| Total from investment operations | | | (1.49 | ) | | | 1.62 | | | | 2.06 | | | | (1.43 | ) | | | 1.20 | |
| Distributions from: | | | | | | | | | | | | | | | | | | | | |
| Net investment income | | | (0.24 | ) | | | (0.56 | ) | | | (0.23 | ) | | | (0.11 | ) | | | (0.12 | ) |
| Realized capital gains | | | (1.10 | ) | | | — | | | | — | | | | — | | | | — | |
| Total distributions | | | (1.34 | ) | | | — | | | | — | | | | — | | | | — | |
| Net asset value at end of period | | $ | 15.54 | | | $ | 18.37 | | | $ | 17.31 | | | $ | 15.48 | | | $ | 17.02 | |
| Total return | | | (7.11 | %) | | | 9.25 | % | | | 13.56 | % | | | (8.43 | %) | | | 7.65 | % |
| Ratios and supplemental data: | | | | | | | | | | | | | | | | | | | | |
| Net assets at end of period (000’s) | | $ | 99,402 | | | $ | 157,502 | | | $ | 148,937 | | | $ | 197,693 | | | $ | 47,319 | |
| Ratio to average net assets: | | | | | | | | | | | | | | | | | | | | |
| Net expenses | | | 1.18 | % | | | 1.18 | % | | | 1.18 | % | | | 1.18 | % | | | 1.18 | % |
| Gross expenses | | | 1.26 | % | | | 1.22 | % | | | 1.23 | % | | | 1.23 | % | | | 1.30 | % |
| Net investment income | | | 1.07 | % | | | 0.87 | % | | | 0.93 | % | | | 0.96 | % | | | 1.27 | % |
| Portfolio turnover rate | | | 91 | % | | | 94 | % | | | 89 | % | | | 90 | % | | | 84 | % |
| (A) | Net expenses include amounts recouped by the Advisor. |
See accompanying Notes to Financial Statements.
Financial Highlights(Continued)
Touchstone Large Cap Focused Fund—Class A
Selected Data for a Share Outstanding Throughout Each Period
| | | Year | | | Seven Months | | | | | | | | | | | | | |
| | | Ended | | | Ended | | | | | | | | | | | | | |
| | | June 30, | | | June 30, | | | Year Ended November 30, |
| | | 2019 | | | 2018(A) | | | 2017 | | | 2016 | | | 2015 | | | 2014 | |
| Net asset value at beginning of period | | $ | 43.80 | | | $ | 48.75 | | | $ | 42.28 | | | $ | 43.08 | | | $ | 42.79 | | | $ | 43.31 | |
| Income (loss) from investment operations: | | | | | | | | | | | | | | | | | | | | | | | | |
| Net investment income | | | 0.38 | (B) | | | 0.23 | | | | 0.45 | | | | 0.53 | (B) | | | 1.01 | (B) | | | 0.56 | (B) |
| Net realized and unrealized gains (losses) on investments | | | 3.72 | | | | 1.85 | | | | 8.99 | | | | 2.43 | | | | (0.25 | ) | | | 4.97 | |
| Total from investment operations | | | 4.10 | | | | 2.08 | | | | 9.44 | | | | 2.96 | | | | 0.76 | | | | 5.53 | |
| Distributions from: | | | | | | | | | | | | | | | | | | | | | | | | |
| Net investment income | | | (0.27 | ) | | | (0.07 | ) | | | (0.51 | ) | | | (1.08 | ) | | | (0.45 | ) | | | (0.58 | ) |
| Realized capital gains | | | (4.26 | ) | | | (6.96 | ) | | | (2.46 | ) | | | (2.68 | ) | | | (0.02 | ) | | | (5.47 | ) |
| Total distributions | | | (4.53 | ) | | | (7.03 | ) | | | (2.97 | ) | | | (3.76 | ) | | | (0.47 | ) | | | (6.05 | ) |
| Net asset value at end of period | | $ | 43.37 | | | $ | 43.80 | | | $ | 48.75 | | | $ | 42.28 | | | $ | 43.08 | | | $ | 42.79 | |
| Total return(C) | | | 10.51 | % | | | 4.74 | %(D) | | | 23.67 | % | | | 7.53 | % | | | 1.79 | % | | | 13.30 | % |
| Ratios and supplemental data: | | | | | | | | | | | | | | | | | | | | | | | | |
| Net assets at end of period (000’s) | | $ | 1,170,490 | | | $ | 1,218,721 | | | $ | 1,321,506 | | | $ | 1,350,861 | | | $ | 1,416,147 | | | $ | 1,577,546 | |
| Ratio to average net assets: | | | | | | | | | | | | | | | | | | | | | | | | |
| Net expenses (including liquidity provider expenses)(E) | | | 0.97 | % | | | 0.97 | %(F) | | | 1.02 | % | | | 1.00 | % | | | 0.99 | % | | | 1.00 | % |
| Gross expenses (including liquidity provider expenses)(G) | | | 1.09 | % | | | 1.09 | %(F) | | | 1.02 | % | | | 1.00 | % | | | 0.99 | % | | | 1.00 | % |
| Net investment income | | | 0.88 | % | | | 0.88 | %(F) | | | 0.98 | % | | | 1.32 | % | | | 2.36 | %(H) | | | 1.28 | % |
| Portfolio turnover rate | | | 15 | %(I) | | | 9 | %(D)(I) | | | 12 | %(I) | | | 8 | % | | | 11 | % | | | 19 | % |
| (A) | The Fund changed its fiscal year end from November 30 to June 30. |
| (B) | The net investment income per share was based on average shares outstanding for the period. |
| (C) | Total returns shown exclude the effect of applicable sales loads and fees. If these charges were included, the returns would be lower. |
| (E) | The ratio of net expenses to average net assets excluding liquidity provider expenses was 0.96%, 0.95% and 1.02% for the year ended June 30, 2019, the seven months ended June 30, 2018 and the year ended November 30, 2017, respectively. There were no liquidity provider expenses prior to November 30, 2017. |
| (G) | The ratio of gross expenses to average net assets excluding liquidity provider expenses was 1.08%, 1.07% and 1.02% for the year ended June 30, 2019, the seven months ended June 30, 2018 and the year ended November 30, 2017, respectively. There were no liquidity provider expenses prior to November 30, 2017. |
| (H) | Includes the impact of special dividends resulting from an acquisition of Covidien plc by Medtronic, Inc. on January 26, 2015 through the formation of a new holding company, Medtronic plc, incorporated in Ireland. These special dividends enhanced the ratios of net investment income for Class A shares by 1.22% for the fiscal year ended November 30, 2015. |
| (I) | Portfolio turnover excludes securities delivered from processing redemptions-in-kind. |
See accompanying Notes to Financial Statements.
Financial Highlights(Continued)
Touchstone Large Cap Focused Fund—Class C
Selected Data for a Share Outstanding Throughout Each Period
| | | Year | | | Seven Months | | | | | | | | | | | | | |
| | | Ended | | | Ended | | | | | | | | | | | | | |
| | | June 30, | | | June 30, | | | Year Ended November 30, |
| | | 2019 | | | 2018(A) | | | 2017 | | | 2016 | | | 2015 | | | 2014 | |
| Net asset value at beginning of period | | $ | 41.29 | | | $ | 46.48 | | | $ | 40.44 | | | $ | 41.36 | | | $ | 41.15 | | | $ | 41.82 | |
| Income (loss) from investment operations: | | | | | | | | | | | | | | | | | | | | | | | | |
| Net investment income (loss) | | | 0.03 | (B) | | | 0.03 | | | | — | (C) | | | 0.21 | (B) | | | 0.64 | (B) | | | 0.21 | (B) |
| Net realized and unrealized gains (losses) on investments | | | 3.50 | | | | 1.74 | | | | 8.67 | | | | 2.33 | | | | (0.24 | ) | | | 4.78 | |
| Total from investment operations | | | 3.53 | | | | 1.77 | | | | 8.67 | | | | 2.54 | | | | 0.40 | | | | 4.99 | |
| Distributions from: | | | | | | | | | | | | | | | | | | | | | | | | |
| Net investment income | | | — | | | | — | | | | (0.17 | ) | | | (0.78 | ) | | | (0.17 | ) | | | (0.19 | ) |
| Realized capital gains | | | (4.26 | ) | | | (6.96 | ) | | | (2.46 | ) | | | (2.68 | ) | | | (0.02 | ) | | | (5.47 | ) |
| Total distributions | | | (4.26 | ) | | | (6.96 | ) | | | (2.63 | ) | | | (3.46 | ) | | | (0.19 | ) | | | (5.66 | ) |
| Net asset value at end of period | | $ | 40.56 | | | $ | 41.29 | | | $ | 46.48 | | | $ | 40.44 | | | $ | 41.36 | | | $ | 41.15 | |
| Total return(D) | | | 9.61 | % | | | 4.24 | %(E) | | | 22.69 | % | | | 6.71 | % | | | 0.98 | % | | | 12.40 | % |
| Ratios and supplemental data: | | | | | | | | | | | | | | | | | | | | | | | | |
| Net assets at end of period (000’s) | | $ | 47,838 | | | $ | 67,599 | | | $ | 74,122 | | | $ | 83,246 | | | $ | 89,890 | | | $ | 90,784 | |
| Ratio to average net assets: | | | | | | | | | | | | | | | | | | | | | | | | |
| Net expenses (including liquidity provider expenses)(F) | | | 1.79 | % | | | 1.78 | %(G) | | | 1.82 | % | | | 1.79 | % | | | 1.78 | % | | | 1.79 | % |
| Gross expenses (including liquidity provider expenses)(H) | | | 1.90 | % | | | 1.89 | %(G) | | | 1.82 | % | | | 1.79 | % | | | 1.78 | % | | | 1.79 | % |
| Net investment income | | | 0.07 | % | | | 0.07 | %(G) | | | 0.18 | % | | | 0.54 | % | | | 1.57 | %(I) | | | 0.50 | % |
| Portfolio turnover rate | | | 15 | %(J) | | | 9 | %(E)(J) | | | 12 | %(J) | | | 8 | % | | | 11 | % | | | 19 | % |
| (A) | The Fund changed its fiscal year end from November 30 to June 30. |
| (B) | The net investment income per share was based on average shares outstanding for the period. |
| (C) | Represents less than $0.005 per share. |
| (D) | Total returns shown exclude the effect of applicable sales loads and fees. If these charges were included, the returns would be lower. |
| (F) | The ratio of net expenses to average net assets excluding liquidity provider expenses was 1.78%, 1.76% and 1.82% for the year ended June 30, 2019, the seven months ended June 30, 2018 and the year ended November 30, 2017, respectively. There were no liquidity provider expenses prior to November 30, 2017. |
| (H) | The ratio of gross expenses to average net assets excluding liquidity provider expenses was 1.89%, 1.87% and 1.82% for the year ended June 30, 2019, the seven months ended June 30, 2018 and the year ended November 30, 2017, respectively. There were no liquidity provider expenses prior to November 30, 2017. |
| (I) | Includes the impact of special dividends resulting from an acquisition of Covidien plc by Medtronic, Inc. on January 26, 2015 through the formation of a new holding company, Medtronic plc, incorporated in Ireland. These special dividends enhanced the ratios of net investment income for Class C shares by 1.22% for the fiscal year ended November 30, 2015. |
| (J) | Portfolio turnover excludes securities delivered from processing redemptions-in-kind. |
See accompanying Notes to Financial Statements.
Financial Highlights(Continued)
Touchstone Large Cap Focused Fund — Class Y
Selected Data for a Share Outstanding Throughout Each Period
| | | Year | | | Seven Months | | | | | | | | | | | | | |
| | | Ended | | | Ended | | | | | | | | | | | | | |
| | | June 30, | | | June 30, | | | Year Ended November 30, |
| | | 2019 | | | 2018(A) | | | 2017(B) | | | 2016 | | | 2015 | | | 2014 | |
| Net asset value at beginning of period | | $ | 43.68 | | | $ | 48.72 | | | $ | 42.26 | | | $ | 43.06 | | | $ | 42.76 | | | $ | 43.31 | |
| Income (loss) from investment operations: | | | | | | | | | | | | | | | | | | | | | | | | |
| Net investment income | | | 0.48 | (C) | | | 0.29 | | | | 0.56 | | | | 0.64 | (C) | | | 1.12 | (C) | | | 0.68 | (C) |
| Net realized and unrealized gains (losses) on investments | | | 3.71 | | | | 1.84 | | | | 8.99 | | | | 2.43 | | | | (0.25 | ) | | | 4.97 | |
| Total from investment operations | | | 4.19 | | | | 2.13 | | | | 9.55 | | | | 3.07 | | | | 0.87 | | | | 5.65 | |
| Distributions from: | | | | | | | | | | | | | | | | | | | | | | | | |
| Net investment income | | | (0.37 | ) | | | (0.21 | ) | | | (0.63 | ) | | | (1.19 | ) | | | (0.55 | ) | | | (0.73 | ) |
| Realized capital gains | | | (4.26 | ) | | | (6.96 | ) | | | (2.46 | ) | | | (2.68 | ) | | | (0.02 | ) | | | (5.47 | ) |
| Total distributions | | | (4.63 | ) | | | (7.17 | ) | | | (3.09 | ) | | | (3.87 | ) | | | (0.57 | ) | | | (6.20 | ) |
| Net asset value at end of period | | $ | 43.24 | | | $ | 43.68 | | | $ | 48.72 | | | $ | 42.26 | | | $ | 43.06 | | | $ | 42.76 | |
| Total return | | | 10.81 | % | | | 4.85 | %(D) | | | 24.03 | % | | | 7.84 | % | | | 2.07 | % | | | 13.61 | % |
| Ratios and supplemental data: | | | | | | | | | | | | | | | | | | | | | | | | |
| Net assets at end of period (000’s) | | $ | 413,137 | | | $ | 394,077 | | | $ | 438,732 | | | $ | 552,611 | | | $ | 689,502 | | | $ | 932,941 | |
| Ratio to average net assets: | | | | | | | | | | | | | | | | | | | | | | | | |
| Net expenses (including liquidity provider expenses)(E) | | | 0.73 | % | | | 0.74 | %(F) | | | 0.74 | % | | | 0.72 | % | | | 0.71 | % | | | 0.72 | % |
| Gross expenses (including liquidity provider expenses)(G) | | | 0.89 | % | | | 0.90 | %(F) | | | 0.75 | % | | | 0.72 | % | | | 0.71 | % | | | 0.72 | % |
| Net investment income | | | 1.13 | % | | | 1.11 | %(F) | | | 1.26 | % | | | 1.60 | % | | | 2.63 | %(H) | | | 1.55 | % |
| Portfolio turnover rate | | | 15 | %(I) | | | 9 | %(D)(I) | | | 12 | %(I) | | | 8 | % | | | 11 | % | | | 19 | % |
| (A) | The Fund changed its fiscal year end from November 30 to June 30. |
| (B) | Effective October 28, 2017, Class I shares of the Sentinel International Equity Fund (the “Predecessor Fund”) were reorganized into Class Y shares of the Fund. |
| (C) | The net investment income per share was based on average shares outstanding for the period. |
| (E) | The ratio of net expenses to average net assets excluding liquidity provider expenses was 0.72%, 0.72% and 0.74% for the year ended June 30, 2019, the seven months ended June 30, 2018 and the year ended November 30, 2017, respectively. There were no liquidity provider expenses prior to November 30, 2017. |
| (G) | The ratio of gross expenses to average net assets excluding liquidity provider expenses was 0.88%, 0.88% and 0.75% for the year ended June 30, 2019, the seven months ended June 30, 2018 and the year ended November 30, 2017, respectively. There were no liquidity provider expenses prior to November 30, 2017. |
| (H) | Includes the impact of special dividends resulting from an acquisition of Covidien plc by Medtronic, Inc. on January 26, 2015 through the formation of a new holding company, Medtronic plc, incorporated in Ireland. These special dividends enhanced the ratios of net investment income for Class Y shares by 1.22%, for the fiscal year ended November 30, 2015. |
| (I) | Portfolio turnover excludes securities delivered from processing redemptions-in-kind. |
See accompanying Notes to Financial Statements.
Financial Highlights(Continued)
Touchstone Large Cap Focused Fund — Institutional Class
Selected Data for a Share Outstanding Throughout Each Period
| | | Year | | | Seven Months | | | | | | | | | | |
| | | Ended | | | Ended | | | | | | | | | Period Ended | |
| | | June 30, | | | June 30, | | | Year Ended November 30, | | | November 30, | |
| | | 2019 | | | 2018(A) | | | 2017(B) | | | 2016 | | | 2015(C) | |
| Net asset value at beginning of period | | $ | 43.75 | | | $ | 48.81 | | | $ | 42.32 | | | $ | 43.11 | | | $ | 43.01 | |
| Income (loss) from investment operations: | | | | | | | | | | | | | | | | | | | | |
| Net investment income | | | 0.51 | (D) | | | 0.34 | | | | 0.61 | | | | 0.70 | (D) | | | 1.07 | (D) |
| Net realized and unrealized gains (losses) on investments | | | 3.71 | | | | 1.80 | | | | 9.01 | | | | 2.41 | | | | (0.51 | ) |
| Total from investment operations | | | 4.22 | | | | 2.14 | | | | 9.62 | | | | 3.11 | | | | 0.56 | |
| Distributions from: | | | | | | | | | | | | | | | | | | | | |
| Net investment income | | | (0.40 | ) | | | (0.24 | ) | | | (0.67 | ) | | | (1.22 | ) | | | (0.46 | ) |
| Realized capital gains | | | (4.26 | ) | | | (6.96 | ) | | | (2.46 | ) | | | (2.68 | ) | | | — | |
| Total distributions | | | (4.66 | ) | | | (7.20 | ) | | | (3.13 | ) | | | (3.90 | ) | | | (0.46 | ) |
| Net asset value at end of period | | $ | 43.31 | | | $ | 43.75 | | | $ | 48.81 | | | $ | 42.32 | | | $ | 43.11 | |
| Total return | | | 10.87 | % | | | 4.93 | %(E) | | | 24.14 | % | | | 7.92 | % | | | 1.31 | %(E) |
| Ratios and supplemental data: | | | | | | | | | | | | | | | | | | | | |
| Net assets at end of period (000’s) | | $ | 100,473 | | | $ | 46,683 | | | $ | 44,738 | | | $ | 29,927 | | | $ | 18,225 | |
| Ratio to average net assets: | | | | | | | | | | | | | | | | | | | | |
| Net expenses (including liquidity provider expenses)(F) | | | 0.66 | % | | | 0.67 | %(G) | | | 0.68 | % | | | 0.65 | % | | | 0.61 | %(G) |
| Gross expenses (including liquidity provider expenses)(H) | | | 0.85 | % | | | 0.88 | %(G) | | | 0.70 | % | | | 0.72 | % | | | 1.76 | %(G) |
| Net investment income | | | 1.20 | % | | | 1.18 | %(G) | | | 1.32 | % | | | 1.72 | % | | | 2.65 | %(G)(I) |
| Portfolio turnover rate | | | 15 | %(J) | | | 9 | %(E)(J) | | | 12 | %(J) | | | 8 | % | | | 11 | % |
| (A) | The Fund changed its fiscal year end from November 30 to June 30. |
| (B) | Effective October 30, 2017, Class R6 shares of the Predecessor Fund were reorganized into Institutional Class shares of the Fund. |
| (C) | Represents the period from commencement of operations (December 23, 2014) through November 30, 2015. |
| (D) | The net investment income per share was based on average shares outstanding for the period. |
| (F) | The ratio of net expenses to average net assets excluding liquidity provider expenses was 0.65%, 0.65% and 0.68% for the year ended June 30, 2019, the seven months ended June 30, 2018 and the year ended November 30, 2017, respectively. There were no liquidity provider expenses prior to November 30, 2017. |
| (H) | The ratio of gross expenses to average net assets excluding liquidity provider expenses was 0.84%, 0.86% and 0.70% for the year ended June 30, 2019, the seven months ended June 30, 2018 and the year ended November 30, 2017, respectively. There were no liquidity provider expenses prior to November 30, 2017. |
| (I) | Includes the impact of special dividends resulting from an acquisition of Covidien plc by Medtronic, Inc. on January 26, 2015 through the formation of a new holding company, Medtronic plc, incorporated in Ireland. These special dividends enhanced the ratios of net investment income for Institutional Class shares by 1.30%, for the fiscal year ended November 30, 2015. |
| (J) | Portfolio turnover excludes securities delivered from processing redemptions-in-kind. |
See accompanying Notes to Financial Statements.
Financial Highlights(Continued)
Touchstone Large Cap Fund—Class A
Selected Data for a Share Outstanding Throughout Each Period
| | | | | | | | | | | | | | | Period Ended | |
| | | Year Ended June 30, | | | June 30, | |
| | | 2019 | | | 2018 | | | 2017 | | | 2016 | | | 2015(A) | |
| Net asset value at beginning of period | | $ | 13.27 | | | $ | 11.96 | | | $ | 10.49 | | | $ | 10.65 | | | $ | 10.00 | |
| Income (loss) from investment operations: | | | | | | | | | | | | | | | | | | | | |
| Net investment income | | | 0.09 | (B) | | | 0.09 | | | | 0.06 | | | | 0.08 | | | | 0.09 | (B) |
| Net realized and unrealized gains (losses) on investments | | | 0.83 | | | | 1.27 | | | | 1.49 | | | | (0.18 | ) | | | 0.57 | |
| Total from investment operations | | | 0.92 | | | | 1.36 | | | | 1.55 | | | | (0.10 | ) | | | 0.66 | |
| Distributions from: | | | | | | | | | | | | | | | | | | | | |
| Net investment income | | | (0.08 | ) | | | (0.05 | ) | | | (0.08 | ) | | | (0.06 | ) | | | (0.01 | ) |
| Net asset value at end of period | | $ | 14.11 | | | $ | 13.27 | | | $ | 11.96 | | | $ | 10.49 | | | $ | 10.65 | |
| Total return(C) | | | 7.04 | % | | | 11.35 | % | | | 14.82 | % | | | (0.92 | %) | | | 6.57 | %(D) |
| Ratios and supplemental data: | | | | | | | | | | | | | | | | | | | | |
| Net assets at end of period (000’s) | | $ | 4,067 | | | $ | 2,975 | | | $ | 5,368 | | | $ | 3,657 | | | $ | 2,013 | |
| Ratio to average net assets: | | | | | | | | | | | | | | | | | | | | |
| Net expenses | | | 1.11 | % | | | 1.12 | % | | | 1.12 | % | | | 1.12 | % | | | 1.12 | %(E) |
| Gross expenses | | | 1.67 | % | | | 1.50 | % | | | 1.57 | % | | | 1.68 | % | | | 4.17 | %(E) |
| Net investment income | | | 0.63 | % | | | 0.48 | % | | | 0.56 | % | | | 0.87 | % | | | 0.81 | %(E) |
| Portfolio turnover rate | | | 19 | %(F) | | | 10 | % | | | 23 | % | | | 33 | % | | | 8 | %(D)(G) |
Touchstone Large Cap Fund—Class C
Selected Data for a Share Outstanding Throughout Each Period
| | | | | | | | | | | | | | | Period Ended | |
| | | Year Ended June 30, | | | June 30, | |
| | | 2019 | | | 2018 | | | 2017 | | | 2016 | | | 2015(A) | |
| Net asset value at beginning of period | | $ | 13.04 | | | $ | 11.80 | | | $ | 10.37 | | | $ | 10.60 | | | $ | 10.00 | |
| Income (loss) from investment operations: | | | | | | | | | | | | | | | | | | | | |
| Net investment income (loss) | | | (0.02 | )(B) | | | (0.04 | ) | | | (0.02 | ) | | | 0.02 | | | | 0.01 | (B) |
| Net realized and unrealized gains (losses) on investments | | | 0.83 | | | | 1.28 | | | | 1.47 | | | | (0.20 | ) | | | 0.59 | |
| Total from investment operations | | | 0.81 | | | | 1.24 | | | | 1.45 | | | | (0.18 | ) | | | 0.60 | |
| Distributions from: | | | | | | | | | | | | | | | | | | | | |
| Net investment income | | | — | | | | — | | | | (0.02 | ) | | | (0.05 | ) | | | — | |
| Net asset value at end of period | | $ | 13.85 | | | $ | 13.04 | | | $ | 11.80 | | | $ | 10.37 | | | $ | 10.60 | |
| Total return(C) | | | 6.21 | % | | | 10.51 | % | | | 13.98 | % | | | (1.72 | %) | | | 6.00 | %(D) |
| Ratios and supplemental data: | | | | | | | | | | | | | | | | | | | | |
| Net assets at end of period (000’s) | | $ | 7,372 | | | $ | 7,849 | | | $ | 8,102 | | | $ | 6,124 | | | $ | 1,370 | |
| Ratio to average net assets: | | | | | | | | | | | | | | | | | | | | |
| Net expenses | | | 1.86 | % | | | 1.87 | % | | | 1.87 | % | | | 1.87 | % | | | 1.87 | %(E) |
| Gross expenses | | | 2.13 | % | | | 2.12 | % | | | 2.12 | % | | | 2.39 | % | | | 4.34 | %(E) |
| Net investment income (loss) | | | (0.12 | %) | | | (0.27 | %) | | | (0.19 | %) | | | 0.12 | % | | | 0.06 | %(E) |
| Portfolio turnover rate | | | 19 | %(F) | | | 10 | % | | | 23 | % | | | 33 | % | | | 8 | %(D)(G) |
| (A) | Represents the period from commencement of operations (July 10, 2014) through June 30, 2015. |
| (B) | The net investment income per share was based on average shares outstanding for the period. |
| (C) | Total returns shown exclude the effect of applicable sales loads and fees. If these charges were included, the returns would be lower. |
| (F) | Portfolio turnover excludes securities delivered from processing redemptions-in-kind. |
| (G) | Portfolio turnover excludes the purchases and sales of the Touchstone Capital Growth Fund acquired on June 26, 2015. If these transactions were included, portfolio turnover would have been higher. |
See accompanying Notes to Financial Statements.
Financial Highlights(Continued)
Touchstone Large Cap Fund—Class Y
Selected Data for a Share Outstanding Throughout Each Period
| | | | | | | | | | | | | | | Period Ended | |
| | | Year Ended June 30, | | | June 30, | |
| | | 2019 | | | 2018 | | | 2017 | | | 2016 | | | 2015(A) | |
| Net asset value at beginning of period | | $ | 13.31 | | | $ | 12.00 | | | $ | 10.52 | | | $ | 10.67 | | | $ | 10.00 | |
| Income (loss) from investment operations: | | | | | | | | | | | | | | | | | | | | |
| Net investment income | | | 0.12 | (B) | | | 0.10 | | | | 0.09 | | | | 0.11 | | | | 0.11 | (B) |
| Net realized and unrealized gains (losses) on investments | | | 0.84 | | | | 1.30 | | | | 1.49 | | | | (0.19 | ) | | | 0.57 | |
| Total from investment operations | | | 0.96 | | | | 1.40 | | | | 1.58 | | | | (0.08 | ) | | | 0.68 | |
| Distributions from: | | | | | | | | | | | | | | | | | | | | |
| Net investment income | | | (0.13 | ) | | | (0.09 | ) | | | (0.10 | ) | | | (0.07 | ) | | | (0.01 | ) |
| Net asset value at end of period | | $ | 14.14 | | | $ | 13.31 | | | $ | 12.00 | | | $ | 10.52 | | | $ | 10.67 | |
| Total return | | | 7.31 | % | | | 11.62 | % | | | 15.13 | % | | | (0.70 | %) | | | 6.80 | %(C) |
| Ratios and supplemental data: | | | | | | | | | | | | | | | | | | | | |
| Net assets at end of period (000’s) | | $ | 213,650 | | | $ | 231,984 | | | $ | 222,080 | | | $ | 208,463 | | | $ | 194,226 | |
| Ratio to average net assets: | | | | | | | | | | | | | | | | | | | | |
| Net expenses | | | 0.86 | % | | | 0.87 | % | | | 0.87 | % | | | 0.87 | % | | | 0.87 | %(D) |
| Gross expenses | | | 0.99 | % | | | 0.99 | % | | | 1.01 | % | | | 1.04 | % | | | 1.19 | %(D) |
| Net investment income | | | 0.88 | % | | | 0.73 | % | | | 0.81 | % | | | 1.11 | % | | | 1.06 | %(D) |
| Portfolio turnover rate | | | 19 | %(E) | | | 10 | % | | | 23 | % | | | 33 | % | | | 8 | %(C)(F) |
Touchstone Large Cap Fund—Institutional Class
Selected Data for a Share Outstanding Throughout Each Period
| | | | | | | | | | | | | | | Period Ended | |
| | | Year Ended June 30, | | | June 30, | |
| | | 2019 | | | 2018 | | | 2017 | | | 2016 | | | 2015(A) | |
| Net asset value at beginning of period | | $ | 13.33 | | | $ | 12.02 | | | $ | 10.53 | | | $ | 10.68 | | | $ | 10.00 | |
| Income (loss) from investment operations: | | | | | | | | | | | | | | | | | | | | |
| Net investment income | | | 0.14 | (B) | | | 0.10 | | | | 0.11 | | | | 0.13 | | | | 0.12 | (B) |
| Net realized and unrealized gains (losses) on investments | | | 0.83 | | | | 1.31 | | | | 1.49 | | | | (0.20 | ) | | | 0.57 | |
| Total from investment operations | | | 0.97 | | | | 1.41 | | | | 1.60 | | | | (0.07 | ) | | | 0.69 | |
| Distributions from: | | | | | | | | | | | | | | | | | | | | |
| Net investment income | | | (0.14 | ) | | | (0.10 | ) | | | (0.11 | ) | | | (0.08 | ) | | | (0.01 | ) |
| Net asset value at end of period | | $ | 14.16 | | | $ | 13.33 | | | $ | 12.02 | | | $ | 10.53 | | | $ | 10.68 | |
| Total return | | | 7.43 | % | | | 11.70 | % | | | 15.31 | % | | | (0.66 | %) | | | 6.92 | %(C) |
| Ratios and supplemental data: | | | | | | | | | | | | | | | | | | | | |
| Net assets at end of period (000’s) | | $ | 59,211 | | | $ | 124,759 | | | $ | 97,888 | | | $ | 87,032 | | | $ | 98,889 | |
| Ratio to average net assets: | | | | | | | | | | | | | | | | | | | | |
| Net expenses | | | 0.77 | % | | | 0.77 | % | | | 0.77 | % | | | 0.77 | % | | | 0.77 | %(D) |
| Gross expenses | | | 0.92 | % | | | 0.91 | % | | | 0.91 | % | | | 0.93 | % | | | 0.98 | %(D) |
| Net investment income | | | 0.98 | % | | | 0.83 | % | | | 0.91 | % | | | 1.21 | % | | | 1.16 | %(D) |
| Portfolio turnover rate | | | 19 | %(E) | | | 10 | % | | | 23 | % | | | 33 | % | | | 8 | %(C)(F) |
| (A) | Represents the period from commencement of operations (July 10, 2014) through June 30, 2015. |
| (B) | The net investment income per share was based on average shares outstanding for the period. |
| (E) | Portfolio turnover excludes securities delivered from processing redemptions-in-kind. |
| (F) | Portfolio turnover excludes the purchases and sales of the Touchstone Capital Growth Fund acquired on June 26, 2015. If these transactions were included, portfolio turnover would have been higher. |
See accompanying Notes to Financial Statements.
Financial Highlights (Continued)
Touchstone Large Company Growth Fund—Class A
Selected Data for a Share Outstanding Throughout Each Period
| | | | | | Period Ended | |
| | | Year Ended June 30, | | | June 30, | |
| | | 2019 | | | 2018 | | | 2017(A) | |
| Net asset value at beginning of period | | $ | 41.33 | | | $ | 35.52 | | | $ | 31.38 | (B) |
| Income (loss) from investment operations: | | | | | | | | | | | | |
| Net investment loss | | | (0.56 | ) | | | (0.24 | ) | | | (0.19 | )(C) |
| Net realized and unrealized gains on investments | | | 4.42 | | | | 7.19 | | | | 5.41 | |
| Total from investment operations | | | 3.86 | | | | 6.95 | | | | 5.22 | |
| Distributions from: | | | | | | | | | | | | |
| Realized capital gains | | | (2.69 | ) | | | (1.14 | ) | | | (1.08 | ) |
| Net asset value at end of period | | $ | 42.50 | | | $ | 41.33 | | | $ | 35.52 | |
| Total return(D) | | | 10.39 | % | | | 19.75 | % | | | 17.31 | %(E) |
| Ratios and supplemental data: | | | | | | | | | | | | |
| Net assets at end of period (000’s) | | $ | 1,425 | | | $ | 3,417 | | | $ | 140 | |
| Ratio to average net assets: | | | | | | | | | | | | |
| Net expenses | | | 1.23 | % | | | 1.23 | % | | | 1.23 | %(F) |
| Gross expenses | | | 2.01 | % | | | 1.67 | % | | | 11.14 | %(F) |
| Net investment loss | | | (0.59 | %) | | | (0.63 | %) | | | (0.68 | %)(F) |
| Portfolio turnover rate | | | 41 | % | | | 44 | % | | | 55 | % |
Touchstone Large Company Growth Fund—Class C
Selected Data for a Share Outstanding Throughout Each Period
| | | | | | | | | Period Ended | |
| | | Year Ended June 30, | | | June 30, | |
| | | 2019 | | | 2018 | | | 2017(A) | |
| Net asset value at beginning of period | | $ | 40.74 | | | $ | 35.29 | | | $ | 31.38 | (B) |
| Income (loss) from investment operations: | | | | | | | | | | | | |
| Net investment loss | | | (0.40 | ) | | | (0.30 | ) | | | (0.38 | )(C) |
| Net realized and unrealized gains on investments | | | 3.87 | | | | 6.89 | | | | 5.37 | |
| Total from investment operations | | | 3.47 | | | | 6.59 | | | | 4.99 | |
| Distributions from: | | | | | | | | | | | | |
| Realized capital gains | | | (2.69 | ) | | | (1.14 | ) | | | (1.08 | ) |
| Net asset value at end of period | | $ | 41.52 | | | $ | 40.74 | | | $ | 35.29 | |
| Total return(D) | | | 9.55 | % | | | 18.88 | % | | | 16.52 | %(E) |
| Ratios and supplemental data: | | | | | | | | | | | | |
| Net assets at end of period (000’s) | | $ | 396 | | | $ | 236 | | | $ | 31 | |
| Ratio to average net assets: | | | | | | | | | | | | |
| Net expenses | | | 1.98 | % | | | 1.98 | % | | | 1.98 | %(F) |
| Gross expenses | | | 4.38 | % | | | 8.12 | % | | | 257.02 | %(F) |
| Net investment loss | | | (1.34 | %) | | | (1.38 | %) | | | (1.43 | %)(F) |
| Portfolio turnover rate | | | 41 | % | | | 44 | % | | | 55 | % |
| | | | | | | | | | | | | |
| (A) | Represents the period from commencement of operations (August 15, 2016) through June 30, 2017. |
| (B) | Net asset value at the beginning of period is based on the net asset value of Institutional Class shares on August 15, 2016. |
| (C) | The net investment loss per share was based on average shares outstanding for the period. |
| (D) | Total returns shown exclude the effect of applicable sales loads and fees. If these charges were included, the returns would be lower. |
See accompanying Notes to Financial Statements.
Financial Highlights(Continued)
Touchstone Large Company Growth Fund—Class Y
Selected Data for a Share Outstanding Throughout Each Period
| | | | | | | | | Period Ended | |
| | | Year Ended June 30, | | | June 30, | |
| | | | 2019 | | | | 2018 | | | | 2017(A) | |
| Net asset value at beginning of period | | $ | 41.53 | | | $ | 35.60 | | | $ | 31.38 | (B) |
| Income (loss) from investment operations: | | | | | | | | | | | | |
| Net investment loss | | | (0.12 | ) | | | (0.13 | ) | | | (0.12 | )(C) |
| Net realized and unrealized gains on investments | | | 4.10 | | | | 7.20 | | | | 5.42 | |
| Total from investment operations | | | 3.98 | | | | 7.07 | | | | 5.30 | |
| Distributions from: | | | | | | | | | | | | |
| Realized capital gains | | | (2.69 | ) | | | (1.14 | ) | | | (1.08 | ) |
| Net asset value at end of period | | $ | 42.82 | | | $ | 41.53 | | | $ | 35.60 | |
| Total return | | | 10.66 | % | | | 20.02 | % | | | 17.57 | %(D) |
| Ratios and supplemental data: | | | | | | | | | | | | |
| Net assets at end of period (000’s) | | $ | 19,580 | | | $ | 15,961 | | | $ | 9,938 | |
| Ratio to average net assets: | | | | | | | | | | | | |
| Net expenses | | | 0.98 | % | | | 0.98 | % | | | 0.98 | %(E) |
| Gross expenses | | | 1.16 | % | | | 1.12 | % | | | 1.12 | %(E) |
| Net investment loss | | | (0.34 | %) | | | (0.38 | %) | | | (0.42 | %)(E) |
| Portfolio turnover rate | | | 41 | % | | | 44 | % | | | 55 | % |
Touchstone Large Company Growth Fund—Institutional Class
Selected Data for a Share Outstanding Throughout Each Period
| | | Year Ended June 30, | |
| | | 2019 | | | 2018 | | | 2017 | | | 2016 | | | 2015 | |
| Net asset value at beginning of period | | $ | 41.61 | | | $ | 35.63 | | | $ | 29.15 | | | $ | 33.17 | | | $ | 29.67 | |
| Income (loss) from investment operations: | | | | | | | | | | | | | | | | | | | | |
| Net investment loss | | | (0.10 | ) | | | (0.11 | ) | | | (0.12 | )(C) | | | (0.14 | )(C) | | | (0.08 | )(C) |
| Net realized and unrealized gains (losses) on investments | | | 4.13 | | | | 7.23 | | | | 7.68 | | | | (1.45 | ) | | | 4.61 | |
| Total from investment operations | | | 4.03 | | | | 7.12 | | | | 7.56 | | | | (1.59 | ) | | | 4.53 | |
| Distributions from: | | | | | | | | | | | | | | | | | | | | |
| Realized capital gains | | | (2.69 | ) | | | (1.14 | ) | | | (1.08 | ) | | | (2.43 | ) | | | (1.03 | ) |
| Proceeds from redemption fees collected | | | — | | | | — | | | | — | | | | — | (F) | | | — | |
| Net asset value at end of period | | $ | 42.95 | | | $ | 41.61 | | | $ | 35.63 | | | $ | 29.15 | | | $ | 33.17 | |
| Total return | | | 10.74 | % | | | 20.17 | % | | | 26.67 | % | | | (5.08 | %) | | | 15.59 | % |
| Ratios and supplemental data: | | | | | | | | | | | | | | | | | | | | |
| Net assets at end of period (000’s) | | $ | 204,391 | | | $ | 224,379 | | | $ | 189,444 | | | $ | 180,104 | | | $ | 196,084 | |
| Ratio to average net assets: | | | | | | | | | | | | | | | | | | | | |
| Net expenses | | | 0.88 | % | | | 0.88 | % | | | 0.89 | % | | | 0.95 | % | | | 0.95 | % |
| Gross expenses | | | 0.99 | % | | | 0.98 | % | | | 1.02 | % | | | 1.00 | % | | | 1.00 | % |
| Net investment loss | | | (0.24 | %) | | | (0.28 | %) | | | (0.39 | %) | | | (0.46 | %) | | | (0.25 | %) |
| Portfolio turnover rate | | | 41 | % | | | 44 | % | | | 55 | % | | | 57 | % | | | 80 | % |
| (A) | Represents the period from commencement of operations (August 15, 2016) through June 30, 2017. |
| (B) | Net asset value at the beginning of period is based on the net asset value of Institutional Class shares on August 15, 2016. |
| (C) | The net investment loss per share was based on average shares outstanding for the period. |
| (F) | Proceeds from redemption fees are related to the DSM Large Cap Growth Fund, the Predecessor Fund, and are less than $0.005 per share. |
See accompanying Notes to Financial Statements.
Financial Highlights(Continued)
Touchstone Ohio Tax-Free Bond Fund—Class A
Selected Data for a Share Outstanding Throughout Each Period
| | | Year Ended June 30, | |
| | | 2019 | | | 2018 | | | 2017 | | | 2016 | | | 2015 | |
| Net asset value at beginning of period | | $ | 11.33 | | | $ | 11.55 | | | $ | 12.04 | | | $ | 11.70 | | | $ | 11.76 | |
| Income (loss) from investment operations: | | | | | | | | | | | | | | | | | | | | |
| Net investment income | | | 0.32 | | | | 0.33 | | | | 0.35 | | | | 0.36 | | | | 0.38 | |
| Net realized and unrealized gains (losses) on investments | | | 0.30 | | | | (0.22 | ) | | | (0.47 | ) | | | 0.36 | | | | (0.06 | ) |
| Total from investment operations | | | 0.62 | | | | 0.11 | | | | (0.12 | ) | | | 0.72 | | | | 0.32 | |
| Distributions from: | | | | | | | | | | | | | | | | | | | | |
| Net investment income | | | (0.32 | ) | | | (0.33 | ) | | | (0.35 | ) | | | (0.36 | ) | | | (0.38 | ) |
| Realized capital gains | | | — | | | | — | | | | (0.02 | ) | | | (0.02 | ) | | | — | |
| Total distributions | | | (0.32 | ) | | | (0.33 | ) | | | (0.37 | ) | | | (0.38 | ) | | | (0.38 | ) |
| Net asset value at end of period | | $ | 11.63 | | | $ | 11.33 | | | $ | 11.55 | | | $ | 12.04 | | | $ | 11.70 | |
| Total return(A) | | | 5.60 | % | | | 0.99 | % | | | (1.03 | %) | | | 6.25 | % | | | 2.72 | % |
| Ratios and supplemental data: | | | | | | | | | | | | | | | | | | | | |
| Net assets at end of period (000’s) | | $ | 33,515 | | | $ | 35,728 | | | $ | 42,818 | | | $ | 52,599 | | | $ | 47,153 | |
| Ratio to average net assets: | | | | | | | | | | | | | | | | | | | | |
| Net expenses | | | 0.85 | % | | | 0.85 | % | | | 0.85 | % | | | 0.85 | % | | | 0.85 | % |
| Gross expenses | | | 1.15 | % | | | 1.13 | % | | | 1.13 | % | | | 1.13 | % | | | 1.09 | % |
| Net investment income | | | 2.85 | % | | | 2.91 | % | | | 2.98 | % | | | 3.05 | % | | | 3.20 | % |
| Portfolio turnover rate | | | 53 | % | | | 47 | % | | | 34 | % | | | 27 | % | | | 23 | % |
Touchstone Ohio Tax-Free Bond Fund—Class C
Selected Data for a Share Outstanding Throughout Each Period
| | | Year Ended June 30, | |
| | | 2019 | | | 2018 | | | 2017 | | | 2016 | | | 2015 | |
| Net asset value at beginning of period | | $ | 11.33 | | | $ | 11.57 | | | $ | 12.06 | | | $ | 11.72 | | | $ | 11.78 | |
| Income (loss) from investment operations: | | | | | | | | | | | | | | | | | | | | |
| Net investment income | | | 0.23 | | | | 0.25 | | | | 0.26 | | | | 0.27 | | | | 0.29 | |
| Net realized and unrealized gains (losses) on investments | | | 0.33 | | | | (0.24 | ) | | | (0.47 | ) | | | 0.36 | | | | (0.06 | ) |
| Total from investment operations | | | 0.56 | | | | 0.01 | | | | (0.21 | ) | | | 0.63 | | | | 0.23 | |
| Distributions from: | | | | | | | | | | | | | | | | | | | | |
| Net investment income | | | (0.24 | ) | | | (0.25 | ) | | | (0.26 | ) | | | (0.27 | ) | | | (0.29 | ) |
| Realized capital gains | | | — | | | | — | | | | (0.02 | ) | | | (0.02 | ) | | | — | |
| Total distributions | | | (0.24 | ) | | | (0.25 | ) | | | (0.28 | ) | | | (0.29 | ) | | | (0.29 | ) |
| Net asset value at end of period | | $ | 11.65 | | | $ | 11.33 | | | $ | 11.57 | | | $ | 12.06 | | | $ | 11.72 | |
| Total return(A) | | | 4.97 | % | | | 0.06 | % | | | (1.77 | %) | | | 5.45 | % | | | 1.96 | % |
| Ratios and supplemental data: | | | | | | | | | | | | | | | | | | | | |
| Net assets at end of period (000’s) | | $ | 2,756 | | | $ | 5,363 | | | $ | 6,515 | | | $ | 7,320 | | | $ | 7,266 | |
| Ratio to average net assets: | | | | | | | | | | | | | | | | | | | | |
| Net expenses | | | 1.60 | % | | | 1.60 | % | | | 1.60 | % | | | 1.60 | % | | | 1.60 | % |
| Gross expenses | | | 2.08 | % | | | 2.01 | % | | | 2.03 | % | | | 2.09 | % | | | 1.93 | % |
| Net investment income | | | 2.10 | % | | | 2.16 | % | | | 2.23 | % | | | 2.30 | % | | | 2.45 | % |
| Portfolio turnover rate | | | 53 | % | | | 47 | % | | | 34 | % | | | 27 | % | | | 23 | % |
| (A) | Total returns shown exclude the effect of applicable sales loads and fees. If these charges were included, the returns would be lower. |
See accompanying Notes to Financial Statements.
Financial Highlights(Continued)
Touchstone Ohio Tax-Free Bond Fund—Class Y
Selected Data for a Share Outstanding Throughout Each Period
| | | | | | | | | Period Ended | |
| | | Year Ended June 30, | | | June 30, | |
| | | 2019 | | | 2018 | | | 2017(A) | |
| Net asset value at beginning of period | | $ | 11.33 | | | $ | 11.56 | | | $ | 12.00 | (B) |
| Income (loss) from investment operations: | | | | | | | | | | | | |
| Net investment income | | | 0.35 | | | | 0.29 | | | | 0.38 | |
| Net realized and unrealized losses on investments | | | 0.31 | | | | (0.16 | ) | | | (0.49 | ) |
| Total from investment operations | | | 0.66 | | | | 0.13 | | | | (0.11 | ) |
| Distributions from: | | | | | | | | | | | | |
| Net investment income | | | (0.35 | ) | | | (0.36 | ) | | | (0.31 | ) |
| Realized capital gains | | | — | | | | — | | | | (0.02 | ) |
| Total distributions | | | (0.35 | ) | | | (0.36 | ) | | | (0.33 | ) |
| Net asset value at end of period | | $ | 11.64 | | | $ | 11.33 | | | $ | 11.56 | |
| Total return | | | 5.96 | % | | | 1.15 | % | | | (0.90 | %)(C) |
| Ratios and supplemental data: | | | | | | | | | | | | |
| Net assets at end of period (000’s) | | $ | 3,031 | | | $ | 4,596 | | | $ | 2 | |
| Ratio to average net assets: | | | | | | | | | | | | |
| Net expenses | | | 0.60 | % | | | 0.60 | % | | | 0.60 | %(D) |
| Gross expenses | | | 1.05 | % | | | 1.16 | % | | | 298.27 | %(D) |
| Net investment income | | | 3.10 | % | | | 3.16 | % | | | 4.00 | %(D) |
| Portfolio turnover rate | | | 53 | % | | | 47 | % | | | 34 | % |
Touchstone Ohio Tax-Free Bond Fund—Institutional Class
Selected Data for a Share Outstanding Throughout Each Period
| | | | | | | | | Period Ended | |
| | | Year Ended June 30, | | | June 30, | |
| | | 2019 | | | 2018 | | | 2017(A) | |
| Net asset value at beginning of period | | $ | 11.33 | | | $ | 11.56 | | | $ | 12.00 | (B) |
| Income (loss) from investment operations: | | | | | | | | | | | | |
| Net investment income | | | 0.36 | | | | 0.30 | | | | 0.39 | |
| Net realized and unrealized losses on investments | | | 0.31 | | | | (0.16 | ) | | | (0.50 | ) |
| Total from investment operations | | | 0.67 | | | | 0.14 | | | | (0.11 | ) |
| Distributions from: | | | | | | | | | | | | |
| Net investment income | | | (0.36 | ) | | | (0.37 | ) | | | (0.31 | ) |
| Realized capital gains | | | — | | | | — | | | | (0.02 | ) |
| Total distributions | | | (0.36 | ) | | | (0.37 | ) | | | (0.33 | ) |
| Net asset value at end of period | | $ | 11.64 | | | $ | 11.33 | | | $ | 11.56 | |
| Total return | | | 6.05 | % | | | 1.18 | % | | | (0.90 | %)(C) |
| Ratios and supplemental data: | | | | | | | | | | | | |
| Net assets at end of period (000’s) | | $ | 7,913 | | | $ | 560 | | | $ | 2 | |
| Ratio to average net assets: | | | | | | | | | | | | |
| Net expenses | | | 0.55 | % | | | 0.55 | % | | | 0.55 | %(D) |
| Gross expenses | | | 0.96 | % | | | 2.54 | % | | | 298.26 | %(D) |
| Net investment income | | | 3.15 | % | | | 3.21 | % | | | 4.04 | %(D) |
| Portfolio turnover rate | | | 53 | % | | | 47 | % | | | 34 | % |
| (A) | Represents the period from commencement of operations (August 31, 2016) through December 31, 2017. |
| (B) | Net asset value at the beginning of period is based on the net asset value of Class A shares on August 31, 2016. |
See accompanying Notes to Financial Statements.
Financial Highlights(Continued)
Touchstone Small Company Fund—Class A
Selected Data for a Share Outstanding Throughout Each Period
| | | Year | | | Seven Months | | | | | | | | | | | | | |
| | | Ended | | | Ended | | | | | | | | | | | | | |
| | | June 30, | | | June 30, | | | Year Ended November 30, | |
| | | | 2019 | | | | 2018(A) | | | | 2017 | | | | 2016 | | | | 2015 | | | | 2014 | |
| Net asset value at beginning of period | | $ | 5.53 | | | $ | 5.64 | | | $ | 5.19 | | | $ | 5.58 | | | $ | 7.19 | | | $ | 8.52 | |
| Income (loss) from investment operations: | | | | | | | | | | | | | | | | | | | | | | | | |
| Net investment income (loss) | | | (0.01 | ) | | | (0.01 | ) | | | (0.02 | ) | | | (0.02 | )(B) | | | (0.03 | )(B) | | | — | (B)(C) |
| Net realized and unrealized gains (losses) on investments | | | (0.07 | ) | | | 0.37 | | | | 0.89 | | | | 0.57 | | | | 0.26 | | | | 0.38 | |
| Total from investment operations | | | (0.08 | ) | | | 0.36 | | | | 0.87 | | | | 0.55 | | | | 0.23 | | | | 0.38 | |
| Distributions from: | | | | | | | | | | | | | | | | | | | | | | | | |
| Realized capital gains | | | (0.62 | ) | | | (0.47 | ) | | | (0.42 | ) | | | (0.94 | ) | | | (1.84 | ) | | | (1.71 | ) |
| Net asset value at end of period | | $ | 4.83 | | | $ | 5.53 | | | $ | 5.64 | | | $ | 5.19 | | | $ | 5.58 | | | $ | 7.19 | |
| Total return(D) | | | (0.73 | %) | | | 6.89 | %(E) | | | 17.95 | % | | | 12.52 | % | | | 5.32 | % | | | 5.40 | % |
| Ratios and supplemental data: | | | | | | | | | | | | | | | | | | | | | | | | |
| Net assets at end of period (000’s) | | $ | 589,664 | | | $ | 661,866 | | | $ | 677,055 | | | $ | 685,807 | | | $ | 596,864 | | | $ | 682,481 | |
| Ratio to average net assets: | | | | | | | | | | | | | | | | | | | | | | | | |
| Net expenses | | | 1.12 | % | | | 1.10 | %(F) | | | 1.18 | % | | | 1.22 | % | | | 1.25 | % | | | 1.20 | % |
| Gross expenses | | | 1.20 | % | | | 1.18 | %(F) | | | 1.18 | % | | | 1.22 | % | | | 1.25 | % | | | 1.20 | % |
| Net investment income (loss) | | | (0.26 | %) | | | (0.26 | %)(F) | | | (0.49 | %) | | | (0.38 | %) | | | (0.61 | %) | | | 0.06 | % |
| Portfolio turnover rate | | | 94 | %(G)(H) | | | 30 | %(E) | | | 82 | % | | | 61 | % | | | 70 | % | | | 59 | % |
Touchstone Small Company Fund—Class C
Selected Data for a Share Outstanding Throughout Each Period
| | | Year | | | Seven Months | | | | | | | | | | | | | |
| | | Ended | | | Ended | | | | | | | | | | | | | |
| | | June 30, | | | June 30, | | | Year Ended November 30, | |
| | | | 2019 | | | | 2018(A) | | | | 2017 | | | | 2016 | | | | 2015 | | | | 2014 | |
| Net asset value at beginning of period | | $ | 3.23 | | | $ | 3.50 | | | $ | 3.39 | | | $ | 4.01 | | | $ | 5.72 | | | $ | 7.17 | |
| Income (loss) from investment operations: | | | | | | | | | | | | | | | | | | | | | | | | |
| Net investment loss | | | (0.05 | ) | | | (0.02 | ) | | | (0.10 | ) | | | (0.03 | )(B) | | | (0.05 | )(B) | | | (0.04 | )(B) |
| Net realized and unrealized gains (losses) on investments | | | (0.04 | ) | | | 0.22 | | | | 0.63 | | | | 0.35 | | | | 0.18 | | | | 0.30 | |
| Total from investment operations | | | (0.09 | ) | | | 0.20 | | | | 0.53 | | | | 0.32 | | | | 0.13 | | | | 0.26 | |
| Distributions from: | | | | | | | | | | | | | | | | | | | | | | | | |
| Realized capital gains | | | (0.62 | ) | | | (0.47 | ) | | | (0.42 | ) | | | (0.94 | ) | | | (1.84 | ) | | | (1.71 | ) |
| Net asset value at end of period | | $ | 2.52 | | | $ | 3.23 | | | $ | 3.50 | | | $ | 3.39 | | | $ | 4.01 | | | $ | 5.72 | |
| Total return(D) | | | (1.65 | %) | | | 6.51 | %(E) | | | 17.36 | % | | | 11.48 | % | | | 4.72 | % | | | 4.55 | % |
| Ratios and supplemental data: | | | | | | | | | | | | | | | | | | | | | | | | |
| Net assets at end of period (000’s) | | $ | 39,390 | | | $ | 97,136 | | | $ | 104,051 | | | $ | 110,842 | | | $ | 108,192 | | | $ | 115,642 | |
| Ratio to average net assets: | | | | | | | | | | | | | | | | | | | | | | | | |
| Net expenses | | | 1.88 | % | | | 1.85 | %(F) | | | 1.92 | % | | | 1.95 | % | | | 1.94 | % | | | 1.91 | % |
| Gross expenses | | | 1.96 | % | | | 1.93 | %(F) | | | 1.92 | % | | | 1.95 | % | | | 1.94 | % | | | 1.91 | % |
| Net investment loss | | | (1.01 | %) | | | (1.02 | %)(F) | | | (1.23 | %) | | | (1.10 | %) | | | (1.30 | %) | | | (0.66 | %) |
| Portfolio turnover rate | | | 94 | %(G)(H) | | | 30 | %(E) | | | 82 | % | | | 61 | % | | | 70 | % | | | 59 | % |
| (A) | The Fund changed its fiscal year end from November 30 to June 30. |
| (B) | The net investment income (loss) per share was based on average shares outstanding for the period. |
| (C) | Less than $0.005 per share. |
| (D | Total returns shown exclude the effect of applicable sales loads and fees. If these charges were included, the returns would be lower. |
| (G) | Portfolio turnover excludes the purchases and sales of securities by the Touchstone Small Cap Growth Fund acquired on September 21, 2018 (See Note 9 in the Notes to Financial Statements). If these transactions were included, portfolio turnover would have been higher. |
| (H) | Portfolio turnover excludes securities delivered from processing redemptions-in-kind. |
See accompanying Notes to Financial Statements.
Financial Highlights(Continued)
Touchstone Small Company Fund—Class Y
Selected Data for a Share Outstanding Throughout Each Period
| | | Year | | | Seven Months | | | | | | | | | | | | | |
| | | Ended | | | Ended | | | | | | | | | | | | | |
| | | June 30, | | | June 30, | | | Year Ended November 30, | |
| | | 2019 | | | 2018(A) | | | 2017(B) | | | 2016 | | | 2015 | | | 2014 | |
| Net asset value at beginning of period | | $ | 6.04 | | | $ | 6.10 | | | $ | 5.56 | | | $ | 5.89 | | | $ | 7.48 | | | $ | 8.78 | |
| Income (loss) from investment operations: | | | | | | | | | | | | | | | | | | | | | | | | |
| Net investment income (loss) | | | (— | )(C) | | | (— | )(C) | | | (0.06 | ) | | | (— | )(C)(D) | | | (0.01 | )(D) | | | 0.03 | (D) |
| Net realized and unrealized gains (losses) on investments | | | (0.09 | ) | | | 0.41 | | | | 1.02 | | | | 0.61 | | | | 0.28 | | | | 0.38 | |
| Total from investment operations | | | (0.09 | ) | | | 0.41 | | | | 0.96 | | | | 0.61 | | | | 0.27 | | | | 0.41 | |
| Distributions from: | | | | | | | | | | | | | | | | | | | | | | | | |
| Net investment income | | | (— | )(C) | | | — | | | | — | | | | — | | | | (0.02 | ) | | | — | |
| Realized capital gains | | | (0.62 | ) | | | (0.47 | ) | | | (0.42 | ) | | | (0.94 | ) | | | (1.84 | ) | | | (1.71 | ) |
| Total distributions | | | (0.62 | ) | | | (0.47 | ) | | | (0.42 | ) | | | (0.94 | ) | | | (1.86 | ) | | | (1.71 | ) |
| Net asset value at end of period | | $ | 5.33 | | | $ | 6.04 | | | $ | 6.10 | | | $ | 5.56 | | | $ | 5.89 | | | $ | 7.48 | |
| Total return | | | (0.79 | %) | | | 7.21 | %(E) | | | 18.41 | % | | | 12.95 | % | | | 5.71 | % | | | 5.62 | % |
| Ratios and supplemental data: | | | | | | | | | | | | | | | | | | | | | | | | |
| Net assets at end of period (000’s) | | $ | 326,021 | | | $ | 383,050 | | | $ | 388,404 | | | $ | 257,483 | | | $ | 220,543 | | | $ | 247,639 | |
| Ratio to average net assets: | | | | | | | | | | | | | | | | | | | | | | | | |
| Net expenses | | | 0.87 | % | | | 0.84 | %(F) | | | 0.85 | % | | | 0.89 | % | | | 0.87 | % | | | 0.85 | % |
| Gross expenses | | | 0.95 | % | | | 0.92 | %(F) | | | 0.85 | % | | | 0.89 | % | | | 0.87 | % | | | 0.85 | % |
| Net investment income (loss) | | | 0.00 | %(C) | | | (0.01 | %)(F) | | | (0.16 | %) | | | (0.04 | %) | | | (0.24 | %) | | | 0.46 | % |
| Portfolio turnover rate | | | 94 | %(G)(H) | | | 30 | %(E) | | | 82 | % | | | 61 | % | | | 70 | % | | | 59 | % |
Touchstone Small Company Fund — Institutional Class
Selected Data for a Share Outstanding Throughout Each Period
| | | | | | | | | | |
| | | Year | | | Seven Months | | | | |
| | | Ended | | | Ended | | | Period Ended | |
| | | June 30, | | | June 30, | | | November 30, | |
| | | 2019 | | | 2018(A) | | | 2017(I) | |
| Net asset value at beginning of period | | $ | 6.04 | | | $ | 6.10 | | | $ | 5.80 | |
| Income (loss) from investment operations: | | | | | | | | | | | | |
| Net investment income (loss) | | | — | (C) | | | — | (C) | | | (— | )(C) |
| Net realized and unrealized gains (losses) on investments | | | (0.10 | ) | | | 0.41 | | | | 0.30 | |
| Total from investment operations | | | (0.10 | ) | | | 0.41 | | | | 0.30 | |
| Distributions from: | | | | | | | | | | | | |
| Net investment income | | | (—)(C) | | | | — | | | | — | |
| Realized capital gains | | | (0.62 | ) | | | (0.47 | ) | | | — | |
| Total distributions | | | (0.62 | ) | | | (0.47 | ) | | | — | |
| Net asset value at end of period | | $ | 5.32 | | | $ | 6.04 | | | $ | 6.10 | |
| Total return | | | (0.91 | %) | | | 7.21 | %(E) | | | 5.17 | %(E) |
| Ratios and supplemental data: | | | | | | | | | | | | |
| Net assets at end of period (000’s) | | $ | 2,216 | | | $ | 8 | | | $ | 3 | |
| Ratio to average net assets: | | | | | | | | | | | | |
| Net expenses | | | 0.79 | % | | | 0.79 | %(F) | | | 0.79 | %(F) |
| Gross expenses | | | 2.52 | % | | | 275.86 | %(F) | | | 2069.15 | %(F) |
| Net investment income (loss) | | | 0.08 | % | | | 0.05 | %(F) | | | (0.70 | %)(F) |
| Portfolio turnover rate | | | 94 | %(G)(H) | | | 30 | %(E) | | | 82 | % |
| (A) | The Fund changed its fiscal year end from November 30 to June 30. |
| (B) | Effective October 28, 2017, Class I shares of the Sentinel Small Company Fund (the “Predecessor Fund”) were reorganized into Class Y shares of the Fund. |
| (C) | Less than $0.005 per share or 0.005%. |
| (D) | The net investment income (loss) per share was based on average shares outstanding for the period. |
| (G) | Portfolio turnover excludes the purchases and sales of securities by the Touchstone Small Cap Growth Fund acquired on September 21, 2018 (See Note 9 in the Notes to Financial Statements). If these transactions were included, portfolio turnover would have been higher. |
| (H) | Portfolio turnover excludes securities delivered from processing redemptions-in-kind. |
| (I) | Represents the period from commencement of operations (October 30, 2017) through November 30, 2017. |
See accompanying Notes to Financial Statements.
Financial Highlights(Continued)
Touchstone Small CompanyFund—Class R6
Selected Data for a Share Outstanding Throughout Each Period
| | | | | | | | | | | | | | | | |
| | | Year | | | Seven Months | | | | | | | | | | |
| | | Ended | | | Ended | | | | | | | | | Period Ended | |
| | | June 30, | | | June 30, | | | Year Ended November 30, | | | November 30, | |
| | | 2019 | | | 2018(A) | | | 2017 | | | 2016 | | | 2015(B) | |
| Net asset value at beginning of period | | $ | 5.65 | | | $ | 5.73 | | | $ | 5.24 | | | $ | 5.60 | | | $ | 5.44 | |
| Income (loss) from investment operations: | | | | | | | | | | | | | | | | | | | | |
| Net investment income (loss) | | | 0.01 | | | | — | (C) | | | (0.03 | ) | | | 0.01 | (D) | | | (0.01 | )(D) |
| Net realized and unrealized gains (losses) on investments | | | (0.08 | ) | | | 0.39 | | | | 0.94 | | | | 0.57 | | | | 0.17 | |
| Total from investment operations | | | (0.07 | ) | | | 0.39 | | | | 0.91 | | | | 0.58 | | | | 0.16 | |
| Distributions from: | | | | | | | | | | | | | | | | | | | | |
| Net investment income | | | (0.01 | ) | | | — | | | | — | | | | — | | | | — | |
| Realized capital gains | | | (0.62 | ) | | | (0.47 | ) | | | (0.42 | ) | | | (0.94 | ) | | | — | |
| Total distributions | | | (0.63 | ) | | | (0.47 | ) | | | (0.42 | ) | | | (0.94 | ) | | | — | |
| Net asset value at end of period | | $ | 4.95 | | | $ | 5.65 | | | $ | 5.73 | | | $ | 5.24 | | | $ | 5.60 | |
| Total return | | | (0.59 | %) | | | 7.33 | %(E) | | | 18.58 | % | | | 13.07 | % | | | 2.94 | %(E) |
| Ratios and supplemental data: | | | | | | | | | | | | | | | | | | | | |
| Net assets at end of period (000’s) | | $ | 137,585 | | | $ | 76,246 | | | $ | 67,052 | | | $ | 13,000 | | | $ | 599 | |
| Ratio to average net assets: | | | | | | | | | | | | | | | | | | | | |
| Net expenses | | | 0.73 | % | | | 0.73 | %(F) | | | 0.75 | % | | | 0.73 | % | | | 0.73 | %(F) |
| Gross expenses | | | 0.84 | % | | | 0.84 | %(F) | | | 0.77 | % | | | 0.99 | % | | | 2.96 | %(F) |
| Net investment income (loss) | | | 0.14 | % | | | 0.10 | %(F) | | | (0.07 | %) | | | 0.16 | % | | | (0.18 | %)(F) |
| Portfolio turnover rate | | | 94 | %(G)(H) | | | 30 | %(E) | | | 82 | % | | | 61 | % | | | 70 | % |
| (A) | The Fund changed its fiscal year end from November 30 to June 30. |
| (B) | Represents the period from commencement of operations (December 23, 2014) through November 30, 2015. |
| (C) | Less than $0.005 per share. |
| (D) | The net investment income (loss) per share was based on average shares outstanding for the period. |
| (G) | Portfolio turnover excludes the purchases and sales of securities by the Touchstone Small Cap Growth Fund acquired on September 21, 2018 (See Note 9 in the Notes to Financial Statements). If these transactions were included, portfolio turnover would have been higher. |
| (H) | Portfolio turnover excludes securities delivered from processing redemptions-in-kind. |
See accompanying Notes to Financial Statements.
Financial Highlights(Continued)
Touchstone Value Fund—Class A
Selected Data for a Share Outstanding Throughout Each Period
| | | | |
| | | Year Ended June 30, | |
| | | 2019 | | | 2018 | | | 2017 | | | 2016 | | | 2015 | |
| Net asset value at beginning of period | | $ | 9.92 | | | $ | 10.13 | | | $ | 8.84 | | | $ | 9.78 | | | $ | 9.56 | |
| Income (loss) from investment operations: | | | | | | | | | | | | | | | | | | | | |
| Net investment income | | | 0.16 | | | | 0.14 | | | | 0.19 | | | | 0.16 | | | | 0.16 | |
| Net realized and unrealized gains (losses) on investments | | | 0.57 | | | | 0.55 | | | | 1.30 | | | | (0.27 | ) | | | 0.34 | |
| Total from investment operations | | | 0.73 | | | | 0.69 | | | | 1.49 | | | | (0.11 | ) | | | 0.50 | |
| Distributions from: | | | | | | | | | | | | | | | | | | | | |
| Net investment income | | | (0.16 | ) | | | (0.14 | ) | | | (0.18 | ) | | | (0.16 | ) | | | (0.11 | ) |
| Realized capital gains | | | (1.08 | ) | | | (0.76 | ) | | | (0.02 | ) | | | (0.67 | ) | | | (0.17 | ) |
| Total distributions | | | (1.24 | ) | | | (0.90 | ) | | | (0.20 | ) | | | (0.83 | ) | | | (0.28 | ) |
| Net asset value at end of period | | $ | 9.41 | | | $ | 9.92 | | | $ | 10.13 | | | $ | 8.84 | | | $ | 9.78 | |
| Total return(A) | | | 8.53 | % | | | 6.92 | % | | | 16.92 | % | | | (0.89 | %) | | | 5.26 | % |
| Ratios and supplemental data: | | | | | | | | | | | | | | | | | | | | |
| Net assets at end of period (000’s) | | $ | 32,964 | | | $ | 36,968 | | | $ | 43,607 | | | $ | 47,939 | | | $ | 55,539 | |
| Ratio to average net assets: | | | | | | | | | | | | | | | | | | | | |
| Net expenses | | | 1.08 | % | | | 1.08 | % | | | 1.08 | % | | | 1.08 | % | | | 1.08 | % |
| Gross expenses | | | 1.26 | % | | | 1.26 | % | | | 1.24 | % | | | 1.28 | % | | | 1.27 | % |
| Net investment income | | | 1.67 | % | | | 1.42 | % | | | 1.86 | % | | | 1.71 | % | | | 1.54 | % |
| Portfolio turnover rate | | | 37 | %(B) | | | 24 | % | | | 29 | % | | | 19 | %(C) | | | 20 | % |
Touchstone Value Fund—Class C
Selected Data for a Share Outstanding Throughout Each Period
| | | |
| | Year Ended June 30, | |
| | | 2019 | | | 2018 | | | 2017 | | | 2016 | | | 2015 | |
| Net asset value at beginning of period | | $ | 9.89 | | | $ | 10.10 | | | $ | 8.81 | | | $ | 9.75 | | | $ | 9.55 | |
| Income (loss) from investment operations: | | | | | | | | | | | | | | | | | | | | |
| Net investment income | | | 0.09 | | | | 0.08 | | | | 0.12 | | | | 0.09 | | | | 0.07 | |
| Net realized and unrealized gains (losses) on investments | | | 0.56 | | | | 0.54 | | | | 1.29 | | | | (0.27 | ) | | | 0.35 | |
| Total from investment operations | | | 0.65 | | | | 0.62 | | | | 1.41 | | | | (0.18 | ) | | | 0.42 | |
| Distributions from: | | | | | | | | | | | | | | | | | | | | |
| Net investment income | | | (0.08 | ) | | | (0.07 | ) | | | (0.10 | ) | | | (0.09 | ) | | | (0.05 | ) |
| Realized capital gains | | | (1.08 | ) | | | (0.76 | ) | | | (0.02 | ) | | | (0.67 | ) | | | (0.17 | ) |
| Total distributions | | | (1.16 | ) | | | (0.83 | ) | | | (0.12 | ) | | | (0.76 | ) | | | (0.22 | ) |
| Net asset value at end of period | | $ | 9.38 | | | $ | 9.89 | | | $ | 10.10 | | | $ | 8.81 | | | $ | 9.75 | |
| Total return(A) | | | 7.72 | % | | | 6.12 | % | | | 16.06 | % | | | (1.65 | %) | | | 4.41 | % |
| Ratios and supplemental data: | | | | | | | | | | | | | | | | | | | | |
| Net assets at end of period (000’s) | | $ | 3,175 | | | $ | 3,654 | | | $ | 4,503 | | | $ | 5,624 | | | $ | 6,932 | |
| Ratio to average net assets: | | | | | | | | | | | | | | | | | | | | |
| Net expenses | | | 1.83 | % | | | 1.83 | % | | | 1.83 | % | | | 1.83 | % | | | 1.83 | % |
| Gross expenses | | | 2.35 | % | | | 2.21 | % | | | 2.12 | % | | | 2.16 | % | | | 2.14 | % |
| Net investment income | | | 0.92 | % | | | 0.68 | % | | | 1.11 | % | | | 0.96 | % | | | 0.79 | % |
| Portfolio turnover rate | | | 37 | %(B) | | | 24 | % | | | 29 | % | | | 19 | %(C) | | | 20 | % |
| (A) | Total returns shown exclude the effect of applicable sales loads and fees. If these charges were included, the returns would be lower. |
| (B) | Portfolio turnover excludes securities delivered from processing redemptions-in-kind. |
| (C) | Portfolio turnover excludes securities received from processing a subscription-in-kind. |
See accompanying Notes to Financial Statements.
Financial Highlights(Continued)
Touchstone Value Fund—Class Y
Selected Data for a Share Outstanding Throughout Each Period
| | | Year Ended June 30, | |
| | | 2019 | | | 2018 | | | 2017 | | | 2016 | | | 2015 | |
| Net asset value at beginning of period | | $ | 9.96 | | | $ | 10.17 | | | $ | 8.87 | | | $ | 9.81 | | | $ | 9.59 | |
| Income (loss) from investment operations: | | | | | | | | | | | | | | | | | | | | |
| Net investment income | | | 0.19 | | | | 0.17 | | | | 0.20 | | | | 0.18 | | | | 0.18 | |
| Net realized and unrealized gains (losses) on investments | | | 0.57 | | | | 0.55 | | | | 1.32 | | | | (0.27 | ) | | | 0.35 | |
| Total from investment operations | | | 0.76 | | | | 0.72 | | | | 1.52 | | | | (0.09 | ) | | | 0.53 | |
| Distributions from: | | | | | | | | | | | | | | | | | | | | |
| Net investment income | | | (0.19 | ) | | | (0.17 | ) | | | (0.20 | ) | | | (0.18 | ) | | | (0.14 | ) |
| Realized capital gains | | | (1.08 | ) | | | (0.76 | ) | | | (0.02 | ) | | | (0.67 | ) | | | (0.17 | ) |
| Total distributions | | | (1.27 | ) | | | (0.93 | ) | | | (0.22 | ) | | | (0.85 | ) | | | (0.31 | ) |
| Net asset value at end of period | | $ | 9.45 | | | $ | 9.96 | | | $ | 10.17 | | | $ | 8.87 | | | $ | 9.81 | |
| Total return | | | 8.82 | % | | | 7.19 | % | | | 17.28 | % | | | (0.64 | %) | | | 5.52 | % |
| Ratios and supplemental data: | | | | | | | | | | | | | | | | | | | | |
| Net assets at end of period (000’s) | | $ | 92,928 | | | $ | 81,988 | | | $ | 83,974 | | | $ | 76,852 | | | $ | 104,668 | |
| Ratio to average net assets: | | | | | | | | | | | | | | | | | | | | |
| Net expenses | | | 0.79 | % | | | 0.81 | % | | | 0.83 | % | | | 0.83 | % | | | 0.82 | % |
| Gross expenses | | | 0.94 | % | | | 0.95 | % | | | 0.97 | % | | | 0.99 | % | | | 0.97 | % |
| Net investment income | | | 1.96 | % | | | 1.70 | % | | | 2.11 | % | | | 1.96 | % | | | 1.80 | % |
| Portfolio turnover rate | | | 37 | %(A) | | | 24 | % | | | 29 | % | | | 19 | %(B) | | | 20 | % |
Touchstone Value Fund—Institutional Class
Selected Data for a Share Outstanding Throughout Each Period
| | | Year Ended June 30, | |
| | | 2019 | | | 2018 | | | 2017 | | | 2016 | | | 2015 | |
| Net asset value at beginning of period | | | $ | 9.93 | | | | $ | 10.14 | | | $ | 8.85 | | | | $ | 9.79 | | | $ | 9.57 | |
| Income (loss) from investment operations: | | | | | | | | | | | | | | | | | | | | | | | |
| Net investment income | | | | 0.20 | | | | | 0.19 | | | | 0.22 | | | | | 0.19 | | | | 0.18 | |
| Net realized and unrealized gains (losses) on investments | | | | 0.57 | | | | | 0.55 | | | | 1.31 | | | | | (0.27 | ) | | | 0.36 | |
| Total from investment operations | | | | 0.77 | | | | | 0.74 | | | | 1.53 | | | | | (0.08 | ) | | | 0.54 | |
| Distributions from: | | | | | | | | | | | | | | | | | | | | | | | |
| Net investment income | | | | (0.20 | ) | | | | (0.19 | ) | | | (0.22 | ) | | | | (0.19 | ) | | | (0.15 | ) |
| Realized capital gains | | | | (1.08 | ) | | | | (0.76 | ) | | | (0.02 | ) | | | | (0.67 | ) | | | (0.17 | ) |
| Total distributions | | | | (1.28 | ) | | | | (0.95 | ) | | | (0.24 | ) | | | | (0.86 | ) | | | (0.32 | ) |
| Net asset value at end of period | | | $ | 9.42 | | | | $ | 9.93 | | | $ | 10.14 | | | | $ | 8.85 | | | $ | 9.79 | |
| Total return | | | | 8.96 | % | | | | 7.34 | % | | | 17.38 | % | | | | (0.49 | %) | | | 5.68 | % |
| Ratios and supplemental data: | | | | | | | | | | | | | | | | | | | | | | | |
| Net assets at end of period (000’s) | | | $ | 208,686 | | | | $ | 262,467 | | | $ | 249,035 | | | | $ | 219,824 | | | $ | 248,381 | |
| Ratio to average net assets: | | | | | | | | | | | | | | | | | | | | | | | |
| Net expenses | | | | 0.68 | % | | | | 0.68 | % | | | 0.68 | % | | | | 0.68 | % | | | 0.68 | % |
| Gross expenses | | | | 0.89 | % | | | | 0.87 | % | | | 0.86 | % | | | | 0.87 | % | | | 0.86 | % |
| Net investment income | | | | 2.07 | % | | | | 1.82 | % | | | 2.26 | % | | | | 2.11 | % | | | 1.94 | % |
| Portfolio turnover rate | | | | 37 | %(A) | | | | 24 | % | | | 29 | % | | | | 19 | %(B) | | | 20 | % |
| (A) | Portfolio turnover excludes securities delivered from processing redemptions-in-kind. |
| (B) | Portfolio turnover excludes securities received from processing a subscription-in-kind. |
See accompanying Notes to Financial Statements.
Notes to Financial Statements
June 30, 2019
1. Organization
The Touchstone Strategic Trust (the “Trust”) is registered under the Investment Company Act of 1940, as amended (the “1940 Act”), as an open-end management investment company. The Trust was established as a Massachusetts business trust pursuant to an Agreement and Declaration of Trust dated November 18, 1982. The Trust consists of twenty funds, including the following eleven funds (individually, a “Fund”, and collectively, the “Funds”):
Touchstone Balanced Fund (“Balanced Fund”)
Touchstone Credit Opportunities Fund (“Credit Opportunities Fund”)
Touchstone International Equity Fund (“International Equity Fund”)
Touchstone International Growth Opportunities Fund (“International Growth Opportunities Fund”)
Touchstone International Small Cap Fund (“International Small Cap Fund”)
Touchstone Large Cap Focused Fund (“Large Cap Focused Fund”)
Touchstone Large Cap Fund (“Large Cap Fund”)
Touchstone Large Company Growth Fund (“Large Company Growth Fund”)
Touchstone Ohio Tax-Free Bond Fund (“Ohio Tax-Free Bond Fund”)
Touchstone Small Company Fund (“Small Company Fund”)
Touchstone Value Fund (“Value Fund”)
Each Fund is diversified, with the exception of the Credit Opportunities Fund, the International Growth Opportunities Fund, the Large Cap Focused Fund, the Large Cap Fund, the Large Company Growth Fund and the Ohio Tax-Free Bond Fund, which are non-diversified.
The Agreement and Declaration of Trust permits the Trust to issue an unlimited number of shares of beneficial interest of each Fund. The table below indicates the classes of shares that each Fund is registered to offer:
| | | | | Institutional | |
| | Class A | Class C | Class Y | Class | Class R6 |
| Balanced Fund | X | X | X | | |
| Credit Opportunities Fund | X | X | X | X | |
| International Equity Fund | X | X | X | X | |
| International Growth Opportunities Fund | X | X | X | X | |
| International Small Cap Fund | X | X | X | X | |
| Large Cap Focused Fund | X | X | X | X | |
| Large Cap Fund | X | X | X | X | |
| Large Company Growth Fund | X | X | X | X | |
| Ohio Tax-Free Bond Fund | X | X | X | X | |
| Small Company Fund | X | X | X | X | X |
| Value Fund | X | X | X | X | |
The assets of each Fund are segregated, and a shareholder’s interest is limited to the Fund in which shares are held. The Funds’ prospectus provides a description of each Fund’s investment goal, policies, and strategies along with information on the classes of shares currently being offered.
2. Significant Accounting Policies
The following is a summary of the Funds’ significant accounting policies:
Each Fund is an investment company that follows the accounting and reporting guidance of Accounting Standards Codification Topic 946 applicable to investment companies.
Notes to Financial Statements(Continued)
Regulatory Updates —In August 2018, the Securities and Exchange Commission (“SEC”) released its Final Rules that eliminated or amended disclosure requirements in the financial statements that were redundant or outdated in light of changes in SEC requirements or U.S. generally accepted accounting principles (“U.S. GAAP”). The Final Rules were effective November 5, 2018. Management has evaluated the SEC Final Rules and is complying with the amendments in the current financial statements.
In August 2018, the Financial Accounting Standards Board issued Accounting Standards Update (“ASU”) No. 2018-13, Fair Value Measurement (Topic 820): Disclosure Framework - Changes to the Disclosure Requirements for Fair Value Measurement, which amends and eliminates certain disclosure requirements for fair value as part of its framework project. The ASU is effective for annual and interim periods beginning after December 15, 2019. The early adoption of the removal or modification of disclosures and delay of adoption of the additional disclosures is permitted. As of June 30, 2019, the Funds have adopted the removal of applicable disclosures.
Security valuation and fair value measurements —U.S. GAAP defines fair value as the price the Funds would receive to sell an asset or pay to transfer a liability in an orderly transaction between market participants at the measurement date. All investments in securities are recorded at their fair value. The Funds define the term “market value”, as used throughout this report, as the estimated fair value. The Funds use various methods to measure fair value of their portfolio securities on a recurring basis. U.S. GAAP fair value measurement standards require disclosure of a hierarchy that prioritizes inputs to valuation methods.
These inputs are summarized in the three broad levels listed below:
| · | Level 1 – quoted prices in active markets for identical securities |
| · | Level 2 – other significant observable inputs (including quoted prices for similar securities, interest rates, prepayment speeds, credit risk, etc.) |
| · | Level 3 – significant unobservable inputs (including a Fund’s own assumptions in determining the fair value of investments) |
The inputs or methodology used for valuing securities are not necessarily an indication of the risk associated with investing in those securities.
The aggregate value by input level, as of June 30, 2019, for each Fund’s investments, is included in each Fund’s Portfolio of Investments, which also includes a breakdown of the Fund’s investments by geographic, portfolio or sector allocation. The Credit Opportunities Fund held Level 3 categorized securities during the year ended June 30, 2019.
Changes in valuation techniques may result in transfers into or out of an investment’s assigned level within the hierarchy.
The Funds’ portfolio securities are valued as of the close of the regular session of trading on the New York Stock Exchange (“NYSE”) (currently 4:00 p.m., Eastern Time or at the time as of which the NYSE establishes official closing prices). Portfolio securities traded on stock exchanges are valued at the last reported sale price, official close price, or last bid price if no sales are reported. Portfolio securities quoted by NASDAQ are valued at the NASDAQ Official Closing Price (“NOCP”) or from the primary exchange on which the security trades. To the extent these securities are actively traded, they are categorized in Level 1 of the fair value hierarchy. Options are valued at the last quoted sales price. If there is no such reported sale on the valuation date, long option positions are valued at the most recent bid price, and short option positions are valued at the most recent ask price on the valuation date and are categorized in Level 1. Shares of mutual funds in which the Funds invest are valued at their respective net asset value (“NAV”) as reported by the underlying funds and are categorized in Level 1.
Notes to Financial Statements(Continued)
Debt securities held by the Funds are valued at their evaluated bid by an independent pricing service or at their last broker-quoted bid prices as obtained from one or more of the major market makers for such securities. Independent pricing services use information provided by market makers or estimates of market values through accepted market modeling conventions. Observable inputs to the models may include prepayment speeds, pricing spread, yield, trade information, dealer quotes, market color, cash flow models, the securities’ terms and conditions, among others, and are generally categorized in Level 2. The Credit Opportunities Fund’s investments in bank loans are normally valued at the bid quotation obtained from dealers in loans by an independent pricing service in accordance with the Fund’s valuation policies and procedures approved by the Funds’ Board of Trustees (the “Board”), and are generally categorized in Level 2. The Credit Opportunities Fund’s investments in asset-backed and mortgage-backed securities are valued by independent pricing services using models that consider estimated cash flows of each tranche of the security, establish a benchmark yield and develop an estimated tranche specific spread to the benchmark yield based on the unique attributes of the tranche, and are generally categorized in Level 2. Debt securities with remaining maturities of 60 days or less may be valued at amortized cost, provided such amount approximates market value and are categorized in Level 2. While this method provides consistency in valuation (and may only be used if it approximates market value), it may result in periods during which fair value, as determined by amortized cost, is higher or lower than the price that would be received if the Fund sold the investment.
Securities mainly traded on a non-U.S. exchange or denominated in foreign currencies are generally valued according to the preceding closing values on that exchange, translated to U.S. dollars using currency exchange rates as of the close of regular trading on the NYSE, and are generally categorized in Level 1. However, if an event that may change the value of a security occurs after the time that the closing value on the non-U.S. exchange was determined, but before the close of regular trading on the NYSE, the security may be priced based on fair value and is generally categorized in Level 2. This may cause the value of the security, if held on the books of a Fund, to be different from the closing value on the non-U.S. exchange and may affect the calculation of that Fund’s NAV.
The Funds may use fair value pricing under the following circumstances, among others:
| · | If the value of a security has been materially affected by events occurring before the Funds’ pricing time but after the close of the primary markets on which the security is traded. |
| · | If the exchange on which a portfolio security is principally traded closes early or if trading in a particular portfolio security was halted during the day and did not resume prior to the Funds’ NAV calculation. |
| · | If a security is so thinly traded that reliable market quotations are unavailable due to infrequent trading. |
| · | If the validity of market quotations is not reliable. |
Securities held by the Funds that do not have readily available market quotations, significant observable inputs, or securities for which the available market quotations are not reliable, are priced at their estimated fair value using procedures approved by the Board and are generally categorized in Level 3.
Bank Loans —The Credit Opportunities Fund may invest in bank loans, which usually take the form of loan participations and assignments. Loan participations and assignments are agreements to make money available to U.S. or foreign corporations, partnerships or other business entities (the “Borrower”) in a specified amount, at a specified rate and within a specified time. A loan is typically originated, negotiated and structured by a U.S. or foreign bank, insurance company or other financial institution (the “Agent”) for a group of loan investors (“Loan Investors”). The Agent typically administers and enforces the loan on behalf of the other Loan Investors in the syndicate and may hold any collateral on behalf of the Loan Investors. Such loan participations and assignments are typically senior, secured and collateralized in nature. The Fund records an investment when the Borrower withdraws money and records interest as earned. These loans pay interest at rates which are periodically
Notes to Financial Statements(Continued)
reset by reference to a base lending rate plus a spread. These base lending rates are generally the prime rate offered by a designated U.S. bank or London Interbank Offered Rate (“LIBOR”).
The loans in which the Fund invests may be subject to some restrictions on resale. For example, the Fund may be contractually obligated to receive approval from the Agent and/or Borrower prior to the sale of these investments. The Fund generally has no right to enforce compliance with the terms of the loan agreement with the Borrower. As a result, the Fund assumes the credit risk of the Borrower, the selling participant and any other persons interpositioned between the Fund and the Borrower (“Intermediate Participants”). In the event that the Borrower, selling participant or Intermediate Participants become insolvent or enter into bankruptcy, the Fund may incur certain costs and delays in realizing payment or may suffer a loss of principal and/or interest.
Unfunded commitments represent the remaining obligation of the Fund to the Borrower. At any point in time, up to the maturity date of the issue, the Borrower may demand the unfunded portion. Until demanded by the Borrower, unfunded commitments are not recognized as an asset on the Statements of Assets and Liabilities. Unrealized appreciation/depreciation on unfunded commitments presented on the Statements of Assets and Liabilities represents fair value of the unfunded portion of the Fund’s bank loans.
As of June 30, 2019, the Credit Opportunities Fund did not hold any unfunded loan commitments.
Collateralized Loan Obligations —The Credit Opportunities Fund may invest in collateralized loan obligations (“CLOs”). CLOs are types of asset-backed securities. A CLO is an entity that is backed by syndicated bank loans. The cash flows of the CLO can be split into multiple segments, called “tranches,” which will vary in risk profile and yield. The riskiest segment is the subordinated or “equity” tranche. This tranche bears the greatest risk of defaults from the underlying assets in the CLO and serves to protect the other, more senior, tranches from default in all but the most severe circumstances. Since it is shielded from defaults by the more junior tranches, a “senior” tranche will typically have higher credit ratings and lower yields than their underlying securities, and often receive higher ratings from one or more of the nationally recognized rating agencies. Despite the protection from the more junior tranches, senior tranches can experience substantial losses due to actual defaults, increased sensitivity to future defaults and the disappearance of one or more protecting tranches as a result of changes in the credit profile of the underlying pool of assets.
Investment companies —The Funds may invest in securities of other investment companies, including exchange-traded funds (“ETFs”), open-end funds and closed-end funds. Open-end funds are investment companies that issue new shares continuously and redeem shares daily. Closed-end funds are investment companies that typically issue a fixed number of shares that trade on a securities exchange or over-the-counter (“OTC”). An ETF is an investment company that typically seeks to track the performance of an index by holding in its portfolio shares of all the companies, or a representative sample of the companies, that are components of a particular index. ETF shares are traded on a securities exchange based on their market value. The risks of investment in other investment companies typically reflect the risks of the types of securities in which the other investment companies invest. Investments in ETFs and closed-end funds are subject to the additional risk that their shares may trade at a premium or discount to their NAV. When a Fund invests in another investment company, shareholders of the Fund indirectly bear their proportionate share of the other investment company’s fees and expenses, including operating, registration, trustee, licensing and marketing, as well as their share of the Fund’s fees and expenses.
Securities sold short —The Credit Opportunities Fund may engage in selling securities short, which obligates the Fund to replace a security borrowed by purchasing the same security at the current market value. The Fund would incur a loss if the price of the security increases between the date of the short sale and the date on which the Fund replaces the borrowed security. The Fund would realize a gain if the price of the security declines between those dates. As of June 30, 2019, the Credit Opportunities Fund had securities sold short with a fair
Notes to Financial Statements(Continued)
value of $(590,750) and pledged securities with a fair value of $2,158,558 as collateral for both securities sold short and written options and had a related due to prime broker balance of $213,827.
Options —The Credit Opportunities Fund may write or purchase financial option contracts primarily to hedge against changes in the value of equity securities (or securities that the Fund intends to purchase), against fluctuations in fair value caused by changes in prevailing market interest rates or foreign currency exchange rates and against changes in overall equity market volatility. In addition, the Fund may utilize options in an attempt to generate gains from option premiums or to reduce overall portfolio risk. The Fund’s option strategy primarily focuses on the use of writing and/or purchasing call or put options on equity indexes. When the Fund writes or purchases an option, an amount equal to the premium received or paid by the Fund is recorded as a liability or an asset and is subsequently adjusted to the current market value of the option written or purchased. Premiums received or paid from writing or purchasing options which expire unexercised are treated by the Fund on the expiration date as realized gains or losses. The difference between the premium and the amount paid or received on effecting a closing purchase or sale transaction, including brokerage commissions, is also treated as a realized gain or loss. If an option is exercised, the premium paid or received is added to the cost of the purchase or proceeds from the sale in determining whether the Fund has realized a gain or loss on investment transactions. The Fund, as writer of an option, may have no control over whether the underlying securities may be sold (call) or purchased (put) and as a result bears the market risk of an unfavorable change in the price of the security underlying the written option. The Fund, as purchaser of an option, bears the risk that the counterparties to the option may not have the ability to meet the terms of the option contracts. There is minimal counterparty credit risk involved in entering into option contracts since they are exchange-traded instruments and the exchange’s clearinghouse, as counterparty to all exchange-traded options, guarantees the options against default. The maximum risk of loss associated with writing put options is the notional amount as presented in the Portfolio of Investments. In certain circumstances, the maximum risk of loss amounts may be partially offset by recovery values of the respective referenced assets and upfront premium received upon entering into the contract. The maximum risk of loss associated with writing call options is potentially unlimited.
As of June 30, 2019, the Credit Opportunities Fund had written options with fair value of $(1,280) and pledged securities with a fair value of $2,158,558 as collateral for both securities sold short and written options and had a related due to prime broker balance of $213,827. The Credit Opportunities Fund held purchased options with a fair value of $33,475 as of June 30, 2019.
Warrants —The Funds can invest in warrants and stock purchase rights of companies of any market capitalization. A warrant gives the holder the right to buy stock, typically from the issuer. The warrant specifies the amount of underlying stock, the purchase (or “exercise”) price, and the date the warrant expires. Certain warrants may permit, without legal obligation, net settlement for stock or cash. The Funds have no obligation to exercise the warrant and buy the stock.
Futures Contracts —The Balanced Fund may buy and sell futures contracts and related options to manage its exposure to changing interest rates and securities prices. Some strategies reduce the Fund’s exposure to price fluctuations, while others tend to increase its market exposure. Futures and options on futures can be volatile instruments and involve certain risks that could negatively impact the Fund’s return. In order to avoid leveraging and related risks, when the Fund purchases futures contracts, it will collateralize its position by depositing an amount of cash or liquid securities, equal to themarket value of the futures positions held, less margin deposits, in a segregated account with its custodian or otherwise “cover” its position in a manner consistent with the 1940 Act, or the rules of the Securities and Exchange Commission (the “SEC”) or interpretations thereunder. Collateral equal to the current fair value of the futures position will be determined on a daily basis.
When the contract is closed, the Fund records a realized gain or loss equal to the difference between the proceeds from (or cost of) the closing transactions and the Fund’s basis in the contract. Risks of entering into futures
Notes to Financial Statements (Continued)
contracts include the possibility that a change in the value of the contract may not correlate with the changes in the value of the underlying instruments. Second, it is possible that a lack of liquidity for futures contracts could exist in the secondary market resulting in an inability to close a futures position prior to its maturity date. Third, the purchase of a futures contract involves the risk that the Fund could lose more than the original margin deposit required to initiate the futures transaction. Finally, the risk exists that losses could exceed amounts disclosed on the Statements of Assets and Liabilities. There is minimal counterparty credit risk involved in entering into futures contracts since they are exchange-traded instruments and the exchange’s clearinghouse, as counter party to all exchange-traded futures, guarantees the futures against default.
As of June 30, 2019, the Balanced Fund did not hold any futures contracts.
Swap Contracts —The Credit Opportunities Fund may enter into swap transactions to help enhance the value of its portfolio or manage its exposure to different types of investments. Swaps are financial instruments that typically involve the exchange of cash flows between two parties on specified dates (settlement dates), where the cash flows are based on agreed-upon prices, rates, indexes, etc. The nominal amount on which the cash flows are calculated is called the notional amount. Swaps are individually negotiated and structured to include exposure to a variety of different types of investments or market factors, such as interest rates, foreign currency rates, mortgage securities, corporate borrowing rates, security prices, indexes or inflation rates.
Swap agreements may increase or decrease the overall volatility of the investments of the Fund and its share price. The performance of swap agreements may be affected by a change in the specific interest rate, currency, or other factors that determine the amounts of payments due to and from the Fund. If a swap agreement calls for payments by a Fund, the Fund must be prepared to make such payments when due. In addition, if the counterparty’s creditworthiness declines, the value of a swap agreement would be likely to decline, potentially resulting in losses.
Generally, bilateral swap agreements, OTC swaps, have a fixed maturity date that will be agreed upon by the parties. The agreement can be terminated before the maturity date only under limited circumstances, such as default by one of the parties or insolvency, among others, and can be transferred by a party only with the prior written consent of the other party. A Fund may be able to eliminate its exposure under a swap agreement either by assignment or by other disposition, or by entering into an offsetting swap agreement with the same party or a similarly creditworthy party. If the counterparty is unable to meet its obligations under the contract, declares bankruptcy, defaults or becomes insolvent, a Fund may not be able to recover the money it expected to receive under the contract.
Cleared swaps are transacted through futures commission merchants that are members of central clearinghouses with the clearinghouses serving as a central counterparty. Pursuant to rules promulgated under the Dodd-Frank Act, central clearing of swap agreements is currently required for certain market participants trading certain instruments, and central clearing for additional instruments is expected to be implemented by regulators until the majority of the swaps market is ultimately subject to central clearing.
Swaps are marked-to-market daily based upon values received from third party vendors or quotations from market makers. For OTC swaps, any upfront premiums paid or received are recorded as assets or liabilities, respectively, and are shown as premium paid on swap agreements or premium received on swap agreements in the Statements of Assets and Liabilities. For swaps that are centrally cleared, initial margins, determined by each relevant clearing agency, are posted and segregated at a broker account registered with the Commodity Futures Trading Commission, or the applicable regulator. The change in value of swaps, including accruals of periodic amounts of interest to be paid or received on swaps, is recorded as unrealized appreciation or depreciation. Daily changes in the value of centrally cleared swaps are recorded on the Statements of Assets and Liabilities as receivable or payable for variation margin on swap agreements and settled daily. Upfront premiums and
Notes to Financial Statements (Continued)
liquidation payments received or paid are recorded as realized gains or losses at the termination or maturity of the swap. Net periodic payments received or paid by the Fund are recorded as realized gain or loss.
A swap agreement can be a form of leverage, which can magnify the Fund’s gains or losses. In order to reduce the risk associated with leveraging, the Fund may cover its current obligations under swap agreements according to guidelines established by the SEC. If the Fund enters into a swap agreement on a net basis, it will segregate assets with a daily value at least equal to the excess, if any, of the Fund’s accrued obligations under the swap agreement over the accrued amount the Fund is entitled to receive under the agreement. If the Fund enters into a swap agreement on other than a net basis, it will segregate assets with a value equal to the full amount of the Fund’s accrued obligations under the agreement.
As of June 30, 2019, the Credit Opportunities Fund did not hold any swap contracts.
Foreign currency translation —The books and records of the Funds are maintained in U.S. dollars and translated into U.S. dollars on the following basis:
| (1) | market value of investment securities, assets and liabilities at the current rate of exchange on the valuation date; and |
| (2) | purchases and sales of investment securities, income, and expenses at the relevant rates of exchange prevailing on the respective dates of such transactions. |
The Funds do not isolate that portion of gains and losses on investments in equity securities that is due to changes in the foreign exchange rates from that which is due to changes in market prices of equity securities.
Real Estate Investment Trusts —The Funds may invest in real estate investment trusts (“REITs”) that involve risks not associated with investing in stocks. Risks associated with investments in REITs include declines in the value of real estate, general and economic conditions, changes in the value of the underlying property and defaults by borrowers. The value of assets in the real estate industry may go through cycles of relative underperformance and outperformance in comparison to equity securities markets in general. Dividend income is recorded using management’s estimate of the income included in distributions received from REIT investments. The actual amounts of income, return of capital and capital gains are only determined by each REIT after its fiscal year-end and may differ from the estimated amount. Estimates of income are adjusted in the Funds to the actual amounts when the amounts are determined.
Pay-In-Kind (“PIK”) Bonds –PIK bonds are securities that, at the issuer’s option, pay interest in either cash or additional securities for a specified period. PIK bonds, like zero coupon bonds, are designed to give an issuer flexibility in managing cash flow. PIK bonds are expected to reflect the market value of the underlying debt plus an amount representing accrued interest since the last payment. PIK bonds are usually less volatile than zero coupon bonds, but more volatile than cash pay securities.
Derivative instruments and hedging activities —The Credit Opportunities Fund and Balanced Fund may enter into an International Swaps and Derivatives Association, Inc. Master Agreement (“ISDA Master Agreement” or “MNA”) or similar agreement with certain counterparties. An ISDA Master Agreement is a bilateral agreement between a Fund and a counterparty that governs OTC derivatives and foreign exchange contracts, and typically contains, among other things, collateral posting terms and master netting provisions in the event of a default or termination. Under an ISDA Master Agreement, a party may, under certain circumstances, offset with the counterparty certain derivative financial instruments’ payables or receivables with collateral held or posted and create one single net payment. The provisions of the ISDA Master Agreement typically permit a single net payment in the event of default (close-out netting). These default events include bankruptcy or insolvency of the counterparty. Note, however, that bankruptcy or insolvency laws of a particular jurisdiction may impose restrictions on or prohibitions against the right of offset.
Notes to Financial Statements (Continued)
When entering into a derivative transaction, a Fund may be required to post and maintain collateral or margin (including both initial and maintenance margin). Collateral and margin requirements differ by type of derivative. Margin requirements are established by the broker or clearing house for exchange-traded and centrally cleared derivatives (financial futures contracts, options, and centrally cleared swaps). Brokers can ask for margining in excess of the clearing house’s minimum in certain circumstances. Collateral terms are contract specific for OTC derivatives (forward foreign currency contracts, options, and swaps). For derivatives traded under an ISDA Master Agreement, the collateral requirements are typically calculated by netting the marked-to-market amount for each transaction under such agreement and comparing that amount to the value of any collateral currently pledged by the Fund and the counterparty. For financial reporting purposes, cash collateral that has been pledged to cover obligations of the Fund and cash collateral received from the counterparty, if any, are reported separately on the Statements of Assets and Liabilities as cash deposits held at prime broker and due to prime broker, respectively. Non-cash collateral pledged by the Fund, if any, is noted in the Portfolio of Investments. To the extent amounts due to the Fund from its counterparties are not fully collateralized, contractually or otherwise, the Fund bears the risk of loss from counterparty non-performance.
Certain ISDA Master Agreements allow counterparties to OTC derivatives transactions to terminate derivative contracts prior to maturity in the event the Funds’ net assets decline by a stated percentage or the Fund fails to meet the terms of its ISDA Master Agreement, which would cause the Fund (counterparty) to accelerate payment of any net liability owed to the counterparty (Fund).
For financial reporting purposes, the Credit Opportunities Fund does not offset derivative assets and derivative liabilities that are subject to netting arrangements in the Statements of Assets and Liabilities.
As of June 30, 2019, the Credit Opportunities Fund’s assets and liabilities that were subject to a MNA on a gross basis were as follows:
| | | Assets | | | Liabilities | |
| Derivative Financial Instruments: | | | | | | | | |
| Written Options | | $ | — | | | $ | 1,280 | |
The following table presents the Credit Opportunities Fund’s liabilities net of amounts available for offset under a MNA and net of the related collateral pledged by the Fund as of June 30, 2019:
| | | | | | Gross Amounts | | | | | | | | | | |
| | | | | | Available for Offset | | | | | | | | | | |
| | | Gross Amount of | | | in Statement of | | | Non-cash | | | | | | | |
| | | Recognized | | | Assets and | | | Collateral | | | Cash Collateral | | | | |
| | | Liabilities | | | Liabilities | | | Pledged | | | Pledged | | | Net Amount(B) | |
| Written Options(A) | | $ | 1,280 | | | $ | — | | | $ | (1,280 | ) | | $ | — | | | $ | — | |
| (A) | Pershing LLC is the counterparty. |
| (B) | Net amount represents the net amount payable due to the counterparty in the event of default. |
The following table sets forth the fair value of the Credit Opportunities Fund’s derivative financial instruments by primary risk exposure as of June 30, 2019:
Fair Value of Derivative Investments
As of June 30, 2019
| | | Derivatives not accounted for as hedging | | Asset | | | Liability | |
| Fund | | instruments under ASC 815 | | Derivatives | | | Derivatives | |
| Credit Opportunities Fund | | Purchased Options - Equity Contracts* | | $ | 33,475 | | | $ | — | |
| | | Written Options - Equity Contracts** | | | — | | | | 1,280 | |
* Statements of Assets and Liabilities Location: Investments, at market value.
** Statements of Assets and Liabilities Location: Written options, at market value.
Notes to Financial Statements (Continued)
The following table sets forth the effect of the Credit Opportunities Fund’s derivative financial instruments by primary risk exposure on the Statements of Operations for the year ended June 30, 2019:
The Effect of Derivative Investments on the Statements of Operations
for the Year Ended June 30, 2019
| | | | | | | | Change in | |
| | | | | | | | Unrealized | |
| | | | | Realized Gain | | | Appreciation | |
| | | | | (Loss) | | | (Depreciation) | |
| | | Derivatives not accounted for as hedging | | on | | | on | |
| Fund | | instruments under ASC 815 | | Derivatives | | | Derivatives | |
| Credit Opportunities Fund | | Purchased Options - Equity Contracts* | | $ | (73,508 | ) | | $ | (48,576 | ) |
| | | Written Options - Equity Contracts** | | | 40,637 | | | | 1,416 | |
| | | Credit Default Swap - Credit Contracts*** | | | 10,278 | | | | — | |
* Statements of Operations Location: Net realized gains (losses) on investments and Net change in unrealized appreciation (depreciation) on investments.
**Statements of Operations Location: Net realized gains on written options and Net change in unrealized appreciation (depreciation) on written options.
*** Statements of Operations Location: Net realized gains on swap agreements.
For the year ended June 30, 2019, the average quarterly balances of outstanding derivative financial instruments were as follows:
| | | | | | Credit | |
| | | Balanced | | | Opportunities | |
| | | Fund | | | Fund | |
| Equity contracts: | | | | | | | | |
| Purchased Options - Cost | | $ | — | | | $ | 37,777 | |
| Written Options - Premiums received | | | — | | | | 8,290 | |
| Credit contracts: | | | | | | | | |
| Credit Default Swaps - Notional value* | | | — | | | | — | |
| Interest rate contracts: | | | | | | | | |
| Futures Contracts - Notional value | | | 3,132,857 | | | | — | |
* The balance at each quarter end was zero.
Portfolio securities loaned —The Funds may lend their portfolio securities. Lending portfolio securities exposes the Funds to the risk that the borrower may fail to return the loaned securities or may not be able to provide additional collateral or that the Funds may experience delays in recovery of the loaned securities or loss of rights in the collateral if the borrower fails financially. To minimize these risks, the borrower must agree to maintain cash collateral with the Funds’ custodian. The loaned securities are secured by collateral valued at least equal, at all times, to the market value of the loaned securities plus accrued interest, if any. When the collateral falls below specified amounts, the lending agent will use its best effort to obtain additional collateral on the next business day to meet required amounts under the security lending agreement. The cash collateral is reinvested by the Funds’ custodian into an approved short-term investment vehicle. The approved short-term investment vehicle is subject to market risk.
As of June 30, 2019, the following Funds loaned securities and received collateral as follows:
| | | | | Market | | | Market | | | | |
| | | | | Value of | | | Value of | | | | |
| | | | | Securities | | | Collateral | | | Net | |
| Fund | | Security Type | | Loaned* | | | Received** | | | Amount*** | |
| Credit Opportunities Fund | | Corporate Bonds | | $ | 1,346,199 | | | $ | 1,399,650 | | | $ | 53,451 | |
| International Equity Fund | | Common Stocks | | | 109,109 | | | | 114,450 | | | | 5,341 | |
Notes to Financial Statements (Continued)
| | | | | Market | | | Market | | | | |
| | | | | Value of | | | Value of | | | | |
| | | | | Securities | | | Collateral | | | Net | |
| Fund | | Security Type | | Loaned* | | | Received** | | | Amount*** | |
| International Growth Opportunities Fund | | Common Stocks | | $ | 390,644 | | | $ | 411,312 | | | $ | 20,668 | |
| International Small Cap Fund | | Common Stocks | | | 12,229,101 | | | | 12,761,400 | | | | 532,299 | |
| Small Company Fund | | Common Stocks | | | 12,870,562 | | | | 12,979,203 | | | | 108,641 | |
* The remaining contractual maturity is overnight for all securities.
** Gross amount of recognized liabilities for securities lending included in the Statements of Assets and Liabilities.
*** Net amount represents the net amount payable due to the borrower in the event of default.
All cash collateral is received, held, and administered by the Funds’ custodian for the benefit of the lending Fund in its custody account or other account established for the purpose of holding collateral in cash equivalents.
Funds participating in securities lending receive compensation in the form of fees. Securities lending income is derived from lending long securities from the Funds to creditworthy approved borrowers at rates that are determined based on trading volumes, float, short-term interest rates and market liquidity and is shown net of fees on the Statements of Operations. When a Fund lends securities, it retains the interest or dividends on the investment of any cash received as collateral, and the Fund continues to receive interest or dividends on the loaned securities.
Unrealized gain or loss on the market value of the loaned securities that may occur during the term of the loan is recognized by the Fund. The Fund has the right under the lending agreement to recover any loaned securities from the borrower on demand.
When-issued or delayed delivery transactions —Each Fund may purchase or sell securities on a when-issued or delayed delivery basis. These transactions involve a commitment by the Fund to purchase or sell securities for a predetermined price or yield, with payment and delivery taking place beyond the customary settlement period. When delayed delivery purchases are outstanding, the Fund will set aside liquid assets in an amount sufficient to meet the purchase price. When purchasing a security on a delayed delivery basis, the Fund assumes the rights and risks of ownership of the security, including the risk of price and yield fluctuations, and takes such fluctuations into account when determining NAV. The Fund may dispose of or renegotiate a delayed delivery transaction after it is entered into, and may sell when-issued securities before they are delivered, which may result in a capital gain or loss. When the Fund has sold a security on a delayed delivery basis, the Fund does not participate in future gains and losses with respect to the security.
Share valuation —The NAV per share of each class of shares of each Fund is calculated daily by dividing the total value of a Fund’s assets attributable to that class, less liabilities attributable to that class, by the number of outstanding shares of that class.
Effective August 17, 2018, the maximum offering price per share of Class A shares of the equity funds (all of the Funds except the Ohio Tax-Free Bond Fund) is equal to the NAV per share plus a sales load equal to 5.26% of the NAV (or 5.00% of the offering price). The maximum offering price per share of Class A shares of the fixed income fund (the Ohio Tax-Free Bond Fund) is equal to the NAV per share plus a sales load equal to 2.04% of the NAV (or 2.00% of the offering price). Prior to August 17, 2018 the maximum offering price per share of Class A shares of the equity funds was equal to the NAV per share plus a sales load equal to 6.10% of the NAV (or 5.75% of the offering price). The maximum offering price per share of Class A shares of the Ohio Tax-Free Bond Fund was equal to the NAV per share plus a sales load equal to 4.99% of the NAV (or 4.75% of the offering price).There is no sales load on fund purchases of Class A shares when aggregate purchases
Notes to Financial Statements (Continued)
in all Touchstone funds equal the maximum breakpoint which is at least $1 million for equity funds or $500,000 for fixed income funds. The maximum offering price per share of Classes C, Y, Institutional Class and R6 shares of the Funds is equal to the NAV per share.
The redemption price per share of each class of shares of the Funds is generally equal to the NAV per share. However, Class A redemptions that were part of a no-load purchase due to the aggregate purchase amount in all Touchstone Funds equaling at least the maximum breakpoint where a Finder’s Fee was paid may be subject to a contingent deferred sales charge (“CDSC”) of up to 1.00% or 0.50% for equity or fixed income funds, respectively, if redeemed within a one-year period from the date of purchase. Additionally, purchases of Class C shares of the Funds may be subject to a CDSC of 1.00% if redeemed within a one-year period from the date of purchase. The CDSC will be assessed on an amount equal to the lesser of (1) the NAV at the time of purchase of the shares being redeemed or (2) the NAV of such shares being redeemed.
Investment income —Dividend income from securities is recognized on the ex-dividend date, net of foreign withholding taxes, if any, which are reduced by any amounts reclaimable by the Funds, where applicable. Interest income from securities is recorded on the basis of interest accrued, premium amortized and discount accreted. Realized gains and losses resulting from principal paydowns on mortgage-backed and asset-backed securities are included in interest income. Market discounts, original issue discounts and market premiums on debt securities are accreted/amortized to interest income over the life of the security or to the appropriate call date, as applicable, with a corresponding adjustment in the cost basis of that security. In addition, it is the Funds’ policy to accrue for foreign capital gains taxes, if applicable, on certain foreign securities held by the Funds. An estimated foreign capital gains tax is recorded daily on net unrealized gains on these securities and is payable upon the sale of such securities when a gain is realized.
Distributions to shareholders —Each Fund intends to distribute to its shareholders substantially all of its income and capital gains. Each Fund, except the Balanced Fund, Credit Opportunities Fund, Ohio Tax-Free Bond Fund and the Value Fund, declares and distributes net investment income, if any, annually, as a dividend to shareholders. The Balanced Fund, Credit Opportunities Fund and Value Fund declare and distribute net investment income, if any, quarterly as a dividend to shareholders. The Ohio Tax-Free Bond Fund declares distributions from net investment income on a daily basis and distributes as a dividend to shareholders on a monthly basis. Each Fund makes distributions of capital gains, if any, at least annually, net of applicable capital loss carryforwards. Income distributions and capital gain distributions are determined in accordance with income tax regulations. Recognition of the Funds’ net investment income from investments in underlying funds is affected by the timing of dividend declarations by the underlying funds.
Allocations —Investment income earned, realized capital gains and losses, and unrealized appreciation and depreciation for a Fund are allocated daily to each class of shares based upon its proportionate share of total net assets of the Fund. Class-specific expenses are charged directly to the class incurring the expense. Common expenses, which are not attributable to a specific class, are allocated daily to each class of shares based upon their proportionate share of total net assets of the Fund. Expenses not directly billed to a Fund are allocated proportionally among all Funds in the Trust, and, if applicable, Touchstone Funds Group Trust, Touchstone Institutional Funds Trust, and Touchstone Variable Series Trust (collectively with the Trust, “Touchstone Fund Complex”), daily in relation to net assets of each Fund or another reasonable measure.
Security transactions —Security transactions are reflected for financial reporting purposes as of the trade date. Realized gains and losses on sales of portfolio securities are calculated using the identified cost basis.
Estimates —The preparation of financial statements in conformity with U.S. GAAP requires management to make estimates and assumptions that affect the reported amounts of assets and liabilities and disclosure of contingent assets and liabilities at the date of the financial statements and the reported amounts of income and expenses during the reporting period. Actual results could differ from those estimates.
Notes to Financial Statements (Continued)
3. Investment Transactions
Investment transactions (excluding short-term investments and U.S. Government securities) were as follows for the year ended June 30, 2019:
| | | | | | | | | | | | International | |
| | | | | | Credit | | | International | | | Growth | |
| | | Balanced | | | Opportunities | | | Equity | | | Opportunities | |
| | | Fund | | | Fund | | | Fund | | | Fund | |
| Purchases of investment securities | | $ | 39,039,261 | | $ | | 55,671,178 | | | $ | 65,636,034 | | | $ | 39,045,556 | |
| Proceeds from sales and maturities | | $ | 43,360,005 | | $ | | 49,034,825 | | | $ | 89,215,285 | | | $ | 36,804,958 | |
| | | | | | | | | | | | Large | |
| | | International | | | Large Cap | | | | | | Company | |
| | | Small Cap | | | Focused | | | Large Cap | | | Growth | |
| | | Fund | | | Fund* | | | Fund** | | | Fund | |
| Purchases of investment securities | | $ | 216,820,554 | | $ | | 255,010,425 | | | $ | 61,203,241 | | | $ | 90,567,787 | |
| Proceeds from sales and maturities | | $ | 294,780,575 | | $ | | 380,661,929 | | | $ | 127,565,316 | | | $ | 131,214,044 | |
| | | Ohio | | | | | | | | | | | |
| | | Tax-Free | | | Small | | | | | | | | |
| | | Bond | | | Company | | | Value | | | | | |
| | | Fund | | | Fund***, **** | | | Fund***** | | | | | |
| Purchases of investment securities | | $ | 25,560,455 | | $ | | 1,062,947,431 | | | $ | 124,519,601 | | | | | |
| Proceeds from sales and maturities | | $ | 25,290,660 | | $ | | 1,285,031,752 | | | $ | 132,227,100 | | | | | |
*Large Cap Focused Fund had redemptions-in-kind which resulted in redemptions out of the Fund of $75,878,981 and is excluded from the proceeds from sales and maturities. The redemptions were comprised of securities and cash in the amount of $65,726,118 and $10,152,863, respectively.
**Large Cap Fund had redemptions-in-kind which resulted in redemptions out of the Fund of $41,132,098 and is excluded from the proceeds from sales and maturities. The redemptions were comprised of securities and cash in the amount of $39,892,784 and $1,239,314, respectively.
***The costs of purchases and proceeds from sales on the Small Company Fund excludes the purchases and sales of the Small Cap Growth Fund (see Note 9). If these transactions were included, purchases and sales would have been higher.
****Small Company Fund had redemptions-in-kind which resulted in redemptions out of the Fund of $4,650,137 and is excluded from the proceeds from sales and maturities. The redemptions were comprised of securities and cash in the amount of $2,695,518 and $1,954,619, respectively.
*****Value Fund had redemptions-in-kind which resulted in redemptions out of the Fund of $65,223,894 and is excluded from the proceeds from sales and maturities. The redemptions were comprised of securities and cash in the amount of $63,282,300 and $1,941,594, respectively.
For the year ended June 30, 2019, purchases and proceeds from sales and maturities in U.S. Government Securities were $218,155,594 and $212,688,267, respectively, for the Balanced Fund. There were no purchases or proceeds from sales and maturities of U.S. Government securities by the other Funds for the year ended June 30, 2019.
4. Transactions with Affiliates and Other Related Parties
Certain officers of the Trust are also officers of Touchstone Advisors, Inc. (the “Advisor”),Touchstone Securities, Inc. (the “Underwriter”), or The Bank of New York Mellon, the Sub-Administrator to the Funds, and BNY Mellon Investment Servicing (U.S.) Inc., the Transfer Agent to the Funds (collectively referenced to herein as “BNY Mellon”). Such officers receive no compensation from the Trust. The Advisor and the Underwriter are each wholly-owned subsidiaries of Western & Southern Financial Group, Inc. (“Western & Southern”).
On behalf of the Funds, the Advisor pays each Independent Trustee a quarterly retainer plus additional retainers to the Lead Independent Trustee and the chairs of each standing committee. Interested Trustees do not receive compensation from the Funds. Each Independent Trustee also receives compensation for each Board meeting and committee meeting attended. Each standing committee chair receives additional compensation for each committee meeting that he or she oversees. The Advisor is reimbursed by the Funds for the Independent Trustees’
Notes to Financial Statements (Continued)
compensation and out-of-pocket expenses relating to their services. The Funds accrued Trustee-related expenses of $174,745 for the year ended June 30, 2019.
MANAGEMENT& EXPENSE LIMITATION AGREEMENTS
The Advisor provides general investment supervisory services for the Funds, under the terms of an advisory agreement (the “Advisory Agreement”). Under the Advisory Agreement, each Fund pays the Advisor a fee, which is computed and accrued daily and paid monthly, at an annual rate based on average daily net assets of each Fund as shown in the table below.
| Balanced Fund | 0.55% on the first $200 million |
| | 0.50% on the next $200 million |
| | 0.45% on the next $600 million |
| | 0.40% on the next $1 billion |
| | 0.35% on such assets over $2 billion |
| Credit Opportunities Fund* | 0.60% |
| International Equity Fund | 0.70% on the first $500 million |
| | 0.65% on the next $300 million |
| | 0.60% on the next $200 million |
| | 0.50% on the next $1 billion |
| | 0.40% on such assets over $2 billion |
| International Growth Opportunities Fund | 0.80% |
| International Small Cap Fund | 0.95% on the first $300 million |
| | 0.90% on the next $200 million |
| | 0.85% on the next $250 million |
| | 0.80% on the next $250 million |
| | 0.75% on the next $500 million |
| | 0.70% on the next $500 million |
| | 0.65% on such assets over $2 billion |
| Large Cap Focused Fund | 0.70% on the first $500 million |
| | 0.65% on the next $300 million |
| | 0.60% on the next $200 million |
| | 0.50% on the next $1 billion |
| | 0.40% on such assets over $2 billion |
| Large Cap Fund** | 0.60% on the first $500 million |
| | 0.54% on the next $500 million |
| | 0.50% on such assets over $1 billion |
| Large Company Growth Fund | 0.75% on the first $500 million |
| | 0.725% on the next $1.5 billion |
| | 0.70% on such assets over $2 billion |
| Ohio Tax-Free Bond Fund | 0.50% on the first $100 million |
| | 0.45% on the next $100 million |
| | 0.40% on the next $100 million |
| | 0.375% on such assets over $300 million |
| Small Company Fund | 0.70% on the first $500 million |
| | 0.65% on the next $300 million |
| | 0.60% on the next $200 million |
| | 0.50% on the next $1 billion |
| | 0.40% on such assets over $2 billion |
| Value Fund | 0.65% |
* Prior to March 1, 2019, the Fund paid 1.10%.
** Prior to June 1, 2019, the Fund paid 0.70% on the first $500 million, 0.64% on the next $500 million and 0.60% on such assets over $1 billion.
Notes to Financial Statements (Continued)
The Advisor has entered into investment sub-advisory agreements with the following parties (each, a “Sub-Advisor”):
| Ares Capital Management II LLC | DSM Capital Partners LLC |
| Credit Opportunities Fund | International Growth Opportunities Fund |
| | Large Company Growth Fund |
| | |
| Barrow, Hanley, Mewhinney & Strauss, LLC | The London Company |
| Value Fund | Large Cap Fund |
| | |
| Copper Rock Capital Partners LLC | Fort Washington Investment Advisors, Inc.* |
| International Small Cap Fund | Balanced Fund |
| | International Equity Fund |
| | Large Cap Focused Fund |
| | Ohio Tax-Free Bond Fund |
| | Small Company Fund |
*Affiliate of the Advisor and wholly-owned subsidiary of Western & Southern.
The Advisor pays the sub-advisory fees to each Sub-Advisor from its advisory fee.
The Advisor entered into an expense limitation agreement (the “Expense Limitation Agreement”) to contractually limit the annual operating expenses of the Funds, excluding: dividend and interest expenses relating to short sales; interest; taxes; brokerage commissions and other transaction costs; portfolio transaction and investment related expenses, including expenses associated with the Funds’ liquidity providers; other expenditures which are capitalized in accordance with U.S. GAAP; the cost of “Acquired Fund Fees and Expenses”, if any; and other extraordinary expenses not incurred in the ordinary course of business. The maximum annual operating expense limit in any year with respect to the Funds is based on a percentage of the average daily net assets of the Funds. The Advisor has agreed to waive a portion of its fees, and to reimburse certain fund expenses in order to maintain the following expense limitations for the Funds:
| | | | | | | | | | | | Institutional | | | | |
| | | Class A | | | Class C | | | Class Y | | | Class | | | Class R6 | |
| Balanced Fund | | | 1.01 | % | | | 1.78 | % | | | 0.81 | % | | | — | | | | — | |
| Credit Opportunities Fund* | | | 1.08 | % | | | 1.83 | % | | | 0.83 | % | | | 0.73 | % | | | — | |
| International Equity Fund | | | 1.36 | % | | | 2.49 | % | | | 0.99 | % | | | 0.89 | % | | | — | |
| International Growth Opportunities Fund | | | 1.24 | % | | | 1.99 | % | | | 0.99 | % | | | 0.89 | % | | | — | |
| International Small Cap Fund | | | 1.55 | % | | | 2.30 | % | | | 1.30 | % | | | 1.18 | % | | | — | |
| Large Cap Focused Fund | | | 1.00 | % | | | 1.79 | % | | | 0.72 | % | | | 0.65 | % | | | — | |
| Large Cap Fund** | | | 1.03 | % | | | 1.78 | % | | | 0.78 | % | | | 0.68 | % | | | — | |
| Large Company Growth Fund | | | 1.23 | % | | | 1.98 | % | | | 0.98 | % | | | 0.88 | % | | | — | |
| Ohio Tax-Free Bond Fund | | | 0.85 | % | | | 1.60 | % | | | 0.60 | % | | | 0.55 | % | | | — | |
| Small Company Fund | | | 1.22 | % | | | 1.95 | % | | | 0.89 | % | | | 0.79 | % | | | 0.73 | % |
| Value Fund | | | 1.08 | % | | | 1.83 | % | | | 0.83 | % | | | 0.68 | % | | | — | |
*Prior to March 1, 2019, the expense limitations for Classes A, C, Y and Institutional Class shares were 1.69%, 2.44%, 1.44% and 1.34%, respectively.
**Prior to June 1, 2019, the expense limitations for Classes A, C, Y and Institutional Class shares were 1.12%, 1.87%, 0.87% and 0.77%, respectively.
These expense limitations will remain in effect for all Funds through at least October 29, 2019, except for Credit Opportunities Fund and Large Cap Fund. The expense limitation for Credit Opportunities Fund will remain in effect through at least February 29, 2020. The expense limitation for Large Cap Fund will remain in effect through at least May 30, 2020. The expense limitation agreement can be terminated by a vote of the Funds’ Board if it deems the termination to be beneficial to the Funds’ shareholders.
Notes to Financial Statements (Continued)
During the year ended June 30, 2019, the Advisor or its affiliates waived investment advisory fees, administration fees or other operating expenses, including distribution fees, of the Funds as follows:
| | | Investment | | | | | | | | | | |
| | | Advisory | | | | | | Other Operating | | | | |
| | | Fees | | | Administration | | | Expenses | | | | |
| Fund | | Waived | | | Fees Waived | | | Waived | | | Total | |
| Balanced Fund | | $ | — | | | $ | — | | | $ | 261,732 | | | $ | 261,732 | |
| Credit Opportunities Fund | | | 59,280 | | | | 77,626 | | | | 36,344 | | | | 173,250 | |
| International Equity Fund | | | — | | | | 120,516 | | | | 37,851 | | | | 158,367 | |
| International Growth Opportunities Fund | | | 75,351 | | | | 52,255 | | | | 62,196 | | | | 189,802 | |
| International Small Cap Fund | | | — | | | | 37,885 | | | | 133,565 | | | | 171,450 | |
| Large Cap Focused Fund | | | — | | | | 1,939,759 | | | | 261,688 | | | | 2,201,447 | |
| Large Cap Fund | | | — | | | | 402,323 | | | | 57,459 | | | | 459,782 | |
| Large Company Growth Fund | | | — | | | | 116,598 | | | | 151,234 | | | | 267,832 | |
| Ohio Tax-Free Bond Fund | | | 59,529 | | | | 69,039 | | | | 35,349 | | | | 163,917 | |
| Small Company Fund | | | — | | | | 958,355 | | | | 50,119 | | | | 1,008,474 | |
| Value Fund | | | 12,270 | | | | 497,474 | | | | 157,396 | | | | 667,140 | |
Under the terms of the Expense Limitation Agreement, the Advisor is entitled to recover, subject to approval by the Funds’ Board, such amounts waived or reimbursed for a period of up to three years from the date on which the Advisor reduced its compensation or assumed expenses for the Funds. The Fund will make repayments to the Advisor only if such repayment does not cause the Fund’s operating expenses (after the repayment is taken into account) to exceed the Fund’s expense limit in place when such amounts were waived or reimbursed by the Advisor and the Fund’s current expense limitation.
As of June 30, 2019, the Advisor may seek recoupment of previously waived fees and reimbursed expenses as follows:
| | | Expires | | | Expires | | | Expires | | | Expires | | | | |
| | | on or | | | on or | | | on or | | | on or | | | | |
| | | before | | | before | | | before | | | before | | | | |
| | | June 30, | | | November 30, | | | June 30, | | | June 30, | | | | |
| Fund | | 2020 | | | 2020 | | | 2021 | | | 2022 | | | Total | |
| Balanced Fund | | $ | — | | | $ | 3,422 | | | $ | 16,819 | | | $ | 36,339 | | | $ | 56,580 | |
| Credit Opportunities Fund | | | 110,236 | | | | — | | | | 112,035 | | | | 172,127 | | | | 394,398 | |
| International Equity Fund | | | — | | | | 33,634 | | | | 98,681 | | | | 158,366 | | | | 290,681 | |
| International Growth Opportunities Fund | | | 105,564 | | | | — | | | | 106,252 | | | | 185,823 | | | | 397,639 | |
| International Small Cap Fund | | | 109,847 | | | | — | | | | 72,874 | | | | 142,116 | | | | 324,837 | |
| Large Cap Focused Fund | | | — | | | | 90,753 | | | | 1,304,229 | | | | 2,201,447 | | | | 3,596,429 | |
| Large Cap Fund | | | 464,555 | | | | — | | | | 449,854 | | | | 440,511 | | | | 1,354,920 | |
| Large Company Growth Fund | | | 193,888 | | | | — | | | | 249,815 | | | | 259,049 | | | | 702,752 | |
| Ohio Tax-Free Bond Fund | | | 133,855 | | | | — | | | | 129,632 | | | | 143,581 | | | | 407,068 | |
| Small Company Fund | | | — | | | | 29,439 | | | | 596,684 | | | | 1,008,474 | | | | 1,634,597 | |
| Value Fund | | | 620,025 | | | | — | | | | 680,915 | | | | 645,575 | | | | 1,946,515 | |
The Advisor did not recoup any amounts it previously waived or reimbursed during the year ended June 30, 2019.
ADMINISTRATION AGREEMENT
The Advisor entered into an Administration Agreement with the Trust, whereby the Advisor is responsible for: supplying executive and regulatory compliance services; supervising the preparation of tax returns; coordinating the preparation of reports to shareholders and reports to and filings with the SEC and state securities authorities,
Notes to Financial Statements(Continued)
as well as materials for meetings of the Board; calculating the daily NAV per share; and maintaining the financial books and records of each Fund.
For its services, the Advisor’s annual administrative fee is:
0.145% on the first $20 billion of the aggregate average daily net assets;
0.11% on the next $10 billion of aggregate average daily net assets;
0.09% on the next $10 billion of aggregate average daily net assets; and
0.07% on the aggregate average daily net assets over $40 billion.
The fee is computed and allocated among the Touchstone Fund Complex (excluding Touchstone Institutional Funds Trust) on the basis of relative daily net assets.
The Advisor has engaged BNY Mellon as the Sub-Administrator to the Trust. BNY Mellon provides administrative and accounting services to the Trust and is compensated directly by the Advisor, not the Trust.
TRANSFER AGENT AGREEMENT
Under the terms of the Transfer Agent Agreement between the Trust and BNY Mellon, BNY Mellon maintains the records of each shareholder’s account, answers shareholders’ inquiries concerning their accounts, processes purchases and redemptions of each Fund’s shares, acts as dividend and distribution disbursing agent, and performs other shareholder service functions. For these services, BNY Mellon receives a monthly fee from each Fund. In addition, each Fund pays out-of-pocket expenses incurred by BNY Mellon, including, but not limited to, postage and supplies.
The Funds may reimburse the Advisor for fees paid to intermediaries such as banks, broker-dealers, financial advisors or other financial institutions for sub-transfer agency, sub-administration and other services provided to investors whose shares of record are held in omnibus, other group accounts, retirement plans or accounts traded through registered securities clearing agents. These fees may vary based on, for example, the nature of services provided, but generally range up to 0.15% of the assets of the class serviced or maintained by the intermediary or up to $22 per sub-account maintained by the intermediary.
PLANS OF DISTRIBUTION AND SHAREHOLDER SERVICING FEE ARRANGEMENTS
The Trust has adopted distribution plans pursuant to Rule 12b-1 under the 1940 Act for each class of shares it offers that is subject to 12b-1 distribution fees. The plans allow each Fund to pay distribution and other fees for the sale and distribution of its shares and for services provided to shareholders. The fees charged to the Funds are limited to the actual expenses incurred. Under the Class A plan, each Fund offering Class A shares pays an annual fee not to exceed 0.25% of average daily net assets that are attributable to Class A shares. Under the Class C plan, each Fund offering Class C shares pays an annual fee not to exceed 1.00% of average daily net assets that are attributable to Class C shares (of which up to 0.75% is a distribution fee and up to 0.25% is a shareholder servicing fee).
UNDERWRITING AGREEMENT
The Underwriter is the Funds’ principal underwriter and, as such, acts as exclusive agent for distribution of the Funds’ shares. Under the terms of the Underwriting Agreement between the Trust and the Underwriter, the Underwriter earned underwriting and broker commissions on the sale of Class A shares of the Funds. W&S Brokerage Services, Inc., an affiliate of the Underwriter and the Advisor, also earned broker commissions on the sale of Class A shares of the Funds. Listed below are the total underwriting and broker commissions earned by the Underwriter and its affiliate during the year ended June 30, 2019:
Notes to Financial Statements(Continued)
| Fund | | Amount | |
| Balanced Fund | | $ | 16,793 | |
| Credit Opportunities Fund | | | 129 | |
| International Equity Fund | | | 5,107 | |
| International Growth Opportunities Fund | | | 246 | |
| International Small Cap Fund | | | 433 | |
| Large Cap Focused Fund | | | 15,671 | |
| Large Cap Fund | | | 675 | |
| Large Company Growth Fund | | | 585 | |
| Ohio Tax-Free Bond Fund | | | 2,422 | |
| Small Company Fund | | | 18,458 | |
| Value Fund | | | 2,275 | |
In addition, the Underwriter collected CDSC on the redemption of Class A and Class C shares of the Funds listed below during the year ended June 30, 2019:
| Fund | | Class A | | | Class C | |
| Balanced Fund | | $ | — | | | $ | 898 | |
| International Equity Fund | | | 9 | | | | 56 | |
| International Small Cap Fund | | | — | | | | 40 | |
| Large Cap Focused Fund | | | 53 | | | | 276 | |
| Large Cap Fund | | | — | | | | 158 | |
| Small Company Fund | | | 46 | | | | 393 | |
INTERFUND TRANSACTIONS
Pursuant to Rule 17a-7 under the 1940 act, the Funds may engage in purchase and sale transactions with funds that have a common investment advisor (or affiliated investment advisors), common Trustees and/or common Officers. During the year ended June 30, 2019, the Credit Opportunities Fund had purchases under Rule 17a-7 of $587,363.
5. Liquidity
ReFlow Fund LLC —The Funds may participate in the ReFlow Fund LLC liquidity program (“ReFlow”), which is designed to provide an alternative liquidity source for funds experiencing redemptions. In order to pay cash to shareholders who redeem their shares on a given day, a fund typically must hold cash in its portfolio, liquidate portfolio securities, or borrow money. ReFlow provides participating funds with another source of cash by standing ready to purchase shares from a fund up to the amount of the fund’s net redemptions on a given day, cumulatively limited to 3% of the outstanding voting shares of a Fund. ReFlow then generally redeems those shares (in cash or in-kind) when the Fund experiences net sales, at the end of a maximum holding period determined by ReFlow, or at other times at ReFlow’s discretion. In return for this service, the Fund will pay a fee to ReFlow at a rate determined by a daily auction with other participating mutual funds. The resulting fee is included in Other expenses on the Statements of Operations.
During the year ended June 30, 2019, the following Funds utilized ReFlow. The shares ReFlow subscribed to and redemptions-in-kind were as follows:
| | | Shares ReFlow | | | | |
| Fund | | Subscribed to | | | Redemptions-in-kind | |
| Large Cap Focused Fund | | | 1,866,600 | | | $ | 65,726,118 | |
| Small Company Fund | | | 729,142 | | | | 2,695,518 | |
Interfund Lending —Pursuant to an Exemptive Order issued by the SEC on March 28, 2017, the Funds, along with certain other funds in the Touchstone Fund Complex, may participate in an interfund lending program. The interfund lending program provides an alternate credit facility that allows the Funds to lend to
Notes to Financial Statements(Continued)
or borrow from other participating funds in the Touchstone Fund Complex, subject to the conditions of the Exemptive Order. The Funds may not borrow under the facility for leverage purposes and the loans’ duration may be no more than 7 days.
During the year ended June 30, 2019, the following Funds participated as a lender in the interfund lending program. The daily average amount loaned, weighted average interest rate and interest income were as follows:
| | | Daily Average | | | Weighted Average | | | | |
| | | Amount | | | Interest | | | Interest | |
| Fund | | Loaned | | | Rate | | | Income* | |
| Large Cap Focused Fund | | $ | 28,765 | | | | 2.33 | % | | $ | 680 | |
| Small Company Fund | | | 1,085,633 | | | | 2.13 | % | | | 23,274 | |
*Included in Interest in the Statements of Operations.
During the year ended June 30, 2019, the following Funds participated as a borrower in the interfund lending program. The daily average amount borrowed, weighted average interest rate and interest expense were as follows:
| | | Daily Average | | | Weighted Average | | | | |
| | | Amount | | | Interest | | | Interest | |
| Fund | | Borrowed | | | Rate | | | Expense* | |
| Balanced Fund | | $ | 6,961 | | | | 2.96 | % | | $ | 209 | |
| International Growth Opportunities Fund | | | 5,832 | | | | 3.02 | % | | | 179 | |
| International Small Cap Fund | | | 287,818 | | | | 2.29 | % | | | 6,585 | |
| Large Cap Focused Fund | | | 34,138 | | | | 2.14 | % | | | 741 | |
| Large Cap Fund | | | 150,531 | | | | 2.26 | % | | | 3,374 | |
| Large Company Growth Fund | | | 198,561 | | | | 2.14 | % | | | 4,224 | |
*Included in Other expenses in the Statements of Operations.
6. Federal Tax Information
Federal Income Tax —It is each Fund’s policy to continue to comply with the special provisions of the Internal Revenue Code applicable to regulated investment companies. As provided therein, in any fiscal year in which a Fund so qualifies and distributes at least 90% of its investment company taxable income, the Fund (but not the shareholders) will be relieved of federal income tax on the income distributed. It is each Fund’s policy to distribute all of its taxable and tax-exempt income and accordingly, no provision for income taxes has been made.
In order to avoid imposition of the excise tax applicable to regulated investment companies, it is also each Fund’s intention to declare and pay as dividends in each calendar year at least 98% of its investment company taxable income (earned during the calendar year) and 98.2% of its net realized capital gains (earned during the twelve months ending October 31) plus undistributed amounts from prior years.
The tax character of distributions paid is as follows:
| | | Balanced Fund | | | Credit Opportunities Fund | |
| | | | | | Seven | | | | | | | | | | |
| | | Year Ended | | | Months Ended | | | Year Ended | | | Year Ended | | | Year Ended | |
| | | June 30, | | | June 30, | | | November 30, | | | June 30, | | | June 30, | |
| | | 2019 | | | 2018 | | | 2017 | | | 2019 | | | 2018 | |
| From ordinary income | | $ | 5,073,305 | | | $ | 2,415,681 | | | $ | 3,724,887 | | | $ | 3,271,569 | | | $ | 3,211,801 | |
| From long-term capital gains | | | 15,844,335 | | | | 15,494,463 | | | | 2,124,199 | | | | 307,535 | | | | 926,076 | |
| Total Distributions | | $ | 20,917,640 | | | $ | 17,910,144 | | | $ | 5,849,086 | | | $ | 3,579,104 | | | $ | 4,137,877 | |
Notes to Financial Statements(Continued)
| | | International Equity Fund | | | International Growth Opportunities Fund | |
| | | | | | Seven | | | | | | | | | | |
| | | Year Ended | | | Months Ended | | | Year Ended | | | Year Ended | | | Year Ended | |
| | | June 30, | | | June 30, | | | November 30, | | | June 30, | | | June 30, | |
| | | 2019 | | | 2018 | | | 2017 | | | 2019 | | | 2018 | |
| From ordinary income | | $ | 2,842,238 | | | $ | 2,308,837 | | | $ | 1,250,578 | | | $ | 425,814 | | | $ | 372,285 | |
| From long-term capital gains | | | 17,560,388 | | | | 7,102,450 | | | | — | | | | 4,272,059 | | | | 149,175 | |
| Total Distributions | | $ | 20,402,626 | | | $ | 9,411,287 | | | $ | 1,250,578 | | | $ | 4,697,873 | | | $ | 521,460 | |
| | | International Small Cap Fund | | | Large Cap Focused Fund | |
| | | | | | | | | | | | Seven | | | | |
| | | Year Ended | | | Year Ended | | | Year Ended | | | Months Ended | | | Year Ended | |
| | | June 30, | | | June 30, | | | June 30, | | | June 30, | | | November 30, | |
| | | 2019 | | | 2018 | | | 2019 | | | 2018 | | | 2017 | |
| From ordinary income | | $ | 3,700,412 | | | $ | 7,979,769 | | | $ | 22,680,841 | | | $ | 4,002,079 | | | $ | 24,480,711 | |
| From long-term capital gains | | | 16,613,583 | | | | 1,865,799 | | | | 152,239,077 | | | | 265,660,471 | | | | 115,781,936 | |
| Total Distributions | | $ | 20,313,995 | | | $ | 9,845,568 | | | $ | 174,919,918 | | | $ | 269,662,550 | | | $ | 140,262,647 | |
| | | Large Cap Fund | | | Large Company Growth Fund | | | Ohio Tax-Free Bond Fund | |
| | | Year Ended | | | Year Ended | | | Year Ended | | | Year Ended | | | Year Ended | | Year Ended | |
| | | June 30, | | | June 30, | | | June 30, | | | June 30, | | | June 30, | | June 30, | |
| | | 2019 | | | 2018 | | | 2019 | | | 2018 | | | 2019 | | 2018 | |
| From ordinary income | | $ | 2,699,506 | | | $ | 2,347,689 | | | $ | 716,305 | | | $ | 1,615,959 | | | $ | 615 | | $ | 640 | |
| From tax-exempt income | | | — | | | | — | | | | — | | | | — | | | | 1,353,201 | | | 1,338,760 | |
| From long-term capital gains | | | — | | | | — | | | | 12,955,949 | | | | 4,705,569 | | | | — | | | — | |
| Total Distributions | | $ | 2,699,506 | | | $ | 2,347,689 | | | $ | 13,672,254 | | | $ | 6,321,528 | | | $ | 1,353,816 | | $ | 1,339,400 | |
| | | Small Company Fund | | | Value Fund | |
| | | | | | Seven | | | | | | | | | | |
| | | Year Ended | | | Months Ended | | | Year Ended | | | Year Ended | | | Year Ended | |
| | | June 30, | | | June 30, | | | November 30, | | | June 30, | | | June 30, | |
| | | 2019 | | | 2018 | | | 2017 | | | 2019 | | | 2018 | |
| From ordinary income | | $ | 34,623,870 | | | $ | 19,425,568 | | | $ | — | | | $ | 9,739,930 | | | $ | 7,015,940 | |
| From long-term capital gains | | | 110,406,903 | | | | 85,276,646 | | | | 89,216,186 | | | | 31,961,207 | | | | 27,716,248 | |
| Total Distributions | | $ | 145,030,773 | | | $ | 104,702,214 | | | $ | 89,216,186 | | | $ | 41,701,137 | | | $ | 34,732,188 | |
Notes to Financial Statements(Continued)
The following information is computed on a tax basis for each item as of June 30, 2019:
| | | | | | | | | | | | International | |
| | | | | | Credit | | | International | | | Growth | |
| | | Balanced | | | Opportunities | | | Equity | | | Opportunities | |
| | | Fund | | | Fund | | | Fund | | | Fund | |
| Tax cost of portfolio investments | | $ | 200,302,078 | | | $ | 60,699,721 | | | $ | 146,263,986 | | | $ | 28,103,102 | |
| Gross unrealized appreciation on investments | | | 140,283,325 | | | | 1,714,536 | | | | 36,729,656 | | | | 7,859,495 | |
| Gross unrealized depreciation on investments | | | (2,217,217 | ) | | | (1,485,433 | ) | | | (28,344,908 | ) | | | (804,447 | ) |
| Net unrealized appreciation (depreciation) on investments | | | 138,066,108 | | | | 229,103 | | | | 8,384,748 | | | | 7,055,048 | |
| Gross unrealized appreciation on foreign currency transactions, securities sold short, deferred capital gains tax and derivatives | | | — | | | | 2,774 | | | | 838 | | | | 204 | |
| Gross unrealized depreciation on foreign currency transactions, securities sold short, deferred capital gains tax and derivatives | | | — | | | | (10,729 | ) | | | — | | | | — | |
| Net unrealized appreciation (depreciation) on foreign currency transactions, securities sold short, deferred capital gains tax and derivatives | | | — | | | | (7,955 | ) | | | 838 | | | | 204 | |
| Other temporary differences | | | — | | | | — | | | | — | | | | — | |
| Undistributed ordinary income | | | 929,717 | | | | 218,735 | | | | 1,116,936 | | | | 2,970 | |
| Qualified late-year losses | | | — | | | | — | | | | (264,009 | ) | | | — | |
| Capital Loss Carryforwards | | | — | | | | — | | | | — | | | | (4,717,545 | ) |
| Undistributed long-term capital gains | | | 470,741 | | | | 158,624 | | | | 4,978 | | | | — | |
| Distributable earnings (deficit) | | $ | 139,466,566 | | | $ | 598,507 | | | $ | 9,243,491 | | | $ | 2,340,677 | |
| | | | | | Large | | | | | | Large | |
| | | International | | | Cap | | | Large | | | Company | |
| | | Small Cap | | | Focused | | | Cap | | | Growth | |
| | | Fund | | | Fund | | | Fund | | | Fund | |
| Tax cost of portfolio investments | | $ | 192,380,614 | | | $ | 848,766,919 | | | $ | 222,220,904 | | | $ | 129,330,942 | |
| Gross unrealized appreciation on investments | | | 33,104,569 | | | | 914,336,883 | | | | 70,503,267 | | | | 97,512,614 | |
| Gross unrealized depreciation on investments | | | (10,122,767 | ) | | | (30,020,849 | ) | | | (8,488,182 | ) | | | (1,542,861 | ) |
| Net unrealized appreciation (depreciation) on investments | | | 22,981,802 | | | | 884,316,034 | | | | 62,015,085 | | | | 95,969,753 | |
| Net unrealized appreciation on foreign currency transactions | | | 745 | | | | — | | | | — | | | | — | |
| Undistributed ordinary income | | | — | | | | 7,230,685 | | | | 1,775,246 | | | | — | |
| Qualified late-year losses | | | — | | | | — | | | | — | | | | (296,089 | ) |
| Capital Loss Carryforwards | | | (12,449,455 | ) | | | — | | | | — | | | | — | |
| Undistributed long-term capital gains | | | — | | | | 51,515,830 | | | | 15,510,765 | | | | 12,954,030 | |
| Distributable earnings (deficit) | | $ | 10,533,092 | | | $ | 943,062,549 | | | $ | 79,301,096 | | | $ | 108,627,694 | |
Notes to Financial Statements(Continued)
| | | Ohio | | | | | | | |
| | | Tax- Free | | | Small | | | | |
| | | Bond | | | Company | | | Value | |
| | | Fund | | | Fund | | | Fund | |
| Tax cost of portfolio investments | | $ | 44,363,092 | | | $ | 924,181,729 | | | $ | 282,186,973 | |
| Gross unrealized appreciation on investments | | | 2,815,652 | | | | 216,552,683 | | | | 74,006,282 | |
| Gross unrealized depreciation on investments | | | (123 | ) | | | (34,192,392 | ) | | | (18,968,107 | ) |
| Net unrealized appreciation (depreciation) on investments | | | 2,815,529 | | | | 182,360,291 | | | | 55,038,175 | |
| Qualified late-year losses | | | — | | | | (27,552,310 | ) | | | (134,241 | ) |
| Other temporary differences | | | (24,497 | ) | | | — | | | | — | |
| Undistributed ordinary income | | | — | | | | — | | | | — | |
| Undistributed tax-exempt income | | | 6,471 | | | | — | | | | — | |
| Undistributed long-term capital gains | | | 27,980 | | | | 56,602,588 | | | | 15,928,852 | |
| Distributable earnings (deficit) | | $ | 2,825,483 | | | $ | 211,410,569 | | | $ | 70,832,786 | |
The difference between the tax cost of portfolio investments and the financial statement cost is primarily due to wash sale loss deferrals, investments in passive foreign investment company (“PFIC”) adjustments, basis adjustments on securities no longer treated as PFICs and nontaxable distribution basis outstanding.
As of June 30, 2019, the Funds had the following capital loss carryforwards for federal income tax purposes:
| | | No | | | No | | | | |
| | | Expiration | | | Expiration | | | | |
| | | Short Term | | | Long Term | | | Total | |
| International Growth Opportunities Fund | | $ | 4,510,886 | | | $ | 206,659 | | | $ | 4,717,545 | |
| International Small Cap Fund | | | 12,449,455 | | | | — | | | | 12,449,455 | |
The capital loss carryforwards may be utilized in future years to offset net realized capital gains, if any, prior to distributing such gains to shareholders.
During the year ended June 30, 2019, the following Funds utilized capital loss carryforwards:
| Funds | | Utilized | |
| Large Cap Fund | | $ | 13,791,146 | |
Under current laws, certain capital losses realized after October 31 and ordinary losses realized after December 31 may be deferred (and certain ordinary losses after October and/or December 31 may be deferred) and treated as occurring on the first day of the following fiscal year. For the year ended June 30, 2019, the Funds elected to the following losses:
| | | Realized | | | Ordinary | | | | |
| Fund | | Capital Losses | | | Losses | | | Total | |
| International Equity Fund | | $ | 264,009 | | | $ | — | | | $ | 264,009 | |
| Large Company Growth Fund | | | — | | | | 296,089 | | | | 296,089 | |
| Small Company Fund | | | 26,875,724 | | | | 676,586 | | | | 27,552,310 | |
| Value Fund | | | 134,241 | | | | — | | | | 134,241 | |
The Funds have analyzed their tax positions taken or to be taken on federal income tax returns for all open tax years (tax years ended June 30, 2016 through 2019) and have concluded that no provision for income tax is required in their financial statements.
Certain reclassifications, the result of permanent differences between financial statement and income tax reporting requirements, have been made to the components of capital. These reclassifications have no impact on the net assets or NAV per share of the Funds. The following reclassifications, which are primarily attributed to the tax
Notes to Financial Statements(Continued)
treatment of short-term capital gains netted against net operating loss and deemed distributions on shareholder redemptions, have been made to the following Funds for the year ended June 30, 2019:
| | | Paid-In | | | Distributable | |
| Fund | | Capital | | | Earnings | |
| International Small Cap Fund | | $ | (250,682 | ) | | $ | 250,682 | |
| Large Cap Fund | | | 11,821,539 | | | | (11,821,539 | ) |
| Large Cap Focused Fund | | | 72,531,482 | | | | (72,531,482 | ) |
| Large Company Growth Fund | | | (256,315 | ) | | | 256,315 | |
| Small Company Fund | | | 192,234 | | | | (192,234 | ) |
| Value Fund | | | 22,323,067 | | | | (22,323,067 | ) |
7. Commitments and Contingencies
The Funds indemnify theTrust’s officers andTrustees for certain liabilities that might arise from their performance of their duties to the Funds. Additionally, in the normal course of business, the Funds enter into contracts that contain a variety of representations and warranties and which provide general indemnifications. The Funds’ maximum exposure under these arrangements is unknown, as this would involve future claims that may be made against the Funds.
8. Principal Risks
Risks Associated with Foreign Investments —Some of the Funds may invest in the securities of foreign issuers. Investing in securities issued by companies whose principal business activities are outside the U.S. may involve significant risks not present in domestic investments. For example, there is generally less publicly available information about foreign companies, particularly those not subject to the disclosure and reporting requirements of the U.S. securities laws. Foreign issuers are generally not bound by uniform accounting, auditing, and financial reporting requirements and standards of practice comparable to those applicable to domestic issuers. Investments in foreign securities also involve the risk of possible adverse changes in investment or exchange control regulations, expropriation or confiscatory taxation, limitations on the removal of funds or other assets of a Fund, political or financial instability or diplomatic and other developments which could affect such investments. Foreign stock markets, while growing in volume and sophistication, are generally not as developed as those in the U.S., and securities of some foreign issuers (particularly those located in developing countries) may be less liquid and more volatile than securities of comparable U.S. companies. In general, there is less overall governmental supervision and regulation of foreign securities markets, broker-dealers, and issuers than in the U.S.
Risks Associated with Sector Concentration —Certain Funds may invest a high percentage of their assets in specific sectors of the market in order to achieve a potentially greater investment return. As a result, these Funds may be more susceptible to economic, political, and regulatory developments in a particular sector of the market, positive or negative, and may experience increased volatility on the Funds’ NAVs and magnified effect on the total return.
Risks Associated with Credit —An issuer may be unable to make timely payments of either principal or interest. This may cause the issuer’s securities to decline in value. Credit risk is particularly relevant to those Funds that invest a significant amount of their assets in junk bonds or lower-rated securities.
Risks Associated with Interest Rate Changes —The price of debt securities is generally linked to the prevailing market interest rates. In general, when interest rates rise, the price of debt securities falls, and when interest rates fall, the price of debt securities rises. The price volatility of a debt security also depends on its maturity. Longer-term securities are generally more volatile, so the longer the average maturity or duration of these securities, the greater their price risk. Duration is a measure of the expected life, taking into account any prepayment or call features of the security, that is used to determine the price sensitivity of the security for a given change in
Notes to Financial Statements(Continued)
interest rates. Specifically, duration is the change in the value of a fixed-income security that will result from a 1% change in interest rates, and generally is stated in years. For example, as a general rule a 1% rise in interest rates means a 1% fall in value for every year of duration. Maturity, on the other hand, is the date on which a fixed-income security becomes due for payment of principal. The negative impact on fixed income securities if interest rates increase as a result could negatively impact a Fund’s NAV.
Risks Associated with Liquidity —Liquidity risk exists when particular investments are difficult to purchase or sell. This can reduce a Fund’s returns because a Fund may be unable to transact at advantageous times or prices, or at all.
Please see the Funds’ prospectus for a complete discussion of these and other risks.
9. Fund Reorganizations
Small Company Fund Reorganization:
The shareholders of the Touchstone Small Cap Growth Fund, a series of the Trust, approved an Agreement and Plan of Reorganization providing for the transfer of all assets and liabilities of the Touchstone Small Cap Growth Fund to the Touchstone Small Company Fund. The tax-free reorganization took place on September 21, 2018.
The following is a summary of shares outstanding, net assets, net asset value per share and unrealized appreciation immediately before and after the tax-free reorganization.
| | | | | | After | |
| | | Before Reorganization | | | Reorganization | |
| | | Touchstone | | | Touchstone | | | Touchstone | |
| | | Small Cap | | | Small Company | | | Small Company | |
| | | Growth Fund | | | Fund | | | Fund | |
| Class A | | | | | | | | | | | | |
| Shares | | | 3,572,822 | (A) | | | 113,082,178 | | | | 116,655,000 | |
| Net Assets | | $ | 21,326,954 | | | $ | 675,012,128 | | | $ | 696,339,082 | |
| Net Asset Value | | $ | 5.97 | (A) | | $ | 5.97 | | | $ | 5.97 | |
| Class C | | | | | | | | | | | | |
| Shares | | | 1,917,820 | (B) | | | 29,092,599 | | | | 31,010,419 | |
| Net Assets | | $ | 6,665,795 | | | $ | 101,117,364 | | | $ | 107,783,159 | |
| Net Asset Value | | $ | 3.48 | (B) | | $ | 3.48 | | | $ | 3.48 | |
| Class Y | | | | | | | | | | | | |
| Shares | | | 11,284,528 | (C) | | | 65,216,246 | | | | 76,500,774 | |
| Net Assets | | $ | 73,494,700 | | | $ | 424,748,096 | | | $ | 498,242,796 | |
| Net Asset Value | | $ | 6.51 | (C) | | $ | 6.51 | | | $ | 6.51 | |
| Institutional Class | | | | | | | | | | | | |
| Shares | | | 556,531 | (D) | | | 74,162 | | | | 630,693 | |
| Net Assets | | $ | 3,625,412 | | | $ | 483,116 | | | $ | 4,108,528 | |
| Net Asset Value | | $ | 6.51 | (D) | | $ | 6.51 | | | $ | 6.51 | |
| Class R6 | | | | | | | | | | | | |
| Shares | | | — | | | | 13,592,489 | | | | 13,592,489 | |
| Net Assets | | $ | — | | | $ | 82,888,657 | | | $ | 82,888,657 | |
| Net Asset Value | | $ | — | | | $ | 6.10 | | | $ | 6.10 | |
| Fund Total | | | | | | | | | | | | |
| Shares Outstanding | | | 20,075,021 | | | | 221,057,674 | | | | 238,389,375 | |
| Net Assets | | $ | 105,112,861 | | | $ | 1,284,249,361 | | | $ | 1,389,362,222 | |
| Unrealized Appreciation (Depreciation) | | $ | 24,471,563 | | | $ | 345,400,026 | | | $ | 369,871,589 | |
| | | | | | | | | | | | | |
Notes to Financial Statements(Continued)
(A) Reflects a 0.8051:1 stock split which occurred on the date of reorganization, September 21, 2018.
(B) Reflects a 1.0348:1 reverse stock split which occurred on the date of reorganization, September 21, 2018.
(C) Reflects a 0.8586:1 stock split which occurred on the date of reorganization, September 21, 2018.
(D) Reflects a 0.8691:1 stock split which occurred on the date of reorganization, September 21, 2018.
Assuming the reorganization had been completed on July 1, 2018, the Small Company Fund’s results of operations for the year ended June 30, 2019 would have been as follows:
| Net investment loss | | $ | (2,507,344 | ) |
| Net realized and unrealized gain (loss) on investments | | $ | (10,037,911 | ) |
| Net decrease in net assets resulting from operations | | $ | (12,545,255 | ) |
Because the combined investment portfolios have been managed as a single portfolio since the reorganization was completed, it is not practical to separate the amounts of revenue and earnings to the Small Company Fund that have been included in its statement of operations since the reorganization.
Sentinel Reorganization:
The shareholders of the Sentinel Balanced Fund, Sentinel International Equity Fund, Sentinel Common Stock Fund and Sentinel Small Company Fund (the “Reorganizing Funds”), each a series of Sentinel Group Funds, Inc., approved an Agreement and Plan of Reorganization providing for the transfer of all assets and liabilities of each Reorganizing Fund to the corresponding Touchstone Fund as noted below. The Balanced Fund, International Equity Fund, Large Cap Focused Fund and Small Company Fund, each a new series of the Trust, assumed the financial and performance history of the Sentinel Balanced Fund, Sentinel International Equity Fund, Sentinel Common Stock Fund and Sentinel Small Company Fund, respectively. The tax-free reorganizations took place on October 27, 2017.
| | | | | Net | | | Shares | |
| Reorganizing Funds | | Touchstone Funds* | | Assets | | | Outstanding | |
| Sentinel Balanced Fund | | Balanced Fund | | $ | 331,423,150 | | | | 15,092,088 | |
| Sentinel International Equity Fund | | International Equity Fund | | | 203,883,053 | | | | 10,805,595 | |
| Sentinel Common Stock Fund | | Large Cap Focused Fund | | | 1,895,170,925 | | | | 40,069,142 | |
| Sentinel Small Company Fund | | Small Company Fund | | | 1,214,732,067 | | | | 230,307,818 | |
*Class A, Class C, and Class I shares of the Reorganizing Funds were exchanged for Class A, Class C and Class Y shares, respectively, of the corresponding Touchstone Fund. Class R6 shares of the Sentinel Common Stock Fund were exchanged for Institutional Class shares of the Large Cap Focused Fund. Class R6 shares of the Sentinel Small Company Fund were exchanged for Class R6 shares of the Small Company Fund. On October 30, 2017, the International Equity Fund and Small Company Fund began issuing Institutional Class shares.
10. Subsequent Events
Subsequent events occurring after the date of this report have been evaluated for potential impact to this report through the date the financial statements were issued.
At a meeting of the Board held on May 16, 2019, the Board approved the reorganization (“Reorganization”) of the Credit Opportunities Fund into the Touchstone Credit Opportunities II Fund, a series of the Touchstone Funds GroupTrust, subject to shareholder approval. The Reorganization, if approved by shareholders, is expected to be completed on or about September 6, 2019.
There were no other subsequent events that necessitated recognition or disclosure in the Funds’ financial statements.
Report of Independent Registered Public Accounting Firm
To the Shareholders of Touchstone Balanced Fund, Touchstone Credit Opportunities Fund, Touchstone International Equity Fund, Touchstone International Growth Opportunities Fund, Touchstone International Small Cap Fund, Touchstone Large Cap Focused Fund, Touchstone Large Cap Fund, Touchstone Large Company Growth Fund, Touchstone Ohio Tax-Free Bond Fund, Touchstone Small Company Fund and Touchstone Value Fund and the Board of Trustees of Touchstone Strategic Trust.
Opinion on the Financial Statements
We have audited the accompanying statements of assets and liabilities of Touchstone Balanced Fund, Touchstone Credit Opportunities Fund, Touchstone International Equity Fund, Touchstone International Growth Opportunities Fund, Touchstone International Small Cap Fund, Touchstone Large Cap Focused Fund, Touchstone Large Cap Fund, Touchstone Large Company Growth Fund, Touchstone Ohio Tax-Free Bond Fund, Touchstone Small Company Fund and Touchstone Value Fund (collectively referred to as the “Funds”), (eleven of the funds constituting the Touchstone Strategic Trust (the “Trust”)), including the portfolios of investments, as of June 30, 2019, and the related statements of operations and changes in net assets, and the financial highlights for each of the periods indicated in the table below and the related notes (collectively referred to as the “financial statements”). In our opinion, the financial statements present fairly, in all material respects, the financial position of each of the Funds (eleven of the funds constituting Touchstone Strategic Trust) at June 30, 2019, and the results of their operations, changes in net assets and financial highlights for each of the periods indicated in the table below, in conformity with U.S. generally accepted accounting principles.
| Individual funds | | | | | | |
| constituting | | | | | | |
| Touchstone Strategic | | Statement of | | Statements of | | |
| Trust | | operations | | changes in net assets | | Financial highlights |
Touchstone Balanced Fund Touchstone International Equity Fund Touchstone Large Cap Focused Fund Touchstone Small Company Fund | | For the year ended June 30, 2019 | | For the year ended June 30, 2019, the seven months ended June 30, 2018 and the year ended November 30, 2017 |
|
| Touchstone Credit Opportunities Fund | | For the year ended June 30, 2019 | | For each of the two years in the period ended June 30, 2019 | | For each of the three years in the period ended June 30, 2019 and the period from September 1, 2015 (commencement of operations) through June 30, 2016 |
Touchstone International Growth Opportunities Fund Touchstone Large Company Growth Fund | | For the year ended June 30, 2019 | | For each of the two years in the period ended June 30, 2019 | | For each of the three years in the period ended June 30, 2019 |
Touchstone International Small Cap Fund Touchstone Ohio Tax-Free Bond Fund Touchstone Value Fund | | For the year ended June 30, 2018 | | For each of the two years in the period ended June 30, 2018 | | For each of the five years in the period ended June 30, 2018 |
| Touchstone Large Cap Fund | | For the year ended June 30, 2018 | | For each of the two years in the period ended June 30, 2018 | | For each of the three years in the period ended June 30, 2018 and the period from July 10, 2014 (commencement of operations) through June 30, 2015 |
Report of Independent Registered Public Accounting Firm(continued)
The financial highlights for each of the three years in the period ended November 30, 2016 of Touchstone Balanced Fund, Touchstone International Equity Fund, Touchstone Large Cap Focused Fund and Touchstone Small Company Fund were audited by other auditors, whose report dated January 19, 2017 expressed an unqualified opinion on those financial highlights. The financial highlights for each of the two years in the period ended June 30, 2016 of Touchstone International Growth Opportunities Fund and Touchstone Large Company Growth Fund were audited by other auditors, whose report dated August 25, 2016 expressed an unqualified opinion on those financial highlights.
Basis for Opinion
These financial statements are the responsibility of the Trust’s management. Our responsibility is to express an opinion on each of the Funds’ financial statements based on our audits. We are a public accounting firm registered with the Public Company Accounting Oversight Board (United States) (“PCAOB”) and are required to be independent with respect to the Trust in accordance with the U.S. federal securities laws and the applicable rules and regulations of the Securities and Exchange Commission and the PCAOB.
We conducted our audits in accordance with the standards of the PCAOB. Those standards require that we plan and perform the audit to obtain reasonable assurance about whether the financial statements are free of material misstatement, whether due to error or fraud. The Trust is not required to have, nor were we engaged to perform, an audit of the Trust’s internal control over financial reporting. As part of our audits we are required to obtain an understanding of internal control over financial reporting but not for the purpose of expressing an opinion on the effectiveness of the Trust’s internal control over financial reporting. Accordingly, we express no such opinion.
Our audits included performing procedures to assess the risks of material misstatement of the financial statements, whether due to error or fraud, and performing procedures that respond to those risks. Such procedures included examining, on a test basis, evidence regarding the amounts and disclosures in the financial statements. Our procedures included confirmation of securities owned as of June 30, 2019, by correspondence with the custodian, transfer agent, brokers and agent banks or by other appropriate auditing procedures where replies from brokers and agent banks were not received. Our audits also included evaluating the accounting principles used and significant estimates made by management, as well as evaluating the overall presentation of the financial statements. We believe that our audits provide a reasonable basis for our opinion.

We have served as the auditor of one or more Touchstone Investments’ investment companies since 1999.
Cincinnati, Ohio
August 23, 2019
Other Items(Unaudited)
Qualified Dividend Income
Under the Jobs and Growth Tax Relief Reconciliation Act of 2003 (the “Act”), the following percentages of ordinary dividends paid during the fiscal year ended June 30, 2019 are designated as “qualified dividend income,” as defined in the Act, and are subject to reduced tax rates in 2015. The Funds intend to pass through the maximum allowable percentage for Form 1099Div.
| Balanced Fund | | | 75.67 | % |
| International Equity Fund | | | 100.00 | % |
| International Growth Opportunities Fund | | | 32.28 | % |
| International Small Cap Fund | | | 100.00 | % |
| Large Cap Fund | | | 100.00 | % |
| Large Cap Focused Fund | | | 78.41 | % |
| Large Company Growth Fund | | | 100.00 | % |
| Small Company Fund | | | 33.78 | % |
| Value Fund | | | 100.00 | % |
Dividend Received Deduction
For corporate shareholders, the following ordinary distributions paid during the current fiscal year ended June 30, 2019 qualify for the corporate dividends received deduction. The Funds intend to pass through the maximum allowable percentage.
| Balanced Fund | | | 72.49 | % |
| International Growth Opportunities Fund | | | 5.68 | % |
| Large Cap Fund | | | 100.00 | % |
| Large Cap Focused Fund | | | 76.87 | % |
| Large Company Growth Fund | | | 100.00 | % |
| Small Company Fund | | | 33.10 | % |
| Value Fund | | | 97.39 | % |
For the fiscal year ended June 30, 2019, the Funds designated long-term capital gains as follows:
| Balanced Fund | | $ | 15,844,335 | |
| Credit Opportunities Fund | | $ | 307,535 | |
| International Equity Fund | | $ | 17,560,388 | |
| International Growth Opportunities Fund | | $ | 4,272,059 | |
| International Small Cap Fund | | $ | 16,613,583 | |
| Large Cap Fund | | $ | 15,510,765 | |
| Large Cap Focused Fund | | $ | 194,807,693 | |
| Large Company Growth Fund | | $ | 16,674,631 | |
| Ohio Tax Free Bond Fund | | $ | 27,980 | |
| Small Company Fund | | $ | 134,267,837 | |
| Value Fund | | $ | 37,107,684 | |
Of the dividends paid from net investment income during the most-recent fiscal year, 99.96% was designated as exempt interest dividends for federal income tax purposes for the Ohio Tax-Free Bond Fund.
Foreign Tax Income & Foreign Tax Credit
The International Equity Fund, International Growth Opportunities Fund, and International Small Cap Fund intend to pass through a foreign tax credit to the shareholders. For the fiscal year ended June 30, 2019, the total amount of foreign source income is $4,167,609 or $0.42 per share for the International Equity Fund, $344,602 or $0.21 per share for the International Growth Opportunities Fund, and $5,586,907 or $0.43 per share for the International Small Cap Fund. The total amount of foreign taxes to be paid is $270,980 or $0.27 per share per share for the International Equity Fund, $17,729 or $0.01 per share for the International Growth
Other Items(Unaudited) (Continued)
Opportunities Fund, and $397,983 or $0.03 per share for the International Small Cap Fund. Shareholder’s allocable share of the foreign tax credit will be reported on Form 1099 Div.
Proxy Voting Guidelines and Proxy Voting Records
The Sub-Advisors are responsible for exercising the voting rights associated with the securities purchased and held by the Funds. A description of the policies and procedures that the Sub-Advisors use in fulfilling this responsibility is available as an appendix to the most recent Statement of Additional Information, which can be obtained without charge by calling toll free 1.800.543.0407 or by visiting the Touchstone website at TouchstoneInvestments.com or on the Securities and Exchange Commission’s (the “Commission”) website sec.gov. Information regarding how those proxies were voted during the most recent twelve-month period ended June 30, which will be filed by August 31 of that year, is also available without charge by calling toll free 1.800.543.0407 or on the Commission’s website at sec.gov.
Quarterly Portfolio Disclosure
The Trust files a complete listing of portfolio holdings for each Fund as of the end of the first and third quarters of each fiscal year on Form N-PORT. The information will be publicly available 60 days after the end of the period. The complete listing of each Fund’s portfolio holdings is available on the Commission’s website and will be made available to shareholders upon request by calling 1.800.543.0407.
Schedule of Shareholder Expenses
As a shareholder of the Funds, you incur two types of costs: (1) transaction costs, such as sales charges (loads); and (2) ongoing costs, including investment advisory fees; distribution (12b-1) fees; and other Fund expenses. This example is intended to help you understand your ongoing costs (in dollars) of investing in the Funds and to compare these costs with the ongoing costs of investing in other mutual funds.
The example is based on an investment of $1,000 invested at the beginning of the period and held for the entire period (January 1, 2019 through June 30, 2019).
Actual Expenses
The first line for each share class of a Fund in the table below provides information about actual account values and actual expenses. You may use the information in this line, together with the amount you invested, to estimate the expenses that you paid over the period. Simply divide your account value by $1,000 (for example, an $8,600 account value divided by $1,000 = 8.6), then multiply the result by the number in the first line under the heading entitled “Expenses Paid During the Six Months Ended June 30, 2019” to estimate the expenses you paid on your account during this period.
Hypothetical Example for Comparison Purposes
The second line for each share class of a Fund in the table below provides information about hypothetical account values and hypothetical expenses based on the Funds’ actual expense ratio and an assumed rate of return of 5% per year before expenses, which is not the Funds’ actual return. The hypothetical account values and expenses may not be used to estimate the actual ending account balance or expenses you paid for the period. You may use this information to compare the ongoing costs of investing in the Funds and other funds. To do so, compare this 5% hypothetical example with the 5% hypothetical examples that appear in the shareholder reports of the other funds.
Please note that the expenses shown in the table are meant to highlight your ongoing costs only and do not reflect any transactional costs, such as sales charges (loads). Therefore, the second line for each share class of a
Other Items(Unaudited) (Continued)
Fund in the table below is useful in comparing ongoing costs only, and will not help you determine the relative total costs of owning different funds. In addition, if these transactional costs were included, your costs would have been higher.
| | | | | | | | | | | | | | | Expenses | |
| | | | | | Net Expense | | | Beginning | | | Ending | | | Paid During | |
| | | | | | Ratio | | | Account | | | Account | | | the Six Months | |
| | | | | | Annualized | | | Value | | | Value | | | Ended | |
| | | | | | June 30, | | | January 1, | | | June 30, | | | June 30, | |
| | | | | | 2019 | | | 2019 | | | 2019 | | | 2019* | |
| Touchstone Balanced Fund | | | | | | | | | | | | | | | | | |
| Class A | | Actual | | | | 1.01 | % | | $ | 1,000.00 | | | $ | 1,140.40 | | | $ | 5.36 | |
| Class A | | Hypothetical | | | | 1.01 | % | | $ | 1,000.00 | | | $ | 1,019.79 | | | $ | 5.06 | |
| | | | | | | | | | | | | | | | | | | | |
| Class C | | Actual | | | | 1.78 | % | | $ | 1,000.00 | | | $ | 1,135.80 | | | $ | 9.43 | |
| Class C | | Hypothetical | | | | 1.78 | % | | $ | 1,000.00 | | | $ | 1,015.97 | | | $ | 8.90 | |
| | | | | | | | | | | | | | | | | | | | |
| Class Y | | Actual | | | | 0.81 | % | | $ | 1,000.00 | | | $ | 1,140.90 | | | $ | 4.30 | |
| Class Y | | Hypothetical | | | | 0.81 | % | | $ | 1,000.00 | | | $ | 1,020.78 | | | $ | 4.06 | |
| | | | | | | | | | | | | | | | | | | | |
| Touchstone Credit Opportunities Fund | | | | | | | | | | | | | | | | | |
| Class A | | Actual | | | | 1.33 | % | | $ | 1,000.00 | | | $ | 1,099.80 | | | $ | 6.92 | ** |
| Class A | | Hypothetical | | | | 1.33 | % | | $ | 1,000.00 | | | $ | 1,018.20 | | | $ | 6.66 | ** |
| | | | | | | | | | | | | | | | | | | | |
| Class C | | Actual | | | | 2.10 | % | | $ | 1,000.00 | | | $ | 1,095.70 | | | $ | 10.91 | ** |
| Class C | | Hypothetical | | | | 2.10 | % | | $ | 1,000.00 | | | $ | 1,014.38 | | | $ | 10.49 | ** |
| | | | | | | | | | | | | | | | | | | | |
| Class Y | | Actual | | | | 1.05 | % | | $ | 1,000.00 | | | $ | 1,101.00 | | | $ | 5.47 | ** |
| Class Y | | Hypothetical | | | | 1.05 | % | | $ | 1,000.00 | | | $ | 1,019.59 | | | $ | 5.26 | ** |
| | | | | | | | | | | | | | | | | | | | |
| Institutional Class | | Actual | | | | 1.02 | % | | $ | 1,000.00 | | | $ | 1,101.50 | | | $ | 5.31 | ** |
| Institutional Class | | Hypothetical | | | | 1.02 | % | | $ | 1,000.00 | | | $ | 1,019.74 | | | $ | 5.11 | ** |
| | | | | | | | | | | | | | | | | | | | |
| Touchstone International Equity Fund | | | | | | | | | | | | | | | | | |
| Class A | | Actual | | | | 1.32 | % | | $ | 1,000.00 | | | $ | 1,117.10 | | | $ | 6.93 | |
| Class A | | Hypothetical | | | | 1.32 | % | | $ | 1,000.00 | | | $ | 1,018.25 | | | $ | 6.61 | |
| | | | | | | | | | | | | | | | | | | | |
| Class C | | Actual | | | | 2.54 | % | | $ | 1,000.00 | | | $ | 1,109.90 | | | $ | 13.29 | |
| Class C | | Hypothetical | | | | 2.54 | % | | $ | 1,000.00 | | | $ | 1,012.20 | | | $ | 12.67 | |
| | | | | | | | | | | | | | | | | | | | |
| Class Y | | Actual | | | | 0.99 | % | | $ | 1,000.00 | | | $ | 1,118.80 | | | $ | 5.20 | |
| Class Y | | Hypothetical | | | | 0.99 | % | | $ | 1,000.00 | | | $ | 1,019.89 | | | $ | 4.96 | |
| | | | | | | | | | | | | | | | | | | | |
| Institutional Class | | Actual | | | | 0.89 | % | | $ | 1,000.00 | | | $ | 1,119.00 | | | $ | 4.68 | |
| Institutional Class | | Hypothetical | | | | 0.89 | % | | $ | 1,000.00 | | | $ | 1,020.38 | | | $ | 4.46 | |
| | | | | | | | | | | | | | | | | | | | |
| Touchstone International Growth Opportunities Fund | | | | | | | | | | | | | | | |
| Class A | | Actual | | | | 1.24 | % | | $ | 1,000.00 | | | $ | 1,236.40 | | | $ | 6.88 | |
| Class A | | Hypothetical | | | | 1.24 | % | | $ | 1,000.00 | | | $ | 1,018.65 | | | $ | 6.21 | |
| | | | | | | | | | | | | | | | | | | | |
| Class C | | Actual | | | | 1.99 | % | | $ | 1,000.00 | | | $ | 1,231.90 | | | $ | 11.01 | |
| Class C | | Hypothetical | | | | 1.99 | % | | $ | 1,000.00 | | | $ | 1,014.93 | | | $ | 9.94 | |
| | | | | | | | | | | | | | | | | | | | |
| Class Y | | Actual | | | | 0.99 | % | | $ | 1,000.00 | | | $ | 1,238.60 | | | $ | 5.49 | |
| Class Y | | Hypothetical | | | | 0.99 | % | | $ | 1,000.00 | | | $ | 1,019.89 | | | $ | 4.96 | |
| | | | | | | | | | | | | | | | | | | | |
| Institutional Class | | Actual | | | | 0.89 | % | | $ | 1,000.00 | | | $ | 1,238.30 | | | $ | 4.94 | |
| Institutional Class | | Hypothetical | | | | 0.89 | % | | $ | 1,000.00 | | | $ | 1,020.38 | | | $ | 4.46 | |
| | | | | | | | | | | | | | | | | | | | |
| Touchstone International Small Cap Fund | | | | | | | | | | | | | | | | | |
| Class A | | Actual | | | | 1.55 | % | | $ | 1,000.00 | | | $ | 1,165.00 | | | $ | 8.32 | |
| Class A | | Hypothetical | | | | 1.55 | % | | $ | 1,000.00 | | | $ | 1,017.11 | | | $ | 7.75 | |
Other Items(Unaudited) (Continued)
| | | | | | | | | | | | | | | Expenses | |
| | | | | | Net Expense | | | Beginning | | | Ending | | | Paid During | |
| | | | | | Ratio | | | Account | | | Account | | | the Six Months | |
| | | | | | Annualized | | | Value | | | Value | | | Ended | |
| | | | | | June 30, | | | January 1, | | | June 30, | | | June 30, | |
| | | | | | 2019 | | | 2019 | | | 2019 | | | 2019* | |
| Class C | | Actual | | | | 2.30 | % | | $ | 1,000.00 | | | $ | 1,160.60 | | | $ | 12.32 | |
| Class C | | Hypothetical | | | | 2.30 | % | | $ | 1,000.00 | | | $ | 1,013.39 | | | $ | 11.48 | |
| | | | | | | | | | | | | | | | | | | | |
| Class Y | | Actual | | | | 1.30 | % | | $ | 1,000.00 | | | $ | 1,166.00 | | | $ | 6.98 | |
| Class Y | | Hypothetical | | | | 1.30 | % | | $ | 1,000.00 | | | $ | 1,018.35 | | | $ | 6.51 | |
| | | | | | | | | | | | | | | | | | | | |
| Institutional Class | | Actual | | | | 1.18 | % | | $ | 1,000.00 | | | $ | 1,166.70 | | | $ | 6.34 | |
| Institutional Class | | Hypothetical | | | | 1.18 | % | | $ | 1,000.00 | | | $ | 1,018.94 | | | $ | 5.91 | |
| | | | | | | | | | | | | | | | | | | | |
| Touchstone Large Cap Focused Fund | | | | | | | | | | | | | | | | | |
| Class A | | Actual | | | | 0.98 | % | | $ | 1,000.00 | | | $ | 1,175.30 | | | $ | 5.29 | *** |
| Class A | | Hypothetical | | | | 0.98 | % | | $ | 1,000.00 | | | $ | 1,019.93 | | | $ | 4.91 | *** |
| | | | | | | | | | | | | | | | | | | | |
| Class C | | Actual | | | | 1.80 | % | | $ | 1,000.00 | | | $ | 1,170.60 | | | $ | 9.69 | *** |
| Class C | | Hypothetical | | | | 1.80 | % | | $ | 1,000.00 | | | $ | 1,015.87 | | | $ | 9.00 | *** |
| | | | | | | | | | | | | | | | | | | | |
| Class Y | | Actual | | | | 0.73 | % | | $ | 1,000.00 | | | $ | 1,176.90 | | | $ | 3.94 | *** |
| Class Y | | Hypothetical | | | | 0.73 | % | | $ | 1,000.00 | | | $ | 1,021.17 | | | $ | 3.66 | *** |
| | | | | | | | | | | | | | | | | | | | |
| Institutional Class | | Actual | | | | 0.66 | % | | $ | 1,000.00 | | | $ | 1,177.20 | | | $ | 3.56 | *** |
| Institutional Class | | Hypothetical | | | | 0.66 | % | | $ | 1,000.00 | | | $ | 1,021.52 | | | $ | 3.31 | *** |
| | | | | | | | | | | | | | | | | | | | |
| Touchstone Large Cap Fund | | | | | | | | | | | | | | | | | | | |
| Class A | | Actual | | | | 1.10 | % | | $ | 1,000.00 | | | $ | 1,134.30 | | | $ | 5.82 | |
| Class A | | Hypothetical | | | | 1.10 | % | | $ | 1,000.00 | | | $ | 1,019.34 | | | $ | 5.51 | |
| | | | | | | | | | | | | | | | | | | | |
| Class C | | Actual | | | | 1.86 | % | | $ | 1,000.00 | | | $ | 1,129.70 | | | $ | 9.82 | |
| Class C | | Hypothetical | | | | 1.86 | % | | $ | 1,000.00 | | | $ | 1,015.57 | | | $ | 9.30 | |
| | | | | | | | | | | | | | | | | | | | |
| Class Y | | Actual | | | | 0.86 | % | | $ | 1,000.00 | | | $ | 1,135.70 | | | $ | 4.55 | |
| Class Y | | Hypothetical | | | | 0.86 | % | | $ | 1,000.00 | | | $ | 1,020.53 | | | $ | 4.31 | |
| | | | | | | | | | | | | | | | | | | | |
| Institutional Class | | Actual | | | | 0.76 | % | | $ | 1,000.00 | | | $ | 1,136.40 | | | $ | 4.03 | |
| Institutional Class | | Hypothetical | | | | 0.76 | % | | $ | 1,000.00 | | | $ | 1,021.03 | | | $ | 3.81 | |
| | | | | | | | | | | | | | | | | | | | |
| Touchstone Large Company Growth Fund | | | | | | | | | | | | | | | | | |
| Class A | | Actual | | | | 1.23 | % | | $ | 1,000.00 | | | $ | 1,234.80 | | | $ | 6.82 | |
| Class A | | Hypothetical | | | | 1.23 | % | | $ | 1,000.00 | | | $ | 1,018.70 | | | $ | 6.16 | |
| | | | | | | | | | | | | | | | | | | | |
| Class C | | Actual | | | | 1.98 | % | | $ | 1,000.00 | | | $ | 1,230.20 | | | $ | 10.95 | |
| Class C | | Hypothetical | | | | 1.98 | % | | $ | 1,000.00 | | | $ | 1,014.98 | | | $ | 9.89 | |
| | | | | | | | | | | | | | | | | | | | |
| Class Y | | Actual | | | | 0.98 | % | | $ | 1,000.00 | | | $ | 1,236.10 | | | $ | 5.43 | |
| Class Y | | Hypothetical | | | | 0.98 | % | | $ | 1,000.00 | | | $ | 1,019.93 | | | $ | 4.91 | |
| | | | | | | | | | | | | | | | | | | | |
| Institutional Class | | Actual | | | | 0.88 | % | | $ | 1,000.00 | | | $ | 1,236.70 | | | $ | 4.88 | |
| Institutional Class | | Hypothetical | | | | 0.88 | % | | $ | 1,000.00 | | | $ | 1,020.43 | | | $ | 4.41 | |
| | | | | | | | | | | | | | | | | | | | |
| Touchstone Ohio Tax-Free Bond Fund | | | | | | | | | | | | | | | | | |
| Class A | | Actual | | | | 0.85 | % | | $ | 1,000.00 | | | $ | 1,043.30 | | | $ | 4.31 | |
| Class A | | Hypothetical | | | | 0.85 | % | | $ | 1,000.00 | | | $ | 1,020.58 | | | $ | 4.26 | |
| | | | | | | | | | | | | | | | | | | | |
| Class C | | Actual | | | | 1.60 | % | | $ | 1,000.00 | | | $ | 1,039.40 | | | $ | 8.09 | |
| Class C | | Hypothetical | | | | 1.60 | % | | $ | 1,000.00 | | | $ | 1,016.86 | | | $ | 8.00 | |
Other Items(Unaudited) (Continued)
| | | | | | | | | | | | | | | Expenses | |
| | | | | | Net Expense | | | Beginning | | | Ending | | | Paid During | |
| | | | | | Ratio | | | Account | | | Account | | | the Six Months | |
| | | | | | Annualized | | | Value | | | Value | | | Ended | |
| | | | | | June 30, | | | January 1, | | | June 30, | | | June 30, | |
| | | | | | 2019 | | | 2019 | | | 2019 | | | 2019* | |
| Class Y | | Actual | | | | 0.60 | % | | $ | 1,000.00 | | | $ | 1,044.60 | | | $ | 3.04 | |
| Class Y | | Hypothetical | | | | 0.60 | % | | $ | 1,000.00 | | | $ | 1,021.82 | | | $ | 3.01 | |
| | | | | | | | | | | | | | | | | | | | |
| Institutional Class | | Actual | | | | 0.55 | % | | $ | 1,000.00 | | | $ | 1,043.90 | | | $ | 2.79 | |
| Institutional Class | | Hypothetical | | | | 0.55 | % | | $ | 1,000.00 | | | $ | 1,022.07 | | | $ | 2.76 | |
| | | | | | | | | | | | | | | | | | | | |
| Touchstone Small Company Fund | | | | | | | | | | | | | | | | | |
| Class A | | Actual | | | | 1.14 | % | | $ | 1,000.00 | | | $ | 1,150.00 | | | $ | 6.08 | |
| Class A | | Hypothetical | | | | 1.14 | % | | $ | 1,000.00 | | | $ | 1,019.14 | | | $ | 5.71 | |
| | | | | | | | | | | | | | | | | | | | |
| Class C | | Actual | | | | 1.93 | % | | $ | 1,000.00 | | | $ | 1,145.50 | | | $ | 10.27 | |
| Class C | | Hypothetical | | | | 1.93 | % | | $ | 1,000.00 | | | $ | 1,015.22 | | | $ | 9.64 | |
| | | | | | | | | | | | | | | | | | | | |
| Class Y | | Actual | | | | 0.91 | % | | $ | 1,000.00 | | | $ | 1,148.70 | | | $ | 4.85 | |
| Class Y | | Hypothetical | | | | 0.91 | % | | $ | 1,000.00 | | | $ | 1,020.28 | | | $ | 4.56 | |
| | | | | | | | | | | | | | | | | | | | |
| Institutional Class | | Actual | | | | 0.79 | % | | $ | 1,000.00 | | | $ | 1,149.00 | | | $ | 4.21 | |
| Institutional Class | | Hypothetical | | | | 0.79 | % | | $ | 1,000.00 | | | $ | 1,020.88 | | | $ | 3.96 | |
| | | | | | | | | | | | | | | | | | | | |
| Class R6 | | Actual | | | | 0.73 | % | | $ | 1,000.00 | | | $ | 1,148.50 | | | $ | 3.89 | |
| Class R6 | | Hypothetical | | | | 0.73 | % | | $ | 1,000.00 | | | $ | 1,021.17 | | | $ | 3.66 | |
| | | | | | | | | | | | | | | | | | | | |
| Touchstone Value Fund | | | | | | | | | | | | | | | | | | | |
| Class A | | Actual | | | | 1.08 | % | | $ | 1,000.00 | | | $ | 1,148.90 | | | $ | 5.75 | |
| Class A | | Hypothetical | | | | 1.08 | % | | $ | 1,000.00 | | | $ | 1,019.44 | | | $ | 5.41 | |
| | | | | | | | | | | | | | | | | | | | |
| Class C | | Actual | | | | 1.83 | % | | $ | 1,000.00 | | | $ | 1,145.10 | | | $ | 9.73 | |
| Class C | | Hypothetical | | | | 1.83 | % | | $ | 1,000.00 | | | $ | 1,015.72 | | | $ | 9.15 | |
| | | | | | | | | | | | | | | | | | | | |
| Class Y | | Actual | | | | 0.79 | % | | $ | 1,000.00 | | | $ | 1,151.20 | | | $ | 4.21 | |
| Class Y | | Hypothetical | | | | 0.79 | % | | $ | 1,000.00 | | | $ | 1,020.88 | | | $ | 3.96 | |
| | | | | | | | | | | | | | | | | | | | |
| Institutional Class | | Actual | | | | 0.68 | % | | $ | 1,000.00 | | | $ | 1,151.00 | | | $ | 3.63 | |
| Institutional Class | | Hypothetical | | | | 0.68 | % | | $ | 1,000.00 | | | $ | 1,021.42 | | | $ | 3.41 | |
*Expenses are equal to the Fund’s annualized expense ratio, multiplied by the average account value over the period, multiplied by 181/ 365 (to reflect the one-half period).
**Excluding dividend and interest expenses on securities sold short, your actual cost of investment in Class A, Class C, Class Y and Institutional Class would be $6.46, $10.44, $5.00 and $4.85, respectively, and your hypothetical cost of investment in Class A, Class C, Class Y and Institutional Class would be $6.21, $10.04, $4.81, and $4.66, respectively.
***Excluding liquidity provider expenses, your actual cost of investment in Class A, Class C, Class Y and Institutional Class would be $5.23, $9.63, $3.89 and $3.51, respectively, and your hypothetical cost of investment in Class A, Class C, Class Y and Institutional Class would be $4.86, $8.95, $3.61, and $3.26, respectively.
Management of the trust(Unaudited)
Listed below is required information regarding the Trustees and Principal Officers of the Trust. The Trust’s Statement of Additional Information includes additional information about the Trustees and is available, without charge, upon request by calling 1.800.543.0407 or by visiting the Touchstone website at TouchstoneInvestments.com.
| Interested Trustee1: |
| |
| | | | | Number | |
| | | | | of Funds | |
| | | | | Overseen | |
| | | Term of | | in the | |
| Name | Position(s) | Office And | | Touchstone | Other |
| Address | Held with | Length of | Principal Occupation(s) | Fund | Directorships |
| Year of Birth | Trust | Time Served | During Past 5 Years | Complex2 | Held During the Past 5 Years3 |
Jill T. McGruder
Touchstone Advisors, Inc.
303 Broadway
Suite 1100
Cincinnati, Ohio 45202
Year of Birth: 1955 | Trustee and President | Until retirement at age 75 or until she resigns or is removed Trustee since 1999 | President and CEO of IFS Financial Services, Inc. (a holding company). | 44 | IFS Financial Services, Inc. (a holding company) from 1999 to the present; Integrity and National Integrity Life Insurance Co. from 2005 to the present; Touchstone Securities (the Trust’s distributor) from 1999 to the present; Touchstone Advisors, Inc. (the Trust’s investment advisor and administrator) from 1999 to the present; W&S Brokerage Services (a brokerage company) from 1999 to the present; W&S Financial Group Distributors (a distribution company) from 1999 to the present; Cincinnati Analysts, Inc. from 2012 to the present; Columbus Life Insurance Co. from 2016 to the present; The Lafayette Life Insurance Co. from 2016 to the present; Taft Museum of Art from 2007 to the present; YWCA of Greater Cincinnati from 2012 to the present; and LL Global, Inc. from 2016 to the present. |
| Independent Trustees: | | | | | |
Karen Carnahan c/o Touchstone Advisors, Inc.
303 Broadway
Suite 1100
Cincinnati, Ohio 45202
Year of Birth: 1954 | Trustee | Until retirement at age 75 or until she resigns or is removed Trustee since 2019 | Retired; Chief Operating Officer of Shred-it (a business services company) from 2014 to 2015. | 44 | Director of Boys & Girls Club of West Chester/Liberty from 2016 to the present and Director of Cintas Corporation from 2019 to the present. |
Phillip R. Cox c/o Touchstone Advisors, Inc.
303 Broadway
Suite 1100
Cincinnati, Ohio 45202
Year of Birth: 1947 | Trustee | Until retirement at age 75 or until he resigns or is removed Trustee since 1999 | President and Chief Executive Officer of Cox Financial Corp. (a financial services company) from 1971 to the present. | 44 | Director of Cincinnati Bell (a communications company) from 1994 to 2019; Bethesda Inc. (a hospital) from 2005 to the present; Timken Co. (a manufacturing company) from 2004 to 2014; TimkenSteel from 2014 to 2019; Diebold, Inc. (a technology solutions company) from 2004 to the present; Ohio Business Alliance for Higher Education and the Economy from 2005 to the present; and Chairman of Ohio Business Round Table from 2005 to 2018. |
Management of the Trust(Unaudited) (Continued)
| Independent Trustees (Continued): |
| |
| | | | | Number | |
| | | | | of Funds | |
| | | | | Overseen | |
| | | Term of | | in the | |
| Name | Position(s) | Office And | | Touchstone | Other |
| Address | Held with | Length of | Principal Occupation(s) | Fund | Directorships |
| Year of Birth | Trust | Time Served | During Past 5 Years | Complex2 | Held During the Past 5 Years3 |
William C. Gale c/o Touchstone Advisors, Inc.
303 Broadway
Suite 1100
Cincinnati, Ohio 45202
Year of Birth: 1952 | Trustee | Until retirement at age 75 or until he resigns or is removed Trustee since 2013 | Retired; formerly Senior Vice President and Chief Financial Officer (from 2003 to January 2015) of Cintas Corporation (a business services company). | 44 | None. |
Susan J. Hickenlooper c/o Touchstone Advisors, Inc.
303 Broadway
Suite 1100
Cincinnati, Ohio 45202
Year of Birth: 1946 | Trustee | Until retirement at age 75 or until she resigns or is removed Trustee since 2009 | Retired; formerly Financial Analyst for Impact 100 (charitable organization) from November 2012 to 2013. | 44 | Trustee of Diocese of Southern Ohio from 2014 to the present; and Trustee of Cincinnati Parks Foundation from 2000 to 2016. |
Kevin A. Robie c/o Touchstone Advisors, Inc.
303 Broadway
Suite 1100
Cincinnati, Ohio 45202
Year of Birth: 1956 | Trustee | Until retirement at age 75 or until he resigns or is removed Trustee since 2013 | Vice President of Portfolio Management at Soin International LLC (a private multinational holding company) from 2004 to the present. | 44 | Director of SaverSystems, Inc. from 2015 to the present; Director of Buckeye EcoCare, Inc. (a lawn care company) from 2013 to the present; Trustee of Dayton Region New Market Fund, LLC (a private fund) from 2010 to the present; and Trustee of the Entrepreneurs Center, Inc. (a small business incubator) from 2006 to the present. |
Edward J. VonderBrink c/o Touchstone Advisors, Inc.
303 Broadway
Suite 1100
Cincinnati, Ohio 45202
Year of Birth: 1944 | Trustee | Until retirement at age 75 or until he resigns or is removed Trustee since 2013 | Consultant, VonderBrink Consulting LLC from 2000 to the present. | 44 | Director of Streamline Health Solutions, Inc. (healthcare IT) from 2006 to 2015; Mercy Health from 2013 to the present; Mercy Health Foundation (healthcare nonprofit) from 2008 to the present; Al Neyer Inc. (a construction company) from 2013 to the present; and BASCO Shower Door from 2010 to the present. |
| 1 | Ms. McGruder, as a director of the Advisor and the Distributor, and an officer of affiliates of the Advisor and the Distributor, is an “interested person” of the Trust within the meaning of Section 2(a) (19) of the 1940 Act. |
| 2 | As of June 30, 2019, the Touchstone Fund Complex consists of 20 series of the Trust, 13 series of Touchstone Funds Group Trust, 1 series of Touchstone Institutional Funds Trust, and 10 variable annuity series of Touchstone Variable Series Trust. |
| 3 | Each Trustee is also a Trustee of Touchstone Funds Group Trust, Touchstone Institutional Funds Trust, and Touchstone Variable Series Trust. |
Management of the Trust(Unaudited) (Continued)
| Principal Officers: | | | |
| | | Term of | |
| Name | Position(s) | Office and | |
| Address | Held with | Length of | Principal Occupation(s) |
| Year of Birth | Trust1 | Time Served | During Past 5 Years |
Jill T. McGruder
Touchstone Advisors, Inc.
303 Broadway
Suite 1100
Cincinnati, Ohio 45202
Year of Birth: 1955 | President and Trustee | Until resignation, removal or disqualification President since 2006 | See biography above. |
Steven M. Graziano
Touchstone Advisors, Inc.
303 Broadway
Suite 1100
Cincinnati, Ohio 45202
Year of Birth: 1954 | Vice President | Until resignation, removal or disqualification Vice President since 2009 | President of Touchstone Advisors, Inc. |
Timothy D. Paulin
Touchstone Advisors, Inc.
303 Broadway
Suite 1100
Cincinnati, Ohio 45202
Year of Birth: 1963 | Vice President | Until resignation, removal or disqualification Vice President since 2010 | Senior Vice President of Investment Research and Product Management of Touchstone Advisors, Inc. |
Timothy S. Stearns
Touchstone Advisors, Inc.
303 Broadway
Suite 1100
Cincinnati, Ohio 45202
Year of Birth: 1963 | Chief Compliance Officer | Until resignation, removal or disqualification Chief Compliance Officer since 2013 | Chief Compliance Officer of Touchstone Advisors, Inc. |
Terrie A. Wiedenheft
Touchstone Advisors, Inc.
303 Broadway
Suite 1100
Cincinnati, Ohio 45202
Year of Birth: 1962 | Controller and Treasurer | Until resignation, removal or disqualification Controller and Treasurer since 2006 | Senior Vice President, Chief Financial Officer and Chief Operations Officer, of IFS Financial Services, Inc. (a holding company). |
Meredyth A. Whitford
Western & Southern Financial Group
400 Broadway Cincinnati,
Ohio 45202
Year of Birth: 1981 | Secretary | Until resignation, removal or disqualification Secretary since 2018 | Counsel - Securities/Mutual Funds of Western & Southern Financial Group (2015 to present); Associate at Morgan Lewis & Bockius LLP (law firm) (2014 to 2015); Associate at Bingham McCutchen LLP (law firm) (2008 to 2014) |
| 1 | Each officer also holds the same office with Touchstone Funds Group Trust, Touchstone Institutional Funds Trust, and Touchstone Variable Series Trust. |
This page intentionally left blank.
This page intentionally left blank.
This page intentionally left blank.
PRIVACY PROTECTION POLICY
We Respect Your Privacy
Thank you for your decision to invest with us. Touchstone and its affiliates have always placed a high value on the trust and confidence our clients place in us. We believe that confidence must be earned and validated through time. In today’s world, when technology allows the sharing of information at light speeds, trust must be reinforced by our sincere pledge to take the steps necessary to ensure that the information you share with us is treated with respect and confidentiality.
Our Pledge to Our Clients
| · | We collect only the information we need to service your account and administer our business. |
| · | We are committed to keeping your information confidential and we place strict limits and controls on the use and sharing of your information. |
| · | We make every effort to ensure the accuracy of your information. |
We Collect the Following Nonpublic Personal Information About You:
| · | Information we receive from you on or in applications or other forms, correspondence, or conversations, including, but not limited to, your name, address, phone number, social security number, assets, income and date of birth; and |
| · | Information about your transactions with us, our affiliates, or others, including, but not limited to, your account number and balance, payment history, parties to transactions, cost basis information, and other financial information. |
Categories of Information We Disclose and Parties to Whom We Disclose
We do not disclose any nonpublic personal information about our current or former clients to nonaffiliated third parties, except as required or permitted by law.
We Place Strict Limits and Controls on the Use and Sharing of Your Information
| · | We restrict access to nonpublic personal information about you to authorized employees who need the information to administer your business. |
| · | We maintain physical, electronic and procedural safeguards that comply with federal standards to protect this information. |
| · | We do not disclose any nonpublic personal information about our current or former clients to anyone, except as required or permitted by law or as described in this document. |
| · | We will not sell your personal information to anyone. |
We May Provide Information to Service Your Account
Sometimes it is necessary to provide information about you to various companies such as transfer agents, custodians, broker-dealers and marketing service firms to facilitate the servicing of your account. These organizations have a legitimate business need to see some of your personal information in order for us to provide service to you. We may disclose to these various companies the information that we collect as described above. We require that these companies, including our own subsidiaries and affiliates, strictly maintain the confidentiality of this information and abide by all applicable laws. Companies within our corporate family that may receive this information are financial service providers and insurance companies. We do not permit these associated companies to sell the information for their own purposes, and we never sell our customer information.
This policy is applicable to the following affiliated companies: Touchstone Funds Group Trust, Touchstone Strategic Trust, Touchstone Variable Series Trust, Touchstone Institutional Funds Trust, Touchstone Securities, Inc.,* and W&S Brokerage Services, Inc.
* Touchstone Securities, Inc. serves as the underwriter to the Touchstone Funds.
A Member of Western & Southern Financial Group®
The Privacy Protection Policy is not part of the Annual Report.


Touchstone Investments
Distributor
Touchstone Securities, Inc.*
303 Broadway
Cincinnati, Ohio 45202-4203
800.638.8194
www.touchstoneinvestments.com
Investment Advisor
Touchstone Advisors, Inc.*
303 Broadway
Cincinnati, Ohio 45202-4203
Transfer Agent
BNY Mellon Investment Servicing (US) Inc.
4400 Computer Drive
Westborough, Massachusetts 01581
Shareholder Service
800.543.0407
* A Member of Western & Southern Financial Group
TSF-54BB-TST-AR-1906
Item 2. Code of Ethics.
| (a) | The registrant, as of the end of the period covered by this report, has adopted a code of ethics that applies to the registrant’s principal executive officer, principal financial officer, principal accounting officer or controller, or persons performing similar functions, regardless of whether these individuals are employed by the registrant or a third party. |
| (c) | There have been no amendments, during the period covered by this report, to a provision of the code of ethics that applies to the registrant’s principal executive officer, principal financial officer, principal accounting officer or controller, or persons performing similar functions, regardless of whether these individuals are employed by the registrant or a third party, and that relates to any element of the code of ethics description. |
| (d) | The registrant has not granted any waivers, including an implicit waiver, from a provision of the code of ethics that applies to the registrant’s principal executive officer, principal financial officer, principal accounting officer or controller, or persons performing similar functions, regardless of whether these individuals are employed by the registrant or a third party, that relates to one or more of the items set forth in paragraph (b) of this item’s instructions. |
| (f) | A copy of the code of ethics is attached hereto as Exhibit 13(a)(1). |
Item 3. Audit Committee Financial Expert.
The registrant’s Board of Trustees has determined that the registrant has at least one audit committee financial expert serving on its audit committee. Mr. William Gale is the registrant’s audit committee financial expert and is an independent trustee within the meaning of the Investment Company Act of 1940, as amended (the “1940 Act”).
Item 4. Principal Accountant Fees and Services.
Audit Fees
| (a) | Audit fees for Touchstone Strategic Trust (June Funds) totaled $217,100 and $227,700 for the fiscal years ended June 30, 2019 and June 30, 2018, respectively. The fees relate to the annual audit or for services normally provided by Ernst & Young LLP in connection with statutory and regulatory filings or engagements. |
Audit-Related Fees
| (b) | The aggregate fees billed in each of the last two fiscal years for assurance and related services by the principal accountant that are reasonably related to the performance of the audit of the registrant's financial statements and are not reported under paragraph (a) of this Item are $0 and $10,500 for the fiscal years ended June 30, 2019 and June 30, 2018, respectively. The fees for 2018 relate to additional audit procedures and review of predecessor auditor work papers. |
Tax Fees
| (c) | The aggregate fees billed in each of the last two fiscal years for professional services rendered by the principal accountant for tax compliance, tax advice, and tax planning were $88,085 and $74,811 for the fiscal years ended June 30, 2019 and June 30, 2018, respectively. The fees relate to the preparation of federal income and excise tax returns, review of capital gains distribution calculations and tax agent services. |
All Other Fees
| (d) | The aggregate fees billed in each of the last two fiscal years for products and services provided by the principal accountant, other than the services reported in paragraphs (a) through (c) of this Item are $28,089 and $21,719 for the fiscal years ended June 30, 2019 and June 30, 2018, respectively. The fees relate to the PFIC Analyzer and Global Withholding Tax Reporter subscriptions. |
| (e)(1) | Disclose the audit committee's pre-approval policies and procedures described in paragraph (c)(7) of Rule 2-01 of Regulation S-X. |
The Audit Committee’s pre-approval policies describe the types of audit, audit-related, tax and other services that have the general pre-approval of the Audit Committee. The pre-approval policies provide that annual audit service fees, tax services not specifically granted pre-approval, services exceeding pre-approved cost levels and other services that have not received general pre-approval will be subject to specific pre-approval by the Audit Committee. The pre-approval policies further provide that the Committee may grant general pre-approval to other audit services (statutory audits and services associated with SEC registration statements, periodic reports and other documents filed with the SEC or other documents issued in connection with securities offerings), audit-related services (accounting consultations related to accounting, financial reporting or disclosure matters not classified as “audit services,” assistance with understanding and implementing new accounting and financial reporting guidance from rulemaking authorities, agreed-upon or expanded audit procedures related to accounting and/or billing records required to respond to or comply with financial, accounting or regulatory reporting matters and assistance with internal control reporting requirements under Form N-CSR), tax services that have historically been provided by the auditor that the Committee believes would not impair the independence of the auditor and are consistent with the SEC’s rules on auditor independence and permissible non-audit services classified as “all other services” that are routine and recurring services.
| (e)(2) | All services described in paragraphs (b) through (d) of Item 4 were approved by the Audit Committee. |
| (f) | The percentage of hours expended on the principal accountant's engagement to audit the registrant's financial statements for the most recent fiscal year that were attributed to work performed by persons other than the principal accountant's full-time, permanent employees was less than fifty percent. |
| (g) | The aggregate non-audit fees for Touchstone Strategic Trust (June Funds) and certain entities*, totaled approximately $680,755 and $112,030 for the fiscal years ended June 30, 2019 and June 30, 2018, respectively. |
* These include the advisors (excluding sub-advisors) and any entity controlling, controlled by or under common control with the advisors that provides ongoing services to the registrant (Funds).
| (h) | The registrant's audit committee of the board of trustees has considered whether the provision of non-audit services that were rendered to the registrant's investment adviser (not including any sub-adviser whose role is primarily portfolio management and is subcontracted with or overseen by another investment adviser), and any entity controlling, controlled by, or under common control with the investment adviser that provides ongoing services to the registrant that were not pre-approved pursuant to paragraph (c)(7)(ii) of Rule 2-01 of Regulation S-X is compatible with maintaining the principal accountant's independence. |
Item 5. Audit Committee of Listed Registrants.
Not applicable.
Item 6. Investments.
| (a) | Schedule of Investments in securities of unaffiliated issuers as of the close of the reporting period is included as part of the report to shareholders filed under Item 1 of this form. |
Item 7. Disclosure of Proxy Voting Policies and Procedures for Closed-End Management Investment Companies.
Not applicable.
Item 8. Portfolio Managers of Closed-End Management Investment Companies.
Not applicable.
Item 9. Purchases of Equity Securities by Closed-End Management Investment Company and Affiliated Purchasers.
Not applicable.
Item 10. Submission of Matters to a Vote of Security Holders.
There have been no material changes to the procedures by which the shareholders may recommend nominees to the registrant’s board of trustees, where those changes were implemented after the registrant last provided disclosure in response to the requirements of Item 407(c)(2)(iv) of Regulation S-K (17 CFR 229.407) (as required by Item 22(b)(15) of Schedule 14A (17 CFR 240.14a-101)), or this Item.
Item 11. Controls and Procedures.
| (a) | The registrant’s principal executive and principal financial officers, or persons performing similar functions, have concluded that the registrant’s disclosure controls and procedures (as defined in Rule 30a-3(c) under the Investment Company Act of 1940, as amended (the “1940 Act”) (17 CFR 270.30a-3(c))) are effective, as of a date within 90 days of the filing date of the report that includes the disclosure required by this paragraph, based on their evaluation of these controls and procedures required by Rule 30a-3(b) under the 1940 Act (17 CFR 270.30a-3(b)) and Rules 13a-15(b) or 15d-15(b) under the Securities Exchange Act of 1934, as amended (17 CFR 240.13a-15(b) or 240.15d-15(b)). |
| (b) | There were no changes in the registrant’s internal control over financial reporting (as defined in Rule 30a-3(d) under the 1940 Act (17 CFR 270.30a-3(d))) that occurred during the period covered by this report that has materially affected, or is reasonably likely to materially affect, the registrant’s internal control over financial reporting. |
Item 12. Disclosure of Securities Lending Activities for Closed-End Management Investment Companies.
Not applicable.
Item 13. Exhibits.
| (a)(1) | Code of ethics, and any amendment thereto, that is the subject of disclosure required by Item 2 is attached hereto. |
| (a)(2) | Certifications pursuant to Rule 30a-2(a) under the 1940 Act and Section 302 of the Sarbanes-Oxley Act of 2002 are attached hereto. |
| (b) | Certifications pursuant to Rule 30a-2(b) under the 1940 Act and Section 906 of the Sarbanes- Oxley Act of 2002 are attached hereto. |
| | | |
SIGNATURES
Pursuant to the requirements of the Securities Exchange Act of 1934 and the Investment Company Act of 1940, the registrant has duly caused this report to be signed on its behalf by the undersigned, thereunto duly authorized.
(Registrant) Touchstone Strategic Trust
By (Signature and Title)* /s/ Jill T. McGruder
Jill T. McGruder, President
(principal executive officer)
Date August 29, 2019
Pursuant to the requirements of the Securities Exchange Act of 1934 and the Investment Company Act of 1940, this report has been signed below by the following persons on behalf of the registrant and in the capacities and on the dates indicated.
By (Signature and Title)* /s/ Jill T. McGruder
Jill T. McGruder, President
(principal executive officer)
Date August 29, 2019
By (Signature and Title)* /s/ Terrie A. Wiedenheft
Terrie A. Wiedenheft, Controller and Treasurer
(principal financial officer)
Date August 29, 2019
* Print the name and title of each signing officer under his or her signature.