UNITED STATES
SECURITIES AND EXCHANGE COMMISSION
Washington, D.C. 20549
FORM N-CSR
CERTIFIED SHAREHOLDER REPORT OF REGISTERED MANAGEMENT
INVESTMENT COMPANIES
Investment Company Act file number 811-03651
Touchstone Strategic Trust – June Funds
(Exact name of registrant as specified in charter)
303 Broadway, Suite 1100
Cincinnati, Ohio 45202-4203
(Address of principal executive offices) (Zip code)
Jill T. McGruder
303 Broadway, Suite 1100
Cincinnati, Ohio 45202-4203
(Name and address of agent for service)
Registrant's telephone number, including area code: 800-638-8194
Date of fiscal year end: June 30
Date of reporting period: June 30, 2018
Form N-CSR is to be used by management investment companies to file reports with the Commission not later than 10 days after the transmission to stockholders of any report that is required to be transmitted to stockholders under Rule 30e-1 under the Investment Company Act of 1940 (17 CFR 270.30e-1). The Commission may use the information provided on Form N-CSR in its regulatory, disclosure review, inspection, and policymaking roles.
A registrant is required to disclose the information specified by Form N-CSR, and the Commission will make this information public. A registrant is not required to respond to the collection of information contained in Form N-CSR unless the Form displays a currently valid Office of Management and Budget ("OMB") control number. Please direct comments concerning the accuracy of the information collection burden estimate and any suggestions for reducing the burden to Secretary, Securities and Exchange Commission, 450 Fifth Street, NW, Washington, DC 20549-0609. The OMB has reviewed this collection of information under the clearance requirements of 44 U.S.C. § 3507.
| Item 1. | Reports to Stockholders. |
The Report to Shareholders is attached herewith.
June 30, 2018
Annual Report
| Touchstone Strategic Trust |
| Touchstone Credit Opportunities Fund |
| Touchstone International Growth Opportunities Fund (formerly known as Touchstone Global Growth Fund) |
| Touchstone International Small Cap Fund |
| Touchstone Large Cap Fund |
| Touchstone Large Company Growth Fund |
| Touchstone Ohio Tax-Free Bond Fund |
| Touchstone Small Cap Value Opportunities Fund |
| Touchstone Value Fund |

Table of Contents
This report identifies the Funds' investments on June 30, 2018. These holdings are subject to change. Not all investments in each Fund performed the same, nor is there any guarantee that these investments will perform as well in the future. Market forecasts provided in this report may not occur.
Letter from the President
Dear Shareholder:
We are pleased to provide you with the Touchstone Strategic Trust Annual Report. Inside you will find key financial information, as well as manager commentaries for the Funds, for the 12 months ended June 30, 2018.
The global economic recovery, now in its 10th year following the 2008 financial crisis, gained momentum in 2017 as the U.S., Japan, the European Union and China all reported solid economic growth through much of the last 12 months. Despite the overall solid economic fundamentals, the latter half of the period saw an increase in market volatility as tariffs and trade tensions raised the specter of an escalating global trade war. The “synchronized global expansion” showed signs of unraveling because of these growing trade tensions. Monetary policies across the major central banks remained divergent throughout the period as the Bank of Japan and the European Central Bank maintained accommodative stances, while the U.S. Federal Reserve Board (Fed) continued moving toward its goal of monetary policy normalization by raising rates three times in the fiscal year. Additionally, the Fed announced and began executing on plans to reduce the size of its balance sheet by selling securities it had acquired during its quantitative easing programs.
Global equities posted positive returns led by double-digit gains in U.S. equities. U.S. dollar strengthening, diverging economic data and widening trade disputes in the fiscal year’s final quarter affected results overseas. However, broad measures of non-U.S. markets still ended higher, with emerging market equities slightly outperforming developed market equities. Within the U.S. equity markets, growth-oriented stocks far outpaced their value-oriented counterparts, while small-capitalization stocks outperformed mid- and large-capitalization stocks.
The Fed’s three rate hikes during the year pushed short-term rates higher. After spending the first half of the year range-bound, longer-term rates shifted to modestly higher range-bound levels during the latter half. This rise in rates drove negative returns for investment grade bonds. Less sensitive to interest rate changes and more correlated to economic activity than their investment grade counterparts, non-investment grade bonds generated positive returns.
With 2019 now on the horizon, the post-crisis bull market is approaching its 10 year anniversary. While it has certainly experienced periods of volatility, the length and strength of this market environment only reinforces our view that investing is a long-term endeavor which requires a multi-year approach. A disciplined approach and appropriate time horizon can deter short-termism and reactive decision-making. Your financial advisor can help you by identifying a risk-return profile and developing an investment plan that will help you address your long-term financial goals.
We greatly appreciate your continued support. Thank you for including Touchstone as part of your investment plan.
Sincerely,

Jill T. McGruder
President
Touchstone Strategic Trust
Management's Discussion of Fund Performance (Unaudited)
Touchstone Credit Opportunities Fund
Sub-Advised by Ares Capital Management II LLC
Investment Philosophy
The Touchstone Credit Opportunities Fund employs a flexible investment approach by allocating assets among core investments and opportunistic investments as credit market conditions change. It invests in several broad investment categories, including high yield bonds, bank loans, special situations, structured credit and hedges.
Fund Performance
The Touchstone Credit Opportunities Fund (Class A Shares) outperformed its benchmark, the ICE BofA Merrill Lynch 3-Month U.S. Treasury Bill Index, for the 12-month period ended June 30, 2018. The Fund’s total return was 3.50 percent (calculated excluding the maximum sales charge) while the total return of the benchmark was 1.36 percent.
Market Environment
Building upon momentum gained at the start of 2017, the twelve month period ended June 30, 2018 was characterized by continued improved fundamentals and favorable technical conditions, which drove investor appetite for risk assets broadly. Credit markets were initially robust in the third quarter of 2017 as a result of improving corporate earnings data and strengthening technical conditions. The Tax Cuts and Jobs Act that was enacted into law by the Trump Administration in the fourth quarter introduced a large fiscal stimulus, resulting in increased earnings reports from U.S. corporations. The U.S. Federal Open Market Committee (FOMC) also hiked rates in December 2017 and followed suit with two additional hikes in March and June of 2018. As a result, the yield curve has continued to flatten as the front-end shifts up alongside increases in the federal funds rate. The first half of 2018 saw rising interest rates, concerns over the U.S. trade policy and geopolitical uncertainty in Italy. Nonetheless, the economy continued to show signs of expansion as the Institute for Supply Management Purchasing Manager’s Index increased from 58.7 to 60.2 in June 2018, the 22nd consecutive month that the index increased at an accelerating rate. Inflation data released by the U.S. Bureau of Economic Analysis indicated a continued increase in core personal consumption expenditures, the U.S. Federal Reserve Board’s (Fed) primary inflation indicator, which reached its 2 percent target for the first time since 2012 in the second quarter of 2018. As a result of these factors over the last 12 months, both non-investment grade credit and bank loan indexes posted low- to mid-single digit returns.
Portfolio Review
Despite increased volatility in 2018 related to swings in equities, U.S. Treasuries, and oil prices as well as ongoing investor concerns about global trade tensions and political turmoil in Italy during May, the Fund ultimately delivered positive returns in all investment categories except Cash, Hedges, and Forwards, which were essentially unchanged for the period. The largest contributor to performance was the High Yield Bond/Unsecured asset category despite the overall increase in interest rates. Bank Loans continued their strong performance due to their low duration and floating rate nature. Buoyed by the rising rate environment and consistent Collateralized Loan Obligation (CLO) demand, the Loan/Senior Secured portion of the Fund was the second largest contributor to performance. Stressed/Distressed investments also positively contributed to the Fund’s performance, which was largely related to positions in post-reorganization equities including MModal, LLC and Dex Media, Inc. as well as event-driven equity investments such as Envision Healthcare Corp. (Health Care sector) and Acadia Healthcare Company, Inc. (Health Care sector). Robust demand for CLO paper persisted, even amid stout supply conditions, particularly in April. As a result, the Structured Credit portion of the Fund posted positive returns over the period as investors sought higher beta assets amid compressing spreads in the loan market.
Management's Discussion of Fund Performance (Unaudited) (Continued)
During the 12 month period, the Fund’s exposure to floating rate bank loans decreased while high yield bond exposure slightly increased largely related to purchases of over-sold longer-duration, higher quality bonds following bouts of rate volatility. The Fund’s exposure to CLO debt declined slightly while the Fund’s exposure to CLO equity increased, as CLOs saw robust investor demand in both the primary and secondary markets. In terms of sector allocation, we lowered the Fund’s exposure to the Energy sector. While we continued to maintain a constructive view on the sector, we had been selectively reducing exposure to names that either increased in value or experienced execution issues. We increased Fund exposure to the Media space, given its consumer orientation, relatively stable cash flows (for some credits driven by highly recurring revenue models), asset support (exclusive media content, vast content libraries, cable infrastructure) and positive mergers and acquisitions (M&A) catalysts. Conversely, we reduced Fund exposure to Technology and Electronics as execution risk in the space appears to be elevating, while equity valuations are starting to compress. Credit risk exposure continued to be overweight as we increased the Fund’s CCC-rated exposure as a result of our view that corporate earnings were accelerating, economic growth was improving, and the Fed was prudent in raising short term interest rates.
Over the period, the yield curve shifted higher and continued to flatten as the Fed tightened policy, as seen by the three rate hikes of 25 basis points each in December 2017, March 2018 and June 2018. The Fund’s overall duration increased slightly. The shorter-duration positioning benefited performance as the 10-year U.S. Treasury yield increased by 56 basis points to 2.86 percent during the 12 month period. Additionally, the Fund’s allocation to floating rate assets also contributed to Fund performance as the 3-Month London Interbank Offered Rate (LIBOR) increased over the last 12 months.
Outlook
While we believe corporate fundamentals are strong from a growth perspective and that the economy should continue to expand, structural headwinds such as demographics and low inflation may limit any dramatic steepening of the yield curve in the near- to medium-term. In fact, the yield curve continues to flatten and many are watching closely for signs of inversion, which is widely believed to be a leading indicator of impending recession, though the data is inconsistent about how long after the yield curve inverts the recession begins. However, an inverted yield curve is somewhat predictive of negative returns and spread widening in the high yield market one year out. Looking ahead into the back half of 2018, we are comfortable with the Fund’s duration positioning, particularly because of its allocation to floating rate bank loans and CLO debt.
We continue to believe the M&A environment will remain robust and provide many opportunities for the Fund going forward. Relatively low interest rates and high equity valuations should encourage consolidation, continuing a favorite theme of ours for credit investing. We think the odds of consolidation increase along with higher valuations, and suspect this will benefit higher quality companies and select troubled or over-levered credits as well. As a result, the Fund is seeking senior secured paper of stressed/distressed companies that may benefit from an acquisition. As discussed earlier, we see a growing opportunity to buy higher quality, longer-dated bonds at discounts. Lastly, we believe the credit markets are continuing on a path of differentiating winners from losers, which should benefit the Fund due to Ares’ deep, fundamental, bottom-up approach and long tenure as credit investors.
Our primary concerns largely remain the same as previous quarters with the exception of a newer concern surrounding the impact of global trade tensions. After months of speculation, the market largely shrugged off the first $35 billion of imposed tariffs; it was unclear if the news was already priced in, the economic reports immediately following the tariffs temporarily steered the focus to the strong economy, or the market believed that the U.S. is simply using the tariffs as a negotiating tactic that will ultimately get resolved. Now the $200 billion of potential additional tariffs announced on July 10th will test this and whether the market will start pricing in a higher probability of a full-blown global trade war. From a fundamental perspective, we believe
Management's Discussion of Fund Performance (Unaudited) (Continued)
the imposed tariffs are likely to only modestly increase inflation and impact gross domestic product at a manageable level, but it is difficult to determine how far the administration intends to take the next $200 billion in assessing global implications. Given this uncertainty around future trade policy, there could be other indirect consequences including tightening credit conditions, weakening business confidence, scaled back capital spending and a slowdown in M&A. While there likely will not be a quick resolution to these tensions and we expect continued rhetoric and volatility, we ultimately believe that there is a probability that this will lead to a negotiated settlement versus an all-out trade war and we would look to any future sell-offs in individual sectors as potential buying opportunities.
Equally concerning are high valuations in both the equity and credit markets. On an absolute basis, current spread levels are in the top quintile of historical valuations. This creates significant downside risks in the case of any exogenous shocks to the market or idiosyncratic events. Rising global sovereign bond yields also remain a key risk factor in 2018. Throughout the last few years, the U.S. high yield and bank loan markets have benefited from an influx of foreign demand, spurred in part by extremely low sovereign interest rates. Quantitative easing (QE) policies in Japan and Europe have created zero to negative absolute interest rates in significant parts of the yield curve. In Europe in particular, with growth and inflation expectations rising, and QE set to taper, we could see volatility from unanticipated capital flows. For example as U.S. corporations have been repatriating cash as a result of tax reform, there have been concerns in short-term dollar funding markets causing LIBOR to rise at a quicker pace than many have anticipated. These unanticipated consequences of regulatory and tax changes cause some concern for us. A European Central Bank policy misstep could have real implications in the U.S. We are also cautious that the Tax Cuts and Jobs Act also poses a potential risk due to any unanticipated repercussions - namely, the reduction in the deductibility of corporate and mortgage interest expense and reduction of state and local income taxes - and how these affect consumer behavior and spending. We remain cognizant of slowing growth in China, as well as further deterioration of their banking system. Lastly, we believe that volatility around a tightening of monetary policy could have negative impacts on capital markets.
Management's Discussion of Fund Performance (Unaudited) (Continued)
Comparison of the Change in Value of a $10,000 Investment in the Touchstone Credit Opportunities Fund - Class A* and the ICE BofA Merrill Lynch 3-Month U.S. Treasury Bill Index
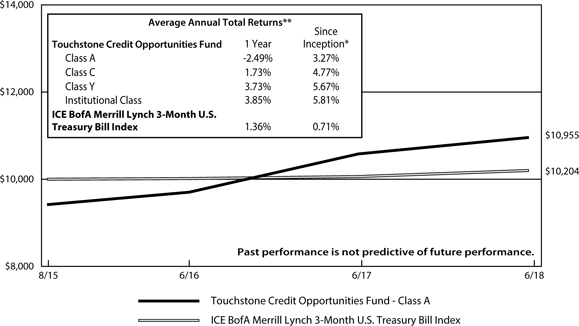
| * | The chart above represents performance of Class A shares only, which will vary from the performance of Class C shares, Class Y shares and Institutional Class shares based on the differences in sales loads and fees paid by shareholders in the different classes. The inception date of the Fund was August 31, 2015. The returns of the index listed above are based on the inception date of the Fund. |
| ** | The average annual total returns shown above are adjusted for maximum sales loads and fees, if applicable. The maximum offering price per share of Class A shares is equal to the net asset value (“NAV”) per share plus a sales load equal to 6.10% of the NAV (or 5.75% of the offering price). Class C shares are subject to a contingent deferred sales charge (“CDSC”) of 1.00%. The CDSC will be assessed on an amount equal to the lesser of (1) the NAV at the time of purchase of the shares being redeemed or (2) the NAV of such shares being redeemed, if redeemed within a one-year period from the date of purchase. Class Y shares and Institutional Class shares are not subject to sales charges. |
The performance of the above Fund does not reflect the deduction of taxes that a shareholder would pay on Fund distributions or the redemption of Fund shares.
Note to Chart
ICE BofA Merrill Lynch 3-Month U.S. Treasury Bill Index is an unmanaged index of Treasury securities maturing in 90 days that assumes reinvestment of all income.
Management's Discussion of Fund Performance (Unaudited)
Touchstone International Growth Opportunities Fund
Effective April 17, 2018, the Fund changed its name from Touchstone Global Growth Fund to Touchstone International Growth Opportunities Fund and its investment strategy changed from a global to international focus.
Sub-Advised by DSM Capital Partners LLC
Investment Philosophy
The Touchstone International Growth Opportunities Fund seeks long-term capital appreciation by primarily investing in equity securities of large capitalization foreign companies believed to offer the best opportunity for reliable growth at attractive stock valuations. The Fund utilizes a bottom-up idea-driven growth style with a distinct valuation discipline. It seeks to identify companies which are believed to exhibit certain quality characteristics, including: predictable growth, solid fundamentals, attractive profitability and successful management.
Fund Performance
The Touchstone International Growth Opportunities Fund (Class A shares) outperformed the MSCI All Country World Ex-USA Index and the MSCI All Country World Index for the 12-month period ended June 30, 2018. The Fund’s total return was 15.00 percent (calculated excluding the maximum sales charge) while the returns of its benchmarks were 7.28 and 10.73 percent, respectively. The Fund’s primary benchmark was changed to reflect its strategy change from global growth to international growth.
Market Environment
The stock market benefited from strong earnings growth during the 12-month period ended June 30, 2018. The synchronization and strength of global growth in 2017 was better than many had anticipated and contributed to higher corporate earnings. This was compounded by tax reform and fiscal stimulus in the U.S. As a result, the equity markets experienced strong gains in 2017 and into early 2018.
However, by February, investors grew concerned that accelerating global growth would become a catalyst for inflation and higher than anticipated interest rates. Market worries were further exacerbated by escalating trade rhetoric and protectionist policies. Though it initially originated in the U.S., American trade partners around the globe responded by imposing retaliatory tariffs and spurring a tit-for-tat trade dispute that increased trade barriers. As a result, markets have traded sideways from February through the end of the fiscal year.
Portfolio Review
During the 12-month period ended June 30, 2018, stock selection and the Fund’s overweight to the Information Technology sector contributed meaningfully to relative performance. Further gains were generated by positive stock selection in the Financials and Consumer Discretionary sectors which also benefited returns. The portfolio faced a modest headwind from its lack of exposure to the market leading Energy sector, which notched gains as crude oil prices moved higher during the fiscal year.
As indicated, stock selection within the Information Technology sector was particularly strong, as holdings such as Tencent Holdings Ltd. (a broad internet and value-added services platform), Alibaba Group Holding Ltd. (a China-based e-commerce company), Adobe Systems Inc. (an application software development company) and Microsoft Corp. (a software development and cloud computing company) all added to relative performance. Each of these companies generated strong earnings growth that exceeded consensus expectations. China-based sportswear manufacturer ANTA Sports Products Ltd. (Consumer Discretionary sector) was also a top contributor to Fund performance.
Management's Discussion of Fund Performance (Unaudited) (Continued)
Among the detractors to Fund performance during the period were specialty pharmaceutical company Regeneron Pharmaceuticals Inc. (Health Care sector), China-based social media platform Weibo Corp., semiconductor company AMS AG (both from the Information Technology sector), water treatment systems company Beijing Enterprises Water Group Ltd. (Utilities sector) and luggage manufacturer Samsonite International SA (Consumer Discretionary sector). Regeneron traded down significantly during the year despite consistently beating quarterly earnings estimates. Research and trials that could pave the way for competition for two of its key drugs (Eylea and Dupixent) has led to concerns about the company’s longer term growth and profitability. However, in our opinion, the company continues to have growth drivers from opportunities for new treatment applications for its drug portfolio, and therefore the Fund remains invested in the stock. Similarly, Weibo underperformed as slowing user growth brought into question the company’s long-term growth trajectory. While user growth has declined slightly, Weibo continues to attract users at a very high rate (more than 20% user growth), which we believe will support the company continuing to generate high levels of earnings and revenue growth.
Outlook
We projected for many years that the current global economic cycle will prove to be longer than the majority of previous economic growth periods. We previously thought that global growth would approximate 3 percent; we now believe the global economy may accelerate to a growth rate above that. This is based on fiscal stimulus and deregulatory policies in the U.S., continued economic growth in China, and improving economic outlooks in Europe and Japan. Notwithstanding the weaker growth of the U.S. and Europe in the first quarter, gross domestic product (GDP) growth for the second quarter and the remainder of 2018 should be much stronger. We continue to believe that the current global economic cycle will be driven by low inflation and low, albeit rising, interest rates.
Trade tensions between the U.S. and Canada, Mexico, China and the eurozone remain a source of investor uncertainty across the globe. We believe President Trump’s intent to renegotiate long-standing trade deals has clearly put investors on edge, thus resulting in weak market performance. Concurrently, the U.S. dollar, which is seen as a safe haven, strengthened while investors’ concerns of a trade war and its impact on the global economy escalated. However, with the combined value of the U.S., Chinese and European economies in excess of $50 trillion, we believe the impact of possible tariffs will be limited by their small relative size.
China is reportedly moving forward with a tax cut for most tax payers in order to enhance consumer spending which should boost domestically driven economic growth. The Chinese government is also accelerating government spending and loosening monetary policy. Each of these initiatives should be a beneficial offset to the potentially negative impact of a trade war with the U.S. Meanwhile, in the eurozone, the economic growth outlook remains firm, with the possibility of 2 percent or more GDP growth. As with the U.S., first quarter growth was slow but the second quarter may be primed for a rebound.
Going forward, we believe today’s uncertainties will be of little concern over time. As recent concerns about the economic impact of tariffs begin to dissipate, we anticipate that a weight will be lifted from investors’ shoulders and global equity markets will resume their march higher. For example, just as past worries about European sovereign debt and concerns over Facebook, Inc. subsided, the recent apprehension about trade wars and rising interest rates in the U.S. and Europe should gradually subside too. Looking ahead, we believe the positive scenario of global economic growth, moderate global inflation, low interest rates, healthy global corporate earnings, normal global market valuations and an improving global financial system should continue to form the foundation of an upwardly driven global equity market.
The Fund remains focused on earnings, as we believe strong and growing earnings, when combined with reasonable valuations, are the key to driving stock prices higher over time. Further, the businesses we identity for the Fund are continuously subject to analysis by our investment team. The Fund’s portfolio holdings remain characterized by strong balance sheets and strong free cash flow, and we continue to project a mid- to high-teens earnings growth rate through 2022 with valuations that remain attractive.
Management's Discussion of Fund Performance (Unaudited) (Continued)
Comparison of the Change in Value of a $10,000 Investment in the Touchstone International Growth Opportunities Fund - Class A*, MSCI All Country World Index and MSCI All Country World Ex USA Index
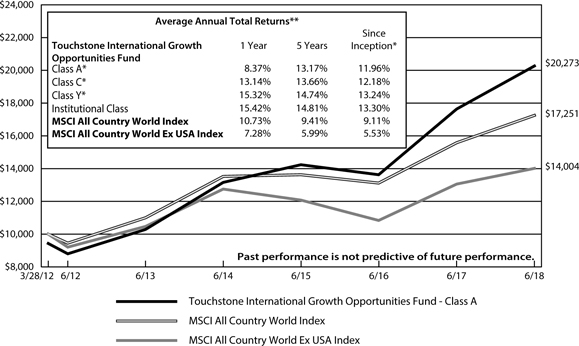
| * | The chart above represents performance of Class A shares only, which will vary from the performance of Class C shares, Class Y shares and Institutional Class shares based on the differences in sales loads and fees paid by shareholders in the different classes. The inception date of Class A shares, Class C shares, Class Y shares and Institutional Class shares was August 15, 2016, August 15, 2016, August 15, 2016 and March 28, 2012, respectively. Class A shares, Class C shares and Class Y shares performance information was calculated using the historical performance of Institutional Class shares for periods prior to August 15, 2016. The returns have been restated for sales loads and fees applicable to Class A, Class C and Class Y shares. The returns of the index listed above are based on the inception date of the Fund. |
| ** | The average annual total returns shown above are adjusted for maximum sales loads and fees, if applicable. The maximum offering price per share of Class A shares is equal to the net asset value (“NAV”) per share plus a sales load equal to 6.10% of the NAV (or 5.75% of the offering price). Class C shares are subject to a contingent deferred sales charge (“CDSC”) of 1.00%. The CDSC will be assessed on an amount equal to the lesser of (1) the NAV at the time of purchase of the shares being redeemed or (2) the NAV of such shares being redeemed, if redeemed within a one-year period from the date of purchase. Class Y shares and Institutional Class shares are not subject to sales charges. |
The performance of the above Fund does not reflect the deduction of taxes that a shareholder would pay on Fund distributions or the redemption of Fund shares.
Notes to Chart
MSCI All Country World Index measures the equity market performance of developed and emerging markets.
MSCI All Country World Ex USA Index measures the performance of global equity market, excluding the United States.
MSCI makes no express or implied warranties or representations and shall have no liability whatsoever with respect to any MSCI data contained herein. The MSCI data may not be further redistributed or used to create indices or financial products. This report is not approved or produced by MSCI.
Management's Discussion of Fund Performance (Unaudited)
Touchstone International Small Cap Fund
Sub-Advised by Copper Rock Capital Partners LLC
Investment Philosophy
The Touchstone International Small Cap Fund seeks capital appreciation by primarily investing in equity securities of non-U.S. small-cap companies diversified across sectors and industries. The Fund’s investment process seeks to add value through bottom-up stock selection and in-depth fundamental research and searches for companies believed to have strong management, superior earnings growth prospects and attractive relative valuations.
Fund Performance
The Touchstone International Small Cap Fund (Class A Shares) underperformed its benchmark, the S&P Developed Ex-U.S. Small Cap Index, for the 12-month period ended June 30, 2018. The Fund’s total return was 8.85 percent (calculated excluding the maximum sales charge) while the total return of the benchmark was 11.43 percent.
Market Environment
Overall, global stock markets posted strong performance during the second half of 2017. In the fourth quarter of 2017, the passage of U.S. tax reforms carried positive investor sentiment throughout the markets. During the first quarter of 2018, however markets began to price in the more aggressive tightening from global central banks amid investors’ concern about inflation trends. There was also an increase in market volatility to more normalized levels, combined with a weakening U.S. dollar and flattening yield curve. The combination of tighter financial conditions, peaking economic activity and trade disputes induced higher levels of equity market volatility which dampened investors’ appetite for risk. As a result, valuation multiples contracted despite strong earnings results. Late in the 12-month period, markets experienced some performance erosion due to investors’ rapid rotation away from cyclical sectors into more defensive sectors, which was triggered by heightened tensions about potential tariffs and trade wars.
Portfolio Review
Regionally, stock selection within the Pacific ex-Japan, the U.K. and emerging markets contributed the most to Fund performance, while stock selection in Japan, Canada and Continental Europe detracted from relative returns. From a sector standpoint, stock selection in the Real Estate, Energy, Materials, Consumer Staples, Health Care and Utilities sectors benefited Fund performance. The majority of underperformance came from stock selection in the Consumer Discretionary sector, while the Information Technology and Industrials sectors also lagged.
Among the individual stocks that contributed to performance during the period were Open House Co. Ltd. (Real Estate sector), AMG Advanced Metallurgical Group NV (Materials sector), Beach Energy Ltd. (Energy sector) and Royal Unibrew A/S (Consumer Staples sector). Open House Co. Ltd. engages in the real estate brokerage business in Japan. During the fourth quarter of 2017, management reported strong year-end earnings driven by superior revenue growth across the single-family home and condominium segments. We believe Open House remains poised for unit growth on the trend of many Japanese residents leaving the countryside and moving to urban city areas. AMG Advanced Metallurgical Group is a Netherlands-based processor of a wide array of mineral ores. The company also owns some tantalum/lithium and graphite mines. AMG has benefited from its plans to double earnings by 2020 through two new hard rock lithium concentrate plants located on an existing pegmatite mine site in Brazil. The company sources lithium in Brazil at an industry-low cost and has also signed an offtake agreement with an established Chinese converter. Since the sourced lithium was previously a residual product, incremental margins from processing have helped increase returns from an already elevated level. AMG is also only one of two suppliers of vanadium in North America, an essential ingredient
Management's Discussion of Fund Performance (Unaudited) (Continued)
in making high-strength steel which is a growing category. AMG sources vanadium ore from recycled oil refinery waste and is paid to take the waste, which covers its fixed costs. Beach Energy is an Australia-based oil and gas exploration and production company. A series of positive exploration and drilling results have culminated into a significant increase in reserves and a lengthening of the company’s reserve lifespan. The stock also benefited from the tailwind of rising Brent crude oil prices which climbed higher during the last quarter of the period. Royal Unibrew, a Denmark-based beverage distribution company, outperformed after it issued an upward adjustment to its fiscal-year earnings outlook based on faster integration and cost synergies of its recent Italian acquisition, Terme di Crodo. In addition, Royal Unibrew’s core beverage market of Northern Europe has experienced exceptionally warm weather trends over the most recent quarter, which led to company management’s confidence in issuing this improved guidance.
Among the individual stocks that detracted from Fund performance were Corus Entertainment Inc., Elior Group SA (both from the Consumer Discretionary sector) and Cembra Money Bank AG (Financials sector). Corus Entertainment, a Canada-based media company, reported disappointing revenue growth from its combination with Shaw Media Inc., a television broadcasting company. The increased size and power resulting from the combined ad agencies did not materialize as expected and ad revenue instead turned negative as advertisers temporarily shifted to digital outlets more quickly than anticipated. Elior Group is a catering and concessions company based in Paris. The company operates cafeterias for corporate and government-owned institutions, as well as meal service areas in airports and auto-routes. In November of 2017, the company negatively pre-announced fiscal-year results ending September 2017 and lowered profit targets. Management attributed this profit miss to the prior CEO’s mishandling of key business units, leading to cost overruns on new contracts and a lack of focus on its multi-year cost-cutting plan. Significant infighting between board members and the former CEO was an additional concern that led us to exit the position. Cembra Money Bank is a Swiss specialty financial services company that provides a range of corporate leasing, personal lending and vehicle financing. Cembra has successfully focused on high-margin lending and services, leveraged by targeting broad markets. The stock underperformed due to 1) a pause in stock performance after strength in the first half of 2017, 2) market rotation toward banks with corporate lending exposure as gross domestic product growth accelerated and 3) the company’s high and growing capital ratios which must be reinvested in high-return businesses or returned to shareholders. We remain attracted to Cembra due to its successful acquisitions and management’s discipline to make capital allocation decisions in its shareholders’ best interests.
Outlook
We continue to believe that we are in the later stages of a bull market with normalizing volatility, greater focus on valuation and returns closer to historical averages. We remain supportive of international small-capitalization equities, due in part to their three pillars of robust earnings growth, buoyant mergers and acquisitions activity and attractive capital return opportunities through dividend and share buybacks.
From a sector standpoint, we are encouraged by the Energy sector, which has endured a long period of balance sheet repair, and focused on capital discipline and cash generative projects. We believe these factors help provide a favorable risk/reward backdrop for a vibrant earnings revision profile while trading at attractive multiples. The Fund ended the period with an overweight allocation to the Energy sector as well as the Health Care, Consumer Staples, Information Technology, Financials and Materials sectors.
Management's Discussion of Fund Performance (Unaudited) (Continued)
Looking ahead, we believe political developments will be front and center. There will likely be continued noise around Brexit, the health of Italy’s new coalition government, Brazil’s elections, and the U.S. mid-term elections. Central Bank rate decisions should also continue to grab headlines. In particular, U.S. rate increases remain data dependent, speculation about the European Central Bank’s pledge of no rate increases until summer 2019, and a more hawkish Bank of England all offer the potential of a policy surprise. We intend to remain selective towards emerging markets, where the combination of a stronger dollar, trade tensions and a busy election calendar have intersected to impact sentiment negatively.
Management's Discussion of Fund Performance (Unaudited) (Continued)
Comparison of the Change in Value of a $10,000 Investment in the Touchstone International Small Cap Fund - Class A* and the S&P Developed Ex-U.S. Small Cap Index
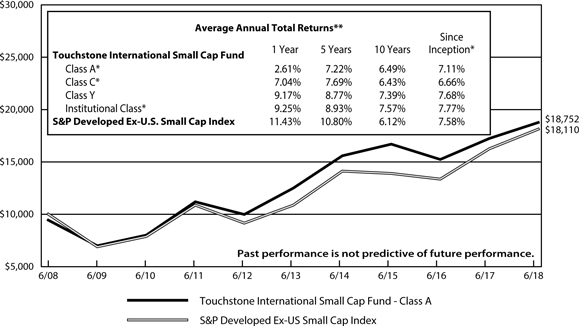
| * | The chart above represents performance of Class A shares only, which will vary from the performance of Class C shares, Class Y shares and Institutional Class shares based on the differences in sales loads and fees paid by shareholders in the different classes. The inception date of Class A shares, Class C shares, Class Y shares and Institutional Class shares was July 31, 2003, April 12, 2012, December 31, 1996 and December 20, 2006, respectively. Class A shares, Class C shares and Institutional Class shares performance was calculated using the historical performance of Class Y shares for the periods prior to July 31, 2003, April 12, 2012 and December 20, 2006, respectively. The returns have been restated for sales loads and fees applicable to Class A, Class C and Institutional Class shares. The returns of the index listed above are based on the inception date of the Fund. |
| ** | The average annual total returns shown above are adjusted for maximum sales loads and fees, if applicable. The maximum offering price per share of Class A shares is equal to the net asset value (“NAV”) per share plus a sales load equal to 6.10% of the NAV (or 5.75% of the offering price). Class C shares are subject to a contingent deferred sales charge (“CDSC”) of 1.00%. The CDSC will be assessed on an amount equal to the lesser of (1) the NAV at the time of purchase of the shares being redeemed or (2) the NAV of such shares being redeemed, if redeemed within a one-year period from the date of purchase. Class Y shares and Institutional Class shares are not subject to sales charges. |
The performance of the above Fund does not reflect the deduction of taxes that a shareholder would pay on Fund distributions or the redemption of Fund shares.
Note to Chart
S&P Developed Ex-U.S. Small Cap Index is an unmanaged index of small-cap stocks from developed countries, excluding the United States.
Management's Discussion of Fund Performance (Unaudited)
Touchstone Large Cap Fund
Sub-Advised by The London Company
Investment Philosophy
The Touchstone Large Cap Fund seeks long-term capital growth by investing primarily in common stocks of large-cap U.S. listed companies. The Fund seeks to purchase financially stable large-cap companies that it believes are consistently generating high returns on unleveraged operating capital, run by shareholder-oriented management, and trading at a discount to the company’s respective private market values.
Fund Performance
The Touchstone Large Cap Fund (Class A Shares) underperformed its benchmark, the Russell 1000® Index, for the 12-month period ended June 30, 2018. The Fund’s total return was 11.35 percent (excluding the maximum sales charge) while the benchmark’s total return was 14.54 percent.
Market Environment
During the trailing 12 months, the U.S. stock market moved consistently higher during 2017 but volatility returned during parts of 2018. The strong returns in 2017 were driven by improving economic data, tepid inflation, and the passage of tax reductions for corporations and individuals. After a strong January 2018, stocks traded lower in both February and March, ending the quarter in negative territory. However, the market turned around during the second quarter due to similar data points and economic news that drove the market in the second half of 2017. The labor market remained strong, with unemployment at roughly 4 percent and a year-over-year increase in average hourly earnings. Labor force participation remained below its all-time high, but we believe that was likely attributed to younger people staying in college longer and retiring baby boomers. In terms of monetary policy, the U.S. Federal Reserve Board (Fed) raised the short-term federal funds rate over the trailing 12 months but inflation has remained low.
Small-capitalization stocks outperformed large-capitalization stocks during the period, primarily due to benefits from the Tax Cuts and Jobs Act. Growth stocks outperformed value stocks with a preference for cyclical sectors over defensive sectors. Strength in the Information Technology sector, especially the dominance of a few companies known as the “FANG” stocks (Facebook Inc., Amazon.com Inc., Netflix Inc. and Google Inc./Alphabet Inc.), continued to drive much of the performance in the market.
The benchmark was led by the Information Technology and Consumer Discretionary sectors while the Consumer Staples sector lagged.
Portfolio Review
Within the Fund, stock selection detracted from relative performance as did sector allocation but to a lesser degree. At the sector level, an overweight to the Consumer Discretionary sector and an underweight to the Health Care sector had a positive impact on relative performance. This was partially offset by the negative impact from an underweight to the Information Technology sector and an overweight to the Financials sector.
Among the individual stocks that contributed to Fund performance during the period were Progressive Corp. (Financials sector), Nike Inc. (Consumer Discretionary sector), Norfolk Southern Corp. (Industrials sector), Visa Inc. and Cisco Systems Inc. (both from the Information Technology sector). Progressive Corp., an insurance provider, contributed to performance during the period as the company continued to take market share in the auto insurance market. The company’s attractive pricing has helped drive market share gains while its conservative underwriting has kept losses minimal. Further, Progressive has been slowly building a homeowner’s insurance business and can now sell joint policies which should drive policy growth over time. Nike is a retailer of footwear, apparel, and sports equipment and accessories. Nike contributed to performance during the 12-month period
Management's Discussion of Fund Performance (Unaudited) (Continued)
as the company posted multiple solid earnings and announced a new $15 billion buyback authorization. The company showed growth in its North America segment after several quarters of deceleration. We remain attracted to Nike’s strong brand, global distribution and cash flow generation. Norfolk Southern, a railway transportation provider, rallied steadily throughout the period after a slow start last summer. The company continued to reduce its expenses while benefiting from strength in the overall economy. The company was also aggressive with recent share repurchases, which further contributed. Visa, a global payments technology company, moved steadily higher along with the Information Technology sector. The company was rewarded for stable growth in a low-growth world. Visa also hosted an encouraging investor day that detailed new opportunities to drive long-term expansion of its platform. Visa generated copious cash flow, and benefited from significant barriers to entry, a duopoly with Mastercard Inc. and an attractive long-term growth profile. Cisco Systems, an information technology and networking company, also rose along with strength in the Information Technology sector. Recent earnings were better than expected and the company continued to pivot toward higher margin software and services. Further, the company’s legacy switches and router business, which is no longer growing, continued to generate ample cash flow.
Among the stocks that detracted from Fund performance were Altria Group Inc. (Consumer Staples sector), Carnival Corp. (Consumer Discretionary sector), New Market Corp. (Materials sector), General Dynamics Corp. and Southwest Airlines Co. (both from the Industrials sector). Altria, the owner of multiple tobacco operating companies, detracted from performance along with many other stocks in the Consumer Staples sector. Rising interest rates also negatively impacted some higher yielding stocks, including Altria. While there have been some concerns about a possible loss in cigarette volume due to smoking alternatives, we remain attracted to Altria’s market position, strong pricing power, return on capital and shareholder-focused orientation longer term. We believe Altria’s partnership with Philip Morris International Inc. to gain approval from the Food and Drug Administration (FDA) to start selling its heat-not-burn tobacco device called iQOS should also position Altria nicely to compete in the smoking alternative space. Carnival, a cruise ship operator, detracted from performance as the company lowered its earnings per share (EPS) guidance reflecting rising fuel costs, and tempered near-term expectations due to issues with travel to the Caribbean. We believe any negative impact to the stock due to weather should be temporary, and the cruise industry’s promising long-term demographics (e.g., retiring baby boomers and experience-seeking millennials) should be positive for the company going forward. We are also attracted to the cruise industry’s strong barriers to entry and limited competition. NewMarket, a company that primarily serves the petroleum additives industry, detracted during the period due to higher raw material costs and lower pricing. We remain attracted to the company’s stable revenue outlook in the market for fuel additives and lubricants, pricing power in a consolidated industry and excellent history of capital allocation. General Dynamics, a global aerospace and defense company, benefited early in the year when political tensions with North Korea ran high and the market was under some pressure. However, from late April through the second quarter, the company and other prime defense contractors were negatively impacted as North and South Korean leaders met and announced an end to the Korean War, which led to the face-to-face meeting between President Trump and North Korean leader Kim Jong-un in June. These events deflated political tensions, which were perceived as a negative for defense-related stocks. Also, during the second quarter of 2018, General Dynamics provided more specific commentary about the transition to new commercial jet models in its Gulfstream unit, and how that transition is expected to lower operating margins from the record levels that have been reported. While the company remained fundamentally strong, continued to generate excellent free cash flow and prioritized the return of capital to its shareholders, recent news flow prompted short-term profit taking in the stock. Southwest Airlines, a passenger airline operator, declined due to rising fuel costs as well as concerns about capacity increases from competitor United Airlines Inc. While increased capacity could lead to lower revenue per available seat in the short term, we are not concerned about a price war given the consolidation in the industry. We also believe the recent consolidation in the industry will allow airlines to raise prices to offset fuel costs. As such,
Management's Discussion of Fund Performance (Unaudited) (Continued)
we remain attracted to Southwest’s low-cost position, which we believe should allow it to effectively compete with its larger peers.
During the 12-month period, we opportunistically took advantage of market weakness and added to the Fund’s position in Alphabet Inc. (Information Technology sector). We believe Alphabet, a multinational conglomerate that includes Google Inc. and its internet products, is structurally advantaged with long-term tailwinds from cloud computing and data centers.
We also initiated positions in The Home Depot Inc. (Consumer Discretionary sector) and Albemarle Corp. (Materials sector). In order to fund these purchases, we trimmed the Fund’s positions in Deere & Co. (Industrials sector), General Dynamics Corp. (Industrials sector) and Lowe’s Companies Inc. (Consumer Discretionary sector). Home Depot is the world’s largest home improvement specialty retailer, with industry-leading margins and returns on capital. Management has also excelled at building its business aimed at professionals. While professionals accounted for only 4 percent of the company’s customer base, they generate approximately 45 percent of sales and are less likely to be disintermediated by the internet. Home Depot is also expected to benefit from the tailwinds in the housing market for some time. Further, recent insider buying and management’s allocation of capital positively impacted the stock. Albemarle is a specialty chemical company with three reporting segments: lithium, bromine specialties and catalysts. The company is a low-cost producer of bromine, and in 2015 expanded into the lithium business where it gained significant market share. A primary use of lithium is in rechargeable batteries, which is expected to see growing demand over the next several years as electric vehicles become more prevalent. Albemarle maintained a top position in each market it serves and a strong balance sheet.
Outlook
The combination of solid economic growth, low inflation and relatively low interest rates has tended to create a positive environment for stocks. We believe this holds true today, but our outlook has a more balanced view. We believe the potential risks include relatively high valuations for stocks using traditional metrics, geopolitical turmoil, excessive government stimulus, rising inflation, risks of increasing tariffs or the Fed taking a more aggressive stance. We believe the risks and rewards are somewhat balanced as they relate to stocks overall, but we will remain cautious and focused.
Going forward, we remain optimistic despite the current market headwinds. We believe the attractive investment candidates we are vetting today are a result of what the market is providing, and is consistent with our general outlook. The market is not cheap and we could certainly see a pullback and/or greater volatility in the future. We seek companies with strong returns on capital and flexibility to enhance shareholder value using the balance sheet and that wisely deploy capital — which includes higher dividends, share repurchases at attractive prices and mergers and acquisitions activity. We believe the Fund is positioned well by remaining focused on those companies with pricing power, copious cash generation and prudent capital allocation.
Management's Discussion of Fund Performance (Unaudited) (Continued)
Comparison of the Change in Value of a $10,000 Investment in the Touchstone Large Cap Fund - Class A* and the Russell 1000® Index
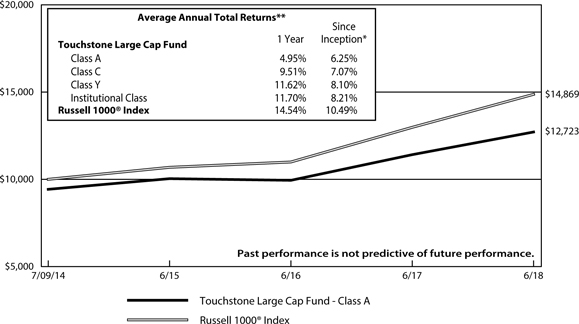
| * | The chart above represents performance of Class A shares only, which will vary from the performance of Class C shares, Class Y shares and Institutional Class shares based on the differences in sales loads and fees paid by shareholders in the different classes. The inception date of the Fund was July 9, 2014. The returns of the index listed above are based on the inception date of the Fund. |
| ** | The average annual total returns shown above are adjusted for maximum sales loads and fees, if applicable. The maximum offering price per share of Class A shares is equal to the net asset value (“NAV”) per share plus a sales load equal to 6.10% of the NAV (or 5.75% of the offering price). Class C shares are subject to a contingent deferred sales charge (“CDSC”) of 1.00%. The CDSC will be assessed on an amount equal to the lesser of (1) the NAV at the time of purchase of the shares being redeemed or (2) the NAV of such shares being redeemed, if redeemed within a one-year period from the date of purchase. Class Y shares and Institutional Class shares are not subject to sales charges. |
The performance of the above Fund does not reflect the deduction of taxes that a shareholder would pay on Fund distributions or the redemption of Fund shares.
Note to Chart
Russell 1000® Index measures the performance of the 1,000 largest companies in the Russell 3000® Index.
The Frank Russell Company (FRC) is the source and owner of the data contained or reflected in this material and all trademarks and copyrights related thereto. The material may contain confidential information and unauthorized use, disclosure, copying, dissemination or redistribution is strictly prohibited. This is a Touchstone Investments presentation of the data, and FRC is not responsible for the formatting or configuration of this material or for any inaccuracy in the presentation thereof.
Management's Discussion of Fund Performance (Unaudited)
Touchstone Large Company Growth Fund
Sub-Advised by DSM Capital Partners LLC
Investment Philosophy
The Touchstone Large Company Growth Fund seeks long-term capital appreciation by primarily investing in U.S. equity securities of large capitalization companies believed to offer the best opportunity for reliable growth at attractive stock valuations. The Fund utilizes a bottom-up idea-driven growth style with a distinct valuation discipline. It seeks to identify companies which are believed to exhibit certain quality characteristics, including: predictable growth, solid fundamentals, attractive profitability and successful management.
Fund Performance
The Touchstone Large Company Growth Fund (Class A shares) underperformed its benchmark, the Russell 1000® Growth Index and outperformed its benchmark the S&P 500® Index, for the 12-month period ended June 30, 2018. The Fund’s total return was 19.75 percent (calculated excluding the maximum sales charge), while the total return of the Russell 1000® Growth Index was 22.51 percent and the total return of the S&P 500® Index was 14.37 percent.
Market Environment
The stock market benefited from strong earnings growth during the 12-month period that ended June 30, 2018. The synchronization and strength of global growth in 2017 was better than many had anticipated and contributed to higher corporate earnings. This was compounded by tax reform and fiscal stimulus in the U.S. As a result, the equity markets experienced strong gains in 2017 and into early 2018.
However, by February, investors grew concerned that accelerating global growth would become a catalyst for inflation and higher than anticipated interest rates. Market worries were further exacerbated by escalating trade rhetoric and protectionist trade policies. Though it initially originated in the U.S., American trade partners around the globe responded by imposing retaliatory tariffs and spurring a tit-for-tat trade dispute that increased trade barriers. As a result, markets have traded sideways from February through the end of the fiscal year.
Portfolio Review
During the 12-month period that ended June 30, 2018, the Fund’s underperformance versus the benchmark was primarily due to weak stock selection in the Consumer Discretionary and Health Care sectors. This was partially offset by the Fund’s stock selection in and overweight to the Information Technology sector.
There were no significant changes made to the Fund’s positioning during the 12-month period. The majority of the Fund’s portfolio was invested in the Information Technology, Health Care and Consumer Discretionary sectors, with smaller weights in the Financials, Consumer Staples and Industrials sectors. The Fund’s allocation to the Financials sector increased during the period and was funded through a decline in the Consumer Discretionary exposure.
As previously discussed, stock selection was strong in the Information Technology sector. Holdings such as Adobe Systems Inc. (an application software development company), Tencent Holdings Ltd. (a broad internet and value-added services platform), Alibaba Group Holding Ltd. (a Chinese e-commerce company), Visa Inc. (an electronic payments company) and Facebook Inc. (a developer of social networking applications) all contributed materially to the Fund’s performance. For instance, Adobe generated gains during the fiscal period, driven by strong earnings that continued to beat consensus estimates.
Among the detractors to Fund performance during the period were specialty pharmaceutical companies Regeneron Pharmaceuticals Inc. and Allergan PLC (both from the Health Care sector), global cruise operator Norwegian
Management's Discussion of Fund Performance (Unaudited) (Continued)
Cruise Line Holdings Ltd. and consumer products manufacturer Newell Brands Inc. (both from the Consumer Discretionary sector), and investment management corporation BlackRock Inc. (Financials sector). Regeneron traded down significantly during the year despite consistently beating quarterly earnings estimates. Research and trials that could pave the way for competition for two of its key drugs (Eylea and Dupixent) led to concerns about the company’s longer term growth and profitability. However, in our opinion, the company continues to have growth drivers from opportunities for new treatment applications for its drug portfolio, therefore the Fund remains invested in the stock.
Outlook
We have projected for many years that the current global economic cycle will prove to be longer than the majority of previous economic growth periods. We previously thought that global growth would approximate three percent; we now believe the global economy may accelerate to a growth rate above that. This is based on fiscal stimulus and deregulatory policies in the U.S., continued economic growth in China, and improving economic outlooks in Europe and Japan. Despite the weaker growth of the U.S. and Europe in the first quarter, gross domestic product (GDP) growth for the second quarter and the remainder of 2018 should be stronger.
We continue to believe that the current global economic cycle will be driven by low inflation and low, albeit rising, interest rates. The changes in corporate tax rates in the U.S. are substantial, and we believe the resulting impact on GDP has been underestimated by many analysts.
Trade tensions between the U.S. and Canada, Mexico, China and the eurozone remain a source of investor uncertainty across the globe. We believe President Trump’s intent to renegotiate long-standing trade deals have clearly put investors on edge, resulting in weak market performance. Concurrently, the U.S. dollar strengthened while concerns of a trade war and its impact on the global economy escalated. However, with the combined value of the U.S., Chinese and European economies in excess of $50 trillion, we believe the impact of possible tariffs will be limited by their small relative size.
Going forward, we believe today’s uncertainties will be of little concern over time. As recent concerns about the economic impact of tariffs begin to dissipate, we anticipate that a weight will be lifted from investors’ shoulders and global equity markets will resume their march higher. For example, just as past worries about European sovereign debt and concerns over Facebook subsided, the recent apprehension about trade wars and rising interest rates in the U.S. and Europe should gradually subside too. Looking ahead, we believe the positive scenario of global economic growth, moderate global inflation, low interest rates, healthy global corporate earnings, normal global market valuations and an improving global financial system, should continue to form the foundation of an upwardly driven global equity market.
The Fund remains focused on earnings, as we believe strong and growing earnings, when combined with reasonable valuations, are the key to driving stock prices higher over time. Further, the businesses we identity for the Fund are continuously subject to analysis by our investment team. The Fund’s portfolio holdings remain characterized by strong balance sheets and strong free cash flow, and we continue to project a mid- to high-teens earnings growth rate through 2022 with valuations that remain attractive.
Management's Discussion of Fund Performance (Unaudited) (Continued)
Comparison of the Change in Value of a $10,000 Investment in the Touchstone Large Company Growth Fund- Class A*, the Russell 1000® Growth Index and the S&P 500® Index
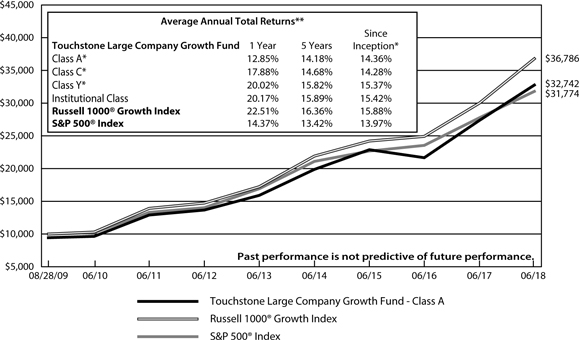
| * | The chart above represents performance of Class A shares only, which will vary from the performance of Class C shares, Class Y shares and Institutional Class shares based on the differences in sales loads and fees paid by shareholders in the different classes. The inception date of Class A shares, Class C shares, Class Y shares and Institutional Class shares was August 15, 2016, August 15, 2016, August 15, 2016 and August 28, 2009, respectively. Class A shares, Class C shares and Class Y shares performance information was calculated using the historical performance of Institutional Class shares for periods prior to August 15, 2016. The returns have been restated for sales loads and fees applicable to Class A, Class C and Class Y shares. The returns of the indexes listed above are based on the inception date of the Fund. |
| ** | The average annual total returns shown above are adjusted for maximum sales loads and fees, if applicable. The maximum offering price per share of Class A shares is equal to the net asset value (“NAV”) per share plus a sales load equal to 6.10% of the NAV (or 5.75% of the offering price). Class C shares are subject to a contingent deferred sales charge (“CDSC”) of 1.00%. The CDSC will be assessed on an amount equal to the lesser of (1) the NAV at the time of purchase of the shares being redeemed or (2) the NAV of such shares being redeemed, if redeemed within a one-year period from the date of purchase. Class Y shares and Institutional Class shares are not subject to sales charges. |
The performance of the above Fund does not reflect the deduction of taxes that a shareholder would pay on Fund distributions or the redemption of Fund shares.
Note to Chart
Russell 1000® Growth Index measures the performance of those Russell 1000 companies with higher price-to-book ratios and higher forecasted growth values.
The Frank Russell Company (FRC) is the source and owner of the data contained or reflected in this material and all trademarks and copyrights related thereto. The material may contain confidential information and unauthorized use, disclosure, copying, dissemination or redistribution is strictly prohibited. This is a Touchstone Investments presentation of the data, and FRC is not responsible for the formatting or configuration of this material or for any inaccuracy in the presentation thereof.
S&P 500® Index is a group of 500 widely held stocks and is commonly regarded to be representative of the large capitalization stock universe.
Management's Discussion of Fund Performance (Unaudited)
Touchstone Ohio Tax-Free Bond Fund
Sub-Advised by Fort Washington Investment Advisors, Inc.
Investment Philosophy
The Touchstone Ohio Tax-Free Bond Fund seeks the highest level of interest income exempt from federal income and Ohio personal income taxes, consistent with the protection of capital. It invests primarily in high-quality, long-term Ohio Municipal obligations.
Fund Performance
The Touchstone Ohio Tax-Free Bond Fund (Class A Shares) underperformed its benchmark, the Bloomberg Barclays Municipal Bond Index, for the 12-month period ended June 30, 2018. The Fund’s total return was 0.99 percent (calculated excluding the maximum sales charge) while the total return of the benchmark was 1.56 percent.
Market Environment
The U.S. economy showed solid growth during the fiscal year. In particular, U.S. employment growth remained strong with an average of 200,000 new jobs per month, and the unemployment rate declined to 4 percent as new workers entered the workforce. Inflation gradually increased during the year, with most major indicators exceeding the U.S. Federal Reserve Board’s (Fed) target rate of 2 percent. The Fed raised the federal funds rates at each meeting beginning in December 2017. The federal funds rate ended the fiscal year at 2 percent, which was up from 1.25 percent at the beginning of the period. The Fed also began to reduce its holdings of U.S. Treasuries and mortgaged-backed securities, thereby unwinding the quantitative easing measures taken following the financial crisis. Following the most recent Federal Open Market Committee meeting in June 2018, Fed Chairman Powell announced expectations for two additional rate increases this year, with the caveat that any additional actions will be driven by economic data.
Against the backdrop of a growing economy and tightening monetary policy, interest rates on U.S. Treasuries increased over the course of the 12-month period. Short-term interest rates rose over 1 percent, which was in line with the increases in the federal funds rate, while longer term maturities increased but to a lesser degree. This caused the U.S. Treasury curve to flatten considerably as 10-year U.S. Treasury Notes increased meaningfully.
The municipal market performed well over the period with various events influencing performance. The single most impactful event was the Tax Cuts and Jobs Act (TCJA), which was announced in late 2017 and reduced individual and corporate tax rates. This caused new issue supply to swell in late 2017 as issuers rushed to market, selling bonds to beat restrictions contained in the new law that eliminated advanced refundings or the ability of municipalities to issue tax-free bonds to refinance outstanding debt in advance of call or maturity dates. Since the beginning of 2018, however, new issue supply has declined substantially. The combination of lower new issue supply and continued strong demand from individual investors helped municipals outperform other bond sectors during the period. Thus far in 2018, rising interest rates have focused investor demand on bonds with short-term maturities in the one- to five-year range, which also helped the municipals sector outperform. Going forward, barring any disruptions in the global markets or the U.S. economy, the Fed will likely raise the federal funds rate. If this occurs, we believe interest rates across the yield curve will move higher as well, especially on 10- and 30-year maturities.
Portfolio Review
In managing the Fund, we put greater emphasis on high-quality Ohio municipal bonds in the 20-year maturity range, where we believe the market offers the best combination of tax-free yield and total return. We believe
Management's Discussion of Fund Performance (Unaudited) (Continued)
this strategy can help the Fund maintain a shorter duration relative to the broader market and reduce volatility associated with longer term bonds. During the fiscal year, the Fund benefited from an allocation to Education bonds and an overweight position in pre-refunded bonds. The Fund’s position in Hospital bonds, in which the Fund was overweight, detracted from performance primarily due to security selection. The Fund was also negatively impacted by having a zero allocation to Transportation bonds, as the ability to invest in that industry was limited within the Ohio market.
The municipal yield curve flattened over the course of the fiscal year with short-term rates increasing in response to the Fed’s tightening monetary policy. However, the adjustment was not as dramatic as the flattening that occurred in the U.S. Treasury market as the preference for short-term bonds in a rising interest rate market helped restrain short-term municipal rates. The changes in the municipal yield curve were a slight benefit to Fund performance during the period.
Outlook
Positive economic growth was supportive to credit fundamentals across the municipal sector as state and local revenues increased as a result of the favorable macro conditions. However, while the environment for the municipal market was generally positive, we believe some sector-specific issues could increase volatility going forward. First, the TCJA’s reduction in corporate tax rates could impact the participation of banks and property and casualty insurance companies, which make up 20 to 25 percent of the current municipal market. While we have already seen some selling by banks, a further reduction in demand from these buyers in a more robust new issue market could negatively impact market performance. Second, state pension funding levels for some states are well below required levels. Over the long term, this could squeeze budgets, and cause credit deterioration and ratings downgrades as municipalities work to improve funding levels. Fortunately, Ohio’s major pension plans are in good shape with healthy funding levels and continue to improve following adjustments the state made a few years ago to better its plans.
We believe the Fund is properly positioned at quarter end. We will seek to take advantage of opportunities during periods of market volatility that lead to higher yields using cash and pre-refunded bonds to fund new purchases. We are likely to favor maturities in the 15- to 20-year range as we believe these securities offer better relative value in the current market.
Management's Discussion of Fund Performance (Unaudited) (Continued)
Comparison of the Change in Value of a $10,000 Investment in the Touchstone Ohio Tax-Free Bond Fund - Class A* and the Bloomberg Barclays Municipal Bond Index
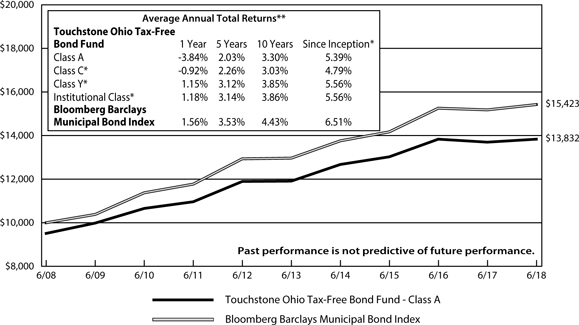
| * | The chart above represents performance of Class A shares only, which will vary from the performance of Class C shares, Class Y shares and Institutional Class shares based on the difference in sales loads and fees paid by shareholders in the different classes. The inception date of Class A shares, Class C shares, Class Y shares and Institutional Class shares was April 1, 1985, November 1, 1993, August 30, 2016 and August 30, 2016, respectively. Class C shares, Class Y shares and Institutional Class shares performance information was calculated using the historical performance of Class A shares for the periods prior to November 1, 1993, August 30, 2016 and August 30, 2016, respectively. The returns have been restated for sales loads and fees applicable to Class C shares, Class Y shares and Institutional Class shares. The returns of the index listed above are based on the inception of the Fund. |
| ** | The average annual total returns shown above are adjusted for maximum sales loads and fees, if applicable. The maximum offering price per share of Class A shares is equal to the net asset value (“NAV”) per share plus a sales load equal to 4.99% of the NAV (or 4.75% of the offering price). Class C shares are subject to a contingent deferred sales charge (“CDSC”) of 1.00% that will be assessed on an amount equal to the lesser of (1) the NAV at the time of purchase of the shares being redeemed or (2) the NAV of such shares being redeemed, if redeemed within a one-year period from the date of purchase. Class Y shares and Institutional Class shares are not subject to sales charges. |
The performance of the above Fund does not reflect the deduction of taxes that a shareholder would pay on Fund distributions or the redemption of Fund shares.
Note to Chart
The Bloomberg Barclays Municipal Bond Index is a widely recognized unmanaged index of municipal bonds with maturities of at least one year.
Management's Discussion of Fund Performance (Unaudited)
Touchstone Small Cap Value Opportunities Fund
Sub-Advised by Thompson, Siegel & Walmsley LLC
Investment Philosophy
The Fund seeks long-term capital growth by primarily investing in equity securities of small-cap companies believed to present a value or potential worth that is not recognized by prevailing market prices or that have experienced some fundamental changes and are intrinsically undervalued by the investment community. The sub-advisor uses a combination of quantitative and qualitative methods to assess the outlook for a company.
Fund Performance
The Touchstone Small Cap Value Opportunities Fund (Class A Shares) underperformed its benchmark, the Russell 2000® Value Index, for the 12-month period ended June 30, 2018. The Fund’s total return was 11.04 percent (calculated excluding the maximum sales charge) while the total return of the benchmark was 13.10 percent.
Market Environment
Over the trailing 12 months, the market generally favored more cyclical sectors, while more defensive areas of the market, such as the Consumer Staples and Utilities sectors, lagged. Despite heightened valuations, the market continued to move higher due, in part, to the passage of tax reform in late 2017. The market was also relatively complacent as evidenced by record-low volatility in 2017, outperformance from momentum stocks, and valuation factors generally being out of favor. During the latter part of 2017, the U.S. Federal Reserve Board (Fed) signaled a move towards a more normalized interest rate environment which, coupled with a rise in the 10-year U.S. Treasury and continued divergence in global trade policy, contributed to an increase in volatility and a decline in stock correlations. While 2018 started off strong, it was followed by a market correction in late January. Overall, small-cap stocks performed well during the period, though investor concerns surrounding a trade war benefited more domestic-oriented stocks.
Portfolio Review
Both stock selection and sector allocation contributed to relative performance. At the sector level, the Fund’s overweight to the Industrials sector and underweight to the Utilities sector were positive contributors to relative performance, but they were partially offset by an underweight to the Energy and Health Care sectors.
Among the individual stocks that contributed to Fund performance were Vonage Holdings Corp. (Telecommunication Services sector),The Stars Group Inc. (Consumer Discretionary sector) and Green Dot Corp. (Financials sector). The largest detractors were Basic Energy Services Inc. (Energy sector), Diebold Nixdorf Inc. (Information Technology sector) and Motorcar Parts of American Inc. (Consumer Discretionary sector).
At the end of the quarter, the Fund was overweight to the Financials, Industrials, Consumer Discretionary, Telecommunication Services, Health Care, Consumer Staples and Information Technology sectors, and underweight to the Real Estate, Utilities, Materials and Energy sectors.
Management's Discussion of Fund Performance (Unaudited) (Continued)
Outlook
We believe the economy appears to be in good health, with no major indications of recession on the immediate horizon. We expect a continuation of noise in the marketplace leading to increased volatility, thereby creating short-term opportunities for the Fund. The market continues to trade at an expensive multiple, which is even further pronounced when comparing growth against value. In fact, we believe the relative valuation of the Russell 2000® Growth Index compared to the Russell 2000® Value Index indicates a significant disconnect in relative valuation. Going forward, however, we believe the backdrop of an expensive market influenced heavily by macroeconomic headlines and uncertainty in political rhetoric warrants a disciplined and risk-aware approach to investing. As such, we believe our disciplined focus on sustainability of cash flows, probabilistic outcomes, and identifying those stocks with the highest reward to risk should benefit the Fund in this environment.
Management's Discussion of Fund Performance (Unaudited) (Continued)
Comparison of the Change in Value of a $10,000 Investment in the Touchstone Small Cap Value Opportunities Fund - Class A* and the Russell 2000® Value Index
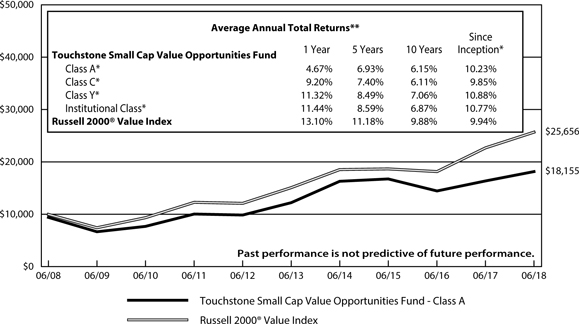
| * | The chart above represents performance of Class A shares only, which will vary from the performance of Class C shares, Class Y shares and Institutional Class shares based on the differences in sales loads and fees paid by shareholders in the different classes. The inception date of Class A shares, Class C shares, Class Y shares and Institutional Class shares was July 31, 2003, April 12, 2012, July 25, 2003 and December 9, 2008, respectively. Performance information presented prior to July 25, 2003 for Class Y shares includes performance of a predecessor fund whose inception date was July 31, 2000. Class A shares, Class C shares and Institutional Class shares performance was calculated using the historical performance of Class Y shares for periods prior to July 31, 2003, April 12, 2012 and December 9, 2008, respectively. The returns have been restated for sales loads and fees applicable to Class A, Class C and Institutional Class shares. The returns of the index listed above are based on the inception date of the Fund. |
| ** | The average annual total returns shown above are adjusted for maximum sales loads and fees, if applicable. The maximum offering price per share of Class A shares is equal to the net asset value (“NAV”) per share plus a sales load equal to 6.10% of the NAV (or 5.75% of the offering price). Class C shares are subject to a contingent deferred sales charge (“CDSC”) of 1.00%. The CDSC will be assessed on an amount equal to the lesser of (1) the NAV at the time of purchase of the shares being redeemed or (2) the NAV of such shares being redeemed, if redeemed within a one-year period from the date of purchase. Class Y shares and Institutional Class shares are not subject to sales charges. |
The performance of the above Fund does not reflect the deduction of taxes that a shareholder would pay on Fund distributions or the redemption of Fund shares.
Note to Chart
Russell 2000® Value Index measures the performance of those Russell 2000 companies with lower price-to-book ratios and lower forecasted growth values.
The Frank Russell Company (FRC) is the source and owner of the data contained or reflected in this material and all trademarks and copyrights related thereto. The material may contain confidential information and unauthorized use, disclosure, copying, dissemination or redistribution is strictly prohibited. This is a Touchstone Investments presentation of the data, and FRC is not responsible for the formatting or configuration of this material or for any inaccuracy in the presentation thereof.
Management's Discussion of Fund Performance (Unaudited)
Touchstone Value Fund
Sub-Advised by Barrow, Hanley, Mewhinney & Strauss, LLC
Investment Philosophy
The Touchstone Value Fund seeks long-term growth by primarily investing in equity securities of large- and mid-cap companies believed to be undervalued. The Fund uses traditional methods of stock selection — research and analysis — to identify companies that have price-to-earnings and price-to-book ratios below the market, that also have above-average dividend yields, and that focus on companies that are out of favor due to internal or external challenges judged to be short-term in nature. Stock selection is driven by fundamental analysis on individual companies rather than by broad market themes.
Fund Performance
The Touchstone Value Fund (Class A Shares) outperformed its benchmark, the Russell 1000® Value Index, for the 12-month period ended June 30, 2018. The Fund’s total return was 6.92 percent (calculated excluding the maximum sales charge), while the total return of the benchmark was 6.77 percent for the same period.
Market Environment
After a strong period for stocks in the second half of 2017, the first six months of 2018 produced negative returns along with a growing list of concerns about the sustainability of the current bull market. The extreme optimism and lack of volatility that characterized late 2017 were replaced in 2018 with higher interest rates, a stronger U.S. dollar, higher energy prices, and escalating trade wars, the last of which has generated the most apprehension from investors. While all are valid concerns, their effects have been offset by the meaningful benefits derived from tax cuts, repatriations of corporate cash, and higher government spending.
We believe the common theme to both the negatives and positives previously mentioned is that each scenario has very different and uneven impacts on individual industries and companies. Such a market environment could prove to be an inflection point in favor of active stock selection rather than the passive investing strategies that have been popular in recent years. It would also call into question the popularity of growth stocks relative to value stocks, as many passive benchmarks have outsized weightings in a handful of “superstar” growth stocks. While growth stocks have continued to outperform value stocks, we believe the underpinnings of a value cycle — most notably faster economic growth and higher interest rates — have become evident and could likely increase going forward.
Portfolio Review
During the 12-month period, the Fund’s overweight position and positive stock selection in the Energy and Consumer Discretionary sectors were primary contributors, though the Financials and Utilities sectors also generated positive relative returns. This was partially offset by relative weakness in the Health Care and Industrials sectors.
The Fund’s overweight to, and stock selection in, the Energy sector contributed meaningfully to the Fund’s performance during the period. Most of the Fund’s Energy stocks were influenced by higher oil prices, including Occidental Petroleum Corp., ConocoPhillips and BP PLC; this positioning benefited the Fund. Occidental Petroleum, a petroleum and natural gas exploration and production company, performed well during the period as its Permian Basin oil production exceeded expectations and its mid-stream business captured significant margins in a tight market. Exploration and production company ConocoPhillips also contributed to performance as the company’s cash flows were affected by higher oil prices. The increased production and higher operating cash flows along with proceeds from 2017’s asset sale in Canada allowed management to pay off company
Management's Discussion of Fund Performance (Unaudited) (Continued)
debt and institute a multi-year share repurchase program. BP, an integrated oil and gas company, moved higher during the period as the company’s financial results for both its upstream and downstream assets exceeded expectations.
The Health Care sector was the largest detractor from the Fund’s relative performance over the course of the full fiscal year, largely due to overweight positions in Cardinal Health Inc. and Teva Pharmaceutical Industries Ltd.
Cardinal Health is one of the largest pharmaceutical distributors in North America, with a dominant medical product distribution business. Distributors typically make a disproportionate amount of profits from generic drug distribution, and as a result, Cardinal has been negatively impacted by generic drug pricing that has been weaker than usual over the last two years. We believe accelerating approvals from the Food and Drug Administration (FDA) of new generics will continue to pressure generic drug prices, but the consolidation of generic drug purchasing into large group purchasing organizations has run its course and should lead to moderating generic drug price deflation. Looking ahead, we believe Cardinal Health’s valuation should improve as its pharmaceutical business continues to recover and its medical business makes headway on integration issues related to the company’s acquisition of Cordis.
Teva Pharmaceutical Industries develops, manufactures and markets both generic and branded prescription drugs. The company’s underperformance was driven by a sharp decline in earnings as generic drug price deflation accelerated following the company’s acquisition of Allergan PLC’s generic drug business. Though the company’s new CEO began to aggressively cut costs in order to stabilize earnings and pay down debt, we believe the risks Teva faces appear to be long-term in nature. As a result, our investment thesis changed materially and the Fund exited the stock.
Other individual stocks that contributed to performance during the fiscal year were XL Group Ltd. (Financials sector),Microsoft Corp. (Information Technology sector) and Twenty-First Century Fox Inc. (Consumer Discretionary sector). XL Group is a global insurance company that generates the majority of its earnings from primary insurance and the remainder from reinsurance. Shares of XL moved higher following the announcement from AXA, a French insurance conglomerate, that it would acquire XL at a significant premium. Microsoft develops, manufactures and sells computer software, consumer electronics, personal computers and services. The company’s transition from de-emphasizing some legacy businesses to focus on well-positioned enterprise businesses has been successful thus far. In particular, its Office 365 and Azure products have experienced rapid growth as customers look to move workloads from their own internally managed servers to the cloud. Acceleration in these businesses, despite increasingly larger bases, support our view that Microsoft can capture an increased portion of a larger market as the business model shifts to be more cloud based. As incremental costs associated with these cloud investments slow and the businesses reach scale, the profit contribution has become more important. Twenty-First Century Fox owns and operates a collection of top-tier media assets which include domestic and international cable networks, a broadcast network, and film and television libraries and studios. In December 2017, The Walt Disney Co. offered to purchase a majority of the company’s assets and acquisition interest from Comcast denoted the start of a bidding war with Disney, which benefit the Twenty-First Century Fox stock and the Fund’s performance.
Among the individual stocks that detracted from performance were General Electric Co., Johnson Controls International PLC (both from the Industrials sector) and Philip Morris International Inc. (Consumer Staples sector). General Electric (GE), a global digital industrial company, has market-leading franchises in industries that, in general, have grown and have high barriers to entry. However, the company’s financial performance has been below average. The company’s new CEO was also expected to generate greater cost discipline, rising margins, better cash conversion and portfolio simplification. While progress was made in these areas, it was offset by a greater than expected decline in the market for gas turbines due to growing renewables penetration.
Management's Discussion of Fund Performance (Unaudited) (Continued)
Additionally, a larger than expected charge from GE Capital led to balance sheet concerns and a widening of credit spreads. While overcapacity issues in the power business continues to suppress margins, we believe the oligopolistic structure of the industry and long-term nature of the service agreements could lead to improved cash generation and a rebound in General Electric’s performance. Johnson Controls International produces, installs and services HVAC, fire and security systems and is a large producer of automotive batteries. The stock detracted from performance due to a cash flow shortfall. In our view, the problems were primarily related to working capital and taxes, which we believe to be one-time in nature and should be resolved by late 2018. Importantly, the company is executing well on cost synergies from the Tyco acquisition, a significant driver of Johnson’s expected earnings growth going forward. Philip Morris International, a cigarette and tobacco manufacturer, declined following poor results in the first quarter of 2018, primarily due to mishandled communications for the company’s iQOS heat-not-burn product in Japan. A change in the way Philip Morris reported Japanese market share showed an apparent drop in Japan’s iQOS market share. Though a deeper analysis actually demonstrated an increase in iQOS market share, the damage to the stock was done before explanations could be made and the stock continued to be penalized. On a more positive note, iQOS is now being marketed in approximately 40 markets around the globe and market shares are rising, although none as rapidly as in Japan and South Korea. Further, we believe that the FDA could approve iQOS for distribution in the U.S. by Philip Morris’ sister company Altria Group Inc. before year-end.
Outlook
The current bull market has spanned nine years and, if it continues for a few more months, will become the longest bull market in history (since 1928). However, as the bull market has stumbled recently, we are reminded of how other bull markets have played out. After extended bull markets, investor bullishness for the areas of the market that have already been successful typically becomes extreme. In this cycle, that area has clearly been growth stocks, specifically a handful of highly priced technology and internet-related names. The valuation gap between growth and value has recently widened further as investors continue to chase the best performing stocks of the last few years. While value has not yet overtaken growth, market returns have moderated thus far in 2018 and the Fund has benefited as a result.
We remain confident that our conservative, defensive style of investing is a proven one. Importantly, our investment process has historically provided downside protection by focusing on undervalued companies with strong fundamentals and a meaningful and growing dividend. If markets fall or produce modest returns compared to the past nine years, we believe the Fund is well positioned going forward.
Management's Discussion of Fund Performance (Unaudited) (Continued)
Comparison of the Change in Value of a $10,000 Investment in the Touchstone Value Fund - Class A* and the Russell 1000® Value Index
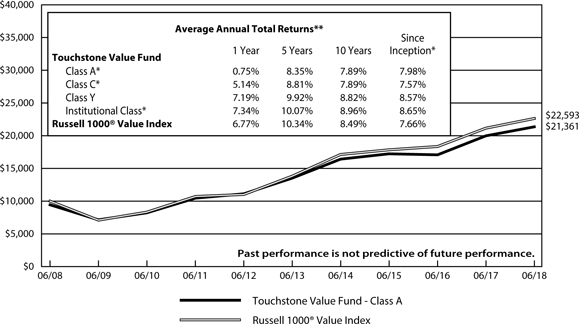
| * | The chart above represents performance of Class A shares only, which will vary from the performance of Class C shares, Class Y shares and Institutional Class shares based on the differences in sales loads and fees paid by shareholders in the different classes. The inception date of Class A shares, Class C shares, Class Y shares and Institutional Class shares was July 31, 2003, April 12, 2012, September 10, 1998 and December 20, 2006, respectively. Class A shares, Class C shares and Institutional Class shares performance was calculated using the historical performance of Class Y shares for the periods prior to July 31, 2003, April 12, 2012 and December 20, 2006, respectively. The returns have been restated for sales loads and fees applicable to Class A, Class C and Institutional Class shares. The returns of the index listed above are based on the inception date of the Fund. |
| ** | The average annual total returns shown above are adjusted for maximum sales loads and fees, if applicable. The maximum offering price per share of Class A shares is equal to the net asset value (“NAV”) per share plus a sales load equal to 6.10% of the NAV (or 5.75% of the offering price). Class C shares are subject to a contingent deferred sales charge (“CDSC”) of 1.00%. The CDSC will be assessed on an amount equal to the lesser of (1) the NAV at the time of purchase of the shares being redeemed or (2) the NAV of such shares being redeemed, if redeemed within a one-year period from the date of purchase. Class Y shares and Institutional Class shares are not subject to sales charges. |
The performance of the above Fund does not reflect the deduction of taxes that a shareholder would pay on Fund distributions or the redemption of Fund shares.
Note to Chart
Russell 1000® Value Index measures those Russell 1000 companies with lower price-to-book ratios and lower expected growth values.
The Frank Russell Company (FRC) is the source and owner of the data contained or reflected in this material and all trademarks and copyrights related thereto. The material may contain confidential information and unauthorized use, disclosure, copying, dissemination or redistribution is strictly prohibited. This is a Touchstone Investments presentation of the data, and FRC is not responsible for the formatting or configuration of this material or for any inaccuracy in the presentation thereof.
Tabular Presentation of Portfolios of Investments (Unaudited)
June 30, 2018
The tables below provide each Fund’s geographic allocation, credit quality and/or sector allocation. We hope it will be useful to shareholders as it summarizes key information about each Fund’s investments.
| Touchstone Credit Opportunities Fund |
| Credit Quality* | | (% of Fixed Income Securities) | |
| BBB/Baa | | | 1.7 | % |
| BB/Ba | | | 38.2 | |
| B/B | | | 40.2 | |
| CCC | | | 13.9 | |
| Not Rated | | | 2.6 | |
| Cash equivalents | | | 3.4 | |
| | | | 100.0 | % |
| Sector Allocation** | | (% of Net Assets) | |
| Long Positions | | | | |
| Corporate Bonds | | | | |
| Consumer Discretionary | | | 15.2 | % |
| Telecommunications Services | | | 13.7 | |
| Energy | | | 10.1 | |
| Materials | | | 9.2 | |
| Information Technology | | | 8.0 | |
| Health Care | | | 7.2 | |
| Financials | | | 5.7 | |
| Industrials | | | 5.3 | |
| Consumer Staples | | | 2.6 | |
| Utilities | | | 1.0 | |
| Real Estate | | | 1.0 | |
| Bank Loans | | | 11.1 | |
| Asset-Backed Securities | | | 4.1 | |
| Common Stocks | | | 1.7 | |
| Warrants | | | 0.0 | |
| Purchased Call Options | | | 0.0 | |
| Purchased Put Options | | | 0.1 | |
| Short-Term Investment Funds | | | 7.8 | |
| Other Assets/Liabilities (Net) | | | (3.2 | ) |
| | | | 100.6 | % |
| Short Positions | | | | |
| Corporate Bond | | | (0.6 | ) |
| Written Call Options | | | (0.0 | ) |
| | | | (0.6 | ) |
| Total | | | 100.0 | % |
| Touchstone International Growth Opportunities Fund |
| Geographic Allocation | | (% of Net Assets) | |
| Common Stocks | | | | |
| China | | | 40.8 | % |
| Switzerland | | | 12.5 | |
| India | | | 7.6 | |
| Canada | | | 7.1 | |
| Japan | | | 6.0 | |
| Singapore | | | 4.6 | |
| Germany | | | 3.2 | |
| Macau | | | 3.1 | |
| Sweden | | | 2.6 | |
| United Kingdom | | | 2.5 | |
| France | | | 2.5 | |
| Mexico | | | 2.1 | |
| Brazil | | | 2.0 | |
| Thailand | | | 1.7 | |
| Austria | | | 1.3 | |
| Short-Term Investment Funds | | | 1.3 | |
| Other Assets/Liabilities (Net) | | | (0.9 | ) |
| Total | | | 100.0 | % |
| * | Credit quality ratings are from Standard & Poor’s (“S&P”) and Moody’s Investors Service (“Moody’s”). If agency ratings differ, the higher rating will be used. Where no rating has been assigned, it may be for reasons unrelated to the creditworthiness of the issuer. |
| ** | Sector classifications are based upon the Global Industry Classification Standard (GICS®). |
Tabular Presentation of Portfolios of Investments (Unaudited) (Continued)
| Touchstone International Small Cap Fund |
| Geographic Allocation | | (% of Net Assets) | |
| Common Stocks | | | | |
| Japan | | | 27.9 | % |
| United Kingdom | | | 10.9 | |
| Australia | | | 7.9 | |
| Germany | | | 6.9 | |
| Netherlands | | | 5.0 | |
| France | | | 4.3 | |
| Italy | | | 3.8 | |
| Canada | | | 3.7 | |
| Denmark | | | 3.6 | |
| Hong Kong | | | 2.7 | |
| Switzerland | | | 2.4 | |
| South Korea | | | 2.2 | |
| Spain | | | 1.8 | |
| Sweden | | | 1.7 | |
| India | | | 1.4 | |
| Luxembourg | | | 1.3 | |
| China | | | 1.3 | |
| Ireland | | | 1.2 | |
| Malaysia | | | 1.2 | |
| Jordan | | | 1.0 | |
| Singapore | | | 1.0 | |
| Norway | | | 0.9 | |
| Exchange-Traded Fund | | | 1.8 | |
| Short-Term Investment Funds | | | 5.8 | |
| Other Assets/Liabilities (Net) | | | (1.7 | ) |
| Total | | | 100.0 | % |
| Touchstone Large Cap Fund |
| Sector Allocation* | | (% of Net Assets) | |
| Financials | | | 24.1 | % |
| Consumer Discretionary | | | 23.4 | |
| Information Technology | | | 18.9 | |
| Industrials | | | 13.4 | |
| Materials | | | 5.8 | |
| Health Care | | | 4.8 | |
| Consumer Staples | | | 4.6 | |
| Energy | | | 2.4 | |
| Telecommunication Services | | | 1.5 | |
| Short-Term Investment Fund | | | 1.1 | |
| Other Assets/Liabilities (Net) | | | 0.0 | |
| Total | | | 100.0 | % |
| Touchstone Large Company Growth Fund |
| Sector Allocation* | | (% of Net Assets) | |
| Information Technology | | | 52.4 | % |
| Health Care | | | 16.4 | |
| Financials | | | 12.5 | |
| Consumer Discretionary | | | 11.0 | |
| Consumer Staples | | | 3.8 | |
| Industrials | | | 3.6 | |
| Short-Term Investment Funds | | | 1.6 | |
| Other Assets/Liabilities (Net) | | | (1.3 | ) |
| Total | | | 100.0 | % |
* Sector classifications are based upon the Global Industry Classification Standard (GICS®).
Tabular Presentation of Portfolios of Investments (Unaudited) (Continued)
| Touchstone Ohio Tax-Free Bond Fund |
| Credit Quality* | | (% of Fixed Income Securities) | |
| AAA/Aaa | | | 9.2 | % |
| AA/Aa | | | 65.4 | |
| A/A | | | 20.8 | |
| BBB/Baa | | | 3.8 | |
| Not Rated | | | 0.8 | |
| Total | | | 100.0 | % |
| Portfolio Allocation | | (% of Net Assets) | |
| Fixed Rate Revenue Bonds | | | 63.2 | % |
| Pre-refunded/Escrowed to Maturity | | | 18.7 | |
| General Obligation Bonds | | | 15.4 | |
| Variable Rate Demand Notes | | | 2.1 | |
| Other Assets/Liabilities (Net) | | | 0.6 | |
| Total | | | 100.0 | % |
| Touchstone Value Fund |
| Sector Allocation** | | (% of Net Assets) | |
| Financials | | | 18.7 | % |
| Health Care | | | 18.3 | |
| Energy | | | 17.0 | |
| Information Technology | | | 11.5 | |
| Consumer Discretionary | | | 11.3 | |
| Industrials | | | 8.8 | |
| Materials | | | 5.9 | |
| Consumer Staples | | | 4.2 | |
| Utilities | | | 1.2 | |
| Telecommunication Services | | | 0.6 | |
| Short-Term Investment Fund | | | 2.4 | |
| Other Assets/Liabilities (Net) | | | 0.1 | |
| Total | | | 100.0 | % |
| Touchstone Small Cap Value Opportunities Fund | | | |
| Sector Allocation** | | (% of Net Assets) | |
| Financials | | | 33.4 | % |
| Industrials | | | 15.8 | |
| Consumer Discretionary | | | 13.2 | |
| Information Technology | | | 11.3 | |
| Real Estate | | | 7.1 | |
| Health Care | | | 5.6 | |
| Energy | | | 5.1 | |
| Consumer Staples | | | 3.6 | |
| Utilities | | | 2.0 | |
| Materials | | | 1.7 | |
| Telecommunication Services | | | 1.7 | |
| Short-Term Investment Fund | | | 0.1 | |
| Other Assets/Liabilities (Net) | | | (0.6 | ) |
| Total | | | 100.0 | % |
| * | Credit quality ratings are from Standard & Poor’s (“S&P”) and Moody’s Investors Service (“Moody’s”). If agency ratings differ, the higher rating will be used. Where no rating has been assigned, it may be for reasons unrelated to the creditworthiness of the issuer. |
| ** | Sector classifications are based upon the Global Industry Classification Standard (GICS®). |
Portfolio of Investments
Touchstone Credit Opportunities Fund – June 30, 2018
| Principal | | | | | Market | |
| Amount | | | | | Value | |
| | | | | | | |
| | | | | Corporate Bonds — 79.0% | | | | |
| | | | | | | | | |
| | | | | Consumer Discretionary — 15.2% | | | | |
| $ | 524,000 | | | Altice Luxembourg SA (Luxembourg), | | | | |
| | | | | 144a, 7.625%, 2/15/25 | | $ | 482,080 | |
| | 480,000 | | | Altice Luxembourg SA (Luxembourg), | | | | |
| | | | | 144a, 7.750%, 5/15/22 | | | 464,400 | |
| | 500,000 | | | Altice US Finance I Corp., 144a, | | | | |
| | | | | 5.375%, 7/15/23 | | | 497,500 | |
| | 55,000 | | | Aramark Services, Inc., 144a, | | | | |
| | | | | 5.000%, 2/1/28 | | | 52,525 | |
| | 230,000 | | | Boyd Gaming Corp., 6.375%, 4/1/26 | | | 232,875 | |
| | 300,000 | | | Cablevision Systems Corp., | | | | |
| | | | | 5.875%, 9/15/22 | | | 297,750 | |
| | 110,000 | | | Carlson Travel, Inc., 144a, | | | | |
| | | | | 6.750%, 12/15/23 | | | 107,800 | |
| | 100,000 | | | CSC Holdings LLC, 5.250%, 6/1/24 | | | 94,500 | |
| | 140,000 | | | Golden Nugget, Inc., 144a, | | | | |
| | | | | 6.750%, 10/15/24 | | | 140,025 | |
| | 550,000 | | | Hillman Group, Inc. (The), 144a, | | | | |
| | | | | 6.375%, 7/15/22 | | | 526,625 | |
| | 550,000 | | | IRB Holding Corp., 144a, | | | | |
| | | | | 6.750%, 2/15/26 | | | 525,250 | |
| | 125,000 | | | JC Penney Corp., Inc., 144a, | | | | |
| | | | | 5.875%, 7/1/23 | | | 117,188 | |
| | 60,000 | | | Jeld-Wen, Inc., 144a, 4.625%, 12/15/25 | | | 57,150 | |
| | 550,000 | | | Jeld-Wen, Inc., 144a, 4.875%, 12/15/27 | | | 511,500 | |
| | 101,000 | | | L Brands, Inc., 6.875%, 11/1/35 | | | 89,890 | |
| | 145,000 | | | MGM Resorts International, | | | | |
| | | | | 5.750%, 6/15/25 | | | 144,775 | |
| | 261,000 | | | Mohegan Gaming & Entertainment, | | | | |
| | | | | 144a, 7.875%, 10/15/24 | | | 246,645 | |
| | 77,000 | | | PetSmart, Inc., 144a, 5.875%, 6/1/25 | | | 59,298 | |
| | 714,000 | | | Sabre GLBL, Inc., 144a, | | | | |
| | | | | 5.250%, 11/15/23(A) | | | 718,448 | |
| | 600,000 | | | Seminole Hard Rock Entertainment, | | | | |
| | | | | Inc. / Seminole Hard Rock | | | | |
| | | | | International LLC, 144a, | | | | |
| | | | | 5.875%, 5/15/21 | | | 603,000 | |
| | 300,000 | | | Sinclair Television Group, Inc., 144a, | | | | |
| | | | | 5.625%, 8/1/24 | | | 297,750 | |
| | 557,000 | | | Six Flags Entertainment Corp., 144a, | | | | |
| | | | | 4.875%, 7/31/24 | | | 542,379 | |
| | 250,000 | | | Six Flags Entertainment Corp., 144a, | | | | |
| | | | | 5.500%, 4/15/27 | | | 242,740 | |
| | 131,000 | | | Station Casinos LLC, 144a, | | | | |
| | | | | 5.000%, 10/1/25 | | | 123,140 | |
| | 295,000 | | | Summit Materials LLC / Summit | | | | |
| | | | | Materials Finance Corp., | | | | |
| | | | | 6.125%, 7/15/23 | | | 299,425 | |
| | 500,000 | | | Tribune Media Co., 5.875%, 7/15/22(A) | | | 504,625 | |
| | | | | | | | 7,979,283 | |
| | | | | | | | | |
| | | | | Telecommunication Services — 13.7% | | | | |
| | 255,000 | | | AMC Networks, Inc., 4.750%, 8/1/25 | | | 245,121 | |
| | 350,000 | | | Block Communications, Inc., 144a, | | | | |
| | | | | 6.875%, 2/15/25 | | | 349,125 | |
| | 675,000 | | | CCO Holdings LLC / CCO Holdings | | | | |
| | | | | Capital Corp., 144a, 5.000%, 2/1/28 | | | 617,625 | |
| | 190,000 | | | CCO Holdings LLC / CCO Holdings | | | | |
| | | | | Capital Corp., 144a, 5.125%, 5/1/27 | | | 177,769 | |
| | 101,000 | | | CenturyLink, Inc., 5.625%, 4/1/25† | | | 95,445 | |
| | 365,000 | | | Digicel Group Ltd. (Bermuda), 144a, | | | | |
| | | | | 8.250%, 9/30/20 | | | 275,575 | |
| | 500,000 | | | Digicel Ltd. (Bermuda), 144a, | | | | |
| | | | | 6.000%, 4/15/21 | | | 453,125 | |
| | 230,000 | | | Frontier Communications Corp., | | | | |
| | | | | 11.000%, 9/15/25 | | | 183,931 | |
| | 50,000 | | | Frontier Communications Corp., 144a, | | | | |
| | | | | 8.500%, 4/1/26 | | | 48,250 | |
| | 360,000 | | | Gray Television, Inc., 144a, | | | | |
| | | | | 5.125%, 10/15/24 | | | 344,592 | |
| | 380,000 | | | Inmarsat Finance PLC (United | | | | |
| | | | | Kingdom), 144a, 6.500%, 10/1/24 | | | 380,950 | |
| | 120,000 | | | Intelsat Jackson Holdings SA | | | | |
| | | | | (Luxembourg), 144a, | | | | |
| | | | | 8.000%, 2/15/24 | | | 126,000 | |
| | 275,000 | | | Lee Enterprises, Inc., 144a, | | | | |
| | | | | 9.500%, 3/15/22 | | | 287,031 | |
| | 500,000 | | | Level 3 Financing, Inc., | | | | |
| | | | | 5.375%, 1/15/24 | | | 489,750 | |
| | 385,000 | | | Netflix, Inc., 144a, 4.875%, 4/15/28 | | | 366,970 | |
| | 449,000 | | | Nexstar Broadcasting, Inc., 144a, | | | | |
| | | | | 5.625%, 8/1/24 | | | 434,408 | |
| | 413,000 | | | Sinclair Television Group, Inc., 144a, | | | | |
| | | | | 5.125%, 2/15/27 | | | 379,960 | |
| | 125,000 | | | Sinclair Television Group, Inc., 144a, | | | | |
| | | | | 5.875%, 3/15/26 | | | 121,562 | |
| | 160,000 | | | Sirius XM Radio, Inc., 144a, | | | | |
| | | | | 5.000%, 8/1/27 | | | 149,800 | |
| | 300,000 | | | Sirius XM Radio, Inc., 144a, | | | | |
| | | | | 5.375%, 7/15/26(A) | | | 288,750 | |
| | 443,000 | | | Sprint Corp., 7.625%, 2/15/25 | | | 451,864 | |
| | 300,000 | | | T-Mobile USA, Inc., 4.750%, 2/1/28 | | | 277,875 | |
| | 200,000 | | | Townsquare Media, Inc., 144a, | | | | |
| | | | | 6.500%, 4/1/23 | | | 180,000 | |
| | 260,000 | | | Videotron Ltd. (Canada), 144a, | | | | |
| | | | | 5.125%, 4/15/27 | | | 252,252 | |
| | 228,000 | | | Wind Tre SpA (Italy), 144a, | | | | |
| | | | | 5.000%, 1/20/26 | | | 180,690 | |
| | | | | | | | 7,158,420 | |
| | | | | | | | | |
| | | | | Energy — 10.1% | | | | |
| | 310,000 | | | Alta Mesa Holdings LP / Alta Mesa | | | | |
| | | | | Finance Services Corp., | | | | |
| | | | | 7.875%, 12/15/24 | | | 328,213 | |
| | 145,000 | | | Calfrac Holdings LP, 144a, | | | | |
| | | | | 8.500%, 6/15/26 | | | 144,275 | |
| | 179,000 | | | California Resources Corp., 144a, | | | | |
| | | | | 8.000%, 12/15/22 | | | 162,442 | |
| | 298,000 | | | Extraction Oil & Gas, Inc., 144a, | | | | |
| | | | | 5.625%, 2/1/26 | | | 285,353 | |
| | 63,000 | | | Extraction Oil & Gas, Inc., 144a, | | | | |
| | | | | 7.375%, 5/15/24 | | | 65,992 | |
Touchstone Credit Opportunities Fund (Continued)
| Principal | | | | | Market | |
| Amount | | | | | Value | |
| | | | | | | |
| | | | | Corporate Bonds — 79.0% (Continued) | | | | |
| | | | | | | | | |
| | | | | Energy — (Continued) | | | | |
| $ | 995,000 | | | FTS International, Inc., 6.250%, 5/1/22 | | $ | 1,003,656 | |
| | 106,000 | | | Great Western Petroleum LLC / Great | | | | |
| | | | | Western Finance Corp., 144a, | | | | |
| | | | | 9.000%, 9/30/21 | | | 108,120 | |
| | 310,000 | | | MEG Energy Corp. (Canada), 144a, | | | | |
| | | | | 6.375%, 1/30/23 | | | 288,300 | |
| | 210,000 | | | MEG Energy Corp. (Canada), 144a, | | | | |
| | | | | 7.000%, 3/31/24 | | | 195,825 | |
| | 250,000 | | | Murphy Oil Corp., 6.875%, 8/15/24 | | | 262,500 | |
| | 309,000 | | | Murray Energy Corp., 144a, | | | | |
| | | | | 12.000%, 4/15/24 | | | 258,015 | |
| | 99,000 | | | Parsley Energy LLC / Parsley Finance | | | | |
| | | | | Corp., 144a, 5.375%, 1/15/25 | | | 98,258 | |
| | 500,000 | | | Parsley Energy LLC / Parsley Finance | | | | |
| | | | | Corp., 144a, 6.250%, 6/1/24 | | | 518,750 | |
| | 115,000 | | | Peabody Energy Corp., 144a, | | | | |
| | | | | 6.000%, 3/31/22 | | | 116,679 | |
| | 56,000 | | | Rowan Cos., Inc., 7.375%, 6/15/25 | | | 54,180 | |
| | 220,000 | | | SRC Energy, Inc., 144a, | | | | |
| | | | | 6.250%, 12/1/25 | | | 219,725 | |
| | 207,000 | | | Summit Midstream Holdings LLC / | | | | |
| | | | | Summit Midstream Finance Corp., | | | | |
| | | | | 5.500%, 8/15/22 | | | 203,378 | |
| | 390,000 | | | Summit Midstream Holdings LLC / | | | | |
| | | | | Summit Midstream Finance Corp., | | | | |
| | | | | 5.750%, 4/15/25 | | | 370,500 | |
| | 89,000 | | | Targa Resources Partners LP / Targa | | | | |
| | | | | Resources Partners Finance Corp., | | | | |
| | | | | 144a, 5.875%, 4/15/26 | | | 89,668 | |
| | 50,000 | | | Whiting Petroleum Corp., | | | | |
| | | | | 5.750%, 3/15/21 | | | 51,098 | |
| | 239,000 | | | Whiting Petroleum Corp., | | | | |
| | | | | 6.250%, 4/1/23 | | | 244,975 | |
| | 80,000 | | | Whiting Petroleum Corp., 144a, | | | | |
| | | | | 6.625%, 1/15/26 | | | 82,400 | |
| | 133,000 | | | WildHorse Resource Development | | | | |
| | | | | Corp., 144a, 6.875%, 2/1/25 | | | 135,494 | |
| | | | | | | | 5,287,796 | |
| | | | | | | | | |
| | | | | Materials — 9.2% | | | | |
| | 195,000 | | | ArcelorMittal (Luxembourg), | | | | |
| | | | | 7.000%, 10/15/39 | | | 223,899 | |
| | 330,000 | | | ARD Finance SA (Luxembourg), | | | | |
| | | | | 7.125%, 9/15/23(B) | | | 330,825 | |
| | 145,000 | | | Ardagh Packaging Finance PLC / | | | | |
| | | | | Ardagh Holdings USA, Inc. (Ireland), | | | | |
| | | | | 144a, 6.000%, 2/15/25 | | | 141,194 | |
| | 125,000 | | | BWAY Holding Co., 144a, | | | | |
| | | | | 7.250%, 4/15/25 | | | 121,875 | |
| | 155,000 | | | CF Industries, Inc., 5.150%, 3/15/34 | | | 143,762 | |
| | 464,000 | | | Constellium NV (Netherlands), 144a, | | | | |
| | | | | 5.750%, 5/15/24 | | | 448,920 | |
| | 23,000 | | | Constellium NV (Netherlands), 144a, | | | | |
| | | | | 5.875%, 2/15/26 | | | 22,195 | |
| | 490,000 | | | Crown Americas LLC / Crown | | | | |
| | | | | Americas Capital Corp. VI, 144a, | | | | |
| | | | | 4.750%, 2/1/26 | | | 465,500 | |
| | 200,000 | | | First Quantum Minerals Ltd. (Canada), | | | | |
| | | | | 144a, 6.875%, 3/1/26 | | | 191,500 | |
| | 203,000 | | | First Quantum Minerals Ltd. (Canada), | | | | |
| | | | | 144a, 7.500%, 4/1/25 | | | 200,341 | |
| | 260,000 | | | Freeport-McMoRan, Inc., | | | | |
| | | | | 5.400%, 11/14/34(A) | | | 235,950 | |
| | 160,000 | | | Freeport-McMoRan, Inc., | | | | |
| | | | | 5.450%, 3/15/43 | | | 140,352 | |
| | 171,000 | | | HB Fuller Co., 4.000%, 2/15/27 | | | 153,472 | |
| | 300,000 | | | Hecla Mining Co., 6.875%, 5/1/21 | | | 303,177 | |
| | 37,000 | | | Hudbay Minerals, Inc. (Canada), 144a, | | | | |
| | | | | 7.250%, 1/15/23 | | | 38,110 | |
| | 163,000 | | | Kraton Polymers LLC / Kraton | | | | |
| | | | | Polymers Capital Corp., 144a, | | | | |
| | | | | 7.000%, 4/15/25 | | | 168,705 | |
| | 575,000 | | | New Gold, Inc. (Canada), 144a, | | | | |
| | | | | 6.250%, 11/15/22 | | | 580,750 | |
| | 120,000 | | | Olin Corp., 5.000%, 2/1/30 | | | 113,400 | |
| | 221,000 | | | Platform Specialty Products Corp., | | | | |
| | | | | 144a, 5.875%, 12/1/25 | | | 216,028 | |
| | 60,000 | | | Trinseo Materials Operating SCA / | | | | |
| | | | | Trinseo Materials Finance, Inc. | | | | |
| | | | | (Luxembourg), 144a, | | | | |
| | | | | 5.375%, 9/1/25 | | | 59,475 | |
| | 256,000 | | | Tronox Finance PLC (United | | | | |
| | | | | Kingdom), 144a, 5.750%, 10/1/25 | | | 248,640 | |
| | 255,000 | | | Venator Finance SARL / Venator | | | | |
| | | | | Materials LLC, 144a, | | | | |
| | | | | 5.750%, 7/15/25 | | | 243,525 | |
| | | | | | | | 4,791,595 | |
| | | | | | | | | |
| | | | | Information Technology — 8.0% | | | | |
| | 52,000 | | | Fair Isaac Corp., 144a, 5.250%, 5/15/26 | | | 52,195 | |
| | 395,000 | | | Genesys Telecommunications | | | | |
| | | | | Laboratories, Inc./Greeneden Lux 3 | | | | |
| | | | | SARL/Greeneden US Ho, 144a, | | | | |
| | | | | 10.000%, 11/30/24 | | | 440,869 | |
| | 220,000 | | | j2 Cloud Services LLC / j2 Global | | | | |
| | | | | Co.-Obligor, Inc., 144a, | | | | |
| | | | | 6.000%, 7/15/25 | | | 222,750 | |
| | 500,000 | | | NCR Corp., 5.000%, 7/15/22 | | | 495,000 | |
| | 495,000 | | | Nielsen Co. Luxembourg SARL (The) | | | | |
| | | | | (Luxembourg), 144a, | | | | |
| | | | | 5.000%, 2/1/25(A) | | | 471,488 | |
| | 500,000 | | | Nielsen Finance LLC / Nielsen Finance | | | | |
| | | | | Co., 144a, 5.000%, 4/15/22 | | | 491,300 | |
| | 320,000 | | | Radiate Holdco LLC / Radiate Finance, | | | | |
| | | | | Inc., 144a, 6.625%, 2/15/25 | | | 292,800 | |
| | 647,000 | | | Sensata Technologies BV | | | | |
| | | | | (Netherlands), 144a, | | | | |
| | | | | 5.000%, 10/1/25 | | | 651,852 | |
| | 410,000 | | | Solera LLC / Solera Finance, Inc., 144a, | | | | |
| | | | | 10.500%, 3/1/24 | | | 455,358 | |
Touchstone Credit Opportunities Fund (Continued)
| Principal | | | | | Market | |
| Amount | | | | | Value | |
| | | | | | | |
| | | | | Corporate Bonds — 79.0% (Continued) | | | | |
| | | | | | | | | |
| | | | | Information Technology — (Continued) | | | | |
| $ | 434,000 | | | TIBCO Software, Inc., 144a, | | | | |
| | | | | 11.375%, 12/1/21 | | $ | 468,720 | |
| | 200,000 | | | Veritas US, Inc. / Veritas Bermuda Ltd., | | | | |
| | | | | 144a, 10.500%, 2/1/24 | | | 164,000 | |
| | | | | | | | 4,206,332 | |
| | | | | | | | | |
| | | | | Health Care — 7.2% | | | | |
| | 18,000 | | | Acadia Healthcare Co., Inc., | | | | |
| | | | | 6.500%, 3/1/24 | | | 18,450 | |
| | 443,000 | | | BioScrip, Inc., 8.875%, 2/15/21† | | | 423,065 | |
| | 215,000 | | | Centene Corp., 4.750%, 1/15/25 | | | 213,925 | |
| | 130,000 | | | Centene Corp., 6.125%, 2/15/24(A) | | | 136,988 | |
| | 246,000 | | | DJO Finance LLC / DJO Finance Corp., | | | | |
| | | | | 10.750%, 4/15/20 | | | 240,465 | |
| | 460,000 | | | DJO Finco, Inc. / DJO Finance LLC / | | | | |
| | | | | DJO Finance Corp., 144a, | | | | |
| | | | | 8.125%, 6/15/21 | | | 465,612 | |
| | 322,000 | | | Envision Healthcare Corp., | | | | |
| | | | | 5.625%, 7/15/22 | | | 326,226 | |
| | 102,000 | | | Envision Healthcare Corp., 144a, | | | | |
| | | | | 6.250%, 12/1/24 | | | 108,630 | |
| | 100,000 | | | HCA, Inc., 7.690%, 6/15/25 | | | 108,500 | |
| | 250,000 | | | Hill-Rom Holdings, Inc., 144a, | | | | |
| | | | | 5.000%, 2/15/25 | | | 242,500 | |
| | 295,000 | | | Molina Healthcare, Inc., | | | | |
| | | | | 5.375%, 11/15/22 | | | 296,844 | |
| | 125,000 | | | Molina Healthcare, Inc., 144a, | | | | |
| | | | | 4.875%, 6/15/25 | | | 121,250 | |
| | 220,000 | | | Tenet Healthcare Corp., 144a, | | | | |
| | | | | 4.625%, 7/15/24 | | | 208,384 | |
| | 444,000 | | | Tenet Healthcare Corp., 144a, | | | | |
| | | | | 7.000%, 8/1/25 | | | 440,670 | |
| | 199,000 | | | Valeant Pharmaceuticals International, | | | | |
| | | | | Inc. (Canada), 144a, 5.500%, 3/1/23 | | | 185,070 | |
| | 110,000 | | | Valeant Pharmaceuticals International, | | | | |
| | | | | Inc. (Canada), 144a, 5.625%, 12/1/21 | | | 108,212 | |
| | 100,000 | | | Valeant Pharmaceuticals International, | | | | |
| | | | | Inc. (Canada), 144a, 6.500%, 3/15/22 | | | 103,500 | |
| | | | | | | | 3,748,291 | |
| | | | | | | | | |
| | | | | Financials — 5.7% | | | | |
| | 558,000 | | | Acrisure LLC / Acrisure Finance, Inc., | | | | |
| | | | | 144a, 7.000%, 11/15/25 | | | 507,780 | |
| | 488,000 | | | ASP AMC Merger Sub, Inc., 144a, | | | | |
| | | | | 8.000%, 5/15/25 | | | 405,040 | |
| | 750,000 | | | Blue Racer Midstream LLC / Blue Racer | | | | |
| | | | | Finance Corp., 144a, | | | | |
| | | | | 6.125%, 11/15/22(A) | | | 757,500 | |
| | 25,000 | | | Fidelity & Guaranty Life Holdings, Inc., | | | | |
| | | | | 144a, 5.500%, 5/1/25 | | | 24,375 | |
| | 225,000 | | | GEO Group, Inc. (The), | | | | |
| | | | | 6.000%, 4/15/26 | | | 218,250 | |
| | 262,000 | | | Iron Mountain, Inc., 144a, | | | | |
| | | | | 5.250%, 3/15/28 | | | 242,455 | |
| | 290,000 | | | Quicken Loans, Inc., 144a, | | | | |
| | | | | 5.250%, 1/15/28 | | | 267,467 | |
| | 428,000 | | | Realogy Group LLC / Realogy | | | | |
| | | | | Co.-Issuer Corp., 144a, | | | | |
| | | | | 4.875%, 6/1/23 | | | 402,320 | |
| | 134,000 | | | Travelport Corporate Finance PLC | | | | |
| | | | | (United Kingdom), 144a, | | | | |
| | | | | 6.000%, 3/15/26 | | | 135,005 | |
| | | | | | | | 2,960,192 | |
| | | | | | | | | |
| | | | | Industrials — 5.3% | | | | |
| | 462,000 | | | Air Medical Group Holdings, Inc., 144a, | | | | |
| | | | | 6.375%, 5/15/23 | | | 429,660 | |
| | 30,000 | | | BBA US Holdings, Inc., 144a, | | | | |
| | | | | 5.375%, 5/1/26 | | | 30,113 | |
| | 165,000 | | | Bombardier, Inc. (Canada), 144a, | | | | |
| | | | | 6.000%, 10/15/22 | | | 164,332 | |
| | 189,000 | | | Bombardier, Inc. (Canada), 144a, | | | | |
| | | | | 7.500%, 12/1/24 | | | 198,922 | |
| | 111,000 | | | Builders FirstSource, Inc., 144a, | | | | |
| | | | | 5.625%, 9/1/24 | | | 107,948 | |
| | 81,000 | | | BWX Technologies, Inc., 144a, | | | | |
| | | | | 5.375%, 7/15/26 | | | 82,013 | |
| | 150,000 | | | Grinding Media, Inc. / Moly-Cop | | | | |
| | | | | AltaSteel Ltd., 144a, | | | | |
| | | | | 7.375%, 12/15/23 | | | 156,375 | |
| | 250,000 | | | KAR Auction Services, Inc., 144a, | | | | |
| | | | | 5.125%, 6/1/25 | | | 238,750 | |
| | 19,000 | | | Mueller Water Products, Inc., 144a, | | | | |
| | | | | 5.500%, 6/15/26 | | | 19,142 | |
| | 235,000 | | | Novelis Corp., 144a, 5.875%, 9/30/26 | | | 225,012 | |
| | 230,000 | | | RBS Global, Inc. / Rexnord LLC, 144a, | | | | |
| | | | | 4.875%, 12/15/25 | | | 216,200 | |
| | 66,000 | | | Standard Industries, Inc./NJ, 144a, | | | | |
| | | | | 4.750%, 1/15/28 | | | 60,555 | |
| | 69,000 | | | TransDigm, Inc., 6.000%, 7/15/22 | | | 69,366 | |
| | 250,000 | | | TransDigm, Inc., 6.500%, 5/15/25 | | | 252,812 | |
| | 150,000 | | | Tutor Perini Corp., 144a, | | | | |
| | | | | 6.875%, 5/1/25 | | | 150,188 | |
| | 15,000 | | | United Rentals North America, Inc., | | | | |
| | | | | 4.875%, 1/15/28 | | | 13,889 | |
| | 375,000 | | | United Rentals North America, Inc., | | | | |
| | | | | 5.875%, 9/15/26 | | | 378,750 | |
| | | | | | | | 2,794,027 | |
| | | | | | | | | |
| | | | | Consumer Staples — 2.6% | | | | |
| | 380,000 | | | B&G Foods, Inc., 5.250%, 4/1/25† | | | 358,150 | |
| | 310,000 | | | Centene Escrow I Corp., 144a, | | | | |
| | | | | 5.375%, 6/1/26 | | | 314,070 | |
| | 120,000 | | | Clearwater Seafoods, Inc. (Canada), | | | | |
| | | | | 144a, 6.875%, 5/1/25 | | | 115,200 | |
| | 115,000 | | | Cott Holdings, Inc., 144a, | | | | |
| | | | | 5.500%, 4/1/25 | | | 111,838 | |
| | 155,000 | | | First Quality Finance Co., Inc., 144a, | | | | |
| | | | | 5.000%, 7/1/25 | | | 141,825 | |
| | 113,000 | | | Rite Aid Corp., 144a, 6.125%, 4/1/23 | | | 114,582 | |
| | 245,000 | | | Simmons Foods, Inc., 144a, | | | | |
| | | | | 5.750%, 11/1/24 | | | 212,538 | |
| | | | | | | | 1,368,203 | |
Touchstone Credit Opportunities Fund (Continued)
| Principal | | | | | Market | |
| Amount | | | | | Value | |
| | | | | | | |
| | | | | Corporate Bonds — 79.0% (Continued) | | | | |
| | | | | | | | | |
| | | | | Utilities — 1.0% | | | | |
| $ | 330,000 | | | NGL Energy Partners LP / NGL Energy | | | | |
| | | | | Finance Corp., 7.500%, 11/1/23 | | $ | 333,300 | |
| | 205,000 | | | Vistra Energy Corp., 7.625%, 11/1/24 | | | 218,581 | |
| | | | | | | | 551,881 | |
| | | | | | | | | |
| | | | | Real Estate — 1.0% | | | | |
| | 471,000 | | | ESH Hospitality, Inc. REIT, 144a, | | | | |
| | | | | 5.250%, 5/1/25 | | | 454,515 | |
| | 62,000 | | | MGM Growth Properties Operating | | | | |
| | | | | Partnership LP / MGP Finance | | | | |
| | | | | Co.-Issuer, Inc., 4.500%, 1/15/28 | | | 56,265 | |
| | | | | | | | 510,780 | |
| | | | | Total Corporate Bonds | | $ | 41,356,800 | |
| | | | | | | | | |
| | | | | Bank Loans(C) — 11.1% | | | | |
| | | | | | | | | |
| | | | | Industrials — 2.7% | | | | |
| | 299,526 | | | Air Medical Group Holdings Inc, Initial | | | | |
| | | | | Term Loan (LIBOR +3.250%), | | | | |
| | | | | 5.280%, 4/28/22 | | | 290,603 | |
| | 152,095 | | | Cumulus Media New Holdings Inc., | | | | |
| | | | | Exit Term Loan (LIBOR +4.500%), | | | | |
| | | | | 6.600%, 5/13/22 | | | 150,802 | |
| | 87,453 | | | Engility Corporation, New Term B-2 | | | | |
| | | | | Loan (LIBOR +2.750%), 4.843%, | | | | |
| | | | | 8/14/23 | | | 87,220 | |
| | 56,835 | | | Envigo Laboratories Inc, First Lien | | | | |
| | | | | Dollar Term Loan (LIBOR +8.500%), | | | | |
| | | | | 10.840%, 10/28/21 | | | 56,835 | |
| | 443,491 | | | Forterra Finance LLC, Replacement | | | | |
| | | | | Term Loan (LIBOR +3.000%), | | | | |
| | | | | 5.094%, 10/25/23 | | | 413,462 | |
| | 133,241 | | | Sequa Mezzanine Holdings LLC, First | | | | |
| | | | | Lien Initial Term Loan (LIBOR | | | | |
| | | | | +5.000%), 7.046%, 11/28/21 | | | 133,407 | |
| | 171,438 | | | Sequa Mezzanine Holdings LLC, Initial | | | | |
| | | | | Loan (Second Lien) (LIBOR | | | | |
| | | | | +9.000%), 11.099%, 4/28/22 | | | 171,009 | |
| | 78,729 | | | Syniverse Holdings, Inc., Tranche Term | | | | |
| | | | | Loan (LIBOR+5.000%), 7.089%, | | | | |
| | | | | 3/9/23 | | | 78,565 | |
| | | | | | | | 1,381,903 | |
| | | | | | | | | |
| | | | | Energy — 1.9% | | | | |
| | 100,000 | | | California Resources Corp., Term Loan | | | | |
| | | | | (LIBOR +10.375%), 12.466%, | | | | |
| | | | | 12/31/21 | | | 110,500 | |
| | 96,739 | | | California Resources Corp., Term Loan | | | | |
| | | | | (LIBOR +4.750%), 6.838, 12/31/22 | | | 98,372 | |
| | 125,000 | | | Chesapeake Energy Corp, Class A | | | | |
| | | | | Loan (LIBOR +7.500%), 9.594%, | | | | |
| | | | | 8/23/21 | | | 130,651 | |
| | 34,217 | | | Emerald 2 Limited, Facility B1 (LIBOR | | | | |
| | | | | +4.000%), 6.334%, 5/14/21 | | | 34,131 | |
| | 66,998 | | | FTS International Inc, Initial Term Loan | | | | |
| | | | | (LIBOR +4.750%), 6.844%, 4/16/21 | | | 67,137 | |
| | 58,870 | | | Gulf Finance LLC, Tranche B Term Loan | | | | |
| | | | | (LIBOR +5.250%), 7.590%, 8/25/23 | | | 50,677 | |
| | 313,609 | | | Murray Energy Corporation, Term B-2 | | | | |
| | | | | Loan Non-PIK (LIBOR+7.250%), | | | | |
| | | | | 9.344%, 10/17/22 | | | 294,943 | |
| | 97,865 | | | Seadrill Operating LP (Seadrill Partners | | | | |
| | | | | Finco LLC), Initial Term Loan | | | | |
| | | | | (Marshall Islands) (LIBOR +6.000%), | | | | |
| | | | | 8.334%, 2/21/21 | | | 87,494 | |
| | 108,281 | | | Traverse Midstream Partners LLC, | | | | |
| | | | | Advance (LIBOR +4.000%), 6.340%, | | | | |
| | | | | 9/27/24 | | | 108,146 | |
| | 25,000 | | | Ultra Resources, Inc., Senior Secured | | | | |
| | | | | Term Loan, 4/12/24(D) | | | 22,984 | |
| | | | | | | | 1,005,035 | |
| | | | | | | | | |
| | | | | Health Care — 1.6% | | | | |
| | 352,985 | | | BPA Laboratories, Inc., Term Loan | | | | |
| | | | | (Second Lien) (LIBOR +7.750%), | | | | |
| | | | | 10.084%, 4/29/20 | | | 324,746 | |
| | 117,372 | | | General Nutrition Center, Inc., First in | | | | |
| | | | | last Out Term Loan (LIBOR+7.000%), | | | | |
| | | | | 9.100%, 12/31/22 | | | 120,976 | |
| | 136,271 | | | General Nutrition Centers, Inc., | | | | |
| | | | | Extended Term Loan B (LIBOR | | | | |
| | | | | +8.750%), 10.850%, 3/4/21 | | | 130,699 | |
| | 241,753 | | | Radnet Management Inc, Term B-1 | | | | |
| | | | | Loan (First Lien) (LIBOR +3.750%), | | | | |
| | | | | 6.500%, 6/30/23 | | | 242,208 | |
| | | | | | | | 818,629 | |
| | | | | | | | | |
| | | | | Telecommunication Services — 1.6% | | | | |
| | 42,151 | | | Applied Systems Inc, Second Lien | | | | |
| | | | | Initial Term Loan (LIBOR +7.000%), | | | | |
| | | | | 9.334%, 9/19/25 | | | 43,310 | |
| | 311,043 | | | Checkout Holding Corp, Term B Loan | | | | |
| | | | | (First Lien) (LIBOR +3.500%), 5.594%, | | | | |
| | | | | 4/9/21 | | | 194,402 | |
| | 104,402 | | | Infoblox, Inc., Refinancing Term Loan | | | | |
| | | | | (LIBOR+4.500%), 6.594%, 11/7/23 | | | 105,055 | |
| | 498,744 | | | WideOpenWest Finance LLC, | | | | |
| | | | | Refinancing Term B Loan, 8/18/23(D) | | | 475,053 | |
| | | | | | | | 817,820 | |
| | | | | | | | | |
| | | | | Financials — 1.5% | | | | |
| | 131,000 | | | Acrisure LLC, First Lien Term Loan B, | | | | |
| | | | | 11/22/23(D) | | | 129,854 | |
| | 427,946 | | | Asurion LLC, Second Lien | | | | |
| | | | | Replacement B-2 Term Loan (LIBOR | | | | |
| | | | | +6.000%), 8.094%, 8/4/25 | | | 433,830 | |
| | 234,668 | | | HUB International Ltd., Initial Term | | | | |
| | | | | Loan, 4/25/25(D) | | | 233,114 | |
| | | | | | | | 796,798 | |
| | | | | | | | | |
| | | | | Consumer Discretionary — 1.0% | | | | |
| | 194,968 | | | Academy Ltd, Initial Term Loan (LIBOR | | | | |
| | | | | +4.000%), 5.988%, 7/1/22 | | | 161,769 | |
Touchstone Credit Opportunities Fund (Continued)
| Principal | | | | | Market | |
| Amount | | | | | Value | |
| | | | | | | |
| | | | | Bank Loans(C) — 11.1% (Continued) | | | | |
| | | | | | | | | |
| | | | | Consumer Discretionary — (Continued) | | | | |
| $ | 166,376 | | | Jeld-Wen, Inc., Term B-4 Loan (LIBOR | | | | |
| | | | | +2.000%), 4.334%, 12/14/24 | | $ | 165,649 | |
| | 264,491 | | | Petco Animal Supplies Inc, Second | | | | |
| | | | | Amendment Term Loan (LIBOR | | | | |
| | | | | +3.250%), 5.609%, 1/26/23 | | | 190,434 | |
| | | | | | | | 517,852 | |
| | | | | | | | | |
| | | | | Information Technology — 0.5% | | | | |
| | 187,643 | | | Evergreen Skills Lux Sarl, First Lien | | | | |
| | | | | Initial Term Loan (LIBOR +4.750%), | | | | |
| | | | | 6.844%, 4/28/21 | | | 176,912 | |
| | 48,397 | | | Optiv Inc, First Lien Initial Term Loan | | | | |
| | | | | (LIBOR +3.250%), 5.313%, 2/1/24 | | | 46,945 | |
| | 49,874 | | | Veritas US Inc, New Dollar Term B Loan | | | | |
| | | | | (LIBOR +4.500%), 6.654%, 1/27/23 | | | 45,585 | |
| | | | | | | | 269,442 | |
| | | | | | | | | |
| | | | | Materials — 0.2% | | | | |
| | 114,167 | | | BWay Holding Company, Initial Term | | | | |
| | | | | Loan, 4/3/24(D) | | | 113,471 | |
| | | | | | | | | |
| | | | | Consumer Staples — 0.1% | | | | |
| | 46,533 | | | Energizer Holdings, Inc., First Lien | | | | |
| | | | | Term Loan B, 6/20/25(D) | | | 46,513 | |
| | 8,755 | | | Revlon Consumer Products Corp., | | | | |
| | | | | Initial Term B Loan (LIBOR+3.500%), | | | | |
| | | | | 5.838%, 9/7/23(D) | | | 6,742 | |
| | | | | | | | 53,255 | |
| | | | | Total Bank Loans | | $ | 5,774,205 | |
| | | | | | | | | |
| | | | | Asset-Backed Securities — 4.1% | | | | |
| | 500,000 | | | Bain Capital Credit CLO 2018-1, Ser | | | | |
| | | | | 2018-1A, Class SUB, (Cayman | | | | |
| | | | | Islands), 144a, 4/23/31(E) | | | 454,375 | |
| | 500,000 | | | Dryden XXVIII Senior Loan Fund, Ser | | | | |
| | | | | 2013-28A, Class B2LR, (Cayman | | | | |
| | | | | Islands), 144a, (3M LIBOR +6.450%), | | | | |
| | | | | 8.793%, 8/15/30(F) | | | 508,655 | |
| | 300,000 | | | Madison Park Funding XII Ltd., Ser | | | | |
| | | | | 2014-12A, Class SUB, (Cayman | | | | |
| | | | | Islands), 144a, 7/20/26(E) | | | 218,951 | |
| | 500,000 | | | OZLM XXI, Ser 2017-21A, Class SUB, | | | | |
| | | | | (Cayman Islands), 144a, 1/20/31(E) | | | 484,535 | |
| | 300,000 | | | Symphony CLO XVI Ltd., Ser 2015-16A, | | | | |
| | | | | Class D, (Cayman Islands), 144a, (3M | | | | |
| | | | | LIBOR +3.650%), 5.998%, 7/15/28(F) | | | 300,147 | |
| | 250,000 | | | Venture XVIII CLO Ltd., Ser 2014-18A, | | | | |
| | | | | Class SUB, (Cayman Islands), 144a, | | | | |
| | | | | 10/15/29(E) | | | 179,582 | |
| | | | | Total Asset-Backed Securities | | $ | 2,146,245 | |
| | | | | | | |
| | | | | | Market | |
| Shares | | | | | Value | |
| | | | | | | |
| | | | | Common Stocks — 1.7% | | | | |
| | | | | | | | | |
| | | | | Information Technology — 0.9% | | | | |
| | 461,722 | | | Eagle Topco Ltd.* | | $ | 182,807 | |
| | 8,386 | | | MModal LLC | | | 272,545 | |
| | | | | | | | 455,352 | |
| | | | | | | | | |
| | | | | Industrials — 0.0% | | | | |
| | 1,299 | | | Cumulus Media New Holdings | | | 19,160 | |
| | | | | | | | | |
| | | | | Health Care — 0.5% | | | | |
| | 15,600 | | | Hanger, Inc.* | | | 264,576 | |
| | | | | | | | | |
| | | | | Energy — 0.3% | | | | |
| | 74,381 | | | Trident, Class A Templar Restructure* | | | 74,381 | |
| | 11,748 | | | Trident, Templar Restructure* | | | 76,362 | |
| | | | | | | | 150,743 | |
| | | | | Total Common Stocks | | $ | 889,831 | |
| | | | | Number | | | | | | | |
| | | | | of | | | Notional | | | | |
| | | | | Contracts | | | Amount | | | | |
| | | | | | | | | | | | |
| Purchased Call Options — 0.0% | | | | | | | | | | | | |
| VIX, Strike @20.00, Exp 08/22(A) | | | 60 | | | $ | 96,540 | | | | 8,700 | |
| | | | | | | | | | | | | | | |
| Purchased Put Options — 0.1% | | | | | | | | | | | | |
| SPDR S&P 500 ETF Trust @ | | | | | | | | | | | | |
| 260.00, Exp 9/18(A) | | | 136 | | | | 3,689,408 | | | | 52,768 | |
| | | | | | | | | | | | | | | |
| | | Total Purchased Options | | | | | | | | | | $ | 61,468 | |
| Shares | | | | | | |
| | | | | | | |
| | | | | Warrants — 0.0% | | | | |
| | | | | | | | | |
| | | | | Health Care — 0.0% | | | | |
| | 1,179 | | | Envigo Laboratories, Inc. (Fka Bpa | | | | |
| | | | | Laboratories Inc.) Series A | | | | |
| | | | | Warrant(G)* | | | — | |
| | 1,889 | | | Envigo Laboratories, Inc. (Fka Bpa | | | | |
| | | | | Laboratories Inc.) Series B | | | | |
| | | | | Warrant(G)* | | | — | |
| | | | | Total Warrants | | $ | — | |
| | | | | | | | | |
| | | | | Short-Term Investment Funds — 7.8% | | | | |
| | 3,195,744 | | | Dreyfus Government Cash | | | | |
| | | | | Management, Institutional | | | | |
| | | | | Shares, 1.81%∞Ω | | | 3,195,744 | |
| | 903,254 | | | Invesco Government & Agency | | | | |
| | | | | Portfolio, Institutional Class, | | | | |
| | | | | 1.81%**∞Ω | | | 903,254 | |
| | | | | Total Short-Term Investment Funds | | $ | 4,098,998 | |
| | | | | | | | | |
| Total Long Positions —103.8% | | | | |
| (Cost $54,555,367) | | $ | 54,327,547 | |
Touchstone Credit Opportunities Fund (Continued)
| Principal | | | | | Market | |
| Amount | | | | | Value | |
| | | | | | | |
| | | | | Securities Sold Short — (0.6%) | | | | |
| | | | | | | | | |
| | | | | Corporate Bond — (0.6%) | | | | |
| | | | | | | | | |
| | | | | Financials — (0.6%) | | | | |
| $ | (350,000 | ) | | Uniti Group LP / Uniti Fiber | | | | |
| | | | | Holdings Inc / CSL Capital LLC, | | | | |
| | | | | 144a, 7.125%, 12/14/24 | | $ | (316,750 | ) |
| | | | | | | | | |
| Total Securities Sold Short | | | | |
| (Proceeds $318,500) | | $ | (316,750 | ) |
| | | Number | | | | | | | |
| | | of | | | Notional | | | | |
| | | Contracts | | | Amount | | | | |
| | | | | | | | | | |
| Written Options — (0.0%) | | | | | | | | | | | | |
| | | | | | | | | | | | | |
| Written Call Options — (0.0%) | | | | | | | | | | | | |
| VIX, Strike @ 25.00, Exp 08/22 | | | (60 | ) | | $ | (96,540 | ) | | | (5,400 | ) |
| | | | | | | | | | | | | |
| (Premiums received $(3,982)) | | | | | | | | | | $ | (5,400 | ) |
| | | | | | | | | | | | | |
| Total — 103.2% | | | | | | | | | | $ | 54,005,397 | |
| | | | | | | | | | | | | |
| Liabilities in Excess of Other Assets — (3.2%) | | | | | | | | | | | (1,670,854 | ) |
| Net Assets — 100.0% | | | | | | | | | | $ | 52,334,543 | |
| (A) | All or a portion of these securities are pledged as collateral for securities sold short and written options. The total value of the securities pledged as collateral as of June 30, 2018 was $2,009,678. |
| | |
| (B) | Represents a payment-in-kind (“PIK”) security, which may pay interest in additional principal amounts. |
| | |
| (C) | Bank loans pay interest at rates which adjust periodically unless otherwise indicated. The interest rates shown are the current interest rates as of June 30, 2018. |
| | |
| (D) | All or a portion of this position has not settled. Full contract rates do not take effect until settlement date. |
| | |
| (E) | Security has no stated coupon and is considered an equity position in the collateralized loan obligation (“CLO”). CLO equity investments are entitled to recurring distributions which are generally equal to the excess cash flow generated from the underlying investments after payment of the contractual payments to debt holders and fund expenses. |
| | |
| (F) | Variable rate security - Rate reflected is the rate in effect as of June 30, 2018. |
| (G) | Level 3 - For more information on valuation inputs, and their aggregation into the levels used in the table below, please refer to the security valuation section in the accompanying Notes to Financial Statements. |
| * | Non-income producing security. |
| ** | Represents collateral for securities loaned. |
| † | All or a portion of the security is on loan. The total market value of the securities on loan as of June 30, 2018 was $865,468. |
| Ω | Represents the 7-day SEC yield as of June 30, 2018. |
Portfolio Abbreviations:
CLO - Collateral Loan Obligations
ETF - Exchange-Traded Fund
LIBOR - London Interbank Offered Rate
LLC - Limited Liability Company
LP - Limited Partnership
PIK - Pay-in-Kind
PLC - Public Limited Company
REIT - Real Estate Investment Trust
SPDR - Standard & Poor's Depositary Receipt
144a - This is a restricted security that was sold in a transaction exempt from Rule 144a of the Securities Act of 1933. This security may be sold in transactions exempt from registration, normally to qualified institutional buyers. At June 30, 2018, these securities were valued at $ 31,456,306 or 60.1% of net assets. These securities were deemed liquid pursuant to procedures approved by the Board of Trustees.
Touchstone Credit Opportunities Fund (Continued)
Other Information:
The inputs or methodology used for valuing securities may not be an indication of the risk associated with investing in those securities. For more information on valuation inputs, and their aggregation into the levels used in the table below, please refer to the security valuation section in the accompanying Notes to Financial Statements.
| | | Valuation inputs at Reporting Date: | |
| Description | | Level 1 | | | Level 2 | | | Level 3 | | | Total | |
| | | | | | | | | | | | | |
| Assets: | | | | | | | | | | | | | | | | |
| Corporate Bonds | | $ | — | | | $ | 41,356,800 | | | $ | — | | | $ | 41,356,800 | |
| Bank Loans | | | — | | | | 5,774,205 | | | | — | | | | 5,774,205 | |
| Asset-Backed Securities | | | — | | | | 2,146,245 | | | | — | | | | 2,146,245 | |
| Common Stocks | | | 264,576 | | | | 625,255 | | | | — | | | | 889,831 | |
| Purchased Call Options Equity Contracts | | | 8,700 | | | | — | | | | — | | | | 8,700 | |
| Purchased Put Options Equity Contracts | | | 52,768 | | | | — | | | | — | | | | 52,768 | |
| Warrants | | | — | | | | — | | | | — | | | | — | |
| Short-Term Investment Funds | | | 4,098,998 | | | | — | | | | — | | | | 4,098,998 | |
| Total Assets | | $ | 4,425,042 | | | $ | 49,902,505 | | | $ | — | | | $ | 54,327,547 | |
| Liabilities: | | | | | | | | | | | | | | | | |
| Securities Sold Short | | | | | | | | | | | | | | | | |
| Corporate Bond | | $ | — | | | $ | (316,750 | ) | | $ | — | | | $ | (316,750 | ) |
| Written Call Options Equity Contracts | | | (5,400 | ) | | | — | | | | — | | | | (5,400 | ) |
| Total Liabilities | | $ | (5,400 | ) | | $ | (316,750 | ) | | $ | — | | | $ | (322,150 | ) |
| Total | | $ | 4,419,642 | | | $ | 49,585,755 | | | $ | — | | | $ | 54,005,397 | |
At June 30, 2018, equity securities valued at $150,743 were transferred from Level 1 to Level 2 and an equity security valued at $182,807 was transferred from Level 3 to Level 2. Transfers from Level 1 to Level 2 are due to inactive markets. Transfers from Level 3 to Level 2 are due to the availability of other significant observable inputs for the security.
Measurements Using Unobservable Inputs (Level 3)
| | | Common | |
| Assets | | Stocks | |
| | | | |
| Beginning balance, June 30, 2017 | | $ | — | |
| Bank loan restructure | | | 110,567 | |
| Net realized gain (loss) | | | (6,054 | ) |
| Change in unrealized appreciation (depreciation) | | | 78,294 | |
| Transfer out of Level 3 | | | (182,807 | ) |
| Ending balance, June 30, 2018 | | $ | — | |
See accompanying Notes to Financial Statements.
Portfolio of Investments
Touchstone International Growth Opportunities Fund – June 30, 2018
| | | | | | Market | |
| | | Shares | | | Value | |
| | | | | | | |
| Common Stocks — 99.6% | | | | | | | | |
| | | | | | | | | |
| China — 40.8% | | | | | | | | |
| | | | | | | | | |
| Consumer Discretionary — 10.3% | | | | | | | | |
| ANTA Sports Products Ltd. | | | 126,000 | | | $ | 664,437 | |
| Ctrip.com International Ltd. ADR* | | | 30,180 | | | | 1,437,473 | |
| New Oriental Education & | | | | | | | | |
| Technology Group, Inc. ADR | | | 14,895 | | | | 1,409,961 | |
| | | | | | | | | |
| Consumer Staples — 1.1% | | | | | | | | |
| Wuliangye Yibin Co. Ltd. - Class A* | | | 32,363 | | | | 369,681 | |
| | | | | | | | | |
| Industrials — 0.7% | | | | | | | | |
| Han's Laser Technology Industry | | | | | | | | |
| Group Co. Ltd. - Class A | | | 27,941 | | | | 223,590 | |
| | | | | | | | | |
| Information Technology — 25.2% | | | | | | | | |
| 58.com, Inc. ADR* | | | 6,650 | | | | 461,111 | |
| Alibaba Group Holding Ltd. ADR* | | | 12,685 | | | | 2,353,448 | |
| Autohome, Inc. ADR | | | 10,285 | | | | 1,038,785 | |
| Baidu, Inc. ADR* | | | 1,955 | | | | 475,065 | |
| Sunny Optical Technology Group Co. | | | | | | | | |
| Ltd. | | | 27,000 | | | | 500,779 | |
| Tencent Holdings Ltd. | | | 38,025 | | | | 1,909,441 | |
| Weibo Corp. ADR* | | | 12,550 | | | | 1,113,938 | |
| YY, Inc. ADR* | | | 7,450 | | | | 748,502 | |
| | | | | | | | | |
| Utilities — 3.5% | | | | | | | | |
| ENN Energy Holdings Ltd. | | | 120,000 | | | | 1,175,208 | |
| Total China | | | | | | | 13,881,419 | |
| | | | | | | | | |
| Switzerland — 12.5% | | | | | | | | |
| | | | | | | | | |
| Consumer Discretionary — 3.0% | | | | | | | | |
| Dufry AG | | | 7,995 | | | | 1,016,827 | |
| | | | | | | | | |
| Consumer Staples — 2.7% | | | | | | | | |
| Coca-Cola HBC AG | | | 28,040 | | | | 933,300 | |
| | | | | | | | | |
| Financials — 4.2% | | | | | | | | |
| Julius Baer Group Ltd. | | | 24,310 | | | | 1,423,872 | |
| | | | | | | | | |
| Health Care — 2.6% | | | | | | | | |
| Sonova Holding AG | | | 4,905 | | | | 877,424 | |
| Total Switzerland | | | | | | | 4,251,423 | |
| | | | | | | | | |
| India — 7.6% | | | | | | | | |
| | | | | | | | | |
| Financials — 7.6% | | | | | | | | |
| HDFC Bank Ltd. ADR | | | 17,290 | | | | 1,815,796 | |
| IndusInd Bank Ltd. | | | 27,255 | | | | 769,345 | |
| Total India | | | | | | | 2,585,141 | |
| | | | | | | | | |
| Canada — 7.1% | | | | | | | | |
| | | | | | | | | |
| Financials — 4.4% | | | | | | | | |
| Toronto-Dominion Bank (The) | | | 26,095 | | | | 1,510,340 | |
| Industrials — 2.7% | | | | | | | | |
| Canadian Pacific Railway Ltd. | | | 5,005 | | | | 916,015 | |
| Total Canada | | | | | | | 2,426,355 | |
| | | | | | | | | |
| Japan — 6.0% | | | | | | | | |
| | | | | | | | | |
| Industrials — 3.7% | | | | | | | | |
| Recruit Holdings Co. Ltd. | | | 45,400 | | | | 1,253,887 | |
| | | | | | | | | |
| Information Technology — 2.3% | | | | | | | | |
| Nexon Co. Ltd.* | | | 53,500 | | | | 776,251 | |
| Total Japan | | | | | | | 2,030,138 | |
| | | | | | | | | |
| Singapore — 4.6% | | | | | | | | |
| | | | | | | | | |
| Financials — 4.6% | | | | | | | | |
| DBS Group Holdings Ltd. | | | 79,900 | | | | 1,553,817 | |
| | | | | | | | | |
| Germany — 3.2% | | | | | | | | |
| | | | | | | | | |
| Information Technology — 3.2% | | | | | | | | |
| SAP SE | | | 9,475 | | | | 1,093,585 | |
| | | | | | | | | |
| Macau — 3.1% | | | | | | | | |
| | | | | | | | | |
| Consumer Discretionary — 3.1% | | | | | | | | |
| Wynn Macau Ltd. | | | 325,200 | | | | 1,042,151 | |
| | | | | | | | | |
| Sweden — 2.6% | | | | | | | | |
| | | | | | | | | |
| Information Technology — 2.6% | | | | | | | | |
| Hexagon AB | | | 15,925 | | | | 884,907 | |
| | | | | | | | | |
| United Kingdom — 2.5% | | | | | | | | |
| | | | | | | | | |
| Consumer Discretionary — 2.5% | | | | | | | | |
| InterContinental Hotels Group PLC | | | 13,955 | | | | 867,515 | |
| | | | | | | | | |
| France — 2.5% | | | | | | | | |
| | | | | | | | | |
| Industrials — 2.5% | | | | | | | | |
| Safran SA | | | 7,145 | | | | 865,295 | |
| | | | | | | | | |
| Mexico — 2.1% | | | | | | | | |
| | | | | | | | | |
| Consumer Staples — 2.1% | | | | | | | | |
| Coca-Cola Femsa SAB de CV ADR† | | | 5,635 | | | | 317,983 | |
| Fomento Economico Mexicano SAB | | | | | | | | |
| de CV ADR | | | 4,415 | | | | 387,593 | |
| Total Mexico | | | | | | | 705,576 | |
| | | | | | | | | |
| Brazil — 2.0% | | | | | | | | |
| | | | | | | | | |
| Consumer Discretionary — 1.1% | | | | | | | | |
| Magazine Luiza SA | | | 12,000 | | | | 394,762 | |
| | | | | | | | | |
| Information Technology — 0.9% | | | | | | | | |
| Pagseguro Digital Ltd.* | | | 10,835 | | | | 300,671 | |
| Total Brazil | | | | | | | 695,433 | |
Touchstone International Growth Opportunities Fund (Continued)
| | | | | | Market | |
| | | Shares | | | Value | |
| | | | | | | |
| Common Stocks — 99.6% (Continued) | | | | | | | | |
| | | | | | | | | |
| Thailand — 1.7% | | | | | | | | |
| | | | | | | | | |
| Consumer Staples — 1.7% | | | | | | | | |
| CP ALL PCL | | | 266,600 | | | $ | 590,862 | |
| | | | | | | | | |
| Austria — 1.3% | | | | | | | | |
| Information Technology — 1.3% | | | | | | | | |
| ams AG | | | 5,985 | | | | 443,848 | |
| Total Common Stocks | | | | | | $ | 33,917,465 | |
| | | | | | | | | |
| Short-Term Investment Funds — 1.3% | | | | | | | | |
| Dreyfus Government Cash | | | | | | | | |
| Management, Institutional Shares, | | | | | | | | |
| 1.81%∞Ω | | | 167,009 | | | | 167,009 | |
| Invesco Government & Agency | | | | | | | | |
| Portfolio, Institutional Class, | | | | | | | | |
| 1.81%**∞Ω | | | 278,400 | | | | 278,400 | |
| Total Short-Term Investment Funds | | | | | | $ | 445,409 | |
| | | | | | | | | |
| Total Investment Securities —100.9% | | | | | | | | |
| (Cost $30,390,583) | | | | | | $ | 34,362,874 | |
| | | | | | | | | |
| Liabilities in Excess of Other Assets — (0.9%) | | | | | | | (296,598 | ) |
| | | | | | | | | |
| Net Assets — 100.0% | | | | | | $ | 34,066,276 | |
| * | Non-income producing security. |
| ** | Represents collateral for securities loaned. |
| † | All or a portion of the security is on loan. The total market value of the securities on loan as of June 30, 2018 was $270,864. |
| Ω | Represents the 7-day SEC yield as of June 30, 2018. |
Portfolio Abbreviations:
ADR - American Depositary Receipt
PCL- Public Company Limited
PLC - Public Limited Company
Other Information:
The inputs or methodology used for valuing securities may not be an indication of the risk associated with investing in those securities. For more information on valuation inputs, and their aggregation into the levels used in the table below, please refer to the security valuation section in the accompanying Notes to Financial Statements.
| | | Valuation inputs at Reporting Date: | |
| | | Level 1 | | | Level 2 | | | Level 3 | | | Total | |
| Common Stocks | | | | | | | | | | | | | | | | |
| China | | $ | 9,038,283 | | | $ | 4,843,136 | | | $ | — | | | $ | 13,881,419 | |
| Switzerland | | | — | | | | 4,251,423 | | | | — | | | | 4,251,423 | |
| India | | | 1,815,796 | | | | 769,345 | | | | — | | | | 2,585,141 | |
| Canada | | | 2,426,355 | | | | — | | | | — | | | | 2,426,355 | |
| Japan | | | — | | | | 2,030,138 | | | | — | | | | 2,030,138 | |
| Singapore | | | — | | | | 1,553,817 | | | | — | | | | 1,553,817 | |
| Germany | | | — | | | | 1,093,585 | | | | — | | | | 1,093,585 | |
| Macau | | | — | | | | 1,042,151 | | | | — | | | | 1,042,151 | |
| Sweden | | | — | | | | 884,907 | | | | — | | | | 884,907 | |
| United Kingdom | | | — | | | | 867,515 | | | | — | | | | 867,515 | |
| France | | | — | | | | 865,295 | | | | — | | | | 865,295 | |
| Mexico | | | 705,576 | | | | — | | | | — | | | | 705,576 | |
| Brazil | | | 695,433 | | | | — | | | | — | | | | 695,433 | |
| Thailand | | | — | | | | 590,862 | | | | — | | | | 590,862 | |
| Austria | | | — | | | | 443,848 | | | | — | | | | 443,848 | |
| Short-Term Investment Funds | | | 445,409 | | | | — | | | | — | | | | 445,409 | |
| Total | | $ | 15,126,852 | | | $ | 19,236,022 | | | $ | — | | | $ | 34,362,874 | |
At June 30, 2018, equity securities valued at $664,437 were transferred from Level 1 to Level 2. Transfers from Level 1 to Level 2 occur when required confidence levels are achieved, triggering use of a systematic valuation model, provided by an independent third party, to fair value the international equity securities.
See accompanying Notes to Financial Statements.
Portfolio of Investments
Touchstone International Small Cap Fund – June 30, 2018
| | | | | | Market | |
| | | Shares | | | Value | |
| | | | | | | |
| Common Stocks — 94.1% | | | | | | | | |
| | | | | | | | | |
| Japan — 27.9% | | | | | | | | |
| | | | | | | | | |
| Consumer Discretionary — 3.8% | | | | | | | | |
| DA Consortium Holdings, Inc. | | | 45,900 | | | $ | 1,278,920 | |
| Marui Group Co. Ltd. | | | 197,400 | | | | 4,152,325 | |
| Nifco, Inc. | | | 109,500 | | | | 3,383,955 | |
| Round One Corp. | | | 202,700 | | | | 3,181,807 | |
| | | | | | | | | |
| Consumer Staples — 2.4% | | | | | | | | |
| Lion Corp. | | | 210,100 | | | | 3,844,463 | |
| Pigeon Corp. | | | 79,900 | | | | 3,882,912 | |
| | | | | | | | | |
| Energy — 1.0% | | | | | | | | |
| Cosmo Energy Holdings Co. Ltd. | | | 88,400 | | | | 3,095,672 | |
| | | | | | | | | |
| Financials — 2.3% | | | | | | | | |
| Fukuoka Financial Group, Inc. | | | 663,000 | | | | 3,327,134 | |
| Zenkoku Hosho Co. Ltd. | | | 86,400 | | | | 3,911,975 | |
| | | | | | | | | |
| Health Care — 2.2% | | | | | | | | |
| Rohto Pharmaceutical Co. Ltd. | | | 110,200 | | | | 3,530,918 | |
| Takara Bio, Inc. | | | 164,900 | | | | 3,440,689 | |
| | | | | | | | | |
| Industrials — 6.9% | | | | | | | | |
| Kamigumi Co. Ltd. | | | 171,000 | | | | 3,549,249 | |
| Kandenko Co. Ltd. | | | 335,900 | | | | 3,680,548 | |
| Kinden Corp. | | | 222,100 | | | | 3,622,349 | |
| Seino Holdings Co. Ltd. | | | 227,700 | | | | 4,029,194 | |
| TechnoPro Holdings, Inc. | | | 56,400 | | | | 3,463,239 | |
| Toda Corp. | | | 400,000 | | | | 3,473,660 | |
| | | | | | | | | |
| Information Technology — 3.1% | | | | | | | | |
| Azbil Corp. | | | 61,300 | | | | 2,667,248 | |
| Capcom Co. Ltd. | | | 117,600 | | | | 2,891,749 | |
| Nihon Unisys Ltd. | | | 169,500 | | | | 4,250,692 | |
| | | | | | | | | |
| Materials — 3.9% | | | | | | | | |
| Sumitomo Bakelite Co. Ltd. | | | 484,000 | | | | 4,658,828 | |
| Teijin Ltd. | | | 220,100 | | | | 4,031,729 | |
| Tokai Carbon Co. Ltd.† | | | 198,700 | | | | 3,559,360 | |
| | | | | | | | | |
| Real Estate — 2.3% | | | | | | | | |
| Aeon Mall Co. Ltd. | | | 188,900 | | | | 3,388,686 | |
| Open House Co. Ltd. | | | 62,800 | | | | 3,710,853 | |
| Total Japan | | | | | | | 88,008,154 | |
| | | | | | | | | |
| United Kingdom — 10.9% | | | | | | | | |
| | | | | | | | | |
| Consumer Discretionary — 1.1% | | | | | | | | |
| SSP Group PLC | | | 398,017 | | | | 3,320,918 | |
| | | | | | | | | |
| Energy — 3.3% | | | | | | | | |
| Petrofac Ltd. | | | 415,452 | | | | 3,191,520 | |
| Premier Oil PLC* | | | 2,401,341 | | | | 4,060,531 | |
| Tullow Oil PLC* | | | 1,020,011 | | | | 3,282,023 | |
| | | | | | | | | |
| Financials — 2.2% | | | | | | | | |
| IG Group Holdings PLC | | | 269,942 | | | | 3,067,361 | |
| Intermediate Capital Group PLC | | | 274,077 | | | | 3,970,523 | |
| | | | | | | | | |
| Health Care — 2.0% | | | | | | | | |
| Abcam PLC | | | 177,920 | | | | 3,125,547 | |
| Dechra Pharmaceuticals PLC | | | 86,593 | | | | 3,169,058 | |
| | | | | | | | | |
| Industrials — 1.1% | | | | | | | | |
| Pagegroup PLC | | | 453,887 | | | | 3,365,583 | |
| | | | | | | | | |
| Information Technology — 1.2% | | | | | | | | |
| Electrocomponents PLC | | | 385,546 | | | | 3,843,607 | |
| Total United Kingdom | | | | | | | 34,396,671 | |
| | | | | | | | | |
| Australia — 7.9% | | | | | | | | |
| | | | | | | | | |
| Energy — 2.7% | | | | | | | | |
| Beach Energy Ltd. | | | 3,060,581 | | | | 3,961,541 | |
| WorleyParsons Ltd. | | | 341,900 | | | | 4,416,286 | |
| | | | | | | | | |
| Health Care — 1.0% | | | | | | | | |
| Ansell Ltd. | | | 153,789 | | | | 3,089,763 | |
| | | | | | | | | |
| Materials — 2.8% | | | | | | | | |
| BlueScope Steel Ltd. | | | 313,216 | | | | 3,997,442 | |
| St Barbara Ltd. | | | 1,345,554 | | | | 4,838,810 | |
| | | | | | | | | |
| Real Estate — 1.4% | | | | | | | | |
| Charter Hall Group REIT | | | 936,091 | | | | 4,517,331 | |
| Total Australia | | | | | | | 24,821,173 | |
| | | | | | | | | |
| Germany — 6.9% | | | | | | | | |
| | | | | | | | | |
| Consumer Discretionary — 1.9% | | | | | | | | |
| CTS Eventim AG & Co. KGaA | | | 64,517 | | | | 3,167,640 | |
| Stroeer SE & Co. KGaA | | | 45,153 | | | | 2,726,110 | |
| | | | | | | | | |
| Financials — 2.1% | | | | | | | | |
| AURELIUS Equity Opportunities SE & Co. KGaA | | | 61,198 | | | | 3,622,210 | |
| Deutsche Pfandbriefbank AG, 144a | | | 202,256 | | | | 2,821,926 | |
| | | | | | | | | |
| Industrials — 0.7% | | | | | | | | |
| Rheinmetall AG | | | 20,860 | | | | 2,295,068 | |
| | | | | | | | | |
| Information Technology — 2.2% | | | | | | | | |
| CANCOM SE | | | 30,735 | | | | 3,123,022 | |
| Software AG | | | 84,857 | | | | 3,943,925 | |
| Total Germany | | | | | | | 21,699,901 | |
| | | | | | | | | |
| Netherlands — 5.0% | | | | | | | | |
| | | | | | | | | |
| Financials — 2.4% | | | | | | | | |
| ASR Nederland NV. | | | 106,847 | | | | 4,350,909 | |
| Euronext NV., 144a | | | 50,931 | | | | 3,227,382 | |
| | | | | | | | | |
| Information Technology — 1.1% | | | | | | | | |
| ASM International NV.† | | | 61,001 | | | | 3,361,324 | |
| | | | | | | | | |
| Materials — 1.5% | | | | | | | | |
| AMG Advanced Metallurgical Group NV. | | | 86,564 | | | | 4,840,892 | |
| Total Netherlands | | | | | | | 15,780,507 | |
Touchstone International Small Cap Fund (Continued)
| | | | | | Market | |
| | | Shares | | | Value | |
| | | | | | | |
| Common Stocks — 94.1% (Continued) | | | | | | | | |
| | | | | | | | | |
| France — 4.3% | | | | | | | | |
| | | | | | | | | |
| Consumer Discretionary — 0.7% | | | | | | | | |
| Fnac Darty SA* | | | 23,740 | | | $ | 2,250,349 | |
| | | | | | | | | |
| Information Technology — 1.7% | | | | | | | | |
| Alten SA | | | 26,946 | | | | 2,769,938 | |
| Sopra Steria Group | | | 13,003 | | | | 2,645,710 | |
| | | | | | | | | |
| Materials — 0.7% | | | | | | | | |
| Eramet | | | 17,792 | | | | 2,334,128 | |
| | | | | | | | | |
| Utilities — 1.2% | | | | | | | | |
| Rubis SCA | | | 59,661 | | | | 3,718,819 | |
| Total France | | | | | | | 13,718,944 | |
| | | | | | | | | |
| Italy — 3.8% | | | | | | | | |
| | | | | | | | | |
| Consumer Discretionary — 0.9% | | | | | | | | |
| Brembo SpA | | | 203,072 | | | | 2,738,787 | |
| | | | | | | | | |
| Energy — 1.0% | | | | | | | | |
| Saras SpA | | | 1,318,641 | | | | 3,187,061 | |
| | | | | | | | | |
| Industrials — 1.0% | | | | | | | | |
| Interpump Group SpA | | | 105,713 | | | | 3,277,110 | |
| | | | | | | | | |
| Utilities — 0.9% | | | | | | | | |
| Iren SpA | | | 1,151,905 | | | | 2,939,095 | |
| Total Italy | | | | | | | 12,142,053 | |
| | | | | | | | | |
| Canada — 3.7% | | | | | | | | |
| | | | | | | | | |
| Energy — 1.0% | | | | | | | | |
| Enerplus Corp. | | | 239,497 | | | | 3,020,470 | |
| | | | | | | | | |
| Industrials — 1.4% | | | | | | | | |
| Finning International, Inc. | | | 179,109 | | | | 4,421,015 | |
| | | | | | | | | |
| Materials — 1.3% | | | | | | | | |
| Interfor Corp.* | | | 221,832 | | | | 4,260,646 | |
| Total Canada | | | | | | | 11,702,131 | |
| | | | | | | | | |
| Denmark — 3.6% | | | | | | | | |
| | | | | | | | | |
| Consumer Staples — 1.4% | | | | | | | | |
| Royal Unibrew A/S | | | 56,069 | | | | 4,455,688 | |
| | | | | | | | | |
| Financials — 1.2% | | | | | | | | |
| Topdanmark A/S | | | 86,628 | | | | 3,783,150 | |
| | | | | | | | | |
| Information Technology — 1.0% | | | | | | | | |
| SimCorp A/S | | | 39,116 | | | | 3,159,244 | |
| Total Denmark | | | | | | | 11,398,082 | |
| | | | | | | | | |
| Hong Kong — 2.7% | | | | | | | | |
| | | | | | | | | |
| Consumer Discretionary — 1.5% | | | | | | | | |
| Melco International Development Ltd. | | | 1,583,000 | | | | 4,856,014 | |
| | | | | | | | | |
| Health Care — 1.2% | | | | | | | | |
| China Traditional Chinese Medicine | | | | | | | | |
| Holdings Co. Ltd. | | | 4,350,000 | | | | 3,753,736 | |
| Total Hong Kong | | | | | | | 8,609,750 | |
| | | | | | | | | |
| Switzerland — 2.4% | | | | | | | | |
| | | | | | | | | |
| Industrials — 2.4% | | | | | | | | |
| Georg Fischer AG | | | 3,144 | | | | 4,014,840 | |
| Wizz Air Holdings PLC, 144a* | | | 78,233 | | | | 3,704,788 | |
| Total Switzerland | | | | | | | 7,719,628 | |
| | | | | | | | | |
| South Korea — 2.2% | | | | | | | | |
| | | | | | | | | |
| Consumer Staples — 1.3% | | | | | | | | |
| Orion Corp./Republic of Korea | | | 31,180 | | | | 4,162,984 | |
| | | | | | | | | |
| Industrials — 0.9% | | | | | | | | |
| Doosan Bobcat, Inc.* | | | 95,510 | | | | 2,742,550 | |
| Total South Korea | | | | | | | 6,905,534 | |
| | | | | | | | | |
| Spain — 1.8% | | | | | | | | |
| | | | | | | | | |
| Consumer Discretionary — 1.2% | | | | | | | | |
| Melia Hotels International SA | | | 285,146 | | | | 3,900,420 | |
| | | | | | | | | |
| Materials — 0.6% | | | | | | | | |
| Ence Energia y Celulosa SA | | | 214,968 | | | | 1,900,133 | |
| Total Spain | | | | | | | 5,800,553 | |
| | | | | | | | | |
| Sweden — 1.7% | | | | | | | | |
| | | | | | | | | |
| Consumer Discretionary — 1.0% | | | | | | | | |
| Dometic Group AB, 144a | | | 321,692 | | | | 3,148,462 | |
| | | | | | | | | |
| Real Estate — 0.7% | | | | | | | | |
| Hemfosa Fastigheter AB | | | 203,314 | | | | 2,374,779 | |
| Total Sweden | | | | | | | 5,523,241 | |
| | | | | | | | | |
| India — 1.4% | | | | | | | | |
| | | | | | | | | |
| Information Technology — 1.4% | | | | | | | | |
| WNS Holdings Ltd. ADR* | | | 82,323 | | | | 4,295,614 | |
| | | | | | | | | |
| Luxembourg — 1.3% | | | | | | | | |
| | | | | | | | | |
| Real Estate — 1.3% | | | | | | | | |
| Grand City Properties SA | | | 157,844 | | | | 4,092,176 | |
| | | | | | | | | |
| China — 1.3% | | | | | | | | |
| | | | | | | | | |
| Health Care — 1.3% | | | | | | | | |
| China Medical System Holdings Ltd. | | | 2,049,000 | | | | 4,081,295 | |
| | | | | | | | | |
| Ireland — 1.2% | | | | | | | | |
| | | | | | | | | |
| Health Care — 1.2% | | | | | | | | |
| UDG Healthcare PLC | | | 346,079 | | | | 3,760,953 | |
Touchstone International Small Cap Fund (Continued)
| | | | | | Market | |
| | | Shares | | | Value | |
| | | | | | | |
| Common Stocks — 94.1% (Continued) | | | | | | | | |
| | | | | | | | | |
| Malaysia — 1.2% | | | | | | | | |
| | | | | | | | | |
| Health Care — 1.2% | | | | | | | | |
| Top Glove Corp. Bhd | | | 1,251,000 | | | $ | 3,751,027 | |
| | | | | | | | | |
| Jordan — 1.0% | | | | | | | | |
| | | | | | | | | |
| Health Care — 1.0% | | | | | | | | |
| Hikma Pharmaceuticals PLC | | | 154,628 | | | | 3,049,969 | |
| | | | | | | | | |
| Singapore — 1.0% | | | | | | | | |
| | | | | | | | | |
| Information Technology — 1.0% | | | | | | | | |
| Kulicke & Soffa Industries, Inc. | | | 126,556 | | | | 3,014,564 | |
| | | | | | | | | |
| Norway — 0.9% | | | | | | | | |
| | | | | | | | | |
| Consumer Staples — 0.9% | | | | | | | | |
| Leroy Seafood Group ASA | | | 435,184 | | | | 2,932,450 | |
| Total Common Stocks | | | | | | $ | 297,204,370 | |
| | | | | | | | | |
| Exchange-Traded Fund — 1.8% | | | | | | | | |
| | | | | | | | | |
| United States — 1.8% | | | | | | | | |
| iShares MSCI EAFE Small-Cap ETF | | | 92,467 | | | $ | 5,801,380 | |
| | | | | | | | | |
| Short-Term Investment Funds — 5.8% | | | | | | | | |
| Dreyfus Government Cash | | | | | | | | |
| Management, Institutional Shares, | | | | | | | | |
| 1.81%∞Ω | | | 12,942,890 | | | | 12,942,890 | |
| Invesco Government & Agency | | | | | | | | |
| Portfolio, Institutional Class, | | | | | | | | |
| 1.81%**∞Ω | | | 5,289,953 | | | | 5,289,953 | |
| Total Short-Term Investment Funds | | | | | | $ | 18,232,843 | |
| | | | | | | | | |
| Total Investment Securities —101.7% | | | | | | | | |
| (Cost $279,623,532) | | | | | | $ | 321,238,593 | |
| | | | | | | | | |
| Liabilities in Excess of Other Assets — (1.7%) | | | | | | | (5,338,114 | ) |
| | | | | | | | | |
| Net Assets — 100.0% | | | | | | $ | 315,900,479 | |
| * | Non-income producing security. |
| ** | Represents collateral for securities loaned. |
| † | All or a portion of the security is on loan. The total market value of the securities on loan as of June 30, 2018 was $5,000,080. |
| Ω | Represents the 7-day SEC yield as of June 30, 2018. |
Portfolio Abbreviations:
ADR - American Depositary Receipt
ETF - Exchange-Traded Fund
PLC - Public Limited Company
REIT- Real Estate Investment Trust
144a - This is a restricted security that was sold in a transaction qualifying for the exemption under Rule 144a of the Securities Act of 1933. This security may be sold in transactions exempt from registration, normally to qualified institutional buyers. At June 30, 2018, these securities were valued at $12,902,558 or 4.1% of net assets. These securities were deemed liquid pursuant to procedures approved by the Board of Trustees.
Touchstone International Small Cap Fund (Continued)
Other Information:
The inputs or methodology used for valuing securities may not be an indication of the risk associated with investing in those securities. For more information on valuation inputs, and their aggregation into the levels used in the table below, please refer to the security valuation section in the accompanying Notes to Financial Statements.
| | | Valuation inputs at Reporting Date: | |
| | | Level 1 | | | Level 2 | | | Level 3 | | | Total | |
| | | | | | | | | | | | | | | | | |
| Common Stocks | | | | | | | | | | | | | | | | |
| Japan | | $ | 2,891,749 | | | $ | 85,116,405 | | | $ | — | | | $ | 88,008,154 | |
| United Kingdom | | | 3,067,361 | | | | 31,329,310 | | | | — | | | | 34,396,671 | |
| Australia | | | — | | | | 24,821,173 | | | | — | | | | 24,821,173 | |
| Germany | | | — | | | | 21,699,901 | | | | — | | | | 21,699,901 | |
| Netherlands | | | — | | | | 15,780,507 | | | | — | | | | 15,780,507 | |
| France | | | — | | | | 13,718,944 | | | | — | | | | 13,718,944 | |
| Italy | | | — | | | | 12,142,053 | | | | — | | | | 12,142,053 | |
| Canada | | | 11,702,131 | | | | — | | | | — | | | | 11,702,131 | |
| Denmark | | | — | | | | 11,398,082 | | | | — | | | | 11,398,082 | |
| Hong Kong | | | — | | | | 8,609,750 | | | | — | | | | 8,609,750 | |
| Switzerland | | | — | | | | 7,719,628 | | | | — | | | | 7,719,628 | |
| South Korea | | | — | | | | 6,905,534 | | | | — | | | | 6,905,534 | |
| Spain | | | — | | | | 5,800,553 | | | | — | | | | 5,800,553 | |
| Sweden | | | — | | | | 5,523,241 | | | | — | | | | 5,523,241 | |
| India | | | 4,295,614 | | | | — | | | | — | | | | 4,295,614 | |
| Luxembourg | | | — | | | | 4,092,176 | | | | — | | | | 4,092,176 | |
| China | | | — | | | | 4,081,295 | | | | — | | | | 4,081,295 | |
| Ireland | | | — | | | | 3,760,953 | | | | — | | | | 3,760,953 | |
| Malaysia | | | — | | | | 3,751,027 | | | | — | | | | 3,751,027 | |
| Jordan | | | — | | | | 3,049,969 | | | | — | | | | 3,049,969 | |
| Singapore | | | 3,014,564 | | | | — | | | | — | | | | 3,014,564 | |
| Norway | | | 2,932,450 | | | | — | | | | — | | | | 2,932,450 | |
| Exchange- Traded Fund | | | 5,801,380 | | | | — | | | | — | | | | 5,801,380 | |
| Short-Term Investment Funds | | | 18,232,843 | | | | — | | | | — | | | | 18,232,843 | |
| Total | | $ | 51,938,092 | | | $ | 269,300,501 | | | $ | — | | | $ | 321,238,593 | |
At June 30, 2018, equity securities valued at $25,254,302 were transferred from Level 1 to Level 2. Transfers from Level 1 to Level 2 occur when required confidence levels are achieved, triggering use of a systematic valuation model, provided by an independent third party, to fair value the international equity securities.
See accompanying Notes to Financial Statements.
Portfolio of Investments
Touchstone Large Cap Fund – June 30, 2018
| | | | | | Market | |
| | | Shares | | | Value | |
| Common Stocks — 98.9% | | | | | | | | |
| | | | | | | | | |
| Financials — 24.1% | | | | | | | | |
| Alleghany Corp. | | | 19,363 | | | $ | 11,133,144 | |
| Bank of America Corp. | | | 218,659 | | | | 6,163,997 | |
| Berkshire Hathaway, Inc. - Class B* | | | 134,654 | | | | 25,133,169 | |
| BlackRock, Inc. | | | 30,332 | | | | 15,136,881 | |
| Progressive Corp. (The) | | | 317,925 | | | | 18,805,264 | |
| Wells Fargo & Co. | | | 221,739 | | | | 12,293,210 | |
| | | | | | | | 88,665,665 | |
| | | | | | | | | |
| Consumer Discretionary — 23.4% | | | | | | | | |
| CarMax, Inc.* | | | 212,832 | | | | 15,509,068 | |
| Carnival Corp. | | | 257,724 | | | | 14,770,162 | |
| Dollar Tree, Inc.* | | | 176,105 | | | | 14,968,925 | |
| Home Depot, Inc. (The) | | | 63,860 | | | | 12,459,086 | |
| Lowe's Cos., Inc. | | | 55,362 | | | | 5,290,946 | |
| NIKE, Inc. - Class B | | | 170,900 | | | | 13,617,312 | |
| O'Reilly Automotive, Inc.* | | | 34,440 | | | | 9,421,751 | |
| | | | | | | | 86,037,250 | |
| | | | | | | | | |
| Information Technology — 18.9% | | | | | | | | |
| Alphabet, Inc. - Class C* | | | 17,480 | | | | 19,501,562 | |
| Apple, Inc. | | | 111,955 | | | | 20,723,990 | |
| Cisco Systems, Inc. | | | 253,382 | | | | 10,903,028 | |
| Visa, Inc. - Class A | | | 138,097 | | | | 18,290,948 | |
| | | | | | | | 69,419,528 | |
| | | | | | | | | |
| Industrials — 13.4% | | | | | | |
| Deere & Co. | | | 69,148 | | | | 9,666,890 | |
| FedEx Corp. | | | 35,355 | | | | 8,027,706 | |
| General Dynamics Corp. | | | 55,697 | | | | 10,382,478 | |
| Norfolk Southern Corp. | | | 98,600 | | | | 14,875,782 | |
| Southwest Airlines Co. | | | 122,005 | | | | 6,207,614 | |
| | | | | | | | 49,160,470 | |
| | | | | | | | | |
| Materials — 5.8% | | | | | | | | |
| Albemarle Corp. | | | 114,300 | | | | 10,781,919 | |
| NewMarket Corp. | | | 26,382 | | | | 10,671,519 | |
| | | | | | | | 21,453,438 | |
| | | | | | | | | |
| Health Care — 4.8% | | | | | | | | |
| Alexion Pharmaceuticals, Inc.* | | | 84,110 | | | | 10,442,257 | |
| Bristol-Myers Squibb Co. | | | 130,709 | | | | 7,233,436 | |
| | | | | | | | 17,675,693 | |
| | | | | | | | | |
| Consumer Staples — 4.6% | | | | | | | | |
| Altria Group, Inc. | | | 185,055 | | | | 10,509,273 | |
| Coca-Cola Co. (The) | | | 146,573 | | | | 6,428,692 | |
| | | | | | | | 16,937,965 | |
| | | | | | | | | |
| Energy — 2.4% | | | | | | | | |
| Chevron Corp. | | | 68,541 | | | | 8,665,639 | |
| | | | | | | | | |
| Telecommunication Services — 1.5% | | | | | | | | |
| Verizon Communications, Inc. | | | 113,144 | | | | 5,692,275 | |
| Total Common Stocks | | | | | | $ | 363,707,923 | |
| | | | | | | | | |
| Short-Term Investment Fund — 1.1% | | | | | | | | |
| Dreyfus Government Cash | | | | | | | | |
| Management, Institutional Shares, | | | | | | | | |
| 1.81%∞Ω | | | 3,980,421 | | | $ | 3,980,421 | |
| | | | | | | | | |
| Total Investment Securities —100.0% | | | | | | | | |
| (Cost $283,347,699) | | | | | | $ | 367,688,344 | |
| | | | | | | | | |
| Liabilities in Excess of Other Assets — 0.0% | | | | | | | (121,444 | ) |
| | | | | | | | | |
| Net Assets — 100.0% | | | | | | $ | 367,566,900 | |
| * | Non-income producing security. |
| Ω | Represents the 7-day SEC yield as of June 30, 2018. |
Other Information:
The inputs or methodology used for valuing securities may not be an indication of the risk associated with investing in those securities. For more information on valuation inputs, and their aggregation into the levels used in the table below, please refer to the security valuation section in the accompanying Notes to Financial Statements.
| | | Valuation inputs at Reporting Date: | |
| Description | | Level 1 | | | Level 2 | | | Level 3 | | | Total | |
| Common Stocks | | $ | 363,707,923 | | | $ | — | | | $ | — | | | $ | 363,707,923 | |
| Short-Term Investment Fund | | | 3,980,421 | | | | — | | | | — | | | | 3,980,421 | |
| Total | | $ | 367,688,344 | | | $ | — | | | $ | — | | | $ | 367,688,344 | |
See accompanying Notes to Financial Statements.
Portfolio of Investments
Touchstone Large Company Growth Fund – June 30, 2018
| | | | | | Market | |
| | | Shares | | | Value | |
| | | | | | | |
| Common Stocks — 99.7% | | | | | | | | |
| | | | | | | | | |
| Information Technology — 52.4% | | | | | | | | |
| Adobe Systems, Inc.* | | | 61,525 | | | $ | 15,000,410 | |
| Alibaba Group Holding Ltd. (China) ADR* | | | 96,850 | | | | 17,968,580 | |
| Alphabet, Inc. - Class A* | | | 13,035 | | | | 14,718,992 | |
| Electronic Arts, Inc.* | | | 29,300 | | | | 4,131,886 | |
| Facebook, Inc. - Class A* | | | 95,100 | | | | 18,479,832 | |
| Intuit, Inc. | | | 26,300 | | | | 5,373,222 | |
| IPG Photonics Corp.* | | | 17,650 | | | | 3,894,120 | |
| Microsoft Corp. | | | 118,850 | | | | 11,719,798 | |
| PayPal Holdings, Inc.* | | | 72,650 | | | | 6,049,566 | |
| Tencent Holdings Ltd. (China) ADR | | | 290,875 | | | | 14,616,469 | |
| Visa, Inc. - Class A | | | 119,225 | | | | 15,791,351 | |
| | | | | | | | 127,744,226 | |
| | | | | | | | | |
| Health Care — 16.4% | | | | | | | | |
| Abbott Laboratories | | | 136,200 | | | | 8,306,838 | |
| Becton Dickinson and Co. | | | 36,800 | | | | 8,815,808 | |
| Regeneron Pharmaceuticals, Inc.* | | | 11,225 | | | | 3,872,513 | |
| Thermo Fisher Scientific, Inc. | | | 36,900 | | | | 7,643,466 | |
| Zoetis, Inc. | | | 132,750 | | | | 11,308,972 | |
| | | | | | | | 39,947,597 | |
| | | | | | | | | |
| Financials — 12.5% | | | | | | | | |
| BlackRock, Inc. | | | 13,125 | | | | 6,549,900 | |
| Charles Schwab Corp. (The) | | | 213,775 | | | | 10,923,902 | |
| MSCI, Inc. | | | 34,075 | | | | 5,637,027 | |
| Toronto-Dominion Bank (The) (Canada) | | | 129,350 | | | | 7,484,191 | |
| | | | | | | | 30,595,020 | |
| | | | | | | | | |
| Consumer Discretionary — 11.0% | | | | | | | | |
| Booking Holdings, Inc.* | | | 5,375 | | | | 10,895,609 | |
| Norwegian Cruise Line Holdings Ltd.* | | | 119,425 | | | | 5,642,831 | |
| Royal Caribbean Cruises Ltd. | | | 66,630 | | | | 6,902,868 | |
| Sirius XM Holdings, Inc.† | | | 486,800 | | | | 3,295,636 | |
| | | | | | | | 26,736,944 | |
| | | | | | | | | |
| Consumer Staples — 3.8% | | | | | | | | |
| Monster Beverage Corp.* | | | 163,800 | | | | 9,385,740 | |
| | | | | | | | | |
| Industrials — 3.6% | | | | | | | | |
| Canadian Pacific Railway Ltd. (Canada) | | | 25,225 | | | | 4,616,680 | |
| Raytheon Co. | | | 21,650 | | | | 4,182,347 | |
| | | | | | | | 8,799,027 | |
| Total Common Stocks | | | | | | $ | 243,208,554 | |
| | | | | | | | | |
| Short-Term Investment Funds — 1.6% | | | | | | | | |
| Dreyfus Government Cash | | | | | | | | |
Management, Institutional Shares,
1.81%∞Ω | | | 1,570,004 | | | | 1,570,004 | |
| Invesco Government & Agency | | | | | | | | |
Portfolio, Institutional Class,
1.81%**∞Ω | | | 2,450,644 | | | | 2,450,644 | |
| Total Short-Term Investment Funds | | | | | | $ | 4,020,648 | |
| | | | | | | | | |
| Total Investment Securities —101.3% | | | | | | | | |
| (Cost $156,590,337) | | | | | | $ | 247,229,202 | |
| | | | | | | | | |
| Liabilities in Excess of Other Assets — (1.3%) | | | | | | | (3,235,959 | ) |
| | | | | | | | | |
| Net Assets — 100.0% | | | | | | $ | 243,993,243 | |
| * | Non-income producing security. |
| ** | Represents collateral for securities loaned. |
| † | All or a portion of the security is on loan. The total market value of the securities on loan as of June 30, 2018 was $2,370,123. |
| Ω | Represents the 7-day SEC yield as of June 30, 2018. |
Portfolio Abbreviations:
ADR - American Depositary Receipt
Other Information:
The inputs or methodology used for valuing securities may not be an indication of the risk associated with investing in those securities. For more information on valuation inputs, and their aggregation into the levels used in the table below, please refer to the security valuation section in the accompanying Notes to Financial Statements.
| | | Valuation inputs at Reporting Date: | |
| Description | | Level 1 | | | Level 2 | | | Level 3 | | | Total | |
| Common Stocks | | $ | 243,208,554 | | | $ | — | | | $ | — | | | $ | 243,208,554 | |
| Short-Term Investment Funds | | | 4,020,648 | | | | — | | | | — | | | | 4,020,648 | |
| Total | | $ | 247,229,202 | | | $ | — | | | $ | — | | | $ | 247,229,202 | |
See accompanying Notes to Financial Statements.
Portfolio of Investments
Touchstone Ohio Tax-Free Bond Fund – June 30, 2018
| Principal | | | | | Interest | | | Maturity | | Market | |
| Amount | | | | | Rate | | | Date | | Value | |
| | | | | | | | | | | | |
| | | | | Fixed Rate Revenue Bonds — 63.2% | | | | | | | | | | |
| $ | 500,000 | | | New Albany OH Cmnty Auth (Ref) Ser C | | | 5.000 | % | | 10/01/24 | | $ | 552,570 | |
| | 375,000 | | | Univ of Akron OH (Ref) Ser A | | | 5.000 | | | 01/01/28 | | | 420,394 | |
| | 650,000 | | | Greene Co OH Hosp Fac Rev (Kettering Health Network) | | | 5.125 | | | 04/01/29 | | | 666,972 | |
| | 650,000 | | | Montgomery Co OH Rev (Unrefunded Catholic Hlth Initiatives) | | | 5.250 | | | 05/01/29 | | | 713,765 | |
| | 750,000 | | | Cleveland OH Income Tax Rev (Ref Sub Lien) Ser B 2 | | | 5.000 | | | 10/01/29 | | | 859,598 | |
| | 500,000 | | | Hamilton Co OH Hosp Facs Rev (Uc Hlth) | | | 5.000 | | | 02/01/30 | | | 553,705 | |
| | 1,000,000 | | | Butler Co OH Hosp Facs (Ref Cincinnati Children's Hosp) | | | 5.000 | | | 05/15/30 | | | 1,203,960 | |
| | 1,000,000 | | | Hamilton Co OH Student Rev (Ref Stratford Heights Proj) | | | 5.000 | | | 06/01/30 | | | 1,052,680 | |
| | 1,000,000 | | | Green OH Cmnty Learning Ctr (Ref) | | | 4.000 | | | 12/01/30 | | | 1,057,540 | |
| | 500,000 | | | Butler Co OH Hosp Facs (Kettering Health Network Oblig) | | | 5.250 | | | 04/01/31 | | | 535,680 | |
| | 1,000,000 | | | Wright OH St Univ (Gen Recpts) Ser A | | | 5.000 | | | 05/01/31 | | | 1,041,650 | |
| | 750,000 | | | Middleburg Heights OH Hosp Rev (Facs Southwest Gen) | | | 5.125 | | | 08/01/31 | | | 815,392 | |
| | 1,000,000 | | | Kent OH St Univ Rev (Gen Recpts) Ser A | | | 4.500 | | | 05/01/32 | | | 1,055,680 | |
| | 1,000,000 | | | Hamilton Co OH Hlth Care Facs (Christ Hosp Proj) | | | 5.250 | | | 06/01/32 | | | 1,095,190 | |
| | 1,000,000 | | | Cuyahoga Co OH COP (Convention Hotel Proj) | | | 5.000 | | | 12/01/32 | | | 1,098,480 | |
| | 1,060,000 | | | OH St EDR (Enterprise Bd Fd) Ser 7 | | | 4.750 | | | 12/01/32 | | | 1,124,141 | |
| | 500,000 | | | OH St Univ Ser A | | | 4.000 | | | 12/01/32 | | | 526,865 | |
| | 150,000 | | | OH Univ Gen Recpts Athens (Ref) Ser A | | | 5.000 | | | 12/01/32 | | | 173,556 | |
| | 265,000 | | | OH St Hgr Edl Fac Commis (Ref Xavier Univ) Ser C | | | 5.000 | | | 05/01/33 | | | 291,988 | |
| | 1,080,000 | | | Hamilton Co OH Hosp Facs Rev (Ref Cincinnati Childrens Hosp) | | | 5.000 | | | 05/15/33 | | | 1,207,688 | |
| | 970,000 | | | Franklin Co OH Sales Tax Rev (Various Purpose) | | | 4.000 | | | 06/01/33 | | | 1,046,562 | |
| | 1,000,000 | | | Hamilton Co OH EDR (Ref King Highland Cmnty Urban) | | | 5.000 | | | 06/01/33 | | | 1,131,970 | |
| | 250,000 | | | Warren Co OH Hlth Care Facs Rev (Ref & Impt Otterbein Homes) | | | 5.000 | | | 07/01/33 | | | 272,518 | |
| | 2,000,000 | | | Cincinnati OH EDR (U Square The Loop Proj) | | | 5.000 | | | 11/01/33 | | | 2,167,300 | |
| | 525,000 | | | OH St Univ Ser A | | | 4.000 | | | 12/01/33 | | | 551,644 | |
| | 265,000 | | | Cleveland OH Wtr Rev (Ref) Ser Y | | | 4.000 | | | 01/01/34 | | | 275,876 | |
| | 625,000 | | | Hamilton Co OH Hosp Facs Rev (Ref Cincinnati Childrens Hosp) | | | 5.000 | | | 05/15/34 | | | 696,744 | |
| | 250,000 | | | Warren Co OH Hlth Care Facs Rev (Ref & Impt Otterbein Homes) | | | 5.000 | | | 07/01/34 | | | 271,950 | |
| | 500,000 | | | Cuyahoga Co OH Sales Tax Rev (Ref) | | | 5.000 | | | 12/01/34 | | | 567,900 | |
| | 570,000 | | | Miami Univ OH (Ref) | | | 5.000 | | | 09/01/35 | | | 651,960 | |
| | 1,085,000 | | | Cincinnati OH Urban Redev Rev (Mercer Commons Phase 2 Proj) Ser B | | | 5.000 | | | 11/01/35 | | | 1,230,574 | |
| | 500,000 | | | Polaris Career Ctr OH COP | | | 5.000 | | | 11/01/35 | | | 561,825 | |
| | 475,000 | | | Cincinnati OH Wtr Sys Rev Ser A | | | 5.000 | | | 12/01/35 | | | 547,580 | |
| | 200,000 | | | Clermont Co OH Port Auth Lease (W Clermont Local Sch Dist Proj) | | | 5.000 | | | 12/01/35 | | | 226,114 | |
| | 290,000 | | | OH St Hgr Edl Fac Commis (University Of Dayton 2018 Pro) Ser A | | | 4.000 | | | 12/01/35 | | | 302,789 | |
| | 500,000 | | | OH St Hgr Edl Fac Commis (Ref Higher Eductnl Fac John Ca) | | | 5.000 | | | 04/01/36 | | | 546,570 | |
| | 350,000 | | | Warren Co OH Hlth Care Facs Rev (Ref Otterbein Homes) Ser A | | | 5.000 | | | 07/01/36 | | | 385,052 | |
| | 550,000 | | | Franklin Co OH Hosp Facs Rev (Ref Nationwide Childrens Hosp) | | | 4.000 | | | 11/01/36 | | | 567,721 | |
| | 1,000,000 | | | Univ Of Cincinnati OH Recpts (Ref) Ser A | | | 5.000 | | | 06/01/37 | | | 1,159,190 | |
| | | | | Total Fixed Rate Revenue Bonds | | | | | | | | $ | 29,209,333 | |
| | | | | | | | | | | | | | | |
| | | | | Pre-refunded/Escrowed to Maturity(A) — 18.7% | | | | | | | | | | |
| | 1,000,000 | | | OH St Hgr Edl Fac Commis (Xavier Univ) Ser C Pre-refunded @ $100 | | | 5.750 | | | 11/01/18 | | | 1,014,050 | |
| | 1,500,000 | | | OH St Hosp Fac Rev (Cleveland Clinic Hlth) Ser B Pre-refunded @ $100 | | | 5.125 | | | 01/01/19 | | | 1,527,210 | |
| | 1,000,000 | | | Columbus OH CSD (Sch Facs Constr & Impt) UTGO Pre-refunded @ $100 | | | 4.500 | | | 06/01/19 | | | 1,026,760 | |
| | 465,000 | | | Genoa OH Area LSD (Sch Facs Constr & Impt) UTGO Pre-refunded @ $100 | | | 4.625 | | | 06/01/19 | | | 477,750 | |
| | 1,000,000 | | | Franklin Co OH Hosp Rev (Nationwide Childrens Hosp Impt) Pre-refunded @ $100 | | | 4.750 | | | 11/01/19 | | | 1,040,800 | |
| | 895,000 | | | Milton Union OH Exempt Vlg Sch Dist (Sch Impt) Pre-refunded @ $100 | | | 4.875 | | | 12/01/19 | | | 934,443 | |
| | 1,500,000 | | | Cincinnati Oh CSD (Ref Sch Impt) LTGO Pre-refunded @ $100 | | | 5.000 | | | 06/01/20 | | | 1,588,875 | |
| | 345,000 | | | Univ of Toledo OH Ser B Pre-refunded @ $100 | | | 5.000 | | | 06/01/21 | | | 375,860 | |
| | 250,000 | | | Lakewood OH CSD (Sch Facs Impt) UTGO Ser A Pre-refunded @ $100 | | | 5.000 | | | 11/01/22 | | | 281,270 | |
Touchstone Ohio Tax-Free Bond Fund (Continued)
| Principal | | | | | Interest | | | Maturity | | Market | |
| Amount | | | | | Rate | | | Date | | Value | |
| | | | | | | | | | | | |
| | | | | Pre-refunded/Escrowed to Maturity(A) — 18.7% (Continued) | | | | | | | | | | |
| $ | 350,000 | | | Montgomery Co OH Rev (Prerefunded Catholic Hlth Initiatives) Pre-refunded @ $100 | | | 5.250 | % | | 11/12/23 | | $ | 401,982 | |
| | | | | Total Pre-refunded/Escrowed to Maturity | | | | | | | | $ | 8,669,000 | |
| | | | | | | | | | | | | | | |
| | | | | General Obligation Bonds — 15.4% | | | | | | | | | | |
| | 845,000 | | | Licking Heights OH LSD UTGO | | | 6.400 | | | 12/01/28 | | | 1,029,134 | |
| | 250,000 | | | S W OH LSD Hamilton UTGO Ser A | | | 4.000 | | | 01/15/32 | | | 266,955 | |
| | 1,000,000 | | | Toledo OH CSD (Ref Sch Facs Impt) UTGO | | | 5.000 | | | 12/01/32 | | | 1,120,390 | |
| | 300,000 | | | Upper Arlington OH (Ref Various Purpose) LTGO | | | 4.000 | | | 12/01/32 | | | 318,567 | |
| | 250,000 | | | S W OH LSD Hamilton UTGO Ser A | | | 4.000 | | | 01/15/34 | | | 263,792 | |
| | 345,000 | | | Bowling Green OH CSD (Ref) UTGO | | | 5.000 | | | 12/01/34 | | | 391,920 | |
| | 700,000 | | | Miami Vly Career Tech Center O UTGO | | | 4.000 | | | 12/01/34 | | | 736,883 | |
| | 500,000 | | | Three Rivers OH LSD (Ref) UTGO | | | 5.000 | | | 12/01/34 | | | 562,885 | |
| | 435,000 | | | Miami Trace OH LSD UTGO | | | 5.000 | | | 12/01/35 | | | 493,964 | |
| | 200,000 | | | Milford OH Exempt Vlg Sch Dist (Ref) UTGO | | | 5.000 | | | 12/01/35 | | | 226,930 | |
| | 500,000 | | | Lakewood OH (Ref) LTGO | | | 5.000 | | | 12/01/36 | | | 571,045 | |
| | 1,000,000 | | | Hamilton Co Oh (Ref) LTGO Ser A | | | 5.000 | | | 12/01/37 | | | 1,163,790 | |
| | | | | Total General Obligation Bonds | | | | | | | | $ | 7,146,255 | |
| | | | | | | | | | | | | | | |
| | | | | Variable Rate Demand Notes(B)(C) — 2.1% | | | | | | | | | | |
| | | | | | | | | | | | | | | |
| | 700,000 | | | Allen Co OH Hosp Facs Rev (Adj Catholic Healthcare) Ser C (LOC: Union Bank NA)(D) | | | 1.450 | | | 06/01/34 | | | 700,000 | |
| | 250,000 | | | Montgomery Co OH Hosp Rev (Ref Premier Health Miami V) (LOC: Barclays Bank PLC)(D) | | | 1.250 | | | 11/15/45 | | | 250,000 | |
| | | | | Total Variable Rate Demand Notes | | | | | | | | $ | 950,000 | |
| | | | | | | | | | | | | | | |
| | | | | Total Investment Securities —99.4% | | | | | | | | | | |
| | | | | (Cost $44,360,368) | | | | | | | | $ | 45,974,588 | |
| | | | | | | | | | | | | | | |
| | | | | Other Assets in Excess of Liabilities — 0.6% | | | | | | | | | 271,760 | |
| | | | | | | | | | | | | | | |
| | | | | Net Assets — 100.0% | | | | | | | | $ | 46,246,348 | |
| (A) | Bonds denoted as pre-refunded are anticipated to be redeemed prior to their scheduled maturity. The dates indicated are the stipulated pre-refunded dates. |
| (B) | Floating and variable rate demand notes (“put bonds”) earn interest at a coupon rate which fluctuates at specified intervals, usually daily, monthly or semi-annually. The interest rates shown are the coupon rates in effect at June 30, 2018. Put bonds may be redeemed at the discretion of the holder on specified dates prior to maturity. Mandatory put bonds are automatically redeemed at a specified put date unless action is taken by the holder to prevent redemption. |
| (C) | Demand Feature - Maturities shown are the final maturities, not the date on which principal could be recovered through the demand feature. |
| (D) | Certain variable rate securities are not based on a published reference rate and spread but are determined by the issuer or agent and are based on current market conditions. These securities do not indicate a reference rate and spread in their description. |
Touchstone Ohio Tax-Free Bond Fund (Continued)
As of June 30, 2018, the Touchstone Ohio Tax-Free Bond Fund was invested exclusively in debt obligations issued by the State of Ohio and its political subdivisions, agencies, authorities and instrumentalities and by other issuers, the interest from which is exempt from Ohio personal income tax. The Touchstone Ohio Tax-Free Bond Fund is a non-diversified Fund under the Investment Company Act of 1940. Thus, the Fund may invest in fewer issuers than those of a diversified fund. As of June 30, 2018, there were no investments of 10% or greater in any one issuer held by the Fund.
Portfolio Abbreviations:
COP – Certificates of Participation
CSD – City School District
EDR – Economic Development Revenue
LOC – Letter of Credit
LSD – Local School District
LTGO – Limited Tax General Obligation
UTGO – Unlimited Tax General Obligation
Other Information:
The inputs or methodology used for valuing securities may not be an indication of the risk associated with investing in those securities. For more information on valuation inputs, and their aggregation into the levels used in the table below, please refer to the security valuation section in the accompanying Notes to Financial Statements.
| | | Valuation inputs at Reporting Date: | |
| Description | | Level 1 | | | Level 2 | | | Level 3 | | | Total | |
| Municipal Bonds | | $ | — | | | $ | 45,974,588 | | | $ | — | | | $ | 45,974,588 | |
See accompanying Notes to Financial Statements.
Portfolio of Investments
Touchstone Small Cap Value Opportunities Fund – June 30, 2018
| | | | | | Market | |
| | | Shares | | | Value | |
| | | | | | | |
| Common Stocks — 100.5% | | | | | | | | |
| | | | | | | | | |
| Financials — 33.4% | | | | | | | | |
| Argo Group International Holdings Ltd. (Bermuda) | | | 17,442 | | | $ | 1,014,252 | |
| Bancorp, Inc. (The)* | | | 111,560 | | | | 1,166,918 | |
| BofI Holding, Inc.* | | | 18,100 | | | | 740,471 | |
| Boston Private Financial Holdings, Inc. | | | 47,478 | | | | 754,900 | |
| Cowen, Inc.* | | | 47,475 | | | | 657,529 | |
| Customers Bancorp, Inc.* | | | 43,020 | | | | 1,220,908 | |
| First Bancorp/Southern Pines NC | | | 25,700 | | | | 1,051,387 | |
| First Busey Corp. | | | 37,000 | | | | 1,173,640 | |
| First Foundation, Inc.* | | | 58,700 | | | | 1,088,298 | |
| FirstCash, Inc. | | | 7,400 | | | | 664,890 | |
| Genworth Financial, Inc. - Class A* | | | 85,800 | | | | 386,100 | |
| Green Dot Corp. - Class A* | | | 7,900 | | | | 579,781 | |
| Greenlight Capital Re Ltd. (Cayman Islands) - Class A* | | | 32,700 | | | | 464,340 | |
| HomeStreet, Inc.* | | | 33,165 | | | | 893,797 | |
| Investors Bancorp, Inc. | | | 47,200 | | | | 603,688 | |
| James River Group Holdings Ltd. (Bermuda) | | | 13,250 | | | | 520,592 | |
| MBIA, Inc.* | | | 55,300 | | | | 499,912 | |
| Nationstar Mortgage Holdings, Inc.* | | | 52,900 | | | | 927,337 | |
| Popular, Inc. (Puerto Rico) | | | 11,400 | | | | 515,394 | |
| Radian Group, Inc. | | | 30,900 | | | | 501,198 | |
| Republic First Bancorp, Inc.* | | | 85,500 | | | | 671,175 | |
| Simmons First National Corp. - Class A | | | 28,400 | | | | 849,160 | |
| South State Corp. | | | 8,800 | | | | 759,000 | |
| Stewart Information Services Corp. | | | 15,800 | | | | 680,506 | |
| Texas Capital Bancshares, Inc.* | | | 8,300 | | | | 759,450 | |
| | | | | | | | 19,144,623 | |
| | | | | | | | | |
| Industrials — 15.8% | | | | | | | | |
| Air Transport Services Group, Inc.* | | | 38,500 | | | | 869,715 | |
| Apogee Enterprises, Inc. | | | 17,500 | | | | 842,975 | |
| Casella Waste Systems, Inc. - Class A* | | | 29,600 | | | | 758,056 | |
| Comfort Systems USA, Inc. | | | 14,500 | | | | 664,100 | |
| Covanta Holding Corp. | | | 44,500 | | | | 734,250 | |
| Dycom Industries, Inc.* | | | 7,600 | | | | 718,276 | |
| EnerSys | | | 9,500 | | | | 709,080 | |
| MRC Global, Inc.* | | | 38,250 | | | | 828,877 | |
| NCI Building Systems, Inc.* | | | 33,700 | | | | 707,700 | |
| SP Plus Corp.* | | | 15,513 | | | | 577,084 | |
| Textainer Group Holdings Ltd.* | | | 34,300 | | | | 545,370 | |
| Tutor Perini Corp.* | | | 22,500 | | | | 415,125 | |
| YRC Worldwide, Inc.* | | | 67,432 | | | | 677,692 | |
| | | | | | | | 9,048,300 | |
| | | | | | | | | |
| Consumer Discretionary — 13.2% | | | | | | | | |
| AMC Entertainment Holdings, Inc. - Class A | | | 24,300 | | | | 386,370 | |
| Bloomin' Brands, Inc. | | | 22,300 | | | | 448,230 | |
| Boot Barn Holdings, Inc.* | | | 27,800 | | | | 576,850 | |
| Children's Place, Inc. (The) | | | 3,900 | | | | 471,120 | |
| Michaels Cos., Inc. (The)* | | | 32,700 | | | | 626,859 | |
| Motorcar Parts of America, Inc.* | | | 20,200 | | | | 377,942 | |
| New Media Investment Group, Inc. | | | 26,487 | | | | 489,480 | |
| Oxford Industries, Inc. | | | 7,700 | | | | 638,946 | |
| Red Robin Gourmet Burgers, Inc.* | | | 10,000 | | | | 466,000 | |
| SeaWorld Entertainment, Inc.* | | | 36,500 | | | | 796,430 | |
| Stars Group, Inc. (The) (Canada)* | | | 16,600 | | | | 602,580 | |
| Stoneridge, Inc.* | | | 15,300 | | | | 537,642 | |
| TRI Pointe Group, Inc.* | | | 41,400 | | | | 677,304 | |
| ZAGG, Inc.* | | | 27,830 | | | | 481,459 | |
| | | | | | | | 7,577,212 | |
| | | | | | | | | |
| Information Technology — 11.3% | | | | | | | | |
| ACI Worldwide, Inc.* | | | 29,800 | | | | 735,166 | |
| Brooks Automation, Inc. | | | 9,300 | | | | 303,366 | |
| CACI International, Inc. - Class A* | | | 5,175 | | | | 872,246 | |
| Conduent, Inc.* | | | 13,700 | | | | 248,929 | |
| Diebold Nixdorf, Inc. | | | 19,500 | | | | 233,025 | |
| Entegris, Inc. | | | 16,100 | | | | 545,790 | |
| Finisar Corp.* | | | 39,100 | | | | 703,800 | |
| Imperva, Inc.* | | | 8,200 | | | | 395,650 | |
| Methode Electronics, Inc. | | | 16,900 | | | | 681,070 | |
| Net 1 UEPS Technologies, Inc. (South Africa)* | | | 51,200 | | | | 464,896 | |
| Semtech Corp.* | | | 17,800 | | | | 837,490 | |
| TiVo Corp. | | | 31,816 | | | | 427,925 | |
| | | | | | | | 6,449,353 | |
| | | | | | | | | |
| Real Estate — 7.1% | | | | | | | | |
| Columbia Property Trust, Inc. REIT | | | 31,300 | | | | 710,823 | |
| CoreCivic, Inc. REIT | | | 19,300 | | | | 461,077 | |
| Equity Commonwealth REIT* | | | 27,100 | | | | 853,650 | |
| Retail Opportunity Investments Corp. REIT | | | 37,600 | | | | 720,416 | |
| RLJ Lodging Trust REIT | | | 29,537 | | | | 651,291 | |
| Spirit Realty Capital, Inc. REIT | | | 84,600 | | | | 679,338 | |
| | | | | | | | 4,076,595 | |
| | | | | | | | | |
| Health Care — 5.6% | | | | | | | | |
| AMN Healthcare Services, Inc.* | | | 11,625 | | | | 681,225 | |
| BioTelemetry, Inc.* | | | 16,200 | | | | 729,000 | |
| OraSure Technologies, Inc.* | | | 18,400 | | | | 303,048 | |
| Patterson Cos., Inc. | | | 17,400 | | | | 394,458 | |
| Syneos Health, Inc.* | | | 15,000 | | | | 703,500 | |
| Tivity Health, Inc.* | | | 11,300 | | | | 397,760 | |
| | | | | | | | 3,208,991 | |
| | | | | | | | | |
| Energy — 5.1% | | | | | | | | |
| Basic Energy Services, Inc.* | | | 44,100 | | | | 489,951 | |
| Delek US Holdings, Inc. | | | 11,900 | | | | 597,023 | |
| Laredo Petroleum, Inc.* | | | 65,600 | | | | 631,072 | |
| McDermott International, Inc.* | | | 26,033 | | | | 511,548 | |
| Ring Energy, Inc.* | | | 55,000 | | | | 694,100 | |
| | | | | | | | 2,923,694 | |
| | | | | | | | | |
| Consumer Staples — 3.6% | | | | | | | | |
| B&G Foods, Inc. | | | 19,000 | | | | 568,100 | |
| Casey's General Stores, Inc. | | | 6,050 | | | | 635,734 | |
| Turning Point Brands, Inc. | | | 15,000 | | | | 478,500 | |
| United Natural Foods, Inc.* | | | 8,500 | | | | 362,610 | |
| | | | | | | | 2,044,944 | |
Touchstone Small Cap Value Opportunities Fund (Continued)
| | | | | | Market | |
| | | Shares | | | Value | |
| | | | | | | |
| Common Stocks — 100.5% (Continued) | | | | | | | | |
| | | | | | | | | |
| Utilities — 2.0% | | | | | | | | |
| NorthWestern Corp. | | | 5,800 | | | $ | 332,050 | |
| Portland General Electric Co. | | | 19,500 | | | | 833,820 | |
| | | | | | | | 1,165,870 | |
| | | | | | | | | |
| Materials — 1.7% | | | | | | | | |
| Compass Minerals International, Inc. | | | 7,300 | | | | 479,975 | |
| Ferroglobe PLC (United kingdom) | | | 61,400 | | | | 526,198 | |
| Ferroglobe Representation and | | | | | | | | |
| Warranty Insurance Trust(A) | | | 173,700 | | | | — | |
| | | | | | | | 1,006,173 | |
| | | | | | | | | |
| Telecommunication Services — 1.7% | | | | | | | | |
| Vonage Holdings Corp.* | | | 74,000 | | | | 953,860 | |
| Total Common Stocks | | | | | | $ | 57,599,615 | |
| | | | | | | | | |
| Short-Term Investment Fund — 0.1% | | | | | | | | |
| Dreyfus Government Cash | | | | | | | | |
Management, Institutional Shares,
1.81%∞Ω | | | 32,204 | | | $ | 32,204 | |
| | | | | | | | | |
| Total Investment Securities —100.6% | | | | | | | | |
| (Cost $46,938,955) | | | | | | $ | 57,631,819 | |
| | | | | | | | | |
| Liabilities in Excess of Other Assets — (0.6%) | | | | | | | (341,922 | ) |
| | | | | | | | | |
| Net Assets — 100.0% | | | | | | $ | 57,289,897 | |
| (A) | Level 3 - For more information on valuation inputs, and their aggregation into the levels used in the table below, please refer to the security valuation section in the accompanying Notes to Financial Statements. |
| * | Non-income producing security. |
| Ω | Represents the 7-day SEC yield as of June 30, 2018. |
Portfolio Abbreviations:
PLC - Public Limited Company
REIT - Real Estate Investment Trust
Other Information:
The inputs or methodology used for valuing securities may not be an indication of the risk associated with investing in those securities. For more information on valuation inputs, and their aggregation into the levels used in the table below, please refer to the security valuation section in the accompanying Notes to Financial Statements.
| | | Valuation inputs at Reporting Date: | |
| Description | | Level 1 | | | Level 2 | | | Level 3 | | | Total | |
| Common Stocks | | $ | 57,599,615 | | | $ | — | | | $ | — | | | $ | 57,599,615 | |
| Short-Term Investment Fund | | | 32,204 | | | | — | | | | — | | | | 32,204 | |
| Total | | $ | 57,631,819 | | | $ | — | | | $ | — | | | $ | 57,631,819 | |
See accompanying Notes to Financial Statements.
Portfolio of Investments
Touchstone Value Fund – June 30, 2018
| | | | | | Market | |
| | | Shares | | | Value | |
| | | | | | | |
| Common Stocks — 97.5% | | | | | | | | |
| | | | | | | | | |
| Financials — 18.7% | | | | | | | | |
| American Express Co. | | | 97,933 | | | $ | 9,597,434 | |
| American International Group, Inc. | | | 180,307 | | | | 9,559,877 | |
| Bank of America Corp. | | | 291,051 | | | | 8,204,728 | |
| Bank of New York Mellon Corp. (The) | | | 73,229 | | | | 3,949,240 | |
| Citigroup, Inc. | | | 124,593 | | | | 8,337,764 | |
| JPMorgan Chase & Co. | | | 117,335 | | | | 12,226,307 | |
| Wells Fargo & Co. | | | 234,007 | | | | 12,973,348 | |
| XL Group Ltd. (Bermuda) | | | 128,921 | | | | 7,213,130 | |
| | | | | | | | 72,061,828 | |
| | | | | | | | | |
| Health Care — 18.3% | | | | | | | | |
| Anthem, Inc. | | | 40,543 | | | | 9,650,450 | |
| Cardinal Health, Inc. | | | 99,285 | | | | 4,848,087 | |
| CVS Health Corp. | | | 142,091 | | | | 9,143,556 | |
| Express Scripts Holding Co.* | | | 87,519 | | | | 6,757,342 | |
| Johnson & Johnson | | | 63,512 | | | | 7,706,546 | |
| Medtronic PLC (Ireland) | | | 139,715 | | | | 11,961,001 | |
| Merck & Co., Inc. | | | 77,656 | | | | 4,713,719 | |
| Pfizer, Inc. | | | 286,676 | | | | 10,400,605 | |
| Sanofi (France) ADR | | | 136,608 | | | | 5,465,686 | |
| | | | | | | | 70,646,992 | |
| | | | | | | | | |
| Energy — 17.0% | | | | | | | | |
| BP PLC (United Kingdom) ADR | | | 301,846 | | | | 13,782,288 | |
| Chevron Corp. | | | 74,923 | | | | 9,472,515 | |
| ConocoPhillips | | | 187,819 | | | | 13,075,959 | |
| Occidental Petroleum Corp. | | | 114,457 | | | | 9,577,762 | |
| Phillips 66 | | | 124,876 | | | | 14,024,824 | |
| Schlumberger Ltd. | | | 81,120 | | | | 5,437,474 | |
| | | | | | | | 65,370,822 | |
| | | | | | | | | |
| Information Technology — 11.5% | | | | | | | | |
| Broadcom, Inc. | | | 14,818 | | | | 3,595,439 | |
| Microsoft Corp. | | | 126,801 | | | | 12,503,847 | |
| Oracle Corp. | | | 254,556 | | | | 11,215,737 | |
| QUALCOMM, Inc. | | | 152,481 | | | | 8,557,234 | |
| Texas Instruments, Inc. | | | 76,004 | | | | 8,379,441 | |
| | | | | | | | 44,251,698 | |
| | | | | | | | | |
| Consumer Discretionary — 11.3% | | | | | | | | |
| Advance Auto Parts, Inc. | | | 30,857 | | | | 4,187,295 | |
| Comcast Corp. - Class A | | | 304,989 | | | | 10,006,689 | |
| Dollar General Corp. | | | 139,252 | | | | 13,730,247 | |
| Lowe's Cos., Inc. | | | 138,720 | | | | 13,257,470 | |
| Twenty-First Century Fox, Inc. - Class A | | | 49,990 | | | | 2,484,003 | |
| | | | | | | | 43,665,704 | |
| | | | | | | | | |
| Industrials — 8.8% | | | | | | | | |
| General Dynamics Corp. | | | 32,347 | | | | 6,029,804 | |
| General Electric Co. | | | 585,714 | | | | 7,971,568 | |
| Johnson Controls International PLC | | | 305,290 | | | | 10,211,950 | |
| United Technologies Corp. | | | 78,776 | | | | 9,849,363 | |
| | | | | | | | 34,062,685 | |
| | | | | | | | | |
| Materials — 5.9% | | | | | | | | |
| Air Products & Chemicals, Inc. | | | 77,763 | | | | 12,110,032 | |
| DowDuPont, Inc. | | | 159,566 | | | | 10,518,591 | |
| | | | | | | | 22,628,623 | |
| | | | | | | | | |
| Consumer Staples — 4.2% | | | | | | | | |
| Altria Group, Inc. | | | 141,101 | | | | 8,013,126 | |
| Philip Morris International, Inc. | | | 100,781 | | | | 8,137,058 | |
| | | | | | | | 16,150,184 | |
| | | | | | | | | |
| Utilities — 1.2% | | | | | | | | |
| Exelon Corp. | | | 103,729 | | | | 4,418,855 | |
| | | | | | | | | |
| Telecommunication Services — 0.6% | | | | | | | | |
| Verizon Communications, Inc. | | | 44,007 | | | | 2,213,992 | |
| Total Common Stocks | | | | | | $ | 375,471,383 | |
| | | | | | | | | |
| Short-Term Investment Fund — 2.4% | | | | | | | | |
| Dreyfus Government Cash | | | | | | | | |
Management, Institutional Shares,
1.81%∞Ω | | | 9,321,432 | | | $ | 9,321,432 | |
| | | | | | | | | |
| Total Investment Securities —99.9% | | | | | | | | |
| (Cost $293,130,858) | | | | | | $ | 384,792,815 | |
| | | | | | | | | |
| Other Assets in Excess of Liabilities — 0.1% | | | | | | | 284,015 | |
| | | | | | | | | |
| Net Assets — 100.0% | | | | | | $ | 385,076,830 | |
| * | Non-income producing security. |
| Ω | Represents the 7-day SEC yield as of June 30, 2018. |
Portfolio Abbreviations:
ADR - American Depositary Receipt
PLC - Public Limited Company
Touchstone Value Fund (Continued)
Other Information:
The inputs or methodology used for valuing securities may not be an indication of the risk associated with investing in those securities. For more information on valuation inputs, and their aggregation into the levels used in the table below, please refer to the security valuation section in the accompanying Notes to Financial Statements.
| | | Valuation inputs at Reporting Date: | |
| Description | | Level 1 | | | Level 2 | | | Level 3 | | | Total | |
| Common Stocks | | $ | 375,471,383 | | | $ | — | | | $ | — | | | $ | 375,471,383 | |
| Short-Term Investment Fund | | | 9,321,432 | | | | — | | | | — | | | | 9,321,432 | |
| Total | | $ | 384,792,815 | | | $ | — | | | $ | — | | | $ | 384,792,815 | |
See accompanying Notes to Financial Statements.
This page intentionally left blank.
Statements of Assets and Liabilities
June 30, 2018
| | | | | | Touchstone | | | | | | | |
| | | Touchstone | | | International | | | Touchstone | | | | |
| | | Credit | | | Growth | | | International | | | Touchstone | |
| | | Opportunities | | | Opportunities | | | Small Cap | | | Large Cap | |
| | | Fund | | | Fund | | | Fund | | | Fund | |
| Assets | | | | | | | | | | | | | | | | |
| Investments, at cost | | $ | 54,555,367 | | | $ | 30,390,583 | | | $ | 279,623,532 | | | $ | 283,347,699 | |
| Investments, at market value (A) | | $ | 54,327,547 | | | $ | 34,362,874 | | | $ | 321,238,593 | | | $ | 367,688,344 | |
| Cash | | | 62,998 | | | | — | | | | — | | | | — | |
| Foreign currency (B) | | | 24,722 | | | | — | | | | 647,659 | | | | — | |
| Dividends and interest receivable | | | 724,161 | | | | 39,940 | | | | 547,174 | | | | 377,406 | |
| Receivable for capital shares sold | | | — | | | | — | | | | 144,625 | | | | 111,995 | |
| Receivable for investments sold | | | 265,707 | | | | — | | | | 5,698,069 | | | | — | |
| Receivable for securities lending income | | | 1,526 | | | | 254 | | | | 6,930 | | | | — | |
| Tax reclaim receivable | | | — | | | | 8,972 | | | | 287,267 | | | | — | |
| Other assets | | | 6,682 | | | | 13,449 | | | | 18,541 | | | | 24,445 | |
| Total Assets | | | 55,413,343 | | | | 34,425,489 | | | | 328,588,858 | | | | 368,202,190 | |
| | | | | | | | | | | | | | | | | |
| Liabilities | | | | | | | | | | | | | | | | |
| Written options, at market value(C) | | | 5,400 | | | | — | | | | — | | | | — | |
| Securities sold short (D) | | | 316,750 | | | | — | | | | — | | | | — | |
| Dividends and interest payable on securities sold short | | | 1,805 | | | | — | | | | — | | | | — | |
| Due to prime broker | | | 398,994 | | | | 16 | | | | — | | | | — | |
| Dividends payable | | | — | | | | — | | | | — | | | | — | |
| Deferred foreign capital gains tax(E) | | | — | | | | 11,192 | | | | — | | | | — | |
| Payable for return of collateral for securities on loan | | | 903,254 | | | | 278,400 | | | | 5,289,953 | | | | — | |
| Payable for capital shares redeemed | | | 59,079 | | | | 4,999 | | | | 190,717 | | | | 291,623 | |
| Payable for investments purchased | | | 1,284,621 | | | | — | | | | 6,745,350 | | | | — | |
| Loan payable to affiliates(F) | | | — | | | | — | | | | — | | | | — | |
| Payable to Investment Advisor | | | 38,410 | | | | 19,597 | | | | 260,748 | | | | 217,089 | |
| Payable to other affiliates | | | 115 | | | | 115 | | | | 43,270 | | | | 13,764 | |
| Payable to Trustees | | | 3,540 | | | | 3,540 | | | | 3,540 | | | | 3,540 | |
| Payable to Transfer Agent | | | 213 | | | | 2,362 | | | | 68,109 | | | | 72,662 | |
| Payable for reports to shareholders | | | 4,691 | | | | 4,646 | | | | 9,349 | | | | 10,260 | |
| Payable for professional services | | | 40,177 | | | | 27,094 | | | | 37,300 | | | | 22,813 | |
| Other accrued expenses and liabilities | | | 21,751 | | | | 7,252 | | | | 40,043 | | | | 3,539 | |
| Total Liabilities | | | 3,078,800 | | | | 359,213 | | | | 12,688,379 | | | | 635,290 | |
| Net Assets | | $ | 52,334,543 | | | $ | 34,066,276 | | | $ | 315,900,479 | | | $ | 367,566,900 | |
| | | | | | | | | | | | | | | | | |
| Net assets consist of: | | | | | | | | | | | | | | | | |
| Paid-in capital | | $ | 52,060,768 | | | $ | 25,429,178 | | | $ | 260,557,032 | | | $ | 295,865,404 | |
| Undistributed (distributions in excess of) net investment income | | | 15,138 | | | | 77,010 | | | | (2,101,065 | ) | | | 1,637,893 | |
| Accumulated net realized gains (losses) on investments, foreign currency transactions, securities sold short and written options | | | 483,826 | | | | 4,598,910 | | | | 15,832,410 | | | | (14,277,042 | ) |
| Net unrealized appreciation (depreciation) on investments, foreign currency transactions, securities sold short and written options | | | (225,189 | ) | | | 3,961,178 | | | | 41,612,102 | | | | 84,340,645 | |
| Net Assets | | $ | 52,334,543 | | | $ | 34,066,276 | | | $ | 315,900,479 | | | $ | 367,566,900 | |
| (A) Includes market value of securities on loan of: | | $ | 865,468 | | | $ | 270,864 | | | $ | 5,000,080 | | | $ | — | |
| (B) Cost of foreign currency: | | $ | 22,423 | | | $ | — | | | $ | 647,549 | | | $ | — | |
| (C) Premiums received for written options: | | $ | 3,982 | | | $ | — | | | $ | — | | | $ | — | |
| (D) Proceeds received for securities sold short: | | $ | 318,500 | | | $ | — | | | $ | — | | | $ | — | |
| (E) See Note 2 in Notes to Financial Statements. | | | | | | | | | | | | | | | | |
| (F) See Note 5 in Notes to Financial Statements. | | | | | | | | | | | | | | | | |
See accompanying Notes to Financial Statements.
Statements of Assets and Liabilities (Continued)
| Touchstone | | | Touchstone | | | Touchstone | | | | |
| Large Company | | | Ohio Tax-Free | | | Small Cap Value | | | Touchstone | |
| Growth | | | Bond | | | Opportunities | | | Value | |
| Fund | | | Fund | | | Fund | | | Fund | |
| | | | | | | | | | | |
| $ | 156,590,337 | | | $ | 44,360,368 | | | $ | 46,938,955 | | | $ | 293,130,858 | |
| $ | 247,229,202 | | | $ | 45,974,588 | | | $ | 57,631,819 | | | $ | 384,792,815 | |
| | — | | | | 47,326 | | | | — | | | | — | |
| | — | | | | — | | | | — | | | | — | |
| | 57,094 | | | | 330,248 | | | | 82,076 | | | | 680,668 | |
| | 564,071 | | | | 5,698 | | | | 5,809 | | | | 343,710 | |
| | 332,732 | | | | — | | | | 6,337,532 | | | | — | |
| | 8,783 | | | | — | | | | — | | | | — | |
| | — | | | | — | | | | — | | | | — | |
| | 16,447 | | | | 7,224 | | | | 11,756 | | | | 16,791 | |
| | 248,208,329 | | | | 46,365,084 | | | | 64,068,992 | | | | 385,833,984 | |
| | | | | | | | | | | | | | | |
| | — | | | | — | | | | — | | | | — | |
| | — | | | | — | | | | — | | | | — | |
| | — | | | | — | | | | — | | | | — | |
| | — | | | | — | | | | — | | | | — | |
| | — | | | | 27,721 | | | | — | | | | — | |
| | — | | | | — | | | | — | | | | — | |
| | 2,450,644 | | | | — | | | | — | | | | — | |
| | 1,553,908 | | | | 14,775 | | | | 1,589,088 | | | | 451,221 | |
| | — | | | | — | | | | — | | | | — | |
| | — | | | | — | | | | 5,053,272 | | | | — | |
| | 137,330 | | | | 17,446 | | | | 70,708 | | | | 196,908 | |
| | 20,900 | | | | 10,705 | | | | 4,149 | | | | 11,153 | |
| | 3,540 | | | | 3,540 | | | | 3,540 | | | | 3,540 | |
| | 18,527 | | | | 6,734 | | | | 20,394 | | | | 56,770 | |
| | 5,198 | | | | 5,049 | | | | 7,892 | | | | 10,691 | |
| | 21,883 | | | | 24,043 | | | | 21,980 | | | | 22,913 | |
| | 3,156 | | | | 8,723 | | | | 8,072 | | | | 3,958 | |
| | 4,215,086 | | | | 118,736 | | | | 6,779,095 | | | | 757,154 | |
| $ | 243,993,243 | | | $ | 46,246,348 | | | $ | 57,289,897 | | | $ | 385,076,830 | |
| | | | | | | | | | | | | | | |
| $ | 143,852,655 | | | $ | 44,650,199 | | | $ | 42,155,476 | | | $ | 282,940,551 | |
| | — | | | | (18,071 | ) | | | — | | | | 90,275 | |
| | 9,501,723 | | | | — | | | | 4,441,557 | | | | 10,384,047 | |
| | 90,638,865 | | | | 1,614,220 | | | | 10,692,864 | | | | 91,661,957 | |
| $ | 243,993,243 | | | $ | 46,246,348 | | | $ | 57,289,897 | | | $ | 385,076,830 | |
| $ | 2,370,123 | | | $ | — | | | $ | — | | | $ | — | |
| $ | — | | | $ | — | | | $ | — | | | $ | — | |
| $ | — | | | $ | — | | | $ | — | | | $ | — | |
| $ | — | | | $ | — | | | $ | — | | | $ | — | |
Statements of Assets and Liabilities (Continued)
| | | | | | Touchstone | | | | | | | |
| | | Touchstone | | | International | | | Touchstone | | | | |
| | | Credit | | | Growth | | | International | | | Touchstone | |
| | | Opportunities | | | Opportunities | | | Small Cap | | | Large Cap | |
| | | Fund | | | Fund | | | Fund | | | Fund | |
| | | | | | | | | | | | | |
| Pricing of Class A Shares | | | | | | | | | | | | | | | | |
| Net assets applicable to Class A shares | | $ | 153,053 | | | $ | 918,026 | | | $ | 11,727,373 | | | $ | 2,975,145 | |
| Shares of beneficial interest outstanding (unlimited number of shares authorized, no par value) | | | 15,362 | | | | 36,549 | | | | 655,490 | | | | 224,192 | |
| Net asset value price per share* | | $ | 9.96 | | | $ | 25.12 | | | $ | 17.89 | | | $ | 13.27 | |
| Maximum sales charge - Class A shares | | | 5.75 | % | | | 5.75 | % | | | 5.75 | % | | | 5.75 | % |
| Maximum offering price per share | | | | | | | | | | | | | | | | |
| (100%/(100%-maximum sales charge) of net asset value adjusted to the nearest cent) - Class A shares | | $ | 10.57 | | | $ | 26.65 | | | $ | 18.98 | | | $ | 14.08 | |
| | | | | | | | | | | | | | | | | |
| Pricing of Class C Shares | | | | | | | | | | | | | | | | |
| Net assets applicable to Class C shares | | $ | 22,333 | | | $ | 436,284 | | | $ | 2,498,104 | | | $ | 7,848,505 | |
| Shares of beneficial interest outstanding (unlimited number of shares authorized, no par value) | | | 2,234 | | | | 17,618 | | | | 142,121 | | | | 601,833 | |
| Net asset value and offering price per share** | | $ | 10.00 | | | $ | 24.76 | | | $ | 17.58 | | | $ | 13.04 | |
| | | | | | | | | | | | | | | | | |
| Pricing of Class Y Shares | | | | | | | | | | | | | | | | |
| Net assets applicable to Class Y shares | | $ | 443,788 | | | $ | 4,553,387 | | | $ | 144,172,902 | | | $ | 231,984,488 | |
| Shares of beneficial interest outstanding (unlimited number of shares authorized, no par value) | | | 44,576 | | | | 180,774 | | | | 7,888,074 | | | | 17,429,521 | |
| Net asset value, offering price and redemption price per share | | $ | 9.96 | | | $ | 25.19 | | | $ | 18.28 | | | $ | 13.31 | |
| | | | | | | | | | | | | | | | | |
| Pricing of Institutional Class Shares | | | | | | | | | | | | | | | | |
| Net assets applicable to Institutional Class shares | | $ | 51,715,369 | | | $ | 28,158,579 | | | $ | 157,502,100 | | | $ | 124,758,762 | |
| Shares of beneficial interest outstanding (unlimited number of shares authorized, no par value) | | | 5,193,059 | | | | 1,114,162 | | | | 8,574,035 | | | | 9,358,658 | |
| Net asset value, offering price and redemption price per share | | $ | 9.96 | | | $ | 25.27 | | | $ | 18.37 | | | $ | 13.33 | |
* There is no sales load on subscriptions of $1 million or more. Redemptions that were part of a $1 million or more subscription may be subject to a contingent deferred sales load if redeemed within a one-year period from the date of purchase.
** Redemption price per share varies by length of time shares are held due to the terms of the contingent deferred sales charge.
See accompanying Notes to Financial Statements.
Statements of Assets and Liabilities (Continued)
| Touchstone | | | Touchstone | | | Touchstone | | | | |
| Large Company | | | Ohio Tax-Free | | | Small Cap Value | | | Touchstone | |
| Growth | | | Bond | | | Opportunities | | | Value | |
| Fund | | | Fund | | | Fund | | | Fund | |
| | | | | | | | | | | |
| $ | 3,416,567 | | | $ | 35,728,238 | | | $ | 2,332,853 | | | $ | 36,968,367 | |
| | 82,672 | | | | 3,153,578 | | | | 125,366 | | | | 3,726,441 | |
| $ | 41.33 | | | $ | 11.33 | | | $ | 18.61 | | | $ | 9.92 | |
| | 5.75 | % | | | 4.75 | % | | | 5.75 | % | | | 5.75 | % |
| | | | | | | | | | | | | | | |
| $ | 43.85 | | | $ | 11.90 | | | $ | 19.75 | | | $ | 10.53 | |
| | | | | | | | | | | | | | | |
| $ | 236,018 | | | $ | 5,362,630 | | | $ | 492,960 | | | $ | 3,653,552 | |
| | 5,793 | | | | 473,336 | | | | 27,644 | | | | 369,389 | |
| $ | 40.74 | | | $ | 11.33 | | | $ | 17.83 | | | $ | 9.89 | |
| | | | | | | | | | | | | | | |
| $ | 15,961,273 | | | $ | 4,595,647 | | | $ | 46,224,498 | | | $ | 81,987,538 | |
| | 384,376 | | | | 405,638 | | | | 2,327,260 | | | | 8,233,490 | |
| $ | 41.53 | | | $ | 11.33 | | | $ | 19.86 | | | $ | 9.96 | |
| | | | | | | | | | | | | | | |
| $ | 224,379,385 | | | $ | 559,833 | | | $ | 8,239,586 | | | $ | 262,467,373 | |
| | 5,392,643 | | | | 49,414 | | | | 408,587 | | | | 26,425,633 | |
| $ | 41.61 | | | $ | 11.33 | | | $ | 20.17 | | | $ | 9.93 | |
Statements of Operations
For the Year Ended June 30, 2018
| | | | | | Touchstone | | | | |
| | | Touchstone | | | International | | | Touchstone | |
| | | Credit | | | Growth | | | International | |
| | | Opportunities | | | Opportunities | | | Small Cap | |
| | | Fund | | | Fund | | | Fund | |
| Investment Income | | | | | | | | | | | | |
| Dividends(A) | | $ | 41,621 | | | $ | 381,118 | | | $ | 6,799,187 | |
| Interest | | | 3,417,344 | | | | — | | | | — | |
| Income from securities loaned | | | 12,699 | | | | 7,100 | | | | 116,209 | |
| Total Investment Income | | | 3,471,664 | | | | 388,218 | | | | 6,915,396 | |
| Expenses | | | | | | | | | | | | |
| Investment advisory fees | | | 564,894 | | | | 259,908 | | | | 3,178,374 | |
| Administration fees | | | 74,463 | | | | 43,026 | | | | 487,905 | |
| Compliance fees and expenses | | | 1,402 | | | | 1,402 | | | | 1,402 | |
| Custody fees | | | 23,505 | | | | 10,160 | | | | 103,986 | |
| Professional fees | | | 50,703 | | | | 26,512 | | | | 44,369 | |
| Transfer Agent fees, Class A | | | 241 | | | | 867 | | | | 21,261 | |
| Transfer Agent fees, Class C | | | 65 | | | | 277 | | | | 3,555 | |
| Transfer Agent fees, Class Y | | | 157 | | | | 814 | | | | 163,779 | |
| Transfer Agent fees, Institutional Class | | | 84 | | | | 8,508 | | | | 67,408 | |
| Registration Fees, Class A | | | 3,331 | | | | 9,701 | | | | 17,146 | |
| Registration Fees, Class C | | | 3,778 | | | | 3,563 | | | | 10,763 | |
| Registration Fees, Class Y | | | 5,426 | | | | 4,160 | | | | 17,821 | |
| Registration Fees, Institutional Class | | | 3,221 | | | | 4,043 | | | | 18,567 | |
| Dividend expense on securities sold short | | | 625 | | | | — | | | | — | |
| Interest expense on securities sold short | | | 36,652 | | | | — | | | | — | |
| Reports to Shareholders, Class A | | | 3,304 | | | | 3,376 | | | | 4,434 | |
| Reports to Shareholders, Class C | | | 3,273 | | | | 3,299 | | | | 3,690 | |
| Reports to Shareholders, Class Y | | | 3,284 | | | | 3,298 | | | | 12,997 | |
| Reports to Shareholders, Institutional Class | | | 3,272 | | | | 3,320 | | | | 4,952 | |
| Distribution expenses, Class A | | | 210 | | | | 1,529 | | | | 33,856 | |
| Distribution and shareholder servicing expenses, Class C | | | 222 | | | | 2,504 | | | | 28,203 | |
| Trustee fees | | | 14,488 | | | | 14,488 | | | | 14,488 | |
| Other expenses | | | 42,194 | | | | 14,121 | | | | 104,683 | |
| Total Expenses | | | 838,794 | | | | 418,876 | | | | 4,343,639 | |
| Fees waived by the Advisor and/or Affiliates(B) | | | (112,467 | ) | | | (110,285 | ) | | | (112,506 | ) |
| Fees recouped by the Advisor(B) | | | — | | | | — | | | | 7,559 | |
| Net Expenses | | | 726,327 | | | | 308,591 | | | | 4,238,692 | |
| Net Investment Income (Loss) | | | 2,745,337 | | | | 79,627 | | | | 2,676,704 | |
| Realized and Unrealized Gains (Losses) on Investments | | | | | | | | | | | | |
| Net realized gains on investments | | | 885,909 | | | | 5,138,900 | | | | 35,280,826 | |
| Net realized gains (losses) on foreign currency transactions | | | 11 | | | | (2,617 | ) | | | (184,486 | ) |
| Net realized gains on securities sold short | | | 9,103 | | | | — | | | | — | |
| Net realized losses on written options | | | (11,746 | ) | | | — | | | | — | |
| Net change in unrealized appreciation (depreciation) on investments(C) | | | (1,659,611 | ) | | | (1,526,361 | ) | | | (6,523,413 | ) |
| Net change in unrealized appreciation (depreciation) on foreign currency transactions | | | 537 | | | | 33 | | | | (37,125 | ) |
| Net change in unrealized appreciation (depreciation) on securities sold short | | | (40,750 | ) | | | — | | | | — | |
| Net change in unrealized appreciation (depreciation) on written options | | | (1,418 | ) | | | — | | | | — | |
| Net change in unrealized appreciation (depreciation) on unfunded loan commitments | | | 432 | | | | — | | | | — | |
| Net Realized and Unrealized Gains (Losses) on Investments | | | (817,533 | ) | | | 3,609,955 | | | | 28,535,802 | |
| Change in Net Assets Resulting from Operations | | $ | 1,927,804 | | | $ | 3,689,582 | | | $ | 31,212,506 | |
| (A) Net of foreign tax withholding of: | | $ | — | | | $ | 14,580 | | | $ | 777,847 | |
| (B) | See Note 4 in Notes to Financial Statements. |
| (C) | Includes change in deferred foreign capital gains tax of $(1,366) for the International Growth Opportunities Fund. |
See accompanying Notes to Financial Statements.
Statements of Operations (Continued)
| | | | Touchstone | | | Touchstone | | | Touchstone | | | | |
| Touchstone | | | Large Company | | | Ohio | | | Small Cap Value | | | Touchstone | |
| Large Cap | | | Growth | | | Tax-Free Bond | | | Opportunities | | | Value | |
| Fund | | | Fund | | | Fund | | | Fund | | | Fund | |
| | | | | | | | | | | | | | |
| $ | 5,747,679 | | | $ | 1,251,132 | | | $ | 363 | | | $ | 966,306 | | | $ | 9,731,971 | |
| | — | | | | — | | | | 1,767,402 | | | | — | | | | — | |
| | 221 | | | | 96,002 | | | | — | | | | 129,552 | | | | 1,327 | |
| | 5,747,900 | | | | 1,347,134 | | | | 1,767,765 | | | | 1,095,858 | | | | 9,733,298 | |
| | | | | | | | | | | | | | | | | | | |
| | 2,507,972 | | | | 1,692,905 | | | | 235,247 | | | | 950,509 | | | | 2,526,416 | |
| | 519,508 | | | | 327,295 | | | | 68,222 | | | | 145,078 | | | | 563,585 | |
| | 1,402 | | | | 1,402 | | | | 1,402 | | | | 1,402 | | | | 1,402 | |
| | 10,635 | | | | 11,415 | | | | 4,277 | | | | 10,583 | | | | 9,833 | |
| | 30,559 | | | | 30,835 | | | | 25,144 | | | | 25,745 | | | | 33,672 | |
| | 5,284 | | | | 3,724 | | | | 20,283 | | | | 5,233 | | | | 50,421 | |
| | 3,333 | | | | 152 | | | | 2,602 | | | | 1,000 | | | | 3,824 | |
| | 197,409 | | | | 9,597 | | | | 239 | | | | 92,231 | | | | 82,975 | |
| | 15,121 | | | | 97,572 | | | | 672 | | | | 393 | | | | 101,220 | |
| | 7,733 | | | | 7,527 | | | | 8,451 | | | | 16,898 | | | | 19,150 | |
| | 11,927 | | | | 4,325 | | | | 6,254 | | | | 8,216 | | | | 9,284 | |
| | 20,499 | | | | 11,696 | | | | 3,941 | | | | 17,026 | | | | 19,347 | |
| | 14,687 | | | | 20,203 | | | | 3,941 | | | | 16,429 | | | | 19,598 | |
| | — | | | | — | | | | — | | | | — | | | | — | |
| | — | | | | — | | | | — | | | | — | | | | — | |
| | 3,801 | | | | 3,791 | | | | 4,002 | | | | 3,483 | | | | 6,033 | |
| | 3,657 | | | | 3,393 | | | | 3,415 | | | | 3,394 | | | | 3,704 | |
| | 18,423 | | | | 3,614 | | | | 3,271 | | | | 8,311 | | | | 7,652 | |
| | 3,277 | | | | 4,236 | | | | 3,253 | | | | 3,049 | | | | 10,498 | |
| | 11,379 | | | | 7,660 | | | | 97,127 | | | | 6,374 | | | | 98,056 | |
| | 80,718 | | | | 1,271 | | | | 57,329 | | | | 6,395 | | | | 43,231 | |
| | 14,488 | | | | 14,488 | | | | 14,488 | | | | 14,488 | | | | 14,488 | |
| | 87,394 | | | | 13,116 | | | | 24,016 | | | | 26,797 | | | | 42,938 | |
| | 3,569,206 | | | | 2,270,217 | | | | 587,576 | | | | 1,363,034 | | | | 3,667,327 | |
| | (472,071 | ) | | | (258,745 | ) | | | (151,489 | ) | | | (170,603 | ) | | | (708,284 | ) |
| | — | | | | — | | | | — | | | | — | | | | — | |
| | 3,097,135 | | | | 2,011,472 | | | | 436,087 | | | | 1,192,431 | | | | 2,959,043 | |
| | 2,650,765 | | | | (664,338 | ) | | | 1,331,678 | | | | (96,573 | ) | | | 6,774,255 | |
| | | | | | | | | | | | | | | | | | | |
| | 4,594,631 | | | | 11,427,420 | | | | 22,620 | | | | 11,020,896 | | | | 27,488,737 | |
| | — | | | | — | | | | — | | | | — | | | | — | |
| | — | | | | — | | | | — | | | | — | | | | — | |
| | — | | | | — | | | | — | | | | — | | | | — | |
| | 30,816,488 | | | | 28,941,080 | | | | (945,346 | ) | | | (142,942 | ) | | | (7,210,659 | ) |
| | — | | | | — | | | | — | | | | — | | | | — | |
| | — | | | | — | | | | — | | | | — | | | | — | |
| | — | | | | — | | | | — | | | | — | | | | — | |
| | — | | | | — | | | | — | | | | — | | | | — | |
| | 35,411,119 | | | | 40,368,500 | | | | (922,726 | ) | | | 10,877,954 | | | | 20,278,078 | |
| $ | 38,061,884 | | | $ | 39,704,162 | | | $ | 408,952 | | | $ | 10,781,381 | | | $ | 27,052,333 | |
| $ | — | | | $ | 37,304 | | | $ | — | | | $ | 2,413 | | | $ | 58,844 | |
Statements of Changes in Net Assets
| | | | | | Touchstone | |
| | | Touchstone | | | International | |
| | | Credit Opportunities | | | Growth | |
| | | Fund | | | Opportunities Fund | |
| | | | | | | | | | | | For the Year | |
| | | For the Year | | | For the Year | | | For the Year | | | Ended | |
| | | Ended | | | Ended | | | Ended | | | June 30, | |
| | | June 30, 2018 | | | June 30, 2017 | | | June 30, 2018 | | | 2017(A) | |
| From Operations | | | | | | | | | | | | | | | | |
| Net investment income (loss) | | $ | 2,745,337 | | | $ | 2,586,804 | | | $ | 79,627 | | | $ | (25,018 | ) |
| Net realized gains (losses) on investments, foreign currency transactions, written options and securities sold short | | | 883,277 | | | | 1,350,613 | | | | 5,136,283 | | | | 153,540 | |
| Net change in unrealized appreciation (depreciation) on investments, foreign currency transactions, securities sold short, written options and unfunded loan commitments | | | (1,700,810 | ) | | | 961,678 | | | | (1,526,328 | ) | | | 4,889,304 | |
| Change in Net Assets from Operations | | | 1,927,804 | | | | 4,899,095 | | | | 3,689,582 | | | | 5,017,826 | |
| Distributions to Shareholders from: | | | | | | | | | | | | | | | | |
| Net investment income, Class A | | | (4,696 | ) | | | (1,933 | ) | | | — | | | | — | |
| Net investment income, Class C | | | (971 | ) | | | (408 | ) | | | — | | | | — | |
| Net investment income, Class Y | | | (19,128 | ) | | | (5,964 | ) | | | — | | | | — | |
| Net investment income, Institutional Class | | | (2,779,367 | ) | | | (2,592,322 | ) | | | — | | | | — | |
| Net realized gains, Class A | | | (1,263 | ) | | | (203 | ) | | | (10,467 | ) | | | — | |
| Net realized gains, Class C | | | (590 | ) | | | (46 | ) | | | (4,915 | ) | | | — | |
| Net realized gains, Class Y | | | (8,581 | ) | | | (18 | ) | | | (5,274 | ) | | | — | |
| Net realized gains, Institutional Class | | | (1,323,281 | ) | | | (359,674 | ) | | | (500,804 | ) | | | (155,083 | ) |
| Total Distributions | | | (4,137,877 | ) | | | (2,960,568 | ) | | | (521,460 | ) | | | (155,083 | ) |
| | | | | | | | | | | | | | | | | |
| Net Increase (Decrease) from Share Transactions(B) | | | 1,013,131 | | | | (2,870,159 | ) | | | 6,637,894 | | | | 12,979,916 | |
| | | | | | | | | | | | | | | | | |
| Total Increase (Decrease) in Net Assets | | | (1,196,942 | ) | | | (931,632 | ) | | | 9,806,016 | | | | 17,842,659 | |
| Net Assets | | | | | | | | | | | | | | | | |
| Beginning of period | | | 53,531,485 | | | | 54,463,117 | | | | 24,260,260 | | | | 6,417,601 | |
| End of period | | $ | 52,334,543 | | | $ | 53,531,485 | | | $ | 34,066,276 | | | $ | 24,260,260 | |
| Undistributed (Distributions in Excess of) Net Investment Income | | $ | 15,138 | | | $ | 73,952 | | | $ | 77,010 | | | $ | — | |
| (A) | See Note 9 in Notes to Financial Statements. |
| (B) | For details on share transactions by class, see Statements of Changes in Net Assets - Capital Stock Activity on pages 68-69. |
See accompanying Notes to Financial Statements.
Statements of Changes in Net Assets (Continued)
| Touchstone | | | Touchstone | |
| International | | | Large Cap | |
| Small Cap Fund | | | Fund | |
| For the Year | | | For the Year | | | For the Year | | | For the Year | |
| Ended | | | Ended | | | Ended | | | Ended | |
| June 30, 2018 | | | June 30, 2017 | | | June 30, 2018 | | | June 30, 2017 | |
| | | | | | | | | | | |
| $ | 2,676,704 | | | $ | 2,901,003 | | | $ | 2,650,765 | | | $ | 2,607,270 | |
| | 35,096,340 | | | | 7,988,931 | | | | 4,594,631 | | | | (4,059,548 | ) |
| | (6,560,538 | ) | | | 27,492,447 | | | | 30,816,488 | | | | 45,267,795 | |
| | 31,212,506 | | | | 38,382,381 | | | | 38,061,884 | | | | 43,815,517 | |
| | | | | | | | | | | | | | | |
| | (224,474 | ) | | | (163,775 | ) | | | (15,190 | ) | | | (25,206 | ) |
| | (35,220 | ) | | | — | | | | — | | | | (13,471 | ) |
| | (4,356,261 | ) | | | (1,895,619 | ) | | | (1,521,043 | ) | | | (1,947,427 | ) |
| | (5,229,613 | ) | | | (2,380,600 | ) | | | (811,456 | ) | | | (921,412 | ) |
| | — | | | | — | | | | — | | | | — | |
| | — | | | | — | | | | — | | | | — | |
| | — | | | | — | | | | — | | | | — | |
| | — | | | | — | | | | — | | | | — | |
| | (9,845,568 | ) | | | (4,439,994 | ) | | | (2,347,689 | ) | | | (2,907,516 | ) |
| | | | | | | | | | | | | | | |
| | (20,494,615 | ) | | | (110,797,484 | ) | | | (1,585,818 | ) | | | (12,745,724 | ) |
| | | | | | | | | | | | | | | |
| | 872,323 | | | | (76,855,097 | ) | | | 34,128,377 | | | | 28,162,277 | |
| | | | | | | | | | | | | | | |
| | 315,028,156 | | | | 391,883,253 | | | | 333,438,523 | | | | 305,276,246 | |
| $ | 315,900,479 | | | $ | 315,028,156 | | | $ | 367,566,900 | | | $ | 333,438,523 | |
| $ | (2,101,065 | ) | | $ | 1,533,686 | | | $ | 1,637,893 | | | $ | 1,334,817 | |
Statements of Changes in Net Assets (Continued)
| | | Touchstone | | | Touchstone | |
| | | Large Company | | | Ohio Tax-Free | |
| | | Growth Fund | | | Bond Fund | |
| | | | | | For the Year | | | | | | | |
| | | For the Year | | | Ended | | | For the Year | | | For the Year | |
| | | Ended | | | June 30, | | | Ended | | | Ended | |
| | | June 30, 2018 | | | 2017(A) | | | June 30, 2018 | | | June 30, 2017 | |
| From Operations | | | | | | | | | | | | | | | | |
| Net investment income (loss) | | $ | (664,338 | ) | | $ | (745,449 | ) | | $ | 1,331,678 | | | $ | 1,576,300 | |
| Net realized gains (losses) on investments | | | 11,427,420 | | | | 12,366,481 | | | | 22,620 | | | | (11,341 | ) |
| Net change in unrealized appreciation (depreciation) on investments | | | 28,941,080 | | | | 34,250,486 | | | | (945,346 | ) | | | (2,357,140 | ) |
| Change in Net Assets from Operations | | | 39,704,162 | | | | 45,871,518 | | | | 408,952 | | | | (792,181 | ) |
| Distributions to Shareholders from: | | | | | | | | | | | | | | | | |
| Net investment income, Class A | | | — | | | | — | | | | (1,129,730 | ) | | | (1,419,216 | ) |
| Net investment income, Class C | | | — | | | | — | | | | (123,927 | ) | | | (155,644 | ) |
| Net investment income, Class Y | | | — | | | | — | | | | (63,307 | ) | | | (66 | ) |
| Net investment income, Institutional Class | | | — | | | | — | | | | (14,365 | ) | | | (66 | ) |
| Net realized gains, Class A | | | (79,495 | ) | | | (642 | ) | | | — | | | | (66,722 | ) |
| Net realized gains, Class C | | | (4,037 | ) | | | (86 | ) | | | — | | | | (10,018 | ) |
| Net realized gains, Class Y | | | (334,448 | ) | | | (167,270 | ) | | | — | | | | (3 | ) |
| Net realized gains, Institutional Class | | | (5,903,548 | ) | | | (6,208,313 | ) | | | — | | | | (3 | ) |
| Total Distributions | | | (6,321,528 | ) | | | (6,376,311 | ) | | | (1,331,329 | ) | | | (1,651,738 | ) |
| | | | | | | | | | | | | | | | | |
| Net Increase (Decrease) from Share Transactions(B) | | | 11,058,131 | | | | (20,047,053 | ) | | | (2,169,116 | ) | | | (8,137,523 | ) |
| | | | | | | | | | | | | | | | | |
| Total Increase (Decrease) in Net Assets | | | 44,440,765 | | | | 19,448,154 | | | | (3,091,493 | ) | | | (10,581,442 | ) |
| Net Assets | | | | | | | | | | | | | | | | |
| Beginning of period | | | 199,552,478 | | | | 180,104,324 | | | | 49,337,841 | | | | 59,919,283 | |
| End of period | | $ | 243,993,243 | | | $ | 199,552,478 | | | $ | 46,246,348 | | | $ | 49,337,841 | |
| Undistributed (Distributions in Excess of) Net Investment Income | | $ | — | | | $ | — | | | $ | (18,071 | ) | | $ | (18,495 | ) |
| (A) | See Note 9 in Notes to Financial Statements. |
| (B) | For details on share transactions by class, see Statements of Changes in Net Assets - Capital Stock Activity on pages 70-71. |
See accompanying Notes to Financial Statements.
Statements of Changes in Net Assets (Continued)
| Touchstone | | | | | | | |
| Small Cap | | | Touchstone | |
| Value Opportunities Fund | | | Value Fund | |
| For the Year | | | For the Year | | | For the Year | | | For the Year | |
| Ended | | | Ended | | | Ended | | | Ended | |
| June 30, 2018 | | | June 30, 2017 | | | June 30, 2018 | | | June 30, 2017 | |
| | | | | | | | | | | |
| $ | (96,573 | ) | | $ | (58,786 | ) | | $ | 6,774,255 | | | $ | 8,052,159 | |
| | 11,020,896 | | | | 2,931,189 | | | | 27,488,737 | | | | 25,998,303 | |
| | (142,942 | ) | | | 14,790,035 | | | | (7,210,659 | ) | | | 24,770,144 | |
| | 10,781,381 | | | | 17,662,438 | | | | 27,052,333 | | | | 58,820,606 | |
| | | | | | | | | | | | | | | |
| | — | | | | — | | | | (552,960 | ) | | | (828,909 | ) |
| | — | | | | — | | | | (28,376 | ) | | | (51,543 | ) |
| | — | | | | (46,779 | ) | | | (1,461,974 | ) | | | (1,682,534 | ) |
| | — | | | | (13,360 | ) | | | (4,807,215 | ) | | | (5,503,856 | ) |
| | — | | | | (4,935 | ) | | | (2,904,492 | ) | | | (98,619 | ) |
| | — | | | | (1,239 | ) | | | (312,663 | ) | | | (10,992 | ) |
| | — | | | | (136,864 | ) | | | (6,143,348 | ) | | | (167,148 | ) |
| | — | | | | (13,210 | ) | | | (18,521,160 | ) | | | (499,295 | ) |
| | — | | | | (216,387 | ) | | | (34,732,188 | ) | | | (8,842,896 | ) |
| | | | | | | | | | | | | | | |
| | (68,090,084 | ) | | | (39,330,301 | ) | | | 11,638,173 | | | | (19,099,001 | ) |
| | | | | | | | | | | | | | | |
| | (57,308,703 | ) | | | (21,884,250 | ) | | | 3,958,318 | | | | 30,878,709 | |
| | | | | | | | | | | | | | | |
| | 114,598,600 | | | | 136,482,850 | | | | 381,118,512 | | | | 350,239,803 | |
| $ | 57,289,897 | | | $ | 114,598,600 | | | $ | 385,076,830 | | | $ | 381,118,512 | |
| $ | — | | | $ | 185 | | | $ | 90,275 | | | $ | 166,545 | |
Statements of Changes in Net Assets - Capital Stock Activity
| | | Touchstone | | | Touchstone | |
| | | Credit Opportunities Fund | | | International Growth Opportunities Fund | |
| | | For the | | | For the | | | For the | | | For the | |
| | | Year Ended | | | Year Ended | | | Year Ended | | | Year Ended | |
| | | June 30, 2018 | | | June 30, 2017 | | | June 30, 2018 | | | June 30, 2017(A) | |
| | | Shares | | | Dollars | | | Shares | | | Dollars | | | Shares | | | Dollars | | | Shares | | | Dollars | |
| Class A | | | | | | | | | | | | | | | | | | | | | | | | | | | | | | | | |
| Proceeds from Shares issued | | | 11,643 | | | $ | 118,995 | | | | 3,736 | | | $ | 38,800 | | | | 38,090 | | | $ | 957,819 | | | | 6,775 | | | $ | 148,131 | |
| Reinvestment of distributions | | | 558 | | | | 5,652 | | | | 206 | | | | 2,136 | | | | 421 | | | | 10,400 | | | | — | | | | — | |
| Cost of Shares redeemed | | | (1,170 | ) | | | (11,882 | ) | | | (3,914 | ) | | | (40,567 | ) | | | (8,258 | ) | | | (209,568 | ) | | | (479 | ) | | | (10,631 | ) |
| Change from Class A Share Transactions | | | 11,031 | | | | 112,765 | | | | 28 | | | | 369 | | | | 30,253 | | | | 758,651 | | | | 6,296 | | | | 137,500 | |
| Class C | | | | | | | | | | | | | | | | | | | | | | | | | | | | | | | | |
| Proceeds from Shares issued | | | — | | | | — | | | | 2,171 | | | | 22,837 | | | | 17,363 | | | | 432,259 | | | | 133 | | | | 2,500 | |
| Reinvestment of distributions | | | 152 | | | | 1,561 | | | | 44 | | | | 454 | | | | 201 | | | | 4,915 | | | | — | | | | — | |
| Cost of Shares redeemed | | | — | | | | — | | | | (771 | ) | | | (7,946 | ) | | | (79 | ) | | | (1,996 | ) | | | — | | | | — | |
| Change from Class C Share Transactions | | | 152 | | | | 1,561 | | | | 1,444 | | | | 15,345 | | | | 17,485 | | | | 435,178 | | | | 133 | | | | 2,500 | |
| Class Y | | | | | | | | | | | | | | | | | | | | | | | | | | | | | | | | |
| Proceeds from Shares issued | | | 22,305 | | | | 226,981 | | | | 34,418 | | | | 359,007 | | | | 185,801 | | | | 4,785,015 | | | | 7,257 | | | | 162,500 | |
| Reinvestment of distributions | | | 2,719 | | | | 27,709 | | | | 578 | | | | 5,982 | | | | 214 | | | | 5,274 | | | | — | | | | — | |
| Cost of Shares redeemed | | | (10,727 | ) | | | (108,970 | ) | | | (4,974 | ) | | | (51,431 | ) | | | (12,498 | ) | | | (325,519 | ) | | | — | | | | — | |
| Change from Class Y Share Transactions | | | 14,297 | | | | 145,720 | | | | 30,022 | | | | 313,558 | | | | 173,517 | | | | 4,464,770 | | | | 7,257 | | | | 162,500 | |
| Institutional Class | | | | | | | | | | | | | | | | | | | | | | | | | | | | | | | | |
| Proceeds from Shares issued | | | 621,437 | | | | 6,398,512 | | | | 457,954 | | | | 4,766,837 | | | | 28,498 | | | | 703,725 | | | | 507,635 | | | | 9,148,447 | |
| Proceeds from Shares issued in connection with merger(A) | | | — | | | | — | | | | — | | | | — | | | | — | | | | — | | | | 263,883 | | | | 4,918,771 | |
| Reinvestment of distributions | | | 402,090 | | | | 4,102,648 | | | | 285,920 | | | | 2,951,996 | | | | 20,134 | | | | 498,928 | | | | 8,424 | | | | 155,083 | |
| Cost of Shares redeemed | | | (936,639 | ) | | | (9,748,075 | ) | | | (1,053,187 | ) | | | (10,918,264 | ) | | | (8,538 | ) | | | (223,358 | ) | | | (70,432 | ) | | | (1,544,885 | ) |
| Change from Institutional Class Share Transactions | | | 86,888 | | | | 753,085 | | | | (309,313 | ) | | | (3,199,431 | ) | | | 40,094 | | | | 979,295 | | | | 709,510 | | | | 12,677,416 | |
| Change from Share Transactions | | | 112,368 | | | $ | 1,013,131 | | | | (277,819 | ) | | $ | (2,870,159 | ) | | | 261,349 | | | $ | 6,637,894 | | | | 723,196 | | | $ | 12,979,916 | |
(A) See Note 9 in Notes to Financial Statements.
See accompanying Notes to Financial Statements.
Statements of Changes in Net Assets - Capital Stock Activity (Continued)
| Touchstone International Small Cap Fund | | | | | | Touchstone Large Cap Fund | | | | |
| For the | | | For the | | | For the | | | For the | |
| Year Ended | | | Year Ended | | | Year Ended | | | Year Ended | |
| June 30, 2018 | | | June 30, 2017 | | | June 30, 2018 | | | June 30, 2017 | |
| Shares | | | Dollars | | | Shares | | | Dollars | | | Shares | | | Dollars | | | Shares | | | Dollars | |
| | | | | | | | | | | | | | | | | | | | | | | |
| | 345,684 | | | $ | 6,430,894 | | | | 405,684 | | | $ | 6,216,965 | | | | 95,560 | | | $ | 1,247,461 | | | | 247,695 | | | $ | 2,868,502 | |
| | 9,187 | | | | 169,676 | | | | 9,986 | | | | 142,989 | | | | 1,038 | | | | 13,968 | | | | 2,099 | | | | 23,357 | |
| | (684,584 | ) | | | (12,593,056 | ) | | | (972,387 | ) | | | (14,809,628 | ) | | | (321,234 | ) | | | (4,203,183 | ) | | | (149,744 | ) | | | (1,640,326 | ) |
| | (329,713 | ) | | | (5,992,486 | ) | | | (556,717 | ) | | | (8,449,674 | ) | | | (224,636 | ) | | | (2,941,754 | ) | | | 100,050 | | | | 1,251,533 | |
| | | | | | | | | | | | | | | | | | | | | | | | | | | | | | | |
| | 29,552 | | | | 533,110 | | | | 20,392 | | | | 312,814 | | | | 71,811 | | | | 933,646 | | | | 311,441 | | | | 3,370,728 | |
| | 1,567 | | | | 28,533 | | | | — | | | | — | | | | — | | | | — | | | | 1,143 | | | | 12,600 | |
| | (60,140 | ) | | | (1,082,759 | ) | | | (142,006 | ) | | | (2,104,408 | ) | | | (156,637 | ) | | | (2,005,538 | ) | | | (216,616 | ) | | | (2,361,777 | ) |
| | (29,021 | ) | | | (521,116 | ) | | | (121,614 | ) | | | (1,791,594 | ) | | | (84,826 | ) | | | (1,071,892 | ) | | | 95,968 | | | | 1,021,551 | |
| | | | | | | | | | | | | | | | | | | | | | | | | | | | | | | |
| | 1,072,936 | | | | 20,052,296 | | | | 1,574,379 | | | | 24,648,465 | | | | 1,543,884 | | | | 20,431,285 | | | | 2,276,554 | | | | 25,680,387 | |
| | 221,715 | | | | 4,176,429 | | | | 125,225 | | | | 1,837,046 | | | | 109,646 | | | | 1,478,024 | | | | 169,257 | | | | 1,887,248 | |
| | (1,932,134 | ) | | | (36,110,600 | ) | | | (4,011,935 | ) | | | (62,391,343 | ) | | | (2,732,808 | ) | | | (35,729,564 | ) | | | (3,758,341 | ) | | | (41,934,501 | ) |
| | (637,483 | ) | | | (11,881,875 | ) | | | (2,312,331 | ) | | | (35,905,832 | ) | | | (1,079,278 | ) | | | (13,820,255 | ) | | | (1,312,530 | ) | | | (14,366,866 | ) |
| | | | | | | | | | | | | | | | | | | | | | | | | | | | | | | |
| | 4,228,129 | | | | 79,770,190 | | | | 2,784,678 | | | | 44,371,744 | | | | 1,489,272 | | | | 19,874,004 | | | | 2,273,124 | | | | 24,728,676 | |
| | — | | | | — | | | | — | | | | — | | | | — | | | | — | | | | — | | | | — | |
| | 274,388 | | | | 5,194,163 | | | | 160,912 | | | | 2,371,845 | | | | 58,429 | | | | 788,793 | | | | 82,562 | | | | 921,390 | |
| | (4,534,311 | ) | | | (87,063,491 | ) | | | (7,109,360 | ) | | | (111,393,973 | ) | | | (335,590 | ) | | | (4,414,714 | ) | | | (2,473,080 | ) | | | (26,302,008 | ) |
| | (31,794 | ) | | | (2,099,138 | ) | | | (4,163,770 | ) | | | (64,650,384 | ) | | | 1,212,111 | | | | 16,248,083 | | | | (117,394 | ) | | | (651,942 | ) |
| | (1,028,011 | ) | | $ | (20,494,615 | ) | | | (7,154,432 | ) | | $ | (110,797,484 | ) | | | (176,629 | ) | | $ | (1,585,818 | ) | | | (1,233,906 | ) | | $ | (12,745,724 | ) |
Statements of Changes in Net Assets - Capital Stock Activity (Continued)
| | | Touchstone Large Company Growth Fund | | | Touchstone Ohio Tax-Free Bond Fund | |
| | | For the | | | For the | | | For the | | | For the | |
| | | Year Ended | | | Year Ended | | | Year Ended | | | Year Ended | |
| | | June 30, 2018 | | | June 30, 2017(A) | | | June 30, 2018 | | | June 30, 2017 | |
| | | Shares | | | Dollars | | | Shares | | | Dollars | | | Shares | | | Dollars | | | Shares | | | Dollars | |
| Class A | | | | | | | | | | | | | | | | | | | | | | | | | | | | | | | | |
| Proceeds from Shares issued | | | 123,690 | | | $ | 4,870,568 | | | | 3,914 | | | $ | 118,488 | | | | 407,502 | | | $ | 4,689,822 | | | | 69,331 | | | $ | 816,892 | |
| Reinvestment of distributions | | | 2,033 | | | | 79,495 | | | | 22 | | | | 642 | | | | 70,240 | | | | 804,607 | | | | 85,777 | | | | 997,012 | |
| Cost of Shares redeemed | | | (46,986 | ) | | | (1,908,742 | ) | | | (1 | ) | | | (30 | ) | | | (1,030,455 | ) | | | (11,842,288 | ) | | | (816,120 | ) | | | (9,458,089 | ) |
| Change from Class A Share Transactions | | | 78,737 | | | | 3,041,321 | | | | 3,935 | | | | 119,100 | | | | (552,713 | ) | | | (6,347,859 | ) | | | (661,012 | ) | | | (7,644,185 | ) |
| Class C | | | | | | | | | | | | | | | | | | | | | | | | | | | | | | | | |
| Proceeds from Shares issued | | | 4,822 | | | | 193,954 | | | | 864 | | | | 30,347 | | | | 24,400 | | | | 279,406 | | | | 23,282 | | | | 274,598 | |
| Reinvestment of distributions | | | 104 | | | | 4,037 | | | | 3 | | | | 86 | | | | 8,628 | | | | 99,015 | | | | 10,784 | | | | 125,431 | |
| Cost of Shares redeemed | | | — | | | | — | | | | — | | | | — | | | | (122,815 | ) | | | (1,417,373 | ) | | | (77,880 | ) | | | (898,506 | ) |
| Change from Class C Share Transactions | | | 4,926 | | | | 197,991 | | | | 867 | | | | 30,433 | | | | (89,787 | ) | | | (1,038,952 | ) | | | (43,814 | ) | | | (498,477 | ) |
| Class Y | | | | | | | | | | | | | | | | | | | | | | | | | | | | | | | | |
| Proceeds from Shares issued | | | 137,093 | | | | 5,592,515 | | | | 318,295 | | | | 10,093,114 | | | | 411,840 | | | | 4,721,220 | | | | 208 | | | | 2,501 | |
| Reinvestment of distributions | | | 8,523 | | | | 334,448 | | | | 2,725 | | | | 80,853 | | | | 4,519 | | | | 51,370 | | | | 6 | | | | 69 | |
| Cost of Shares redeemed | | | (40,424 | ) | | | (1,666,941 | ) | | | (41,836 | ) | | | (1,333,534 | ) | | | (10,935 | ) | | | (124,361 | ) | | | — | | | | — | |
| Change from Class Y Share Transactions | | | 105,192 | | | | 4,260,022 | | | | 279,184 | | | | 8,840,433 | | | | 405,424 | | | | 4,648,229 | | | | 214 | | | | 2,570 | |
| Institutional Class | | | | | | | | | | | | | | | | | | | | | | | | | | | | | | | | |
| Proceeds from Shares issued | | | 926,758 | | | | 37,540,549 | | | | 924,524 | | | | 29,335,294 | | | | 58,836 | | | | 681,123 | | | | 209 | | | | 2,511 | |
| Reinvestment of distributions | | | 143,468 | | | | 5,638,302 | | | | 195,271 | | | | 5,795,660 | | | | 1,256 | | | | 14,365 | | | | 6 | | | | 69 | |
| Cost of Shares redeemed | | | (994,504 | ) | | | (39,620,054 | ) | | | (1,981,379 | ) | | | (64,167,973 | ) | | | (10,892 | ) | | | (126,022 | ) | | | (1 | ) | | | (11 | ) |
| Change from Institutional Class Share Transactions | | | 75,722 | | | | 3,558,797 | | | | (861,584 | ) | | | (29,037,019 | ) | | | 49,200 | | | | 569,466 | | | | 214 | | | | 2,569 | |
| Change from Share Transactions | | | 264,577 | | | $ | 11,058,131 | | | | (577,598 | ) | | $ | (20,047,053 | ) | | | (187,876 | ) | | $ | (2,169,116 | ) | | | (704,398 | ) | | $ | (8,137,523 | ) |
| (A) | See Note 9 in Notes to Financial Statements. |
See accompanying Notes to Financial Statements.
Statements of Changes in Net Assets - Capital Stock Activity (Continued)
| Touchstone Small Cap Value Opportunities Fund | | | Touchstone Value Fund | |
| For the | | | For the | | | For the | | | For the | |
| Year Ended | | | Year Ended | | | Year Ended | | | Year Ended | |
| June 30, 2018 | | | June 30, 2017 | | | June 30, 2018 | | | June 30, 2017 | |
| Shares | | | Dollars | | | Shares | | | Dollars | | | Shares | | | Dollars | | | Shares | | | Dollars | |
| | | | | | | | | | | | | | | | | | | | | | | |
| | 10,553 | | | $ | 183,105 | | | | 171,483 | | | $ | 2,679,355 | | | | 220,556 | | | $ | 2,207,890 | | | | 332,336 | | | $ | 3,160,227 | |
| | — | | | | — | | | | 269 | | | | 4,727 | | | | 327,947 | | | | 3,256,583 | | | | 79,899 | | | | 782,692 | |
| | (55,203 | ) | | | (965,109 | ) | | | (305,138 | ) | | | (4,994,452 | ) | | | (1,125,388 | ) | | | (11,384,407 | ) | | | (1,531,171 | ) | | | (14,636,648 | ) |
| | | | | | | | | | | | | | | | | | | | | | | | | | | | | | | |
| | (44,650 | ) | | | (782,004 | ) | | | (133,386 | ) | | | (2,310,370 | ) | | | (576,885 | ) | | | (5,919,934 | ) | | | (1,118,936 | ) | | | (10,693,729 | ) |
| | | | | | | | | | | | | | | | | | | | | | | | | | | | | | | |
| | 301 | | | | 5,000 | | | | 9,419 | | | | 148,718 | | | | 12,381 | | | | 124,927 | | | | 22,657 | | | | 211,830 | |
| | — | | | | — | | | | 60 | | | | 1,014 | | | | 27,913 | | | | 275,950 | | | | 4,403 | | | | 42,913 | |
| | (22,168 | ) | | | (374,023 | ) | | | (37,583 | ) | | | (592,906 | ) | | | (116,542 | ) | | | (1,169,914 | ) | | | (219,564 | ) | | | (2,088,832 | ) |
| | | | | | | | | | | | | | | | | | | | | | | | | | | | | | | |
| | (21,867 | ) | | | (369,023 | ) | | | (28,104 | ) | | | (443,174 | ) | | | (76,248 | ) | | | (769,037 | ) | | | (192,504 | ) | | | (1,834,089 | ) |
| | | | | | | | | | | | | | | | | | | | | | | | | | | | | | | |
| | 224,204 | | | | 4,130,807 | | | | 809,738 | | | | 14,256,308 | | | | 1,420,393 | | | | 14,432,337 | | | | 2,499,249 | | | | 23,943,290 | |
| | — | | | | — | | | | 9,416 | | | | 174,974 | | | | 729,059 | | | | 7,268,521 | | | | 146,549 | | | | 1,442,227 | |
| | (3,821,512 | ) | | | (73,341,632 | ) | | | (1,515,030 | ) | | | (26,650,962 | ) | | | (2,172,809 | ) | | | (22,089,267 | ) | | | (3,050,024 | ) | | | (29,219,678 | ) |
| | | | | | | | | | | | | | | | | | | | | | | | | | | | | | | |
| | (3,597,308 | ) | | | (69,210,825 | ) | | | (695,876 | ) | | | (12,219,680 | ) | | | (23,357 | ) | | | (388,409 | ) | | | (404,226 | ) | | | (3,834,161 | ) |
| | | | | | | | | | | | | | | | | | | | | | | | | | | | | | | |
| | 190,243 | | | | 3,687,200 | | | | 58,728 | | | | 998,193 | | | | 4,724,179 | | | | 47,634,334 | | | | 5,960,527 | | | | 57,086,298 | |
| | — | | | | — | | | | 1,312 | | | | 24,673 | | | | 2,318,457 | | | | 23,063,384 | | | | 531,286 | | | | 5,213,712 | |
| | (72,047 | ) | | | (1,415,432 | ) | | | (1,425,430 | ) | | | (25,379,943 | ) | | | (5,164,702 | ) | | | (51,982,165 | ) | | | (6,779,064 | ) | | | (65,037,032 | ) |
| | | | | | | | | | | | | | | | | | | | | | | | | | | | | | | |
| | 118,196 | | | | 2,271,768 | | | | (1,365,390 | ) | | | (24,357,077 | ) | | | 1,877,934 | | | | 18,715,553 | | | | (287,251 | ) | | | (2,737,022 | ) |
| | (3,545,629 | ) | | $ | (68,090,084 | ) | | | (2,222,756 | ) | | $ | (39,330,301 | ) | | | 1,201,444 | | | $ | 11,638,173 | | | | (2,002,917 | ) | | $ | (19,099,001 | ) |
Financial Highlights
| Touchstone Credit Opportunities Fund—Class A |
| Selected Data for a Share Outstanding Throughout Each Period |
| | | Year Ended | | | Year Ended | | | Period Ended | |
| | | June 30, | | | June 30, | | | June 30, | |
| | | 2018 | | | 2017 | | | 2016(A) | |
| Net asset value at beginning of period | | $ | 10.41 | | | $ | 10.05 | | | $ | 10.00 | |
| Income (loss) from investment operations: | | | | | | | | | | | | |
| Net investment income | | | 0.49 | | | | 0.45 | | | | 0.22 | |
| Net realized and unrealized gains (losses) on investments | | | (0.13 | ) | | | 0.45 | | | | 0.07 | |
| Total from investment operations | | | 0.36 | | | | 0.90 | | | | 0.29 | |
| Distributions from: | | | | | | | | | | | | |
| Net investment income | | | (0.53 | ) | | | (0.47 | ) | | | (0.23 | ) |
| Realized capital gains | | | (0.28 | ) | | | (0.07 | ) | | | (0.01 | ) |
| Total distributions | | | (0.81 | ) | | | (0.54 | ) | | | (0.24 | ) |
| Net asset value at end of period | | $ | 9.96 | | | $ | 10.41 | | | $ | 10.05 | |
| Total return(B) | | | 3.50 | % | | | 9.08 | % | | | 2.95 | %(C) |
| Ratios and supplemental data: | | | | | | | | | | | | |
| Net assets at end of period (000's) | | $ | 153 | | | $ | 45 | | | $ | 43 | |
| Ratio to average net assets: | | | | | | | | | | | | |
| Net expenses (including dividend and interest expense on securities sold short)(D) | | | 1.76 | % | | | 1.87 | % | | | 1.73 | %(E) |
| Gross expenses (including dividend and interest expense on securities sold short)(F) | | | 10.00 | % | | | 16.01 | % | | | 38.32 | %(E) |
| Net investment income | | | 5.00 | % | | | 4.44 | % | | | 3.53 | %(E) |
| Portfolio turnover rate | | | 70 | % | | | 84 | % | | | 91 | %(C) |
| Touchstone Credit Opportunities Fund—Class C |
| Selected Data for a Share Outstanding Throughout Each Period |
| | | Year Ended | | | Year Ended | | | Period Ended | |
| | | June 30, | | | June 30, | | | June 30, | |
| | | 2018 | | | 2017 | | | 2016(A) | |
| Net asset value at beginning of period | | $ | 10.44 | | | $ | 10.08 | | | $ | 10.00 | |
| Income (loss) from investment operations: | | | | | | | | | | | | |
| Net investment income | | | 0.44 | | | | 0.34 | | | | 0.17 | |
| Net realized and unrealized gains (losses) on investments | | | (0.15 | ) | | | 0.48 | | | | 0.08 | |
| Total from investment operations | | | 0.29 | | | | 0.82 | | | | 0.25 | |
| Distributions from: | | | | | | | | | | | | |
| Net investment income | | | (0.45 | ) | | | (0.39 | ) | | | (0.16 | ) |
| Realized capital gains | | | (0.28 | ) | | | (0.07 | ) | | | (0.01 | ) |
| Total distributions | | | (0.73 | ) | | | (0.46 | ) | | | (0.17 | ) |
| Net asset value at end of period | | $ | 10.00 | | | $ | 10.44 | | | $ | 10.08 | |
| Total return(B) | | | 2.69 | % | | | 8.31 | % | | | 2.59 | %(C) |
| Ratios and supplemental data: | | | | | | | | | | | | |
| Net assets at end of period (000's) | | $ | 22 | | | $ | 22 | | | $ | 6 | |
| Ratio to average net assets: | | | | | | | | | | | | |
| Net expenses (including dividend and interest expense on securities sold short)(D) | | | 2.51 | % | | | 2.62 | % | | | 2.48 | %(E) |
| Gross expenses (including dividend and interest expense on securities sold short)(F) | | | 34.60 | % | | | 73.30 | % | | | 276.34 | %(E) |
| Net investment income | | | 4.25 | % | | | 3.69 | % | | | 2.79 | %(E) |
| Portfolio turnover rate | | | 70 | % | | | 84 | % | | | 91 | %(C) |
| | | | | | | | | | | | | |
| (A) | Represents the period from commencement of operations (September 1, 2015) through June 30, 2016. |
| (B) | Total returns shown exclude the effect of applicable sales loads. If these charges were included, the returns would be lower. |
| (D) | The ratio of net expenses to average net assets excluding dividend and interest expense on securities sold short for Class A was 1.69%, 1.69% and 1.69% and for Class C was 2.44%, 2.44% and 2.44% for the years ended June 30, 2018, June 30, 2017 and for the period ended June 30, 2016, respectively. |
| (F) | The ratio of gross expenses to average net assets excluding dividend and interest expense on securities sold short for Class A was 9.93%, 15.83% and 38.28% and for Class C was 34.53%, 73.12% and 276.30% for the years ended June 30, 2018, June 30, 2017 and for the period ended June 30, 2016, respectively. |
See accompanying Notes to Financial Statements.
Financial Highlights (Continued)
| Touchstone Credit Opportunities Fund—Class Y |
| Selected Data for a Share Outstanding Throughout Each Period |
| | | Year Ended | | | Year Ended | | | Period Ended | |
| | | June 30, | | | June 30, | | | June 30, | |
| | | 2018 | | | 2017 | | | 2016(A) | |
| Net asset value at beginning of period | | $ | 10.41 | | | $ | 10.04 | | | $ | 10.00 | |
| Income (loss) from investment operations: | | | | | | | | | | | | |
| Net investment income | | | 0.50 | | | | 0.39 | | | | 0.31 | |
| Net realized and unrealized gains (losses) on investments | | | (0.12 | ) | | | 0.54 | | | | (0.02 | ) |
| Total from investment operations | | | 0.38 | | | | 0.93 | | | | 0.29 | |
| Distributions from: | | | | | | | | | | | | |
| Net investment income | | | (0.55 | ) | | | (0.49 | ) | | | (0.24 | ) |
| Realized capital gains | | | (0.28 | ) | | | (0.07 | ) | | | (0.01 | ) |
| Total distributions | | | (0.83 | ) | | | (0.56 | ) | | | (0.25 | ) |
| Net asset value at end of period | | $ | 9.96 | | | $ | 10.41 | | | $ | 10.04 | |
| Total return | | | 3.73 | % | | | 9.39 | % | | | 3.04 | %(B) |
| Ratios and supplemental data: | | | | | | | | | | | | |
| Net assets at end of period (000's) | | $ | 444 | | | $ | 315 | | | $ | 3 | |
| Ratio to average net assets: | | | | | | | | | | | | |
| Net expenses (including dividend and interest expense on securities sold short)(C) | | | 1.51 | % | | | 1.62 | % | | | 1.48 | %(D) |
| Gross expenses (including dividend and interest expense on securities sold short)(E) | | | 4.29 | % | | | 8.25 | % | | | 355.77 | %(D) |
| Net investment income | | | 5.25 | % | | | 4.69 | % | | | 3.79 | %(D) |
| Portfolio turnover rate | | | 70 | % | | | 84 | % | | | 91 | %(B) |
| Touchstone Credit Opportunities Fund—Institutional Class |
| Selected Data for a Share Outstanding Throughout Each Period |
| | | Year Ended | | | Year Ended | | | Period Ended | |
| | | June 30, | | | June 30, | | | June 30, | |
| | | 2018 | | | 2017 | | | 2016(A) | |
| Net asset value at beginning of period | | $ | 10.41 | | | $ | 10.05 | | | $ | 10.00 | |
| Income (loss) from investment operations: | | | | | | | | | | | | |
| Net investment income | | | 0.55 | | | | 0.50 | | | | 0.28 | |
| Net realized and unrealized gains (losses) on investments | | | (0.16 | ) | | | 0.43 | | | | 0.03 | |
| Total from investment operations | | | 0.39 | | | | 0.93 | | | | 0.31 | |
| Distributions from: | | | | | | | | | | | | |
| Net investment income | | | (0.56 | ) | | | (0.50 | ) | | | (0.25 | ) |
| Realized capital gains | | | (0.28 | ) | | | (0.07 | ) | | | (0.01 | ) |
| Total distributions | | | (0.84 | ) | | | (0.57 | ) | | | (0.26 | ) |
| Net asset value at end of period | | $ | 9.96 | | | $ | 10.41 | | | $ | 10.05 | |
| Total return | | | 3.85 | % | | | 9.47 | % | | | 3.22 | %(B) |
| Ratios and supplemental data: | | | | | | | | | | | | |
| Net assets at end of period (000's) | | $ | 51,715 | | | $ | 53,150 | | | $ | 54,411 | |
| Ratio to average net assets: | | | | | | | | | | | | |
| Net expenses (including dividend and interest expense on securities sold short)(C) | | | 1.41 | % | | | 1.52 | % | | | 1.38 | %(D) |
| Gross expenses (including dividend and interest expense on securities sold short)(E) | | | 1.59 | % | | | 1.69 | % | | | 1.65 | %(D) |
| Net investment income | | | 5.35 | % | | | 4.79 | % | | | 3.88 | %(D) |
| Portfolio turnover rate | | | 70 | % | | | 84 | % | | | 91 | %(B) |
| | | | | | | | | | | | | |
| (A) | Represents the period from commencement of operations (September 1, 2015) through June 30, 2016. |
| (C) | The ratio of net expenses to average net assets excluding dividend and interest expense on securities sold short for Class Y was 1.44%, 1.44% and 1.44% and for Institutional Class was 1.34%, 1.34% and 1.34% for the years ended June 30, 2018, June 30, 2017 and for the period ended June 30, 2016, respectively. |
| (E) | The ratio of gross expenses to average net assets excluding dividend and interest expense on securities sold short for Class Y was 4.22%, 8.07% and 355.73% and for Institutional Class was 1.52%, 1.51% and 1.61% for the years ended June 30, 2018, June 30, 2017 and for the period ended June 30, 2016, respectively. |
See accompanying Notes to Financial Statements.
Financial Highlights (Continued)
| Touchstone International Growth Opportunities Fund—Class A |
| Selected Data for a Share Outstanding Throughout Each Period |
| | | Year Ended | | | Period Ended | |
| | | June 30, | | | June 30, | |
| | | 2018 | | | 2017(A) | |
| Net asset value at beginning of period | | $ | 22.25 | | | $ | 18.74 | (B) |
| Income (loss) from investment operations: | | | | | | | | |
| Net investment loss | | | (0.01 | ) | | | (0.01 | ) |
| Net realized and unrealized gains on investments | | | 3.34 | | | | 3.52 | |
| Total from investment operations | | | 3.33 | | | | 3.51 | |
| Distributions from: | | | | | | | | |
| Realized capital gains | | | (0.46 | ) | | | — | |
| Net asset value at end of period | | $ | 25.12 | | | $ | 22.25 | |
| Total return(C) | | | 15.00 | % | | | 18.73 | %(D) |
| Ratios and supplemental data: | | | | | | | | |
| Net assets at end of period (000's) | | $ | 918 | | | $ | 140 | |
| Ratio to average net assets: | | | | | | | | |
| Net expenses | | | 1.36 | % | | | 1.41 | %(E) |
| Gross expenses | | | 3.75 | % | | | 42.93 | %(E) |
| Net investment loss | | | (0.05 | %) | | | (0.35 | %)(E) |
| Portfolio turnover rate | | | 109 | % | | | 72 | %(F) |
| Touchstone International Growth Opportunities Fund—Class C |
| Selected Data for a Share Outstanding Throughout Each Period |
| | | Year Ended | | | Period Ended | |
| | | June 30, | | | June 30, | |
| | | 2018 | | | 2017(A) | |
| Net asset value at beginning of period | | $ | 22.10 | | | $ | 18.74 | (B) |
| Income (loss) from investment operations: | | | | | | | | |
| Net investment loss | | | (0.11 | ) | | | (0.19 | ) |
| Net realized and unrealized gains on investments | | | 3.23 | | | | 3.55 | |
| Total from investment operations | | | 3.12 | | | | 3.36 | |
| Distributions from: | | | | | | | | |
| Realized capital gains | | | (0.46 | ) | | | — | |
| Net asset value at end of period | | $ | 24.76 | | | $ | 22.10 | |
| Total return(C) | | | 14.14 | % | | | 17.93 | %(D) |
| Ratios and supplemental data: | | | | | | | | |
| Net assets at end of period (000's) | | $ | 436 | | | $ | 3 | |
| Ratio to average net assets: | | | | | | | | |
| Net expenses | | | 2.10 | % | | | 2.16 | %(E) |
| Gross expenses | | | 5.06 | % | | | 237.46 | %(E) |
| Net investment loss | | | (0.79 | %) | | | (1.11 | %)(E) |
| Portfolio turnover rate | | | 109 | % | | | 72 | %(F) |
| | | | | | | | | |
| (A) | Represents the period from commencement of operations (August 15, 2016) through June 30, 2017. |
| (B) | Net asset value at the beginning of period is based on the net asset value of Institutional Class shares on August 15, 2016. |
| (C) | Total returns shown exclude the effect of applicable sales loads. If these charges were included, the returns would be lower. |
| (F) | Portfolio turnover excludes the purchases and sales of the DSM Global Growth & Income Fund merger on August 15, 2016 (see Note 9). If these transactions were included, portfolio turnover would have been higher. |
See accompanying Notes to Financial Statements.
Financial Highlights (Continued)
| Touchstone International Growth Opportunities Fund—Class Y |
| Selected Data for a Share Outstanding Throughout Each Period |
| | | Year Ended | | | Period Ended | |
| | | June 30, | | | June 30, | |
| | | 2018 | | | 2017(A) | |
| Net asset value at beginning of period | | $ | 22.25 | | | $ | 18.74 | (B) |
| Income (loss) from investment operations: | | | | | | | (— | )(C) |
| Net investment income (loss) | | | 0.02 | | | | | |
| Net realized and unrealized gains on investments | | | 3.38 | | | | 3.51 | |
| Total from investment operations | | | 3.40 | | | | 3.51 | |
| Distributions from: | | | | | | | | |
| Realized capital gains | | | (0.46 | ) | | | — | |
| Net asset value at end of period | | $ | 25.19 | | | $ | 22.25 | |
| Total return | | | 15.32 | % | | | 18.73 | %(D) |
| Ratios and supplemental data: | | | | | | | | |
| Net assets at end of period (000's) | | $ | 4,553 | | | $ | 161 | |
| Ratio to average net assets: | | | | | | | | |
| Net expenses | | | 1.03 | % | | | 1.16 | %(E) |
| Gross expenses | | | 1.81 | % | | | 51.68 | %(E) |
| Net investment income (loss) | | | 0.28 | % | | | (0.10 | %)(E) |
| Portfolio turnover rate | | | 109 | % | | | 72 | %(F) |
| Touchstone International Growth Opportunities Fund—Institutional Class |
| Selected Data for a Share Outstanding Throughout Each Period |
| | | Year Ended June 30, | |
| | | 2018 | | | 2017 | | | 2016 | | | 2015 | | | 2014 | |
| Net asset value at beginning of period | | $ | 22.30 | | | $ | 17.60 | | | $ | 19.75 | | | $ | 20.26 | | | $ | 16.38 | |
| Income (loss) from investment operations: | | | | | | | | | | | | | | | | | | | | |
| Net investment income (loss) | | | 0.07 | | | | (0.02 | ) | | | (0.04 | )(G) | | | (0.02 | )(G) | | | 0.07 | (G) |
| Net realized and unrealized gains (losses) on investments | | | 3.36 | | | | 5.15 | | | | (0.73 | ) | | | 1.56 | | | | 4.48 | |
| Total from investment operations | | | 3.43 | | | | 5.13 | | | | (0.77 | ) | | | 1.54 | | | | 4.55 | |
| Distributions from: | | | | | | | | | | | | | | | | | | | | |
| Net investment income | | | — | | | | — | | | | — | | | | (0.06 | ) | | | — | |
| Realized capital gains | | | (0.46 | ) | | | (0.43 | ) | | | (1.38 | ) | | | (1.99 | ) | | | (0.67 | ) |
| Total distributions | | | (0.46 | ) | | | (0.43 | ) | | | (1.38 | ) | | | (2.05 | ) | | | (0.67 | ) |
| Net asset value at end of period | | $ | 25.27 | | | $ | 22.30 | | | $ | 17.60 | | | $ | 19.75 | | | $ | 20.26 | |
| Total return | | | 15.42 | % | | | 29.63 | % | | | (4.06 | %) | | | 8.52 | % | | | 28.04 | % |
| Ratios and supplemental data: | | | | | | | | | | | | | | | | | | | | |
| Net assets at end of period (000's) | | $ | 28,159 | | | $ | 23,956 | | | $ | 6,418 | | | $ | 6,040 | | | $ | 5,015 | |
| Ratio to average net assets: | | | | | | | | | | | | | | | | | | | | |
| Net expenses | | | 1.02 | % | | | 1.06 | % | | | 1.15 | %(H) | | | 1.20 | % | | | 1.20 | % |
| Gross expenses | | | 1.31 | % | | | 1.82 | % | | | 4.12 | % | | | 4.54 | % | | | 5.92 | % |
| Net investment income (loss) | | | 0.28 | % | | | (0.14 | %) | | | (0.23 | %) | | | (0.10 | %) | | | 0.37 | % |
| Portfolio turnover rate | | | 109 | % | | | 72 | %(F) | | | 57 | % | | | 91 | % | | | 82 | % |
| | | | | | | | | | | | | | | | | | | | | |
| (A) | Represents the period from commencement of operations (August 15, 2016) through June 30, 2017. |
| (B) | Net asset value at the beginning of period is based on the net asset value of Institutional Class shares on August 15, 2016. |
| (C) | Less than $0.005 per share. |
| (F) | Portfolio turnover excludes the purchases and sales of the DSM Global Growth & Income Fund merger on August 15, 2016 (see Note 9). If these transactions were included, portfolio turnover would have been higher. |
| (G) | The net investment income (loss) per share was based on average shares outstanding for the period. |
| (H) | Expense cap was lowered to 1.10% from 1.20% on January 1, 2016. |
See accompanying Notes to Financial Statements.
Financial Highlights (Continued)
| Touchstone International Small Cap Fund—Class A |
| Selected Data for a Share Outstanding Throughout Each Period |
| | | Year Ended June 30, | |
| | | 2018 | | | 2017 | | | 2016 | | | 2015 | | | 2014 | |
| Net asset value at beginning of period | | $ | 16.78 | | | $ | 14.98 | | | $ | 16.52 | | | $ | 15.48 | | | $ | 12.58 | |
| Income (loss) from investment operations: | | | | | | | | | | | | | | | | | | | | |
| Net investment income | | | 0.18 | | | | 0.10 | | | | 0.09 | | | | 0.11 | | | | 0.11 | (A) |
| Net realized and unrealized gains (losses) on investments | | | 1.32 | | | | 1.84 | | | | (1.53 | ) | | | 1.00 | | | | 3.00 | |
| Total from investment operations | | | 1.50 | | | | 1.94 | | | | (1.44 | ) | | | 1.11 | | | | 3.11 | |
| Distributions from: | | | | | | | | | | | | | | | | | | | | |
| Net investment income | | | (0.39 | ) | | | (0.14 | ) | | | (0.10 | ) | | | (0.07 | ) | | | (0.21 | ) |
| Net asset value at end of period | | $ | 17.89 | | | $ | 16.78 | | | $ | 14.98 | | | $ | 16.52 | | | $ | 15.48 | |
| Total return(B) | | | 8.85 | % | | | 13.13 | % | | | (8.77 | %) | | | 7.29 | % | | | 24.74 | % |
| Ratios and supplemental data: | | | | | | | | | | | | | | | | | | | | |
| Net assets at end of period (000's) | | $ | 11,727 | | | $ | 16,529 | | | $ | 23,095 | | | $ | 24,635 | | | $ | 10,721 | |
| Ratio to average net assets: | | | | | | | | | | | | | | | | | | | | |
| Net expenses | | | 1.55 | % | | | 1.55 | % | | | 1.55 | % | | | 1.55 | % | | | 1.55 | % |
| Gross expenses | | | 1.74 | % | | | 1.71 | % | | | 1.66 | % | | | 1.84 | % | | | 2.12 | % |
| Net investment income | | | 0.51 | % | | | 0.56 | % | | | 0.59 | % | | | 0.90 | % | | | 0.76 | % |
| Portfolio turnover rate | | | 94 | % | | | 89 | % | | | 90 | % | | | 84 | % | | | 60 | % |
| Touchstone International Small Cap Fund—Class C |
| Selected Data for a Share Outstanding Throughout Each Period |
| | | Year Ended June 30, | |
| | | 2018 | | | 2017 | | | 2016 | | | 2015 | | | 2014 | |
| Net asset value at beginning of period | | $ | 16.47 | | | $ | 14.67 | | | $ | 16.28 | | | $ | 15.33 | | | $ | 12.54 | |
| Income (loss) from investment operations: | | | | | | | | | | | | | | | | | | | | |
| Net investment income (loss) | | | (0.11 | ) | | | (0.12 | ) | | | (0.04 | ) | | | 0.06 | | | | — | (A)(C) |
| Net realized and unrealized gains (losses) on investments | | | 1.44 | | | | 1.92 | | | | (1.49 | ) | | | 0.92 | | | | 2.99 | |
| Total from investment operations | | | 1.33 | | | | 1.80 | | | | (1.53 | ) | | | 0.98 | | | | 2.99 | |
| Distributions from: | | | | | | | | | | | | | | | | | | | | |
| Net investment income | | | (0.22 | ) | | | — | | | | (0.08 | ) | | | (0.03 | ) | | | (0.20 | ) |
| Net asset value at end of period | | $ | 17.58 | | | $ | 16.47 | | | $ | 14.67 | | | $ | 16.28 | | | $ | 15.33 | |
| Total return(B) | | | 8.04 | % | | | 12.27 | % | | | (9.43 | %) | | | 6.44 | % | | | 23.94 | % |
| Ratios and supplemental data: | | | | | | | | | | | | | | | | | | | | |
| Net assets at end of period (000's) | | $ | 2,498 | | | $ | 2,818 | | | $ | 4,294 | | | $ | 4,120 | | | $ | 613 | |
| Ratio to average net assets: | | | | | | | | | | | | | | | | | | | | |
| Net expenses | | | 2.30 | % | | | 2.30 | % | | | 2.30 | % | | | 2.30 | % | | | 2.30 | % |
| Gross expenses | | | 2.81 | % | | | 2.73 | % | | | 2.62 | % | | | 2.92 | % | | | 7.28 | % |
| Net investment income (loss) | | | (0.25 | %) | | | (0.19 | %) | | | (0.16 | %) | | | 0.15 | % | | | 0.01 | % |
| Portfolio turnover rate | | | 94 | % | | | 89 | % | | | 90 | % | | | 84 | % | | | 60 | % |
| | | | | | | | | | | | | | | | | | | | | |
| (A) | The net investment income per share was based on average shares outstanding for the period. |
| (B) | Total returns shown exclude the effect of applicable sales loads. If these charges were included, the returns would be lower. |
| (C) | Less than $0.005 per share. |
See accompanying Notes to Financial Statements.
Financial Highlights (Continued)
| Touchstone International Small Cap Fund—Class Y |
| Selected Data for a Share Outstanding Throughout Each Period |
| | | Year Ended June 30, | |
| | | 2018 | | | 2017 | | | 2016 | | | 2015 | | | 2014 | |
| Net asset value at beginning of period | | $ | 17.21 | | | $ | 15.39 | | | $ | 16.94 | | | $ | 15.86 | | | $ | 12.84 | |
| Income (loss) from investment operations: | | | | | | | | | | | | | | | | | | | | |
| Net investment income | | | 0.13 | | | | 0.17 | | | | 0.13 | | | | 0.14 | | | | 0.16 | (A) |
| Net realized and unrealized gains (losses) on investments | | | 1.46 | | | | 1.85 | | | | (1.57 | ) | | | 1.04 | | | | 3.07 | |
| Total from investment operations | | | 1.59 | | | | 2.02 | | | | (1.44 | ) | | | 1.18 | | | | 3.23 | |
| Distributions from: | | | | | | | | | | | | | | | | | | | | |
| Net investment income | | | (0.52 | ) | | | (0.20 | ) | | | (0.11 | ) | | | (0.10 | ) | | | (0.21 | ) |
| Net asset value at end of period | | $ | 18.28 | | | $ | 17.21 | | | $ | 15.39 | | | $ | 16.94 | | | $ | 15.86 | |
| Total return | | | 9.17 | % | | | 13.39 | % | | | (8.56 | %) | | | 7.54 | % | | | 25.16 | % |
| Ratios and supplemental data: | | | | | | | | | | | | | | | | | | | | |
| Net assets at end of period (000's) | | $ | 144,173 | | | $ | 146,744 | | | $ | 166,801 | | | $ | 172,477 | | | $ | 120,537 | |
| Ratio to average net assets: | | | | | | | | | | | | | | | | | | | | |
| Net expenses | | | 1.30 | %(B) | | | 1.30 | % | | | 1.30 | % | | | 1.30 | % | | | 1.25 | % |
| Gross expenses | | | 1.30 | % | | | 1.32 | % | | | 1.32 | % | | | 1.38 | % | | | 1.44 | % |
| Net investment income | | | 0.75 | % | | | 0.81 | % | | | 0.84 | % | | | 1.15 | % | | | 1.06 | % |
| Portfolio turnover rate | | | 94 | % | | | 89 | % | | | 90 | % | | | 84 | % | | | 60 | % |
| Touchstone International Small Cap Fund—Institutional Class |
| Selected Data for a Share Outstanding Throughout Each Period |
| | | Year Ended June 30, | |
| | | 2018 | | | 2017 | | | 2016 | | | 2015 | | | 2014 | |
| Net asset value at beginning of period | | $ | 17.31 | | | $ | 15.48 | | | $ | 17.02 | | | $ | 15.94 | | | $ | 12.90 | |
| Income (loss) from investment operations: | | | | | | | | | | | | | | | | | | | | |
| Net investment income | | | 0.12 | | | | 0.16 | | | | 0.12 | | | | 0.18 | | | | 0.18 | (A) |
| Net realized and unrealized gains (losses) on investments | | | 1.50 | | | | 1.90 | | | | (1.55 | ) | | | 1.02 | | | | 3.09 | |
| Total from investment operations | | | 1.62 | | | | 2.06 | | | | (1.43 | ) | | | 1.20 | | | | 3.27 | |
| Distributions from: | | | | | | | | | | | | | | | | | | | | |
| Net investment income | | | (0.56 | ) | | | (0.23 | ) | | | (0.11 | ) | | | (0.12 | ) | | | (0.23 | ) |
| Net asset value at end of period | | $ | 18.37 | | | $ | 17.31 | | | $ | 15.48 | | | $ | 17.02 | | | $ | 15.94 | |
| Total return | | | 9.25 | % | | | 13.56 | % | | | (8.43 | %) | | | 7.65 | % | | | 25.38 | % |
| Ratios and supplemental data: | | | | | | | | | | | | | | | | | | | | |
| Net assets at end of period (000's) | | $ | 157,502 | | | $ | 148,937 | | | $ | 197,693 | | | $ | 47,319 | | | $ | 30,223 | |
| Ratio to average net assets: | | | | | | | | | | | | | | | | | | | | |
| Net expenses | | | 1.18 | % | | | 1.18 | % | | | 1.18 | % | | | 1.18 | % | | | 1.08 | % |
| Gross expenses | | | 1.22 | % | | | 1.23 | % | | | 1.23 | % | | | 1.30 | % | | | 1.33 | % |
| Net investment income | | | 0.87 | % | | | 0.93 | % | | | 0.96 | % | | | 1.27 | % | | | 1.23 | % |
| Portfolio turnover rate | | | 94 | % | | | 89 | % | | | 90 | % | | | 84 | % | | | 60 | % |
| | | | | | | | | | | | | | | | | | | | | |
| (A) | The net investment income per share was based on average shares outstanding for the period. |
| (B) | Net expenses include amounts recouped by the Advisor. |
See accompanying Notes to Financial Statements.
Financial Highlights (Continued)
| Touchstone Large Cap Fund—Class A |
| Selected Data for a Share Outstanding Throughout Each Period |
| | | | | | | | | | | | Period Ended | |
| | | Year Ended June 30, | | | June 30, | |
| | | 2018 | | | 2017 | | | 2016 | | | 2015(A) | |
| Net asset value at beginning of period | | $ | 11.96 | | | $ | 10.49 | | | $ | 10.65 | | | $ | 10.00 | |
| Income (loss) from investment operations: | | | | | | | | | | | | | | | | |
| Net investment income | | | 0.09 | | | | 0.06 | | | | 0.08 | | | | 0.09 | (B) |
| Net realized and unrealized gains (losses) on investments | | | 1.27 | | | | 1.49 | | | | (0.18 | ) | | | 0.57 | |
| Total from investment operations | | | 1.36 | | | | 1.55 | | | | (0.10 | ) | | | 0.66 | |
| Distributions from: | | | | | | | | | | | | | | | | |
| Net investment income | | | (0.05 | ) | | | (0.08 | ) | | | (0.06 | ) | | | (0.01 | ) |
| Net asset value at end of period | | $ | 13.27 | | | $ | 11.96 | | | $ | 10.49 | | | $ | 10.65 | |
| Total return(C) | | | 11.35 | % | | | 14.82 | % | | | (0.92 | %) | | | 6.57 | %(D) |
| Ratios and supplemental data: | | | | | | | | | | | | | | | | |
| Net assets at end of period (000's) | | $ | 2,975 | | | $ | 5,368 | | | $ | 3,657 | | | $ | 2,013 | |
| Ratio to average net assets: | | | | | | | | | | | | | | | | |
| Net expenses | | | 1.12 | % | | | 1.12 | % | | | 1.12 | % | | | 1.12 | %(E) |
| Gross expenses | | | 1.50 | % | | | 1.57 | % | | | 1.68 | % | | | 4.17 | %(E) |
| Net investment income | | | 0.48 | % | | | 0.56 | % | | | 0.87 | % | | | 0.81 | %(E) |
| Portfolio turnover rate | | | 10 | % | | | 23 | % | | | 33 | % | | | 8 | %(D)(F) |
| Touchstone Large Cap Fund—Class C |
| Selected Data for a Share Outstanding Throughout Each Period |
| | | | | | | | | | | | Period Ended | |
| | | Year Ended June 30, | | | June 30, | |
| | | 2018 | | | 2017 | | | 2016 | | | 2015(A) | |
| Net asset value at beginning of period | | $ | 11.80 | | | $ | 10.37 | | | $ | 10.60 | | | $ | 10.00 | |
| Income (loss) from investment operations: | | | | | | | | | | | | | | | | |
| Net investment income (loss) | | | (0.04 | ) | | | (0.02 | ) | | | 0.02 | | | | 0.01 | (B) |
| Net realized and unrealized gains (losses) on investments | | | 1.28 | | | | 1.47 | | | | (0.20 | ) | | | 0.59 | |
| Total from investment operations | | | 1.24 | | | | 1.45 | | | | (0.18 | ) | | | 0.60 | |
| Distributions from: | | | | | | | | | | | | | | | | |
| Net investment income | | | — | | | | (0.02 | ) | | | (0.05 | ) | | | — | |
| Net asset value at end of period | | $ | 13.04 | | | $ | 11.80 | | | $ | 10.37 | | | $ | 10.60 | |
| Total return(C) | | | 10.51 | % | | | 13.98 | % | | | (1.72 | %) | | | 6.00 | %(D) |
| Ratios and supplemental data: | | | | | | | | | | | | | | | | |
| Net assets at end of period (000's) | | $ | 7,849 | | | $ | 8,102 | | | $ | 6,124 | | | $ | 1,370 | |
| Ratio to average net assets: | | | | | | | | | | | | | | | | |
| Net expenses | | | 1.87 | % | | | 1.87 | % | | | 1.87 | % | | | 1.87 | %(E) |
| Gross expenses | | | 2.12 | % | | | 2.12 | % | | | 2.39 | % | | | 4.34 | %(E) |
| Net investment income (loss) | | | (0.27 | %) | | | (0.19 | %) | | | 0.12 | % | | | 0.06 | %(E) |
| Portfolio turnover rate | | | 10 | % | | | 23 | % | | | 33 | % | | | 8 | %(D)(F) |
| | | | | | | | | | | | | | | | | |
| (A) | Represents the period from commencement of operations (July 10, 2014) through June 30, 2015. |
| (B) | The net investment income per share was based on average shares outstanding for the period. |
| (C) | Total returns shown exclude the effect of applicable sales loads. If these charges were included, the returns would be lower. |
| (F) | Portfolio turnover excludes the purchases and sales of the Touchstone Capital Growth Fund acquired on June 26, 2015. If these transactions were included, portfolio turnover would have been higher. |
See accompanying Notes to Financial Statements.
Financial Highlights (Continued)
| Touchstone Large Cap Fund—Class Y |
| Selected Data for a Share Outstanding Throughout Each Period |
| | | | | | | | | | | | Period Ended | |
| | | Year Ended June 30, | | | June 30, | |
| | | 2018 | | | 2017 | | | 2016 | | | 2015(A) | |
| Net asset value at beginning of period | | $ | 12.00 | | | $ | 10.52 | | | $ | 10.67 | | | $ | 10.00 | |
| Income (loss) from investment operations: | | | | | | | | | | | | | | | | |
| Net investment income | | | 0.10 | | | | 0.09 | | | | 0.11 | | | | 0.11 | (B) |
| Net realized and unrealized gains (losses) on investments | | | 1.30 | | | | 1.49 | | | | (0.19 | ) | | | 0.57 | |
| Total from investment operations | | | 1.40 | | | | 1.58 | | | | (0.08 | ) | | | 0.68 | |
| Distributions from: | | | | | | | | | | | | | | | | |
| Net investment income | | | (0.09 | ) | | | (0.10 | ) | | | (0.07 | ) | | | (0.01 | ) |
| Net asset value at end of period | | $ | 13.31 | | | $ | 12.00 | | | $ | 10.52 | | | $ | 10.67 | |
| Total return | | | 11.62 | % | | | 15.13 | % | | | (0.70 | %) | | | 6.80 | %(C) |
| Ratios and supplemental data: | | | | | | | | | | | | | | | | |
| Net assets at end of period (000's) | | $ | 231,984 | | | $ | 222,080 | | | $ | 208,463 | | | $ | 194,226 | |
| Ratio to average net assets: | | | | | | | | | | | | | | | | |
| Net expenses | | | 0.87 | % | | | 0.87 | % | | | 0.87 | % | | | 0.87 | %(D) |
| Gross expenses | | | 0.99 | % | | | 1.01 | % | | | 1.04 | % | | | 1.19 | %(D) |
| Net investment income | | | 0.73 | % | | | 0.81 | % | | | 1.11 | % | | | 1.06 | %(D) |
| Portfolio turnover rate | | | 10 | % | | | 23 | % | | | 33 | % | | | 8 | %(C)(E) |
| Touchstone Large Cap Fund—Institutional Class |
| Selected Data for a Share Outstanding Throughout Each Period |
| | | | | | | | | | | | Period Ended | |
| | | Year Ended June 30, | | | June 30, | |
| | | 2018 | | | 2017 | | | 2016 | | | 2015(A) | |
| Net asset value at beginning of period | | $ | 12.02 | | | $ | 10.53 | | | $ | 10.68 | | | $ | 10.00 | |
| Income (loss) from investment operations: | | | | | | | | | | | | | | | | |
| Net investment income | | | 0.10 | | | | 0.11 | | | | 0.13 | | | | 0.12 | (B) |
| Net realized and unrealized gains (losses) on investments | | | 1.31 | | | | 1.49 | | | | (0.20 | ) | | | 0.57 | |
| Total from investment operations | | | 1.41 | | | | 1.60 | | | | (0.07 | ) | | | 0.69 | |
| Distributions from: | | | | | | | | | | | | | | | | |
| Net investment income | | | (0.10 | ) | | | (0.11 | ) | | | (0.08 | ) | | | (0.01 | ) |
| Net asset value at end of period | | $ | 13.33 | | | $ | 12.02 | | | $ | 10.53 | | | $ | 10.68 | |
| Total return | | | 11.70 | % | | | 15.31 | % | | | (0.66 | %) | | | 6.92 | %(C) |
| Ratios and supplemental data: | | | | | | | | | | | | | | | | |
| Net assets at end of period (000's) | | $ | 124,759 | | | $ | 97,888 | | | $ | 87,032 | | | $ | 98,889 | |
| Ratio to average net assets: | | | | | | | | | | | | | | | | |
| Net expenses | | | 0.77 | % | | | 0.77 | % | | | 0.77 | % | | | 0.77 | %(D) |
| Gross expenses | | | 0.91 | % | | | 0.91 | % | | | 0.93 | % | | | 0.98 | %(D) |
| Net investment income | | | 0.83 | % | | | 0.91 | % | | | 1.21 | % | | | 1.16 | %(D) |
| Portfolio turnover rate | | | 10 | % | | | 23 | % | | | 33 | % | | | 8 | %(C)(E) |
| | | | | | | | | | | | | | | | | |
| (A) | Represents the period from commencement of operations (July 10, 2014) through June 30, 2015. |
| (B) | The net investment income per share was based on average shares outstanding for the period. |
| (E) | Portfolio turnover excludes the purchases and sales of the Touchstone Capital Growth Fund acquired on June 26, 2015. If these transactions were included, portfolio turnover would have been higher. |
See accompanying Notes to Financial Statements.
Financial Highlights (Continued)
| Touchstone Large Company Growth Fund—Class A |
| Selected Data for a Share Outstanding Throughout Each Period |
| | | Year Ended | | | Period Ended | |
| | | June 30, | | | June 30, | |
| | | 2018 | | | 2017(A) | |
| Net asset value at beginning of period | | $ | 35.52 | | | $ | 31.38 | (B) |
| Income (loss) from investment operations: | | | | | | | | |
| Net investment loss | | | (0.24 | ) | | | (0.19 | )(C) |
| Net realized and unrealized gains on investments | | | 7.19 | | | | 5.41 | |
| Total from investment operations | | | 6.95 | | | | 5.22 | |
| Distributions from: | | | | | | | | |
| Realized capital gains | | | (1.14 | ) | | | (1.08 | ) |
| Net asset value at end of period | | $ | 41.33 | | | $ | 35.52 | |
| Total return(D) | | | 19.75 | % | | | 17.31 | %(E) |
| Ratios and supplemental data: | | | | | | | | |
| Net assets at end of period (000's) | | $ | 3,417 | | | $ | 140 | |
| Ratio to average net assets: | | | | | | | | |
| Net expenses | | | 1.23 | % | | | 1.23 | %(F) |
| Gross expenses | | | 1.67 | % | | | 11.14 | %(F) |
| Net investment loss | | | (0.63 | %) | | | (0.68 | %)(F) |
| Portfolio turnover rate | | | 44 | % | | | 55 | % |
| Touchstone Large Company Growth Fund—Class C |
| Selected Data for a Share Outstanding Throughout Each Period |
| | | Year Ended | | | Period Ended | |
| | | June 30, | | | June 30, | |
| | | 2018 | | | 2017(A) | |
| Net asset value at beginning of period | | $ | 35.29 | | | $ | 31.38 | (B) |
| Income (loss) from investment operations: | | | | | | | | |
| Net investment loss | | | (0.30 | ) | | | (0.38 | )(C) |
| Net realized and unrealized gains on investments | | | 6.89 | | | | 5.37 | |
| Total from investment operations | | | 6.59 | | | | 4.99 | |
| Distributions from: | | | | | | | | |
| Realized capital gains | | | (1.14 | ) | | | (1.08 | ) |
| Net asset value at end of period | | $ | 40.74 | | | $ | 35.29 | |
| Total return(D) | | | 18.88 | % | | | 16.52 | %(E) |
| Ratios and supplemental data: | | | | | | | | |
| Net assets at end of period (000's) | | $ | 236 | | | $ | 31 | |
| Ratio to average net assets: | | | | | | | | |
| Net expenses | | | 1.98 | % | | | 1.98 | %(F) |
| Gross expenses | | | 8.12 | % | | | 257.02 | %(F) |
| Net investment loss | | | (1.38 | %) | | | (1.43 | %)(F) |
| Portfolio turnover rate | | | 44 | % | | | 55 | % |
| | | | | | | | | |
| (A) | Represents the period from commencement of operations (August 15, 2016) through June 30, 2017. |
| (B) | Net asset value at the beginning of period is based on the net asset value of Institutional Class shares on August 15, 2016. |
| (C) | The net investment loss per share was based on average shares outstanding for the period. |
| (D) | Total returns shown exclude the effect of applicable sales loads. If these charges were included, the returns would be lower. |
See accompanying Notes to Financial Statements.
Financial Highlights (Continued)
| Touchstone Large Company Growth Fund—Class Y |
| Selected Data for a Share Outstanding Throughout Each Period |
| | | Year Ended | | | Period Ended | |
| | | June 30, | | | June 30, | |
| | | 2018 | | | 2017(A) | |
| Net asset value at beginning of period | | $ | 35.60 | | | $ | 31.38 | (B) |
| Income (loss) from investment operations: | | | | | | | | |
| Net investment loss | | | (0.13 | ) | | | (0.12 | )(C) |
| Net realized and unrealized gains on investments | | | 7.20 | | | | 5.42 | |
| Total from investment operations | | | 7.07 | | | | 5.30 | |
| Distributions from: | | | | | | | | |
| Realized capital gains | | | (1.14 | ) | | | (1.08 | ) |
| Net asset value at end of period | | $ | 41.53 | | | $ | 35.60 | |
| Total return | | | 20.02 | % | | | 17.57 | %(D) |
| Ratios and supplemental data: | | | | | | | | |
| Net assets at end of period (000's) | | $ | 15,961 | | | $ | 9,938 | |
| Ratio to average net assets: | | | | | | | | |
| Net expenses | | | 0.98 | % | | | 0.98 | %(E) |
| Gross expenses | | | 1.12 | % | | | 1.12 | %(E) |
| Net investment loss | | | (0.38 | %) | | | (0.42 | %)(E) |
| Portfolio turnover rate | | | 44 | % | | | 55 | % |
| Touchstone Large Company Growth Fund—Institutional Class |
| Selected Data for a Share Outstanding Throughout Each Period |
| | | Year Ended June 30, | |
| | | 2018 | | | 2017 | | | 2016 | | | 2015 | | | 2014 | |
| Net asset value at beginning of period | | $ | 35.63 | | | $ | 29.15 | | | $ | 33.17 | | | $ | 29.67 | | | $ | 24.25 | |
| Income (loss) from investment operations: | | | | | | | | | | | | | | | | | | | | |
| Net investment loss | | | (0.11 | ) | | | (0.12 | )(C) | | | (0.14 | )(C) | | | (0.08 | )(C) | | | (0.01 | )(C) |
| Net realized and unrealized gains (losses) on investments | | | 7.23 | | | | 7.68 | | | | (1.45 | ) | | | 4.61 | | | | 6.08 | |
| Total from investment operations | | | 7.12 | | | | 7.56 | | | | (1.59 | ) | | | 4.53 | | | | 6.07 | |
| Distributions from: | | | | | | | | | | | | | | | | | | | | |
| Net investment income | | | — | | | | — | | | | — | | | | — | | | | (0.03 | ) |
| Realized capital gains | | | (1.14 | ) | | | (1.08 | ) | | | (2.43 | ) | | | (1.03 | ) | | | (0.62 | ) |
| Total distributions | | | (1.14 | ) | | | (1.08 | ) | | | (2.43 | ) | | | (1.03 | ) | | | (0.65 | ) |
| Proceeds from redemption fees collected | | | — | | | | — | | | | — | (F) | | | — | | | | — | |
| Net asset value at end of period | | $ | 41.61 | | | $ | 35.63 | | | $ | 29.15 | | | $ | 33.17 | | | $ | 29.67 | |
| Total return | | | 20.17 | % | | | 26.67 | % | | | (5.08 | %) | | | 15.59 | % | | | 25.19 | % |
| Ratios and supplemental data: | | | | | | | | | | | | | | | | | | | | |
| Net assets at end of period (000's) | | $ | 224,379 | | | $ | 189,444 | | | $ | 180,104 | | | $ | 196,084 | | | $ | 152,569 | |
| Ratio to average net assets: | | | | | | | | | | | | | | | | | | | | |
| Net expenses | | | 0.88 | % | | | 0.89 | % | | | 0.95 | % | | | 0.95 | % | | | 0.95 | % |
| Gross expenses | | | 0.98 | % | | | 1.02 | % | | | 1.00 | % | | | 1.00 | % | | | 1.07 | % |
| Net investment loss | | | (0.28 | %) | | | (0.39 | %) | | | (0.46 | %) | | | (0.25 | %) | | | (0.04 | %) |
| Portfolio turnover rate | | | 44 | % | | | 55 | % | | | 57 | % | | | 80 | % | | | 56 | % |
| | | | | | | | | | | | | | | | | | | | | |
| (A) | Represents the period from commencement of operations (August 15, 2016) through June 30, 2017. |
| (B) | Net asset value at the beginning of period is based on the net asset value of Institutional Class shares on August 15, 2016. |
| (C) | The net investment loss per share was based on average shares outstanding for the period. |
| (F) | Proceeds from redemption fees are related to the DSM Large Cap Growth Fund, the Predecessor Fund, and are less than $0.005 per share. |
See accompanying Notes to Financial Statements.
Financial Highlights (Continued)
| Touchstone Ohio Tax-Free Bond Fund—Class A |
| Selected Data for a Share Outstanding Throughout Each Period |
| | | Year Ended June 30, | |
| | | 2018 | | | 2017 | | | 2016 | | | 2015 | | | 2014 | |
| Net asset value at beginning of period | | $ | 11.55 | | | $ | 12.04 | | | $ | 11.70 | | | $ | 11.76 | | | $ | 11.47 | |
| Income (loss) from investment operations: | | | | | | | | | | | | | | | | | | | | |
| Net investment income | | | 0.33 | | | | 0.35 | | | | 0.36 | | | | 0.38 | | | | 0.39 | |
| Net realized and unrealized gains (losses) on investments | | | (0.22 | ) | | | (0.47 | ) | | | 0.36 | | | | (0.06 | ) | | | 0.33 | |
| Total from investment operations | | | 0.11 | | | | (0.12 | ) | | | 0.72 | | | | 0.32 | | | | 0.72 | |
| Distributions from: | | | | | | | | | | | | | | | | | | | | |
| Net investment income | | | (0.33 | ) | | | (0.35 | ) | | | (0.36 | ) | | | (0.38 | ) | | | (0.39 | ) |
| Realized capital gains | | | — | | | | (0.02 | ) | | | (0.02 | ) | | | — | | | | (0.04 | ) |
| Total distributions | | | (0.33 | ) | | | (0.37 | ) | | | (0.38 | ) | | | (0.38 | ) | | | (0.43 | ) |
| Net asset value at end of period | | $ | 11.33 | | | $ | 11.55 | | | $ | 12.04 | | | $ | 11.70 | | | $ | 11.76 | |
| Total return(A) | | | 0.99 | % | | | (1.03 | %) | | | 6.25 | % | | | 2.72 | % | | | 6.41 | % |
| Ratios and supplemental data: | | | | | | | | | | | | | | | | | | | | |
| Net assets at end of period (000's) | | $ | 35,728 | | | $ | 42,818 | | | $ | 52,599 | | | $ | 47,153 | | | $ | 44,939 | |
| Ratio to average net assets: | | | | | | | | | | | | | | | | | | | | |
| Net expenses | | | 0.85 | % | | | 0.85 | % | | | 0.85 | % | | | 0.85 | % | | | 0.85 | % |
| Gross expenses | | | 1.13 | % | | | 1.13 | % | | | 1.13 | % | | | 1.09 | % | | | 1.10 | % |
| Net investment income | | | 2.91 | % | | | 2.98 | % | | | 3.05 | % | | | 3.20 | % | | | 3.42 | % |
| Portfolio turnover rate | | | 47 | % | | | 34 | % | | | 27 | % | | | 23 | % | | | 25 | % |
| Touchstone Ohio Tax-Free Bond Fund—Class C |
| Selected Data for a Share Outstanding Throughout Each Period |
| | | Year Ended June 30, | |
| | | 2018 | | | 2017 | | | 2016 | | | 2015 | | | 2014 | |
| Net asset value at beginning of period | | $ | 11.57 | | | $ | 12.06 | | | $ | 11.72 | | | $ | 11.78 | | | $ | 11.48 | |
| Income (loss) from investment operations: | | | | | | | | | | | | | | | | | | | | |
| Net investment income | | | 0.25 | | | | 0.26 | | | | 0.27 | | | | 0.29 | | | | 0.31 | |
| Net realized and unrealized gains (losses) on investments | | | (0.24 | ) | | | (0.47 | ) | | | 0.36 | | | | (0.06 | ) | | | 0.34 | |
| Total from investment operations | | | 0.01 | | | | (0.21 | ) | | | 0.63 | | | | 0.23 | | | | 0.65 | |
| Distributions from: | | | | | | | | | | | | | | | | | | | | |
| Net investment income | | | (0.25 | ) | | | (0.26 | ) | | | (0.27 | ) | | | (0.29 | ) | | | (0.31 | ) |
| Realized capital gains | | | — | | | | (0.02 | ) | | | (0.02 | ) | | | — | | | | (0.04 | ) |
| Total distributions | | | (0.25 | ) | | | (0.28 | ) | | | (0.29 | ) | | | (0.29 | ) | | | (0.35 | ) |
| Net asset value at end of period | | $ | 11.33 | | | $ | 11.57 | | | $ | 12.06 | | | $ | 11.72 | | | $ | 11.78 | |
| Total return(A) | | | 0.06 | % | | | (1.77 | %) | | | 5.45 | % | | | 1.96 | % | | | 5.70 | % |
| Ratios and supplemental data: | | | | | | | | | | | | | | | | | | | | |
| Net assets at end of period (000's) | | $ | 5,363 | | | $ | 6,515 | | | $ | 7,320 | | | $ | 7,266 | | | $ | 7,333 | |
| Ratio to average net assets: | | | | | | | | | | | | | | | | | | | | |
| Net expenses | | | 1.60 | % | | | 1.60 | % | | | 1.60 | % | | | 1.60 | % | | | 1.60 | % |
| Gross expenses | | | 2.01 | % | | | 2.03 | % | | | 2.09 | % | | | 1.93 | % | | | 2.01 | % |
| Net investment income | | | 2.16 | % | | | 2.23 | % | | | 2.30 | % | | | 2.45 | % | | | 2.67 | % |
| Portfolio turnover rate | | | 47 | % | | | 34 | % | | | 27 | % | | | 23 | % | | | 25 | % |
| | | | | | | | | | | | | | | | | | | | | |
| (A) | Total returns shown exclude the effect of applicable sales loads. If these charges were included, the returns would be lower. |
See accompanying Notes to Financial Statements.
Financial Highlights (Continued)
| Touchstone Ohio Tax-Free Bond Fund—Class Y |
| Selected Data for a Share Outstanding Throughout Each Period |
| | | Year Ended | | | Period Ended | |
| | | June 30, | | | June 30, | |
| | | 2018 | | | 2017(A) | |
| Net asset value at beginning of period | | $ | 11.56 | | | $ | 12.00 | (B) |
| Income (loss) from investment operations: | | | | | | | | |
| Net investment income | | | 0.29 | | | | 0.38 | |
| Net realized and unrealized losses on investments | | | (0.16 | ) | | | (0.49 | ) |
| Total from investment operations | | | 0.13 | | | | (0.11 | ) |
| Distributions from: | | | | | | | | |
| Net investment income | | | (0.36 | ) | | | (0.31 | ) |
| Realized capital gains | | | — | | | | (0.02 | ) |
| Total distributions | | | (0.36 | ) | | | (0.33 | ) |
| Net asset value at end of period | | $ | 11.33 | | | $ | 11.56 | |
| Total return | | | 1.15 | % | | | (0.90 | %)(C) |
| Ratios and supplemental data: | | | | | | | | |
| Net assets at end of period (000's) | | $ | 4,596 | | | $ | 2 | |
| Ratio to average net assets: | | | | | | | | |
| Net expenses | | | 0.60 | % | | | 0.60 | %(D) |
| Gross expenses | | | 1.16 | % | | | 298.27 | %(D) |
| Net investment income | | | 3.16 | % | | | 4.00 | %(D) |
| Portfolio turnover rate | | | 47 | % | | | 34 | % |
| Touchstone Ohio Tax-Free Bond Fund—Institutional Class |
| Selected Data for a Share Outstanding Throughout Each Period |
| | | Year Ended | | | Period Ended | |
| | | June 30, | | | June 30, | |
| | | 2018 | | | 2017(A) | |
| Net asset value at beginning of period | | $ | 11.56 | | | $ | 12.00 | (B) |
| Income (loss) from investment operations: | | | | | | | | |
| Net investment income | | | 0.30 | | | | 0.39 | |
| Net realized and unrealized losses on investments | | | (0.16 | ) | | | (0.50 | ) |
| Total from investment operations | | | 0.14 | | | | (0.11 | ) |
| Distributions from: | | | | | | | | |
| Net investment income | | | (0.37 | ) | | | (0.31 | ) |
| Realized capital gains | | | — | | | | (0.02 | ) |
| Total distributions | | | (0.37 | ) | | | (0.33 | ) |
| Net asset value at end of period | | $ | 11.33 | | | $ | 11.56 | |
| Total return | | | 1.18 | % | | | (0.90 | %)(C) |
| Ratios and supplemental data: | | | | | | | | |
| Net assets at end of period (000's) | | $ | 560 | | | $ | 2 | |
| Ratio to average net assets: | | | | | | | | |
| Net expenses | | | 0.55 | % | | | 0.55 | %(D) |
| Gross expenses | | | 2.54 | % | | | 298.26 | %(D) |
| Net investment income | | | 3.21 | % | | | 4.04 | %(D) |
| Portfolio turnover rate | | | 47 | % | | | 34 | % |
| | | | | | | | | |
| (A) | Represents the period from commencement of operations (August 31, 2016) through December 31, 2017. |
| (B) | Net asset value at the beginning of period is based on the net asset value of Class A shares on August 31, 2016. |
See accompanying Notes to Financial Statements.
Financial Highlights (Continued)
| Touchstone Small Cap Value Opportunities Fund—Class A |
| Selected Data for a Share Outstanding Throughout Each Period |
| | | Year Ended June 30, | |
| | | 2018 | | | 2017 | | | 2016 | | | 2015 | | | 2014 | |
| Net asset value at beginning of period | | $ | 16.76 | | | $ | 14.84 | | | $ | 18.67 | | | $ | 20.92 | | | $ | 18.75 | |
| Income (loss) from investment operations: | | | | | | | | | | | | | | | | | | | | |
| Net investment income (loss) | | | (0.07 | ) | | | (0.13 | ) | | | (0.06 | ) | | | 0.04 | | | | (0.05 | ) |
| Net realized and unrealized gains (losses) on investments | | | 1.92 | | | | 2.07 | | | | (2.51 | ) | | | 0.39 | | | | 5.88 | (A) |
| Total from investment operations | | | 1.85 | | | | 1.94 | | | | (2.57 | ) | | | 0.43 | | | | 5.83 | |
| Distributions from: | | | | | | | | | | | | | | | | | | | | |
| Net investment income | | | — | | | | — | | | | — | | | | (0.31 | ) | | | (0.02 | ) |
| Realized capital gains | | | — | | | | (0.02 | ) | | | (1.26 | ) | | | (2.37 | ) | | | (3.64 | ) |
| Total distributions | | | — | | | | (0.02 | ) | | | (1.26 | ) | | | (2.68 | ) | | | (3.66 | ) |
| Net asset value at end of period | | $ | 18.61 | | | $ | 16.76 | | | $ | 14.84 | | | $ | 18.67 | | | $ | 20.92 | |
| Total return(B) | | | 11.04 | % | | | 13.08 | % | | | (13.72 | %) | | | 2.68 | % | | | 33.35 | %(A) |
| Ratios and supplemental data: | | | | | | | | | | | | | | | | | | | | |
| Net assets at end of period (000's) | | $ | 2,333 | | | $ | 2,849 | | | $ | 4,503 | | | $ | 15,219 | | | $ | 13,332 | |
| Ratio to average net assets: | | | | | | | | | | | | | | | | | | | | |
| Net expenses | | | 1.43 | % | | | 1.43 | % | | | 1.43 | % | | | 1.45 | % | | | 1.50 | % |
| Gross expenses | | | 2.42 | % | | | 2.03 | % | | | 1.82 | % | | | 1.70 | % | | | 1.93 | % |
| Net investment income (loss) | | | (0.34 | %) | | | (0.29 | %) | | | (0.22 | %) | | | 0.31 | % | | | (0.09 | %) |
| Portfolio turnover rate | | | 56 | % | | | 59 | % | | | 42 | % | | | 57 | % | | | 73 | % |
| Touchstone Small Cap Value Opportunities Fund—Class C |
| Selected Data for a Share Outstanding Throughout Each Period |
| | | Year Ended June 30, | |
| | | 2018 | | | 2017 | | | 2016 | | | 2015 | | | 2014 | |
| Net asset value at beginning of period | | $ | 16.18 | | | $ | 14.44 | | | $ | 18.34 | | | $ | 20.70 | | | $ | 18.69 | |
| Income (loss) from investment operations: | | | | | | | | | | | | | | | | | | | | |
| Net investment income (loss) | | | (0.25 | ) | | | (0.32 | ) | | | (0.20 | ) | | | 0.03 | | | | (0.14 | ) |
| Net realized and unrealized gains (losses) on investments | | | 1.90 | | | | 2.08 | | | | (2.44 | ) | | | 0.25 | | | | 5.79 | (A) |
| Total from investment operations | | | 1.65 | | | | 1.76 | | | | (2.64 | ) | | | 0.28 | | | | 5.65 | |
| Distributions from: | | | | | | | | | | | | | | | | | | | | |
| Net investment income | | | — | | | | — | | | | — | | | | (0.27 | ) | | | — | |
| Realized capital gains | | | — | | | | (0.02 | ) | | | (1.26 | ) | | | (2.37 | ) | | | (3.64 | ) |
| Total distributions | | | — | | | | (0.02 | ) | | | (1.26 | ) | | | (2.64 | ) | | | (3.64 | ) |
| Net asset value at end of period | | $ | 17.83 | | | $ | 16.18 | | | $ | 14.44 | | | $ | 18.34 | | | $ | 20.70 | |
| Total return(B) | | | 10.20 | % | | | 12.19 | % | | | (14.38 | %) | | | 1.93 | % | | | 32.43 | %(A) |
| Ratios and supplemental data: | | | | | | | | | | | | | | | | | | | | |
| Net assets at end of period (000's) | | $ | 493 | | | $ | 801 | | | $ | 1,121 | | | $ | 2,077 | | | $ | 558 | |
| Ratio to average net assets: | | | | | | | | | | | | | | | | | | | | |
| Net expenses | | | 2.18 | % | | | 2.18 | % | | | 2.18 | % | | | 2.19 | % | | | 2.25 | % |
| Gross expenses | | | 4.14 | % | | | 3.53 | % | | | 2.79 | % | | | 2.63 | % | | | 5.09 | % |
| Net investment loss | | | (1.09 | %) | | | (1.04 | %) | | | (0.97 | %) | | | (0.44 | %) | | | (0.84 | %) |
| Portfolio turnover rate | | | 56 | % | | | 59 | % | | | 42 | % | | | 57 | % | | | 73 | % |
| | | | | | | | | | | | | | | | | | | | | |
| (A) | Impact of payment from affiliate was less than $0.01 per share and 0.01%, respectively. |
| (B) | Total returns shown exclude the effect of applicable sales loads. If these charges were included, the returns would be lower. |
See accompanying Notes to Financial Statements.
Financial Highlights (Continued)
| Touchstone Small Cap Value Opportunities Fund—Class Y |
| Selected Data for a Share Outstanding Throughout Each Period |
| | | Year Ended June 30, | |
| | | 2018 | | | 2017 | | | 2016 | | | 2015 | | | 2014 | |
| Net asset value at beginning of period | | $ | 17.84 | | | $ | 15.77 | | | $ | 19.69 | | | $ | 21.90 | | | $ | 19.45 | |
| Income (loss) from investment operations: | | | | | | | | | | | | | | | | | | | | |
| Net investment income (loss) | | | (0.03 | ) | | | (— | )(A) | | | 0.01 | | | | 0.09 | | | | 0.04 | |
| Net realized and unrealized gains (losses) on investments | | | 2.05 | | | | 2.10 | | | | (2.67 | ) | | | 0.41 | | | | 6.11 | (B) |
| Total from investment operations | | | 2.02 | | | | 2.10 | | | | (2.66 | ) | | | 0.50 | | | | 6.15 | |
| Distributions from: | | | | | | | | | | | | | | | | | | | | |
| Net investment income | | | — | | | | (0.01 | ) | | | — | | | | (0.34 | ) | | | (0.06 | ) |
| Realized capital gains | | | — | | | | (0.02 | ) | | | (1.26 | ) | | | (2.37 | ) | | | (3.64 | ) |
| Total distributions | | | — | | | | (0.03 | ) | | | (1.26 | ) | | | (2.71 | ) | | | (3.70 | ) |
| Net asset value at end of period | | $ | 19.86 | | | $ | 17.84 | | | $ | 15.77 | | | $ | 19.69 | | | $ | 21.90 | |
| Total return | | | 11.32 | % | | | 13.30 | % | | | (13.46 | %) | | | 2.92 | % | | | 33.80 | %(B) |
| Ratios and supplemental data: | | | | | | | | | | | | | | | | | | | | |
| Net assets at end of period (000's) | | $ | 46,224 | | | $ | 105,692 | | | $ | 104,377 | | | $ | 149,852 | | | $ | 140,689 | |
| Ratio to average net assets: | | | | | | | | | | | | | | | | | | | | |
| Net expenses | | | 1.18 | % | | | 1.18 | % | | | 1.18 | % | | | 1.20 | % | | | 1.17 | % |
| Gross expenses | | | 1.30 | % | | | 1.29 | % | | | 1.28 | % | | | 1.26 | % | | | 1.24 | % |
| Net investment income (loss) | | | (0.09 | %) | | | (0.04 | %) | | | 0.03 | % | | | 0.55 | % | | | 0.24 | % |
| Portfolio turnover rate | | | 56 | % | | | 59 | % | | | 42 | % | | | 57 | % | | | 73 | % |
| Touchstone Small Cap Value Opportunities Fund—Institutional Class |
| Selected Data for a Share Outstanding Throughout Each Period |
| | | Year Ended June 30, | |
| | | 2018 | | | 2017 | | | 2016 | | | 2015 | | | 2014 | |
| Net asset value at beginning of period | | $ | 18.10 | | | $ | 15.99 | | | $ | 19.94 | | | $ | 22.13 | | | $ | 19.62 | |
| Income (loss) from investment operations: | | | | | | | | | | | | | | | | | | | | |
| Net investment income (loss) | | | (— | )(A) | | | 0.09 | | | | 0.02 | | | | 0.16 | | | | 0.04 | |
| Net realized and unrealized gains (losses) on investments | | | 2.07 | | | | 2.06 | | | | (2.71 | ) | | | 0.37 | | | | 6.18 | (B) |
| Total from investment operations | | | 2.07 | | | | 2.15 | | | | (2.69 | ) | | | 0.53 | | | | 6.22 | |
| Distributions from: | | | | | | | | | | | | | | | | | | | | |
| Net investment income | | | — | | | | (0.02 | ) | | | — | | | | (0.35 | ) | | | (0.07 | ) |
| Realized capital gains | | | — | | | | (0.02 | ) | | | (1.26 | ) | | | (2.37 | ) | | | (3.64 | ) |
| Total distributions | | | — | | | | (0.04 | ) | | | (1.26 | ) | | | (2.72 | ) | | | (3.71 | ) |
| Net asset value at end of period | | $ | 20.17 | | | $ | 18.10 | | | $ | 15.99 | | | $ | 19.94 | | | $ | 22.13 | |
| Total return | | | 11.44 | % | | | 13.46 | % | | | (13.44 | %) | | | 3.04 | % | | | 33.90 | %(B) |
| Ratios and supplemental data: | | | | | | | | | | | | | | | | | | | | |
| Net assets at end of period (000's) | | $ | 8,240 | | | $ | 5,257 | | | $ | 26,483 | | | $ | 31,318 | | | $ | 26,466 | |
| Ratio to average net assets: | | | | | | | | | | | | | | | | | | | | |
| Net expenses | | | 1.10 | % | | | 1.10 | % | | | 1.10 | % | | | 1.10 | % | | | 1.10 | % |
| Gross expenses | | | 1.49 | % | | | 1.30 | % | | | 1.24 | % | | | 1.32 | % | | | 1.37 | % |
| Net investment income (loss) | | | (0.01 | %) | | | 0.04 | % | | | 0.11 | % | | | 0.66 | % | | | 0.31 | % |
| Portfolio turnover rate | | | 56 | % | | | 59 | % | | | 42 | % | | | 57 | % | | | 73 | % |
| | | | | | | | | | | | | | | | | | | | | |
| (A) | Less than $0.005 per share. |
| (B) | Impact of payment from affiliate was less than $0.01 per share and 0.01%, respectively. |
See accompanying Notes to Financial Statements.
Financial Highlights (Continued)
| Touchstone Value Fund—Class A |
| Selected Data for a Share Outstanding Throughout Each Period |
| | | Year Ended June 30, | |
| | | 2018 | | | 2017 | | | 2016 | | | 2015 | | | 2014 | |
| Net asset value at beginning of period | | $ | 10.13 | | | $ | 8.84 | | | $ | 9.78 | | | $ | 9.56 | | | $ | 8.02 | |
| Income (loss) from investment operations: | | | | | | | | | | | | | | | | | | | | |
| Net investment income | | | 0.14 | | | | 0.19 | | | | 0.16 | | | | 0.16 | | | | 0.19 | |
| Net realized and unrealized gains (losses) on investments | | | 0.55 | | | | 1.30 | | | | (0.27 | ) | | | 0.34 | | | | 1.53 | |
| Total from investment operations | | | 0.69 | | | | 1.49 | | | | (0.11 | ) | | | 0.50 | | | | 1.72 | |
| Distributions from: | | | | | | | | | | | | | | | | | | | | |
| Net investment income | | | (0.14 | ) | | | (0.18 | ) | | | (0.16 | ) | | | (0.11 | ) | | | (0.18 | ) |
| Realized capital gains | | | (0.76 | ) | | | (0.02 | ) | | | (0.67 | ) | | | (0.17 | ) | | | — | |
| Total distributions | | | (0.90 | ) | | | (0.20 | ) | | | (0.83 | ) | | | (0.28 | ) | | | (0.18 | ) |
| Net asset value at end of period | | $ | 9.92 | | | $ | 10.13 | | | $ | 8.84 | | | $ | 9.78 | | | $ | 9.56 | |
| Total return(A) | | | 6.92 | % | | | 16.92 | % | | | (0.89 | %) | | | 5.26 | % | | | 21.50 | % |
| Ratios and supplemental data: | | | | | | | | | | | | | | | | | | | | |
| Net assets at end of period (000's) | | $ | 36,968 | | | $ | 43,607 | | | $ | 47,939 | | | $ | 55,539 | | | $ | 66,000 | |
| Ratio to average net assets: | | | | | | | | | | | | | | | | | | | | |
| Net expenses | | | 1.08 | % | | | 1.08 | % | | | 1.08 | % | | | 1.08 | % | | | 1.07 | % |
| Gross expenses | | | 1.26 | % | | | 1.24 | % | | | 1.28 | % | | | 1.27 | % | | | 1.31 | % |
| Net investment income | | | 1.42 | % | | | 1.86 | % | | | 1.71 | % | | | 1.54 | % | | | 2.13 | % |
| Portfolio turnover rate | | | 24 | % | | | 29 | % | | | 19 | %(B) | | | 20 | % | | | 26 | % |
| Touchstone Value Fund—Class C |
| Selected Data for a Share Outstanding Throughout Each Period |
| | | Year Ended June 30, | |
| | | 2018 | | | 2017 | | | 2016 | | | 2015 | | | 2014 | |
| Net asset value at beginning of period | | $ | 10.10 | | | $ | 8.81 | | | $ | 9.75 | | | $ | 9.55 | | | $ | 8.02 | |
| Income (loss) from investment operations: | | | | | | | | | | | | | | | �� | | | | | |
| Net investment income | | | 0.08 | | | | 0.12 | | | | 0.09 | | | | 0.07 | | | | 0.11 | |
| Net realized and unrealized gains (losses) on investments | | | 0.54 | | | | 1.29 | | | | (0.27 | ) | | | 0.35 | | | | 1.54 | |
| Total from investment operations | | | 0.62 | | | | 1.41 | | | | (0.18 | ) | | | 0.42 | | | | 1.65 | |
| Distributions from: | | | | | | | | | | | | | | | | | | | | |
| Net investment income | | | (0.07 | ) | | | (0.10 | ) | | | (0.09 | ) | | | (0.05 | ) | | | (0.12 | ) |
| Realized capital gains | | | (0.76 | ) | | | (0.02 | ) | | | (0.67 | ) | | | (0.17 | ) | | | — | |
| Total distributions | | | (0.83 | ) | | | (0.12 | ) | | | (0.76 | ) | | | (0.22 | ) | | | (0.12 | ) |
| Net asset value at end of period | | $ | 9.89 | | | $ | 10.10 | | | $ | 8.81 | | | $ | 9.75 | | | $ | 9.55 | |
| Total return(A) | | | 6.12 | % | | | 16.06 | % | | | (1.65 | %) | | | 4.41 | % | | | 20.61 | % |
| Ratios and supplemental data: | | | | | | | | | | | | | | | | | | | | |
| Net assets at end of period (000's) | | $ | 3,654 | | | $ | 4,503 | | | $ | 5,624 | | | $ | 6,932 | | | $ | 5,218 | |
| Ratio to average net assets: | | | | | | | | | | | | | | | | | | | | |
| Net expenses | | | 1.83 | % | | | 1.83 | % | | | 1.83 | % | | | 1.83 | % | | | 1.82 | % |
| Gross expenses | | | 2.21 | % | | | 2.12 | % | | | 2.16 | % | | | 2.14 | % | | | 2.19 | % |
| Net investment income | | | 0.68 | % | | | 1.11 | % | | | 0.96 | % | | | 0.79 | % | | | 1.38 | % |
| Portfolio turnover rate | | | 24 | % | | | 29 | % | | | 19 | %(B) | | | 20 | % | | | 26 | % |
| | | | | | | | | | | | | | | | | | | | | |
| (A) | Total returns shown exclude the effect of applicable sales loads. If these charges were included, the returns would be lower. |
| (B) | Portfolio turnover rate excludes securities received from processing a subscription-in-kind. |
See accompanying Notes to Financial Statements.
Financial Highlights (Continued)
| Touchstone Value Fund—Class Y |
| Selected Data for a Share Outstanding Throughout Each Period |
| | | Year Ended June 30, | |
| | | 2018 | | | 2017 | | | 2016 | | | 2015 | | | 2014 | |
| Net asset value at beginning of period | | $ | 10.17 | | | $ | 8.87 | | | $ | 9.81 | | | $ | 9.59 | | | $ | 8.05 | |
| Income (loss) from investment operations: | | | | | | | | | | | | | | | | | | | | |
| Net investment income | | | 0.17 | | | | 0.20 | | | | 0.18 | | | | 0.18 | | | | 0.21 | |
| Net realized and unrealized gains (losses) on investments | | | 0.55 | | | | 1.32 | | | | (0.27 | ) | | | 0.35 | | | | 1.53 | |
| Total from investment operations | | | 0.72 | | | | 1.52 | | | | (0.09 | ) | | | 0.53 | | | | 1.74 | |
| Distributions from: | | | | | | | | | | | | | | | | | | | | |
| Net investment income | | | (0.17 | ) | | | (0.20 | ) | | | (0.18 | ) | | | (0.14 | ) | | | (0.20 | ) |
| Realized capital gains | | | (0.76 | ) | | | (0.02 | ) | | | (0.67 | ) | | | (0.17 | ) | | | — | |
| Total distributions | | | (0.93 | ) | | | (0.22 | ) | | | (0.85 | ) | | | (0.31 | ) | | | (0.20 | ) |
| Net asset value at end of period | | $ | 9.96 | | | $ | 10.17 | | | $ | 8.87 | | | $ | 9.81 | | | $ | 9.59 | |
| Total return | | | 7.19 | % | | | 17.28 | % | | | (0.64 | %) | | | 5.52 | % | | | 21.71 | % |
| Ratios and supplemental data: | | | | | | | | | | | | | | | | | | | | |
| Net assets at end of period (000's) | | $ | 81,988 | | | $ | 83,974 | | | $ | 76,852 | | | $ | 104,668 | | | $ | 113,055 | |
| Ratio to average net assets: | | | | | | | | | | | | | | | | | | | | |
| Net expenses | | | 0.81 | % | | | 0.83 | % | | | 0.83 | % | | | 0.82 | % | | | 0.80 | % |
| Gross expenses | | | 0.95 | % | | | 0.97 | % | | | 0.99 | % | | | 0.97 | % | | | 0.99 | % |
| Net investment income | | | 1.70 | % | | | 2.11 | % | | | 1.96 | % | | | 1.80 | % | | | 2.39 | % |
| Portfolio turnover rate | | | 24 | % | | | 29 | % | | | 19 | %(A) | | | 20 | % | | | 26 | % |
| Touchstone Value Fund—Institutional Class |
| Selected Data for a Share Outstanding Throughout Each Period |
| | | Year Ended June 30, | |
| | | 2018 | | | 2017 | | | 2016 | | | 2015 | | | 2014 | |
| Net asset value at beginning of period | | $ | 10.14 | | | $ | 8.85 | | | $ | 9.79 | | | $ | 9.57 | | | $ | 8.03 | |
| Income (loss) from investment operations: | | | | | | | | | | | | | | | | | | | | |
| Net investment income | | | 0.19 | | | | 0.22 | | | | 0.19 | | | | 0.18 | | | | 0.21 | |
| Net realized and unrealized gains (losses) on investments | | | 0.55 | | | | 1.31 | | | | (0.27 | ) | | | 0.36 | | | | 1.54 | |
| Total from investment operations | | | 0.74 | | | | 1.53 | | | | (0.08 | ) | | | 0.54 | | | | 1.75 | |
| Distributions from: | | | | | | | | | | | | | | | | | | | | |
| Net investment income | | | (0.19 | ) | | | (0.22 | ) | | | (0.19 | ) | | | (0.15 | ) | | | (0.21 | ) |
| Realized capital gains | | | (0.76 | ) | | | (0.02 | ) | | | (0.67 | ) | | | (0.17 | ) | | | — | |
| Total distributions | | | (0.95 | ) | | | (0.24 | ) | | | (0.86 | ) | | | (0.32 | ) | | | (0.21 | ) |
| Net asset value at end of period | | $ | 9.93 | | | $ | 10.14 | | | $ | 8.85 | | | $ | 9.79 | | | $ | 9.57 | |
| Total return | | | 7.34 | % | | | 17.38 | % | | | (0.49 | %) | | | 5.68 | % | | | 21.92 | % |
| Ratios and supplemental data: | | | | | | | | | | | | | | | | | | | | |
| Net assets at end of period (000's) | | $ | 262,467 | | | $ | 249,035 | | | $ | 219,824 | | | $ | 248,381 | | | $ | 245,573 | |
| Ratio to average net assets: | | | | | | | | | | | | | | | | | | | | |
| Net expenses | | | 0.68 | % | | | 0.68 | % | | | 0.68 | % | | | 0.68 | % | | | 0.67 | % |
| Gross expenses | | | 0.87 | % | | | 0.86 | % | | | 0.87 | % | | | 0.86 | % | | | 0.87 | % |
| Net investment income | | | 1.82 | % | | | 2.26 | % | | | 2.11 | % | | | 1.94 | % | | | 2.52 | % |
| Portfolio turnover rate | | | 24 | % | | | 29 | % | | | 19 | %(A) | | | 20 | % | | | 26 | % |
| | | | | | | | | | | | | | | | | | | | | |
| (A) | Portfolio turnover rate excludes securities received from processing a subscription-in-kind. |
See accompanying Notes to Financial Statements.
Notes to Financial Statements
June 30, 2018
1. Organization
The Touchstone Strategic Trust (the “Trust”) is registered under the Investment Company Act of 1940, as amended (the “1940 Act”), as an open-end management investment company. The Trust was established as a Massachusetts business trust pursuant to an Agreement and Declaration of Trust dated November 18, 1982. The Trust consists of twenty-five funds including, the following eight funds (individually, a “Fund”, and collectively, the “Funds”):
Touchstone Credit Opportunities Fund (“Credit Opportunities Fund”)
Touchstone International Growth Opportunities Fund (“International Growth Opportunities Fund”) (formerly known as Touchstone Global Growth Fund)
Touchstone International Small Cap Fund (“International Small Cap Fund“)
Touchstone Large Cap Fund (“Large Cap Fund”)
Touchstone Large Company Growth Fund (“Large Company Growth Fund”)
Touchstone Ohio Tax-Free Bond Fund (”Ohio Tax-Free Bond Fund”)
Touchstone Small Cap Value Opportunities Fund (“Small Cap Value Opportunities Fund”)
Touchstone Value Fund (“Value Fund”)
Each Fund is diversified, with the exception of the Credit Opportunities Fund, the International Growth Opportunities Fund, the Large Cap Fund, the Large Company Growth Fund and the Ohio Tax-Free Bond Fund, which are non-diversified.
The Agreement and Declaration of Trust permits the Trust to issue an unlimited number of shares of beneficial interest of each Fund. The Funds are registered to offer the following classes of shares: Class A shares, Class C shares, Class Y shares, and Institutional Class shares. The assets of each Fund are segregated, and a shareholder’s interest is limited to the Fund in which shares are held. The Funds’ prospectus provides a description of each Fund’s investment goal, policies, and strategies along with information on the classes of shares currently being offered.
2. Significant Accounting Policies
The following is a summary of the Funds’ significant accounting policies:
Each Fund is an investment company that follows the accounting and reporting guidance of Accounting Standards Codification Topic 946 applicable to investment companies.
Security valuation and fair value measurements — U.S. generally accepted accounting principles (“U.S. GAAP”) define fair value as the price the Funds would receive to sell an asset or pay to transfer a liability in an orderly transaction between market participants at the measurement date. All investments in securities are recorded at their fair value. The Funds define the term “market value”, as used throughout this report, as the estimated fair value. The Funds use various methods to measure fair value of their portfolio securities on a recurring basis. U.S. GAAP fair value measurement standards require disclosure of a hierarchy that prioritizes inputs to valuation methods.
These inputs are summarized in the three broad levels listed below:
| · | Level 1 – quoted prices in active markets for identical securities |
| · | Level 2 – other significant observable inputs (including quoted prices for similar securities, interest rates, prepayment speeds, credit risk, etc.) |
| · | Level 3 – significant unobservable inputs (including a Fund’s own assumptions in determining the fair value of investments) |
Notes to Financial Statements (Continued)
The inputs or methodology used for valuing securities are not necessarily an indication of the risk associated with investing in those securities.
The aggregate value by input level, as of June 30, 2018, for each Fund’s investments, as well as a reconciliation of assets for which significant unobservable inputs (Level 3) were used in determining value, if applicable, is included in each Fund’s Portfolio of Investments, which also includes a breakdown of the Fund’s investments by geographic, portfolio or sector allocation. The Credit Opportunities Fund and Small Cap Value Opportunities Fund held Level 3 categorized securities during the year ended June 30, 2018.
Changes in valuation techniques may result in transfers into or out of an investment’s assigned level within the hierarchy. All transfers in and out of the levels are recognized at the value at the end of the period. At June 30, 2018, there were no transfers between Levels 1, 2 and 3 for the Funds, except as shown in the Portfolio of Investments for the Credit Opportunities Fund, International Growth Opportunities Fund and International Small Cap Fund.
During the year ended June 30, 2018, there were no material changes to the valuation policies and techniques.
The Funds’ portfolio securities are valued as of the close of the regular session of trading on the New York Stock Exchange (“NYSE”) (currently 4:00 p.m., Eastern Time or at the time as of which the NYSE establishes official closing prices). Portfolio securities traded on stock exchanges are valued at the last reported sale price, official close price, or last bid price if no sales are reported. Portfolio securities quoted by NASDAQ are valued at the NASDAQ Official Closing Price (“NOCP”) or from the primary exchange on which the security trades. To the extent these securities are actively traded, they are categorized in Level 1 of the fair value hierarchy. Options are valued at the last quoted sales price. If there is no such reported sale on the valuation date, long option positions are valued at the most recent bid price, and short option positions are valued at the most recent ask price on the valuation date and are categorized in Level 1. Shares of mutual funds in which the Funds invest are valued at their respective net asset value (“NAV”) as reported by the underlying funds and are categorized in Level 1.
Debt securities held by the Funds are valued at their evaluated bid by an independent pricing service or at their last broker-quoted bid prices as obtained from one or more of the major market makers for such securities. Independent pricing services use information provided by market makers or estimates of market values through accepted market modeling conventions. Observable inputs to the models may include prepayment speeds, pricing spread, yield, trade information, dealer quotes, market color, cash flow models, the securities’ terms and conditions, among others, and are generally categorized in Level 2. The Credit Opportunities Fund’s investments in bank loans are normally valued at the bid quotation obtained from dealers in loans by an independent pricing service in accordance with the Fund’s valuation policies and procedures approved by the Funds’ Board of Trustees (the “Board”), and are generally categorized in Level 2. The Credit Opportunities Fund’s investments in asset-backed and mortgage-backed securities are valued by independent pricing services using models that consider estimated cash flows of each tranche of the security, establish a benchmark yield and develop an estimated tranche specific spread to the benchmark yield based on the unique attributes of the tranche, and are generally categorized in Level 2. Debt securities with remaining maturities of 60 days or less may be valued at amortized cost, provided such amount approximates market value and are categorized in Level 2. While this method provides consistency in valuation (and may only be used if it approximates market value), it may result in periods during which fair value, as determined by amortized cost, is higher or lower than the price that would be received if the Fund sold the investment.
Foreign currency exchange contracts are valued at the mean between the bid and ask prices and are determined as of the close of regular trading on the NYSE. Interpolated values are derived when the settlement date of the contract is an interim date for which quotations are not available and are categorized in Level 2.
Notes to Financial Statements (Continued)
Securities mainly traded on a non-U.S. exchange or denominated in foreign currencies are generally valued according to the preceding closing values on that exchange, translated to U.S. dollars using currency exchange rates as of the close of regular trading on the NYSE, and are generally categorized in Level 1. However, if an event that may change the value of a security occurs after the time that the closing value on the non-U.S. exchange was determined, but before the close of regular trading on the NYSE, the security may be priced based on fair value and is generally categorized in Level 2. This may cause the value of the security, if held on the books of a Fund, to be different from the closing value on the non-U.S. exchange and may affect the calculation of that Fund’s NAV.
The Funds may use fair value pricing under the following circumstances, among others:
| · | If the value of a security has been materially affected by events occurring before the Funds’ pricing time but after the close of the primary markets on which the security is traded. |
| · | If the exchange on which a portfolio security is principally traded closes early or if trading in a particular portfolio security was halted during the day and did not resume prior to the Funds’ NAV calculation. |
| · | If a security is so thinly traded that reliable market quotations are unavailable due to infrequent trading. |
| · | If the validity of market quotations is not reliable. |
Securities held by the Funds that do not have readily available market quotations, significant observable inputs, or securities for which the available market quotations are not reliable, are priced at their estimated fair value using procedures approved by the Board and are generally categorized in Level 3.
Bank Loans — The Credit Opportunities Fund may invest in bank loans, which usually take the form of loan participations and assignments. Loan participations and assignments are agreements to make money available to U.S. or foreign corporations, partnerships or other business entities (the “Borrower”) in a specified amount, at a specified rate and within a specified time. A loan is typically originated, negotiated and structured by a U.S. or foreign bank, insurance company or other financial institution (the “Agent”) for a group of loan investors (“Loan Investors”). The Agent typically administers and enforces the loan on behalf of the other Loan Investors in the syndicate and may hold any collateral on behalf of the Loan Investors. Such loan participations and assignments are typically senior, secured and collateralized in nature. The Fund records an investment when the Borrower withdraws money and records interest as earned. These loans pay interest at rates which are periodically reset by reference to a base lending rate plus a spread. These base lending rates are generally the prime rate offered by a designated U.S. bank or London InterBank Offered Rate (“LIBOR”).
The loans in which the Fund invests may be subject to some restrictions on resale. For example, the Fund may be contractually obligated to receive approval from the Agent and/or Borrower prior to the sale of these investments. The Fund generally has no right to enforce compliance with the terms of the loan agreement with the Borrower. As a result, the Fund assumes the credit risk of the Borrower, the selling participant and any other persons interpositioned between the Fund and the Borrower (“Intermediate Participants”). In the event that the Borrower, selling participant or Intermediate Participants become insolvent or enter into bankruptcy, the Fund may incur certain costs and delays in realizing payment or may suffer a loss of principal and/or interest.
Unfunded commitments represent the remaining obligation of the Fund to the Borrower. At any point in time, up to the maturity date of the issue, the Borrower may demand the unfunded portion. Until demanded by the Borrower, unfunded commitments are not recognized as an asset on the Statements of Assets and Liabilities. Unrealized appreciation/depreciation on unfunded commitments presented on the Statements of Assets and Liabilities represents fair value of the unfunded portion of the Fund’s bank loans.
As of June 30, 2018, the Credit Opportunities Fund did not hold any unfunded loan commitments.
Notes to Financial Statements (Continued)
Collateralized Loan Obligations — The Credit Opportunities Fund may invest in collateralized loan obligations (“CLOs”). CLOs are types of asset-backed securities. A CLO is an entity that is backed by syndicated bank loans. The cash flows of the CLO can be split into multiple segments, called “tranches,” which will vary in risk profile and yield. The riskiest segment is the subordinated or “equity” tranche. This tranche bears the greatest risk of defaults from the underlying assets in the CLO and serves to protect the other, more senior, tranches from default in all but the most severe circumstances. Since it is shielded from defaults by the more junior tranches, a “senior” tranche will typically have higher credit ratings and lower yields than their underlying securities, and often receive investment grade ratings from one or more of the nationally recognized rating agencies. Despite the protection from the more junior tranches, senior tranches can experience substantial losses due to actual defaults, increased sensitivity to future defaults and the disappearance of one or more protecting tranches as a result of changes in the credit profile of the underlying pool of assets.
Investment companies — The Funds may invest in securities of other investment companies, including exchange-traded funds (“ETFs”), open-end funds and closed-end funds. Open-end funds are investment companies that issue new shares continuously and redeem shares daily. Closed-end funds are investment companies that typically issue a fixed number of shares that trade on a securities exchange or over-the-counter (“OTC”). An ETF is an investment company that typically seeks to track the performance of an index by holding in its portfolio shares of all the companies, or a representative sample of the companies, that are components of a particular index. ETF shares are traded on a securities exchange based on their market value. The risks of investment in other investment companies typically reflect the risks of the types of securities in which the other investment companies invest. Investments in ETFs and closed-end funds are subject to the additional risk that their shares may trade at a premium or discount to their NAV. When a Fund invests in another investment company, shareholders of the Fund indirectly bear their proportionate share of the other investment company’s fees and expenses, including operating, registration, trustee, licensing and marketing, as well as their share of the Fund’s fees and expenses.
Securities sold short — The Credit Opportunities Fund may engage in selling securities short, which obligates the Fund to replace a security borrowed by purchasing the same security at the current market value. The Fund would incur a loss if the price of the security increases between the date of the short sale and the date on which the Fund replaces the borrowed security. The Fund would realize a gain if the price of the security declines between those dates. As of June 30, 2018, the Credit Opportunities Fund had securities sold short with a fair value of $(316,750) and pledged securities with a fair value of $2,009,678 as collateral for both securities sold short and written options.
Options — The Credit Opportunities Fund may write or purchase financial option contracts primarily to hedge against changes in the value of equity securities (or securities that the Fund intends to purchase), against fluctuations in fair value caused by changes in prevailing market interest rates or foreign currency exchange rates and against changes in overall equity market volatility. In addition, the Fund may utilize options in an attempt to generate gains from option premiums or to reduce overall portfolio risk. The Fund’s option strategy primarily focuses on the use of writing and/or purchasing call or put options on equity indexes. When the Fund writes or purchases an option, an amount equal to the premium received or paid by the Fund is recorded as a liability or an asset and is subsequently adjusted to the current market value of the option written or purchased. Premiums received or paid from writing or purchasing options which expire unexercised are treated by the Fund on the expiration date as realized gains or losses. The difference between the premium and the amount paid or received on effecting a closing purchase or sale transaction, including brokerage commissions, is also treated as a realized gain or loss. If an option is exercised, the premium paid or received is added to the cost of the purchase or proceeds from the sale in determining whether the Fund has realized a gain or loss on investment transactions. The Fund, as writer of an option, may have no control over whether the underlying securities may be sold (call) or purchased (put) and as a result bears the market risk of an unfavorable change in the price
Notes to Financial Statements (Continued)
of the security underlying the written option. The Fund, as purchaser of an option, bears the risk that the counterparties to the option may not have the ability to meet the terms of the option contracts. There is minimal counterparty credit risk involved in entering into option contracts since they are exchange-traded instruments and the exchange’s clearinghouse, as counterparty to all exchange-traded options, guarantees the options against default.
As of June 30, 2018, the Credit Opportunities Fund had written options with fair value of $(5,400) and pledged securities with a fair value of $2,009,678 as collateral for both securities sold short and written options and had a related due to prime broker balance of $398,994. The Credit Opportunities Fund held purchased options with a fair value of $61,468 as of June 30, 2018.
Warrants — The Funds can invest in warrants and stock purchase rights of companies of any market capitalization. A warrant gives the company the right to buy stock, typically from the issuer. The warrant specifies the amount of underlying stock, the purchase (or “exercise”) price, and the date the warrant expires. Certain warrants may permit, without legal obligation, net settlement for stock or cash. The Funds have no obligation to exercise the warrant and buy the stock.
Foreign currency translation — The books and records of the Funds are maintained in U.S. dollars and translated into U.S. dollars on the following basis:
| (1) | market value of investment securities, assets and liabilities at the current rate of exchange on the valuation date; and |
| (2) | purchases and sales of investment securities, income, and expenses at the relevant rates of exchange prevailing on the respective dates of such transactions. |
The Funds do not isolate that portion of gains and losses on investments in equity securities that is due to changes in the foreign exchange rates from that which is due to changes in market prices of equity securities.
Forward foreign currency contracts — A forward foreign currency contract is an agreement between two parties to buy and sell a specific currency at a price that is set on the date of the contract. The forward contract calls for delivery of the currency on a future date that is specified in the contract. Risks related to the use of forwards include the possible failure of counterparties to meet the terms of the forward agreement, the failure of the counterparties to timely post collateral, the risk that currency movements will not occur thereby reducing a Fund’s total return, and the potential for losses in excess of a Fund’s initial investment.
The market value of a forward foreign currency contract fluctuates with changes in foreign currency exchange rates. Forward foreign currency contracts are marked to market daily and the change in value is recorded by a Fund as an unrealized gain or loss. Realized gains or losses, equal to the difference between the value of the contract at the time it was opened and the value at the time it was closed, are recorded upon delivery or receipt of the currency.
As of June 30, 2018, there were no open forward foreign currency contracts.
Real Estate Investment Trusts — The Funds may invest in real estate investment trusts (“REITs”) that involve risks not associated with investing in stocks. Risks associated with investments in REITs include declines in the value of real estate, general and economic conditions, changes in the value of the underlying property and defaults by borrowers. The value of assets in the real estate industry may go through cycles of relative underperformance and outperformance in comparison to equity securities markets in general. Dividend income is recorded using management’s estimate of the income included in distributions received from REIT investments. The actual amounts of income, return of capital and capital gains are only determined by each REIT after its fiscal year-end and may differ from the estimated amount. Estimates of income are adjusted in the Funds to the actual amounts when the amounts are determined.
Notes to Financial Statements (Continued)
Pay-In-Kind (“PIK”) Bonds – PIK bonds are securities that, at the issuer’s option, pay interest in either cash or additional securities for a specified period. PIK bonds, like zero coupon bonds, are designed to give an issuer flexibility in managing cash flow. PIK bonds are expected to reflect the market value of the underlying debt plus an amount representing accrued interest since the last payment. PIK bonds are usually less volatile than zero coupon bonds, but more volatile than cash pay securities.
Derivative instruments and hedging activities — The Credit Opportunities Fund may enter into an International Swaps and Derivatives Association, Inc. Master Agreement (“ISDA Master Agreement” or “MNA”) or similar agreement with certain counterparties. An ISDA Master Agreement is a bilateral agreement between the Fund and a counterparty that governs OTC derivatives and foreign exchange contracts, and typically contains, among other things, collateral posting terms and master netting provisions in the event of a default or termination. Under an ISDA Master Agreement, a party may, under certain circumstances, offset with the counterparty certain derivative financial instruments’ payables or receivables with collateral held or posted and create one single net payment. The provisions of the ISDA Master Agreement typically permit a single net payment in the event of default (close-out netting). These default events include bankruptcy or insolvency of the counterparty. Note, however, that bankruptcy or insolvency laws of a particular jurisdiction may impose restrictions on or prohibitions against the right of offset.
When entering into a derivative transaction, the Fund may be required to post and maintain collateral or margin (including both initial and maintenance margin). Collateral and margin requirements differ by type of derivative. Margin requirements are established by the broker or clearing house for exchange-traded and centrally cleared derivatives (financial futures contracts, options, and centrally cleared swaps). Brokers can ask for margining in excess of the clearing house’s minimum in certain circumstances. Collateral terms are contract specific for OTC derivatives (forward foreign currency contracts, options, and swaps). For derivatives traded under an ISDA Master Agreement, the collateral requirements are typically calculated by netting the marked-to-market amount for each transaction under such agreement and comparing that amount to the value of any collateral currently pledged by the Fund and the counterparty. For financial reporting purposes, cash collateral that has been pledged to cover obligations of the Fund and cash collateral received from the counterparty, if any, are reported separately on the Statements of Assets and Liabilities as cash deposits held at prime broker and due to prime broker, respectively. Non-cash collateral pledged by the Fund, if any, is noted in the Portfolio of Investments. To the extent amounts due to the Fund from its counterparties are not fully collateralized, contractually or otherwise, the Fund bears the risk of loss from counterparty non-performance.
Certain ISDA Master Agreements allow counterparties to OTC derivatives transactions to terminate derivative contracts prior to maturity in the event the Fund’s net assets decline by a stated percentage or the Fund fails to meet the terms of its ISDA Master Agreement, which would cause the Fund (counterparty) to accelerate payment of any net liability owed to the counterparty (Fund).
For financial reporting purposes, the Credit Opportunities Fund does not offset derivative assets and derivative liabilities that are subject to netting arrangements in the Statements of Assets and Liabilities.
As of June 30, 2018, the Credit Opportunities Fund’s assets and liabilities that were subject to a MNA on a gross basis were as follows:
| | | Assets | | | Liabilities | |
| Derivative Financial Instruments: | | | | | | | | |
| Written Options | | $ | — | | | $ | (5,400 | ) |
Notes to Financial Statements (Continued)
The following table presents the Credit Opportunities Fund’s liabilities net of amounts available for offset under a MNA and net of the related collateral received by the Fund as of June 30, 2018:
| | | | | | Gross Amounts | | | | | | | | | | |
| | | | | | Available for Offset | | | | | | | | | | |
| | | Gross Amount of | | | in Statement of | | | Non-cash | | | | | | | |
| | | Recognized | | | Assets and | | | Collateral | | | Cash Collateral | | | | |
| | | Liabilities | | | Liabilities | | | Pledged | | | Pledged | | | Net Amount(B) | |
| Written Options(A) | | $ | 5,400 | | | $ | — | | | $ | (5,400 | ) | | $ | — | | | $ | — | |
| (A) | Pershing LLC is the counterparty. |
| (B) | Net amount represents the net amount payable due to the counterparty in the event of default. |
The following table sets forth the fair value of the Credit Opportunities Fund’s derivative financial instruments by primary risk exposure as of June 30, 2018:
Fair Value of Derivative Investments
As of June 30, 2018
| | | Derivatives not accounted for as hedging | | Asset | | | Liability | |
| Fund | | instruments under ASC 815 | | Derivatives | | | Derivatives | |
| Credit Opportunities Fund | | Purchased Options - Equity Contracts* | | $ | 61,468 | | | $ | — | |
| | | Written Options - Equity Contracts** | | | — | | | | (5,400 | ) |
* Statements of Assets and Liabilities Location: Investments, at market value.
** Statements of Assets and Liabilities Location: Written options, at market value.
The following table sets forth the effect of the Credit Opportunities Fund’s derivative financial instruments by primary risk exposure on the Statements of Operations for the year ended June 30, 2018:
The Effect of Derivative Investments on the Statements of Operations
for the Year Ended June 30, 2018
| | | | | | | | Change in | |
| | | | | | | | Unrealized | |
| | | | | Realized Gain | | | Appreciation | |
| | | | | (Loss) | | | (Depreciation) | |
| | | Derivatives not accounted for as hedging | | on | | | on | |
| Fund | | instruments under ASC 815 | | Derivatives | | | Derivatives | |
| Credit Opportunities Fund | | Purchased Options - Equity Contracts* | | $ | 5,536 | | | $ | 11,098 | |
| | | Written Options - Equity Contracts** | | | (11,746 | ) | | | (1,418 | ) |
* Statements of Operations Location: Net realized gains on investments and Net change in unrealized appreciation (depreciation) on investments.
** Statements of Operations Location: Net realized losses on written options and Net change in unrealized appreciation (depreciation) on written options.
For the year ended June 30, 2018, the average quarterly balances of outstanding derivative financial instruments were as follows:
| | | Credit | |
| | | Opportunities | |
| | | Fund | |
| Equity Contracts: | | | | |
| Purchased Options - Cost | | $ | 15,187 | |
| Written Options - Premiums Received | | | 1,304 | |
Portfolio securities loaned — The Funds may lend their portfolio securities. Lending portfolio securities exposes the Funds to the risk that the borrower may fail to return the loaned securities or may not be able to provide additional collateral or that the Funds may experience delays in recovery of the loaned securities or loss of rights in the collateral if the borrower fails financially. To minimize these risks, the borrower must agree to maintain
Notes to Financial Statements (Continued)
cash collateral with the Funds’ custodian. The loaned securities are secured by collateral valued at least equal, at all times, to the market value of the loaned securities plus accrued interest, if any. When the collateral falls below specified amounts, the lending agent will use its best effort to obtain additional collateral on the next business day to meet required amounts under the security lending agreement. The cash collateral is reinvested by the Funds’ custodian into an approved short-term investment vehicle. The approved short-term investment vehicle is subject to market risk.
As of June 30, 2018, the following Funds loaned securities and received collateral as follows:
| | | | | Market | | | Market | | | | |
| | | | | Value of | | | Value of | | | | |
| | | | | Securities | | | Collateral | | | Net | |
| Fund | | Security Type | | Loaned* | | | Received** | | | Amount*** | |
| Credit Opportunities Fund | | Corporate Bonds | | $ | 865,468 | | | $ | 903,254 | | | $ | 37,786 | |
| International Growth Opportunities Fund | | Common Stocks | | | 270,864 | | | | 278,400 | | | | 7,536 | |
| International Small Cap Fund | | Common Stocks | | | 5,000,080 | | | | 5,289,953 | | | | 289,873 | |
| Large Company Growth Fund | | Common Stocks | | | 2,370,123 | | | | 2,450,644 | | | | 80,521 | |
* The remaining contractual maturity is overnight for all securities.
** Gross amount of recognized liabilities for securities lending is included in the Statements of Assets and Liabilities.
*** Net amount represents the net amount payable due to the borrower in the event of default.
All cash collateral is received, held, and administered by the Funds’ custodian for the benefit of the lending Fund in its custody account or other account established for the purpose of holding collateral in cash equivalents.
Funds participating in securities lending receive compensation in the form of fees. Securities lending income is derived from lending long securities from the Funds to creditworthy approved borrowers at rates that are determined based on trading volumes, float, short-term interest rates and market liquidity and is shown net of fees on the Statements of Operations. When a Fund lends securities, it retains the interest or dividends on the investment of any cash received as collateral, and the Fund continues to receive interest or dividends on the loaned securities.
Unrealized gain or loss on the market value of the loaned securities that may occur during the term of the loan is recognized by the Fund. The Fund has the right under the lending agreement to recover any loaned securities from the borrower on demand.
When-issued or delayed delivery transactions — Each Fund may purchase or sell securities on a when-issued or delayed delivery basis. These transactions involve a commitment by the Fund to purchase or sell securities for a predetermined price or yield, with payment and delivery taking place beyond the customary settlement period. When delayed delivery purchases are outstanding, the Fund will set aside liquid assets in an amount sufficient to meet the purchase price. When purchasing a security on a delayed delivery basis, the Fund assumes the rights and risks of ownership of the security, including the risk of price and yield fluctuations, and takes such fluctuations into account when determining NAV. The Fund may dispose of or renegotiate a delayed delivery transaction after it is entered into, and may sell when-issued securities before they are delivered, which may result in a capital gain or loss. When the Fund has sold a security on a delayed delivery basis, the Fund does not participate in future gains and losses with respect to the security.
Share valuation — The NAV per share of each class of shares of each Fund is calculated daily by dividing the total value of a Fund’s assets attributable to that class, less liabilities attributable to that class, by the number of outstanding shares of that class.
The maximum offering price per share of Class A shares of the Funds (except the Ohio Tax-Free Bond Fund) is equal to the NAV per share plus a sales load equal to 6.10% of the NAV (or 5.75% of the offering price). The maximum offering price per share of Class A shares of the Ohio Tax-Free Bond Fund is equal to the NAV
Notes to Financial Statements (Continued)
per share plus a sales load equal to 4.99% of the NAV (or 4.75% of the offering price). There is no sales load on purchases of $1 million or more of Class A shares. The maximum offering price per share of Classes C, Y, and Institutional Class shares of the Funds is equal to the NAV per share.
The redemption price per share of each class of shares of the Funds is generally equal to the NAV per share. However, Class A redemptions that were part of a no-load $1 million subscription may be subject to a contingent deferred sales charge (“CDSC”) of up to 1.00% if redeemed within a one-year period from the date of purchase. Additionally, purchases of Class C shares of the Funds are subject to a CDSC of 1.00%. The CDSC will be assessed on an amount equal to the lesser of (1) the NAV at the time of purchase of the shares being redeemed or (2) the NAV of such shares being redeemed, if redeemed within a one-year period from the date of purchase.
Investment income — Dividend income from securities is recognized on the ex-dividend date, net of foreign withholding taxes, if any, which are reduced by any amounts reclaimable by the Funds, where applicable. Interest income from securities is recorded on the basis of interest accrued, premium amortized and discount accreted. Realized gains and losses resulting from principal paydowns on mortgage-backed and asset-backed securities are included in interest income. Market discounts, original issue discount and market premiums on debt securities are accreted/amortized to interest income over the life of the security with a corresponding adjustment in the cost basis of that security. In addition, it is the Funds’ policy to accrue for foreign capital gains taxes, if applicable, on certain foreign securities held by the Funds. An estimated foreign capital gains tax is recorded daily on net unrealized gains on these securities and is payable upon the sale of such securities when a gain is realized.
Distributions to shareholders — Each Fund intends to distribute to its shareholders substantially all of its income and capital gains. Each Fund, except the Credit Opportunities Fund, Ohio Tax-Free Bond Fund and the Value Fund, declares and distributes net investment income, if any, annually, as a dividend to shareholders. The Credit Opportunities Fund and Value Fund declare and distribute net investment income, if any, quarterly as a dividend to shareholders. The Ohio Tax-Free Bond Fund declares distributions from net investment income on a daily basis and distributes as a dividend to shareholders on a monthly basis. Each Fund makes distributions of capital gains, if any, at least annually, net of applicable capital loss carryforwards. Income distributions and capital gain distributions are determined in accordance with income tax regulations. Recognition of the Funds’ net investment income from investments in underlying funds is affected by the timing of dividend declarations by the underlying funds.
Allocations — Investment income earned, realized capital gains and losses, and unrealized appreciation and depreciation for a Fund are allocated daily to each class of shares based upon its proportionate share of total net assets of the Fund. Class-specific expenses are charged directly to the class incurring the expense. Common expenses, which are not attributable to a specific class, are allocated daily to each class of shares based upon their proportionate share of total net assets of the Fund. Expenses not directly billed to a Fund are allocated proportionally among all Funds in the Trust, and, if applicable, Touchstone Funds Group Trust, Touchstone Institutional Funds Trust, and Touchstone Variable Series Trust (collectively with the Trust, “Touchstone Fund Complex”), daily in relation to net assets of each Fund or another reasonable measure.
Security transactions — Security transactions are reflected for financial reporting purposes as of the trade date. Realized gains and losses on sales of portfolio securities are calculated using the identified cost basis.
Estimates — The preparation of financial statements in conformity with U.S. GAAP requires management to make estimates and assumptions that affect the reported amounts of assets and liabilities and disclosure of contingent assets and liabilities at the date of the financial statements and the reported amounts of income and expenses during the reporting period. Actual results could differ from those estimates.
Notes to Financial Statements (Continued)
3. Investment Transactions
Investment transactions (excluding short-term investments and U.S. Government securities) were as follows for the year ended June 30, 2018:
| | | | | | International | | | | | | | |
| | | Credit | | | Growth | | | International | | | | |
| | | Opportunities | | | Opportunities | | | Small Cap | | | Large Cap | |
| | | Fund | | | Fund | | | Fund | | | Fund | |
| Purchases of investment securities | | $ | 34,429,638 | | | $ | 38,229,489 | | | $ | 304,489,030 | | | $ | 41,291,445 | |
| Proceeds from sales and maturities | | $ | 35,293,930 | | | $ | 32,061,235 | | | $ | 335,994,601 | | | $ | 36,391,187 | |
| | | | | | | | | | | | | | | | | |
| | | Large | | | Ohio | | | Small Cap | | | | |
| | | Company | | | Tax-Free | | | Value | | | | |
| | | Growth | | | Bond | | | Opportunities | | | Value | |
| | | Fund | | | Fund | | | Fund | | | Fund | |
| Purchases of investment securities | | $ | 106,230,134 | | | $ | 22,143,387 | | | $ | 53,974,069 | | | $ | 90,178,136 | |
| Proceeds from sales and maturities | | $ | 98,390,754 | | | $ | 24,034,299 | | | $ | 119,083,978 | | | $ | 107,220,543 | |
There were no purchases or proceeds from sales and maturities of U.S. Government securities by the Funds for the year ended June 30, 2018.
4. Transactions with Affiliates and Other Related Parties
Certain officers of the Trust are also officers of Touchstone Advisors, Inc. (the “Advisor”),Touchstone Securities, Inc. (the “Underwriter”), or The Bank of New York Mellon, the Sub-Administrator to the Funds, and BNY Mellon Investment Servicing (U.S.) Inc., the Transfer Agent to the Funds (collectively referenced to herein as “BNY Mellon”). Such officers receive no compensation from the Trust. The Advisor and the Underwriter are each wholly-owned subsidiaries of Western & Southern Financial Group, Inc. (“Western & Southern”).
On behalf of the Funds, the Advisor pays each Independent Trustee a quarterly retainer plus additional retainers to the Lead Independent Trustee and the chairs of each standing committee. Interested Trustees do not receive compensation from the Funds. Each Independent Trustee also receives compensation for each Board meeting and committee meeting attended. Each standing committee chair receives additional compensation for each committee meeting that he or she oversees. The Advisor is reimbursed by the Funds for the Independent Trustees’ compensation and out-of-pocket expenses relating to their services. The Funds accrued Trustee-related expenses of $115,904 for the year ended June 30, 2018.
MANAGEMENT & EXPENSE LIMITATION AGREEMENTS
The Advisor provides general investment supervisory services for the Funds, under the terms of an advisory agreement (the “Advisory Agreement”). Under the Advisory Agreement, each Fund pays the Advisor a fee, which is computed and accrued daily and paid monthly, at an annual rate based on average daily net assets of each Fund as shown in the table below.
Notes to Financial Statements (Continued)
| Credit Opportunities Fund | 1.10% |
| International Growth Opportunities Fund* | 0.80% |
| International Small Cap Fund | 0.95% on the first $300 million |
| | 0.90% on the next $200 million |
| | 0.85% on the next $250 million |
| | 0.80% on the next $250 million |
| | 0.75% on the next $500 million |
| | 0.70% on the next $500 million |
| | 0.65% on such assets over $2 billion |
| Large Cap Fund | 0.70% on the first $500 million |
| | 0.64% on the next $500 million |
| | 0.60% on such assets over $1 billion |
| Large Company Growth Fund | 0.75% on the first $500 million |
| | 0.725% on the next $1.5 billion |
| | 0.70% on such assets over $2 billion |
| Ohio Tax-Free Bond Fund | 0.50% on the first $100 million |
| | 0.45% on the next $100 million |
| | 0.40% on the next $100 million |
| | 0.375% on such assets over $300 million |
| Small Cap Value Opportunities Fund | 0.95% on the first $300 million |
| | 0.90% on the next $200 million |
| | 0.85% on such assets over $500 million |
| Value Fund | 0.65% |
* Prior to April 17, 2018, the Fund paid 0.90% on the first $500 Million, 0.85% on the next $1.5 Billion and 0.80% on such assets over $2 Billion.
The Advisor has entered into investment sub-advisory agreements with the following parties (each, a “Sub-Advisor”):
| Ares Capital Management II LLC | The London Company |
| Credit Opportunities Fund | Large Cap Fund |
| | |
| Barrow, Hanley, Mewhinney & Strauss, LLC | Thompson, Siegel & Walmsley LLC |
| Value Fund | Small Cap Value Opportunities Fund |
| | |
| Copper Rock Capital Partners LLC | Fort Washington Investment Advisors, Inc.* |
| International Small Cap Fund | Ohio Tax-Free Bond Fund |
| | |
| DSM Capital Partners LLC | |
| International Growth Opportunities Fund | |
| Large Company Growth Fund | |
*Affiliate of the Advisor and wholly-owned subsidiary of Western & Southern.
The Advisor, not the Funds, pays the sub-advisory fees to each Sub-Advisor.
The Advisor entered into an expense limitation agreement (the “Expense Limitation Agreement”) to contractually limit the annual operating expenses of the Funds, excluding: dividend and interest expenses relating to short sales; interest; taxes; brokerage commissions and other transaction costs; portfolio transaction and investment related expenses, including expenses associated with the Funds’ liquidity providers; other expenditures which are capitalized in accordance with U.S. GAAP; the cost of “Acquired Fund Fees and Expenses”, if any; and other extraordinary expenses not incurred in the ordinary course of business. The maximum annual operating
Notes to Financial Statements (Continued)
expense limit in any year with respect to the Funds is based on a percentage of the average daily net assets of the Funds. The Advisor has agreed to separately waive class-level expenses, advisory fees and administration fees, and to reimburse expenses in order to maintain the following expense limitations for the Funds:
| | | | | | | | | | | | Institutional | |
| Fund | | Class A | | | Class C | | | Class Y | | | Class | |
| Credit Opportunities Fund | | | 1.69 | % | | | 2.44 | % | | | 1.44 | % | | | 1.34 | % |
| International Growth Opportunities Fund* | | | 1.24 | % | | | 1.99 | % | | | 0.99 | % | | | 0.89 | % |
| International Small Cap Fund | | | 1.55 | % | | | 2.30 | % | | | 1.30 | % | | | 1.18 | % |
| Large Cap Fund | | | 1.12 | % | | | 1.87 | % | | | 0.87 | % | | | 0.77 | % |
| Large Company Growth Fund | | | 1.23 | % | | | 1.98 | % | | | 0.98 | % | | | 0.88 | % |
| Ohio Tax-Free Bond Fund | | | 0.85 | % | | | 1.60 | % | | | 0.60 | % | | | 0.55 | % |
| Small Cap Value Opportunities Fund | | | 1.43 | % | | | 2.18 | % | | | 1.18 | % | | | 1.10 | % |
| Value Fund | | | 1.08 | % | | | 1.83 | % | | | 0.83 | % | | | 0.68 | % |
*Prior to April 17, 2018, the expense limitations for Classes A, C, Y and Institutional Class shares were 1.41%, 2.16%, 1.16% and 1.06%, respectively.
These expense limitations will remain in effect for all Funds through at least October 29, 2018, except for International Growth Opportunities Fund. The expense limitation for International Growth Opportunities Fund will remain in effect through at least June 29, 2019. The expense limitation agreement can be terminated by a vote of the Funds’ Board if it deems the termination to be beneficial to the Funds’ shareholders.
During the year ended June 30, 2018, the Advisor or its affiliates waived investment advisory fees and administration fees or other operating expenses, including distribution fees, of the Funds as follows:
| | | Investment | | | | | | | | | | |
| | | Advisory | | | | | | Other Operating | | | | |
| | | Fees | | | Administration | | | Expenses | | | | |
| Fund | | Waived | | | Fees Waived | | | Waived | | | Total | |
| Credit Opportunities Fund | | $ | 9,042 | | | $ | 74,463 | | | $ | 28,962 | | | $ | 112,467 | |
| International Growth Opportunities Fund | | | 23,857 | | | | 43,026 | | | | 43,402 | | | | 110,285 | |
| International Small Cap Fund | | | — | | | | — | | | | 112,506 | | | | 112,506 | |
| Large Cap Fund | | | — | | | | 413,619 | | | | 58,452 | | | | 472,071 | |
| Large Company Growth Fund | | | — | | | | 105,047 | | | | 153,698 | | | | 258,745 | |
| Ohio Tax-Free Bond Fund | | | 47,136 | | | | 68,222 | | | | 36,131 | | | | 151,489 | |
| Small Cap Value Opportunities Fund | | | — | | | | 70,016 | | | | 100,587 | | | | 170,603 | |
| Value Fund | | | — | | | | 549,705 | | | | 158,579 | | | | 708,284 | |
Under the terms of the Expense Limitation Agreement, the Advisor is entitled to recover, subject to approval by the Funds’ Board, such amounts waived or reimbursed for a period of up to three years from the date on which the Advisor reduced its compensation or assumed expenses for the Funds. No recoupment will occur unless a Fund’s operating expenses are below the expense limitation amount in effect at the time of the waiver or reimbursement and the Fund’s current expense limitation.
Notes to Financial Statements (Continued)
As of June 30, 2018, the Advisor may seek recoupment of previously waived fees and reimbursed expenses as follows:
| | | Expiration | | | Expiration | | | Expiration | | | | |
| | | June 30, | | | June 30, | | | June 30, | | | | |
| Fund | | 2019 | | | 2020 | | | 2021 | | | Total | |
| Credit Opportunities Fund | | $ | 128,969 | | | $ | 110,236 | | | $ | 112,035 | | | $ | 351,240 | |
| International Growth Opportunities Fund | | | — | | | | 105,564 | | | | 106,252 | | | | 211,816 | |
| International Small Cap Fund | | | 96,319 | | | | 109,847 | | | | 72,874 | | | | 279,040 | |
| Large Cap Fund | | | 487,776 | | | | 464,555 | | | | 449,854 | | | | 1,402,185 | |
| Large Company Growth Fund | | | — | | | | 193,888 | | | | 249,815 | | | | 443,703 | |
| Ohio Tax-Free Bond Fund | | | 15,919 | | | | 133,855 | | | | 129,632 | | | | 279,406 | |
| Small Cap Value Opportunities Fund | | | 174,274 | | | | 173,346 | | | | 157,834 | | | | 505,454 | |
| Value Fund | | | 659,183 | | | | 620,025 | | | | 680,915 | | | | 1,960,123 | |
For the year ended June 30, 2018, the Advisor recouped previously waived fees or reimbursed expenses from the International Small Cap Fund of $7,559.
ADMINISTRATION AGREEMENT
The Advisor entered into an Administration Agreement with the Trust, whereby the Advisor is responsible for: supplying executive and regulatory compliance services; supervising the preparation of tax returns; coordinating the preparation of reports to shareholders and reports to and filings with the SEC and state securities authorities, as well as materials for meetings of the Board; calculating the daily NAV per share; and maintaining the financial books and records of each Fund.
For its services, the Advisor’s annual administrative fee is:
0.145% on the first $20 billion of the aggregate average daily net assets;
0.11% on the next $10 billion of aggregate average daily net assets;
0.09% on the next $10 billion of aggregate average daily net assets; and
0.07% on the aggregate average daily net assets over $40 billion.
The fee is computed and allocated among the Touchstone Fund Complex (excluding Touchstone Institutional Funds Trust) on the basis of relative daily net assets.
The Advisor has engaged BNY Mellon as the Sub-Administrator to the Trust. BNY Mellon provides administrative and accounting services to the Trust and is compensated directly by the Advisor, not the Trust.
TRANSFER AGENT AGREEMENT
Under the terms of the Transfer Agent Agreement between the Trust and BNY Mellon, BNY Mellon maintains the records of each shareholder’s account, answers shareholders’ inquiries concerning their accounts, processes purchases and redemptions of each Fund’s shares, acts as dividend and distribution disbursing agent, and performs other shareholder service functions. For these services, BNY Mellon receives a monthly fee from each Fund. In addition, each Fund pays out-of-pocket expenses incurred by BNY Mellon, including, but not limited to, postage and supplies.
The Funds may reimburse the Advisor for fees paid to intermediaries such as banks, broker-dealers, financial advisors or other financial institutions for sub-transfer agency, sub-administration and other services provided to investors whose shares of record are held in omnibus, other group accounts, retirement plans or accounts
Notes to Financial Statements (Continued)
traded through registered securities clearing agents. These fees may vary based on, for example, the nature of services provided, but generally range up to 0.15% of the assets of the class serviced or maintained by the intermediary or up to $22 per sub-account maintained by the intermediary.
PLANS OF DISTRIBUTION AND SHAREHOLDER SERVICING FEE ARRANGEMENTS
The Trust has adopted distribution plans pursuant to Rule 12b-1 under the 1940 Act for each class of shares it offers that is subject to 12b-1 distribution fees. The plans allow each Fund to pay distribution and other fees for the sale and distribution of its shares and for services provided to shareholders. The fees charged to the Funds are limited to the actual expenses incurred. Under the Class A plan, each Fund offering Class A shares pays an annual fee of up to 0.25% of average daily net assets that are attributable to Class A shares. Under the Class C plan, each Fund offering Class C shares pays an annual fee of up to 1.00% of average daily net assets that are attributable to Class C shares (of which up to 0.75% is a distribution fee and up to 0.25% is a shareholder servicing fee).
UNDERWRITING AGREEMENT
The Underwriter is the Funds’ principal underwriter and, as such, acts as exclusive agent for distribution of the Funds’ shares. Under the terms of the Underwriting Agreement between the Trust and the Underwriter, the Underwriter earned underwriting and broker commissions on the sale of Class A shares of the Funds. W&S Brokerage Services, Inc., an affiliate of the Underwriter and the Advisor, also earned broker commissions on the sale of Class A shares of the Funds. Listed below are the total underwriting and broker commissions earned by the Underwriter and its affiliate during the year ended June 30, 2018:
| Fund | | Amount | |
| International Growth Opportunities Fund | | $ | 325 | |
| International Small Cap Fund | | | 1,972 | |
| Large Cap Fund | | | 1,965 | |
| Large Company Growth Fund | | | 990 | |
| Ohio Tax-Free Bond Fund | | | 2,572 | |
| Small Cap Value Opportunities Fund | | | 1,013 | |
| Value Fund | | | 2,974 | |
In addition, the Underwriter collected CDSC on the redemption of Class C shares of the Funds listed below during the year ended June 30, 2018:
| Fund | | Amount | |
| International Small Cap Fund | | $ | 434 | |
| Large Cap Fund | | | 48 | |
| Ohio Tax-Free Bond Fund | | | 100 | |
| Small Cap Value Opportunities Fund | | | 97 | |
| Value Fund | | | 3 | |
INTERFUND TRANSACTIONS
The Funds may engage in purchase and sale transactions with funds that have a common investment advisor (or affiliated investment advisors), common Trustees and/or common Officers. During the year ended June 30, 2018, the Funds did not engage in any Rule 17a-7 transactions as defined under the 1940 Act.
5. Liquidity
ReFlow Fund LLC — The Funds may participate in the ReFlow Fund LLC liquidity program (“ReFlow”), which is designed to provide an alternative liquidity source for funds experiencing redemptions. In order to pay cash to shareholders who redeem their shares on a given day, a fund typically must hold cash in its portfolio,
Notes to Financial Statements (Continued)
liquidate portfolio securities, or borrow money. ReFlow provides participating funds with another source of cash by standing ready to purchase shares from a fund up to the amount of the fund’s net redemptions on a given day, cumulatively limited to 3% of the outstanding voting shares of a Fund. ReFlow then generally redeems those shares (in cash or in-kind) when the Fund experiences net sales, at the end of a maximum holding period determined by ReFlow, or at other times at ReFlow’s discretion. In return for this service, the Fund will pay a fee to ReFlow at a rate determined by a daily auction with other participating mutual funds.
During the year ended June 30, 2018, the Small Cap Value Opportunities Fund utilized ReFlow. ReFlow subscribed to 82,689 shares of the Small Cap Value Opportunities Fund during the period. The resulting fee is recorded in Other expenses on the Statements of Operations.
Interfund Lending — Pursuant to an Exemptive Order issued by the SEC on March 28, 2017, the Funds, along with certain other funds in the Touchstone Fund Complex, may participate in an interfund lending program. The interfund lending program provides an alternate credit facility that allows the Funds to lend to or borrow from other participating funds in the Touchstone Fund Complex, subject to the conditions of the Exemptive Order. The Funds may not borrow under the facility for leverage purposes and the loans’ duration may be no more than 7 days.
At June 30, 2018, the Small Cap Value Opportunities Fund had an outstanding loan payable of $5,053,272.
During the year ended June 30, 2018, the following Funds participated as a borrower in the interfund lending program. The average amount borrowed, average interest rate and interest expense were as follows:
| | | Average Amount | | | Average Interest | | | Interest | |
| Fund | | Borrowed | | | Rate | | | Expense* | |
| International Small Cap Fund | | $ | 50,785 | | | | 1.32 | % | | $ | 681 | |
| Small Cap Value Opportunities Fund | | $ | 45,469 | | | | 1.76 | % | | $ | 855 | |
*Included in Other expenses in the Statement of Operations.
6. Federal Tax Information
Federal income tax — It is each Fund’s policy to continue to comply with the special provisions of the Internal Revenue Code applicable to regulated investment companies. As provided therein, in any fiscal year in which a Fund so qualifies and distributes at least 90% of its investment company taxable income, the Fund (but not the shareholders) will be relieved of federal income tax on the income distributed. It is each Fund’s policy to distribute all of its taxable and tax-exempt income and accordingly, no provision for income taxes has been made.
In order to avoid imposition of the excise tax applicable to regulated investment companies, it is also each Fund’s intention to declare and pay as dividends in each calendar year at least 98% of its investment company taxable income (earned during the calendar year) and 98.2% of its net realized capital gains (earned during the twelve months ending October 31) plus undistributed amounts from prior years.
The tax character of distributions paid for the years ended June 30, 2018 and June 30, 2017 is as follows:
| | | | | | International Growth | | | | |
| | | Credit Opportunities Fund | | | Opportunities Fund | | | International Small Cap Fund | |
| | | Year Ended | | | Year Ended | | | Year Ended | | | Year Ended | | | Year Ended | | | Year Ended | |
| | | June 30, | | | June 30, | | | June 30, | | | June 30, | | | June 30, | | | June 30, | |
| | | 2018 | | | 2017 | | | 2018 | | | 2017 | | | 2018 | | | 2017 | |
| From ordinary income | | $ | 3,211,801 | | | $ | 2,960,568 | | | $ | 372,285 | | | $ | 15,884 | | | $ | 7,979,769 | | | $ | 4,439,994 | |
| From long-term capital gains | | | 926,076 | | | | — | | | | 149,175 | | | | 139,199 | | | | 1,865,799 | | | | — | |
| Total Distributions | | $ | 4,137,877 | | | $ | 2,960,568 | | | $ | 521,460 | | | $ | 155,083 | | | $ | 9,845,568 | | | $ | 4,439,994 | |
Notes to Financial Statements (Continued)
| | | Large Cap Fund | | | Large Company Growth Fund | | | Ohio Tax-Free Bond Fund | |
| | | Year Ended | | | Year Ended | | | Year Ended | | | Year Ended | | | Year Ended | | | Year Ended | |
| | | June 30, | | | June 30, | | | June 30, | | | June 30, | | | June 30, | | | June 30, | |
| | | 2018 | | | 2017 | | | 2018 | | | 2017 | | | 2018 | | | 2017 | |
| From ordinary income | | $ | 2,347,689 | | | $ | 2,907,516 | | | $ | 1,615,959 | | | $ | — | | | $ | 640 | | | $ | 8,371 | |
| From tax-exempt income | | | — | | | | — | | | | — | | | | — | | | | 1,338,760 | | | | 1,584,185 | |
| From long-term capital gains | | | — | | | | — | | | | 4,705,569 | | | | 6,376,311 | | | | — | | | | 69,440 | |
| Total Distributions | | $ | 2,347,689 | | | $ | 2,907,516 | | | $ | 6,321,528 | | | $ | 6,376,311 | | | $ | 1,339,400 | | | $ | 1,661,996 | |
| | | Small Cap Value Opportunities Fund | | Value Fund |
| | | Year Ended | | Year Ended | | Year Ended | | Year Ended |
| | | June 30, | | June 30, | | June 30, | | June 30, |
| | | 2018 | | 2017 | | 2018 | | 2017 |
| From ordinary income | | $ | — | | | $ | 216,387 | | | $ | 7,015,940 | | | $ | 8,066,842 | |
| From long-term capital gains | | | — | | | | — | | | | 27,716,248 | | | | 776,054 | |
| Total Distributions | | $ | — | | | $ | 216,387 | | | $ | 34,732,188 | | | $ | 8,842,896 | |
The following information is computed on a tax basis for each item as of June 30, 2018:
| | | | | International | | | | |
| | | Credit | | Growth | | International | | Large |
| | | Opportunities | | Opportunities | | Small Cap | | Cap |
| | | Fund | | Fund | | Fund | | Fund |
| Tax cost of portfolio investments | | $ | 54,672,721 | | | $ | 30,412,020 | | | $ | 282,505,770 | | | $ | 283,833,595 | |
| Gross unrealized appreciation on investments | | | 986,063 | | | | 5,166,776 | | | | 45,434,035 | | | | 86,088,499 | |
| Gross unrealized depreciation on investments | | | (1,331,237 | ) | | | (1,215,922 | ) | | | (6,701,212 | ) | | | (2,233,750 | ) |
| Net unrealized appreciation (depreciation) on investments | | | (345,174 | ) | | | 3,950,854 | | | | 38,732,823 | | | | 83,854,749 | |
| Gross unrealized appreciation on foreign currency transactions, deferred capital gain tax and derivatives | | | 1,750 | | | | 79 | | | | 13,144 | | | | — | |
| Gross unrealized depreciation on foreign currency transactions, deferred capital gain tax and derivatives | | | (99 | ) | | | (11,192 | ) | | | (16,103 | ) | | | — | |
| Net unrealized appreciation (depreciation) on foreign currency transactions, deferred capital gain tax and derivatives | | | 1,651 | | | | (11,113 | ) | | | (2,959 | ) | | | — | |
| Accumulated capital and other losses | | | — | | | | — | | | | — | | | | (13,791,146 | ) |
| Undistributed ordinary income | | | 310,154 | | | | 425,298 | | | | — | | | | 1,637,893 | |
| Undistributed long-term capital gains | | | 307,144 | | | | 4,272,059 | | | | 16,613,583 | | | | — | |
| Accumulated earnings (deficit) | | $ | 273,775 | | | $ | 8,637,098 | | | $ | 55,343,447 | | | $ | 71,701,496 | |
Notes to Financial Statements (Continued)
| | | | | Ohio | | Small Cap | | |
| | | Large Company | | Tax-Free | | Value | | |
| | | Growth | | Bond | | Opportunities | | Value |
| | | Fund | | Fund | | Fund | | Fund |
| Tax cost of portfolio investments | | $ | 157,040,267 | | | $ | 44,360,368 | | | $ | 47,991,211 | | | $ | 295,457,551 | |
| Gross unrealized appreciation on investments | | | 92,658,091 | | | | 1,656,120 | | | | 12,864,560 | | | | 108,171,657 | |
| Gross unrealized depreciation on investments | | | (2,469,156 | ) | | | (41,900 | ) | | | (3,223,952 | ) | | | (18,836,393 | ) |
| Net unrealized appreciation (depreciation) on investments | | | 90,188,935 | | | | 1,614,220 | | | | 9,640,608 | | | | 89,335,264 | |
| Undistributed ordinary income | | | 716,305 | | | | — | | | | 2,262,946 | | | | 2,018,640 | |
| Undistributed tax-exempt income | | | — | | | | 9,649 | | | | — | | | | — | |
| Undistributed long-term capital gains | | | 9,235,348 | | | | — | | | | 3,230,867 | | | | 10,782,375 | |
| Other temporary differences | | | — | | | | (27,720 | ) | | | — | | | | — | |
| Accumulated earnings (deficit) | | $ | 100,140,588 | | | $ | 1,596,149 | | | $ | 15,134,421 | | | $ | 102,136,279 | |
The difference between the tax cost of portfolio investments and the financial statement cost is primarily due to wash sale loss deferrals, passive foreign investment company (“PFIC”) adjustments and nontaxable distribution basis outstanding.
As of June 30, 2018, the Funds had the following capital loss carryforwards for federal income tax purposes:
| | | No |
| | | Expiration |
| | | Short Term |
| Large Cap Fund | | $ | 13,791,146 | |
The capital loss carryforwards may be utilized in future years to offset net realized capital gains, if any, prior to distributing such gains to shareholders.
During the year ended June 30, 2018, the following Funds utilized capital loss carryforwards as follows:
| Funds | | Utilized |
| International Small Cap Fund | | $ | 12,814,191 | |
| Large Cap Fund | | | 4,632,712 | |
| Small Cap Value Opportunities Fund | | | 3,480,339 | |
Under current laws, certain capital losses realized after October 31 and ordinary losses realized after December 31 may be deferred (and certain ordinary losses after October and/or December 31 may be deferred) and treated as occurring on the first day of the following fiscal year. For the year ended June 30, 2018, the Funds did not elect to defer any losses.
The Funds have analyzed their tax positions taken on federal income tax returns for all open tax years (tax years ended June 30, 2015 through 2018) and have concluded that no provision for income tax is required in their financial statements.
Certain reclassifications, the result of permanent differences between financial statement and income tax reporting requirements, have been made to the components of capital. These reclassifications have no impact on the net assets or NAV per share of the Funds. The following reclassifications, which are primarily attributed to the tax treatment of foreign currency gains/losses, gains/losses from PFICs, nontaxable and/or capital gains distribution reclassifications, re-designation of dividends paid, short-term capital gains netted against net operating loss and deemed distributions on shareholder redemptions, have been made to the following Funds for the year ended June 30, 2018:
Notes to Financial Statements (Continued)
| | | | | Accumulated | | Accumulated |
| | | Paid-In | | Net Investment | | Net Realized |
| Fund | | Capital | | Income(Loss) | | Gains(Losses) |
| Credit Opportunities Fund | | $ | — | | | $ | 11 | | | $ | (11 | ) |
| International Growth Opportunities Fund | | | — | | | | (2,617 | ) | | | 2,617 | |
| International Small Cap Fund | | | 1,987,532 | | | | 3,534,113 | | | | (5,521,645 | ) |
| Large Company Growth Fund | | | — | | | | 664,338 | | | | (664,338 | ) |
| Ohio Tax-Free Bond Fund | | | — | | | | 75 | | | | (75 | ) |
| Small Cap Value Opportunities Fund | | | 1,827,303 | | | | 96,388 | | | | (1,923,691 | ) |
7. Commitments and Contingencies
The Funds indemnify the Trust’s officers and Trustees for certain liabilities that might arise from their performance of their duties to the Funds. Additionally, in the normal course of business, the Funds enter into contracts that contain a variety of representations and warranties and which provide general indemnifications. The Funds’ maximum exposure under these arrangements is unknown, as this would involve future claims that may be made against the Funds.
8. Principal Risks
Risks Associated with Foreign Investments — Some of the Funds may invest in the securities of foreign issuers. Investing in securities issued by companies whose principal business activities are outside the U.S. may involve significant risks not present in domestic investments. For example, there is generally less publicly available information about foreign companies, particularly those not subject to the disclosure and reporting requirements of the U.S. securities laws. Foreign issuers are generally not bound by uniform accounting, auditing, and financial reporting requirements and standards of practice comparable to those applicable to domestic issuers. Investments in foreign securities also involve the risk of possible adverse changes in investment or exchange control regulations, expropriation or confiscatory taxation, limitations on the removal of funds or other assets of a Fund, political or financial instability or diplomatic and other developments which could affect such investments. Foreign stock markets, while growing in volume and sophistication, are generally not as developed as those in the U.S., and securities of some foreign issuers (particularly those located in developing countries) may be less liquid and more volatile than securities of comparable U.S. companies. In general, there is less overall governmental supervision and regulation of foreign securities markets, broker-dealers, and issuers than in the U.S.
Risks Associated with Concentration — Certain Funds may invest a high percentage of their assets in specific sectors of the market in order to achieve a potentially greater investment return. As a result, these Funds may be more susceptible to economic, political, and regulatory developments in a particular sector of the market, positive or negative, and may experience increased volatility on the Funds’ NAVs and magnified effect on the total return.
Risks Associated with Credit — An issuer may be unable to make timely payments of either principal or interest. This may cause the issuer’s securities to decline in value. Credit risk is particularly relevant to those Funds that invest a significant amount of their assets in junk bonds or lower-rated securities.
Risks Associated with Interest Rate Changes — As interest rates rise, the value of fixed-income securities a Fund owns will likely decrease. The price of debt securities is generally linked to the prevailing market interest rates. In general, when interest rates rise, the price of debt securities falls, and when interest rates fall, the price of debt securities rises. The price volatility of a debt security also depends on its maturity. Longer-term securities are generally more volatile, so the longer the average maturity or duration of these securities, the greater their price risk. Duration is a measure of the expected life, taking into account any prepayment or call features of the security, that is used to determine the price sensitivity of the security for a given change in interest rates. Specifically, duration is the change in the value of a fixed-income security that will result from a 1% change
Notes to Financial Statements (Continued)
in interest rates, and generally is stated in years. For example, as a general rule a 1% rise in interest rates means a 1% fall in value for every year of duration. Maturity, on the other hand, is the date on which a fixed-income security becomes due for payment of principal. The negative impact on fixed income securities if interest rates increase as a result could negatively impact a Fund’s NAV.
Risks Associated with Liquidity — Liquidity risk exists when particular investments are difficult to purchase or sell. This can reduce a Fund’s returns because a Fund may be unable to transact at advantageous times or prices, or at all.
Please see the Funds’ prospectus for a complete discussion of these and other risks.
9. Fund Mergers and Reorganizations
On August 4, 2016, the shareholders of the DSM Global Growth Fund, DSM Global Growth & Income Fund and DSM Large Cap Growth Fund (the “Reorganizing Funds”), each a series of the Professionally Managed Portfolios Trust, approved an Agreement and Plan of Reorganization providing for the transfer of all assets and liabilities of each Reorganizing Fund to the corresponding Touchstone Fund as noted below. The International Growth Opportunities Fund and Large Company Growth Fund, each a new series of the Trust, assumed the financial and performance history of the DSM Global Growth Fund and DSM Large Cap Growth Fund, respectively. The tax-free reorganizations took place on August 15, 2016.
| | | | | Net | | Shares |
| Reorganizing Funds | | Touchstone Funds* | | Assets | | Outstanding |
| DSM Global Growth Fund | | International Growth Opportunities Fund | | $ | 6,948,009 | | | | 372,747 | |
| DSM Global Growth & Income Fund | | International Growth Opportunities Fund | | | 4,918,771 | | | | 305,368 | |
| DSM Large Cap Growth Fund | | Large Company Growth Fund | | | 192,530,525 | | | | 6,169,105 | |
*The Reorganizing Funds had Institutional Class shares outstanding immediately prior to the reorganization. On August 15, 2016, the Touchstone Funds began issuing Class A shares, Class C shares and Class Y shares.
On August 4, 2016, the shareholders of the DSM Global Growth & Income Fund approved an Agreement and Plan of Reorganization providing for the transfer of all assets and liabilities of the DSM Global Growth & Income Fund to the Touchstone International Growth Opportunities Fund. The tax-free merger took place on August 15, 2016.
| | | | | | | | | After | |
| | | Before Reorganization | | | Reorganization | |
| | | | | | Touchstone | | | Touchstone | |
| | | DSM Global | | | International | | | International | |
| | | Growth & | | | Growth | | | Growth | |
| | | Income | | | Opportunities | | | Opportunities | |
| | | Fund | | | Fund | | | Fund | |
| Institutional Class | | | | | | | | | | | | |
| Shares | | | 263,883 | (A) | | | 372,747 | | | | 636,630 | |
| Net Assets | | $ | 4,918,771 | | | $ | 6,948,009 | | | $ | 11,866,780 | |
| Net Asset Value | | $ | 18.64 | (A) | | $ | 18.64 | | | $ | 18.64 | |
| Unrealized Appreciation | | $ | 301,083 | | | $ | 695,380 | | | $ | 996,463 | |
(A)Reflects a 0.864147:1 stock split which occurred on the date of reorganization, August 15, 2016.
Notes to Financial Statements (Continued)
Assuming this reorganization had been completed on July 1, 2016, the International Growth Opportunities Fund’s results of operations for the year ended June 30, 2017 would have been as follows:
| Net investment loss | | $ | (33,696 | ) |
| Net realized and unrealized gains on investments | | $ | 5,322,345 | |
| Net increase in net assets from operations | | $ | 5,288,649 | |
Because the combined investment portfolios have been managed as a single portfolio since the reorganization was completed, it is not practical to separate the amounts of revenue and earnings to the International Growth Opportunities Fund that have been included in its statements of operations since the reorganization.
10. Subsequent Events
Subsequent events occurring after the date of this report have been evaluated for potential impact to this report through the date the financial statements were issued.
At a meeting of the Board of Trustees (the “Board”) of the Trust held on May 17, 2018, the Board approved the reorganization (the “Reorganization”) of the Touchstone Small Cap Value Opportunities Fund into the Touchstone Small Cap Value Fund, a series of Touchstone Funds Group Trust, subject to shareholder approval. The Reorganization, if approved, is expected to be completed on or about September 21, 2018.
There were no other subsequent events that necessitated recognition or disclosure in the Funds’ financial statements.
Report of Independent Registered Public Accounting Firm
To the Shareholders of Touchstone Credit Opportunities Fund, Touchstone International Growth Opportunities Fund, Touchstone International Small Cap Fund, Touchstone Large Cap Fund, Touchstone Large Company Growth Fund, Touchstone Ohio Tax-Free Bond Fund, Touchstone Small Cap Value Opportunities Fund and Touchstone Value Fund and the Board of Trustees of Touchstone Strategic Trust
Opinion on the Financial Statements
We have audited the accompanying statements of assets and liabilities of Touchstone Credit Opportunities Fund, Touchstone International Growth Opportunities Fund, Touchstone International Small Cap Fund, Touchstone Large Cap Fund, Touchstone Large Company Growth Fund, Touchstone Ohio Tax-Free Bond Fund, Touchstone Small Cap Value Opportunities Fund and Touchstone Value Fund (collectively referred to as the “Funds”), (eight of the funds constituting the Touchstone Strategic Trust (the “Trust”)), including the portfolios of investments, as of June 30, 2018, and the related statements of operations and changes in net assets, and the financial highlights for each of the periods indicated in the table below and the related notes (collectively referred to as the “financial statements”). In our opinion, the financial statements present fairly, in all material respects, the financial position of each of the Funds (eight of the funds constituting Touchstone Strategic Trust) at June 30, 2018, and the results of their operations, changes in net assets and financial highlights for each of the periods indicated in the table below, in conformity with U.S. generally accepted accounting principles.
| Individual funds | | | | | | |
| constituting | | | | | | |
| Touchstone Strategic | | Statement of | | Statements of | | |
| Trust | | operations | | changes in net assets | | Financial highlights |
| Touchstone Credit Opportunities Fund | | For the year ended June 30, 2018 | | For each of the two years in the period ended June 30, 2018 | | For each of the two years in the period ended June 30, 2018 and the period from September 1, 2015 (commencement of operations) through June 30, 2016 |
Touchstone International Small Cap Fund
Touchstone Ohio Tax-Free Bond Fund
Touchstone Small Cap Value Opportunities Fund
Touchstone Value Fund | | For the year ended June 30, 2018 | | For each of the two years in the period ended June 30, 2018 | | For each of the five years in the period ended June 30, 2018 |
| Touchstone Large Cap Fund | | For the year ended June 30, 2018 | | For each of the two years in the period ended June 30, 2018 | | For each of the three years in the period ended June 30, 2018 and the period from July 10, 2014 (commencement of operations) through June 30, 2015 |
Touchstone International Growth Opportunities Fund
Touchstone Large Company Growth Fund | | For the year ended June 30, 2018 | | For each of the two years in the period ended June 30, 2018 | | For each of the two years in the period ended June 30, 2018 |
The financial highlights for each of the three years in the period ended June 30, 2016 of Touchstone International Growth Opportunities Fund and Touchstone Large Company Growth Fund were audited by other auditors, whose report dated August 25, 2016 expressed an unqualified opinion on those financial highlights.
Report of Independent Registered Public Accounting Firm (Continued)
Basis for Opinion
These financial statements are the responsibility of the Trust’s management. Our responsibility is to express an opinion on each of the Funds’ financial statements based on our audits. We are a public accounting firm registered with the Public Company Accounting Oversight Board (United States) (“PCAOB”) and are required to be independent with respect to the Trust in accordance with the U.S. federal securities laws and the applicable rules and regulations of the Securities and Exchange Commission and the PCAOB.
We conducted our audits in accordance with the standards of the PCAOB. Those standards require that we plan and perform the audit to obtain reasonable assurance about whether the financial statements are free of material misstatement, whether due to error or fraud. The Trust is not required to have, nor were we engaged to perform, an audit of the Trust’s internal control over financial reporting. As part of our audits, we are required to obtain an understanding of internal control over financial reporting but not for the purpose of expressing an opinion on the effectiveness of the Trust’s internal control over financial reporting. Accordingly, we express no such opinion.
Our audits included performing procedures to assess the risks of material misstatement of the financial statements, whether due to error or fraud, and performing procedures that respond to those risks. Such procedures included examining, on a test basis, evidence regarding the amounts and disclosures in the financial statements. Our procedures included confirmation of securities owned as of June 30, 2018, by correspondence with the custodian, transfer agent, brokers and agent banks or by other appropriate auditing procedures where replies from brokers and agent banks were not received. Our audits also included evaluating the accounting principles used and significant estimates made by management, as well as evaluating the overall presentation of the financial statements. We believe that our audits provide a reasonable basis for our opinion.

We have served as the auditor of one or more Touchstone Investments’ investment companies since 1999.
Cincinnati, Ohio
August 17, 2018
Other Items (Unaudited)
Supplemental Tax Information
The information set forth below is for the Funds’ fiscal year as required by federal income tax laws. Shareholders, however, must report distributions on a calendar year basis for income tax purposes, which may include distributions for portions of two fiscal years of the Fund. Accordingly, the information needed by shareholders for income tax purposes will be sent to them in February of each year. Please consult your tax advisor for proper treatment of this information.
Qualified Dividend Income
Under the Jobs and Growth Tax Relief Reconciliation Act of 2003 (the “Act”), the following percentages of ordinary dividends paid during the fiscal year ended June 30, 2018 are designated as “qualified dividend income,” as defined in the Act, and are subject to reduced tax rates. The Fund intends to pass through the maximum allowable percentage for Form 1099 Div.
| International Growth Opportunities Fund | | | 30.33 | % |
| International Small Cap Fund | | | 100.00 | % |
| Large Cap Fund | | | 100.00 | % |
| Large Company Growth Fund | | | 50.11 | % |
| Small Cap Value Opportunities Fund | | | 17.95 | % |
| Value Fund | | | 100.00 | % |
Dividend Received Deduction
For corporate shareholders, the following ordinary distributions paid during the current fiscal year ended June 30, 2018 qualify for the corporate dividends received deduction. The Funds intend to pass through the maximum allowable percentage.
| International Growth Opportunities Fund | | | 7.19 | % |
| Large Cap Fund | | | 100.00 | % |
| Large Company Growth Fund | | | 30.94 | % |
| Small Cap Value Opportunities Fund | | | 19.08 | % |
| Value Fund | | | 88.65 | % |
For the fiscal year ended June 30, 2018, the Funds designated long-term capital gains as follows:
| Credit Opportunities Fund | | $ | 926,076 | |
| International Growth Opportunities Fund | | $ | 4,421,234 | |
| International Small Cap Fund | | $ | 20,466,914 | |
| Large Company Growth Fund | | $ | 9,235,375 | |
| Small Cap Value Opportunities Fund | | $ | 4,311,639 | |
| Value Fund | | $ | 27,716,248 | |
Of the dividends paid from net investment income during the most-recent fiscal year, 99.96% was designated as exempt interest dividends for federal income tax purposes for the Ohio Tax-Free Bond Fund.
Foreign Tax Income and Foreign Tax Credit
The International Growth Opportunities Fund and International Small Cap Fund intend to pass through a foreign tax credit to the shareholders. For the fiscal year ended June 30, 2018, the total amount of foreign source income is $326,304 or $0.24 per share for the International Growth Opportunities Fund and $7,228,743 or $0.42 per share for the International Small Cap Fund. The total amount of foreign taxes to be paid is $12,560 or $0.01 per share for the International Growth Opportunities Fund and $555,007 or $0.03 per share for the International Small Cap Fund. Shareholder’s allocable share of the foreign tax credit will be reported on Form 1099 Div.
Other Items (Unaudited) (Continued)
Proxy Voting Guidelines and Proxy Voting Records
The Sub-Advisors are responsible for exercising the voting rights associated with the securities purchased and held by the Funds. A description of the policies and procedures that the Sub-Advisors use in fulfilling this responsibility is available as an appendix to the most recent Statement of Additional Information, which can be obtained without charge by calling toll free 1.800.543.0407 or by visiting the Touchstone website at TouchstoneInvestments.com or on the Securities and Exchange Commission’s (the “Commission”) website sec.gov. Information regarding how those proxies were voted during the most recent twelve-month period ended June 30 is also available without charge by calling toll free 1.800.543.0407 or on the Commission’s website at sec.gov.
Quarterly Portfolio Disclosure
The Trust files a complete listing of portfolio holdings for each Fund as of the end of the first and third quarters of each fiscal year on Form N-Q. The complete listing (i) is available on the Commission’s website; (ii) may be reviewed and copied at the Commission’s Public Reference Room in Washington, DC; or (iii) will be made available to shareholders upon request by calling 1.800.543.0407. Information on the operation of the Public Reference Room may be obtained by calling 1.800.SEC.0330.
Schedule of Shareholder Expenses
As a shareholder of the Funds, you incur two types of costs: (1) transaction costs, including reinvested dividends or other distributions; and (2) ongoing costs, including investment advisory fees; distribution (12b-1) fees; and other Fund expenses. This example is intended to help you understand your ongoing costs (in dollars) of investing in the Funds and to compare these costs with the ongoing costs of investing in other mutual funds. The example is based on an investment of $1,000 invested at the beginning of the period and held for the entire period (January 1, 2018 through June 30, 2018).
Actual Expenses
The first line of the table below for each share class of a Fund provides information about actual account values and actual expenses. You may use the information in this line, together with the amount you invested, to estimate the expenses that you paid over the period. Simply divide your account value by $1,000 (for example, an $8,600 account value divided by $1,000 = 8.6), then multiply the result by the number in the first line under the heading entitled “Expenses Paid During the Six Months Ended June 30, 2018” to estimate the expenses you paid on your account during this period.
Hypothetical Example for Comparison Purposes
The second line of the table below for each share class of a Fund provides information about hypothetical account values and hypothetical expenses based on the Funds’ actual expense ratio and an assumed rate of return of 5% per year before expenses, which is not the Funds’ actual return. The hypothetical account values and expenses may not be used to estimate the actual ending account balance or expenses you paid for the period. You may use this information to compare the ongoing costs of investing in the Funds and other funds. To do so, compare this 5% hypothetical example with the 5% hypothetical examples that appear in the shareholder reports of the other funds.
Please note that the expenses shown in the table are meant to highlight your ongoing costs only and do not reflect any transactional costs, such as sales charges (loads), redemption fees, or exchange fees. Therefore, the second line of the table below is useful in comparing ongoing costs only, and will not help you determine the relative total costs of owning different funds. In addition, if these transactional costs were included, your costs would have been higher
Other Items (Unaudited) (Continued)
| | | | | | | | | | | | | | Expenses | |
| | | | | Net Expense | | | Beginning | | | Ending | | | Paid During | |
| | | | | Ratio | | | Account | | | Account | | | the Six Months | |
| | | | | Annualized | | | Value | | | Value | | | Ended | |
| | | | | June 30, | | | January 1, | | | June 30, | | | June 30, | |
| | | | | 2018 | | | 2018 | | | 2018 | | | 2018* | |
| Touchstone Credit Opportunities Fund | | | | | | | | | | | | | | | | | | |
| Class A | | Actual | | | 1.78 | % | | $ | 1,000.00 | | | $ | 1,003.60 | | | $ | 8.84 | ** |
| Class A | | Hypothetical | | | 1.78 | % | | $ | 1,000.00 | | | $ | 1,015.97 | | | $ | 8.90 | ** |
| | | | | | | | | | | | | | | | | | | |
| Class C | | Actual | | | 2.53 | % | | $ | 1,000.00 | | | $ | 999.70 | | | $ | 12.54 | ** |
| Class C | | Hypothetical | | | 2.53 | % | | $ | 1,000.00 | | | $ | 1,012.25 | | | $ | 12.62 | ** |
| | | | | | | | | | | | | | | | | | | |
| Class Y | | Actual | | | 1.53 | % | | $ | 1,000.00 | | | $ | 1,004.70 | | | $ | 7.60 | ** |
| Class Y | | Hypothetical | | | 1.53 | % | | $ | 1,000.00 | | | $ | 1,017.21 | | | $ | 7.65 | ** |
| | | | | | | | | | | | | | | | | | | |
| Institutional Class | | Actual | | | 1.43 | % | | $ | 1,000.00 | | | $ | 1,005.20 | | | $ | 7.11 | ** |
| Institutional Class | | Hypothetical | | | 1.43 | % | | $ | 1,000.00 | | | $ | 1,017.70 | | | $ | 7.15 | ** |
| | | | | | | | | | | | | | | | | | | |
| Touchstone International Growth Opportunities Fund | | | | | | | | | | | | | | | | |
| Class A | | Actual | | | 1.33 | % | | $ | 1,000.00 | | | $ | 1,010.90 | | | $ | 6.63 | |
| Class A | | Hypothetical | | | 1.33 | % | | $ | 1,000.00 | | | $ | 1,018.20 | | | $ | 6.66 | |
| | | | | | | | | | | | | | | | | | | |
| Class C | | Actual | | | 2.08 | % | | $ | 1,000.00 | | | $ | 1,006.90 | | | $ | 10.35 | |
| Class C | | Hypothetical | | | 2.08 | % | | $ | 1,000.00 | | | $ | 1,014.48 | | | $ | 10.39 | |
| | | | | | | | | | | | | | | | | | | |
| Class Y | | Actual | | | 1.07 | % | | $ | 1,000.00 | | | $ | 1,012.10 | | | $ | 5.34 | |
| Class Y | | Hypothetical | | | 1.07 | % | | $ | 1,000.00 | | | $ | 1,019.49 | | | $ | 5.36 | |
| | | | | | | | | | | | | | | | | | | |
| Institutional Class | | Actual | | | 0.99 | % | | $ | 1,000.00 | | | $ | 1,012.40 | | | $ | 4.94 | |
| Institutional Class | | Hypothetical | | | 0.99 | % | | $ | 1,000.00 | | | $ | 1,019.89 | | | $ | 4.96 | |
| | | | | | | | | | | | | | | | | | | |
| Touchstone International Small Cap Fund | | | | | | | | | | | | | | | | |
| Class A | | Actual | | | 1.55 | % | | $ | 1,000.00 | | | $ | 966.00 | | | $ | 7.56 | |
| Class A | | Hypothetical | | | 1.55 | % | | $ | 1,000.00 | | | $ | 1,017.11 | | | $ | 7.75 | |
| | | | | | | | | | | | | | | | | | | |
| Class C | | Actual | | | 2.30 | % | | $ | 1,000.00 | | | $ | 962.20 | | | $ | 11.19 | |
| Class C | | Hypothetical | | | 2.30 | % | | $ | 1,000.00 | | | $ | 1,013.39 | | | $ | 11.48 | |
| | | | | | | | | | | | | | | | | | | |
| Class Y | | Actual | | | 1.30 | % | | $ | 1,000.00 | | | $ | 966.70 | | | $ | 6.34 | |
| Class Y | | Hypothetical | | | 1.30 | % | | $ | 1,000.00 | | | $ | 1,018.35 | | | $ | 6.51 | |
| | | | | | | | | | | | | | | | | | | |
| Institutional Class | | Actual | | | 1.18 | % | | $ | 1,000.00 | | | $ | 967.90 | | | $ | 5.76 | |
| Institutional Class | | Hypothetical | | | 1.18 | % | | $ | 1,000.00 | | | $ | 1,018.94 | | | $ | 5.91 | |
| | | | | | | | | | | | | | | | | | | |
| Touchstone Large Cap Fund | | | | | | | | | | | | | | | | | | |
| Class A | | Actual | | | 1.12 | % | | $ | 1,000.00 | | | $ | 989.60 | | | $ | 5.53 | |
| Class A | | Hypothetical | | | 1.12 | % | | $ | 1,000.00 | | | $ | 1,019.24 | | | $ | 5.61 | |
| | | | | | | | | | | | | | | | | | | |
| Class C | | Actual | | | 1.87 | % | | $ | 1,000.00 | | | $ | 985.60 | | | $ | 9.21 | |
| Class C | | Hypothetical | | | 1.87 | % | | $ | 1,000.00 | | | $ | 1,015.52 | | | $ | 9.35 | |
| | | | | | | | | | | | | | | | | | | |
| Class Y | | Actual | | | 0.87 | % | | $ | 1,000.00 | | | $ | 990.30 | | | $ | 4.29 | |
| Class Y | | Hypothetical | | | 0.87 | % | | $ | 1,000.00 | | | $ | 1,020.48 | | | $ | 4.36 | |
| | | | | | | | | | | | | | | | | | | |
| Institutional Class | | Actual | | | 0.77 | % | | $ | 1,000.00 | | | $ | 991.10 | | | $ | 3.80 | |
| Institutional Class | | Hypothetical | | | 0.77 | % | | $ | 1,000.00 | | | $ | 1,020.98 | | | $ | 3.86 | |
Other Items (Unaudited) (Continued)
| | | | | | | | | | | | | | Expenses | |
| | | | | Net Expense | | | Beginning | | | Ending | | | Paid During | |
| | | | | Ratio | | | Account | | | Account | | | the Six Months | |
| | | | | Annualized | | | Value | | | Value | | | Ended | |
| | | | | June 30, | | | January 1, | | | June 30, | | | June 30, | |
| | | | | 2018 | | | 2018 | | | 2018 | | | 2018* | |
| Touchstone Large Company Growth Fund | | | | | | | | | | | | | | | | | |
| Class A | | Actual | | | 1.23 | % | | $ | 1,000.00 | | | $ | 1,058.10 | | | $ | 6.28 | |
| Class A | | Hypothetical | | | 1.23 | % | | $ | 1,000.00 | | | $ | 1,018.70 | | | $ | 6.16 | |
| | | | | | | | | | | | | | | | | | | |
| Class C | | Actual | | | 1.98 | % | | $ | 1,000.00 | | | $ | 1,054.10 | | | $ | 10.08 | |
| Class C | | Hypothetical | | | 1.98 | % | | $ | 1,000.00 | | | $ | 1,014.98 | | | $ | 9.89 | |
| | | | | | | | | | | | | | | | | | | |
| Class Y | | Actual | | | 0.98 | % | | $ | 1,000.00 | | | $ | 1,059.20 | | | $ | 5.00 | |
| Class Y | | Hypothetical | | | 0.98 | % | | $ | 1,000.00 | | | $ | 1,019.93 | | | $ | 4.91 | |
| | | | | | | | | | | | | | | | | | | |
| Institutional Class | | Actual | | | 0.88 | % | | $ | 1,000.00 | | | $ | 1,059.90 | | | $ | 4.49 | |
| Institutional Class | | Hypothetical | | | 0.88 | % | | $ | 1,000.00 | | | $ | 1,020.43 | | | $ | 4.41 | |
| | | | | | | | | | | | | | | | | | | |
| Touchstone Ohio Tax-Free Bond Fund | | | | | | | | | | | | | | | | | | |
| Class A | | Actual | | | 0.85 | % | | $ | 1,000.00 | | | $ | 994.20 | | | $ | 4.20 | |
| Class A | | Hypothetical | | | 0.85 | % | | $ | 1,000.00 | | | $ | 1,020.58 | | | $ | 4.26 | |
| | | | | | | | | | | | | | | | | | | |
| Class C | | Actual | | | 1.60 | % | | $ | 1,000.00 | | | $ | 990.50 | | | $ | 7.90 | |
| Class C | | Hypothetical | | | 1.60 | % | | $ | 1,000.00 | | | $ | 1,016.86 | | | $ | 8.00 | |
| | | | | | | | | | | | | | | | | | | |
| Class Y | | Actual | | | 0.60 | % | | $ | 1,000.00 | | | $ | 994.60 | | | $ | 2.97 | |
| Class Y | | Hypothetical | | | 0.60 | % | | $ | 1,000.00 | | | $ | 1,021.82 | | | $ | 3.01 | |
| | | | | | | | | | | | | | | | | | | |
| Institutional Class | | Actual | | | 0.55 | % | | $ | 1,000.00 | | | $ | 995.70 | | | $ | 2.72 | |
| Institutional Class | | Hypothetical | | | 0.55 | % | | $ | 1,000.00 | | | $ | 1,022.07 | | | $ | 2.76 | |
| | | | | | | | | | | | | | | | | | | |
| Touchstone Small Cap Value Opportunities Fund | | | | | | | | | | | | | | | | |
| Class A | | Actual | | | 1.43 | % | | $ | 1,000.00 | | | $ | 1,049.10 | | | $ | 7.27 | |
| Class A | | Hypothetical | | | 1.43 | % | | $ | 1,000.00 | | | $ | 1,017.70 | | | $ | 7.15 | |
| | | | | | | | | | | | | | | | | | | |
| Class C | | Actual | | | 2.18 | % | | $ | 1,000.00 | | | $ | 1,045.10 | | | $ | 11.05 | |
| Class C | | Hypothetical | | | 2.18 | % | | $ | 1,000.00 | | | $ | 1,013.98 | | | $ | 10.89 | |
| | | | | | | | | | | | | | | | | | | |
| Class Y | | Actual | | | 1.18 | % | | $ | 1,000.00 | | | $ | 1,050.80 | | | $ | 6.00 | |
| Class Y | | Hypothetical | | | 1.18 | % | | $ | 1,000.00 | | | $ | 1,018.94 | | | $ | 5.91 | |
| | | | | | | | | | | | | | | | | | | |
| Institutional Class | | Actual | | | 1.10 | % | | $ | 1,000.00 | | | $ | 1,051.10 | | | $ | 5.59 | |
| Institutional Class | | Hypothetical | | | 1.10 | % | | $ | 1,000.00 | | | $ | 1,019.34 | | | $ | 5.51 | |
| | | | | | | | | | | | | | | | | | | |
| Touchstone Value Fund | | | | | | | | | | | | | | | | | | |
| Class A | | Actual | | | 1.08 | % | | $ | 1,000.00 | | | $ | 997.60 | | | $ | 5.35 | |
| Class A | | Hypothetical | | | 1.08 | % | | $ | 1,000.00 | | | $ | 1,019.44 | | | $ | 5.41 | |
| | | | | | | | | | | | | | | | | | | |
| Class C | | Actual | | | 1.83 | % | | $ | 1,000.00 | | | $ | 994.50 | | | $ | 9.05 | |
| Class C | | Hypothetical | | | 1.83 | % | | $ | 1,000.00 | | | $ | 1,015.72 | | | $ | 9.15 | |
| | | | | | | | | | | | | | | | | | | |
| Class Y | | Actual | | | 0.80 | % | | $ | 1,000.00 | | | $ | 999.00 | | | $ | 3.97 | |
| Class Y | | Hypothetical | | | 0.80 | % | | $ | 1,000.00 | | | $ | 1,020.83 | | | $ | 4.01 | |
| | | | | | | | | | | | | | | | | | | |
| Institutional Class | | Actual | | | 0.68 | % | | $ | 1,000.00 | | | $ | 999.60 | | | $ | 3.37 | |
| Institutional Class | | Hypothetical | | | 0.68 | % | | $ | 1,000.00 | | | $ | 1,021.42 | | | $ | 3.41 | |
| * | Expenses are equal to the Fund's annualized expense ratio, multiplied by the average account value over the period, multiplied by 181/365 (to reflect the one-half year period). |
| ** | Excluding dividend and interest expenses on securities sold short, your actual cost of investment in Class A, Class C, Class Y and Institutional Class would be $8.40, $12.10, $7.16 and $6.66, respectively, and your hypothetical cost of investment in Class A, Class C, Class Y and Institutional Class would be $8.45, $12.18, $7.20, and $6.71, respectively. |
Other Items (Unaudited) (Continued)
Basis for Board’s Approval of Sub-Advisory Agreement
Touchstone Small Cap Value Opportunities Fund
At an in-person meeting held on May 17, 2018 (the “Meeting”), Touchstone Advisors, Inc. (the “Advisor”) proposed the replacement of the current sub-advisor of the Touchstone Small Cap Value Opportunities Fund (the “Fund”), Thompson, Siegel & Walmsley LLC (“TS&W”), to the Board of the Touchstone Strategic Trust (the “Trust”). As discussed below, the Board approved replacing TS&W with LMCG Investments, LLC (“LMCG”). TS&W served as sub-advisor to the Fund through the end of July 2018, at which time LMCG began serving as sub-advisor pursuant to a Sub-Advisory Agreement between the Advisor and LMCG (the “Sub-Advisory Agreement”).
The Advisor and LMCG provided the Board with various written materials in advance of the Meeting to assist with the Board’s consideration of LMCG as the Fund’s sub-advisor. The Advisor provided written and oral information stating the basis for its recommendation to engage LMCG as a sub-advisor. The information also included details regarding LMCG’s: (a) investment philosophy and investment process; (b) investment management services proposed to be provided to the Fund; (c) investment management personnel; (d) operating history, infrastructure and financial condition; (e) proposed sub-advisory fee that would be paid to LMCG by the Advisor; and (f) reputation, expertise and resources as an investment advisor. The Board then discussed the written materials that the Board received before the Meeting and all other information that the Board received at the Meeting.
The Board, including the Independent Trustees of the Trust, voting separately, unanimously determined that the proposal to approve the Sub-Advisory Agreement for the Fund would be in the best interests of the shareholders and the Fund. In approving the Sub-Advisory Agreement, the Board considered various factors, among them: (1) the nature, extent, and quality of services to be provided by LMCG to the Fund, including the personnel who would be providing such services; (2) LMCG’s proposed compensation; (3) LMCG’s past performance; and (4) the terms of the Sub-Advisory Agreement. The Board’s analysis of these factors is set forth below. The Independent Trustees were advised by independent legal counsel throughout the process.
Nature, Extent and Quality of Services Provided; Investment Personnel. The Board considered information provided by the Advisor regarding the services to be provided by LMCG. The Board considered LMCG’s level of knowledge and investment style. The Board reviewed the experience and credentials of the investment personnel who would be responsible for managing the investment of portfolio securities with respect to the Fund. The Board also took into consideration that the Advisor was satisfied with LMCG’s in-house risk and compliance teams and the Board’s familiarity with LMCG given LMCG’s management of other Touchstone Funds.
Profitability. The Board took into consideration the financial condition of LMCG and any direct and indirect benefits to be derived by LMCG’s relationship with the Fund. In considering the anticipated level of profitability to LMCG, the Board noted the proposed contractual undertaking of the Advisor to maintain expense limitations for the Fund and also noted that the sub-advisory fee under the Sub-Advisory Agreement would be paid by Touchstone out of the advisory fee that it receives from the Fund, and that the sub-advisory fee was negotiated at arm’s length between Touchstone and LMCG. As a consequence, the anticipated level of profitability to LMCG from its relationship with the Fund was not a substantial factor in the Board’s deliberations. For similar reasons, the Board did not consider potential economies of scale in LMCG’s management of the Fund to be a substantial factor in its consideration.
Sub-Advisory Fee. The Board considered that the Fund would pay an advisory fee to the Advisor and that the Advisor would pay a sub-advisory fee to LMCG. The Board compared LMCG’s proposed sub-advisory fee to the sub-advisory fee paid to the current sub-advisor to the Fund, noting that the proposed sub-advisory
Other Items (Unaudited) (Continued)
fee rate was lower than or equal to the current sub-advisory fee schedule. The Board took into account the sub-advisory fees other Touchstone Funds had paid for sub-advisory services provided by LMCG, noting that the proposed sub-advisory fee was comparable to those other fees. The Board considered the amount of the advisory fee to be retained by the Advisor and the amount to be paid to LMCG, with respect to the various services to be provided by the Advisor and LMCG. The Board also noted that the Advisor negotiated the sub-advisory fee with LMCG at arm’s length. Based upon their review, the Trustees concluded that the Fund’s proposed sub-advisory fee was reasonable in light of the services to be received by the Fund from LMCG.
Fund Performance. The Board also considered LMCG’s investment performance and the Fund’s performance record under the management of the current sub-advisor. The Trustees also noted that LMCG has served as sub-advisor for other Touchstone Funds, including the Touchstone Small Cap Value Fund that uses a small cap value strategy substantially similar to the strategy proposed to be used in managing the Fund, and that the Advisor was satisfied with LMCG’s management of those funds.
Conclusion. The Board reached the following conclusions regarding the Sub-Advisory Agreement: (a) LMCG is qualified to manage the Fund’s assets in accordance with the Fund’s investment goal and policies; (b) LMCG maintains an appropriate compliance program; (c) the Fund’s proposed sub-advisory fee is reasonable in relation to the services provided and fees charged to other Touchstone Funds; and (d) LMCG’s proposed investment strategies are appropriate for managing the Fund. In considering the approval of the Sub-Advisory Agreement, the Board, including the Independent Trustees, did not identify any single factor as controlling, and each Trustee attributed different weights to the various factors. Based on its conclusions, the Board determined that approval of the Sub-Advisory Agreement was in the best interests of the Fund and its shareholders.
Management of the Trust (Unaudited)
Listed below is required information regarding the Trustees and principal officers of the Trust. The Trust’s Statement of Additional Information includes additional information about the Trustees and is available, without charge, upon request by calling 1.800.543.0407 or by visiting the Touchstone website at TouchstoneInvestments.com.
Interested Trustee1:
| | | | | | | | | Number | | |
| | | | | | | | | of Funds | | |
| | | | | | | | | Overseen | | |
| | | | | Term of | | | | in the | | |
| Name | | Position(s) | | Office And | | | | Touchstone | | Other |
| Address | | Held with | | Length of | | Principal Occupation(s) | | Fund | | Directorships |
| Year of Birth | | Trust | | Time Served | | During Past 5 Years | | Complex2 | | Held During the Past 5 Years3 |
Jill T. McGruder Touchstone Advisors, Inc. 303 Broadway Suite 1100 Cincinnati, Ohio 45202 Year of Birth: 1955 | | Trustee and President | | Until retirement at age 75 or until she resigns or is removed Trustee since 1999 | | President and CEO of IFS Financial Services, Inc. (a holding company). | | 49 | | IFS Financial Services, Inc. (a holding company) from 1999 to the present; Integrity and National Integrity Life Insurance Co. from 2005 to the present; Touchstone Securities (the Trust’s distributor) from 1999 to the present; Touchstone Advisors, Inc. (the Trust’s investment advisor and administrator) from 1999 to the present; W&S Brokerage Services (a brokerage company) from 1999 to the present; W&S Financial Group Distributors (a distribution company) from 1999 to the present; Cincinnati Analysts, Inc. from 2012 to the present; Columbus Life Insurance Co. from 2016 to the present; The Lafayette Life Insurance Co. from 2016 to the present; Taft Museum of Art from 2007 to the present; YWCA of Greater Cincinnati from 2012 to the present; and LL Global, Inc. from 2016 to the present. |
| Independent Trustees: | | | | | | | | | | |
Phillip R. Cox c/o Touchstone Advisors, Inc. 303 Broadway Suite 1100 Cincinnati, Ohio 45202 Year of Birth: 1947 | | Trustee | | Until retirement at age 75 or until he resigns or is removed Trustee since 1999 | | President and Chief Executive Officer of Cox Financial Corp. (a financial services company) from 1971 to the present. | | 49 | | Director of Cincinnati Bell (a communications company) from 1994 to the present; Bethesda Inc. (a hospital) from 2005 to the present; Timken Co. (a manufacturing company) from 2004 to 2014; TimkenSteel from 2014 to the present; Diebold, Inc. (a technology solutions company) from 2004 to the present; and Ohio Business Alliance for Higher Education and the Economy from 2005 to the present. |
William C. Gale c/o Touchstone Advisors, Inc. 303 Broadway Suite 1100 Cincinnati, Ohio 45202 Year of Birth: 1952 | | Trustee | | Until retirement at age 75 or until he resigns or is removed Trustee since 2013 | | Retired; formerly Senior Vice President and Chief Financial Officer (from 2003 to January 2015) of Cintas Corporation (a business services company). | | 49 | | None. |
Management of the Trust (Unaudited) (Continued)
Independent Trustees (Continued):
| | | | | | | | | Number | | |
| | | | | | | | | of Funds | | |
| | | | | | | | | Overseen | | |
| | | | | Term of | | | | in the | | |
| Name | | Position | | Office And | | | | Touchstone | | Other |
| Address | | Held with | | Length of | | Principal Occupation(s) | | Fund | | Directorships |
| Year of Birth | | Trust | | Time Served | | During Past 5 Years | | Complex2 | | Held During the Past 5 Years3 |
Susan J. Hickenlooper c/o Touchstone Advisors, Inc. 303 Broadway Suite 1100 Cincinnati, Ohio 45202 Year of Birth: 1946 | | Trustee | | Until retirement at age 75 or until she resigns or is removed Trustee since 2009 | | Retired; formerly Financial Analyst for Impact 100 (charitable organization) from November 2012 to 2013. | | 49 | | Trustee of Diocese of Southern Ohio from 2014 to the present; and Trustee of Cincinnati Parks Foundation from 2000 to 2016. |
Kevin A. Robie c/o Touchstone Advisors, Inc. 303 Broadway Suite 1100 Cincinnati, Ohio 45202 Year of Birth: 1956 | | Trustee | | Until retirement at age 75 or until he resigns or is removed Trustee since 2013 | | Vice President of Portfolio Management at Soin International LLC (a multinational holding company) from 2004 to the present. | | 49 | | SaverSystems, Inc. from 2015 to the present; Director of Buckeye EcoCare, Inc. (a lawn care company) from 2013 to the present; Trustee of Dayton Region New Market Fund, LLC (a private fund) from 2010 to the present; and Trustee of the Entrepreneurs Center, Inc. (a small business incubator) from 2006 to the present. |
Edward J. VonderBrink c/o Touchstone Advisors, Inc. 303 Broadway Suite 1100 Cincinnati, Ohio 45202 Year of Birth: 1944 | | Trustee | | Until retirement at age 75 or until he resigns or is removed Trustee since 2013 | | Consultant, VonderBrink Consulting LLC from 2000 to the present. | | 49 | | Director of Streamline Health Solutions, Inc. (healthcare IT) from 2006 to 2015; Mercy Health from 2013 to the present; Mercy Health Foundation (healthcare nonprofit) from 2008 to the present; Al Neyer Inc. (a construction company) from 2013 to the present; and BASCO Shower Door from 2011 to the present. |
| 1 | Ms. McGruder, as a director of the Advisor and the Trust's Distributor, and an officer of affiliates of the Advisor and the Distributor, is an “interested person” of the Trust within the meaning of Section 2(a) (19) of the 1940 Act. |
| 2 | As of June 30, 2018, the Touchstone Fund Complex consists of 25 series of the Trust, 13 series of Touchstone Funds Group Trust, 1 series of Touchstone Institutional Funds Trust, and 10 variable annuity series of Touchstone Variable Series Trust. |
| 3 | Each Trustee is also a Trustee of Touchstone Funds Group Trust, Touchstone Institutional Funds Trust, and Touchstone Variable Series Trust. |
Management of the Trust (Unaudited) (Continued)
Principal Officers:
| | | | | Term of | | |
| Name | | Position(s) | | Office And | | |
| Address | | Held with | | Length of | | Principal Occupation(s) |
| Year of Birth | | Trust1 | | Time Served | | During the Past 5 Years |
Jill T. McGruder Touchstone Advisors, Inc. 303 Broadway Suite 1100 Cincinnati, Ohio 45202 Year of Birth: 1955 | | President and Trustee | | Until resignation, removal or disqualification President since 2006 | | See biography above. |
Steven M. Graziano Touchstone Advisors, Inc. 303 Broadway Suite 1100 Cincinnati, Ohio 45202 Year of Birth: 1954 | | Vice President | | Until resignation, removal or disqualification Vice President since 2009 | | President of Touchstone Advisors, Inc. |
Timothy D. Paulin Touchstone Advisors, Inc. 303 Broadway Suite 1100 Cincinnati, Ohio 45202 Year of Birth: 1963 | | Vice President | | Until resignation, removal or disqualification Vice President since 2010 | | Senior Vice President of Investment Research and Product Management of Touchstone Advisors, Inc. |
Timothy S. Stearns Touchstone Advisors, Inc. 303 Broadway Suite 1100 Cincinnati, Ohio 45202 Year of Birth: 1963 | | Chief Compliance Officer | | Until resignation, removal or disqualification Chief Compliance Officer since 2013 | | Chief Compliance Officer of Touchstone Advisors, Inc.; Chief Compliance Officer of Envestnet Asset Management, Inc. (2009 to 2013). |
Terrie A. Wiedenheft Touchstone Advisors, Inc. 303 Broadway Suite 1100 Cincinnati, Ohio 45202 Year of Birth: 1962 | | Controller and Treasurer | | Until resignation, removal or disqualification Controller and Treasurer since 2006 | | Senior Vice President, Chief Financial Officer and Chief Operations Officer, of IFS Financial Services, Inc. (a holding company). |
Ellen Blanchard The Bank of New York Mellon 201 Washington Street, 13th Floor Boston, Massachusetts 02108 Year of Birth: 1973 | | Secretary | | Until resignation, removal or disqualification Secretary since 2015 | | Director of The Bank of New York Mellon. |
| 1 | Each officer also holds the same office with Touchstone Funds Group Trust, Touchstone Institutional Funds Trust, and Touchstone Variable Series Trust. |
PRIVACY PROTECTION POLICY
We Respect Your Privacy
Thank you for your decision to invest with us. Touchstone and its affiliates have always placed a high value on the trust and confidence our clients place in us. We believe that confidence must be earned and validated through time. In today’s world, when technology allows the sharing of information at light speeds, trust must be reinforced by our sincere pledge to take the steps necessary to ensure that the information you share with us is treated with respect and confidentiality.
Our Pledge to Our Clients
| · | We collect only the information we need to service your account and administer our business. |
| · | We are committed to keeping your information confidential and we place strict limits and controls on the use and sharing of your information. |
| · | We make every effort to ensure the accuracy of your information. |
We Collect the Following Nonpublic Personal Information About You:
| · | Information we receive from you on or in applications or other forms, correspondence, or conversations, including, but not limited to, your name, address, phone number, social security number, assets, income and date of birth; and |
| · | Information about your transactions with us, our affiliates, or others, including, but not limited to, your account number and balance, payment history, parties to transactions, cost basis information, and other financial information. |
Categories of Information We Disclose and Parties to Whom We Disclose
We do not disclose any nonpublic personal information about our current or former clients to nonaffiliated third parties, except as required or permitted by law.
We Place Strict Limits and Controls on the Use and Sharing of Your Information
| · | We restrict access to nonpublic personal information about you to authorized employees who need the information to administer your business. |
| · | We maintain physical, electronic and procedural safeguards that comply with federal standards to protect this information. |
| · | We do not disclose any nonpublic personal information about our current or former clients to anyone, except as required or permitted by law or as described in this document. |
| · | We will not sell your personal information to anyone. |
We May Provide Information to Service Your Account
Sometimes it is necessary to provide information about you to various companies such as transfer agents, custodians, broker-dealers and marketing service firms to facilitate the servicing of your account. These organizations have a legitimate business need to see some of your personal information in order for us to provide service to you. We may disclose to these various companies the information that we collect as described above. We require that these companies, including our own subsidiaries and affiliates, strictly maintain the confidentiality of this information and abide by all applicable laws. Companies within our corporate family that may receive this information are financial service providers and insurance companies. We do not permit these associated companies to sell the information for their own purposes, and we never sell our customer information.
This policy is applicable to the following affiliated companies: Touchstone Funds Group Trust, Touchstone Strategic Trust, Touchstone Variable Series Trust, Touchstone Institutional Funds Trust, Touchstone Securities, Inc.,* and W&S Brokerage Services, Inc.
* Touchstone Securities, Inc. serves as the underwriter to the Touchstone Funds.
A Member of Western & Southern Financial Group®
The Privacy Protection Policy is not part of the Annual Report.
800.638.8194 · TouchstoneInvestments.com

Go paperless, sign up today at:
www.touchstoneinvestments.com
Touchstone Investments
Distributor
Touchstone Securities, Inc.*
303 Broadway
Cincinnati, Ohio 45202-4203
800.638.8194
www.touchstoneinvestments.com
Investment Advisor
Touchstone Advisors, Inc.*
303 Broadway
Cincinnati, Ohio 45202-4203
Transfer Agent
BNY Mellon Investment Servicing (US) Inc.
4400 Computer Drive
Westborough, Massachusetts 01581
Shareholder Service
800.543.0407
* A Member of Western & Southern Financial Group
TSF-54BB-TST-AR-1806
| (a) | The registrant, as of the end of the period covered by this report, has adopted a code of ethics that applies to the registrant’s principal executive officer, principal financial officer, principal accounting officer or controller, or persons performing similar functions, regardless of whether these individuals are employed by the registrant or a third party. |
| (c) | There have been no amendments, during the period covered by this report, to a provision of the code of ethics that applies to the registrant’s principal executive officer, principal financial officer, principal accounting officer or controller, or persons performing similar functions, regardless of whether these individuals are employed by the registrant or a third party, and that relates to any element of the code of ethics description. |
| (d) | The registrant has not granted any waivers, including an implicit waiver, from a provision of the code of ethics that applies to the registrant’s principal executive officer, principal financial officer, principal accounting officer or controller, or persons performing similar functions, regardless of whether these individuals are employed by the registrant or a third party, that relates to one or more of the items set forth in paragraph (b) of this item’s instructions. |
| Item 3. | Audit Committee Financial Expert. |
The registrant’s Board of Trustees has determined that the registrant has at least one audit committee financial expert serving on its audit committee. Mr. William Gale is the registrant’s audit committee financial expert and is an independent trustee within the meaning of the Investment Company Act of 1940, as amended (the “1940 Act”).
| Item 4. | Principal Accountant Fees and Services. |
Audit Fees
| (a) | Audit fees for Touchstone Strategic Trust (June Funds) totaled $156,350 and $150,300 for the fiscal years ended June 30, 2018 and June 30, 2017, respectively, including fees associated with the annual audit and filing of Form N-1A and Form NSAR. |
Audit-Related Fees
| (b) | The aggregate fees billed in each of the last two fiscal years for assurance and related services by the principal accountant that are reasonably related to the performance of the audit of the registrant's financial statements and are not reported under paragraph (a) of this Item are $0 and $12,000 for the fiscal years ended June 30, 2018 and June 30, 2017, respectively. The fees for 2018 relate to additional audit procedures and review of predecessor auditor work papers. The fees for 2017 relate to the review N-1A and Prospectus filings. |
Tax Fees
| (c) | The aggregate fees billed in each of the last two fiscal years for professional services rendered by the principal accountant for tax compliance, tax advice, and tax planning were $50,993 and $41,090 for the fiscal years ended June 30, 2018 and June 30, 2017, respectively. The fees relate to the preparation of federal income and excise tax returns, review of capital gains distribution calculations and tax agent services. |
All Other Fees
| (d) | The aggregate fees billed in each of the last two fiscal years for products and services provided by the principal accountant, other than the services reported in paragraphs (a) through (c) of this Item are $16,719 and $22,102 for the fiscal years ended June 30, 2018 and June 30, 2017, respectively. The fees relate to the PFIC Analyzer and Global Withholding Tax Reporter subscriptions. |
| (e)(1) | Disclose the audit committee's pre-approval policies and procedures described in paragraph (c)(7) of Rule 2-01 of Regulation S-X. |
The Audit Committee’s pre-approval policies describe the types of audit, audit-related, tax and other services that have the general pre-approval of the Audit Committee. The pre-approval policies provide that annual audit service fees, tax services not specifically granted pre-approval, services exceeding pre-approved cost levels and other services that have not received general pre-approval will be subject to specific pre-approval by the Audit Committee. The pre-approval policies further provide that the Committee may grant general pre-approval to other audit services (statutory audits and services associated with SEC registration statements, periodic reports and other documents filed with the SEC or other documents issued in connection with securities offerings), audit-related services (accounting consultations related to accounting, financial reporting or disclosure matters not classified as “audit services,” assistance with understanding and implementing new accounting and financial reporting guidance from rulemaking authorities, agreed-upon or expanded audit procedures related to accounting and/or billing records required to respond to or comply with financial, accounting or regulatory reporting matters and assistance with internal control reporting requirements under Form N-CSR), tax services that have historically been provided by the auditor that the Committee believes would not impair the independence of the auditor and are consistent with the SEC’s rules on auditor independence and permissible non-audit services classified as “all other services” that are routine and recurring services.
All services described in paragraphs (c) through (d) of Item 4 were approved by the Audit Committee.
| (f) | The percentage of hours expended on the principal accountant's engagement to audit the registrant's financial statements for the most recent fiscal year that were attributed to work performed by persons other than the principal accountant's full-time, permanent employees was less than fifty percent. |
| (g) | The aggregate non-audit fees for Touchstone Strategic Trust (June Funds) and certain entities*, totaled approximately $72,712 and $75,192 for the fiscal years ended June 30, 2018 and June 30, 2017, respectively. |
* These include the advisors (excluding sub-advisors) and any entity controlling, controlled by or under common control with the advisors that provides ongoing services to the registrant (Funds).
| (h) | The registrant's audit committee of the board of directors has considered whether the provision of non-audit services that were rendered to the registrant's investment adviser (not including any sub-adviser whose role is primarily portfolio management and is subcontracted with or overseen by another investment adviser), and any entity controlling, controlled by, or under common control with the investment adviser that provides ongoing services to the registrant that were not pre-approved pursuant to paragraph (c)(7)(ii) of Rule 2-01 of Regulation S-X is compatible with maintaining the principal accountant's independence. |
| Item 5. | Audit Committee of Listed Registrants. |
Not applicable.
| (a) | Schedule of Investments in securities of unaffiliated issuers as of the close of the reporting period is included as part of the report to shareholders filed under Item 1 of this form. |
| Item 7. | Disclosure of Proxy Voting Policies and Procedures for Closed-End Management Investment Companies. |
Not applicable.
| Item 8. | Portfolio Managers of Closed-End Management Investment Companies. |
Not applicable.
| Item 9. | Purchases of Equity Securities by Closed-End Management Investment Company and Affiliated Purchasers. |
Not applicable.
| Item 10. | Submission of Matters to a Vote of Security Holders. |
There have been no material changes to the procedures by which the shareholders may recommend nominees to the registrant’s board of trustees, where those changes were implemented after the registrant last provided disclosure in response to the requirements of Item 407(c)(2)(iv) of Regulation S-K (17 CFR 229.407) (as required by Item 22(b)(15) of Schedule 14A (17 CFR 240.14a-101)), or this Item.
| Item 11. | Controls and Procedures. |
| (a) | The registrant’s principal executive and principal financial officers, or persons performing similar functions, have concluded that the registrant’s disclosure controls and procedures (as defined in Rule 30a-3(c) under the Investment Company Act of 1940, as amended (the “1940 Act”) (17 CFR 270.30a-3(c))) are effective, as of a date within 90 days of the filing date of the report that includes the disclosure required by this paragraph, based on their evaluation of these controls and procedures required by Rule 30a-3(b) under the 1940 Act (17 CFR 270.30a-3(b)) and Rules 13a-15(b) or 15d-15(b) under the Securities Exchange Act of 1934, as amended (17 CFR 240.13a-15(b) or 240.15d-15(b)). |
| (b) | There were no changes in the registrant’s internal control over financial reporting (as defined in Rule 30a-3(d) under the 1940 Act (17 CFR 270.30a-3(d))) that occurred during the registrant’s last fiscal quarter that has materially affected, or is reasonably likely to materially affect, the registrant’s internal control over financial reporting. |
| Item 12. | Disclosure of Securities Lending Activities for Closed-End Management Investment Companies. |
Not applicable.
| (a)(1) | Code of ethics, or any amendment thereto, that is the subject of disclosure required by Item 2 is attached hereto. |
| (a)(2) | Certifications pursuant to Rule 30a-2(a) under the 1940 Act and Section 302 of the Sarbanes-Oxley Act of 2002 are attached hereto. |
| (b) | Certifications pursuant to Rule 30a-2(b) under the 1940 Act and Section 906 of the Sarbanes- Oxley Act of 2002 are attached hereto. |
SIGNATURES
Pursuant to the requirements of the Securities Exchange Act of 1934 and the Investment Company Act of 1940, the registrant has duly caused this report to be signed on its behalf by the undersigned, thereunto duly authorized.
(Registrant) Touchstone Strategic Trust
By (Signature and Title)* /s/ Jill T. McGruder
Jill T. McGruder, President
(principal executive officer)
Date August 24, 2018
Pursuant to the requirements of the Securities Exchange Act of 1934 and the Investment Company Act of 1940, this report has been signed below by the following persons on behalf of the registrant and in the capacities and on the dates indicated.
By (Signature and Title)* /s/ Jill T. McGruder
Jill T. McGruder, President
(principal executive officer)
Date August 24, 2018
By (Signature and Title)* /s/ Terrie A. Wiedenheft
Terrie A. Wiedenheft, Controller and Treasurer
(principal financial officer)
Date August 24, 2018
* Print the name and title of each signing officer under his or her signature.