UNITED STATES
SECURITIES AND EXCHANGE COMMISSION
Washington, D.C. 20549
FORM N-CSR
CERTIFIED SHAREHOLDER REPORT OF REGISTERED MANAGEMENT
INVESTMENT COMPANIES
Investment Company Act file number 811-03651
Touchstone Strategic Trust – June Funds
(Exact name of registrant as specified in charter)
303 Broadway, Suite 1100
Cincinnati, Ohio 45202-4203
(Address of principal executive offices) (Zip code)
Jill T. McGruder
303 Broadway, Suite 1100
Cincinnati, Ohio 45202-4203
(Name and address of agent for service)
Registrant's telephone number, including area code: 800-638-8194
Date of fiscal year end: June 30
Date of reporting period: June 30, 2018
Form N-CSR is to be used by management investment companies to file reports with the Commission not later than 10 days after the transmission to stockholders of any report that is required to be transmitted to stockholders under Rule 30e-1 under the Investment Company Act of 1940 (17 CFR 270.30e-1). The Commission may use the information provided on Form N-CSR in its regulatory, disclosure review, inspection, and policymaking roles.
A registrant is required to disclose the information specified by Form N-CSR, and the Commission will make this information public. A registrant is not required to respond to the collection of information contained in Form N-CSR unless the Form displays a currently valid Office of Management and Budget ("OMB") control number. Please direct comments concerning the accuracy of the information collection burden estimate and any suggestions for reducing the burden to Secretary, Securities and Exchange Commission, 450 Fifth Street, NW, Washington, DC 20549-0609. The OMB has reviewed this collection of information under the clearance requirements of 44 U.S.C. § 3507.
Item 1. Reports to Stockholders.
The Report to Shareholders is attached herewith.
June 30, 2018
Annual Report
Touchstone Strategic Trust
Touchstone Balanced Fund
Touchstone International Equity Fund
Touchstone Large Cap Focused Fund
Touchstone Small Company Fund

Table of Contents
This report identifies the Funds' investments on June 30, 2018. These holdings are subject to change. Not all investments in each Fund performed the same, nor is there any guarantee that these investments will perform as well in the future. Market forecasts provided in this report may not occur.
Letter from the President
Dear Shareholder:
We are pleased to provide you with the Touchstone Strategic Trust Annual Report. Inside you will find key financial information, as well as manager commentaries for the Funds, for the seven months ended June 30, 2018.
The global economic recovery, now in its 10th year following the 2008 financial crisis, gained momentum in 2017 as the U.S., Japan, the European Union and China all reported solid economic growth. Despite the overall solid economic fundamentals, market volatility increased in 2018 as tariffs and trade tensions raised the specter of an escalating global trade war. The “synchronized global expansion” showed signs of unraveling because of these growing trade tensions. Monetary policies across the major central banks remained divergent throughout the period as the Bank of Japan and the European Central Bank maintained accommodative stances, while the U.S. Federal Reserve Board (Fed) continued moving toward its goal of monetary policy normalization by raising interest rates three times in the fiscal year. Additionally, the Fed announced and began executing on plans to reduce the size of its balance sheet by selling securities it had acquired during its quantitative easing programs.
Despite the negative impact of widening trade disputes, global equities eked out positive returns, led by the domestic market. While non-U.S. equities produced positive local currency returns, a strengthening U.S. dollar offset those gains and resulted in slight losses for dollar-denominated investors allocating to foreign markets. Within the U.S. equity markets, growth-oriented stocks far outpaced their value-oriented counterparts, while small-capitalization stocks outperformed mid- and large-capitalization stocks.
The Fed’s three interest rate hikes during the fiscal year pushed short-term interest rates higher. Longer-term interest rates also moved higher early in the period before settling into range-bound trading from mid-February on. This rise in interest rates drove negative returns for investment grade bonds. Though non-investment grade bonds also experienced price declines, these were offset by these bonds’ higher coupon payments, enabling the non-investment grade market to produce slightly positive returns in aggregate for the fiscal period.
With 2019 now on the horizon, the post-crisis bull market is approaching its 10 year anniversary. While it has certainly experienced periods of volatility, the length and strength of this market environment only reinforces our view that investing is a long-term endeavor which requires a multi-year approach. A disciplined approach and appropriate time horizon can deter short-termism and reactive decision-making. Your financial advisor can help you by identifying a risk-return profile and developing an investment plan that will help you address your long-term financial goals.
We greatly appreciate your continued support. Thank you for including Touchstone as part of your investment plan.
Sincerely,

Jill T. McGruder
President
Touchstone Strategic Trust
Management's Discussion of Fund Performance (Unaudited)
Touchstone Balanced Fund
Sub-Advised by Fort Washington Investment Advisors, Inc.
Investment Philosophy
The Fund seeks to achieve its investment goal of providing investors with capital appreciation and current income by generally investing in a diversified portfolio comprising 60 percent equity securities and 40 percent fixed-income securities.
With respect to equities, the Fund invests primarily in issuers having a market capitalization, at the time of purchase, above $5 billion. Equity securities include common stock and preferred stock. With respect to fixed-income, the Fund invests primarily in bonds, including mortgage-related securities, asset-backed securities, government securities (both U.S. government securities and foreign sovereign debt), and corporate debt securities.
Fund Performance
The Touchstone Balanced Fund (Class A Shares) underperformed its first benchmark, the S&P 500® Index, and outperformed its second benchmark, the Bloomberg Barclays U.S. Aggregate Bond Index, for the seven-month period ended June 30, 2018. The Fund’s total return was 1.72 percent (calculated excluding the maximum sales charge) while the total return of the S&P 500® Index was 3.79 percent and the total return of the Bloomberg Barclays U.S. Aggregate Bond Index was -1.17 percent.
Market Environment
The market environment was mixed during the period. In the last quarter of 2017, U.S. equities continued the bull market that began in 2009 as the market experienced low volatility and ended the year near all-time highs. Solid financial conditions and strong profit growth were the key drivers of the market. Markets benefited from an added boost in the later stages of 2017 as the White House and Congressional Republican leaders coalesced around a plan for tax reform. In the first quarter of 2018, the major theme in the U.S. equity market was the return of volatility. The primary drivers were concerns over higher interest rates and uncertainty about trade relations. The U.S. equity market experienced the first correction of 10 percent in more than a year and ended the quarter down slightly. In the second quarter, the U.S. equity market ended slightly higher as solid earnings and elevated corporate buyback activity overshadowed ongoing trade concerns. Sectors that led the S&P 500® Index higher included Information Technology, Consumer Discretionary and Energy. The Consumer Staples, Telecommunication Services, Real Estate, Industrials, Materials, Financials, Health Care and Utilities sectors underperformed the index during the period.
The yield curve continued to flatten over the period with interest rates on the front end of the curve rising at a greater magnitude than the long end. This was driven by the combination of the U.S. Federal Reserve Board continuing to gradually raise short-term rates and lower-than-expected inflation subduing the long-end of the yield curve. U.S. investment grade corporate bonds and Treasuries declined during the period, while U.S. non-investment grade corporate bonds gained due to positive economic data and continued investor demand for high-yield bonds. Emerging Markets debt also declined as a stronger dollar and uncertainty on global trade made the space unappealing to investors.
Portfolio Review
Sectors in which the Fund outperformed the S&P 500® Index included Telecommunication Services, Industrials, Health Care, Financials, Information Technology, Consumer Staples and Real Estate. The Consumer Discretionary, Utilities and Energy sectors were the areas where the Fund underperformed the index. Sector allocation was marginally positive to performance primarily due to the underweights to Utilities, Real Estate, Industrials, and Health Care.
Management's Discussion of Fund Performance (Unaudited) (Continued)
With credit spreads widening during the period, the Fund’s typical overweight to risk assets was detrimental to performance. The Fund’s allocation to investment grade corporate bonds naturally made this segment a primary source of weakness during the period. The Fund’s allocation to U.S. dollar denominated Emerging Markets debt also detracted. Given the negative move in the market overall, the Fund’s holdings in cash contributed to performance over the period.
Outlook
Overall, our outlook supports the Fund’s overweight to risk assets based on steady U.S. economic growth and moderate inflation levels. While broad financial conditions are not tight, they have tightened in recent months amid increased market volatility and higher interest rates.
At the mid-point of a year that has been characterized by strong economic data and corporate earnings overshadowing trade conflicts and rising interest rates, the U.S. equity market is slightly ahead of where we started the year. Our view is that the U.S. equity market is healthy and priced at fair value. We continue to monitor the most common indicators of the end of a bull market – a credit cycle, inflation, and an asset bubble. At this point, these indicators do not give us reason to get defensive. We also look for deteriorating market breadth, which is typically a hallmark of an ensuing market top. Throughout the year, market breadth readings have been solid. As a result, the Fund’s cash position remains near its historical average.
Within fixed income, valuations have adjusted to reflect uncertainty around trade issues, but potential upside to price appreciation remains limited. The team has been taking advantage of opportunities among Securitized Assets when possible, where attractive risk/reward profiles can be found in the Asset-Backed and Non-agency Mortgage-Backed Sectors. We also are attracted to these sectors’ close connection to consumer spending, which continues to be healthy. We believe interest rates are currently fair and do not anticipate a meaningful move higher from here. As a result, the Fund’s portfolio will generally remain duration neutral relative to the Bloomberg Barclays U.S. Aggregate Bond Index, and look to opportunistically take advantage of dislocations in the market as they arise.
Management's Discussion of Fund Performance (Unaudited) (Continued)
Comparison of the Change in Value of a $10,000 Investment in the Touchstone Balanced Fund - Class A*, the S&P 500® Index and the Bloomberg Barclays U.S. Aggregate Bond Index

| * | The chart above represents performance of Class A shares only, which will vary from the performance of Class C shares and Class Y shares based on the differences in sales loads and fees paid by shareholders in the different classes. The inception date of Class A shares, Class C shares and Class Y shares was November 15, 1938, May 4, 1998 and August 27, 2007, respectively. Class C shares and Class Y shares performance information was calculated using the historical performance of Class A shares for periods prior to May 4, 1998 and August 27, 2007, respectively. The returns have been restated for sales loads and fees applicable to Class C and Class Y shares. The launch date of the S&P 500® Index and the Bloomberg Barclays U.S. Aggregate Bond Index was after the inception date of the Fund, therefore there is no return for inception. |
| ** | The average annual total returns shown above are adjusted for maximum sales loads and fees, if applicable. Prior to October 28, 2017, the maximum offering price per share of Class A shares was equal to the net asset value (“NAV”) per share plus a sales load equal to 5.26% of the NAV (or 5.00% of the offering price). Effective October 28, 2017, the maximum offering price per share of Class A shares is equal to the NAV per share plus a sales load equal to 6.10% of the NAV (or 5.75% of the offering price). Class C shares are subject to a contingent deferred sales charge (“CDSC”) of 1.00%. The CDSC will be assessed on an amount equal to the lesser of (1) the NAV at the time of purchase of the shares being redeemed or (2) the NAV of such shares being redeemed, if redeemed within a one-year period from the date of purchase. Class Y shares are not subject to sales charges. |
The performance of the above Fund does not reflect the deduction of taxes that a shareholder would pay on Fund distributions or the redemption of Fund shares.
Notes to Chart
S&P 500® Index is a group of 500 widely held stocks and is commonly regarded to be representative of the large capitalization stock universe.
Bloomberg Barclays U.S. Aggregate Bond Index is an unmanaged index comprised of U.S. investment grade, fixed rate bond market securities, including government, government agency, corporate and mortgage-backed securities between one and ten years.
Management's Discussion of Fund Performance (Unaudited)
Touchstone International Equity Fund
Sub-Advised by Fort Washington Investment Advisors, Inc.
Investment Philosophy
The Touchstone International Equity Fund invests primarily in common stocks of established large capitalization companies located in or that conduct their business mainly in one or more foreign countries, which may include emerging markets. The process starts with a regular quantitative screening or bottom up identification of companies that meet the investment profile of high returns on capital, operating margins and strong cash flow generation. These means of identifying companies narrows the investable universe. The Fund analyzes companies based on the following five fundamental factors: business quality, valuation, growth, management and balance sheet strength, focusing on quality at a reasonable price. This approach to portfolio construction seeks to result in a concentrated, high-conviction portfolio.
Fund Performance
The Touchstone International Equity Fund (Class A Shares) underperformed its benchmark, the MSCI EAFE Index, for the seven-month period ended June 30, 2018. The Fund’s total return was -3.23 percent (calculated excluding the maximum sales charge) while the total return of the benchmark was -1.19 percent.
Market Environment
The seven-month period ended June 30, 2018 was a tale of two markets. The MSCI EAFE Index declined overall despite the Energy, Materials and Real Estate sector stocks generating positive returns. Conversely, Telecommunication Services, Financials and Industrials sectors each posted negative returns. The steady up market at the end of 2017 culminated in record low volatility and post-financial-crisis highs in global indices in early 2018. January saw a spike in volatility and an initial crash, which led to choppier, generally falling markets for the rest of the period. The dollar recovered sharply in January, benefiting from the risk off trade and further stressed export-oriented markets. As the period ended, there were signs of peaking global economic growth and tightening monetary conditions combined with rising trade tensions, which dampened investor confidence.
Portfolio Review
The Touchstone International Equity Fund underperformance was mainly due to poor stock selection in the Consumer Discretionary, Real Estate and Materials sectors, while an underweight position in the Financials sector and solid stock selection in the Information Technology sector were positive contributors to performance over the seven-month period. Geographically, the Fund’s holdings in Canada and India were the largest performance detractors, while an overweight position in the U.K. and good stock selection within the country contributed to performance. Additionally, the Fund benefited from solid stock selection in its German and Dutch holdings.
Among the detractors from relative performance over the seven-month period were PC Jeweller (Consumer Discretionary sector), SES SA (Consumer Discretionary sector) and Uni-Select Inc. (Consumer Discretionary sector).
Shares of PC Jeweller Ltd., one of India’s leading branded jewelry makers and retailers, experienced a significant decline during the seven-month period. The Indian jewelry market has been going through a structural transition as organized retailers such as PC Jeweller gain market share from the highly fragmented mom and pop segment, thanks in part to the recent introduction of mandatory hallmarking of gold jewelry and a new general sales tax introduced in 2017. As a result, PC Jeweller’s growth began to accelerate as the company expanded its national retail footprint, which led to a strong share price rise during calendar year 2017. The last six months,
Management's Discussion of Fund Performance (Unaudited) (Continued)
however, were considerably less friendly to the company and its shareholders. Several events, which were either completely unrelated to the company or irrelevant to the value of the business, combined with some aggressive and unfounded rumor mongering by short sellers, reduced the value of the stock. We believe the company’s valuation was at the point where its implied value was no longer recognizing any value to the business beyond its inventory on hand. Research and ongoing communication with management suggested there was a fundamental disconnect between the recent share price volatility and the economic reality of the underlying business. Management continued to roll out new, mainly franchised locations and recently announced a share buyback in an effort to help restore confidence among investors.
SES is the Luxembourg-domiciled global leading provider of fixed satellite services, including video broadcasting and broadband services. The company’s share price came under pressure during the latter part of 2017 as the company failed to deliver on expectations over multiple quarters as improvements in data compression technology led to weaker than expected revenue growth. As a result, the position was sold.
Uni-Select, a Canadian-based commercial distributor of automotive parts and paint, reported inconsistent results over recent quarters. The company attributed some of the headwinds to transitory factors, but also admitted to some unfavorable evolving market dynamics, as Axalta Coating Systems, the company’s largest paint supplier in North America, announced a modification in its distribution strategy.
Among the contributors to relative performance over the seven-month period were Aveva Group PLC (Information Technology sector), Wynn Macau Ltd. (Consumer Discretionary sector) and BCA Marketplace PLC (Consumer Discretionary sector).
Aveva Group is a leading industrial software company with a strong market share in computer-aided design and product lifecycle management solutions for the process manufacturing industry. We believe the company’s recent merger with Schneider Software SE should provide unmatched end-to-end capabilities in design, simulation and operations. The market was encouraged by the potential synergies from the combination and its Internet of Things platform (IoT). In addition, the company saw a steady recovery in its key end markets on the back of higher oil prices.
Wynn Macau is the Hong Kong listed subsidiary of Wynn Resorts in Las Vegas. Shares of Wynn Macau continued their winning streak through the early part of 2018, following a stellar 2017. The recovery in the Macau gaming sector accelerated over the course of 2017 as spending on luxury and gaming among Chinese consumers gained momentum. Wynn Macau particularly benefited from the successful opening and market share gain of its high profile premium resort Wynn Palace on Macau’s Cotai Strip. The Fund’s Wynn Macau position was sold in January 2018.
BCA Marketplace operates Europe’s largest used vehicle marketplace. It has more than 50 percent share of the market in the U.K. and Germany and leading positions in many other markets across Europe. The company conducts physical and online auctions. In addition to exhibiting solid growth over the past year, its share price surged after private equity firm Apax Partners Worldwide LLC said it was considering an offer for the company.
During the seven-month period, the Fund sold six holdings and purchased five new positions. Most sales were a result of valuations that exceeded our comfort level, while a few reflected reduced confidence in the Fund’s investment theses due to deteriorating fundamentals. A couple of small positions that were received as a result of spin offs from larger holdings were also sold. Sector and country allocation remained more or less stable over the period.
Outlook
We believe politics is beginning to supplant monetary policy as the primary driver of global markets. That is not to say that monetary conditions are necessarily stable, after all, interest rates continued to rise in the U.S.
Management's Discussion of Fund Performance (Unaudited) (Continued)
and the U.S. Federal Reserve Board’s (Fed’s) balance sheet continued to slowly contract, while it appears likely that Europe will begin, cautiously at first, to wind down quantitative easing soon. Nonetheless, the massive injections of liquidity that helped propel financial markets and economic activity over the past decade are more than likely behind us now, while one political consequence of the long period of easy money, namely the radicalization of economic policy proposals, begins to make itself felt. From rising trade protectionism to the increasing resonance of outright socialism with young voters; from Brexit to the rise of Euroskeptic political parties across Europe, we believe the message is clear: the current combination of policy mix, technological change and globalization is increasingly leaving certain vulnerable citizens behind and resulting in a hollowing out of the political center. How this tension is ultimately resolved is the biggest question facing developed countries, their politicians and investors going forward.
Although some parts of the stock market, in particular the digital disruptors in Information Technology, look pricey by historical standards, a number of the stable growth businesses where we focus our efforts are trading at some of the most attractive valuations in several years. With increasing signs of slowing global growth, we believe an emphasis on high quality businesses with strong balance sheets leaves the Fund well positioned for the potential risks and opportunities ahead.
Management's Discussion of Fund Performance (Unaudited) (Continued)
Comparison of the Change in Value of a $10,000 Investment in the Touchstone
International Equity Fund - Class A* and the MSCI EAFE Index

| * | The chart above represents performance of Class A shares only, which will vary from the performance of Class C shares, Class Y shares and Institutional Class shares based on the differences in sales loads and fees paid by shareholders in the different classes. The inception date of Class A shares, Class C shares, Class Y shares and Institutional Class shares was March 1, 1993, May 4, 1998, August 27, 2007 and October 30, 2017, respectively. Class C shares, Class Y and Institutional Class shares performance information was calculated using the historical performance of Class A shares for periods prior to May 4, 1998, August 27, 2007 and October 30, 2017, respectively. The returns have been restated for sales loads and fees applicable to Class C, Class Y and Institutional Class shares. The returns of the index listed above are based on the inception date of the Fund. |
| ** | The average annual total returns shown above are adjusted for maximum sales loads and fees, if applicable. Prior to October 28, 2017, the maximum offering price per share of Class A shares was equal to the net asset value (“NAV”) per share plus a sales load equal to 5.26% of the NAV (or 5.00% of the offering price). Effective October 28, 2017, the maximum offering price per share of Class A shares is equal to the NAV per share plus a sales load equal to 6.10% of the NAV (or 5.75% of the offering price). Class C shares are subject to a contingent deferred sales charge (“CDSC”) of 1.00%. The CDSC will be assessed on an amount equal to the lesser of (1) the NAV at the time of purchase of the shares being redeemed or (2) the NAV of such shares being redeemed, if redeemed within a one-year period from the date of purchase. Class Y shares and Institutional Class shares are not subject to sales charges. |
The performance of the above Fund does not reflect the deduction of taxes that a shareholder would pay on Fund distributions or the redemption of Fund shares.
Notes to Chart
The MSCI EAFE Index is a free float-adjusted market capitalization index that is designed to measure developed market equity performance excluding the U.S. and Canada.
MSCI makes no express or implied warranties or representations and shall have no liability whatsoever with respect to any MSCI data contained herein. The MSCI data may not be further redistributed or used to create indices or financial products. This report is not approved or produced by MSCI.
Management's Discussion of Fund Performance (Unaudited)
Touchstone Large Cap Focused Fund
Sub-Advised by Fort Washington Investment Advisors, Inc.
Investment Philosophy
The Fund seeks to invest in companies of large capitalizations that are trading below what is believed to be the estimate of their intrinsic value and have a sustainable competitive advantage or a high barrier to entry in place. The barrier(s) to entry can be created through a cost advantage, economies of scale, high customer loyalty or a government barrier (e.g. license or subsidy). Fort Washington believes that the strongest barrier to entry is the combination of economies of scale and high customer loyalty.
Fund Performance
The Touchstone Large Cap Focused Fund (Class A Shares) outperformed the S&P 500® Index for the seven-month period ended June 30, 2018. The Fund’s total return was 4.74 percent (calculated excluding the maximum sales charge) while the return of its benchmark was 3.79 percent.
Market Environment
The market environment was mixed during the period. In the last quarter of 2017, U.S. equities continued the bull market that began in 2009 as the market experienced low volatility and ended the year near all-time highs. Solid financial conditions and strong profit growth were the key drivers of the market. Markets benefited from an added boost in the later stages of 2017 as the White House and Congressional Republican leaders coalesced around a plan for tax reform. In the first quarter of 2018, the major theme in the U.S. equity market was the return of volatility. The primary drivers were concerns over higher interest rates and uncertainty about trade relations. The U.S. equity market experienced the first correction of 10 percent in more than a year and ended the quarter down slightly. In the second quarter, the U.S. equity market ended slightly higher as solid earnings and elevated corporate buyback activity overshadowed ongoing trade concerns. Sectors that led the S&P 500® Index higher included Information Technology, Consumer Discretionary, and Energy. The Consumer Staples, Telecommunication Services, Real Estate, Industrials, Materials, Financials, Health Care, and Utilities sectors underperformed the benchmark during the period.
Portfolio Review
Sectors in which the Fund outperformed the benchmark included Telecommunication Services, Industrials, Health Care, Financials, Information Technology, Consumer Staples, and Real Estate. The Consumer Discretionary, Utilities, and Energy sectors were the areas where the Fund underperformed its benchmark. The cash position detracted from performance given the positive move in the S&P 500® Index during the period. Sector allocation was marginally positive to performance primarily due to the underweights to Utilities, Real Estate, Industrials, and Health Care.
Stock selection was the primary driver of the Fund’s outperformance relative to the benchmark. The three largest contributors to performance were S&P Global, Inc. (Financials sector), Boeing Co. (Industrials sector), and Visa Inc. (Information Technology sector). The three largest detractors for the period were McDonald’s Corp., Comcast Corp., and Amazon.com, Inc. (all from the Consumer Discretionary sector).
Outlook
At the mid-point of a year that has been characterized by strong economic data and corporate earnings overshadowing trade conflicts and rising interest rates, the U.S. equity market is slightly ahead of where we started the year. Our view is that the U.S. equity market is healthy and priced at fair value with the assumption that the market should achieve seven to eight percent returns going forward. We continue to monitor the most common indicators of the end of a bull market – a credit cycle, inflation, and an asset bubble. At this point, these indicators do
Management's Discussion of Fund Performance (Unaudited) (Continued)
not give us reason to get defensive. We also look for deteriorating market breadth, which is typically a hallmark of an ensuing market top. Throughout the year, market breadth readings have been solid. As a result, the Fund’s cash position remains near its historical average.
While we do not see signs of what typically causes a severe pullback, the Fund’s positioning reflects the sub-advisor’s belief that we are in the later stages of the market cycle. The team continues to look for businesses that it believes are mispriced by the market. The Fund currently emphasizes larger cap, Franchise Value businesses with higher barriers to entry.
Management's Discussion of Fund Performance (Unaudited) (Continued)
Comparison of the Change in Value of a $10,000 Investment in the Touchstone Large Cap
Focused Fund - Class A* and the S&P 500® Index

| * | The chart above represents performance of Class A shares only, which will vary from the performance of Class C shares, Class Y shares and Institutional Class shares based on the differences in sales loads and fees paid by shareholders in the different classes. The inception date of Class A shares, Class C shares, Class Y shares and Institutional Class shares was January 12, 1934, May 4, 1998, May 4, 2007 and December 23, 2014, respectively. Class C shares, Class Y shares and Institutional Class shares performance was calculated using the historical performance of Class A shares for the periods prior to May 4, 1998, May 4, 2007 and December 23, 2014, respectively. The returns have been restated for sales loads and fees applicable to Class C, Class Y and Institutional Class shares. The launch date of the S&P 500® Index was after the inception date of the Fund, therefore there is no return for inception. |
| ** | The average annual total returns shown above are adjusted for maximum sales loads and fees, if applicable. Prior to October 28, 2017, the maximum offering price per share of Class A shares was equal to the net asset value (“NAV”) per share plus a sales load equal to 5.26% of the NAV (or 5.00% of the offering price). Effective October 28, 2017, the maximum offering price per share of Class A shares is equal to the NAV per share plus a sales load equal to 6.10% of the NAV (or 5.75% of the offering price). Class C shares are subject to a contingent deferred sales charge (“CDSC”) of 1.00%. The CDSC will be assessed on an amount equal to the lesser of (1) the NAV at the time of purchase of the shares being redeemed or (2) the NAV of such shares being redeemed, if redeemed within a one-year period from the date of purchase. Class Y shares and Institutional Class shares are not subject to sales charges. |
The performance of the above Fund does not reflect the deduction of taxes that a shareholder would pay on Fund distributions or the redemption of Fund shares.
Note to Chart
S&P 500® Index is a group of 500 widely held stocks and is commonly regarded to be representative of the large capitalization stock universe.
Management's Discussion of Fund Performance (Unaudited)
Touchstone Small Company Fund
Sub-Advised by Fort Washington Investment Advisors, Inc.
Investment Philosophy
The Fund seeks to provide investors with growth of capital by investing primarily in common stocks of small companies that the sub-advisor believes are high quality, have superior business models, solid management teams, sustainable growth potential and are attractively valued.
Fund Performance
The Touchstone Small Company Fund (Class A Shares) underperformed its benchmark, the Russell 2000® Index, for the seven-month period ended June 30, 2018. The Fund’s total return was 6.89 percent (calculated excluding the maximum sales charge) while the return of the benchmark was 7.23 percent.
Market Environment
U.S. equity markets experienced solid returns for the seven-month period ended June 30, 2018. At the beginning of the period, the overall economic environment was stable and positive. We believe the primary catalyst for market gains in late 2017 was anticipation of corporate tax reform legislation, which was ultimately passed in December. The market’s upward momentum carried over to the first quarter of 2018 with the benchmark marching to all-time highs in January. However, the favorable trading conditions gave way to a significant increase in volatility in February and March and economic growth remained solid in early 2018, with continued strength in the labor market and moderate inflation levels. This positive economic environment combined with strong corporate profits re-energized markets in the second quarter of 2018.
While most sectors generated positive absolute returns during the seven-month period, value-oriented sectors generally underperformed their growth counterparts. Traditional growth sectors such as Health Care, Information Technology, and Consumer Discretionary were among the top performing are as of the market, while the value-oriented Financials sector underperformed. Bond proxies (i.e., Utilities, Real Estate, and Telecommunication Services) detracted from performance during a period in which interest rates rose sharply.
Portfolio Review
The Information Technology sector was the Fund’s largest weight on an absolute and relative basis. In a period when Information Technology was one of the benchmark’s strongest performing sectors, this positioning was beneficial to the Fund’s relative returns. Strong security selection in the sector also contributed. Technology Hardware and Equipment was an area of particular strength, with the Fund’s holdings significantly outperforming their benchmark peers. Plantronics Inc. was among the Fund’s top performers. A designer and manufacturer of phone headsets and headset accessories, Plantronics announced a pending acquisition of Polycom Inc., which will allow the company to expand into new areas such as web conferencing and desktop calling. The market recognized the strategic benefits of this acquisition and drove Plantronics’ stock price in the period.
The Fund’s stock selections in the Semiconductor space also added to relative performance. One example was ON Semiconductor Corp. We initiated this position in 2013 when the company was in the early stages of the equity investment cycle with low market expectations. Our research led us to believe that a focus on automotive and industrial end markets where semiconductor content is growing would lead to better than industry revenue growth. Additionally, we were encouraged by a number of corporate initiatives to expand margins, increase free cash flow conversion, and improve the capital structure. This long-term holding delivered positive results as the investment thesis came to fruition.
Though providing strong absolute returns, the Fund’s Software & Services positions slightly lagged the benchmark’s return for this segment of the Information Technology sector. Bottomline Technologies Inc. was among the
Management's Discussion of Fund Performance (Unaudited) (Continued)
Fund’s top performers in the group. Bottomline Technologies is a provider of business and financial software with primarily a subscription based business model. A year ago, the company was experiencing falling market expectations as the cost and time to implement large new digital banking sales were greater than anticipated. We viewed these cost and timing issues as transitory, and we believed that once implemented, they would drive higher and more consistent revenue growth and profitability levels. Consistent with our investment thesis, we believe the management team has executed well, and the stock has appreciated on higher market expectations for the company. However, not all of the Fund’s Software and Services positions met expectations. Nuance Communications Inc. was one of the more challenging positions in the fiscal period and detracted from performance. Nuance Communications provides voice and language software solutions for businesses and consumers across the Health Care, Enterprise, Automotive, and Mobile markets. The company’s IT network was impacted by a global malware incident, which resulted in lost healthcare business segment revenue and remediation costs. The company successfully resolved the issue and future bookings were not impacted. However, more recently, demand has been weak for certain components of its non-core mobile and imaging segments, causing the company to lower its organic growth targets. We have reevaluated our investment thesis and the Fund continues to hold a position in the company given its compelling industry positions (particularly in Health Care and Automotive), high margins, and strong free cash flow conversion. Lastly, we are optimistic that the newly appointed CEO will make positive changes going forward.
The Health Care sector was the Fund’s second largest weight. While the Fund’s holdings generated returns in excess of the broader small cap market, they trailed the benchmark’s Health Care sector, the best performing segment of the market for the seven months ended June 30, 2018. Nuvasive Inc., a leading provider of spine surgical products, detracted from performance. The company experienced a deceleration in revenue growth from its above market growth to rates more in line with the market over the last year, which has compressed the valuation multiple of the business. Additionally, the transition to in-source manufacturing and resulting margin improvement benefits has taken longer than anticipated. We assessed our investment thesis and the Fund continued to hold the stock. We believe that the company’s leading position in the development of minimally-disruptive spine surgical options continued to place it at the forefront of gaining market share, and that while delayed, the margin improvement initiatives will ultimately come to fruition.
Despite the broad underperformance of the Fund’s Health Care positions, there were several successes in the sector. One of the Fund’s top performing stocks in the period, Haemonetics Corp., was in the Health Care space. The company is a provider of hematology products and solutions for plasma collection, blood centers, and hospitals. The company hired a new CEO and CFO two years ago in the summer of 2016. The new leadership executed several initiatives to stabilize the business model which we believe will start to drive better revenue growth and margin improvement. Additionally, it successfully executed the FDA approval of its next generation plasma collection device and software, the NexSys PCS. This product and software materially improves plasma collection efficiencies that are expected to drive significant improvements in the company’s business model over the coming years. The stock price has positively reacted in anticipation of these expected improvements. Similarly, the recent portfolio purchase of Tactile Systems Technology Inc. contributed to performance. The company is a leader in developing at-home therapy devices that treat chronic swelling conditions such as lymphedema and chronic venous insufficiency. We believe it has the leading technology and distribution strategy in an underpenetrated industry. This is a classic small company growth stock which we believe was undervalued given the characteristics of the business model.
Mergers and acquisitions (M&A) activity remained a theme in the Fund for the period. There were five companies involved with M&A in the Information Technology sector. Microsemi Corp., a long-term semiconductor holding, was acquired by Microchip Technology Inc., and Broadsoft, a software provider to the unified communications market, was bought by Cisco Systems Inc. Additionally, three Fund positions were involved in private equity acquisitions - Barracuda Networks Inc., a security software provider; Blackhawk Network Holdings Inc., a
Management's Discussion of Fund Performance (Unaudited) (Continued)
provider of physical and digital gift cards; and VeriFone Systems Inc., a leading provider of point-of sale (POS) hardware and software. Outside of the Information Technology sector, Regal Entertainment & Consultants Ltd., a leading theater operator in the United States, was acquired by the United Kingdom’s largest theater operator. We invested in all of these companies in the early stages of their growth cycles. As the management teams executed initiatives to improve the business model, the companies became attractive targets in the later stages of the investment cycle to both strategic and financial buyers.
Outlook
The broader economic environment remains conducive to small company stocks and their earnings growth prospects. Additionally, U.S. corporate tax reform was a positive development, in the immediate form of higher earnings, and longer-term potential value creation from increased cash flows. Furthermore, it should accelerate M&A activity, which is a hallmark to investing in small company stocks, and has also been a driver of portfolio returns.
We remain focused on executing our fundamental stock selection and portfolio management process. We believe that stocks experience a four stage investment cycle and our research process is focused on the dynamics that apply to each stage of the investment cycle. We believe that excess returns and lower volatility are driven by the ability to successfully identify a stock’s current stage and the potential for it to transition to a different stage of its investment cycle.
Management's Discussion of Fund Performance (Unaudited) (Continued)
Comparison of the Change in Value of a $10,000 Investment in the Touchstone Small
Company Fund - Class A* and the Russell 2000® Index
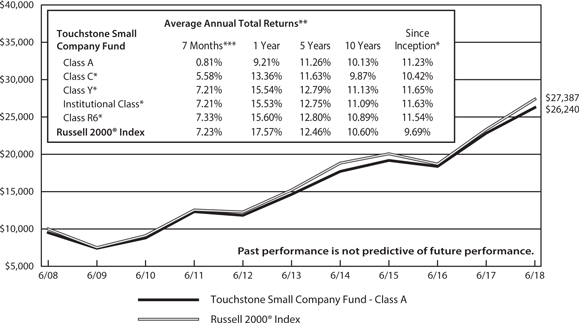
| * | The chart above represents performance of Class A shares only, which will vary from the performance of Class C shares, Class Y shares, Institutional Class shares and Class R6 shares based on the differences in sales loads and fees paid by shareholders in the different classes. The inception date of Class A shares, Class C shares, Class Y shares, Institutional Class shares and Class R6 shares was March 1, 1993, July 9, 2001, May 4, 2007, October 30, 2017 and December 23, 2014, respectively. Class C shares, Class Y shares, Institutional Class shares and Class R6 shares performance was calculated using the historical performance of Class A shares for the periods prior to July 9, 2001, May 4, 2007, October 30, 2017 and December 23, 2014, respectively. The returns have been restated for sales loads and fees applicable to Class C, Class Y, Institutional Class and Class R6 shares. The returns of the index listed above are based on the inception date of the Fund. |
| ** | The average annual total returns shown above are adjusted for maximum sales loads and fees, if applicable. Prior to October 28, 2017, the maximum offering price per share of Class A shares was equal to the net asset value (“NAV”) per share plus a sales load equal to 5.26% of the NAV (or 5.00% of the offering price). Effective October 28, 2017, the maximum offering price per share of Class A shares is equal to the NAV per share plus a sales load equal to 6.10% of the NAV (or 5.75% of the offering price). Class C shares are subject to a contingent deferred sales charge (“CDSC”) of 1.00%. The CDSC will be assessed on an amount equal to the lesser of (1) the NAV at the time of purchase of the shares being redeemed or (2) the NAV of such shares being redeemed, if redeemed within a one-year period from the date of purchase. Class Y shares, Institutional Class shares and Class R6 shares are not subject to sales charges. |
The performance of the above Fund does not reflect the deduction of taxes that a shareholder would pay on Fund distributions or the redemption of Fund shares.
Notes to Chart
Russell 2000® Index measures the performance of the small-cap segment of the U.S. equity universe.
The Frank Russell Company (FRC) is the source and owner of the data contained or reflected in this material and all trademarks and copyrights related thereto. The material may contain confidential information and unauthorized use, disclosure, copying, dissemination or redistribution is strictly prohibited. This is a Touchstone Investments presentation of the data, and FRC is not responsible for the formatting or configuration of this material or for any inaccuracy in the presentation thereof.
This page intentionally left blank.
Tabular Presentation of Portfolios of Investments (Unaudited)
June 30, 2018
The tables below provide each Fund’s geographic allocation, credit quality and/or sector allocation. We hope it will be useful to shareholders as it summarizes key information about each Fund’s investments.
| Touchstone Balanced Fund | | | |
| Credit Quality* | | (% of Fixed Income Securities) | |
| AAA/Aaa | | | 52.1 | % |
| AA/Aa | | | 4.0 | |
| A/A | | | 13.5 | |
| BBB/Baa | | | 27.9 | |
| BB/Ba | | | 1.0 | |
| Not Rated | | | 1.5 | |
| | | | 100.0 | % |
| Sector Allocation** | | (% of Net Assets) | |
| Fixed Income Securities | | | 28.7 | % |
| Common Stocks | | | | |
| Information Technology | | | 17.5 | |
| Health Care | | | 10.5 | |
| Financials | | | 9.8 | |
| Consumer Discretionary | | | 8.8 | |
| Industrials | | | 7.1 | |
| Consumer Staples | | | 5.5 | |
| Energy | | | 4.6 | |
| Telecommunication Services | | | 1.5 | |
| Materials | | | 1.4 | |
| Real Estate | | | 0.8 | |
| Exchange-Traded Funds | | | 2.2 | |
| Preferred Stock | | | 0.0 | |
| Short-Term Investment Fund | | | 1.5 | |
| Other Assets/Liabilities (Net) | | | 0.1 | |
| Total | | | 100.0 | % |
| Touchstone International Equity Fund | | | |
| Geographic Allocation | | (% of Net Assets) | |
| Common Stocks | | | | |
| United Kingdom | | | 30.0 | % |
| France | | | 8.7 | |
| Switzerland | | | 7.7 | |
| Canada | | | 6.3 | |
| Germany | | | 5.7 | |
| Ireland | | | 5.1 | |
| India | | | 4.3 | |
| Japan | | | 3.8 | |
| China | | | 3.1 | |
| Spain | | | 2.8 | |
| Denmark | | | 2.5 | |
| Netherlands | | | 2.3 | |
| Mexico | | | 2.3 | |
| Greece | | | 2.3 | |
| South Korea | | | 1.7 | |
| United States | | | 1.6 | |
| Australia | | | 1.5 | |
| Jersey | | | 1.4 | |
| Short-Term Investment Funds | | | 9.5 | |
| Other Assets/Liabilities (Net) | | | (2.6 | ) |
| Total | | | 100.0 | % |
| * | Credit quality ratings are from Standard & Poor's (“S&P”) and Moody's Investors Service (“Moody's”). If agency ratings differ, the higher rating will be used. Where no rating has been assigned, it may be for reasons unrelated to the creditworthiness of the issuer. |
| ** | Sector classifications are based upon the Global Industry Classification Standard (GICS®). |
Tabular Presentation of Portfolios of Investments (Unaudited) (Continued)
| Touchstone Large Cap Focused Fund | | | |
| Sector Allocation* | | (% of Net Assets) | |
| Information Technology | | | 25.6 | % |
| Financials | | | 14.3 | |
| Consumer Discretionary | | | 13.3 | |
| Health Care | | | 13.0 | |
| Consumer Staples | | | 8.4 | |
| Industrials | | | 8.2 | |
| Energy | | | 6.9 | |
| Telecommunication Services | | | 2.2 | |
| Materials | | | 1.8 | |
| Real Estate | | | 1.3 | |
| Exchange-Traded Funds | | | 4.8 | |
| Short-Term Investment Fund | | | 0.6 | |
| Other Assets/Liabilities (Net) | | | (0.4 | ) |
| Total | | | 100.0 | % |
| Touchstone Small Company Fund | | | |
| Sector Allocation* | | (% of Net Assets) | |
| Information Technology | | | 25.3 | % |
| Industrials | | | 19.6 | |
| Health Care | | | 19.1 | |
| Consumer Discretionary | | | 12.6 | |
| Financials | | | 10.8 | |
| Real Estate | | | 3.3 | |
| Energy | | | 1.5 | |
| Consumer Staples | | | 1.4 | |
| Telecommunication Services | | | 1.4 | |
| Materials | | | 1.3 | |
| Short-Term Investment Fund | | | 4.0 | |
| Other Assets/Liabilities (Net) | | | (0.3 | ) |
| Total | | | 100.0 | % |
| * | Sector classifications are based upon the Global Industry Classification Standard (GICS®). |
Portfolio of Investments
Touchstone Balanced Fund – June 30, 2018
| | | | | | Market | |
| | | Shares | | | Value | |
| | | | | | | |
| Common Stocks — 67.5% | | | | | | | | |
| | | | | | | | | |
| Information Technology — 17.5% | | | | | | | | |
| Accenture PLC (Ireland) - Class A | | | 30,000 | | | $ | 4,907,700 | |
| Alphabet, Inc. - Class C* | | | 6,000 | | | | 6,693,900 | |
| Apple, Inc. | | | 48,000 | | | | 8,885,280 | |
| Check Point Software Technologies Ltd. (Israel)* | | | 20,000 | | | | 1,953,600 | |
| Facebook, Inc. - Class A* | | | 17,266 | | | | 3,355,129 | |
| Microsoft Corp. | | | 123,000 | | | | 12,129,030 | |
| Synopsys, Inc.* | | | 30,000 | | | | 2,567,100 | |
| Texas Instruments, Inc. | | | 60,000 | | | | 6,615,000 | |
| Visa, Inc. - Class A | | | 53,000 | | | | 7,019,850 | |
| | | | | | | | 54,126,589 | |
| | | | | | | | | |
| Health Care — 10.5% | | | | | | | | |
| AmerisourceBergen Corp. | | | 23,954 | | | | 2,042,558 | |
| Amgen, Inc. | | | 15,000 | | | | 2,768,850 | |
| Becton Dickinson and Co. | | | 13,000 | | | | 3,114,280 | |
| Biogen, Inc.* | | | 5,000 | | | | 1,451,200 | |
| Bristol-Myers Squibb Co. | | | 45,000 | | | | 2,490,300 | |
| CVS Health Corp. | | | 10,000 | | | | 643,500 | |
| Johnson & Johnson | | | 23,000 | | | | 2,790,820 | |
| Merck & Co., Inc. | | | 70,000 | | | | 4,249,000 | |
| Novartis AG (Switzerland) ADR | | | 28,756 | | | | 2,172,228 | |
| Stryker Corp. | | | 15,000 | | | | 2,532,900 | |
| UnitedHealth Group, Inc. | | | 20,000 | | | | 4,906,800 | |
| Zoetis, Inc. | | | 40,000 | | | | 3,407,600 | |
| | | | | | | | 32,570,036 | |
| | | | | | | | | |
| Financials — 9.8% | | | | | | | | |
| American Express Co. | | | 25,000 | | | | 2,450,000 | |
| Chubb Ltd. (Switzerland) | | | 20,000 | | | | 2,540,400 | |
| CME Group, Inc. | | | 18,000 | | | | 2,950,560 | |
| JPMorgan Chase & Co. | | | 39,000 | | | | 4,063,800 | |
| Morgan Stanley | | | 100,000 | | | | 4,740,000 | |
| PNC Financial Services Group, Inc. (The) | | | 27,000 | | | | 3,647,700 | |
| S&P Global, Inc. | | | 20,000 | | | | 4,077,800 | |
| Signature Bank/NewYork NY* | | | 17,239 | | | | 2,204,523 | |
| Travelers Cos., Inc. (The) | | | 30,000 | | | | 3,670,200 | |
| | | | | | | | 30,344,983 | |
| | | | | | | | | |
| Consumer Discretionary — 8.8% | | | | | | | | |
| Amazon.com, Inc.* | | | 1,000 | | | | 1,699,800 | |
| Carnival Corp. | | | 8,592 | | | | 492,408 | |
| Comcast Corp. - Class A | | | 120,000 | | | | 3,937,200 | |
| Home Depot, Inc. (The) | | | 15,000 | | | | 2,926,500 | |
| JD.com, Inc. (China) ADR* | | | 52,764 | | | | 2,055,158 | |
| Marriott International, Inc. - Class A | | | 31,100 | | | | 3,937,260 | |
| McDonald's Corp. | | | 33,000 | | | | 5,170,770 | |
| Omnicom Group, Inc. | | | 31,000 | | | | 2,364,370 | |
| Starbucks Corp. | | | 9,643 | | | | 471,061 | |
| TJX Cos., Inc. (The) | | | 45,000 | | | | 4,283,100 | |
| | | | | | | | 27,337,627 | |
| | | | | | | | | |
| Industrials — 7.1% | | | | | | | | |
| Boeing Co. (The) | | | 20,000 | | | | 6,710,200 | |
| Canadian National Railway Co. (Canada) | | | 32,000 | | | | 2,616,000 | |
| General Dynamics Corp. | | | 14,000 | | | | 2,609,740 | |
| Honeywell International, Inc. | | | 35,000 | | | | 5,041,750 | |
| United Technologies Corp. | | | 22,000 | | | | 2,750,660 | |
| Verisk Analytics, Inc.* | | | 20,000 | | | | 2,152,800 | |
| | | | | | | | 21,881,150 | |
| | | | | | | | | |
| Consumer Staples — 5.5% | | | | | | | | |
| Kraft Heinz Co. (The) | | | 30,000 | | | | 1,884,600 | |
| Monster Beverage Corp.* | | | 9,714 | | | | 556,612 | |
| PepsiCo, Inc. | | | 40,000 | | | | 4,354,800 | |
| Philip Morris International, Inc. | | | 40,000 | | | | 3,229,600 | |
| Procter & Gamble Co. (The) | | | 40,000 | | | | 3,122,400 | |
| Unilever NV (United Kingdom) | | | 70,000 | | | | 3,900,400 | |
| | | | | | | | 17,048,412 | |
| | | | | | | | | |
| Energy — 4.6% | | | | | | | | |
| Chevron Corp. | | | 20,000 | | | | 2,528,600 | |
| EOG Resources, Inc. | | | 25,000 | | | | 3,110,750 | |
| Exxon Mobil Corp. | | | 38,000 | | | | 3,143,740 | |
| Marathon Petroleum Corp. | | | 40,000 | | | | 2,806,400 | |
| Schlumberger Ltd. | | | 37,700 | | | | 2,527,031 | |
| | | | | | | | 14,116,521 | |
| | | | | | | | | |
| Telecommunication Services — 1.5% | | | | | | | | |
| AT&T, Inc. | | | 28,740 | | | | 922,841 | |
| Verizon Communications, Inc. | | | 75,000 | | | | 3,773,250 | |
| | | | | | | | 4,696,091 | |
| | | | | | | | | |
| Materials — 1.4% | | | | | | | | |
| DowDuPont, Inc. | | | 38,460 | | | | 2,535,283 | |
| Praxair, Inc. | | | 12,000 | | | | 1,897,800 | |
| | | | | | | | 4,433,083 | |
| | | | | | | | | |
| Real Estate — 0.8% | | | | | | | | |
| Jones Lang LaSalle, Inc. | | | 7,564 | | | | 1,255,548 | |
| Simon Property Group, Inc. REIT | | | 6,587 | | | | 1,121,042 | |
| | | | | | | | 2,376,590 | |
| Total Common Stocks | | | | | | $ | 208,931,082 | |
| Principal | | | | |
| Amount | | | | |
| | | | | |
| | | | | Corporate Bonds — 12.5% | | | | |
| | | | | | | | | |
| | | | | Financials — 3.6% | | | | |
| $ | 440,000 | | | American Express Co., | | | | |
| | | | | 3.000%, 10/30/24 | | | 419,826 | |
| | 355,000 | | | Bank of America Corp., | | | | |
| | | | | 3.705%, 4/24/28 | | | 342,373 | |
| | 535,000 | | | Bank of America Corp. MTN, | | | | |
| | | | | 4.000%, 1/22/25 | | | 528,127 | |
| | 390,000 | | | Bank of Montreal (Canada), | | | | |
| | | | | 3.803%, 12/15/32 | | | 361,261 | |
| | 449,000 | | | Bank of New York Mellon Corp. (The) | | | | |
| | | | | MTN, 2.950%, 1/29/23 | | | 438,829 | |
Touchstone Balanced Fund (Continued)
| Principal | | | | | Market | |
| Amount | | | | | Value | |
| | | | | | | |
| | | | | Corporate Bonds — 12.5% (Continued) | | | | |
| | | | | | | | | |
| | | | | Financials — (Continued) | | | | |
| $ | 435,000 | | | Barclays PLC (United Kingdom), | | | | |
| | | | | 3.250%, 1/12/21 | | $ | 428,769 | |
| | 380,000 | | | BB&T Corp. MTN, 2.850%, 10/26/24 | | | 360,559 | |
| | 217,000 | | | Chubb INA Holdings, Inc., | | | | |
| | | | | 4.350%, 11/3/45 | | | 222,088 | |
| | 330,000 | | | Citigroup, Inc., 3.300%, 4/27/25 | | | 316,387 | |
| | 197,000 | | | Citigroup, Inc., 4.750%, 5/18/46 | | | 187,332 | |
| | 305,000 | | | Credit Suisse AG/New York NY | | | | |
| | | | | (Switzerland) MTN, 3.625%, 9/9/24 | | | 299,902 | |
| | 345,000 | | | Fifth Third Bancorp, 2.875%, 7/27/20 | | | 343,059 | |
| | 385,000 | | | General Motors Financial Co., Inc., | | | | |
| | | | | 3.200%, 7/13/20 | | | 383,184 | |
| | 440,000 | | | Goldman Sachs Group, Inc. (The), (3M | | | | |
| | | | | LIBOR +1.000%), 3.359%, 7/24/23(A) | | | 441,608 | |
| | 150,000 | | | Goldman Sachs Group, Inc. (The), | | | | |
| | | | | 3.691%, 6/5/28 | | | 142,197 | |
| | 350,000 | | | Goldman Sachs Group, Inc. (The), | | | | |
| | | | | 5.250%, 7/27/21 | | | 367,826 | |
| | 335,000 | | | HSBC Holdings PLC (United Kingdom), | | | | |
| | | | | 3.900%, 5/25/26 | | | 327,573 | |
| | 562,000 | | | Huntington Bancshares, Inc., | | | | |
| | | | | 4.000%, 5/15/25 | | | 563,649 | |
| | 350,000 | | | JPMorgan Chase & Co., (3M LIBOR | | | | |
| | | | | +0.730%), 3.092%, 4/23/24(A) | | | 348,189 | |
| | 270,000 | | | JPMorgan Chase & Co., | | | | |
| | | | | 3.250%, 9/23/22 | | | 267,497 | |
| | 425,000 | | | JPMorgan Chase & Co., | | | | |
| | | | | 3.509%, 1/23/29 | | | 402,668 | |
| | 416,000 | | | Lloyds Banking Group PLC (United | | | | |
| | | | | Kingdom), 3.574%, 11/7/28 | | | 383,814 | |
| | 148,000 | | | Morgan Stanley, 3.737%, 4/24/24 | | | 147,112 | |
| | 470,000 | | | Morgan Stanley, 3.950%, 4/23/27 | | | 448,047 | |
| | 232,000 | | | New York Life Global Funding, 144a, | | | | |
| | | | | 3.000%, 1/10/28 | | | 217,617 | |
| | 300,000 | | | Northwestern Mutual Life Insurance | | | | |
| | | | | Co. (The), 144a, 3.850%, 9/30/47 | | | 274,707 | |
| | 370,000 | | | PNC Bank NA, 2.700%, 11/1/22 | | | 355,673 | |
| | 339,000 | | | Prudential Financial, Inc., | | | | |
| | | | | 5.625%, 6/15/43 | | | 349,594 | |
| | 434,000 | | | Royal Bank of Canada (Canada) MTN, | | | | |
| | | | | 3.200%, 4/30/21 | | | 433,813 | |
| | 380,000 | | | SunTrust Banks, Inc., 4.000%, 5/1/25 | | | 381,811 | |
| | 285,000 | | | Wells Fargo & Co., 2.100%, 7/26/21 | | | 273,849 | |
| | 270,000 | | | Wells Fargo & Co., 4.125%, 8/15/23 | | | 271,460 | |
| | 63,000 | | | Wells Fargo & Co. MTN, 4.100%, 6/3/26 | | | 61,734 | |
| | | | | | | | 11,092,134 | |
| | | | | | | | | |
| | | | | Energy — 1.4% | | | | |
| | 224,000 | | | Boardwalk Pipelines LP, | | | | |
| | | | | 4.450%, 7/15/27 | | | 217,508 | |
| | 333,000 | | | Cenovus Energy, Inc. (Canada), | | | | |
| | | | | 4.250%, 4/15/27 | | | 320,744 | |
| | 301,000 | | | Columbia Pipeline Group, Inc., | | | | |
| | | | | 4.500%, 6/1/25 | | | 300,309 | |
| | 266,000 | | | Concho Resources, Inc., | | | | |
| | | | | 3.750%, 10/1/27 | | | 255,877 | |
| | 418,000 | | | Enbridge, Inc. (Canada), (3M LIBOR | | | | |
| | | | | +0.700%), 3.041%, 6/15/20(A) | | | 419,635 | |
| | 243,000 | | | Energy Transfer Partners LP, | | | | |
| | | | | 4.950%, 6/15/28 | | | 242,245 | |
| | 264,000 | | | EOG Resources, Inc., 3.900%, 4/1/35 | | | 256,126 | |
| | 440,000 | | | Kinder Morgan Energy Partners LP, | | | | |
| | | | | 3.500%, 9/1/23 | | | 427,535 | |
| | 106,000 | | | Midcontinent Express Pipeline LLC, | | | | |
| | | | | 144a, 6.700%, 9/15/19 | | | 109,127 | |
| | 89,000 | | | NGPL PipeCo LLC, 144a, | | | | |
| | | | | 7.768%, 12/15/37 | | | 104,575 | |
| | 307,000 | | | Petroleos Mexicanos (Mexico), | | | | |
| | | | | 4.500%, 1/23/26 | | | 288,027 | |
| | 53,000 | | | Petroleos Mexicanos (Mexico), 144a, | | | | |
| | | | | 5.350%, 2/12/28 | | | 50,180 | |
| | 345,000 | | | Sabine Pass Liquefaction LLC, | | | | |
| | | | | 5.000%, 3/15/27 | | | 350,585 | |
| | 100,000 | | | Shell International Finance BV | | | | |
| | | | | (Netherlands), 1.875%, 5/10/21 | | | 96,948 | |
| | 286,000 | | | Valero Energy Corp., 4.350%, 6/1/28 | | | 284,735 | |
| | 526,000 | | | Williams Cos., Inc. (The), | | | | |
| | | | | 3.700%, 1/15/23 | | | 508,905 | |
| | | | | | | | 4,233,061 | |
| | | | | | | | | |
| | | | | Health Care — 1.2% | | | | |
| | 202,000 | | | Abbott Laboratories, | | | | |
| | | | | 3.750%, 11/30/26 | | | 198,550 | |
| | 365,000 | | | AbbVie, Inc., 4.450%, 5/14/46 | | | 349,032 | |
| | 260,000 | | | Allergan Funding SCS (Luxembourg), | | | | |
| | | | | 3.800%, 3/15/25 | | | 252,472 | |
| | 322,000 | | | Allergan Sales LLC, 144a, | | | | |
| | | | | 5.000%, 12/15/21 | | | 333,156 | |
| | 299,000 | | | Celgene Corp., 5.000%, 8/15/45 | | | 292,778 | |
| | 475,000 | | | CVS Health Corp., 4.300%, 3/25/28 | | | 468,544 | |
| | 230,000 | | | CVS Health Corp., 5.125%, 7/20/45 | | | 233,054 | |
| | 327,000 | | | Express Scripts Holding Co., | | | | |
| | | | | 3.300%, 2/25/21 | | | 325,801 | |
| | 270,000 | | | Thermo Fisher Scientific, Inc., | | | | |
| | | | | 3.600%, 8/15/21 | | | 271,474 | |
| | 442,000 | | | UnitedHealth Group, Inc., | | | | |
| | | | | 2.375%, 10/15/22 | | | 424,985 | |
| | 287,000 | | | Zimmer Biomet Holdings, Inc., | | | | |
| | | | | 3.150%, 4/1/22 | | | 281,748 | |
| | 26,000 | | | Zimmer Biomet Holdings, Inc., | | | | |
| | | | | 3.375%, 11/30/21 | | | 25,793 | |
| | 139,000 | | | Zoetis, Inc., 3.250%, 2/1/23 | | | 136,856 | |
| | | | | | | | 3,594,243 | |
| | | | | | | | | |
| | | | | Telecommunication Services — 1.1% | | | | |
| | 552,000 | | | AT&T, Inc., 3.800%, 3/15/22 | | | 552,942 | |
| | 88,000 | | | AT&T, Inc., 4.350%, 6/15/45 | | | 74,548 | |
| | 410,000 | | | Booking Holdings, Inc., 3.600%, 6/1/26 | | | 398,974 | |
| | 368,000 | | | Charter Communications Operating | | | | |
| | | | | LLC / Charter Communications | | | | |
| | | | | Operating Capital, | | | | |
| | | | | 6.484%, 10/23/45 | | | 387,885 | |
| | 367,000 | | | Comcast Corp., 2.850%, 1/15/23 | | | 354,860 | |
Touchstone Balanced Fund (Continued)
| Principal | | | | | Market | |
| Amount | | | | | Value | |
| | | | | | | |
| | | | | Corporate Bonds — 12.5% (Continued) | | | | |
| | | | | | | | | |
| | | | | Telecommunication Services — (Continued) | | | | |
| $ | 232,000 | | | Comcast Corp., 4.000%, 3/1/48 | | $ | 204,396 | |
| | 465,000 | | | Qwest Corp., 6.750%, 12/1/21 | | | 494,808 | |
| | 426,000 | | | Telecom Italia SpA/Milano (Italy), | | | | |
| | | | | 144a, 5.303%, 5/30/24 | | | 420,142 | |
| | 130,000 | | | Verizon Communications, Inc., | | | | |
| | | | | 4.672%, 3/15/55 | | | 115,458 | |
| | 285,000 | | | Verizon Communications, Inc., | | | | |
| | | | | 5.012%, 4/15/49 | | | 277,548 | |
| | 287,000 | | | Warner Media LLC, 3.800%, 2/15/27 | | | 271,035 | |
| | | | | | | | 3,552,596 | |
| | | | | | | | | |
| | | | | Consumer Discretionary — 1.1% | | | | |
| | 380,000 | | | Anheuser-Busch InBev Finance, Inc., | | | | |
| | | | | 4.900%, 2/1/46 | | | 390,784 | |
| | 105,000 | | | Aptiv PLC (Jersey), 3.150%, 11/19/20 | | | 104,238 | |
| | 89,000 | | | AutoNation, Inc., 5.500%, 2/1/20 | | | 91,646 | |
| | 658,000 | | | BMW US Capital LLC, 144a, | | | | |
| | | | | 3.100%, 4/12/21 | | | 653,894 | |
| | 434,000 | | | Dollar Tree, Inc., (3M LIBOR +0.700%), | | | | |
| | | | | 3.055%, 4/17/20(A) | | | 434,887 | |
| | 235,000 | | | Ford Motor Co., 4.750%, 1/15/43 | | | 203,114 | |
| | 434,000 | | | Ford Motor Credit Co. LLC, | | | | |
| | | | | 4.140%, 2/15/23 | | | 433,855 | |
| | 150,000 | | | General Motors Financial Co., Inc., | | | | |
| | | | | 3.950%, 4/13/24 | | | 146,791 | |
| | 279,000 | | | General Motors Financial Co., Inc., | | | | |
| | | | | 4.350%, 4/9/25 | | | 274,998 | |
| | 285,000 | | | Home Depot, Inc. (The), | | | | |
| | | | | 5.950%, 4/1/41 | | | 351,929 | |
| | 434,000 | | | Toyota Motor Credit Corp. MTN, | | | | |
| | | | | 2.950%, 4/13/21 | | | 431,763 | |
| | | | | | | | 3,517,899 | |
| | | | | | | | | |
| | | | | Consumer Staples — 0.9% | | | | |
| | 438,000 | | | Cargill, Inc., 144a, 3.050%, 4/19/21 | | | 435,629 | |
| | 205,000 | | | General Mills, Inc., 3.200%, 4/16/21 | | | 203,937 | |
| | 380,000 | | | Grupo Bimbo SAB de CV (Mexico), | | | | |
| | | | | 144a, 4.500%, 1/25/22 | | | 387,823 | |
| | 475,000 | | | Imperial Brands Finance PLC (United | | | | |
| | | | | Kingdom), 144a, 4.250%, 7/21/25 | | | 472,828 | |
| | 255,000 | | | Kraft Heinz Foods Co., 6.875%, 1/26/39 | | | 300,660 | |
| | 140,000 | | | Kroger Co. (The), 5.000%, 4/15/42 | | | 138,021 | |
| | 244,000 | | | Mondelez International, Inc., | | | | |
| | | | | 4.125%, 5/7/28 | | | 241,915 | |
| | 374,000 | | | Moody's Corp., 2.750%, 12/15/21 | | | 365,279 | |
| | 351,000 | | | Reynolds American, Inc., | | | | |
| | | | | 4.450%, 6/12/25 | | | 353,248 | |
| | | | | | | | 2,899,340 | |
| | | | | | | | | |
| | | | | Real Estate — 0.9% | | | | |
| | 390,000 | | | Boston Properties LP REIT, | | | | |
| | | | | 3.200%, 1/15/25 | | | 371,199 | |
| | 403,000 | | | Crown Castle International Corp. REIT, | | | | |
| | | | | 3.650%, 9/1/27 | | | 374,853 | |
| | 260,000 | | | Digital Realty Trust LP, REIT, | | | | |
| | | | | 2.750%, 2/1/23 | | | 247,651 | |
| | 288,000 | | | Mid-America Apartments LP, REIT, | | | | |
| | | | | 3.750%, 6/15/24 | | | 284,031 | |
| | 149,000 | | | Sabra Health Care LP. REIT, | | | | |
| | | | | 5.125%, 8/15/26 | | | 142,373 | |
| | 110,000 | | | SL Green Operating Partnership LP | | | | |
| | | | | REIT, 3.250%, 10/15/22 | | | 106,894 | |
| | 795,000 | | | VEREIT Operating Partnership LP REIT, | | | | |
| | | | | 4.600%, 2/6/24 | | | 795,295 | |
| | 309,000 | | | Welltower, Inc. REIT, 4.250%, 4/1/26 | | | 305,739 | |
| | | | | | | | 2,628,035 | |
| | | | | | | | | |
| | | | | Information Technology — 0.8% | | | | |
| | 105,000 | | | Activision Blizzard, Inc., 144a, | | | | |
| | | | | 6.125%, 9/15/23 | | | 108,792 | |
| | 899,000 | | | Apple, Inc., 2.750%, 1/13/25 | | | 860,424 | |
| | 110,000 | | | Apple, Inc., 4.650%, 2/23/46 | | | 118,503 | |
| | 235,000 | | | Dell International LLC / EMC Corp., | | | | |
| | | | | 144a, 6.020%, 6/15/26 | | | 246,842 | |
| | 210,000 | | | Microsoft Corp., 3.500%, 2/12/35 | | | 203,489 | |
| | 351,000 | | | Oracle Corp., 2.650%, 7/15/26 | | | 323,704 | |
| | 340,000 | | | QUALCOMM, Inc., 3.450%, 5/20/25 | | | 327,194 | |
| | 297,000 | | | Visa, Inc., 4.150%, 12/14/35 | | | 307,745 | |
| | | | | | | | 2,496,693 | |
| | | | | | | | | |
| | | | | Industrials — 0.8% | | | | |
| | 106,544 | | | Air Canada 2015-1 Class A Pass | | | | |
| | | | | Through Trust (Canada), 144a, | | | | |
| | | | | 3.600%, 3/15/27 | | | 103,103 | |
| | 418,000 | | | Burlington Northern Santa Fe LLC, | | | | |
| | | | | 5.750%, 5/1/40 | | | 495,285 | |
| | 370,000 | | | CRH America Finance, Inc., 144a, | | | | |
| | | | | 4.500%, 4/4/48 | | | 347,088 | |
| | 377,000 | | | Eagle Materials, Inc., 4.500%, 8/1/26 | | | 378,750 | |
| | 280,000 | | | FedEx Corp., 5.100%, 1/15/44 | | | 293,556 | |
| | 395,000 | | | General Electric Co., 4.125%, 10/9/42 | | | 366,858 | |
| | 330,000 | | | Vulcan Materials Co., 4.500%, 4/1/25 | | | 331,629 | |
| | | | | | | | 2,316,269 | |
| | | | | | | | | |
| | | | | Utilities — 0.4% | | | | |
| | 398,000 | | | Dominion Energy, Inc., | | | | |
| | | | | 2.000%, 8/15/21 | | | 379,493 | |
| | 237,000 | | | Duke Energy Progress LLC, | | | | |
| | | | | 4.150%, 12/1/44 | | | 233,892 | |
| | 329,000 | | | Fortis, Inc. (Canada), 3.055%, 10/4/26 | | | 299,753 | |
| | 250,000 | | | NextEra Energy Capital Holdings, Inc., | | | | |
| | | | | 2.800%, 1/15/23 | | | 241,673 | |
| | 76,000 | | | Oncor Electric Delivery Co. LLC, | | | | |
| | | | | 3.800%, 9/30/47 | | | 72,619 | |
| | 125,000 | | | PacifiCorp., 5.750%, 4/1/37 | | | 150,270 | |
| | | | | | | | 1,377,700 | |
| | | | | | | | | |
| | | | | Materials — 0.3% | | | | |
| | 250,000 | | | Braskem America Finance Co., 144a, | | | | |
| | | | | 7.125%, 7/22/41 | | | 280,000 | |
| | 66,000 | | | Newcrest Finance Pty Ltd. (Australia), | | | | |
| | | | | 144a, 4.200%, 10/1/22 | | | 66,073 | |
Touchstone Balanced Fund (Continued)
| Principal | | | | | Market | |
| Amount | | | | | Value | |
| | | | | | | |
| | | | | Corporate Bonds — 12.5% (Continued) | | | | |
| | | | | | | | | |
| | | | | Materials — (Continued) | | | | |
| $ | 121,000 | | | Newcrest Finance Pty Ltd. (Australia), | | | | |
| | | | | 144a, 4.450%, 11/15/21 | | $ | 122,558 | |
| | 470,000 | | | Suzano Austria GmbH (Austria), 144a, | | | | |
| | | | | 5.750%, 7/14/26 | | | 475,452 | |
| | | | | | | | 944,083 | |
| | | | | Total Corporate Bonds | | $ | 38,652,053 | |
| | | | | | | | | |
| | | | | U.S. Government Mortgage-Backed | | | | |
| | | | | Obligations — 7.9% | | | | |
| | 3,984 | | | FHLMC, Pool #G08062, 5.000%, 6/1/35 | | | 4,252 | |
| | 629,782 | | | FHLMC, Pool #G08637, 4.000%, 4/1/45 | | | 644,538 | |
| | 770 | | | FHLMC, Pool #G18091, | | | | |
| | | | | 6.000%, 12/1/20 | | | 783 | |
| | 14,192 | | | FHLMC, Pool #P00020, | | | | |
| | | | | 6.500%, 10/1/22 | | | 14,285 | |
| | 2,587,788 | | | FHLMC, Pool #Q02664, 4.500%, 8/1/41 | | | 2,720,130 | |
| | 3,617,927 | | | FHLMC, Pool #Q29056, | | | | |
| | | | | 4.000%, 10/1/44 | | | 3,702,354 | |
| | 1,777,847 | | | FHLMC, Pool #Q29260, | | | | |
| | | | | 4.000%, 10/1/44 | | | 1,819,396 | |
| | 1,305,229 | | | FHLMC REMIC, Ser 3859 Class JB, | | | | |
| | | | | 5.000%, 5/15/41 | | | 1,400,806 | |
| | 170 | | | FNMA, Pool #254907, 5.000%, 10/1/18 | | | 173 | |
| | 1,113 | | | FNMA, Pool #255273, 4.500%, 6/1/19 | | | 1,121 | |
| | 358 | | | FNMA, Pool #255358, 5.000%, 9/1/19 | | | 364 | |
| | 33 | | | FNMA, Pool #687301, 6.000%, 11/1/32 | | | 36 | |
| | 1,247 | | | FNMA, Pool #690305, 5.500%, 3/1/33 | | | 1,337 | |
| | 740,391 | | | FNMA, Pool #725423, 5.500%, 5/1/34 | | | 805,406 | |
| | 690,881 | | | FNMA, Pool #725610, 5.500%, 7/1/34 | | | 751,595 | |
| | 91,327 | | | FNMA, Pool #748895, 6.000%, 12/1/33 | | | 96,395 | |
| | 378,822 | | | FNMA, Pool #AD9193, 5.000%, 9/1/40 | | | 405,595 | |
| | 802,889 | | | FNMA, Pool #AH8925, 4.500%, 3/1/41 | | | 844,101 | |
| | 1,017,676 | | | FNMA, Pool #AL2860, 3.000%, 12/1/42 | | | 995,088 | |
| | 460,499 | | | FNMA, Pool #AL5718, 3.500%, 9/1/44 | | | 460,924 | |
| | 668,267 | | | FNMA, Pool #AR9195, 3.000%, 3/1/43 | | | 653,204 | |
| | 1,224,380 | | | FNMA, Pool #AS4707, 3.500%, 4/1/45 | | | 1,222,603 | |
| | 1,565,190 | | | FNMA, Pool #AS8703, 2.500%, 2/1/32 | | | 1,521,959 | |
| | 1,977,887 | | | FNMA, Pool #AZ7347, 3.000%, 11/1/45 | | | 1,921,730 | |
| | 2,061,942 | | | FNMA, Pool #BC1809, 3.500%, 5/1/46 | | | 2,058,417 | |
| | 1,302,651 | | | GNMA, Pool #5175, 4.500%, 9/20/41 | | | 1,370,447 | |
| | 750,000 | | | GNMA, Ser 2010-169, Class AW, | | | | |
| | | | | 4.500%, 12/20/40 | | | 776,752 | |
| | 7,498,929 | | | GNMA, Ser 2012-147, Class IO, | | | | |
| | | | | 0.564%, 4/16/54(A)(B)(C) | | | 267,211 | |
| | | | | Total U.S. Government | | | | |
| | | | | Mortgage-Backed Obligations | | $ | 24,461,002 | |
| | | | U.S. Treasury Obligations — 5.5% | | | |
| | 1,790,000 | | | U.S. Treasury Bond, 3.000%, 2/15/48 | | | 1,796,013 | |
| | 2,565,000 | | | U.S. Treasury Note, 2.000%, 10/31/22 | | | 2,490,555 | |
| | 1,095,000 | | | U.S. Treasury Note, 2.500%, 5/31/20 | | | 1,094,487 | |
| | 5,185,000 | | | U.S. Treasury Note, 2.500%, 3/31/23 | | | 5,133,150 | |
| | 6,530,000 | | | U.S. Treasury Note, 2.875%, 5/15/28 | | | 6,543,009 | |
| | | | | Total U.S. Treasury Obligations | | $ | 17,057,214 | |
| | | | | | Market | |
| | | Shares | | | Value | |
| | | | | | | |
| Exchange-Traded Funds — 2.2% | | | | | | | | |
| iShares JP Morgan USD Emerging | | | | | | | | |
| Markets Bond ETF | | | 49,202 | | | $ | 5,253,298 | |
| SPDR S&P MidCap 400 ETF Trust | | | 4,300 | | | | 1,526,586 | |
| Total Exchange-Traded Funds | | | | | | $ | 6,779,884 | |
Principal
Amount | | | | | | |
| | | | | | | |
| | | | | Non-Agency Collateralized Mortgage | | | | |
| | | | | Obligations — 1.0% | | | | |
| $ | 788,097 | | | Agate Bay Mortgage Trust, Ser 2015-7, | | | | |
| | | | | Class B1, 144a, | | | | |
| | | | | 3.765%, 10/25/45(A)(C) | | | 784,835 | |
| | 788,732 | | | CSMC Trust, Ser 2015-1, Class B3, 144a, | | | | |
| | | | | 3.943%, 1/25/45(A)(C) | | | 760,749 | |
| | 896,610 | | | CSMC Trust, Ser 2015-WIN1, Class B3, | | | | |
| | | | | 144a, 3.867%, 12/25/44(A)(C) | | | 881,933 | |
| | 790,549 | | | PMT Loan Trust, Ser 2013-J1, Class A11, | | | | |
| | | | | 144a, 3.500%, 9/25/43(A)(C) | | | 776,467 | |
| | | | | Total Non-Agency Collateralized | | | | |
| | | | | Mortgage Obligations | | $ | 3,203,984 | |
| | | | | | | | | |
| | | | | Asset-Backed Securities — 0.9% | | | | |
| | 1,350,000 | | | Hertz Vehicle Financing II LP, Ser | | | | |
| | | | | 2016-4A, Class A, 144a, | | | | |
| | | | | 2.650%, 7/25/22 | | | 1,314,640 | |
| | 1,343,258 | | | Wendy's Funding LLC, Ser 2018-1A, | | | | |
| | | | | Class A2I, 144a, 3.573%, 3/15/48 | | | 1,306,346 | |
| | | | | Total Asset-Backed Securities | | $ | 2,620,986 | |
| | | | | | | | | |
| | | | | Sovereign Government Obligations — 0.5% | | | | |
| | 238,000 | | | Colombia Government International | | | | |
| | | | | Bond, 5.000%, 6/15/45 | | | 234,132 | |
| | 345,000 | | | Mexico Government International | | | | |
| | | | | Bond, 4.350%, 1/15/47 | | | 308,258 | |
| | 359,000 | | | Province of Alberta Canada, 2.200%, | | | | |
| | | | | 7/26/22 | | | 346,654 | |
| | 417,000 | | | Province of Ontario Canada, 1.875%, | | | | |
| | | | | 5/21/20 | | | 409,712 | |
| | 280,000 | | | Uruguay Government International | | | | |
| | | | | Bond, 4.975%, 4/20/55 | | | 271,600 | |
| | | | | Total Sovereign Government | | | | |
| | | | | Obligations | | $ | 1,570,356 | |
| | | | | | | | | |
| | | | | Commercial Mortgage-Backed Security — 0.4% | | | | |
| | 1,400,000 | | | GS Mortgage Securities Trust, Ser | | | | |
| | | | | 2017-FARM, Class B, 144a, | | | | |
| | | | | 3.659%, 1/10/43(A)(C) | | $ | 1,344,700 | |
| | | Shares | | | | |
| | | | | | | |
| Preferred Stock — 0.0% | | | | | | | | |
| | | | | | | | | |
| Utilities — 0.0% | | | | | | | | |
| Integrys Holding, Inc., 6.000%, 8/1/73 | | | 2,000 | | | $ | 52,500 | |
Touchstone Balanced Fund (Continued)
| | | | | | Market | |
| | | Shares | | | Value | |
| | | | | | | |
| Short-Term Investment Fund — 1.5% | | | | | | | | |
| Dreyfus Government Cash | | | | | | | | |
| Management, Institutional Shares, | | | | | | | | |
| 1.81%∞Ω | | | 4,511,695 | | | $ | 4,511,695 | |
| | | | | | | | | |
| Total Investment Securities —99.9% | | | | | | | | |
| (Cost $185,585,144) | | | | | | $ | 309,185,456 | |
| | | | | | | | | |
| Other Assets in Excess of Liabilities — 0.1% | | | | | | | 252,472 | |
| | | | | | | | | |
| Net Assets — 100.0% | | | | | | $ | 309,437,928 | |
| (A) | Variable rate security - Rate reflected is the rate in effect as of June 30, 2018. |
| (B) | Interest only security - This type of security represents the right to receive the monthly interest payments on an underlying pool of mortgages. Payments of principal on the pool reduce the value of the “interest only” holding. |
| (C) | Certain variable rate securities are not based on a published reference rate and spread but are determined by the issuer or agent and are based on current market conditions. These securities do not indicate a reference rate and spread in their description. |
| * | Non-income producing security. |
| Ω | Represents the 7-day SEC yield as of June 30, 2018. |
Portfolio Abbreviations:
ADR - American Depositary Receipt
ETF - Exchange-Traded Fund
FHLMC - Federal Home Loan Mortgage Corporation
FNMA - Federal National Mortgage Association
GNMA - Government National Mortgage Association
LIBOR - London Inter Bank Offered Rate
LLC - Limited Liability Company
LP - Limited Partnership
MTN - Medium Term Note
PLC - Public Limited Company
REIT - Real Estate Investment Trust
REMIC - Real Estate Mortgage Investment Conduit
SPDR - Standard & Poor's Depositary Receipt
USD - United States Dollar
144a - This is a restricted security that was sold in a transaction qualifying for the exemption under Rule 144a of the Securities Act of 1933. This security may be sold in transactions exempt from registration, normally to qualified institutional buyers. At June 30, 2018, these securities were valued at $12,379,256 or 4.0% of net assets. These securities were deemed liquid pursuant to procedures approved by the Board of Trustees.
Touchstone Balanced Fund (Continued)
Other Information:
The inputs or methodology used for valuing securities may not be an indication of the risk associated with investing in those securities. For more information on valuation inputs, and their aggregation into the levels used in the table below, please refer to the security valuation section in the accompanying Notes to Financial Statements.
| | | Valuation inputs at Reporting Date: | |
| Description | | Level 1 | | | Level 2 | | | Level 3 | | | Total | |
| | | | | | | | | | | | | |
| Common Stocks | | $ | 208,931,082 | | | $ | — | | | $ | — | | | $ | 208,931,082 | |
| Corporate Bonds | | | — | | | | 38,652,053 | | | | — | | | | 38,652,053 | |
| U.S. Government Mortgage-Backed Obligations | | | — | | | | 24,461,002 | | | | — | | | | 24,461,002 | |
| U.S. Treasury Obligations | | | — | | | | 17,057,214 | | | | — | | | | 17,057,214 | |
| Exchange-Traded Funds | | | 6,779,884 | | | | — | | | | — | | | | 6,779,884 | |
| Non-Agency Collateralized Mortgage Obligations | | | — | | | | 3,203,984 | | | | — | | | | 3,203,984 | |
| Asset-Backed Securities | | | — | | | | 2,620,986 | | | | — | | | | 2,620,986 | |
| Sovereign Government Obligations | | | — | | | | 1,570,356 | | | | — | | | | 1,570,356 | |
| Commercial Mortgage-Backed Security | | | — | | | | 1,344,700 | | | | — | | | | 1,344,700 | |
| Preferred Stock | | | 52,500 | | | | — | | | | — | | | | 52,500 | |
| Short-Term Investment Fund | | | 4,511,695 | | | | — | | | | — | | | | 4,511,695 | |
| Total | | $ | 220,275,161 | | | $ | 88,910,295 | | | $ | — | | | $ | 309,185,456 | |
See accompanying Notes to Financial Statements.
Portfolio of Investments
Touchstone International Equity Fund – June 30, 2018
| | | | | | Market | |
| | | Shares | | | Value | |
| | | | | | | |
| Common Stocks — 93.1% | | | | | | | | |
| | | | | | | | | |
| United Kingdom — 30.0% | | | | | | | | |
| | | | | | | | | |
| Consumer Discretionary — 15.9% | | | | | | | | |
| BCA Marketplace PLC | | | 2,213,837 | | | $ | 6,407,136 | |
| Compass Group PLC | | | 209,615 | | | | 4,468,072 | |
| InterContinental Hotels Group PLC | | | 46,000 | | | | 2,859,598 | |
| ITV PLC | | | 3,410,000 | | | | 7,796,077 | |
| WPP PLC | | | 495,000 | | | | 7,777,227 | |
| | | | | | | | | |
| Consumer Staples — 2.8% | | | | | | | | |
| Reckitt Benckiser Group PLC | | | 62,500 | | | | 5,135,298 | |
| | | | | | | | | |
| Health Care — 1.2% | | | | | | | | |
| Indivior PLC* | | | 431,000 | | | | 2,170,297 | |
| | | | | | | | | |
| Industrials — 2.2% | | | | | | | | |
| Experian PLC | | | 167,000 | | | | 4,119,658 | |
| | | | | | | | | |
| Information Technology — 4.8% | | | | | | | | |
| Auto Trader Group PLC, 144a | | | 825,000 | | | | 4,623,622 | |
| AVEVA Group PLC | | | 120,000 | | | | 4,253,815 | |
| | | | | | | | | |
| Real Estate — 3.1% | | | | | | | | |
| Foxtons Group PLC | | | 1,750,000 | | | | 1,307,211 | |
| Savills PLC | | | 392,000 | | | | 4,491,100 | |
| Total United Kingdom | | | | | | | 55,409,111 | |
| | | | | | | | | |
| France — 8.7% | | | | | | | | |
| | | | | | | | | |
| Consumer Discretionary — 6.8% | | | | | | | | |
| Eutelsat Communications SA | | | 217,000 | | | | 4,490,871 | |
| JCDecaux SA | | | 111,000 | | | | 3,706,476 | |
| Renault SA† | | | 51,000 | | | | 4,320,798 | |
| | | | | | | | | |
| Industrials — 1.9% | | | | | | | | |
| Edenred | | | 113,000 | | | | 3,569,301 | |
| Total France | | | | | | | 16,087,446 | |
| | | | | | | | | |
| Switzerland — 7.7% | | | | | | | | |
| | | | | | | | | |
| Consumer Staples — 3.2% | | | | | | | | |
| Nestle SA | | | 77,000 | | | | 5,967,565 | |
| | | | | | | | | |
| Health Care — 2.5% | | | | | | | | |
| Novartis AG | | | 60,000 | | | | 4,545,057 | |
| | | | | | | | | |
| Industrials — 2.0% | | | | | | | | |
| Adecco Group AG | | | 63,000 | | | | 3,717,888 | |
| Total Switzerland | | | | | | | 14,230,510 | |
| | | | | | | | | |
| Canada — 6.3% | | | | | | | | |
| | | | | | | | | |
| Consumer Discretionary — 2.6% | | | | | | | | |
| Uni-Select, Inc. | | | 300,000 | | | | 4,771,612 | |
| | | | | | | | | |
| Information Technology — 2.2% | | | | | | | | |
| BlackBerry Ltd.*† | | | 419,000 | | | | 4,043,350 | |
| | | | | | | | | |
| Materials — 1.5% | | | | | | | | |
| Pretium Resources, Inc.*† | | | 389,000 | | | | 2,855,260 | |
| Total Canada | | | | | | | 11,670,222 | |
| | | | | | | | | |
| Germany — 5.7% | | | | | | | | |
| | | | | | | | | |
| Industrials — 2.8% | | | | | | | | |
| Brenntag AG | | | 93,000 | | | | 5,167,239 | |
| | | | | | | | | |
| Information Technology — 2.9% | | | | | | | | |
| SAP SE | | | 47,000 | | | | 5,424,641 | |
| Total Germany | | | | | | | 10,591,880 | |
| | | | | | | | | |
| Ireland — 5.1% | | | | | | | | |
| | | | | | | | | |
| Consumer Discretionary — 1.5% | | | | | | | | |
| Aptiv PLC | | | 31,500 | | | | 2,886,345 | |
| | | | | | | | | |
| Health Care — 3.6% | | | | | | | | |
| Medtronic PLC | | | 77,000 | | | | 6,591,970 | |
| Total Ireland | | | | | | | 9,478,315 | |
| | | | | | | | | |
| India — 4.3% | | | | | | | | |
| | | | | | | | | |
| Consumer Discretionary — 1.9% | | | | | | | | |
| PC Jeweller Ltd. | | | 1,745,000 | | | | 3,493,305 | |
| | | | | | | | | |
| Financials — 2.4% | | | | | | | | |
| Shriram Transport Finance Co. Ltd. | | | 235,000 | | | | 4,459,556 | |
| Total India | | | | | | | 7,952,861 | |
| | | | | | | | | |
| Japan — 3.8% | | | | | | | | |
| | | | | | | | | |
| Consumer Discretionary — 2.1% | | | | | | | | |
| USS Co. Ltd. | | | 202,000 | | | | 3,840,537 | |
| | | | | | | | | |
| Industrials — 1.7% | | | | | | | | |
| FANUC Corp. | | | 15,800 | | | | 3,131,747 | |
| Total Japan | | | | | | | 6,972,284 | |
| | | | | | | | | |
| China — 3.1% | | | | | | | | |
| | | | | | | | | |
| Information Technology — 3.1% | | | | | | | | |
| Baidu, Inc. ADR* | | | 11,000 | | | | 2,673,000 | |
| Tencent Holdings Ltd. | | | 60,000 | | | | 3,012,924 | |
| Total China | | | | | | | 5,685,924 | |
| | | | | | | | | |
| Spain — 2.8% | | | | | | | | |
| | | | | | | | | |
| Utilities — 2.8% | | | | | | | | |
| Red Electrica Corp. SA | | | 255,000 | | | | 5,180,590 | |
| | | | | | | | | |
| Denmark — 2.5% | | | | | | | | |
| | | | | | | | | |
| Industrials — 2.5% | | | | | | | | |
| ISS A/S | | | 136,000 | | | | 4,658,265 | |
Touchstone International Equity Fund (Continued)
| | | | | | Market | |
| | | Shares | | | Value | |
| | | | | | | |
| Common Stocks — 93.1% (Continued) | | | | | | | | |
| | | | | | | | | |
| Netherlands — 2.3% | | | | | | | | |
| | | | | | | | | |
| Energy — 2.3% | | | | | | | | |
| Core Laboratories NV | | | 34,000 | | | $ | 4,291,140 | |
| | | | | | | | | |
| Mexico — 2.3% | | | | | | | | |
| | | | | | | | | |
| Consumer Staples — 2.3% | | | | | | | | |
| Gruma SAB de CV - Class B | | | 346,000 | | | | 4,225,816 | |
| | | | | | | | | |
| Greece — 2.3% | | | | | | | | |
| | | | | | | | | |
| Consumer Discretionary — 2.3% | | | | | | | | |
| OPAP SA | | | 370,000 | | | | 4,171,727 | |
| | | | | | | | | |
| South Korea — 1.7% | | | | | | | | |
| | | | | | | | | |
| Information Technology — 1.7% | | | | | | | | |
| NAVER Corp. | | | 4,500 | | | | 3,079,371 | |
| | | | | | | | | |
| United States — 1.6% | | | | | | | | |
| | | | | | | | | |
| Information Technology — 1.6% | | | | | | | | |
| Mastercard, Inc. - Class A | | | 15,100 | | | | 2,967,452 | |
| | | | | | | | | |
| Australia — 1.5% | | | | | | | | |
| | | | | | | | | |
| Materials — 1.5% | | | | | | | | |
| Northern Star Resources Ltd. | | | 500,000 | | | | 2,706,850 | |
| | | | | | | | | |
| Jersey — 1.4% | | | | | | | | |
| | | | | | | | | |
| Materials — 1.4% | | | | | | | | |
| Randgold Resources Ltd. | | | 34,000 | | | | 2,616,887 | |
| Total Common Stocks | | | | | | $ | 171,976,651 | |
| | | | | | | | | |
| Short-Term Investment Funds — 9.5% | | | | | | | | |
| Dreyfus Government Cash | | | | | | | | |
| Management, Institutional Shares, | | | | | | | | |
| 1.81%∞Ω | | | 8,793,293 | | | | 8,793,293 | |
| Invesco Government & Agency | | | | | | | | |
| Portfolio, Institutional Class, | | | | | | | | |
| 1.81%**∞Ω | | | 8,776,526 | | | | 8,776,526 | |
| Total Short-Term Investment Funds | | | | | | $ | 17,569,819 | |
| | | | | | | | | |
| Total Investment Securities —102.6% | | | | | | | | |
| (Cost $175,324,829) | | | | | | $ | 189,546,470 | |
| | | | | | | | | |
| Liabilities in Excess of Other Assets — (2.6%) | | | | | | | (4,719,990 | ) |
| | | | | | | | | |
| Net Assets — 100.0% | | | | | | $ | 184,826,480 | |
| * | Non-income producing security. |
| ** | Represents collateral for securities loaned. |
| † | All or a portion of the security is on loan. The total market value of the securities on loan as of June 30, 2018 was $8,495,499. |
| Ω | Represents the 7-day SEC yield as of June 30, 2018. |
Portfolio Abbreviations:
ADR - American Depositary Receipt
PLC - Public Limited Company
144a - This is a restricted security that was sold in a transaction qualifying for the exemption under Rule 144a of the Securities Act of 1933. This security may be sold in transactions exempt from registration, normally to qualified institutional buyers. At June 30, 2018, these securities were valued at $4,623,622 or 2.5% of net assets. These securities were deemed liquid pursuant to procedures approved by the Board of Trustees.
Touchstone International Equity Fund (Continued)
Other Information:
The inputs or methodology used for valuing securities may not be an indication of the risk associated with investing in those securities. For more information on valuation inputs, and their aggregation into the levels used in the table below, please refer to the security valuation section in the accompanying Notes to Financial Statements.
| | | Valuation inputs at Reporting Date: | |
| Description | | Level 1 | | | Level 2 | | | Level 3 | | | Total | |
| | | | | | | | | | | | | |
| Common Stocks | | | | | | | | | | | | | | | | |
United Kingdom | | $ | 5,561,026 | | | $ | 49,848,085 | | | $ | — | | | $ | 55,409,111 | |
| France | | | — | | | | 16,087,446 | | | | — | | | | 16,087,446 | |
| Switzerland | | | — | | | | 14,230,510 | | | | — | | | | 14,230,510 | |
| Canada | | | 11,670,222 | | | | — | | | | — | | | | 11,670,222 | |
| Germany | | | — | | | | 10,591,880 | | | | — | | | | 10,591,880 | |
| Ireland | | | 9,478,315 | | | | — | | | | — | | | | 9,478,315 | |
| India | | | — | | | | 7,952,861 | | | | — | | | | 7,952,861 | |
| Japan | | | — | | | | 6,972,284 | | | | — | | | | 6,972,284 | |
| China | | | 2,673,000 | | | | 3,012,924 | | | | — | | | | 5,685,924 | |
| Spain | | | — | | | | 5,180,590 | | | | — | | | | 5,180,590 | |
| Denmark | | | — | | | | 4,658,265 | | | | — | | | | 4,658,265 | |
| Netherlands | | | 4,291,140 | | | | — | | | | — | | | | 4,291,140 | |
| Mexico | | | 4,225,816 | | | | — | | | | — | | | | 4,225,816 | |
| Greece | | | — | | | | 4,171,727 | | | | — | | | | 4,171,727 | |
| South Korea | | | — | | | | 3,079,371 | | | | — | | | | 3,079,371 | |
| United States | | | 2,967,452 | | | | — | | | | — | | | | 2,967,452 | |
| Australia | | | — | | | | 2,706,850 | | | | — | | | | 2,706,850 | |
| Jersey | | | — | | | | 2,616,887 | | | | — | | | | 2,616,887 | |
| Short-Term Investment Funds | | | 17,569,819 | | | | — | | | | — | | | | 17,569,819 | |
| Total | | $ | 58,436,790 | | | $ | 131,109,680 | | | $ | — | | | $ | 189,546,470 | |
At June 30, 2018, equity securities valued at $40,429,040 were transferred from Level 1 to Level 2. Transfers from Level 1 to Level 2 occur when required confidence levels are achieved, triggering use of a systematic valuation model, provided by an independent third party, to fair value the international equity securities.
See accompanying Notes to Financial Statements.
Portfolio of Investments
Touchstone Large Cap Focused Fund – June 30, 2018
| | | | | | Market | |
| | | Shares | | | Value | |
| | | | | | | |
| Common Stocks — 95.0% | | | | | | | | |
| | | | | | | | | |
| Information Technology — 25.6% | | | | | | | | |
| Accenture PLC (Ireland) - Class A | | | 223,043 | | | $ | 36,487,604 | |
| Alphabet, Inc. - Class C* | | | 57,000 | | | | 63,592,050 | |
| Apple, Inc. | | | 340,315 | | | | 62,995,710 | |
| Cisco Systems, Inc. | | | 584,365 | | | | 25,145,226 | |
| Facebook, Inc. - Class A* | | | 270,892 | | | | 52,639,733 | |
| Microsoft Corp. | | | 905,572 | | | | 89,298,455 | |
| Oracle Corp. | | | 413,559 | | | | 18,221,410 | |
| salesforce.com, Inc.* | | | 84,031 | | | | 11,461,828 | |
| Texas Instruments, Inc. | | | 176,177 | | | | 19,423,514 | |
| Visa, Inc. - Class A | | | 475,920 | | | | 63,035,604 | |
| | | | | | | | 442,301,134 | |
| | | | | | | | | |
| Financials — 14.3% | | | | | | | | |
| American Express Co. | | | 165,720 | | | | 16,240,560 | |
| Chubb Ltd. (Switzerland) | | | 178,036 | | | | 22,614,133 | |
| CME Group, Inc. | | | 182,926 | | | | 29,985,230 | |
| JPMorgan Chase & Co. | | | 325,000 | | | | 33,865,000 | |
| Morgan Stanley | | | 797,500 | | | | 37,801,500 | |
| PNC Financial Services Group, Inc. (The) | | | 262,000 | | | | 35,396,200 | |
| S&P Global, Inc. | | | 197,596 | | | | 40,287,848 | |
| Signature Bank/NewYork NY* | | | 82,316 | | | | 10,526,570 | |
| Travelers Cos., Inc. (The) | | | 161,374 | | | | 19,742,495 | |
| | | | | | | | 246,459,536 | |
| | | | | | | | | |
| Consumer Discretionary — 13.3% | | | | | | | | |
| Amazon.com, Inc.* | | | 26,751 | | | | 45,471,350 | |
| Booking Holdings, Inc.* | | | 7,878 | | | | 15,969,415 | |
| Carnival Corp. | | | 68,498 | | | | 3,925,620 | |
| Comcast Corp. - Class A | | | 947,256 | | | | 31,079,469 | |
| Home Depot, Inc. (The) | | | 162,400 | | | | 31,684,240 | |
| JD.com, Inc. (China) ADR* | | | 429,243 | | | | 16,719,015 | |
| Marriott International, Inc. - Class A | | | 54,375 | | | | 6,883,875 | |
| McDonald's Corp. | | | 186,095 | | | | 29,159,226 | |
| Omnicom Group, Inc. | | | 87,027 | | | | 6,637,549 | |
| Starbucks Corp. | | | 112,287 | | | | 5,485,220 | |
| TJX Cos, Inc. (The) | | | 388,219 | | | | 36,950,684 | |
| | | | | | | | 229,965,663 | |
| | | | | | | | | |
| Health Care — 13.0% | | | | | | | | |
| AmerisourceBergen Corp. | | | 199,567 | | | | 17,017,078 | |
| Amgen, Inc. | | | 91,644 | | | | 16,916,566 | |
| Becton Dickinson and Co. | | | 82,860 | | | | 19,849,942 | |
| Biogen, Inc.* | | | 54,698 | | | | 15,875,548 | |
| Bristol-Myers Squibb Co. | | | 244,323 | | | | 13,520,835 | |
| Johnson & Johnson | | | 100,337 | | | | 12,174,892 | |
| Merck & Co., Inc. | | | 536,551 | | | | 32,568,646 | |
| Novartis AG (Switzerland) ADR | | | 191,666 | | | | 14,478,450 | |
| Stryker Corp. | | | 51,510 | | | | 8,697,979 | |
| UnitedHealth Group, Inc. | | | 181,658 | | | | 44,567,974 | |
| Zoetis, Inc. | | | 349,008 | | | | 29,731,992 | |
| | | | | | | | 225,399,902 | |
| | | | | | | | | |
| Consumer Staples — 8.4% | | | | | | | | |
| Estee Lauder Cos., Inc. (The) - Class A | | | 212,718 | | | | 30,352,731 | |
| Kraft Heinz Co. (The) | | | 183,288 | | | | 11,514,152 | |
| Monster Beverage Corp.* | | | 79,236 | | | | 4,540,223 | |
| PepsiCo, Inc. | | | 274,751 | | | | 29,912,141 | |
| Philip Morris International, Inc. | | | 275,000 | | | | 22,203,500 | |
| Procter & Gamble Co. (The) | | | 271,672 | | | | 21,206,716 | |
| Unilever NV (United Kingdom) | | | 456,408 | | | | 25,431,054 | |
| | | | | | | | 145,160,517 | |
| | | | | | | | | |
| Industrials — 8.2% | | | | | | | | |
| Boeing Co. (The) | | | 139,549 | | | | 46,820,085 | |
| Canadian National Railway Co. (Canada) | | | 217,247 | | | | 17,759,942 | |
| Honeywell International, Inc. | | | 239,886 | | | | 34,555,578 | |
| United Technologies Corp. | | | 208,281 | | | | 26,041,373 | |
| Verisk Analytics, Inc.* | | | 148,725 | | | | 16,008,759 | |
| | | | | | | | 141,185,737 | |
| | | | | | | | | |
| Energy — 6.9% | | | | | | | | |
| Chevron Corp. | | | 172,149 | | | | 21,764,798 | |
| EOG Resources, Inc. | | | 192,000 | | | | 23,890,560 | |
| Exxon Mobil Corp. | | | 455,000 | | | | 37,642,150 | |
| Marathon Petroleum Corp. | | | 281,761 | | | | 19,768,352 | |
| Schlumberger Ltd. | | | 248,127 | | | | 16,631,953 | |
| | | | | | | | 119,697,813 | |
| | | | | | | | | |
| Telecommunication Services — 2.2% | | | | | | | | |
| AT&T, Inc. | | | 140,021 | | | | 4,496,083 | |
| Verizon Communications, Inc. | | | 656,086 | | | | 33,007,687 | |
| | | | | | | | 37,503,770 | |
| | | | | | | | | |
| Materials — 1.8% | | | | | | | | |
| DowDuPont, Inc. | | | 270,314 | | | | 17,819,099 | |
| Praxair, Inc. | | | 87,298 | | | | 13,806,179 | |
| | | | | | | | 31,625,278 | |
| | | | | | | | | |
| Real Estate — 1.3% | | | | | | | | |
| Jones Lang LaSalle, Inc. | | | 70,961 | | | | 11,778,816 | |
| Simon Property Group, Inc. REIT | | | 58,609 | | | | 9,974,666 | |
| | | | | | | | 21,753,482 | |
| Total Common Stocks | | | | | | $ | 1,641,052,832 | |
| | | | | | | | | |
| Exchange-Traded Funds — 4.8% | | | | | | | | |
| SPDR S&P 500 ETF Trust | | | 230,000 | | | | 62,394,400 | |
| Utilities Select Sector SPDR Fund | | | 385,000 | | | | 20,004,600 | |
| Total Exchange-Traded Funds | | | | | | $ | 82,399,000 | |
Touchstone Large Cap Focused Fund (Continued)
| | | | | | Market | |
| | | Shares | | | Value | |
| | | | | | | |
| Short-Term Investment Fund — 0.6% | | | | | | | | |
| Dreyfus Government Cash | | | | | | | | |
| Management, Institutional Shares, | | | | | | | | |
| 1.81%∞Ω | | | 10,433,978 | | | $ | 10,433,978 | |
| | | | | | | | | |
| Total Investment Securities —100.4% | | | | | | | | |
| (Cost $749,373,150) | | | | | | $ | 1,733,885,810 | |
| | | | | | | | | |
| Liabilities in Excess of Other Assets — (0.4%) | | | | | | | (6,805,123 | ) |
| | | | | | | | | |
| Net Assets — 100.0% | | | | | | $ | 1,727,080,687 | |
| * | Non-income producing security. |
| Ω | Represents the 7-day SEC yield as of June 30, 2018. |
Portfolio Abbreviations:
ADR - American Depositary Receipt
ETF - Exchange-Traded Fund
PLC - Public Limited Company
REIT - Real Estate Investment Trust
SPDR - Standard & Poor's Depositary Receipt
Other Information:
The inputs or methodology used for valuing securities may not be an indication of the risk associated with investing in those securities. For more information on valuation inputs, and their aggregation into the levels used in the table below, please refer to the security valuation section in the accompanying Notes to Financial Statements.
| | | Valuation inputs at Reporting Date: | |
| Description | | Level 1 | | | Level 2 | | | Level 3 | | | Total | |
| Common Stocks | | $ | 1,641,052,832 | | | $ | — | | | $ | — | | | $ | 1,641,052,832 | |
| Exchange-Traded Funds | | | 82,399,000 | | | | — | | | | — | | | | 82,399,000 | |
| Short-Term Investment Fund | | | 10,433,978 | | | | — | | | | — | | | | 10,433,978 | |
| Total | | $ | 1,733,885,810 | | | $ | — | | | $ | — | | | $ | 1,733,885,810 | |
See accompanying Notes to Financial Statements.
Portfolio of Investments
Touchstone Small Company Fund – June 30, 2018
| | | | | | Market | |
| | | Shares | | | Value | |
| Common Stocks — 96.3% | | | | | | | | |
| | | | | | | | | |
| Information Technology — 25.3% | | | | | | | | |
| 8x8, Inc.* | | | 797,200 | | | $ | 15,983,860 | |
| Acxiom Corp.* | | | 591,166 | | | | 17,705,422 | |
| Aspen Technology, Inc.* | | | 167,500 | | | | 15,533,950 | |
| Avaya Holdings Corp.* | | | 572,000 | | | | 11,485,760 | |
| Bottomline Technologies de, Inc.* | | | 329,300 | | | | 16,409,019 | |
| Carbonite, Inc.* | | | 453,440 | | | | 15,825,056 | |
| Cision Ltd.* | | | 663,000 | | | | 9,928,425 | |
| CommVault Systems, Inc.* | | | 236,000 | | | | 15,540,600 | |
| Finisar Corp.* | | | 900,600 | | | | 16,210,800 | |
| GTT Communications, Inc.* | | | 350,384 | | | | 15,767,280 | |
| j2 Global, Inc. | | | 189,485 | | | | 16,411,296 | |
| MAXIMUS, Inc. | | | 253,209 | | | | 15,726,811 | |
| NetScout Systems, Inc.* | | | 550,100 | | | | 16,337,970 | |
| Nice Ltd. ADR (Israel)* | | | 154,020 | | | | 15,982,655 | |
| Nuance Communications, Inc.* | | | 1,153,270 | | | | 16,013,154 | |
| ON Semiconductor Corp.* | | | 611,380 | | | | 13,594,034 | |
| Open Text Corp. (Canada) | | | 333,320 | | | | 11,729,531 | |
| Plantronics, Inc. | | | 360,840 | | | | 27,514,050 | |
| Verint Systems, Inc.* | | | 564,600 | | | | 25,040,010 | |
| | | | | | | | 308,739,683 | |
| | | | | | | | | |
| Industrials — 19.6% | | | | | | | | |
| Clean Harbors, Inc.* | | | 307,500 | | | | 17,081,625 | |
| Crane Co. | | | 194,400 | | | | 15,577,272 | |
| EnerSys, Inc. | | | 298,800 | | | | 22,302,432 | |
| Esterline Technologies Corp.* | | | 208,400 | | | | 15,379,920 | |
| Genesee & Wyoming, Inc. - Class A* | | | 205,800 | | | | 16,735,656 | |
| Hillenbrand, Inc. | | | 328,000 | | | | 15,465,200 | |
| Knight-Swift Transportation Holdings, Inc. | | | 396,600 | | | | 15,154,086 | |
| Luxfer Holdings PLC (United Kingdom) | | | 339,500 | | | | 5,934,460 | |
| Luxfer Holdings PLC (United Kingdom) | | | 23,500 | | | | 412,425 | |
| Mobile Mini, Inc. | | | 348,962 | | | | 16,366,318 | |
| Quanta Services, Inc.* | | | 709,170 | | | | 23,686,278 | |
| Regal Beloit Corp. | | | 308,600 | | | | 25,243,480 | |
| SkyWest, Inc. | | | 313,300 | | | | 16,260,270 | |
| Terex Corp. | | | 378,000 | | | | 15,947,820 | |
| Woodward, Inc. | | | 217,800 | | | | 16,740,108 | |
| | | | | | | | 238,287,350 | |
| | | | | | | | | |
| Health Care — 19.1% | | | | | | | | |
| Allscripts Healthcare Solutions, Inc.* | | | 2,041,800 | | | | 24,501,600 | |
| AngioDynamics, Inc.* | | | 760,106 | | | | 16,904,757 | |
| Bio-Rad Laboratories, Inc. - Class A* | | | 55,864 | | | | 16,118,999 | |
| Bio-Techne Corp. | | | 107,200 | | | | 15,860,240 | |
| Encompass Health Corp. | | | 245,500 | | | | 16,625,260 | |
| Globus Medical, Inc. - Class A* | | | 295,700 | | | | 14,921,022 | |
| Haemonetics Corp.* | | | 169,300 | | | | 15,182,824 | |
| MEDNAX, Inc.* | | | 343,700 | | | | 14,875,336 | |
| NuVasive, Inc.* | | | 480,400 | | | | 25,038,448 | |
| Omnicell, Inc.* | | | 329,100 | | | | 17,261,295 | |
| Orthofix International NV* | | | 296,434 | | | | 16,843,380 | |
| Tactile Systems Technology, Inc.* | | | 307,500 | | | | 15,990,000 | |
| Tivity Health, Inc.* | | | 633,330 | | | | 22,293,216 | |
| | | | | | | | 232,416,377 | |
| | | | | | | | | |
| Consumer Discretionary — 12.6% | | | | | | | | |
| Aaron's, Inc. | | | 599,274 | | | | 26,038,455 | |
| Adtalem Global Education, Inc.* | | | 349,035 | | | | 16,788,583 | |
| Bloomin' Brands, Inc. | | | 798,040 | | | | 16,040,604 | |
| Callaway Golf Co. | | | 822,680 | | | | 15,606,240 | |
| KB Home | | | 593,500 | | | | 16,166,940 | |
| Penn National Gaming, Inc.* | | | 453,800 | | | | 15,243,142 | |
| Planet Fitness, Inc. - Class A* | | | 358,600 | | | | 15,756,884 | |
| Texas Roadhouse, Inc. | | | 247,900 | | | | 16,239,929 | |
| TRI Pointe Group, Inc.* | | | 946,600 | | | | 15,486,376 | |
| | | | | | | | 153,367,153 | |
| | | | | | | | | |
| Financials — 10.8% | | | | | | | | |
| Chemical Financial Corp. | | | 328,700 | | | | 18,298,729 | |
| Evercore, Inc. - Class A | | | 148,500 | | | | 15,659,325 | |
| Glacier Bancorp, Inc. | | | 426,000 | | | | 16,477,680 | |
| Heartland Financial USA, Inc. | | | 309,800 | | | | 16,992,530 | |
| Stifel Financial Corp. | | | 286,200 | | | | 14,953,950 | |
| Webster Financial Corp. | | | 268,800 | | | | 17,122,560 | |
| Western Alliance Bancorp* | | | 282,300 | | | | 15,981,003 | |
| WSFS Financial Corp. | | | 307,300 | | | | 16,379,090 | |
| | | | | | | | 131,864,867 | |
| | | | | | | | | |
| Real Estate — 3.3% | | | | | | | | |
| Corporate Office Properties Trust REIT | | | 834,700 | | | | 24,197,953 | |
| Outfront Media, Inc. REIT | | | 807,800 | | | | 15,711,710 | |
| | | | | | | | 39,909,663 | |
| | | | | | | | | |
| Energy — 1.5% | | | | | | | | |
| Gulfport Energy Corp.* | | | 1,416,300 | | | | 17,802,891 | |
| | | | | | | | | |
| Consumer Staples — 1.4% | | | | | | | | |
| Sprouts Farmers Market, Inc.* | | | 785,000 | | | | 17,324,950 | |
| | | | | | | | | |
| Telecommunication Services — 1.4% | | | | | | | | |
| Cogent Communications Holdings, Inc. | | | 317,800 | | | | 16,970,520 | |
| | | | | | | | | |
| Materials — 1.3% | | | | | | | | |
| Innophos Holdings, Inc. | | | 346,900 | | | | 16,512,440 | |
| Total Common Stocks | | | | | | $ | 1,173,195,894 | |
| | | | | | | | | |
| Short-Term Investment Fund — 4.0% | | | | | | | | |
Dreyfus Government Cash Management, Institutional Shares, 1.81%∞Ω | | | 48,725,299 | | | $ | 48,725,299 | |
Touchstone Small Company Fund (Continued)
| | | Market | |
| | | Value | |
| Total Investment Securities —100.3% | | | | |
| (Cost $922,199,198) | | $ | 1,221,921,193 | |
| | | | | |
| Liabilities in Excess of Other Assets — (0.3%) | | | (3,615,693 | ) |
| | | | | |
| Net Assets — 100.0% | | $ | 1,218,305,500 | |
| * | Non-income producing security. |
| Ω | Represents the 7-day SEC yield as of June 30, 2018. |
Portfolio Abbreviations:
ADR - American Depositary Receipt
PLC - Public Limited Company
REIT - Real Estate Investment Trust
Other Information:
The inputs or methodology used for valuing securities may not be an indication of the risk associated with investing in those securities. For more information on valuation inputs, and their aggregation into the levels used in the table below, please refer to the security valuation section in the accompanying Notes to Financial Statements.
| | | Valuation inputs at Reporting Date: | |
| Description | | Level 1 | | | Level 2 | | | Level 3 | | | Total | |
| Common Stocks | | $ | 1,173,195,894 | | | $ | — | | | $ | — | | | $ | 1,173,195,894 | |
| Short-term Investment Fund | | | 48,725,299 | | | | — | | | | — | | | | 48,725,299 | |
| Total | | $ | 1,221,921,193 | | | $ | — | | | $ | — | | | $ | 1,221,921,193 | |
See accompanying Notes to Financial Statements.
Statements of Assets and Liabilities
June 30, 2018
| | | | | | Touchstone | | | Touchstone | | | Touchstone | |
| | | Touchstone | | | International | | | Large Cap | | | Small | |
| | | Balanced | | | Equity | | | Focused | | | Company | |
| | | Fund | | | Fund | | | Fund | | | Fund | |
| Assets | | | | | | | | | | | | | | | | |
| Investments, at cost | | $ | 185,585,144 | | | $ | 175,324,829 | | | $ | 749,373,150 | | | $ | 922,199,198 | |
| Investments, at market value (A) | | $ | 309,185,456 | | | $ | 189,546,470 | | | $ | 1,733,885,810 | | | $ | 1,221,921,193 | |
| Cash | | | — | | | | — | | | | — | | | | 579,468 | |
| Foreign currency(B) | | | — | | | | 3,612,158 | | | | — | | | | — | |
| Dividends and interest receivable | | | 759,961 | | | | 508,060 | | | | 1,187,979 | | | | 424,734 | |
| Receivable for capital shares sold | | | 111,288 | | | | 135,563 | | | | 470,919 | | | | 523,681 | |
| Loan receivable from affiliates(C) | | | — | | | | — | | | | — | | | | 5,053,272 | |
| Receivable for securities lending income | | | — | | | | 20,901 | | | | 2,310 | | | | 106 | |
| Tax reclaim receivable | | | — | | | | 269,371 | | | | 141,926 | | | | 8,004 | |
| Other assets | | | 18,702 | | | | 22,081 | | | | 60,725 | | | | 27,825 | |
| Total Assets | | | 310,075,407 | | | | 194,114,604 | | | | 1,735,749,669 | | | | 1,228,538,283 | |
| | | | | | | | | | | | | | | | | |
| Liabilities | | | | | | | | | | | | | | | | |
| Bank overdrafts | | | 115 | | | | 8 | | | | 1,043 | | | | — | |
| Dividends payable | | | — | | | | — | | | | 273 | | | | — | |
| Payable for return of collateral for securities on loan | | | — | | | | 8,776,526 | | | | — | | | | — | |
| Payable for capital shares redeemed | | | 271,576 | | | | 242,177 | | | | 7,122,635 | | | | 3,080,088 | |
| Payable for investments purchased | | | — | | | | — | | | | — | | | | 5,884,422 | |
| Payable to Investment Advisor | | | 132,510 | | | | 108,604 | | | | 845,682 | | | | 649,001 | |
| Payable to other affiliates | | | 100,778 | | | | 34,510 | | | | 322,418 | | | | 260,050 | |
| Payable to Trustees | | | 5,415 | | | | 5,415 | | | | 5,415 | | | | 5,415 | |
| Payable for professional services | | | 27,492 | | | | 27,674 | | | | 31,859 | | | | 28,480 | |
| Payable to Transfer Agent | | | 80,940 | | | | 67,033 | | | | 314,151 | | | | 290,131 | |
| Payable for reports to shareholders | | | 5,936 | | | | 8,799 | | | | 17,316 | | | | 28,963 | |
| Other accrued expenses and liabilities | | | 12,717 | | | | 17,378 | | | | 8,190 | | | | 6,233 | |
| Total Liabilities | | | 637,479 | | | | 9,288,124 | | | | 8,668,982 | | | | 10,232,783 | |
| Net Assets | | $ | 309,437,928 | | | $ | 184,826,480 | | | $ | 1,727,080,687 | | | $ | 1,218,305,500 | |
| | | | | | | | | | | | | | | | | |
| Net assets consist of: | | | | | | | | | | | | | | | | |
| Paid-in capital | | $ | 179,522,481 | | | $ | 152,498,159 | | | $ | 705,952,632 | | | $ | 865,236,942 | |
| Accumulated net investment income | | | 224,126 | | | | 1,889,327 | | | | 5,226,183 | | | | — | |
| Accumulated net realized gains on investments and foreign currency transactions | | | 6,091,009 | | | | 16,228,525 | | | | 31,389,212 | | | | 53,346,563 | |
| Net unrealized appreciation on investments and foreign currency transactions | | | 123,600,312 | | | | 14,210,469 | | | | 984,512,660 | | | | 299,721,995 | |
| Net Assets | | $ | 309,437,928 | | | $ | 184,826,480 | | | $ | 1,727,080,687 | | | $ | 1,218,305,500 | |
| (A) Includes market value of securities on loan of: | | $ | — | | | $ | 8,495,499 | | | $ | — | | | $ | — | |
| (B) Cost of foreign currency: | | $ | — | | | $ | 3,618,863 | | | $ | — | | | $ | — | |
| (C) See Note 5 in Notes to Financial Statements. | | | | | | | | | | | | | | | | |
See accompanying Notes to Financial Statements.
Statements of Assets and Liabilities (Continued)
| | | | | | Touchstone | | | Touchstone | | | Touchstone | |
| | | Touchstone | | | International | | | Large Cap | | | Small | |
| | | Balanced | | | Equity | | | Focused | | | Company | |
| | | Fund | | | Fund | | | Fund | | | Fund | |
| | | | | | | | | | | | | |
| Pricing of Class A Shares | | | | | | | | | | | | | | | | |
| Net assets applicable to Class A shares | | $ | 239,056,471 | | | $ | 118,390,693 | | | $ | 1,218,720,995 | | | $ | 661,865,564 | |
| Shares of beneficial interest outstanding (unlimited number of shares authorized, no par value) | | | 11,100,279 | | | | 6,521,383 | | | | 27,827,646 | | | | 119,581,411 | |
| Net asset value price per share* | | $ | 21.54 | | | $ | 18.15 | | | $ | 43.80 | | | $ | 5.53 | |
| Maximum sales charge - Class A shares | | | 5.75 | % | | | 5.75 | % | | | 5.75 | % | | | 5.75 | % |
| Maximum offering price per share (100%/(100%-maximum sales charge) of net asset value adjusted to the nearest cent) - Class A shares | | $ | 22.85 | | | $ | 19.26 | | | $ | 46.47 | | | $ | 5.87 | |
| | | | | | | | | | | | | | | | | |
| Pricing of Class C Shares | | | | | | | | | | | | | | | | |
| Net assets applicable to Class C shares | | $ | 39,769,210 | | | $ | 6,737,075 | | | $ | 67,598,954 | | | $ | 97,136,009 | |
| Shares of beneficial interest outstanding (unlimited number of shares authorized, no par value) | | | 1,838,374 | | | | 393,433 | | | | 1,637,289 | | | | 30,089,137 | |
| Net asset value and offering price per share** | | $ | 21.63 | | | $ | 17.12 | | | $ | 41.29 | | | $ | 3.23 | |
| | | | | | | | | | | | | | | | | |
| Pricing of Class Y Shares | | | | | | | | | | | | | | | | |
| Net assets applicable to Class Y shares | | $ | 30,612,247 | | | $ | 57,438,401 | | | $ | 394,077,445 | | | $ | 383,050,110 | |
| Shares of beneficial interest outstanding (unlimited number of shares authorized, no par value) | | | 1,431,310 | | | | 3,202,731 | | | | 9,020,916 | | | | 63,467,011 | |
| Net asset value, offering price and redemption price per share | | $ | 21.39 | | | $ | 17.93 | | | $ | 43.68 | | | $ | 6.04 | |
| | | | | | | | | | | | | | | | | |
| Pricing of Institutional Class Shares | | | | | | | | | | | | | | | | |
| Net assets applicable to Institutional Class shares | | $ | — | | | $ | 2,260,311 | | | $ | 46,683,293 | | | $ | 8,122 | |
| Shares of beneficial interest outstanding (unlimited number of shares authorized, no par value) | | | — | | | | 126,135 | | | | 1,067,079 | | | | 1,345 | |
| Net asset value, offering price and redemption price per share | | $ | — | | | $ | 17.92 | | | $ | 43.75 | | | $ | 6.04 | |
| | | | | | | | | | | | | | | | | |
| Pricing of Class R6 Shares | | | | | | | | | | | | | | | | |
| Net assets applicable to Class R6 shares | | $ | — | | | $ | — | | | $ | — | | | $ | 76,245,695 | |
| Shares of beneficial interest outstanding (unlimited number of shares authorized, no par value) | | | — | | | | — | | | | — | | | | 13,495,234 | |
| Net asset value, offering price and redemption price per share | | $ | — | | | $ | — | | | $ | — | | | $ | 5.65 | |
* There is no sales load on subscriptions of $1 million or more. Redemptions that were part of a $1 million or more subscription may be subject to a contingent deferred sales load if redeemed within a one-year period from the date of purchase.
** Redemption price per share varies by length of time shares are held due to the terms of the contingent deferred sales charge.
See accompanying Notes to Financial Statements.
Statements of Operations
For the Period Ended June 30, 2018 and the Year Ended November 30, 2017
| | | Touchstone | |
| | | Balanced | |
| | | Fund | |
| | | For the Seven | | | For the | |
| | | Months Ended | | | Year Ended | |
| | | June 30, | | | November 30, | |
| | | 2018(B) | | | 2017(C) | |
| Investment Income | | | | | | | | |
| Dividends(A) | | $ | 2,839,955 | | | $ | 5,463,132 | |
| Interest | | | 1,383,170 | | | | 1,340,373 | |
| Income from securities loaned | | | 3,138 | | | | — | |
| Total Investment Income | | | 4,226,263 | | | | 6,803,505 | |
| Expenses | | | | | | | | |
| Investment advisory fees | | | 996,772 | | | | 1,780,771 | |
| Administration fees | | | 272,220 | | | | 157,368 | |
| Trustee and Compliance fees and expenses | | | 13,247 | | | | 76,057 | |
| Custody fees | | | 7,248 | | | | 29,967 | |
| Professional fees | | | 36,111 | | | | 37,709 | |
| Transfer Agent fees, Class A | | | 91,646 | | | | 408,175 | |
| Transfer Agent fees, Class C | | | 17,507 | | | | 61,257 | |
| Transfer Agent fees, Class Y | | | 17,176 | | | | 14,595 | |
| Transfer Agent fees, Institutional Class | | | — | | | | — | |
| Transfer Agent fees, Class R6 | | | — | | | | — | |
| Registration Fees, Class A | | | 8,961 | | | | 17,492 | |
| Registration Fees, Class C | | | 8,416 | | | | 13,629 | |
| Registration Fees, Class Y | | | 9,990 | | | | 14,268 | |
| Registration Fees, Institutional Class | | | — | | | | — | |
| Registration Fees, Class R6 | | | — | | | | — | |
| Reports to Shareholders, Class A | | | 2,424 | | | | 9,679 | |
| Reports to Shareholders, Class C | | | 667 | | | | 7,089 | |
| Reports to Shareholders, Class Y | | | 941 | | | | 5,123 | |
| Reports to Shareholders, Institutional Class | | | — | | | | — | |
| Reports to Shareholders, Class R6 | | | — | | | | — | |
| Distribution expenses, Class A | | | 364,730 | | | | 675,286 | |
| Distribution and shareholder servicing expenses, Class C | | | 240,494 | | | | 456,057 | |
| Other expenses | | | 75,915 | | | | 33,020 | |
| Total Expenses | | | 2,164,465 | | | | 3,797,542 | |
| Fees waived by the Advisor and/or Affiliates(D) | | | (118,730 | ) | | | (28,413 | ) |
| Net Expenses | | | 2,045,735 | | | | 3,769,129 | |
| Net Investment Income (Loss) | | | 2,180,528 | | | | 3,034,376 | |
| Realized and Unrealized Gains (Losses) on Investments | | | | | | | | |
| Net realized gains on investments(E)(F)(G) | | | 6,347,607 | | | | 15,905,772 | |
| Net realized gains (losses) on foreign currency transactions | | | — | | | | 121 | |
| Net change in unrealized appreciation (depreciation) on investments(H) | | | (3,085,132 | ) | | | 30,193,699 | |
| Net change in unrealized appreciation (depreciation) on foreign currency transactions | | | — | | | | — | |
| Net Realized and Unrealized Gains (Losses) on Investments | | | 3,262,475 | | | | 46,099,592 | |
| Change in Net Assets Resulting from Operations | | $ | 5,443,003 | | | $ | 49,133,968 | |
| (A) | Net of foreign tax withholding of: | | $ | 17,369 | | | $ | 39,841 | |
| (B) | The Fund changed its fiscal year from November 30 to June 30. |
| (C) | See Note 9 in Notes to Financial Statements. |
| (D) | See Note 4 in Notes to Financial Statements. |
| (E) | Includes deferred foreign capital gains tax paid of $604,469 for the International Equity Fund for the period ended June 30, 2018. |
| (F) | For the period ended June 30, 2018, the Large Cap Focused Fund had redemptions-in-kind of securities in the amount of $ 113,896,614. Net realized gains on investments includes the realized gain on the transactions of $80,716,028, which will not be realized by the Fund for tax purposes. |
| (G) | For the year ended November 30, 2017, the Large Cap Focused Fund had a redemption-in-kind of securities in the amount of $17,324,054. Net realized gains on investments includes the realized gain on the transaction of $14,298,673, which will not be realized by the Fund for tax purposes. |
| (H) | Includes change in deferred foreign capital gains tax of $675,346 for the International Equity Fund for the period ended June 30, 2018. See accompanying Notes to Financial Statements. |
Statements of Operations (Continued)
| Touchstone | | | Touchstone | | | Touchstone | |
| International Equity | | | Large Cap Focused | | | Small Company | |
| Fund | | | Fund | | | Fund | |
| For the Seven | | | For the | | | For the Seven | | | For the | | | For the Seven | | | For the | |
| Months Ended | | | Year Ended | | | Months Ended | | | Year Ended | | | Months Ended | | | Year Ended | |
| June 30, | | | November 30, | | | June 30, | | | November 30, | | | June 30, | | | November 30, | |
| 2018(B) | | | 2017(C) | | | 2018(B) | | | 2017(C) | | | 2018(B) | | | 2017(C) | |
| | | | | | | | | | | | | | | | | |
| $ | 5,090,436 | | | $ | 4,358,267 | | | $ | 19,361,931 | | | $ | 39,950,628 | | | $ | 5,862,292 | | | $ | 7,036,682 | |
| | — | | | | 25,246 | | | | — | | | | 246,474 | | | | 10,710 | | | | 895,668 | |
| | 60,393 | | | | — | | | | 16,819 | | | | — | | | | 9,060 | | | | 7,151 | |
| | 5,150,829 | | | | 4,383,513 | | | | 19,378,750 | | | | 40,197,102 | | | | 5,882,062 | | | | 7,939,501 | |
| | | | | | | | | | | | | | | | | | | | | | | |
| | 808,770 | | | | 1,339,833 | | | | 6,180,210 | | | | 11,641,206 | | | | 4,493,912 | | | | 7,434,256 | |
| | 167,531 | | | | 90,849 | | | | 1,514,338 | | | | 931,012 | | | | 1,025,311 | | | | 548,434 | |
| | 13,247 | | | | 44,721 | | | | 13,247 | | | | 423,398 | | | | 13,247 | | | | 273,364 | |
| | 22,275 | | | | 55,449 | | | | 15,274 | | | | 122,171 | | | | 12,656 | | | | 76,059 | |
| | 34,704 | | | | 42,062 | | | | 62,739 | | | | 58,224 | | | | 49,831 | | | | 53,558 | |
| | 58,487 | | | | 329,763 | | | | 370,982 | | | | 1,441,521 | | | | 434,911 | | | | 1,277,202 | |
| | 5,276 | | | | 24,600 | | | | 33,364 | | | | 106,440 | | | | 55,849 | | | | 173,352 | |
| | 37,688 | | | | 67,998 | | | | 251,083 | | | | 420,749 | | | | 222,587 | | | | 348,442 | |
| | 16 | | | | 34 | | | | 16,225 | | | | 597 | | | | 3 | | | | 31 | |
| | — | | | | — | | | | — | | | | — | | | | 254 | | | | 794 | |
| | 8,145 | | | | 15,712 | | | | 10,595 | | | | 33,111 | | | | 11,548 | | | | 31,048 | |
| | 5,933 | | | | 13,691 | | | | 10,289 | | | | 14,269 | | | | 12,325 | | | | 17,591 | |
| | 9,261 | | | | 24,994 | | | | 18,116 | | | | 22,168 | | | | 15,814 | | | | 31,359 | |
| | 5,685 | | | | 270 | | | | 8,981 | | | | 7,897 | | | | 9,737 | | | | 454 | |
| | — | | | | — | | | | — | | | | — | | | | 10,461 | | | | 7,992 | |
| | 2,887 | | | | 8,860 | | | | 5,066 | | | | 45,348 | | | | 4,698 | | | | 58,873 | |
| | 845 | | | | 4,484 | | | | 975 | | | | 10,500 | | | | 2,100 | | | | 15,550 | |
| | 2,726 | | | | 9,925 | | | | — | | | | 26,386 | | | | 12,767 | | | | 33,398 | |
| | 581 | | | | 3,810 | | | | 1,312 | | | | 5,990 | | | | 726 | | | | 3,810 | |
| | — | | | | — | | | | — | | | | — | | | | 831 | | | | 5,882 | |
| | 184,808 | | | | 314,448 | | | | 1,841,099 | | | | 3,379,466 | | | | 967,261 | | | | 1,685,559 | |
| | 41,222 | | | | 67,951 | | | | 412,261 | | | | 815,288 | | | | 581,788 | | | | 1,070,272 | |
| | 63,406 | | | | 67,110 | | | | 435,914 | | | | 156,731 | | | | 141,522 | | | | 50,784 | |
| | 1,473,493 | | | | 2,526,564 | | | | 11,202,070 | | | | 19,662,472 | | | | 8,080,139 | | | | 13,198,064 | |
| | (98,681 | ) | | | (37,546 | ) | | | (1,304,229 | ) | | | (94,117 | ) | | | (596,684 | ) | | | (29,439 | ) |
| | 1,374,812 | | | | 2,489,018 | | | | 9,897,841 | | | | 19,568,355 | | | | 7,483,455 | | | | 13,168,625 | |
| | 3,776,017 | | | | 1,894,495 | | | | 9,480,909 | | | | 20,628,747 | | | | (1,601,393 | ) | | | (5,229,124 | ) |
| | | | | | | | | | | | | | | | | | | | | | | |
| | 15,735,396 | | | | 7,331,990 | | | | 131,863,649 | | | | 326,285,220 | | | | 59,511,081 | | | | 125,291,363 | |
| | (121,895 | ) | | | (82,018 | ) | | | — | | | | 937 | | | | — | | | | — | |
| | (25,660,986 | ) | | | 35,678,455 | | | | (54,861,111 | ) | | | 77,569,795 | | | | 25,431,940 | | | | 72,290,088 | |
| | (4,285 | ) | | | 38,455 | | | | — | | | | — | | | | — | | | | — | |
| | (10,051,770 | ) | | | 42,966,882 | | | | 77,002,538 | | | | 403,855,952 | | | | 84,943,021 | | | | 197,581,451 | |
| $ | (6,275,753 | ) | | $ | 44,861,377 | | | $ | 86,483,447 | | | $ | 424,484,699 | | | $ | 83,341,628 | | | $ | 192,352,327 | |
| $ | 335,481 | | | $ | 554,278 | | | $ | 103,671 | | | $ | 486,517 | | | $ | 21,275 | | | $ | 40,850 | |
Statements of Changes in Net Assets
| | | Touchstone Balanced Fund | |
| | | For the | | | | | | | |
| | | Seven Months | | | For the Year | | | For the Year | |
| | | Ended | | | Ended | | | Ended | |
| | | June 30, | | | November 30, | | | November 30, | |
| | | 2018(A) | | | 2017(B) | | | 2016(B) | |
| From Operations | | | | | | | | | | | | |
| Net investment income | | $ | 2,180,528 | | | $ | 3,034,376 | | | $ | 3,476,233 | |
| Net realized gains (losses) on investments and foreign currency transactions | | | 6,347,607 | | | | 15,905,893 | | | | 2,775,604 | |
| Net change in unrealized appreciation (depreciation) on investments and foreign currency transactions | | | (3,085,132 | ) | | | 30,193,699 | | | | 8,122,265 | |
| Change in Net Assets from Operations | | | 5,443,003 | | | | 49,133,968 | | | | 14,374,102 | |
| | | | | | | | | | | | | |
| Distributions to Shareholders from: | | | | | | | | | | | | |
| Net investment income, Class A | | | (2,042,843 | ) | | | (3,241,942 | ) | | | (5,903,448 | ) |
| Net investment income, Class C | | | (98,271 | ) | | | (199,892 | ) | | | (557,296 | ) |
| Net investment income, Class Y | | | (306,197 | ) | | | (283,053 | ) | | | (306,472 | ) |
| Net investment income, Institutional Class | | | — | | | | — | | | | — | |
| Net realized gains, Class A | | | (11,994,902 | ) | | | (1,736,894 | ) | | | (8,375,703 | ) |
| Net realized gains, Class C | | | (1,997,013 | ) | | | (284,357 | ) | | | (1,138,389 | ) |
| Net realized gains, Class Y | | | (1,470,918 | ) | | | (102,948 | ) | | | (402,692 | ) |
| Net realized gains, Institutional Class | | | — | | | | — | | | | — | |
| Total Distributions | | | (17,910,144 | ) | | | (5,849,086 | ) | | | (16,684,000 | ) |
| | | | | | | | | | | | | |
| Net Increase (Decrease) from Share Transactions(C) | | | (10,388,249 | ) | | | (33,445,071 | ) | | | 13,554,035 | |
| | | | | | | | | | | | | |
| Total Increase (Decrease) in Net Assets | | | (22,855,390 | ) | | | 9,839,811 | | | | 11,244,137 | |
| | | | | | | | | | | | | |
| Net Assets | | | | | | | | | | | | |
| Beginning of period | | | 332,293,318 | | | | 322,453,507 | | | | 311,209,370 | |
| End of period | | $ | 309,437,928 | | | $ | 332,293,318 | | | $ | 322,453,507 | |
| Accumulated Net Investment Income | | $ | 224,126 | | | $ | 306,053 | | | $ | 590,626 | |
| (A) | The Fund changed its fiscal year end from November 30 to June 30. |
| (B) | See Note 9 in Notes to Financial Statements. |
| (C) | For details on share transactions by class, see Statements of Changes in Net Assets - Capital Stock Activity on pages 42 - 43. |
See accompanying Notes to Financial Statements.
Statements of Changes in Net Assets (Continued)
| Touchstone International Equity Fund | |
| For the | | | | | | | |
| Seven Months | | | For the Year | | | For the Year | |
| Ended | | | Ended | | | Ended | |
| June 30, | | | November 30, | | | November 30, | |
| 2018(A) | | | 2017(B) | | | 2016(B) | |
| | | | | | | | | | | |
| $ | 3,776,017 | | | $ | 1,894,495 | | | $ | 1,716,938 | |
| | 15,613,501 | | | | 7,249,972 | | | | (534,656 | ) |
| | (25,665,271 | ) | | | 35,716,910 | | | | (9,079,558 | ) |
| | (6,275,753 | ) | | | 44,861,377 | | | | (7,897,276 | ) |
| | | | | | | | | | | |
| | | | | | | | | | | |
| | (1,381,745 | ) | | | (764,365 | ) | | | (813,762 | ) |
| | — | | | | — | | | | — | |
| | (927,040 | ) | | | (486,213 | ) | | | (163,018 | ) |
| | (52 | ) | | | — | | | | — | |
| | (4,565,200 | ) | | | — | | | | (3,278,878 | ) |
| | (262,489 | ) | | | — | | | | (146,299 | ) |
| | (2,274,644 | ) | | | — | | | | (435,123 | ) |
| | (117 | ) | | | — | | | | — | |
| | (9,411,287 | ) | | | (1,250,578 | ) | | | (4,837,080 | ) |
| | | | | | | | | | | |
| | 1,127,073 | | | | (5,244,715 | ) | | | 40,844,204 | |
| | | | | | | | | | | |
| | (14,559,967 | ) | | | 38,366,084 | | | | 28,109,848 | |
| | | | | | | | | | | |
| | 199,386,447 | | | | 161,020,363 | | | | 132,910,515 | |
| $ | 184,826,480 | | | $ | 199,386,447 | | | $ | 161,020,363 | |
| $ | 1,889,327 | | | $ | 1,037,307 | | | $ | 475,407 | |
Statements of Changes in Net Assets (Continued)
| | | Touchstone Large Cap Focused Fund | |
| | | For the | | | | | | | |
| | | Seven Months | | | For the Year | | | For the Year | |
| | | Ended | | | Ended | | | Ended | |
| | | June 30, | | | November 30, | | | November 30, | |
| | | 2018(A) | | | 2017(B) | | | 2016(B) | |
| From Operations | | | | | | | | | | | | |
| Net investment income (loss) | | $ | 9,480,909 | | | $ | 20,628,747 | | | $ | 28,782,872 | |
| Net realized gains on investments and foreign currency transactions | | | 131,863,649 | | | | 326,286,157 | | | | 115,779,861 | |
| Net change in unrealized appreciation (depreciation) on investments | | | (54,861,111 | ) | | | 77,569,795 | | | | 5,723,736 | |
| Change in Net Assets from Operations | | | 86,483,447 | | | | 424,484,699 | | | | 150,286,469 | |
| | | | | | | | | | | | | |
| Distributions to Shareholders from: | | | | | | | | | | | | |
| Net investment income, Class A | | | (1,856,543 | ) | | | (15,710,842 | ) | | | (35,777,405 | ) |
| Net investment income, Class C | | | — | | | | (349,488 | ) | | | (1,690,016 | ) |
| Net investment income, Class Y | | | (1,927,798 | ) | | | (7,901,170 | ) | | | (19,023,933 | ) |
| Net investment income, Institutional Class | | | (218,011 | ) | | | (519,211 | ) | | | (588,231 | ) |
| Net realized gains, Class A | | | (183,755,594 | ) | | | (77,329,736 | ) | | | (88,022,127 | ) |
| Net realized gains, Class C | | | (10,906,303 | ) | | | (5,018,041 | ) | | | (5,826,909 | ) |
| Net realized gains, Class Y | | | (64,798,741 | ) | | | (31,927,617 | ) | | | (42,756,022 | ) |
| Net realized gains, Institutional Class | | | (6,199,833 | ) | | | (1,506,542 | ) | | | (1,116,259 | ) |
| Net realized gains, Class R6 | | | — | | | | — | | | | — | |
| Total Distributions | | | (269,662,823 | ) | | | (140,262,647 | ) | | | (194,800,902 | ) |
| | | | | | | | | | | | | |
| Net Increase (Decrease) from Share Transactions(C) | | | 31,161,686 | | | | (421,767,332 | ) | | | (152,606,260 | ) |
| | | | | | | | | | | | | |
| Total Increase (Decrease) in Net Assets | | | (152,017,690 | ) | | | (137,545,280 | ) | | | (197,120,693 | ) |
| | | | | | | | | | | | | |
| Net Assets | | | | | | | | | | | | |
| Beginning of period | | | 1,879,098,377 | | | | 2,016,643,657 | | | | 2,213,764,350 | |
| End of period | | $ | 1,727,080,687 | | | $ | 1,879,098,377 | | | $ | 2,016,643,657 | |
| Accumulated Net Investment Income (Loss) | | $ | 5,226,183 | | | $ | 2,586,763 | | | $ | 6,778,552 | |
| (A) | The Fund changed its fiscal year end from November 30 to June 30. |
| (B) | See Note 9 in Notes to Financial Statements. |
| (C) | For details on share transactions by class, see Statements of Changes in Net Assets - Capital Stock Activity on pages 44 - 45. |
See accompanying Notes to Financial Statements.
Statements of Changes in Net Assets (Continued)
| Touchstone Small Company Fund | |
| For the | | | | | | | |
| Seven Months | | | For the Year | | | For the Year | |
| Ended | | | Ended | | | Ended | |
| June 30, | | | November 30, | | | November 30, | |
| 2018(A) | | | 2017(B) | | | 2016(B) | |
| | | | | | | | | | | |
| $ | (1,601,393 | ) | | $ | (5,229,124 | ) | | $ | (3,537,031 | ) |
| | 59,511,081 | | | | 125,291,363 | | | | 89,651,921 | |
| | 25,431,940 | | | | 72,290,088 | | | | 34,009,436 | |
| | 83,341,628 | | | | 192,352,327 | | | | 120,124,326 | |
| | | | | | | | | | | |
| | | | | | | | | | | |
| | — | | | | — | | | | — | |
| | — | | | | — | | | | — | |
| | — | | | | — | | | | — | |
| | — | | | | — | | | | — | |
| | (55,816,413 | ) | | | (54,250,628 | ) | | | (99,287,043 | ) |
| | (13,671,576 | ) | | | (13,229,732 | ) | | | (24,962,262 | ) |
| | (29,679,392 | ) | | | (20,710,154 | ) | | | (34,832,569 | ) |
| | (203 | ) | | | — | | | | — | |
| | (5,534,630 | ) | | | (1,025,672 | ) | | | (106,313 | ) |
| | (104,702,214 | ) | | | (89,216,186 | ) | | | (159,188,187 | ) |
| | | | | | | | | | | |
| | 3,102,430 | | | | 66,295,636 | | | | 179,997,957 | |
| | | | | | | | | | | |
| | (18,258,156 | ) | | | 169,431,777 | | | | 140,934,096 | |
| | | | | | | | | | | |
| | 1,236,563,656 | | | | 1,067,131,879 | | | | 926,197,783 | |
| $ | 1,218,305,500 | | | $ | 1,236,563,656 | | | $ | 1,067,131,879 | |
| $ | — | | | $ | — | | | $ | (3,393,354 | ) |
Statements of Changes in Net Assets - Capital Stock Activity
| | | Touchstone Balanced Fund | |
| | | For the Seven Months | | | For the Year | | | For the Year | |
| | | Ended | | | Ended | | | Ended | |
| | | June 30, 2018(A) | | | November 30, 2017(B) | | | November 30, 2016(B) | |
| | | Shares | | | Dollars | | | Shares | | | Dollars | | | Shares | | | Dollars | |
| Class A | | | | | | | | | | | | | | | | | | | | | | | | |
| Proceeds from Shares issued | | | 511,448 | | | $ | 11,135,471 | | | | 1,213,883 | | | $ | 25,250,539 | | | | 1,565,029 | | | $ | 29,691,528 | |
| Reinvestment of distributions | | | 624,673 | | | | 13,440,191 | | | | 232,528 | | | | 4,719,857 | | | | 714,717 | | | | 13,537,834 | |
| Cost of Shares redeemed | | | (1,566,532 | ) | | | (34,116,123 | ) | | | (3,376,990 | ) | | | (71,336,387 | ) | | | (2,065,116 | ) | | | (39,491,955 | ) |
| Change from Class A Share Transactions | | | (430,411 | ) | | | (9,540,461 | ) | | | (1,930,579 | ) | | | (41,365,991 | ) | | | 214,630 | | | | 3,737,407 | |
| Class C | | | | | | | | | | | | | | | | | | | | | | | | |
| Proceeds from Shares issued | | | 103,613 | | | | 2,254,694 | | | | 380,017 | | | | 7,809,067 | | | | 674,076 | | | | 12,858,314 | |
| Reinvestment of distributions | | | 91,678 | | | | 1,983,483 | | | | 22,578 | | | | 454,129 | | | | 83,917 | | | | 1,594,901 | |
| Cost of Shares redeemed | | | (262,440 | ) | | | (5,705,271 | ) | | | (679,379 | ) | | | (14,377,072 | ) | | | (348,665 | ) | | | (6,674,997 | ) |
| Change from Class C Share Transactions | | | (67,149 | ) | | | (1,467,094 | ) | | | (276,784 | ) | | | (6,113,876 | ) | | | 409,328 | | | | 7,778,218 | |
| Class Y(C) | | | | | | | | | | | | | | | | | | | | | | | | |
| Proceeds from Shares issued | | | 191,050 | | | | 4,149,196 | | | | 1,036,380 | | | | 21,843,739 | | | | 375,707 | | | | 7,158,331 | |
| Reinvestment of distributions | | | 79,069 | | | | 1,689,671 | | | | 15,954 | | | | 323,761 | | | | 32,255 | | | | 607,739 | |
| Cost of Shares redeemed | | | (240,934 | ) | | | (5,219,561 | ) | | | (390,115 | ) | | | (8,132,704 | ) | | | (304,459 | ) | | | (5,727,660 | ) |
| Change from Class Y Share Transactions | | | 29,185 | | | | 619,306 | | | | 662,219 | | | | 14,034,796 | | | | 103,503 | | | | 2,038,410 | |
| Institutional Class(D) | | | | | | | | | | | | | | | | | | | | | | | | |
| Proceeds from Shares issued | | | — | | | | — | | | | — | | | | — | | | | — | | | | — | |
| Reinvestment of distributions | | | — | | | | — | | | | — | | | | — | | | | — | | | | — | |
| Cost of Shares redeemed | | | — | | | | — | | | | — | | | | — | | | | — | | | | — | |
| Change from Institutional Class Share Transactions | | | — | | | | — | | | | — | | | | — | | | | — | | | | — | |
| Change from Share Transactions | | | (468,375 | ) | | $ | (10,388,249 | ) | | | (1,545,144 | ) | | $ | (33,445,071 | ) | | | 727,461 | | | $ | 13,554,035 | |
| (A) | The Fund changed its fiscal year from November 30 to June 30. |
| (B) | See Note 9 in Notes to Financial Statements. |
| (C) | Effective October 28, 2017, Class I shares of the Sentinel Balanced Fund and Sentinel International Equity Fund (the “Predecessor Funds”) were reorganized into Class Y shares of the Touchstone Balanced Fund and Touchstone International Equity Fund, respectively. |
| (D) | The International Equity Fund began issuing Institutional Class shares on October 30, 2017. |
See accompanying Notes to Financial Statements.
Statements of Changes in Net Assets - Capital Stock Activity (Continued)
| Touchstone International Equity Fund | |
| For the Seven Months | | | For the Year | | | For the Year | |
| Ended | | | Ended | | | Ended | |
| June 30, 2018(A) | | | November 30, 2017(B) | | | November 30, 2016(B) | |
| Shares | | | Dollars | | | Shares | | | Dollars | | | Shares | | | Dollars | |
| | | | | | | | | | | | | | | | | | | | | | | |
| | 473,654 | | | $ | 9,152,679 | | | | 1,311,801 | | | $ | 23,285,877 | | | | 1,553,659 | | | $ | 25,111,407 | |
| | 293,806 | | | | 5,682,188 | | | | 44,226 | | | | 688,604 | | | | 243,606 | | | | 3,919,623 | |
| | (822,238 | ) | | | (15,736,184 | ) | | | (2,162,637 | ) | | | (38,654,321 | ) | | | (1,107,176 | ) | | | (17,785,789 | ) |
| | (54,778 | ) | | | (901,317 | ) | | | (806,610 | ) | | | (14,679,840 | ) | | | 690,089 | | | | 11,245,241 | |
| | | | | | | | | | | | | | | | | | | | | | | |
| | 70,047 | | | | 1,268,035 | | | | 133,628 | | | | 2,213,614 | | | | 151,705 | | | | 2,310,222 | |
| | 13,759 | | | | 252,206 | | | | — | | | | — | | | | 9,255 | | | | 142,064 | |
| | (65,387 | ) | | | (1,176,556 | ) | | | (159,419 | ) | | | (2,683,483 | ) | | | (54,798 | ) | | | (835,594 | ) |
| | 18,419 | | | | 343,685 | | | | (25,791 | ) | | | (469,869 | ) | | | 106,162 | | | | 1,616,692 | |
| | | | | | | | | | | | | | | | | | | | | | | |
| | 807,622 | | | | 15,303,803 | | | | 2,569,654 | | | | 45,276,408 | | | | 2,607,571 | | | | 41,542,080 | |
| | 164,684 | | | | 3,143,813 | | | | 30,455 | | | | 468,087 | | | | 34,334 | | | | 545,916 | |
| | (1,024,275 | ) | | | (19,283,081 | ) | | | (1,976,731 | ) | | | (35,842,676 | ) | | | (901,887 | ) | | | (14,105,725 | ) |
| | (51,969 | ) | | | (835,465 | ) | | | 623,378 | | | | 9,901,819 | | | | 1,740,018 | | | | 27,982,271 | |
| | | | | | | | | | | | | | | | | | | | | | | |
| | 125,960 | | | | 2,520,019 | | | | 167 | | | | 3,175 | | | | — | | | | — | |
| | 9 | | | | 169 | | | | — | | | | — | | | | — | | | | — | |
| | (1 | ) | | | (18 | ) | | | — | | | | — | | | | — | | | | — | |
| | 125,968 | | | | 2,520,170 | | | | 167 | | | | 3,175 | | | | — | | | | — | |
| | 37,640 | | | $ | 1,127,073 | | | | (208,856 | ) | | $ | (5,244,715 | ) | | | 2,536,269 | | | $ | 40,844,204 | |
Statements of Changes in Net Assets - Capital Stock Activity (Continued)
| | | Touchstone Large Cap Focused Fund | |
| | | For the Seven Months | | | For the Year | | | For the Year | |
| | | Ended | | | Ended | | | Ended | |
| | | June 30, 2018(A) | | | November 30, 2017(B) | | | November 30, 2016(B) | |
| | | Shares | | | Dollars | | | Shares | | | Dollars | | | Shares | | | Dollars | |
| Class A | | | | | | | | | | | | | | | | | | | | | | | | |
| Proceeds from Shares issued | | | 815,107 | | | $ | 35,628,247 | | | | 1,459,660 | | | $ | 63,541,135 | | | | 2,011,742 | | | $ | 79,630,789 | |
| Proceeds from Shares issued in connection with reorganization(C) | | | — | | | | — | | | | — | | | | — | | | | — | | | | — | |
| Reinvestment of distributions | | | 3,889,740 | | | | 165,033,926 | | | | 1,998,894 | | | | 82,231,470 | | | | 2,743,659 | | | | 108,807,856 | |
| Cost of Shares redeemed | | | (3,982,603 | ) | | | (177,279,849 | ) | | | (8,302,661 | ) | | | (368,083,987 | ) | | | (5,680,117 | ) | | | (227,322,184 | ) |
| Change from Class A Share Transactions | | | 722,244 | | | | 23,382,324 | | | | (4,844,107 | ) | | | (222,311,382 | ) | | | (924,716 | ) | | | (38,883,539 | ) |
| Class C | | | | | | | | | | | | | | | | | | | | | | | | |
| Proceeds from Shares issued | | | 50,250 | | | | 2,070,075 | | | | 211,838 | | | | 8,585,918 | | | | 229,138 | | | | 8,735,036 | |
| Proceeds from Shares issued in connection with reorganization(C) | | | — | | | | — | | | | — | | | | — | | | | — | | | | — | |
| Reinvestment of distributions | | | 260,648 | | | | 10,467,621 | | | | 130,769 | | | | 5,107,041 | | | | 187,505 | | | | 7,117,912 | |
| Cost of Shares redeemed | | | (268,366 | ) | | | (11,164,662 | ) | | | (806,388 | ) | | | (34,030,006 | ) | | | (531,259 | ) | | | (20,322,699 | ) |
| Change from Class C Share Transactions | | | 42,532 | | | | 1,373,034 | | | | (463,781 | ) | | | (20,337,047 | ) | | | (114,616 | ) | | | (4,469,751 | ) |
| Class Y(D) | | | | | | | | | | | | | | | | | | | | | | | | |
| Proceeds from Shares issued | | | 1,429,384 | | | | 64,702,421 | | | | 2,583,052 | | | | 111,976,965 | | | | 2,399,401 | | | | 95,152,331 | |
| Proceeds from Shares issued in connection with reorganization(C) | | | — | | | | — | | | | — | | | | — | | | | — | | | | — | |
| Reinvestment of distributions | | | 1,306,403 | | | | 55,221,657 | | | | 781,425 | | | | 32,153,805 | | | | 1,261,092 | | | | 49,976,190 | |
| Cost of Shares redeemed | | | (2,719,325 | ) | | | (118,462,809 | ) | | | (7,436,364 | ) | | | (331,943,211 | ) | | | (6,597,450 | ) | | | (266,012,904 | ) |
| Change from Class Y Share Transactions | | | 16,462 | | | | 1,461,269 | | | | (4,071,887 | ) | | | (187,812,441 | ) | | | (2,936,957 | ) | | | (120,884,383 | ) |
| Institutional Class(E)(F) | | | | | | | | | | | | | | | | | | | | | | | | |
| Proceeds from Shares issued | | | 3,028,530 | | | | 135,629,681 | | | | 1,083,816 | | | | 49,314,099 | | | | 519,016 | | | | 21,445,402 | |
| Reinvestment of distributions | | | 151,651 | | | | 6,417,844 | | | | 48,834 | | | | 2,025,753 | | | | 42,879 | | | | 1,704,490 | |
| Cost of Shares redeemed | | | (3,029,751 | ) | | | (137,102,466 | ) | | | (923,130 | ) | | | (42,646,314 | ) | | | (277,504 | ) | | | (11,518,479 | ) |
| Change from Institutional Class Share Transactions | | | 150,430 | | | | 4,945,059 | | | | 209,520 | | | | 8,693,538 | | | | 284,391 | | | | 11,631,413 | |
| Class R6 | | | | | | | | | | | | | | | | | | | | | | | | |
| Proceeds from Shares issued | | | — | | | | — | | | | — | | | | — | | | | — | | | | — | |
| Reinvestment of distributions | | | — | | | | — | | | | — | | | | — | | | | — | | | | — | |
| Cost of Shares redeemed | | | — | | | | — | | | | — | | | | — | | | | — | | | | — | |
| Change from Class R6 Share Transactions | | | — | | | | — | | | | — | | | | — | | | | — | | | | — | |
| Change from Share Transactions | | | 931,668 | | | $ | 31,161,686 | | | | (9,170,255 | ) | | $ | (421,767,332 | ) | | | (3,691,898 | ) | | $ | (152,606,260 | ) |
| (A) | The Fund changed its fiscal year from November 30 to June 30. |
| (B) | See Note 9 in Notes to Financial Statements. |
| (C) | See Note 9 for specific details of the Plan of Reorganization. The reorganization was completed following the close of business on March 30, 2016 by a tax-free exchange of 5,792,669 shares of the Sentinel Mid Cap Fund Class A for 21,750,338 shares of the Sentinel Small Company Fund (the “Predecessor Fund” to the Touchstone Small Company Fund) Class A , a merger conversion ratio of 3.75480448; 746,855 shares of the Sentinel Mid Cap Fund Class C for 3,030,573 shares of the Predecessor Fund Class C, a merger conversion ratio of 4.05778094; 306,597 shares of the Sentinel Mid Cap Fund Class I for 1,122,267 shares of the Predecessor Fund Class I, a merger conversion ratio of 3.66039781; and none for the Predecessor Fund Class R6 because the Sentinel Mid Cap Fund did not offer a comparable share class. |
| (D) | Effective October 28, 2017, Class I shares of the Sentinel Common Stock Fund and Sentinel Small Company Fund (the “Predecessor Funds”) were reorganized into Class Y shares of the Touchstone Large Cap Focused Fund and Touchstone Small Company Fund, respectively. |
| (E) | Effective October 30, 2017, Class R6 shares of the Sentinel Common Stock Fund (the “Predecessor Fund”) were reorganized into Institutional Class shares of the Touchstone Large Cap Focused Fund. |
| (F) | The Small Company Fund began issuing Institutional Class shares on October 30, 2017. |
See accompanying Notes to Financial Statements.
Statements of Changes in Net Assets - Capital Stock Activity (Continued)
| Touchstone Small Company Fund | |
| For the Seven Months | | | For the Year | | | For the Year | |
| Ended | | | Ended | | | Ended | |
| June 30, 2018(A) | | | November 30, 2017(B) | | | November 30, 2016(B) | |
| Shares | | | Dollars | | | Shares | | | Dollars | | | Shares | | | Dollars | |
| | | | | | | | | | | | | | | | | |
| | 5,895,776 | | | $ | 31,725,207 | | | | 12,736,974 | | | $ | 64,922,273 | | | | 13,503,919 | | | $ | 61,857,550 | |
| | — | | | | — | | | | — | | | | — | | | | 21,750,338 | | | | 97,558,873 | |
| | 9,931,506 | | | | 51,941,762 | | | | 10,260,090 | | | | 50,274,442 | | | | 20,377,103 | | | | 91,333,636 | |
| | (16,353,009 | ) | | | (88,164,421 | ) | | | (35,156,499 | ) | | | (181,071,810 | ) | | | (30,416,453 | ) | | | (140,182,495 | ) |
| | (525,727 | ) | | | (4,497,452 | ) | | | (12,159,435 | ) | | | (65,875,095 | ) | | | 25,214,907 | | | | 110,567,564 | |
| | | | | | | | | | | | | | | | | | | | | | | |
| | 1,201,762 | | | | 3,809,548 | | | | 4,275,835 | | | | 13,492,231 | | | | 3,214,030 | | | | 9,681,443 | |
| | | | | | | | | | | | | | | | | | | | | | | |
| | — | | | | — | | | | — | | | | — | | | | 3,030,573 | | | | 8,942,615 | |
| | 4,368,606 | | | | 13,367,905 | | | | 4,154,959 | | | | 12,714,176 | | | | 8,091,895 | | | | 23,881,812 | |
| | (5,246,225 | ) | | | (16,802,180 | ) | | | (11,339,284 | ) | | | (36,511,088 | ) | | | (8,674,499 | ) | | | (26,656,802 | ) |
| | 324,143 | | | | 375,273 | | | | (2,908,490 | ) | | | (10,304,681 | ) | | | 5,661,999 | | | | 15,849,068 | |
| | 10,885,478 | | | | 63,650,858 | | | | 33,014,830 | | | | 182,189,524 | | | | 16,511,503 | | | | 81,203,549 | |
| | — | | | | — | | | | — | | | | — | | | | 1,122,267 | | | | 5,382,625 | |
| | 4,412,737 | | | | 25,152,605 | | | | 3,158,900 | | | | 16,678,996 | | | | 5,753,132 | | | | 27,513,172 | |
| | (15,544,983 | ) | | | (91,507,813 | ) | | | (18,800,069 | ) | | | (104,298,111 | ) | | | (14,489,625 | ) | | | (71,757,069 | ) |
| | (246,768 | ) | | | (2,704,350 | ) | | | 17,373,661 | | | | 94,570,409 | | | | 8,897,277 | | | | 42,342,277 | |
| | | | | | | | | | | | | | | | | | | | | | | |
| | 878 | | | | 5,183 | | | | 431 | | | | 2,500 | | | | — | | | | — | |
| | 36 | | | | 203 | | | | — | | | | — | | | | — | | | | — | |
| | — | | | | — | | | | — | | | | — | | | | — | | | | — | |
| | 914 | | | | 5,386 | | | | 431 | | | | 2,500 | | | | — | | | | — | |
| | | | | | | | | | | | | | | | | | | | | | | |
| | 2,887,650 | | | | 16,010,197 | | | | 11,135,743 | | | | 58,124,146 | | | | 2,539,283 | | | | 12,035,697 | |
| | 1,038,392 | | | | 5,534,630 | | | | 206,788 | | | | 1,025,672 | | | | 23,450 | | | | 106,313 | |
| | (2,127,109 | ) | | | (11,621,254 | ) | | | (2,126,522 | ) | | | (11,247,315 | ) | | | (189,301 | ) | | | (902,962 | ) |
| | 1,798,933 | | | | 9,923,573 | | | | 9,216,009 | | | | 47,902,503 | | | | 2,373,432 | | | | 11,239,048 | |
| | 1,351,495 | | | $ | 3,102,430 | | | | 11,522,176 | | | $ | 66,295,636 | | | | 42,147,615 | | | $ | 179,997,957 | |
Financial Highlights
Touchstone Balanced Fund—Class A
Selected Data for a Share Outstanding Throughout Each Period
| | | Seven Months | | | | | | | | | | | | | | | | |
| | | Ended | | | | | | | | | | | | | | | | |
| | | June 30, | | | Year Ended November 30, | |
| | | 2018(A) | | | 2017 | | | 2016 | | | 2015 | | | 2014 | | | 2013 | |
| Net asset value at beginning of period | | $ | 22.40 | | | $ | 19.68 | | | $ | 19.87 | | | $ | 20.98 | | | $ | 20.23 | | | $ | 18.03 | |
| Income (loss) from investment operations: | | | | | | | | | | | | | | | | | | | | | | | | |
| Net investment income | | | 0.16 | | | | 0.21 | | | | 0.23 | (B) | | | 0.43 | (B) | | | 0.26 | (B) | | | 0.23 | (B) |
| Net realized and unrealized gains (losses) on investments | | | 0.22 | | | | 2.89 | | | | 0.66 | | | | (0.35 | ) | | | 1.50 | | | | 2.91 | |
| Total from investment operations | | | 0.38 | | | | 3.10 | | | | 0.89 | | | | 0.08 | | | | 1.76 | | | | 3.14 | |
| Distributions from: | | | | | | | | | | | | | | | | | | | | | | | | |
| Net investment income | | | (0.18 | ) | | | (0.25 | ) | | | (0.44 | ) | | | (0.30 | ) | | | (0.26 | ) | | | (0.26 | ) |
| Realized capital gains | | | (1.06 | ) | | | (0.13 | ) | | | (0.64 | ) | | | (0.89 | ) | | | (0.75 | ) | | | (0.68 | ) |
| Total distributions | | | (1.24 | ) | | | (0.38 | ) | | | (1.08 | ) | | | (1.19 | ) | | | (1.01 | ) | | | (0.94 | ) |
| Net asset value at end of period | | $ | 21.54 | | | $ | 22.40 | | | $ | 19.68 | | | $ | 19.87 | | | $ | 20.98 | | | $ | 20.23 | |
| Total return(C) | | | 1.72 | %(D) | | | 15.95 | % | | | 4.75 | % | | | 0.56 | % | | | 9.10 | % | | | 18.15 | % |
| Ratios and supplemental data: | | | | | | | | | | | | | | | | | | | | | | | | |
| Net assets at end of period (000's) | | $ | 239,056 | | | $ | 258,279 | | | $ | 264,910 | | | $ | 263,276 | | | $ | 278,385 | | | $ | 267,627 | |
| Ratio to average net assets: | | | | | | | | | | | | | | | | | | | | | | | | |
| Net expenses | | | 1.01 | %(E) | | | 1.03 | % | | | 1.01 | % | | | 1.04 | % | | | 1.07 | % | | | 1.06 | % |
| Gross expenses | | | 1.07 | %(E) | | | 1.04 | % | | | 1.01 | % | | | 1.04 | % | | | 1.07 | % | | | 1.06 | % |
| Net investment income | | | 1.24 | %(E) | | | 0.99 | % | | | 1.20 | % | | | 2.17 | %(F) | | | 1.29 | % | | | 1.22 | % |
| Portfolio turnover rate | | | 119 | %(D) | | | 46 | % | | | 45 | % | | | 86 | % | | | 94 | % | | | 154 | % |
Touchstone Balanced Fund—Class C
Selected Data for a Share Outstanding Throughout Each Period
| | | Seven Months | | | | |
| | | Ended | | | | |
| | | June 30, | | | Year Ended November 30, | |
| | | 2018(A) | | | 2017 | | | 2016 | | | 2015 | | | 2014 | | | 2013 | |
| Net asset value at beginning of period | | $ | 22.46 | | | $ | 19.73 | | | $ | 19.93 | | | $ | 21.04 | | | $ | 20.27 | | | $ | 18.07 | |
| Income (loss) from investment operations: | | | | | | | | | | | | | | | | | | | | | | | | |
| Net investment income | | | 0.06 | | | | 0.04 | | | | 0.08 | (B) | | | 0.28 | (B) | | | 0.11 | (B) | | | 0.08 | (B) |
| Net realized and unrealized gains (losses) on investments | | | 0.22 | | | | 2.91 | | | | 0.66 | | | | (0.35 | ) | | | 1.51 | | | | 2.91 | |
| Total from investment operations | | | 0.28 | | | | 2.95 | | | | 0.74 | | | | (0.07 | ) | | | 1.62 | | | | 2.99 | |
| Distributions from: | | | | | | | | | | | | | | | | | | | | | | | | |
| Net investment income | | | (0.05 | ) | | | (0.09 | ) | | | (0.30 | ) | | | (0.15 | ) | | | (0.10 | ) | | | (0.11 | ) |
| Realized capital gains | | | (1.06 | ) | | | (0.13 | ) | | | (0.64 | ) | | | (0.89 | ) | | | (0.75 | ) | | | (0.68 | ) |
| Total distributions | | | (1.11 | ) | | | (0.22 | ) | | | (0.94 | ) | | | (1.04 | ) | | | (0.85 | ) | | | (0.79 | ) |
| Net asset value at end of period | | $ | 21.63 | | | $ | 22.46 | | | $ | 19.73 | | | $ | 19.93 | | | $ | 21.04 | | | $ | 20.27 | |
| Total return(C) | | | 1.25 | %(D) | | | 15.09 | % | | | 3.91 | % | | | (0.23 | %) | | | 8.34 | % | | | 17.19 | % |
| Ratios and supplemental data: | | | | | | | | | | | | | | | | | | | | | | | | |
| Net assets at end of period (000's) | | $ | 39,769 | | | $ | 42,800 | | | $ | 43,066 | | | $ | 35,344 | | | $ | 32,002 | | | $ | 30,647 | |
| Ratio to average net assets: | | | | | | | | | | | | | | | | | | | | | | | | |
| Net expenses | | | 1.78 | %(E) | | | 1.79 | % | | | 1.78 | % | | | 1.82 | % | | | 1.82 | % | | | 1.86 | % |
| Gross expenses | | | 1.86 | %(E) | | | 1.81 | % | | | 1.78 | % | | | 1.82 | % | | | 1.82 | % | | | 1.86 | % |
| Net investment income | | | 0.47 | %(E) | | | 0.23 | % | | | 0.43 | % | | | 1.39 | %(F) | | | 0.53 | % | | | 0.42 | % |
| Portfolio turnover rate | | | 119 | %(D) | | | 46 | % | | | 45 | % | | | 86 | % | | | 94 | % | | | 154 | % |
| (A) | The Fund changed its fiscal year end from November 30 to June 30. |
| (B) | The net investment income per share was based on average shares outstanding for the period. |
| (C) | Total returns shown exclude the effect of applicable sales loads. If these charges were included, the returns would be lower. |
| (F) | Includes the impact of special dividends resulting from an acquisition of Covidien plc by Medtronic, Inc. on January 26, 2015 through the formation of a new holding company, Medtronic plc, incorporated in Ireland. These special dividends enhanced the ratios of net investment income for Class A and Class C shares by 0.86% for the fiscal year ended November 30, 2015. |
See accompanying Notes to Financial Statements.
Financial Highlights (Continued)
Touchstone Balanced Fund—Class Y(A)
Selected Data for a Share Outstanding Throughout Each Period
| | | Seven Months | | | | | | | | | | | | | | | | |
| | | Ended | | | | | | | | | | | | | | | | |
| | | June 30, | | | Year Ended November 30, | |
| | | 2018(B) | | | 2017 | | | 2016 | | | 2015 | | | 2014 | | | 2013 | |
| Net asset value at beginning of period | | $ | 22.26 | | | $ | 19.57 | | | $ | 19.78 | | | $ | 20.90 | | | $ | 20.15 | | | $ | 17.95 | |
| Income (loss) from investment operations: | | | | | | | | | | | | | | | | | | | | | | | | |
| Net investment income | | | 0.19 | | | | 0.28 | | | | 0.27 | (C) | | | 0.47 | (C) | | | 0.31 | (C) | | | 0.28 | (C) |
| Net realized and unrealized gains (losses) on investments | | | 0.22 | | | | 2.84 | | | | 0.65 | | | | (0.34 | ) | | | 1.50 | | | | 2.89 | |
| Total from investment operations | | | 0.41 | | | | 3.12 | | | | 0.92 | | | | 0.13 | | | | 1.81 | | | | 3.17 | |
| Distributions from: | | | | | | | | | | | | | | | | | | | | | | | | |
| Net investment income | | | (0.22 | ) | | | (0.30 | ) | | | (0.49 | ) | | | (0.36 | ) | | | (0.31 | ) | | | (0.29 | ) |
| Realized capital gains | | | (1.06 | ) | | | (0.13 | ) | | | (0.64 | ) | | | (0.89 | ) | | | (0.75 | ) | | | (0.68 | ) |
| Total distributions | | | (1.28 | ) | | | (0.43 | ) | | | (1.13 | ) | | | (1.25 | ) | | | (1.06 | ) | | | (0.97 | ) |
| Net asset value at end of period | | $ | 21.39 | | | $ | 22.26 | | | $ | 19.57 | | | $ | 19.78 | | | $ | 20.90 | | | $ | 20.15 | |
| Total return | | | 1.86 | %(D) | | | 16.20 | % | | | 4.94 | % | | | 0.79 | % | | | 9.43 | % | | | 18.46 | % |
| Ratios and supplemental data: | | | | | | | | | | | | | | | | | | | | | | | | |
| Net assets at end of period (000's) | | $ | 30,612 | | | $ | 31,215 | | | $ | 14,477 | | | $ | 12,589 | | | $ | 17,062 | | | $ | 20,468 | |
| Ratio to average net assets: | | | | | | | | | | | | | | | | | | | | | | | | |
| Net expenses | | | 0.81 | %(E) | | | 0.78 | % | | | 0.81 | % | | | 0.81 | % | | | 0.80 | % | | | 0.77 | % |
| Gross expenses | | | 0.90 | %(E) | | | 0.80 | % | | | 0.81 | % | | | 0.81 | % | | | 0.80 | % | | | 0.77 | % |
| Net investment income | | | 1.44 | %(E) | | | 1.25 | % | | | 1.41 | % | | | 2.39 | %(F) | | | 1.55 | % | | | 1.50 | % |
| Portfolio turnover rate | | | 119 | %(D) | | | 46 | % | | | 45 | % | | | 86 | % | | | 94 | % | | | 154 | % |
| (A) | Effective October 28, 2017, Class I shares of the Sentinel Balanced Fund (the “Predecessor Fund”) were reorganized into Class Y shares of the Fund. |
| (B) | The Fund changed its fiscal year end from November 30 to June 30. |
| (C) | The net investment income per share was based on average shares outstanding for the period. |
| (F) | Includes the impact of special dividends resulting from an acquisition of Covidien plc by Medtronic, Inc. on January 26, 2015 through the formation of a new holding company, Medtronic plc, incorporated in Ireland. These special dividends enhanced the ratios of net investment income for Class Y shares by 0.86% for the fiscal year ended November 30, 2015. |
See accompanying Notes to Financial Statements.
Financial Highlights (Continued)
Touchstone International Equity Fund—Class A
Selected Data for a Share Outstanding Throughout Each Period
| | | Seven Months | | | | |
| | | Ended | | | | |
| | | June 30, | | | Year Ended November 30, | |
| | | 2018(A) | | | 2017 | | | 2016 | | | 2015 | | | 2014 | | | 2013 | |
| Net asset value at beginning of period | | $ | 19.64 | | | $ | 15.52 | | | $ | 16.92 | | | $ | 19.61 | | | $ | 20.18 | | | $ | 16.03 | |
| Income (loss) from investment operations: | | | | | | | | | | | | | | | | | | | | | | | | |
| Net investment income | | | 0.36 | (B) | | | 0.17 | | | | 0.18 | (C) | | | 0.13 | (C) | | | 0.25 | (C) | | | 0.16 | (C) |
| Net realized and unrealized gains (losses) on investments | | | (0.94 | ) | | | 4.05 | | | | (0.97 | ) | | | 0.47 | | | | (0.61 | ) | | | 4.13 | |
| Total from investment operations | | | (0.58 | ) | | | 4.22 | | | | (0.79 | ) | | | 0.60 | | | | (0.36 | ) | | | 4.29 | |
| Distributions from: | | | | | | | | | | | | | | | | | | | | | | | | |
| Net investment income | | | (0.21 | ) | | | (0.10 | ) | | | (0.12 | ) | | | (0.34 | ) | | | (0.21 | ) | | | (0.14 | ) |
| Realized capital gains | | | (0.70 | ) | | | — | | | | (0.49 | ) | | | (2.95 | ) | | | — | | | | — | |
| Total distributions | | | (0.91 | ) | | | (0.10 | ) | | | (0.61 | ) | | | (3.29 | ) | | | (0.21 | ) | | | (0.14 | ) |
| Net asset value at end of period | | $ | 18.15 | | | $ | 19.64 | | | $ | 15.52 | | | $ | 16.92 | | | $ | 19.61 | | | $ | 20.18 | |
| Total return(D) | | | (3.23 | %)(E) | | | 27.39 | % | | | (4.81 | %) | | | 4.49 | % | | | (1.81 | %) | | | 26.93 | % |
| Ratios and supplemental data: | | | | | | | | | | | | | | | | | | | | | | | | |
| Net assets at end of period (000's) | | $ | 118,391 | | | $ | 129,139 | | | $ | 114,616 | | | $ | 113,212 | | | $ | 115,216 | | | $ | 122,646 | |
| Ratio to average net assets: | | | | | | | | | | | | | | | | | | | | | | | | |
| Net expenses | | | 1.23 | %(F) | | | 1.37 | % | | | 1.36 | % | | | 1.41 | % | | | 1.41 | % | | | 1.44 | % |
| Gross expenses | | | 1.30 | %(F) | | | 1.39 | % | | | 1.36 | % | | | 1.41 | % | | | 1.41 | % | | | 1.44 | % |
| Net investment income | | | 3.22 | %(B)(F) | | | 0.92 | % | | | 1.11 | % | | | 0.76 | % | | | 1.22 | % | | | 0.91 | % |
| Portfolio turnover rate | | | 26 | %(E) | | | 37 | % | | | 36 | % | | | 55 | % | | | 50 | % | | | 52 | % |
Touchstone International Equity Fund— Class C
Selected Data for a Share Outstanding Throughout Each Period
| | | Seven Months | | | | | | | | | | | | | | | | |
| | | Ended | | | | | | | | | | | | | | | | |
| | | June 30, | | | Year Ended November 30, | |
| | | 2018(A) | | | 2017 | | | 2016 | | | 2015 | | | 2014 | | | 2013 | |
| Net asset value at beginning of period | | $ | 18.46 | | | $ | 14.66 | | | $ | 16.06 | | | $ | 18.71 | | | $ | 19.34 | | | $ | 15.49 | |
| Income (loss) from investment operations: | | | | | | | | | | | | | | | | | | | | | | | | |
| Net investment income (loss) | | | 0.26 | (B) | | | (0.06 | ) | | | (0.01 | )(C) | | | (0.10 | )(C) | | | (0.04 | )(C) | | | (0.11 | )(C) |
| Net realized and unrealized gains (losses) on investments | | | (0.90 | ) | | | 3.86 | | | | (0.90 | ) | | | 0.47 | | | | (0.59 | ) | | | 3.97 | |
| Total from investment operations | | | (0.64 | ) | | | 3.80 | | | | (0.91 | ) | | | 0.37 | | | | (0.63 | ) | | | 3.86 | |
| Distributions from: | | | | | | | | | | | | | | | | | | | | | | | | |
| Net investment income | | | — | | | | — | | | | — | | | | (0.07 | ) | | | — | | | | (0.01 | ) |
| Realized capital gains | | | (0.70 | ) | | | — | | | | (0.49 | ) | | | (2.95 | ) | | | — | | | | — | |
| Total distributions | | | (0.70 | ) | | | — | | | | (0.49 | ) | | | (3.02 | ) | | | — | | | | (0.01 | ) |
| Net asset value at end of period | | $ | 17.12 | | | $ | 18.46 | | | $ | 14.66 | | | $ | 16.06 | | | $ | 18.71 | | | $ | 19.34 | |
| Total return(D) | | | (3.72 | %)(E) | | | 25.92 | % | | | (5.82 | )%) | | | 3.14 | % | | | (3.26 | %) | | | 24.92 | % |
| Ratios and supplemental data: | | | | | | | | | | | | | | | | | | | | | | | | |
| Net assets at end of period (000's) | | $ | 6,737 | | | $ | 6,924 | | | $ | 5,876 | | | $ | 4,732 | | | $ | 3,581 | | | $ | 3,634 | |
| Ratio to average net assets: | | | | | | | | | | | | | | | | | | | | | | | | |
| Net expenses | | | 2.18 | %(F) | | | 2.45 | % | | | 2.49 | % | | | 2.70 | % | | | 2.86 | % | | | 3.04 | % |
| Gross expenses | | | 2.25 | %(F) | | | 2.49 | % | | | 2.49 | % | | | 2.70 | % | | | 2.86 | % | | | 3.04 | % |
| Net investment income (loss) | | | 2.27 | %(B)(F) | | | (0.16 | %) | | | (0.04 | %) | | | (0.60 | %) | | | (0.23 | %) | | | (0.66 | %) |
| Portfolio turnover rate | | | 26 | %(E) | | | 37 | % | | | 36 | % | | | 55 | % | | | 50 | % | | | 52 | % |
| (A) | The Fund changed its fiscal year end from November 30 to June 30. |
| (B) | Reflects the impact of a special dividend that resulted in a one-time increase to net investment income. If the special dividend had not occurred, the ratio of net investment income to average net assets would have been lower by 1.54% and the net investment income per share would have been lower by $0.17 and $0.16 for Class A and Class C, respectively. |
| (C) | The net investment income (loss) per share was based on average shares outstanding for the period. |
| (D) | Total returns shown exclude the effect of applicable sales loads. If these charges were included, the returns would be lower. |
See accompanying Notes to Financial Statements.
Financial Highlights (Continued)
Touchstone International Equity Fund—Class Y(A)
Selected Data for a Share Outstanding Throughout Each Period
| | | Seven Months | | | | |
| | | Ended | | | | |
| | | June 30, | | | Year Ended November 30, | |
| | | 2018(B) | | | 2017 | | | 2016 | | | 2015 | | | 2014 | | | 2013 | |
| Net asset value at beginning of period | | $ | 19.45 | | | $ | 15.40 | | | $ | 16.79 | | | $ | 19.53 | | | $ | 20.13 | | | $ | 15.99 | |
| Income (loss) from investment operations: | | | | | | | | | | | | | | | | | | | | | | | | |
| Net investment income | | | 0.40 | (C) | | | 0.25 | | | | 0.23 | (D) | | | 0.18 | (D) | | | 0.38 | (D) | | | 0.26 | (D) |
| Net realized and unrealized gains (losses) on investments | | | (0.93 | ) | | | 3.98 | | | | (0.95 | ) | | | 0.47 | | | | (0.65 | ) | | | 4.11 | |
| Total from investment operations | | | (0.53 | ) | | | 4.23 | | | | (0.72 | ) | | | 0.65 | | | | (0.27 | ) | | | 4.37 | |
| Distributions from: | | | | | | | | | | | | | | | | | | | | | | | | |
| Net investment income | | | (0.29 | ) | | | (0.18 | ) | | | (0.18 | ) | | | (0.44 | ) | | | (0.33 | ) | | | (0.23 | ) |
| Realized capital gains | | | (0.70 | ) | | | — | | | | (0.49 | ) | | | (2.95 | ) | | | — | | | | — | |
| Total distributions | | | (0.99 | ) | | | (0.18 | ) | | | (0.67 | ) | | | (3.39 | ) | | | (0.33 | ) | | | (0.23 | ) |
| Net asset value at end of period | | $ | 17.93 | | | $ | 19.45 | | | $ | 15.40 | | | $ | 16.79 | | | $ | 19.53 | | | $ | 20.13 | |
| Total return | | | (3.05 | %)(E) | | | 27.78 | % | | | (4.41 | %) | | | 4.89 | % | | | (1.39 | % | ) | | 27.64 | % |
| Ratios and supplemental data: | | | | | | | | | | | | | | | | | | | | | | | | |
| Net assets at end of period (000's) | | $ | 57,438 | | | $ | 63,320 | | | $ | 40,528 | | | $ | 14,967 | | | $ | 10,997 | | | $ | 34,561 | |
| Ratio to average net assets: | | | | | | | | | | | | | | | | | | | | | | | | |
| Net expenses | | | 0.99 | %(F) | | | 1.01 | % | | | 0.99 | % | | | 1.02 | % | | | 0.92 | % | | | 0.89 | % |
| Gross expenses | | | 1.09 | %(F) | | | 1.03 | % | | | 0.99 | % | | | 1.02 | % | | | 0.92 | % | | | 0.89 | % |
| Net investment income | | | 3.47 | %(C)(F) | | | 1.28 | % | | | 1.45 | % | | | 1.05 | % | | | 1.91 | % | | | 1.48 | % |
| Portfolio turnover rate | | | 26 | %(E) | | | 37 | % | | | 36 | % | | | 55 | % | | | 50 | % | | | 52 | % |
Touchstone International Equity Fund—Institutional Class
Selected Data for a Share Outstanding Throughout Each Period
| | | Seven Months | | | | |
| | | Ended | | | Period Ended | |
| | | June 30, | | | November 30, | |
| | | 2018(B) | | | 2017(G) | |
| Net asset value at beginning of period | | $ | 19.46 | | | $ | 18.91 | |
| Income (loss) from investment operations: | | | | | | | | |
| Net investment income | | | 0.56 | (C) | | | 0.02 | |
| Net realized and unrealized gains (losses) on investments | | | (1.09 | ) | | | 0.53 | |
| Total from investment operations | | | (0.53 | ) | | | 0.55 | |
| Distributions from: | | | | | | | | |
| Net investment income | | | (0.31 | ) | | | — | |
| Realized capital gains | | | (0.70 | ) | | | — | |
| Total distributions | | | (1.01 | ) | | | — | |
| Net asset value at end of period | | $ | 17.92 | | | $ | 19.46 | |
| Total return | | | (3.02 | %)(E) | | | 2.91 | %(E) |
| Ratios and supplemental data: | | | | | | | | |
| Net assets at end of period (000's) | | $ | 2,260 | | | $ | 3 | |
| Ratio to average net assets: | | | | | | | | |
| Net expenses | | | 0.89 | %(F) | | | 0.89 | %(F) |
| Gross expenses | | | 1.63 | %(F) | | | 1921.18 | %(F) |
| Net investment income | | | 3.57 | %(C)(F) | | | 1.40 | %(F) |
| Portfolio turnover rate | | | 26 | %(E) | | | 37 | % |
| (A) | Effective October 28, 2017, Class I shares of the Sentinel International Equity Fund (the “Predecessor Fund”) were reorganized into Class Y shares of the Fund. |
| (B) | The Fund changed its fiscal year end from November 30 to June 30. |
| (C) | Reflects the impact of a special dividend that resulted in a one-time increase to net investment income. If the special dividend had not occurred, the ratio of net investment income to average net assets would have been lower by 1.54% and the net investment income per share would have been lower by $0.17 and $0.16 for Class Y and Institutional Class, respectively. |
| (D) | The net investment income per share was based on average shares outstanding for the period. |
| (G) | Represents the period from commencement of operations (October 30, 2017) through November 30, 2017. |
See accompanying Notes to Financial Statements.
Financial Highlights (Continued)
Touchstone Large Cap Focused Fund—Class A
Selected Data for a Share Outstanding Throughout Each Period
| | | Seven Months | | | | |
| | | Ended | | | | |
| | | June 30, | | | Year Ended November 30, | |
| | | 2018(A) | | | 2017 | | | 2016 | | | 2015 | | | 2014 | | | 2013 | |
| Net asset value at beginning of period | | $ | 48.75 | | | $ | 42.28 | | | $ | 43.08 | | | $ | 42.79 | | | $ | 43.31 | | | $ | 34.84 | |
| Income (loss) from investment operations: | | | | | | | | | | | | | | | | | | | | | | | | |
| Net investment income | | | 0.23 | | | | 0.45 | | | | 0.53 | (B) | | | 1.01 | (B) | | | 0.56 | (B) | | | 0.44 | (B) |
| Net realized and unrealized gains (losses) on investments | | | 1.85 | | | | 8.99 | | | | 2.43 | | | | (0.25 | ) | | | 4.97 | | | | 9.50 | |
| Total from investment operations | | | 2.08 | | | | 9.44 | | | | 2.96 | | | | 0.76 | | | | 5.53 | | | | 9.94 | |
| Distributions from: | | | | | | | | | | | | | | | | | | | | | | | | |
| Net investment income | | | (0.07 | ) | | | (0.51 | ) | | | (1.08 | ) | | | (0.45 | ) | | | (0.58 | ) | | | (0.43 | ) |
| Realized capital gains | | | (6.96 | ) | | | (2.46 | ) | | | (2.68 | ) | | | (0.02 | ) | | | (5.47 | ) | | | (1.04 | ) |
| Total distributions | | | (7.03 | ) | | | (2.97 | ) | | | (3.76 | ) | | | (0.47 | ) | | | (6.05 | ) | | | (1.47 | ) |
| Net asset value at end of period | | $ | 43.80 | | | $ | 48.75 | | | $ | 42.28 | | | $ | 43.08 | | | $ | 42.79 | | | $ | 43.31 | |
| Total return(C) | | | 4.74 | %(D) | | | 23.67 | % | | | 7.53 | % | | | 1.79 | % | | | 13.30 | % | | | 29.53 | % |
| Ratios and supplemental data: | | | | | | | | | | | | | | | | | | | | | | | | |
| Net assets at end of period (000's) | | $ | 1,218,721 | | | $ | 1,321,506 | | | $ | 1,350,861 | | | $ | 1,416,147 | | | $ | 1,577,546 | | | $ | 1,454,446 | |
| Ratio to average net assets: | | | | | | | | | | | | | | | | | | | | | | | | |
| Net expenses (including liquidity provider expenses)(E) | | | 0.97 | %(F) | | | 1.02 | % | | | 1.00 | % | | | 0.99 | % | | | 1.00 | % | | | 1.03 | % |
| Gross expenses (including liquidity provider expenses)(G) | | | 1.09 | %(F) | | | 1.02 | % | | | 1.00 | % | | | 0.99 | % | | | 1.00 | % | | | 1.03 | % |
| Net investment income | | | 0.88 | %(F) | | | 0.98 | % | | | 1.32 | % | | | 2.36 | %(H) | | | 1.28 | % | | | 1.15 | % |
| Portfolio turnover rate | | | 9 | %(D)(I) | | | 12 | %(I) | | | 8 | % | | | 11 | % | | | 19 | % | | | 12 | % |
| (A) | The Fund changed its fiscal year end from November 30 to June 30. |
| (B) | The net investment income per share was based on average shares outstanding for the period. |
| (C) | Total returns shown exclude the effect of applicable sales loads. If these charges were included, the returns would be lower. |
| (E) | The ratio of net expenses to average net assets excluding liquidity provider expenses was 0.95% for the seven months ended June 30, 2018 and 1.02% for the year ended November 30, 2017. There were no liquidity provider expenses prior to 2017. |
| (G) | The ratio of gross expenses to average net assets excluding liquidity provider expenses was 1.07% for the seven months ended June 30, 2018 and 1.02% for the year ended November 30, 2017. There were no liquidity provider expenses prior to 2017. |
| (H) | Includes the impact of special dividends resulting from an acquisition of Covidien plc by Medtronic, Inc. on January 26, 2015 through the formation of a new holding company, Medtronic plc, incorporated in Ireland. These special dividends enhanced the ratios of net investment income for Class A shares by 1.22% for the fiscal year ended November 30, 2015. |
| (I) | Portfolio turnover excludes securities delivered from processing a redemption-in-kind. |
See accompanying Notes to Financial Statements.
Financial Highlights (Continued)
Touchstone Large Cap Focused Fund—Class C
Selected Data for a Share Outstanding Throughout Each Period
| | | Seven Months | | | | |
| | | Ended | | | | |
| | | June 30, | | | Year Ended November 30, | |
| | | 2018(A) | | | 2017 | | | 2016 | | | 2015 | | | 2014 | | | 2013 | |
| Net asset value at beginning of period | | $ | 46.48 | | | $ | 40.44 | | | $ | 41.36 | | | $ | 41.15 | | | $ | 41.82 | | | $ | 33.70 | |
| Income (loss) from investment operations: | | | | | | | | | | | | | | | | | | | | | | | | |
| Net investment income | | | 0.03 | | | | — | (B) | | | 0.21 | (C) | | | 0.64 | (C) | | | 0.21 | (C) | | | 0.12 | (C) |
| Net realized and unrealized gains (losses) on investments | | | 1.74 | | | | 8.67 | | | | 2.33 | | | | (0.24 | ) | | | 4.78 | | | | 9.18 | |
| Total from investment operations | | | 1.77 | | | | 8.67 | | | | 2.54 | | | | 0.40 | | | | 4.99 | | | | 9.30 | |
| Distributions from: | | | | | | | | | | | | | | | | | | | | | | | | |
| Net investment income | | | — | | | | (0.17 | ) | | | (0.78 | ) | | | (0.17 | ) | | | (0.19 | ) | | | (0.14 | ) |
| Realized capital gains | | | (6.96 | ) | | | (2.46 | ) | | | (2.68 | ) | | | (0.02 | ) | | | (5.47 | ) | | | (1.04 | ) |
| Total distributions | | | (6.96 | ) | | | (2.63 | ) | | | (3.46 | ) | | | (0.19 | ) | | | (5.66 | ) | | | (1.18 | ) |
| Net asset value at end of period | | $ | 41.29 | | | $ | 46.48 | | | $ | 40.44 | | | $ | 41.36 | | | $ | 41.15 | | | $ | 41.82 | |
| Total return(D) | | | 4.24 | %(E) | | | 22.69 | % | | | 6.71 | % | | | 0.98 | % | | | 12.40 | % | | | 28.47 | % |
| Ratios and supplemental data: | | | | | | | | | | | | | | | | | | | | | | | | |
| Net assets at end of period (000's) | | $ | 67,599 | | | $ | 74,122 | | | $ | 83,246 | | | $ | 89,890 | | | $ | 90,784 | | | $ | 78,259 | |
| Ratio to average net assets: | | | | | | | | | | | | | | | | | | | | | | | | |
| Net expenses (including liquidity provider expenses)(F) | | | 1.78 | %(G) | | | 1.82 | % | | | 1.79 | % | | | 1.78 | % | | | 1.79 | % | | | 1.84 | % |
| Gross expenses (including liquidity provider expenses)(H) | | | 1.89 | %(G) | | | 1.82 | % | | | 1.79 | % | | | 1.78 | % | | | 1.79 | % | | | 1.84 | % |
| Net investment income | | | 0.07 | %(G) | | | 0.18 | % | | | 0.54 | % | | | 1.57 | %(I) | | | 0.50 | % | | | 0.32 | % |
| Portfolio turnover rate | | | 9 | %(E)(J) | | | 12 | %(J) | | | 8 | % | | | 11 | % | | | 19 | % | | | 12 | % |
| (A) | The Fund changed its fiscal year end from November 30 to June 30. |
| (B) | Represents less than $0.005 per share. |
| (C) | The net investment income per share was based on average shares outstanding for the period. |
| (D) | Total returns shown exclude the effect of applicable sales loads. If these charges were included, the returns would be lower. |
| (F) | The ratio of net expenses to average net assets excluding liquidity provider expenses was 1.76% for the seven months ended June 30, 2018 and 1.82% for the year ended November 30, 2017. There were no liquidity provider expenses prior to 2017. |
| (H) | The ratio of gross expenses to average net assets excluding liquidity provider expenses was 1.87% for the seven months ended June 30, 2018 and 1.82% for the year ended November 30, 2017. There were no liquidity provider expenses prior to 2017. |
| (I) | Includes the impact of special dividends resulting from an acquisition of Covidien plc by Medtronic, Inc. on January 26, 2015 through the formation of a new holding company, Medtronic plc, incorporated in Ireland. These special dividends enhanced the ratios of net investment income for Class C shares by 1.22% for the fiscal year ended November 30, 2015. |
| (J) | Portfolio turnover excludes securities delivered from processing a redemption-in-kind. |
See accompanying Notes to Financial Statements.
Financial Highlights (Continued)
Touchstone Large Cap Focused Fund— Class Y(A)
Selected Data for a Share Outstanding Throughout Each Period
| | | Seven Months | | | | |
| | | Ended | | | | |
| | | June 30, | | | Year Ended November 30, | |
| | | 2018(B) | | | 2017 | | | 2016 | | | 2015 | | | 2014 | | | 2013 | |
| Net asset value at beginning of period | | $ | 48.72 | | | $ | 42.26 | | | $ | 43.06 | | | $ | 42.76 | | | $ | 43.31 | | | $ | 34.85 | |
| Income (loss) from investment operations: | | | | | | | | | | | | | | | | | | | | | | | | |
| Net investment income | | | 0.29 | | | | 0.56 | | | | 0.64 | (C) | | | 1.12 | (C) | | | 0.68 | (C) | | | 0.56 | (C) |
| Net realized and unrealized gains (losses) on investments | | | 1.84 | | | | 8.99 | | | | 2.43 | | | | (0.25 | ) | | | 4.97 | | | | 9.50 | |
| Total from investment operations | | | 2.13 | | | | 9.55 | | | | 3.07 | | | | 0.87 | | | | 5.65 | | | | 10.06 | |
| Distributions from: | | | | | | | | | | | | | | | | | | | | | | | | |
| Net investment income | | | (0.21 | ) | | | (0.63 | ) | | | (1.19 | ) | | | (0.55 | ) | | | (0.73 | ) | | | (0.56 | ) |
| Realized capital gains | | | (6.96 | ) | | | (2.46 | ) | | | (2.68 | ) | | | (0.02 | ) | | | (5.47 | ) | | | (1.04 | ) |
| Total distributions | | | (7.17 | ) | | | (3.09 | ) | | | (3.87 | ) | | | (0.57 | ) | | | (6.20 | ) | | | (1.60 | ) |
| Net asset value at end of period | | $ | 43.68 | | | $ | 48.72 | | | $ | 42.26 | | | $ | 43.06 | | | $ | 42.76 | | | $ | 43.31 | |
| Total return | | | 4.85 | %(D) | | | 24.03 | % | | | 7.84 | % | | | 2.07 | % | | | 13.61 | % | | | 29.93 | % |
| Ratios and supplemental data: | | | | | | | | | | | | | | | | | | | | | | | | |
| Net assets at end of period (000's) | | $ | 394,077 | | | $ | 438,732 | | | $ | 552,611 | | | $ | 689,502 | | | $ | 932,941 | | | $ | 941,223 | |
| Ratio to average net assets: | | | | | | | | | | | | | | | | | | | | | | | | |
| Net expenses (including liquidity provider expenses)(E) | | | 0.74 | %(F) | | | 0.74 | % | | | 0.72 | % | | | 0.71 | % | | | 0.72 | % | | | 0.72 | % |
| Gross expenses (including liquidity provider expenses)(G) | | | 0.90 | %(F) | | | 0.75 | % | | | 0.72 | % | | | 0.71 | % | | | 0.72 | % | | | 0.72 | % |
| Net investment income | | | 1.11 | %(F) | | | 1.26 | % | | | 1.60 | % | | | 2.63 | %(H) | | | 1.55 | % | | | 1.45 | % |
| Portfolio turnover rate | | | 9 | %(D)(I) | | | 12 | %(I) | | | 8 | % | | | 11 | % | | | 19 | % | | | 12 | % |
| (A) | Effective October 28, 2017, Class I shares of the Sentinel Common Stock Fund (the “Predecessor Fund”) were reorganized into Class Y shares of the Fund. |
| (B) | The Fund changed its fiscal year end from November 30 to June 30. |
| (C) | The net investment income per share was based on average shares outstanding for the period. |
| (E) | The ratio of net expenses to average net assets excluding liquidity provider expenses was 0.72% for the seven months ended June 30, 2018 and 0.74% for the year ended November 30, 2017. There were no liquidity provider expenses prior to 2017. |
| (G) | The ratio of gross expenses to average net assets excluding liquidity provider expenses was 0.88% for the seven months ended June 30, 2018 and 0.75% for the year ended November 30, 2017. There were no liquidity provider expenses prior to 2017. |
| (H) | Includes the impact of special dividends resulting from an acquisition of Covidien plc by Medtronic, Inc. on January 26, 2015 through the formation of a new holding company, Medtronic plc, incorporated in Ireland. These special dividends enhanced the ratios of net investment income for Class Y shares by 1.22%, for the fiscal year ended November 30, 2015. |
| (I) | Portfolio turnover excludes securities delivered from processing a redemption-in-kind. |
See accompanying Notes to Financial Statements.
Financial Highlights (Continued)
Touchstone Large Cap Focused Fund— Institutional Class(A)
Selected Data for a Share Outstanding Throughout Each Period
| | | Seven Months | | | | |
| | | Ended | | | | | | Period Ended | |
| | | June 30, | | | Year Ended November 30, | | | November 30, | |
| | | 2018(B) | | | 2017 | | | 2016 | | | 2015(C) | |
| Net asset value at beginning of period | | $ | 48.81 | | | $ | 42.32 | | | $ | 43.11 | | | $ | 43.01 | |
| Income (loss) from investment operations: | | | | | | | | | | | | | | | | |
| Net investment income | | | 0.34 | | | | 0.61 | | | | 0.70 | (D) | | | 1.07 | (D) |
| Net realized and unrealized gains (losses) on investments | | | 1.80 | | | | 9.01 | | | | 2.41 | | | | (0.51 | ) |
| Total from investment operations | | | 2.14 | | | | 9.62 | | | | 3.11 | | | | 0.56 | |
| Distributions from: | | | | | | | | | | | | | | | | |
| Net investment income | | | (0.24 | ) | | | (0.67 | ) | | | (1.22 | ) | | | (0.46 | ) |
| Realized capital gains | | | (6.96 | ) | | | (2.46 | ) | | | (2.68 | ) | | | — | |
| Total distributions | | | (7.20 | ) | | | (3.13 | ) | | | (3.90 | ) | | | (0.46 | ) |
| Net asset value at end of period | | $ | 43.75 | | | $ | 48.81 | | | $ | 42.32 | | | $ | 43.11 | |
| Total return | | | 4.93 | %(E) | | | 24.14 | % | | | 7.92 | % | | | 1.31 | %(E) |
| Ratios and supplemental data: | | | | | | | | | | | | | | | | |
| Net assets at end of period (000's) | | $ | 46,683 | | | $ | 44,738 | | | $ | 29,927 | | | $ | 18,225 | |
| Ratio to average net assets: | | | | | | | | | | | | | | | | |
| Net expenses (including liquidity provider expenses)(F) | | | 0.67 | %(G) | | | 0.68 | % | | | 0.65 | % | | | 0.61 | %(G) |
| Gross expenses (including liquidity provider expenses)(H) | | | 0.88 | %(G) | | | 0.70 | % | | | 0.72 | % | | | 1.76 | %(G) |
| Net investment income | | | 1.18 | %(G) | | | 1.32 | % | | | 1.72 | % | | | 2.65 | %(G)(I) |
| Portfolio turnover rate | | | 9 | %(E)(J) | | | 12 | %(J) | | | 8 | % | | | 11 | % |
| (A) | Effective October 30, 2017, Class R6 shares of the Predecessor Fund were reorganized into Institutional Class shares of the Fund. |
| (B) | The Fund changed its fiscal year end from November 30 to June 30. |
| (C) | Represents the period from commencement of operations (December 23, 2014) through November 30, 2015. |
| (D) | The net investment income per share was based on average shares outstanding for the period. |
| (F) | The ratio of net expenses to average net assets excluding liquidity provider expenses was 0.65% for the seven months ended June 30, 2018 and 0.68% for the year ended November 30, 2017. There were no liquidity provider expenses prior to 2017. |
| (H) | The ratio of gross expenses to average net assets excluding liquidity provider expenses was 0.86% for the seven months ended June 30, 2018 and 0.70% for the year ended November 30, 2017. There were no liquidity provider expenses prior to 2017. |
| (I) | Includes the impact of special dividends resulting from an acquisition of Covidien plc by Medtronic, Inc. on January 26, 2015 through the formation of a new holding company, Medtronic plc, incorporated in Ireland. These special dividends enhanced the ratios of net investment income for Institutional Class shares by 1.30%, for the fiscal year ended November 30, 2015. |
| (J) | Portfolio turnover excludes securities delivered from processing a redemption-in-kind. |
See accompanying Notes to Financial Statements.
Financial Highlights (Continued)
Touchstone Small Company Fund—Class A
Selected Data for a Share Outstanding Throughout Each Period
| | | Seven Months | | | | |
| | | Ended | | | | |
| | | June 30, | | | Year Ended November 30, | |
| | | 2018(A) | | | 2017 | | | 2016 | | | 2015 | | | 2014 | | | 2013 | |
| Net asset value at beginning of period | | $ | 5.64 | | | $ | 5.19 | | | $ | 5.58 | | | $ | 7.19 | | | $ | 8.52 | | | $ | 7.96 | |
| Income (loss) from investment operations: | | | | | | | | | | | | | | | | | | | | | | | | |
| Net investment income (loss) | | | (0.01 | ) | | | (0.02 | ) | | | (0.02 | )(B) | | | (0.03 | )(B) | | | — | (B)(C) | | | (0.02 | )(B) |
| Net realized and unrealized gains on investments | | | 0.37 | | | | 0.89 | | | | 0.57 | | | | 0.26 | | | | 0.38 | | | | 2.25 | |
| Total from investment operations | | | 0.36 | | | | 0.87 | | | | 0.55 | | | | 0.23 | | | | 0.38 | | | | 2.23 | |
| Distributions from: | | | | | | | | | | | | | | | | | | | | | | | | |
| Realized capital gains | | | (0.47 | ) | | | (0.42 | ) | | | (0.94 | ) | | | (1.84 | ) | | | (1.71 | ) | | | (1.67 | ) |
| Net asset value at end of period | | $ | 5.53 | | | $ | 5.64 | | | $ | 5.19 | | | $ | 5.58 | | | $ | 7.19 | | | $ | 8.52 | |
| Total return(D) | | | 6.89 | %(E) | | | 17.95 | % | | | 12.52 | % | | | 5.32 | % | | | 5.40 | % | | | 34.79 | % |
| Ratios and supplemental data: | | | | | | | | | | | | | | | | | | | | | | | | |
| Net assets at end of period (000's) | | $ | 661,866 | | | $ | 677,055 | | | $ | 685,807 | | | $ | 596,864 | | | $ | 682,481 | | | $ | 808,145 | |
| Ratio to average net assets: | | | | | | | | | | | | | | | | | | | | | | | | |
| Net expenses | | | 1.10 | %(F) | | | 1.18 | % | | | 1.22 | % | | | 1.25 | % | | | 1.20 | % | | | 1.21 | % |
| Gross expenses | | | 1.18 | %(F) | | | 1.18 | % | | | 1.22 | % | | | 1.25 | % | | | 1.20 | % | | | 1.21 | % |
| Net investment income (loss) | | | (0.26 | %)(F) | | | (0.49 | %) | | | (0.38 | %) | | | (0.61 | %) | | | 0.06 | % | | | (0.24 | )%) |
| Portfolio turnover rate | | | 30 | %(E) | | | 82 | % | | | 61 | % | | | 70 | % | | | 59 | % | | | 23 | % |
Touchstone Small Company Fund—Class C
Selected Data for a Share Outstanding Throughout Each Period
| | | Seven Months | | | | |
| | | Ended | | | | |
| | | June 30, | | | Year Ended November 30, | |
| | | 2018(A) | | | 2017 | | | 2016 | | | 2015 | | | 2014 | | | 2013 | |
| Net asset value at beginning of period | | $ | 3.50 | | | $ | 3.39 | | | $ | 4.01 | | | $ | 5.72 | | | $ | 7.17 | | | $ | 6.99 | |
| Income (loss) from investment operations: | | | | | | | | | | | | | | | | | | | | | | | | |
| Net investment loss | | | (0.02 | ) | | | (0.10 | ) | | | (0.03 | )(B) | | | (0.05 | )(B) | | | (0.04 | )(B) | | | (0.06 | )(B) |
| Net realized and unrealized gains on investments | | | 0.22 | | | | 0.63 | | | | 0.35 | | | | 0.18 | | | | 0.30 | | | | 1.91 | |
| Total from investment operations | | | 0.20 | | | | 0.53 | | | | 0.32 | | | | 0.13 | | | | 0.26 | | | | 1.85 | |
| Distributions from: | | | | | | | | | | | | | | | | | | | | | | | | |
| Realized capital gains | | | (0.47 | ) | | | (0.42 | ) | | | (0.94 | ) | | | (1.84 | ) | | | (1.71 | ) | | | (1.67 | ) |
| Net asset value at end of period | | $ | 3.23 | | | $ | 3.50 | | | $ | 3.39 | | | $ | 4.01 | | | $ | 5.72 | | | $ | 7.17 | |
| Total return(D) | | | 6.51 | %(E) | | | 17.36 | % | | | 11.48 | % | | | 4.72 | % | | | 4.55 | % | | | 33.94 | % |
| Ratios and supplemental data: | | | | | | | | | | | | | | | | | | | | | | | | |
| Net assets at end of period (000's) | | $ | 97,136 | | | $ | 104,051 | | | $ | 110,842 | | | $ | 108,192 | | | $ | 115,642 | | | $ | 128,521 | |
| Ratio to average net assets: | | | | | | | | | | | | | | | | | | | | | | | | |
| Net expenses | | | 1.85 | %(F) | | | 1.92 | % | | | 1.95 | % | | | 1.94 | % | | | 1.91 | % | | | 1.93 | % |
| Gross expenses | | | 1.93 | %(F) | | | 1.92 | % | | | 1.95 | % | | | 1.94 | % | | | 1.91 | % | | | 1.93 | % |
| Net investment loss | | | (1.02 | %)(F) | | | (1.23 | % | ) | | (1.10 | %) | | | (1.30 | %) | | | (0.66 | %) | | | (0.97 | %) |
| Portfolio turnover rate | | | 30 | %(E) | | | 82 | % | | | 61 | % | | | 70 | % | | | 59 | % | | | 23 | % |
| (A) | The Fund changed its fiscal year end from November 30 to June 30. |
| (B) | The net investment income (loss) per share was based on average shares outstanding for the period. |
| (C) | Less than $0.005 per share. |
| (D) | Total returns shown exclude the effect of applicable sales loads. If these charges were included, the returns would be lower. |
See accompanying Notes to Financial Statements.
Financial Highlights (Continued)
Touchstone Small Company Fund—Class Y(A)
Selected Data for a Share Outstanding Throughout Each Period
| | | Seven Months | | | | |
| | | Ended | | | | |
| | | June 30, | | | Year Ended November 30, | |
| | | 2018(B) | | | 2017 | | | 2016 | | | 2015 | | | 2014 | | | 2013 | |
| Net asset value at beginning of period | | $ | 6.10 | | | $ | 5.56 | | | $ | 5.89 | | | $ | 7.48 | | | $ | 8.78 | | | $ | 8.16 | |
| Income (loss) from investment operations: | | | | | | | | | | | | | | | | | | | | | | | | |
| Net investment income (loss) | | | (— | )(C) | | | (0.06 | ) | | | (— | )(C)(D) | | | (0.01 | )(D) | | | 0.03 | (D) | | | 0.01 | (D) |
| Net realized and unrealized gains on investments | | | 0.41 | | | | 1.02 | | | | 0.61 | | | | 0.28 | | | | 0.38 | | | | 2.32 | |
| Total from investment operations | | | 0.41 | | | | 0.96 | | | | 0.61 | | | | 0.27 | | | | 0.41 | | | | 2.33 | |
| Distributions from: | | | | | | | | | | | | | | | | | | | | | | | | |
| Net investment income | | | — | | | | — | | | | — | | | | (0.02 | ) | | | — | | | | (0.04 | ) |
| Realized capital gains | | | (0.47 | ) | | | (0.42 | ) | | | (0.94 | ) | | | (1.84 | ) | | | (1.71 | ) | | | (1.67 | ) |
| Total distributions | | | (0.47 | ) | | | (0.42 | ) | | | (0.94 | ) | | | (1.86 | ) | | | (1.71 | ) | | | (1.71 | ) |
| Net asset value at end of period | | $ | 6.04 | | | $ | 6.10 | | | $ | 5.56 | | | $ | 5.89 | | | $ | 7.48 | | | $ | 8.78 | |
| Total return | | | 7.21 | %(E) | | | 18.41 | % | | | 12.95 | % | | | 5.71 | % | | | 5.62 | % | | | 35.40 | % |
| Ratios and supplemental data: | | | | | | | | | | | | | | | | | | | | | | | | |
| Net assets at end of period (000's) | | $ | 383,050 | | | $ | 388,404 | | | $ | 257,483 | | | $ | 220,543 | | | $ | 247,639 | | | $ | 385,692 | |
| Ratio to average net assets: | | | | | | | | | | | | | | | | | | | | | | | | |
| Net expenses | | | 0.84 | %(F) | | | 0.85 | % | | | 0.89 | % | | | 0.87 | % | | | 0.85 | % | | | 0.81 | % |
| Gross expenses | | | 0.92 | %(F) | | | 0.85 | % | | | 0.89 | % | | | 0.87 | % | | | 0.85 | % | | | 0.81 | % |
| Net investment income (loss) | | | (0.01 | %)(F) | | | (0.16 | %) | | | (0.04 | )% | | | (0.24 | )%) | | | 0.46 | % | | | 0.17 | % |
| Portfolio turnover rate | | | 30 | %(E) | | | 82 | % | | | 61 | % | | | 70 | % | | | 59 | % | | | 23 | % |
Touchstone Small Company Fund— Institutional Class
Selected Data for a Share Outstanding Throughout Each Period
| | | Seven Months | | | | |
| | | Ended | | | Period Ended | |
| | | June 30, | | | November 30, | |
| | | 2018(B) | | | 2017(G) | |
| Net asset value at beginning of period | | $ | 6.10 | | | $ | 5.80 | |
| Income (loss) from investment operations: | | | | | | | | |
| Net investment income (loss) | | | — | (C) | | | (— | )(C) |
| Net realized and unrealized gains on investments | | | 0.41 | | | | 0.30 | |
| Total from investment operations | | | 0.41 | | | | 0.30 | |
| Distributions from: | | | | | | | | |
| Realized capital gains | | | (0.47 | ) | | | — | |
| Net asset value at end of period | | $ | 6.04 | | | $ | 6.10 | |
| Total return | | | 7.21 | %(E) | | | 5.17 | %(E) |
| Ratios and supplemental data: | | | | | | | | |
| Net assets at end of period (000's) | | $ | 8 | | | $ | 3 | |
| Ratio to average net assets: | | | | | | | | |
| Net expenses | | | 0.79 | %(F) | | | 0.79 | %(F) |
| Gross expenses | | | 275.86 | %(F) | | | 2069.15 | %(F) |
| Net investment income (loss) | | | 0.05 | %(F) | | | (0.70 | )%(F) |
| Portfolio turnover rate | | | 30 | %(E) | | | 82 | % |
| (A) | Effective October 28, 2017, Class I shares of the Sentinel Small Company Fund (the “Predecessor Fund”) were reorganized into Class Y shares of the Fund. |
| (B) | The Fund changed its fiscal year end from November 30 to June 30. |
| (C) | Less than $0.005 per share. |
| (D) | The net investment income (loss) per share was based on average shares outstanding for the period. |
| (G) | Represents the period from commencement of operations (October 30, 2017) through November 30, 2017. |
See accompanying Notes to Financial Statements.
Financial Highlights (Continued)
Touchstone Small Company Fund—Class R6
Selected Data for a Share Outstanding Throughout Each Period
| | | Seven Months | | | | | | | |
| | | Ended | | | | | | Period Ended | |
| | | June 30, | | | Year Ended November 30, | | | November 30, | |
| | | 2018(A) | | | 2017 | | | 2016 | | | 2015(B) | |
| Net asset value at beginning of period | | $ | 5.73 | | | $ | 5.24 | | | $ | 5.60 | | | $ | 5.44 | |
| Income (loss) from investment operations: | | | | | | | | | | | | | | | | |
| Net investment income (loss) | | | — | (C) | | | (0.03 | ) | | | 0.01 | (D) | | | (0.01 | )(D) |
| Net realized and unrealized gains on investments | | | 0.39 | | | | 0.94 | | | | 0.57 | | | | 0.17 | |
| Total from investment operations | | | 0.39 | | | | 0.91 | | | | 0.58 | | | | 0.16 | |
| Distributions from: | | | | | | | | | | | | | | | | |
| Realized capital gains | | | (0.47 | ) | | | (0.42 | ) | | | (0.94 | ) | | | — | |
| Net asset value at end of period | | $ | 5.65 | | | $ | 5.73 | | | $ | 5.24 | | | $ | 5.60 | |
| Total return | | | 7.33 | %(E) | | | 18.58 | % | | | 13.07 | % | | | 2.94 | %(E) |
| Ratios and supplemental data: | | | | | | | | | | | | | | | | |
| Net assets at end of period (000's) | | $ | 76,246 | | | $ | 67,052 | | | $ | 13,000 | | | $ | 599 | |
| Ratio to average net assets: | | | | | | | | | | | | | | | | |
| Net expenses | | | 0.73 | %(F) | | | 0.75 | % | | | 0.73 | % | | | 0.73 | %(F) |
| Gross expenses | | | 0.84 | %(F) | | | 0.77 | % | | | 0.99 | % | | | 2.96 | %(F) |
| Net investment income (loss) | | | 0.10 | %(F) | | | (0.07 | %) | | | 0.16 | % | | | (0.18 | )%(F) |
| Portfolio turnover rate | | | 30 | %(E) | | | 82 | % | | | 61 | % | | | 70 | % |
| (A) | The Fund changed its fiscal year end from November 30 to June 30. |
| (B) | Represents the period from commencement of operations (December 23, 2014) through November 30, 2015. |
| (C) | Less than $0.005 per share. |
| (D) | The net investment income (loss) per share was based on average shares outstanding for the period. |
See accompanying Notes to Financial Statements.
Notes to Financial Statements
June 30, 2018
1. Organization
The Touchstone Strategic Trust (the “Trust”) is registered under the Investment Company Act of 1940, as amended (the “1940 Act”), as an open-end management investment company. The Trust was established as a Massachusetts business trust pursuant to an Agreement and Declaration of Trust dated November 18, 1982. The Trust consists of twenty-five funds, including the following four funds (individually, a “Fund”, and collectively, the “Funds”):
Touchstone Balanced Fund (“Balanced Fund”)
Touchstone International Equity Fund (“International Equity Fund”)
Touchstone Large Cap Focused Fund (“Large Cap Focused Fund“)
Touchstone Small Company Fund (“Small Company Fund”)
Each Fund is diversified, with the exception of the Large Cap Focused Fund, which is non-diversified.
The Agreement and Declaration of Trust permits the Trust to issue an unlimited number of shares of beneficial interest of each Fund. The table below indicates the classes of shares that each Fund is registered to offer:
| | | | | | | | | Institutional | | |
| | | Class A | | Class C | | Class Y | | Class | | Class R6 |
| Balanced Fund | | X | | X | | X | | | | |
| International Equity Fund | | X | | X | | X | | X | | |
| Large Cap Focused Fund | | X | | X | | X | | X | | |
| Small Company Fund | | X | | X | | X | | X | | X |
The assets of each Fund are segregated, and a shareholder’s interest is limited to the Fund in which shares are held. The Funds’ prospectus provides a description of each Fund’s investment goal, policies, and strategies along with information on the classes of shares currently being offered.
2. Significant Accounting Policies
The following is a summary of the Funds’ significant accounting policies:
Each Fund is an investment company that follows the accounting and reporting guidance of Accounting Standards Codification Topic 946 applicable to investment companies.
Security valuation and fair value measurements — U.S. generally accepted accounting principles (“U.S. GAAP”) define fair value as the price the Funds would receive to sell an asset or pay to transfer a liability in an orderly transaction between market participants at the measurement date. All investments in securities are recorded at their fair value. The Funds define the term “market value”, as used throughout this report, as the estimated fair value. The Funds use various methods to measure fair value of their portfolio securities on a recurring basis. U.S. GAAP fair value measurement standards require disclosure of a hierarchy that prioritizes inputs to valuation methods.
These inputs are summarized in the three broad levels listed below:
| • | Level 1 | – | quoted prices in active markets for identical securities |
| • | Level 2 | – | other significant observable inputs (including quoted prices for similar securities, interest rates, prepayment speeds, credit risk, etc.) |
| • | Level 3 | – | significant unobservable inputs (including a Fund’s own assumptions in determining the fair value of investments) |
The inputs or methodology used for valuing securities are not necessarily an indication of the risk associated with investing in those securities.
Notes to Financial Statements (Continued)
The aggregate value by input level, as of June 30, 2018, for each Fund’s investments, as well as a reconciliation of assets for which significant unobservable inputs (Level 3) were used in determining value, if applicable, is included in each Fund’s Portfolio of Investments, which also includes a breakdown of the Fund’s investments by geographic, portfolio or sector allocation. The Funds did not hold any Level 3 categorized securities during the seven months ended June 30, 2018.
Changes in valuation techniques may result in transfers into or out of an investment’s assigned level within the hierarchy. All transfers in and out of the levels are recognized at the value at the end of the period. At June 30, 2018, there were no transfers between Levels 1, 2 and 3 for the Funds, except as discussed in the Portfolio of Investments for International Equity Fund.
During the seven months ended June 30, 2018, there were no material changes to the valuation policies and techniques.
The Funds’ portfolio securities are valued as of the close of the regular session of trading on the New York Stock Exchange (“NYSE”) (currently 4:00 p.m., Eastern Time or at the time as of which the NYSE establishes official closing prices). Portfolio securities traded on stock exchanges are valued at the last reported sale price, official close price, or last bid price if no sales are reported. Portfolio securities quoted by NASDAQ are valued at the NASDAQ Official Closing Price (“NOCP”) or from the primary exchange on which the security trades. To the extent these securities are actively traded, they are categorized in Level 1 of the fair value hierarchy. Shares of mutual funds in which the Funds invest are valued at their respective net asset value (“NAV”) as reported by the underlying funds and are categorized in Level 1.
Debt securities held by the Funds are valued at their evaluated bid by an independent pricing service or at their last broker-quoted bid prices as obtained from one or more of the major market makers for such securities. Independent pricing services use information provided by market makers or estimates of market values through accepted market modeling conventions. Observable inputs to the models may include prepayment speeds, pricing spread, yield, trade information, dealer quotes, market color, cash flow models, the securities’ terms and conditions, among others, and are generally categorized in Level 2. Debt securities with remaining maturities of 60 days or less may be valued at amortized cost, provided such amount approximates market value and are categorized in Level 2. While this method provides consistency in valuation (and may only be used if it approximates market value), it may result in periods during which fair value, as determined by amortized cost, is higher or lower than the price that would be received if the Fund sold the investment.
Securities mainly traded on a non-U.S. exchange or denominated in foreign currencies are generally valued according to the preceding closing values on that exchange, translated to U.S. dollars using currency exchange rates as of the close of regular trading on the NYSE, and are generally categorized in Level 1. However, if an event that may change the value of a security occurs after the time that the closing value on the non-U.S. exchange was determined, but before the close of regular trading on the NYSE, the security may be priced based on fair value and is generally categorized in Level 2. This may cause the value of the security, if held on the books of a Fund, to be different from the closing value on the non-U.S. exchange and may affect the calculation of the Fund’s NAV.
Notes to Financial Statements (Continued)
The Funds may use fair value pricing under the following circumstances, among others:
| • | If the value of a security has been materially affected by events occurring before the Funds’ pricing time but after the close of the primary markets on which the security is traded. |
| • | If the exchange on which a portfolio security is principally traded closes early or if trading in a particular portfolio security was halted during the day and did not resume prior to the Funds’ NAV calculation. |
| • | If a security is so thinly traded that reliable market quotations are unavailable due to infrequent trading. |
| • | If the validity of market quotations is not reliable. |
Securities held by the Funds that do not have readily available market quotations, significant observable inputs, or securities for which the available market quotations are not reliable, are priced at their estimated fair value using procedures approved by the Funds’ Board of Trustees (the “Board”) and are generally categorized in Level 3.
Investment companies — The Funds may invest in securities of other investment companies, including exchange-traded funds (“ETFs”), open-end funds and closed-end funds. Open-end funds are investment companies that issue new shares continuously and redeem shares daily. Closed-end funds are investment companies that typically issue a fixed number of shares that trade on a securities exchange or over-the-counter (“OTC”). An ETF is an investment company that typically seeks to track the performance of an index by holding in its portfolio shares of all the companies, or a representative sample of the companies, that are components of a particular index. ETF shares are traded on a securities exchange based on their market value. The risks of investment in other investment companies typically reflect the risks of the types of securities in which the other investment companies invest. Investments in ETFs and closed-end funds are subject to the additional risk that their shares may trade at a premium or discount to their NAV. When a Fund invests in another investment company, shareholders of the Fund indirectly bear their proportionate share of the other investment company’s fees and expenses, including operating, registration, trustee, licensing and marketing, as well as their share of the Fund’s fees and expenses.
Foreign currency translation — The books and records of the Funds are maintained in U.S. dollars and translated into U.S. dollars on the following basis:
| (1) | market value of investment securities, assets and liabilities at the current rate of exchange on the valuation date; and |
| (2) | purchases and sales of investment securities, income, and expenses at the relevant rates of exchange prevailing on the respective dates of such transactions. |
The Funds do not isolate that portion of gains and losses on investments in equity securities that is due to changes in the foreign exchange rates from that which is due to changes in market prices of equity securities.
Real Estate Investment Trusts — The Funds may invest in real estate investment trusts (“REITs”) that involve risks not associated with investing in stocks. Risks include declines in the value of real estate, general and economic conditions, changes in the value of the underlying property and defaults by borrowers. The value of assets in the real estate industry may go through cycles of relative underperformance and outperformance in comparison to equity securities markets in general. Dividend income is recorded using management’s estimate of the income included in distributions received from REIT investments. The actual amounts of income, return of capital and capital gains are only determined by each REIT after its fiscal year-end and may differ from the estimated amount. Estimates of income are adjusted in the Funds to the actual amounts when the amounts are determined.
Notes to Financial Statements (Continued)
Portfolio securities loaned — The Funds may lend their portfolio securities. Lending portfolio securities exposes the Funds to the risk that the borrower may fail to return the loaned securities or may not be able to provide additional collateral or that the Funds may experience delays in recovery of the loaned securities or loss of rights in the collateral if the borrower fails financially. To minimize these risks, the borrower must agree to maintain cash collateral with the Funds’ custodian. The loaned securities are secured by collateral valued at least equal, at all times, to the market value of the loaned securities plus accrued interest, if any. When the collateral falls below specified amounts, the lending agent will use its best effort to obtain additional collateral on the next business day to meet required amounts under the security lending agreement. The cash collateral is reinvested by the Funds’ custodian into an approved short-term investment vehicle. The approved short-term investment vehicle is subject to market risk.
As of June 30, 2018, the following Fund loaned securities and received collateral as follows:
| | | | | Market | | | Market | | | | |
| | | | | Value of | | | Value of | | | | |
| | | | | Securities | | | Collateral | | | Net | |
| Fund | | Security Type | | Loaned* | | | Received** | | | Amount*** | |
| International Equity Fund | | Common Stocks | | $ | 8,495,499 | | | $ | 8,776,526 | | | $ | 281,027 | |
| * | The remaining contractual maturity is overnight for all securities. |
| ** | Gross amount of recognized liabilities for securities lending is included in the Statements of Assets and Liabilities. |
| *** | Net amount represents the net amount payable due to the borrower in the event of default. |
All cash collateral is received, held, and administered by the Funds’ custodian for the benefit of the lending Fund in its custody account or other account established for the purpose of holding collateral in cash equivalents.
Funds participating in securities lending receive compensation in the form of fees. Securities lending income is derived from lending long securities from the Funds to creditworthy approved borrowers at rates that are determined based on trading volumes, float, short-term interest rates and market liquidity and is shown net of fees on the Statements of Operations. When a Fund lends securities, it retains the interest or dividends on the investment of any cash received as collateral, and the Fund continues to receive interest or dividends on the loaned securities.
Unrealized gain or loss on the market value of the loaned securities that may occur during the term of the loan is recognized by the Fund. The Fund has the right under the lending agreement to recover any loaned securities from the borrower on demand.
When-issued or delayed delivery transactions — Each Fund may purchase or sell securities on a when-issued or delayed delivery basis. These transactions involve a commitment by the Fund to purchase or sell securities for a predetermined price or yield, with payment and delivery taking place beyond the customary settlement period. When delayed delivery purchases are outstanding, the Fund will set aside liquid assets in an amount sufficient to meet the purchase price. When purchasing a security on a delayed delivery basis, the Fund assumes the rights and risks of ownership of the security, including the risk of price and yield fluctuations, and takes such fluctuations into account when determining NAV. The Fund may dispose of or renegotiate a delayed delivery transaction after it is entered into, and may sell when-issued securities before they are delivered, which may result in a capital gain or loss. When the Fund has sold a security on a delayed delivery basis, the Fund does not participate in future gains and losses with respect to the security.
Share valuation — The NAV per share of each class of shares of each Fund is calculated daily by dividing the total value of a Fund’s assets attributable to that class, less liabilities attributable to that class, by the number of outstanding shares of that class.
The maximum offering price per share of Class A shares of the Funds is equal to the NAV per share plus a sales load equal to 6.10% of the NAV (or 5.75% of the offering price). There is no sales load on purchases of
Notes to Financial Statements (Continued)
$1 million or more of Class A shares. The maximum offering price per share of Classes C, Y, Institutional Class and R6 shares of the Funds is equal to the NAV per share. Prior to October 28, 2017, the maximum offering price per share of Class A shares of the Funds was equal to the NAV per share plus a sales load equal to 5.26% of the NAV (or 5.00% of the offering price).
The redemption price per share of each class of shares of the Funds is generally equal to the NAV per share. However, Class A redemptions that were part of a no-load $1 million subscription may be subject to a contingent deferred sales charge (“CDSC”) of up to 1.00% if redeemed within a one-year period from the date of purchase. Additionally, purchases of Class C shares of the Funds are subject to a CDSC of 1.00%. The CDSC will be assessed on an amount equal to the lesser of (1) the NAV at the time of purchase of the shares being redeemed or (2) the NAV of such shares being redeemed, if redeemed within a one-year period from the date of purchase.
Redemption Fees — Prior to October 28, 2017, shareholders of the International Equity Fund and Small Company Fund were subject to redemption fees of 2% on shares held 30 calendar days or less. Shareholders of the Balanced Fund and Large Cap Focused Fund were subject to, under certain circumstances, an excessive trading fee of 2% of the amount redeemed. Both the redemption fee and excessive trading fee were subject to certain exceptions under which they may not be charged. As of October 28, 2017, the Funds are no longer subject to redemption fees or excess trading fees. For the period December 1, 2016 through October 27, 2017, these fees totaled $1,743 and are included in Cost of Shares redeemed on the Statements of Changes in Net Assets - Capital Stock Activity for the year ended November 30, 2017.
Investment income — Dividend income from securities is recognized on the ex-dividend date, net of foreign withholding taxes, if any, which are reduced by any amounts reclaimable by the Funds, where applicable. Interest income from securities is recorded on the basis of interest accrued, premium amortized and discount accreted. Realized gains and losses resulting from principal paydowns on mortgage-backed and asset-backed securities are included in interest income. Market discounts, original issue discount and market premiums on debt securities are accreted/amortized to interest income over the life of the security with a corresponding adjustment in the cost basis of that security. In addition, it is the Funds’ policy to accrue for foreign capital gains taxes, if applicable, on certain foreign securities held by the Funds. An estimated foreign capital gains tax is recorded daily on net unrealized gains on these securities and is payable upon the sale of such securities when a gain is realized.
Distributions to shareholders — Each Fund intends to distribute to its shareholders substantially all of its income and capital gains. Each Fund, except the Balanced Fund, declares and distributes net investment income, if any, annually, as a dividend to shareholders. The Balanced Fund declares and distributes net investment income, if any, quarterly as a dividend to shareholders. Prior to October 28, 2017, the Large Cap Focused Fund declared and distributed net investment income, if any, quarterly as a dividend to shareholders. Each Fund makes distributions of capital gains, if any, at least annually, net of applicable capital loss carryforwards. Income distributions and capital gain distributions are determined in accordance with income tax regulations. Recognition of the Funds’ net investment income from investments in underlying funds is affected by the timing of dividend declarations by the underlying funds.
Allocations — Investment income earned, realized capital gains and losses, and unrealized appreciation and depreciation for a Fund are allocated daily to each class of shares based upon its proportionate share of total net assets of the Fund. Class-specific expenses are charged directly to the class incurring the expense. Common expenses, which are not attributable to a specific class, are allocated daily to each class of shares based upon their proportionate share of total net assets of the Fund. Expenses not directly billed to a Fund are allocated proportionally among all Funds in the Trust, and, if applicable, Touchstone Funds Group Trust, Touchstone Institutional Funds Trust, and Touchstone Variable Series Trust (collectively with the Trust, “Touchstone Fund Complex”), daily in relation to net assets of each Fund or another reasonable measure.
Notes to Financial Statements (Continued)
Security transactions — Security transactions are reflected for financial reporting purposes as of the trade date. Realized gains and losses on sales of portfolio securities are calculated using the identified cost basis.
Estimates — The preparation of financial statements in conformity with U.S. GAAP requires management to make estimates and assumptions that affect the reported amounts of assets and liabilities and disclosure of contingent assets and liabilities at the date of the financial statements and the reported amounts of income and expenses during the reporting period. Actual results could differ from those estimates.
3. Investment Transactions
Investment transactions (excluding short-term investments and U.S. Government securities) were as follows for the seven months ended June 30, 2018:
| | | | | | International | | | Large Cap | | | Small | |
| | | Balanced | | | Equity | | | Focused | | | Company | |
| | | Fund | | | Fund | | | Fund* | | | Fund | |
| Purchases of investment securities | | $ | 65,036,671 | | | $ | 48,685,829 | | | $ | 164,396,615 | | | $ | 339,585,073 | |
| Proceeds from sales and maturities | | $ | 65,941,047 | | | $ | 59,961,100 | | | $ | 226,682,795 | | | $ | 429,908,940 | |
*Large Cap Focused Fund had redemptions-in-kind which resulted in redemptions out of the Fund of $118,054,500 and is excluded from the proceeds from sales and maturities. The redemptions were comprised of securities and cash in the amount of $113,896,614 and $4,157,886, respectively.
For the seven months ended June 30, 2018, purchases and proceeds from sales and maturities in U.S. Government Securities were $314,179,966 and $340,150,627, respectively, for the Balanced Fund. There were no purchases or proceeds from sales and maturities of U.S. Government Securities by the remaining Funds for the seven months ended June 30, 2018.
4. Transactions with Affiliates and Other Related Parties
Certain officers of the Trust are also officers of Touchstone Advisors, Inc. (the “Advisor”),Touchstone Securities, Inc. (the “Underwriter”), or The Bank of New York Mellon, the Sub-Administrator to the Funds and BNY Mellon Investment Servicing (U.S.) Inc., the Transfer Agent to the Funds (collectively referenced to herein as “BNY Mellon”). Such officers receive no compensation from the Trust. The Advisor and the Underwriter are each wholly-owned subsidiaries of Western & Southern Financial Group, Inc. (“Western & Southern”).
On behalf of the Funds, the Advisor pays each Independent Trustee a quarterly retainer plus additional retainers to the Lead Independent Trustee and the chairs of each standing committee. Interested Trustees do not receive compensation from the Funds. Each Independent Trustee also receives compensation for each Board meeting and committee meeting attended. Each standing committee chair receives additional compensation for each committee meeting that he or she oversees. The Advisor is reimbursed by the Funds for the Independent Trustees’ compensation and out-of-pocket expenses relating to their services. The Funds accrued Trustee-related expenses of $49,852 and $7,500 for the seven months ended June 30, 2018 and for the period October 28, 2017 through November 30, 2017, respectively, which are included in the Trustee and Compliance fees and expenses on the Statements of Operations. For the period December 1, 2016 through October 27, 2017, the Funds incurred Director-related expenses of $809,156 for the Directors of the Sentinel Group Funds, Inc. (the “Former Board of Directors”), which are included in the Trustee and Compliance fees and expenses on the Statements of Operations for the year ended November 30, 2017.
Notes to Financial Statements (Continued)
MANAGEMENT & EXPENSE LIMITATION AGREEMENTS
The Advisor provides general investment supervisory services for the Funds, under terms of an advisory agreement (the “Advisory Agreement”). Under the Advisory Agreement, each Fund pays the Advisor a fee, which is computed and accrued daily and paid monthly, at an annual rate based on average daily net assets of each Fund as shown in the table below.
| Balanced Fund | 0.55% on the first $200 million |
| | 0.50% on the next $200 million |
| | 0.45% on the next $600 million |
| | 0.40% on the next $1 billion |
| | 0.35% on such assets over $2 billion |
| International Equity Fund | 0.70% on the first $500 million |
| | 0.65% on the next $300 million |
| | 0.60% on the next $200 million |
| | 0.50% on the next $1 billion |
| | 0.40% on such assets over $2 billion |
| Large Cap Focused Fund | 0.70% on the first $500 million |
| | 0.65% on the next $300 Million |
| | 0.60% on the next $200 million |
| | 0.50% on the next $1 billion |
| | 0.40% on such assets over $2 billion |
| Small Company Fund | 0.70% on the first $500 million |
| | 0.65% on the next $300 million |
| | 0.60% on the next $200 million |
| | 0.50% on the next $1 billion |
| | 0.40% on such assets over $2 billion |
Prior to October 28, 2017, Sentinel Asset Management, Inc. (the “Former Advisor”), a subsidiary of NLV Financial Corp., served as the advisor to the Funds. For its services, each Fund paid the Former Advisor a monthly fee at an annual rate based on average daily net assets of each Fund as shown in the table listed above.
Effective October 28, 2017, the Advisor entered into investment sub-advisory agreements for the Funds with Fort Washington Investment Advisors, Inc. (the “Sub-Advisor”), an affiliate of the Advisor and wholly-owned subsidiary of Western & Southern. The Advisor, not the Funds, pays the sub-advisory fees to the Sub-Advisor.
Effective October 28, 2017, the Advisor entered into an expense limitation agreement (the “Expense Limitation Agreement”) to contractually limit the annual operating expenses of the Funds, excluding: dividend and interest expenses relating to short sales; interest; taxes; brokerage commissions and other transaction costs; portfolio transaction and investment related expenses, including expenses associated with the Fund’s liquidity provider; other expenditures which are capitalized in accordance with U.S. GAAP; the cost of “Acquired Fund Fees and Expenses”, if any; and other extraordinary expenses not incurred in the ordinary course of business. The maximum annual operating expense limit in any year with respect to the Funds is based on a percentage of the average daily net assets of the Funds. The Advisor has agreed to separately waive class-level expenses, advisory fees and administration fees, and to reimburse expenses in order to maintain the following expense limitations for the Funds:
Notes to Financial Statements (Continued)
| | | | | | | | | | | | Institutional | | | | |
| | | Class A | | | Class C | | | Class Y | | | Class | | | Class R6 | |
| Balanced Fund | | | 1.01 | % | | | 1.78 | % | | | 0.81 | % | | | — | | | | — | |
| International Equity Fund | | | 1.36 | % | | | 2.49 | % | | | 0.99 | % | | | 0.89 | % | | | — | |
| Large Cap Focused Fund | | | 1.00 | % | | | 1.79 | % | | | 0.72 | % | | | 0.65 | % | | | — | |
| Small Company Fund | | | 1.22 | % | | | 1.95 | % | | | 0.89 | % | | | 0.79 | % | | | 0.73 | % |
These expense limitations will remain in effect for all Funds through at least October 27, 2019, but can be terminated by a vote of the Funds’ Board if it deems the termination to be beneficial to the Funds’ shareholders.
During the seven months ended June 30, 2018, the Advisor or its affiliates waived investment advisory fees, administration fees or reimbursed or waived other operating expenses, including distribution fees, of the Funds as follows:
| | | Investment | | | | | | | | | | |
| | | Advisory | | | | | | Other Operating | | | | |
| | | Fees | | | Administration | | | Expenses | | | | |
| Fund | | Waived | | | Fees Waived | | | Waived | | | Total | |
| Balanced Fund | | $ | — | | | $ | — | | | $ | 118,730 | | | $ | 118,730 | |
| International Equity Fund | | | — | | | | 79,268 | | | | 19,413 | | | | 98,681 | |
| Large Cap Focused Fund | | | — | | | | 1,176,046 | | | | 128,183 | | | | 1,304,229 | |
| Small Company Fund | | | — | | | | 574,674 | | | | 22,010 | | | | 596,684 | |
For the period October 28, 2017 through November 30, 2017, the Advisor or its affiliates waived investment advisory fees, administration fees and other operating expenses, including distribution fees, of the Funds, which are included on the Statements of Operations for the year ended November 30, 2017, as follows:
| | | Investment | | | | | | | | | | |
| | | Advisory | | | | | | Other Operating | | | | |
| | | Fees | | | Administration | | | Expenses | | | | |
| Fund | | Waived | | | Fees Waived | | | Waived | | | Total | |
| Balanced Fund | | $ | — | | | $ | — | | | $ | 28,413 | | | $ | 28,413 | |
| International Equity Fund | | | — | | | | 24,784 | | | | 12,762 | | | | 37,546 | |
| Large Cap Focused Fund | | | — | | | | 71,773 | | | | 22,344 | | | | 94,117 | |
| Small Company Fund | | | — | | | | 20,418 | | | | 9,021 | | | | 29,439 | |
Prior to October 28, 2017, the Former Advisor had contractually agreed to reimburse certain expenses paid by the former Class I shares of each Fund to the extent necessary to prevent the total annual fund operating expense ratios of the Class I shares of each Fund, on an annualized basis, from exceeding the total annual fund operating expense ratio of the respective Class A shares of the same Fund, where applicable. On October 28, 2017, this arrangement was terminated and Class I shares of the Funds converted to Class Y shares.
Prior to October 28, 2017, the Former Advisor had contractually agreed to waive fees and/or reimburse certain expenses in order to limit total annual fund operating expenses after fee waiver and/or expense reimbursement for the Large Cap Focused Fund and the Small Company Fund former Class R6 shares, on an annualized basis, to 0.65% and 0.73%, respectively, of average daily net assets attributable to Class R6 shares. On October 28, 2017, this arrangement was terminated and Class R6 shares of the Large Cap Focused Fund converted to Institutional Class shares.
Notes to Financial Statements (Continued)
For the period December 1, 2016 through October 27, 2017, the Former Advisor accrued investment advisory fees of the Funds, which are included in the Investment advisory fees on the Statements of Operations for the year ended November 30, 2017, as follows:
| | | Investment | |
| | | Advisory | |
| | | Fees | |
| Fund | | Accrued | |
| Balanced Fund | | $ | 1,617,997 | |
| International Equity Fund | | | 1,209,465 | |
| Large Cap Focused Fund | | | 10,612,937 | |
| Small Company Fund | | | 6,719,520 | |
The Former Advisor did not waive fees or reimburse expenses for the period December 1, 2016 through October 27, 2017.
Under the terms of the Expense Limitation Agreement, the Advisor is entitled to recover, subject to approval by the Funds’ Board, such amounts waived or reimbursed for a period of up to three years from the date on which the Advisor reduced its compensation or assumed expenses for the Funds. No recoupment will occur unless a Fund’s operating expenses are below the expense limitation amount in effect at the time of the waiver or reimbursement and the Fund’s current expense limitation.
As of June 30, 2018, the Advisor may seek recoupment of previously waived fees and reimbursed expenses as follows:
| | | Expiration | | | Expiration | | | | |
| | | November 30, | | | June 30, | | | | |
| Fund | | 2020 | | | 2021 | | | Total | |
| Balanced Fund | | $ | 3,422 | | | $ | 16,819 | | | $ | 20,241 | |
| International Equity Fund | | | 33,634 | | | | 98,681 | | | | 132,315 | |
| Large Cap Focused Fund | | | 90,753 | | | | 1,304,229 | | | | 1,394,982 | |
| Small Company Fund | | | 29,439 | | | | 596,684 | | | | 626,123 | |
The Advisor did not recoup any amounts it previously waived or reimbursed during the seven months ended June 30, 2018 and year ended November 30, 2017
For the period December 1, 2016 through October 27, 2017, the Former Advisor did not recoup any amounts it previously reimbursed for the Funds. Additionally, any amounts previously reimbursed by the Former Advisor are no longer subject to recoupment.
ADMINISTRATION AGREEMENT
The Advisor entered into an Administration Agreement with the Trust, whereby the Advisor is responsible for: supplying executive and regulatory compliance services; supervising the preparation of tax returns; coordinating the preparation of reports to shareholders and reports to, and filings with, the Securities and Exchange Commission (the “SEC”) and state securities authorities, as well as materials for meetings of the Board; calculating the daily NAV per share; and maintaining the financial books and records of each Fund.
For its services, the Advisor’s annual administrative fee is:
0.145% on the first $20 billion of the aggregate average daily net assets;
0.11% on the next $10 billion of aggregate average daily net assets;
0.09% on the next $10 billion of aggregate average daily net assets; and
0.07% on the aggregate average daily net assets over $40 billion.
Notes to Financial Statements (Continued)
The fee is computed and allocated among the Touchstone Fund Complex (excluding Touchstone Institutional Funds Trust) on the basis of relative daily net assets.
The Advisor has engaged BNY Mellon as the Sub-Administrator to the Trust. BNY Mellon provides administrative and accounting services to the Trust and is compensated directly by the Advisor, not the Trust.
Prior to October 28, 2017, Sentinel Administrative Services, Inc. (the “Former Administrator”), a wholly owned subsidiary of the Former Advisor, served as the Administrator to the Funds. The Former Administrator provided a) general administrative services and b) transfer agency administrative and oversight services on behalf of the Funds. Under the general administrative services portion of the agreement, the Funds received administration services and paid the Former Administrator a monthly fee at an annual rate of 0.0375% of the first $4 billion of the aggregate average daily net assets; 0.035% of the next $3 billion of the aggregate average daily net assets and 0.0325% of the aggregate average daily net assets in excess of $7 billion. The fee was computed and allocated among the Sentinel Group Funds, Inc. on the basis of relative daily net assets. Under the transfer agency administrative and oversight services portion of the agreement, the Funds received monitoring and oversight of transfer agency vendor services and were responsible for all costs and expenses relating to the individuals designated by the Former Administrator to perform such services on behalf of the Former Administrator. The number of such individuals designated by the Former Administrator to perform services was subject to approval by the Former Board of Directors. The Funds were also responsible for all charges of outside pricing services and other out-of-pocket expenses incurred by the Former Administrator in connection with the performance of its duties. The Funds could also reimburse the Former Administrator for sub-transfer agency, plan agent and similar fees paid by the Former Administrator to other entities that provided services to accounts underlying an omnibus account of record in accordance with policies approved by the Former Board of Directors. During the period December 1, 2016, through October 27, 2017, the Former Administrator received the following fees, which are included in the Administration fees on the Statements of Operations for the year ended November 30, 2017:
| Fund | | | | |
| Balanced Fund | | $ | 112,866 | |
| International Equity Fund | | | 63,844 | |
| Large Cap Focused Fund | | | 677,387 | |
| Small Company Fund | | | 385,733 | |
TRANSFER AGENT AGREEMENT
Under the terms of the Transfer Agent Agreement between the Trust and BNY Mellon, BNY Mellon maintains the records of each shareholder’s account, answers shareholders’ inquiries concerning their accounts, processes purchases and redemptions of each Fund’s shares, acts as dividend and distribution disbursing agent, and performs other shareholder service functions. For these services, BNY Mellon receives a monthly fee from each Fund. In addition, each Fund pays out-of-pocket expenses incurred by BNY Mellon, including, but not limited to, postage and supplies.
The Funds may reimburse the Advisor for fees paid to intermediaries such as banks, broker-dealers, financial advisors or other financial institutions for sub-transfer agency, sub-administration and other services provided to investors whose shares of record are held in omnibus, other group accounts, retirement plans or accounts traded through registered securities clearing agents. These fees may vary based on, for example, the nature of services provided, but generally range up to 0.15% of the assets of the class serviced or maintained by the intermediary or up to $22 per sub-account maintained by the intermediary.
Prior to October 28, 2017, Boston Financial Data Services, Inc. served as the Transfer Agent to the Funds.
Notes to Financial Statements (Continued)
PLANS OF DISTRIBUTION AND SHAREHOLDER SERVICING FEE ARRANGEMENTS
The Trust has adopted distribution plans pursuant to Rule 12b-1 under the 1940 Act for each class of shares it offers that is subject to 12b-1 distribution fees. The plans allow each Fund to pay distribution and other fees for the sale and distribution of its shares and for services provided to shareholders. The fees charged to the Funds are limited to the actual expenses incurred. Under the Class A plan, each Fund offering Class A shares pays an annual fee of up to 0.25% of average daily net assets that are attributable to Class A shares. Under the Class C plan, each Fund offering Class C shares pays an annual fee of up to 1.00% of average daily net assets that are attributable to Class C shares (of which up to 0.75% is a distribution fee and up to 0.25% is a shareholder servicing fee).
Prior to October 28, 2017, the Class A shares of the Funds had adopted a distribution plan pursuant to Rule 12b-1 under the 1940 Act, (the “Former A Plans”). Under the Former A Plans, each participating Fund paid to Sentinel Financial Services Company (the “Former Distributor”, a company in which the Former Advisor and Sentinel Financial Services, Inc., a wholly owned subsidiary of the Former Advisor, are partners), a monthly fee at the maximum annual rate of 0.25% of average daily net assets relating to Class A shares outstanding. Such fees were used to reimburse the Former Distributor for eligible expenses incurred in connection with distribution and promotion of the shares and, up to 0.25%, for the servicing of shareholders of each participating Fund.
Prior to October 28, 2017, the Funds that offered Class C shares had also adopted a Class C distribution plan applicable to its Class C shares (the “Former C Plans”). Under the Former C Plans, the Class C shares of each Fund paid to the Former Distributor a monthly fee at an annual rate of up to a total of 1.00% of average daily net assets. Such fees were used to reimburse the Former Distributor for eligible expenses incurred in connection with distribution and promotion of the shares and, up to 0.25%, for the servicing of shareholders of each participating Fund. In the first year after the purchase, this fee was designed to recover the initial sales commission of 1.00% paid by the Former Distributor to the selling financial intermediary. In subsequent years, the entire 1.00% may have been paid to the financial intermediary as additional commission and/or, up to 0.25%, for service fees.
Prior to October 28, 2017, the Funds were not assessed distribution fees on shares owned by NLV Financial Corporation and its affiliates.
For the period December 1, 2016, through October 27, 2017, the Former Distributor received the following fees, which are included in the Distribution expenses, Class A, for Class A shares and the Distribution and shareholder servicing expenses, Class C, for Class C shares on the Statements of Operations for the year ended November 30, 2017:
| | | Class A | | | Class C | |
| Fund | | Shares | | | Shares | |
| Balanced Fund | | $ | 614,649 | | | $ | 416,269 | |
| International Equity Fund | | | 284,691 | | | | 61,377 | |
| Large Cap Focused Fund | | | 3,072,777 | | | | 747,052 | |
| Small Company Fund | | | 1,531,820 | | | | 976,000 | |
UNDERWRITING AGREEMENT
The Underwriter is the Funds’ principal underwriter and, as such, acts as exclusive agent for distribution of the Funds’ shares. Under the terms of the Underwriting Agreement between the Trust and the Underwriter, the Underwriter earned underwriting and broker commissions on the sale of Class A shares of the Funds. W&S Brokerage Services, Inc., an affiliate of the Underwriter and the Advisor, also earned broker commissions on the sale of Class A shares of the Funds. Listed below are the total underwriting and broker commissions earned by the Underwriter and its affiliate for the seven months ended June 30, 2018:
Notes to Financial Statements (Continued)
| Fund | | Amount | |
| Balanced Fund | | $ | 23,139 | |
| International Equity Fund | | | 17,542 | |
| Large Cap Focused Fund | | | 22,603 | |
| Small Company Fund | | | 26,598 | |
In addition, the Underwriter collected CDSC on the redemption of Class A shares and Class C shares of the Funds listed below for the seven months ended June 30, 2018:
| Fund | | Class A Shares | | | Class C Shares | |
| Balanced Fund | | $ | 42 | | | $ | 876 | |
| International Equity Fund | | | 374 | | | | 7 | |
| Large Cap Focused Fund | | | 2,561 | | | | 92 | |
| Small Company Fund | | | 131 | | | | 53 | |
INTERFUND TRANSACTIONS
The Funds may engage in purchase and sale transactions with funds that have a common investment advisor (or affiliated investment advisors), common Trustees and/or common Officers. During the seven months ended June 30, 2018, the Funds did not engage in any Rule 17a-7 transactions as defined under the 1940 Act.
5. Liquidity
ReFlow Fund LLC — The Funds may participate in the ReFlow Fund LLC liquidity program (“ReFlow”), which is designed to provide an alternative liquidity source for funds experiencing redemptions. In order to pay cash to shareholders who redeem their shares on a given day, a fund typically must hold cash in its portfolio, liquidate portfolio securities, or borrow money. ReFlow provides participating funds with another source of cash by standing ready to purchase shares from a fund up to the amount of the fund’s net redemptions on a given day, cumulatively limited to 3% of the outstanding voting shares of a Fund. ReFlow then generally redeems those shares when the Fund experiences net sales. In return for this service, the Fund will pay a fee to ReFlow at a rate determined by a daily auction with other participating mutual funds.
During the seven months ended June 30, 2018, the Large Cap Focused Fund utilized ReFlow. ReFlow subscribed to 2,879,784 shares of the Fund during the period and had redemptions-in-kind of $113,896,614. The resulting fee is recorded in Other expenses on the Statements of Operations.
Interfund Lending—Pursuant to an Exemptive Order issued by the SEC on March 28, 2017, the Funds, along with certain other funds in the Touchstone Fund Complex, may participate in an interfund lending program. The interfund lending program provides an alternate credit facility that allows the Funds to lend to or borrow from other participating funds in the Touchstone Fund Complex, subject to the conditions of the Exemptive Order. The Funds may not borrow under the facility for leverage purposes and the loans’ duration may be no more than 7 days.
During the seven months ended June 30, 2018, the following Fund participated as lender in the interfund lending program. The average amount loaned, average interest rate and interest income were as follows:
| | | Average Amount | | | Average Interest | | | Interest | |
| Fund | | Loaned | | | Rate | | | Income* | |
| Small Company Fund | | $ | 1,166,718 | | | | 1.56 | % | | $ | 10,710 | |
* Included in Interest in the Statements of Operations.
Notes to Financial Statements (Continued)
During the seven months end June 30, 2018, the following Fund participated as a borrower in the interfund lending program. The average amount borrowed, average interest rate and interest expense were as follows:
| | | Average Amount | | | Average Interest | | | Interest | |
| Fund | | Borrowed | | | Rate | | | Expense* | |
| International Equity Fund | | $ | 245,283 | | | | 1.60 | % | | $ | 2,096 | |
* Included in Other expenses in the Statements of Operations.
6. Federal Tax Information
Federal income tax — It is each Fund’s policy to continue to comply with the special provisions of the Internal Revenue Code applicable to regulated investment companies. As provided therein, in any fiscal year in which a Fund so qualifies and distributes at least 90% of its investment company taxable income, the Fund (but not the shareholders) will be relieved of federal income tax on the income distributed. It is each Fund’s policy to distribute all of its taxable income and accordingly, no provision for income taxes has been made.
In order to avoid imposition of the excise tax applicable to regulated investment companies, it is also each Fund’s intention to declare and pay as dividends in each calendar year at least 98% of its investment company taxable income (earned during the calendar year) and 98.2% of its net realized capital gains (earned during the twelve months ending October 31) plus undistributed amounts from prior years.
The tax character of distributions paid for the seven months ended June 30, 2018 and years ended November 30, 2017 and November 30, 2016 is as follows:
| | | Balanced Fund | | | International Equity Fund | |
| | | Seven
Months Ended
June 30,
2018 | | | Year Ended
November 30,
2017 | | | Year Ended
November 30,
2016 | | | Seven
Months Ended
June 30,
2018 | | | Year Ended
November 30,
2017 | | | Year Ended
November 30,
2016 | |
| From ordinary income | | $ | 2,415,681 | | | $ | 3,724,887 | | | $ | 6,767,216 | | | $ | 2,308,837 | | | $ | 1,250,578 | | | $ | 976,876 | |
| From long-term capital gains | | | 15,494,463 | | | | 2,124,199 | | | | 9,916,784 | | | | 7,102,450 | | | | — | | | | 3,860,204 | |
| Total distributions | | $ | 17,910,144 | | | $ | 5,849,086 | | | $ | 16,684,000 | | | $ | 9,411,287 | | | $ | 1,250,578 | | | $ | 4,837,080 | |
| | | Large Cap Focused Fund | | | Small Company Fund | |
| | | Seven
Months Ended
June 30,
2018 | | | Year Ended
November 30,
2017 | | | Year Ended
November 30,
2016 | | | Seven
Months Ended
June 30,
2018 | | | Year Ended
November 30,
2017 | | | Year Ended
November 30,
2016 | |
| From ordinary income | | $ | 4,002,079 | | | $ | 24,480,711 | | | $ | 57,077,267 | | | $ | 19,425,568 | | | $ | — | | | $ | — | |
| From long-term capital gains | | | 265,660,471 | | | | 115,781,936 | | | | 137,723,635 | | | | 85,276,646 | | | | 89,216,186 | | | | 159,188,187 | |
| Total distributions | | $ | 269,662,550 | | | $ | 140,262,647 | | | $ | 194,800,902 | | | $ | 104,702,214 | | | $ | 89,216,186 | | | $ | 159,188,187 | |
Notes to Financial Statements (Continued)
The following information is computed on a tax basis for each item as of June 30, 2018:
| | | Balanced | | | International | |
| | | Fund | | | Equity Fund | |
| Tax cost of portfolio investments | | $ | 185,670,936 | | | $ | 175,347,746 | |
| Gross unrealized appreciation on investments | | | 125,514,059 | | | | 27,758,153 | |
| Gross unrealized depreciation on investments | | | (1,999,539 | ) | | | (13,559,429 | ) |
| Net unrealized appreciation (depreciation) on investments | | | 123,514,520 | | | | 14,198,724 | |
| Net unrealized depreciation on foreign currency transactions | | | — | | | | (11,172 | ) |
| Other temporary differences | | | (450 | ) | | | — | |
| Undistributed ordinary income | | | 338,007 | | | | 1,952,690 | |
| Undistributed capital gains | | | 6,063,370 | | | | 16,188,079 | |
| Accumulated earnings (deficit) | | $ | 129,915,447 | | | $ | 32,328,321 | |
| | | Large Cap | | | Small Company | |
| | | Focused Fund | | | Fund | |
| Tax cost of portfolio investments | | $ | 751,127,156 | | | $ | 924,870,531 | |
| Gross unrealized appreciation on investments | | | 990,182,055 | | | | 310,582,076 | |
| Gross unrealized depreciation on investments | | | (7,423,401 | ) | | | (13,531,414 | ) |
| Net unrealized appreciation (depreciation) on investments | | | 982,758,654 | | | | 297,050,662 | |
| Other temporary differences | | | (273 | ) | | | — | |
| Undistributed ordinary income | | | 15,934,570 | | | | 23,281,263 | |
| Undistributed capital gains | | | 22,435,104 | | | | 32,736,633 | |
| Accumulated earnings (deficit) | | $ | 1,021,128,055 | | | $ | 353,068,558 | |
The difference between the tax cost of portfolio investments and the financial statement cost is primarily due to wash sale loss deferrals and passive foreign investment company (“PFIC”) adjustments.
As of June 30, 2018, the Funds had no capital loss carryforwards for federal income tax purposes.
Under current laws, certain capital losses realized after October 31 and ordinary losses realized after December 31 may be deferred (and certain ordinary losses after October and/or December 31 may be deferred) and treated as occurring on the first day of the following fiscal year. For the seven months ended June 30, 2018, the Funds did not elect to defer any losses.
The Funds have analyzed their tax positions taken on federal income tax returns for all open tax years (tax years ended June 30, 2018 and November 30, 2014 through 2017) and have concluded that no provision for income tax is required in their financial statements.
Certain reclassifications, the result of permanent differences between financial statement and income tax reporting requirements, have been made to the components of capital. These reclassifications have no impact on the net assets or NAV per share of the Funds. The following reclassifications, which are primarily attributed to the tax treatment of foreign currency gains/losses, reclassification of net operating losses, redesignation of dividends paid, adjustments on preferred sold, deferred capital gains tax reclassification, capital gains distributions reclassifications, litigation reclassification, paydown gain/losses on mortgage-backed securities, in-kind distributions for shareholder redemptions and deemed distributions on shareholder redemptions, have been made to the following Funds for the seven months ended June 30, 2018:
Notes to Financial Statements (Continued)
| | | | | | Accumulated | | | Accumulated | |
| | | Paid-In | | | Net Investment | | | Net Realized | |
| Fund | | Capital | | | Income(Loss) | | | Gains(Losses) | |
| Balanced Fund | | $ | — | | | $ | 184,856 | | | $ | (184,856 | ) |
| International Equity Fund | | | — | | | | (615,160 | ) | | | 615,160 | |
| Large Cap Focused Fund | | | 101,559,359 | | | | (2,839,137 | ) | | | (98,720,222 | ) |
| Small Company Fund | | | (26,578 | ) | | | 1,601,393 | | | | (1,574,815 | ) |
7. Commitments and Contingencies
The Funds indemnify the Trust’s officers and Trustees for certain liabilities that might arise from their performance of their duties to the Funds. Additionally, in the normal course of business, the Funds enter into contracts that contain a variety of representations and warranties and which provide general indemnifications. The Funds’ maximum exposure under these arrangements is unknown, as this would involve future claims that may be made against the Funds.
8. Principal Risks
Risks Associated with Foreign Investments — Some of the Funds may invest in the securities of foreign issuers. Investing in securities issued by companies whose principal business activities are outside the U.S. may involve significant risks not present in domestic investments. For example, there is generally less publicly available information about foreign companies, particularly those not subject to the disclosure and reporting requirements of the U.S. securities laws. Foreign issuers are generally not bound by uniform accounting, auditing, and financial reporting requirements and standards of practice comparable to those applicable to domestic issuers. Investments in foreign securities also involve the risk of possible adverse changes in investment or exchange control regulations, expropriation or confiscatory taxation, limitations on the removal of funds or other assets of a Fund, political or financial instability or diplomatic and other developments which could affect such investments. Foreign stock markets, while growing in volume and sophistication, are generally not as developed as those in the U.S., and securities of some foreign issuers (particularly those located in developing countries) may be less liquid and more volatile than securities of comparable U.S. companies. In general, there is less overall governmental supervision and regulation of foreign securities markets, broker-dealers, and issuers than in the U.S.
Risks Associated with Concentration — Certain Funds may invest a high percentage of their assets in specific sectors of the market in order to achieve a potentially greater investment return. As a result, these Funds may be more susceptible to economic, political, and regulatory developments in a particular sector of the market, positive or negative, and may experience increased volatility on the Funds’ NAVs and magnified effect on the total return.
Risks Associated with Credit — An issuer may be unable to make timely payments of either principal or interest. This may cause the issuer’s securities to decline in value. Credit risk is particularly relevant to those Funds that invest a significant amount of their assets in junk bonds or lower-rated securities.
Risks Associated with Interest Rate Changes — As interest rates rise, the value of fixed-income securities a Fund owns will likely decrease. The price of debt securities is generally linked to the prevailing market interest rates. In general, when interest rates rise, the price of debt securities falls, and when interest rates fall, the price of debt securities rises. The price volatility of a debt security also depends on its maturity. Longer-term securities are generally more volatile, so the longer the average maturity or duration of these securities, the greater their price risk. Duration is a measure of the expected life, taking into account any prepayment or call features of the security, that is used to determine the price sensitivity of the security for a given change in interest rates. Specifically, duration is the change in the value of a fixed-income security that will result from a 1% change in interest rates, and generally is stated in years. For example, as a general rule a 1% rise in interest rates means
Notes to Financial Statements (Continued)
a 1% fall in value for every year of duration. Maturity, on the other hand, is the date on which a fixed-income security becomes due for payment of principal. The negative impact on fixed income securities if interest rates increase as a result could negatively impact a Fund’s NAV.
Please see the Funds’ prospectus for a complete discussion of these and other risks.
9. Reorganizations
The shareholders of the Sentinel Balanced Fund, Sentinel International Equity Fund, Sentinel Common Stock Fund and Sentinel Small Company Fund (the “Reorganizing Funds”), each a series of Sentinel Group Funds, Inc., approved an Agreement and Plan of Reorganization providing for the transfer of all assets and liabilities of each Reorganizing Fund to the corresponding Touchstone Fund as noted below. The Balanced Fund, International Equity Fund, Large Cap Focused Fund and Small Company Fund, each a new series of the Trust, assumed the financial and performance history of the Sentinel Balanced Fund, Sentinel International Equity Fund, Sentinel Common Stock Fund and Sentinel Small Company Fund, respectively. The tax-free reorganizations took place on October 27, 2017.
| | | | | Net | | | Shares | |
| Reorganizing Funds | | Touchstone Funds* | | Assets | | | Outstanding | |
| Sentinel Balanced Fund | | Balanced Fund | | $ | 331,423,150 | | | | 15,092,088 | |
| Sentinel International Equity Fund | | International Equity Fund | | | 203,883,053 | | | | 10,805,595 | |
| Sentinel Common Stock Fund | | Large Cap Focused Fund | | | 1,895,170,925 | | | | 40,069,142 | |
| Sentinel Small Company Fund | | Small Company Fund | | | 1,214,732,067 | | | | 230,307,818 | |
*Class A, Class C, and Class I shares of the Reorganizing Funds were exchanged for Class A, Class C and Class Y shares, respectively, of the corresponding Touchstone Fund. Class R6 shares of the Sentinel Common Stock Fund were exchanged for Institutional Class shares of the Large Cap Focused Fund. Class R6 shares of the Sentinel Small Company Fund were exchanged for Class R6 shares of the Small Company Fund. On October 30, 2017, the International Equity Fund and Small Company Fund began issuing Institutional Class shares.
Pursuant to a Plan of Reorganization approved by the Sentinel Group Funds, Inc. Board of Directors on December 3, 2015, as of the close of business on March 30, 2016, Sentinel Small Company Fund acquired 100% of the voting equity interests, substantially all of the assets and assumed substantially all of the liabilities of Sentinel Mid Cap Fund, a separate series of the Sentinel Group Funds, Inc., in a tax-free reorganization in exchange for shares of the Sentinel Small Company Fund. The primary reason for the transaction was to combine a smaller Fund into a larger Fund with similar investment strategies and policies. For financial reporting purposes, the net assets received and shares issued by the Sentinel Small Company Fund were recorded at fair value; however, the Sentinel Mid Cap Fund’s cost of investments were carried forward to align ongoing reporting of the Sentinel Small Company Fund’s realized and unrealized gains and losses with amounts distributable to shareholders for tax purposes. The merger conversion ratios, the number of shares and the value of shares issued by the Sentinel Small Company Fund is presented in the Statement of Changes in Net Assets – Capital Stock Activity. Net assets and acquired unrealized appreciation (depreciation) as of the reorganization date were as follows:
Notes to Financial Statements (Continued)
| | | | | | | | | | | Total | | | | |
| | | | | | | | | | | Net Assets of | | | Acquired | |
| | | | | Total | | | Total | | | Acquiring | | | Fund | |
| | | | | Net Assets of | | | Net Assets of | | | Fund | | | Unrealized | |
| | | | | Acquiring | | | Acquired | | | After the | | | Appreciation/ | |
| Acquiring Fund | | Acquired Fund | | Fund | | | Fund | | | Acquisition | | | (Depreciation) | |
| Sentinel Small Company Fund Class A | | Sentinel Mid Cap Fund Class A | | $ | 546,804,192 | | | $ | 97,558,873 | | | $ | 644,363,065 | | | $ | 9,958,785 | |
| Sentinel Small Company Fund Class C | | Sentinel Mid Cap Fund Class C | | | 97,641,067 | | | | 8,942,615 | | | | 106,583,682 | | | | (5,233,947 | ) |
| Sentinel Small Company Fund Class I | | Sentinel Mid Cap Fund Class I | | | 209,050,954 | | | | 5,382,625 | | | | 214,433,579 | | | | 7,617,354 | |
| Sentinel Small Company Fund Class R6 | | None | | | 2,116,165 | | | | — | | | | 2,116,165 | | | | — | |
| | | | | $ | 855,612,378 | | | $ | 111,884,113 | * | | $ | 967,496,491 | | | $ | 12,342,192 | |
*The net assets of the Sentinel Mid Cap Fund were primarily comprised of investments with a fair value of $112,084,254 just prior to the reorganization.
The financial statements reflect the operations of the Sentinel Small Company Fund for the period prior to the acquisition and the combined fund for the period subsequent to the acquisition. Assuming the acquisition had been completed on December 1, 2015, the beginning of the fiscal annual reporting period of the Sentinel Small Company Fund, Sentinel Small Company Fund’s pro forma results of operations for the year ended November 30, 2016 are estimated as follows.
| Increase (Decrease) in Net Assets from Operations | | | |
| Net investment income (loss) | | $ | (3,621,210 | ) |
| Net realized gain (loss) on sales of investments, futures contracts and foreign currency transactions | | | 95,636,043 | |
| Net change in unrealized appreciation (depreciation) | | | 27,441,323 | |
| Net increase (decrease) in net assets from operations | | $ | 119,456,156 | |
Because the combined investment portfolios have been managed as a single integrated portfolio since the acquisition was completed, it is not practicable to separate the amounts of revenue and earnings of Sentinel Mid Cap Fund that have been included in the Sentinel Small Company Fund’s statement of operations since March 30, 2016.
10. Subsequent Events
Subsequent events occurring after the date of this report have been evaluated for potential impact to this report through the date financial statements were issued.
At a meeting of the Board of Trustees (the “Board”) of the Trust held on May 17, 2018, the Board approved the reorganization (the “Reorganization”) of the Touchstone Small Cap Growth Fund, a series of the Trust, into the Touchstone Small Company Fund, subject to shareholder approval. The Reorganization, if approved, is expected to be completed on or about September 21, 2018.
There were no other subsequent events that necessitated recognition or disclosure in the Funds’ financial statements.
Report of Independent Registered Public Accounting Firm
To the Shareholders of Touchstone Balanced Fund, Touchstone International Equity Fund, Touchstone Large Cap Focused Fund and Touchstone Small Company Fund and the Board of Trustees of Touchstone Strategic Trust
Opinion on the Financial Statements
We have audited the accompanying statements of assets and liabilities of Touchstone Balanced Fund, Touchstone International Equity Fund, Touchstone Large Cap Focused Fund and Touchstone Small Company Fund (collectively referred to as the “Funds”), (four of the funds constituting the Touchstone Strategic Trust (the “Trust”)), including the portfolios of investments, as of June 30, 2018, and the related statements of operations and changes in net assets, and the financial highlights for the seven months ended June 30, 2018 and the year ended November 30, 2017 and the related notes (collectively referred to as the “financial statements”). In our opinion, the financial statements present fairly, in all material respects, the financial position of each of the Funds (four of the funds constituting Touchstone Strategic Trust) at June 30, 2018, and the results of their operations, the changes in their net assets and their financial highlights for the seven months ended June 30, 2018 and the year ended November 30, 2017, in conformity with U.S. generally accepted accounting principles.
The statements of changes in net assets for the year ended November 30, 2016 and the financial highlights for each of the four years in the period ended November 30, 2016 of Touchstone Balanced Fund, Touchstone International Equity Fund, Touchstone Large Cap Focused Fund and Touchstone Small Company Fund were audited by other auditors, whose report dated January 19, 2017 expressed an unqualified opinion on those financial statements and financial highlights.
Basis For Opinion
These financial statements are the responsibility of the Trust’s management. Our responsibility is to express an opinion on each of the Funds’ financial statements based on our audits. We are a public accounting firm registered with the Public Company Accounting Oversight Board (United States) (“PCAOB”) and are required to be independent with respect to the Trust in accordance with the U.S. federal securities laws and the applicable rules and regulations of the Securities and Exchange Commission and the PCAOB.
We conducted our audits in accordance with the standards of the PCAOB. Those standards require that we plan and perform the audit to obtain reasonable assurance about whether the financial statements are free of material misstatement, whether due to error or fraud. The Trust is not required to have, nor were we engaged to perform, an audit of the Trust’s internal control over financial reporting. As part of our audits, we are required to obtain an understanding of internal control over financial reporting but not for the purpose of expressing an opinion on the effectiveness of the Trust’s internal control over financial reporting. Accordingly, we express no such opinion.
Report of Independent Registered Public Accounting Firm (Continued)
Our audits included performing procedures to assess the risks of material misstatement of the financial statements, whether due to error or fraud, and performing procedures that respond to those risks. Such procedures included examining, on a test basis, evidence regarding the amounts and disclosures in the financial statements. Our procedures included confirmation of securities owned as of June 30, 2018, by correspondence with the custodian, transfer agent and brokers or by other appropriate auditing procedures where replies from brokers were not received. Our audits also included evaluating the accounting principles used and significant estimates made by management, as well as evaluating the overall presentation of the financial statements. We believe that our audits provide a reasonable basis for our opinion.

We have served as the auditor of one or more Touchstone Investments’ investment companies since 1999.
Cincinnati, Ohio
August 8, 2018
Other Items (Unaudited)
Qualified Dividend Income
Under the Jobs and Growth Tax Relief Reconciliation Act of 2003 (the “Act”), the following percentages of ordinary dividends paid during the fiscal period ended June 30, 2018 are designated as “qualified dividend income,” as defined in the Act, and are subject to reduced tax rates. The Fund intends to pass through the maximum allowable percentage for Form 1099 Div.
| Balanced Fund | | | 95.99 | % |
| International Equity Fund | | | 100.00 | % |
| Large Cap Focused Fund | | | 73.50 | % |
| Small Company Fund | | | 31.57 | % |
Dividend Received Deduction
For corporate shareholders, the following ordinary distributions paid during the current fiscal period ended June 30, 2018 qualify for the corporate dividends received deduction. The Funds intend to pass through the maximum allowable percentage.
| Balanced Fund | | | 92.40 | % |
| International Equity Fund | | | 1.03 | % |
| Large Cap Focused Fund | | | 71.61 | % |
| Small Company Fund | | | 30.49 | % |
For the fiscal period ended June 30, 2018, the Funds designated long-term capital gains as follows:
| Balanced Fund | | $ | 15,494,463 | |
| International Equity Fund | | $ | 16,188,208 | |
| Large Cap Focused Fund | | $ | 277,847,759 | |
| Small Company Fund | | $ | 85,276,646 | |
Foreign Tax Income and Foreign Tax Credit
The International Equity Fund intends to pass through a foreign tax credit to the shareholders. For the fiscal period ended June 30, 2018, the total amount of foreign source income is $5,324,519 or $0.51 per share. The total amount of foreign taxes to be paid is $859,720 or $0.08 per share. Shareholder’s allocable share of the foreign tax credit will be reported on Form 1099 Div.
Proxy Voting Guidelines and Proxy Voting Records
The Sub-Advisor is responsible for exercising the voting rights associated with the securities purchased and held by the Funds. A description of the policies and procedures that the Sub-Advisor uses in fulfilling this responsibility is available as an appendix to the most recent Statement of Additional Information, which can be obtained without charge by calling toll free 1.800.543.0407 or by visiting the Touchstone website at TouchstoneInvestments.com or on the Securities and Exchange Commission’s (the “Commission”) website sec.gov. Information regarding how those proxies were voted during the most recent twelve-month period ended June 30 is also available without charge by calling toll free 1.800.543.0407 or on the Commission’s website at sec.gov.
Quarterly Portfolio Disclosure
The Trust files a complete listing of portfolio holdings for each Fund as of the end of the first and third quarters of each fiscal year on Form N-Q. The complete listing (i) is available on the Commission’s website; (ii) may be reviewed and copied at the Commission’s Public Reference Room in Washington, DC; or (iii) will be made available to shareholders upon request by calling 1.800.543.0407. Information on the operation of the Public Reference Room may be obtained by calling 1.800.SEC.0330.
Other Items (Unaudited) (Continued)
Schedule of Shareholder Expenses
As a shareholder of the Funds, you incur two types of costs: (1) transaction costs, including reinvested dividends or other distributions; and (2) ongoing costs, including investment advisory fees; distribution (12b-1) fees; and other Fund expenses. This example is intended to help you understand your ongoing costs (in dollars) of investing in the Funds and to compare these costs with the ongoing costs of investing in other mutual funds. The example is based on an investment of $1,000 invested at the beginning of the period and held for the entire period (January 1, 2018 through June 30, 2018).
Actual Expenses
The first line of the table below for each share class of a Fund provides information about actual account values and actual expenses. You may use the information in this line, together with the amount you invested, to estimate the expenses that you paid over the period. Simply divide your account value by $1,000 (for example, an $8,600 account value divided by $1,000 = 8.6), then multiply the result by the number in the first line under the heading entitled “Expenses Paid During the Six Months Ended June 30, 2018” to estimate the expenses you paid on your account during this period.
Hypothetical Example for Comparison Purposes
The second line of the table below for each share class of a Fund provides information about hypothetical account values and hypothetical expenses based on the Funds’ actual expense ratio and an assumed rate of return of 5% per year before expenses, which is not the Funds’ actual return. The hypothetical account values and expenses may not be used to estimate the actual ending account balance or expenses you paid for the period. You may use this information to compare the ongoing costs of investing in the Funds and other funds. To do so, compare this 5% hypothetical example with the 5% hypothetical examples that appear in the shareholder reports of the other funds.
Please note that the expenses shown in the table are meant to highlight your ongoing costs only and do not reflect any transactional costs, such as sales charges (loads), redemption fees, or exchange fees. Therefore, the second line of the table below is useful in comparing ongoing costs only, and will not help you determine the relative total costs of owning different funds. In addition, if these transactional costs were included, your costs would have been higher.
| | | | | | | | | | | | | | Expenses | |
| | | | | Net Expense | | | Beginning | | | Ending | | | Paid During | |
| | | | | Ratio | | | Account | | | Account | | | the Six Months | |
| | | | | Annualized | | | Value | | | Value | | | Ended | |
| | | | | June 30, | | | January 1, | | | June 30, | | | June 30, | |
| | | | | 2018 | | | 2018 | | | 2018 | | | 2018* | |
| Touchstone Balanced Fund | | | | | | | | | | | | | | | | |
| Class A | | Actual | | | 1.01 | % | | $ | 1,000.00 | | | $ | 1,006.90 | | | $ | 5.03 | |
| Class A | | Hypothetical | | | 1.01 | % | | $ | 1,000.00 | | | $ | 1,019.79 | | | $ | 5.06 | |
| | | | | | | | | | | | | | | | | | | |
| Class C | | Actual | | | 1.78 | % | | $ | 1,000.00 | | | $ | 1,002.90 | | | $ | 8.84 | |
| Class C | | Hypothetical | | | 1.78 | % | | $ | 1,000.00 | | | $ | 1,015.97 | | | $ | 8.90 | |
| | | | | | | | | | | | | | | | | | | |
| Class Y | | Actual | | | 0.81 | % | | $ | 1,000.00 | | | $ | 1,008.00 | | | $ | 4.03 | |
| Class Y | | Hypothetical | | | 0.81 | % | | $ | 1,000.00 | | | $ | 1,020.78 | | | $ | 4.06 | |
| | | | | | | | | | | | | | | | | | | |
| Touchstone International Equity Fund | | | | | | | | | | | | | | | | |
| Class A | | Actual | | | 1.21 | % | | $ | 1,000.00 | | | $ | 934.60 | | | $ | 5.80 | |
| Class A | | Hypothetical | | | 1.21 | % | | $ | 1,000.00 | | | $ | 1,018.79 | | | $ | 6.06 | |
| | | | | | | | | | | | | | | | | | | |
| Class C | | Actual | | | 2.13 | % | | $ | 1,000.00 | | | $ | 930.40 | | | $ | 10.19 | |
| Class C | | Hypothetical | | | 2.13 | % | | $ | 1,000.00 | | | $ | 1,014.23 | | | $ | 10.64 | |
| | | | | | | | | | | | | | | | | | | |
| Class Y | | Actual | | | 0.99 | % | | $ | 1,000.00 | | | $ | 935.30 | | | $ | 4.75 | |
| Class Y | | Hypothetical | | | 0.99 | % | | $ | 1,000.00 | | | $ | 1,019.89 | | | $ | 4.96 | |
Other Items (Unaudited) (Continued)
| | | | | | | | | | | | | | Expenses | |
| | | | | Net Expense | | | Beginning | | | Ending | | | Paid During | |
| | | | | Ratio | | | Account | | | Account | | | the Six Months | |
| | | | | Annualized | | | Value | | | Value | | | Ended | |
| | | | | June 30, | | | January 1, | | | June 30, | | | June 30, | |
| | | | | 2018 | | | 2018 | | | 2018 | | | 2018* | |
| Touchstone International Equity Fund (Continued) | | | | | | | | | | | | |
| Institutional Class | | Actual | | | 0.89 | % | | $ | 1,000.00 | | | $ | 935.80 | | | $ | 4.27 | |
| Institutional Class | | Hypothetical | | | 0.89 | % | | $ | 1,000.00 | | | $ | 1,020.38 | | | $ | 4.46 | |
| | | | | | | | | | | | | | | | | | | |
| Touchstone Large Cap Focused Fund | | | | | | | | | | |
| Class A | | Actual | | | 0.95 | % | | $ | 1,000.00 | | | $ | 1,035.20 | | | $ | 4.79 | ** |
| Class A | | Hypothetical | | | 0.95 | % | | $ | 1,000.00 | | | $ | 1,020.08 | | | $ | 4.76 | ** |
| | | | | | | | | | | | | | | | | | | |
| Class C | | Actual | | | 1.76 | % | | $ | 1,000.00 | | | $ | 1,031.00 | | | $ | 8.86 | ** |
| Class C | | Hypothetical | | | 1.76 | % | | $ | 1,000.00 | | | $ | 1,016.07 | | | $ | 8.80 | ** |
| | | | | | | | | | | | | | | | | | | |
| Class Y | | Actual | | | 0.73 | % | | $ | 1,000.00 | | | $ | 1,036.10 | | | $ | 3.69 | ** |
| Class Y | | Hypothetical | | | 0.73 | % | | $ | 1,000.00 | | | $ | 1,021.17 | | | $ | 3.66 | ** |
| | | | | | | | | | | | | | | | | | | |
| Institutional Class | | Actual | | | 0.66 | % | | $ | 1,000.00 | | | $ | 1,036.50 | | | $ | 3.33 | ** |
| Institutional Class | | Hypothetical | | | 0.66 | % | | $ | 1,000.00 | | | $ | 1,021.52 | | | $ | 3.31 | ** |
| | | | | | | | | | | | | | | | | | | |
| Touchstone Small Company Fund | | | | | | | | | | | | |
| Class A | | Actual | | | 1.08 | % | | $ | 1,000.00 | | | $ | 1,059.40 | | | $ | 5.51 | |
| Class A | | Hypothetical | | | 1.08 | % | | $ | 1,000.00 | | | $ | 1,019.44 | | | $ | 5.41 | |
| | | | | | | | | | | | | | | | | | | |
| Class C | | Actual | | | 1.84 | % | | $ | 1,000.00 | | | $ | 1,055.60 | | | $ | 9.38 | |
| Class C | | Hypothetical | | | 1.84 | % | | $ | 1,000.00 | | | $ | 1,015.67 | | | $ | 9.20 | |
| | | | | | | | | | | | | | | | | | | |
| Class Y | | Actual | | | 0.85 | % | | $ | 1,000.00 | | | $ | 1,063.40 | | | $ | 4.35 | |
| Class Y | | Hypothetical | | | 0.85 | % | | $ | 1,000.00 | | | $ | 1,020.58 | | | $ | 4.26 | |
| | | | | | | | | | | | | | | | | | | |
| Institutional Class | | Actual | | | 0.79 | % | | $ | 1,000.00 | | | $ | 1,063.40 | | | $ | 4.04 | |
| Institutional Class | | Hypothetical | | | 0.79 | % | | $ | 1,000.00 | | | $ | 1,020.88 | | | $ | 3.96 | |
| | | | | | | | | | | | | | | | | | | |
| Class R6 | | Actual | | | 0.73 | % | | $ | 1,000.00 | | | $ | 1,062.00 | | | $ | 3.73 | |
| Class R6 | | Hypothetical | | | 0.73 | % | | $ | 1,000.00 | | | $ | 1,021.17 | | | $ | 3.66 | |
| * | Expenses are equal to the Fund's annualized expense ratio, multiplied by the average account value over the period, multiplied by 181/365 (to reflect the one-half year period). |
| ** | Excluding liquidity provider expenses, your actual cost of investment in Class A, Class C, Class Y and Institutional Class would be $4.74, $8.81, $3.63 and $3.28, respectively, and your hypothetical cost of investment in Class A, Class C, Class Y and Institutional Class would be $4.71, $8.75, $3.61, and $3.26, respectively. |
Management of the Trust (Unaudited)
Listed below is required information regarding the Trustees and principal officers of the Trust. The Trust’s Statement of Additional Information includes additional information about the Trustees and is available, without charge, upon request by calling 1.800.543.0407 or by visiting the Touchstone website at TouchstoneInvestments.com.
| Interested Trustees1: | | | | | | |
| | | | | | | | | Number | | |
| | | | | | | | | of Funds | | |
| | | | | | | | | Overseen | | |
| | | | | Term of | | | | in the | | |
| Name | | Position | | Office And | | | | Touchstone | | Other |
| Address | | Held with | | Length of | | Principal Occupation(s) | | Fund | | Directorships |
| Year of Birth | | Trust | | Time Served | | During Past 5 Years | | Complex2 | | Held During the Past 5 Years3 |
Jill T. McGruder
Touchstone Advisors, Inc.
303 Broadway
Suite 1100
Cincinnati, Ohio 45202
Year of Birth: 1955 | | Trustee and President | | Until retirement at age 75 or until she resigns or is removed Trustee since 1999 | | President and CEO of IFS Financial Services, Inc. (a holding company). | | 49 | | IFS Financial Services, Inc. (a holding company) from 1999 to the present; Integrity and National Integrity Life Insurance Co. from 2005 to the present; Touchstone Securities (the Trust’s distributor) from 1999 to the present; Touchstone Advisors, Inc. (the Trust’s investment advisor and administrator) from 1999 to the present; W&S Brokerage Services (a brokerage company) from 1999 to the present; W&S Financial Group Distributors (a distribution company) from 1999 to the present; Cincinnati Analysts, Inc. from 2012 to the present; Columbus Life Insurance Co. from 2016 to the present; The Lafayette Life Insurance Co. from 2016 to the present; Taft Museum of Art from 2007 to the present; YWCA of Greater Cincinnati from 2012 to the present; and LL Global, Inc. from 2016 to the present. |
| Independent Trustees: | | | | | | | | | | |
Phillip R. Cox
c/o Touchstone Advisors, Inc.
303 Broadway
Suite 1100
Cincinnati, Ohio 45202
Year of Birth: 1947 | | Trustee | | Until retirement at age 75 or until he resigns or is removed Trustee since 1999 | | President and Chief Executive Officer of Cox Financial Corp. (a financial services company) from 1971 to the present. | | 49 | | Director of Cincinnati Bell (a communications company) from 1994 to the present; Bethesda Inc. (a hospital) from 2005 to the present; Timken Co. (a manufacturing company) from 2004 to 2014; TimkenSteel from 2014 to the present; Diebold, Inc. (a technology solutions company) from 2004 to the present; and Ohio Business Alliance for Higher Education and the Economy from 2005 to the present. |
William C. Gale
c/o Touchstone Advisors, Inc.
303 Broadway
Suite 1100
Cincinnati, Ohio 45202
Year of Birth: 1952 | | Trustee | | Until retirement at age 75 or until he resigns or is removed Trustee since 2013 | | Retired; formerly Senior Vice President and Chief Financial Officer (from 2003 to January 2015) of Cintas Corporation (a business services company). | | 49 | | None. |
Management of the Trust (Unaudited) (Continued)
| Independent Trustees (Continued): | | | | | | |
| | | | | | | | | Number | | |
| | | | | | | | | of Funds | | |
| | | | | | | | | Overseen | | |
| | | | | Term of | | | | in the | | |
| Name | | Position(s) | | Office And | | | | Touchstone | | Other |
| Address | | Held with | | Length of | | Principal Occupation(s) | | Fund | | Directorships |
| Year of Birth | | Trust | | Time Served | | During Past 5 Years | | Complex2 | | Held During the Past 5 Years3 |
Susan J. Hickenlooper
c/o Touchstone Advisors, Inc.
303 Broadway
Suite 1100
Cincinnati, Ohio 45202
Year of Birth: 1946 | | Trustee | | Until retirement at age 75 or until she resigns or is removed Trustee since 2009 | | Retired; formerly Financial Analyst for Impact 100 (charitable organization) from November 2012 to 2013. | | 49 | | Trustee of Diocese of Southern Ohio from 2014 to the present; and Trustee of Cincinnati Parks Foundation from 2000 to 2016. |
Kevin A. Robie
c/o Touchstone Advisors, Inc.
303 Broadway
Suite 1100
Cincinnati, Ohio 45202
Year of Birth: 1956 | | Trustee | | Until retirement at age 75 or until he resigns or is removed Trustee since 2013 | | Vice President of Portfolio Management at Soin International LLC (a multinational holding company) from 2004 to the present. | | 49 | | SaverSystems, Inc. from 2015 to the present; Director of Buckeye EcoCare, Inc. (a lawn care company) from 2013 to the present; Trustee of Dayton Region New Market Fund, LLC (a private fund) from 2010 to the present; and Trustee of the Entrepreneurs Center, Inc. (a small business incubator) from 2006 to the present. |
Edward J. VonderBrink
c/o Touchstone Advisors, Inc.
303 Broadway
Suite 1100
Cincinnati, Ohio 45202
Year of Birth: 1944 | | Trustee | | Until retirement at age 75 or until he resigns or is removed Trustee since 2013 | | Consultant, VonderBrink Consulting LLC from 2000 to the present. | | 49 | | Director of Streamline Health Solutions, Inc. (healthcare IT) from 2006 to 2015; Mercy Health from 2013 to the present; Mercy Health Foundation (healthcare nonprofit) from 2008 to the present; Al Neyer Inc. (a construction company) from 2013 to the present; and BASCO Shower Door from 2011 to the present. |
| 1 | Ms. McGruder, as a director of the Advisor and the Trust's Distributor, and an officer of affiliates of the Advisor and the Distributor, is an “interested person” of the Trust within the meaning of Section 2(a) (19) of the 1940 Act. |
| 2 | As of June 30, 2018, the Touchstone Fund Complex consisted of 25 series of the Trust, 13 series of Touchstone Funds Group Trust, 1 series of Touchstone Institutional Funds Trust, and 10 variable annuity series of Touchstone Variable Series Trust. |
| 3 | Each Trustee is also a Trustee of Touchstone Funds Group Trust, Touchstone Institutional Funds Trust, and Touchstone Variable Series Trust. |
Management of the Trust (Unaudited) (Continued)
| Principal Officers: | | | | | | |
| | | | | Term of | | |
| Name | | Position | | Office and | | |
| Address | | Held with | | Length of | | Principal Occupation(s) |
| Year of Birth | | Trust1 | | Time Served | | During the Past 5 Years |
Jill T. McGruder
Touchstone Advisors, Inc.
303 Broadway
Suite 1100
Cincinnati, Ohio 45202
Year of Birth: 1955 | | President and Trustee | | Until resignation, removal or disqualification President since 2006 | | See biography above. |
Steven M. Graziano
Touchstone Advisors, Inc.
303 Broadway
Suite 1100
Cincinnati, Ohio 45202
Year of Birth: 1954 | | Vice President | | Until resignation, removal or disqualification Vice President since 2009 | | President of Touchstone Advisors, Inc. |
Timothy D. Paulin
Touchstone Advisors, Inc.
303 Broadway
Suite 1100
Cincinnati, Ohio 45202
Year of Birth: 1963 | | Vice President | | Until resignation, removal or disqualification Vice President since 2010 | | Senior Vice President of Investment Research and Product Management of Touchstone Advisors, Inc. |
Timothy S. Stearns
Touchstone Advisors, Inc.
303 Broadway
Suite 1100
Cincinnati, Ohio 45202
Year of Birth: 1963 | | Chief Compliance Officer | | Until resignation, removal or disqualification Chief Compliance Officer since 2013 | | Chief Compliance Officer of Touchstone Advisors, Inc.; Chief Compliance Officer of Envestnet Asset Management, Inc. (2009 to 2013). |
Terrie A. Wiedenheft
Touchstone Advisors, Inc.
303 Broadway
Suite 1100
Cincinnati, Ohio 45202
Year of Birth: 1962 | | Controller and Treasurer | | Until resignation, removal or disqualification Controller and Treasurer since 2006 | | Senior Vice President, Chief Financial Officer and Chief Operations Officer, of IFS Financial Services, Inc. (a holding company). |
Ellen Blanchard
The Bank of New York
Mellon
201 Washington St, 13th
Floor
Boston, Massachusetts 02108
Year of Birth: 1973 | | Secretary | | Until resignation, removal or disqualification Secretary since 2015 | | Director of The Bank of New York Mellon |
| 1 | Each officer also holds the same office with Touchstone Funds Group Trust, Touchstone Institutional Funds Trust, and Touchstone Variable Series Trust. |
This page intentionally left blank.
PRIVACY PROTECTION POLICY
We Respect Your Privacy
Thank you for your decision to invest with us. Touchstone and its affiliates have always placed a high value on the trust and confidence our clients place in us. We believe that confidence must be earned and validated through time. In today’s world, when technology allows the sharing of information at light speeds, trust must be reinforced by our sincere pledge to take the steps necessary to ensure that the information you share with us is treated with respect and confidentiality.
Our Pledge to Our Clients
| • | We collect only the information we need to service your account and administer our business. |
| • | We are committed to keeping your information confidential and we place strict limits and controls on the use and sharing of your information. |
| • | We make every effort to ensure the accuracy of your information. |
We Collect the Following Nonpublic Personal Information About You:
| • | Information we receive from you on or in applications or other forms, correspondence, or conversations, including, but not limited to, your name, address, phone number, social security number, assets, income and date of birth; and |
| • | Information about your transactions with us, our affiliates, or others, including, but not limited to, your account number and balance, payment history, parties to transactions, cost basis information, and other financial information. |
Categories of Information We Disclose and Parties to Whom We Disclose
We do not disclose any nonpublic personal information about our current or former clients to nonaffiliated third parties, except as required or permitted by law.
We Place Strict Limits and Controls on the Use and Sharing of Your Information
| • | We restrict access to nonpublic personal information about you to authorized employees who need the information to administer your business. |
| • | We maintain physical, electronic and procedural safeguards that comply with federal standards to protect this information. |
| • | We do not disclose any nonpublic personal information about our current or former clients to anyone, except as required or permitted by law or as described in this document. |
| • | We will not sell your personal information to anyone. |
We May Provide Information to Service Your Account
Sometimes it is necessary to provide information about you to various companies such as transfer agents, custodians, broker-dealers and marketing service firms to facilitate the servicing of your account. These organizations have a legitimate business need to see some of your personal information in order for us to provide service to you. We may disclose to these various companies the information that we collect as described above. We require that these companies, including our own subsidiaries and affiliates, strictly maintain the confidentiality of this information and abide by all applicable laws. Companies within our corporate family that may receive this information are financial service providers and insurance companies. We do not permit these associated companies to sell the information for their own purposes, and we never sell our customer information.
This policy is applicable to the following affiliated companies: Touchstone Funds Group Trust, Touchstone Strategic Trust, Touchstone Variable Series Trust, Touchstone Institutional Funds Trust, Touchstone Securities, Inc.,* and W&S Brokerage Services, Inc.
* Touchstone Securities, Inc. serves as the underwriter to the Touchstone Funds.
A Member of Western & Southern Financial Group®
The Privacy Protection Policy is not part of the Annual Report.


Go paperless, sign up today at:
www.touchstoneinvestments.com
Touchstone Investments
Distributor
Touchstone Securities, Inc.*
303 Broadway
Cincinnati, Ohio 45202-4203
800.638.8194
www.touchstoneinvestments.com
Investment Advisor
Touchstone Advisors, Inc.*
303 Broadway
Cincinnati, Ohio 45202-4203
Transfer Agent
BNY Mellon Investment Servicing (US) Inc.
4400 Computer Drive
Westborough, Massachusetts 01581
Shareholder Service
800.543.0407
* A Member of Western & Southern Financial Group
TSF-54BB-TST-SENT-AR-1806
Item 2. Code of Ethics.
| (a) | The registrant, as of the end of the period covered by this report, has adopted a code of ethics that applies to the registrant’s principal executive officer, principal financial officer, principal accounting officer or controller, or persons performing similar functions, regardless of whether these individuals are employed by the registrant or a third party. |
| (c) | There have been no amendments, during the period covered by this report, to a provision of the code of ethics that applies to the registrant’s principal executive officer, principal financial officer, principal accounting officer or controller, or persons performing similar functions, regardless of whether these individuals are employed by the registrant or a third party, and that relates to any element of the code of ethics description. |
| (d) | The registrant has not granted any waivers, including an implicit waiver, from a provision of the code of ethics that applies to the registrant’s principal executive officer, principal financial officer, principal accounting officer or controller, or persons performing similar functions, regardless of whether these individuals are employed by the registrant or a third party, that relates to one or more of the items set forth in paragraph (b) of this item’s instructions. |
Item 3. Audit Committee Financial Expert.
The registrant’s Board of Trustees has determined that the registrant has at least one audit committee financial expert serving on its audit committee. Mr. William Gale is the registrant’s audit committee financial expert and is an independent trustee within the meaning of the Investment Company Act of 1940, as amended (the “1940 Act”).
Item 4. Principal Accountant Fees and Services.
Audit Fees
| (a) | Audit fees for Touchstone Strategic Trust (June/Nov Funds) totaled $71,350 and $66,200 for the seven-month period ended June 30, 2018 and the fiscal year ended November 30, 2017, respectively, including fees associated with the annual audits and filings of Form N-1A and Form NSAR. |
Audit-Related Fees
| (b) | The fees billed for assurance and related services by the principal accountant that are reasonably related to the performance of the audit of the registrant's financial statements and are not reported under paragraph (a) of this Item are $10,500 and $7,092 for the seven-month period ended June 30, 2018 and the fiscal year ended November 30, 2017, respectively. The fees for 2018 relate to additional audit procedures and review of predecessor auditor work papers. The fees for 2017 relate to consent filings for N-14s. |
Tax Fees
| (c) | The fees for tax compliance services totaled $23,818 and $20,780 for the seven-month period ended June 30, 2018 and the fiscal year ended November 30, 2017, respectively. The fees relate to the preparation of federal income, excise tax returns and review of capital gains distribution calculations and tax agent services. |
All Other Fees
| (d) | The aggregate fees billed for products and services provided by the principal accountant, other than the services reported in paragraphs (a) through (c) of this Item are $5,000 and $0 for the seven-month period ended June 30, 2018 and the fiscal year ended November 30, 2017, respectively. The fees relate to the PFIC Analyzer and Global Withholding Tax Reporter subscriptions. |
| (e)(1) | Disclose the audit committee's pre-approval policies and procedures described in paragraph (c)(7) of Rule 2-01 of Regulation S-X. |
The Audit Committee’s pre-approval policies describe the types of audit, audit-related, tax and other services that have the general pre-approval of the Audit Committee. The pre-approval policies provide that annual audit service fees, tax services not specifically granted pre-approval, services exceeding pre-approved cost levels and other services that have not received general pre-approval will be subject to specific pre-approval by the Audit Committee. The pre-approval policies further provide that the Committee may grant general pre-approval to other audit services (statutory audits and services associated with SEC registration statements, periodic reports and other documents filed with the SEC or other documents issued in connection with securities offerings), audit-related services (accounting consultations related to accounting, financial reporting or disclosure matters not classified as “audit services,” assistance with understanding and implementing new accounting and financial reporting guidance from rulemaking authorities, agreed-upon or expanded audit procedures related to accounting and/or billing records required to respond to or comply with financial, accounting or regulatory reporting matters and assistance with internal control reporting requirements under Form N-CSR), tax services that have historically been provided by the auditor that the Committee believes would not impair the independence of the auditor and are consistent with the SEC’s rules on auditor independence and permissible non-audit services classified as “all other services” that are routine and recurring services.
All services described in paragraphs (c) through (d) of Item 4 were approved by the Audit Committee.
| (f) | The percentage of hours expended on the principal accountant's engagement to audit the registrant's financial statements for the most recent fiscal year that were attributed to work performed by persons other than the principal accountant's full-time, permanent employees was less than fifty percent. |
| (g) | The aggregate non-audit fees for Touchstone Strategic Trust (June/Nov Funds) and certain entities*, totaled approximately $39,318 and $27,872 for the seven-month period ended June 30, 2018 and the fiscal year ended November 30, 2017, respectively. |
* These include the advisors (excluding sub-advisors) and any entity controlling, controlled by or under common control with the advisors that provides ongoing services to the registrant (Funds).
| (h) | The registrant's audit committee of the board of directors has considered whether the provision of non-audit services that were rendered to the registrant's investment adviser (not including any sub-adviser whose role is primarily portfolio management and is subcontracted with or overseen by another investment adviser), and any entity controlling, controlled by, or under common control with the investment adviser that provides ongoing services to the registrant that were not pre-approved pursuant to paragraph (c)(7)(ii) of Rule 2-01 of Regulation S-X is compatible with maintaining the principal accountant's independence. |
Item 5. Audit Committee of Listed Registrants.
Not applicable.
Item 6. Investments.
| (a) | Schedule of Investments in securities of unaffiliated issuers as of the close of the reporting period is included as part of the report to shareholders filed under Item 1 of this form. |
Item 7. Disclosure of Proxy Voting Policies and Procedures for Closed-End Management Investment Companies.
Not applicable.
Item 8. Portfolio Managers of Closed-End Management Investment Companies.
Not applicable.
Item 9. Purchases of Equity Securities by Closed-End Management Investment Company and Affiliated Purchasers.
Not applicable.
Item 10. Submission of Matters to a Vote of Security Holders.
There have been no material changes to the procedures by which the shareholders may recommend nominees to the registrant’s board of trustees, where those changes were implemented after the registrant last provided disclosure in response to the requirements of Item 407(c)(2)(iv) of Regulation S-K (17 CFR 229.407) (as required by Item 22(b)(15) of Schedule 14A (17 CFR 240.14a-101)), or this Item.
Item 11. Controls and Procedures.
| (a) | The registrant’s principal executive and principal financial officers, or persons performing similar functions, have concluded that the registrant’s disclosure controls and procedures (as defined in Rule 30a-3(c) under the Investment Company Act of 1940, as amended (the “1940 Act”) (17 CFR 270.30a-3(c))) are effective, as of a date within 90 days of the filing date of the report that includes the disclosure required by this paragraph, based on their evaluation of these controls and procedures required by Rule 30a-3(b) under the 1940 Act (17 CFR 270.30a-3(b)) and Rules 13a-15(b) or 15d-15(b) under the Securities Exchange Act of 1934, as amended (17 CFR 240.13a-15(b) or 240.15d-15(b)). |
| (b) | There were no changes in the registrant’s internal control over financial reporting (as defined in Rule 30a-3(d) under the 1940 Act (17 CFR 270.30a-3(d))) that occurred during the registrant’s four-month period from March 1, 2018 to June 30, 2018 that has materially affected, or is reasonably likely to materially affect, the registrant’s internal control over financial reporting. |
Item 12. Disclosure of Securities Lending Activities for Closed-End Management Investment Companies.
Not applicable.
Item 13. Exhibits.
| (a)(1) | Code of ethics, or any amendment thereto, that is the subject of disclosure required by Item 2 is attached hereto. |
| | |
| (a)(2) | Certifications pursuant to Rule 30a-2(a) under the 1940 Act and Section 302 of the Sarbanes-Oxley Act of 2002 are attached hereto. |
| | |
| (a)(3) | Not applicable. |
| | |
| (a)(4) | Not applicable. |
| | |
| (b) | Certifications pursuant to Rule 30a-2(b) under the 1940 Act and Section 906 of the Sarbanes- Oxley Act of 2002 are attached hereto. |
SIGNATURES
Pursuant to the requirements of the Securities Exchange Act of 1934 and the Investment Company Act of 1940, the registrant has duly caused this report to be signed on its behalf by the undersigned, thereunto duly authorized.
(Registrant) Touchstone Strategic Trust
By (Signature and Title)* /s/ Jill T. McGruder
Jill T. McGruder, President
(principal executive officer)
Date August 13, 2018
Pursuant to the requirements of the Securities Exchange Act of 1934 and the Investment Company Act of 1940, this report has been signed below by the following persons on behalf of the registrant and in the capacities and on the dates indicated.
By (Signature and Title)* /s/ Jill T. McGruder
Jill T. McGruder, President
(principal executive officer)
Date August 13, 2018
By (Signature and Title)* /s/ Terrie A. Wiedenheft
Terrie A. Wiedenheft, Controller and Treasurer
(principal financial officer)
Date August 13, 2018
* Print the name and title of each signing officer under his or her signature.