UNITED STATES
SECURITIES AND EXCHANGE COMMISSION
Washington, D.C. 20549
FORM N-CSR
CERTIFIED SHAREHOLDER REPORT OF REGISTERED MANAGEMENT INVESTMENT COMPANIES
Investment Company Act file number 811-03651
Touchstone Strategic Trust
(Exact name of registrant as specified in charter)
303 Broadway, Suite 1100
Cincinnati, Ohio 45202-4203
(Address of principal executive offices) (Zip code)
Jill T. McGruder
303 Broadway, Suite 1100
Cincinnati, Ohio 45202-4203
(Name and address of agent for service)
Registrant's telephone number, including area code: 800-638-8194
Date of fiscal year end: March 31
Date of reporting period: March 31, 2018
Form N-CSR is to be used by management investment companies to file reports with the Commission not later than 10 days after the transmission to stockholders of any report that is required to be transmitted to stockholders under Rule 30e-1 under the Investment Company Act of 1940 (17 CFR 270.30e-1). The Commission may use the information provided on Form N-CSR in its regulatory, disclosure review, inspection, and policymaking roles.
A registrant is required to disclose the information specified by Form N-CSR, and the Commission will make this information public. A registrant is not required to respond to the collection of information contained in Form N-CSR unless the Form displays a currently valid Office of Management and Budget ("OMB") control number. Please direct comments concerning the accuracy of the information collection burden estimate and any suggestions for reducing the burden to Secretary, Securities and Exchange Commission, 450 Fifth Street, NW, Washington, DC 20549-0609. The OMB has reviewed this collection of information under the clearance requirements of 44 U.S.C. § 3507.
Item 1. Reports to Stockholders.
The Report to Shareholders is attached herewith.
March 31, 2018
Annual Report
Touchstone Strategic Trust
Touchstone Flexible Income Fund
Touchstone Focused Fund
Touchstone Growth Opportunities Fund
Touchstone International Growth Fund
Touchstone International Value Fund
Touchstone Mid Cap Growth Fund
Touchstone Sands Capital Emerging Markets Growth Fund
Touchstone Small Cap Growth Fund
Touchstone Sustainability and Impact Equity Fund

Table of Contents
This report identifies the Funds' investments on March 31, 2018. These holdings are subject to change. Not all investments in each Fund performed the same, nor is there any guarantee that these investments will perform as well in the future. Market forecasts provided in this report may not occur.
Letter from the President
Dear Shareholder:
We are pleased to provide this Annual Report for the Touchstone Strategic Trust. Inside you will find key financial information, as well as fund manager commentaries, for the 12 months ended March 31, 2018.
The worldwide economic recovery gained momentum during 2017 as economies participated in what could be characterized as a “synchronized global expansion.” The United States, Japan, the European Union and China all reported solid economic growth. Despite the solid economic fundamentals through much of the last 12 months, early 2018 saw an increase in market volatility as tariffs and trade tensions raised the specter of an escalating global trade war. Monetary policies across the major central banks remained divergent throughout the period as the Bank of Japan and the European Central Bank maintained accommodative stances, while the U.S. Federal Reserve Board (Fed) continued moving toward its goal of monetary policy normalization by raising rates three times in the fiscal year. Additionally, the Fed announced and began executing on plans to reduce the size of its balance sheet by selling securities it had acquired during its quantitative easing programs; this is expected to take place over a number of years.
Global equities posted strong returns with most broad indices generating double-digit returns. Non-U.S. markets led the way, with emerging market equities producing particularly strong performance. Within the U.S. equity markets, growth-oriented stocks outpaced their value-oriented counterparts, while large capitalization stocks outperformed small- and mid-capitalization stocks.
The Fed’s three rate hikes during the year pushed short-term rates higher and, after spending most of the year range bound, longer-term rates rose late in the fiscal year. While rising rates limited gains, investment grade bonds were still able to produce positive returns for the year. Amid stronger economic growth and a low default environment, non-investment grade bonds enjoyed tightening credit spreads and led the fixed income market.
After nearly a decade of strong gains, many investors may be wondering whether the volatility of early 2018 marks a turning point for the capital markets. We would offer the same counsel as always: maintain a long-term approach. Rather than reacting to last month’s returns, work with your financial advisor to establish an investment plan that will help you achieve your long-term financial objectives.
We greatly appreciate your continued support. Thank you for including Touchstone as part of your investment plan.
| Sincerely, | |
| | |

| |
| Jill T. McGruder | |
| President | |
| Touchstone Strategic Trust | |
Management's Discussion of Fund Performance (Unaudited)
Touchstone Flexible Income Fund
Sub-Advised by ClearArc Capital, Inc.
Investment Philosophy
The Touchstone Flexible Income Fund seeks a high level of income consistent with reasonable risk and seeks capital appreciation as a secondary goal. The Fund primarily invests in income-producing securities such as debt securities, common stocks and preferred stocks. The Fund’s sub-advisor seeks to provide value by investing in asset classes that appear to be attractive based on their risks and in companies with attractive price-to-cash flow ratios. The Fund seeks returns by investing across a broader array of investments than traditional investment-grade fixed-income funds, and ClearArc believes that a low correlation between various asset classes leads to stability of expected returns.
Fund Performance
The Touchstone Flexible Income Fund (Class A Shares) outperformed its benchmark, the Bloomberg Barclays U.S. Aggregate Bond Index, for the 12-month period ended March 31, 2018. The Fund’s total return was 3.46 percent (calculated excluding the maximum sales charge), while the total return of the benchmark was 1.20 percent.
Market Environment
Volatility was low for much of the 12-month period that ended on March 31, 2018, which saw a transition to a new U.S. Federal Reserve Board (Fed) Chairman, and continued slow interest rate hikes. This favorable environment for risky assets continued a trend we have seen for some time; however, market conditions changed near the end of the period. The first calendar quarter of 2018 saw an inflection in which equity volatility picked up. The Chicago Board Options Exchange Volatility Index (VIX), which measures expected volatility in the S&P 500® Index, spiked. This was driven by higher interest rates, rising inflation expectations and climbing economic growth expectations due to recently passed tax legislation in the U.S.
Over the 12 months, the U.S. dollar depreciated, confounding investors who were convinced that rising interest rates would cause the opposite. The U.S. dollar’s status as the global reserve currency appears to be starting to slowly erode due to the emergence of China and diminishing American influence in certain areas of the world. The weak U.S. dollar has generally kept financial conditions easy. However, as interest rates climbed in the first quarter of 2018 there was a sense that financial conditions may finally be getting tighter. For example, the three-month London Interbank Offer Rate (LIBOR) rose, as short-term borrowers demanded more return for the risks they were taking.
Over the full period, the yield curve in the U.S. flattened, with 2-year yields rising and 30-year yields falling. Inflation expectations moved down at the start of the year, but then started a climb that continued until the end of the period. The breakeven inflation rate, which is the yield difference between Treasury Inflation Protected Securities (TIPS) and a nominal fixed-rate Treasury of similar maturity, indicated the market expects higher future inflation.
Equity markets delivered the best return for the period, with the S&P 500® Index up despite the pick-up in interest rate volatility toward the end of the period. Bonds generated positive low returns but corporate credit performed well among major bond sectors despite rising interest rates. Preferreds had a strong year relative to credit, driven by shorter duration securities and European issuers, although these too lost momentum in the last quarter. Emerging markets generally saw strong returns too, but again, momentum faded as we moved into 2018. In contrast, the Real Estate Investment Trusts (REIT) market had a difficult year after a long run of outperformance. REITs experienced mid-single-digit negative total returns as investors fretted about interest
Management's Discussion of Fund Performance (Unaudited) (Continued)
rate pressures, REITs being net losers in the recent tax cuts, and accelerating REIT supply. Rounding out the major asset classes, commodities, including gold and oil, had a strong year.
Portfolio Review
The Fund’s shorter duration relative to the benchmark helped performance as interest rates rose. For much of the year, the market embraced risk as equities delivered strong performance. In addition, the credit environment was a positive during the period, especially for preferreds. On a relative basis, the preferred allocation represented the largest contributor to the Fund’s relative returns.
Turning to performance within asset classes, the bond portion of the Fund outperformed the benchmark. Top contributors included Commercial Mortgage-Backed Securities (CMBS) and residential Mortgage-Backed Securities (MBS). CMBS and MBS holdings both benefited from favorable security selection. Detracting from performance within the bond allocation was weak security selection within corporate bonds.
Preferred equities provided the biggest boost to the Fund’s relative returns, primarily due to strong security selection. Top contributors within the allocation were floating rate securities, shorter duration hybrids and European holdings. We started adding floating rate and shorter duration hybrid preferreds during the second half of 2016 and continued into 2017. Towards the end of the 12-month period, U.S. hybrid preferreds became rich after a rally, leading us to take profits and reduce the Fund’s exposure. Top performers among floating rate preferreds included Catlin Insurance Co., Ltd., NextEra Energy, Inc., and Reinsurance Group of America, Inc. Large contributors among the Fund’s European preferreds included Credit Agricole SA, Societe Generale SA, and BNP Paribas SA.
Security selection within the Fund’s common equity allocation contributed to relative outperformance. Top equity performers included The Boeing Co. (Industrials sector), AbbVie Inc. (Health Care sector), The Estée Lauder Companies Inc. (Consumer Staples sector), Illinois Tool Works Inc. (Industrials sector), Valero Energy Corp. (Energy sector), Visa Inc. (Financials sector), and Raytheon Co. (Industrials sector). The Fund’s exchange traded fund (ETF) exposure saw Japanese and European equity ETFs deliver strong returns while a Chinese equity ETF and gold miner ETF represented the largest detractors. The Fund’s REIT holdings Crown Castle International Corp. and Prologis, Inc. contributed to Fund performance. We sold underperforming REITs such as Kimco Realty Corp., Boston Properties, Inc. and Ventas, Inc.
The Fund’s derivatives, namely the VIX volatility hedges had an overall drag on performance during the period. This was due to an expectation that volatility would increase when in fact, the market experienced an extraordinarily low level of volatility for most of the year. However, as volatility spiked up during the first calendar quarter of 2018, this hedge had a positive impact on returns.
Outlook
It appears the investment environment is becoming binary and extreme. After a robust return environment over the last few years, the recent increase in volatility should force risk managers to adjust to a more conservative stance. Moreover, now that U.S. tax cuts have been priced in it is not clear if there will be another catalyst to drive markets higher. Global debt levels remain elevated. This high leverage may exacerbate any moves in inflation, up or down. In addition, there is little tolerance for tighter money or higher interest rates. We are monitoring U.S. dollar movements and Fed actions to assess the tightness of financial conditions. The tone from Washington D.C. remains protectionist on global trade and the new Fed chairman appears determined to normalize interest rates by raising them to match inflation.
Our base case scenario continues to call for a reflationary environment, though we are not expecting significant inflation in 2018. There is no change in our belief that inflation risks persist, or that in the remainder of this year, these risks are rising. Over the near- to medium-term, we continue to view inflation as likely to surprise
Management's Discussion of Fund Performance (Unaudited) (Continued)
to the upside. Global labor markets continue to tighten, the U.S. dollar remains weak and an uptrend in oil and other commodity prices prevail. Tax stimulus in the U.S. also contributes to a more inflationary environment, which could make economic growth less sustainable. Finally, implementation of Chinese reforms may actually stifle growth but, for the moment, it appears any slowdown will be mild. We are keeping a close eye on China, which is now the world’s second largest economy.
The Fund continues to be defensively positioned, as we believe the market environment will be more volatile going forward driven by its less than certain view on central bank policy, as well as the prospect of an end to the strong move higher in global economic growth. Therefore, we think remaining focused on high-quality securities and patiently waiting for opportunity is paramount.
Dividend-paying investments may not experience the same price appreciation as non-dividend paying instruments, dividend-issuing companies may choose not to pay a dividend, or the dividend may be less than what is anticipated.
Management's Discussion of Fund Performance (Unaudited) (Continued)
Comparison of the Change in Value of a $10,000 Investment in the
Touchstone Flexible Income Fund - Class A* and the Bloomberg Barclays U.S. Aggregate Bond Index

| * | The chart above represents performance of Class A shares only, which will vary from the performance of Class C shares, Class Y shares and Institutional Class shares based on the differences in sales loads and fees paid by shareholders in the different classes. The inception date of Class A shares, Class C shares, Class Y shares and Institutional Class shares was April 1, 2004, October 29, 2001, September 1, 1998 and September 10, 2012, respectively. Class A shares, Class C shares and Class Y shares performance information was calculated using the historical performance of the Fifth Third/Maxus Income Fund Investor shares, with an inception date of March 10, 1985, for periods prior to April 1, 2004, October 29, 2001 and September 1, 1998, respectively. Institutional Class shares performance information was calculated using the historical performance of Class Y shares for the periods prior to September 10, 2012. The returns have been restated for sales loads and fees applicable to Class A, Class C, Class Y and Institutional Class shares. The returns of the index listed above are based on the inception date of the Fund. |
| ** | The average annual total returns shown above are adjusted for maximum sales loads and fees, if applicable. The maximum offering price per share of Class A shares is equal to the net asset value (“NAV”) per share plus a sales load equal to 6.10% of the NAV (or 5.75% of the offering price). Class C shares are subject to a contingent deferred sales charge (“CDSC”) of 1.00%. The CDSC will be assessed on an amount equal to the lesser of (1) the NAV at the time of purchase of the shares being redeemed or (2) the NAV of such shares being redeemed, if redeemed within a one-year period from the date of purchase. Class Y shares and Institutional Class shares are not subject to sales charges. |
The performance of the above Fund does not reflect the deduction of taxes that a shareholder would pay on Fund distributions or the redemption of Fund shares.
Note to Chart
Bloomberg Barclays U.S. Aggregate Bond Index is an unmanaged index comprised of U.S. investment grade, fixed rate bond market securities, including government, government agency, corporate and mortgage-backed securities between one and ten years.
Management's Discussion of Fund Performance (Unaudited)
Touchstone Focused Fund
Sub-Advised by Fort Washington Investment Advisors, Inc.
Investment Philosophy
The Fund may invest in companies of any market capitalization. The Fund seeks to invest in companies that are trading below what is believed to be the estimate of their intrinsic value and have a sustainable competitive advantage or a high barrier to entry in place. The barrier(s) to entry can be created through a cost advantage, economies of scale, high customer loyalty or a government barrier (e.g. license or subsidy). Fort Washington believes that the strongest barrier to entry is the combination of economies of scale and high customer loyalty.
Fund Performance
The Touchstone Focused Fund (Class A Shares) underperformed its primary benchmark, the Russell 3000® Index (the “Index” or “benchmark”), and its secondary benchmark, the S&P 500® Index, for the 12-month period ended March 31, 2018. The Fund’s total return was 10.13 percent (calculated excluding the maximum sales charge), while the total return of the Russell 3000® Index was 13.81 percent and the total return of the S&P 500® Index was 13.99 percent.
Market Environment
In the last three quarters of 2017, U.S. equities continued the bull market that began in 2009 as the market experienced low volatility and ended the year near all-time highs. Solid financial conditions and strong profit growth were the key drivers. Markets benefited from an added boost in the later stages of 2017 as the White House and Congressional Republican leaders coalesced around a plan for tax reform. In the first quarter of 2018, the major theme in the U.S. equity market was the return of volatility. The primary drivers were concerns over higher interest rates and uncertainty about trade relations. The U.S. equity market experienced the first correction in more than a year and ended the quarter down slightly. Sectors that led the market higher included Information Technology, Financials, Industrials, and Consumer Discretionary. Telecommunication Services, Real Estate, Consumer Staples, Energy, and Utilities underperformed the Index during the period. The Health Care sector performed in line with the Index.
Portfolio Review
Within the Fund, the Real Estate, Consumer Discretionary, Financials, and Consumer Staples sectors outperformed relative to the benchmark. Sectors that lagged relative to the benchmark included Industrials, Energy, Information Technology, Materials, and Telecommunication Services. Stock selection detracted from Fund performance for the 12-month period. Sector allocation contributed primarily due to the underweights to Consumer Staples and Utilities and the overweight to Information Technology stocks. Cash holdings had a negative impact to performance given the positive move in the market.
The Fund’s top contributing stocks relative to the benchmark were Amazon.com Inc., Yum China Holdings Inc. (both Consumer Discretionary sector) and Jones Lang Lasalle Inc. (Real Estate sector). Amazon.com rose due to acceleration of growth in Prime and Amazon Web Services. Yum China rose primarily due to higher margins and strength in its KFC brand in the Chinese market. Jones Lang Lasalle rose on higher fee revenue from leasing and property management.
Stocks that detracted the most include General Electric Co., Stericycle Inc. (both Industrials sector) and Simon Property Group Inc. (Real Estate sector). General Electric declined due to weakness in oil, gas, and power end markets combined with the guidance and dividend reset among other concerns. Stericycle fell on pricing pressure among small quantity medical waste customers and weakness in its communication services unit. Simon Property Group declined primarily due to investor concerns about an over-supplied retail sector in the U.S.
Management's Discussion of Fund Performance (Unaudited) (Continued)
From a market cap perspective, the Fund maintained an underweight to smaller-cap stocks (companies with a market cap below $2 billion). The Index weight to this segment is 4.0 percent compared to 0.0 percent for the Fund. The Fund remained underweight to mid-cap businesses, which now comprise 10.5 percent of assets, compared to an Index weight of 13.4 percent. Lastly, the Fund continued to maintain an overweight to larger-cap businesses (companies with a market cap above $10 billion). The Fund’s weight to that segment is currently 87.1 percent versus the Index weight of 82.6 percent.
During the period, the Fund bought Starbucks Corp. (Consumer Discretionary sector), Signature Bank, Bank of the Ozarks Inc. (both Financials sector), and Facebook Inc. (Information Technology sector). The Fund sold Vista Outdoor Inc. (Industrials sector), Abbott Laboratories (Health Care sector),The Bank of New York Mellon Corp. (Financials sector), World Fuel Services Corp. (Energy sector), and CVS Health Corp. (Consumer Staples sector).
As of the end of the 12-month period, the Fund had an overweight to the Consumer Discretionary, Information Technology, Financials, and Real Estate sectors and an underweight to the Consumer Staples, Energy, Materials, and Industrials sectors. The weights in the Health Care and Telecommunication Services sectors were generally equal to the Index. No positions were held in Utilities at the end of the quarter.
Outlook
While we do not see signs of what typically causes a severe pullback, Fund positioning reflects our belief that we are in the later stages of the market cycle. As we continue to look for businesses that we believe are mispriced by the market, we have been gradually improving the quality of the Fund’s portfolio with stocks of companies that tend to have higher returns on capital, less debt on their balance sheets, strong cash flow generation and high barriers to entry.
Management's Discussion of Fund Performance (Unaudited) (Continued)
Comparison of the Change in Value of a $10,000 Investment in the
Touchstone Focused Fund - Class A*, the Russell 3000® Index and the S&P 500® Index
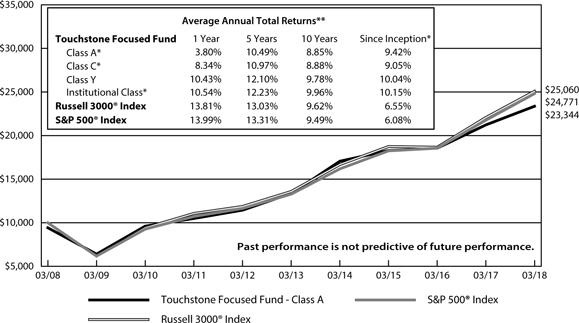
| * | The chart above represents performance of Class A shares only, which will vary from the performance of Class C shares, Class Y shares and Institutional Class shares based on the differences in sales loads and fees paid by shareholders in the different classes. The inception date of Class A shares, Class C shares, Class Y shares and Institutional Class shares was September 30, 2003, April 12, 2012, February 12, 1999 and December 20, 2006, respectively. Class A shares, Class C shares and Institutional Class shares performance information was calculated using the historical performance of Class Y shares for the periods prior to September 30, 2003, April 12, 2012 and December 20, 2006, respectively. The returns have been restated for sales loads and fees applicable to Class A, Class C and Institutional Class shares. The returns of the indexes listed above are based on the inception date of the Fund. |
| ** | The average annual total returns shown above are adjusted for maximum sales loads and fees, if applicable. The maximum offering price per share of Class A shares is equal to the net asset value (“NAV”) per share plus a sales load equal to 6.10% of the NAV (or 5.75% of the offering price). Class C shares are subject to a contingent deferred sales charge (“CDSC”) of 1.00%. The CDSC will be assessed on an amount equal to the lesser of (1) the NAV at the time of purchase of the shares being redeemed or (2) the NAV of such shares being redeemed, if redeemed within a one-year period from the date of purchase. Class Y shares and Institutional Class shares are not subject to sales charges. |
The performance of the above Fund does not reflect the deduction of taxes that a shareholder would pay on Fund distributions or the redemption of Fund shares.
Notes to Chart
Russell 3000® Index measures the performance of the 3,000 largest U.S. companies based on total market capitalization, which represents approximately 98% of the investable U.S. equity market.
S&P 500® Index is a group of 500 widely held stocks and is commonly regarded to be representative of the large capitalization stock universe.
The Frank Russell Company (FRC) is the source and owner of the Russell 3000® Index data contained or reflected in this material and all trademarks and copyrights related thereto. The material may contain confidential information and unauthorized use, disclosure, copying, dissemination or redistribution is strictly prohibited. This is a Touchstone Investments presentation of the data, and FRC is not responsible for the formatting or configuration of this material or for any inaccuracy in the presentation thereof.
Management's Discussion of Fund Performance (Unaudited)
Touchstone Growth Opportunities Fund
Sub-Advised by Westfield Capital Management Company, L.P.
Investment Philosophy
The Touchstone Growth Opportunities Fund seeks long-term growth of capital by primarily investing in stocks of U.S. companies with large, medium and small market capitalizations. The Fund’s portfolio managers place focus on companies they believe to have demonstrated records of achievement with excellent prospects for earnings growth over a 1- to 3-year period. Westfield looks for companies that it believes are reasonably priced with high forecasted earnings potential.
Fund Performance
The Touchstone Growth Opportunities Fund (Class A Shares) underperformed its benchmark, the Russell 3000® Growth Index, for the 12-month period ended March 31, 2018. The Fund’s total return was 19.51 percent (calculated excluding the maximum sales charge), while the total return of the benchmark was 21.06 percent.
Market Environment
U.S. equity markets started the quarter much like they ended 2017 with strong returns and limited volatility. These gains were supported by continued strength in the underlying economy, robust earnings growth in corporate America, and further propelled by the stimulus of tax reform. However, as the quarter unfolded, volatility returned to the markets as investors grew concerned about the impact of rising inflation and the potential that the U.S. Federal Reserve Board may alter the course of expected future rate hikes. The political backdrop contributed to the market gyrations as escalating trade tensions between the U.S. and China called into question the continuation of synchronized global growth, which had been present over the preceding year.
Portfolio Review
Relative weakness in the Health Care and Industrials sectors outweighed relative strength in the Consumer Staples and Information Technology sectors.
The Health Care sector was the Fund’s largest source of weakness. Celgene Corp., a global biopharmaceutical company focused on discovering therapies for the treatment of cancer and immune-inflammatory diseases, was the Fund’s largest detractor in the sector. This long-term holding sold off in October after missing third quarter consensus estimates for psoriasis drug Otezla and lowering 2020 guidance. While the overall cut to long-term guidance was modest, the resultant revenue share increase from the business’s core franchise Revlimid raised concerns among investors as to the company’s ability to diversify away from its marquee drug over time. Despite disappointment with the quarterly report and the subsequent stock decline, we maintained the Fund’s investment. We believe the breadth of the late-stage pipeline, as well as deployment of the cash flow associated with the Revlimid franchise into additional assets should allow the company to successfully diversify its revenue concentration away from the drug over time. Medicines Co., which is developing an exciting cholesterol-lowering agent, was also a detractor from relative returns for the period. Investors had been anticipating a mergers and acquisitions (M&A) deal, but punished the stock when a deal failed to materialize. Our thesis on Medicines, however, is more long term in nature and focuses on the company’s Phase 3 product candidate for cholesterol management. Clinical data published for the product thus far has been encouraging and we believe the drug could become a key driver of revenue generation in the future for the company.
The Industrials sector was another area of weakness for the period. Industrial distributor HD Supply Holdings Inc. was the sector’s largest relative detractor. The company’s price declined sharply in early June, following its quarterly earnings report. Although the earnings reported were in line with management’s initial guidance,
Management's Discussion of Fund Performance (Unaudited) (Continued)
they were slightly below consensus expectations and resulted in negative price action. Following an extensive internal review, the investment was sold out of the Fund as we lost faith in the company’s ability to meet its profitability goals. Manufacturer of air and ventilation systems Ingersoll-Rand PLC was also a relative detractor for the period. We purchased the stock back in April 2017 on the premise that the company would benefit from organic growth in the commercial construction markets given its HVAC (or heating, ventilation, and air conditioning) exposure. However, earnings reported during the last two quarters of 2017 showed somewhat disappointing results. Margins in the company’s Climate business segment were compressed by higher than expected raw material costs as well as heavy investment in a Chinese sales force for this segment, the latter of which management thought would position the company for long-term growth. Going forward, Ingersoll-Rand thinks it can offset these margin headwinds through pricing power. Despite the stock’s weakness, the Fund remains invested in the stock believing these margin headwinds to be temporary.
Consumer Staples was the Fund’s top-performing sector, contributing to relative returns primarily through an underweight positioning to the sector. The Fund remained underexposed to the sector as many of the constituents of the group lacked the growth and valuation profiles we seek in investments. However, the Fund maintains select investments with a bias to own above-average growers such as those involved in the sale of imported beer and reduced-risk cigarettes. For example, Constellation Brands Inc. is a producer and distributor of alcoholic beverages, and was the sector’s top relative performer. Improvement in the company’s beer business segment has been key to our investment thesis, and the company has been delivering on this front. Constellation generates ample free cash flow and we think they should execute on share repurchases down the road. Additionally, it has been encouraging to see the price recover and move higher from the declines experienced in the wake of the U.S. election and the corresponding Mexican/American trade policy uncertainty. We continue to believe that the company has painted a credible picture of how it will navigate various trade scenarios and with more clarity on the policy front, we believe the stock should maintain its momentum.
The Information Technology sector contributed to relative returns through positive stock selection. The Fund’s position in Red Hat Inc., a provider of open-source software solutions to various enterprises worldwide, was the sector’s top relative performer. Recent comments from the company’s Chief Executive Officer indicated that the company is facing pent-up demand in terms of technology spending from corporate decision makers. The company has also seen a recent resurgence in its core business which is taking share from UNIX and Windows. ServiceNow Inc., the leading provider of SaaS/cloud IT service management software, also enhanced the sector’s relative returns. The stock accelerated into the company’s latest round of quarterly results which came in ahead of Wall Street expectations and saw the company raise forward guidance. ServiceNow has compelling top-line growth and is generating meaningful cash flow, which we believe sets them apart from most other high-growth technology companies.
Outlook
As a fundamental, bottom-up manager, macro-economic forecasts do not drive our stock selection process, but do help to shape our investment themes. With that said, we look forward to markets normalizing and fundamentals once again driving stock prices. We believe the current environment is becoming more favorable to active security selection as intra-stock correlations have receded and idiosyncratic drivers, such as earnings, are helping to determine asset valuations. We further think these developments should favor bottom-up GARP (“growth-at-a-reasonable-price”) managers such as Westfield. At present, the Fund is focused on stocks that can benefit from such factors as tax reform, fiscal stimulus, repatriation of money from overseas, and reduced regulation out of Washington D.C under Republican leadership. These measures, if implemented successfully, could help accelerate economic growth and drive further market gains.
We believe Energy represents one of the most compelling sectors of the market with good growth and attractive valuations. Oil prices have recovered off of 2016 lows, yet the Energy sector has been the worst performing
Management's Discussion of Fund Performance (Unaudited) (Continued)
segment of the market over the last year. Looking forward, we feel there is now a significant disconnect between floundering stock prices and fundamentals, which have now recovered. We are also entering a seasonally strong period for the sector as well. With that said, we continue to be selective within Energy, focusing our attention on low cost producers with the best geology within exploration and production companies, and refining assets that benefit from the tailwinds of increased demand and production growth in the U.S.
As we exit the first quarter, risks appear balanced and we have structured the Fund accordingly. With increased volatility comes increased opportunity to identify and take advantage of favorable pricing in both directions and we believe this market environment plays into our strengths. While trade concerns make splashy headlines, we continue to believe the true driver of equity returns remains earnings and the domestic earnings growth story should remain intact for the time being. We are also keeping a keen eye on inflation developments and the pace of progress with regard to interest rates, as both have the potential to impact equity markets and optimal Fund positioning.
Management's Discussion of Fund Performance (Unaudited) (Continued)
Comparison of the Change in Value of a $10,000 Investment in the
Touchstone Growth Opportunities Fund - Class A* and the Russell 3000® Growth Index

| * | The chart above represents performance of Class A shares only, which will vary from the performance of Class C shares, Class Y shares and Institutional Class shares based on the differences in sales loads and fees paid by shareholders in the different classes. The inception date of Class A shares, Class C shares, Class Y shares and Institutional Class shares was September 29, 1995, August 2, 1999, February 2, 2009 and February 2, 2009, respectively. Class C shares, Class Y shares and Institutional Class shares performance information was calculated using the historical performance of Class A shares for periods prior to August 2, 1999, February 2, 2009 and February 2, 2009, respectively. The returns have been restated for sales loads and fees applicable to Class C, Class Y and Institutional Class shares. The returns of the index listed above are based on the inception date of the Fund. |
| ** | The average annual total returns shown above are adjusted for maximum sales loads and fees, if applicable. The maximum offering price per share of Class A shares is equal to the net asset value (“NAV”) per share plus a sales load equal to 6.10% of the NAV (or 5.75% of the offering price). Class C shares are subject to a contingent deferred sales charge (“CDSC”) of 1.00%. The CDSC will be assessed on an amount equal to the lesser of (1) the NAV at the time of purchase of the shares being redeemed or (2) the NAV of such shares being redeemed, if redeemed within a one-year period from the date of purchase. Class Y shares and Institutional Class shares are not subject to sales charges. |
The performance of the above Fund does not reflect the deduction of taxes that a shareholder would pay on Fund distributions or the redemption of Fund shares.
Notes to Chart
Russell 3000® Growth Index measures the performance of those Russell 3000® companies with higher price-to-book ratios and higher forecasted growth values.
The Frank Russell Company (FRC) is the source and owner of the Index data contained or reflected in this material and all trademarks and copyrights related thereto. The material may contain confidential information and unauthorized use, disclosure, copying, dissemination or redistribution is strictly prohibited. This is a Touchstone Investments presentation of the data, and FRC is not responsible for the formatting or configuration of this material or for any inaccuracy in the presentation thereof.
Management's Discussion of Fund Performance (Unaudited)
Touchstone International Growth Fund
Sub-Advised by Fiera Capital Inc.
Investment Philosophy
The Touchstone International Growth Fund seeks to achieve long-term capital growth by investing primarily in issuers located in developed markets utilizing an approach that combines “top-down” secular - and macro-economic trend analysis with “bottom-up” security selection. The “top-down” view seeks to provide a framework for “bottom-up” research by identifying sectors, industries and companies that may benefit from the sustainability of the observed trends. Fundamental “bottom-up” research is applied to identify individual companies that exhibit earnings growth potential and may benefit from observed secular- and macro-economic trends. The Fund typically invests in companies that are recognized as “established growth” companies which generally provide more stability and consistency in volatile markets. It also invests in companies that are in the earlier stages of their growth cycle that are known as “emerging growth” companies which typically exhibit more aggressive growth characteristics and may experience a significant positive transformation or a favorable catalyst impacting their long-term earnings potential.
Fund Performance
The Touchstone International Growth Fund (Class A Shares) outperformed its benchmark, the MSCI All Country World (ACWI) ex-U.S. Index, for the 12-month period ended March 31, 2018. The Fund’s total return was 19.35 percent (calculated excluding the maximum sales charge), while the total return of the benchmark was 16.53 percent.
Market Environment
International stocks outperformed U.S. Large-Cap stocks during the 12-month period ended March 31, 2018. This was in stark contrast to most of the post-financial crisis period in which international stocks trailed their U.S. counterparts. Emerging Markets performance over the past year told a similar story, where they outperformed U.S. large cap stocks and international stocks. In general, equity markets witnessed greater volatility during the first quarter of 2018 than in 2017. Since late January, markets around the world declined due to a variety of factors, including concerns over trade tariffs, valuation concerns and worries around the potential impact of a sharp rise in short-term interest rates.
During the 12-month period, all sectors within the Fund’s benchmark, the MSCI ACWI ex-U.S. Index produced positive gains. The Index was led by the Information Technology, Consumer Discretionary and Materials sectors. Fundamentals were strong for the Information Technology sector and valuation multiples expanded as expectations for future growth also increased. Commensurate with an increase in global economic growth, some of the cyclical sectors such as Consumer Discretionary and Materials, marginally outperformed the benchmark. The interest rate sensitive sectors (Real Estate, Telecommunication Services, Consumer Staples and Utilities) underperformed the Index, since a pickup in economic growth suggested that central banks around the developed world are more likely to increase short term interest rates and wind down their expansionary monetary policy operations. From a regional standpoint, most of the key emerging market regions produced strong gains. In Asia, a combination of a pickup in economic growth globally, a stabilization in domestic currencies relative to the dollar and an increase in corporate profitability across the region were the driving forces behind the strong performance. Eurozone, Japan and developed Asia also outperformed during the period, whereas the United Kingdom, Australia and Canada underperformed.
Portfolio Review
The Fund’s outperformance relative to its benchmark was due to a combination of sector allocation and stock selection. From a sector standpoint, overweights in the Information Technology and Consumer Discretionary
Management's Discussion of Fund Performance (Unaudited) (Continued)
sectors were key contributors to relative performance, while stock selection was strongest within the Financials and Consumer Staples sectors. In terms of specific stocks, Weibo Corp., Tencent Holdings Ltd., Alibaba Group Holding Ltd., Dassault Systemes SE and Sony Corp. were the largest contributors to performance, whereas Inditex SA, Grupo Aeroportuario del Sureste SAB CV, Luxoft Holding Inc., Subaru Corp., Hoya Corp. and Roche Holdings Ltd. were the largest detractors.
During the period, the Fund’s Emerging Markets allocation was increased, especially in Asia. Our optimism in this region stems from various factors that we believe are working in its favor. First, the global economy continued to gain momentum as indicated by the Purchasing Managers Index (PMI) numbers of various major regions. Second, currencies in the recent past that were major headwinds for many of the Emerging Markets countries due to deteriorating current account balances, are stabilizing and we believe might even become tailwinds going forward, as the current account balances showed improvement. We also either added to or initiated new Fund positions in many Emerging Markets companies that we believe will benefit from these trends but also because these companies were major beneficiaries of the secular themes that we find attractive. We also slightly increased the Fund’s exposure to Japan as we initiated new positions in companies that we believe are well positioned to benefit from the growth in industrial automation.
Outlook
Based on how the Fund is currently positioned, we believe the single biggest risk it faces is a sudden deterioration in the global macro situation. While we do not see signs of that happening anytime soon, we are paying attention to areas of the market that are currently weak, which may pose a risk to global recovery. Policy missteps such as trade wars could lead to a potential slowdown in economic activity. We believe a broader economic fallout of Brexit, political uncertainty in Europe or a reversal in Emerging Markets growth are risks that are worth monitoring. We are entering a new phase as central bankers across the developed markets are looking to exit their respective multi-year quantitative easing cycle as the global economic recovery strengthens. While we expect the tapering of the monetary easing to be gradual and measured, any substantial deviation from this or a sudden increase in interest rates could cause economic turmoil. While these issues are concerning and need to be monitored, we still believe there are reasons to be positive. Economic prospects across the globe look bright, and economic growth in the eurozone and Emerging Markets is strong.
We remain focused on individual companies with strong and sustainable organic growth backed by secular trends. Of particular interest are companies on the cutting edge of technology and those that benefit the most from the challenges of uncertainty. Examples include consumer mobility, big data and cloud computing, virtual reality, e-commerce and personalized medicine and genomics. We believe that these areas of long-term potential will be the key drivers in a more normalized market environment.
Management's Discussion of Fund Performance (Unaudited) (Continued)
Comparison of the Change in Value of a $10,000 Investment in the Touchstone International
Growth Fund - Class A* and the MSCI All Country World Ex-U.S. Index

| * | The chart above represents performance of Class A shares only, which will vary from the performance of Class C shares, Class Y shares and Institutional Class shares based on the differences in sales loads and fees paid by shareholders in the different classes. The inception date of Fund was March 31, 2016. The returns of the index listed above are based on the inception date of the Fund. |
| ** | The average annual total returns shown above are adjusted for maximum sales loads and fees, if applicable. The maximum offering price per share of Class A shares is equal to the net asset value (“NAV”) per share plus a sales load equal to 6.10% of the NAV (or 5.75% of the offering price). Class C shares are subject to a contingent deferred sales charge (“CDSC”) of 1.00%. The CDSC will be assessed on an amount equal to the lesser of (1) the NAV at the time of purchase of the shares being redeemed or (2) the NAV of such shares being redeemed, if redeemed within a one-year period from the date of purchase. Class Y shares and Institutional Class shares are not subject to sales charges. |
The performance of the above Fund does not reflect the deduction of taxes that a shareholder would pay on Fund distributions or the redemption of Fund shares.
Notes to Chart
MSCI All Country World Ex-U.S. Index measures the equity market performance of the non U.S. developed and emerging markets.
MSCI makes no express or implied warranties or representations and shall have no liability whatsoever with respect to any MSCI data contained herein. The MSCI data may not be further redistributed or used to create indices or financial products. This report is not approved or produced by MSCI.
Management's Discussion of Fund Performance (Unaudited)
Touchstone International Value Fund
Sub-Advised by Barrow, Hanley, Mewhinney & Strauss, LLC
Investment Philosophy
The Touchstone International Value Fund seeks long-term capital growth by primarily investing in equity securities of non-U.S. companies believed to be undervalued and seeks companies that have price-to-earnings and price-to-book ratios below the market, enterprise-value/free-cash-flow ratios at or below the market and dividend yields above the market.
Fund Performance
The Touchstone International Value Fund (Class A Shares) outperformed both of its benchmarks, the MSCI EAFE Value Index and the MSCI EAFE Index, for the 12-month period ended March 31, 2018. The Fund’s total return was 15.37 percent (calculated excluding the maximum sales charge), while the total return of the MSCI EAFE Value Index was 12.19 percent and the total return of the MSCI EAFE Index was 14.80 percent.
Market Environment
During the 12-month period ended March 31, 2018, investors reacted positively toward higher levels of global economic growth, driving stock markets to strong gains. The markets favored growth stocks over value stocks during this period, leading the MSCI EAFE Growth Index to outperform the MSCI EAFE Value Index by a meaningful margin. Stocks in the Information Technology sector, in particular, were strong drivers of outperformance, while the more defensive areas of the market, such as the Consumer Staples and Health Care sectors, fell out of favor with investors. Benefiting from a rally in crude oil and commodity prices, the Energy and Materials sectors enjoyed solid gains during the period.
Regionally, Emerging Markets stocks continued to outperform, far outpacing their developed market peers. During the 12-month period, Japan led the developed market rally, but still was unable to keep pace with its Emerging Markets counterparts. The U.K. was among the weakest performers, as investors’ concerns over Brexit (i.e., Britain’s exit from the European Union) continued to impact sentiment toward the region.
Portfolio Review
The Touchstone International Value Fund outpaced the MSCI EAFE Value Index for the 12-month period ended March 31, 2018. The Fund was aided by its strong security selection in the Financials and Consumer Discretionary sectors, which was partially offset by weaker stock picking in the Health Care and Consumer Staples market sectors. Fund positioning in the Industrials and Information Technology sectors also benefited relative returns.
Among the individual stocks that contributed to performance were Erste Group Bank AG, XL Group Ltd. (both from the Financials sector), Hitachi Ltd. (Information Technology sector), Fiat Chrysler Automobiles NV (Consumer Discretionary sector) and Ecopetrol SA (Energy sector). Erste Group is based in Austria and is one of the largest financial services providers in Central and Eastern Europe. The company benefited from a positive interest rate environment in the Czech Republic and Romania, along with favorable loan growth in its core market. XL Group is a global insurance company that generates the majority of its earnings from primary insurance and the remainder from reinsurance. XL contributed meaningfully after AXA, a French insurance conglomerate, announced its intent to acquire XL at a compelling premium. Hitachi is a highly diversified manufacturing corporation headquartered in Japan. The company outperformed during the period as it continued to execute well on its restructuring program which helped improve margins and increase profitability. Fiat Chrysler Automobiles is a global automotive original equipment manufacturer (OEM) that also outperformed during the period. Fiat reported strong profit growth as it continued to execute well on its strategic plan to reduce
Management's Discussion of Fund Performance (Unaudited) (Continued)
costs, improve margins and improve profitability. Columbia’s national oil company Ecopetrol added to relative results, benefiting from the tailwind of rising oil prices. Company specific drivers of the strong gains include its reduced debt load and an increase in its dividend.
Among the individual stocks that detracted from Fund performance were Imperial Brands PLC, Aryzta AG (both from the Consumer Staples sector) andTeva Pharmaceutical Industries Ltd. (Health Care sector). Imperial Brands is a U.K.-based cigarette, cigar and tobacco manufacturer that underperformed along with most other tobacco-related stocks during the year. The company faced added challenges due to its lack of a product in the heat-not-burn (or vapor) segment of the market. Imperial continued to trade at compelling valuations and we believe investor sentiment should change if the company can successfully bring its vapor product to market. Aryzta is a Switzerland-based food business with a primary focus on specialty baking, a niche segment of the overall bakery market. Aryzta fell short of its profit goals during the year as its North American operations were challenged by increasing labor and transportation costs. However, Aryzta has been in the process of selling assets, and a large divestiture remaining is food company Picard Surgelés SAS. The sale, combined with the stabilization of operating fundamentals, is expected to bolster the company’s balance sheet. Teva Pharmaceuticals, a multinational pharmaceutical company headquartered in Israel, continued to face challenges during the year due to falling generic drug prices and outside competition for its key drug COPAXONE®. The company was further impacted by challenges from a change in corporate management, a dividend cut and poor operating results during the year. As a result, we exited the Fund’s position.
Outlook
The turbulence in the markets during the most recent quarter marked a definitive turning point for investors who shrugged off many events last year. We believe many risks remain for equity and bond markets both here and around the globe, some of which began to unfold in the first quarter. An increased sensitivity to risk is occurring as markets around the globe are trading at above-average valuations. Notwithstanding the recent pull-back in stocks and even with the benefit of improving earnings growth, global equity markets are still trading well above their long-term averages. As we have discussed previously, these elevated valuations mean that market returns will likely be much more reliant on earnings growth and dividends than in the multiple expansion driven gains of recent years.
Previously, we have noted the risk of inflation across the globe as many central banks attempt to unwind nearly a decade of unprecedented easy monetary policies. With falling unemployment, high consumer confidence, higher energy costs and now added stimulus from the U.S. government, it would appear that prices are only set to move higher. As a result, we believe central banks may be forced to tighten monetary policies more quickly, causing economic growth to slow. We have begun to see this risk appear, as global economic indicators such as Purchasing Managers’ Indexes (PMIs) have pulled back from their recent highs. However, on the positive side, these indicators remain in expansion territory and, if they were to stabilize, we expect global economies to continue growing faster than during the last eight years. Investors’ sensitivity to risk is increasing as markets around the globe are trading at above-average valuations. Notwithstanding the recent pullback in stocks – even with the benefit of improved earnings growth – global equity markets have continued trading well above their long-term averages.
Looking forward, earnings expectations are forecast to grow rapidly, boosted by tax cuts and government spending. Given the extent to which this bull market has driven up valuations, it seems wise to focus on the contributions that earnings and dividends make to overall returns. As always, we seek stocks with meaningful valuation discounts to the overall market and those with the potential to return to normalized profitability that are underappreciated by investors. This is a sharp contrast to many of the highly-valued growth stocks with high embedded expectations for future profit growth. The Fund’s value process is built for the long-run and its long-term track record was based more closely on the long-term components of return than those of the current nine-year bull market.
Management's Discussion of Fund Performance (Unaudited) (Continued)
We believe that the next five years will not look like the past five years, with lower returns and increased volatility. This type of environment is when the Fund’s process has historically added the most value.
Dividend-paying investments may not experience the same price appreciation as non-dividend paying instruments, dividend-issuing companies may choose not to pay a dividend, or the dividend may be less than what is anticipated.
Management's Discussion of Fund Performance (Unaudited) (Continued)
Comparison of the Change in Value of a $10,000 Investment in the Touchstone International Value Fund - Class A*, the MSCI EAFE Value Index and the MSCI EAFE Index

| * | The chart above represents performance of Class A shares only, which will vary from the performance of Class C shares, Class Y shares and Institutional Class shares based on the differences in sales loads and fees paid by shareholders in the different classes. The inception date of Class A shares, Class C shares, Class Y shares and Institutional Class shares was August 18, 1994, April 25, 1996, October 9, 1998 and September 10, 2012, respectively. Class C shares, Class Y shares and Institutional Class shares performance information was calculated using the historical performance of Class A shares for periods prior to April 25, 1996, October 9, 1998 and September 10, 2012, respectively. The returns have been restated for sales loads and fees applicable to Class C, Class Y, and Institutional Class shares. The returns of the indexes listed above are based on the inception date of the Fund. |
| ** | The average annual total returns shown above are adjusted for maximum sales loads and fees, if applicable. The maximum offering price per share of Class A shares is equal to the net asset value (“NAV”) per share plus a sales load equal to 6.10% of the NAV (or 5.75% of the offering price). Class C shares are subject to a contingent deferred sales charge (“CDSC”) of 1.00%. The CDSC will be assessed on an amount equal to the lesser of (1) the NAV at the time of purchase of the shares being redeemed or (2) the NAV of such shares being redeemed, if redeemed within a one-year period from the date of purchase. Class Y shares and Institutional Class shares are not subject to sales charges. |
The performance of the above Fund does not reflect the deduction of taxes that a shareholder would pay on Fund distributions or the redemption of Fund shares.
Notes to Chart
MSCI EAFE Value Index captures large- and mid-cap securities exhibiting overall value style characteristics across developed markets countries around the world, excluding the U.S. and Canada.
MSCI EAFE Index is a free float-adjusted market capitalization index that is designed to measure developed market equity performance excluding the U.S. and Canada.
MSCI makes no express or implied warranties or representations and shall have no liability whatsoever with respect to any MSCI data contained herein. The MSCI data may not be further redistributed or used to create indices or financial products. This report is not approved or produced by MSCI.
Management's Discussion of Fund Performance (Unaudited)
Touchstone Mid Cap Growth Fund
Sub-Advised by Westfield Capital Management Company, L.P.
Investment Philosophy
The Touchstone Mid Cap Growth Fund seeks to increase the value of Fund shares by primarily investing in stocks of mid-cap U.S. companies. The Fund’s portfolio managers place focus on companies that they believe to have a demonstrated record of achievement with excellent prospects for earnings growth over a 1-to-3-year period. Westfield looks for companies that it believes are reasonably priced with high forecasted earnings potential.
Fund Performance
The Touchstone Mid Cap Growth Fund (Class A Shares) underperformed its benchmark, the Russell Midcap® Growth Index, for the 12-month period ended March 31, 2018. The Fund’s total return was 19.28 percent (calculated excluding the maximum sales charge), while the total return of the benchmark was 19.74 percent.
Market Environment
By the end of 2017, U.S. equity markets pushed most major indices to new highs and closed out the best calendar year returns for stocks since 2013. Underpinning the market strength was continued strong economic data which consistently supported the view that growth was accelerating both in the U.S. and abroad. However, as the first quarter of 2018 unfolded, volatility returned to the markets as investors grew concerned about the impact of rising inflation and the potential that the U.S. Federal Reserve Board may alter the course of expected future rate hikes. In addition, the political backdrop contributed to the market gyrations as escalating trade tensions between the U.S. and China called into question the continuation of synchronized global growth, which had been present over the preceding year.
Portfolio Review
Relative strength in the Energy, Consumer Staples, and Materials sectors offset relative weakness in the Real Estate and Industrials sectors.
The Energy sector was the Fund’s top contributor to relative performance. Stock selection within the group was particularly important over the period as the dispersion of returns was significant. Oil and gas refiner Andeavor was the top relative contributor. Even after the positive recent results, we continue to be excited about the prospects for the company going forward. New regulations soon to be implemented put a sulfur cap on global maritime shipping operations which will require maritime traffic to use relatively cleaner and more expensive diesel fuel. We anticipate that this change should enhance Andeavor’s earnings power by increasing demand for these more-refined, and importantly higher margin, fuels.
The Consumer Staples sector was also a source of strength during the period. Constellation Brands Inc., a producer and distributor of alcoholic beverages, was the sector’s top relative performer. Improvement in the company’s beer business segment has been key to our investment thesis, and the company has been delivering on this front. Constellation generates ample free cash flow and we think it should execute on share repurchases down the road. Additionally, it has been encouraging to see the stock price recover and move higher from the declines experienced in the wake of the U.S. election and the corresponding Mexican/American trade policy uncertainty. We continue to believe that the company has painted a credible picture of how it will navigate various trade scenarios and with more clarity on the policy front, we believe the stock should maintain its momentum.
Management's Discussion of Fund Performance (Unaudited) (Continued)
The Materials sector contributed to relative returns through a combination of stock selection and the Fund’s underweight to this market trailing sector. Avery Dennison Corp., a manufacturer of self-adhesive materials, retail tags, and specialty tapes, among other products, was the top relative performer in the sector. We consider fundamentals to be healthy and expect the company to continue to generate solid organic sales growth. Avery is a high-quality business with what we believe are sustainable competitive advantages as the company benefits from strong pricing power driven by its robust market share and fragmented customer base. The company has also shown its ability to smartly develop capital, which we think should serve it well as it embarks on its announced acquisition strategy.
The Real Estate sector was the Fund’s biggest source of relative weakness. American Campus Communities Inc., an owner of on-campus housing properties, was the sector’s largest relative detractor. It declined in September after reporting its final leasing results for the 2018 academic year which showed occupancy rates below consensus expectations and rental rate growth only at the mid-point of the prior guidance. We exited the stock in light of these developments. As we continue to progress into the current rising interest rate environment, we are managing the Fund’s exposure to this sector with selectivity geared towards those real estate investment trusts (REIT) which we expect to experience growth next year despite the challenging backdrop.
Fund positioning in the Industrials sector detracted from relative returns. Macquarie Infrastructure Corp., which invests in infrastructure companies located in the U.S., was the Fund’s biggest source of relative weakness during the period. The stock declined sharply following the company’s most recent quarterly earnings release in which Macquarie reported earnings before interest, taxes, depreciation and amortization (EBITDA) and distributable cash flow per share numbers that fell short of investor expectations due to a drop in the utilization rates of its tank and storage businesses. The company is repurposing storage tanks to shift away from residual and heavy oil given changing storage needs for these products and the resultant guidance adjustment lower from this change in strategy weighed heavily on the stock price. As a result of this negative development, we determined that exiting the position was the most prudent course of action.
Outlook
As a fundamental, bottom-up manager, macro-economic forecasts do not drive the stock selection process, but do help to shape our investment themes. With that said, we look forward to markets normalizing and fundamentals once again driving stock prices. We believe the current environment is becoming more favorable to active security selection as intra-stock correlations have receded and idiosyncratic drivers, such as earnings, are helping to determine asset valuations. We further think these developments should favor bottom-up GARP (“growth-at-a-reasonable-price”) managers such as Westfield. At present, the Fund is focused on stocks that have the ability to benefit from such factors as tax reform, fiscal stimulus, repatriation of money from overseas, and reduced regulation out of Washington D.C. under Republican leadership. These measures, if implemented successfully, could help accelerate economic growth and drive further market gains.
We believe Energy represents one of the most compelling sectors of the market with good growth and attractive valuations. Oil prices have recovered off of 2016 lows, yet the Energy sector has been the worst performing segment of the market over the last year. Looking forward, we believe there is now a significant disconnect between floundering stock prices and fundamentals, which have now recovered. We are also entering a seasonally strong period for the sector as well. We continue to be very selective within Energy, focusing our attention on low cost producers with the best geology within exploration and production companies, and refining assets that benefit from the tailwinds of increased demand and production growth in the U.S.
At the end of the first quarter of 2018, risks appeared balanced and we have structured the Fund accordingly. With increased volatility comes increased opportunity to identify and take advantage of favorable pricing in both directions and we believe this market environment plays into our strengths. While trade concerns make splashy headlines, we continue to believe the true driver of equity returns remains earnings and the domestic
Management's Discussion of Fund Performance (Unaudited) (Continued)
earnings growth story should remain intact for the time being. We are also keeping a keen eye on inflation developments and the pace of progress with regard to interest rates, as both have the potential to impact equity markets and optimal Fund positioning.
Management's Discussion of Fund Performance (Unaudited) (Continued)
Comparison of the Change in Value of a $10,000 Investment in the Touchstone Mid Cap Growth Fund - Class A* and the Russell Midcap® Growth Index

| * | The chart above represents performance of Class A shares only, which will vary from the performance of Class C shares, Class Y shares and Institutional Class shares based on the differences in sales loads and fees paid by shareholders in the different classes. The inception date of Class A shares, Class C shares, Class Y shares and Institutional Class shares was October 3, 1994, October 3, 1994, February 2, 2009 and April 1, 2011. Class Y shares and Institutional Class shares performance information was calculated using the historical performance of Class A shares for periods prior to February 2, 2009 and April 1, 2011, respectively. The returns have been restated for fees applicable to Class Y and Institutional Class shares. The returns of the index listed above are based on the inception date of the Fund. |
| ** | The average annual total returns shown above are adjusted for maximum sales loads and fees, if applicable. The maximum offering price per share of Class A shares is equal to the net asset value (“NAV”) per share plus a sales load equal to 6.10% of the NAV (or 5.75% of the offering price). Class C shares are subject to a contingent deferred sales charge (“CDSC”) of 1.00%. The CDSC will be assessed on an amount equal to the lesser of (1) the NAV at the time of purchase of the shares being redeemed or (2) the NAV of such shares being redeemed, if redeemed within a one-year period from the date of purchase. Class Y shares and Institutional Class shares are not subject to sales charges. |
The performance of the above Fund does not reflect the deduction of taxes that a shareholder would pay on Fund distributions or the redemption of Fund shares.
Notes to Chart
Russell Midcap® Growth Index measures the performance of those Russell Midcap® companies with higher price-to-book ratios and higher forecasted growth values.
The Frank Russell Company (FRC) is the source and owner of the Index data contained or reflected in this material and all trademarks and copyrights related thereto. The material may contain confidential information and unauthorized use, disclosure, copying, dissemination or redistribution is strictly prohibited. This is a Touchstone Investments presentation of the data, and FRC is not responsible for the formatting or configuration of this material or for any inaccuracy in the presentation thereof.
Management's Discussion of Fund Performance (Unaudited)
Touchstone Sands Capital Emerging Markets Growth Fund
Sub-Advised by Sands Capital Management, LLC
Investment Philosophy
The Touchstone Sands Capital Emerging Markets Growth Fund seeks long-term capital appreciation. The Fund invests in equity and equity-related securities issued by companies located in Emerging or Frontier Markets countries. The Fund’s sub-advisor, Sands Capital Management LLC, uses a “bottom-up” approach to investment selection, as opposed to sector or regional allocations that focuses on a company’s long-term business fundamentals. Sands Capital seeks companies that have: sustainable above-average earnings growth; a leadership position in a promising business space; significant competitive advantages such as profitability, superior quality or distribution relative to competitors or strong brand and consumer loyalty; a clear mission in an understandable business model; financial strength; and a rational valuation in relation to competitors, the market and business prospects.
Fund Performance
The Touchstone Sands Capital Emerging Markets Growth Fund (Class Y Shares) outperformed its benchmark, the MSCI Emerging Markets Index, for the 12-month period ended March 31, 2018. The Fund’s total return was 26.82 percent, while the total return of the benchmark was 24.93 percent.
Market Environment
Emerging Markets equities (as measured by the MSCI Emerging Markets Index) posted strong gains over the calendar year. The Information Technology sector was the strongest contributor to returns (with Chinese technology businesses accounting for a majority of the sector’s index contribution), and there were no detracting sectors, indicating market breadth. Only two countries—Qatar and Pakistan—modestly detracted from returns, while Chinese, South Korean, and Taiwanese businesses contributed the most.
Information Technology businesses posted strong results over the past year globally, as strong revenue and earnings growth translated into share price gains. Just three companies—Tencent Holdings Ltd., Alibaba Group Holding Ltd. and Taiwan Semiconductor Manufacturing Co. Ltd.—accounted for a majority of the sector’s overall contribution to the benchmark return. We believe these companies remain poised to benefit from the secular trends of increased internet connectivity, digital consumption and mobile access.
Solid corporate fundamentals were supported by broad economic strength. India posted the fastest year-over-year gross domestic product (GDP) growth among major economies, and Brazil finally returned to growth after two years of deep recession. In China, growth annually accelerated for the first time in seven years, and we believe President Xi Jinping’s consolidation of power could provide long-term stability, given his pro-growth policies. Additionally, a decline in the U.S. Dollar—coupled with an increase in oil prices—provided additional support.
As long-term investors, we attempt to look past external factors and stock price movements not explained by fundamentals. Market and macro environments change, and it is impossible to predict which sectors and countries will lead or lag on a short-term basis. Rather, we continue to believe that investing in leading franchises capable of generating above-average earnings growth across economic cycles is the most prudent way to add value over time.
Portfolio Review
During the 12-month period ended March 31, 2018, the largest five contributors to relative investment results were Alibaba Group Holding Ltd., MercadoLibre Inc., Jubilant Foodworks Ltd., Yandex NV and Medy-Tox Inc. MercadoLibre continued to take steps to widen its competitive moat and extend its market leadership,
Management's Discussion of Fund Performance (Unaudited) (Continued)
which drove strong topline results. In its most recently reported quarterly results, the company posted 63 percent gross merchandise volume (GMV) growth in U.S. dollar terms and 58 percent growth in units sold. The company saw strong contributions from Brazil and Mexico, where MercadoLibre recently introduced free shipping. This feature was launched recently in Argentina, which we believe should help sustain growth, because the country accounts for one-quarter of the company’s total revenue. E-commerce makes up less than five percent of total retail sales in Latin America, and MercadoLibre, domestic retailers and other internet businesses are all investing to accelerate retail’s shift from offline to online. While some work remains, we believe MercadoLibre’s existing market share leadership, strong brand recognition and third-party model will allow it to be one of the main beneficiaries of this shift and enjoy sustained above-average growth.
The top five detractors from relative investment results during the period were Hikma Pharmaceuticals PLC, Magnit PJSC, Siloam International Hospitals Tbk PT, Lupin Ltd. and Netshoes (Cayman) Ltd. We believe that the low liquidity of Siloam International Hospitals’ shares—along with relatively low current margins due to ongoing expansion—continued to overshadow the business’s underlying fundamentals. Siloam is the largest private healthcare group in Indonesia, and we believe it stands to benefit from the country’s hospital supply-demand imbalance. Gross revenue grew 16 percent year-over-year in the fourth quarter, in line with the longer-term growth trajectory we expect for the business. Earnings before interest, tax, depreciation and amortization (EBITDA) margins, excluding rental costs, showed meaningful improvement, increasing 230 basis points year-over-year to 18 percent, driven by increased profitability at established hospitals and narrowing losses at newer hospitals. Despite this, increased expansion efforts over the past year have depressed EBITDA margins and net margins—masking the underlying long-term earnings potential of the business. In 2017, the company opened eight new hospitals, increasing total bed count by 25 percent year-over-year. We expect this expansion to add value over time, as these hospitals mature and generate earnings, but patience may be required for the market to better appreciate this. While further expansion will continue to drag on margins, we believe this negative effect will be increasingly overwhelmed by Siloam’s growing base of more profitable, maturing hospitals. We expect annualized earnings growth in excess of 30 percent as the company continues to improve profitability over the next five years.
During the past 12 months, the following businesses were purchased: Avenue Supermarts Ltd., Bank Central Asia Tbk PT, Grupo Aeroportuario del Sureste SAB CV, Maruti Suzuki India Ltd., Netshoes (Cayman) Ltd., Sea Ltd. and Sunny Optical Technology (Group) Co. Ltd.
Avenue Supermarts (DMart) is the second-largest formal food retailer in India by revenue. Founded in 2001, Avenue Supermarts’s DMart chain now has a presence in over 30 cities with more than 100 stores, and is the industry leader in terms of sales per square foot, like-for-like sales growth, margins, operating costs and inventory turnover. DMart primarily caters to middle-class consumers across the food and grocery, fast-moving consumer goods and general merchandise and apparel categories. The majority of the company’s operations are in Gujarat and Majarashtra, which are two industrialized states with a combined population of nearly 200 million. Grocery remains a highly fragmented market in India, and we expect DMart to gain share as Indian consumers shift to modern store formats. In our view, government reform should further fuel this secular trend, which is likely to pressure margins for independent retailers. We believe that the combination of DMart’s operating model and the potential long-term structural tailwind supporting organized retail should allow Avenue Supermarts to sustain above-average annual revenue and earnings growth.
Bank Central Asia (BCA) is Indonesia’s largest private bank, and is the market share leader for payment transactions, unsubsidized mortgage lending and credit card issuance. It operates in what we view as a highly attractive macro environment, which features relatively low levels of financial penetration (less than 40 percent of Indonesians have a bank account), a large and increasingly urbanized population, strong underlying GDP growth in the mid-single digits over the last decade and relatively high levels of bank profitability. BCA’s competitive advantage stems from its strong transaction banking presence, which has enabled it to capture a disproportionate share of sticky, low-cost deposits. We believe the company’s culture of risk management has consistently led to superior
Management's Discussion of Fund Performance (Unaudited) (Continued)
asset quality compared to peers, with loan losses of only one percent (on average) through cycles. Additionally, BCA has a strong affiliation with Indonesians of Chinese descent, who are concentrated in urban areas and are disproportionately represented in the country’s small-to-medium enterprises and large corporations. Over the Fund’s investment horizon, we expect above-average earnings growth as BCA builds on its market-leading position, supported by a favorable macroeconomic environment.
Grupo Aeroportuario del Sureste (ASUR) is Mexico’s leading airport operator, holding a 50-year concession to develop and operate nine airports in southeast Mexico. This group includes Cancun International Airport, which comprises the majority of the company’s business. ASUR generates revenue from traffic fees charged to airlines, as well as from commercial activity within the airports. We believe a number of secular trends will drive long-term increases in airline passenger growth, including increased incomes and shifting demographics. We expect ASUR will disproportionately benefit from this growth in air travel, given its near-monopolistic position. Beyond fees generated from aeronautical services, we expect ASUR’s commercial activity to provide further upside to revenue growth. The company’s management has demonstrated its ability to increase revenue-per-passenger through subtle but accumulative operational improvements, most recently evidenced in renovations at Cancun International. ASUR is one of the fastest growing and most profitable airport operators globally, and we expect the company to generate sustained above-average earnings growth over the Fund’s investment horizon.
Maruti Suzuki is the leading car manufacturer in India, with approximately 50 percent market share. Over the next decade, we expect Indian auto sales growth to be a powerful secular trend, as consumer incomes rise and road infrastructure improves. Today car ownership rates remain low in both absolute terms and relative to other Emerging Markets, and we believe Maruti should benefit as the market leader. The company has an extensive dealership outlet and service center network, which supplies integrated services for vehicle financing, insurance, training and re-sale. In our view, its large footprint provides convenience and a strong competitive barrier. Maruti also has industry-leading operating income margins, supported by its joint venture with Suzuki Motor Corp., which owns a majority stake in the business. As a result, Maruti is able to leverage Suzuki’s engine technology, which results in a lower-than-average research and development budget. Finally, Maruti is increasing its efforts in higher-priced car segments, including SUVs. We believe this will attract additional consumer segments, cementing the company’s longer-term position. Given our expectations for Maruti’s continued leadership within a growing auto market and stable margins, we believe the company can grow above-average annual revenue and earnings over the Fund’s investment horizon.
Netshoes (Cayman) Ltd. is the leading sports, athletic apparel and lifestyle e-commerce platform in Brazil, with over 70 percent share of online sales in the country. We believe Netshoes has built a compelling competitive moat around its business thanks to powerful technology, leading brands, a high repeat customer base, good supplier relationships and strong distribution capabilities. In our view, the market opportunity is attractive, underpinned by strong secular trends including the emerging middle class consumer, market consolidation and the ongoing shift from brick-and-mortar retail to online. Furthermore, the company’s recently launched Zattini fashion and beauty platform expands Netshoes’s market opportunity beyond the sporting and athletic categories. Longer term, we believe Zattini has the potential to become the leader in the online fashion space through its offering of third-party brands as well as by developing its own private-label fashion brands. We view the company’s strategy as comparable to other leading e-commerce platforms that have experienced success elsewhere in the world. We believe Netshoes’s build-out of Zattini, as well as its expansion into other Latin American markets; will contribute to above-average sustained revenue and earnings growth over the long term.
Sea is a leading internet company that operates three core business units in the Greater Southeast Asia (GSEA) region—Garena, a popular video gaming publishing platform, Shopee, an emerging e-commerce platform, and Airpay, a digital payment service. The GSEA, which includes nearly 600 million inhabitants, benefits from several secular trends—including rising consumer wealth, e-commerce adoption and gaming engagement. We
Management's Discussion of Fund Performance (Unaudited) (Continued)
believe each of these should support strong growth of Sea’s core businesses. First, Garena is the region’s top game publisher (desktop and mobile) in terms of revenue and user base, and is the exclusive regional distributor of popular gaming titles, including Arena of Valor and League of Legends. Along with the large GSEA gaming user base, we believe Sea’s most important competitive advantage is its strategic partnership with Tencent, China’s largest gaming and social media company. Tencent owns approximately 40 percent of Sea, and provides full and exclusive access to its library of top-ranked games. Garena is also the leading regional advocate and organizer of eSports, which are large organized gaming competitions. eSports enhance Garena’s gamer ecosystem and extend the monetization runway. In addition to Garena, we believe Shopee provides an additional long-term growth opportunity. In a short span of two to three years, Shopee has become one of GSEA’s largest e-commerce platforms, and has taken a leadership position in several high-margin and fast-growing categories, including apparel, beauty and fashion. Sea’s third business, Airpay, primarily serves as a payments enabler for its other two businesses, but is also used for everyday expenses such as bills, food delivery and movie tickets. Overall, we believe Sea will generate above-average revenue growth over the Fund’s investment horizon from its core gaming franchise, with additional upside from its e-commerce and payment businesses.
Sunny Optical (Sunny) is the largest integrated optical component manufacturer in China, based on market share. Sunny is positioned at the crossroads of several technology trends, including the increasing complexity of smartphone cameras, proliferation of vehicle cameras and, longer term, emerging applications such as surveillance, drones and machine vision. The company is the leading supplier of high-end compact camera modules for Chinese smartphone manufacturers. We believe continued smartphone innovation—including the shift from one to multiple cameras and 3D sensing—will greatly increase Sunny’s addressable market. Beyond smartphones, Sunny has the highest share in the rapidly growing vehicle lens market, which is expanding with automakers’ race toward advanced driver-assistance systems and autonomous driving. Longer term, we believe Sunny will sustain growth through emerging technologies—including surveillance, drones and machine vision. The company is investing ahead of competitors and leading these markets, which we believe could result in additional upside potential.
During the period, Almarai Co. Ltd., PT Bank Rakyat Indonesia Persero Tbk, Cielo SA, Hikma Pharmaceuticals PLC, Lupin Ltd., Shandong Weigao Group Medical Polymer Co. and Universal Robina Corp. were sold.
Almarai was sold due to ongoing macro pressures that we expect will challenge the business in the near-to-medium term. We will continue to monitor Almarai, as we believe it is the leader in an attractive growth industry, but external factors are hindering progress in its core businesses. Consumer weakness in Saudi Arabia and currency devaluation in Egypt have caused Almarai’s core bakery, dairy and juice businesses to slow, and other geopolitical factors are disrupting its operations in the Gulf Cooperation Council area. These factors also contribute to our view that Almarai’s share price is overvalued, especially relative to other opportunities we are exploring. While we will continue to monitor the company for a pickup in growth, at this time we believe there are more compelling businesses with more favorable prospects.
Bank Rakyat was sold due to increased government regulation of microfinance loans, which account for a large portion of the company’s loan book and earnings. Bank Rakyat’s microfinance leadership was a cornerstone of our investment case, given Indonesia’s high share of small businesses and low credit penetration. However, over the last few years, increasing government involvement has rendered Bank Rakyat’s business—and the Indonesian microfinance industry in general—less attractive. In our view, government-mandated loan disbursements could weaken Bank Rakyat’s lending standards over time, introducing risks from higher default rates. Additionally, Kredit Usaha Rakyat, a government-subsidized microfinance program, eroded Bank Rakyat’s profitability by cannibalizing the company’s core microfinance offering. We continue to view the Indonesian banking sector as one of the best in Emerging Markets. The sector is supported by solid economic growth, relatively low levels of financial penetration and an increasingly urbanized population, and we will seek to gain exposure through a company less reliant on micro lending.
Management's Discussion of Fund Performance (Unaudited) (Continued)
Concerns around the weak macroeconomic environment in Brazil, particularly related to consumer spending, led to the sale of Cielo. The business is Brazil and Latin America’s leading merchant acquirer and payment processor based on market share, and generates the majority of its revenues from fees charged to merchants for accepting credit or debit card payments. While we believe Cielo continues to benefit from its market position and the secular trend of electronic transactions taking share from cash-based payments, the company faces increasing headwinds resulting from Brazil’s weak economy. Consumers are making fewer purchases, leading to slowing transaction growth. We believe the business can no longer rely on other growth drivers, such as receivables discounting. Our research indicates that it could be years before Brazil recovers to a level that would support above-average earnings growth. Given the concentrated nature of the Fund’s strategy and wide opportunity set, we believe there are better opportunities with more favorable growth prospects.
Hikma was sold due to growth sustainability concerns relating to weak industry fundamentals. Hikma has contended with challenges facing most U.S. generic manufacturers over the past two years, including delayed complex generics approvals by the U.S. Food and Drug Administration (FDA), a consolidating customer base and pricing pressure. While we expect Hikma to resume double-digit earnings growth in the next few years, persistent delays with Hikma’s generic version of the asthma drug Advair further obscure the company’s path to recovery. Given the persistent industry headwinds and uncertain business outlook, we believe that there are other opportunities better aligned with our six investment criteria.
Lupin, a leading generic drug company, was sold due to lessening conviction in the recovery of its U.S. business. Lupin derives around 35 percent of its revenue from the U.S., and this business segment faced multiple headwinds over the past two years, including delayed FDA approval for new product launches, price erosion from customer consolidation and, most recently, FDA warning letters issued to two of its major manufacturing facilities. These letters were issued for violation of good manufacturing practices, and mean that FDA approvals for products made in those facilities will probably be greatly delayed until Lupin addresses the FDA’s requirements. We initially expected new product approvals in fiscal 2019 to drive an earnings recovery, but the FDA warning letters now obfuscate the recovery’s timing, and introduce the risk of further earnings cuts. The decision was made to invest in other opportunities with more favorable growth prospects, given the increased uncertainty about Lupin’s recovery, along with persistent industry and regulatory headwinds.
Shandong Weigao Group Medical, one of China’s largest domestic medical device manufacturers, was sold. Despite stable business results, we believe Weigao’s growth has been disrupted in recent years by issues including government reform, industry anti-corruption pressures and, most recently, a reorganization of its sales force. The company’s consumables business, which currently accounts for over 70 percent of revenue, appears to have matured, so we believe it is no longer capable of delivering above-average growth. In addition, we believe management’s recent decision to divest large stakes in its two most attractive business lines, orthopedics and dialysis, will result in diminished growth prospects for Weigao shareholders. At this time, we believe there are other opportunities that are a better fit with our six investment criteria.
Universal Robina, a leading packaged food product company in Southeast Asia, was sold. The company’s core profit engines—the Philippines and Vietnam—face prolonged challenges, while the remainder of the business remains in heavy investment mode. In the Philippines, increased competition and rising input costs continue to slow profit growth. Sales and market share in Vietnam are slowly recovering following a product recall of beverages containing lead, but public distrust lingers. Additionally, although we expect the company’s investments in other Association of Southeast Asian Nations (ASEAN) countries to be profitable, we now think those returns will take much longer to materialize. While we will continue to monitor the company, we believe there are too many external headwinds pressuring Universal Robina’s business results.
Management's Discussion of Fund Performance (Unaudited) (Continued)
Outlook
We seek businesses that are benefiting from structural local demand growth rather than export-driven business models, such as natural resource extraction or low-cost manufacturing. We believe local demand growth is more sustainable because in many developing countries, it is underpinned by long-term secular trends, including increasing productivity, growing discretionary incomes and attractive demographic profiles. When we combine this backdrop with our criteria-driven research, we typically find growth businesses primarily in the Information Technology, Consumer, and Health Care sectors, as well as companies that are building the needed infrastructure to improve productivity and support growth.
Investing globally causes us to be macro aware, even though our investment philosophy and process is fundamental. As such, we remain focused on conditions that have created global imbalances, including distortive central bank policies, demographic shifts, debt and slowing growth. We believe these factors drive corporate and individual decision-making. We monitor these exogenous influences, but remain steadfast in our belief that prices eventually reconnect with fundamentals, and we position the Fund to own franchises we believe will become larger, more profitable, dominant and more valuable over the long term.
We continue to view Emerging Markets as an attractive area for long-term investors and believe the Touchstone Sands Capital Emerging Markets Growth Fund is well positioned to weather the current environment. Emerging Markets have certain attributes that developed markets generally do not, including growing middle classes, increasing demand for healthcare services and expansion of infrastructure that we believe can create attractive areas for investment. Through our in-depth research, we have selected a group of businesses that we believe can sustain above-average growth through a combination of business-specific drivers and powerful secular tailwinds.
We consider macroeconomic influences when making investment decisions, even though they are not the main driver of stock selection. Within Emerging Markets, we believe certain countries are structurally more attractive than others, and the Fund’s positioning reflects our views.
Management's Discussion of Fund Performance (Unaudited) (Continued)
Comparison of the Change in Value of a $10,000 Investment in the Touchstone Sands Capital Emerging Markets Growth Fund - Class Y* and the MSCI Emerging Markets Index

| * | The chart above represents performance of Class Y shares only, which will vary from the performance of Institutional Class shares based on the fees paid by shareholders in the different classes. The inception date of the Fund was May 9, 2014. The returns of the index listed above are based on the inception date of the Fund. |
The performance of the above Fund does not reflect the deduction of taxes that a shareholder would pay on Fund distributions or the redemption of Fund shares.
Notes to Chart
MSCI Emerging Markets Index is a free float-adjusted market capitalization index that is designed to measure equity market performance of emerging markets.
MSCI makes no express or implied warranties or representations and shall have no liability whatsoever with respect to any MSCI data contained herein. The MSCI data may not be further redistributed or used to create indices or financial products. This report is not approved or produced by MSCI.
Management's Discussion of Fund Performance (Unaudited)
Touchstone Small Cap Growth Fund
Sub-Advised by Fiera Capital Inc.
Investment Philosophy
The Touchstone Small Cap Growth Fund invests in a diversified portfolio of common stocks of small-cap growth-oriented companies that are selected for their long-term capital appreciation potential and which are expected to grow faster than the U.S. economy. The core investments of the portfolio include “stable growth” companies which typically provide more stability and consistency in volatile markets. The balance of the portfolio is invested in “emerging growth” companies which typically exhibit more aggressive growth characteristics and may experience positive transformation or a favorable catalyst impacting their long-term growth potential. Fund management uses an approach that combines top-down secular/macro-economic theme analysis with bottom-up security selection.
Fund Performance
The Touchstone Small Cap Growth Fund (Class A Shares) underperformed its benchmark, the Russell 2000® Growth Index, for the 12-month period ended March 31, 2018. The Fund’s total return was 12.05 percent (calculated excluding the maximum sales charge), while the total return of the benchmark was 18.63 percent.
Market Environment
U.S. equities moved higher throughout the 12-month period ended March 31, 2018. The overarching theme during most of the period was low volatility supported by a healthy global economic backdrop. Volatility returned in the last two months of the calendar year as concerns over valuation, the potential impact of higher interest rates and the prospect of a trade war between the U.S. and China dampened investor sentiment.
From a style perspective, Growth outperformed Value across all three market capitalization tiers (small, mid and large) while large capitalization stocks outperformed smaller capitalization stocks. Stocks of low quality companies, as measured by return on equity (ROE), outperformed their higher quality counterparts and companies with negative earnings beat positive earners.
Among sectors, ten of the eleven major groups produced positive gains. As the year progressed, the attempts to repeal and replace Obamacare faded away, which stopped the rotations in and out of the Health Care sector. Returns in the sector were driven by the biotechnology industry, which comprised very few companies with positive earnings. Earnings growth in the Information Technology sector remained strong and is expected to hit double digits for 2018. These growth rates were among the highest of all sectors and forecasted earnings revisions were a tailwind as well. The Energy sector was the only declining sector. The unusual dichotomy of increasing oil prices and negative performance in U.S. Energy stocks seen in 2017 continued in the first quarter of 2018. Weakness in the Energy sector came despite West Texas Intermediate’s (WTI’s) rebound to three year highs and the prognosis for strong earnings growth as the sector rebounds from depressed levels.
Portfolio Review
Given the Fund’s focus on stocks of high quality and profitable companies, the outperformance of lower quality and negative earnings stocks represented a headwind and detracted from performance. Sector allocation and stock selection also detracted from relative performance. The top contributing sectors relative to the benchmark were InformationTechnology, Materials and Real Estate. The largest detracting sectors were Industrials, Consumer Discretionary, Energy and Health Care.
During the 12-month period ended March 31, 2018, the largest five contributors to relative performance were NektarTherapeutics Inc., a research-based biopharmaceutical company, Icon PLC, a clinical research organization that provides outsourced development services to the pharmaceutical, biotechnology and medical device industries
Management's Discussion of Fund Performance (Unaudited) (Continued)
in Ireland, and Chemed Corp., which provides hospice and palliative care services in the U.S. (all three Health Care sector), Grubhub Inc., an online and mobile platform company for restaurant pick-up and delivery orders in the U.S., and Qualys Inc., a cloud-based security and compliance solutions company in the U.S. and internationally (both Information Technology sector). The largest detractors from relative performance were Nutrisystem Inc., a weight management products and services company (Consumer Discretionary sector), Achaogen Inc., a late-stage biopharmaceutical company (Health Care sector), Cirrus Logic Inc., a fabless semiconductor company that develops, manufactures and markets analog and mixed-signal integrated circuits (Information Technology sector), WageWorks Inc., administers consumer-directed benefits and provides corporate tax advantages for employers in the U.S, and Hawaiian Holdings Inc., a company that engages in the scheduled air transportation of passengers and cargo (both Industrials sector).
Given that the current bull market is in its ninth year and leadership tends to shift from small- to large- capitalization stocks as bull markets mature, we decided to tilt the Fund’s portfolio toward larger stocks, albeit those that are still well within the benchmark’s market capitalization parameters.
The Fund’s Information Technology sector holdings were increased, going from underweight relative to the Russell 2000® Growth Index, to being overweight. The Fund’s overweight to the Health Care sector was also increased. In our opinion, these two sectors have a sustainable long-term secular growth profile. Within Health Care, the underweight to biotechnology was slightly reduced. In the Information Technology sector, there was a rotation from semiconductors to software.
The Fund exited the Consumer Staples sector entirely during the period. We believe that the sector is in flux, as rapidly growing e-commerce channels disrupt traditional models. Lackluster earnings growth (relative to other sectors), valuation that is back in line with the longer term average and interest rate sensitivity all continue to trouble the sector. We have also reduced the Fund’s Consumer Discretionary exposure to underweight relative to the benchmark.
Outlook
If the overarching theme of 2017 was a low volatility uptrend, then the first three months of 2018 could hardly have been a starker contrast. Lost in all the market noise is a healthy backdrop for the equity markets. Although some economic readings may have peaked, we believe there is little evidence to suggest the global economy is at risk. In the U.S., economic conditions remain quite healthy, and even the U.S. Federal Reserve Board (Fed) expressed optimism on the economic outlook in a recent Federal Open Market Committee (FOMC) press release. Earnings growth is strong on a global basis as well and we believe valuations for U.S. equities, which at their January peak seemed stretched, have become more favorable after the recent price decline.
We believe China/U.S. geopolitical events present one of the biggest risk to the markets; and it is quite likely that the dispute could drag on for much of the rest of the year, or perhaps until after the U.S. mid-term elections are over and there is more clarity around control over both houses of Congress. We believe this could likely cause higher volatility and a range-bound market for most of the year.
We remain focused on individual, high-quality companies believed to have strong and sustainable organic growth backed by secular trends. Of particular interest are companies on the cutting edge of technology and those that benefit the most from the challenges of uncertainty. Examples include consumer mobility, big data and cloud computing, virtual reality, e-commerce and personalized medicine and genomics. We believe that these areas of long-term potential will be the key drivers in a more normalized market environment.
Management's Discussion of Fund Performance (Unaudited) (Continued)
Comparison of the Change in Value of a $10,000 Investment in the Touchstone Small Cap Growth Fund - Class A* and the Russell 2000® Growth Index

| * | The chart above represents performance of Class A shares only, which will vary from the performance of Class C shares, Class Y shares and Institutional Class shares based on the differences in sales loads and fees paid by shareholders in the different classes. The inception date of Class A shares, Class C shares, Class Y shares and Institutional Class shares was August 13, 2001, August 13, 2001, February 1, 1998 and September 10, 2012, respectively. Class A shares, Class C shares and Institutional Class shares performance information was calculated using the historical performance of Class Y shares for periods prior to August 13, 2001, August 13, 2001 and September 10, 2012, respectively. The returns have been restated for sales loads and fees applicable to Class A, Class C and Institutional Class shares. The returns of the index listed above are based on the inception date of the Fund. |
| ** | The average annual total returns shown above are adjusted for maximum sales loads and fees, if applicable. The maximum offering price per share of Class A shares is equal to the net asset value (“NAV”) per share plus a sales load equal to 6.10% of the NAV (or 5.75% of the offering price). Class C shares are subject to a contingent deferred sales charge (“CDSC”) of 1.00%. The CDSC will be assessed on an amount equal to the lesser of (1) the NAV at the time of purchase of the shares being redeemed or (2) the NAV of such shares being redeemed, if redeemed within a one-year period from the date of purchase. Class Y shares and Institutional Class shares are not subject to sales charges. |
The performance of the above Fund does not reflect the deduction of taxes that a shareholder would pay on Fund distributions or the redemption of Fund shares.
Notes to Chart
Russell 2000® Growth Index measures the performance of those Russell 2000® companies with higher price-to-book ratios and higher forecasted growth values.
The Frank Russell Company (FRC) is the source and owner of the Index data contained or reflected in this material and all trademarks and copyrights related thereto. The material may contain confidential information and unauthorized use, disclosure, copying, dissemination or redistribution is strictly prohibited. This is a Touchstone Investments presentation of the data, and FRC is not responsible for the formatting or configuration of this material or for any inaccuracy in the presentation thereof.
Management's Discussion of Fund Performance (Unaudited)
Touchstone Sustainability and Impact Equity Fund
Sub-Advised by Rockefeller & Co., Inc.
Investment Philosophy
The Touchstone Sustainability and Impact Equity Fund seeks long-term growth of capital. The Fund primarily invests in equity securities of U.S. and non-U.S. companies and generally focuses on larger, more established companies. The Fund selects investments based on an evaluation of a company’s sustainability and impact practices which considers environmental, social and governance (ESG) impacts and risks of a company, how well the company manages these impacts and risks and ascertains the company’s willingness and ability to take a leadership position in implementing best practices.
Fund Performance
The Touchstone Sustainability and Impact Equity Fund (Class A Shares) outperformed its benchmark, the MSCI All Country World Index, for the 12-month period ended March 31, 2018. The Fund’s total return was 15.57 percent (calculated excluding the maximum sales charge), while the total return of the benchmark was 14.85 percent.
Market Environment
Global equity markets posted strong gains for the 12-month period ended March 31, 2018. The returns were driven by a combination of global economic growth and increased corporate profits. Adding to the positive economic environment were the U.S. tax cuts enacted in late 2017, which we believe could also contribute meaningfully to earnings growth. We expect U.S. companies should get a profit boost from these tax cuts alone. Another important factor that boosted global returns for U.S.-based investors was the decline in the U.S. dollar, which experienced a double digit decline against a basket of major currencies, as measured by the DXY (U.S. dollar) Index. More recently, returns stalled which ended with markets slightly down for the first quarter of 2018. We believe investor attention shifted from the positive macro-factors to the thread of tariffs and a potential trade war.
Reflecting the environment of synchronized global growth, the last twelve months was a typical “risk-on” period for stocks, with economically-sensitive sectors among the largest performers. Information Technology, Consumer Discretionary and Financials sectors performed well, while more defensive sectors such as Utilities, Consumer Staples and Telecommunication Services lagged. Continuing the trend of the last several years, growth stocks (especially in Information Technology) outperformed more traditional value stocks.
Portfolio Review
The Fund’s outperformance was broad-based with value added through both sector allocation decisions and positive security selection. The Health Care, Industrials and Consumer Discretionary sectors were key contributors to relative performance during the period, while investments in the Consumer Staples and Materials sectors lagged. Stock selection was particularly strong in the Health Care and Consumer Discretionary sectors, where positions such as Alnylam Pharmaceuticals Inc., Dexcom Inc., Amazon.com Inc. and Sony Corp. all enjoyed solid performance and contributed meaningfully to relative returns. This was partially offset by underperformance in the Materials sector, which was the largest detractor to relative returns. The Fund’s lack of exposure to the mining industry contributed to the weak relative performance in the sector. This is an extractive industry the Fund typically would not own given the potential negative environmental impacts. Within Consumer Staples, the Fund’s largest detractor was CVS Health Corp., which underperformed due to fears regarding Amazon’s potential impact in the sector, as well the recent news of CVS’ proposed acquisition of Aetna Inc. We believe CVS’ merger with Aetna will likely result in a more defensible model, and the Fund continued to hold the stock.
Management's Discussion of Fund Performance (Unaudited) (Continued)
The Fund’s geographic orientation changed throughout the fiscal year. At the beginning of the period, the Fund’s exposure to Europe was increased, which we believed was overly discounting the odds of eurozone fragmentation. We believed European growth was improving and prospects for the Euro were good, and we added to existing holdings and initiated new positions to participate. By the end of the year, however, we shifted back to a more U.S. domestically-focused orientation, as we anticipated U.S. tax cuts being passed could add a significant tailwind to U.S. earnings growth. The Fund was repositioned by adding areas that we believe would benefit most from the tax law changes, such as holdings in banks and other domestically-focused companies like Ross Stores Inc. and Comcast Corp. These investments were funded through sales of low-tax payers such as Oracle Corp. and by taking profits in European and Japanese companies (Orix Corp. and Atlas Copco AB).
Outlook
With the current bull market and the U.S. economic expansion in its ninth year, low-hanging fruits appeared to have already been picked. As such, the Fund strives to find relatively undervalued stocks that may be temporarily out of favor. We believe stocks of some of the domestically focused U.S. companies may benefit due to the lower tax-rate-triggered earnings upgrade. The Fund also continued to have an overweight in the Financials sector. We believe Financials remains one of the most attractive sectors, as it could benefit from the gradual tightening among major central banks. We believe net interest margins for banks could continue to expand, and rising interest rates could also create investment opportunities for insurance companies.
The market correction since February has created a healthier environment as the euphoria and irrational exuberance being experienced appeared to be largely washed away. We believe global growth should remain on the expansion path, and U.S. economic growth will likely surprise on the upside after a softer start in the first quarter of 2018. With S&P 500® Index earnings-per-share (EPS) projected to grow moving forward, we currently view the chances of a more sustained market downturn as low.
Management's Discussion of Fund Performance (Unaudited) (Continued)
Comparison of the Change in Value of a $10,000 Investment in the Touchstone Sustainability and Impact Equity Fund - Class A* and the MSCI All Country World Index
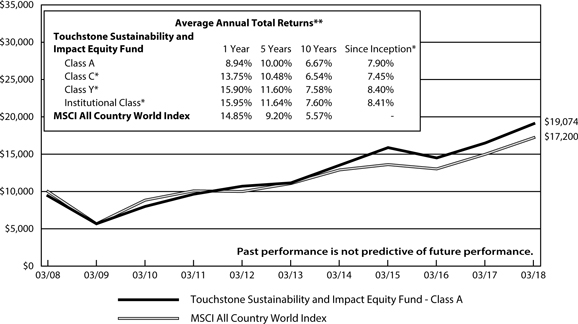
| * | The chart above represents performance of Class A shares only, which will vary from the performance of Class C shares, Class Y shares and Institutional Class shares based on the differences in sales loads and fees paid by shareholders in the different classes. The inception date of Class A shares, Class C shares, Class Y shares and Institutional Class shares was December 19, 1997, October 4, 2003, November 10, 2004 and May 4, 2015, respectively. Class C shares, Class Y shares and Institutional Class shares performance information was calculated using the historical performance of Class A shares for periods prior to October 4, 2003, November 10, 2004 and May 4, 2015, respectively. The returns have been restated for sales loads and fees applicable to Class C, Class Y and Institutional Class shares . The returns of the index listed above are based on the inception date of the Fund. The launch date of the index listed above was after the inception date of the Fund, therefore there is no return for since inception. |
| ** | The average annual total returns shown above are adjusted for maximum sales loads and fees, if applicable. The maximum offering price per share of Class A shares is equal to the net asset value (“NAV”) per share plus a sales load equal to 6.10% of the NAV (or 5.75% of the offering price). Class C shares are subject to a contingent deferred sales charge (“CDSC”) of 1.00%. The CDSC will be assessed on an amount equal to the lesser of (1) the NAV at the time of purchase of the shares being redeemed or (2) the NAV of such shares being redeemed, if redeemed within a one-year period from the date of purchase. Class Y shares and Institutional Class shares are not subject to sales charges. |
The performance of the above Fund does not reflect the deduction of taxes that a shareholder would pay on Fund distributions or the redemption of Fund shares.
Notes to Chart
MSCI All Country World Index measures the equity market performance of developed and emerging markets.
MSCI makes no express or implied warranties or representations and shall have no liability whatsoever with respect to any MSCI data contained herein. The MSCI data may not be further redistributed or used to create indices or financial products. This report is not approved or produced by MSCI.
This page intentionally left blank.
Tabular Presentation of Portfolios of Investments (Unaudited)
March 31, 2018
The tables below provide each Fund’s geographic allocation, sector allocation and/or credit quality. We hope it will be useful to shareholders as it summarizes key information about each Fund’s investments.
| Touchstone Flexible Income Fund |
| Credit Quality* | | (% of Fixed Income Securities) | |
| AAA/Aaa | | | 44.5 | % |
| AA/Aa | | | 3.6 | |
| A/A | | | 14.4 | |
| BBB/Baa | | | 22.6 | |
| BB/Ba | | | 5.2 | |
| B/B | | | 1.2 | |
| Not Rated | | | 8.5 | |
| | | | 100.0 | % |
| | | | | |
| Credit Quality* | | | (% of Preferred Stocks) | |
| A/A | | | 3.7 | % |
| BBB/Baa | | | 49.6 | |
| BB/Ba | | | 41.2 | |
| Not Rated | | | 5.5 | |
| | | | 100.0 | % |
| | | | | |
| Sector Allocation** | | | (% of Net Assets) | |
| Fixed Income Securities | | | 87.4 | % |
| Common Stocks | | | | |
| Real Estate | | | 2.0 | |
| Health Care | | | 0.7 | |
| Utilities | | | 0.5 | |
| Financials | | | 0.5 | |
| Industrials | | | 0.5 | |
| Information Technology | | | 0.4 | |
| Consumer Staples | | | 0.3 | |
| Preferred Stocks | | | 2.7 | |
| Exchange-Traded Funds | | | 1.1 | |
| Commercial Paper | | | 1.0 | |
| Short-Term Investment Fund | | | 1.1 | |
| Other Assets/Liabilities (Net) | | | 1.8 | |
| Total | | | 100.0 | % |
| Touchstone Focused Fund | | | |
| Sector Allocation** | | (% of Net Assets) | |
| Information Technology | | | 26.4 | % |
| Consumer Discretionary | | | 16.5 | |
| Financials | | | 16.1 | |
| Health Care | | | 13.9 | |
| Industrials | | | 8.4 | |
| Real Estate | | | 5.0 | |
| Energy | | | 4.6 | |
| Consumer Staples | | | 3.4 | |
| Telecommunication Services | | | 2.1 | |
| Materials | | | 1.2 | |
| Short-Term Investment Fund | | | 2.4 | |
| Other Assets/Liabilities (Net) | | | 0.0 | |
| Total | | | 100.0 | % |
| Touchstone Growth Opportunities Fund | | | |
| Sector Allocation** | | (% of Net Assets) | |
| Information Technology | | | 37.6 | % |
| Health Care | | | 14.9 | |
| Consumer Discretionary | | | 13.2 | |
| Industrials | | | 13.1 | |
| Financials | | | 6.9 | |
| Energy | | | 4.4 | |
| Materials | | | 4.1 | |
| Consumer Staples | | | 2.9 | |
| Short-Term Investment Fund | | | 3.6 | |
| Other Assets/Liabilities (Net) | | | (0.7 | ) |
| Total | | | 100.0 | % |
* Credit quality ratings are from Standard & Poor's (“S&P”) and Moody's Investors Service (“Moody's”). If agency ratings differ, the higher rating will be used. Where no rating has been assigned, it may be for reasons unrelated to the creditworthiness of the issuer.
** Sector classifications are based upon the Global Industry Classification Standard (GICS®).
Tabular Presentation of Portfolios of Investments (Unaudited) (Continued)
Touchstone International Growth Fund
| Geographic Allocation | | (% of Net Assets) | |
| Common Stocks | | | | |
| France | | | 12.0 | % |
| China | | | 11.3 | |
| Japan | | | 11.2 | |
| Germany | | | 8.5 | |
| Netherlands | | | 7.0 | |
| Canada | | | 5.3 | |
| United Kingdom | | | 4.4 | |
| Singapore | | | 4.3 | |
| Switzerland | | | 4.2 | |
| India | | | 3.7 | |
| Denmark | | | 2.9 | |
| Jersey | | | 2.5 | |
| Taiwan | | | 1.9 | |
| Sweden | | | 1.8 | |
| Ireland | | | 1.8 | |
| Brazil | | | 1.7 | |
| Austria | | | 1.7 | |
| Macau | | | 1.5 | |
| Spain | | | 1.5 | |
| Panama | | | 1.5 | |
| Philippines | | | 1.4 | |
| South Africa | | | 1.2 | |
| Mexico | | | 1.1 | |
| Luxembourg | | | 1.1 | |
| Virgin Islands (British) | | | 1.0 | |
| Short-Term Investment Funds | | | 4.4 | |
| Other Assets/Liabilities (Net) | | | (0.9 | ) |
| Total | | | 100.0 | % |
| Touchstone International Value Fund | |
| Geographic Allocation | | (% of Net Assets) | |
| Common Stocks | | | | |
| Japan | | | 16.0 | % |
| United Kingdom | | | 14.7 | |
| Netherlands | | | 14.3 | |
| Germany | | | 14.1 | |
| France | | | 7.2 | |
| Italy | | | 5.9 | |
| Switzerland | | | 3.9 | |
| Ireland | | | 3.2 | |
| Singapore | | | 2.8 | |
| Colombia | | | 2.7 | |
| Austria | | | 2.3 | |
| Malaysia | | | 2.1 | |
| United States | | | 1.9 | |
| Taiwan | | | 1.9 | |
| Spain | | | 1.9 | |
| Hong Kong | | | 1.6 | |
| Finland | | | 1.6 | |
| Australia | | | 1.5 | |
| Brazil | | | 1.4 | |
| South Korea | | | 1.0 | |
| Short-Term Investment Funds | | | 6.4 | |
| Other Assets/Liabilities (Net) | | | (8.4 | ) |
| Total | | | 100.0 | % |
| Touchstone Mid Cap Growth Fund | |
| Sector Allocation* | | (% of Net Assets) | |
| Information Technology | | | 25.4 | % |
| Industrials | | | 18.9 | |
| Consumer Discretionary | | | 14.8 | |
| Health Care | | | 14.0 | |
| Financials | | | 9.2 | |
| Materials | | | 4.3 | |
| Energy | | | 4.0 | |
| Consumer Staples | | | 3.3 | |
| Real Estate | | | 2.6 | |
| Short-Term Investment Funds | | | 2.9 | |
| Other Assets/Liabilities (Net) | | | 0.6 | |
| Total | | | 100.0 | % |
* Sector classifications are based upon the Global Industry Classification Standard (GICS®).
Tabular Presentation of Portfolios of Investments (Unaudited) (Continued)
| Touchstone Sands Capital Emerging Markets Growth Fund | |
| Geographic Allocation | | (% of Net Assets) | |
| Common Stocks | | | | |
| India | | | 29.6 | % |
| China | | | 21.7 | |
| South Korea | | | 6.5 | |
| South Africa | | | 6.3 | |
| Netherlands | | | 4.5 | |
| Thailand | | | 3.0 | |
| United States | | | 2.8 | |
| Taiwan | | | 2.6 | |
| Macau | | | 2.5 | |
| Philippines | | | 2.4 | |
| Indonesia | | | 2.4 | |
| Brazil | | | 2.4 | |
| Cambodia | | | 1.7 | |
| Virgin Islands (British) | | | 1.7 | |
| Peru | | | 1.6 | |
| Mexico | | | 1.2 | |
| Malaysia | | | 1.1 | |
| Singapore | | | 0.9 | |
| Russia | | | 0.7 | |
| Short-Term Investment Funds | | | 3.9 | |
| Other Assets/Liabilities (Net) | | | 0.5 | |
| Total | | | 100.0 | % |
| Touchstone Small Cap Growth Fund | | | |
| Sector Allocation* | | (% of Net Assets) | |
| Information Technology | | | 26.8 | % |
| Health Care | | | 26.3 | |
| Industrials | | | 13.8 | |
| Consumer Discretionary | | | 11.2 | |
| Financials | | | 9.1 | |
| Materials | | | 5.8 | |
| Real Estate | | | 3.3 | |
| Energy | | | 2.3 | |
| Short-Term Investment Funds | | | 5.7 | |
| Other Assets/Liabilities (Net) | | | (4.3 | ) |
| Total | | | 100.0 | % |
| Touchstone Sustainability and Impact Equity Fund |
| Geographic Allocation | | (% of Net Assets) | |
| Common Stocks | | | | |
| United States | | | 54.9 | % |
| Japan | | | 10.4 | |
| Germany | | | 4.9 | |
| United Kingdom | | | 4.7 | |
| France | | | 3.9 | |
| China | | | 3.2 | |
| Netherlands | | | 3.0 | |
| South Korea | | | 2.4 | |
| Switzerland | | | 1.9 | |
| Jersey | | | 1.8 | |
| Ireland | | | 1.5 | |
| Sweden | | | 1.4 | |
| Liberia | | | 1.1 | |
| Italy | | | 0.9 | |
| Indonesia | | | 0.8 | |
| Mexico | | | 0.7 | |
| India | | | 0.7 | |
| Curacao | | | 0.6 | |
| Belgium | | | 0.6 | |
| Short-Term Investment Funds | | | 1.8 | |
| Other Assets/Liabilities (Net) | | | (1.2 | ) |
| Total | | | 100.0 | % |
* Sector classifications are based upon the Global Industry Classification Standard (GICS®).
Portfolio of Investments
Touchstone Flexible Income Fund – March 31, 2018
| Principal | | | | | Market | |
| Amount | | | | | Value | |
| | | | | | | |
| | | | | Corporate Bonds — 53.8% | | | | |
| | | | | | | | | |
| | | | | Financials — 27.5% | | | | |
| $ | 6,765,000 | | | Aflac, Inc., 2.875%, 10/15/26 | | $ | 6,362,625 | |
| | 2,000,000 | | | Allstate Corp. (The), 5.750%, 8/15/53 | | | 2,095,000 | |
| | 3,210,000 | | | Assurant, Inc., 7.000%, 3/27/48 | | | 3,281,366 | |
| | 12,600,000 | | | Australia & New Zealand Banking Group Ltd./United Kingdom (Australia), 144a, 6.750%(A) | | | 13,387,500 | |
| | 15,200,000 | | | Banco Santander SA (Spain), 6.375%(A) | | | 15,405,595 | |
| | 2,400,000 | | | Bank of America Corp., 5.875%(A) | | | 2,415,140 | |
| | 1,750,000 | | | Bank of America Corp. MTN, 3.248%, 10/21/27 | | | 1,649,405 | |
| | 5,480,000 | | | Bank of New York Mellon Corp. (The), 4.950%(A) | | | 5,610,862 | |
| | 5,975,000 | | | Berkshire Hathaway, Inc., 3.125%, 3/15/26 | | | 5,823,693 | |
| | 7,450,000 | | | BNP Paribas SA (France), 144a, 6.750%(A) | | | 7,813,187 | |
| | 13,602,000 | | | Catlin Insurance Co. Ltd. (Bermuda), 144a, (3M LIBOR +2.975%), 4.714%(A)(B) | | | 13,567,995 | |
| | 7,780,000 | | | Charles Schwab Corp. (The), 4.625%(A) | | | 7,780,000 | |
| | 4,000,000 | | | Chubb INA Holdings, Inc., 3.350%, 5/3/26 | | | 3,934,281 | |
| | 582,000 | | | Citizens Financial Group, Inc., 4.300%, 12/3/25 | | | 588,609 | |
| | 6,000,000 | | | Credit Agricole SA (France), 144a, 8.125%(A) | | | 6,835,128 | |
| | 3,630,000 | | | Dai-ichi Life Insurance Co. Ltd. (The) (Japan), 144a, 7.250%(A) | | | 4,011,150 | |
| | 501,211 | | | Doric Nimrod Air Finance Alpha Ltd. 2012-1 Class B Pass Through Trust (Guernsey), 144a, 6.500%, 5/30/19 | | | 508,535 | |
| | 6,100,000 | | | Duke Realty LP, 3.250%, 6/30/26 | | | 5,848,776 | |
| | 6,250,000 | | | Goldman Sachs Group, Inc. (The), Ser P, 5.000%(A) | | | 6,078,125 | |
| | 6,969,000 | | | Hartford Financial Services Group, Inc. (The), 8.125%, 6/15/38 | | | 7,038,690 | |
| | 850,000 | | | HCP, Inc., 4.000%, 6/1/25 | | | 851,279 | |
| | 2,400,000 | | | HSBC Holdings PLC (United Kingdom), 6.250%(A) | | | 2,454,000 | |
| | 11,550,000 | | | HSBC Holdings PLC (United Kingdom), 6.375%(A) | | | 11,882,062 | |
| | 15,050,000 | | | ING Groep NV (Netherlands), 6.000%(A) | | | 15,426,250 | |
| | 1,050,000 | | | JPMorgan Chase & Co., 2.950%, 10/1/26 | | | 988,062 | |
| | 8,500,000 | | | JPMorgan Chase & Co., Ser I, 7.900%(A) | | | 8,543,350 | |
| | 9,417,000 | | | JPMorgan Chase & Co., Ser Z, 5.300%(A) | | | 9,671,259 | |
| | 427,000 | | | Kemper Corp., 4.350%, 2/15/25 | | | 427,326 | |
| | 4,070,000 | | | Lincoln National Corp., (3M LIBOR +2.358%), 4.242%, 5/17/66(B) | | | 3,928,201 | |
| | 12,550,000 | | | Lloyds Banking Group PLC (United Kingdom), 7.500%(A) | | | 13,601,062 | |
| | 1,045,000 | | | Manulife Financial Corp. (Canada), 4.150%, 3/4/26 | | | 1,060,251 | |
| | 1,300,000 | | | MetLife, Inc., 4.600%, 5/13/46 | | | 1,359,712 | |
| | 6,430,000 | | | MetLife, Inc., Ser C, 5.250%(A) | | | 6,573,003 | |
| | 1,100,000 | | | QBE Insurance Group Ltd., EMTN (Australia), 5.875%, 6/17/46 | | | 1,135,709 | |
| | 13,326,000 | | | Reinsurance Group of America, Inc., (3M LIBOR +2.665%), 4.790%, 12/15/65(B) | | | 13,232,718 | |
| | 1,400,000 | | | Retail Opportunity Investments Partnership LP, 5.000%, 12/15/23 | | | 1,425,471 | |
| | 17,365,000 | | | Royal Bank of Scotland Group PLC (United Kingdom), 7.500%(A) | | | 18,059,600 | |
| | 1,500,000 | | | Simon Property Group LP, 4.250%, 11/30/46 | | | 1,484,961 | |
| | 3,150,000 | | | Societe Generale SA (France), 144a, 6.000%(A) | | | 3,185,469 | |
| | 9,025,000 | | | Societe Generale SA (France), 144a, 7.375%(A) | | | 9,600,344 | |
| | 2,150,000 | | | Travelers Cos., Inc. (The), 3.750%, 5/15/46 | | | 2,048,026 | |
| | 5,000,000 | | | UBS Group AG (Switzerland), 7.125%(A) | | | 5,200,000 | |
| | 7,100,000 | | | US Bancorp, Ser I, 5.125%(A) | | | 7,295,250 | |
| | 2,250,000 | | | Westpac Banking Corp. (Australia) GMTN, 4.322%, 11/23/31 | | | 2,233,306 | |
| | | | | | | | 261,702,333 | |
| | | | | | | | | |
| | | | | Industrials — 7.2% | | | | |
| | 4,300,000 | | | AerCap Global Aviation Trust, 144a, 6.500%, 6/15/45 | | | 4,638,625 | |
| | 542,179 | | | Air Canada 2013-1 Class A Pass Through Trust (Canada), 144a, 4.125%, 5/15/25 | | | 546,842 | |
| | 2,745,000 | | | Asciano Finance Ltd. (Australia), 144a, 5.000%, 4/7/18 | | | 2,745,593 | |
| | 6,140,247 | | | Continental Airlines 2012-2 Class A Pass Through Trust, 4.000%, 10/29/24 | | | 6,247,701 | |
| | 6,760,000 | | | CRH America Finance, Inc., 144a, 3.400%, 5/9/27 | | | 6,475,680 | |
| | 3,651,221 | | | Delta Air Lines 2002-1 Class G-1 Pass Through Trust, 6.718%, 1/2/23 | | | 3,953,177 | |
| | 7,760,000 | | | General Electric Co., Ser D, 5.000%(A) | | | 7,682,400 | |
| | 3,169,533 | | | Hawaiian Airlines 2013-1 Class A Pass Through Certificates, 3.900%, 1/15/26 | | | 3,169,533 | |
| | 7,690,000 | | | John Deere Capital Corp. MTN, 2.800%, 9/8/27 | | | 7,241,860 | |
| | 1,050,000 | | | Lockheed Martin Corp., 3.550%, 1/15/26 | | | 1,041,240 | |
| | 6,665,000 | | | Lockheed Martin Corp., 4.700%, 5/15/46 | | | 7,232,854 | |
| | 4,025,000 | | | Mexico City Airport Trust (Mexico), 144a, 3.875%, 4/30/28 | | | 3,693,420 | |
| | 1,125,000 | | | Northrop Grumman Corp., 3.850%, 4/15/45 | | | 1,050,132 | |
| | 2,327,642 | | | Northwest Airlines 2007-1 Class A Pass Through Trust, 7.027%, 11/1/19 | | | 2,451,473 | |
| | 1,500,000 | | | Owens Corning, 3.400%, 8/15/26 | | | 1,444,663 | |
Touchstone Flexible Income Fund (Continued)
| Principal | | | | | Market | |
| Amount | | | | | Value | |
| | | | | | | |
| | | | | Corporate Bonds — 53.8% (Continued) | | | | |
| | | | | | | | | |
| | | | | Industrials — (Continued) | | | | |
| $ | 3,180,000 | | | Owens Corning, 4.200%, 12/15/22 | | $ | 3,252,972 | |
| | 5,318,318 | | | US Airways 2012-2 Class A Pass Through Trust, 4.625%, 6/3/25 | | | 5,481,590 | |
| | | | | | | | 68,349,755 | |
| | | | | | | | | |
| | | | | Consumer Discretionary — 5.4% | | | | |
| | 7,455,000 | | | Amazon.com, Inc., 144a, 3.150%, 8/22/27 | | | 7,192,916 | |
| | 1,550,000 | | | Anheuser-Busch InBev Finance, Inc., 4.900%, 2/1/46 | | | 1,671,692 | |
| | 2,050,000 | | | Comcast Corp., 2.350%, 1/15/27 | | | 1,840,505 | |
| | 775,000 | | | D.R. Horton, Inc., 4.750%, 2/15/23 | | | 813,205 | |
| | 1,100,000 | | | General Motors Financial Co., Inc., 3.200%, 7/6/21 | | | 1,090,479 | |
| | 1,000,000 | | | General Motors Financial Co., Inc., 5.250%, 3/1/26 | | | 1,056,202 | |
| | 7,020,000 | | | Home Depot, Inc. (The), 4.200%, 4/1/43 | | | 7,259,256 | |
| | 6,680,000 | | | Lennar Corp., 144a, 5.250%, 6/1/26 | | | 6,596,500 | |
| | 6,950,000 | | | McDonald's Corp. MTN, 2.625%, 1/15/22 | | | 6,841,774 | |
| | 1,050,000 | | | McDonald's Corp. MTN, 3.700%, 1/30/26 | | | 1,055,918 | |
| | 1,425,000 | | | Time Warner, Inc., 3.800%, 2/15/27 | | | 1,377,733 | |
| | 5,195,000 | | | Time Warner, Inc., 3.875%, 1/15/26 | | | 5,089,136 | |
| | 9,365,000 | | | Toll Brothers Finance Corp., 4.375%, 4/15/23 | | | 9,283,056 | |
| | | | | | | | 51,168,372 | |
| | | | | | | | | |
| | | | | Energy — 4.1% | | | | |
| | 11,650,000 | | | Andeavor Logistics LP, 6.875%(A) | | | 11,703,881 | |
| | 9,448,000 | | | Boardwalk Pipelines LP, 4.450%, 7/15/27 | | | 9,185,538 | |
| | 14,745,000 | | | Energy Transfer Partners LP, 6.250%(A) | | | 14,109,122 | |
| | 1,500,000 | | | Enterprise Products Operating LLC, Ser D, 4.875%, 8/16/77 | | | 1,471,500 | |
| | 1,500,000 | | | Enterprise Products Operating LLC, Ser E, 5.250%, 8/16/77 | | | 1,458,750 | |
| | 1,225,000 | | | Sabine Pass Liquefaction LLC, 5.625%, 3/1/25 | | | 1,317,907 | |
| | | | | | | | 39,246,698 | |
| | | | | | | | | |
| | | | | Telecommunication Services — 2.4% | | | | |
| | 1,175,000 | | | America Movil SAB de CV (Mexico), 6.125%, 3/30/40 | | | 1,406,932 | |
| | 592,000 | | | AT&T, Inc., 3.800%, 3/15/22 | | | 600,527 | |
| | 9,785,000 | | | AT&T, Inc., 3.900%, 8/14/27 | | | 9,852,365 | |
| | 1,500,000 | | | CBS Corp., 4.000%, 1/15/26 | | | 1,479,863 | |
| | 1,350,000 | | | Cox Communications, Inc., 144a, 3.350%, 9/15/26 | | | 1,285,381 | |
| | 6,603,000 | | | Viacom, Inc., 5.875%, 2/28/57 | | | 6,611,254 | |
| | 1,750,000 | | | Ziggo Secured Finance BV (Netherlands), 144a, 5.500%, 1/15/27 | | | 1,644,492 | |
| | | | | | | | 22,880,814 | |
| | | | | | | | | |
| | | | | Information Technology — 2.4% | | | | |
| | 4,025,000 | | | Alphabet, Inc., 1.998%, 8/15/26 | | | 3,657,421 | |
| | 7,410,000 | | | Applied Materials, Inc., 3.300%, 4/1/27 | | | 7,281,083 | |
| | 1,150,000 | | | KLA-Tencor Corp., 4.650%, 11/1/24 | | | 1,201,090 | |
| | 1,550,000 | | | Microsoft Corp., 2.400%, 8/8/26 | | | 1,442,397 | |
| | 6,680,000 | | | Microsoft Corp., 4.450%, 11/3/45 | | | 7,395,184 | |
| | 1,500,000 | | | QUALCOMM, Inc., 3.450%, 5/20/25 | | | 1,464,663 | |
| | | | | | | | 22,441,838 | |
| | | | | | | | | |
| | | | | Health Care — 1.8% | | | | |
| | 850,000 | | | Abbott Laboratories, 4.900%, 11/30/46 | | | 931,988 | |
| | 1,500,000 | | | Amgen, Inc., 2.600%, 8/19/26 | | | 1,369,572 | |
| | 1,370,000 | | | Cardinal Health, Inc., 4.900%, 9/15/45 | | | 1,401,978 | |
| | 7,160,000 | | | Eli Lilly & Co., 3.100%, 5/15/27 | | | 6,985,941 | |
| | 810,000 | | | Express Scripts Holding Co., 3.400%, 3/1/27 | | | 761,018 | |
| | 1,500,000 | | | Kraft Heinz Foods Co., 4.375%, 6/1/46 | | | 1,375,478 | |
| | 2,090,000 | | | Medtronic, Inc., 3.150%, 3/15/22 | | | 2,093,478 | |
| | 1,350,000 | | | Medtronic, Inc., 3.500%, 3/15/25 | | | 1,349,441 | |
| | 1,500,000 | | | Thermo Fisher Scientific, Inc., 2.950%, 9/19/26 | | | 1,400,285 | |
| | | | | | | | 17,669,179 | |
| | | | | | | | | |
| | | | | Utilities — 1.6% | | | | |
| | 7,190,000 | | | American Water Capital Corp., 2.950%, 9/1/27 | | | 6,826,814 | |
| | 850,000 | | | Electricite de France SA (France), 144a, 3.625%, 10/13/25 | | | 850,404 | |
| | 2,700,000 | | | NextEra Energy Capital Holdings, Inc., (3M LIBOR +2.125%), 4.250%, 6/15/67(B) | | | 2,632,500 | |
| | 1,300,000 | | | NextEra Energy Capital Holdings, Inc., (3M LIBOR +2.068%), 4.376%, 10/1/66(B) | | | 1,270,750 | |
| | 4,001,000 | | | WEC Energy Group, Inc., (3M LIBOR +2.113%), 3.951%, 5/15/67(B) | | | 3,900,975 | |
| | | | | | | | 15,481,443 | |
| | | | | | | | | |
| | | | | Consumer Staples — 1.1% | | | | |
| | 1,520,000 | | | BAT Capital Corp., 144a, 3.557%, 8/15/27 | | | 1,455,912 | |
| | 7,150,000 | | | Kroger Co. (The), 2.650%, 10/15/26 | | | 6,456,027 | |
| | 1,800,000 | | | Lamb Weston Holdings, Inc., 144a, 4.875%, 11/1/26 | | | 1,784,250 | |
| | 1,050,000 | | | Walgreens Boots Alliance, Inc., 3.450%, 6/1/26 | | | 992,151 | |
| | | | | | | | 10,688,340 | |
| | | | | | | | | |
| | | | | Materials — 0.3% | | | | |
| | 1,750,000 | | | Domtar Corp., 6.250%, 9/1/42 | | | 1,850,017 | |
| | 850,000 | | | International Paper Co., 4.400%, 8/15/47 | | | 810,279 | |
| | | | | | | | 2,660,296 | |
| | | | | Total Corporate Bonds | | $ | 512,289,068 | |
Touchstone Flexible Income Fund (Continued)
| Principal | | | | | Market | |
| Amount | | | | | Value | |
| | | | | | | |
| | | | | Asset-Backed Securities — 16.0% | | | | |
| $ | 1,375,000 | | | Ally Master Owner Trust, Ser 2015-3, Class A, 1.630%, 5/15/20 | | $ | 1,373,931 | |
| | 3,961,439 | | | American Homes 4 Rent Trust, Ser 2014-SFR2, Class A, 144a, 3.786%, 10/17/36 | | | 4,050,884 | |
| | 9,931,432 | | | AmeriCredit Automobile Receivables Trust, Ser 2016-2, Class A3, 1.600%, 11/9/20 | | | 9,893,107 | |
| | 9,255,000 | | | Barclays Dryrock Issuance Trust, Ser 2015-2, Class A, 1.560%, 3/15/21 | | | 9,247,684 | |
| | 5,435,000 | | | Cabela's Credit Card Master Note Trust, Ser 2013-1A, Class A, 144a, 2.710%, 2/17/26 | | | 5,357,513 | |
| | 1,873,781 | | | California Republic Auto Receivables Trust, Ser 2014-3, Class A4, 1.790%, 3/16/20 | | | 1,870,333 | |
| | 2,573,380 | | | Capital Auto Receivables Asset Trust, Ser 2016-2, Class A3, 1.460%, 6/22/20 | | | 2,562,315 | |
| | 9,300,000 | | | Capital One Multi-Asset Execution Trust, Ser 2015-A5, Class A5, 1.600%, 5/17/21 | | | 9,278,336 | |
| | 6,500,000 | | | Chase Issuance Trust, Ser 2015-A7, Class A7, 1.620%, 7/15/20 | | | 6,484,960 | |
| | 1,105,000 | | | Chrysler Capital Auto Receivables Trust, Ser 2014-AA, Class D, 144a, 2.640%, 7/15/21 | | | 1,104,238 | |
| | 450,633 | | | Conseco Finance Corp., Ser 1998-4, Class A7, 6.870%, 4/1/30(B)(C) | | | 478,592 | |
| | 1,991,628 | | | Countrywide Asset-Backed Certificates, Ser 2004-8, Class M1, (1M LIBOR +1.050%), 2.922%, 1/25/35(B) | | | 2,000,014 | |
| | 5,797,466 | | | GM Financial Automobile Leasing Trust, Ser 2016-2, Class A3, 1.620%, 9/20/19 | | | 5,775,994 | |
| | 4,330,000 | | | Hyundai Auto Lease Securitization Trust, Ser 2017-C, Class A3, 144a, 2.120%, 2/16/21 | | | 4,289,623 | |
| | 6,700,000 | | | Merrill Lynch Mortgage Investors Trust Series, Ser 2006-FF1, Class M3, (1M LIBOR +0.310%), 2.182%, 8/25/36(B) | | | 6,681,759 | |
| | 576,464 | | | Mid-State Capital Corp. Trust, Ser 2005-1, Class M2, 7.079%, 1/15/40 | | | 628,406 | |
| | 6,017,066 | | | New Residential Mortgage Trust, Ser 2018-1A, Class A1A, 144a, 4.000%, 12/25/57(B)(C) | | | 6,151,730 | |
| | 4,815,000 | | | Newcastle Mortgage Securities Trust, Ser 2006-1, Class M2, (1M LIBOR +0.370%), 2.242%, 3/25/36(B) | | | 4,774,202 | |
| | 5,965,007 | | | Nomura Home Equity Loan, Inc. Home Equity Loan Trust, Ser 2005-FM1, Class M2, (1M LIBOR +0.490%), 2.362%, 5/25/35(B) | | | 5,991,567 | |
| | 2,240,000 | | | Oscar US Funding Trust, Ser 2014-1A, Class A4, 144a, 2.550%, 12/15/21 | | | 2,232,982 | |
| | 3,986,334 | | | Park Place Securities, Inc. Asset-Backed Pass-Through Certificates, Ser 2004-MHQ1, Class M2, (1M LIBOR +1.125%), 2.997%, 12/25/34(B) | | | 4,004,069 | |
| | 3,074,314 | | | Popular ABS Mortgage Pass-Through Trust, Ser 2004-4, Class AV1, (1M LIBOR +0.680%), 2.552%, 9/25/34(B) | | | 3,063,375 | |
| | 2,335,000 | | | RAMP Trust, Ser 2005-EFC5, Class M3, (1M LIBOR +0.690%), 2.562%, 10/25/35(B) | | | 2,277,102 | |
| | 8,455,000 | | | Santander Drive Auto Receivables Trust, Ser 2014-4, Class D, 3.100%, 11/16/20 | | | 8,474,786 | |
| | 7,820,000 | | | Synchrony Credit Card Master Note Trust, Ser 2015-2, Class A, 1.600%, 4/15/21 | | | 7,818,436 | |
| | 296,250 | | | Taco Bell Funding LLC, Ser 2016-1A, Class A2I, 144a, 3.832%, 5/25/46 | | | 297,900 | |
| | 2,642,719 | | | Tax Ease Funding LLC, Ser 2016-1A, Class A, 144a, 3.131%, 6/15/28 | | | 2,628,897 | |
| | 9,324,204 | | | TLF National Tax Lien Trust, Ser 2017-1A, Class A, 144a, 3.090%, 12/15/29 | | | 9,313,255 | |
| | 1,077,464 | | | TLF National Tax Lien Trust, Ser 2017-1A, Class B, 144a, 3.840%, 12/15/29 | | | 1,074,727 | |
| | 5,900,000 | | | Towd Point Mortgage Trust, Ser 2016-1, Class M1, 144a, 3.500%, 2/25/55(B)(C) | | | 5,902,375 | |
| | 15,894,592 | | | Towd Point Mortgage Trust, Ser 2017-6, Class A1, 144a, 2.750%, 10/25/57(B)(C) | | | 15,662,708 | |
| | 1,473,917 | | | Wells Fargo Home Equity Asset-Backed Securities Trust, Ser 2005-4, Class M1, (1M LIBOR +0.460%), 2.332%, 12/25/35(B) | | | 1,475,264 | |
| | | | | Total Asset-Backed Securities | | $ | 152,221,064 | |
| | | | | | | | | |
| | | | | U.S. Treasury Obligations — 6.1% | | | | |
| | 7,420,000 | | | U.S. Treasury Note, 1.375%, 10/31/20 | | | 7,236,239 | |
| | 5,514,200 | | | U.S. Treasury Note, 1.500%, 8/15/26 | | | 5,005,213 | |
| | 3,500,000 | | | U.S. Treasury Note, 1.750%, 5/31/22 | | | 3,394,043 | |
| | 6,880,000 | | | U.S. Treasury Note, 1.875%, 1/31/22 | | | 6,724,125 | |
| | 4,770,000 | | | U.S. Treasury Note, 2.000%, 10/31/21 | | | 4,693,233 | |
| | 3,520,000 | | | United States Treasury Inflation Indexed Bonds, 0.875%, 2/15/47 | | | 3,586,042 | |
| | 27,970,000 | | | United States Treasury Inflation Indexed Note, 0.375%, 1/15/27 | | | 27,955,754 | |
| | | | | Total U.S. Treasury Obligations | | $ | 58,594,649 | |
| | | | | | | | | |
| | | | | Agency Collateralized Mortgage Obligations — 4.1% | | | | |
| | 1,178,107 | | | Fannie Mae REMICs, Ser 2008-60, Class SA, (1M LIBOR +6.500%), 4.629%, 7/25/38(B)(D) | | | 176,944 | |
Touchstone Flexible Income Fund (Continued)
| Principal | | | | | Market | |
| Amount | | | | | Value | |
| | | | | | | |
| | | | | Agency Collateralized Mortgage Obligations — 4.1% (Continued) | | | | |
| $ | 32,522,607 | | | FHLMC Multifamily Structured Pass Through Certificates, Ser K006 Class AX1, 0.963%, 1/25/20(B)(C)(D) | | $ | 467,064 | |
| | 14,707,444 | | | FHLMC Multifamily Structured Pass Through Certificates, Ser K019 Class X1, 1.672%, 3/25/22(B)(C)(D) | | | 802,143 | |
| | 26,318,820 | | | FHLMC Multifamily Structured Pass Through Certificates, Ser K025 Class X1, 0.866%, 10/25/22(B)(C)(D) | | | 849,448 | |
| | 71,063,149 | | | FHLMC Multifamily Structured Pass Through Certificates, Ser K033 Class X1, 0.307%, 7/25/23(B)(C)(D) | | | 1,013,225 | |
| | 111,075,287 | | | FHLMC Multifamily Structured Pass Through Certificates, Ser K036 Class X1, 0.762%, 10/25/23(B)(C)(D) | | | 3,873,784 | |
| | 32,911,350 | | | FHLMC Multifamily Structured Pass Through Certificates, Ser K710 Class X1, 1.731%, 5/25/19(B)(C)(D) | | | 455,723 | |
| | 3,000,000 | | | FREMF Mortgage Trust, Ser 2012-K19, Class B, 144a, 4.033%, 5/25/45(B)(C) | | | 3,030,470 | |
| | 5,730,000 | | | FREMF Mortgage Trust, Ser 2013-K712, Class C, 144a, 3.364%, 5/25/45(B)(C) | | | 5,739,411 | |
| | 5,095,000 | | | FREMF Mortgage Trust, Ser 2013-K713, Class C, 144a, 3.163%, 4/25/46(B)(C) | | | 5,084,639 | |
| | 607,394 | | | GNMA, Ser 2011-83, Class NI, 4.500%, 10/16/37(D) | | | 12,083 | |
| | 7,627,388 | | | GNMA, Ser 2012-147, Class IO, 0.567%, 4/16/54(B)(C)(D) | | | 259,882 | |
| | 29,565,594 | | | GNMA, Ser 2016-110, Class IO, 1.036%, 5/16/58(B)(C)(D) | | | 2,368,151 | |
| | 39,052,092 | | | GNMA, Ser 2016-158, Class IO, 0.909%, 6/16/58(B)(C)(D) | | | 3,002,426 | |
| | 70,375,596 | | | GNMA, Ser 2016-35, Class IO, 0.883%, 3/16/58(B)(C)(D) | | | 5,112,287 | |
| | 43,131,952 | | | GNMA, Ser 2017-76, Class IO, 0.955%, 12/16/56(B)(C)(D) | | | 3,295,734 | |
| | 50,721,295 | | | GNMA, Ser 2017-94, Class IO, 0.658%, 2/16/59(B)(C)(D) | | | 3,211,196 | |
| | | | | Total Agency Collateralized Mortgage Obligations | | $ | 38,754,610 | |
| | | | | | | | | |
| | | | | Non-Agency Collateralized Mortgage Obligations — 3.6% | | | | |
| | 1,339,899 | | | American Home Mortgage Investment Trust, Ser 2004-4, Class 4A, (6M LIBOR +2.000%), 4.211%, 2/25/45(B) | | | 1,365,021 | |
| | 4,245,729 | | | Bear Stearns ALT-A Trust, Ser 2004-12, Class 1M1, (1M LIBOR +0.930%), 2.802%, 1/25/35(B) | | | 4,206,959 | |
| | 101,132 | | | Bear Stearns Asset Backed Securities Trust, Ser 2003-AC7, Class A2, 5.750%, 1/25/34(E) | | | 102,232 | |
| | 6,326,053 | | | Citigroup Mortgage Loan Trust, Inc., Ser 2018-RP1, Class A1, 144a, 2.996%, 9/25/64(B)(C) | | | 6,279,967 | |
| | 1,395,326 | | | GSR Mortgage Loan Trust, Ser 2005-AR4, Class 6A1, 3.520%, 7/25/35(B)(C) | | | 1,404,511 | |
| | 5,338,705 | | | JP Morgan Mortgage Trust, Ser 2014-2, Class 1A1, 144a, 3.000%, 6/25/29(B)(C) | | | 5,317,852 | |
| | 6,617 | | | Merrill Lynch Mortgage Investors Trust, Ser 2003-A1, Class 2A, (12M LIBOR +1.625%), 4.106%, 12/25/32(B) | | | 6,615 | |
| | 5,700,318 | | | Metlife Securitization Trust, Ser 2017-1A, Class A, 144a, 3.000%, 4/25/55(B)(C) | | | 5,658,866 | |
| | 368,755 | | | Morgan Stanley Mortgage Loan Trust, Ser 2004-7AR, Class 2A6, 3.686%, 9/25/34(B)(C) | | | 378,111 | |
| | 4,547,000 | | | Morgan Stanley Mortgage Loan Trust, Ser 2005-5AR, Class 1M1, (1M LIBOR +0.500%), 2.372%, 9/25/35(B) | | | 4,552,888 | |
| | 43,769 | | | RALI Trust, Ser 2004-QS6, Class A1, 5.000%, 5/25/19 | | | 43,609 | |
| | 5,219,022 | | | Sequoia Mortgage Trust, Ser 2013-9, Class B1, 144a, 3.500%, 7/25/43 | | | 5,222,782 | |
| | 130,912 | | | Wells Fargo Mortgage Backed Securities Trust, Ser 2004-X, Class 1A5, 3.681%, 11/25/34(B)(C) | | | 133,548 | |
| | | | | Total Non-Agency Collateralized Mortgage Obligations | | $ | 34,672,961 | |
| | | | | | | | | |
| | | | | U.S. Government Mortgage-Backed Obligations — 1.6% | | | | |
| | 40,962 | | | FHLMC, Pool #972110, (1 Year CMT Rate +2.225%), 3.376%, 10/1/32(B) | | | 42,076 | |
| | 41,654 | | | FHLMC, Pool #G03170, 6.500%, 8/1/37 | | | 46,910 | |
| | 54,604 | | | FHLMC, Pool #G12780, 6.500%, 9/1/22 | | | 57,000 | |
| | 3,505,102 | | | FHLMC, Pool #Q41208, 3.500%, 6/1/46 | | | 3,519,448 | |
| | 91,358 | | | FNMA, Pool #844415, 5.500%, 10/1/35 | | | 100,280 | |
| | 603,038 | | | FNMA, Pool #AB1952, 4.000%, 12/1/40 | | | 625,149 | |
| | 432,295 | | | FNMA, Pool #AB1953, 4.000%, 12/1/40 | | | 447,404 | |
| | 369,756 | | | FNMA, Pool #AB3387, 4.000%, 8/1/41 | | | 382,438 | |
| | 2,136,917 | | | FNMA, Pool #AS7601, 4.000%, 7/1/46 | | | 2,194,433 | |
| | 1,780,070 | | | FNMA, Pool #AS8703, 2.500%, 2/1/32 | | | 1,745,120 | |
| | 1,909,336 | | | FNMA, Pool #BC4492, 4.500%, 12/1/39 | | | 2,016,131 | |
| | 4,111,152 | | | FNMA, Pool #BE4435, 3.000%, 11/1/46 | | | 4,015,490 | |
| | | | | Total U.S. Government Mortgage-Backed Obligations | | $ | 15,191,879 | |
| | | | | | | | | |
| | | | | Sovereign Government Obligations — 1.5% | | | | |
| | 9,625,000 | | | Australia Government Bond (AUD), 2.000%, 12/21/21 | | | 7,341,064 | |
Touchstone Flexible Income Fund (Continued)
| Principal | | | | | Market | |
| Amount | | | | | Value | |
| | | | | | | |
| | | | | Sovereign Government Obligations — 1.5% (Continued) | | | | |
| $ | 8,925,000 | | | Canadian Government Bond (CAD), 0.750%, 8/1/19 | | $ | 6,842,396 | |
| | | | | Total Sovereign Government Obligations | | $ | 14,183,460 | |
| | | | | | | | | |
| | | | | Commercial Mortgage-Backed Security — 0.6% | | | | |
| | 6,020,000 | | | Banc of America Commercial Mortgage Trust, Ser 2015-UBS7, Class A4, 3.705%, 9/15/48 | | | 6,102,408 | |
| | | | | | | | | |
| | | | | U.S. Government Agency Obligation — 0.1% | | | | |
| | 1,500,000 | | | FHLMC, 2.375%, 1/13/22 | | | 1,489,335 | |
| Shares | | | | | | |
| | | | | | | |
| | | | | Common Stocks — 4.9% | | | | |
| | | | | | | | | |
| | | | | Real Estate — 2.0% | | | | |
| | 73,196 | | | Crown Castle International Corp. REIT | | | 8,023,014 | |
| | 18,347 | | | Digital Realty Trust, Inc. REIT | | | 1,933,407 | |
| | 236,493 | | | MGM Growth Properties LLC - Class A, REIT | | | 6,276,524 | |
| | 39,089 | | | Prologis, Inc. REIT | | | 2,462,216 | |
| | | | | | | | 18,695,161 | |
| | | | | | | | | |
| | | | | Health Care — 0.7% | | | | |
| | 39,673 | | | Abbott Laboratories | | | 2,377,206 | |
| | 9,654 | | | Stryker Corp. | | | 1,553,522 | |
| | 11,625 | | | UnitedHealth Group, Inc. | | | 2,487,750 | |
| | | | | | | | 6,418,478 | |
| | | | | | | | | |
| | | | | Utilities — 0.5% | | | | |
| | 38,441 | | | Dominion Energy, Inc. | | | 2,592,077 | |
| | 15,921 | | | NextEra Energy, Inc. | | | 2,600,377 | |
| | | | | | | | 5,192,454 | |
| | | | | | | | | |
| | | | | Financials — 0.5% | | | | |
| | 113,146 | | | AGNC Investment Corp. | | | 2,140,722 | |
| | 14,443 | | | CME Group, Inc. | | | 2,336,011 | |
| | | | | | | | 4,476,733 | |
| | | | | | | | | |
| | | | | Industrials — 0.5% | | | | |
| | 37,077 | | | Fastenal Co. | | | 2,024,033 | |
| | 11,082 | | | Raytheon Co. | | | 2,391,717 | |
| | | | | | | | 4,415,750 | |
| | | | | | | | | |
| | | | | Information Technology — 0.4% | | | | |
| | 20,779 | | | Texas Instruments, Inc. | | | 2,158,730 | |
| | 14,664 | | | Visa, Inc. - Class A | | | 1,754,108 | |
| | | | | | | | 3,912,838 | |
| | | | | | | | | |
| | | | | Consumer Staples — 0.3% | | | | |
| | 21,965 | | | Estee Lauder Cos., Inc. (The) - Class A | | | 3,288,600 | |
| | | | | Total Common Stocks | | $ | 46,400,014 | |
| | | | | | | | | |
| | | | | Preferred Stocks — 2.7% | | | | |
| | | | | | | | | |
| | | | | Financials — 2.0% | | | | |
| | 110,000 | | | AGNC Investment Corp., Ser C, 7.000%(A) | | | 2,802,800 | |
| | 200,875 | | | Chimera Investment Corp., Ser B, 8.000%(A) | | | 5,102,225 | |
| | 59,650 | | | CoBank ACB, Ser H, 6.200%(A) | | | 6,501,850 | |
| | 120,000 | | | Two Harbors Investment Corp., Ser.B, 7.625%(A) | | | 3,022,800 | |
| | 80,612 | | | WR Berkley Corp., 5.750%, 6/1/56 | | | 2,027,392 | |
| | | | | | | | 19,457,067 | |
| | | | | | | | | |
| | | | | Industrials — 0.4% | | | | |
| | 139,438 | | | Seaspan Corp. (Marshall Islands), 6.375%, 4/30/19 | | | 3,547,303 | |
| | | | | | | | | |
| | | | | Consumer Staples — 0.3% | | | | |
| | 103,723 | | | CHS, Inc., Ser 3, 6.750%(A) | | | 2,793,260 | |
| | | | | Total Preferred Stocks | | $ | 25,797,630 | |
| | | | | | | | | |
| | | | | Exchange-Traded Funds — 1.1% | | | | |
| | 54,785 | | | iShares MSCI Japan ETF | | | 3,324,354 | |
| | 310,406 | | | VanEck Vectors Gold Miners ETF | | | 6,822,724 | |
| | | | | Total Exchange-Traded Funds | | $ | 10,147,078 | |
| Principal | | | | | | |
| Amount | | | | | | |
| | | | | | | |
| | | | | Commercial Paper — 1.0% | | | | |
| $ | 9,700,000 | | | Toyota Motor Credit Corp., 2.034%, 06/25/18(F) | | $ | 9,646,627 | |
| Shares | | | | | | |
| | | | | | | |
| | | | | Short-Term Investment Fund — 1.1% | | | | |
| | 10,248,745 | | | Dreyfus Government Cash Management, Institutional Shares, 1.54%∞Ω | | | 10,248,745 | |
| | | | | | | | | |
| Total Investment Securities —98.2% | | $ | 935,739,528 | |
| (Cost $933,990,877) | | | | |
| | | | | | | | | |
| Other Assets in Excess of Liabilities — 1.8% | | | 16,939,524 | |
| | | | | | | | | |
| Net Assets — 100.0% | | $ | 952,679,052 | |
| (A) | Perpetual Bond - A bond with no definite maturity date. |
| (B) | Variable rate security - Rate reflected is the rate in effect as of March 31, 2018. |
| (C) | Certain variable rate securities are not based on a published reference rate and spread but are determined by the issuer or agent and are based on current market conditions. These securities do not indicate a reference rate and spread in their description. |
Touchstone Flexible Income Fund (Continued)
| (D) | Interest only security - This type of security represents the right to receive the monthly interest payments on an underlying pool of mortgages. Payments of principal on the pool reduce the value of the “interest only” holding. |
| (E) | Step Bond - A bond that pays an initial interest rate for the first period and then a higher interest rate for the following periods until maturity. The interest rate shown reflects the rate in effect as of March 31, 2018. |
| (F) | Rate reflects yield at the time of purchase. |
| W | Represents the 7-day SEC yield as of March 31, 2018. |
Portfolio Abbreviations:
AUD - Australian Dollar
CAD - Canadian Dollar
CMT - Constant Maturity Treasury
EMTN - Euro Medium Term Note
ETF - Exchange-Traded Fund
FHLMC - Federal Home Loan Mortgage Corporation
FNMA - Federal National Mortgage Association
FREMF - Finnish Real Estate Management Federation
GMTN - Global Medium Term Note
GNMA - Government National Mortgage Association
JPY - Japanese Yen
LIBOR - London Interbank Offered Rate
LLC - Limited Liability Company
LP - Limited Partnership
MTN - Medium Term Note
PLC - Public Limited Company
REIT - Real Estate Investment Trust
REMIC - Real Estate Mortgage Investment Conduit
TRY - Turkish Lira
USD - United States Dollar
144a - This is a restricted security that was sold in a transaction qualifying for the exemption under Rule 144a of the Securities Act of 1933. This security may be sold in transactions exempt from registration, normally to qualified institutional buyers. At March 31, 2018, these securities were valued at $192,220,142 or 20.2% of net assets. These securities were deemed liquid pursuant to procedures approved by the Board of Trustees.
Other Information:
The inputs or methodology used for valuing securities may not be an indication of the risk associated with investing in those securities. For more information on valuation inputs, and their aggregation into the levels used in the table below, please refer to the security valuation section in the accompanying Notes to Financial Statements.
Valuation inputs at Reporting Date:
| Description | | Level 1 | | | Level 2 | | | Level 3 | | | Total | |
| Assets: | | | | | | | | | | | | | | | | |
| Long Positions | | | | | | | | | | | | | | | | |
| Corporate Bonds | | $ | — | | | $ | 512,289,068 | | | $ | — | | | $ | 512,289,068 | |
| Asset-Backed Securities | | | — | | | | 152,221,064 | | | | — | | | | 152,221,064 | |
| U.S. Treasury Obligations | | | — | | | | 58,594,649 | | | | — | | | | 58,594,649 | |
| Agency Collateralized Mortgage Obligations | | | — | | | | 38,754,610 | | | | — | | | | 38,754,610 | |
| Non-Agency Collateralized Mortgage Obligations | | | — | | | | 34,672,961 | | | | — | | | | 34,672,961 | |
| U.S. Government Mortgage-Backed Obligations | | | — | | | | 15,191,879 | | | | — | | | | 15,191,879 | |
| Sovereign Government Obligations | | | — | | | | 14,183,460 | | | | — | | | | 14,183,460 | |
| Commercial Mortgage-Backed Security | | | — | | | | 6,102,408 | | | | — | | | | 6,102,408 | |
| U.S. Government Agency Obligation | | | — | | | | 1,489,335 | | | | — | | | | 1,489,335 | |
Touchstone Flexible Income Fund (Continued)
Valuation inputs at Reporting Date:
| Description | | Level 1 | | | Level 2 | | | Level 3 | | | Total | |
| Common Stocks | | | 46,400,014 | | | | — | | | | — | | | | 46,400,014 | |
| Preferred Stocks | | $ | 25,797,630 | | | $ | — | | | $ | — | | | $ | 25,797,630 | |
| Exchange-Traded Funds | | | 10,147,078 | | | | — | | | | — | | | | 10,147,078 | |
| Commercial Paper | | | — | | | | 9,646,627 | | | | — | | | | 9,646,627 | |
| Short-Term Investment Fund | | | 10,248,745 | | | | — | | | | — | | | | 10,248,745 | |
| Other Financial Instruments*** | | | | | | | | | | | | | | | | |
| Forward Foreign Currency Contracts | | | — | | | | 571,421 | | | | — | | | | 571,421 | |
| Futures Equity Contracts | | | 347,910 | | | | — | | | | — | | | | 347,910 | |
| Total Assets | | $ | 92,941,377 | | | $ | 843,717,482 | | | $ | — | | | $ | 936,658,859 | |
Valuation inputs at Reporting Date:
| Description | | Level 1 | | | Level 2 | | | Level 3 | | | Total | |
| Liabilities: | | | | | | | | | | | | | | | | |
| Other Financial Instruments*** | | | | | | | | | | | | | | | | |
| Forward Foreign Currency Contracts | | $ | — | | | $ | (37,213 | ) | | $ | — | | | $ | (37,213 | ) |
| Futures Interest Rate Contracts | | | (343,810 | ) | | | — | | | | — | | | | (343,810 | ) |
| Total Liabilities | | $ | (343,810 | ) | | $ | (37,213 | ) | | $ | — | | | $ | (381,023 | ) |
| Total | | $ | 92,597,567 | | | $ | 843,680,269 | | | $ | — | | | $ | 936,277,836 | |
*** Other Financial Instruments are derivative instruments not reflected in total investments. Amounts shown represent unrealized appreciation (depreciation) on forward foreign currency contracts, futures equity contracts and futures interest rate contracts.
Futures Contracts
At March 31, 2018, $6,012,362 was segregated with the broker as collateral for futures contracts. The Fund had the following futures contracts, brokered by Wells Fargo, open at March 31, 2018:
| | | | | | | | | | Value and | |
| | | | | | | | | | Unrealized | |
| | | | | Number of | | Notional | | | Appreciation/ | |
| Description | | Expiration Date | | Contracts | | Amount | | | (Depreciation) | |
| Short Futures: | | | | | | | | | | | | |
| Euro-Bund Futures | | 06/11/2018 | | 124 | | $ | 24,004,424 | | | $ | (320,756 | ) |
| 10-Year JGB Futures | | 06/20/2018 | | 7 | | | 9,900,822 | | | | (23,054 | ) |
| | | | | | | | | | | $ | (343,810 | ) |
| Long Futures: | | | | | | | | | | | | |
| CBOE Volatility Index Futures | | 06/20/2018 | | 225 | | | 3,887,715 | | | | 347,910 | |
| | | | | | | | | | | $ | 4,100 | |
Forward Foreign Currency Contracts
| | | | | | | | | | | Unrealized | |
| | | | | Contract to | | | Appreciation/ | |
| Counterparty | | Expiration Date | | Receive | | | Deliver | | | (Depreciation) | |
| Morgan Stanley | | 04/20/2018 | | JPY | 1,856,209,930 | | | USD | 17,506,115 | | | $ | (37,213 | ) |
| Morgan Stanley | | 04/20/2018 | | USD | 17,338,090 | | | AUD | 21,990,276 | | | | 448,300 | |
| Morgan Stanley | | 04/20/2018 | | USD | 9,527,501 | | | TRY | 37,350,406 | | | | 123,121 | |
| | | | | | | | | | | | | $ | 534,208 | |
See accompanying Notes to Financial Statements.
Portfolio of Investments
Touchstone Focused Fund – March 31, 2018
| | | | | | Market | |
| | | Shares | | | Value | |
| | | | | | | |
| Common Stocks — 97.6% | | | | | | | | |
| | | | | | | | | |
| Information Technology — 26.4% | | | | | | | | |
| Alphabet, Inc. - Class A* | | | 16,581 | | | $ | 17,196,818 | |
| Alphabet, Inc. - Class C* | | | 34,961 | | | | 36,072,410 | |
| Apple, Inc. | | | 302,220 | | | | 50,706,472 | |
| Avnet, Inc. | | | 502,467 | | | | 20,983,022 | |
| Cisco Systems, Inc. | | | 503,460 | | | | 21,593,399 | |
| Facebook, Inc. - Class A* | | | 232,753 | | | | 37,191,602 | |
| International Business Machines Corp. | | | 136,647 | | | | 20,965,749 | |
| Microsoft Corp. | | | 562,313 | | | | 51,322,308 | |
| Oracle Corp. | | | 662,854 | | | | 30,325,571 | |
| salesforce.com, Inc.* | | | 274,288 | | | | 31,899,694 | |
| | | | | | | | 318,257,045 | |
| | | | | | | | | |
| Consumer Discretionary — 16.5% | | | | | | | | |
| Amazon.com, Inc.* | | | 41,166 | | | | 59,581,198 | |
| Booking Holdings, Inc.* | | | 16,032 | | | | 33,352,812 | |
| Carnival Corp. (Panama) | | | 394,191 | | | | 25,851,046 | |
| Comcast Corp. - Class A | | | 658,008 | | | | 22,484,133 | |
| Starbucks Corp. | | | 278,413 | | | | 16,117,329 | |
| Twenty-First Century Fox, Inc. - Class A | | | 744,051 | | | | 27,299,231 | |
| Yum China Holdings, Inc. | | | 331,871 | | | | 13,772,647 | |
| | | | | | | | 198,458,396 | |
| | | | | | | | | |
| Financials — 16.1% | | | | | | | | |
| Bank of America Corp. | | | 987,717 | | | | 29,621,633 | |
| Bank of the Ozarks | | | 280,771 | | | | 13,552,816 | |
| Berkshire Hathaway, Inc. - Class B* | | | 525,001 | | | | 104,727,199 | |
| Goldman Sachs Group, Inc. (The) | | | 116,068 | | | | 29,232,886 | |
| Signature Bank/NewYork NY* | | | 119,413 | | | | 16,950,675 | |
| | | | | | | | 194,085,209 | |
| | | | | | | | | |
| Health Care — 13.9% | | | | | | | | |
| Biogen, Inc.* | | | 98,763 | | | | 27,043,285 | |
| Bio-Rad Laboratories, Inc. - Class A* | | | 102,154 | | | | 25,546,672 | |
| Bristol-Myers Squibb Co. | | | 639,535 | | | | 40,450,589 | |
| Johnson & Johnson | | | 246,337 | | | | 31,568,087 | |
| Novartis AG ADR | | | 526,559 | | | | 42,572,295 | |
| | | | | | | | 167,180,928 | |
| | | | | | | | | |
| Industrials — 8.4% | | | | | | | | |
| General Electric Co. | | | 1,010,529 | | | | 13,621,931 | |
| Johnson Controls International PLC (Ireland) | | | 460,913 | | | | 16,242,574 | |
| Stericycle, Inc.* | | | 295,974 | | | | 17,323,358 | |
| Union Pacific Corp. | | | 170,804 | | | | 22,961,182 | |
| United Technologies Corp. | | | 245,112 | | | | 30,839,992 | |
| | | | | | | | 100,989,037 | |
| | | | | | | | | |
| Real Estate — 5.0% | | | | | | | | |
| Jones Lang LaSalle, Inc. | | | 181,925 | | | | 31,771,382 | |
| Simon Property Group, Inc. REIT | | | 180,048 | | | | 27,790,409 | |
| | | | | | | | 59,561,791 | |
| | | | | | | | | |
| Energy — 4.6% | | | | | | | | |
| Exxon Mobil Corp. | | | 225,353 | | | | 16,813,587 | |
| Halliburton Co. | | | 411,813 | | | | 19,330,502 | |
| Schlumberger Ltd. (Curacao) | | | 302,165 | | | | 19,574,249 | |
| | | | | | | | 55,718,338 | |
| | | | | | | | | |
| Consumer Staples — 3.4% | | | | | | | | |
| JM Smucker Co. (The) | | | 92,171 | | | | 11,430,126 | |
| Mondelez International, Inc. - Class A | | | 254,641 | | | | 10,626,169 | |
| Unilever NV (Netherlands) | | | 332,618 | | | | 18,756,329 | |
| | | | | | | | 40,812,624 | |
| | | | | | | | | |
| Telecommunication Services — 2.1% | | | | | | | | |
| AT&T, Inc. | | | 703,381 | | | | 25,075,533 | |
| | | | | | | | | |
| Materials — 1.2% | | | | | | | | |
| Nutrien Ltd. (Canada) | | | 303,996 | | | | 14,366,851 | |
| Total Common Stocks | | | | | | $ | 1,174,505,752 | |
| | | | | | | | | |
| Short-Term Investment Fund — 2.4% | | | | | | | | |
| Dreyfus Government Cash Management, Institutional Shares, 1.54%∞Ω | | | 29,180,563 | | | | 29,180,563 | |
| | | | | | | | | |
| Total Investment Securities —100.0% | | | | | | | | |
| (Cost $900,895,689) | | | | | | $ | 1,203,686,315 | |
| | | | | | | | | |
| Other Assets in Excess of Liabilities — 0.0% | | | | | | | 131,431 | |
| | | | | | | | | |
| Net Assets — 100.0% | | | | | | $ | 1,203,817,746 | |
| * | Non-income producing security. |
| Ω | Represents the 7-day SEC yield as of March 31, 2018. |
Portfolio Abbreviations:
ADR - American Depositary Receipt
PLC - Public Limited Company
REIT - Real Estate Investment Trust
Touchstone Focused Fund (Continued)
Other Information:
The inputs or methodology used for valuing securities may not be an indication of the risk associated with investing in those securities. For more information on valuation inputs, and their aggregation into the levels used in the table below, please refer to the security valuation section in the accompanying Notes to Financial Statements.
Valuation inputs at Reporting Date:
| Description | | Level 1 | | | Level 2 | | | Level 3 | | | Total | |
| Common Stocks | | $ | 1,174,505,752 | | | $ | — | | | $ | — | | | $ | 1,174,505,752 | |
| Short-Term Investment Fund | | | 29,180,563 | | | | — | | | | — | | | | 29,180,563 | |
| Total | | $ | 1,203,686,315 | | | $ | — | | | $ | — | | | $ | 1,203,686,315 | |
See accompanying Notes to Financial Statements.
Portfolio of Investments
Touchstone Growth Opportunities Fund – March 31, 2018
| | | | | | Market | |
| | | Shares | | | Value | |
| | | | | | | |
| Common Stocks — 97.1% | | | | | | | | |
| | | | | | | | | |
| Information Technology — 37.6% | | | | | | | | |
| Adobe Systems, Inc.* | | | 11,960 | | | $ | 2,584,317 | |
| Alibaba Group Holding Ltd. ADR* | | | 14,965 | | | | 2,746,676 | |
| Alphabet, Inc. - Class A* | | | 6,148 | | | | 6,376,337 | |
| Alphabet, Inc. - Class C* | | | 8,055 | | | | 8,311,068 | |
| Apple, Inc. | | | 79,925 | | | | 13,409,817 | |
| Broadcom Ltd. (Singapore) | | | 18,400 | | | | 4,335,960 | |
| Cognizant Technology Solutions Corp. - Class A | | | 56,050 | | | | 4,512,025 | |
| Facebook, Inc. - Class A* | | | 60,860 | | | | 9,724,819 | |
| FleetCor Technologies, Inc.* | | | 14,385 | | | | 2,912,963 | |
| International Business Machines Corp. | | | 22,100 | | | | 3,390,803 | |
| Lam Research Corp. | | | 21,970 | | | | 4,463,425 | |
| Micron Technology, Inc.* | | | 51,100 | | | | 2,664,354 | |
| Microsoft Corp. | | | 117,570 | | | | 10,730,614 | |
| Red Hat, Inc.* | | | 27,950 | | | | 4,178,805 | |
| salesforce.com, Inc.* | | | 38,640 | | | | 4,493,832 | |
| ServiceNow, Inc.* | | | 23,050 | | | | 3,813,622 | |
| Visa, Inc. - Class A | | | 91,870 | | | | 10,989,489 | |
| Worldpay, Inc. - Class A* | | | 77,610 | | | | 6,382,646 | |
| | | | | | | | 106,021,572 | |
| | | | | | | | | |
| Health Care — 14.9% | | | | | | | | |
| Abbott Laboratories | | | 72,380 | | | | 4,337,010 | |
| Biogen, Inc.* | | | 12,671 | | | | 3,469,573 | |
| Celgene Corp.* | | | 54,015 | | | | 4,818,678 | |
| Cooper Cos., Inc. (The) | | | 15,440 | | | | 3,532,826 | |
| Jazz Pharmaceuticals PLC (Ireland)* | | | 26,735 | | | | 4,036,718 | |
| Masimo Corp.* | | | 34,180 | | | | 3,006,131 | |
| Medicines Co. (The)* | | | 85,480 | | | | 2,815,711 | |
| STERIS PLC (United Kingdom) | | | 49,830 | | | | 4,652,129 | |
| UnitedHealth Group, Inc. | | | 27,909 | | | | 5,972,526 | |
| Vertex Pharmaceuticals, Inc.* | | | 32,170 | | | | 5,243,067 | |
| | | | | | | | 41,884,369 | |
| | | | | | | | | |
| Consumer Discretionary — 13.2% | | | | | | | | |
| Amazon.com, Inc.* | | | 8,421 | | | | 12,188,050 | |
| Aramark | | | 110,530 | | | | 4,372,567 | |
| Delphi Technologies PLC (Jersey) | | | 71,890 | | | | 3,425,559 | |
| Dollar Tree, Inc.* | | | 39,140 | | | | 3,714,386 | |
| Home Depot, Inc. (The) | | | 34,575 | | | | 6,162,648 | |
| Marriott International, Inc. - Class A | | | 31,630 | | | | 4,301,047 | |
| TopBuild Corp.* | | | 39,469 | | | | 3,020,168 | |
| | | | | | | | 37,184,425 | |
| | | | | | | | | |
| Industrials — 13.1% | | | | | | | | |
| AMETEK, Inc. | | | 76,940 | | | | 5,845,132 | |
| Boeing Co. (The) | | | 16,176 | | | | 5,303,787 | |
| Ferguson PLC ADR | | | 478,910 | | | | 3,627,743 | |
| Illinois Tool Works, Inc. | | | 23,930 | | | | 3,748,874 | |
| Ingersoll-Rand PLC, (Ireland) | | | 60,200 | | | | 5,147,702 | |
| Union Pacific Corp. | | | 43,780 | | | | 5,885,345 | |
| United Continental Holdings, Inc.* | | | 51,906 | | | | 3,605,910 | |
| Univar, Inc.* | | | 132,740 | | | | 3,683,535 | |
| | | | | | | | 36,848,028 | |
| | | | | | | | | |
| Financials — 6.9% | | | | | | | | |
| Bank of America Corp. | | | 132,680 | | | | 3,979,073 | |
| CME Group, Inc. | | | 23,880 | | | | 3,862,351 | |
| Essent Group Ltd. (Bermuda)* | | | 79,600 | | | | 3,387,776 | |
| S&P Global, Inc. | | | 20,560 | | | | 3,928,194 | |
| Western Alliance Bancorp* | | | 76,360 | | | | 4,437,280 | |
| | | | | | | | 19,594,674 | |
| | | | | | | | | |
| Energy — 4.4% | | | | | | | | |
| Andeavor | | | 40,930 | | | | 4,115,921 | |
| EOG Resources, Inc. | | | 36,900 | | | | 3,884,463 | |
| RSP Permian, Inc.* | | | 94,850 | | | | 4,446,568 | |
| | | | | | | | 12,446,952 | |
| | | | | | | | | |
| Materials — 4.1% | | | | | | | | |
| Berry Global Group, Inc.* | | | 54,395 | | | | 2,981,390 | |
| DowDuPont, Inc. | | | 72,720 | | | | 4,632,991 | |
| Summit Materials, Inc. - Class A* | | | 135,193 | | | | 4,093,644 | |
| | | | | | | | 11,708,025 | |
| | | | | | | | | |
| Consumer Staples — 2.9% | | | | | | | | |
| Constellation Brands, Inc. - Class A | | | 21,520 | | | | 4,904,838 | |
| Philip Morris International, Inc. | | | 32,980 | | | | 3,278,212 | |
| | | | | | | | 8,183,050 | |
| Total Common Stocks | | | | | | $ | 273,871,095 | |
| | | | | | | | | |
| Short-Term Investment Fund — 3.6% | | | | | | | | |
| Dreyfus Government Cash Management, Institutional Shares, 1.54%∞Ω | | | 9,988,985 | | | | 9,988,985 | |
| | | | | | | | | |
| Total Investment Securities —100.7% | | | | | | | | |
| (Cost $222,246,379) | | | | | | $ | 283,860,080 | |
| | | | | | | | | |
| Liabilities in Excess of Other Assets — (0.7%) | | | | | | | (1,895,439 | ) |
| | | | | | | | | |
| Net Assets — 100.0% | | | | | | $ | 281,964,641 | |
| * | Non-income producing security. |
| Ω | Represents the 7-day SEC yield as of March 31, 2018. |
Portfolio Abbreviations:
ADR - American Depositary Receipt
PLC - Public Limited Company
Touchstone Growth Opportunities Fund (Continued)
Other Information:
The inputs or methodology used for valuing securities may not be an indication of the risk associated with investing in those securities. For more information on valuation inputs, and their aggregation into the levels used in the table below, please refer to the security valuation section in the accompanying Notes to Financial Statements.
Valuation inputs at Reporting Date:
| Description | | Level 1 | | | Level 2 | | | Level 3 | | | Total | |
| Common Stocks | | $ | 273,871,095 | | | $ | — | | | $ | — | | | $ | 273,871,095 | |
| Short-Term Investment Fund | | | 9,988,985 | | | | — | | | | — | | | | 9,988,985 | |
| Total | | $ | 283,860,080 | | | $ | — | | | $ | — | | | $ | 283,860,080 | |
See accompanying Notes to Financial Statements.
Portfolio of Investments
Touchstone International Growth Fund – March 31, 2018
| | | | | | Market | |
| | | Shares | | | Value | |
| | | | | | | |
| Common Stocks — 96.5% | | | | | | | | |
| | | | | | | | | |
| France — 12.0% | | | | | | | | |
| | | | | | | | | |
| Consumer Discretionary — 2.4% | | | | | | | | |
| LVMH Moet Hennessy Louis Vuitton SE ADR | | | 5,960 | | | $ | 367,434 | |
| | | | | | | | | |
| Consumer Staples — 3.8% | | | | | | | | |
| L'Oreal SA ADR | | | 5,275 | | | | 238,140 | |
| Remy Cointreau SA ADR | | | 23,789 | | | | 343,751 | |
| | | | | | | | | |
| Financials — 1.6% | | | | | | | | |
| BNP Paribas SA ADR | | | 6,593 | | | | 245,556 | |
| | | | | | | | | |
| Industrials — 1.5% | | | | | | | | |
| Safran SA ADR | | | 8,524 | | | | 226,142 | |
| | | | | | | | | |
| Information Technology — 2.7% | | | | | | | | |
| Dassault Systemes SE ADR | | | 3,007 | | | | 410,471 | |
| Total France | | | | | | | 1,831,494 | |
| | | | | | | | | |
| China — 11.3% | | | | | | | | |
| | | | | | | | | |
| Consumer Discretionary — 2.9% | | | | | | | | |
| Geely Automobile Holdings Ltd. ADR | | | 3,007 | | | | 176,451 | |
| JD.com, Inc. ADR* | | | 6,857 | | | | 277,640 | |
| | | | | | | | | |
| Information Technology — 8.4% | | | | | | | | |
| Alibaba Group Holding Ltd. ADR* | | | 2,268 | | | | 416,269 | |
| Baidu, Inc. ADR* | | | 949 | | | | 211,807 | |
| Tencent Holdings Ltd. ADR | | | 7,332 | | | | 390,722 | |
| Weibo Corp. ADR* | | | 2,215 | | | | 264,781 | |
| Total China | | | | | | | 1,737,670 | |
| | | | | | | | | |
| Japan — 11.2% | | | | | | | | |
| | | | | | | | | |
| Consumer Discretionary — 3.8% | | | | | | | | |
| Panasonic Corp. ADR | | | 12,765 | | | | 183,433 | |
| Sony Corp. ADR | | | 8,123 | | | | 392,666 | |
| | | | | | | | | |
| Health Care — 1.0% | | | | | | | | |
| Hoya Corp. ADR | | | 3,112 | | | | 159,117 | |
| | | | | | | | | |
| Industrials — 4.6% | | | | | | | | |
| FANUC Corp. ADR | | | 14,874 | | | | 378,246 | |
| Komatsu Ltd. ADR | | | 9,811 | | | | 330,140 | |
| | | | | | | | | |
| Information Technology — 1.8% | | | | | | | | |
| Omron Corp. ADR | | | 4,694 | | | | 277,040 | |
| Total Japan | | | | | | | 1,720,642 | |
| | | | | | | | | |
| Germany — 8.5% | | | | | | | | |
| | | | | | | | | |
| Consumer Discretionary — 1.9% | | | | | | | | |
| adidas AG ADR | | | 2,374 | | | | 289,082 | |
| | | | | | | | | |
| Financials — 2.1% | | | | | | | | |
| Allianz SE ADR | | | 13,819 | | | | 313,553 | |
| | | | | | | | | |
| Industrials — 1.8% | | | | | | | | |
| HOCHTIEF AG ADR | | | 7,068 | | | | 272,895 | |
| | | | | | | | | |
| Information Technology — 1.2% | | | | | | | | |
| Infineon Technologies AG ADR | | | 6,857 | | | | 185,036 | |
| | | | | | | | | |
| Materials — 1.5% | | | | | | | | |
| BASF SE ADR | | | 9,283 | | | | 235,695 | |
| Total Germany | | | | | | | 1,296,261 | |
| | | | | | | | | |
| Netherlands — 7.0% | | | | | | | | |
| | | | | | | | | |
| Consumer Staples — 1.5% | | | | | | | | |
| Unilever NV | | | 4,009 | | | | 226,068 | |
| | | | | | | | | |
| Financials — 1.7% | | | | | | | | |
| ING Groep NV ADR | | | 15,244 | | | | 258,081 | |
| | | | | | | | | |
| Information Technology — 2.0% | | | | | | | | |
| Interxion Holding NV* | | | 5,011 | | | | 311,233 | |
| | | | | | | | | |
| Materials — 1.8% | | | | | | | | |
| LyondellBasell Industries NV - Class A | | | 2,690 | | | | 284,279 | |
| Total Netherlands | | | | | | | 1,079,661 | |
| | | | | | | | | |
| Canada — 5.3% | | | | | | | | |
| | | | | | | | | |
| Energy — 3.2% | | | | | | | | |
| Canadian Natural Resources Ltd. | | | 8,123 | | | | 255,631 | |
| Suncor Energy, Inc. | | | 6,752 | | | | 233,214 | |
| | | | | | | | | |
| Financials — 2.1% | | | | | | | | |
| Brookfield Asset Management, Inc. - Class A | | | 8,123 | | | | 316,797 | |
| Total Canada | | | | | | | 805,642 | |
| | | | | | | | | |
| United Kingdom — 4.4% | | | | | | | | |
| | | | | | | | | |
| Financials — 2.6% | | | | | | | | |
| Prudential PLC ADR | | | 7,754 | | | | 396,462 | |
| | | | | | | | | |
| Health Care — 1.8% | | | | | | | | |
| AstraZeneca PLC ADR | | | 8,059 | | | | 281,823 | |
| Total United Kingdom | | | | | | | 678,285 | |
| | | | | | | | | |
| Singapore — 4.3% | | | | | | | | |
| | | | | | | | | |
| Financials — 1.5% | | | | | | | | |
| United Overseas Bank Ltd. ADR | | | 5,380 | | | | 225,906 | |
| | | | | | | | | |
| Information Technology — 2.8% | | | | | | | | |
| Broadcom Ltd. | | | 1,846 | | | | 435,010 | |
| Total Singapore | | | | | | | 660,916 | |
| | | | | | | | | |
| Switzerland — 4.2% | | | | | | | | |
| | | | | | | | | |
| Consumer Staples — 1.9% | | | | | | | | |
| Nestle SA ADR | | | 3,745 | | | | 296,042 | |
| | | | | | | | | |
| Financials — 1.3% | | | | | | | | |
| Credit Suisse Group AG ADR | | | 11,551 | | | | 193,941 | |
Touchstone International Growth Fund (Continued)
| | | | | | Market | |
| | | Shares | | | Value | |
| | | | | | | |
| Common Stocks — 96.5% (Continued) | | | | | | | | |
| | | | | | | | | |
| Switzerland — (Continued) | | | | | | | | |
| | | | | | | | | |
| Health Care — 1.0% | | | | | | | | |
| Novartis AG ADR | | | 1,846 | | | $ | 149,249 | |
| Total Switzerland | | | | | | | 639,232 | |
| | | | | | | | | |
| India — 3.7% | | | | | | | | |
| | | | | | | | | |
| Financials — 3.7% | | | | | | | | |
| HDFC Bank Ltd. ADR | | | 4,061 | | | | 401,105 | |
| ICICI Bank Ltd. ADR | | | 19,569 | | | | 173,186 | |
| Total India | | | | | | | 574,291 | |
| | | | | | | | | |
| Denmark — 2.9% | | | | | | | | |
| | | | | | | | | |
| Financials — 1.4% | | | | | | | | |
| Danske Bank A/S ADR | | | 11,657 | | | | 220,026 | |
| | | | | | | | | |
| Health Care — 1.5% | | | | | | | | |
| Novo Nordisk A/S ADR | | | 4,694 | | | | 231,180 | |
| Total Denmark | | | | | | | 451,206 | |
| | | | | | | | | |
| Jersey — 2.5% | | | | | | | | |
| Consumer Discretionary — 1.2% | | | | | | | | |
| Aptiv PLC | | | 2,103 | | | | 178,692 | |
| | | | | | | | | |
| Information Technology — 1.3% | | | | | | | | |
| WNS Holdings Ltd. ADR* | | | 4,589 | | | | 208,019 | |
| Total Jersey | | | | | | | 386,711 | |
| | | | | | | | | |
| Taiwan — 1.9% | | | | | | | | |
| | | | | | | | | |
| Information Technology — 1.9% | | | | | | | | |
| Taiwan Semiconductor | | | | | | | | |
| Manufacturing Co. Ltd. ADR | | | 6,646 | | | | 290,829 | |
| | | | | | | | | |
| Sweden — 1.8% | | | | | | | | |
| | | | | | | | | |
| Industrials — 1.8% | | | | | | | | |
| Atlas Copco AB ADR - Class A | | | 6,488 | | | | 283,720 | |
| | | | | | | | | |
| Ireland — 1.8% | | | | | | | | |
| | | | | | | | | |
| Industrials — 1.8% | | | | | | | | |
| Kingspan Group PLC ADR | | | 6,593 | | | | 278,928 | |
| | | | | | | | | |
| Brazil — 1.7% | | | | | | | | |
| | | | | | | | | |
| Financials — 1.7% | | | | | | | | |
| Itau Unibanco Holding SA ADR | | | 16,668 | | | | 260,021 | |
| | | | | | | | | |
| Austria — 1.7% | | | | | | | | |
| | | | | | | | | |
| Financials — 1.7% | | | | | | | | |
| Erste Group Bank AG ADR | | | 10,127 | | | | 255,909 | |
| | | | | | | | | |
| Macau — 1.5% | | | | | | | | |
| | | | | | | | | |
| Consumer Discretionary — 1.5% | | | | | | | | |
| Sands China Ltd. ADR | | | 4,272 | | | | 232,215 | |
| | | | | | | | | |
| Spain — 1.5% | | | | | | | | |
| | | | | | | | | |
| Consumer Discretionary — 1.5% | | | | | | | | |
| Industria de Diseno Textil SA ADR† | | | 14,400 | | | | 226,008 | |
| | | | | | | | | |
| Panama — 1.5% | | | | | | | | |
| | | | | | | | | |
| Industrials — 1.5% | | | | | | | | |
| Copa Holdings SA - Class A | | | 1,741 | | | | 223,945 | |
| | | | | | | | | |
| Philippines — 1.4% | | | | | | | | |
| | | | | | | | | |
| Financials — 1.4% | | | | | | | | |
| BDO Unibank, Inc. ADR† | | | 8,070 | | | | 213,694 | |
| | | | | | | | | |
| South Africa — 1.2% | | | | | | | | |
| | | | | | | | | |
| Financials — 1.2% | | | | | | | | |
| Capitec Bank Holdings Ltd. ADR | | | 4,905 | | | | 180,126 | |
| | | | | | | | | |
| Mexico — 1.1% | | | | | | | | |
| | | | | | | | | |
| Industrials — 1.1% | | | | | | | | |
| Grupo Aeroportuario del Sureste SAB de CV ADR | | | 1,002 | | | | 170,911 | |
| | | | | | | | | |
| Luxembourg — 1.1% | | | | | | | | |
| | | | | | | | | |
| Consumer Discretionary — 1.1% | | | | | | | | |
| Samsonite International SA ADR | | | 7,121 | | | | 162,003 | |
| | | | | | | | | |
| Virgin Islands (British) — 1.0% | | | | | | | | |
| | | | | | | | | |
| Information Technology — 1.0% | | | | | | | | |
| Luxoft Holding, Inc.* | | | 3,587 | | | | 146,888 | |
| Total Common Stocks | | | | | | $ | 14,787,208 | |
| | | | | | | | | |
| Short-Term Investment Funds — 4.4% | | | | | | | | |
| Dreyfus Government Cash | | | | | | | | |
| Management, Institutional Shares, | | | | | | | | |
| 1.54%∞Ω | | | 553,348 | | | | 553,348 | |
| Invesco Government & Agency | | | | | | | | |
| Portfolio, Institutional Class, | | | | | | | | |
| 1.48%**∞Ω | | | 114,510 | | | | 114,510 | |
| Total Short-Term Investment Funds | | | | | | $ | 667,858 | |
| | | | | | | | | |
| Total Investment Securities —100.9% | | | | | | | | |
| (Cost $12,810,360) | | | | | | $ | 15,455,066 | |
| | | | | | | | | |
| Liabilities in Excess of Other Assets — (0.9%) | | | | | | | (137,144 | ) |
| | | | | | | | | |
| Net Assets — 100.0% | | | | | | $ | 15,317,922 | |
Touchstone International Growth Fund (Continued)
| * | Non-income producing security. |
| ** | Represents collateral for securities loaned. |
| † | All or a portion of the security is on loan. The total market value of the securities on loan as of March 31, 2018 was $107,297. |
| Ω | Represents the 7-day SEC yield as of March 31, 2018. |
Portfolio Abbreviations:
ADR - American Depositary Receipt
PLC - Public Limited Company
Other Information:
The inputs or methodology used for valuing securities may not be an indication of the risk associated with investing in those securities. For more information on valuation inputs, and their aggregation into the levels used in the table below, please refer to the security valuation section in the accompanying Notes to Financial Statements.
Valuation inputs at Reporting Date:
| Description | | Level 1 | | | Level 2 | | | Level 3 | | | Total | |
| Common Stocks | | $ | 14,787,208 | | | $ | — | | | $ | — | | | $ | 14,787,208 | |
| Short-Term Investment Funds | | | 667,858 | | | | — | | | | — | | | | 667,858 | |
| Total | | $ | 15,455,066 | | | $ | — | | | $ | — | | | $ | 15,455,066 | |
See accompanying Notes to Financial Statements.
Portfolio of Investments
Touchstone International Value Fund – March 31, 2018
| | | | | | Market | |
| | | Shares | | | Value | |
| | | | | | | |
| Common Stocks — 102.0% | | | | | | | | |
| | | | | | | | | |
| Japan — 16.0% | | | | | | | | |
| | | | | | | | | |
| Consumer Staples — 1.6% | | | | | | | | |
| Japan Tobacco, Inc. | | | 13,100 | | | $ | 374,228 | |
| | | | | | | | | |
| Energy — 1.8% | | | | | | | | |
| Inpex Corp. | | | 33,800 | | | | 419,435 | |
| | | | | | | | | |
| Financials — 3.1% | | | | | | | | |
| ORIX Corp. | | | 22,200 | | | | 397,846 | |
| Resona Holdings, Inc. | | | 62,100 | | | | 333,785 | |
| | | | | | | | | |
| Industrials — 6.2% | | | | | | | | |
| Fuji Electric Co. Ltd. | | | 65,490 | | | | 451,206 | |
| Seibu Holdings, Inc. | | | 25,700 | | | | 450,585 | |
| Sumitomo Corp. | | | 34,030 | | | | 570,089 | |
| | | | | | | | | |
| Information Technology — 2.2% | | | | | | | | |
| Hitachi Ltd. | | | 72,720 | | | | 529,664 | |
| | | | | | | | | |
| Materials — 1.1% | | | | | | | | |
| Sumitomo Osaka Cement Co. Ltd.† | | | 59,010 | | | | 260,483 | |
| Total Japan | | | | | | | 3,787,321 | |
| | | | | | | | | |
| United Kingdom — 14.7% | | | | | | | | |
| | | | | | | | | |
| Consumer Discretionary — 2.2% | | | | | | | | |
| Greene King PLC | | | 42,372 | | | | 280,237 | |
| ITV PLC | | | 121,462 | | | | 245,871 | |
| | | | | | | | | |
| Consumer Staples — 4.3% | | | | | | | | |
| Coca-Cola European Partners PLC | | | 14,200 | | | | 591,572 | |
| Imperial Brands PLC | | | 12,649 | | | | 430,691 | |
| | | | | | | | | |
| Health Care — 2.2% | | | | | | | | |
| GlaxoSmitKline PLC | | | 26,990 | | | | 524,173 | |
| | | | | | | | | |
| Industrials — 4.3% | | | | | | | | |
| Babcock International Group PLC | | | 33,900 | | | | 318,206 | |
| Cobham PLC* | | | 243,050 | | | | 418,826 | |
| Travis Perkins PLC* | | | 15,351 | | | | 266,156 | |
| | | | | | | | | |
| Materials — 1.7% | | | | | | | | |
| RPC Group PLC | | | 37,200 | | | | 404,434 | |
| Total United Kingdom | | | | | | | 3,480,166 | |
| | | | | | | | | |
| Netherlands — 14.3% | | | | | | | | |
| | | | | | | | | |
| Consumer Discretionary — 2.0% | | | | | | | | |
| Fiat Chrysler Automobiles NV | | | 22,800 | | | | 465,036 | |
| | | | | | | | | |
| Energy — 2.3% | | | | | | | | |
| Koninklijke Vopak NV | | | 10,900 | | | | 535,191 | |
| | | | | | | | | |
| Financials — 1.1% | | | | | | | | |
| ING Groep NV | | | 15,973 | | | | 269,548 | |
| | | | | | | | | |
| Health Care — 2.6% | | | | | | | | |
| Koninklijke Philips NV | | | 16,300 | | | | 624,160 | |
| | | | | | | | | |
| Industrials — 6.3% | | | | | | | | |
| Airbus Group SE | | | 8,540 | | | | 988,572 | |
| CNH Industrial NV | | | 39,940 | | | | 493,540 | |
| Total Netherlands | | | | | | | 3,376,047 | |
| | | | | | | | | |
| Germany — 14.1% | | | | | | | | |
| | | | | | | | | |
| Consumer Discretionary — 2.2% | | | | | | | | |
| HUGO BOSS AG | | | 5,900 | | | | 513,990 | |
| | | | | | | | | |
| Financials — 3.5% | | | | | | | | |
| Deutsche Boerse AG | | | 1,976 | | | | 270,126 | |
| Muenchener Rueckversicherungs- Gesellschaft AG in Muenchen | | | 2,400 | | | | 558,100 | |
| | | | | | | | | |
| Health Care — 2.6% | | | | | | | | |
| Bayer AG | | | 5,430 | | | | 612,145 | |
| | | | | | | | | |
| Industrials — 1.8% | | | | | | | | |
| GEA Group AG | | | 9,800 | | | | 416,763 | |
| | | | | | | | | |
| Materials — 2.2% | | | | | | | | |
| Linde AG* | | | 2,500 | | | | 526,325 | |
| | | | | | | | | |
| Telecommunication Services — 1.8% | | | | | | | | |
| Deutsche Telekom AG | | | 26,800 | | | | 438,467 | |
| Total Germany | | | | | | | 3,335,916 | |
| | | | | | | | | |
| France — 7.2% | | | | | | | | |
| | | | | | | | | |
| Consumer Discretionary — 0.7% | | | | | | | | |
| Elior Group SA, 144a | | | 7,779 | | | | 169,036 | |
| | | | | | | | | |
| Health Care — 2.6% | | | | | | | | |
| Sanofi | | | 7,595 | | | | 609,424 | |
| | | | | | | | | |
| Materials — 2.2% | | | | | | | | |
| Air Liquide SA | | | 4,344 | | | | 533,086 | |
| | | | | | | | | |
| Utilities — 1.7% | | | | | | | | |
| Engie SA | | | 24,185 | | | | 403,853 | |
| Total France | | | | | | | 1,715,399 | |
| | | | | | | | | |
| Italy — 5.9% | | | | | | | | |
| | | | | | | | | |
| Energy — 2.1% | | | | | | | | |
| Eni SpA | | | 28,201 | | | | 496,768 | |
| | | | | | | | | |
| Financials — 1.7% | | | | | | | | |
| Mediobanca SpA | | | 33,400 | | | | 392,664 | |
| | | | | | | | | |
| Utilities — 2.1% | | | | | | | | |
| Enel SpA | | | 81,500 | | | | 498,716 | |
| Total Italy | | | | | | | 1,388,148 | |
| | | | | | | | | |
| Switzerland — 3.9% | | | | | | | | |
| | | | | | | | | |
| Consumer Staples — 1.4% | | | | | | | | |
| Aryzta AG* | | | 14,317 | | | | 318,875 | |
Touchstone International Value Fund (Continued)
| | | | | | Market | |
| | | Shares | | | Value | |
| | | | | | | |
| Common Stocks — 102.0% (Continued) | | | | | | | | |
| | | | | | | | | |
| Switzerland — (Continued) | | | | | | | | |
| | | | | | | | | |
| Financials — 2.5% | | | | | | | | |
| Credit Suisse Group AG | | | 35,604 | | | $ | 597,970 | |
| Total Switzerland | | | | | | | 916,845 | |
| | | | | | | | | |
| Ireland — 3.2% | | | | | | | | |
| | | | | | | | | |
| Financials — 1.4% | | | | | | | | |
| Bank of Ireland Group PLC* | | | 39,500 | | | | 345,566 | |
| | | | | | | | | |
| Materials — 1.8% | | | | | | | | |
| CRH PLC | | | 12,530 | | | | 423,560 | |
| Total Ireland | | | | | | | 769,126 | |
| | | | | | | | | |
| Singapore — 2.8% | | | | | | | | |
| | | | | | | | | |
| Financials — 2.8% | | | | | | | | |
| United Overseas Bank Ltd. | | | 31,070 | | | | 653,782 | |
| | | | | | | | | |
| Colombia — 2.7% | | | | | | | | |
| | | | | | | | | |
| Energy — 2.7% | | | | | | | | |
| Ecopetrol SA ADR† | | | 33,000 | | | | 637,890 | |
| | | | | | | | | |
| Austria — 2.3% | | | | | | | | |
| | | | | | | | | |
| Financials — 2.3% | | | | | | | | |
| Erste Group Bank AG | | | 10,990 | | | | 552,504 | |
| | | | | | | | | |
| Malaysia — 2.1% | | | | | | | | |
| | | | | | | | | |
| Financials — 2.1% | | | | | | | | |
| CIMB Group Holdings Bhd | | | 265,500 | | | | 494,049 | |
| | | | | | | | | |
| United States — 1.9% | | | | | | | | |
| | | | | | | | | |
| Energy — 1.9% | | | | | | | | |
| Oceaneering International, Inc. | | | 24,400 | | | | 452,376 | |
| | | | | | | | | |
| Taiwan — 1.9% | | | | | | | | |
| | | | | | | | | |
| Information Technology — 1.9% | | | | | | | | |
| MediaTek, Inc. | | | 38,400 | | | | 441,840 | |
| | | | | | | | | |
| Spain — 1.9% | | | | | | | | |
| | | | | | | | | |
| Financials — 1.9% | | | | | | | | |
| Banco de Sabadell SA | | | 214,703 | | | | 439,160 | |
| | | | | | | | | |
| Hong Kong — 1.6% | | | | | | | | |
| | | | | | | | | |
| Consumer Discretionary — 1.6% | | | | | | | | |
| SJM Holdings Ltd. | | | 445,000 | | | | 389,862 | |
| | | | | | | | | |
| Finland — 1.6% | | | | | | | | |
| | | | | | | | | |
| Utilities — 1.6% | | | | | | | | |
| Fortum OYJ† | | | 17,900 | | | | 384,546 | |
| | | | | | | | | |
| Australia — 1.5% | | | | | | | | |
| | | | | | | | | |
| Financials — 1.5% | | | | | | | | |
| AMP Ltd. | | | 91,942 | | | | 354,820 | |
| | | | | | | | | |
| Brazil — 1.4% | | | | | | | | |
| | | | | | | | | |
| Information Technology — 1.4% | | | | | | | | |
| Cielo SA | | | 53,160 | | | | 333,473 | |
| | | | | | | | | |
| South Korea — 1.0% | | | | | | | | |
| | | | | | | | | |
| Financials — 1.0% | | | | | | | | |
| Samsung Securities Co. Ltd. | | | 6,500 | | | | 242,720 | |
| Total Common Stocks | | | | | | $ | 24,145,990 | |
| | | | | | | | | |
| Short-Term Investment Funds — 6.4% | | | | | | | | |
| Dreyfus Government Cash Management, Institutional Shares, 1.54%∞Ω | | | 235,681 | | | | 235,681 | |
| Invesco Government & Agency Portfolio, Institutional Class, 1.48%**∞Ω | | | 1,274,491 | | | | 1,274,491 | |
| Total Short-Term Investment Funds | | | | | | $ | 1,510,172 | |
| | | | | | | | | |
| Total Investment Securities —108.4% | | | | | | | | |
| (Cost $25,045,431) | | | | | | $ | 25,656,162 | |
| | | | | | | | | |
| Liabilities in Excess of Other Assets — (8.4%) | | | | | | | (1,985,345 | ) |
| | | | | | | | | |
| Net Assets — 100.0% | | | | | | $ | 23,670,817 | |
| * | Non-income producing security. |
| ** | Represents collateral for securities loaned. |
| † | All or a portion of the security is on loan. The total market value of the securities on loan as of March 31, 2018 was $1,012,212. |
| Ω | Represents the 7-day SEC yield as of March 31, 2018. |
Portfolio Abbreviations:
ADR - American Depositary Receipt
PLC - Public Limited Company
Touchstone International Value Fund (Continued)
144a - This is a restricted security that was sold in a transaction qualifying for the exemption under Rule 144a of the Securities Act of 1933. This security may be sold in transactions exempt from registration, normally to qualified institutional buyers. At March 31, 2018, these securities were valued at $169,036 or 0.7% of net assets. These securities were deemed liquid pursuant to procedures approved by the Board of Trustees.
Other Information:
The inputs or methodology used for valuing securities may not be an indication of the risk associated with investing in those securities. For more information on valuation inputs, and their aggregation into the levels used in the table below, please refer to the security valuation section in the accompanying Notes to Financial Statements.
Valuation inputs at Reporting Date:
| Description | | Level 1 | | | Level 2 | | | Level 3 | | | Total | |
| Common Stocks Japan | | $ | — | | | $ | 3,787,321 | | | $ | — | | | $ | 3,787,321 | |
| United Kingdom | | | 871,809 | | | | 2,608,357 | | | | — | | | | 3,480,166 | |
| Netherlands | | | — | | | | 3,376,047 | | | | — | | | | 3,376,047 | |
| Germany | | | 526,325 | | | | 2,809,591 | | | | — | | | | 3,335,916 | |
| France | | | 169,036 | | | | 1,546,363 | | | | — | | | | 1,715,399 | |
| Italy | | | — | | | | 1,388,148 | | | | — | | | | 1,388,148 | |
| Switzerland | | | — | | | | 916,845 | | | | — | | | | 916,845 | |
| Ireland | | | 345,566 | | | | 423,560 | | | | — | | | | 769,126 | |
| Singapore | | | — | | | | 653,782 | | | | — | | | | 653,782 | |
| Colombia | | | 637,890 | | | | — | | | | — | | | | 637,890 | |
| Austria | | | — | | | | 552,504 | | | | — | | | | 552,504 | |
| Malaysia | | | — | | | | 494,049 | | | | — | | | | 494,049 | |
| United States | | | 452,376 | | | | — | | | | — | | | | 452,376 | |
| Taiwan | | | — | | | | 441,840 | | | | — | | | | 441,840 | |
| Spain | | | — | | | | 439,160 | | | | — | | | | 439,160 | |
| Hong Kong | | | — | | | | 389,862 | | | | — | | | | 389,862 | |
| Finland | | | — | | | | 384,546 | | | | — | | | | 384,546 | |
| Australia | | | — | | | | 354,820 | | | | — | | | | 354,820 | |
| Brazil | | | 333,473 | | | | — | | | | — | | | | 333,473 | |
| South Korea | | | — | | | | 242,720 | | | | — | | | | 242,720 | |
| Short-Term Investment Funds | | | 1,510,172 | | | | — | | | | — | | | | 1,510,172 | |
| Total | | $ | 4,846,647 | | | $ | 20,809,515 | | | $ | — | | | $ | 25,656,162 | |
At March 31, 2018, equity securities valued at $318,206 were transferred from Level 1 to Level 2. Transfers from Level 1 to Level 2 are due to movements of a designated U.S. market index, triggering a systematic valuation model, provided by an independent third party, when required confidence levels are achieved to fair value the international equity securities.
See accompanying Notes to Financial Statements.
Portfolio of Investments
Touchstone Mid Cap Growth Fund – March 31, 2018
| | | | | | Market | |
| | | Shares | | | Value | |
| | | | | | | |
| Common Stocks — 96.5% | | | | | | | | |
| | | | | | | | | |
| Information Technology — 25.4% | | | | | | | | |
| Analog Devices, Inc. | | | 134,960 | | | $ | 12,298,905 | |
| Autodesk, Inc.* | | | 117,195 | | | | 14,717,348 | |
| Cypress Semiconductor Corp. | | | 478,660 | | | | 8,118,074 | |
| Fidelity National Information Services, Inc. | | | 173,120 | | | | 16,671,456 | |
| FleetCor Technologies, Inc.* | | | 94,530 | | | | 19,142,325 | |
| Lam Research Corp. | | | 76,790 | | | | 15,600,656 | |
| Microchip Technology, Inc. | | | 140,040 | | | | 12,794,054 | |
| NetApp, Inc. | | | 126,380 | | | | 7,796,382 | |
| Nice Ltd. ADR* | | | 127,783 | | | | 12,002,657 | |
| Palo Alto Networks, Inc.* | | | 62,580 | | | | 11,359,522 | |
| Red Hat, Inc.* | | | 102,230 | | | | 15,284,407 | |
| ServiceNow, Inc.* | | | 97,400 | | | | 16,114,830 | |
| Splunk, Inc.* | | | 114,480 | | | | 11,263,687 | |
| Universal Display Corp. | | | 28,797 | | | | 2,908,497 | |
| Worldpay, Inc. - Class A* | | | 268,800 | | | | 22,106,112 | |
| | | | | | | | 198,178,912 | |
| | | | | | | | | |
| Industrials — 18.9% | | | | | | | | |
| AMETEK, Inc. | | | 234,210 | | | | 17,792,934 | |
| Ferguson PLC ADR† | | | 2,180,050 | | | | 16,513,879 | |
| IHS Markit Ltd. (Bermuda)* | | | 303,554 | | | | 14,643,445 | |
| JB Hunt Transport Services, Inc. | | | 139,776 | | | | 16,374,758 | |
| Lennox International, Inc. | | | 77,561 | | | | 15,851,142 | |
| Rockwell Automation, Inc. | | | 61,355 | | | | 10,688,041 | |
| Teledyne Technologies, Inc.* | | | 85,599 | | | | 16,021,565 | |
| TransDigm Group, Inc. | | | 45,691 | | | | 14,024,396 | |
| TransUnion* | | | 249,941 | | | | 14,191,650 | |
| United Continental Holdings, Inc.* | | | 162,440 | | | | 11,284,707 | |
| | | | | | | | 147,386,517 | |
| | | | | | | | | |
| Consumer Discretionary — 14.8% | | | | | | | | |
| Aptiv PLC (Jersey) | | | 80,697 | | | | 6,856,824 | |
| Aramark | | | 308,780 | | | | 12,215,337 | |
| Delphi Technologies PLC (Jersey) | | | 219,042 | | | | 10,437,351 | |
| Dollar Tree, Inc.* | | | 160,340 | | | | 15,216,266 | |
| Expedia, Inc. | | | 78,160 | | | | 8,629,646 | |
| Marriott International, Inc. - Class A | | | 103,450 | | | | 14,067,131 | |
| MGM Resorts International | | | 422,040 | | | | 14,779,841 | |
| PVH Corp. | | | 85,250 | | | | 12,909,408 | |
| Six Flags Entertainment Corp. | | | 124,280 | | | | 7,737,673 | |
| Tiffany & Co. | | | 131,360 | | | | 12,828,618 | |
| | | | | | | | 115,678,095 | |
| | | | | | | | | |
| Health Care — 14.0% | | | | | | | | |
| Alexion Pharmaceuticals, Inc.* | | | 101,320 | | | | 11,293,127 | |
| Clovis Oncology, Inc.* | | | 73,360 | | | | 3,873,408 | |
| Cooper Cos., Inc. (The) | | | 72,649 | | | | 16,622,818 | |
| Envision Healthcare Corp.* | | | 164,370 | | | | 6,316,739 | |
| ICON PLC (Ireland)* | | | 99,080 | | | | 11,705,311 | |
| IDEXX Laboratories, Inc.* | | | 71,678 | | | | 13,718,452 | |
| Jazz Pharmaceuticals PLC (Ireland)* | | | 88,119 | | | | 13,305,088 | |
| Medicines Co. (The)* | | | 244,370 | | | | 8,049,548 | |
| Mettler-Toledo International, Inc.* | | | 19,590 | | | | 11,264,838 | |
| Zoetis, Inc. | | | 155,140 | | | | 12,955,741 | |
| | | | | | | | 109,105,070 | |
| | | | | | | | | |
| Financials — 9.2% | | | | | | | | |
| Arthur J Gallagher & Co. | | | 202,710 | | | | 13,932,258 | |
| E*TRADE Financial Corp.* | | | 288,650 | | | | 15,994,096 | |
| MSCI, Inc. | | | 81,050 | | | | 12,114,543 | |
| Progressive Corp. (The) | | | 294,960 | | | | 17,971,913 | |
| Western Alliance Bancorp* | | | 205,510 | | | | 11,942,186 | |
| | | | | | | | 71,954,996 | |
| | | | | | | | | |
| Materials — 4.3% | | | | | | | | |
| Avery Dennison Corp. | | | 118,330 | | | | 12,572,562 | |
| Celanese Corp. - Class A | | | 108,000 | | | | 10,822,680 | |
| Vulcan Materials Co. | | | 92,430 | | | | 10,552,733 | |
| | | | | | | | 33,947,975 | |
| | | | | | | | | |
| Energy — 4.0% | | | | | | | | |
| Andeavor | | | 124,985 | | | | 12,568,492 | |
| Pioneer Natural Resources Co. | | | 107,390 | | | | 18,447,454 | |
| | | | | | | | 31,015,946 | |
| | | | | | | | | |
| Consumer Staples — 3.3% | | | | | | | | |
| Constellation Brands, Inc. - Class A | | | 61,271 | | | | 13,964,886 | |
| Pinnacle Foods, Inc. | | | 218,457 | | | | 11,818,524 | |
| | | | | | | | 25,783,410 | |
| | | | | | | | | |
| Real Estate — 2.6% | | | | | | | | |
| Alexandria Real Estate Equities, Inc. REIT | | | 97,150 | | | | 12,133,063 | |
| CyrusOne, Inc. REIT | | | 154,355 | | | | 7,904,520 | |
| | | | | | | | 20,037,583 | |
| Total Common Stocks | | | | | | $ | 753,088,504 | |
| | | | | | | | | |
| Short-Term Investment Funds — 2.9% | | | | | | | | |
| Dreyfus Government Cash Management, Institutional Shares, 1.54%∞Ω | | | 22,165,762 | | | | 22,165,762 | |
| Invesco Government & Agency Portfolio, Institutional Class, 1.48%**∞Ω | | | 211,200 | | | | 211,200 | |
| Total Short-Term Investment Funds | | | | | | $ | 22,376,962 | |
| | | | | | | | | |
| Total Investment Securities —99.4% | | | | | | | | |
| (Cost $586,365,218) | | | | | | $ | 775,465,466 | |
| | | | | | | | | |
| Other Assets in Excess of Liabilities — 0.6% | | | | | | | 4,556,074 | |
| | | | | | | | | |
| Net Assets — 100.0% | | | | | | $ | 780,021,540 | |
Touchstone Mid Cap Growth Fund (Continued)
| * | Non-income producing security. |
| ** | Represents collateral for securities loaned. |
| † | All or a portion of the security is on loan. The total market value of the securities on loan as of March 31, 2018 was $199,980. |
| Ω | Represents the 7-day SEC yield as of March 31, 2018. |
Portfolio Abbreviations:
ADR - American Depositary Receipt
PLC - Public Limited Company
REIT - Real Estate Investment Trust
Other Information:
The inputs or methodology used for valuing securities may not be an indication of the risk associated with investing in those securities. For more information on valuation inputs, and their aggregation into the levels used in the table below, please refer to the security valuation section in the accompanying Notes to Financial Statements.
Valuation inputs at Reporting Date:
| Description | | Level 1 | | | Level 2 | | | Level 3 | | | Total | |
| Common Stocks | | $ | 753,088,504 | | | $ | — | | | $ | — | | | $ | 753,088,504 | |
| Short-Term Investment Funds | | | 22,376,962 | | | | — | | | | — | | | | 22,376,962 | |
| Total | | $ | 775,465,466 | | | $ | — | | | $ | — | | | $ | 775,465,466 | |
See accompanying Notes to Financial Statements.
Portfolio of Investments
Touchstone Sands Capital Emerging Markets Growth Fund – March 31, 2018
| | | | | | Market | |
| | | Shares | | | Value | |
| | | | | | | |
| Common Stocks — 95.6% | | | | | | | | |
| | | | | | | | | |
| India — 29.6% | | | | | | | | |
| | | | | | | | | |
| Consumer Discretionary — 9.8% | | | | | | | | |
| Jubilant Foodworks Ltd. | | | 570,636 | | | $ | 20,524,795 | |
| Makemytrip Ltd.*† | | | 414,300 | | | | 14,376,210 | |
| Maruti Suzuki India Ltd. | | | 62,475 | | | | 8,535,338 | |
| Zee Entertainment Enterprises Ltd. | | | 1,533,909 | | | | 13,615,648 | |
| | | | | | | | | |
| Consumer Staples — 2.9% | | | | | | | | |
| Avenue Supermarts Ltd., 144a* | | | 225,323 | | | | 4,610,631 | |
| Britannia Industries Ltd. | | | 88,075 | | | | 6,741,253 | |
| ITC Ltd. | | | 1,433,022 | | | | 5,649,831 | |
| | | | | | | | | |
| Financials — 7.7% | | | | | | | | |
| HDFC Bank Ltd. | | | 438,400 | | | | 12,771,021 | |
| Housing Development Finance Corp. Ltd. | | | 709,483 | | | | 19,984,798 | |
| IndusInd Bank Ltd. | | | 429,401 | | | | 11,912,300 | |
| | | | | | | | | |
| Health Care — 1.8% | | | | | | | | |
| Apollo Hospitals Enterprise Ltd. | | | 629,068 | | | | 10,335,474 | |
| | | | | | | | | |
| Industrials — 6.3% | | | | | | | | |
| Adani Ports & Special Economic Zone Ltd. | | | 2,802,963 | | | | 15,328,118 | |
| Eicher Motors Ltd. | | | 23,648 | | | | 10,357,508 | |
| Larsen & Toubro Ltd. | | | 531,214 | | | | 10,742,813 | |
| | | | | | | | | |
| Materials — 1.1% | | | | | | | | |
| Asian Paints Ltd. | | | 379,718 | | | | 6,552,099 | |
| Total India | | | | | | | 172,037,837 | |
| | | | | | | | | |
| China — 21.7% | | | | | | | | |
| | | | | | | | | |
| Consumer Discretionary — 6.9% | | | | | | | | |
| ANTA Sports Products Ltd. | | | 3,420,000 | | | | 17,458,447 | |
| Ctrip.com International Ltd. ADR* | | | 488,500 | | | | 22,773,870 | |
| | | | | | | | | |
| Information Technology — 14.8% | | | | | | | | |
| Alibaba Group Holding Ltd. ADR* | | | 203,969 | | | | 37,436,470 | |
| Baidu, Inc. ADR* | | | 120,406 | | | | 26,873,415 | |
| Sunny Optical Technology Group Co. Ltd. | | | 328,200 | | | | 6,158,445 | |
| Tencent Holdings Ltd. | | | 292,900 | | | | 15,722,746 | |
| Total China | | | | | | | 126,423,393 | |
| | | | | | | | | |
| South Korea — 6.5% | | | | | | | | |
| | | | | | | | | |
| Consumer Staples — 1.8% | | | | | | | | |
| Amorepacific Corp. | | | 36,900 | | | | 10,663,317 | |
| | | | | | | | | |
| Health Care — 4.7% | | | | | | | | |
| Medy-Tox, Inc. | | | 38,275 | | | | 27,024,141 | |
| Total South Korea | | | | | | | 37,687,458 | |
| | | | | | | | | |
| South Africa — 6.3% | | | | | | | | |
| | | | | | | | | |
| Consumer Discretionary — 6.3% | | | | | | | | |
| Naspers Ltd. - Class N | | | 148,700 | | | | 36,388,829 | |
| | | | | | | | | |
| Netherlands — 4.5% | | | | | | | | |
| | | | | | | | | |
| Information Technology — 4.5% | | | | | | | | |
| Yandex NV.* | | | 663,425 | | | | 26,172,116 | |
| | | | | | | | | |
| Thailand — 3.0% | | | | | | | | |
| | | | | | | | | |
| Consumer Staples — 3.0% | | | | | | | | |
| CP ALL PCL | | | 6,183,800 | | | | 17,285,581 | |
| | | | | | | | | |
| United States — 2.8% | | | | | | | | |
| | | | | | | | | |
| Information Technology — 2.8% | | | | | | | | |
| MercadoLibre, Inc. | | | 45,825 | | | | 16,331,572 | |
| | | | | | | | | |
| Taiwan — 2.6% | | | | | | | | |
| | | | | | | | | |
| Information Technology — 2.6% | | | | | | | | |
| Taiwan Semiconductor | | | | | | | | |
| Manufacturing Co. Ltd. ADR | | | 349,940 | | | | 15,313,374 | |
| | | | | | | | | |
| Macau — 2.5% | | | | | | | | |
| | | | | | | | | |
| Consumer Discretionary — 2.5% | | | | | | | | |
| Sands China Ltd. | | | 2,701,400 | | | | 14,680,311 | |
| | | | | | | | | |
| Philippines — 2.4% | | | | | | | | |
| | | | | | | | | |
| Industrials — 1.2% | | | | | | | | |
| International Container Terminal Services, Inc. | | | 3,672,220 | | | | 7,037,938 | |
| | | | | | | | | |
| Real Estate — 1.2% | | | | | | | | |
| SM Prime Holdings, Inc. | | | 10,549,500 | | | | 6,858,885 | |
| Total Philippines | | | | | | | 13,896,823 | |
| | | | | | | | | |
| Indonesia — 2.4% | | | | | | | | |
| | | | | | | | | |
| Financials — 1.6% | | | | | | | | |
| Bank Central Asia Tbk PT | | | 5,448,500 | | | | 9,255,840 | |
| | | | | | | | | |
| Health Care — 0.8% | | | | | | | | |
| Siloam International Hospitals Tbk PT* | | | 7,922,218 | | | | 4,603,432 | |
| Total Indonesia | | | | | | | 13,859,272 | |
| | | | | | | | | |
| Brazil — 2.4% | | | | | | | | |
| | | | | | | | | |
| Consumer Discretionary — 0.3% | | | | | | | | |
| Netshoes Cayman Ltd.*† | | | 257,500 | | | | 1,524,400 | |
| | | | | | | | | |
| Consumer Staples — 2.1% | | | | | | | | |
| Raia Drogasil SA | | | 542,300 | | | | 12,275,236 | |
| Total Brazil | | | | | | | 13,799,636 | |
| | | | | | | | | |
| Cambodia — 1.7% | | | | | | | | |
| | | | | | | | | |
| Consumer Discretionary — 1.7% | | | | | | | | |
| NagaCorp Ltd. | | | 9,772,000 | | | | 10,172,283 | |
Touchstone Sands Capital Emerging Markets Growth Fund (Continued)
| | | | | | Market | |
| | | Shares | | | Value | |
| | | | | | | |
| Common Stocks — 95.6% (Continued) | | | | | | | | |
| | | | | | | | | |
| Virgin Islands (British) — 1.7% | | | | | | | | |
| | | | | | | | | |
| Information Technology — 1.7% | | | | | | | | |
| Mail.Ru Group Ltd. GDR* | | | 283,700 | | | $ | 9,882,790 | |
| | | | | | | | | |
| Peru — 1.6% | | | | | | | | |
| | | | | | | | | |
| Financials — 1.6% | | | | | | | | |
| Credicorp Ltd. | | | 42,114 | | | | 9,561,563 | |
| | | | | | | | | |
| Mexico — 1.2% | | | | | | | | |
| | | | | | | | | |
| Industrials — 1.2% | | | | | | | | |
| Grupo Aeroportuario del Sureste SAB de CV ADR† | | | 39,885 | | | | 6,803,185 | |
| | | | | | | | | |
| Malaysia — 1.1% | | | | | | | | |
| | | | | | | | | |
| Health Care — 1.1% | | | | | | | | |
| IHH Healthcare Bhd | | | 4,037,800 | | | | 6,263,392 | |
| | | | | | | | | |
| Singapore — 0.9% | | | | | | | | |
| | | | | | | | | |
| Information Technology — 0.9% | | | | | | | | |
| Sea Ltd. ADR* | | | 467,100 | | | | 5,264,217 | |
| | | | | | | | | |
| Russia — 0.7% | | | | | | | | |
| | | | | | | | | |
| Consumer Staples — 0.7% | | | | | | | | |
| Magnit PJSC GDR | | | 231,600 | | | | 4,297,274 | |
| Total Common Stocks | | | | | | $ | 556,120,906 | |
| | | | | | | | | |
| Short-Term Investment Funds — 3.9% | | | | | | | | |
| Dreyfus Government Cash Management, Institutional Shares, 1.54%∞Ω | | | 20,171,412 | | | | 20,171,412 | |
| Invesco Government & Agency Portfolio, Institutional Class, 1.48%**∞Ω | | | 2,405,416 | | | | 2,405,416 | |
| Total Short-Term Investment Funds | | | | | | $ | 22,576,828 | |
| | | | | | | | | |
| Total Investment Securities —99.5% | | | | | | | | |
| (Cost $452,251,792) | | | | | | $ | 578,697,734 | |
| | | | | | | | | |
| Other Assets in Excess of Liabilities — 0.5% | | | | | | | 2,963,557 | |
| | | | | | | | | |
| Net Assets — 100.0% | | | | | | $ | 581,661,291 | |
| * | Non-income producing security. |
| ** | Represents collateral for securities loaned. |
| † | All or a portion of the security is on loan. The total market value of the securities on loan as of March 31, 2018 was $2,311,542. |
| W | Represents the 7-day SEC yield as of March 31, 2018. |
Portfolio Abbreviations:
ADR - American Depositary Receipt
GDR - Global Depositary Receipt
PCL - Public Company Limited
144a - This is a restricted security that was sold in a transaction qualifying for the exemption under Rule 144a of the Securities Act of 1933. This security may be sold in transactions exempt from registration, normally to qualified institutional buyers. At March 31, 2018, these securities were valued at $4,610,210 or 0.8% of net assets. These securities were deemed liquid pursuant to procedures approved by the Board of Trustees.
Other Information:
The inputs or methodology used for valuing securities may not be an indication of the risk associated with investing in those securities. For more information on valuation inputs, and their aggregation into the levels used in the table below, please refer to the security valuation section in the accompanying Notes to Financial Statements.
Valuation inputs at Reporting Date:
| Description | | Level 1 | | | Level 2 | | | Level 3 | | | Total | |
| | | | | | | | | | | | | |
| Common Stocks | | | | | | | | | | | | |
| India | | $ | 14,376,210 | | | $ | 157,661,627 | | | $ | — | | | $ | 172,037,837 | |
| China | | | 87,083,755 | | | | 39,339,638 | | | | — | | | | 126,423,393 | |
| South Korea | | | — | | | | 37,687,458 | | | | — | | | | 37,687,458 | |
| South Africa | | | — | | | | 36,388,829 | | | | — | | | | 36,388,829 | |
| Netherlands | | | 26,172,116 | | | | — | | | | — | | | | 26,172,116 | |
| Thailand | | | — | | | | 17,285,581 | | | | — | | | | 17,285,581 | |
| United States | | | 16,331,572 | | | | — | | | | — | | | | 16,331,572 | |
| Taiwan | | | 15,313,374 | | | | — | | | | — | | | | 15,313,374 | |
| Macau | | | — | | | | 14,680,311 | | | | — | | | | 14,680,311 | |
| Philippines | | | 7,037,938 | | | | 6,858,885 | | | | — | | | | 13,896,823 | |
| Indonesia | | | 4,603,432 | | | | 9,255,840 | | | | — | | | | 13,859,272 | |
| Brazil | | | 13,799,636 | | | | — | | | | — | | | | 13,799,636 | |
| Cambodia | | | — | | | | 10,172,283 | | | | — | | | | 10,172,283 | |
| Virgin Islands (British) | | | — | | | | 9,882,790 | | | | — | | | | 9,882,790 | |
| Peru | | | 9,561,563 | | | | — | | | | — | | | | 9,561,563 | |
| Mexico | | | 6,803,185 | | | | — | | | | — | | | | 6,803,185 | |
| Malaysia | | | 6,263,392 | | | | — | | | | — | | | | 6,263,392 | |
| Singapore | | | 5,264,217 | | | | — | | | | — | | | | 5,264,217 | |
| Russia | | | — | | | | 4,297,274 | | | | — | | | | 4,297,274 | |
| Short-Term Investment Funds | | | 22,576,828 | | | | — | | | | — | | | | 22,576,828 | |
| Total | | $ | 235,187,218 | | | $ | 343,510,516 | | | $ | — | | | $ | 578,697,734 | |
Touchstone Sands Capital Emerging Markets Growth Fund (Continued)
At March 31, 2018, equity securities valued at $20,546,107 and $7,037,938 were transferred from Level 1 to Level 2 and from Level 2 to Level 1, respectively. Transfers from Level 1 to Level 2 are due to movements of a designated U.S. market index, triggering a systematic valuation model, provided by an independent third party, when required confidence levels are achieved to fair value the international equity securities. Transfers from Level 2 to Level 1 occur when there is no longer movement of the designated U.S. market index or required confidence levels were not reached in the systematic model.
See accompanying Notes to Financial Statements.
Portfolio of Investments
Touchstone Small Cap Growth Fund – March 31, 2018
| | | | | | Market | |
| | | Shares | | | Value | |
| | | | | | | |
| Common Stocks — 98.6% | | | | | | | | |
| | | | | | | | | |
| Information Technology — 26.8% | | | | | | | | |
| | | | | | | | | |
| Advanced Energy Industries, Inc.* | | | 25,330 | | | $ | 1,618,587 | |
| Alarm.com Holdings, Inc.* | | | 44,350 | | | | 1,673,769 | |
| Entegris, Inc. | | | 72,480 | | | | 2,522,304 | |
| Envestnet, Inc.* | | | 35,411 | | | | 2,029,050 | |
| EPAM Systems, Inc.* | | | 17,352 | | | | 1,987,151 | |
| ePlus, Inc.* | | | 20,531 | | | | 1,595,259 | |
| Euronet Worldwide, Inc.* | | | 55,754 | | | | 4,400,106 | |
| ExlService Holdings, Inc.* | | | 38,535 | | | | 2,149,097 | |
| Fair Isaac Corp.* | | | 12,076 | | | | 2,045,312 | |
| GrubHub, Inc.* | | | 46,920 | | | | 4,760,972 | |
| Instructure, Inc.* | | | 27,562 | | | | 1,161,738 | |
| Nutanix, Inc. - Class A* | | | 57,551 | | | | 2,826,330 | |
| Paycom Software, Inc.* | | | 21,158 | | | | 2,272,158 | |
| Pegasystems, Inc. | | | 36,149 | | | | 2,192,437 | |
| Qualys, Inc.* | | | 37,427 | | | | 2,722,814 | |
| Quotient Technology, Inc.* | | | 140,669 | | | | 1,842,764 | |
| RealPage, Inc.* | | | 47,212 | | | | 2,431,418 | |
| Rogers Corp.* | | | 11,408 | | | | 1,363,712 | |
| Semtech Corp.* | | | 46,035 | | | | 1,797,667 | |
| Trade Desk, Inc. (The) - Class A*† | | | 24,505 | | | | 1,215,938 | |
| TTM Technologies, Inc.* | | | 112,230 | | | | 1,715,997 | |
| Varonis Systems, Inc.* | | | 22,826 | | | | 1,380,973 | |
| Xperi Corp. | | | 36,846 | | | | 779,293 | |
| Yelp, Inc.* | | | 29,832 | | | | 1,245,486 | |
| | | | | | | | 49,730,332 | |
| | | | | | | | | |
| Health Care — 26.3% | | | | | | | | |
| Achaogen, Inc.*† | | | 53,736 | | | | 695,881 | |
| AMN Healthcare Services, Inc.* | | | 42,766 | | | | 2,426,971 | |
| Array BioPharma, Inc.* | | | 52,766 | | | | 861,141 | |
| BioTelemetry, Inc.* | | | 43,358 | | | | 1,346,266 | |
| Cambrex Corp.* | | | 33,398 | | | | 1,746,715 | |
| Cantel Medical Corp. | | | 18,313 | | | | 2,040,251 | |
| Catalent, Inc.* | | | 44,367 | | | | 1,821,709 | |
| Charles River Laboratories International, Inc.* | | | 26,695 | | | | 2,849,424 | |
| Chemed Corp. | | | 12,331 | | | | 3,364,637 | |
| CryoPort, Inc.*† | | | 46,209 | | | | 397,397 | |
| Editas Medicine, Inc.* | | | 13,215 | | | | 438,077 | |
| Encompass Health Corp. | | | 38,987 | | | | 2,228,887 | |
| Exact Sciences Corp.* | | | 22,114 | | | | 891,858 | |
| FibroGen, Inc.* | | | 16,381 | | | | 756,802 | |
| Globus Medical, Inc. - Class A* | | | 44,117 | | | | 2,197,909 | |
| Heska Corp.* | | | 11,895 | | | | 940,538 | |
| ICON PLC (Ireland)* | | | 36,550 | | | | 4,318,017 | |
| ICU Medical, Inc.* | | | 12,296 | | | | 3,103,510 | |
| Intersect ENT, Inc.* | | | 28,018 | | | | 1,101,107 | |
| LeMaitre Vascular, Inc. | | | 39,262 | | | | 1,422,462 | |
| Merit Medical Systems, Inc.* | | | 57,234 | | | | 2,595,562 | |
| Nektar Therapeutics* | | | 23,982 | | | | 2,548,327 | |
| NuVasive, Inc.* | | | 17,199 | | | | 897,960 | |
| OraSure Technologies, Inc.* | | | 59,288 | | | | 1,001,374 | |
| PetIQ, Inc.*† | | | 75,889 | | | | 2,018,647 | |
| Portola Pharmaceuticals, Inc.* | | | 15,815 | | | | 516,518 | |
| Repligen Corp.* | | | 19,583 | | | | 708,513 | |
| Sage Therapeutics, Inc.* | | | 9,750 | | | | 1,570,432 | |
| Sangamo Therapeutics, Inc.* | | | 18,728 | | | | 355,832 | |
| Supernus Pharmaceuticals, Inc.* | | | 34,941 | | | | 1,600,298 | |
| | | | | | | | 48,763,022 | |
| | | | | | | | | |
| Industrials — 13.8% | | | | | | | | |
| Argan, Inc. | | | 26,618 | | | | 1,143,243 | |
| Beacon Roofing Supply, Inc.* | | | 34,338 | | | | 1,822,318 | |
| Brink's Co. (The) | | | 26,932 | | | | 1,921,598 | |
| Curtiss-Wright Corp. | | | 15,064 | | | | 2,034,694 | |
| EMCOR Group, Inc. | | | 52,693 | | | | 4,106,366 | |
| ITT, Inc. | | | 52,955 | | | | 2,593,736 | |
| MasTec, Inc.* | | | 47,397 | | | | 2,230,029 | |
| Mercury Systems, Inc.* | | | 40,714 | | | | 1,967,300 | |
| On Assignment, Inc. | | | 24,028 | | | | 1,967,413 | |
| Raven Industries, Inc. | | | 24,452 | | | | 857,043 | |
| Trex Co., Inc.* | | | 20,302 | | | | 2,208,249 | |
| TriNet Group, Inc.* | | | 45,520 | | | | 2,108,486 | |
| Willdan Group, Inc.* | | | 25,950 | | | | 735,682 | |
| | | | | | | | 25,696,157 | |
| | | | | | | | | |
| Consumer Discretionary — 11.2% | | | | | | | | |
| Boyd Gaming Corp. | | | 48,839 | | | | 1,556,011 | |
| Cable One, Inc. | | | 3,966 | | | | 2,725,078 | |
| Chegg, Inc.* | | | 87,519 | | | | 1,808,143 | |
| Grand Canyon Education, Inc.* | | | 34,429 | | | | 3,612,291 | |
| LCI Industries | | | 16,732 | | | | 1,742,638 | |
| Lithia Motors, Inc. - Class A | | | 25,891 | | | | 2,602,563 | |
| Marriott Vacations Worldwide Corp. | | | 13,964 | | | | 1,860,005 | |
| Nutrisystem, Inc. | | | 45,227 | | | | 1,218,868 | |
| TopBuild Corp.* | | | 27,632 | | | | 2,114,401 | |
| Visteon Corp.* | | | 14,556 | | | | 1,604,653 | |
| | | | | | | | 20,844,651 | |
| | | | | | | | | |
| Financials — 9.1% | | | | | | | | |
| Artisan Partners Asset Management, Inc. - Class A | | | 54,616 | | | | 1,818,713 | |
| Evercore, Inc. - Class A | | | 42,396 | | | | 3,696,931 | |
| National Western Life Group, Inc. - Class A | | | 2,695 | | | | 821,652 | |
| Primerica, Inc. | | | 29,091 | | | | 2,810,191 | |
| Texas Capital Bancshares, Inc.* | | | 30,553 | | | | 2,746,715 | |
| Trupanion, Inc.*† | | | 52,697 | | | | 1,575,113 | |
| Western Alliance Bancorp* | | | 57,541 | | | | 3,343,708 | |
| | | | | | | | 16,813,023 | |
| | | | | | | | | |
| Materials — 5.8% | | | | | | | | |
| KMG Chemicals, Inc. | | | 18,839 | | | | 1,129,398 | |
| Louisiana-Pacific Corp. | | | 94,864 | | | | 2,729,237 | |
| Materion Corp. | | | 28,746 | | | | 1,467,483 | |
| PolyOne Corp. | | | 37,013 | | | | 1,573,793 | |
| Trinseo SA (Luxembourg) | | | 35,045 | | | | 2,595,082 | |
| Tronox Ltd. (Australia) | | | 68,848 | | | | 1,269,557 | |
| | | | | | | | 10,764,550 | |
| | | | | | | | | |
| Real Estate — 3.3% | | | | | | | | |
| CareTrust REIT, Inc. | | | 138,691 | | | | 1,858,459 | |
| CoreSite Realty Corp. | | | 22,272 | | | | 2,232,991 | |
Touchstone Small Cap Growth Fund (Continued)
| | | | | | Market | |
| | | Shares | | | Value | |
| | | | | | | |
| Common Stocks — 98.6% (Continued) | | | | | | | | |
| | | | | | | | | |
| Real Estate — (Continued) | | | | | | | | |
| HFF, Inc. - Class A | | | 39,113 | | | $ | 1,943,916 | |
| | | | | | | | 6,035,366 | |
| | | | | | | | | |
| Energy — 2.3% | | | | | | | | |
| Matador Resources Co.* | | | 68,520 | | | | 2,049,433 | |
| ProPetro Holding Corp.* | | | 71,393 | | | | 1,134,435 | |
| US Silica Holdings, Inc.† | | | 43,995 | | | | 1,122,752 | |
| | | | | | | | 4,306,620 | |
| Total Common Stocks | | | | | | $ | 182,953,721 | |
| | | | | | | | | |
| Short-Term Investment Funds — 5.7% | | | | | | | | |
| Dreyfus Government Cash Management, Institutional Shares, 1.54%∞Ω | | | 3,625,010 | | | | 3,625,010 | |
| Invesco Government & Agency Portfolio, Institutional Class, 1.48%**∞Ω | | | 6,958,978 | | | | 6,958,978 | |
| Total Short-Term Investment Funds | | | | | | $ | 10,583,988 | |
| | | | | | | | | |
| Total Investment Securities —104.3% | | | | | | | | |
| (Cost $161,254,367) | | | | | | $ | 193,537,709 | |
| | | | | | | | | |
| Liabilities in Excess of Other Assets — (4.3%) | | | | | | | (8,051,680 | ) |
| | | | | | | | | |
| Net Assets — 100.0% | | | | | | $ | 185,486,029 | |
| * | Non-income producing security. |
| ** | Represents collateral for securities loaned. |
| † | All or a portion of the security is on loan. The total market value of the securities on loan as of March 31, 2018 was $6,882,652. |
| W | Represents the 7-day SEC yield as of March 31, 2018. |
Portfolio Abbreviations:
PLC - Public Limited Company
REIT - Real Estate Investment Trust
Other Information:
The inputs or methodology used for valuing securities may not be an indication of the risk associated with investing in those securities. For more information on valuation inputs, and their aggregation into the levels used in the table below, please refer to the security valuation section in the accompanying Notes to Financial Statements.
Valuation inputs at Reporting Date:
| Description | | Level 1 | | | Level 2 | | | Level 3 | | | Total | |
| Common Stocks | | $ | 182,953,721 | | | $ | — | | | $ | — | | | $ | 182,953,721 | |
| Short-Term Investment Funds | | | 10,583,988 | | | | — | | | | — | | | | 10,583,988 | |
| Total | | $ | 193,537,709 | | | $ | — | | | $ | — | | | $ | 193,537,709 | |
See accompanying Notes to Financial Statements.
Portfolio of Investments
Touchstone Sustainability and Impact Equity Fund – March 31, 2018
| | | | | | Market | |
| | | Shares | | | Value | |
| | | | | | | |
| Common Stocks — 99.4% | | | | | | | | |
| | | | | | | | | |
| United States — 54.9% | | | | | | | | |
| | | | | | | | | |
| Consumer Discretionary — 9.7% | | | | | | | | |
| Amazon.com, Inc.* | | | 9,650 | | | $ | 13,966,831 | |
| Comcast Corp. - Class A | | | 630,169 | | | | 21,532,875 | |
| Foot Locker, Inc. | | | 69,820 | | | | 3,179,603 | |
| Ford Motor Co. | | | 262,028 | | | | 2,903,270 | |
| Home Depot, Inc. (The) | | | 36,000 | | | | 6,416,640 | |
| Marriott International, Inc. - Class A | | | 25,008 | | | | 3,400,588 | |
| NIKE, Inc. - Class B | | | 65,209 | | | | 4,332,486 | |
| Ross Stores, Inc. | | | 169,753 | | | | 13,237,339 | |
| Time Warner, Inc. | | | 45,000 | | | | 4,256,100 | |
| | | | | | | | | |
| Consumer Staples — 1.5% | | | | | | | | |
| CVS Health Corp. | | | 180,407 | | | | 11,223,119 | |
| | | | | | | | | |
| Energy — 3.6% | | | | | | | | |
| ConocoPhillips | | | 241,560 | | | | 14,322,092 | |
| EOG Resources, Inc. | | | 125,750 | | | | 13,237,703 | |
| | | | | | | | | |
| Financials — 9.4% | | | | | | | | |
| American Express Co. | | | 40,000 | | | | 3,731,200 | |
| Comerica, Inc. | | | 167,552 | | | | 16,073,263 | |
| Discover Financial Services | | | 42,000 | | | | 3,021,060 | |
| Fifth Third Bancorp | | | 634,917 | | | | 20,158,615 | |
| JPMorgan Chase & Co. | | | 94,162 | | | | 10,354,995 | |
| Reinsurance Group of America, Inc. | | | 35,322 | | | | 5,439,588 | |
| Synchrony Financial | | | 358,223 | | | | 12,011,217 | |
| | | | | | | | | |
| Health Care — 8.2% | | | | | | | | |
| Alnylam Pharmaceuticals, Inc.* | | | 31,048 | | | | 3,697,817 | |
| Becton Dickinson & Co. | | | 41,551 | | | | 9,004,101 | |
| Biogen, Inc.* | | | 31,957 | | | | 8,750,466 | |
| Bristol-Myers Squibb Co. | | | 60,000 | | | | 3,795,000 | |
| Cerner Corp.* | | | 77,936 | | | | 4,520,288 | |
| Danaher Corp. | | | 60,000 | | | | 5,874,600 | |
| DexCom, Inc.* | | | 111,309 | | | | 8,254,675 | |
| Illumina, Inc.* | | | 17,597 | | | | 4,160,283 | |
| Merck & Co., Inc. | | | 110,000 | | | | 5,991,700 | |
| Regeneron Pharmaceuticals, Inc.* | | | 19,411 | | | | 6,684,372 | |
| Spark Therapeutics, Inc.* | | | 21,429 | | | | 1,426,957 | |
| | | | | | | | | |
| Industrials — 6.7% | | | | | | | | |
| Fortive Corp. | | | 31,000 | | | | 2,403,120 | |
| Parker-Hannifin Corp. | | | 22,000 | | | | 3,762,660 | |
| Roper Technologies, Inc. | | | 17,818 | | | | 5,001,334 | |
| Southwest Airlines Co. | | | 419,845 | | | | 24,048,722 | |
| United Continental Holdings, Inc.* | | | 158,684 | | | | 11,023,778 | |
| Xylem, Inc. | | | 58,010 | | | | 4,462,129 | |
| | | | | | | | | |
| Information Technology — 12.7% | | | | | | | | |
| Alphabet, Inc. - Class A* | | | 25,061 | | | | 25,991,766 | |
| Facebook, Inc. - Class A* | | | 80,857 | | | | 12,920,140 | |
| Microsoft Corp. | | | 283,568 | | | | 25,881,251 | |
| NCR Corp.* | | | 234,226 | | | | 7,382,803 | |
| Visa, Inc. - Class A | | | 197,266 | | | | 23,596,959 | |
| | | | | | | | | |
| Materials — 1.2% | | | | | | | | |
| Ecolab, Inc. | | | 47,000 | | | | 6,442,290 | |
| Praxair, Inc. | | | 20,000 | | | | 2,886,000 | |
| | | | | | | | | |
| Telecommunication Services — 0.8% | | | | | | | | |
| Verizon Communications, Inc. | | | 120,000 | | | | 5,738,400 | |
| | | | | | | | | |
| Utilities — 1.1% | | | | | | | | |
| American Water Works Co., Inc. | | | 100,812 | | | | 8,279,690 | |
| Total United States | | | | | | | 414,779,885 | |
| | | | | | | | | |
| Japan — 10.4% | | | | | | | | |
| | | | | | | | | |
| Consumer Discretionary — 2.3% | | | | | | | | |
| Sony Corp. | | | 240,400 | | | | 11,626,318 | |
| Start Today Co. Ltd. | | | 199,600 | | | | 5,331,171 | |
| | | | | | | | | |
| Industrials — 3.1% | | | | | | | | |
| Amada Holdings Co. Ltd. | | | 618,300 | | | | 7,507,576 | |
| Kinden Corp. | | | 548,100 | | | | 9,076,192 | |
| Mitsubishi Electric Corp. | | | 442,300 | | | | 7,072,726 | |
| | | | | | | | | |
| Information Technology — 1.5% | | | | | | | | |
| Kyocera Corp. | | | 198,400 | | | | 11,194,903 | |
| | | | | | | | | |
| Telecommunication Services — 2.7% | | | | | | | | |
| Nippon Telegraph & Telephone Corp. | | | 449,500 | | | | 20,699,685 | |
| | | | | | | | | |
| Utilities — 0.8% | | | | | | | | |
| Tokyo Gas Co. Ltd. | | | 238,100 | | | | 6,313,605 | |
| Total Japan | | | | | | | 78,822,176 | |
| | | | | | | | | |
| Germany — 4.9% | | | | | | | | |
| | | | | | | | | |
| Consumer Discretionary — 0.5% | | | | | | | | |
| Bayerische Motoren Werke AG | | | 35,290 | | | | 3,838,488 | |
| | | | | | | | | |
| Industrials — 1.1% | | | | | | | | |
| KION Group AG | | | 91,538 | | | | 8,546,058 | |
| | | | | | | | | |
| Materials — 1.7% | | | | | | | | |
| HeidelbergCement AG | | | 126,868 | | | | 12,463,773 | |
| | | | | | | | | |
| Real Estate — 1.6% | | | | | | | | |
| Vonovia SE | | | 245,346 | | | | 12,166,673 | |
| Total Germany | | | | | | | 37,014,992 | |
| | | | | | | | | |
| United Kingdom — 4.7% | | | | | | | | |
| | | | | | | | | |
| Consumer Discretionary — 1.9% | | | | | | | | |
| Berkeley Group Holdings PLC | | | 43,928 | | | | 2,335,187 | |
| Compass Group PLC | | | 574,085 | | | | 11,722,189 | |
| | | | | | | | | |
| Financials — 2.8% | | | | | | | | |
| Lloyds Banking Group PLC | | | 10,722,651 | | | | 9,753,588 | |
| Prudential PLC | | | 463,627 | | | | 11,585,402 | |
| Total United Kingdom | | | | | | | 35,396,366 | |
Touchstone Sustainability and Impact Equity Fund (Continued)
| | | | | | Market | |
| | | Shares | | | Value | |
| | | | | | | |
| Common Stocks — 99.4% (Continued) | | | | | | | | |
| | | | | | | | | |
| France — 3.9% | | | | | | | | |
| | | | | | | | | |
| Financials — 2.0% | | | | | | | | |
| BNP Paribas SA | | | 197,584 | | | $ | 14,652,982 | |
| | | | | | | | | |
| Industrials — 1.9% | | | | | | | | |
| Cie de Saint-Gobain | | | 179,335 | | | | 9,469,798 | |
| Schneider Electric SE | | | 57,112 | | | | 5,029,366 | |
| Total France | | | | | | | 29,152,146 | |
| | | | | | | | | |
| China — 3.2% | | | | | | | | |
| | | | | | | | | |
| Consumer Discretionary — 0.7% | | | | | | | | |
| Shenzhou International Group Holdings Ltd. | | | 477,000 | | | | 5,053,748 | |
| | | | | | | | | |
| Information Technology — 2.5% | | | | | | | | |
| Tencent Holdings Ltd. | | | 349,000 | | | | 18,734,170 | |
| Total China | | | | | | | 23,787,918 | |
| | | | | | | | | |
| Netherlands — 3.0% | | | | | | | | |
| | | | | | | | | |
| Financials — 3.0% | | | | | | | | |
| ABN AMRO Group NV, 144a | | | 262,440 | | | | 7,913,456 | |
| ING Groep NV | | | 871,997 | | | | 14,715,143 | |
| Total Netherlands | | | | | | | 22,628,599 | |
| | | | | | | | | |
| South Korea — 2.4% | | | | | | | | |
| | | | | | | | | |
| Information Technology — 1.0% | | | | | | | | |
| Samsung SDI Co. Ltd. | | | 43,821 | | | | 7,914,009 | |
| | | | | | | | | |
| Telecommunication Services — 1.4% | | | | | | | | |
| KT Corp. ADR* | | | 764,295 | | | | 10,470,842 | |
| Total South Korea | | | | | | | 18,384,851 | |
| | | | | | | | | |
| Switzerland — 1.9% | | | | | | | | |
| | | | | | | | | |
| Health Care — 1.9% | | | | | | | | |
| Novartis AG | | | 178,830 | | | | 14,463,927 | |
| | | | | | | | | |
| Jersey — 1.8% | | | | | | | | |
| | | | | | | | | |
| Health Care — 1.8% | | | | | | | | |
| Shire PLC ADR | | | 88,596 | | | | 13,235,356 | |
| | | | | | | | | |
| Ireland — 1.5% | | | | | | | | |
| | | | | | | | | |
| Health Care — 1.5% | | | | | | | | |
| Medtronic PLC | | | 141,830 | | | | 11,377,603 | |
| | | | | | | | | |
| Sweden — 1.4% | | | | | | | | |
| | | | | | | | | |
| Financials — 1.4% | | | | | | | | |
| Swedbank AB - Class A† | | | 485,090 | | | | 10,900,141 | |
| | | | | | | | | |
| Liberia — 1.1% | | | | | | | | |
| | | | | | | | | |
| Consumer Discretionary — 1.1% | | | | | | | | |
| Royal Caribbean Cruises Ltd. | | | 73,011 | | | | 8,596,315 | |
| | | | | | | | | |
| Italy — 0.9% | | | | | | | | |
| | | | | | | | | |
| Consumer Discretionary — 0.9% | | | | | | | | |
| Luxottica Group SpA | | | 113,087 | | | | 7,025,493 | |
| | | | | | | | | |
| Indonesia — 0.8% | | | | | | | | |
| | | | | | | | | |
| Financials — 0.8% | | | | | | | | |
| Bank Rakyat Indonesia Persero Tbk PT | | | 22,814,500 | | | | 5,987,428 | |
| | | | | | | | | |
| Mexico — 0.7% | | | | | | | | |
| | | | | | | | | |
| Materials — 0.7% | | | | | | | | |
| Cemex SAB de CV ADR* | | | 792,768 | | | | 5,248,124 | |
| | | | | | | | | |
| India — 0.7% | | | | | | | | |
| | | | | | | | | |
| Financials — 0.7% | | | | | | | | |
| ICICI Bank Ltd. ADR | | | 588,914 | | | | 5,211,889 | |
| | | | | | | | | |
| Curacao — 0.6% | | | | | | | | |
| | | | | | | | | |
| Energy — 0.6% | | | | | | | | |
| Schlumberger Ltd. | | | 67,000 | | | | 4,340,260 | |
| | | | | | | | | |
| Belgium — 0.6% | | | | | | | | |
| | | | | | | | | |
| Health Care — 0.6% | | | | | | | | |
| Galapagos NV*† | | | 41,637 | | | | 4,155,780 | |
| Total Common Stocks | | | | | | $ | 750,509,249 | |
| | | | | | | | | |
| Short-Term Investment Funds — 1.8% | | | | | | | | |
| Dreyfus Government Cash Management, Institutional Shares, 1.54%∞Ω | | | 363,418 | | | | 363,418 | |
| Invesco Government & Agency Portfolio, Institutional Class, 1.48%**∞Ω | | | 13,292,220 | | | | 13,292,220 | |
| Total Short-Term Investment Funds | | | | | | $ | 13,655,638 | |
| | | | | | | | | |
| Total Investment Securities —101.2% | | | | | | | | |
| (Cost $640,574,058) | | | | | | $ | 764,164,887 | |
| | | | | | | | | |
| Liabilities in Excess of Other Assets — (1.2%) | | | | | | | (9,206,061 | ) |
| | | | | | | | | |
| Net Assets — 100.0% | | | | | | $ | 754,958,826 | |
| * | Non-income producing security. |
| ** | Represents collateral for securities loaned. |
| † | All or a portion of the security is on loan. The total market value of the securities on loan as of March 31, 2018 was $12,647,600. |
| Ω | Represents the 7-day SEC yield as of March 31, 2018. |
Touchstone Sustainability and Impact Equity Fund (Continued)
Portfolio Abbreviations:
ADR - American Depositary Receipt
PLC - Public Limited Company
144a - This is a restricted security that was sold in a transaction qualifying for the exemption under Rule 144a of the Securities Act of 1933. This security may be sold in transactions exempt from registration, normally to qualified institutional buyers. At March 31, 2018, these securities were valued at $7,913,456 or 1.0% of net assets. These securities were deemed liquid pursuant to procedures approved by the Board of Trustees.
Other Information:
The inputs or methodology used for valuing securities may not be an indication of the risk associated with investing in those securities. For more information on valuation inputs, and their aggregation into the levels used in the table below, please refer to the security valuation section in the accompanying Notes to Financial Statements.
| | | Valuation inputs at Reporting Date: | | | |
| Description | | Level 1 | | | Level 2 | | | Level 3 | | | Total | |
| Common Stocks | | | | | | | | | | | | | | | | |
| United States | | $ | 414,779,885 | | | $ | — | | | $ | — | | | $ | 414,779,885 | |
| Japan | | | 78,822,176 | | | | — | | | | — | | | | 78,822,176 | |
| Germany | | | — | | | | 37,014,992 | | | | — | | | | 37,014,992 | |
| United Kingdom | | | — | | | | 35,396,366 | | | | — | | | | 35,396,366 | |
| France | | | — | | | | 29,152,146 | | | | — | | | | 29,152,146 | |
| China | | | — | | | | 23,787,918 | | | | — | | | | 23,787,918 | |
| Netherlands | | | — | | | | 22,628,599 | | | | — | | | | 22,628,599 | |
| South Korea | | | 18,384,851 | | | | — | | | | — | | | | 18,384,851 | |
| Switzerland | | | — | | | | 14,463,927 | | | | — | | | | 14,463,927 | |
| Jersey | | | 13,235,356 | | | | — | | | | — | | | | 13,235,356 | |
| Ireland | | | 11,377,603 | | | | — | | | | — | | | | 11,377,603 | |
| Sweden | | | — | | | | 10,900,141 | | | | — | | | | 10,900,141 | |
| Liberia | | | 8,596,315 | | | | — | | | | — | | | | 8,596,315 | |
| Italy | | | — | | | | 7,025,493 | | | | — | | | | 7,025,493 | |
| Indonesia | | | — | | | | 5,987,428 | | | | — | | | | 5,987,428 | |
| Mexico | | | 5,248,124 | | | | — | | | | — | | | | 5,248,124 | |
| India | | | 5,211,889 | | | | — | | | | — | | | | 5,211,889 | |
| Curacao | | | 4,340,260 | | | | — | | | | — | | | | 4,340,260 | |
| Belgium | | | — | | | | 4,155,780 | | | | — | | | | 4,155,780 | |
| Short-Term Investment Funds | | | 13,655,638 | | | | — | | | | — | | | | 13,655,638 | |
| Total | | $ | 573,652,097 | | | $ | 190,512,790 | | | $ | — | | | $ | 764,164,887 | |
At March 31, 2018, equity securities valued at $54,791,960 were transferred from Level 2 to Level 1. Transfers from Level 1 to Level 2 are due to movements of a designated U.S. market index, triggering a systematic valuation model, provided by an independent third party, when required confidence levels are achieved to fair value the international equity securities. Transfers from Level 2 to Level 1 occur when there is no longer movement of the designated U.S. market index or required confidence levels were not reached in the systematic model.
See accompanying Notes to Financial Statements.
Statements of Assets and Liabilities
March 31, 2018
| | | Touchstone | | | | | | Touchstone | | | Touchstone | |
| | | Flexible | | | Touchstone | | | Growth | | | International | |
| | | Income | | | Focused | | | Opportunities | | | Growth | |
| | | Fund | | | Fund | | | Fund | | | Fund | |
| Assets | | | | | | | | | | | | | | | | |
| Investments, at cost | | $ | 933,990,877 | | | $ | 900,895,689 | | | $ | 222,246,379 | | | $ | 12,810,360 | |
| Investments, at market value (A) | | $ | 935,739,528 | | | $ | 1,203,686,315 | | | $ | 283,860,080 | | | $ | 15,455,066 | |
| Cash | | | 659,678 | | | | 243,229 | | | | 88,045 | | | | — | |
| Cash deposits held at prime broker* | | | 7,155,592 | | | | — | | | | — | | | | — | |
| Foreign Currency (B) | | | 121,989 | | | | — | | | | — | | | | — | |
| Unrealized appreciation on forward foreign currency contracts | | | 571,421 | | | | — | | | | — | | | | — | |
| Dividends and interest receivable | | | 6,982,793 | | | | 2,060,385 | | | | 53,954 | | | | 11,774 | |
| Receivable for capital shares sold | | | 3,690,383 | | | | 627,781 | | | | 34,615 | | | | 5,730 | |
| Receivable for investments sold | | | 1,232,106 | | | | — | | | | — | | | | — | |
| Unrealized appreciation on futures contracts | | | 347,910 | | | | — | | | | — | | | | — | |
| Receivable for securities lending income | | | 3,923 | | | | — | | | | — | | | | 488 | |
| Receivable from other affiliates | | | — | | | | — | | | | — | | | | — | |
| Receivable from Investment Advisor | | | — | | | | — | | | | — | | | | 1,611 | |
| Tax reclaim receivable | | | — | | | | 144,699 | | | | — | | | | 7,970 | |
| Other assets | | | 108,065 | | | | 41,084 | | | | 20,524 | | | | 2,637 | |
| Total Assets | | | 956,613,388 | | | | 1,206,803,493 | | | | 284,057,218 | | | | 15,485,276 | |
| Liabilities | | | | | | | | | | | | | | | | |
| Bank overdrafts | | | — | | | | — | | | | — | | | | 7 | |
| Foreign currency (B) | | | — | | | | — | | | | — | | | | — | |
| Unrealized depreciation on forward foreign currency contracts | | | 37,213 | | | | — | | | | — | | | | — | |
| Payable for return of collateral for securities on loan | | | — | | | | — | | | | — | | | | 114,510 | |
| Deferred foreign capital gains tax (C) | | | — | | | | — | | | | — | | | | — | |
| Payable for capital shares redeemed | | | 2,473,558 | | | | 1,577,499 | | | | 118,768 | | | | 10,468 | |
| Payable for investments purchased | | | — | | | | — | | | | 1,670,702 | | | | — | |
| Unrealized depreciation on futures contracts | | | 343,810 | | | | — | | | | — | | | | — | |
| Payable to Investment Advisor | | | 503,078 | | | | 656,177 | | | | 167,728 | | | | — | |
| Payable to other affiliates | | | 247,863 | | | | 226,130 | | | | 37,965 | | | | 111 | |
| Payable to Trustees | | | 3,528 | | | | 3,528 | | | | 3,528 | | | | 3,528 | |
| Payable for professional services | | | 55,687 | | | | 32,973 | | | | 24,310 | | | | 26,992 | |
| Payable for reports to shareholders | | | 30,996 | | | | 33,378 | | | | 11,697 | | | | 8,474 | |
| Payable to Transfer Agent | | | 218,164 | | | | 450,797 | | | | 53,976 | | | | 144 | |
| Other accrued expenses and liabilities | | | 20,439 | | | | 5,265 | | | | 3,903 | | | | 3,120 | |
| Total Liabilities | | | 3,934,336 | | | | 2,985,747 | | | | 2,092,577 | | | | 167,354 | |
| | | | | | | | | | | | | | | | | |
| Net Assets | | $ | 952,679,052 | | | $ | 1,203,817,746 | | | $ | 281,964,641 | | | $ | 15,317,922 | |
| Net assets consist of: | | | | | | | | | | | | | | | | |
| Paid-in capital | | $ | 945,486,256 | | | $ | 869,408,594 | | | $ | 215,039,802 | | | $ | 12,303,715 | |
| Accumulated net investment income (loss) | | | 808,064 | | | | 4,572,920 | | | | — | | | | 19,392 | |
| Accumulated net realized gains (losses) on investments, futures contracts, written options, swap agreements, securities sold short, forward foreign currency contracts and foreign currency transactions | | | 4,098,606 | | | | 27,045,606 | | | | 5,311,138 | | | | 350,109 | |
| Net unrealized appreciation on investments, futures contracts, forward foreign currency contracts and foreign currency transactions | | | 2,286,126 | | | | 302,790,626 | | | | 61,613,701 | | | | 2,644,706 | |
| Net Assets | | $ | 952,679,052 | | | $ | 1,203,817,746 | | | $ | 281,964,641 | | | $ | 15,317,922 | |
| (A) Includes market value of securities on loan of: | | $ | — | | | $ | — | | | $ | — | | | $ | 107,297 | |
| (B) Cost of foreign currency: | | $ | 121,793 | | | $ | — | | | $ | — | | | $ | — | |
| (C) See Note 2 in Notes to Financial Statements. | | | | | | | | | | | | | | | | |
| * | Represents segregated cash for futures contracts, securities sold short and swap agreements. |
See accompanying Notes to Financial Statements.
Statements of Assets and Liabilities (Continued)
| | | | | | | Touchstone | | | | | | | |
| Touchstone | | | Touchstone | | | Sands Capital | | | | | | Touchstone | |
| International | | | Mid Cap | | | Emerging | | | Touchstone | | | Sustainability | |
| Value | | | Growth | | | Markets | | | Small Cap | | | and Impact | |
| Fund | | | Fund | | | Growth Fund | | | Growth Fund | | | Equity Fund | |
| | | | | | | | | | | | | | |
| $ | 25,045,431 | | | $ | 586,365,218 | | | $ | 452,251,792 | | | $ | 161,254,367 | | | $ | 640,574,058 | |
| $ | 25,656,162 | | | $ | 775,465,466 | | | $ | 578,697,734 | | | $ | 193,537,709 | | | $ | 764,164,887 | |
| | 13,862 | | | | 90,889 | | | | — | | | | — | | | | 82,563 | |
| | — | | | | — | | | | — | | | | — | | | | — | |
| | 19,164 | | | | — | | | | 3 | | | | — | | | | — | |
| | — | | | | — | | | | — | | | | — | | | | — | |
| | 95,671 | | | | 391,642 | | | | 174,476 | | | | 85,630 | | | | 2,127,648 | |
| | 47 | | | | 1,480,167 | | | | 8,482,947 | | | | 46,773 | | | | 1,554,074 | |
| | — | | | | 11,627,175 | | | | — | | | | — | | | | 4,158,967 | |
| | — | | | | — | | | | — | | | | — | | | | — | |
| | 721 | | | | 555 | | | | 2,774 | | | | 16,412 | | | | 48,933 | |
| | — | | | | — | | | | — | | | | 11,153 | | | | — | |
| | — | | | | — | | | | — | | | | — | | | | — | |
| | 49,888 | | | | — | | | | 1,266 | | | | — | | | | 209,353 | |
| | 8,366 | | | | 37,246 | | | | 120,909 | | | | 30,558 | | | | 27,170 | |
| | 25,843,881 | | | | 789,093,140 | | | | 587,480,109 | | | | 193,728,235 | | | | 772,373,595 | |
| | | | | | | | | | | | | | | | | | | |
| | — | | | | — | | | | — | | | | — | | | | — | |
| | — | | | | — | | | | — | | | | — | | | | 128 | |
| | — | | | | — | | | | — | | | | — | | | | — | |
| | 1,274,491 | | | | 211,200 | | | | 2,405,416 | | | | 6,958,978 | | | | 13,292,220 | |
| | — | | | | — | | | | 910,399 | | | | — | | | | — | |
| | 746,544 | | | | 954,049 | | | | 174,945 | | | | 943,422 | | | | 1,153,666 | |
| | 83,133 | | | | 6,932,770 | | | | 1,650,022 | | | | — | | | | 1,911,812 | |
| | — | | | | — | | | | — | | | | — | | | | — | |
| | 3,373 | | | | 485,243 | | | | 452,175 | | | | 228,673 | | | | 421,325 | |
| | 111 | | | | 222,155 | | | | 70,740 | | | | — | | | | 332,504 | |
| | 3,528 | | | | 3,528 | | | | 3,528 | | | | 3,528 | | | | 3,528 | |
| | 27,085 | | | | 29,260 | | | | 32,688 | | | | 22,193 | | | | 49,885 | |
| | 8,700 | | | | 36,244 | | | | 12,771 | | | | 19,012 | | | | 25,064 | |
| | 6,640 | | | | 192,591 | | | | 76,956 | | | | 61,568 | | | | 206,199 | |
| | 19,459 | | | | 4,560 | | | | 29,178 | | | | 4,832 | | | | 18,438 | |
| | 2,173,064 | | | | 9,071,600 | | | | 5,818,818 | | | | 8,242,206 | | | | 17,414,769 | |
| | | | | | | | | | | | | | | | | | | |
| $ | 23,670,817 | | | $ | 780,021,540 | | | $ | 581,661,291 | | | $ | 185,486,029 | | | $ | 754,958,826 | |
| | | | | | | | | | | | | | | | | | | |
| $ | 32,202,870 | | | $ | 553,706,291 | | | $ | 465,812,245 | | | $ | 141,160,081 | | | $ | 621,692,292 | |
| | 479,863 | | | | — | | | | (1,475,036 | ) | | | — | | | | (764,327 | ) |
| | | | | | | | | | | | | | | | | | | |
| | | | | | | | | | | | | | | | | | | |
| | (9,623,262 | ) | | | 37,215,001 | | | | (8,214,092 | ) | | | 12,042,606 | | | | 10,447,423 | |
| | | | | | | | | | | | | | | | | | | |
| | | | | | | | | | | | | | | | | | | |
| | 611,346 | | | | 189,100,248 | | | | 125,538,174 | | | | 32,283,342 | | | | 123,583,438 | |
| $ | 23,670,817 | | | $ | 780,021,540 | | | $ | 581,661,291 | | | $ | 185,486,029 | | | $ | 754,958,826 | |
| $ | 1,012,212 | | | $ | 199,980 | | | $ | 2,311,542 | | | $ | 6,882,652 | | | $ | 12,647,600 | |
| $ | 19,280 | | | $ | — | | | $ | — | | | $ | — | | | $ | (129 | ) |
Statements of Assets and Liabilities (Continued)
| | | Touchstone | | | | | | Touchstone | | | Touchstone | |
| | | Flexible | | | Touchstone | | | Growth | | | International | |
| | | Income | | | Focused | | | Opportunities | | | Growth | |
| | | Fund | | | Fund | | | Fund | | | Fund | |
| Pricing of Class A Shares | | | | | | | | | | | | | | | | |
| Net assets applicable to Class A shares | | $ | 136,608,701 | | | $ | 167,354,011 | | | $ | 39,900,520 | | | $ | 159,440 | |
| Shares of beneficial interest outstanding (unlimited number of shares authorized, no par value) | | | 12,633,524 | | | | 3,898,191 | | | | 1,216,679 | | | | 12,452 | |
| Net asset value price per share* | | $ | 10.81 | | | $ | 42.93 | | | $ | 32.79 | | | $ | 12.80 | |
| Maximum sales charge - Class A shares | | | 5.75 | % | | | 5.75 | % | | | 5.75 | % | | | 5.75 | % |
| Maximum offering price per share (100%/(100%-maximum sales charge) of net asset value adjusted to the nearest cent) - Class A shares | | $ | 11.47 | | | $ | 45.55 | | | $ | 34.79 | | | $ | 13.58 | |
| | | | | | | | | | | | | | | | | |
| Pricing of Class C Shares | | | | | | | | | | | | | | | | |
| Net assets applicable to Class C shares | | $ | 100,799,657 | | | $ | 41,634,961 | | | $ | 8,679,720 | | | $ | 40,396 | |
| Shares of beneficial interest outstanding (unlimited number of shares authorized, no par value) | | | 9,449,824 | | | | 1,018,238 | | | | 320,463 | | | | 3,188 | |
| Net asset value and offering price per share** | | $ | 10.67 | | | $ | 40.89 | | | $ | 27.08 | | | $ | 12.67 | |
| | | | | | | | | | | | | | | | | |
| Pricing of Class Y Shares | | | | | | | | | | | | | | | | |
| Net assets applicable to Class Y shares | | $ | 628,693,020 | | | $ | 972,273,136 | | | $ | 47,553,806 | | | $ | 31,611 | |
| Shares of beneficial interest outstanding (unlimited number of shares authorized, no par value) | | | 57,963,807 | | | | 22,348,601 | | | | 1,411,562 | | | | 2,470 | |
| Net asset value, offering price and redemption price per share | | $ | 10.85 | | | $ | 43.50 | | | $ | 33.69 | | | $ | 12.80 | |
| | | | | | | | | | | | | | | | | |
| Pricing of Institutional Class Shares | | | | | | | | | | | | | | | | |
| Net assets applicable to Institutional Class Shares | | $ | 86,577,674 | | | $ | 22,555,638 | | | $ | 185,830,595 | | | $ | 15,086,475 | |
| Shares of beneficial interest outstanding (unlimited number of shares authorized, no par value) | | | 7,984,538 | | | | 516,372 | | | | 5,453,385 | | | | 1,176,347 | |
| Net asset value, offering price and redemption price per share | | $ | 10.84 | | | $ | 43.68 | | | $ | 34.08 | | | $ | 12.82 | |
* There is no sales load on subscriptions of $1 million or more. Redemptions that were part of a $1 million or more subscription may be subject to a contingent deferred sales load if redeemed within a one-year period from the date of purchase.
** Redemption price per share varies by length of time shares are held due to the terms of the contingent deferred sales charge.
See accompanying Notes to Financial Statements.
Statements of Assets and Liabilities (Continued)
| | | | | | | Touchstone | | | | | | | |
| Touchstone | | | Touchstone | | | Sands Capital | | | | | | Touchstone | |
| International | | | Mid Cap | | | Emerging | | | Touchstone | | | Sustainability | |
| Value | | | Growth | | | Markets | | | Small Cap | | | and Impact | |
| Fund | | | Fund | | | Growth Fund | | | Growth Fund | | | Equity Fund | |
| $ | 3,611,978 | | | $ | 218,726,865 | | | $ | — | | | $ | 20,400,740 | | | $ | 485,412,761 | |
| | | | | | | | | | | | | | | | | | | |
| | 444,185 | | | | 7,798,987 | | | | — | | | | 3,480,755 | | | | 22,049,186 | |
| $ | 8.13 | | | $ | 28.05 | | | $ | — | | | $ | 5.86 | | | $ | 22.01 | |
| | 5.75 | % | | | 5.75 | % | | | — | | | | 5.75 | % | | | 5.75 | % |
| | | | | | | | | | | | | | | | | | | |
| $ | 8.63 | | | $ | 29.76 | | | $ | — | | | $ | 6.22 | | | $ | 23.35 | |
| | | | | | | | | | | | | | | | | | | |
| $ | 263,278 | | | $ | 90,501,630 | | | $ | — | | | $ | 7,840,135 | | | $ | 37,512,749 | |
| | | | | | | | | | | | | | | | | | | |
| | 35,052 | | | | 4,954,884 | | | | — | | | | 1,636,129 | | | | 2,008,671 | |
| $ | 7.51 | | | $ | 18.27 | | | $ | — | | | $ | 4.79 | | | $ | 18.68 | |
| | | | | | | | | | | | | | | | | | | |
| $ | 2,376,760 | | | $ | 375,617,038 | | | $ | 207,209,191 | | | $ | 150,606,245 | | | $ | 189,837,254 | |
| | | | | | | | | | | | | | | | | | | |
| | 291,958 | | | | 12,919,669 | | | | 15,277,700 | | | | 22,960,861 | | | | 8,344,631 | |
| $ | 8.14 | | | $ | 29.07 | | | $ | 13.56 | | | $ | 6.56 | | | $ | 22.75 | |
| | | | | | | | | | | | | | | | | | | |
| $ | 17,418,801 | | | $ | 95,176,007 | | | $ | 374,452,100 | | | $ | 6,638,909 | | | $ | 42,196,062 | |
| | | | | | | | | | | | | | | | | | | |
| | 2,156,660 | | | | 3,246,271 | | | | 27,511,582 | | | | 1,002,822 | | | | 1,853,078 | |
| $ | 8.08 | | | $ | 29.32 | | | $ | 13.61 | | | $ | 6.62 | | | $ | 22.77 | |
Statements of Operations
For the Year Ended March 31, 2018
| | | Touchstone | | | | | | Touchstone | | | Touchstone | |
| | | Flexible | | | Touchstone | | | Growth | | | International | |
| | | Income | | | Focused | | | Opportunities | | | Growth | |
| | | Fund | | | Fund | | | Fund | | | Fund | |
| Investment Income | | | | | | | | | | | | | | | | |
| Dividends(A) | | $ | 4,513,292 | | | $ | 19,877,429 | | | $ | 2,494,646 | | | $ | 231,917 | |
| Interest | | | 25,808,194 | | | | — | | | | — | | | | — | |
| Income from securities loaned | | | 69,554 | | | | 10,220 | | | | 5,219 | | | | 11,541 | |
| Total Investment Income | | | 30,391,040 | | | | 19,887,649 | | | | 2,499,865 | | | | 243,458 | |
| Expenses | | | | | | | | | | | | | | | | |
| Investment advisory fees | | | 5,067,199 | | | | 7,759,762 | | | | 2,036,845 | | | | 132,609 | |
| Administration fees | | | 1,203,829 | | | | 1,802,776 | | | | 393,790 | | | | 21,365 | |
| Compliance fees and expenses | | | 1,560 | | | | 1,560 | | | | 1,560 | | | | 1,560 | |
| Custody fees | | | 50,165 | | | | 21,513 | | | | 13,503 | | | | 5,514 | |
| Professional fees | | | 58,581 | | | | 55,697 | | | | 30,592 | | | | 37,685 | |
| Transfer Agent fees, Class A | | | 86,277 | | | | 394,964 | | | | 51,662 | | | | 134 | |
| Transfer Agent fees, Class C | | | 64,176 | | | | 35,708 | | | | 10,235 | | | | 38 | |
| Transfer Agent fees, Class Y | | | 549,122 | | | | 873,283 | | | | 43,677 | | | | 38 | |
| Transfer Agent fees, Institutional Class | | | 35,900 | | | | 6,433 | | | | 103,194 | | | | 49 | |
| Registration fees, Class A | | | 20,532 | | | | 22,204 | | | | 16,564 | | | | 3,087 | |
| Registration fees, Class C | | | 15,580 | | | | 16,208 | | | | 14,373 | | | | 2,833 | |
| Registration fees, Class Y | | | 46,336 | | | | 25,310 | | | | 16,321 | | | | 2,833 | |
| Registration fees, Institutional Class | | | 17,375 | | | | 16,057 | | | | 18,921 | | | | 3,086 | |
| Interest expense on securities sold short | | | 3,302 | | | | — | | | | — | | | | — | |
| Reports to Shareholders, Class A | | | 14,391 | | | | 10,112 | | | | 8,798 | | | | 6,039 | |
| Reports to Shareholders, Class C | | | 15,878 | | | | 9,500 | | | | 6,736 | | | | 6,030 | |
| Reports to Shareholders, Class Y | | | 49,083 | | | | 57,182 | | | | 6,675 | | | | 6,038 | |
| Reports to Shareholders, Institutional Class | | | 9,421 | | | | 6,670 | | | | 9,932 | | | | 5,989 | |
| Distribution expenses, Class A | | | 227,900 | | | | 468,781 | | | | 100,367 | | | | 190 | |
| Distribution and shareholder servicing expenses, Class C | | | 772,948 | | | | 472,235 | | | | 87,366 | | | | 215 | |
| Trustee fees | | | 14,864 | | | | 14,864 | | | | 14,864 | | | | 14,864 | |
| Other expenses | | | 91,394 | | | | 390,141 | | | | 43,150 | | | | 8,276 | |
| Total Expenses | | | 8,415,813 | | | | 12,460,960 | | | | 3,029,125 | | | | 258,472 | |
| Fees waived and/or reimbursed by the Advisor and/or Affiliates(B) | | | (743,674 | ) | | | (184,614 | ) | | | (326,641 | ) | | | (115,032 | ) |
| Fees recouped by the Advisor(B) | | | — | | | | — | | | | — | | | | — | |
| Net Expenses | | | 7,672,139 | | | | 12,276,346 | | | | 2,702,484 | | | | 143,440 | |
| Net Investment Income (Loss) | | | 22,718,901 | | | | 7,611,303 | | | | (202,619 | ) | | | 100,018 | |
| Realized and Unrealized Gains (Losses) on Investments | | | | | | | | | | | | | | | | |
| Net realized gains on investments (C) | | | 16,488,106 | | | | 120,283,282 | | | | 31,494,443 | | | | 606,964 | |
| Net realized gains on futures contracts | | | 1,196,702 | | | | — | | | | — | | | | — | |
| Net realized gains on written options | | | 335,496 | | | | — | | | | — | | | | — | |
| Net realized losses on swap agreements | | | (135,475 | ) | | | — | | | | — | | | | — | |
| Net realized gains on securities sold short | | | 55,168 | | | | — | | | | — | | | | — | |
| Net realized losses on forward foreign currency contracts | | | (650,144 | ) | | | — | | | | — | | | | — | |
| Net realized gains (losses) on foreign currency transactions | | | (1,008,731 | ) | | | — | | | | — | | | | (9 | ) |
| Net change in unrealized appreciation (depreciation) on investments (D)(E) | | | (15,239,196 | ) | | | (5,587,396 | ) | | | 16,991,709 | | | | 1,803,119 | |
| Net change in unrealized appreciation (depreciation) on futures contracts | | | (99,886 | ) | | | — | | | | — | | | | — | |
| Net change in unrealized appreciation (depreciation) on written options | | | (99,307 | ) | | | — | | | | — | | | | — | |
| Net change in unrealized appreciation (depreciation) on forward foreign currency contracts | | | 627,634 | | | | — | | | | — | | | | — | |
| Net change in unrealized appreciation (depreciation) on foreign currency transactions | | | 3,503 | | | | — | | | | — | | | | — | |
| Net Realized and Unrealized Gains (Losses) on Investments | | | 1,473,870 | | | | 114,695,886 | | | | 48,486,152 | | | | 2,410,074 | |
| Change in Net Assets Resulting from Operations | | $ | 24,192,771 | | | $ | 122,307,189 | | | $ | 48,283,533 | | | $ | 2,510,092 | |
| (A) Net of foreign tax withholding of: | | $ | — | | | $ | 422,292 | | | $ | 11,017 | | | $ | 34,832 | |
| (B) See Note 4 in Notes to Financial Statements. | | | | | | | | | | | | | | | | |
| (C) On April 7, 2017, the Focused Fund had a redemption-in-kind of securities in the amount of $196,424,472. Net realized gains (losses) on investments includes the realized gain on the transaction of $54,207,989, which is not recognized as a realized gain by the Fund for tax purposes. | | | | | | | | | | | | | | | | |
| (D) Includes change in deferred foreign capital gains tax of: | | $ | — | | | $ | — | | | $ | — | | | $ | — | |
| (E) Change in unrealized appreciation (depreciation) does not include net appreciation of $8,201,027 for the Touchstone Flexible Income Fund and $147,234,940 for the Touchstone Sustainability and Impact Equity Fund in connection with the Funds' mergers. See Note 9 in the Notes to Financial Statements. | | | | | | | | | | | | | | | | |
See accompanying Notes to Financial Statements.
Statements of Operations (Continued)
| | | | | | | Touchstone | | | | | | | |
| Touchstone | | | Touchstone | | | Sands Capital | | | | | | Touchstone | |
| International | | | Mid Cap | | | Emerging | | | Touchstone | | | Sustainability | |
| Value | | | Growth | | | Markets | | | Small Cap | | | and Impact | |
| Fund | | | Fund | | | Growth Fund | | | Growth Fund | | | Equity Fund | |
| $ | 664,285 | | | $ | 7,365,533 | | | $ | 3,137,325 | | | $ | 1,612,557 | | | $ | 9,079,435 | |
| | — | | | | — | | | | — | | | | — | | | | — | |
| | 7,138 | | | | 7,975 | | | | 43,159 | | | | 264,787 | | | | 77,278 | |
| | 671,423 | | | | 7,373,508 | | | | 3,180,484 | | | | 1,877,344 | | | | 9,156,713 | |
| | | | | | | | | | | | | | | | | �� | | |
| | 235,538 | | | | 5,418,922 | | | | 4,867,305 | | | | 2,982,099 | | | | 3,529,801 | |
| | 34,153 | | | | 1,070,705 | | | | 626,648 | | | | 434,628 | | | | 753,165 | |
| | 1,560 | | | | 1,560 | | | | 1,560 | | | | 1,560 | | | | 1,560 | |
| | 30,024 | | | | 17,775 | | | | 234,559 | | | | 36,235 | | | | 44,264 | |
| | 38,996 | | | | 44,105 | | | | 71,370 | | | | 28,316 | | | | 49,993 | |
| | 10,041 | | | | 286,521 | | | | — | | | | 42,417 | | | | 252,399 | |
| | 460 | | | | 101,658 | | | | — | | | | 14,338 | | | | 41,311 | |
| | 5,042 | | | | 348,123 | | | | 140,376 | | | | 253,557 | | | | 128,353 | |
| | 65 | | | | 27,214 | | | | 107,909 | | | | 4,029 | | | | 24,745 | |
| | 10,310 | | | | 17,692 | | | | — | | | | 18,198 | | | | 20,717 | |
| | 9,422 | | | | 17,941 | | | | — | | | | 17,124 | | | | 16,603 | |
| | 9,728 | | | | 25,524 | | | | 34,025 | | | | 94,972 | | | | 23,672 | |
| | 6,465 | | | | 20,238 | | | | 18,006 | | | | 16,369 | | | | 14,282 | |
| | — | | | | — | | | | — | | | | — | | | | — | |
| | 7,250 | | | | 21,189 | | | | — | | | | 9,777 | | | | 26,196 | |
| | 6,098 | | | | 14,942 | | | | — | | | | 8,480 | | | | 9,598 | |
| | 6,160 | | | | 46,514 | | | | 19,818 | | | | 20,682 | | | | 23,766 | |
| | 6,040 | | | | 7,397 | | | | 16,419 | | | | 7,402 | | | | 6,478 | |
| | 9,082 | | | | 573,350 | | | | — | | | | 64,131 | | | | 708,967 | |
| | 2,471 | | | | 968,420 | | | | — | | | | 96,850 | | | | 418,946 | |
| | 14,864 | | | | 14,864 | | | | 14,864 | | | | 14,864 | | | | 14,864 | |
| | 33,181 | | | | 84,857 | | | | 57,069 | | | | 36,037 | | | | 133,130 | |
| | 476,950 | | | | 9,129,511 | | | | 6,209,928 | | | | 4,202,065 | | | | 6,242,810 | |
| | (224,891 | ) | | | (569 | ) | | | (147,227 | ) | | | (500,987 | ) | | | (231,312 | ) |
| | — | | | | — | | | | — | | | | 6,596 | | | | — | |
| | 252,059 | | | | 9,128,942 | | | | 6,062,701 | | | | 3,707,674 | | | | 6,011,498 | |
| | 419,364 | | | | (1,755,434 | ) | | | (2,882,217 | ) | | | (1,830,330 | ) | | | 3,145,215 | |
| | | | | | | | | | | | | | | | | | | |
| | 631,017 | | | | 74,765,740 | | | | 8,164,216 | | | | 40,261,295 | | | | 107,809,204 | |
| | — | | | | — | | | | — | | | | — | | | | — | |
| | — | | | | — | | | | — | | | | — | | | | — | |
| | — | | | | — | | | | — | | | | — | | | | — | |
| | — | | | | — | | | | — | | | | — | | | | — | |
| | — | | | | — | | | | — | | | | — | | | | — | |
| | 3,255 | | | | — | | | | (185,203 | ) | | | — | | | | (97,155 | ) |
| | | | | | | | | | | | | | | | | | | |
| | 2,317,054 | | | | 56,871,354 | | | | 86,564,615 | | | | (2,439,673 | ) | | | (53,595,494 | ) |
| | | | | | | | | | | | | | | | | | | |
| | — | | | | — | | | | — | | | | — | | | | — | |
| | | | | | | | | | | | | | | | | | | |
| | — | | | | — | | | | — | | | | — | | | | — | |
| | | | | | | | | | | | | | | | | | | |
| | — | | | | — | | | | — | | | | — | | | | — | |
| | | | | | | | | | | | | | | | | | | |
| | 3,326 | | | | — | | | | (18,735 | ) | | | — | | | | (6,588 | ) |
| | 2,954,652 | | | | 131,637,094 | | | | 94,524,893 | | | | 37,821,622 | | | | 54,109,967 | |
| $ | 3,374,016 | | | $ | 129,881,660 | | | $ | 91,642,676 | | | $ | 35,991,292 | | | $ | 57,255,182 | |
| $ | 57,087 | | | $ | 52,965 | | | $ | 189,683 | | | $ | — | | | $ | 535,078 | |
| | | | | | | | | | | | | | | | | | | |
| $ | — | | | $ | — | | | $ | 1,052,596 | | | $ | — | | | $ | — | |
Statements of Changes in Net Assets
| | | Touchstone | |
| | | Flexible Income | |
| | | Fund | |
| | | | |
| | | For the | | | For the | |
| | | Year Ended | | | Year Ended | |
| | | March 31, 2018 | | | March 31, 2017 | |
| From Operations | | | | | | | | |
| Net investment income (loss) | | $ | 22,718,901 | | | $ | 19,283,397 | |
| Net realized gains (losses) on investments, futures contracts, written options, swap agreements, securities shold short, forward foreign currency contracts and foreign currency transactions | | | 16,281,122 | | | | (2,060,369 | ) |
| Net change in unrealized appreciation (depreciation) on investments, futures contracts, written options, forward foreign currency contracts and foreign currency transactions | | | (14,807,252 | ) | | | 7,106,360 | |
| Change in Net Assets from Operations | | | 24,192,771 | | | | 24,329,388 | |
| | | | | | | | | |
| Distributions to Shareholders from: | | | | | | | | |
| Net investment income, Class A | | | (2,242,445 | ) | | | (1,561,926 | ) |
| Net investment income, Class C | | | (1,336,882 | ) | | | (1,072,545 | ) |
| Net investment income, Class Y | | | (15,422,024 | ) | | | (13,277,757 | ) |
| Net investment income, Institutional Class | | | (2,744,520 | ) | | | (2,785,703 | ) |
| Net realized gains, Class A | | | — | | | | — | |
| Net realized gains, Class C | | | — | | | | — | |
| Net realized gains, Class Y | | | — | | | | — | |
| Net realized gains, Institutional Class | | | — | | | | — | |
| Total Distributions | | | (21,745,871 | ) | | | (18,697,931 | ) |
| | | | | | | | | |
| Net Increase (Decrease) from Share Transactions (A) | | | 277,011,831 | | | | 124,129,348 | |
| | | | | | | | | |
| Total Increase (Decrease) in Net Assets | | | 279,458,731 | | | | 129,760,805 | |
| | | | | | | | | |
| Net Assets | | | | | | | | |
| Beginning of period | | | 673,220,321 | | | | 543,459,516 | |
| End of period | | $ | 952,679,052 | | | $ | 673,220,321 | |
| Accumulated Net Investment Income | | $ | 808,064 | | | $ | 924,067 | |
| (A) | For details on share transaction by class, see Statements of Changes in Net Assets - Capital Stock Activity on pages 80 to 82. |
| (B) | Represents the period from commencement of operations (April 1, 2016) through March 31, 2017. |
See accompanying Notes to Financial Statements.
Statements of Changes in Net Assets (Continued)
| | | | Touchstone | | | Touchstone | | | Touchstone | |
| Touchstone | | | Growth Opportunities | | | International Growth | | | International | |
| Focused Fund | | | Fund | | | Fund | | | Value Fund | |
| | | | | | | | | | | | | | | | For the | | | | | | | |
| For the | | | For the | | | For the | | | For the | | | For the | | | Year Ended | | | For the | | | For the | |
| Year Ended | | | Year Ended | | | Year Ended | | | Year Ended | | | Year Ended | | | March 31, | | | Year Ended | | | Year Ended | |
| March 31, 2018 | | | March 31, 2017 | | | March 31, 2018 | | | March 31, 2017 | | | March 31, 2018 | | | 2017(B) | | | March 31, 2018 | | | March 31, 2017 | |
| | | | | | | | | | | | | | | | | | | | | | | |
| $ | 7,611,303 | | | $ | 8,041,618 | | | $ | (202,619 | ) | | $ | 639,004 | | | $ | 100,018 | | | $ | 90,634 | | | $ | 419,364 | | | $ | 682,656 | |
| | | | | | | | | | | | | | | | | | | | | | | | | | | | | | | |
| | 120,283,282 | | | | 50,402,184 | | | | 31,494,443 | | | | 14,884,304 | | | | 606,955 | | | | (245,110 | ) | | | 634,272 | | | | (4,061,696 | ) |
| | | | | | | | | | | | | | | | | | | | | | | | | | | | | | | |
| | (5,587,396 | ) | | | 138,441,540 | | | | 16,991,709 | | | | 18,567,633 | | | | 1,803,119 | | | | 841,587 | | | | 2,320,380 | | | | 5,694,712 | |
| | 122,307,189 | | | | 196,885,342 | | | | 48,283,533 | | | | 34,090,941 | | | | 2,510,092 | | | | 687,111 | | | | 3,374,016 | | | | 2,315,672 | |
| | | | | | | | | | | | | | | | | | | | | | | | | | | | | | | |
| | | | | | | | | | | | | | | | | | | | | | | | | | | | | | | |
| | — | | | | (1,516,379 | ) | | | — | | | | — | | | | (663 | ) | | | (6 | ) | | | (77,481 | ) | | | (414,991 | ) |
| | — | | | | (153,587 | ) | | | — | | | | — | | | | (155 | ) | | | — | | | | (3,959 | ) | | | (13,916 | ) |
| | (8,394,330 | ) | | | (5,279,020 | ) | | | — | | | | (48,495 | ) | | | (221 | ) | | | (12 | ) | | | (79,646 | ) | | | (457,565 | ) |
| | (224,556 | ) | | | (274,970 | ) | | | — | | | | (272,809 | ) | | | (119,437 | ) | | | (53,990 | ) | | | (405,935 | ) | | | (1,942,357 | ) |
| | (10,732,390 | ) | | | (3,669,437 | ) | | | (3,662,965 | ) | | | (1,283,090 | ) | | | (51 | ) | | | — | | | | — | | | | — | |
| | (2,837,165 | ) | | | (489,201 | ) | | | (950,760 | ) | | | (371,428 | ) | | | (20 | ) | | | — | | | | — | | | | — | |
| | (58,912,960 | ) | | | (7,917,486 | ) | | | (4,305,355 | ) | | | (1,725,793 | ) | | | (4 | ) | | | — | | | | — | | | | — | |
| | (1,383,014 | ) | | | (369,490 | ) | | | (16,435,542 | ) | | | (4,752,178 | ) | | | (8,437 | ) | | | — | | | | — | | | | — | |
| | (82,484,415 | ) | | | (19,669,570 | ) | | | (25,354,622 | ) | | | (8,453,793 | ) | | | (128,988 | ) | | | (54,008 | ) | | | (567,021 | ) | | | (2,828,829 | ) |
| | | | | | | | | | | | | | | | | | | | | | | | | | | | | | | |
| | (331,194,847 | ) | | | (34,526,581 | ) | | | 14,449,376 | | | | (90,925,031 | ) | | | 1,017,294 | | | | 11,286,421 | | | | (1,203,758 | ) | | | (20,565,880 | ) |
| | | | | | | | | | | | | | | | | | | | | | | | | | | | | | | |
| | (291,372,073 | ) | | | 142,689,191 | | | | 37,378,287 | | | | (65,287,883 | ) | | | 3,398,398 | | | | 11,919,524 | | | | 1,603,237 | | | | (21,079,037 | ) |
| | | | | | | | | | | | | | | | | | | | | | | | | | | | | | | |
| | 1,495,189,819 | | | | 1,352,500,628 | | | | 244,586,354 | | | | 309,874,237 | | | | 11,919,524 | | | | — | | | | 22,067,580 | | | | 43,146,617 | |
| $ | 1,203,817,746 | | | $ | 1,495,189,819 | | | $ | 281,964,641 | | | $ | 244,586,354 | | | $ | 15,317,922 | | | $ | 11,919,524 | | | $ | 23,670,817 | | | $ | 22,067,580 | |
| $ | 4,572,920 | | | $ | 7,268,626 | | | $ | — | | | $ | — | | | $ | 19,392 | | | $ | 36,626 | | | $ | 479,863 | | | $ | 162,466 | |
Statements of Changes in Net Assets (Continued)
| | | Touchstone | |
| | | Mid Cap | |
| | | Growth Fund | |
| | | | | | | |
| | | For the | | | For the | |
| | | Year Ended | | | Year Ended | |
| | | March 31, 2018 | | | March 31, 2017 | |
| From Operations | | | | | | | | |
| Net investment income (loss) | | $ | (1,755,434 | ) | | $ | (1,849,028 | ) |
| Net realized gains (losses) on investments and foreign currency transactions | | | 74,765,740 | | | | 87,109,885 | |
| Net change in unrealized appreciation (depreciation) on investments and foreign currency transactions | | | 56,871,354 | | | | 9,617,026 | |
| Change in Net Assets from Operations | | | 129,881,660 | | | | 94,877,883 | |
| | | | | | | | | |
| Distributions to Shareholders from: | | | | | | | | |
| Net investment income, Class A | | | — | | | | — | |
| Net investment income, Class C | | | — | | | | — | |
| Net investment income, Class Y | | | — | | | | — | |
| Net investment income, Institutional Class | | | — | | | | — | |
| Net realized gains, Class A | | | (21,079,821 | ) | | | (5,709,545 | ) |
| Net realized gains, Class B | | | — | | | | (11,306 | ) |
| Net realized gains, Class C | | | (12,691,656 | ) | | | (4,186,541 | ) |
| Net realized gains, Class Y | | | (32,957,620 | ) | | | (8,474,706 | ) |
| Net realized gains, Institutional Class | | | (7,253,812 | ) | | | (1,018,216 | ) |
| Total Distributions | | | (73,982,909 | ) | | | (19,400,314 | ) |
| | | | | | | | | |
| Net Increase (Decrease) from Share Transactions(A) | | | 29,486,603 | | | | (167,892,838 | ) |
| | | | | | | | | |
| Total Increase (Decrease) in Net Assets | | | 85,385,354 | | | | (92,415,269 | ) |
| | | | | | | | | |
| Net Assets | | | | | | | | |
| Beginning of period | | | 694,636,186 | | | | 787,051,455 | |
| End of period | | $ | 780,021,540 | | | $ | 694,636,186 | |
| Accumulated Net Investment Income (Loss) | | $ | — | | | $ | (866,767 | ) |
(A) For details on share transaction by class, see Statements of Changes in Net Assets - Capital Stock Activity on pages 82 to 84.
See accompanying Notes to Financial Statements.
Statements of Changes in Net Assets (Continued)
| Touchstone | | | Touchstone | | | Touchstone | |
| Sands Capital Emerging | | | Small Cap | | | Sustainability and Impact | |
| Markets Growth Fund | | | Growth Fund | | | Equity Fund | |
| For the | | | For the | | | For the | | | For the | | | For the | | | For the | |
| Year Ended | | | Year Ended | | | Year Ended | | | Year Ended | | | Year Ended | | | Year Ended | |
| March 31, 2018 | | | March 31, 2017 | | | March 31, 2018 | | | March 31, 2017 | | | March 31, 2018 | | | March 31, 2017 | |
| | | | | | | | | | | | | | | | | |
| $ | (2,882,217 | ) | | $ | (948,935 | ) | | $ | (1,830,330 | ) | | $ | (2,651,106 | ) | | $ | 3,145,215 | | | $ | 2,222,227 | |
| | 7,979,013 | | | | (4,895,839 | ) | | | 40,261,295 | | | | (25,827,977 | ) | | | 107,712,049 | | | | 2,720,054 | |
| | 86,545,880 | | | | 34,827,193 | | | | (2,439,673 | ) | | | 54,388,132 | | | | (53,602,082 | ) | | | 32,511,636 | |
| | 91,642,676 | | | | 28,982,419 | | | | 35,991,292 | | | | 25,909,049 | | | | 57,255,182 | | | | 37,453,917 | |
| | | | | | | | | | | | | | | | | | | | | | | |
| | — | | | | — | | | | — | | | | — | | | | (3,484,805 | ) | | | (653,990 | ) |
| | — | | | | — | | | | — | | | | — | | | | — | | | | (28,717 | ) |
| | — | | | | — | | | | — | | | | — | | | | (1,360,309 | ) | | | (734,641 | ) |
| | — | | | | — | | | | — | | | | — | | | | (325,999 | ) | | | (155,934 | ) |
| | — | | | | — | | | | — | | | | (209,932 | ) | | | (55,263,887 | ) | | | — | |
| | — | | | | — | | | | — | | | | — | | | | — | | | | — | |
| | — | | | | — | | | | — | | | | (82,596 | ) | | | (4,969,553 | ) | | | — | |
| | — | | | | — | | | | — | | | | (1,589,859 | ) | | | (19,953,999 | ) | | | — | |
| | — | | | | — | | | | — | | | | (90,861 | ) | | | (4,442,461 | ) | | | — | |
| | — | | | | — | | | | — | | | | (1,973,248 | ) | | | (89,801,013 | ) | | | (1,573,282 | ) |
| | | | | | | | | | | | | | | | | | | | | | | |
| | 204,149,556 | | | | 97,379,901 | | | | (279,869,397 | ) | | | (192,771,204 | ) | | | 483,918,133 | | | | (972,460 | ) |
| | | | | | | | | | | | | | | | | | | | | | | |
| | 295,792,232 | | | | 126,362,320 | | | | (243,878,105 | ) | | | (168,835,403 | ) | | | 451,372,302 | | | | 34,908,175 | |
| | | | | | | | | | | | | | | | | | | | | | | |
| | | | | | | | | | | | | | | | | | | | | | | |
| | 285,869,059 | | | | 159,506,739 | | | | 429,364,134 | | | | 598,199,537 | | | | 303,586,524 | | | | 268,678,349 | |
| $ | 581,661,291 | | | $ | 285,869,059 | | | $ | 185,486,029 | | | $ | 429,364,134 | | | $ | 754,958,826 | | | $ | 303,586,524 | |
| $ | (1,475,036 | ) | | $ | (310,110 | ) | | $ | — | | | $ | (462,497 | ) | | $ | (764,327 | ) | | $ | 678,052 | |
Statements of Changes in Net Assets - Capital Stock Activity
| | | Touchstone | | | Touchstone | |
| | | Flexible Income Fund | | | Focused Fund | |
| | | For the Year | | | For the Year | | | For the Year | | | For the Year | |
| | | Ended | | | Ended | | | Ended | | | Ended | |
| | | March 31, 2018 | | | March 31, 2017 | | | March 31, 2018 | | | March 31, 2017 | |
| | | Shares | | | Dollars | | | Shares | | | Dollars | | | Shares | | | Dollars | | | Shares | | | Dollars | |
| Class A | | | | | | | | | | | | | | | | | | | | | | | | | | | | | | | | |
| Proceeds from Shares issued | | | 2,384,072 | | | $ | 26,062,646 | | | | 3,173,567 | | | $ | 34,165,603 | | | | 5,193,856 | | | $ | 215,393,682 | | | | 2,103,482 | | | $ | 81,569,477 | |
| Proceeds from Shares issued in connection with merger(B) | | | 9,063,086 | | | | 99,393,351 | | | | — | | | | — | | | | — | | | | — | | | | — | | | | — | |
| Reinvestment of distributions | | | 168,647 | | | | 1,840,354 | | | | 114,811 | | | | 1,232,128 | | | | 218,807 | | | | 9,362,745 | | | | 116,086 | | | | 4,706,363 | |
| Cost of Shares redeemed | | | (3,606,795 | ) | | | (39,446,661 | ) | | | (4,116,327 | ) | | | (44,045,496 | ) | | | (11,772,123 | ) | | | (489,616,422 | ) | | | (3,017,249 | ) | | | (118,313,282 | ) |
| Change from Class A Share Transactions | | | 8,009,010 | | | | 87,849,690 | | | | (827,949 | ) | | | (8,647,765 | ) | | | (6,359,460 | ) | | | (264,859,995 | ) | | | (797,681 | ) | | | (32,037,442 | ) |
| Class C | | | | | | | | | | | | | | | | | | | | | | | | | | | | | | | | |
| Proceeds from Shares issued | | | 847,920 | | | | 9,145,298 | | | | 2,160,399 | | | | 22,964,877 | | | | 76,446 | | | | 3,154,356 | | | | 482,137 | | | | 17,925,651 | |
| Proceeds from Shares issued in connection with merger(B) | | | 6,398,405 | | | | 69,228,625 | | | | — | | | | — | | | | — | | | | — | | | | — | | | | — | |
| Reinvestment of distributions | | | 105,881 | | | | 1,140,279 | | | | 84,701 | | | | 896,553 | | | | 62,701 | | | | 2,560,724 | | | | 12,653 | | | | 494,586 | |
| Cost of Shares redeemed | | | (3,109,526 | ) | | | (33,533,208 | ) | | | (1,355,234 | ) | | | (14,316,266 | ) | | | (468,507 | ) | | | (19,362,544 | ) | | | (394,700 | ) | | | (15,062,303 | ) |
| Change from Class C Share Transactions | | | 4,242,680 | | | | 45,980,994 | | | | 889,866 | | | | 9,545,164 | | | | (329,360 | ) | | | (13,647,464 | ) | | | 100,090 | | | | 3,357,934 | |
| Class Y | | | | | | | | | | | | | | | | | | | | | | | | | | | | | | | | |
| Proceeds from Shares issued | | | 26,129,990 | | | | 286,674,927 | | | | 25,265,156 | | | | 272,373,506 | | | | 1,589,181 | | | | 69,971,464 | | | | 4,259,573 | | | | 168,900,525 | |
| Proceeds from Shares issued in connection with merger(B) | | | 4,717,881 | | | | 51,897,275 | | | | — | | | | — | | | | — | | | | — | | | | — | | | | — | |
| Reinvestment of distributions | | | 1,121,385 | | | | 12,280,699 | | | | 714,239 | | | | 7,685,777 | | | | 1,448,905 | | | | 63,266,483 | | | | 299,050 | | | | 12,330,960 | |
| Cost of Shares redeemed | | | (17,187,979 | ) | | | (188,422,447 | ) | | | (16,586,849 | ) | | | (177,812,998 | ) | | | (3,782,697 | ) | | | (166,382,947 | ) | | | (4,362,807 | ) | | | (173,810,089 | ) |
| Change from Class Y Share Transactions | | | 14,781,277 | | | | 162,430,454 | | | | 9,392,546 | | | | 102,246,285 | | | | (744,611 | ) | | | (33,145,000 | ) | | | 195,816 | | | | 7,421,396 | |
| Institutional Class | | | | | | | | | | | | | | | | | | | | | | | | | | | | | | | | |
| Proceeds from Shares issued | | | 2,830,930 | | | | 31,031,315 | | | | 5,579,839 | | | | 59,878,292 | | | | 266,753 | | | | 11,739,387 | | | | 318,160 | | | | 12,296,441 | |
| Reinvestment of distributions | | | 182,493 | | | | 1,998,020 | | | | 147,977 | | | | 1,589,985 | | | | 36,639 | | | | 1,607,570 | | | | 15,172 | | | | 628,198 | |
| Cost of Shares redeemed | | | (4,769,408 | ) | | | (52,278,642 | ) | | | (3,747,004 | ) | | | (40,482,613 | ) | | | (763,585 | ) | | | (32,889,345 | ) | | | (660,073 | ) | | | (26,193,108 | ) |
| Change from Institutional Class Share Transactions | | | (1,755,985 | ) | | | (19,249,307 | ) | | | 1,980,812 | | | | 20,985,664 | | | | (460,193 | ) | | | (19,542,388 | ) | | | (326,741 | ) | | | (13,268,469 | ) |
| | | | | | | | | | | | | | | | | | | | | | | | | | | | | | | | | |
| Change from Share Transactions | | | 25,276,982 | | | $ | 277,011,831 | | | | 11,435,275 | | | $ | 124,129,348 | | | | (7,893,624 | ) | | $ | (331,194,847 | ) | | | (828,516 | ) | | $ | (34,526,581 | ) |
| (A) | Represents the period from commencement of operations (April 1, 2016) through March 31, 2017. |
| (B) | See Note 9 in the Notes to Financial Statements. |
See accompanying Notes to Financial Statements.
Statements of Changes in Net Assets - Capital Stock Activity (Continued)
| Touchstone Growth | | | Touchstone International | |
| Opportunities Fund | | | Growth Fund | |
| For the Year | | | For the Year | | | For the Year | | | For the Year | |
| Ended | | | Ended | | | Ended | | | Ended | |
| March 31, 2018 | | | March 31, 2017 | | | March 31, 2018 | | | March 31, 2017(A) | |
| Shares | | | Dollars | | | Shares | | | Dollars | | | Shares | | | Dollars | | | Shares | | | Dollars | |
| | | | | | | | | | | | | | | | | | | | | | | |
| | 36,639 | | | $ | 1,195,506 | | | | 117,538 | | | $ | 3,393,344 | | | | 17,252 | | | $ | 217,215 | | | | 3,590 | | | $ | 38,009 | |
| | | | | | | | | | | | | | | | | | | | | | | | | | | | | | | |
| | — | | | | — | | | | — | | | | — | | | | — | | | | — | | | | — | | | | — | |
| | 107,787 | | | | 3,426,398 | | | | 42,553 | | | | 1,194,474 | | | | 56 | | | | 714 | | | | 1 | | | | 6 | |
| | (211,068 | ) | | | (6,916,585 | ) | | | (277,080 | ) | | | (7,824,211 | ) | | | (8,447 | ) | | | (106,496 | ) | | | — | | | | — | |
| | | | | | | | | | | | | | | | | | | | | | | | | | | | | | | |
| | (66,642 | ) | | | (2,294,681 | ) | | | (116,989 | ) | | | (3,236,393 | ) | | | 8,861 | | | | 111,433 | | | | 3,591 | | | | 38,015 | |
| | | | | | | | | | | | | | | | | | | | | | | | | | | | | | | |
| | 14,373 | | | | 394,942 | | | | 15,540 | | | | 374,733 | | | | 2,924 | | | | 36,598 | | | | 250 | | | | 2,500 | |
| | | | | | | | | | | | | | | | | | | | | | | | | | | | | | | |
| | — | | | | — | | | | — | | | | — | | | | — | | | | — | | | | — | | | | — | |
| | 33,112 | | | | 870,838 | | | | 13,561 | | | | 323,436 | | | | 14 | | | | 175 | | | | — | | | | — | |
| | (61,897 | ) | | | (1,698,261 | ) | | | (190,408 | ) | | | (4,593,968 | ) | | | — | | | | — | | | | — | | | | — | |
| | | | | | | | | | | | | | | | | | | | | | | | | | | | | | | |
| | (14,412 | ) | | | (432,481 | ) | | | (161,307 | ) | | | (3,895,799 | ) | | | 2,938 | | | | 36,773 | | | | 250 | | | | 2,500 | |
| | | | | | | | | | | | | | | | | | | | | | | | | | | | | | | |
| | 73,508 | | | | 2,472,287 | | | | 199,492 | | | | 5,718,823 | | | | 2,107 | | | | 27,325 | | | | 345 | | | | 3,500 | |
| | | | | | | | | | | | | | | | | | | | | | | | | | | | | | | |
| | — | | | | — | | | | — | | | | — | | | | — | | | | — | | | | — | | | | — | |
| | 129,813 | | | | 4,234,487 | | | | 59,054 | | | | 1,694,188 | | | | 18 | | | | 225 | | | | 1 | | | | 11 | |
| | (321,436 | ) | | | (10,885,343 | ) | | | (1,730,099 | ) | | | (49,539,781 | ) | | | (1 | ) | | | (13 | ) | | | — | | | | — | |
| | | | | | | | | | | | | | | | | | | | | | | | | | | | | | | |
| | (118,115 | ) | | | (4,178,569 | ) | | | (1,471,553 | ) | | | (42,126,770 | ) | | | 2,124 | | | | 27,537 | | | | 346 | | | | 3,511 | |
| | | | | | | | | | | | | | | | | | | | | | | | | | | | | | | |
| | 902,423 | | | | 30,540,021 | | | | 739,765 | | | | 21,407,544 | | | | 233,436 | | | | 2,757,065 | | | | 1,447,175 | | | | 14,754,377 | |
| | 498,198 | | | | 16,435,542 | | | | 173,177 | | | | 5,016,254 | | | | 9,916 | | | | 127,874 | | | | 5,421 | | | | 53,990 | |
| | (761,920 | ) | | | (25,620,456 | ) | | | (2,357,174 | ) | | | (68,089,867 | ) | | | (166,973 | ) | | | (2,043,388 | ) | | | (352,628 | ) | | | (3,565,972 | ) |
| | | | | | | | | | | | | | | | | | | | | | | | | | | | | | | |
| | 638,701 | | | | 21,355,107 | | | | (1,444,232 | ) | | | (41,666,069 | ) | | | 76,379 | | | | 841,551 | | | | 1,099,968 | | | | 11,242,395 | |
| | | | | | | | | | | | | | | | | | | | | | | | | | | | | | | |
| | 439,532 | | | $ | 14,449,376 | | | | (3,194,081 | ) | | $ | (90,925,031 | ) | | | 90,302 | | | $ | 1,017,294 | | | | 1,104,155 | | | $ | 11,286,421 | |
Statements of Changes in Net Assets - Capital Stock Activity (Continued)
| | | Touchstone International | | | Touchstone Mid Cap | |
| | | Value Fund | | | Growth Fund | |
| | | For the Year | | | For the Year | | | For the Year | | | For the Year | |
| | | Ended | | | Ended | | | Ended | | | Ended | |
| | | March 31, 2018 | | | March 31, 2017 | | | March 31, 2018 | | | March 31, 2017 | |
| | | Shares | | | Dollars | | | Shares | | | Dollars | | | Shares | | | Dollars | | | Shares | | | Dollars | |
| Class A | | | | | | | | | | | | | | | | | | | | | | | | | | | | | | | | |
| Proceeds from Shares issued | | | 16,591 | | | $ | 125,713 | | | | 10,152 | | | $ | 72,509 | | | | 1,278,278 | | | $ | 35,159,997 | | | | 1,497,124 | | | $ | 36,450,213 | |
| Reinvestment of distributions | | | 8,957 | | | | 70,067 | | | | 55,117 | | | | 378,173 | | | | 700,280 | | | | 18,792,918 | | | | 220,840 | | | | 5,417,207 | |
| Cost of Shares redeemed | | | (74,185 | ) | | | (576,350 | ) | | | (74,778 | ) | | | (546,556 | ) | | | (2,878,169 | ) | | | (79,842,262 | ) | | | (2,734,825 | ) | | | (66,511,120 | ) |
| Change from Class A Share Transactions | | | (48,637 | ) | | | (380,570 | ) | | | (9,509 | ) | | | (95,874 | ) | | | (899,611 | ) | | | (25,889,347 | ) | | | (1,016,861 | ) | | | (24,643,700 | ) |
| Class B(A) | | | | | | | | | | | | | | | | | | | | | | | | | | | | | | | | |
| Proceeds from Shares issued | | | — | | | | — | | | | — | | | | — | | | | — | | | | — | | | | 108 | | | | 1,827 | |
| Reinvestment of distributions | | | — | | | | — | | | | — | | | | — | | | | — | | | | — | | | | 491 | | | | 8,558 | |
| Cost of Shares redeemed | | | — | | | | — | | | | — | | | | — | | | | — | | | | — | | | | (68,421 | ) | | | (1,190,153 | ) |
| Change from Class B Share Transactions | | | — | | | | — | | | | — | | | | — | | | | — | | | | — | | | | (67,822 | ) | | | (1,179,768 | ) |
| Class C | | | | | | | | | | | | | | | | | | | | | | | | | | | | | | | | |
| Proceeds from Shares issued | | | 6,967 | | | | 52,539 | | | | 17,629 | | | | 114,215 | | | | 221,414 | | | | 4,144,476 | | | | 232,818 | | | | 3,960,601 | |
| Reinvestment of distributions | | | 510 | | | | 3,681 | | | | 1,826 | | | | 11,725 | | | | 692,097 | | | | 12,118,582 | | | | 189,293 | | | | 3,202,841 | |
| Cost of Shares redeemed | | | (6,435 | ) | | | (48,135 | ) | | | (3,250 | ) | | | (22,143 | ) | | | (2,302,342 | ) | | | (42,936,290 | ) | | | (1,907,512 | ) | | | (32,461,461 | ) |
| Change from Class C Share Transactions | | | 1,042 | | | | 8,085 | | | | 16,205 | | | | 103,797 | | | | (1,388,831 | ) | | | (26,673,232 | ) | | | (1,485,401 | ) | | | (25,298,019 | ) |
| Class Y | | | | | | | | | | | | | | | | | | | | | | | | | | | | | | | | |
| Proceeds from Shares issued | | | 52,785 | | | | 413,686 | | | | 39,383 | | | | 286,761 | | | | 4,508,287 | | | | 128,755,742 | | | | 4,398,245 | | | | 111,297,135 | |
| Reinvestment of distributions | | | 7,032 | | | | 55,408 | | | | 36,361 | | | | 250,337 | | | | 1,106,714 | | | | 30,755,540 | | | | 317,429 | | | | 8,018,203 | |
| Cost of Shares redeemed | | | (258,868 | ) | | | (2,053,555 | ) | | | (205,148 | ) | | | (1,515,781 | ) | | | (4,375,191 | ) | | | (125,544,270 | ) | | | (7,573,840 | ) | | | (190,634,337 | ) |
| Change from Class Y Share Transactions | | | (199,051 | ) | | | (1,584,461 | ) | | | (129,404 | ) | | | (978,683 | ) | | | 1,239,810 | | | | 33,967,012 | | | | (2,858,166 | ) | | | (71,318,999 | ) |
| Institutional Class | | | | | | | | | | | | | | | | | | | | | | | | | | | | | | | | |
| Proceeds from Shares issued | | | 489,277 | | | | 3,812,266 | | | | 114,412 | | | | 842,904 | | | | 2,041,573 | | | | 61,136,861 | | | | 313,502 | | | | 7,980,744 | |
| Reinvestment of distributions | | | 52,122 | | | | 405,935 | | | | 284,299 | | | | 1,942,357 | | | | 254,738 | | | | 7,137,762 | | | | 39,334 | | | | 1,000,658 | |
| Cost of Shares redeemed | | | (447,654 | ) | | | (3,465,013 | ) | | | (3,060,005 | ) | | | (22,380,381 | ) | | | (694,722 | ) | | | (20,192,453 | ) | | | (2,203,846 | ) | | | (54,433,754 | ) |
| Change from Institutional Class Share Transactions | | | 93,745 | | | | 753,188 | | | | (2,661,294 | ) | | | (19,595,120 | ) | | | 1,601,589 | | | | 48,082,170 | | | | (1,851,010 | ) | | | (45,452,352 | ) |
| | | | | | | | | | | | | | | | | | | | | | | | | | | | | | | | | |
| Change from Share Transactions | | | (152,901 | ) | | $ | (1,203,758 | ) | | | (2,784,002 | ) | | $ | (20,565,880 | ) | | | 552,957 | | | $ | 29,486,603 | | | | (7,279,260 | ) | | $ | (167,892,838 | ) |
(A) Class B shares automatically convert to Class A shares after 8 years from the initial purchase. The conversion occurs in the month following the 8-year anniversary. During the year ended March 31, 2017, all Class B shares were converted to Class A shares as they reached their 8-year anniversary and are shown as share redemptions for Class B shares above.
See accompanying Notes to Financial Statements.
Statements of Changes in Net Assets - Capital Stock Activity (Continued)
| Touchstone Sands Capital | | | Touchstone Small Cap | |
| Emerging Markets Growth Fund | | | Growth Fund | |
| For the Year | | | For the Year | | | For the Year | | | For the Year | |
| Ended | | | Ended | | | Ended | | | Ended | |
| March 31, 2018 | | | March 31, 2017 | | | March 31, 2018 | | | March 31, 2017 | |
| Shares | | | Dollars | | | Shares | | | Dollars | | | Shares | | | Dollars | | | Shares | | | Dollars | |
| | | | | | | | | | | | | | | | | | | | | | | |
| | — | | | $ | — | | | | — | | | $ | — | | | | 797,323 | | | $ | 4,302,633 | | | | 3,614,218 | | | $ | 18,626,271 | |
| | — | | | | — | | | | — | | | | — | | | | — | | | | — | | | | 36,189 | | | | 192,888 | |
| | — | | | | — | | | | — | | | | — | | | | (5,787,580 | ) | | | (30,581,060 | ) | | | (4,946,989 | ) | | | (25,080,223 | ) |
| | | | | | | | | | | | | | | | | | | | | | | | | | | | | | | |
| | — | | | | — | | | | — | | | | — | | | | (4,990,257 | ) | | | (26,278,427 | ) | | | (1,296,582 | ) | | | (6,261,064 | ) |
| | | | | | | | | | | | | | | | | | | | | | | | | | | | | | | |
| | — | | | | — | | | | — | | | | — | | | | — | | | | — | | | | — | | | | — | |
| | — | | | | — | | | | — | | | | — | | | | — | | | | — | | | | — | | | | — | |
| | — | | | | — | | | | — | | | | — | | | | — | | | | — | | | | — | | | | — | |
| | | | | | | | | | | | | | | | | | | | | | | | | | | | | | | |
| | — | | | | — | | | | — | | | | — | | | | — | | | | — | | | | — | | | | — | |
| | | | | | | | | | | | | | | | | | | | | | | | | | | | | | | |
| | — | | | | — | | | | — | | | | — | | | | 72,920 | | | | 332,010 | | | | 487,377 | | | | 2,069,131 | |
| | — | | | | — | | | | — | | | | — | | | | — | | | | — | | | | 15,604 | | | | 68,655 | |
| | — | | | | — | | | | — | | | | — | | | | (1,295,375 | ) | | | (5,819,296 | ) | | | (2,051,056 | ) | | | (8,714,326 | ) |
| | | | | | | | | | | | | | | | | | | | | | | | | | | | | | | |
| | — | | | | — | | | | — | | | | — | | | | (1,222,455 | ) | | | (5,487,286 | ) | | | (1,548,075 | ) | | | (6,576,540 | ) |
| | | | | | | | | | | | | | | | | | | | | | | | | | | | | | | |
| | 7,625,778 | | | | 97,669,943 | | | | 5,971,278 | | | | 60,060,093 | | | | 15,708,807 | | | | 93,497,376 | | | | 35,362,616 | | | | 202,195,473 | |
| | — | | | | — | | | | — | | | | — | | | | — | | | | — | | | | 210,558 | | | | 1,250,703 | |
| | (2,015,311 | ) | | | (25,789,341 | ) | | | (2,485,972 | ) | | | (24,267,752 | ) | | | (53,924,286 | ) | | | (330,849,735 | ) | | | (66,031,347 | ) | | | (374,886,480 | ) |
| | | | | | | | | | | | | | | | | | | | | | | | | | | | | | | |
| | 5,610,467 | | | | 71,880,602 | | | | 3,485,306 | | | | 35,792,341 | | | | (38,215,479 | ) | | | (237,352,359 | ) | | | (30,458,173 | ) | | | (171,440,304 | ) |
| | | | | | | | | | | | | | | | | | | | | | | | | | | | | | | |
| | 14,639,380 | | | | 183,478,921 | | | | 9,707,380 | | | | 96,179,684 | | | | 1,537,972 | | | | 9,301,177 | | | | 1,293,710 | | | | 7,420,009 | |
| | — | | | | — | | | | — | | | | — | | | | — | | | | — | | | | 10,078 | | | | 60,366 | |
| | (4,130,300 | ) | | | (51,209,967 | ) | | | (3,479,384 | ) | | | (34,592,124 | ) | | | (3,178,340 | ) | | | (20,052,502 | ) | | | (2,755,432 | ) | | | (15,973,671 | ) |
| | | | | | | | | | | | | | | | | | | | | | | | | | | | | | | |
| | 10,509,080 | | | | 132,268,954 | | | | 6,227,996 | | | | 61,587,560 | | | | (1,640,368 | ) | | | (10,751,325 | ) | | | (1,451,644 | ) | | | (8,493,296 | ) |
| | | | | | | | | | | | | | | | | | | | | | | | | | | | | | | |
| | 16,119,547 | | | $ | 204,149,556 | | | | 9,713,302 | | | $ | 97,379,901 | | | | (46,068,559 | ) | | $ | (279,869,397 | ) | | | (34,754,474 | ) | | $ | (192,771,204 | ) |
Statements of Changes in Net Assets - Capital Stock Activity (Continued)
| | | Touchstone Sustainability | |
| | | and Impact Equity Fund | |
| | | For the Year | | | For the Year | |
| | | Ended | | | Ended | |
| | | March 31, 2018 | | | March 31, 2017 | |
| | | Shares | | | Dollars | | | Shares | | | Dollars | |
| Class A | | | | | | | | | | | | | | | | |
| Proceeds from Shares issued | | | 1,146,374 | | | $ | 26,531,636 | | | | 345,879 | | | $ | 6,944,695 | |
| Proceeds from Shares issued in | | | | | | | | | | | | | | | | |
| connection with merger(A) | | | 15,059,186 | | | | 366,882,146 | | | | — | | | | — | |
| Reinvestment of distributions | | | 2,491,351 | | | | 55,905,909 | | | | 29,039 | | | | 585,151 | |
| Cost of Shares redeemed | | | (1,902,098 | ) | | | (44,334,865 | ) | | | (2,355,115 | ) | | | (47,349,366 | ) |
| Change from Class A Share Transactions | | | 16,794,813 | | | | 404,984,826 | | | | (1,980,197 | ) | | | (39,819,520 | ) |
| Class B(B) | | | | | | | | | | | | | | | | |
| Cost of Shares redeemed | | | — | | | | — | | | | (27,123 | ) | | | (470,493 | ) |
| Change from Class B Share Transactions | | | — | | | | — | | | | (27,123 | ) | | | (470,493 | ) |
| Class C | | | | | | | | | | | | | | | | |
| Proceeds from Shares issued | | | 325,409 | | | | 6,440,754 | | | | 149,007 | | | | 2,569,234 | |
| Reinvestment of distributions | | | 228,656 | | | | 4,362,762 | | | | 1,120 | | | | 19,562 | |
| Cost of Shares redeemed | | | (1,125,959 | ) | | | (22,454,884 | ) | | | (996,552 | ) | | | (17,254,366 | ) |
| Change from Class C Share Transactions | | | (571,894 | ) | | | (11,651,368 | ) | | | (846,425 | ) | | | (14,665,570 | ) |
| Class Y | | | | | | | | | | | | | | | | |
| Proceeds from Shares issued | | | 3,108,576 | | | | 74,213,609 | | | | 3,242,442 | | | | 66,535,198 | |
| Proceeds from Shares issued in | | | | | | | | | | | | | | | | |
| connection with merger(A) | | | 1,194,468 | | | | 29,944,579 | | | | — | | | | — | |
| Reinvestment of distributions | | | 832,351 | | | | 19,285,566 | | | | 31,446 | | | | 650,605 | |
| Cost of Shares redeemed | | | (1,892,189 | ) | | | (45,196,983 | ) | | | (1,642,723 | ) | | | (33,852,465 | ) |
| Change from Class Y Share Transactions | | | 3,243,206 | | | | 78,246,771 | | | | 1,631,165 | | | | 33,333,338 | |
| Institutional Class | | | | | | | | | | | | | | | | |
| Proceeds from Shares issued | | | 593,288 | | | | 14,439,758 | | | | 1,064,008 | | | | 22,131,021 | |
| Reinvestment of distributions | | | 205,537 | | | | 4,768,460 | | | | 7,533 | | | | 155,934 | |
| Cost of Shares redeemed | | | (287,080 | ) | | | (6,870,314 | ) | | | (81,168 | ) | | | (1,637,170 | ) |
| Change from Institutional Class Share Transactions | | | 511,745 | | | | 12,337,904 | | | | 990,373 | | | | 20,649,785 | |
| | | | | | | | | | | | | | | | | |
| Change from Share Transactions | | | 19,977,870 | | | $ | 483,918,133 | | | | (232,207 | ) | | $ | (972,460 | ) |
(A) See Note 9 in the Notes to Financial Statements.
(B) Class B shares automatically convert to Class A shares after 8 years from the initial purchase.
The conversion occurs in the month following the 8-year anniversary. During the year ended March 31, 2017, all Class B shares were converted to Class A shares as they reached their 8-year anniversary and are shown as share redemptions for Class B shares above.
See accompanying Notes to Financial Statements.
Financial Highlights
Touchstone Flexible Income Fund—Class A
Selected Data for a Share Outstanding Throughout Each Period
| | | Year Ended March 31, | |
| | | 2018 | | | 2017 | | | 2016 | | | 2015 | | | 2014 | |
| Net asset value at beginning of period | | $ | 10.71 | | | $ | 10.58 | | | $ | 10.67 | | | $ | 10.60 | | | $ | 10.94 | |
| Income (loss) from investment operations: | | | | | | | | | | | | | | | | | | | | |
| Net investment income | | | 0.26 | | | | 0.30 | | | | 0.32 | | | | 0.43 | | | | 0.51 | |
| Net realized and unrealized gains (losses) on investments | | | 0.11 | | | | 0.11 | | | | (0.10 | ) | | | 0.11 | | | | (0.37 | ) |
| Total from investment operations | | | 0.37 | | | | 0.41 | | | | 0.22 | | | | 0.54 | | | | 0.14 | |
| Distributions from: | | | | | | | | | | | | | | | | | | | | |
| Net investment income | | | (0.27 | ) | | | (0.28 | ) | | | (0.31 | ) | | | (0.47 | ) | | | (0.48 | ) |
| Net asset value at end of period | | $ | 10.81 | | | $ | 10.71 | | | $ | 10.58 | | | $ | 10.67 | | | $ | 10.60 | |
| Total return(A) | | | 3.46 | % | | | 3.93 | % | | | 2.13 | % | | | 5.22 | % | | | 1.45 | % |
| Ratios and supplemental data: | | | | | | | | | | | | | | | | | | | | |
| Net assets at end of period (000's) | | $ | 136,609 | | | $ | 49,544 | | | $ | 57,671 | | | $ | 32,695 | | | $ | 25,928 | |
| Ratio to average net assets: | | | | | | | | | | | | | | | | | | | | |
| Net expenses (including dividend and interest expense on securities sold short) | | | 1.06 | %(B) | | | 1.10 | %(B) | | | 1.09 | % | | | 1.09 | % | | | 0.98 | % |
| Gross expenses (including dividend and interest expense on securities sold short) | | | 1.14 | %(C) | | | 1.30 | %(C) | | | 1.32 | % | | | 1.35 | % | | | 1.35 | % |
| Net investment income | | | 2.60 | % | | | 2.74 | % | | | 3.19 | % | | | 3.95 | % | | | 4.82 | % |
| Portfolio turnover rate | | | 100 | %(D) | | | 127 | % | | | 122 | % | | | 102 | % | | | 44 | % |
Touchstone Flexible Income Fund—Class C
Selected Data for a Share Outstanding Throughout Each Period
| | | Year Ended March 31, | |
| | | 2018 | | | 2017 | | | 2016 | | | 2015 | | | 2014 | |
| Net asset value at beginning of period | | $ | 10.57 | | | $ | 10.44 | | | $ | 10.54 | | | $ | 10.47 | | | $ | 10.82 | |
| Income (loss) from investment operations: | | | | | | | | | | | | | | | | | | | | |
| Net investment income | | | 0.20 | | | | 0.20 | | | | 0.26 | | | | 0.34 | | | | 0.43 | |
| Net realized and unrealized gains (losses) on investments | | | 0.09 | | | | 0.13 | | | | (0.12 | ) | | | 0.12 | | | | (0.37 | ) |
| Total from investment operations | | | 0.29 | | | | 0.33 | | | | 0.14 | | | | 0.46 | | | | 0.06 | |
| Distributions from: | | | | | | | | | | | | | | | | | | | | |
| Net investment income | | | (0.19 | ) | | | (0.20 | ) | | | (0.24 | ) | | | (0.39 | ) | | | (0.41 | ) |
| Net asset value at end of period | | $ | 10.67 | | | $ | 10.57 | | | $ | 10.44 | | | $ | 10.54 | | | $ | 10.47 | |
| Total return(A) | | | 2.73 | % | | | 3.22 | % | | | 1.32 | % | | | 4.52 | % | | | 0.61 | % |
| Ratios and supplemental data: | | | | | | | | | | | | | | | | | | | | |
| Net assets at end of period (000's) | | $ | 100,800 | | | $ | 55,043 | | | $ | 45,079 | | | $ | 25,853 | | | $ | 21,043 | |
| Ratio to average net assets: | | | | | | | | | | | | | | | | | | | | |
| Net expenses (including dividend and interest expense on securities sold short) | | | 1.81 | %(B) | | | 1.85 | %(B) | | | 1.84 | % | | | 1.84 | % | | | 1.74 | % |
| Gross expenses (including dividend and interest expense on securities sold short) | | | 1.89 | %(C) | | | 2.00 | %(C) | | | 2.05 | % | | | 2.10 | % | | | 2.09 | % |
| Net investment income | | | 1.85 | % | | | 1.99 | % | | | 2.44 | % | | | 3.20 | % | | | 4.07 | % |
| Portfolio turnover rate | | | 100 | %(D) | | | 127 | % | | | 122 | % | | | 102 | % | | | 44 | % |
| (A) | Total returns shown exclude the effect of applicable sales loads. If these charges were included, the returns would be lower. |
| (B) | The ratio of net expenses to average net assets excluding dividend and interest expense on securities sold short for Class A was 1.06% and 1.09% and for Class C was 1.81% and 1.84% for the years ended March 31, 2018 and 2017, respectively. |
| (C) | The ratio of gross expenses to average net assets excluding dividend and interest expense on securities sold short for Class A was 1.14% and 1.29% and for Class C was 1.89% and 1.99% for the years ended March 31, 2018 and 2017, respectively. |
| (D) | Portfolio turnover excludes the purchases and sales of securities of the Sentinel Multi-Asset Income Fund acquired on October 27, 2017 (See Note 9 in the Notes to Financial Statements). If these transactions were included, portfolio turnover would have been higher. |
See accompanying Notes to Financial Statements.
Financial Highlights (Continued)
Touchstone Flexible Income Fund—Class Y
Selected Data for a Share Outstanding Throughout Each Period
| | | Year Ended March 31, | |
| | | 2018 | | | 2017 | | | 2016 | | | 2015 | | | 2014 | |
| Net asset value at beginning of period | | $ | 10.75 | | | $ | 10.61 | | | $ | 10.70 | | | $ | 10.62 | | | $ | 10.97 | |
| Income (loss) from investment operations: | | | | | | | | | | | | | | | | | | | | |
| Net investment income | | | 0.31 | | | | 0.32 | | | | 0.36 | | | | 0.46 | | | | 0.54 | |
| Net realized and unrealized gains (losses) on investments | | | 0.09 | | | | 0.13 | | | | (0.11 | ) | | | 0.12 | | | | (0.38 | ) |
| Total from investment operations | | | 0.40 | | | | 0.45 | | | | 0.25 | | | | 0.58 | | | | 0.16 | |
| Distributions from: | | | | | | | | | | | | | | | | | | | | |
| Net investment income | | | (0.30 | ) | | | (0.31 | ) | | | (0.34 | ) | | | (0.50 | ) | | | (0.51 | ) |
| Net asset value at end of period | | $ | 10.85 | | | $ | 10.75 | | | $ | 10.61 | | | $ | 10.70 | | | $ | 10.62 | |
| Total return | | | 3.71 | % | | | 4.28 | % | | | 2.38 | % | | | 5.58 | % | | | 1.63 | % |
| Ratios and supplemental data: | | | | | | | | | | | | | | | | | | | | |
| Net assets at end of period (000's) | | $ | 628,693 | | | $ | 464,002 | | | $ | 358,423 | | | $ | 238,081 | | | $ | 151,652 | |
| Ratio to average net assets: | | | | | | | | | | | | | | | | | | | | |
| Net expenses (including dividend and interest expense on securities sold short) | | | 0.82 | %(A) | | | 0.85 | %(A) | | | 0.84 | % | | | 0.84 | % | | | 0.71 | % |
| Gross expenses (including dividend and interest expense on securities sold short) | | | 0.90 | %(B) | | | 1.00 | %(B) | | | 1.05 | % | | | 1.01 | % | | | 1.00 | % |
| Net investment income | | | 2.84 | % | | | 2.99 | % | | | 3.44 | % | | | 4.21 | % | | | 5.10 | % |
| Portfolio turnover rate | | | 100 | %(C) | | | 127 | % | | | 122 | % | | | 102 | % | | | 44 | % |
Touchstone Flexible Income Fund—Institutional Class
Selected Data for a Share Outstanding Throughout Each Period
| | | Year Ended March 31, | |
| | | 2018 | | | 2017 | | | 2016 | | | 2015 | | | 2014 | |
| Net asset value at beginning of period | | $ | 10.74 | | | $ | 10.60 | | | $ | 10.69 | | | $ | 10.62 | | | $ | 10.96 | |
| Income (loss) from investment operations: | | | | | | | | | | | | | | | | | | | | |
| Net investment income | | | 0.33 | | | | 0.33 | | | | 0.36 | | | | 0.46 | | | | 0.54 | |
| Net realized and unrealized gains (losses) on investments | | | 0.08 | | | | 0.13 | | | | (0.10 | ) | | | 0.12 | | | | (0.36 | ) |
| Total from investment operations | | | 0.41 | | | | 0.46 | | | | 0.26 | | | | 0.58 | | | | 0.18 | |
| Distributions from: | | | | | | | | | | | | | | | | | | | | |
| Net investment income | | | (0.31 | ) | | | (0.32 | ) | | | (0.35 | ) | | | (0.51 | ) | | | (0.52 | ) |
| Net asset value at end of period | | $ | 10.84 | | | $ | 10.74 | | | $ | 10.60 | | | $ | 10.69 | | | $ | 10.62 | |
| Total return | | | 3.81 | % | | | 4.28 | % | | | 2.57 | % | | | 5.58 | % | | | 1.81 | % |
| Ratios and supplemental data: | | | | | | | | | | | | | | | | | | | | |
| Net assets at end of period (000's) | | $ | 86,578 | | | $ | 104,631 | | | $ | 82,286 | | | $ | 44,732 | | | $ | 41,361 | |
| Ratio to average net assets: | | | | | | | | | | | | | | | | | | | | |
| Net expenses (including dividend and interest expense on securities sold short) | | | 0.72 | %(A) | | | 0.75 | %(A) | | | 0.74 | % | | | 0.74 | % | | | 0.65 | % |
| Gross expenses (including dividend and interest expense on securities sold short) | | | 0.86 | %(B) | | | 0.92 | %(B) | | | 0.94 | % | | | 0.95 | % | | | 0.95 | % |
| Net investment income | | | 2.94 | % | | | 3.09 | % | | | 3.54 | % | | | 4.30 | % | | | 5.16 | % |
| Portfolio turnover rate | | | 100 | %(C) | | | 127 | % | | | 122 | % | | | 102 | % | | | 44 | % |
| (A) | The ratio of net expenses to average net assets excluding dividend and interest expense on securities sold short for Class Y was 0.82% and 0.84% and for Institutional Class was 0.72% and 0.74% for the years ended March 31, 2018 and 2017, respectively. |
| (B) | The ratio of gross expenses to average net assets excluding dividend and interest expense on securities sold short for Class Y was 0.90% and 0.99% and for Institutional Class was 0.86% and 0.91% for the years ended March 31, 2018 and 2017, respectively. |
| (C) | Portfolio turnover excludes the purchases and sales of securities of the Sentinel Multi-Asset Income Fund acquired on October 27, 2017 (See Note 9 in the Notes to Financial Statements). If these transactions were included, portfolio turnover would have been higher. |
See accompanying Notes to Financial Statements.
Financial Highlights (Continued)
Touchstone Focused Fund—Class A
Selected Data for a Share Outstanding Throughout Each Period
| | | Year Ended March 31, | |
| | | 2018 | | | 2017 | | | 2016 | | | 2015 | | | 2014 | |
| Net asset value at beginning of period | | $ | 41.47 | | | $ | 36.68 | | | $ | 37.19 | | | $ | 34.87 | | | $ | 27.55 | |
| Income from investment operations: | | | | | | | | | | | | | | | | | | | | |
| Net investment income(A) | | | 0.17 | | | | 0.15 | | | | 0.16 | | | | 0.20 | | | | 0.11 | |
| Net realized and unrealized gains on investments | | | 4.02 | | | | 5.12 | | | | 0.38 | | | | 2.23 | | | | 7.46 | |
| Total from investment operations | | | 4.19 | | | | 5.27 | | | | 0.54 | | | | 2.43 | | | | 7.57 | |
| Distributions from: | | | | | | | | | | | | | | | | | | | | |
| Net investment income | | | — | | | | (0.14 | ) | | | (0.20 | ) | | | (0.11 | ) | | | (0.25 | ) |
| Realized capital gains | | | (2.73 | ) | | | (0.34 | ) | | | (0.85 | ) | | | — | | | | — | |
| Total distributions | | | (2.73 | ) | | | (0.48 | ) | | | (1.05 | ) | | | (0.11 | ) | | | (0.25 | ) |
| Net asset value at end of period | | $ | 42.93 | | | $ | 41.47 | | | $ | 36.68 | | | $ | 37.19 | | | $ | 34.87 | |
| Total return(B) | | | 10.13 | % | | | 14.45 | % | | | 1.47 | % | | | 6.99 | % | | | 27.67 | % |
| Ratios and supplemental data: | | | | | | | | | | | | | | | | | | | | |
| Net assets at end of period (000's) | | $ | 167,354 | | | $ | 425,366 | | | $ | 405,458 | | | $ | 297,072 | | | $ | 233,841 | |
| Ratio to average net assets: | | | | | | | | | | | | | | | | | | | | |
| Net expenses | | | 1.20 | % | | | 1.20 | % | | | 1.20 | % | | | 1.20 | % | | | 1.20 | % |
| Gross expenses | | | 1.29 | % | | | 1.28 | % | | | 1.31 | % | | | 1.37 | % | | | 1.46 | % |
| Net investment income | | | 0.40 | % | | | 0.39 | % | | | 0.43 | % | | | 0.57 | % | | | 0.35 | % |
| Portfolio turnover rate | | | 8 | %(C) | | | 20 | % | | | 28 | % | | | 33 | % | | | 27 | %(D) |
Touchstone Focused Fund—Class C
Selected Data for a Share Outstanding Throughout Each Period
| | | Year Ended March 31, | |
| | | 2018 | | | 2017 | | | 2016 | | | 2015 | | | 2014 | |
| Net asset value at beginning of period | | $ | 39.90 | | | $ | 35.54 | | | $ | 36.34 | | | $ | 34.32 | | | $ | 27.33 | |
| Income (loss) from investment operations: | | | | | | | | | | | | | | | | | | | | |
| Net investment loss(A) | | | (0.14 | ) | | | (0.13 | ) | | | (0.11 | ) | | | (0.06 | ) | | | (0.13 | ) |
| Net realized and unrealized gains on investments | | | 3.86 | | | | 4.94 | | | | 0.37 | | | | 2.18 | | | | 7.38 | |
| Total from investment operations | | | 3.72 | | | | 4.81 | | | | 0.26 | | | | 2.12 | | | | 7.25 | |
| Distributions from: | | | | | | | | | | | | | | | | | | | | |
| Net investment income | | | — | | | | (0.11 | ) | | | (0.21 | ) | | | (0.10 | ) | | | (0.26 | ) |
| Realized capital gains | | | (2.73 | ) | | | (0.34 | ) | | | (0.85 | ) | | | — | | | | — | |
| Total distributions | | | (2.73 | ) | | | (0.45 | ) | | | (1.06 | ) | | | (0.10 | ) | | | (0.26 | ) |
| Net asset value at end of period | | $ | 40.89 | | | $ | 39.90 | | | $ | 35.54 | | | $ | 36.34 | | | $ | 34.32 | |
| Total return(B) | | | 9.34 | % | | | 13.56 | % | | | 0.73 | % | | | 6.18 | % | | | 26.72 | % |
| Ratios and supplemental data: | | | | | | | | | | | | | | | | | | | | |
| Net assets at end of period (000's) | | $ | 41,635 | | | $ | 53,776 | | | $ | 44,338 | | | $ | 9,617 | | | $ | 5,626 | |
| Ratio to average net assets: | | | | | | | | | | | | | | | | | | | | |
| Net expenses | | | 1.94 | % | | | 1.95 | % | | | 1.95 | % | | | 1.95 | % | | | 1.95 | % |
| Gross expenses | | | 1.94 | % | | | 1.97 | % | | | 2.00 | % | | | 2.09 | % | | | 2.84 | % |
| Net investment loss | | | (0.34 | %) | | | (0.36 | %) | | | (0.32 | %) | | | (0.18 | %) | | | (0.40 | %) |
| Portfolio turnover rate | | | 8 | %(C) | | | 20 | % | | | 28 | % | | | 33 | % | | | 27 | %(D) |
| (A) | The net investment income (loss) per share was based on average shares outstanding for the period. |
| (B) | Total returns shown exclude the effect of applicable sales loads. If these charges were included, the returns would be lower. |
| (C) | Portfolio turnover excludes securities delivered from processing a redemption-in-kind. |
| (D) | Portfolio turnover excludes the purchases and sales of securities of the Touchstone Focused Equity Fund acquired on May 17, 2013. If these transactions were included, portfolio turnover would have been higher. |
See accompanying Notes to Financial Statements.
Financial Highlights (Continued)
Touchstone Focused Fund—Class Y
Selected Data for a Share Outstanding Throughout Each Period
| | | Year Ended March 31, | |
| | | 2018 | | | 2017 | | | 2016 | | | 2015 | | | 2014 | |
| Net asset value at beginning of period | | $ | 42.21 | | | $ | 37.29 | | | $ | 37.76 | | | $ | 35.34 | | | $ | 27.86 | |
| Income from investment operations: | | | | | | | | | | | | | | | | | | | | |
| Net investment income(A) | | | 0.31 | | | | 0.27 | | | | 0.26 | | | | 0.31 | | | | 0.19 | |
| Net realized and unrealized gains on investments | | | 4.08 | | | | 5.22 | | | | 0.39 | | | | 2.26 | | | | 7.54 | |
| Total from investment operations | | | 4.39 | | | | 5.49 | | | | 0.65 | | | | 2.57 | | | | 7.73 | |
| Distributions from: | | | | | | | | | | | | | | | | | | | | |
| Net investment income | | | (0.37 | ) | | | (0.23 | ) | | | (0.27 | ) | | | (0.15 | ) | | | (0.25 | ) |
| Realized capital gains | | | (2.73 | ) | | | (0.34 | ) | | | (0.85 | ) | | | — | | | | — | |
| Total distributions | | | (3.10 | ) | | | (0.57 | ) | | | (1.12 | ) | | | (0.15 | ) | | | (0.25 | ) |
| Net asset value at end of period | | $ | 43.50 | | | $ | 42.21 | | | $ | 37.29 | | | $ | 37.76 | | | $ | 35.34 | |
| Total return | | | 10.43 | % | | | 14.77 | % | | | 1.75 | % | | | 7.29 | % | | | 27.95 | % |
| Ratios and supplemental data: | | | | | | | | | | | | | | | | | | | | |
| Net assets at end of period (000's) | | $ | 972,273 | | | $ | 974,660 | | | $ | 853,900 | | | $ | 756,579 | | | $ | 736,023 | |
| Ratio to average net assets: | | | | | | | | | | | | | | | | | | | | |
| Net expenses | | | 0.91 | % | | | 0.92 | % | | | 0.93 | % | | | 0.92 | % | | | 0.94 | % |
| Gross expenses | | | 0.91 | % | | | 0.92 | % | | | 0.94 | % | | | 0.97 | % | | | 1.02 | % |
| Net investment income | | | 0.69 | % | | | 0.68 | % | | | 0.70 | % | | | 0.85 | % | | | 0.61 | % |
| Portfolio turnover rate | | | 8 | %(B) | | | 20 | % | | | 28 | % | | | 33 | % | | | 27 | %(C) |
Touchstone Focused Fund—Institutional Class
Selected Data for a Share Outstanding Throughout Each Period
| | | Year Ended March 31, | |
| | | 2018 | | | 2017 | | | 2016 | | | 2015 | | | 2014 | |
| Net asset value at beginning of period | | $ | 42.38 | | | $ | 37.45 | | | $ | 37.91 | | | $ | 35.47 | | | $ | 27.96 | |
| Income from investment operations: | | | | | | | | | | | | | | | | | | | | |
| Net investment income(A) | | | 0.34 | | | | 0.30 | | | | 0.31 | | | | 0.35 | | | | 0.24 | |
| Net realized and unrealized gains on investments | | | 4.11 | | | | 5.24 | | | | 0.39 | | | | 2.28 | | | | 7.57 | |
| Total from investment operations | | | 4.45 | | | | 5.54 | | | | 0.70 | | | | 2.63 | | | | 7.81 | |
| Distributions from: | | | | | | | | | | | | | | | | | | | | |
| Net investment income | | | (0.42 | ) | | | (0.27 | ) | | | (0.31 | ) | | | (0.19 | ) | | | (0.30 | ) |
| Realized capital gains | | | (2.73 | ) | | | (0.34 | ) | | | (0.85 | ) | | | — | | | | — | |
| Total distributions | | | (3.15 | ) | | | (0.61 | ) | | | (1.16 | ) | | | (0.19 | ) | | | (0.30 | ) |
| Net asset value at end of period | | $ | 43.68 | | | $ | 42.38 | | | $ | 37.45 | | | $ | 37.91 | | | $ | 35.47 | |
| Total return | | | 10.54 | % | | | 14.84 | % | | | 1.89 | % | | | 7.40 | % | | | 28.19 | % |
| Ratios and supplemental data: | | | | | | | | | | | | | | | | | | | | |
| Net assets at end of period (000's) | | $ | 22,556 | | | $ | 41,389 | | | $ | 48,805 | | | $ | 51,765 | | | $ | 30,446 | |
| Ratio to average net assets: | | | | | | | | | | | | | | | | | | | | |
| Net expenses | | | 0.83 | % | | | 0.83 | % | | | 0.82 | % | | | 0.80 | % | | | 0.80 | % |
| Gross expenses | | | 0.92 | % | | | 0.88 | % | | | 0.90 | % | | | 0.88 | % | | | 1.00 | % |
| Net investment income | | | 0.77 | % | | | 0.76 | % | | | 0.81 | % | | | 0.97 | % | | | 0.75 | % |
| Portfolio turnover rate | | | 8 | %(B) | | | 20 | % | | | 28 | % | | | 33 | % | | | 27 | %(C) |
| (A) | The net investment income per share was based on average shares outstanding for the period. |
| (B) | Portfolio turnover excludes securities delivered from processing a redemption-in-kind. |
| (C) | Portfolio turnover excludes the purchases and sales of securities of the Touchstone Focused Equity Fund acquired on May 17, 2013. If these transactions were included, portfolio turnover would have been higher. |
See accompanying Notes to Financial Statements.
Financial Highlights (Continued)
Touchstone Growth Opportunities Fund—Class A
Selected Data for a Share Outstanding Throughout Each Period
| | | Year Ended March 31, | |
| | | 2018 | | | 2017 | | | 2016 | | | 2015 | | | 2014 | |
| Net asset value at beginning of period | | $ | 30.20 | | | $ | 27.35 | | | $ | 33.29 | | | $ | 32.61 | | | $ | 27.05 | |
| Income (loss) from investment operations: | | | | | | | | | | | | | | | | | | | | |
| Net investment income (loss) | | | (0.11 | ) | | | (— | )(A) | | | (0.08 | ) | | | (0.15 | ) | | | 0.01 | |
| Net realized and unrealized gains (losses) on investments | | | 5.89 | | | | 3.86 | | | | (2.90 | ) | | | 4.82 | | | | 6.91 | |
| Total from investment operations | | | 5.78 | | | | 3.86 | | | | (2.98 | ) | | | 4.67 | | | | 6.92 | |
| Distributions from: | | | | | | | | | | | | | | | | | | | | |
| Realized capital gains | | | (3.19 | ) | | | (1.01 | ) | | | (2.96 | ) | | | (3.99 | ) | | | (1.36 | ) |
| Net asset value at end of period | | $ | 32.79 | | | $ | 30.20 | | | $ | 27.35 | | | $ | 33.29 | | | $ | 32.61 | |
| Total return(B) | | | 19.51 | % | | | 14.38 | % | | | (9.12 | %) | | | 14.99 | % | | | 25.84 | % |
| Ratios and supplemental data: | | | | | | | | | | | | | | | | | | | | |
| Net assets at end of period (000's) | | $ | 39,901 | | | $ | 38,752 | | | $ | 38,297 | | | $ | 49,162 | | | $ | 47,552 | |
| Ratio to average net assets: | | | | | | | | | | | | | | | | | | | | |
| Net expenses | | | 1.24 | % | | | 1.24 | % | | | 1.24 | % | | | 1.24 | % | | | 1.22 | % |
| Gross expenses | | | 1.38 | % | | | 1.39 | % | | | 1.38 | % | | | 1.40 | % | | | 1.43 | % |
| Net investment income (loss) | | | (0.32 | %) | | | (0.01 | %) | | | (0.24 | %) | | | (0.47 | %) | | | 0.09 | % |
| Portfolio turnover rate | | | 86 | % | | | 90 | % | | | 137 | % | | | 87 | % | | | 79 | % |
Touchstone Growth Opportunities Fund — Class C
Selected Data for a Share Outstanding Throughout Each Period
| | | Year Ended March 31, | |
| | | 2018 | | | 2017 | | | 2016 | | | 2015 | | | 2014 | |
| Net asset value at beginning of period | | $ | 25.60 | | | $ | 23.51 | | | $ | 29.27 | | | $ | 29.32 | | | $ | 24.62 | |
| Income (loss) from investment operations: | | | | | | | | | | | | | | | | | | | | |
| Net investment loss | | | (0.29 | ) | | | (0.23 | ) | | | (0.24 | ) | | | (0.33 | ) | | | (0.18 | ) |
| Net realized and unrealized gains (losses) on investments | | | 4.96 | | | | 3.33 | | | | (2.56 | ) | | | 4.27 | | | | 6.24 | |
| Total from investment operations | | | 4.67 | | | | 3.10 | | | | (2.80 | ) | | | 3.94 | | | | 6.06 | |
| Distributions from: | | | | | | | | | | | | | | | | | | | | |
| Realized capital gains | | | (3.19 | ) | | | (1.01 | ) | | | (2.96 | ) | | | (3.99 | ) | | | (1.36 | ) |
| Net asset value at end of period | | $ | 27.08 | | | $ | 25.60 | | | $ | 23.51 | | | $ | 29.27 | | | $ | 29.32 | |
| Total return(B) | | | 18.65 | % | | | 13.49 | % | | | (9.78 | %) | | | 14.11 | % | | | 24.92 | % |
| Ratios and supplemental data: | | | | | | | | | | | | | | | | | | | | |
| Net assets at end of period (000's) | | $ | 8,680 | | | $ | 8,574 | | | $ | 11,665 | | | $ | 13,813 | | | $ | 12,498 | |
| Ratio to average net assets: | | | | | | | | | | | | | | | | | | | | |
| Net expenses | | | 1.99 | % | | | 1.99 | % | | | 1.99 | % | | | 1.99 | % | | | 1.97 | % |
| Gross expenses | | | 2.29 | % | | | 2.26 | % | | | 2.20 | % | | | 2.21 | % | | | 2.25 | % |
| Net investment loss | | | (1.07 | %) | | | (0.76 | %) | | | (0.99 | %) | | | (1.22 | %) | | | (0.66 | %) |
| Portfolio turnover rate | | | 86 | % | | | 90 | % | | | 137 | % | | | 87 | % | | | 79 | % |
| (A) | Less than $0.005 per share. |
| (B) | Total returns shown exclude the effect of applicable sales loads. If these charges were included, the returns would be lower. |
See accompanying Notes to Financial Statements.
Financial Highlights (Continued)
Touchstone Growth Opportunities Fund—Class Y
Selected Data for a Share Outstanding Throughout Each Period
| | | Year Ended March 31, | |
| | | 2018 | | | 2017 | | | 2016 | | | 2015 | | | 2014 | |
| Net asset value at beginning of period | | $ | 30.87 | | | $ | 27.90 | | | $ | 33.81 | | | $ | 32.97 | | | $ | 27.27 | |
| Income (loss) from investment operations: | | | | | | | | | | | | | | | | | | | | |
| Net investment income (loss) | | | (0.02 | ) | | | 0.10 | | | | — | (A) | | | (0.06 | ) | | | 0.11 | |
| Net realized and unrealized gains (losses) on investments | | | 6.03 | | | | 3.91 | | | | (2.95 | ) | | | 4.90 | | | | 6.96 | |
| Total from investment operations | | | 6.01 | | | | 4.01 | | | | (2.95 | ) | | | 4.84 | | | | 7.07 | |
| Distributions from: | | | | | | | | | | | | | | | | | | | | |
| Net investment income | | | — | | | | (0.03 | ) | | | — | | | | (0.01 | ) | | | (0.01 | ) |
| Realized capital gains | | | (3.19 | ) | | | (1.01 | ) | | | (2.96 | ) | | | (3.99 | ) | | | (1.36 | ) |
| Total distributions | | | (3.19 | ) | | | (1.04 | ) | | | (2.96 | ) | | | (4.00 | ) | | | (1.37 | ) |
| Net asset value at end of period | | $ | 33.69 | | | $ | 30.87 | | | $ | 27.90 | | | $ | 33.81 | | | $ | 32.97 | |
| Total return | | | 19.80 | % | | | 14.64 | % | | | (8.88 | %) | | | 15.32 | % | | | 26.23 | % |
| Ratios and supplemental data: | | | | | | | | | | | | | | | | | | | | |
| Net assets at end of period (000's) | | $ | 47,554 | | | $ | 47,222 | | | $ | 83,721 | | | $ | 107,295 | | | $ | 92,063 | |
| Ratio to average net assets: | | | | | | | | | | | | | | | | | | | | |
| Net expenses | | | 0.99 | % | | | 0.99 | % | | | 0.99 | % | | | 0.94 | % | | | 0.92 | % |
| Gross expenses | | | 1.07 | % | | | 1.07 | % | | | 1.07 | % | | | 1.01 | % | | | 1.03 | % |
| Net investment income (loss) | | | (0.07 | %) | | | 0.24 | % | | | 0.01 | % | | | (0.17 | %) | | | 0.39 | % |
| Portfolio turnover rate | | | 86 | % | | | 90 | % | | | 137 | % | | | 87 | % | | | 79 | % |
Touchstone Growth Opportunities Fund—Institutional Class
Selected Data for a Share Outstanding Throughout Each Period
| | | Year Ended March 31, | |
| | | 2018 | | | 2017 | | | 2016 | | | 2015 | | | 2014 | |
| Net asset value at beginning of period | | $ | 31.16 | | | $ | 28.15 | | | $ | 34.05 | | | $ | 33.18 | | | $ | 27.42 | |
| Income (loss) from investment operations: | | | | | | | | | | | | | | | | | | | | |
| Net investment income (loss) | | | 0.01 | | | | 0.12 | | | | 0.01 | | | | (0.04 | ) | | | 0.14 | |
| Net realized and unrealized gains (losses) on investments | | | 6.10 | | | | 3.96 | | | | (2.95 | ) | | | 4.92 | | | | 7.01 | |
| Total from investment operations | | | 6.11 | | | | 4.08 | | | | (2.94 | ) | | | 4.88 | | | | 7.15 | |
| Distributions from: | | | | | | | | | | | | | | | | | | | | |
| Net investment income | | | — | | | | (0.06 | ) | | | — | | | | (0.02 | ) | | | (0.03 | ) |
| Realized capital gains | | | (3.19 | ) | | | (1.01 | ) | | | (2.96 | ) | | | (3.99 | ) | | | (1.36 | ) |
| Total distributions | | | (3.19 | ) | | | (1.07 | ) | | | (2.96 | ) | | | (4.01 | ) | | | (1.39 | ) |
| Net asset value at end of period | | $ | 34.08 | | | $ | 31.16 | | | $ | 28.15 | | | $ | 34.05 | | | $ | 33.18 | |
| Total return | | | 19.94 | % | | | 14.77 | % | | | (8.79 | %) | | | 15.39 | % | | | 26.34 | % |
| Ratios and supplemental data: | | | | | | | | | | | | | | | | | | | | |
| Net assets at end of period (000's) | | $ | 185,831 | | | $ | 150,038 | | | $ | 176,191 | | | $ | 134,795 | | | $ | 115,769 | |
| Ratio to average net assets: | | | | | | | | | | | | | | | | | | | | |
| Net expenses | | | 0.89 | % | | | 0.89 | % | | | 0.89 | % | | | 0.87 | % | | | 0.84 | % |
| Gross expenses | | | 1.01 | % | | | 1.00 | % | | | 0.98 | % | | | 0.97 | % | | | 0.98 | % |
| Net investment income (loss) | | | 0.03 | % | | | 0.34 | % | | | 0.11 | % | | | (0.10 | %) | | | 0.47 | % |
| Portfolio turnover rate | | | 86 | % | | | 90 | % | | | 137 | % | | | 87 | % | | | 79 | % |
| (A) | Less than $0.005 per share. |
See accompanying Notes to Financial Statements.
Financial Highlights (Continued)
Touchstone International Growth Fund—Class A
Selected Data for a Share Outstanding Throughout Each Period
| | | Year Ended | |
| | | March 31, | |
| | | 2018 | | | 2017(A) | |
| Net asset value at beginning of period | | $ | 10.80 | | | $ | 10.00 | |
| Income from investment operations: | | | | | | | | |
| Net investment income | | | 0.04 | | | | 0.02 | |
| Net realized and unrealized gains on investments | | | 2.05 | | | | 0.80 | |
| Total from investment operations | | | 2.09 | | | | 0.82 | |
| Distributions from: | | | | | | | | |
| Net investment income | | | (0.08 | ) | | | (0.02 | ) |
| Realized capital gains | | | (0.01 | ) | | | — | |
| Total distributions | | | (0.09 | ) | | | (0.02 | ) |
| Net asset value at end of period | | $ | 12.80 | | | $ | 10.80 | |
| Total return(B) | | | 19.35 | % | | | 8.26 | % |
| Ratios and supplemental data: | | | | | | | | |
| Net assets at end of period (000's) | | $ | 159 | | | $ | 39 | |
| Ratio to average net assets: | | | | | | | | |
| Net expenses | | | 1.32 | % | | | 1.32 | % |
| Gross expenses | | | 13.96 | % | | | 190.56 | % |
| Net investment income | | | 0.33 | % | | | 0.57 | % |
| Portfolio turnover rate | | | 51 | % | | | 63 | % |
Touchstone International Growth Fund— Class C
Selected Data for a Share Outstanding Throughout Each Period
| | | Year Ended | |
| | | March 31, | |
| | | 2018 | | | 2017(A) | |
| Net asset value at beginning of period | | $ | 10.74 | | | $ | 10.00 | |
| Income (Loss) from investment operations: | | | | | | | | |
| Net investment loss | | | (0.01 | ) | | | (0.02 | ) |
| Net realized and unrealized gains on investments | | | 2.00 | | | | 0.76 | |
| Total from investment operations | | | 1.99 | | | | 0.74 | |
| Distributions from: | | | | | | | | |
| Net investment income | | | (0.05 | ) | | | — | |
| Realized capital gains | | | (0.01 | ) | | | — | |
| Total distributions | | | (0.06 | ) | | | — | |
| Net asset value at end of period | | $ | 12.67 | | | $ | 10.74 | |
| Total return(B) | | | 18.53 | % | | | 7.40 | % |
| Ratios and supplemental data: | | | | | | | | |
| Net assets at end of period (000's) | | $ | 40 | | | $ | 3 | |
| Ratio to average net assets: | | | | | | | | |
| Net expenses | | | 2.07 | % | | | 2.07 | % |
| Gross expenses | | | 43.83 | % | | | 291.55 | % |
| Net investment loss | | | (0.42 | %) | | | (0.18 | %) |
| Portfolio turnover rate | | | 51 | % | | | 63 | % |
| (A) | Represents the period from commencement of operations (April 1, 2016) through March 31, 2017. |
| (B) | Total returns shown exclude the effect of applicable sales loads. If these charges were included, the returns would be lower. |
See accompanying Notes to Financial Statements.
Financial Highlights (Continued)
Touchstone International Growth Fund—Class Y
Selected Data for a Share Outstanding Throughout Each Period
| | | Year Ended | |
| | | March 31, | |
| | | 2018 | | | 2017(A) | |
| Net asset value at beginning of period | | $ | 10.79 | | | $ | 10.00 | |
| Income from investment operations: | | | | | | | | |
| Net investment income | | | 0.01 | | | | 0.08 | |
| Net realized and unrealized gains on investments | | | 2.11 | | | | 0.76 | |
| Total from investment operations | | | 2.12 | | | | 0.84 | |
| Distributions from: | | | | | | | | |
| Net investment income | | | (0.10 | ) | | | (0.05 | ) |
| Realized capital gains | | | (0.01 | ) | | | — | |
| Total distributions | | | (0.11 | ) | | | (0.05 | ) |
| Net asset value at end of period | | $ | 12.80 | | | $ | 10.79 | |
| Total return | | | 19.63 | % | | | 8.39 | % |
| Ratios and supplemental data: | | | | | | | | |
| Net assets at end of period (000's) | | $ | 32 | | | $ | 4 | |
| Ratio to average net assets: | | | | | | | | |
| Net expenses | | | 1.07 | % | | | 1.07 | % |
| Gross expenses | | | 79.43 | % | | | 276.18 | % |
| Net investment income | | | 0.58 | % | | | 0.82 | % |
| Portfolio turnover rate | | | 51 | % | | | 63 | % |
Touchstone International Growth Fund—Institutional Class
Selected Data for a Share Outstanding Throughout Each Period
| | | Year Ended | |
| | | March 31, | |
| | | 2018 | | | 2017(A) | |
| Net asset value at beginning of period | | $ | 10.80 | | | $ | 10.00 | |
| Income from investment operations: | | | | | | | | |
| Net investment income | | | 0.08 | | | | 0.08 | |
| Net realized and unrealized gains on investments | | | 2.05 | | | | 0.77 | |
| Total from investment operations | | | 2.13 | | | | 0.85 | |
| Distributions from: | | | | | | | | |
| Net investment income | | | (0.10 | ) | | | (0.05 | ) |
| Realized capital gains | | | (0.01 | ) | | | — | |
| Total distributions | | | (0.11 | ) | | | (0.05 | ) |
| Net asset value at end of period | | $ | 12.82 | | | $ | 10.80 | |
| Total return | | | 19.69 | % | | | 8.56 | % |
| Ratios and supplemental data: | | | | | | | | |
| Net assets at end of period (000's) | | $ | 15,086 | | | $ | 11,874 | |
| Ratio to average net assets: | | | | | | | | |
| Net expenses | | | 0.97 | % | | | 0.97 | % |
| Gross expenses | | | 1.57 | % | | | 1.86 | % |
| Net investment income | | | 0.68 | % | | | 0.92 | % |
| Portfolio turnover rate | | | 51 | % | | | 63 | % |
| (A) | Represents the period from commencement of operations (April 1, 2016) through March 31, 2017. |
See accompanying Notes to Financial Statements.
Financial Highlights (Continued)
Touchstone International Value Fund—Class A
Selected Data for a Share Outstanding Throughout Each Period
| | | Year Ended March 31, | |
| | | 2018 | | | 2017 | | | 2016 | | | 2015 | | | 2014 | |
| Net asset value at beginning of period | | $ | 7.20 | | | $ | 7.37 | | | $ | 8.41 | | | $ | 9.12 | | | $ | 7.62 | |
| Income (loss) from investment operations: | | | | | | | | | | | | | | | | | | | | |
| Net investment income | | | 0.12 | (A) | | | 0.16 | (A) | | | 0.14 | (A) | | | 0.18 | | | | 0.24 | |
| Net realized and unrealized gains (losses) on investments | | | 0.98 | | | | 0.57 | | | | (0.97 | ) | | | (0.63 | ) | | | 1.35 | |
| Total from investment operations | | | 1.10 | | | | 0.73 | | | | (0.83 | ) | | | (0.45 | ) | | | 1.59 | |
| Distributions from: | | | | | | | | | | | | | | | | | | | | |
| Net investment income | | | (0.17 | ) | | | (0.90 | ) | | | (0.21 | ) | | | (0.26 | ) | | | (0.09 | ) |
| Net asset value at end of period | | $ | 8.13 | | | $ | 7.20 | | | $ | 7.37 | | | $ | 8.41 | | | $ | 9.12 | |
| Total return(B) | | | 15.37 | % | | | 10.80 | % | | | (9.97 | %) | | | (4.95 | %) | | | 20.90 | % |
| Ratios and supplemental data: | | | | | | | | | | | | | | | | | | | | |
| Net assets at end of period (000's) | | $ | 3,612 | | | $ | 3,548 | | | $ | 3,700 | | | $ | 5,280 | | | $ | 6,032 | |
| Ratio to average net assets: | | | | | | | | | | | | | | | | | | | | |
| Net expenses | | | 1.34 | % | | | 1.34 | % | | | 1.36 | % | | | 1.39 | % | | | 1.37 | % |
| Gross expenses | | | 2.66 | % | | | 2.56 | % | | | 2.10 | % | | | 1.97 | % | | | 1.79 | % |
| Net investment income | | | 1.51 | % | | | 2.16 | % | | | 1.78 | % | | | 1.89 | % | | | 2.32 | % |
| Portfolio turnover rate | | | 63 | % | | | 23 | % | | | 38 | % | | | 26 | % | | | 31 | % |
Touchstone International Value Fund—Class C
Selected Data for a Share Outstanding Throughout Each Period
| | | Year Ended March 31, | |
| | | 2018 | | | 2017 | | | 2016 | | | 2015 | | | 2014 | |
| Net asset value at beginning of period | | $ | 6.67 | | | $ | 6.83 | | | $ | 7.77 | | | $ | 8.46 | | | $ | 7.10 | |
| Income (loss) from investment operations: | | | | | | | | | | | | | | | | | | | | |
| Net investment income | | | 0.06 | (A) | | | 0.09 | (A) | | | 0.08 | (A) | | | 0.07 | | | | 0.15 | |
| Net realized and unrealized gains (losses) on investments | | | 0.90 | | | | 0.54 | | | | (0.90 | ) | | | (0.55 | ) | | | 1.27 | |
| Total from investment operations | | | 0.96 | | | | 0.63 | | | | (0.82 | ) | | | (0.48 | ) | | | 1.42 | |
| Distributions from: | | | | | | | | | | | | | | | | | | | | |
| Net investment income | | | (0.12 | ) | | | (0.79 | ) | | | (0.12 | ) | | | (0.21 | ) | | | (0.06 | ) |
| Net asset value at end of period | | $ | 7.51 | | | $ | 6.67 | | | $ | 6.83 | | | $ | 7.77 | | | $ | 8.46 | |
| Total return(B) | | | 14.50 | % | | | 10.01 | % | | | (10.61 | %) | | | (5.72 | %) | | | 20.05 | % |
| Ratios and supplemental data: | | | | | | | | | | | | | | | | | | | | |
| Net assets at end of period (000's) | | $ | 263 | | | $ | 227 | | | $ | 122 | | | $ | 233 | | | $ | 216 | |
| Ratio to average net assets: | | | | | | | | | | | | | | | | | | | | |
| Net expenses | | | 2.09 | % | | | 2.09 | % | | | 2.11 | % | | | 2.14 | % | | | 2.12 | % |
| Gross expenses | | | 9.12 | % | | | 11.75 | % | | | 9.23 | % | | | 8.35 | % | | | 6.04 | % |
| Net investment income | | | 0.76 | % | | | 1.41 | % | | | 1.03 | % | | | 1.14 | % | | | 1.57 | % |
| Portfolio turnover rate | | | 63 | % | | | 23 | % | | | 38 | % | | | 26 | % | | | 31 | % |
| (A) | The net investment income per share was based on average shares outstanding for the period. |
| (B) | Total returns shown exclude the effect of applicable sales loads. If these charges were included, the returns would be lower. |
See accompanying Notes to Financial Statements.
Financial Highlights (Continued)
Touchstone International Value Fund—Class Y
Selected Data for a Share Outstanding Throughout Each Period
| | | Year Ended March 31, | |
| | | 2018 | | | 2017 | | | 2016 | | | 2015 | | | 2014 | |
| Net asset value at beginning of period | | $ | 7.21 | | | $ | 7.39 | | | $ | 8.41 | | | $ | 9.13 | | | $ | 7.62 | |
| Income (loss) from investment operations: | | | | | | | | | | | | | | | | | | | | |
| Net investment income | | | 0.14 | (A) | | | 0.18 | (A) | | | 0.17 | (A) | | | 0.23 | | | | 0.19 | |
| Net realized and unrealized gains (losses) on investments | | | 0.98 | | | | 0.58 | | | | (0.98 | ) | | | (0.66 | ) | | | 1.43 | |
| Total from investment operations | | | 1.12 | | | | 0.76 | | | | (0.81 | ) | | | (0.43 | ) | | | 1.62 | |
| Distributions from: | | | | | | | | | | | | | | | | | | | | |
| Net investment income | | | (0.19 | ) | | | (0.94 | ) | | | (0.21 | ) | | | (0.29 | ) | | | (0.11 | ) |
| Net asset value at end of period | | $ | 8.14 | | | $ | 7.21 | | | $ | 7.39 | | | $ | 8.41 | | | $ | 9.13 | |
| Total return | | | 15.64 | % | | | 11.11 | % | | | (9.77 | %) | | | (4.72 | %) | | | 21.32 | % |
| Ratios and supplemental data: | | | | | | | | | | | | | | | | | | | | |
| Net assets at end of period (000's) | | $ | 2,377 | | | $ | 3,540 | | | $ | 4,583 | | | $ | 35,108 | | | $ | 43,794 | |
| Ratio to average net assets: | | | | | | | | | | | | | | | | | | | | |
| Net expenses | | | 1.09 | % | | | 1.09 | % | | | 1.12 | % | | | 1.09 | % | | | 1.04 | % |
| Gross expenses | | | 2.27 | % | | | 2.02 | % | | | 1.56 | % | | | 1.36 | % | | | 1.33 | % |
| Net investment income | | | 1.76 | % | | | 2.41 | % | | | 2.02 | % | | | 2.19 | % | | | 2.65 | % |
| Portfolio turnover rate | | | 63 | % | | | 23 | % | | | 38 | % | | | 26 | % | | | 31 | % |
Touchstone International Value Fund—Institutional Class
Selected Data for a Share Outstanding Throughout Each Period
| | | Year Ended March 31, | |
| | | 2018 | | | 2017 | | | 2016 | | | 2015 | | | 2014 | |
| Net asset value at beginning of period | | $ | 7.15 | | | $ | 7.35 | | | $ | 8.42 | | | $ | 9.14 | | | $ | 7.62 | |
| Income (loss) from investment operations: | | | | | | | | | | | | | | | | | | | | |
| Net investment income | | | 0.15 | (A) | | | 0.18 | (A) | | | 0.17 | (A) | | | 0.24 | | | | 0.28 | |
| Net realized and unrealized gains (losses) on investments | | | 0.98 | | | | 0.59 | | | | (0.98 | ) | | | (0.66 | ) | | | 1.36 | |
| Total from investment operations | | | 1.13 | | | | 0.77 | | | | (0.81 | ) | | | (0.42 | ) | | | 1.64 | |
| Distributions from: | | | | | | | | | | | | | | | | | | | | |
| Net investment income | | | (0.20 | ) | | | (0.97 | ) | | | (0.26 | ) | | | (0.30 | ) | | | (0.12 | ) |
| Net asset value at end of period | | $ | 8.08 | | | $ | 7.15 | | | $ | 7.35 | | | $ | 8.42 | | | $ | 9.14 | |
| Total return | | | 15.89 | % | | | 11.31 | % | | | (9.74 | %) | | | (4.66 | %) | | | 21.51 | % |
| Ratios and supplemental data: | | | | | | | | | | | | | | | | | | | | |
| Net assets at end of period (000's) | | $ | 17,419 | | | $ | 14,753 | | | $ | 34,742 | | | $ | 72,607 | | | $ | 83,628 | |
| Ratio to average net assets: | | | | | | | | | | | | | | | | | | | | |
| Net expenses | | | 0.99 | % | | | 0.99 | % | | | 0.99 | % | | | 0.99 | % | | | 0.97 | % |
| Gross expenses | | | 1.73 | % | | | 1.60 | % | | | 1.29 | % | | | 1.28 | % | | | 1.29 | % |
| Net investment income | | | 1.86 | % | | | 2.51 | % | | | 2.15 | % | | | 2.29 | % | | | 2.72 | % |
| Portfolio turnover rate | | | 63 | % | | | 23 | % | | | 38 | % | | | 26 | % | | | 31 | % |
| (A) | The net investment income per share was based on average shares outstanding for the period. |
See accompanying Notes to Financial Statements.
Financial Highlights (Continued)
Touchstone Mid Cap Growth Fund—Class A
Selected Data for a Share Outstanding Throughout Each Period
| | | Year Ended March 31, | |
| | | 2018 | | | 2017 | | | 2016 | | | 2015 | | | 2014 | |
| Net asset value at beginning of period | | $ | 25.91 | | | $ | 23.28 | | | $ | 27.06 | | | $ | 26.50 | | | $ | 23.61 | |
| Income (loss) from investment operations: | | | | | | | | | | | | | | | | | | | | |
| Net investment loss | | | (0.08 | )(A) | | | (0.06 | ) | | | (0.10 | ) | | | (0.14 | ) | | | (0.10 | ) |
| Net realized and unrealized gains (losses) on investments | | | 4.95 | | | | 3.31 | | | | (1.62 | ) | | | 4.19 | | | | 5.74 | |
| Total from investment operations | | | 4.87 | | | | 3.25 | | | | (1.72 | ) | | | 4.05 | | | | 5.64 | |
| Distributions from: | | | | | | | | | | | | | | | | | | | | |
| Realized capital gains | | | (2.73 | ) | | | (0.62 | ) | | | (2.06 | ) | | | (3.49 | ) | | | (2.75 | ) |
| Net asset value at end of period | | $ | 28.05 | | | $ | 25.91 | | | $ | 23.28 | | | $ | 27.06 | | | $ | 26.50 | |
| Total return(B) | | | 19.28 | % | | | 14.13 | % | | | (6.34 | %) | | | 16.34 | % | | | 24.82 | % |
| Ratios and supplemental data: | | | | | | | | | | | | | | | | | | | | |
| Net assets at end of period (000's) | | $ | 218,727 | | | $ | 225,381 | | | $ | 226,201 | | | $ | 267,421 | | | $ | 308,316 | |
| Ratio to average net assets: | | | | | | | | | | | | | | | | | | | | |
| Net expenses | | | 1.29 | % | | | 1.30 | % | | | 1.31 | % | | | 1.34 | % | | | 1.38 | % |
| Gross expenses | | | 1.29 | % | | | 1.30 | % | | | 1.31 | % | | | 1.34 | % | | | 1.38 | % |
| Net investment loss | | | (0.29 | %) | | | (0.26 | %) | | | (0.42 | %) | | | (0.55 | %) | | | (0.41 | %) |
| Portfolio turnover rate | | | 76 | % | | | 95 | % | | | 92 | % | | | 73 | % | | | 79 | % |
Touchstone Mid Cap Growth Fund—Class C
Selected Data for a Share Outstanding Throughout Each Period
| | | Year Ended March 31, | |
| | | 2018 | | | 2017 | | | 2016 | | | 2015 | | | 2014 | |
| Net asset value at beginning of period | | $ | 17.84 | | | $ | 16.33 | | | $ | 19.78 | | | $ | 20.39 | | | $ | 18.84 | |
| Income (loss) from investment operations: | | | | | | | | | | | | | | | | | | | | |
| Net investment loss | | | (0.20 | )(A) | | | (0.22 | ) | | | (0.21 | ) | | | (0.24 | ) | | | (0.22 | ) |
| Net realized and unrealized gains (losses) on investments | | | 3.36 | | | | 2.35 | | | | (1.18 | ) | | | 3.12 | | | | 4.52 | |
| Total from investment operations | | | 3.16 | | | | 2.13 | | | | (1.39 | ) | | | 2.88 | | | | 4.30 | |
| Distributions from: | | | | | | | | | | | | | | | | | | | | |
| Realized capital gains | | | (2.73 | ) | | | (0.62 | ) | | | (2.06 | ) | | | (3.49 | ) | | | (2.75 | ) |
| Net asset value at end of period | | $ | 18.27 | | | $ | 17.84 | | | $ | 16.33 | | | $ | 19.78 | | | $ | 20.39 | |
| Total return(B) | | | 18.38 | % | | | 13.28 | % | | | (7.02 | %) | | | 15.51 | % | | | 23.90 | % |
| Ratios and supplemental data: | | | | | | | | | | | | | | | | | | | | |
| Net assets at end of period (000's) | | $ | 90,502 | | | $ | 113,153 | | | $ | 127,852 | | | $ | 157,315 | | | $ | 149,927 | |
| Ratio to average net assets: | | | | | | | | | | | | | | | | | | | | |
| Net expenses | | | 2.04 | % | | | 2.06 | % | | | 2.06 | % | | | 2.07 | % | | | 2.11 | % |
| Gross expenses | | | 2.04 | % | | | 2.06 | % | | | 2.06 | % | | | 2.07 | % | | | 2.11 | % |
| Net investment loss | | | (1.04 | %) | | | (1.02 | %) | | | (1.17 | %) | | | (1.29 | %) | | | (1.14 | %) |
| Portfolio turnover rate | | | 76 | % | | | 95 | % | | | 92 | % | | | 73 | % | | | 79 | % |
| (A) | The net investment loss per share was based on average shares outstanding for the period. |
| (B) | Total returns shown exclude the effect of applicable sales loads. If these charges were included, the returns would be lower. |
See accompanying Notes to Financial Statements.
Financial Highlights (Continued)
Touchstone Mid Cap Growth Fund—Class Y
Selected Data for a Share Outstanding Throughout Each Period
| | | Year Ended March 31, | |
| | | 2018 | | | 2017 | | | 2016 | | | 2015 | | | 2014 | |
| Net asset value at beginning of period | | $ | 26.70 | | | $ | 23.92 | | | $ | 27.71 | | | $ | 27.00 | | | $ | 23.93 | |
| Income (loss) from investment operations: | | | | | | | | | | | | | | | | | | | | |
| Net investment loss | | | (0.01 | )(A) | | | (— | )(B) | | | (0.04 | ) | | | (0.08 | ) | | | (0.05 | ) |
| Net realized and unrealized gains (losses) on investments | | | 5.11 | | | | 3.40 | | | | (1.65 | ) | | | 4.28 | | | | 5.87 | |
| Total from investment operations | | | 5.10 | | | | 3.40 | | | | (1.69 | ) | | | 4.20 | | | | 5.82 | |
| Distributions from: | | | | | | | | | | | | | | | | | | | | |
| Net investment income | | | — | | | | — | | | | (0.04 | ) | | | — | | | | — | |
| Realized capital gains | | | (2.73 | ) | | | (0.62 | ) | | | (2.06 | ) | | | (3.49 | ) | | | (2.75 | ) |
| Total distributions | | | (2.73 | ) | | | (0.62 | ) | | | (2.10 | ) | | | (3.49 | ) | | | (2.75 | ) |
| Net asset value at end of period | | $ | 29.07 | | | $ | 26.70 | | | $ | 23.92 | | | $ | 27.71 | | | $ | 27.00 | |
| Total return | | | 19.62 | % | | | 14.38 | % | | | (6.08 | %) | | | 16.69 | % | | | 25.17 | % |
| Ratios and supplemental data: | | | | | | | | | | | | | | | | | | | | |
| Net assets at end of period (000's) | | $ | 375,617 | | | $ | 311,865 | | | $ | 347,706 | | | $ | 299,247 | | | $ | 263,578 | |
| Ratio to average net assets: | | | | | | | | | | | | | | | | | | | | |
| Net expenses | | | 1.02 | % | | | 1.06 | % | | | 1.05 | % | | | 1.07 | % | | | 1.07 | % |
| Gross expenses | | | 1.02 | % | | | 1.06 | % | | | 1.05 | % | | | 1.07 | % | | | 1.07 | % |
| Net investment loss | | | (0.02 | %) | | | (0.02 | %) | | | (0.16 | %) | | | (0.29 | %) | | | (0.11 | %) |
| Portfolio turnover rate | | | 76 | % | | | 95 | % | | | 92 | % | | | 73 | % | | | 79 | % |
Touchstone Mid Cap Growth Fund—Institutional Class
Selected Data for a Share Outstanding Throughout Each Period
| | | Year Ended March 31, | |
| | | 2018 | | | 2017 | | | 2016 | | | 2015 | | | 2014 | |
| Net asset value at beginning of period | | $ | 26.90 | | | $ | 24.07 | | | $ | 27.85 | | | $ | 27.10 | | | $ | 23.99 | |
| Income (loss) from investment operations: | | | | | | | | | | | | | | | | | | | | |
| Net investment income (loss) | | | — | (A)(B) | | | 0.10 | | | | (0.02 | ) | | | (0.03 | ) | | | 0.03 | |
| Net realized and unrealized gains (losses) on investments | | | 5.15 | | | | 3.35 | | | | (1.65 | ) | | | 4.27 | | | | 5.83 | |
| Total from investment operations | | | 5.15 | | | | 3.45 | | | | (1.67 | ) | | | 4.24 | | | | 5.86 | |
| Distributions from: | | | | | | | | | | | | | | | | | | | | |
| Net investment income | | | — | | | | — | | | | (0.05 | ) | | | — | | | | — | |
| Realized capital gains | | | (2.73 | ) | | | (0.62 | ) | | | (2.06 | ) | | | (3.49 | ) | | | (2.75 | ) |
| Total distributions | | | (2.73 | ) | | | (0.62 | ) | | | (2.11 | ) | | | (3.49 | ) | | | (2.75 | ) |
| Net asset value at end of period | | $ | 29.32 | | | $ | 26.90 | | | $ | 24.07 | | | $ | 27.85 | | | $ | 27.10 | |
| Total return | | | 19.62 | % | | | 14.50 | % | | | (5.97 | %) | | | 16.73 | % | | | 25.32 | % |
| Ratios and supplemental data: | | | | | | | | | | | | | | | | | | | | |
| Net assets at end of period (000's) | | $ | 95,176 | | | $ | 44,236 | | | $ | 84,152 | | | $ | 102,420 | | | $ | 35,097 | |
| Ratio to average net assets: | | | | | | | | | | | | | | | | | | | | |
| Net expenses | | | 0.99 | % | | | 0.99 | % | | | 0.95 | % | | | 0.98 | % | | | 0.97 | % |
| Gross expenses | | | 0.99 | % | | | 1.00 | % | | | 0.95 | % | | | 0.98 | % | | | 0.97 | % |
| Net investment income (loss) | | | 0.01 | % | | | 0.05 | % | | | (0.05 | %) | | | (0.20 | %) | | | 0.00 | %(C) |
| Portfolio turnover rate | | | 76 | % | | | 95 | % | | | 92 | % | | | 73 | % | | | 79 | % |
| (A) | The net investment income (loss) per share was based on average shares outstanding for the period. |
| (B) | Less than $0.005 per share. |
See accompanying Notes to Financial Statements.
Financial Highlights (Continued)
Touchstone Sands Capital Emerging Markets Growth Fund—Class Y
Selected Data for a Share Outstanding Throughout Each Period
| | | | | | | | | Period Ended | |
| | | Year Ended March 31, | | | March 31, | |
| | | | 2018 | | | | 2017 | | | | 2016 | | | | 2015(A) | |
| Net asset value at beginning of period | | $ | 10.70 | | | $ | 9.40 | | | $ | 10.37 | | | $ | 10.00 | |
| Income (loss) from investment operations: | | | | | | | | | | | | | | | | |
| Net investment loss | | | (0.06 | ) | | | (0.03 | ) | | | (0.04 | ) | | | (0.03 | ) |
| Net realized and unrealized gains (losses) on investments | | | 2.92 | | | | 1.33 | | | | (0.93 | ) | | | 0.40 | |
| Total from investment operations | | | 2.86 | | | | 1.30 | | | | (0.97 | ) | | | 0.37 | |
| Net asset value at end of period | | $ | 13.56 | | | $ | 10.70 | | | $ | 9.40 | | | $ | 10.37 | |
| Total return | | | 26.82 | % | | | 13.83 | % | | | (9.35 | %) | | | 3.70 | %(B) |
| Ratios and supplemental data: | | | | | | | | | | | | | | | | |
| Net assets at end of period (000's) | | $ | 207,209 | | | $ | 103,467 | | | $ | 58,106 | | | $ | 39,541 | |
| Ratio to average net assets: | | | | | | | | | | | | | | | | |
| Net expenses | | | 1.47 | % | | | 1.49 | % | | | 1.49 | % | | | 1.49 | %(C) |
| Gross expenses | | | 1.49 | % | | | 1.55 | % | | | 1.59 | % | | | 1.68 | %(C) |
| Net investment loss | | | (0.73 | %) | | | (0.49 | %) | | | (0.52 | %) | | | (0.46 | %)(C) |
| Portfolio turnover rate | | | 27 | % | | | 49 | % | | | 32 | % | | | 90 | %(B) |
Touchstone Sands Capital Emerging Markets Growth Fund—Institutional Class
Selected Data for a Share Outstanding Throughout Each Period
| | | | | | | | | Period Ended | |
| | | Year Ended March 31, | | | March 31, | |
| | | 2018 | | | 2017 | | | 2016 | | | 2015(A) | |
| Net asset value at beginning of period | | $ | 10.73 | | | $ | 9.41 | | | $ | 10.37 | | | $ | 10.00 | |
| Income (loss) from investment operations: | | | | | | | | | | | | | | | | |
| Net investment loss | | | (0.06 | ) | | | (0.03 | ) | | | (0.02 | ) | | | (0.03 | ) |
| Net realized and unrealized gains (losses) on investments | | | 2.94 | | | | 1.35 | | | | (0.94 | ) | | | 0.40 | |
| Total from investment operations | | | 2.88 | | | | 1.32 | | | | (0.96 | ) | | | 0.37 | |
| Net asset value at end of period | | $ | 13.61 | | | $ | 10.73 | | | $ | 9.41 | | | $ | 10.37 | |
| Total return | | | 26.84 | % | | | 14.03 | % | | | (9.26 | %) | | | 3.70 | %(B) |
| Ratios and supplemental data: | | | | | | | | | | | | | | | | |
| Net assets at end of period (000's) | | $ | 374,452 | | | $ | 182,402 | | | $ | 101,401 | | | $ | 32,743 | |
| Ratio to average net assets: | | | | | | | | | | | | | | | | |
| Net expenses | | | 1.37 | % | | | 1.39 | % | | | 1.39 | % | | | 1.39 | %(C) |
| Gross expenses | | | 1.41 | % | | | 1.46 | % | | | 1.51 | % | | | 1.59 | %(C) |
| Net investment loss | | | (0.63 | %) | | | (0.39 | %) | | | (0.42 | %) | | | (0.36 | %)(C) |
| Portfolio turnover rate | | | 27 | % | | | 49 | % | | | 32 | % | | | 90 | %(B) |
| (A) | Represents the period from commencement of operations (May 12, 2014) through March 31, 2015. |
See accompanying Notes to Financial Statements.
Financial Highlights (Continued)
Touchstone Small Cap Growth Fund—Class A
Selected Data for a Share Outstanding Throughout Each Period
| | | Year Ended March 31, | |
| | | 2018 | | | 2017 | | | 2016 | | | 2015 | | | 2014 | |
| Net asset value at beginning of period | | $ | 5.23 | | | $ | 4.98 | | | $ | 5.70 | | | $ | 5.24 | | | $ | 4.84 | |
| Income (loss) from investment operations: | | | | | | | | | | | | | | | | | | | | |
| Net investment loss | | | (0.09 | ) | | | (0.04 | ) | | | (0.04 | ) | | | (0.04 | ) | | | (0.01 | ) |
| Net realized and unrealized gains (losses) on investments | | | 0.72 | | | | 0.32 | | | | (0.62 | ) | | | 0.63 | | | | 1.02 | |
| Total from investment operations | | | 0.63 | | | | 0.28 | | | | (0.66 | ) | | | 0.59 | | | | 1.01 | |
| Distributions from: | | | | | | | | | | | | | | | | | | | | |
| Realized capital gains | | | — | | | | (0.03 | ) | | | (0.06 | ) | | | (0.13 | ) | | | (0.61 | ) |
| Net asset value at end of period | | $ | 5.86 | | | $ | 5.23 | | | $ | 4.98 | | | $ | 5.70 | | | $ | 5.24 | |
| Total return(A) | | | 12.05 | % | | | 5.51 | % | | | (11.68 | %) | | | 11.52 | % | | | 22.63 | % |
| Ratios and supplemental data: | | | | | | | | | | | | | | | | | | | | |
| Net assets at end of period (000's) | | $ | 20,401 | | | $ | 44,278 | | | $ | 48,650 | | | $ | 34,017 | | | $ | 35,303 | |
| Ratio to average net assets: | | | | | | | | | | | | | | | | | | | | |
| Net expenses | | | 1.44 | % | | | 1.44 | % | | | 1.44 | % | | | 1.44 | % | | | 1.45 | % |
| Gross expenses | | | 1.70 | % | | | 1.60 | % | | | 1.66 | % | | | 1.69 | % | | | 1.81 | % |
| Net investment loss | | | (0.81 | %) | | | (0.74 | %) | | | (0.94 | %) | | | (0.71 | %) | | | (0.48 | %) |
| Portfolio turnover rate | | | 68 | % | | | 58 | % | | | 36 | % | | | 46 | % | | | 195 | %(B) |
Touchstone Small Cap Growth Fund—Class C
Selected Data for a Share Outstanding Throughout Each Period
| | | Year Ended March 31, | |
| | | 2018 | | | 2017 | | | 2016 | | | 2015 | | | 2014 | |
| Net asset value at beginning of period | | $ | 4.31 | | | $ | 4.14 | | | $ | 4.78 | | | $ | 4.45 | | | $ | 4.22 | |
| Income (loss) from investment operations: | | | | | | | | | | | | | | | | | | | | |
| Net investment loss | | | (0.18 | ) | | | (0.10 | ) | | | (0.07 | ) | | | (0.05 | ) | | | (0.04 | ) |
| Net realized and unrealized gains (losses) on investments | | | 0.66 | | | | 0.30 | | | | (0.51 | ) | | | 0.51 | | | | 0.88 | |
| Total from investment operations | | | 0.48 | | | | 0.20 | | | | (0.58 | ) | | | 0.46 | | | | 0.84 | |
| Distributions from: | | | | | | | | | | | | | | | | | | | | |
| Realized capital gains | | | — | | | | (0.03 | ) | | | (0.06 | ) | | | (0.13 | ) | | | (0.61 | ) |
| Net asset value at end of period | | $ | 4.79 | | | $ | 4.31 | | | $ | 4.14 | | | $ | 4.78 | | | $ | 4.45 | |
| Total return(A) | | | 11.14 | % | | | 4.70 | % | | | (12.26 | %) | | | 10.64 | % | | | 21.85 | % |
| Ratios and supplemental data: | | | | | | | | | | | | | | | | | | | | |
| Net assets at end of period (000's) | | $ | 7,840 | | | $ | 12,312 | | | $ | 18,237 | | | $ | 12,651 | | | $ | 7,429 | |
| Ratio to average net assets: | | | | | | | | | | | | | | | | | | | | |
| Net expenses | | | 2.19 | % | | | 2.19 | % | | | 2.19 | % | | | 2.19 | % | | | 2.20 | % |
| Gross expenses | | | 2.59 | % | | | 2.51 | % | | | 2.46 | % | | | 2.55 | % | | | 2.65 | % |
| Net investment loss | | | (1.56 | %) | | | (1.49 | %) | | | (1.69 | %) | | | (1.46 | %) | | | (1.23 | %) |
| Portfolio turnover rate | | | 68 | % | | | 58 | % | | | 36 | % | | | 46 | % | | | 195 | %(B) |
| (A) | Total returns shown exclude the effect of applicable sales loads. If these charges were included, the returns would be lower. |
| (B) | Portfolio turnover excludes the purchases and sales of securities of the Touchstone Diversified Small Cap Growth Fund acquired on August 23, 2013. If these transactions were included, portfolio turnover would have been higher. |
See accompanying Notes to Financial Statements.
Financial Highlights (Continued)
Touchstone Small Cap Growth Fund—Class Y
Selected Data for a Share Outstanding Throughout Each Period
| | | Year Ended March 31, | |
| | | 2018 | | | 2017 | | | 2016 | | | 2015 | | | 2014 | |
| Net asset value at beginning of period | | $ | 5.84 | | | $ | 5.55 | | | $ | 6.33 | | | $ | 5.78 | | | $ | 5.27 | |
| Income (loss) from investment operations: | | | | | | | | | | | | | | | | | | | | |
| Net investment loss | | | (0.06 | ) | | | (0.03 | ) | | | (0.03 | ) | | | (0.01 | ) | | | (0.01 | ) |
| Net realized and unrealized gains (losses) on investments | | | 0.78 | | | | 0.35 | | | | (0.69 | ) | | | 0.69 | | | | 1.13 | |
| Total from investment operations | | | 0.72 | | | | 0.32 | | | | (0.72 | ) | | | 0.68 | | | | 1.12 | |
| Distributions from: | | | | | | | | | | | | | | | | | | | | |
| Realized capital gains | | | — | | | | (0.03 | ) | | | (0.06 | ) | | | (0.13 | ) | | | (0.61 | ) |
| Net asset value at end of period | | $ | 6.56 | | | $ | 5.84 | | | $ | 5.55 | | | $ | 6.33 | | | $ | 5.78 | |
| Total return | | | 12.33 | % | | | 5.67 | % | | | (11.46 | %) | | | 12.01 | % | | | 22.88 | % |
| Ratios and supplemental data: | | | | | | | | | | | | | | | | | | | | |
| Net assets at end of period (000's) | | $ | 150,606 | | | $ | 357,216 | | | $ | 508,450 | | | $ | 314,062 | | | $ | 37,030 | |
| Ratio to average net assets: | | | | | | | | | | | | | | | | | | | | |
| Net expenses | | | 1.19 | %(A) | | | 1.19 | % | | | 1.19 | % | | | 1.19 | % | | | 1.20 | % |
| Gross expenses | | | 1.33 | % | | | 1.34 | % | | | 1.31 | % | | | 1.36 | % | | | 1.50 | % |
| Net investment loss | | | (0.56 | %) | | | (0.49 | %) | | | (0.69 | %) | | | (0.46 | %) | | | (0.23 | %) |
| Portfolio turnover rate | | | 68 | % | | | 58 | % | | | 36 | % | | | 46 | % | | | 195 | %(B) |
Touchstone Small Cap Growth Fund—Institutional Class
Selected Data for a Share Outstanding Throughout Each Period
| | | Year Ended March 31, | |
| | | 2018 | | | 2017 | | | 2016 | | | 2015 | | | 2014 | |
| Net asset value at beginning of period | | $ | 5.89 | | | $ | 5.58 | | | $ | 6.35 | | | $ | 5.80 | | | $ | 5.28 | |
| Income (loss) from investment operations: | | | | | | | | | | | | | | | | | | | | |
| Net investment loss | | | (0.02 | ) | | | (0.03 | ) | | | (0.03 | ) | | | (0.02 | ) | | | (— | )(C) |
| Net realized and unrealized gains (losses) on investments | | | 0.75 | | | | 0.37 | | | | (0.68 | ) | | | 0.70 | | | | 1.13 | |
| Total from investment operations | | | 0.73 | | | | 0.34 | | | | (0.71 | ) | | | 0.68 | | | | 1.13 | |
| Distributions from: | | | | | | | | | | | | | | | | | | | | |
| Realized capital gains | | | — | | | | (0.03 | ) | | | (0.06 | ) | | | (0.13 | ) | | | (0.61 | ) |
| Net asset value at end of period | | $ | 6.62 | | | $ | 5.89 | | | $ | 5.58 | | | $ | 6.35 | | | $ | 5.80 | |
| Total return | | | 12.39 | % | | | 6.00 | % | | | (11.27 | %) | | | 11.97 | % | | | 23.04 | % |
| Ratios and supplemental data: | | | | | | | | | | | | | | | | | | | | |
| Net assets at end of period (000's) | | $ | 6,639 | | | $ | 15,558 | | | $ | 22,863 | | | $ | 12,285 | | | $ | 12,372 | |
| Ratio to average net assets: | | | | | | | | | | | | | | | | | | | | |
| Net expenses | | | 1.04 | % | | | 1.04 | % | | | 1.04 | % | | | 1.04 | % | | | 1.04 | % |
| Gross expenses | | | 1.38 | % | | | 1.24 | % | | | 1.23 | % | | | 1.31 | % | | | 1.40 | % |
| Net investment loss | | | (0.41 | %) | | | (0.35 | %) | | | (0.54 | %) | | | (0.32 | %) | | | (0.07 | %) |
| Portfolio turnover rate | | | 68 | % | | | 58 | % | | | 36 | % | | | 46 | % | | | 195 | %(B) |
| (A) | Net expenses include amounts recouped by the Advisor. |
| (B) | Portfolio turnover excludes the purchases and sales of securities of the Touchstone Diversified Small Cap Growth Fund acquired on August 23, 2013. If these transactions were included, portfolio turnover would have been higher. |
| (C) | Less than $0.005 per share. |
See accompanying Notes to Financial Statements.
Financial Highlights (Continued)
Touchstone Sustainability and Impact Equity Fund—Class A
Selected Data for a Share Outstanding Throughout Each Period
| | | Year Ended March 31, | |
| | | 2018 | | | 2017 | | | 2016 | | | 2015 | | | 2014 | |
| Net asset value at beginning of period | | $ | 21.52 | | | $ | 18.98 | | | $ | 30.96 | | | $ | 31.81 | | | $ | 28.74 | |
| Income (loss) from investment operations: | | | | | | | | | | | | | | | | | | | | |
| Net investment income | | | 0.03 | | | | 0.18 | | | | 0.06 | (A) | | | 0.11 | | | | 0.02 | |
| Net realized and unrealized gains (losses) on investments | | | 3.37 | | | | 2.47 | | | | (1.99 | ) | | | 4.87 | | | | 5.96 | |
| Total from investment operations | | | 3.40 | | | | 2.65 | | | | (1.93 | ) | | | 4.98 | | | | 5.98 | |
| Distributions from: | | | | | | | | | | | | | | | | | | | | |
| Net investment income | | | (0.17 | ) | | | (0.11 | ) | | | (0.03 | ) | | | (0.05 | ) | | | (0.05 | ) |
| Realized capital gains | | | (2.74 | ) | | | — | | | | (10.02 | ) | | | (5.78 | ) | | | (2.86 | ) |
| Total distributions | | | (2.91 | ) | | | (0.11 | ) | | | (10.05 | ) | | | (5.83 | ) | | | (2.91 | ) |
| Net asset value at end of period | | $ | 22.01 | | | $ | 21.52 | | | $ | 18.98 | | | $ | 30.96 | | | $ | 31.81 | |
| Total return(B) | | | 15.57 | % | | | 14.01 | % | | | (8.73 | %) | | | 17.17 | % | | | 21.27 | % |
| Ratios and supplemental data: | | | | | | | | | | | | | | | | | | | | |
| Net assets at end of period (000's) | | $ | 485,413 | | | $ | 113,062 | | | $ | 137,306 | | | $ | 257,273 | | | $ | 287,813 | |
| Ratio to average net assets: | | | | | | | | | | | | | | | | | | | | |
| Net expenses | | | 1.19 | % | | | 1.24 | % | | | 1.24 | % | | | 1.25 | % | | | 1.23 | % |
| Gross expenses | | | 1.22 | % | | | 1.36 | % | | | 1.39 | % | | | 1.28 | % | | | 1.29 | % |
| Net investment income | | | 0.58 | % | | | 0.83 | % | | | 0.31 | % | | | 0.35 | % | | | 0.06 | % |
| Portfolio turnover rate | | | 72 | %(C) | | | 53 | % | | | 304 | % | | | 98 | % | | | 92 | % |
Touchstone Sustainability and Impact Equity Fund—Class C
Selected Data for a Share Outstanding Throughout Each Period
| | | Year Ended March 31, | |
| | | 2018 | | | 2017 | | | 2016 | | | 2015 | | | 2014 | |
| Net asset value at beginning of period | | $ | 18.62 | | | $ | 16.47 | | | $ | 28.32 | | | $ | 29.72 | | | $ | 27.17 | |
| Income (loss) from investment operations: | | | | | | | | | | | | | | | | | | | | |
| Net investment income (loss) | | | (0.05 | ) | | | 0.01 | | | | (0.08 | )(A) | | | (0.12 | ) | | | (0.21 | ) |
| Net realized and unrealized gains (losses) on investments | | | 2.85 | | | | 2.15 | | | | (1.75 | ) | | | 4.50 | | | | 5.62 | |
| Total from investment operations | | | 2.80 | | | | 2.16 | | | | (1.83 | ) | | | 4.38 | | | | 5.41 | |
| Distributions from: | | | | | | | | | | | | | | | | | | | | |
| Net Investment Income | | | — | | | | (0.01 | ) | | | (10.02 | ) | | | (5.78 | ) | | | (2.86 | ) |
| Realized capital gains | | | (2.74 | ) | | | — | | | | — | | | | — | | | | — | |
| Total distributions | | | (2.74 | ) | | | (0.01 | ) | | | (10.02 | ) | | | (5.78 | ) | | | (2.86 | ) |
| Net asset value at end of period | | $ | 18.68 | | | $ | 18.62 | | | $ | 16.47 | | | $ | 28.32 | | | $ | 29.72 | |
| Total return(B) | | | 14.75 | % | | | 13.12 | % | | | (9.41 | %) | | | 16.30 | % | | | 20.35 | % |
| Ratios and supplemental data: | | | | | | | | | | | | | | | | | | | | |
| Net assets at end of period (000's) | | $ | 37,513 | | | $ | 48,055 | | | $ | 56,435 | | | $ | 103,861 | | | $ | 111,631 | |
| Ratio to average net assets: | | | | | | | | | | | | | | | | | | | | |
| Net expenses | | | 1.99 | % | | | 1.99 | % | | | 1.99 | % | | | 2.00 | % | | | 1.98 | % |
| Gross expenses | | | 2.05 | % | | | 2.12 | % | | | 2.15 | % | | | 2.03 | % | | | 2.04 | % |
| Net investment income (loss) | | | (0.23 | %) | | | 0.08 | % | | | (0.44 | %) | | | (0.40 | %) | | | (0.69 | %) |
| Portfolio turnover rate | | | 72 | %(C) | | | 53 | % | | | 304 | % | | | 98 | % | | | 92 | % |
| (A) | The net investment income (loss) per share was based on average shares outstanding for the period. |
| (B) | Total returns shown exclude the effect of applicable sales loads. If these charges were included, the returns would be lower. |
| (C) | Portfolio turnover excludes the purchases and sales of securities of the Sentinel Sustainable Core Opportunities Fund acquired on October 27, 2017 (See Note 9 in the Notes to Financial Statements). If these transactions were included, portfolio turnover would have been higher. |
See accompanying Notes to Financial Statements.
Financial Highlights (Continued)
Touchstone Sustainability and Impact Equity Fund—Class Y
Selected Data for a Share Outstanding Throughout Each Period
| | | Year Ended March 31, | |
| | | 2018 | | | 2017 | | | 2016 | | | 2015 | | | 2014 | |
| Net asset value at beginning of period | | $ | 22.11 | | | $ | 19.49 | | | $ | 31.49 | | | $ | 32.23 | | | $ | 29.07 | |
| Income (loss) from investment operations: | | | | | | | | | | | | | | | | | | | | |
| Net investment income | | | 0.16 | | | | 0.20 | | | | 0.13 | (A) | | | 0.22 | | | | 0.09 | |
| Net realized and unrealized gains (losses) on investments | | | 3.41 | | | | 2.58 | | | | (2.06 | ) | | | 4.92 | | | | 6.06 | |
| Total from investment operations | | | 3.57 | | | | 2.78 | | | | (1.93 | ) | | | 5.14 | | | | 6.15 | |
| Distributions from: | | | | | | | | | | | | | | | | | | | | |
| Net investment income | | | (0.19 | ) | | | (0.16 | ) | | | (0.05 | ) | | | (0.10 | ) | | | (0.13 | ) |
| Realized capital gains | | | (2.74 | ) | | | �� | | | | (10.02 | ) | | | (5.78 | ) | | | (2.86 | ) |
| Total distributions | | | (2.93 | ) | | | (0.16 | ) | | | (10.07 | ) | | | (5.88 | ) | | | (2.99 | ) |
| Net asset value at end of period | | $ | 22.75 | | | $ | 22.11 | | | $ | 19.49 | | | $ | 31.49 | | | $ | 32.23 | |
| Total return | | | 15.90 | % | | | 14.30 | % | | | (8.54 | %) | | | 17.48 | % | | | 21.62 | % |
| Ratios and supplemental data: | | | | | | | | | | | | | | | | | | | | |
| Net assets at end of period (000's) | | $ | 189,837 | | | $ | 112,790 | | | $ | 67,638 | | | $ | 416,741 | | | $ | 577,708 | |
| Ratio to average net assets: | | | | | | | | | | | | | | | | | | | | |
| Net expenses | | | 0.94 | % | | | 0.99 | % | | | 0.99 | % | | | 0.99 | % | | | 0.97 | % |
| Gross expenses | | | 0.99 | % | | | 1.09 | % | | | 1.14 | % | | | 1.00 | % | | | 1.05 | % |
| Net investment income | | | 0.82 | % | | | 1.08 | % | | | 0.56 | % | | | 0.61 | % | | | 0.32 | % |
| Portfolio turnover rate | | | 72 | %(B) | | | 53 | % | | | 304 | % | | | 98 | % | | | 92 | % |
Touchstone Sustainability and Impact Equity Fund—Institutional Class
Selected Data for a Share Outstanding Throughout Each Period
| | | | | | Period Ended | |
| | | Year Ended March 31, | | | March 31, | |
| | | 2018 | | | 2017 | | | 2016(C) | |
| Net asset value at beginning of period | | $ | 22.13 | | | $ | 19.50 | | | $ | 31.44 | |
| Income (loss) from investment operations: | | | | | | | | | | | | |
| Net Investment income | | | 0.20 | | | | 0.19 | | | | 0.11 | (A) |
| Net realized and unrealized gains (losses) on investments | | | 3.38 | | | | 2.61 | | | | (1.98 | ) |
| Total from investment operations | | | 3.58 | | | | 2.80 | | | | (1.87 | ) |
| Distributions from: | | | | | | | | | | | | |
| Net investment income | | | (0.20 | ) | | | (0.17 | ) | | | (0.05 | ) |
| Realized capital gains | | | (2.74 | ) | | | — | | | | (10.02 | ) |
| Total distributions | | | (2.94 | ) | | | (0.17 | ) | | | (10.07 | ) |
| Net asset value at end of period | | $ | 22.77 | | | $ | 22.13 | | | $ | 19.50 | |
| Total return | | | 15.95 | % | | | 14.41 | % | | | (8.49 | %)(D) |
| Ratios and supplemental data: | | | | | | | | | | | | |
| Net assets at end of period (000's) | | $ | 42,196 | | | $ | 29,679 | | | $ | 6,843 | |
| Ratio to average net assets: | | | | | | | | | | | | |
| Net expenses | | | 0.89 | % | | | 0.89 | % | | | 0.89 | %(E) |
| Gross expenses | | | 1.01 | % | | | 1.11 | % | | | 1.48 | %(E) |
| Net investment income | | | 0.87 | % | | | 1.18 | % | | | 0.66 | %(E) |
| Portfolio turnover rate | | | 72 | %(B) | | | 53 | % | | | 304 | % |
| (A) | The net investment income per share was based on average shares outstanding for the period. |
| (B) | Portfolio turnover excludes the purchases and sales of securities of the Sentinel Sustainable Core Opportunities Fund acquired on October 27, 2017 (See Note 9 in the Notes to Financial Statements). If these transactions were included, portfolio turnover would have been higher. |
| (C) | Represents the period from commencement of operations (May 4, 2015) through March 31, 2016. |
See accompanying Notes to Financial Statements.
Notes to Financial Statements
March 31, 2018
1. Organization
The Touchstone Strategic Trust (the “Trust”) is registered under the Investment Company Act of 1940, as amended (the “1940 Act”), as an open-end management investment company. The Trust was established as a Massachusetts business trust pursuant to an Agreement and Declaration of Trust dated November 18, 1982. TheTrust consists of twenty-five funds, including the following nine funds (individually, a “Fund”, and collectively, the “Funds”):
Touchstone Flexible Income Fund (“Flexible Income Fund”)
Touchstone Focused Fund (“Focused Fund”)
Touchstone Growth Opportunities Fund (“Growth Opportunities Fund”)
Touchstone International Growth Fund (“International Growth Fund”)
Touchstone International Value Fund (“International Value Fund”)
Touchstone Mid Cap Growth Fund (“Mid Cap Growth Fund”)
Touchstone Sands Capital Emerging Markets Growth Fund (“Sands Capital Emerging Markets Growth Fund”)
Touchstone Small Cap Growth Fund (“Small Cap Growth Fund”)
Touchstone Sustainability and Impact Equity Fund (“Sustainability and Impact Equity Fund”)
Each Fund is diversified, with the exception of the Focused Fund, the Growth Opportunities Fund and the Sands Capital Emerging Markets Growth Fund, which are non-diversified.
The Agreement and Declaration of Trust permits the Trust to issue an unlimited number of shares of beneficial interest of each Fund. The table below indicates the classes of shares that each Fund is registered to offer:
| | Class A | Class C | Class Y | Institutional Class |
| Flexible Income Fund | X | X | X | X |
| Focused Fund | X | X | X | X |
| Growth Opportunities Fund | X | X | X | X |
| International Growth Fund | X | X | X | X |
| International Value Fund | X | X | X | X |
| Mid Cap Growth Fund | X | X | X | X |
| Sands Capital Emerging Markets Growth Fund | — | — | X | X |
| Small Cap Growth Fund | X | X | X | X |
| Sustainability and Impact Equity Fund | X | X | X | X |
The assets of each Fund are segregated, and a shareholder’s interest is limited to the Fund in which shares are held. The Funds’ prospectus provides a description of each Fund’s investment goal, policies, and strategies along with information on the classes of shares currently being offered.
2. Significant Accounting Policies
The following is a summary of the Funds’ significant accounting policies:
Each Fund is an investment company that follows the accounting and reporting guidance of Accounting Standards Codification Topic 946 applicable to investment companies.
Security valuation and fair value measurements — U.S. generally accepted accounting principles (“U.S. GAAP”) define fair value as the price the Funds would receive to sell an asset or pay to transfer a liability in an orderly transaction between market participants at the measurement date. All investments in securities are recorded at their fair value. The Funds define the term “market value”, as used throughout this report, as the estimated fair value. The Funds use various methods to measure fair value of their portfolio securities on a recurring basis. U.S. GAAP fair value measurement standards require disclosure of a hierarchy that prioritizes inputs to valuation methods.
Notes to Financial Statements (Continued)
These inputs are summarized in the three broad levels listed below:
| • | Level 1 | – | quoted prices in active markets for identical securities |
| | | | |
| • | Level 2 | – | other significant observable inputs (including quoted prices for similar securities, interest rates, prepayment speeds, credit risk, etc.) |
| | | | |
| • | Level 3 | – | significant unobservable inputs (including a Fund’s own assumptions in determining the fair value of investments) |
The inputs or methodology used for valuing securities are not necessarily an indication of the risk associated with investing in those securities.
The aggregate value by input level, as of March 31, 2018, for each Fund’s investments, as well as a reconciliation of assets for which significant unobservable inputs (Level 3) were used in determining value, if applicable, is included in each Fund’s Portfolio of Investments, which also includes a breakdown of the Fund’s investments by geographic, portfolio or sector allocation. The Funds did not hold any Level 3 categorized securities during the year ended March 31, 2018.
Changes in valuation techniques may result in transfers into or out of an investment’s assigned level within the hierarchy. All transfers in and out of the levels are recognized at the value at the end of the period. At March 31, 2018, there were no transfers between Levels 1, 2 and 3 for all Funds, except as discussed in the Portfolio of Investments for the International Value Fund, Sands Capital Emerging Markets Growth Fund and Sustainability and Impact Equity Fund.
During the year ended March 31, 2018, there were no material changes to the valuation policies and techniques.
The Funds’ portfolio securities are valued as of the close of the regular session of trading on the New York Stock Exchange (“NYSE”) (currently 4:00 p.m., Eastern Time or at the time as of which the NYSE establishes official closing prices). Portfolio securities traded on stock exchanges are valued at the last reported sale price, official close price, or last bid price if no sales are reported. Portfolio securities quoted by NASDAQ are valued at the NASDAQ Official Closing Price (“NOCP”) or from the primary exchange on which the security trades. To the extent these securities are actively traded, they are categorized in Level 1 of the fair value hierarchy. Options and futures are valued at the last quoted sales price. If there is no such reported sale on the valuation date, long option positions are valued at the most recent bid price, and short option positions are valued at the most recent ask price on the valuation date and are categorized in Level 1. Shares of mutual funds in which the Funds invest are valued at their respective net asset values (“NAV”) as reported by the underlying funds (the “Underlying Funds”) and are categorized in Level 1.
Debt securities held by the Funds are valued at their evaluated bid by an independent pricing service or at their last broker-quoted bid prices as obtained from one or more of the major market makers for such securities. Independent pricing services use information provided by market makers or estimates of market values through accepted market modeling conventions. Observable inputs to the models may include prepayment speeds, pricing spread, yield, trade information, dealer quotes, market color, cash flow models, the securities’ terms and conditions, among others, and are generally categorized in Level 2. Debt securities with remaining maturities of 60 days or less may be valued at amortized cost, provided such amount approximates market value and are categorized in Level 2. While this method provides consistency in valuation (and may only be used if it approximates market value), it may result in periods during which fair value, as determined by amortized cost, is higher or lower than the price that would be received if the Fund sold the investment.
Notes to Financial Statements (Continued)
Foreign currency exchange contracts are valued at the mean between the bid and ask prices and are determined as of the close of regular trading on the NYSE. Interpolated values are derived when the settlement date of the contract is an interim date for which quotations are not available and categorized in Level 2.
Securities mainly traded on a non-U.S. exchange or denominated in foreign currencies are generally valued according to the preceding closing values on that exchange, translated to U.S. dollars using currency exchange rates as of the close of regular trading on the NYSE, and are generally categorized in Level 1. However, if an event that may change the value of a security occurs after the time that the closing value on the non-U.S. exchange was determined, but before the close of regular trading on the NYSE, the security may be priced based on fair value and generally categorized in Level 2. This may cause the value of the security, if held on the books of a Fund to be different from the closing value on the non-U.S. exchange and may affect the calculation of that Fund’s NAV.
The Funds may use fair value pricing under the following circumstances, among others:
| • | If the value of a security has been materially affected by events occurring before the Funds’ pricing time but after the close of the primary markets on which the security is traded. |
| • | If the exchange on which a portfolio security is principally traded closes early or if trading in a particular portfolio security was halted during the day and did not resume prior to the Funds’ NAV calculation. |
| • | If a security is so thinly traded that reliable market quotations are unavailable due to infrequent trading. |
| • | If the validity of market quotations is not reliable. |
Securities held by the Funds that do not have readily available market quotations, significant observable inputs, or securities for which the available market quotations are not reliable, are priced at their estimated fair value using procedures approved by the Funds’ Board of Trustees (the “Board”) and are generally categorized in Level 3.
Bank Loans — The Flexible Income Fund had investments in bank loans, which usually take the form of loan participations and assignments. Loan participations and assignments are agreements to make money available to U.S. or foreign corporations, partnerships or other business entities (the “Borrower”) in a specified amount, at a specified rate and within a specified time. A loan is typically originated, negotiated and structured by a U.S. or foreign bank, insurance company or other financial institution (the “Agent”) for a group of loan investors (“Loan Investors”). The Agent typically administers and enforces the loan on behalf of the other Loan Investors in the syndicate and may hold any collateral on behalf of the Loan Investors. Such loan participations and assignments are typically senior, secured and collateralized in nature. The Fund records an investment when the Borrower withdraws money and records interest as earned. These loans pay interest at rates which are periodically reset by reference to a base lending rate plus a spread. These base lending rates are generally the prime rate offered by a designated U.S. bank or London InterBank Offered Rate (“LIBOR”).
The loans in which the Fund invests may be subject to some restrictions on resale. For example, the Fund may be contractually obligated to receive approval from the Agent and/or Borrower prior to the sale of these investments. The Fund generally has no right to enforce compliance with the terms of the loan agreement with the Borrower. As a result, the Fund assumes the credit risk of the Borrower, the selling participant and any other persons interpositioned between the Fund and the Borrower (“Intermediate Participants”). In the event that the Borrower, selling participant or Intermediate Participants become insolvent or enter into bankruptcy, the Fund may incur certain costs and delays in realizing payment or may suffer a loss of principal and/or interest.
Unfunded commitments represent the remaining obligation of the Fund to the Borrower. At any point in time, up to the maturity date of the issue, the Borrower may demand the unfunded portion. Until demanded by the Borrower, unfunded commitments are not recognized as an asset on the Statement of Assets and Liabilities.
Notes to Financial Statements (Continued)
Unrealized appreciation/depreciation on unfunded commitments presented on the Statement of Assets and Liabilities represents fair value of the unfunded portion of the Fund’s bank loans.
As of March 31, 2018, the Fund did not hold any bank loans or unfunded loan commitments.
Investment companies — The Funds may invest in securities of other investment companies, including exchange-traded funds (“ETFs”), open-end funds, and closed-end funds. Open-end funds are investment companies that issue new shares continuously and redeem shares daily. Closed-end funds are investment companies that typically issue a fixed number of shares that trade on a securities exchange or over-the-counter (“OTC”). An ETF is an investment company that typically seeks to track the performance of an index by holding in its portfolio shares of all the companies, or a representative sample of the companies, that are components of a particular index. ETF shares are traded on a securities exchange based on their market value. The risks of investment in other investment companies typically reflect the risks of the types of securities in which the other investment companies invest. Investments in ETFs and closed-end funds are subject to the additional risk that their shares may trade at a premium or discount to their NAV. When a Fund invests in another investment company, shareholders of the Fund indirectly bear their proportionate share of the other investment company’s fees and expenses, including operating, registration, trustee, licensing, and marketing, as well as their share of the Fund’s fees and expenses.
Securities sold short — The Flexible Income Fund may engage in selling securities short, which obligates the Fund to replace a security borrowed by purchasing the same security at the current market value. The Fund would incur a loss if the price of the security increases between the date of the short sale and the date on which the Fund replaces the borrowed security. The Fund would realize a gain if the price of the security declines between those dates.
As of March 31, 2018, the Flexible Income Fund did not hold any securities sold short.
Options — The Flexible Income Fund may write or purchase financial option contracts primarily to hedge against changes in the value of equity securities (or securities that the Fund intends to purchase), against fluctuations in fair value caused by changes in prevailing market interest rates or foreign currency exchange rates and against changes in overall equity market volatility. In addition, the Fund may utilize options in an attempt to generate gains from option premiums or to reduce overall portfolio risk. The Fund’s option strategy primarily focuses on the use of writing and/or purchasing call or put options on equity indexes. When the Fund writes or purchases an option, an amount equal to the premium received or paid by the Fund is recorded as a liability or an asset and is subsequently adjusted to the current market value of the option written or purchased. Premiums received or paid from writing or purchasing options which expire unexercised are treated by the Fund on the expiration date as realized gains or losses. The difference between the premium and the amount paid or received on effecting a closing purchase or sale transaction, including brokerage commissions, is also treated as a realized gain or loss. If an option is exercised, the premium paid or received is added to the cost of the purchase or proceeds from the sale in determining whether the Fund has realized a gain or loss on investment transactions. The Fund, as writer of an option, may have no control over whether the underlying securities may be sold (call) or purchased (put) and as a result bears the market risk of an unfavorable change in the price of the security underlying the written option. The Fund, as purchaser of an option, bears the risk that the counterparties to the option may not have the ability to meet the terms of the option contracts. There is minimal counterparty credit risk involved in entering into option contracts since they are exchange-traded instruments and the exchange’s clearinghouse, as counterparty to all exchange-traded options, guarantees the options against default.
As of March 31, 2018, the Flexible Income Fund did not hold any options.
Futures Contracts — The Flexible Income Fund may buy and sell futures contracts and related options to manage its exposure to changing interest rates and securities prices. Some strategies reduce the Fund’s exposure
Notes to Financial Statements (Continued)
to price fluctuations, while others tend to increase its market exposure. Futures and options on futures can be volatile instruments and involve certain risks that could negatively impact the Fund’s return. In order to avoid leveraging and related risks, when the Fund purchases futures contracts, it will collateralize its position by depositing an amount of cash or liquid securities, equal to the market value of the futures positions held, less margin deposits, in a segregated account with its custodian or otherwise “cover” its position in a manner consistent with the 1940 Act or the rules of the Securities and Exchange Commission (the “SEC”) or interpretations thereunder. Collateral equal to the current fair value of the futures position will be determined on a daily basis.
When the contract is closed, the Fund records a realized gain or loss equal to the difference between the proceeds from (or cost of) the closing transactions and the Fund’s basis in the contract. Risks of entering into futures contracts include the possibility that a change in the value of the contract may not correlate with the changes in the value of the underlying instruments. Second, it is possible that a lack of liquidity for futures contracts could exist in the secondary market resulting in an inability to close a futures position prior to its maturity date. Third, the purchase of a futures contract involves the risk that the Fund could lose more than the original margin deposit required to initiate the futures transaction. Finally, the risk exists that losses could exceed amounts disclosed on the Statements of Assets and Liabilities. There is minimal counterparty credit risk involved in entering into futures contracts since they are exchange-traded instruments and the exchange’s clearinghouse, as counterparty to all exchange-traded futures, guarantees the futures against default.
As of March 31, 2018, the Flexible Income Fund held futures contracts as shown in the Portfolio of Investments and had cash in the amount of $6,012,362 held as collateral for futures contracts.
Swap Contracts — The Flexible Income Fund may enter into swap transactions to help enhance the value of its portfolio or manage its exposure to different types of investments. Swaps are financial instruments that typically involve the exchange of cash flows between two parties on specified dates (settlement dates), where the cash flows are based on agreed-upon prices, rates, indexes, etc. The nominal amount on which the cash flows are calculated is called the notional amount. Swaps are individually negotiated and structured to include exposure to a variety of different types of investments or market factors, such as interest rates, foreign currency rates, mortgage securities, corporate borrowing rates, security prices, indexes or inflation rates.
Swap agreements may increase or decrease the overall volatility of the investments of the Fund and its share price. The performance of swap agreements may be affected by a change in the specific interest rate, currency, or other factors that determine the amounts of payments due to and from the Fund. If a swap agreement calls for payments by the Fund, the Fund must be prepared to make such payments when due. In addition, if the counterparty’s creditworthiness declines, the value of a swap agreement would be likely to decline, potentially resulting in losses.
Generally, bilateral swap agreements, OTC swaps, have a fixed maturity date that will be agreed upon by the parties. The agreement can be terminated before the maturity date only under limited circumstances, such as default by one of the parties or insolvency, among others, and can be transferred by a party only with the prior written consent of the other party. The Fund may be able to eliminate its exposure under a swap agreement either by assignment or by other disposition, or by entering into an offsetting swap agreement with the same party or a similarly creditworthy party. If the counterparty is unable to meet its obligations under the contract, declares bankruptcy, defaults or becomes insolvent, the Fund may not be able to recover the money it expected to receive under the contract.
Cleared swaps are transacted through futures commission merchants that are members of central clearinghouses with the clearinghouses serving as a central counterparty. Pursuant to rules promulgated under the Dodd-Frank Act, central clearing of swap agreements is currently required for certain market participants trading certain instruments, and central clearing for additional instruments is expected to be implemented by regulators until the majority of the swaps market is ultimately subject to central clearing.
Notes to Financial Statements (Continued)
Swaps are marked-to-market daily based upon values received from third party vendors or quotations from market makers. For OTC swaps, any upfront premiums paid or received are recorded as assets or liabilities, respectively, and are shown as premium paid on swap agreements or premium received on swap agreements in the Statements of Assets and Liabilities. For swaps that are centrally cleared, initial margins, determined by each relevant clearing agency, are posted and segregated at a broker account registered with the Commodity Futures Trading Commission, or the applicable regulator. The change in value of swaps, including accruals of periodic amounts of interest to be paid or received on swaps, is recorded as unrealized appreciation or depreciation. Daily changes in the value of centrally cleared swaps are recorded on the Statements of Assets and Liabilities as receivable or payable for variation margin on swap agreements and settled daily. Upfront premiums and liquidation payments received or paid are recorded as realized gains or losses at the termination or maturity of the swap. Net periodic payments received or paid by the Fund are recorded as realized gain or loss.
A swap agreement can be a form of leverage, which can magnify the Fund’s gains or losses. In order to reduce the risk associated with leveraging, the Fund may cover its current obligations under swap agreements according to guidelines established by the SEC. If the Fund enters into a swap agreement on a net basis, it will segregate assets with a daily value at least equal to the excess, if any, of the Fund’s accrued obligations under the swap agreement over the accrued amount the Fund is entitled to receive under the agreement. If the Fund enters into a swap agreement on other than a net basis, it will segregate assets with a value equal to the full amount of the Fund’s accrued obligations under the agreement.
As of March 31, 2018, the Flexible Income Fund did not hold any swap contracts.
Foreign currency translation — The books and records of the Funds are maintained in U.S. dollars and translated into U.S. dollars on the following basis:
| (1) | market value of investment securities, assets and liabilities at the current rate of exchange on the valuation date; and |
| (2) | purchases and sales of investment securities, income, and expenses at the relevant rates of exchange prevailing on the respective dates of such transactions. |
The Funds do not isolate that portion of gains and losses on investments in equity securities that is due to changes in the foreign exchange rates from that which is due to changes in market prices of equity securities.
Forward foreign currency contracts — A forward foreign currency contract is an agreement between two parties to buy and sell a specific currency at a price that is set on the date of the contract. The forward contract calls for delivery of the currency on a future date that is specified in the contract. Risks related to the use of forwards include the possible failure of counterparties to meet the terms of the forward agreement, the failure of the counterparties to timely post collateral, the risk that currency movements will not occur thereby reducing a Fund’s total return, and the potential for losses in excess of a Fund’s initial investment.
The market value of a forward foreign currency contract fluctuates with changes in foreign currency exchange rates. Forward foreign currency contracts are marked to market daily and the change in value is recorded by a Fund as an unrealized gain or loss. Realized gains or losses, equal to the difference between the value of the contract at the time it was opened and the value at the time it was closed, are recorded upon delivery or receipt of the currency.
During the year ended March 31, 2018, the Flexible Income Fund used forward foreign currency contracts to enhance potential gains, hedge against anticipated currency exchange rates, maintain diversity and liquidity of the portfolio and/or adjust exposure to foreign currencies.
Real Estate Investment Trusts — The Funds may invest in real estate investment trusts (“REITs”) that involve risks not associated with investing in stocks. Risks include declines in the value of real estate, general and economic
Notes to Financial Statements (Continued)
conditions, changes in the value of the underlying property and defaults by borrowers. The value of assets in the real estate industry may go through cycles of relative underperformance and outperformance in comparison to equity securities markets in general. Dividend income is recorded using management’s estimate of the income included in distributions received from REIT investments. The actual amounts of income, return of capital and capital gains are only determined by each REIT after its fiscal year-end and may differ from the estimated amount. Estimates of income are adjusted in the Funds to the actual amounts when the amounts are determined.
Derivative instruments and hedging activities — The Flexible Income Fund may enter into an International Swaps and Derivatives Association, Inc. Master Agreement (“ISDA Master Agreement” or “MNA”) or similar agreement with certain counterparties. An ISDA Master Agreement is a bilateral agreement between the Fund and a counterparty that governs OTC derivatives and foreign exchange contracts, and typically contains, among other things, collateral posting terms and master netting provisions in the event of a default or termination. Under an ISDA Master Agreement, a party may, under certain circumstances, offset with the counterparty certain derivative financial instrument’s payables or receivables with collateral held or posted and create one single net payment. The provisions of the ISDA Master Agreement typically permit a single net payment in the event of default (close-out netting). These default events include bankruptcy or insolvency of the counterparty. Note, however, that bankruptcy or insolvency laws of a particular jurisdiction may impose restrictions on or prohibitions against the right of offset.
When entering into a derivative transaction, the Fund may be required to post and maintain collateral or margin (including both initial and maintenance margin). Collateral and margin requirements differ by type of derivative. Margin requirements are established by the broker or clearing house for exchange-traded and centrally cleared derivatives (financial futures contracts, options, and centrally cleared swaps). Brokers can ask for margining in excess of the clearing house’s minimum in certain circumstances. Collateral terms are contract specific for OTC derivatives (forward foreign currency contracts, options, and swaps). For derivatives traded under an ISDA Master Agreement, the collateral requirements are typically calculated by netting the marked-to-market amount for each transaction under such agreement and comparing that amount to the value of any collateral currently pledged by the Fund and the counterparty. For financial reporting purposes, cash collateral that has been pledged to cover obligations of the Fund and cash collateral received from the counterparty, if any, are reported separately on the Statement of Assets and Liabilities as cash deposits held at prime broker and due to prime broker, respectively. Non-cash collateral pledged by the Fund, if any, is noted in the Portfolio of Investments. To the extent amounts due to the Fund from its counterparties are not fully collateralized, contractually or otherwise, the Fund bears the risk of loss from counterparty non-performance.
Certain ISDA Master Agreements allow counterparties to OTC derivatives transactions to terminate derivative contracts prior to maturity in the event the Fund’s net assets decline by a stated percentage or the Fund fails to meet the terms of its ISDA Master Agreement, which would cause the Fund (counterparty) to accelerate payment of any net liability owed to the counterparty (Fund).
For financial reporting purposes, the Flexible Income Fund does not offset derivative assets and derivative liabilities that are subject to netting arrangements in the Statement of Assets and Liabilities.
Notes to Financial Statements (Continued)
As of March 31, 2018, the Flexible Income Fund’s assets and liabilities that were subject to a MNA on a gross basis were as follows:
| | | Assets | | | Liabilities | |
| Flexible Income Fund | | | | | | | | |
| Futures Contracts | | $ | 347,910 | | | $ | (343,810 | ) |
| Forward Foreign Currency Contracts | | | 571,421 | | | | (37,213 | ) |
| Total gross amount of assets and liabilities subject to MNA | | $ | 919,331 | | | $ | (381,023 | ) |
The following table presents the Flexible Income Fund’s assets net of amounts available for offset under a MNA and net of the related collateral pledged to the Fund as of March 31, 2018:
| | | | | Gross | | | | | | | | | | | | | |
| | | | | Amount | | | Gross Amount Available | | | | | | | | | | |
| | | | | of | | | for Offset in Statement of | | | Non-Cash | | | Cash | | | | |
| | | Derivative | | Recognized | | | Assets | | | Collateral | | | Collateral | | | Net | |
| Counterparty | | Type | | Assets | | | and Liabilities | | | Received | | | Received | | | Amount(A) | |
| Wells Fargo | | Futures Contracts | | $ | 347,910 | | | $ | (343,810 | ) | | $ | — | | | $ | — | | | $ | 4,100 | |
| Morgan Stanley | | Forward Foreign Currency Contracts | | | 571,421 | | | | (37,213 | ) | | | — | | | | — | | | | 534,208 | |
(A) Net amount represents the net amount receivable from the counterparty in the event of default.
The following table presents the Flexible Income Fund’s liabilities net of amounts available for offset under a MNA and net of the related collateral pledged by the Fund as of March 31, 2018:
| | | | | Gross | | | | | | | | | | | | | |
| | | | | Amount | | | | | | | | | | | | | |
| | | | | of | | | Gross Amount Available | | | Non-Cash | | | Cash | | | | |
| | | Derivative | | Recognized | | | for Offset in Statement of | | | Collateral | | | Collateral | | | Net | |
| Counterparty | | Type | | Liabilities | | | Assets and Liabilities | | | Pledged | | | Pledged | | | Amount(A) | |
| Wells Fargo | | Futures Contracts | | $ | 343,810 | | | $ | (343,810 | ) | | $ | — | | | $ | — | | | $ | — | |
| Morgan Stanley | | Forward Foreign Currency Contracts | | | 37,213 | | | | (37,213 | ) | | | — | | | | — | | | | — | |
(A) Net amount represents the net amount payable due to the counterparty in the event of default.
The following table sets forth the fair value of the Flexible Income Fund’s derivative financial instruments by primary risk exposure as of March 31, 2018:
Fair Value of Derivative Investments
As of March 31, 2018
| | | Derivatives not accounted for as hedging | | Asset | | | Liability | |
| Fund | | instruments under ASC 815 | | Derivatives | | | Derivatives | |
| Flexible Income Fund | | Futures - Interest Rate Contracts* | | $ | — | | | $ | (343,810 | ) |
| | | Futures - Equity Contracts* | | | 347,910 | | | | — | |
| | | Forward Foreign Currency Contracts** | | | 571,421 | | | | (37,213 | ) |
| * | Statements of Assets and Liabilities Location: Unrealized appreciation on futures contracts and unrealized depreciation on futures contracts, respectively. |
| ** | Statements of Assets and Liabilities Location: Unrealized appreciation on forward foreign currency contracts and unrealized depreciation on forward foreign currency contracts, respectively. |
Notes to Financial Statements (Continued)
The following table sets forth the effect of the Flexible Income Fund’s derivative financial instruments by primary risk exposure on the Statements of Operations for the year ended March 31, 2018:
The Effect of Derivative Investments on the Statement of Operations
for the Year Ended March 31, 2018
| | | | | | | | Change in | |
| | | | | | | | Unrealized | |
| | | | | Realized Gain | | | Appreciation | |
| | | Derivatives not accounted for as hedging | | (Loss) | | | (Depreciation) | |
| Fund | | instruments under ASC 815 | | on Derivatives | | | on Derivatives | |
| Flexible Income Fund | | Purchased Options - Equity Contracts* | | $ | (276,256 | ) | | $ | 99,125 | |
| | | Futures - Equity Contracts** | | | 1,034,201 | | | | 322,206 | |
| | | Futures - Interest Rate Contracts** | | | 162,501 | | | | (422,092 | ) |
| | | Written Options - Equity Contracts*** | | | 194,741 | | | | (44,872 | ) |
| | | Written Options - Foreign Currency Contracts*** | | | 140,755 | | | | (54,435 | ) |
| | | Swap Agreements - Credit Contracts**** | | | (135,475 | ) | | | — | |
| | | Forward - Foreign Currency Contracts***** | | | (650,144 | ) | | | 627,634 | |
| * | Statements of Operations Location: Net realized gains on investments and net change in unrealized appreciation (depreciation) on investments, respectively. |
| ** | Statements of Operations Location: Net realized gains on futures contracts and net change in unrealized appreciation (depreciation) on futures contracts, respectively. |
| *** | Statements of Operations Location: Net realized gains on written options and net change in unrealized appreciation (depreciation) on written options, respectively. |
| **** | Statements of Operations Location: Net realized losses on swap agreements. |
| ***** | Statements of Operations Location: Net realized losses on forward foreign currency contracts and net change in unrealized appreciation (depreciation) on forward foreign currency contracts, respectively. |
For the year ended March 31, 2018, the average quarterly balance of outstanding derivative financial instruments for the Flexible Income Fund was as follows:
| | | Flexible | |
| | | Income | |
| | | Fund | |
| Equity contracts: | | | | |
| Purchased Options - Cost | | $ | 62,425 | |
| Written Options - Premiums received | | $ | 19,774 | |
| Futures - Notional value | | $ | 2,014,446 | |
| Interest rate contracts: | | | | |
| Futures - Notional value | | $ | 45,569,871 | |
| Foreign currency contracts: | | | | |
| Written Options - Premiums received | | $ | 17,164 | |
| Forward foreign currency contracts: | | | | |
| U.S. dollar amount delivered | | $ | 4,878,801 | |
| U.S. dollar amount received | | $ | 11,501,368 | |
| Credit contracts: | | | | |
| Credit Default Swaps - Notional value* | | $ | — | |
* The balance at each quarter end was zero.
Portfolio securities loaned — The Funds may lend their portfolio securities. Lending portfolio securities exposes the Funds to the risk that the borrower may fail to return the loaned securities or may not be able to provide additional collateral or that the Funds may experience delays in recovery of the loaned securities or loss of rights in the collateral if the borrower fails financially. To minimize these risks, the borrower must agree to maintain cash collateral with the Funds’ custodian. The loaned securities are secured by collateral valued at least equal, at all times, to the market value of the loaned securities plus accrued interest, if any. When the collateral falls below specified amounts, the lending agent will use its best effort to obtain additional collateral on the next
Notes to Financial Statements (Continued)
business day to meet required amounts under the security lending agreement. The cash collateral is reinvested by the Funds’ custodian into an approved short-term investment vehicle. The approved short-term investment vehicle is subject to market risk.
As of March 31, 2018, the following Funds loaned securities and received collateral as follows:
| | | | | | | | Market | | | | |
| | | | | Market | | | Value | | | | |
| | | | | Value of | | | of | | | | |
| | | | | Securities | | | Collateral | | | Net | |
| Fund | | Security Type | | Loaned* | | | Received** | | | Amount*** | |
| International Growth Fund | | Common Stocks | | $ | 107,297 | | | $ | 114,510 | | | $ | 7,213 | |
| International Value Fund | | Common Stocks | | | 1,012,212 | | | | 1,274,491 | | | | 262,279 | |
| Mid Cap Growth Fund | | Common Stocks | | | 199,980 | | | | 211,200 | | | | 11,220 | |
| Sands Capital Emerging Markets Growth Fund | | Common Stocks | | | 2,311,542 | | | | 2,405,416 | | | | 93,874 | |
| Small Cap Growth Fund | | Common Stocks | | | 6,882,652 | | | | 6,958,978 | | | | 76,326 | |
| Sustainability and Impact Equity Fund | | Common Stocks | | | 12,647,600 | | | | 13,292,220 | | | | 644,620 | |
* The remaining contractual maturity is overnight for all securities.
** Gross amount of recognized liabilities for securities lending included in the Statements of Assets and Liabilities.
*** Net amount represents the net amount payable due to the borrower in the event of default.
All cash collateral is received, held, and administered by the Funds’ custodian for the benefit of the lending Fund in its custody account or other account established for the purpose of holding collateral in cash equivalents.
Funds participating in securities lending receive compensation in the form of fees. Securities lending income is derived from lending long securities from the Funds to creditworthy approved borrowers at rates that are determined based on trading volumes, float, short-term interest rates and market liquidity and is shown net of fees on the Statements of Operations. When a Fund lends securities, it retains the interest or dividends on the investment of any cash received as collateral, and the Fund continues to receive interest or dividends on the loaned securities.
Unrealized gain or loss on the market value of the loaned securities that may occur during the term of the loan is recognized by the Fund. The Fund has the right under the lending agreement to recover any loaned securities from the borrower on demand.
Share valuation — The NAV per share of each class of shares of each Fund is calculated daily by dividing the total value of a Fund’s assets attributable to that class, less liabilities attributable to that class, by the number of outstanding shares of that class.
The maximum offering price per share of Class A shares of the Funds is equal to the NAV per share plus a sales load equal to 6.10% of the NAV (or 5.75% of the offering price). There is no sales load on purchases of $1 million or more of Class A shares. The maximum offering price per share of Classes C, Y, and Institutional Class shares of the Funds is equal to the NAV per share.
The redemption price per share of each class of shares of the Funds is generally equal to the NAV per share. However, Class A redemptions that were part of a no-load $1 million subscription may be subject to a contingent deferred sales charge (“CDSC”) of up to 1.00% if redeemed within a one-year period from the date of purchase. Additionally, purchases of Class C shares of the Funds are subject to a CDSC of 1.00%. The CDSC will be assessed on an amount equal to the lesser of (1) the NAV at the time of purchase of the shares being redeemed or (2) the NAV of such shares being redeemed, if redeemed within a one-year period from the date of purchase.
Notes to Financial Statements (Continued)
Investment income — Dividend income from securities is recognized on the ex-dividend date, net of foreign withholding taxes, if any, which are reduced by any amounts reclaimable by the Funds, where applicable. Interest income from securities is recorded on the basis of interest accrued, premium amortized and discount accreted. Realized gains and losses resulting from principal paydowns on mortgage-backed and asset-backed securities are included in interest income. Market discounts, original issues discount and market premiums on debt securities are accreted/amortized to interest income over the life of the security with a corresponding adjustment in the cost basis of that security. In addition, it is the Funds’ policy to accrue for foreign capital gains taxes, if applicable, on certain foreign securities held by the Funds. An estimated foreign capital gains tax is recorded daily on net unrealized gains on these securities and is payable upon the sale of such securities when a gain is realized.
Distributions to shareholders — Each Fund intends to distribute to its shareholders substantially all of its income and capital gains. Each Fund, except for the Flexible Income Fund and the InternationalValue Fund, declares and distributes net investment income, if any, annually, as a dividend to shareholders. The Flexible Income Fund declares and distributes net investment income, if any, monthly, as a dividend to shareholders. The International Value Fund declares and distributes net investment income, if any, quarterly as a dividend to shareholders. Each Fund makes distributions of capital gains, if any, at least annually, net of applicable capital loss carryforwards. Income distributions and capital gain distributions are determined in accordance with income tax regulations. Recognition of the Funds’ net investment income from investments in Underlying Funds is affected by the timing of dividend declarations by the Underlying Funds.
Allocations — Investment income earned, realized capital gains and losses, and unrealized appreciation and depreciation for a Fund are allocated daily to each class of shares based upon its proportionate share of total net assets of the Fund. Class-specific expenses are charged directly to the class incurring the expense. Common expenses, which are not attributable to a specific class, are allocated daily to each class of shares based upon their proportionate share of total net assets of the Fund. Expenses not directly billed to a Fund are allocated proportionally among all the Funds in the Trust, and, if applicable, Touchstone Funds Group Trust, Touchstone Institutional Funds Trust, and Touchstone Variable Series Trust (collectively with the Trust, “Touchstone Fund Complex”), daily in relation to net assets of each Fund or another reasonable measure.
Security transactions — Security transactions are reflected for financial reporting purposes as of the trade date. Realized gains and losses on sales of portfolio securities are calculated using the identified cost basis.
Estimates — The preparation of financial statements in conformity with U.S. GAAP requires management to make estimates and assumptions that affect the reported amounts of assets and liabilities and disclosure of contingent assets and liabilities at the date of the financial statements and the reported amounts of income and expenses during the reporting period. Actual results could differ from those estimates.
3. Investment Transactions
Investment transactions (excluding short-term investments and U.S. Government securities) were as follows for the year ended March 31, 2018:
| | | Flexible | | | | | | Growth | |
| | | Income | | | Focused | | | Opportunities | |
| | | Fund* | | | Fund** | | | Fund | |
| Purchases of investment securities | | $ | 571,550,196 | | | $ | 98,682,860 | | | $ | 228,540,217 | |
| Proceeds from sales and maturities | | $ | 540,790,364 | | | $ | 268,774,672 | | | $ | 239,826,499 | |
Notes to Financial Statements (Continued)
| | | International | | | International | | | Mid Cap | |
| | | Growth | | | Value | | | Growth | |
| | | Fund | | | Fund | | | Fund | |
| Purchases of investment securities | | $ | 8,393,387 | | | $ | 14,538,503 | | | $ | 545,276,406 | |
| Proceeds from sales and maturities | | $ | 7,301,448 | | | $ | 14,608,097 | | | $ | 598,577,622 | |
| | | Sands Capital | | | | | | | |
| | | Emerging | | | | | | Sustainability | |
| | | Markets | | | Small Cap | | | and Impact | |
| | | Growth | | | Growth | | | Equity | |
| | | Fund | | | Fund | | | Fund* | |
| Purchases of investment securities | | $ | 295,492,027 | | | $ | 200,273,472 | | | $ | 401,628,414 | |
| Proceeds from sales and maturities | | $ | 113,169,515 | | | $ | 457,336,782 | | | $ | 377,983,217 | |
* The cost of purchases and proceeds from sales and maturities on the Flexible Income Fund and the Sustainability and Impact Equity Fund excludes the purchases and sales of the Sentinel Multi-Asset Income Fund and the Sentinel Sustainable Core Opportunities Fund, respectively (see Note 9). If these transactions were included, purchases and sales would have been higher.
** Touchstone Focused Fund had a redemption-in-kind on April 7, 2017, which resulted in a redemption out of the Fund of $196,427,222 and is excluded from the proceeds from sales and maturities. The redemption was comprised of securities and cash in the amount of $196,424,472 and $2,750, respectively.
For the year ended March 31, 2018, purchases and proceeds from sales and maturities in U.S. Government securities were $281,318,526 and $265,470,870, respectively, for the Flexible Income Fund.
4. Transactions with Affiliates and Other Related Parties
Certain officers of the Trust are also officers of Touchstone Advisors, Inc. (the “Advisor”), Touchstone Securities, Inc. (the “Underwriter”), or The Bank of New York Mellon, the Sub-Administrator to the Funds and BNY Mellon Investment Servicing (U.S.) Inc., the Transfer Agent to the Funds (collectively referenced to herein as “BNY Mellon”). Such officers receive no compensation from the Trust. The Advisor and the Underwriter are each wholly-owned, indirect subsidiaries of Western & Southern Financial Group, Inc. (“Western & Southern”).
On behalf of the Funds, the Advisor pays each Independent Trustee a quarterly retainer plus additional retainers to the Lead Independent Trustee and the chairs of each standing committee. Interested Trustees do not receive compensation from the Funds. Each Independent Trustee also receives compensation for each Board meeting and committee meeting attended. Each standing committee chair receives additional compensation for each committee meeting that he or she oversees. The Advisor is reimbursed by the Funds for the IndependentTrustees’ compensation and out-of-pocket expenses relating to their services. The Funds accrued Trustee-related expenses of $133,776 for the year ended March 31, 2018.
MANAGEMENT & EXPENSE LIMITATION AGREEMENTS
The Advisor provides general investment supervisory services for the Funds, under the terms of an advisory agreement (“Advisory Agreement”). Under the Advisory Agreement, each Fund pays the Advisor a fee, which is computed and accrued daily and paid monthly, at an annual rate based on average daily net assets of each Fund as shown in the table below.
| Flexible Income Fund* | 0.60% on the first $500 million |
| | 0.50% on such assets in excess of $500 million |
| Focused Fund | 0.70% on the first $100 million |
| | 0.65% on the next $400 million |
| | 0.60% on such assets in excess of $500 million |
Notes to Financial Statements (Continued)
| Growth Opportunities Fund | 0.75% on the first $500 million |
| | 0.70% on the next $500 million |
| | 0.65% on such assets in excess of $1 billion |
| International Growth Fund | 0.90% on the first $500 million |
| | 0.85% on the next $1 billion |
| | 0.80% on such assets in excess of $1.5 billion |
| International Value Fund | 1.00% |
| Mid Cap Growth Fund | 0.75% on the first $500 million |
| | 0.70% on the next $500 million |
| | 0.65% on such assets in excess of $1 billion |
| Sands Capital Emerging Markets Growth Fund** | 1.00% |
| Small Cap Growth Fund | 1.00% on the first $300 million |
| | 0.95% on such assets in excess of $300 million |
| Sustainability and Impact Equity Fund*** | 0.65% on the first $1 billion |
| | 0.60% on such assets in excess of $1 billion |
* Prior to October 28, 2017, the Fund paid 0.70% on the first $500 million, 0.60% on such assets over $500 million.
** Prior to February 16, 2018, the Fund paid 1.15%.
*** Prior to October 28, 2017, the Fund paid 0.75% on the first $200 million, 0.70% on the next $800 million and 0.65% on such assets over $1 billion.
The Advisor has entered into investment sub-advisory agreements with the following parties (each, a “Sub-Advisor”):
| Barrow, Hanley, Mewhinney & Strauss, LLC | Rockefeller & Co., Inc. |
| International Value Fund | Sustainability and Impact Equity Fund |
| ClearArc Capital, Inc. | Sands Capital Management, LLC |
| Flexible Income Fund | Sands Capital Emerging Markets Growth Fund |
| Fiera Capital Inc. | Westfield Capital Management Company, L.P. |
| International Growth Fund | Growth Opportunities Fund |
| Small Cap Growth Fund | Mid Cap Growth Fund |
| Fort Washington Investment Advisors, Inc.* | |
| Focused Fund | |
*Affiliate of the Advisor and wholly-owned subsidiary of Western & Southern.
The Advisor, not the Funds, pays sub-advisory fees to each Sub-Advisor.
The Advisor entered into an expense limitation agreement (the “Expense Limitation Agreement”) to contractually limit the annual operating expenses of the Funds, excluding: dividend and interest expenses relating to short sales; interest; taxes; brokerage commissions and other transaction costs; portfolio transaction and investment related expenses, including expenses associated with the Funds’ liquidity providers, other expenditures which are capitalized in accordance with U.S. GAAP; the cost of “Acquired Fund Fees and Expenses”, if any; and other extraordinary expenses not incurred in the ordinary course of business. The maximum annual operating expense limit in any year with respect to the Funds is based on a percentage of the average daily net assets of the Funds. The Advisor has agreed to separately waive class-level expenses, advisory fees and administration fees, and to reimburse expenses in order to maintain the following expense limitations for the Funds:
Notes to Financial Statements (Continued)
| | | | | | | | | | | | Institutional | |
| | | Class A | | | Class C | | | Class Y | | | Class | |
| Flexible Income Fund* | | | 1.04 | % | | | 1.79 | % | | | 0.79 | % | | | 0.69 | % |
| Focused Fund | | | 1.20 | % | | | 1.95 | % | | | 0.95 | % | | | 0.83 | % |
| Growth Opportunities Fund | | | 1.24 | % | | | 1.99 | % | | | 0.99 | % | | | 0.89 | % |
| International Growth Fund | | | 1.32 | % | | | 2.07 | % | | | 1.07 | % | | | 0.97 | % |
| International Value Fund | | | 1.34 | % | | | 2.09 | % | | | 1.09 | % | | | 0.99 | % |
| Mid Cap Growth Fund | | | 1.39 | % | | | 2.14 | % | | | 1.14 | % | | | 0.99 | % |
| Sands Capital Emerging Markets Growth Fund** | | | — | | | | — | | | | 1.35 | % | | | 1.25 | % |
| Small Cap Growth Fund | | | 1.44 | % | | | 2.19 | % | | | 1.19 | % | | | 1.04 | % |
| Sustainability and Impact Equity Fund*** | | | 1.17 | % | | | 1.99 | % | | | 0.90 | % | | | 0.89 | % |
*Prior to October 28, 2017, the expense limitations for Classes A, C, Y and Institutional Class shares were 1.09%, 1.84%, 0.84% and 0.74%, respectively.
**Prior to February 16, 2018, the expense limitations for Class Y and Institutional Class shares were 1.49% and 1.39%, respectively.
***Prior to October 28, 2017, the expense limitations for Classes A and Y shares were 1.24% and 0.99%, respectively.
These expense limitations will remain in effect for all Funds through at least July 29, 2018, except for Flexible Income Fund, Sustainability and Impact Equity Fund, and Sands Capital Emerging Market Growth Fund. The expense limitation for Flexible Income Fund and Sustainability and Impact Equity Fund will remain in effect through at least October 26, 2019. The expense limitation for Sands Capital Emerging Markets Growth Fund will remain in effect through at least March 30, 2019. The expense limitation agreement can be terminated by a vote of the Funds’ Board if it deems the termination to be beneficial to the Funds’ shareholders.
During the year ended March 31, 2018, the Advisor or its affiliates waived or reimbursed investment advisory fees and administration fees or reimbursed other operating expenses, including distribution fees of the Funds, as follows:
| | | Investment | | | | | | Other Operating | | | | |
| | | Advisory | | | | | | Expenses | | | | |
| | | Fees | | | Administration | | | Reimbursed/ | | | | |
| Fund | | Waived | | | Fees Waived | | | Waived | | | Total | |
| Flexible Income Fund | | $ | — | | | $ | 548,328 | | | $ | 195,346 | | | $ | 743,674 | |
| Focused Fund | | | — | | | | — | | | | 184,614 | | | | 184,614 | |
| Growth Opportunities Fund | | | — | | | | 117,247 | | | | 209,394 | | | | 326,641 | |
| International Growth Fund | | | 58,093 | | | | 21,365 | | | | 35,574 | | | | 115,032 | |
| International Value Fund | | | 121,123 | | | | 34,153 | | | | 69,615 | | | | 224,891 | |
| Mid Cap Growth Fund | | | — | | | | — | | | | 569 | | | | 569 | |
| Sands Capital Emerging Markets Growth Fund | | | — | | | | — | | | | 147,227 | | | | 147,227 | |
| Small Cap Growth Fund | | | — | | | | 415,926 | | | | 85,061 | | | | 500,987 | |
| Sustainability and Impact Equity Fund | | | — | | | | 74,899 | | | | 156,413 | | | | 231,312 | |
Under the terms of the Expense Limitation Agreement, the Advisor is entitled to recover, subject to approval by the Funds’ Board, such amounts waived or reimbursed for a period of up to three years from the date on which the Advisor reduced its compensation or assumed expenses for the Funds. No recoupment will occur unless a Fund’s operating expenses are below the expense limitation amount in effect at the time of waiver or reimbursement and the Fund’s current expense limitation.
As of March 31, 2018, the Advisor may seek recoupment of previously waived fees and reimbursed expenses as follows:
Notes to Financial Statements (Continued)
| | | Expiration | | | Expiration | | | Expiration | | | | |
| | | March 31, | | | March 31, | | | March 31, | | | | |
| Fund | | 2019 | | | 2020 | | | 2021 | | | Total | |
| Flexible Income Fund | | $ | 775,043 | | | $ | 988,671 | | | $ | 695,170 | | | $ | 2,458,884 | |
| Focused Fund | | | 178,123 | | | | 23,692 | | | | 23,561 | | | | 225,376 | |
| Growth Opportunities Fund | | | 227,669 | | | | 262,643 | | | | 267,156 | | | | 757,468 | |
| International Growth Fund | | | — | | | | 109,155 | | | | 114,627 | | | | 223,782 | |
| International Value Fund | | | 327,638 | | | | 205,902 | | | | 213,339 | | | | 746,879 | |
| Mid Cap Growth Fund | | | — | | | | 3,217 | | | | 569 | | | | 3,786 | |
| Sands Capital Emerging Markets Growth Fund | | | 105,154 | | | | 148,454 | | | | 147,227 | | | | 400,835 | |
| Small Cap Growth Fund | | | 583,974 | | | | 732,807 | | | | 443,707 | | | | 1,760,488 | |
| Sustainability and Impact Equity Fund | | | 358,635 | | | | 218,763 | | | | 161,406 | | | | 738,804 | |
For the year ended March 31, 2018, the Advisor recouped previously waived fees or reimbursed expenses from the Small Cap Growth Fund of $6,596.
ADMINISTRATION AGREEMENT
The Advisor entered into an Administration Agreement with the Trust, whereby the Advisor is responsible for: supplying executive and regulatory compliance services; supervising the preparation of tax returns; coordinating the preparation of reports to shareholders and reports to, and filings with, the SEC and state securities authorities, as well as materials for meetings of the Board; calculating the daily NAV per share; and maintaining the financial books and records of each Fund.
For its services, the Advisor’s annual administrative fee is:
0.145% on the first $20 billion of the aggregate average daily net assets;
0.11% on the next $10 billion of aggregate average daily net assets;
0.09% on the next $10 billion of aggregate average daily net assets; and
0.07% on the aggregate average daily net assets over $40 billion.
The fee is computed and allocated among the Touchstone Fund Complex (excluding Touchstone Institutional Funds Trust) on the basis of relative daily net assets.
The Advisor has engaged BNY Mellon as the Sub-Administrator to theTrust. BNY Mellon provides administrative and accounting services to the Trust and is compensated directly by the Advisor, not the Trust.
TRANSFER AGENT AGREEMENT
Under the terms of the Transfer Agent Agreement between the Trust and BNY Mellon, BNY Mellon maintains the records of each shareholder’s account, answers shareholders’ inquiries concerning their accounts, processes purchases and redemptions of each Fund’s shares, acts as dividend and distribution disbursing agent, and performs other shareholder service functions. For these services, BNY Mellon receives a monthly fee from each Fund. In addition, each Fund pays out-of-pocket expenses incurred by BNY Mellon, including, but not limited to, postage and supplies.
The Funds may reimburse the Advisor for fees paid to intermediaries such as banks, broker-dealers, financial advisors or other financial institutions for sub-transfer agency, sub-administration and other services provided to investors whose shares of record are held in omnibus, other group accounts, retirement plans or accounts traded through registered securities clearing agents. These fees may vary based on, for example, the nature of services provided, but generally range up to 0.15% of the assets of the class serviced or maintained by the intermediary or up to $22 per sub-account maintained by the intermediary.
Notes to Financial Statements (Continued)
PLANS OF DISTRIBUTION AND SHAREHOLDER SERVICING FEE ARRANGEMENTS
The Trust has adopted distribution plans pursuant to Rule 12b-1 under the 1940 Act for each class of shares it offers that is subject to 12b-1 distribution fees. The plans allow each Fund to pay distribution and other fees for the sale and distribution of its shares and for services provided to shareholders. The fees charged to the Funds are limited to the actual expenses incurred. Under the Class A plan, each Fund offering Class A shares pays an annual fee of up to 0.25% of average daily net assets that are attributable to Class A shares. Under the Class C plan, each Fund offering Class C shares pays an annual fee of up to 1.00% of average daily net assets that are attributable to Class C shares (of which up to 0.75% is a distribution fee and up to 0.25% is a shareholder servicing fee).
UNDERWRITING AGREEMENT
The Underwriter is the Funds’ principal underwriter and, as such, acts as exclusive agent for distribution of the Funds’ shares. Under the terms of the Underwriting Agreement between the Trust and the Underwriter, the Underwriter earned underwriting and broker commissions on the sale of Class A shares of the Funds. W&S Brokerage Services, Inc., an affiliate of the Underwriter and the Advisor, also earned broker commissions on the sale of Class A shares of the Funds. Listed below are the total underwriting and broker commissions earned by the Underwriter and its affiliate during the year ended March 31, 2018:
| Fund | | Amount | |
| Flexible Income Fund | | $ | 16,685 | |
| Focused Fund | | | 36,099 | |
| Growth Opportunities Fund | | | 5,505 | |
| International Growth Fund | | | 1,198 | |
| International Value Fund | | | 466 | |
| Mid Cap Growth Fund | | | 70,302 | |
| Small Cap Growth Fund | | | 3,273 | |
| Sustainability and Impact Equity Fund | | | 45,289 | |
In addition, the Underwriter collected CDSC on the redemption of Class A and Class C shares of the Funds listed below during the year ended March 31, 2018:
| Fund | | Class A | | | Class C | |
| Flexible Income Fund | | $ | 9 | | | $ | 2,634 | |
| Focused Fund | | | — | | | | 2,425 | |
| Growth Opportunities Fund | | | — | | | | 9 | |
| Mid Cap Growth Fund | | | — | | | | 1,200 | |
| Small Cap Growth Fund | | | — | | | | 575 | |
| Sustainability and Impact Equity Fund | | | 5 | | | | 114 | |
INTERFUND TRANSACTIONS
The Funds may engage in purchase and sale transactions with funds that have a common investment advisor (or affiliated investment advisors), common Trustees and/or common Officers. During the year ended March 31, 2018, the Funds did not engage in any Rule 17a-7 transactions as defined under the 1940 Act.
5. Liquidity
ReFlow Fund LLC—The Funds may participate in the ReFlow Fund LLC liquidity program (“ReFlow”), which is designed to provide an alternative liquidity source for funds experiencing redemptions. In order to pay cash to shareholders who redeem their shares on a given day, a fund typically must hold cash in its portfolio, liquidate portfolio securities, or borrow money. ReFlow provides participating funds with another source of cash by standing ready to purchase shares from a fund up to the amount of the fund’s net redemptions on a given day, cumulatively limited to 3% of the outstanding voting shares of a Fund. ReFlow then generally redeems those
Notes to Financial Statements (Continued)
shares when the Fund experiences net sales. In return for this service, the Fund will pay a fee to ReFlow at a rate determined by a daily auction with other participating mutual funds.
During the year ended March 31, 2018, Reflow was not utilized.
Interfund Lending—Pursuant to an Exemptive Order issued by the SEC on March 28, 2017, the Funds, along with certain other funds in the Touchstone Fund Complex, may participate in an interfund lending program. The interfund lending program provides an alternate credit facility that allows the Funds to lend to or borrow from other participating funds in the Touchstone Fund Complex, subject to the conditions of the Exemptive Order. The Funds may not borrow under the facility for leverage purposes and the loans’ duration may be no more than 7 days.
During the year ended March 31, 2018, the following Fund participated as lender in the interfund lending program. The average amount loaned, average interest rate and interest income were as follows:
| | | Average Amount | | | Average Interest | | | Interest | |
| Fund | | Loaned | | | Rate | | | Income* | |
| Flexible Income Fund | | $ | 3,166,304 | | | | 1.32 | % | | $ | 116 | |
* Included in interest in the Statements of Operations.
During the year ended March 31, 2018, the following Fund participated as a borrower in the interfund lending program. The average amount borrowed, average interest rate and interest expense were as follows:
| | | Average Amount | | | Average Interest | | | Interest | |
| Fund | | Borrowed | | | Rate | | | Expense* | |
| Small Cap Growth Fund | | $ | 3,026,410 | | | | 1.32 | % | | $ | 890 | |
* Included in other expenses in the Statements of Operations.
6. Federal Tax Information
Federal income tax — It is each Fund’s policy to continue to comply with the special provisions of the Internal Revenue Code applicable to regulated investment companies. As provided therein, in any fiscal year in which a Fund so qualifies and distributes at least 90% of its investment company taxable income, the Fund (but not the shareholders) will be relieved of federal income tax on the income distributed. It is each Fund’s policy to distribute all of its taxable income and accordingly, no provision for income taxes has been made.
In order to avoid imposition of the excise tax applicable to regulated investment companies, it is also each Fund’s intention to declare and pay as dividends in each calendar year at least 98% of its investment company taxable income (earned during the calendar year) and 98.2% of its net realized capital gains (earned during the twelve months ending October 31) plus undistributed amounts from prior years.
The tax character of distributions paid for the years ended March 31, 2018 and March 31, 2017 are as follows:
| | | Flexible | | | | | | | | | Growth | |
| | | Income Fund | | | Focused Fund | | | Opportunities Fund | |
| | | Year Ended | | | Year Ended | | | Year Ended | | | Year Ended | | | Year Ended | | | Year Ended | |
| | | March 31, | | | March 31, | | | March 31, | | | March 31, | | | March 31, | | | March 31, | |
| | | 2018 | | | 2017 | | | 2018 | | | 2017 | | | 2018 | | | 2017 | |
| From ordinary income | | $ | 21,745,871 | | | $ | 18,697,931 | | | $ | 29,800,080 | | | $ | 7,223,956 | | | $ | 15,769,503 | | | $ | 6,735,141 | |
| From long-term capital gains | | | — | | | | — | | | | 52,684,335 | | | | 12,445,614 | | | | 9,585,119 | | | | 1,718,652 | |
| Total distributions | | $ | 21,745,871 | | | $ | 18,697,931 | | | $ | 82,484,415 | | | $ | 19,669,570 | | | $ | 25,354,622 | | | $ | 8,453,793 | |
Notes to Financial Statements (Continued)
| | | International | | | International | | | Mid Cap | |
| | | Growth Fund | | | Value Fund | | | Growth Fund | |
| | | Year Ended | | | Year Ended | | | Year Ended | | | Year Ended | | | Year Ended | | | Year Ended | |
| | | March 31, | | | March 31, | | | March 31, | | | March 31, | | | March 31, | | | March 31, | |
| | | 2018 | | | 2017* | | | 2018 | | | 2017 | | | 2018 | | | 2017 | |
| From ordinary income | | $ | 120,476 | | | $ | 54,008 | | | $ | 567,021 | | | $ | 2,828,829 | | | $ | 12,550,670 | | | $ | — | |
| From long-term capital gains | | | 8,512 | | | | — | | | | — | | | | — | | | | 61,432,239 | | | | 19,400,314 | |
| Total distributions | | $ | 128,988 | | | $ | 54,008 | | | $ | 567,021 | | | $ | 2,828,829 | | | $ | 73,982,909 | | | $ | 19,400,314 | |
| | | Sands Capital | | | | | | | | | Sustainability | |
| | | Emerging Markets | | | Small Cap | | | and Impact Equity | |
| | | Growth Fund | | | Growth Fund | | | Fund | |
| | | Year Ended | | | Year Ended | | | Year Ended | | | Year Ended | | | Year Ended | | | Year Ended | |
| | | March 31, | | | March 31, | | | March 31, | | | March 31, | | | March 31, | | | March 31, | |
| | | 2018 | | | 2017 | | | 2018 | | | 2017 | | | 2018 | | | 2017 | |
| From ordinary income | | $ | — | | | $ | — | | | $ | — | | | $ | — | | | $ | 5,228,811 | | | $ | 1,573,282 | |
| From long-term capital gains | | | — | | | | — | | | | — | | | | 1,973,248 | | | | 84,572,202 | | | | — | |
| Total distributions | | $ | — | | | $ | — | | | $ | — | | | $ | 1,973,248 | | | $ | 89,801,013 | | | $ | 1,573,282 | |
* Represents the period from commencement of operations (April 1, 2016) through March 31, 2017.
The following information is computed on a tax basis for each item as of March 31, 2018:
| | | Flexible | | | | | | Growth | |
| | | Income | | | Focused | | | Opportunities | |
| | | Fund | | | Fund | | | Fund | |
| Tax cost of portfolio investments | | $ | 934,100,847 | | | $ | 900,895,689 | | | $ | 222,682,297 | |
| Gross unrealized appreciation on investments | | | 17,318,967 | | | | 346,338,847 | | | | 66,096,531 | |
| Gross unrealized depreciation on investments | | | (15,680,286 | ) | | | (43,548,221 | ) | | | (4,918,748 | ) |
| Net unrealized appreciation (depreciation) on investments | | | 1,638,681 | | | | 302,790,626 | | | | 61,177,783 | |
| Gross unrealized appreciation on foreign currency transactions and derivatives | | | 1,158 | | | | — | | | | — | |
| Gross unrealized depreciation on foreign currency transactions and derivatives | | | (25,045 | ) | | | — | | | | — | |
| Net unrealized depreciation on foreign currency transactions and derivatives | | | (23,887 | ) | | | — | | | | — | |
| Other temporary differences | | | (2,895 | ) | | | — | | | | — | |
| Undistributed ordinary income | | | 1,346,242 | | | | 7,638,867 | | | | — | |
| Undistributed capital gains | | | 4,234,655 | | | | 23,979,659 | | | | 5,747,056 | |
| Accumulated earnings (deficit) | | $ | 7,192,796 | | | $ | 334,409,152 | | | $ | 66,924,839 | |
| | | International | | | International | | | Mid Cap | |
| | | Growth | | | Value | | | Growth | |
| | | Fund | | | Fund | | | Fund | |
| Tax cost of portfolio investments | | $ | 12,812,509 | | | $ | 25,083,602 | | | $ | 587,414,935 | |
| Gross unrealized appreciation on investments | | | 2,860,802 | | | | 2,617,027 | | | | 198,349,849 | |
| Gross unrealized depreciation on investments | | | (218,245 | ) | | | (2,044,467 | ) | | | (10,299,318 | ) |
| Net unrealized appreciation (depreciation) on investments | | | 2,642,557 | | | | 572,560 | | | | 188,050,531 | |
| Gross unrealized appreciation on foreign currency transactions | | | — | | | | 731 | | | | — | |
| Gross unrealized depreciation on foreign currency transactions | | | — | | | | (116 | ) | | | — | |
| Net unrealized depreciation on foreign currency transactions | | | — | | | | 615 | | | | — | |
| Capital loss carryforwards | | | — | | | | (9,586,442 | ) | | | — | |
Notes to Financial Statements (Continued)
| | | International | | | International | | | Mid Cap | |
| | | Growth | | | Value | | | Growth | |
| | | Fund | | | Fund | | | Fund | |
| Undistributed ordinary income | | $ | 19,392 | | | $ | 481,214 | | | $ | 13,059,653 | |
| Undistributed capital gains | | | 352,258 | | | | — | | | | 25,205,065 | |
| Accumulated earnings (deficit) | | $ | 3,014,207 | | | $ | (8,532,053 | ) | | $ | 226,315,249 | |
| | | Sands Capital | | | | | | | |
| | | Emerging Markets | | | Small Cap | | | Sustainability | |
| | | Growth | | | Growth | | | and Impact Equity | |
| | | Fund | | | Fund | | | Fund | |
| Tax cost of portfolio investments | | $ | 456,256,819 | | | $ | 161,635,050 | | | $ | 644,067,679 | |
| Gross unrealized appreciation on investments | | | 140,362,555 | | | | 38,831,712 | | | | 138,675,902 | |
| Gross unrealized depreciation on investments | | | (17,921,640 | ) | | | (6,929,053 | ) | | | (18,578,694 | ) |
| Net unrealized appreciation (depreciation) on investments | | | 122,440,915 | | | | 31,902,659 | | | | 120,097,208 | |
| Gross unrealized appreciation on foreign currency transactions and deferred foreign capital gains tax | | | — | | | | — | | | | 23 | |
| Gross unrealized depreciation on foreign currency transactions and deferred foreign capital gains tax | | | (907,768 | ) | | | — | | | | (11,177 | ) |
| Net unrealized depreciation on foreign currency transactions and deferred foreign capital gains tax | | | (907,768 | ) | | | — | | | | (11,154 | ) |
| Post-October and Qualified Late-Year Losses | | | (1,475,036 | ) | | | — | | | | — | |
| Capital loss carryforwards | | | (4,209,065 | ) | | | — | | | | — | |
| Undistributed ordinary income | | | — | | | | 843,908 | | | | 2,287,722 | |
| Undistributed capital gains | | | — | | | | 11,579,381 | | | | 10,892,758 | |
| Accumulated earnings (deficit) | | $ | 115,849,046 | | | $ | 44,325,948 | | | $ | 133,266,534 | |
The difference between the tax cost of portfolio investments and the financial statement cost is primarily due to wash sale loss deferrals, trust preferred securities and investments in passive foreign investment company (“PFIC”) adjustments.
As of March 31, 2018, the Funds had the following capital loss carryforwards for federal income tax purposes:
| | | No | | | No | | | | |
| | | Expiration | | | Expiration | | | | |
| Fund | | Short Term | | | Long Term | | | Total | |
| International Value Fund | | $ | 2,874,987 | | | $ | 6,711,455 | | | $ | 9,586,442 | |
| Sands Capital Emerging Markets Growth Fund | | | 4,209,065 | | | | — | | | | 4,209,065 | |
The capital loss carryforwards may be utilized in future years to offset net realized capital gains, if any, prior to distributing such gains to shareholders.
During the year ended March 31, 2018, the following Funds utilized capital loss carryforwards or had capital loss carryforwards expire as follows:
| Fund | | Utilized | | | Expired | |
| Flexible Income Fund | | $ | 6,355,592 | | | $ | — | |
| International Growth Fund | | | 242,445 | | | | — | |
| International Value Fund | | | 318,875 | | | | 70,912,135 | |
| Sands Capital Emerging Markets Growth Fund | | | 7,804,460 | | | | — | |
| Small Cap Growth Fund | | | 24,155,339 | | | | — | |
| Sustainability and Impact Equity Fund | | | 11,335,434 | | | | — | |
Under current laws, certain capital losses realized after October 31 and ordinary losses realized after December 31 may be deferred (and certain ordinary losses after October and/or December 31 may be deferred) and treated
Notes to Financial Statements (Continued)
as occurring on the first day of the following fiscal year. For the year ended March 31, 2018, the Funds elected to defer the following losses:
| | | Realized | | | Ordinary | | | | |
| Fund | | Capital Losses | | | Losses | | | Total | |
| Sands Capital Emerging Markets Growth Fund | | $ | — | | | $ | 1,475,036 | | | $ | 1,475,036 | |
The Funds have analyzed their tax positions taken on federal income tax returns for all open tax years (tax years ended March 31, 2015 through 2018) and have concluded that no provision for income tax is required in their financial statements.
Certain reclassifications, the result of permanent differences between financial statement and income tax reporting requirements, have been made to the components of capital as presented on the Statements of Assets and Liabilities. These reclassifications have no impact on the net assets or NAV per share of the Funds. The following reclassifications, which are primarily attributed to the tax treatment of foreign currency gains/losses, paydown gains/losses on mortgage backed and asset backed securities, gains/losses from passive foreign investment companies, net operating losses, re-designation of dividends paid, swap reclassifications, forward currency contracts reclassifications, foreign futures reclassifications, acquired wash sales from mergers, in-kind distributions for shareholder redemptions, capital gain adjustment on sale of partnership, deemed distributions on shareholder redemptions, nontaxable and/or capital gain distributions reclassification and capital loss carryforwards expiration adjustments have been made to the following Funds for the year ended March 31, 2018:
| | | | | | Accumulated | | | Accumulated | |
| | | Paid-In | | | Net Investment | | | Net Realized | |
| Fund | | Capital | | | Income(Loss) | | | Gains(Losses) | |
| Flexible Income Fund | | $ | 4,406 | | | $ | (1,089,033 | ) | | $ | 1,084,627 | |
| Focused Fund | | | 66,618,484 | | | | (1,688,123 | ) | | | (64,930,361 | ) |
| Growth Opportunities Fund | | | — | | | | 202,619 | | | | (202,619 | ) |
| International Growth Fund | | | — | | | | 3,224 | | | | (3,224 | ) |
| International Value Fund | | | (70,912,135 | ) | | | 465,054 | | | | 70,447,081 | |
| Mid Cap Growth Fund | | | — | | | | 2,622,201 | | | | (2,622,201 | ) |
| Sands Capital Emerging Markets Growth Fund | | | (1,902,494 | ) | | | 1,717,291 | | | | 185,203 | |
| Small Cap Growth Fund | | | — | | | | 2,292,827 | | | | (2,292,827 | ) |
| Sustainability and Impact Equity Fund | | | 83,396 | | | | 583,519 | | | | (666,915 | ) |
7. Commitments and Contingencies
The Funds indemnify the Trust’s officers and Trustees for certain liabilities that might arise from their performance of their duties to the Funds. Additionally, in the normal course of business, the Funds enter into contracts that contain a variety of representations and warranties and which provide general indemnifications. The Funds’ maximum exposure under these arrangements is unknown, as this would involve future claims that may be made against the Funds.
8. Principal Risks
Risks Associated with Foreign Investments — Some of the Funds may invest in the securities of foreign issuers. Investing in securities issued by companies whose principal business activities are outside the U.S. may involve significant risks not present in domestic investments. For example, there is generally less publicly available information about foreign companies, particularly those not subject to the disclosure and reporting requirements of the U.S. securities laws. Foreign issuers are generally not bound by uniform accounting, auditing, and financial reporting requirements and standards of practice comparable to those applicable to domestic issuers. Investments in foreign securities also involve the risk of possible adverse changes in investment or exchange control regulations, expropriation or confiscatory taxation, limitations on the removal of funds or other assets of a Fund, political
Notes to Financial Statements (Continued)
or financial instability or diplomatic and other developments which could affect such investments. Foreign stock markets, while growing in volume and sophistication, are generally not as developed as those in the U.S., and securities of some foreign issuers (particularly those located in developing countries) may be less liquid and more volatile than securities of comparable U.S. companies. In general, there is less overall governmental supervision and regulation of foreign securities markets, broker-dealers, and issuers than in the U.S.
Risks Associated with Concentration — Certain Funds may invest a high percentage of their assets in specific sectors of the market in order to achieve a potentially greater investment return. As a result, these Funds may be more susceptible to economic, political, and regulatory developments in a particular sector of the market, positive or negative, and may experience increased volatility in the Funds’ NAVs and magnified effect on the total return.
Risks Associated with Credit — An issuer may be unable to make timely payments of either principal or interest. This may cause the issuer’s securities to decline in value. Credit risk is particularly relevant to those Funds that invest a significant amount of their assets in junk bonds or lower-rated securities.
Risks Associated with Interest Rate Changes — As interest rates rise, the value of fixed-income securities a Fund owns will likely decrease. The price of debt securities is generally linked to the prevailing market interest rates. In general, when interest rates rise, the price of debt securities falls, and when interest rates fall, the price of debt securities rises. The price volatility of a debt security also depends on its maturity. Longer-term securities are generally more volatile, so the longer the average maturity or duration of these securities, the greater their price risk. Duration is a measure of the expected life, taking into account any prepayment or call features of the security, that is used to determine the price sensitivity of the security for a given change in interest rates. Specifically, duration is the change in the value of a fixed-income security that will result from a 1% change in interest rates, and generally is stated in years. For example, as a general rule a 1% rise in interest rates means a 1% fall in value for every year of duration. Maturity, on the other hand, is the date on which a fixed-income security becomes due for payment of principal. The negative impact on fixed income securities if interest rates increase as a result could negatively impact a Fund’s NAV.
Please see the Funds’ prospectus for a complete discussion of these and other risks.
9. Fund Mergers
Flexible Income Fund:
The shareholders of the Sentinel Multi-Asset Income Fund, a series of the Sentinel Group Funds, Inc., approved an Agreement and Plan of Reorganization providing for the transfer of all assets and liabilities of the Sentinel Multi-Asset Income Fund to the Touchstone Flexible Income Fund. The tax-free merger took place on October 27, 2017.
| | | | | | | | | After | |
| | | Before Reorganization | | | Reorganization | |
| | | Sentinel | | | Touchstone | | | Touchstone | |
| | | Multi-Asset | | | Flexible | | | Flexible | |
| | | Income Fund | | | Income Fund | | | Income Fund | |
| Class A | | | | | | | | | | | | |
| Shares | | | 9,063,086 | (A) | | | 4,559,664 | | | | 13,622,750 | |
| Net Assets | | $ | 99,393,351 | | | $ | 50,004,817 | | | $ | 149,398,168 | |
| Net Asset Value | | $ | 10.97 | (A) | | $ | 10.97 | | | $ | 10.97 | |
| Class C | | | | | | | | | | | | |
| Shares | | | 6,398,405 | (B) | | | 4,812,158 | | | | 11,210,563 | |
| Net Assets | | $ | 69,228,625 | | | $ | 52,065,980 | | | $ | 121,294,605 | |
| Net Asset Value | | $ | 10.82 | (B) | | $ | 10.82 | | | $ | 10.82 | |
Notes to Financial Statements (Continued)
| | | | | | | | | After | |
| | | Before Reorganization | | | Reorganization | |
| | | Sentinel | | | Touchstone | | | Touchstone | |
| | | Multi-Asset | | | Flexible | | | Flexible | |
| | | Income Fund | | | Income Fund | | | Income Fund | |
| Class Y* | | | | | | | | | | | | |
| Shares | | | 4,717,881 | (C) | | | 51,502,699 | | | | 56,220,580 | |
| Net Assets | | $ | 51,897,275 | | | $ | 566,535,937 | | | $ | 618,433,212 | |
| Net Asset Value | | $ | 11.00 | (C) | | $ | 11.00 | | | $ | 11.00 | |
| Institutional Class | | | | | | | | | | | | |
| Shares | | | — | | | | 9,032,583 | | | | 9,032,583 | |
| Net Assets | | $ | — | | | $ | 99,330,556 | | | $ | 99,330,556 | |
| Net Asset Value | | $ | — | | | $ | 11.00 | | | $ | 11.00 | |
| Fund Total | | | | | | | | | | | | |
| Shares Outstanding | | | 17,801,358 | | | | 69,907,104 | | | | 90,086,476 | |
| Net Assets | | $ | 220,519,251 | | | $ | 767,937,290 | | | $ | 988,456,541 | |
| Unrealized Appreciation | | $ | 8,201,027 | | | $ | 20,254,664 | | | $ | 28,455,691 | |
(A)Reflects a 1.1325:1 reverse stock split which occurred on the date of reorganization, October 27, 2017.
(B)Reflects a 1.1411:1 reverse stock split which occurred on the date of reorganization, October 27, 2017.
(C)Reflects a 1.1256:1 reverse stock split which occurred on the date of reorganization, October 27, 2017.
* The Sentinel Multi-Asset Income Fund had Class I shares outstanding immediately prior to the reorganization, which were exchanged for Class Y shares of the Flexible Income Fund.
Assuming this reorganization had been completed on April 1, 2017, the Flexible Income Fund’s results of operations for the year ended March 31, 2018 (unaudited) would have been as follows:
| Net investment income | | $ | 29,517,381 | |
| Net realized and unrealized gains (losses) on investments, foreign currency and derivatives | | $ | 6,551,457 | |
| Net increase in net assets resulting from operations | | $ | 36,068,838 | |
Because the combined investment portfolios have been managed as a single portfolio since the reorganization was completed, it is not practical to separate the amounts of revenue and earnings to the Flexible Income Fund that have been included in its statement of operations since the reorganization.
Sustainability and Impact Equity Fund:
The shareholders of the Sentinel Sustainable Core Opportunities Fund, a series of the Sentinel Group Funds, Inc., approved an Agreement and Plan of Reorganization providing for the transfer of all assets and liabilities of the Sentinel Sustainable Core Opportunities Fund to the Touchstone Sustainability and Impact Equity Fund. The tax-free merger took place on October 27, 2017.
Notes to Financial Statements (Continued)
| | | | | | | | | After | |
| | | Before Reorganization | | | Reorganization | |
| | | Sentinel | | | Touchstone | | | Touchstone | |
| | | Sustainable | | | Sustainability | | | Sustainability | |
| | | Core | | | and | | | and | |
| | | Opportunities | | | Impact Equity | | | Impact Equity | |
| | | Fund | | | Fund | | | Fund | |
| Class A | | | | | | | | | | | | |
| Shares | | | 15,059,186 | (A) | | | 5,341,974 | | | | 20,401,160 | |
| Net Assets | | $ | 366,882,146 | | | $ | 130,145,017 | | | $ | 497,027,163 | |
| Net Asset Value | | $ | 24.36 | (A) | | $ | 24.36 | | | $ | 24.36 | |
| Class C | | | | | | | | | | | | |
| Shares | | | — | | | | 1,938,144 | | | | 1,938,144 | |
| Net Assets | | $ | — | | | $ | 40,684,897 | | | $ | 40,684,897 | |
| Net Asset Value | | $ | — | | | $ | 20.99 | | | $ | 20.99 | |
| Class Y* | | | | | | | | | | | | |
| Shares | | | 1,194,468 | (B) | | | 6,049,314 | | | | 7,243,782 | |
| Net Assets | | $ | 29,944,579 | | | $ | 151,652,545 | | | $ | 181,597,124 | |
| Net Asset Value | | $ | 25.07 | (B) | | $ | 25.07 | | | $ | 25.07 | |
| Institutional Class | | | | | | | | | | | | |
| Shares | | | — | | | | 1,507,931 | | | | 1,507,931 | |
| Net Assets | | $ | — | | | $ | 37,853,181 | | | $ | 37,853,181 | |
| Net Asset Value | | $ | — | | | $ | 25.10 | | | $ | 25.10 | |
| Fund Total | | | | | | | | | | | | |
| Shares Outstanding | | | 16,455,114 | | | | 14,837,363 | | | | 31,091,017 | |
| Net Assets | | $ | 396,826,725 | | | $ | 360,335,640 | | | $ | 757,162,365 | |
| Unrealized Appreciation | | $ | 147,234,940 | | | $ | 65,885,795 | | | $ | 213,120,735 | |
(A)Reflects a 0.9897:1 stock split which occurred on the date of reorganization, October 27, 2017.
(B)Reflects a 0.9645:1 stock split which occurred on the date of reorganization, October 27, 2017.
* The Sentinel Sustainable Core Opportunities Fund had Class I shares outstanding immediately prior to the reorganization, which were exchanged for Class Y shares of the Sustainability and Impact Equity Fund.
Assuming this reorganization had been completed on April 1, 2017, the Sustainability and Impact Equity Fund’s results of operations for the year ended March 31, 2018 (unaudited) would have been as follows:
| Net investment income | | $ | 5,616,467 | |
| Net realized and unrealized gains (losses) on investments and foreign currency | | $ | 93,683,687 | |
| Net increase in net assets resulting from operations | | $ | 99,300,154 | |
Because the combined investment portfolios have been managed as a single portfolio since the reorganization was completed, it is not practical to separate the amounts of revenue and earnings to the Sustainability and Impact Equity Fund that have been included in its statement of operations since the reorganization.
10. Subsequent Events
Subsequent events occurring after the date of this report have been evaluated for potential impact to this report through the date the financial statements were issued.
At a meeting of the Board of Trustees (the “Board”) of the Trust held on May 17, 2018, the Board approved a plan to close and liquidate the International Growth Fund due to its small size and limited growth potential. The Fund is expected to be closed and liquidated on or about July 30, 2018.
Notes to Financial Statements (Continued)
The Board also approved the reorganization (the “Reorganization”) of the Small Cap Growth Fund into the Touchstone Small Company Fund, a series of the Trust, subject to shareholder approval. The Reorganization, if approved, is expected to be completed on or about September 21, 2018.
There were no other subsequent events that necessitated recognition or disclosure in the Funds’ financial statements.
Report of Independent Registered Public Accounting Firm
To the Shareholders of Touchstone Flexible Income Fund, Touchstone Focused Fund, Touchstone Growth Opportunities Fund,Touchstone International Growth Fund,Touchstone International Value Fund,Touchstone Mid Cap Growth Fund, Touchstone Sands Capital Emerging Markets Growth Fund, Touchstone Small Cap Growth Fund and Touchstone Sustainability and Impact Equity Fund and the Board of Trustees of Touchstone Strategic Trust.
Opinion on the Financial Statements
We have audited the accompanying statements of assets and liabilities of Touchstone Flexible Income Fund, Touchstone Focused Fund, Touchstone Growth Opportunities Fund, Touchstone International Growth Fund, Touchstone International Value Fund,Touchstone Mid Cap Growth Fund,Touchstone Sands Capital Emerging Markets Growth Fund, Touchstone Small Cap Growth Fund and Touchstone Sustainability and Impact Equity Fund (collectively referred to as the “Funds”), (nine of the funds constituting the Touchstone Strategic Trust (the “Trust”)), including the portfolios of investments, as of March 31, 2018, and the related statements of operations and changes in net assets, and the financial highlights for each of the periods indicated in the table below and the related notes (collectively referred to as the “financial statements”). In our opinion, the financial statements present fairly, in all material respects, the financial position of each of the Funds (nine of the funds constituting Touchstone Strategic Trust) at March 31, 2018, and the results of their operations, changes in net assets and financial highlights for each of the periods indicated in the table below, in conformity with U.S. generally accepted accounting principles.
| Individual funds | | | |
| constituting | | | |
| Touchstone Strategic | Statement of | Statements of | |
| Trust | operations | changes in net assets | Financial highlights |
| Touchstone Flexible Income Fund | For the year ended March 31, 2018 | For each of the two years in the period ended March 31, 2018 | For each of the five years in the period ended March 31, 2018 |
| Touchstone Focused Fund | For the year ended March 31, 2018 | For each of the two years in the period ended March 31, 2018 | For each of the five years in the period ended March 31, 2018 |
| Touchstone Growth Opportunities Fund | For the year ended March 31, 2018 | For each of the two years in the period ended March 31, 2018 | For each of the five years in the period ended March 31, 2018 |
| Touchstone International Growth Fund | For the year ended March 31, 2018 | For each of the two years in the period ended March 31, 2018 |
| Touchstone International Value Fund | For the year ended March 31, 2018 | For each of the two years in the period ended March 31, 2018 | For each of the five years in the period ended March 31, 2018 |
| Touchstone Mid Cap Growth Fund | For the year ended March 31, 2018 | For each of the two years in the period ended March 31, 2018 | For each of the five years in the period ended March 31, 2018 |
| Touchstone Sands Capital Emerging Markets Growth Fund | For the year ended March 31, 2018 | For each of the two years in the period ended March 31, 2018 | For each of the three years in the period ended March 31, 2018 and the period from May 12, 2014 (commencement of operations) through March 31, 2015 |
| Touchstone Small Cap Growth Fund | For the year ended March 31, 2018 | For each of the two years in the period ended March 31, 2018 | For each of the five years in the period ended March 31, 2018 |
| Touchstone Sustainability and Impact Equity Fund | For the year ended March 31, 2018 | For each of the two years in the period ended March 31, 2018 | For each of the five years in the period ended March 31, 2018 |
Report of Independent Registered Public Accounting Firm (Continued)
Basis for Opinion
These financial statements are the responsibility of the Trust’s management. Our responsibility is to express an opinion on each of the Funds’ financial statements based on our audits. We are a public accounting firm registered with the Public Company Accounting Oversight Board (United States) (“PCAOB”) and are required to be independent with respect to the Trust in accordance with the U.S. federal securities laws and the applicable rules and regulations of the Securities and Exchange Commission and the PCAOB.
We conducted our audits in accordance with the standards of the PCAOB. Those standards require that we plan and perform the audit to obtain reasonable assurance about whether the financial statements are free of material misstatement, whether due to error or fraud. The Trust is not required to have, nor were we engaged to perform, an audit of the Trust’s internal control over financial reporting. As part of our audits we are required to obtain an understanding of internal control over financial reporting but not for the purpose of expressing an opinion on the effectiveness of the Trust’s internal control over financial reporting. Accordingly, we express no such opinion.
Our audits included performing procedures to assess the risks of material misstatement of the financial statements, whether due to error or fraud, and performing procedures that respond to those risks. Such procedures included examining, on a test basis, evidence regarding the amounts and disclosures in the financial statements. Our procedures included confirmation of securities owned as of March 31, 2018, by correspondence with the custodian, transfer agent and brokers or by other appropriate auditing procedures where replies from brokers were not received. Our audits also included evaluating the accounting principles used and significant estimates made by management, as well as evaluating the overall presentation of the financial statements. We believe that our audits provide a reasonable basis for our opinion.

We have served as the auditor of one or more Touchstone Investments’ investment companies since 1999.
Cincinnati, Ohio
May 21, 2018
Other Items (Unaudited)
Qualified Dividend Income
Under the Jobs and Growth Tax Relief Reconciliation Act of 2003 (the “Act”), the following percentages of ordinary dividends paid during the fiscal year ended March 31, 2018 are designated as “qualified dividend income,” as defined in the Act, and are subject to reduced tax rates. The Funds intend to pass through the maximum allowable percentage for Form 1099 Div.
| Flexible Income Fund | | | 8.86 | % |
| Focused Fund | | | 72.84 | % |
| Growth Opportunities Fund | | | 14.43 | % |
| International Growth Fund | | | 100.00 | % |
| International Value Fund | | | 74.04 | % |
| Mid Cap Growth Fund | | | 22.53 | % |
| Sustainability and Impact Equity Fund | | | 100.00 | % |
Dividend Received Deduction
For corporate shareholders, the following ordinary distributions paid during the current fiscal year ended March 31, 2018 qualify for the corporate dividends received deduction. The Funds intend to pass through the maximum allowable percentage.
| Flexible Income Fund | | | 6.01 | % |
| Focused Fund | | | 62.07 | % |
| Growth Opportunities Fund | | | 12.95 | % |
| Mid Cap Growth Fund | | | 21.18 | % |
| Sustainability and Impact Equity Fund | | | 54.85 | % |
For the fiscal year ended March 31, 2018, the Funds designated long-term capital gains as follows:
| Flexible Income Fund | | $ | 4,234,655 | |
| Focused Fund | | | 62,274,893 | |
| Growth Opportunities Fund | | | 15,332,175 | |
| International Growth Fund | | | 360,770 | |
| Mid Cap Growth Fund | | | 61,432,239 | |
| Small Cap Growth Fund | | | 11,579,381 | |
| Sustainability and Impact Equity Fund | | | 95,464,960 | |
Foreign Tax Income & Foreign Tax Credit
The International Growth Fund and International Value Fund intend to pass through a foreign tax credit to their shareholders. For the fiscal year ended March 31, 2018, the total amount of foreign source income was $259,997 or $0.22 per share for the International Growth Fund and $705,260 or $0.24 per share for the International Value Fund. The total amount of foreign taxes to be paid was $18,636 or $0.02 per share for the International Growth Fund and $44,933 or $0.02 per share for the International Value Fund. Shareholders’ allocable share of the foreign tax credit will be reported on Form 1099 Div.
Proxy Voting Guidelines
The Sub-Advisors are responsible for exercising the voting rights associated with the securities purchased and held by the Funds. A description of the policies and procedures that the Sub-Advisors use in fulfilling this responsibility is available as an appendix to the most recent Statement of Additional Information, which can be obtained without charge by calling toll free 1.800.543.0407 or by visiting the Touchstone website at TouchstoneInvestments.com or on the Securities and Exchange Commission’s (the “Commission”) website
Other Items (Unaudited) (Continued)
sec.gov. Information regarding how those proxies were voted during the most recent twelve-month period ended June 30 is also available without charge by calling toll free 1.800.543.0407 or on the Commission’s website at sec.gov.
Quarterly Portfolio Disclosure
The Trust files a complete listing of portfolio holdings for each Fund as of the end of the first and third quarters of each fiscal year on Form N-Q. The complete listing (i) is available on the Commission’s website; (ii) may be reviewed and copied at the Commission’s Public Reference Room in Washington, DC; or (iii) will be made available to shareholders upon request by calling 1.800.543.0407. Information on the operation of the Public Reference Room may be obtained by calling 1-800-SEC-0330.
Schedule of Shareholder Expenses
As a shareholder of the Funds, you incur two types of costs: (1) transaction costs, including reinvested dividends or other distributions; and (2) ongoing costs, including investment advisory fees; distribution (12b-1) fees; and other Fund expenses. This example is intended to help you understand your ongoing costs (in dollars) of investing in the Funds and to compare these costs with the ongoing costs of investing in other mutual funds.
The example is based on an investment of $1,000 invested at the beginning of the period and held for the entire period (October 1, 2017 through March 31, 2018).
Actual Expenses
The first line of the table below for each share class of a Fund provides information about actual account values and actual expenses. You may use the information in this line, together with the amount you invested, to estimate the expenses that you paid over the period. Simply divide your account value by $1,000 (for example, an $8,600 account value divided by $1,000 = 8.6), then multiply the result by the number in the first line under the heading entitled “Expenses Paid During the Six Months Ended March 31, 2018” to estimate the expenses you paid on your account during this period.
Hypothetical Example for Comparison Purposes
The second line of the table below for each share class of a Fund provides information about hypothetical account values and hypothetical expenses based on the Funds’ actual expense ratio and an assumed rate of return of 5% per year before expenses, which is not the Funds’ actual return. The hypothetical account values and expenses may not be used to estimate the actual ending account balance or expenses you paid for the period. You may use this information to compare the ongoing costs of investing in the Funds and other funds. To do so, compare this 5% hypothetical example with the 5% hypothetical examples that appear in the shareholder reports of the other funds.
Please note that the expenses shown in the table are meant to highlight your ongoing costs only and do not reflect any transactional costs, such as sales charges (loads), redemption fees, or exchange fees. Therefore, the second line for each share class of a Fund in the table below is useful in comparing ongoing costs only, and will not help you determine the relative total costs of owning different funds. In addition, if these transactional costs were included, your costs would have been higher.
Other Items (Unaudited) (Continued)
| | | | | | | | | | | | | | Expenses | |
| | | | | Net Expense | | | Beginning | | | Ending | | | Paid During | |
| | | | | Ratio | | | Account | | | Account | | | the Six Months | |
| | | | | Annualized | | | Value | | | Value | | | Ended | |
| | | | | March 31, | | | October 1, | | | March 31, | | | March 31, | |
| | | | | 2018 | | | 2017 | | | 2018 | | | 2018* | |
| Touchstone Flexible Income Fund | | | | | | | | | | | | | | | | |
| Class A | | Actual | | | 1.05 | % | | $ | 1,000.00 | | | $ | 999.40 | | | $ | 5.23 | ** |
| Class A | | Hypothetical | | | 1.05 | % | | $ | 1,000.00 | | | $ | 1,019.70 | | | $ | 5.29 | ** |
| | | | | | | | | | | | | | | | | | | |
| Class C | | Actual | | | 1.80 | % | | $ | 1,000.00 | | | $ | 995.70 | | | $ | 8.96 | ** |
| Class C | | Hypothetical | | | 1.80 | % | | $ | 1,000.00 | | | $ | 1,015.96 | | | $ | 9.05 | ** |
| | | | | | | | | | | | | | | | | | | |
| Class Y | | Actual | | | 0.80 | % | | $ | 1,000.00 | | | $ | 1,000.70 | | | $ | 3.99 | ** |
| Class Y | | Hypothetical | | | 0.80 | % | | $ | 1,000.00 | | | $ | 1,020.94 | | | $ | 4.03 | ** |
| | | | | | | | | | | | | | | | | | | |
| Institutional Class | | Actual | | | 0.70 | % | | $ | 1,000.00 | | | $ | 1,001.20 | | | $ | 3.49 | ** |
| Institutional Class | | Hypothetical | | | 0.70 | % | | $ | 1,000.00 | | | $ | 1,021.44 | | | $ | 3.53 | ** |
| | | | | | | | | | | | | | | | | | | |
| Touchstone Focused Fund | | | | | | | | | | | | | | | | |
| Class A | | Actual | | | 1.20 | % | | $ | 1,000.00 | | | $ | 1,048.30 | | | $ | 6.13 | |
| Class A | | Hypothetical | | | 1.20 | % | | $ | 1,000.00 | | | $ | 1,018.95 | | | $ | 6.04 | |
| | | | | | | | | | | | | | | | | | | |
| Class C | | Actual | | | 1.93 | % | | $ | 1,000.00 | | | $ | 1,044.50 | | | $ | 9.84 | |
| Class C | | Hypothetical | | | 1.93 | % | | $ | 1,000.00 | | | $ | 1,015.31 | | | $ | 9.70 | |
| | | | | | | | | | | | | | | | | | | |
| Class Y | | Actual | | | 0.92 | % | | $ | 1,000.00 | | | $ | 1,049.60 | | | $ | 4.70 | |
| Class Y | | Hypothetical | | | 0.92 | % | | $ | 1,000.00 | | | $ | 1,020.34 | | | $ | 4.63 | |
| | | | | | | | | | | | | | | | | | | |
| Institutional Class | | Actual | | | 0.83 | % | | $ | 1,000.00 | | | $ | 1,050.10 | | | $ | 4.24 | |
| Institutional Class | | Hypothetical | | | 0.83 | % | | $ | 1,000.00 | | | $ | 1,020.79 | | | $ | 4.18 | |
| | | | | | | | | | | | | | | | | | | |
| Touchstone Growth Opportunities Fund | | | | | | | | | | | | | | | | |
| Class A | | Actual | | | 1.24 | % | | $ | 1,000.00 | | | $ | 1,077.70 | | | $ | 6.42 | |
| Class A | | Hypothetical | | | 1.24 | % | | $ | 1,000.00 | | | $ | 1,018.75 | | | $ | 6.24 | |
| | | | | | | | | | | | | | | | | | | |
| Class C | | Actual | | | 1.99 | % | | $ | 1,000.00 | | | $ | 1,073.70 | | | $ | 10.29 | |
| Class C | | Hypothetical | | | 1.99 | % | | $ | 1,000.00 | | | $ | 1,015.01 | | | $ | 10.00 | |
| | | | | | | | | | | | | | | | | | | |
| Class Y | | Actual | | | 0.99 | % | | $ | 1,000.00 | | | $ | 1,078.90 | | | $ | 5.13 | |
| Class Y | | Hypothetical | | | 0.99 | % | | $ | 1,000.00 | | | $ | 1,020.00 | | | $ | 4.99 | |
| | | | | | | | | | | | | | | | | | | |
| Institutional Class | | Actual | | | 0.89 | % | | $ | 1,000.00 | | | $ | 1,079.30 | | | $ | 4.61 | |
| Institutional Class | | Hypothetical | | | 0.89 | % | | $ | 1,000.00 | | | $ | 1,020.49 | | | $ | 4.48 | |
| | | | | | | | | | | | | | | | | | | |
| Touchstone International Growth Fund | | | | | | | | | | | | | | | | |
| Class A | | Actual | | | 1.32 | % | | $ | 1,000.00 | | | $ | 1,037.80 | | | $ | 6.71 | |
| Class A | | Hypothetical | | | 1.32 | % | | $ | 1,000.00 | | | $ | 1,018.35 | | | $ | 6.64 | |
| | | | | | | | | | | | | | | | | | | |
| Class C | | Actual | | | 2.07 | % | | $ | 1,000.00 | | | $ | 1,034.20 | | | $ | 10.50 | |
| Class C | | Hypothetical | | | 2.07 | % | | $ | 1,000.00 | | | $ | 1,014.61 | | | $ | 10.40 | |
| | | | | | | | | | | | | | | | | | | |
| Class Y | | Actual | | | 1.07 | % | | $ | 1,000.00 | | | $ | 1,039.30 | | | $ | 5.44 | |
| Class Y | | Hypothetical | | | 1.07 | % | | $ | 1,000.00 | | | $ | 1,019.60 | | | $ | 5.39 | |
| | | | | | | | | | | | | | | | | | | |
| Institutional Class | | Actual | | | 0.97 | % | | $ | 1,000.00 | | | $ | 1,039.90 | | | $ | 4.93 | |
| Institutional Class | | Hypothetical | | | 0.97 | % | | $ | 1,000.00 | | | $ | 1,020.09 | | | $ | 4.89 | |
Other Items (Unaudited) (Continued)
| | | | | | | | | | | | | | Expenses | |
| | | | | Net Expense | | | Beginning | | | Ending | | | Paid During | |
| | | | | Ratio | | | Account | | | Account | | | the Six Months | |
| | | | | Annualized | | | Value | | | Value | | | Ended | |
| | | | | March 31, | | | October 1, | | | March 31, | | | March 31, | |
| | | | | 2018 | | | 2017 | | | 2018 | | | 2018* | |
| Touchstone International Value Fund | | | | | | | | | | | | |
| Class A | | Actual | | | 1.34 | % | | $ | 1,000.00 | | | $ | 1,031.90 | | | $ | 6.79 | |
| Class A | | Hypothetical | | | 1.34 | % | | $ | 1,000.00 | | | $ | 1,018.25 | | | $ | 6.74 | |
| | | | | | | | | | | | | | | | | | | |
| Class C | | Actual | | | 2.09 | % | | $ | 1,000.00 | | | $ | 1,028.80 | | | $ | 10.57 | |
| Class C | | Hypothetical | | | 2.09 | % | | $ | 1,000.00 | | | $ | 1,014.51 | | | $ | 10.50 | |
| | | | | | | | | | | | | | | | | | | |
| Class Y | | Actual | | | 1.09 | % | | $ | 1,000.00 | | | $ | 1,033.10 | | | $ | 5.53 | |
| Class Y | | Hypothetical | | | 1.09 | % | | $ | 1,000.00 | | | $ | 1,019.50 | | | $ | 5.49 | |
| | | | | | | | | | | | | | | | | | | |
| Institutional Class | | Actual | | | 0.99 | % | | $ | 1,000.00 | | | $ | 1,035.30 | | | $ | 5.02 | |
| Institutional Class | | Hypothetical | | | 0.99 | % | | $ | 1,000.00 | | | $ | 1,020.00 | | | $ | 4.99 | |
| | | | | | | | | | | | | | | | | | | |
| Touchstone Mid Cap Growth Fund | | | | | | | | | | | | | | | | | | |
| Class A | | Actual | | | 1.29 | % | | $ | 1,000.00 | | | $ | 1,087.40 | | | $ | 6.71 | |
| Class A | | Hypothetical | | | 1.29 | % | | $ | 1,000.00 | | | $ | 1,018.50 | | | $ | 6.49 | |
| | | | | | | | | | | | | | | | | | | |
| Class C | | Actual | | | 2.00 | % | | $ | 1,000.00 | | | $ | 1,083.60 | | | $ | 10.39 | |
| Class C | | Hypothetical | | | 2.00 | % | | $ | 1,000.00 | | | $ | 1,014.96 | | | $ | 10.05 | |
| | | | | | | | | | | | | | | | | | | |
| Class Y | | Actual | | | 1.01 | % | | $ | 1,000.00 | | | $ | 1,089.30 | | | $ | 5.26 | |
| Class Y | | Hypothetical | | | 1.01 | % | | $ | 1,000.00 | | | $ | 1,019.90 | | | $ | 5.09 | |
| | | | | | | | | | | | | | | | | | | |
| Institutional Class | | Actual | | | 0.99 | % | | $ | 1,000.00 | | | $ | 1,088.90 | | | $ | 5.16 | |
| Institutional Class | | Hypothetical | | | 0.99 | % | | $ | 1,000.00 | | | $ | 1,020.00 | | | $ | 4.99 | |
| | | | | | | | | | | | | | | | | | | |
| Touchstone Sands Capital Emerging Markets Growth Fund | | | |
| Class Y | | Actual | | | 1.45 | % | | $ | 1,000.00 | | | $ | 1,086.50 | | | $ | 7.54 | |
| Class Y | | Hypothetical | | | 1.45 | % | | $ | 1,000.00 | | | $ | 1,017.70 | | | $ | 7.29 | |
| | | | | | | | | | | | | | | | | | | |
| Institutional Class | | Actual | | | 1.35 | % | | $ | 1,000.00 | | | $ | 1,087.10 | | | $ | 7.02 | |
| Institutional Class | | Hypothetical | | | 1.35 | % | | $ | 1,000.00 | | | $ | 1,018.20 | | | $ | 6.79 | |
| | | | | | | | | | | | | | | | | | | |
| Touchstone Small Cap Growth Fund | | | | | | | | | | | | | | | | | | |
| Class A | | Actual | | | 1.44 | % | | $ | 1,000.00 | | | $ | 1,054.00 | | | $ | 7.37 | |
| Class A | | Hypothetical | | | 1.44 | % | | $ | 1,000.00 | | | $ | 1,017.75 | | | $ | 7.24 | |
| | | | | | | | | | | | | | | | | | | |
| Class C | | Actual | | | 2.19 | % | | $ | 1,000.00 | | | $ | 1,048.10 | | | $ | 11.18 | |
| Class C | | Hypothetical | | | 2.19 | % | | $ | 1,000.00 | | | $ | 1,014.01 | | | $ | 11.00 | |
| | | | | | | | | | | | | | | | | | | |
| Class Y | | Actual | | | 1.19 | % | | $ | 1,000.00 | | | $ | 1,054.70 | | | $ | 6.10 | |
| Class Y | | Hypothetical | | | 1.19 | % | | $ | 1,000.00 | | | $ | 1,019.00 | | | $ | 5.99 | |
| | | | | | | | | | | | | | | | | | | |
| Institutional Class | | Actual | | | 1.04 | % | | $ | 1,000.00 | | | $ | 1,055.80 | | | $ | 5.33 | |
| Institutional Class | | Hypothetical | | | 1.04 | % | | $ | 1,000.00 | | | $ | 1,019.75 | | | $ | 5.24 | |
Other Items (Unaudited) (Continued)
| | | | | | | | | | | | | | Expenses | |
| | | | | Net Expense | | | Beginning | | | Ending | | | Paid During | |
| | | | | Ratio | | | Account | | | Account | | | the Six Months | |
| | | | | Annualized | | | Value | | | Value | | | Ended | |
| | | | | March 31, | | | October 1, | | | March 31, | | | March 31, | |
| | | | | 2018 | | | 2017 | | | 2018 | | | 2018* | |
| Touchstone Sustainability and Impact Equity Fund | | | |
| Class A | | Actual | | | 1.17 | % | | $ | 1,000.00 | | | $ | 1,035.00 | | | $ | 5.94 | |
| Class A | | Hypothetical | | | 1.17 | % | | $ | 1,000.00 | | | $ | 1,019.10 | | | $ | 5.89 | |
| | | | | | | | | | | | | | | | | | | |
| Class C | | Actual | | | 1.99 | % | | $ | 1,000.00 | | | $ | 1,031.20 | | | $ | 10.08 | |
| Class C | | Hypothetical | | | 1.99 | % | | $ | 1,000.00 | | | $ | 1,015.01 | | | $ | 10.00 | |
| | | | | | | | | | | | | | | | | | | |
| Class Y | | Actual | | | 0.91 | % | | $ | 1,000.00 | | | $ | 1,036.70 | | | $ | 4.62 | |
| Class Y | | Hypothetical | | | 0.91 | % | | $ | 1,000.00 | | | $ | 1,020.39 | | | $ | 4.58 | |
| | | | | | | | | | | | | | | | | | | |
| Institutional Class | | Actual | | | 0.89 | % | | $ | 1,000.00 | | | $ | 1,036.70 | | | $ | 4.52 | |
| Institutional Class | | Hypothetical | | | 0.89 | % | | $ | 1,000.00 | | | $ | 1,020.49 | | | $ | 4.48 | |
* Expenses are equal to the Fund’s annualized expense ratio, multiplied by the average account value over the period, multiplied by 182/365 (to reflect one-half year period).
** Excluding dividend and interest expenses on securities sold short, your actual cost of investment in Class A, Class C, Class Y and Institutional Class would be $5.23, $8.96, $3.99 and $3.49, respectively, and your hypothetical cost of investment in Class A, Class C, ClassY and Institutional Class would be $5.29, $9.05, $4.03 and $3.53, respectively.
Advisory and Sub-Advisory Agreement Approval Disclosure
At a meeting held on November 16, 2017, the Board of Trustees (the “Board” or “Trustees”) of the Touchstone Strategic Trust (the “Trust”), and by a separate vote, the Independent Trustees of the Trust, approved the continuance of the Investment Advisory Agreement between the Trust and the Advisor with respect to each Fund of the Trust, and the continuance of the Sub-Advisory Agreement between the Advisor and each Fund’s respective Sub-Advisor.
In determining whether to approve the continuation of the Investment Advisory Agreement and the Sub-Advisory Agreements, the Advisor furnished information necessary for a majority of the Independent Trustees to make the determination that the continuance of the Investment Advisory Agreement and each Sub-Advisory Agreement was in the best interests of the respective Funds and their shareholders. The information provided to the Board included: (1) industry data comparing advisory fees and total expense ratios of comparable funds; (2) comparative performance information; (3) the Advisor’s and its affiliates’ revenues and costs of providing services to the Funds; and (4) information about the Advisor’s and Sub-Advisors’ personnel. Prior to voting, the Independent Trustees reviewed the proposed continuance of the Investment Advisory Agreement and the Sub-Advisory Agreements with management and experienced independent legal counsel and received materials from such counsel discussing the legal standards for their consideration of the proposed continuation of the Investment Advisory Agreement and each Sub-Advisory Agreement. The Independent Trustees also reviewed the proposed continuation of the Investment Advisory Agreement and each Sub-Advisory Agreement with independent legal counsel in private sessions at which no representatives of management were present.
In approving the Funds’ Investment Advisory Agreement, the Board considered various factors, among them: (1) the nature, extent and quality of services provided to the Funds, including the personnel providing such services; (2) the Advisor’s compensation and profitability; (3) a comparison of fees and performance with comparable funds; (4) economies of scale; and (5) the terms of the Investment Advisory Agreement. The Board’s analysis of these factors is set forth below. The Independent Trustees were advised by independent legal counsel throughout the process.
Other Items (Unaudited) (Continued)
Nature, Extent and Quality of Advisor Services. The Board considered the level and depth of knowledge of the Advisor, including the professional experience and qualifications of senior personnel. In evaluating the quality of services provided by the Advisor, the Board took into account its familiarity with the Advisor’s senior management through Board meetings, discussions and reports during the preceding year. The Board also took into account the Advisor’s compliance policies and procedures. The quality of administrative and other services, including the Advisor’s role in coordinating the activities of the Funds’ other service providers, was also considered. The Board also considered the Advisor’s relationship with its affiliates and the resources available to them, as well as any potential conflicts of interest.
The Board discussed the Advisor’s effectiveness in monitoring the performance of each Sub-Advisor, including the Sub-Advisor that was an affiliate of the Advisor, and the Advisor’s timeliness in responding to performance issues. The Board considered the Advisor’s process for monitoring each of the Sub-Advisors, which includes an examination of both qualitative and quantitative elements of the Sub-Advisor’s organization, personnel, procedures, investment discipline, infrastructure and performance. The Board considered that the Advisor conducts regular on-site compliance visits with each Sub-Advisor, during which the Advisor examines a wide variety of factors, such as the financial condition of the Sub-Advisor, the quality of the Sub-Advisor’s systems, the effectiveness of the Sub-Advisor’s disaster recovery programs, trade allocation and execution procedures, compliance with the Sub-Advisor’s policies and procedures, results of regulatory examinations and any other factors that might affect the quality of services that the Sub-Advisor provides to the applicable Fund(s). The Board noted that the Advisor’s compliance monitoring processes also include quarterly reviews of compliance reports, and that any issues arising from such reports and the Advisor’s compliance visits to the Sub-Advisors are reported to the Board.
The Trustees concluded that they were satisfied with the nature, extent and quality of services provided to each Fund by the Advisor under the Investment Advisory Agreement.
Advisor’s Compensation and Profitability. The Board took into consideration the financial condition and profitability of the Advisor and its affiliates (including the Sub-Advisor to one of the Funds) and the direct and indirect benefits derived by the Advisor and its affiliates from the Advisor’s relationship with the Funds. The information considered by the Board included operating profit margin information for the Advisor’s business as a whole. The Board noted that the Advisor had waived a portion of advisory fees and administrative fees and/or reimbursed expenses in order to limit each Fund’s net operating expenses. The Board also noted that the Advisor pays the Sub-Advisors’ sub-advisory fees out of the advisory fees the Advisor receives from the Funds. The Board reviewed the profitability of the Advisor’s relationship with the Funds both before and after tax expenses, and also considered whether the Advisor has the financial wherewithal to continue to provide services to the Funds, noting the ongoing commitment of the Advisor’s parent company with respect to providing support and resources as needed. The Board considered that the Funds’ distributor, an affiliate of the Advisor, receives Rule 12b-1 distribution fees from the Funds and receives a portion of the sales charges on sales or redemptions of certain classes of shares. The Board also noted that the Advisor derives benefits to its reputation and other benefits from its association with the Funds.
The Board recognized that the Advisor should be entitled to earn a reasonable level of profits in exchange for the level of services it provides to each Fund and the entrepreneurial risk that it assumes as Advisor. Based upon their review, the Trustees concluded that the Advisor’s and its affiliates’ anticipated level of profitability, if any, from their relationship with each Fund was reasonable and not excessive.
Expenses and Performance. The Board compared the respective advisory fees and total expense ratios for each of the Funds with various comparative data, including the median and average advisory fees and total expense ratios of each Fund’s respective peer group. The Board also considered, among other data, the Funds’ respective performance results during the six-month, twelve-month, and thirty-six month periods ended June 30, 2017,
Other Items (Unaudited) (Continued)
as applicable, and noted that the Board reviews on a quarterly basis detailed information about each Fund’s performance results, portfolio composition and investment strategies. The Board also took into account current market conditions and their effect on the Funds’ performance.
The Board also considered the effect of each Fund’s growth and size on its performance and expenses. The Board noted that the Advisor had waived a portion of the fees and/or reimbursed expenses of each Fund in order to reduce the Funds’ respective operating expenses to targeted levels. The Board noted that the sub-advisory fees under the Sub-Advisory Agreement with respect to each Fund were paid by the Advisor out of the advisory fees it receives from the Fund and considered the impact of such sub-advisory fees on the profitability of the Advisor. In reviewing the respective expense ratios and performance of each of the Funds, the Board also took into account the nature, extent and quality of the services provided to the Funds by the Advisor and its affiliates.
The Board considered, among other data, the specific factors and related conclusions set forth below with respect to each Fund:
Touchstone Flexible Income Fund. The Fund’s advisory fee and total expense ratio (net of applicable expense waivers and reimbursements) were above the median of its peer group. The Board noted that the Advisor was waiving a portion of the Fund’s fees and/or reimbursing a portion of the Fund’s operating expenses. The Fund’s performance for the six-month period ended June 30, 2017 was in the 2nd quintile, the Fund’s performance for the twelve-month period ended June 30, 2017 was in the 4th quintile, and the Fund’s performance for the thirty-six-month period ended June 30, 2017 was in the 1st quintile of its peer group. The Board noted management’s discussion of the Fund’s performance, particularly in light of the current market environment, and management’s continued monitoring of the Fund’s performance. Based upon their review, the Trustees concluded that the overall performance of the Fund was satisfactory relative to the performance of funds with similar investment objectives and relevant indices, and that the advisory fee was reasonable in light of the services received by the Fund from the Advisor and the other factors considered.
Touchstone Focused Fund. The Fund’s advisory fee and total expense ratio (net of applicable expense waivers and reimbursements) were at the median and above the median, respectively, of its peer group. The Board noted that the Advisor was waiving a portion of the Fund’s fees and/or reimbursing a portion of the Fund’s operating expenses. The Fund’s performance for the six- and twelve-month periods ended June 30, 2017 was in the 5th quintile of its peer group, and the Fund’s performance for the thirty-six-month period ended June 30, 2017 was in the 3rd quintile of its peer group. The Board noted management’s discussion of the Fund’s performance, particularly in light of the current market environment, and management’s continued monitoring of the Fund’s performance. Based upon their review, the Trustees concluded that the overall performance of the Fund was satisfactory relative to the performance of funds with similar investment objectives and relevant indices, and that the advisory fee was reasonable in light of the services received by the Fund from the Advisor and the other factors considered.
Touchstone Growth Opportunities Fund. The Fund’s advisory fee and total expense ratio (net of applicable expense waivers and reimbursements) were above the median of its peer group. The Board noted that the Advisor was waiving a portion of the Fund’s fees and/or reimbursing a portion of the Fund’s operating expenses. The Fund’s performance for the six- and the twelve-month periods ended June 30, 2017 was in the 2nd quintile of its peer group, and the Fund’s performance for the thirty-six-month period ended June 30, 2017 was in the 4th quintile of its peer group. The Board noted management’s discussion of the Fund’s performance and management’s continued monitoring of the Fund’s performance. Based upon their review, the Trustees concluded that the overall performance of the Fund was satisfactory relative to the performance of funds with similar investment objectives and relevant indices, and that the advisory fee was reasonable in light of the services received by the Fund from the Advisor and the other factors considered.
Other Items (Unaudited) (Continued)
Touchstone International Growth Fund. The Fund’s advisory fee and total expense ratio (net of applicable expense waivers and reimbursements) were above the median and at the median, respectively, of its peer group. The Board noted that the Advisor was waiving a portion of the Fund’s fees and/or reimbursing a portion of the Fund’s operating expenses. The Fund’s performance for the six-month period ended June 30, 2017 was in the 3rd quintile of its peer group, and the Fund’s performance for the twelve-month period ended June 30, 2017 was in the 2nd quintile of its peer group. Based upon their review, the Trustees concluded that the overall performance of the Fund was satisfactory relative to the performance of funds with similar investment objectives and relevant indices, and that the advisory fee was reasonable in light of the services received by the Fund from the Advisor and the other factors considered.
Touchstone International Value Fund. The Fund’s advisory fee and total expense ratio (net of applicable expense waivers and reimbursements) were above the median and below the median, respectively, of its peer group. The Board noted that the Advisor was waiving a portion of the Fund’s fees and/or reimbursing a portion of the Fund’s operating expenses. The Fund’s performance for the six-month period ended June 30, 2017 was in the 2nd quintile of its peer group, the Fund’s performance for the twelve-month period ended June 30, 2017 was in the 1st quintile of its peer group, and the Fund’s performance for the thirty-six-month period ended June 30, 2017 was in the 5th quintile of its peer group. The Board noted management’s discussion of the Fund’s performance, particularly in light of the current market environment, and management’s continued monitoring of the Fund’s performance. Based upon their review, theTrustees concluded that the overall performance of the Fund was satisfactory relative to the performance of funds with similar investment objectives and relevant indices, and that the advisory fee was reasonable in light of the services received by the Fund from the Advisor and the other factors considered.
Touchstone Mid Cap Growth Fund. The Fund’s advisory fee and total expense ratio (net of applicable expense waivers and reimbursements) were below the median and above the median, respectively, of its peer group. The Board noted that the Advisor was waiving a portion of the Fund’s fees and/or reimbursing a portion of the Fund’s operating expenses. The Fund’s performance for the six- and twelve-month periods ended June 30, 2017 was in the 3rd quintile of its peer group, and the Fund’s performance for the thirty-six month period ended June 30, 2017 was in the 2nd quintile of its peer group. Based upon their review, the Trustees concluded that the overall performance of the Fund was satisfactory relative to the performance of funds with similar investment objectives and relevant indices, and that the advisory fee was reasonable in light of the services received by the Fund from the Advisor and the other factors considered.
Touchstone Sands Capital Emerging Markets Growth Fund. The Fund’s advisory fee and total expense ratio (net of applicable expense waivers and reimbursements) were above the median of its peer group. The Board noted that the Advisor was waiving a portion of the Fund’s fees and/or reimbursing a portion of the Fund’s operating expenses. The Fund’s performance for the six-month period ended June 30, 2017 was in the 2nd quintile of its peer group, the Fund’s performance for the twelve-month period ended June 30, 2017 was in the 4th quintile of its peer group, and the Fund’s performance for the thirty-six-month period ended June 30, 2017 was in the 1st quintile of its peer group. The Board noted management’s discussion of the Fund’s performance, particularly in light of the current market environment, and management’s continued monitoring of the Fund’s performance. Based upon their review, the Trustees concluded that the overall performance of the Fund was satisfactory relative to the performance of funds with similar investment objectives and relevant indices, and that the advisory fee was reasonable in light of the services received by the Fund from the Advisor and the other factors considered.
Touchstone Small Cap Growth Fund. The Fund’s advisory fee and total expense ratio (net of applicable expense waivers and reimbursements) were above the median of its peer group. The Board noted that the Advisor was waiving a portion of the Fund’s fees and/or reimbursing a portion of the Fund’s operating expenses. The Fund’s
Other Items (Unaudited) (Continued)
performance for the six-, twelve- and thirty-six-month periods ended June 30, 2017 was in the 5th quintile of its peer group. The Board considered management’s discussion of the Fund’s performance and management’s continued monitoring of the Fund’s performance. Based upon their review, the Trustees concluded that the Fund’s performance was being addressed, and that the advisory fee was reasonable in light of the services received by the Fund and the other factors considered.
Touchstone Sustainability and Impact Equity Fund. The Fund’s advisory fee and total expense ratio (net of applicable expense waivers and reimbursements) were below the median and above the median, respectively, of its peer group. The Board noted that the Advisor was waiving a portion of the Fund’s fees and/or reimbursing a portion of the Fund’s operating expenses. The Fund’s performance for the six- and twelve-month periods ended June 30, 2017 was in the 2nd quintile of its peer group, and the Fund’s performance for the thirty-six-month period ended June 30, 2017 was in the 1st quintile of its peer group. Based upon their review, the Trustees concluded that the overall performance of the Fund was satisfactory relative to the performance of funds with similar investment objectives and relevant indices, and that the advisory fee was reasonable in light of the services received by the Fund from the Advisor and the other factors considered.
Economies of Scale. The Board considered the effect of each Fund’s current size and potential growth on its performance and expenses. The Board took into account management’s discussion of the Funds’ advisory fee structure. The Board considered the effective advisory fees under the Investment Advisory Agreement as a percentage of assets at different asset levels and possible economies of scale that might be realized if the assets of each Fund increase. The Board noted that the advisory fee schedule for each Fund, except the Touchstone International Value Fund and the Touchstone Sands Capital Emerging Markets Growth Fund, contains breakpoints that would reduce the respective advisory fee rate on assets above specified levels as the applicable Fund’s assets increased and considered the necessity of adding breakpoints with respect to the Funds that did not currently have such breakpoints in their advisory fee schedules. The Board determined that adding breakpoints at specified levels to the advisory fee schedule of the Touchstone International Value Fund and the Touchstone Sands Capital Emerging Markets Growth Fund would not be appropriate at this time. The Board noted that if a Fund’s assets increase over time, the Fund might realize other economies of scale if assets increase proportionally more than certain other expenses. The Board also considered the fact that, under the Investment Advisory Agreement, the advisory fee payable to the Advisor by a Fund was reduced by the total sub-advisory fee paid by the Advisor to the Fund’s Sub-Advisor.
Conclusion. In considering the renewal of the Funds’ Investment Advisory Agreement, the Board, including the Independent Trustees, did not identify any single factor as controlling, and each Trustee may have attributed different weights to the various factors. The Trustees evaluated all information available to them on a Fund-by-Fund basis, and their determinations were made separately with respect to each Fund. The Board reached the following conclusions regarding the Funds’ Investment Advisory Agreement with the Advisor, among others: (a) the Advisor demonstrated that it possesses the capability and resources to perform the duties required of it under the Investment Advisory Agreement; (b) the Advisor maintains an appropriate compliance program; (c) the overall performance of each Fund is satisfactory relative to the performance of funds with similar investment objectives and relevant indices or, as discussed above, has been or is being addressed; and (d) each Fund’s advisory fee is reasonable in light of the services received by the Fund from the Advisor and other factors considered. Based on their conclusions, the Trustees determined with respect to each Fund that continuation of the Investment Advisory Agreement was in the best interests of the Fund and its shareholders.
In approving the Funds’ respective Sub-Advisory Agreements, the Board considered various factors with respect to each Fund and the applicable Sub-Advisory Agreement, among them: (1) the nature, extent and quality of services provided to the Fund, including the personnel providing such services; (2) the Sub-Advisor’s compensation; (3) a comparison of the sub-advisory fee and performance with comparable funds; and (4) the terms of the
Other Items (Unaudited) (Continued)
Sub-Advisory Agreement. The Board’s analysis of these factors is set forth below. The Independent Trustees were advised by independent legal counsel throughout the process.
Nature, Extent and Quality of Services Provided; Investment Personnel. The Board considered information provided by the Advisor regarding the services provided by each Sub-Advisor, including information presented periodically throughout the previous year. The Board noted the affiliation of one of the Sub-Advisors with the Advisor, noting any potential conflicts of interest. The Board also noted that, on a periodic basis, the Board meets with portfolio managers of the Sub-Advisors to discuss their respective performance and investment processes and strategies. The Board considered each Sub-Advisor’s level of knowledge and investment style. The Board reviewed the experience and credentials of the applicable investment personnel who are responsible for managing the investment of portfolio securities with respect to the Funds. The Board also noted each Sub-Advisor’s brokerage practices.
Sub-Advisor’s Compensation, Profitability and Economies of Scale. The Board also took into consideration the financial condition of each Sub-Advisor and any indirect benefits derived by each Sub-Advisor and its affiliates from the Sub-Advisor’s relationship with the Funds. In considering the profitability to each Sub-Advisor of its relationship with the Funds, the Board noted the undertaking of the Advisor to maintain expense limitations for the Funds and also noted that the sub-advisory fees under the Sub-Advisory Agreements were paid by the Advisor out of the advisory fees that it receives under the Investment Advisory Agreement and in addition, with respect to the unaffiliated Sub-Advisors, are negotiated at arm’s-length. As a consequence, the profitability to each Sub-Advisor of its relationship with a Fund was not a substantial factor in the Board’s deliberations. For similar reasons, the Board did not consider the potential economies of scale in each Sub-Advisor’s management of the applicable Fund to be a substantial factor in its consideration, although the Board noted that the sub-advisory fee schedule for all but two of the Funds contained breakpoints that would reduce the sub-advisory fee rate on assets above specified levels as the applicable Fund’s assets increased.
Sub-Advisory Fees and Fund Performance. The Board considered that each Fund pays an advisory fee to the Advisor and that the Advisor pays the sub-advisory fee to the Sub-Advisor out of the advisory fee it receives from the respective Fund. The Board also compared the sub-advisory fees paid by the Advisor to fees charged by the Sub-Advisor to manage comparable institutional separate accounts. The Board considered the amount retained by the Advisor and the sub-advisory fee paid to each Sub-Advisor with respect to the various services provided by the Advisor and the Sub-Advisor. The Board also noted that the Advisor negotiated the sub-advisory fee with each of the unaffiliated Sub-Advisors at arm’s-length. The Board reviewed the sub-advisory fee for each Fund in relation to various comparative data, including the median and average sub-advisory fees of each Fund’s peer group, and considered the following information:
Touchstone Flexible Income Fund. The Fund’s sub-advisory fee was above the median of its peer group. Based upon their review, the Trustees concluded that the sub-advisory fee was reasonable in light of the services received by the Fund from the Sub-Advisor and the other factors considered.
Touchstone Focused Fund. The Fund’s sub-advisory fee was above the median of its peer group. Based upon their review, the Trustees concluded that the sub-advisory fee was reasonable in light of the services received by the Fund from the Sub-Advisor and the other factors considered.
Touchstone Growth Opportunities Fund. The Fund’s sub-advisory fee was above the median of its peer group. Based upon their review, the Trustees concluded that the sub-advisory fee was reasonable in light of the services received by the Fund from the Sub-Advisor and the other factors considered.
Touchstone International Growth Fund. The Fund’s sub-advisory fee was above the median of its peer group. Based upon their review, the Trustees concluded that the sub-advisory fee was reasonable in light of the services received by the Fund from the Sub-Advisor and the other factors considered.
Other Items (Unaudited) (Continued)
Touchstone International Value Fund. The Fund’s sub-advisory fee was above the median of its peer group. Based upon their review, the Trustees concluded that the sub-advisory fee was reasonable in light of the services received by the Fund from the Sub-Advisor and the other factors considered.
Touchstone Mid Cap Growth Fund. The Fund’s sub-advisory fee was above the median of its peer group. Based upon their review, the Trustees concluded that the sub-advisory fee was reasonable in light of the services received by the Fund from the Sub-Advisor and the other factors considered.
Touchstone Sands Capital Emerging Markets Growth Fund. The Fund’s sub-advisory fee was above the median of its peer group. Based upon their review, the Trustees concluded that the sub-advisory fee was reasonable in light of the services received by the Fund from the Sub-Advisor and the other factors considered.
Touchstone Small Cap Growth Fund. The Fund’s sub-advisory fee was above the median of its peer group. Based upon their review, the Trustees concluded that the sub-advisory fee was reasonable in light of the services received by the Fund from the Sub-Advisor and the other factors considered.
Touchstone Sustainability and Impact Equity Fund. The Fund’s sub-advisory fee was above the median of its peer group. Based upon their review, the Trustees concluded that the sub-advisory fee was reasonable in light of the services received by the Fund from the Sub-Advisor and the other factors considered.
As noted above, the Board considered each Fund’s performance during the six-month, twelve-month, and thirty-six month periods ended June 30, 2017, as applicable, as compared to each Fund’s peer group and noted that the Board reviews on a quarterly basis detailed information about each Fund’s performance results, portfolio composition and investment strategies. The Board noted the Advisor’s expertise and resources in monitoring the performance, investment style and risk-adjusted performance of each Sub-Advisor. The Board also was mindful of the Advisor’s ongoing monitoring of each Sub-Advisor’s performance and the measures undertaken by the Advisor to address any underperformance.
Conclusion. In considering the renewal of the Sub-Advisory Agreement with respect to each Fund, the Board, including the Independent Trustees, did not identify any single factor as controlling, and each Trustee may have attributed different weights to the various factors. The Board reached the following conclusions regarding each Sub-Advisory Agreement, among others: (a) the Sub-Advisor is qualified to manage each Fund’s assets in accordance with the Fund’s investment goals and policies; (b) the Sub-Advisor maintains an appropriate compliance program; (c) the overall performance of each Fund is satisfactory relative to the performance of funds with similar investment objectives and relevant indices or, as discussed above, has been or is being addressed; (d) each Fund’s sub-advisory fees are reasonable in light of the services received by the Fund from the Sub-Advisor and the other factors considered; and (e) the Sub-Advisor’s investment strategies are appropriate for pursuing the investment goals of each Fund. Based on its conclusions, the Board determined that approval of the Sub-Advisory Agreement with respect to each Fund was in the best interests of the Fund and its shareholders.
Management of the Trust (Unaudited)
Listed below is required information regarding the Trustees and principal officers of the Trust. The Trust’s Statement of Additional Information includes additional information about the Trustees and is available, without charge, upon request by calling 1.800.543.0407 or by visiting the Touchstone website at TouchstoneInvestments.com.
| Interested Trustee1: | | | | | | | | | | |
| | | | | | | | | Number | | |
| | | | | | | | | of Funds | | |
| | | | | | | | | Overseen | | |
| | | | | Term of | | | | in the | | |
| Name | | Position | | Office And | | | | Touchstone | | Other |
| Address | | Held with | | Length of | | Principal Occupation(s) | | Fund | | Directorships |
| Year of Birth | | Trust | | Time Served | | During Past 5 Years | | Complex2 | | Held During the Past 5 Years3 |
Jill T. McGruder
Touchstone Advisors, Inc.
303 Broadway
Suite 1100
Cincinnati, Ohio 45202
Year of Birth: 1955 | | Trustee and President | | Until retirement at age 75 or until she resigns or is removed Trustee since 1999 | | President and CEO of IFS Financial Services, Inc. (a holding company). | | 49 | | IFS Financial Services, Inc. (a holding company) from 1999 to the present; Integrity and National Integrity Life Insurance Co. from 2005 to the present; Touchstone Securities (the Trust’s distributor) from 1999 to the present; Touchstone Advisors, Inc. (the Trust’s investment advisor and administrator) from 1999 to the present; W&S Brokerage Services (a brokerage company) from 1999 to the present; W&S Financial Group Distributors (a distribution company) from 1999 to the present; Cincinnati Analysts, Inc. from 2012 to the present; Columbus Life Insurance Co. from 2016 to the present; The Lafayette Life Insurance Co. from 2016 to the present; Taft Museum of Art from 2007 to the present; YWCA of Greater Cincinnati from 2012 to the present; and LL Global, Inc. from 2016 to the present. |
| Independent Trustees: | | | | | | | | | | |
Phillip R. Cox
c/o Touchstone Advisors, Inc.
303 Broadway
Suite 1100
Cincinnati, Ohio 45202
Year of Birth: 1947 | | Trustee | | Until retirement at age 75 or until he resigns or is removed Trustee since 1999 | | President and Chief Executive Officer of Cox Financial Corp. (a financial services company) from 1971 to the present. | | 49 | | Director of Cincinnati Bell (a communications company) from 1994 to the present; Bethesda Inc. (a hospital) from 2005 to the present; Timken Co. (a manufacturing company) from 2004 to 2014; TimkenSteel from 2014 to the present; Diebold, Inc. (a technology solutions company) from 2004 to the present; and Ohio Business Alliance for Higher Education and the Economy from 2005 to the present. |
William C. Gale
c/o Touchstone Advisors, Inc.
303 Broadway
Suite 1100
Cincinnati, Ohio 45202
Year of Birth: 1952 | | Trustee | | Until retirement at age 75 or until he resigns or is removed Trustee since 2013 | | Retired; formerly Senior Vice President and Chief Financial Officer (from 2003 to January 2015) of Cintas Corporation (a business services company). | | 49 | | None. |
Management of the Trust (Unaudited) (Continued)
| Independent Trustees (Continued): | | |
| | | | | | | | | Number | | |
| | | | | | | | | of Funds | | |
| | | | | | | | | Overseen | | |
| | | | | Term of | | | | in the | | |
| Name | | Position | | Office And | | | | Touchstone | | Other |
| Address | | Held with | | Length of | | Principal Occupation(s) | | Fund | | Directorships |
| Age | | Trust | | Time Served | | During Past 5 Years | | Complex2 | | Held During the Past 5 Years3 |
Susan J. Hickenlooper
c/o Touchstone Advisors, Inc.
303 Broadway
Suite 1100
Cincinnati, Ohio 45202
Year of Birth: 1946 | | Trustee | | Until retirement at age 75 or until she resigns or is removed Trustee since 2009 | | Retired; formerly Financial Analyst for Impact 100 (charitable organization) from November 2012 to 2013. | | 49 | | Trustee of Diocese of Southern Ohio from 2014 to the present; and Trustee of Cincinnati Parks Foundation from 2000 to 2016. |
Kevin A. Robie
c/o Touchstone Advisors, Inc.
303 Broadway
Suite 1100
Cincinnati, Ohio 45202
Year of Birth: 1956 | | Trustee | | Until retirement at age 75 or until he resigns or is removed Trustee since 2013 | | Vice President of Portfolio Management at Soin International LLC (a multinational holding company) from 2004 to the present. | | 49 | | SaverSystems, Inc. from 2015 to the present; Director of Buckeye EcoCare, Inc. (a lawn care company) from 2013 to the present; Trustee of Dayton Region New Market Fund, LLC (a private fund) from 2010 to the present; and Trustee of the Entrepreneurs Center, Inc. (a small business incubator) from 2006 to the present. |
Edward J. VonderBrink
c/o Touchstone Advisors, Inc.
303 Broadway
Suite 1100
Cincinnati, Ohio 45202
Year of Birth: 1944 | | Trustee | | Until retirement at age 75 or until he resigns or is removed Trustee since 2013 | | Consultant, VonderBrink Consulting LLC from 2000 to the present. | | 49 | | Director of Streamline Health Solutions, Inc. (healthcare IT) from 2006 to 2015; Mercy Health from 2013 to the present; Mercy Health Foundation (healthcare nonprofit) from 2008 to the present; Al Neyer Inc. (a construction company) from 2013 to the present; and BASCO Shower Door from 2011 to the present. |
| 1 | Ms. McGruder, as a director of the Advisor and the Trust's Distributor, and an officer of affiliates of the Advisor and the Distributor, is an “interested person” of the Trust within the meaning of Section 2(a) (19) of the 1940 Act. |
| 2 | As of March 31, 2018, the Touchstone Fund Complex consists of 25 series of the Trust, 13 series of Touchstone Funds Group Trust, 1 series of Touchstone Institutional Funds Trust, and 10 variable annuity series of Touchstone Variable Series Trust. |
| 3 | Each Trustee is also a Trustee of Touchstone Funds Group Trust, Touchstone Institutional Funds Trust, and Touchstone Variable Series Trust. |
Management of the Trust (Unaudited) (Continued)
| Principal Officers: | | | | | | |
| | | | | Term of | | |
| Name | | Position(s) | | Office And | | |
| Address | | Held with | | Length of | | Principal Occupation(s) |
| Year of Birth | | Trust1 | | Time Served | | During the Past 5 Years |
Jill T. McGruder
Touchstone Advisors, Inc.
303 Broadway
Suite 1100
Cincinnati, Ohio 45202
Year of Birth: 1955 | | President and Trustee | | Until resignation, removal or disqualification President since 2006 | | See biography above. |
Steven M. Graziano
Touchstone Advisors, Inc.
303 Broadway
Suite 1100
Cincinnati, Ohio 45202
Year of Birth: 1954 | | Vice President | | Until resignation, removal or disqualification Vice President since 2009 | | President of Touchstone Advisors, Inc. |
Timothy D. Paulin
Touchstone Advisors, Inc.
303 Broadway
Suite 1100
Cincinnati, Ohio 45202
Year of Birth: 1963 | | Vice President | | Until resignation, removal or disqualification Vice President since 2010 | | Senior Vice President of Investment Research and Product Management of Touchstone Advisors, Inc. |
Timothy S. Stearns
Touchstone Advisors, Inc.
303 Broadway
Suite 1100
Cincinnati, Ohio 45202
Year of Birth: 1963 | | Chief Compliance Officer | | Until resignation, removal or disqualification Chief Compliance Officer since 2013 | | Chief Compliance Officer of Touchstone Advisors, Inc.; Chief Compliance Officer of Envestnet Asset Management, Inc. (2009 to 2013). |
Terrie A. Wiedenheft
Touchstone Advisors, Inc.
303 Broadway
Suite 1100
Cincinnati, Ohio 45202
Year of Birth: 1962 | | Controller and Treasurer | | Until resignation, removal or disqualification Controller and Treasurer since 2006 | | Senior Vice President, Chief Financial Officer and Chief Operations Officer of IFS Financial Services, Inc. (a holding company). |
Ellen Blanchard
The Bank of New York
Mellon
201 Washington Street,
13th Floor
Boston, Massachusetts 02108
Year of Birth: 1973 | | Secretary | | Until resignation, removal or disqualification Secretary since 2015 | | Director of The Bank of New York Mellon. |
| 1 | Each officer also holds the same office with Touchstone Funds Group Trust, Touchstone Institutional Funds Trust, and Touchstone Variable Series Trust. |
This page intentionally left blank.
PRIVACY PROTECTION POLICY
We Respect Your Privacy
Thank you for your decision to invest with us. Touchstone and its affiliates have always placed a high value on the trust and confidence our clients place in us. We believe that confidence must be earned and validated through time. In today’s world, when technology allows the sharing of information at light speeds, trust must be reinforced by our sincere pledge to take the steps necessary to ensure that the information you share with us is treated with respect and confidentiality.
Our Pledge to Our Clients
| • | We collect only the information we need to service your account and administer our business. |
| • | We are committed to keeping your information confidential and we place strict limits and controls on the use and sharing of your information. |
| • | We make every effort to ensure the accuracy of your information. |
We Collect the Following Nonpublic Personal Information About You:
| • | Information we receive from you on or in applications or other forms, correspondence, or conversations, including, but not limited to, your name, address, phone number, social security number, assets, income and date of birth; and |
| • | Information about your transactions with us, our affiliates, or others, including, but not limited to, your account number and balance, payment history, parties to transactions, cost basis information, and other financial information. |
Categories of Information We Disclose and Parties to Whom We Disclose
We do not disclose any nonpublic personal information about our current or former clients to nonaffiliated third parties, except as required or permitted by law.
We Place Strict Limits and Controls on the Use and Sharing of Your Information
| • | We restrict access to nonpublic personal information about you to authorized employees who need the information to administer your business. |
| • | We maintain physical, electronic and procedural safeguards that comply with federal standards to protect this information. |
| • | We do not disclose any nonpublic personal information about our current or former clients to anyone, except as required or permitted by law or as described in this document. |
| • | We will not sell your personal information to anyone. |
We May Provide Information to Service Your Account
Sometimes it is necessary to provide information about you to various companies such as transfer agents, custodians, broker-dealers and marketing service firms to facilitate the servicing of your account. These organizations have a legitimate business need to see some of your personal information in order for us to provide service to you. We may disclose to these various companies the information that we collect as described above. We require that these companies, including our own subsidiaries and affiliates, strictly maintain the confidentiality of this information and abide by all applicable laws. Companies within our corporate family that may receive this information are financial service providers and insurance companies. We do not permit these associated companies to sell the information for their own purposes, and we never sell our customer information.
This policy is applicable to the following affiliated companies: Touchstone Funds Group Trust, Touchstone Strategic Trust, Touchstone Variable Series Trust, Touchstone Institutional Funds Trust, Touchstone Securities, Inc.,* and W&S Brokerage Services, Inc.
* Touchstone Securities, Inc. serves as the underwriter to the Touchstone Funds.
A Member of Western & Southern Financial Group®
The Privacy Protection Policy is not part of the Annual Report.


Touchstone Investments
Distributor
Touchstone Securities, Inc.*
303 Broadway
Cincinnati, Ohio 45202-4203
800.638.8194
www.touchstoneinvestments.com
Investment Advisor
Touchstone Advisors, Inc.*
303 Broadway
Cincinnati, Ohio 45202-4203
Transfer Agent
BNY Mellon Investment Servicing (US) Inc.
4400 Computer Drive
Westborough, Massachusetts 01581
Shareholder Service
800.543.0407
* A Member of Western & Southern Financial Group
TSF-54-TST-AR-1803
Item 2. Code of Ethics.
| (a) | The registrant, as of the end of the period covered by this report, has adopted a code of ethics that applies to the registrant’s principal executive officer, principal financial officer, principal accounting officer or controller, or persons performing similar functions, regardless of whether these individuals are employed by the registrant or a third party. |
| (c) | There have been no amendments, during the period covered by this report, to a provision of the code of ethics that applies to the registrant’s principal executive officer, principal financial officer, principal accounting officer or controller, or persons performing similar functions, regardless of whether these individuals are employed by the registrant or a third party, and that relates to any element of the code of ethics description. |
| (d) | The registrant has not granted any waivers, including an implicit waiver, from a provision of the code of ethics that applies to the registrant’s principal executive officer, principal financial officer, principal accounting officer or controller, or persons performing similar functions, regardless of whether these individuals are employed by the registrant or a third party, that relates to one or more of the items set forth in paragraph (b) of this item’s instructions. |
Item 3. Audit Committee Financial Expert.
The registrant’s Board of Trustees has determined that the registrant has at least one audit committee financial expert serving on its audit committee. Mr. William Gale is the registrant’s audit committee financial expert and is an independent trustee within the meaning of the Investment Company Act of 1940, as amended (the “1940 Act”).
Item 4. Principal Accountant Fees and Services.
Audit Fees
| (a) | Audit fees for Touchstone Strategic Trust (March Funds) totaled $161,600 and $151,500 for the fiscal years ended March 31, 2018 and 2017, respectively, including fees associated with the annual audits and filings of Form N-1A and Form N-SAR. |
Audit-Related Fees
| (b) | The aggregate fees billed in each of the last two fiscal years for assurance and related services by the principal accountant that are reasonably related to the performance of the audit of the registrant's financial statements and are not reported under paragraph (a) of this Item are $11,525 and $7,273 for the fiscal years ended March 31, 2018 and March 31, 2017, respectively. The fees for 2018 relate to consent filings for N-14s. The fees for 2017 relate to additional audit procedures. |
Tax Fees
| (c) | The Fees for tax compliance services totaled $78,983 and $59,315 for the fiscal years ended March 31, 2018 and 2017, respectively. The fees relate to the preparation of federal income and excise tax returns, review of capital gains distribution calculations and out of scope tax services. |
All Other Fees
| (d) | The aggregate fees billed for products and services provided by the principal accountant, other than the services reported in paragraphs (a) through (c) of this Item are $38,914 and $32,347 for the fiscal years ended March 31, 2018 and 2017, respectively. The fees relate to the PFIC Analyzer and Global Withholding Tax Reporter subscriptions. |
| (e)(1) | Disclose the audit committee's pre-approval policies and procedures described in paragraph (c)(7) of Rule 2-01 of Regulation S-X. |
The Audit Committee’s pre-approval policies describe the types of audit, audit-related, tax and other services that have the general pre-approval of the Audit Committee. The pre-approval policies provide that annual audit service fees, tax services not specifically granted pre-approval, services exceeding pre-approved cost levels and other services that have not received general pre-approval will be subject to specific pre-approval by the Audit Committee. The pre-approval policies further provide that the Committee may grant general pre-approval to other audit services (statutory audits and services associated with SEC registration statements, periodic reports and other documents filed with the SEC or other documents issued in connection with securities offerings), audit-related services (accounting consultations related to accounting, financial reporting or disclosure matters not classified as “audit services,” assistance with understanding and implementing new accounting and financial reporting guidance from rulemaking authorities, agreed-upon or expanded audit procedures related to accounting and/or billing records required to respond to or comply with financial, accounting or regulatory reporting matters and assistance with internal control reporting requirements under Form N-SAR and Form N-CSR), tax services that have historically been provided by the auditor that the Committee believes would not impair the independence of the auditor and are consistent with the SEC’s rules on auditor independence and permissible non-audit services classified as “all other services” that are routine and recurring services.
| (e)(2) | All services described in paragraphs (c) through (d) of Item 4 were approved by the Audit Committee. |
| (f) | The percentage of hours expended on the principal accountant's engagement to audit the registrant's financial statements for the most recent fiscal year that were attributed to work performed by persons other than the principal accountant's full-time, permanent employees was less than fifty percent. |
| (g) | The aggregate non-audit fees for Touchstone Strategic Trust (March Funds) and certain entities*, totaled approximately $129,422 and $98,935 for the fiscal years ended March 31, 2018 and 2017, respectively. |
| * | These include the advisors (excluding sub-advisors) and any entity controlling, controlled by or under common control with the advisors that provides ongoing services to the registrant (Funds). |
| (h) | The registrant's audit committee of the board of trustees has considered whether the provision of non-audit services that were rendered to the registrant's investment adviser (not including any sub-adviser whose role is primarily portfolio management and is subcontracted with or overseen by another investment adviser), and any entity controlling, controlled by, or under common control with the investment adviser that provides ongoing services to the registrant that were not pre-approved pursuant to paragraph (c)(7)(ii) of Rule 2-01 of Regulation S-X is compatible with maintaining the principal accountant's independence. |
Item 5. Audit Committee of Listed Registrants.
Not applicable.
Item 6. Investments.
| (a) | Schedule of Investments in securities of unaffiliated issuers as of the close of the reporting period is included as part of the report to shareholders filed under Item 1 of this form. |
Item 7. Disclosure of Proxy Voting Policies and Procedures for Closed-End Management Investment Companies.
Not applicable.
Item 8. Portfolio Managers of Closed-End Management Investment Companies.
Not applicable.
Item 9. Purchases of Equity Securities by Closed-End Management Investment Company and Affiliated Purchasers.
Not applicable.
Item 10. Submission of Matters to a Vote of Security Holders.
There have been no material changes to the procedures by which the shareholders may recommend nominees to the registrant’s board of trustees, where those changes were implemented after the registrant last provided disclosure in response to the requirements of Item 407(c)(2)(iv) of Regulation S-K (17 CFR 229.407) (as required by Item 22(b)(15) of Schedule 14A (17 CFR 240.14a-101)), or this Item.
Item 11. Controls and Procedures.
| (a) | The registrant’s principal executive and principal financial officers, or persons performing similar functions, have concluded that the registrant’s disclosure controls and procedures (as defined in Rule 30a-3(c) under the Investment Company Act of 1940, as amended (the “1940 Act”) (17 CFR 270.30a-3(c))) are effective, as of a date within 90 days of the filing date of the report that includes the disclosure required by this paragraph, based on their evaluation of these controls and procedures required by Rule 30a-3(b) under the 1940 Act (17 CFR 270.30a-3(b)) and Rules 13a-15(b) or 15d-15(b) under the Securities Exchange Act of 1934, as amended (17 CFR 240.13a-15(b) or 240.15d-15(b)). |
| (b) | There were no changes in the registrant’s internal control over financial reporting (as defined in Rule 30a-3(d) under the 1940 Act (17 CFR 270.30a-3(d))) that occurred during the registrant’s last fiscal quarter that has materially affected, or is reasonably likely to materially affect, the registrant’s internal control over financial reporting. |
Item 12. Disclosure of Securities Lending Activities for Closed-End Management Investment Companies.
Not applicable.
Item 13. Exhibits.
| | (a)(1) | Code of ethics, or any amendment thereto, that is the subject of disclosure required by Item 2 is attached hereto. |
| | | |
| | (a)(2) | Certifications pursuant to Rule 30a-2(a) under the 1940 Act and Section 302 of the Sarbanes-Oxley Act of 2002 are attached hereto. |
| | | |
| | (a)(3) | Not applicable. |
| | | |
| | (a)(4) | Not applicable. |
| | | |
| | (b) | Certifications pursuant to Rule 30a-2(b) under the 1940 Act and Section 906 of the Sarbanes- Oxley Act of 2002 are attached hereto. |
SIGNATURES
Pursuant to the requirements of the Securities Exchange Act of 1934 and the Investment Company Act of 1940, the registrant has duly caused this report to be signed on its behalf by the undersigned, thereunto duly authorized.
(Registrant) Touchstone Strategic Trust
By (Signature and Title)* /s/ Jill T. McGruder
Jill T. McGruder, President
(principal executive officer)
Date May 25, 2018
Pursuant to the requirements of the Securities Exchange Act of 1934 and the Investment Company Act of 1940, this report has been signed below by the following persons on behalf of the registrant and in the capacities and on the dates indicated.
By (Signature and Title)* /s/ Jill T. McGruder
Jill T. McGruder, President
(principal executive officer)
Date May 25, 2018
By (Signature and Title)* /s/ Terrie A. Wiedenheft
Terrie A. Wiedenheft, Controller and Treasurer
(principal financial officer)
Date May 25, 2018
* Print the name and title of each signing officer under his or her signature.