UNITED STATES
SECURITIES AND EXCHANGE COMMISSION
Washington, D.C. 20549
FORM N-CSR
CERTIFIED SHAREHOLDER REPORT OF REGISTERED MANAGEMENT INVESTMENT COMPANIES
Investment Company Act file number 811-03651
Touchstone Strategic Trust – June Funds
(Exact name of registrant as specified in charter)
303 Broadway, Suite 1100
Cincinnati, Ohio 45202-4203
(Address of principal executive offices) (Zip code)
Jill T. McGruder
303 Broadway, Suite 1100
Cincinnati, Ohio 45202-4203
(Name and address of agent for service)
Registrant's telephone number, including area code: 800-638-8194
Date of fiscal year end: June 30
Date of reporting period: June 30, 2017
Form N-CSR is to be used by management investment companies to file reports with the Commission not later than 10 days after the transmission to stockholders of any report that is required to be transmitted to stockholders under Rule 30e-1 under the Investment Company Act of 1940 (17 CFR 270.30e-1). The Commission may use the information provided on Form N-CSR in its regulatory, disclosure review, inspection, and policymaking roles.
A registrant is required to disclose the information specified by Form N-CSR, and the Commission will make this information public. A registrant is not required to respond to the collection of information contained in Form N-CSR unless the Form displays a currently valid Office of Management and Budget ("OMB") control number. Please direct comments concerning the accuracy of the information collection burden estimate and any suggestions for reducing the burden to Secretary, Securities and Exchange Commission, 450 Fifth Street, NW, Washington, DC 20549-0609. The OMB has reviewed this collection of information under the clearance requirements of 44 U.S.C. § 3507.
Item 1. Reports to Stockholders.
The Report to Shareholders is attached herewith.
June 30, 2017
Annual Report
Touchstone Strategic Trust
Touchstone Credit Opportunities Fund
Touchstone Global Growth Fund
Touchstone International Small Cap Fund
Touchstone Large Cap Fund
Touchstone Large Company Growth Fund
Touchstone Ohio Tax-Free Bond Fund
Touchstone Small Cap Value Opportunities Fund
Touchstone Value Fund

Table of Contents
This report identifies the Funds' investments on June 30, 2017. These holdings are subject to change. Not all investments in each Fund performed the same, nor is there any guarantee that these investments will perform as well in the future. Market forecasts provided in this report may not occur.
Letter from the President
Dear Shareholder:
We are pleased to provide you with the Touchstone Strategic Trust Annual Report. Inside you will find key financial information, as well as manager commentaries for the Funds, for the 12 months ended June 30, 2017.
Capital markets were dominated by political headlines against a backdrop of broadly positive, albeit muted, economic data. The beginning of the fiscal year followed immediately after Britain’s June 2016 vote to exit the European Union (i.e., “Brexit”) roiled financial markets. The initial market volatility gave way to calm as Brexit related concerns faded and investors refocused attention on the improving economic environment and resumed the market rally that had been underway since early 2016. The U.S. elections in November brought the possibility of growth-enhancing fiscal policies and regulatory changes, igniting investor optimism worldwide. Emmanuel Macron’s victory in the June 2017 French Presidential election was widely viewed as positive for European economic growth and stability. U.S. economic data continued to show steady improvement in employment while inflation remained constrained, allowing the U.S. Federal Reserve Board (Fed) to advance its objective of normalizing monetary policy. The Fed increased its target for the Federal Funds Rate three times for a total of three-quarters of a percent over the period.
Global equity markets posted strong results during the period with most major U.S. and non-U.S. indexes generating double-digit returns. Emerging markets equities were the top performers followed by developed non-U.S. and U.S. equities. Chinese stocks led emerging markets as economic optimism in Asia coupled with stability in commodities prices fueled demand for equities in developing economies. Developed stock markets posted strong absolute returns as well, powered by solid performance in the German and French equity markets. Within the U.S. equity markets, small-cap value stocks were the best performing group, yet large- and mid-cap growth stocks outperformed their value counterparts.
While the Fed ramped up its drive toward normalizing U.S. monetary policy, other developed market central banks maintained their monetary stimulus programs. The short-term rate hikes caused the U.S. Treasury yield curve to rise as the bellwether 10-year Treasury yield increased by approximately eight-tenths of a percentage point during the period. The upward move in Treasury yields led to negative returns for U.S. Treasury debt securities. Similarly, non-U.S. government debt securities produced mostly negative returns for the period. Conversely, improvements in the U.S. economy contributed to tightening credit spreads. Non-investment grade outperformed investment grade corporate bonds during a year of positive returns across the corporate quality spectrum.
After a year of strong returns across many asset classes, we believe that now is a good time to evaluate your financial situation. The counsel of a financial advisor can help determine an appropriate risk/return profile, prudent portfolio allocation decisions and the right path to addressing your long-term investment goals.
We greatly appreciate your continued support. Thank you for including Touchstone as part of your investment plan.
Sincerely,

Jill T. McGruder
President
Touchstone Strategic Trust
Management's Discussion of Fund Performance (Unaudited)
Touchstone Credit Opportunities Fund
Sub-Advised by Ares Capital Management II LLC
Investment Philosophy
The Touchstone Credit Opportunities Fund employs a flexible investment approach by allocating assets among core investments and opportunistic investments as market conditions change. It invests in several broad investment categories, including high yield bonds, bank loans, special situations, structured credit and hedges.
Fund Performance
The Touchstone Credit Opportunities Fund (Class A Shares) outperformed its benchmark, the BofA Merrill Lynch 3-Month U.S. Treasury Bill Index, for the 12-month period ended June 30, 2017. The Fund’s total return was 9.08 percent (calculated excluding the maximum sales charge) while the total return of the benchmark was 0.49 percent.
Market Environment
Following the dislocation in the credit markets through the end of 2015 and the start of 2016, the 12-month period ended June 30, 2017 was characterized by improved fundamentals and favorable technical conditions, thus broadly driving investor appetite for risk assets. In particular, energy and commodity sectors rallied as crude prices rebounded and stabilized globally. Despite mixed economic results in the third quarter of 2016, U.S. corporations reported the first instance of earnings expansion in the fourth quarter of 2016 after seven consecutive quarters of declines. This growth trajectory extended into the first quarter of 2017 and projections remain positive for further earnings expansion in the second half of 2017. Continued technical demand for risk assets globally amidst historically low sovereign yields abroad augmented returns in the credit markets throughout the second half of 2016 and the first half of 2017. Moreover, a surprise victory for President Trump ushered in the phenomenon known as the “Trump Trade,” which has bolstered equities to all-time highs with the expectation of renewed pro-business policies. Equities, as measured by the S&P 500® Index, have risen in the trailing twelve months. Alongside this reflationary momentum, the U.S. Federal Reserve Board (Fed) hiked rates in December of 2016, and followed suit with an additional two hikes in March and June of 2017. Regardless of periodic highs in the 10-year Treasury yield, the result has largely been a flattening of the yield curve due to a combination of the front-end shifting up with increases in the federal funds rate and less of a yield increase on the long-end.
Portfolio Review
Over the last twelve months, with the rally in non-investment grade credit continuing unabated, we increased our positioning to high yield bonds, as well as lower rated assets. In addition, despite interest rate hikes by the Fed, the flattening of the yield curve buoyed fixed income investments and reinforced our positioning in these assets. Consequently, the high yield bond portion of the Fund has been the largest contributor to performance. Aided by strong technical demand for floating rate assets from the retail market, as well as healthy collateralized loan obligations (CLO) issuance, the leveraged loan segment of the portfolio positively contributed as well.
Outlook
The latter half of 2017 presents a multitude of different risks. A primary concern remains the potential for the Fed to tighten monetary policy at an unexpectedly swift pace. This threat exists both in the form of additional rate hikes or the delicate unwinding of the Fed’s massive $4.5 trillion balance sheet. Additionally, amidst an improving fundamental backdrop, the European Central Bank (ECB) faces mounting pressure to end quantitative easing. The resulting rise in European sovereign rates could remove the yield arbitrage between the U.S. and the rest of the world and prompt a reversal in technical flows. Volatility in energy and further gluts of crude
Management's Discussion of Fund Performance (Unaudited) (Continued)
oil supply pose additional risks to the market environment. However, we maintain the position that crude oil prices will remain stable going forward. Nonetheless, we feel that the Fund is defensively positioned and we view bouts of market volatility as opportunities to source new securities at attractive prices.
Management's Discussion of Fund Performance (Unaudited) (Continued)
Comparison of the Change in Value of a $10,000 Investment in the Touchstone Credit Opportunities Fund - Class A* and the BofA Merrill Lynch 3-Month U.S. Treasury Bill Index
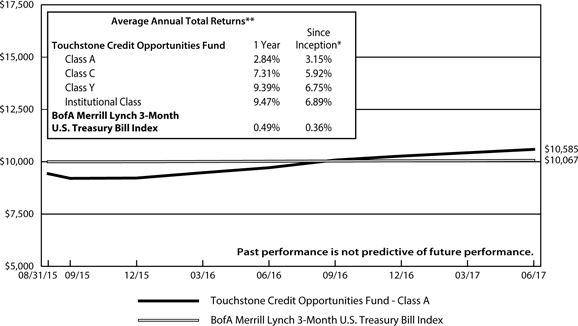
| * | The chart above represents performance of Class A shares only, which will vary from the performance of Class C shares, Class Y shares and Institutional Class shares based on the differences in sales loads and fees paid by shareholders in the different classes. The inception date of the Fund was August 31, 2015. The returns of the index listed above are based on the inception date of the Fund. |
| ** | The average annual total returns shown above are adjusted for maximum sales loads and fees, if applicable. The maximum offering price per share of Class A shares is equal to the net asset value (“NAV”) per share plus a sales load equal to 6.10% of the NAV (or 5.75% of the offering price). Class C shares are subject to a contingent deferred sales charge (“CDSC”) of 1.00%. The CDSC will be assessed on an amount equal to the lesser of (1) the NAV at the time of purchase of the shares being redeemed or (2) the NAV of such shares being redeemed, if redeemed within a one-year period from the date of purchase. Class Y shares and Institutional Class shares are not subject to sales charges. |
The performance of the above Fund does not reflect the deduction of taxes that a shareholder would pay on Fund distributions or the redemption of Fund shares.
Note to Chart
BofA Merrill Lynch 3-Month U.S. Treasury Bill Index is an unmanaged index of Treasury securities maturing in 90 days that assumes reinvestment of all income.
Management's Discussion of Fund Performance (Unaudited)
Touchstone Global Growth Fund
Sub-Advised by DSM Capital Partners LLC
Investment Philosophy
The Touchstone Global Growth Fund seeks long-term capital appreciation by primarily investing in equity securities of large capitalization companies believed to offer the best opportunity for reliable growth at attractive stock valuations. The Fund utilizes a bottom-up idea-driven growth style with a distinct valuation discipline. It seeks to identify companies which are believed to exhibit certain quality characteristics, including: predictable growth, solid fundamentals, attractive profitability and successful management.
Fund Performance
The Touchstone Global Growth Fund (Institutional Class shares) outperformed its benchmark, the MSCI All Country World Index, for the 12-month period ended June 30, 2017. The Fund’s total return was 29.63 percent, while the benchmark’s total return was 18.78 percent.
Market Environment
At the start of the 12-month period ended June 30, 2017, interest rates reached 75-year lows due to fears of global recession and concerns about a deflationary environment. During the period, yield-oriented stocks increased due to investors’ thirst for income. Additional factors that impacted the markets included a rebound in oil prices, slowing growth in the Chinese economy and the path of the U.S. Federal Reserve Board’s (Fed) interest rate hikes. After PresidentTrump’s election last November, the markets reflected a reflation theme where interest rates and inflation expectations moved higher, and industrial and commodity-related companies experienced gains. This market behavior lasted through the end of calendar year 2016, but during 2017, the market became more balanced as equities rewarded demonstrated fundamental strength. While the legislative agenda has been delayed early in his term, ultimately we believe President Trump’s focus on economic growth driven by tax cuts, capital repatriation and reduced regulations remains bullish for both the economy and the equity markets.
Portfolio Review
During the 12-month period ended June 30, 2017, the Touchstone Global Growth Fund outperformed its benchmark, the MSCI All Country World Index. This outperformance was primarily due to stock selection and the Fund’s overweight to the Information Technology sector, which was one of the best performing sectors during the period. Additionally, stock picking within the Consumer Discretionary (e.g., Royal Caribbean Cruises Ltd., Anta Sports Products Ltd., The Priceline Group Inc.) and Information Technology (e.g., Alibaba Group Holding Ltd., Tencent Holdings Ltd., and ARM Holdings PLC) sectors were strong contributors to relative performance. The Fund’s underweight to the Energy sector also benefited performance. The Health Care sector was one area of weakness for the Fund. Its overweight to the Health Care sector detracted most from performance.
There were no meaningful changes made to the Fund’s positioning during the 12-month period. The majority of the portfolio was invested in companies in the Information Technology, Consumer Discretionary, Health Care and Financials sectors with smaller weights in the Consumer Staples, Industrials and Utilities sectors.
The holdings which contributed most to the Fund’s performance during the period were Alibaba Group Holding Ltd., a Chinese e-commerce company (Information Technology sector), Tencent Holdings Ltd., an instant messaging and electronic gaming company (Information Technology sector), Royal Caribbean Cruises Ltd., a global cruise operator (Consumer Discretionary sector), Adobe Systems Inc., an application software development company and Facebook Inc., a social networking website (both Information Technology sector).
Management's Discussion of Fund Performance (Unaudited) (Continued)
Among the detractors to the Fund’s performance during the period were Dollar General Corp., a U.S. discount store chain operator (Consumer Discretionary sector), Shire PLC, a specialty pharmaceuticals company and Bristol-Myers Squibb Co., an American pharmaceuticals company (both Health Care sector), Monster Beverage Corp.,energy drinks and alternative beverages (Consumer Staples sector) and Allergan PLC, a specialty pharmaceuticals company (Health Care sector).
Outlook
DSM Capital Partners continues to expect an extended, slow-growth global economic cycle driven by low inflation and low interest rates. Our multi-year outlook of stable 3 percent global growth remains unchanged and we continue to believe that this will be a longer, albeit slower, global growth cycle than most of the previous growth periods. We have not altered our long-standing opinion that global equity markets will work their way higher amid a backdrop of modest growth in developed world economies, low inflation (and thus low interest rates) and reasonable valuations. In our view, if President Trump moves forward with pro-growth tax reform and reducing regulatory restrictions, U.S. economic growth may improve, generating further gains in the equity markets. Given the low levels of inflation currently observed, many Fed watchers believe just one additional rate hike is likely in 2017. However, with unemployment low, we believe more rapid wage inflation may force the Fed to raise interest rates faster than expected.
Globally, the economic outlook for both Europe and China has improved somewhat, and we believe the possibility of a financial dislocation in the Chinese financial system is becoming less likely. The Chinese government and the People’s Bank of China continue to utilize ever-expanding and well-enforced financial regulations to reduce financial risk throughout the economy. These include tighter controls on real estate lending and speculation, increased focus on local government borrowing and efforts to reduce the risks inherent to inefficient, “zombie” firms, in some cases through continued debt-for-equity swaps. Already these initiatives have reduced systematic financial risk and led to a more stable yuan. The economic outlook in Europe has improved, although growth remains subdued by historical comparison. The European Central Bank (ECB) remains focused on using price stability as the critical variable to reduce excess liquidity in the system. The eurozone economy is growing and unemployment is falling, but underlying inflation is not rising because wage growth has yet to pick up. Once it does, we believe that the ECB would likely consider reducing its monetary stimulus.
The Fund remains focused on businesses, which are subject to continuous analysis by our investment team. The Fund’s holdings remain characterized by strong balance sheets and strong free-cash-flow, and we continue to project a mid- to high-teens earnings growth rate through 2020. It is worth noting that the Fund’s portfolio estimated price-to-earnings (P/E) on forward twelve-month earnings through June of 2018 is roughly equivalent to the long-term average P/E of the S&P 500® Index, during low inflation periods. In our view, the valuation of the Fund’s portfolio remains attractive.
Management's Discussion of Fund Performance (Unaudited) (Continued)
Comparison of the Change in Value of a $10,000 Investment in the Touchstone Global Growth Fund - Class A* and MSCI All Country World Index, Net
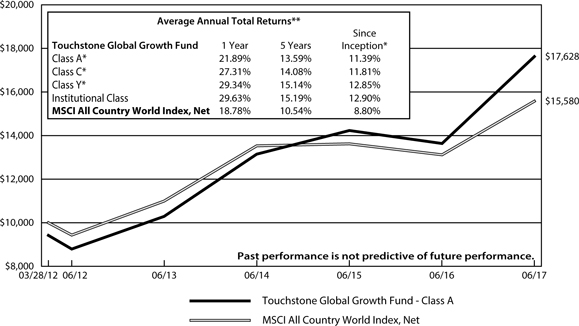
| * | The chart above represents performance of Class A shares only, which will vary from the performance of Class C shares, Class Y shares and Institutional Class shares based on the differences in sales loads and fees paid by shareholders in the different classes. The inception date of Class A shares, Class C shares, Class Y shares and Institutional Class shares was August 15, 2016, August 15, 2016, August 15, 2016 and March 28, 2012, respectively. Class A shares, Class C shares and Class Y shares performance information was calculated using the historical performance of Institutional Class shares for periods prior to August 15, 2016. The returns have been restated for sales loads and fees applicable to Class A, Class C and Class Y shares. The returns of the index listed above are based on the inception date of the Fund. |
| ** | The average annual total returns shown above are adjusted for maximum sales loads and fees, if applicable. The maximum offering price per share of Class A shares is equal to the net asset value (“NAV”) per share plus a sales load equal to 6.10% of the NAV (or 5.75% of the offering price). Class C shares are subject to a contingent deferred sales charge (“CDSC”) of 1.00%. The CDSC will be assessed on an amount equal to the lesser of (1) the NAV at the time of purchase of the shares being redeemed or (2) the NAV of such shares being redeemed, if redeemed within a one-year period from the date of purchase. Class Y shares and Institutional Class shares are not subject to sales charges. |
The performance of the above Fund does not reflect the deduction of taxes that a shareholder would pay on Fund distributions or the redemption of Fund shares.
Notes to Chart
MSCI All Country World Index, Net measures the equity market performance of developed and emerging markets.
MSCI makes no express or implied warranties or representations and shall have no liability whatsoever with respect to any MSCI data contained herein. The MSCI data may not be further redistributed or used to create indices or financial products. This report is not approved or produced by MSCI.
Management's Discussion of Fund Performance (Unaudited)
Touchstone International Small Cap Fund
Sub-Advised by Copper Rock Capital Partners LLC
Investment Philosophy
TheTouchstone International Small Cap Fund seeks capital appreciation by primarily investing in equity securities of non-U.S. small-cap companies diversified across sectors and industries. The Fund’s investment process seeks to add value through bottom-up stock selection and in-depth fundamental research and searches for companies believed to have strong management, superior earnings growth prospects and attractive relative valuations.
Fund Performance
TheTouchstone International Small Cap Fund (Class A Shares) underperformed its benchmark, the S&P Developed Ex-U.S. Small Cap Index for the 12-month period ended June 30, 2017. The Fund’s total return was 13.13 percent (calculated excluding the maximum sales charge) while the total return of the benchmark was 21.83 percent.
Market Environment
Overall, global stock market performance was exceptionally broad and strong during the trailing 12-month period. Within the U.S., investors’ expectations of a more positive economic climate immediately followed the U.S. presidential election in November 2016. In general, investors were hopeful the new administration would increase economic growth, lower regulatory burdens and reduce corporate tax rates. However, investors’ euphoria faded as politicians failed to reach an agreement on healthcare restructuring and there was a lack of movement on the new administration’s platform initiatives surrounding infrastructure. Globally, investors began to witness signs of positive, albeit slow, economic growth. In general, the economic backdrop improved as major central banks maintained accommodative monetary policies and economic data strengthened.
Portfolio Review
Regionally, stock selection within Japan, Continental Europe and the U.K. detracted from relative returns. From a sector standpoint, stock selection within the Health Care and Utilities sectors contributed the most to Fund performance.
However, overall stock selection was negative across most other sectors including the Industrials sector, which detracted the most, and the Financials sector, where individual stocks election was overshadowed by the outperformance of lower quality stocks in the latter half of 2016.
Among the individual stocks that contributed to performance during the period were Ipsen SA (Health Care sector), Interpump Group SpA (Industrials sector) and Cembra Money Bank AG (Financials sector). Ipsen, a France-based pharmaceutical manufacturer, moved higher after reporting strong quarterly and full-year data that were ahead of expectations. Ipsen also benefited from strong results from its tumor treatment drug, Somatuline®, and from two newer cancer treatment drugs which are expected to provide revenue growth going forward. Ipsen also presented new data for these drugs at the annual American Society of Clinical Oncology in early June 2017 which raised awareness of the company’s promising oncology pipeline. Finally, the possibility of long-term revenue growth within the company’s Consumer Health division was bolstered by the early actions of a recently hired CEO who has significantly increased mergers and acquisitions activity. We exited the Fund’s position toward the end of the fiscal period due to market capitalization restraints. Interpump Group, an Italy-based manufacturer of piston pumps and hydraulic products, outperformed as a result of Europe’s improving industrial economy and the company’s excellent execution on its acquisition strategies. Further, the company maintained a global leadership position in very-high and ultra-high pressure pumps. Interpump has a broad offering of solutions for hydraulic and motion control products within the commercial vehicle, aerospace and general
Management's Discussion of Fund Performance (Unaudited) (Continued)
industrial markets. Cembra Money Bank, a Switzerland-based financial services provider, announced that its 2016 data came in better than expected. The company’s acquisition of SWISSBILLING, an accounts receivable management company, is also expected to provide growth opportunities for Cembra going forward.
Among the individual stocks that detracted from Fund performance were Pantheon Resources PLC, Raging River Exploration Inc. (both from the Energy sector), SalMar ASA and Bakkafrost (both from the Consumer Staples sector). Pantheon Resources is a U.K.-based independent oil and gas exploration company. The company experienced a string of operational difficulties that have steadily weighed on the stock and there is uncertainty surrounding the company in the near term. We exited the Fund’s position in lieu of other opportunities. Raging River Exploration, a Canada-based oil and gas producer, underperformed as the market began to focus on the possibility President Trump would enact a border tax that would negatively impact Canadian energy producers. More important, the resurgence of U.S. shale producers prompted a sharp rebound in lower cost production, which pressured the somewhat higher cost Canadian oil and gas importers. We exited the Fund’s position. SalMar and Bakkafrost are Norway-based salmon producers. Both stocks had a meaningful negative impact on the Fund during the fiscal year. Factors that drove some of the negative performance for each stock included a disease in the Chilean farming region, and some early harvesting of salmon stock that led to excess supply coupled with depressed global pricing. We exited the Fund’s position in each company.
Outlook
Potential shifts in monetary policy, and public policy in some regions, are reasons for concern among investors. For example, the European Central Bank is in the early phase of ending its quantitative easing (QE) program, the Bank of England is facing the dilemma of protecting the British pound while maintaining economic stimulus through the Brexit process and the Bank of Japan must protect the value of the bonds on its balance sheet even at the expense of strengthening the yen. While any resulting shifts may be supportive of overall equity performance, there will likely be increased volatility in individual stocks as new trends come into focus. While the unwinding of QE is likely to produce a slow but steady increase in long-term interest rates over time, we believe the process of raising interest rates can be positive. The process could increase credit availability to small and medium-sized businesses and also improve sentiment from consumers, particularly in Europe and Japan where negative rates have dampened consumer activity.
Going forward, we believe the Fund is positioned to take advantage of consumers’ appetite for healthier snacks and beverages, as well as pre-packaged, convenience food options. The Fund is also positioned to seek to take advantage of global expansion into emerging markets and remained overweight to the Consumer Staples sector. However, until there is more concerted demand and spending behavior from the consumer, with a challenging retail environment and auto sales generally flat, the Fund remains underweight in the Consumer Discretionary sector. The Fund ended the quarter with an overweight to the Information Technology sector as we believe there are attractive opportunities throughout the globe, particularly in the software and services and semiconductor equipment space. The Fund was initially overweight the Health Care sector, but the Fund exited some stocks due to strong performance and ended the period underweight relative to the benchmark.
Management's Discussion of Fund Performance (Unaudited) (Continued)
Comparison of the Change in Value of a $10,000 Investment in the Touchstone International Small Cap Fund - Class A* and the S&P Developed Ex-U.S. Small Cap Index
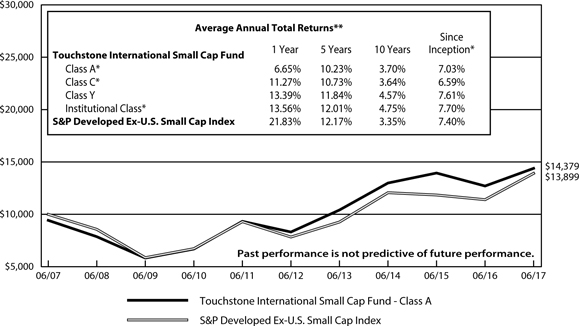
| * | The chart above represents performance of Class A shares only, which will vary from the performance of Class C shares, Class Y shares and Institutional Class shares based on the differences in sales loads and fees paid by shareholders in the different classes. The inception date of Class A shares, Class C shares, Class Y shares and Institutional Class shares was July 31, 2003, April 12, 2012, December 31, 1996 and December 20, 2006, respectively. Class A shares, Class C shares and Institutional Class shares performance was calculated using the historical performance of Class Y shares for the periods prior to July 31, 2003, April 12, 2012 and December 20, 2006, respectively. The returns have been restated for sales loads and fees applicable to Class A, Class C and Institutional Class shares. The returns of the index listed above are based on the inception date of the Fund. |
| ** | The average annual total returns shown above are adjusted for maximum sales loads and fees, if applicable. The maximum offering price per share of Class A shares is equal to the net asset value (“NAV”) per share plus a sales load equal to 6.10% of the NAV (or 5.75% of the offering price). Class C shares are subject to a contingent deferred sales charge (“CDSC”) of 1.00%. The CDSC will be assessed on an amount equal to the lesser of (1) the NAV at the time of purchase of the shares being redeemed or (2) the NAV of such shares being redeemed, if redeemed within a one-year period from the date of purchase. Class Y shares and Institutional Class shares are not subject to sales charges. |
The performance of the above Fund does not reflect the deduction of taxes that a shareholder would pay on Fund distributions or the redemption of Fund shares.
Note to Chart
S&P Developed Ex-U.S. Small Cap Index is an unmanaged index of small-cap stocks from developed countries, excluding the United States.
Management's Discussion of Fund Performance (Unaudited)
Touchstone Large Cap Fund
Sub-Advised by The London Company
Investment Philosophy
The Touchstone Large Cap Fund seeks long-term capital growth by investing primarily in common stocks of large-cap U.S. listed companies. The Fund seeks to purchase financially stable large-cap companies that the sub-advisor believes are consistently generating high returns on unleveraged operating capital, run by shareholder-oriented management, and trading at a discount to the company’s respective private market values.
Fund Performance
The Touchstone Large Cap Fund (Class A Shares) underperformed its benchmark, the Russell 1000® Index, for the 12-month period ended June 30, 2017. The Fund’s total return was 14.82 percent (excluding the maximum sales charge) while the benchmark’s total return was 18.03 percent.
Market Environment
For the trailing twelve months ended June 30, 2017, the overall market posted strong performance. The first half of the period was dominated by the U.S. presidential election and the impact a Trump administration may have on fiscal policy. Many of the sectors that were among the strongest performers following the election have since rolled over. The stocks that have performed well in 2017 were mostly strong growers with good visibility. Investors have paid a premium for stability in stocks, and stocks that were viewed as more isolated from online competitive threats have experienced multiple expansion.
Economic developments were mostly muted but positive, and generally progressed with few surprises. Gross domestic product (GDP) growth remained low but showed positive signs during the last four quarters. The U.S. Federal Reserve Board (Fed) raised short-term interest rates during the period but inflation remained low and the yield curve flattened.
During the period, the benchmark was led by the Financials and Information Technology sectors, while the Energy and Telecommunication Services sectors lagged. Growth stocks outperformed value stocks and cyclical stocks outperformed defensive stocks.
Portfolio Review
The Fund’s sector allocation contributed to relative returns during the period, while stock selection detracted. From a sector perspective, the Fund’s overweight to the Financials sector and underweight to the Energy sector had a positive impact on relative performance. This was partially offset by the negative impact of an overweight to the Consumer Staples sector and underweight to the Information Technology sector.
Among the individual stocks that contributed to Fund performance during the period were Carnival Corp. (Consumer Discretionary sector), Progressive Corp. (Financials sector), General Dynamics Corp., Deere & Co. and Norfolk Southern Corp. (all three from the Industrials sector). Carnival, a cruise ship operator, rallied as results continued to point toward stronger demand due to new ships, attractions and destinations. The company also experienced strong bookings at higher price points and an increase in customer onboard spending which have led to higher returns. Progressive, an insurance provider, continued to exhibit premium growth along with profitable underwriting results and interest rate increases. Progressive also posted improved top-line growth in its personal auto and property business. In particular, growth in the agency’s personal auto business outpaced the industry and its conservative underwriting philosophy has held up well. General Dynamics, an aerospace and defense company, outperformed after reporting better than expected quarters and raising guidance. The company also benefited from solid sales and improving margins. Investors had been concerned about the company’s
Management's Discussion of Fund Performance (Unaudited) (Continued)
Gulfstream business but it has stabilized and the overall backlog has steadied as well. Further, General Dynamics increased its earnings per share through opportunistic share buybacks. Deere, a manufacturer of agricultural, construction and forest machinery, rallied after posting better than expected quarterly earnings and management issued higher guidance for the rest of 2017. Further, demand has improved for the company’s agriculture as well as construction and forestry markets. Norfolk Southern, a low-cost provider of freight transportation, moved higher as the company continued to post solid volume growth and higher revenue per carload. Its operating expenses as a percentage of revenue continued to decline which led to higher margins.
Among the stocks that detracted from Fund performance were Bristol-Myers Squibb Co. (Health Care sector), Edgewell Personal Care Inc. (Consumer Staples sector), DollarTree Inc., Lowe’s Cos. Inc. and O’Reilly Automotive Inc. (all three from the Consumer Discretionary sector). Bristol-Myers continued to face headwinds after it faced poor trial results in a flagship drug. The company declined further after its guidance for 2017 was lowered and competitor Merck & Co. Inc. gained more traction with the combination of its Keytruda® drug plus chemotherapy. That said, we believe Bristol-Myers still has a strong pipeline and significant cash flow. Dollar Tree, a chain of discount variety stores, declined as the integration of Family Dollar Stores, while progressing, has taken longer than expected. News of Amazon.com Inc.’s agreement to acquire Whole Foods Market Inc. also pressured the overall retail sector as investors considered how Amazon’s presence might impact future competition. We remain attracted to DollarTree’s ongoing margin improvement as well as its high free-cash-flow yield and reasonable valuation. Lowe’s, a home improvement retailer, ended the period relatively flat after reporting two solid quarters and two quarters that were softer than expected due to weak quarterly sales. Most recently, Lowe’s reported same-store sales that were below consensus and also below results at its competitor Home Depot Inc. Cold and wet weather, primarily in March, and promotional activity were the main reasons for sales weakness. Looking ahead, we believe the home improvement market should remain attractive based on solid housing fundamentals and improving consumer income. Edgewell Personal Care, a consumer products company, was negatively impacted by a strong competitive environment. In particular, The Procter & Gamble Co. reduced prices on its Gillette brand to regain market share and Unilever recently acquired Dollar Shave Club. Edgewell also faced negative pressure from foreign currency conversions, which further weighed on the stock. O’Reilly Automotive, an auto parts retailer, lagged expectations due to a variety of reasons during the period, including weather and delayed tax refunds. O’Reilly also posted four consecutive quarters in which same-store sales missed management’s guidance. Furthermore, the threat of Amazon taking share in the do-it-yourself retail business added further pressure during the most recent quarter. Conversely, the company has benefited from a solid increase in the average size of individual credit card sales.
During the period, the Fund sold its positions in Mosaic Inc. (Materials sector), General Electric Inc. (Industrials sector) and Edgewell Personal Care Inc. (Consumer Staples sector). Mosaic was sold after the company hit the Fund’s soft stop loss. With regard to General Electric and Edgewell, confidence waned in each company’s ability to provide suitable downside protection for the Fund. Further, the transition at General Electric has taken longer than expected and new competition from online razor competitors threatened the long-term viability at Edgewell.
The Fund initiated positions in NIKE Inc. (Consumer Discretionary sector), Southwest Airlines Co. (Industrials sector), Alphabet Inc. (Information Technology sector) and Alexion Pharmaceuticals Inc. (Health Care sector). NIKE is a market share leader in the large and growing markets for sports apparel and shoes. Its competitive advantage stems from its leading brand and culture of innovation, which has led to pricing power as well as improving margins and returns. While the stock is not cheap, we believe its downside is limited due to the strength of the brand, stability of the business and solid balance sheet. Southwest Airlines is the largest U.S. carrier to offer a point-to-point network, which allows the company to avoid more congested hubs and increase airplane utilization. Return on capital has improved significantly in recent years reflecting consolidation in the industry, network optimization and lower fuel prices. We believe the more consolidated industry is a long-term
Management's Discussion of Fund Performance (Unaudited) (Continued)
positive for pricing and should lead to higher returns on capital. The company’s balance sheet is also strong with a net cash position. We believe the stock trades at an attractive discount to its intrinsic value, assuming conservative growth. Insider purchases from multiple executives late last year also gave us greater conviction in our entry price. The purchase of Alphabet, or Google as many people know it, reflects our optimism surrounding the company’s competitive advantages and leading market share in its Search, Maps, Ads, YouTube, Android and Chrome divisions. The company generates attractive returns on capital and maintains a strong balance sheet. The stock is not cheap by traditional valuation metrics, but we believe the company’s competitive advantages will persist while its cash flow generation and balance sheet may limit potential downside. Alexion Pharmaceuticals Inc. is a biopharmaceutical company focusing on serving patients with ultra-rare disorders through the development and commercialization of life-transforming therapeutic products. We believe Alexion’s focus on ultra-rare diseases should insulate the company from recent industry concerns over drug pricing. Legislatures generally view the Orphan Drug Act as necessary to promote research and development as well as investment into rare diseases that would be otherwise overlooked. Given that the drugs are lifesaving, Alexion can also make a strong argument that their drugs meet the value-based pricing criteria. Company management also expects growth to come from volume gains with new indications of its drug Soliris. Recent management additions and significant insider purchases provided further confidence in the stock.
Outlook
Market volatility has been low and investors have been anxious to see what impact the new administration’s policies will have on the market. We expect volatility to rise as details emerge on these policies, which will likely decrease equity valuations and benefit active managers as companies are reevaluated based on company-specific fundamentals. A solid economy, low inflation, and relatively low interest rates usually create a positive environment for stocks. We believe this holds true today, but there are risks. We believe potential risks include relatively high valuations for stocks using traditional metrics, rising inflation, excessive government stimulus, or the Fed taking a more aggressive stance. We believe the risks and rewards are somewhat balanced as they relate to stocks overall, but we remain cautious and focused on limiting downside in the Fund’s holdings.
Going forward, we believe the attractive candidates we are vetting today are a result of what the market is providing, and is consistent with our general outlook. Specifically, we believe the Fund’s downside risk can be mitigated by remaining focused on those companies with pricing power, copious cash generation and prudent capital allocation. We seek companies with strong returns on capital and flexibility to enhance shareholder value using the balance sheet. Further, global growth remains tepid but margins and returns on capital are stable and attractive. Looking ahead, we believe the Fund is positioned well for a slow growth environment that rewards strong capital allocation.
Management's Discussion of Fund Performance (Unaudited) (Continued)
Comparison of the Change in Value of a $10,000 Investment in the Touchstone Large Cap Fund - Class A* and the Russell 1000® Index
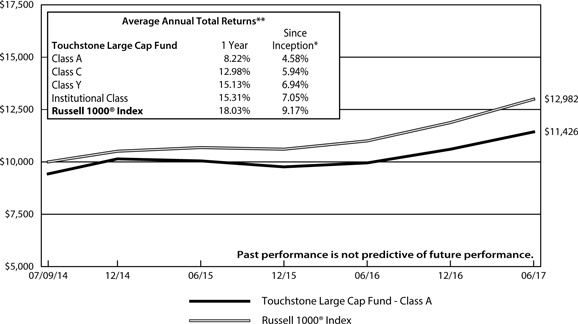
| * | The chart above represents performance of Class A shares only, which will vary from the performance of Class C shares, Class Y shares and Institutional Class shares based on the differences in sales loads and fees paid by shareholders in the different classes. The inception date of the Fund was July 9, 2014. The returns of the index listed above are based on the inception date of the Fund. |
| ** | The average annual total returns shown above are adjusted for maximum sales loads and fees, if applicable. The maximum offering price per share of Class A shares is equal to the net asset value (“NAV”) per share plus a sales load equal to 6.10% of the NAV (or 5.75% of the offering price). Class C shares are subject to a contingent deferred sales charge (“CDSC”) of 1.00%. The CDSC will be assessed on an amount equal to the lesser of (1) the NAV at the time of purchase of the shares being redeemed or (2) the NAV of such shares being redeemed, if redeemed within a one-year period from the date of purchase. Class Y shares and Institutional Class shares are not subject to sales charges. |
The performance of the above Fund does not reflect the deduction of taxes that a shareholder would pay on Fund distributions or the redemption of Fund shares.
Note to Chart
Russell 1000® Index measures the performance of the 1,000 largest companies in the Russell 3000® Index.
The Frank Russell Company (FRC) is the source and owner of the data contained or reflected in this material and all trademarks and copyrights related thereto. The material may contain confidential information and unauthorized use, disclosure, copying, dissemination or redistribution is strictly prohibited. This is a Touchstone Investments presentation of the data, and FRC is not responsible for the formatting or configuration of this material or for any inaccuracy in the presentation thereof.
Management's Discussion of Fund Performance (Unaudited)
Touchstone Large Company Growth Fund
Sub-Advised by DSM Capital Partners LLC
Investment Philosophy
The Touchstone Large Company Growth Fund seeks long-term capital appreciation by primarily investing in U.S. equity securities of large capitalization companies believed to offer the best opportunity for reliable growth at attractive stock valuations. The Fund utilizes a bottom-up idea-driven growth style with a distinct valuation discipline. It seeks to identify companies which are believed to exhibit certain quality characteristics, including: predictable growth, solid fundamentals, attractive profitability and successful management.
Fund Performance
The Touchstone Large Company Growth Fund (Institutional Class shares) outperformed its benchmark, the Russell 1000® Growth Index, for the 12-month period ended June 30, 2017. The Fund’s total return was 26.67 percent, while the total return of the benchmark was 20.42 percent.
Market Environment
At the start of the 12-month period ended June 30, 2017, interest rates reached 75-year lows due to fears of global recession and concerns about a deflationary environment. During the period, yield-oriented stocks increased due to investors’ thirst for income. Additional factors that impacted the markets included a rebound in oil prices, slowing growth in the Chinese economy and the path of the U.S. Federal Reserve Board’s (Fed) interest rate hikes. After President Trump’s election last November, the markets reflected a reflation theme where interest rates and inflation expectations moved higher, and industrial and commodity-related companies experienced gains. This market behavior lasted through the end of calendar year 2016, but during 2017, the market became more balanced as equities rewarded demonstrated fundamental strength. While the legislative agenda has been delayed early in his term, ultimately we believe President Trump’s focus on economic growth driven by tax cuts, capital repatriation and reduced regulations remains bullish for both the economy and the equity markets.
Portfolio Review
During the 12-month period ended June 30, 2017, the Fund outperformed its benchmark, the Russell 1000® Growth Index. This outperformance was primarily due to stock selection and the Fund’s overweight to the Information Technology sector, the best performing sector during the period. Stock picking was particularly strong in the Consumer Discretionary (e.g., Royal Caribbean Cruises Ltd., The Priceline Group Inc.) and Information Technology (e.g., Alibaba Group Holdings Ltd., Tencent Holdings Ltd.) sectors. Underweight positions in lower growth sectors such as Consumer Staples, Real Estate and Telecommunication Services all positively contributed to the Fund’s relative performance versus the benchmark. The Health Care sector was one area of weakness during the period, where an overweight position and poor stock selection detracted from relative returns.
There were no meaningful changes made to the Fund’s positioning during the 12-month period. The majority of the Fund’s portfolio was invested in companies in the Information Technology, Health Care and Consumer Discretionary sectors with smaller weights in the Financials, Consumer Staples and Industrials sectors.
The holdings which contributed most to the Fund’s performance during the period were Alibaba Group Holding Ltd., a Chinese e-commerce company (Information Technology sector), Tencent Holdings Ltd., an instant messaging and electronic gaming company (Information Technology sector), Royal Caribbean Cruises Ltd., a global cruise operator (Consumer Discretionary sector), Adobe Systems Inc., an application software development company and Facebook Inc., a social networking website (both Information Technology sector).
Management's Discussion of Fund Performance (Unaudited) (Continued)
Among the detractors to the Fund’s performance during the period were Dollar General Corp., a U.S. discount store chain operator (Consumer Discretionary sector), Shire PLC, a specialty pharmaceuticals company and Bristol-Myers Squibb Co., an American pharmaceuticals company (both Health Care sector), Monster Beverage Corp., energy drinks and alternative beverages (Consumer Staples sector) and Allergan PLC, a specialty pharmaceuticals company (Health Care sector).
Outlook
DSM Capital Partners continues to expect an extended, slow-growth global economic cycle driven by low inflation and low interest rates. Our multi-year outlook of stable 3 percent global growth remains unchanged and we continue to believe that this will be a longer, albeit slower, global growth cycle than most of the previous growth periods. We have not altered our long-standing opinion that global equity markets will work their way higher amid a backdrop of modest growth in developed world economies, low inflation (and thus low interest rates) and reasonable valuations. In our view, if President Trump moves forward with pro-growth tax reform and reducing regulatory restrictions, U.S. economic growth may improve, generating further gains in the equity markets. Given the low levels of inflation currently observed, many Fed watchers believe just one additional rate hike is likely in 2017. However, with unemployment low, we believe more rapid wage inflation may force the Fed to raise interest rates faster than expected.
Globally, the economic outlook for both Europe and China has improved somewhat, and we believe the possibility of a financial dislocation in the Chinese financial system is becoming less likely. The Chinese government and the People’s Bank of China continue to utilize ever-expanding and well-enforced financial regulations to reduce financial risk throughout the economy. These include tighter controls on real estate lending and speculation, increased focus on local government borrowing and efforts to reduce the risks inherent to inefficient “zombie” firms, in some cases through continued debt-for-equity swaps. Already these initiatives have reduced systematic financial risk and led to a more stable yuan. The economic outlook in Europe has improved, although growth remains subdued by historical comparison. The European Central Bank (ECB) remains focused on using price stability as the critical variable to reduce excess liquidity in the system. The eurozone economy is growing and unemployment is falling, but underlying inflation is not rising because wage growth has yet to pick up. Once it does, we believe that the ECB would likely consider reducing its monetary stimulus.
The Fund remains focused on businesses, which are subject to continuous analysis by our investment team. The Fund’s portfolio holdings remain characterized by strong balance sheets and strong free-cash-flow, and we continue to project a mid- to high-teens earnings growth rate through 2020. It is worth noting that the Fund’s estimated price-to-earnings (P/E) on forward twelve-month earnings through June of 2018 is roughly equivalent to the long-term average P/E of the S&P 500® Index, during low inflation periods. In our view, the valuation of the Fund’s portfolio remains attractive.
Management's Discussion of Fund Performance (Unaudited) (Continued)
Comparison of the Change in Value of a $10,000 Investment in the Touchstone Large Company Growth Fund- Class A*, the Russell 1000® Growth Index and the S&P 500® Index
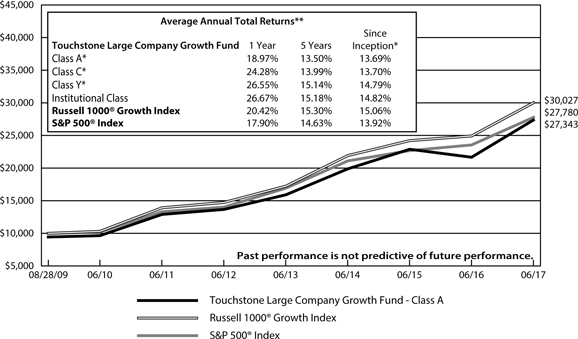
| * | The chart above represents performance of Class A shares only, which will vary from the performance of Class C shares, Class Y shares and Institutional Class shares based on the differences in sales loads and fees paid by shareholders in the different classes. The inception date of Class A shares, Class C shares, Class Y shares and Institutional Class shares was August 15, 2016, August 15, 2016, August 15, 2016 and August 28, 2009, respectively. Class A shares, Class C shares and Class Y shares performance information was calculated using the historical performance of Institutional Class shares for periods prior to August 15, 2016. The returns have been restated for sales loads and fees applicable to Class A, Class C and Class Y shares. The returns of the indexes listed above are based on the inception date of the Fund. |
| ** | The average annual total returns shown above are adjusted for maximum sales loads and fees, if applicable. The maximum offering price per share of Class A shares is equal to the net asset value (“NAV”) per share plus a sales load equal to 6.10% of the NAV (or 5.75% of the offering price). Class C shares are subject to a contingent deferred sales charge (“CDSC”) of 1.00%. The CDSC will be assessed on an amount equal to the lesser of (1) the NAV at the time of purchase of the shares being redeemed or (2) the NAV of such shares being redeemed, if redeemed within a one-year period from the date of purchase. Class Y shares and Institutional Class shares are not subject to sales charges. |
The performance of the above Fund does not reflect the deduction of taxes that a shareholder would pay on Fund distributions or the redemption of Fund shares.
Note to Chart
Russell 1000® Growth Index measures the performance of those Russell 1000 companies with higher price-to-book ratios and higher forecasted growth values.
The Frank Russell Company (FRC) is the source and owner of the data contained or reflected in this material and all trademarks and copyrights related thereto. The material may contain confidential information and unauthorized use, disclosure, copying, dissemination or redistribution is strictly prohibited. This is a Touchstone Investments presentation of the data, and FRC is not responsible for the formatting or configuration of this material or for any inaccuracy in the presentation thereof.
S&P 500® Index is a group of 500 widely held stocks and is commonly regarded to be representative of the large capitalization stock universe.
Management's Discussion of Fund Performance (Unaudited)
Touchstone Ohio Tax-Free Bond Fund
Sub-Advised by Fort Washington Investment Advisors, Inc.
Investment Philosophy
The Touchstone Ohio Tax-Free Bond Fund seeks the highest level of interest income exempt from federal income and Ohio personal income taxes, consistent with the protection of capital. It invests primarily in high-quality, long-term Ohio municipal obligations.
Fund Performance
TheTouchstone OhioTax-Free Bond Fund (Class A Shares) underperformed its benchmark, the Barclays Municipal Bond Index, for the 12-month period ended June 30, 2017. The Fund’s total return was -1.03 percent (calculated excluding the maximum sales charge) while the total return of the benchmark was -0.49 percent.
Market Environment
The U.S. domestic economy showed modest growth during the fiscal year. In addition, U.S. employment growth was steady and the unemployment rate declined by the end of the fiscal year. Despite solid employment growth, wage inflation remained controlled. Broader measures of inflation increased but were below the U.S. Federal Reserve Board’s (Fed) long-term goal of 2 percent. Global growth remained subdued but showed signs of improvement, especially in Europe where the central bank suggested it may begin to taper purchases of government and corporate bonds under its quantitative easing (QE) program later this year.
The Fed continued to adjust its monetary policy and raised interest rates on three occasions during the fiscal year, once in 2016 and twice in 2017. The latest interest rate increase occurred in June 2017 which coincided with the Fed’s announcement that it plans to begin reducing its holdings of U.S. Treasury and agency mortgage-backed securities.
Interest rates spiked following the U.S. presidential election in November, as markets were hopeful that the new administration’s policies would have a positive impact on economic conditions. At the end of the period, however, few policies had surfaced and the chance for meaningful tax reform seemed to be fading. Investor skepticism and weaker growth during the first quarter of 2017 caused interest rates to decline from their peak following the election. For the fiscal year, yields on 10- and 30-year U.S. Treasuries increased. The municipal market followed the lead of U.S. Treasuries for much of the year as yields moved higher in response to the positive tone set following the election. As 2017 began, however, the new-issue calendar began to slow while investor demand remained quite strong.This helped municipal bonds rally significantly, thereby pushing municipal valuations higher relative to U.S. Treasuries. The rally in the market impacted short-term maturities (where direct investors were most comfortable buying) as well as the long end of the yield curve (where many mutual funds are buyers). For the fiscal year, high-quality municipal bond yields increased on 10- and 30-year maturities.
Portfolio Review
In managing the Fund, we put greater emphasis on high-quality Ohio municipal bonds in the 15- to 20-year maturity range, where we feel the market offers the best combination of tax-free yield and total return. We believe this strategy can help the Fund maintain a shorter duration and reduce volatility associated with longer term bonds. During the fiscal year, the short end of the municipal yield curve (out to the seven-year maturity range) outperformed as direct buyers of municipal bonds bought bonds within this maturity range to avoid the volatility in a rising rate environment. Conversely, the Fund’s portfolio, which is more centered in the 15-to 20-year maturity range, was more negatively impacted by rising interest rates.
Management's Discussion of Fund Performance (Unaudited) (Continued)
The Fund maintained overweight positions in the Health Care sector and in Education bonds, which were slight detractors from performance. Within the Health Care sector, investors grew concerned that the repeal of the Affordable Care Act by Congress would reduce revenues for not-for-profit hospitals, which are active issuers in the municipal market. While it is premature to determine the impact on the sector, we remained confident in the Fund’s health care holdings during the period.
Outlook
The Fed has announced plans to reduce the size of its balance sheet and is expected to begin unwinding its QE program later this year. The process will involve allowing bonds to mature or be sold to reduce the Fed’s holdings of Treasury and mortgage-backed securities. There are concerns that the market has underestimated the impact of these actions which could lead to a more severe selloff in the bond market; however, the Fed raised interest rates three times during the period with minimal impact on the markets. That said, the markets are in uncharted waters with regard to reversing QE and it is possible that there could be some disruption in the markets, similar to what was experienced during the “taper tantrum” in 2013.
Bonds within the municipal market remain strong and we believe positive economic growth should benefit municipal revenues. Market participants have also seemed to ignore many of the factors that could have a negative impact on performance, including problem issues such as Puerto Rico and Illinois. These issues have had little impact on the market thus far. Overall credit fundamentals remain relatively positive despite some of the headlines. Ohio issues in particular are on solid financial footing from both the state and individual municipalities. We believe they provide good opportunities to find attractive investments for the Fund.
We believe the Fund is properly positioned at quarter end. We will seek to take advantage of opportunities during periods of market volatility that lead to higher yield using pre-refunded bonds and cash to fund new purchases. We are likely to favor maturities in the 15- to 20-year range, as we believe these securities offer better relative value in the current markets, especially following the recent period of underperformance relative to longer maturities.
Management's Discussion of Fund Performance (Unaudited) (Continued)
Comparison of the Change in Value of a $10,000 Investment in the Touchstone Ohio Tax-Free Bond Fund - Class A* and the Bloomberg Barclays Municipal Bond Index
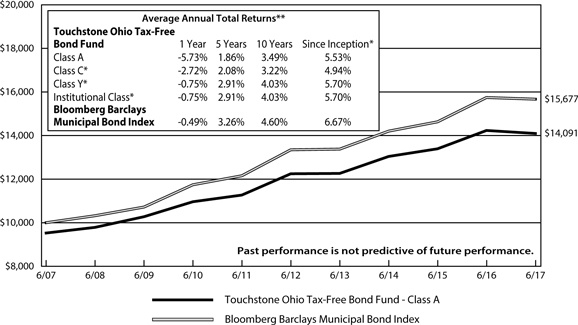
*The chart above represents performance of Class A shares only, which will vary from the performance of Class C shares, Class Y shares and Institutional Class shares based on the difference in sales loads and fees paid by shareholders in the different classes. The inception date of Class A shares, Class C shares, Class Y shares and Institutional Class shares was April 1, 1985, November 1, 1993, August 30, 2016 and August 30, 2016, respectively. Class C shares, Class Y shares and Institutional Class shares performance information was calculated using the historical performance of Class A shares for the periods prior to November 1, 1993, August 30, 2016 and August 30, 2016, respectively. The returns have been restated for sales loads and fees applicable to Class C shares, Class Y shares and Institutional Class shares. The returns of the index listed above are based on the inception of the Fund.
**The average annual total returns shown above are adjusted for maximum sales loads and fees, if applicable. The maximum offering price per share of Class A shares is equal to the net asset value (“NAV”) per share plus a sales load equal to 4.99% of the NAV (or 4.75% of the offering price). Class C shares are subject to a contingent deferred sales charge (“CDSC”) of 1.00% that will be assessed on an amount equal to the lesser of (1) the NAV at the time of purchase of the shares being redeemed or (2) the NAV of such shares being redeemed, if redeemed within a one-year period from the date of purchase. Class Y shares and Institutional Class shares are not subject to sales charges.
The performance of the above Fund does not reflect the deduction of taxes that a shareholder would pay on Fund distributions or the redemption of Fund shares.
Note to Chart
The Bloomberg Barclays Municipal Bond Index is a widely recognized unmanaged index of municipal bonds with maturities of at least one year.
Management's Discussion of Fund Performance (Unaudited)
Touchstone Small Cap Value Opportunities Fund
Sub-Advised by Thompson, Siegel & Walmsley LLC
Investment Philosophy
The Fund seeks long-term capital growth by primarily investing in equity securities of small-cap companies believed to present a value or potential worth that is not recognized by prevailing market prices or that have experienced some fundamental changes and are intrinsically undervalued by the investment community. The sub-advisor uses a combination of quantitative and qualitative methods to assess the outlook for a company.
Fund Performance
The Touchstone Small Cap Value Opportunities Fund (Class A Shares) underperformed its benchmark, the Russell 2000® Value Index, for the 12-month period ended June 30, 2017. The Fund’s total return was 13.08 percent (calculated excluding the maximum sales charge) while the total return of the benchmark was 24.86 percent.
Market Environment
Over the trailing 12 months, the market was impacted by macroeconomic and political rhetoric. Among the most notable influences were the U.S. Federal Reserve Board’s (Fed) policy regarding the future direction of interest rates, the 2016 U.S. presidential election and the subsequent market reaction to the current administration. These events contributed to a difficult environment for active managers to add value.
The 12-month period had two distinct phases. The first phase was a speculative rally that, while prevalent at different points in the year, came into full force during part of the third quarter of 2016 and immediately following the U.S. election in November. As a result of the election outcome, the shift in expectations for higher interest rates and the possibility the incoming administration would simultaneously increase economic growth, lower regulatory burdens and reduce corporate tax rates, led to significant multiple expansion across the market. Banks benefited from these expectations, along with the metals industries and the majority of stocks with exposure to infrastructure growth. In this environment, yield-sensitive sectors such as Utilities sold off, while small-cap stocks outperformed.
The second phase was a moderation of the first phase, as investors grew concerned that the current administration would be able to achieve its goals. The first half of 2017 experienced a relatively flat market where small-cap stocks underperformed large-caps stocks, and growth stocks significantly outperformed value stocks. Bank stocks and the Energy sector moved significantly higher in the latter half of 2016, but reversed course dramatically and ended the first half of 2017 in negative territory. Similarly, the Utilities sector followed its negative performance in the latter half of 2016 with a solid return in the first half of 2017.
Portfolio Review
There were several market factors that influenced Fund performance during the 12-month period ended June 30, 2017. At many points throughout the twelve months, fundamentals and valuation levels appeared to be ignored; investors seemed fixated on potential outcomes that may or may not occur. The second half of 2016 was influenced by the more speculative rally that occurred during part of the third quarter and the last two months of the year following the election, when the Fund experienced the largest headwind, which drove the majority of its underperformance. While the Fund also lagged the benchmark during the first six months of 2017, the performance gap was mitigated significantly during this period.
From a sector standpoint, the Energy and Health Care sectors contributed the most to Fund performance. The Fund was positively impacted by its bank holdings that benefited from the aforementioned expectations of reduced regulatory burden and higher interest rates. Strong stock selection within both the Energy and
Management's Discussion of Fund Performance (Unaudited) (Continued)
Health Care sectors was a positive contributor to the Fund’s relative performance. Conversely, the Industrials and Consumer Discretionary sectors were the most significant detractors from Fund performance.
Among the individual stocks that contributed to performance during the period were BioTelemetry Inc. (Health Care sector), Delek US Holdings Inc. (Energy sector) and Texas Capital Bancshares Inc. (Financials sector). BioTelemetry is a manufacturer of cardiac monitoring devices and a provider of cardiac laboratory and monitoring services. The stock moved higher due to a number of solid earnings reports and increases in forward-looking earnings guidance. BioTelemetry also received coverage from two prominent insurance companies and experienced growth in its Patient Services division through increased usage of its flagship Mobile Cardiac Outpatient Telemetry (MCOT) device. Delek US Holdings is a downstream energy company and a refining and logistics operator. Delek benefited from strong earnings results and the closing of the company’s acquisition of Alon USA Energy which pushed the stock significantly higher during the period. Texas Capital Bancshares is the parent company of Texas Capital Bank, a provider of commercial banking services in Texas. As an asset sensitive bank, the stock performed well during the period as expectations for higher interest rates and a more accommodating regulatory environment led to an overall rally for banks. Texas Capital received an added boost due to the recovery in oil prices, thereby reducing the potential for additional charge-offs from oil industry loans.
Among the stocks that detracted from performance during the period were Synchronoss Technologies Inc. (Information Technology sector), Celadon Group Inc. (Industrials sector) and Basic Energy Services Inc. (Energy sector). Synchronoss Technologies, a mobile cloud solutions business, was challenged following the market’s negative reaction to its acquisition of Intralinks Holdings Inc. The stock was further negatively impacted after the company announced it would restate prior financials. We exited the Fund’s position due to the stock’s declining risk-reward outlook. Celadon Group, a long-haul truckload carrier, struggled in the difficult trucking market as freight volumes have failed to meet expectations. Celadon also indicated that company auditors were withdrawing their financial reports from the prior calendar year which put additional pressure on the stock. From a risk mitigation standpoint, we exited the position. Basic Energy Services engages in the provision of well site services to oil and natural gas drilling and production companies. The stock moved lower following the decline in oil prices, and was further pressured from rumors surrounding the company’s potential merger with a competitor.
Outlook
Valuations continue to be stretched across domestic equities. While market volatility remains low relative to historical levels, we believe the backdrop of an expensive market influenced heavily by macroeconomic headlines and uncertainty in political rhetoric warrants a disciplined and risk-aware approach to investing. Going forward, we believe our disciplined focus on sustainability of cash flows, probabilistic outcomes, and identifying those stocks with the highest reward to risk should benefit the Fund in this environment.
Management's Discussion of Fund Performance (Unaudited) (Continued)
Comparison of the Change in Value of a $10,000 Investment in the Touchstone Small Cap Value Opportunities Fund - Class A* and the Russell 2000® Value Index
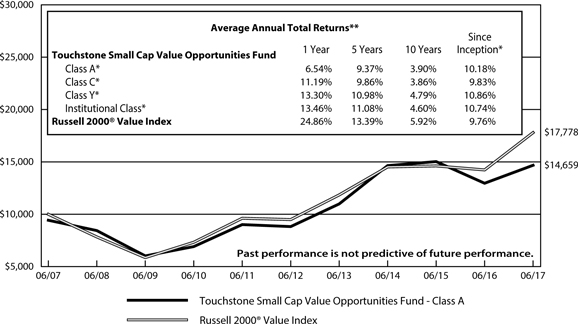
| * | The chart above represents performance of Class A shares only, which will vary from the performance of Class C shares, Class Y shares and Institutional Class shares based on the differences in sales loads and fees paid by shareholders in the different classes. The inception date of Class A shares, Class C shares, Class Y shares and Institutional Class shares was July 31, 2003, April 12, 2012, July 25, 2003 and December 9, 2008, respectively. Performance information presented prior to July 25, 2003 for Class Y shares includes performance of a predecessor fund whose inception date was July 31, 2000. Class A shares, Class C shares and Institutional Class shares performance was calculated using the historical performance of Class Y shares for periods prior to July 31, 2003, April 12, 2012 and December 9, 2008, respectively. The returns have been restated for sales loads and fees applicable to Class A, Class C and Institutional Class shares. The returns of the index listed above are based on the inception date of the Fund. |
| ** | The average annual total returns shown above are adjusted for maximum sales loads and fees, if applicable. The maximum offering price per share of Class A shares is equal to the net asset value (“NAV”) per share plus a sales load equal to 6.10% of the NAV (or 5.75% of the offering price). Class C shares are subject to a contingent deferred sales charge (“CDSC”) of 1.00%. The CDSC will be assessed on an amount equal to the lesser of (1) the NAV at the time of purchase of the shares being redeemed or (2) the NAV of such shares being redeemed, if redeemed within a one-year period from the date of purchase. Class Y shares and Institutional Class shares are not subject to sales charges. |
The performance of the above Fund does not reflect the deduction of taxes that a shareholder would pay on Fund distributions or the redemption of Fund shares.
Note to Chart
Russell 2000® Value Index measures the performance of those Russell 2000 companies with lower price-to-book ratios and lower forecasted growth values.
The Frank Russell Company (FRC) is the source and owner of the data contained or reflected in this material and all trademarks and copyrights related thereto. The material may contain confidential information and unauthorized use, disclosure, copying, dissemination or redistribution is strictly prohibited. This is a Touchstone Investments presentation of the data, and FRC is not responsible for the formatting or configuration of this material or for any inaccuracy in the presentation thereof.
Management's Discussion of Fund Performance (Unaudited)
Touchstone Value Fund
Sub-Advised by Barrow, Hanley, Mewhinney & Strauss, LLC
Investment Philosophy
The Touchstone Value Fund seeks long-term capital growth by primarily investing in equity securities of large-and mid-cap companies believed to be undervalued. The Fund uses traditional methods of stock selection – research and analysis – to identify companies that have price-to-earnings and price-to-book ratios below the market, that also have above-average dividend yields, and that focus on companies that are out of favor due to internal or external challenges judged to be short-term in nature. Stock selection is driven by fundamental analysis on individual companies rather than by broad market themes.
Fund Performance
The Touchstone Value Fund (Class A Shares) outperformed its benchmark, the Russell 1000® Value Index, for the 12-month period ended June 30, 2017. The Fund’s total return was 16.92 percent (calculated excluding the maximum sales charge), while the total return of the benchmark was 15.53 percent for the same period.
Market Environment
Global economic measures have steadily improved for some time, even before the U.S. presidential election in November 2016, and the surprising outcome of that election added even more pro-growth expectations to an improving global economy. Stock markets around the world responded with robust returns.
During the trailing 12-month period, the U.S. witnessed a strong return environment that pushed the S&P 500® Index up nearly 18 percent. The market was driven by stocks and sectors geared to improving economic growth such as the Financials and Information Technology sectors. The perceived safety of many bond proxy stocks disappointed the consensus, as the Telecommunication Services, Real Estate and Utilities sectors posted below-average returns during the period. The U.S. Federal Reserve Board (Fed) began increasing the federal funds rate and announced plans to unwind the massive monetary policy put in place during the financial crisis, which further impacted bond proxy stocks.
The popularity of Information Technology stocks throughout the bull market has pushed their weightings within the S&P 500® Index to magnified levels, while the weightings of Financials sector stocks were considerably less in the same index. These weightings were reversed within the Russell 1000® Value Index. Interestingly, isolating these two sectors helps differentiate the performance between growth stocks versus value stocks over nearly any time period in the post-Crisis era. In general terms, many InformationTechnology stocks are perceived to be able to grow, even in the slow growth macro environment that has characterized the past eight years. Conversely, stocks within the Financials sector are favored when economic growth expectations rise alongside expectations for higher interest rates. Much has been written about the dominance of a few InformationTechnology companies known as the “FANG” stocks (Facebook Inc., Amazon.com Inc., Netflix Inc. and Google Inc., which is now known as Alphabet Inc.). The performance of these stocks has been impressive, and has left them with super-sized weightings, both in the growth benchmarks and the S&P 500® Index.
Portfolio Review
During the 12-month period, the Fund’s positioning in the Financials and Energy sectors contributed to the Fund’s relative performance. Additionally, an underweight to bond proxy stocks within the Real Estate and Utilities sector was also additive to performance. The Health Care sector was the worst performing sector in 2016, but benefited from a sharp turnaround thus far in 2017. As such, the Fund’s overweight to this sector initially detracted from performance, but during the past six months has contributed.
Management's Discussion of Fund Performance (Unaudited) (Continued)
The Financials sector has meaningfully outperformed during the past year. From a Fund perspective, we believe our disciplined approach and consistent belief that financial stocks were undervalued began to pay off, particularly afterTrump’s presidential victory. Additionally, the Fed raised interest rates several times and indicated its intention to begin unwinding quantitative easing, which was meaningful for banks because the low interest rate environment has depressed net interest margins well below normalized levels. Higher interest rates going forward would have a positive impact on net interest margins and profitability within the Financials sector. From a capital standpoint, a lower regulatory burden should help accelerate capital deployment via dividends, buybacks and mergers and acquisitions. The recent Comprehensive Capital Analysis and Review (CCAR) was more transparent and will allow many banks to return more capital to shareholders through higher dividends in the coming quarters. Specific to the Fund’s positioning, PNC Financial Services Group Inc., State Street Corp., Capital One Financial Corp. and Bank of America Corp. were leading contributors to relative returns within the Financials sector.
Over the course of the full fiscal year, Health Care was the worst performing sector, and the Fund’s large overweight detracted meaningfully. However, performance for the sector has turned positive in 2017, and reversed some of the weakness from 2016. The Health Care sector has continued to be in the headlines of late, as Republicans in Congress attempted to replace the Affordable Care Act (ACA). An ACA repeal/replacement bill will likely hamper hospital profitability (to which the Fund was not exposed), impact the Medicaid-focused Managed Care business (to which the Fund had little exposure) and benefit medical device companies (to which the Fund had some exposure). The inability of Congress to make headway on health care legislation maintains the status quo for branded pharmaceutical companies, thereby allowing them to benefit from small but above-inflation increases in drug prices. Going forward, we believe the sector’s fundamentals are solid due to innovations in products and services, low valuations on earnings and cash flow, strong and growing dividends, increasing healthcare and drug utilization and an aging demographic driving an ever-increasing share of gross domestic product.
Among the individual stocks that contributed to performance during the fiscal year were Anthem Inc. (Health Care sector), Marathon Petroleum Corp. (Energy sector) and State Street Corp. (Financials sector). Anthem is the second-largest managed care organization in the U.S. and performed well during the period, benefiting from its industry-leading and sustainable Blue Cross Blue Shield brand and its leading market share position in the high-margin commercial insurance segment. In response to the implementation of the ACA, the company sought to further increase its scale through the proposed acquisition of one of its competitors, Cigna Corp. The merger was blocked by regulators, which turned out to be a blessing in disguise, as it freed up capital which Anthem has used to enhance shareholder returns through share buybacks and dividends. Anthem’s shares benefited from investors’ markedly improved sentiment as a result of this shareholder-friendly capital deployment, along with strong first quarter 2017 results and guidance for the remainder of the year. Marathon Petroleum is an independent refiner with a significant number of retail locations and a sizeable mid-stream operation. Marathon’s plans to accelerate the drop down of assets to the company’s mid-stream Master Limited Partnership helped drive the stock’s strong performance. This action is designed to increase cash distributions to Marathon Petroleum Corp., allowing it to accelerate dividend growth and share repurchases. In the Financials sector, State Street is a global asset manager and provider of asset servicing solutions to the financial services industry. The company benefited during the period from rising equity markets and higher interest rates in the U.S. and across the globe. State Street’s shares meaningfully revalued higher during the period due to recent positive developments, including significant new business wins, higher than expected cost savings from the company’s Project Beacon digitalization efforts, and better than expected CCAR results. State Street also benefited from the market’s more constructive interest rate outlook.
Among the individual stocks that detracted from performance wereTeva Pharmaceutical Industries Ltd., Express Scripts Holdings Co. (both from the Health Care sector) and Target Corp. (Consumer Discretionary sector). Teva Pharmaceutical Industries develops, manufactures and markets both generic and branded prescription
Management's Discussion of Fund Performance (Unaudited) (Continued)
drugs. The company’s underperformance was driven by anemic near-term bottom-line growth, a management change, poor investor communication and potential generic entry into its largest and most profitable brand, Copaxone. However, with a new CEO in place, Teva has acquired Allergan PLC’s generic drug business and won FDA approval for a new and highly anticipated drug. We believe these developments should provide the stock some respite from its challenges. At present, we view the stock’s valuation as attractive and believe that it currently prices in most of the company’s challenges. Express Scripts is a pharmacy benefits management (PBM) company and serves a wide range of payors, including managed care organizations, union-sponsored benefit plans, workers’ compensation plans and employers. The company’s valuations were lowered during the period, resulting from political commentary about drug pricing and PBMs’ role in price inflation. Target, a discount store retailer, declined meaningfully during the period. The stock price was relatively flat until its investor day at the end of February 2017 when the company announced fourth quarter results that were much lower than expected and disclosed downward revisions in its future financial prospects as it reset its business model. These moves are the result of a challenging retail environment, including declining foot traffic in malls and free-standing stores, and the encroachment of e-commerce on traditional retailer sales. Target announced a significant price investment in its e-commerce initiatives, in which it is moving from a “high-low” strategy (more frequent discounts) to an “everyday low price” strategy that is similar to the approach taken by Wal-Mart Stores Inc. Target management also announced significant investments in new product category launches over the next two years, increased investments in labor to improve in-store service levels and meaningful remodeling of at least one-third of its store base. As a result, Target lowered its 2018 same-store-sales forecast to negative, guided down its prior 2018 earnings-per-share (EPS) forecast to negative, and did not provide guidance beyond 2018, as it was unable to predict when the aforementioned initiatives would return the chain to positive sales and earnings increases. The stock declined further in June following Amazon.com Inc.’s announcement that it will acquire Whole Foods Inc. Many stocks involved in manufacturing or retailing consumer packaged goods, including Target, came under severe pressure with the entry of the e-commerce giant Amazon into food retailing.
Outlook
Valuations remain stretched and continue to rise. In fact, nearly half of the S&P 500® Index’s return thus far in 2017 was derived from valuation expansion. While earnings growth materialized, mainly in the Energy, Financials and Information Technology sectors, current expectations are high for projected earnings growth in 2017 and 2018, led by the aforementioned sectors. With high expectations against a backdrop of low volatility and complacency, investors appear more comfortable moving into equities but swings in consensus investor sentiment often happen at precisely the wrong time.
We believe the rapid growth of passive management ultimately improves the opportunity for active managers like us to outperform, by avoiding overcrowded stocks or sectors and finding value in less popular names with strong and improving fundamentals. As stock selection becomes less about the Fed’s actions and more about analyzing the fundamental differences between companies, the markets have become less correlated – a trend we expect will benefit active managers more broadly. Additionally, as the Fed’s support for equity prices is removed, interest rates normalize and the massive monetary stimulus of the past eight years begins to unwind, we expect the tide that has lifted many stocks will subside and important distinctions among individual stocks will be exposed. Though difficult to predict, we believe we may also see a number of unintended consequences roil financial markets as well.
We remain confident that our conservative, defensive style of investing is a proven one. Importantly, our investment process provides downside protection by focusing on undervalued companies with strong fundamentals and a meaningful and growing dividend. If markets fall or produce modest returns compared to the past eight years, we believe the Fund is well positioned moving forward.
Management's Discussion of Fund Performance (Unaudited) (Continued)
Comparison of the Change in Value of a $10,000 Investment in the Touchstone Value Fund - Class A* and the Russell 1000® Value Index
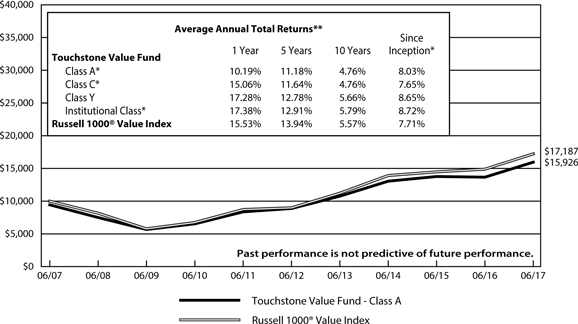
| * | The chart above represents performance of Class A shares only, which will vary from the performance of Class C shares, Class Y shares and Institutional Class shares based on the differences in sales loads and fees paid by shareholders in the different classes. The inception date of Class A shares, Class C shares, Class Y shares and Institutional Class shares was July 31, 2003, April 12, 2012, September 10, 1998 and December 20, 2006, respectively. Class A shares, Class C shares and Institutional Class shares performance was calculated using the historical performance of Class Y shares for the periods prior to July 31, 2003, April 12, 2012 and December 20, 2006, respectively. The returns have been restated for sales loads and fees applicable to Class A, Class C and Institutional Class shares. The returns of the index listed above are based on the inception date of the Fund. |
| ** | The average annual total returns shown above are adjusted for maximum sales loads and fees, if applicable. The maximum offering price per share of Class A shares is equal to the net asset value (“NAV”) per share plus a sales load equal to 6.10% of the NAV (or 5.75% of the offering price). Class C shares are subject to a contingent deferred sales charge (“CDSC”) of 1.00%. The CDSC will be assessed on an amount equal to the lesser of (1) the NAV at the time of purchase of the shares being redeemed or (2) the NAV of such shares being redeemed, if redeemed within a one-year period from the date of purchase. Class Y shares and Institutional Class shares are not subject to sales charges. |
The performance of the above Fund does not reflect the deduction of taxes that a shareholder would pay on Fund distributions or the redemption of Fund shares.
Note to Chart
Russell 1000® Value Index measures those Russell 1000 companies with lower price-to-book ratios and lower expected growth values.
The Frank Russell Company (FRC) is the source and owner of the data contained or reflected in this material and all trademarks and copyrights related thereto. The material may contain confidential information and unauthorized use, disclosure, copying, dissemination or redistribution is strictly prohibited. This is a Touchstone Investments presentation of the data, and FRC is not responsible for the formatting or configuration of this material or for any inaccuracy in the presentation thereof.
Tabular Presentation of Portfolios of Investments (Unaudited)
June 30, 2017
The tables below provides each Fund’s geographic allocation, credit quality or sector allocation. We hope it will be useful to shareholders as it summarizes key information about each Fund’s investments.
| Touchstone Credit Opportunities Fund | | | |
| Credit Quality* | | (% of Fixed Income Securities) | |
| BBB/Baa | | | 2.5 | % |
| BB/Ba | | | 37.5 | |
| B/B | | | 42.4 | |
| CCC | | | 13.4 | |
| Not Rated | | | 1.4 | |
| Cash equivalents | | | 2.8 | |
| | | | 100.0 | % |
| | | | | |
| Sector Allocation** | | | (% of Net Assets) | |
| Long Positions | | | | |
| Corporate Bonds | | | | |
| Consumer Discretionary | | | 17.8 | % |
| Telecommunications Services | | | 12.5 | |
| Energy | | | 12.2 | |
| Information Technology | | | 8.5 | |
| Health Care | | | 7.3 | |
| Materials | | | 6.3 | |
| Financials | | | 4.4 | |
| Industrials | | | 3.8 | |
| Consumer Staples | | | 2.0 | |
| Utilities | | | 1.9 | |
| Real Estate | | | 0.9 | |
| Bank Loans | | | 14.0 | |
| Asset-Backed Securities | | | 3.8 | |
| Common Stocks | | | 0.7 | |
| Warrants | | | 0.0 | |
| Investment Fund | | | 0.2 | |
| Short-Term Investment Funds | | | 5.3 | |
| Other Assets/Liabilities (Net) | | | (1.3 | ) |
| | | | 100.3 | % |
| Short Positions | | | | |
| Corporate Bonds | | | (0.3 | ) |
| Total | | | 100.0 | % |
| | | | | |
| Touchstone Global Growth Fund | | | |
| Geographic Allocation | | (% of Net Assets) | |
| Common Stocks | | | | |
| United States | | | 51.6 | % |
| Cayman Islands | | | 23.4 | |
| India | | | 5.0 | |
| Liberia | | | 4.6 | |
| Switzerland | | | 3.6 | |
| Jersey | | | 2.5 | |
| Thailand | | | 2.2 | |
| Bermuda | | | 1.8 | |
| Singapore | | | 1.5 | |
| Spain | | | 1.2 | |
| Mexico | | | 1.1 | |
| United Kingdom | | | 1.0 | |
| Short-Term Investment Funds | | | 3.2 | |
| Other Assets/Liabilities (Net) | | | (2.7 | ) |
| Total | | | 100.0 | % |
| * | Credit quality ratings are from Standard & Poor's (“S&P”) and Moody's Investors Service (“Moody's”). If agency ratings differ, the higher rating will be used. Where no rating has been assigned, it may be for reasons unrelated to the creditworthiness of the issuer. |
** Sector classifications are based upon the Global Industry Classification Standard (GICS®).
Tabular Presentation of Portfolios of Investments (Unaudited) (Continued)
| Touchstone International Small Cap Fund | | | |
| Geographic Allocation | | (% of Net Assets) | |
| Common Stocks | | | | |
| Japan | | | 21.8 | % |
| United Kingdom | | | 8.8 | |
| France | | | 7.7 | |
| Italy | | | 7.3 | |
| Germany | | | 6.9 | |
| Canada | | | 5.4 | |
| Switzerland | | | 4.7 | |
| Australia | | | 4.7 | |
| Sweden | | | 4.3 | |
| Netherlands | | | 3.7 | |
| Luxembourg | | | 3.2 | |
| Ireland | | | 3.1 | |
| South Korea | | | 2.1 | |
| Jersey | | | 1.8 | |
| Taiwan | | | 1.8 | |
| Singapore | | | 1.7 | |
| Demmark | | | 1.6 | |
| Isle of Man | | | 1.5 | |
| United States | | | 1.5 | |
| Cayman Islands | | | 0.9 | |
| Bermuda | | | 0.9 | |
| Spain | | | 0.7 | |
| Austria | | | 0.0 | |
| Exchange Traded Fund | | | 1.0 | |
| Short-Term Investment Funds | | | 6.6 | |
| Other Assets/Liabilities (Net) | | | (3.7 | ) |
| Total | | | 100.0 | % |
| Touchstone Large Cap Fund | | | |
| Sector Allocation* | | (% of Net Assets) | |
| Financials | | | 23.7 | % |
| Consumer Discretionary | | | 20.4 | |
| Industrials | | | 16.1 | |
| Information Technology | | | 14.6 | |
| Health Care | | | 8.8 | |
| Consumer Staples | | | 6.1 | |
| Materials | | | 3.6 | |
| Energy | | | 2.2 | |
| Telecommunication Services | | | 1.5 | |
| Short-Term Investment Fund | | | 1.7 | |
| Other Assets/Liabilities (Net) | | | 1.3 | |
| Total | | | 100.0 | % |
| Touchstone Large Company Growth Fund | | | |
| Sector Allocation* | | (% of Net Assets) | |
| Information Technology | | | 46.9 | % |
| Consumer Discretionary | | | 20.0 | |
| Health Care | | | 18.9 | |
| Industrials | | | 4.4 | |
| Financials | | | 3.8 | |
| Consumer Staples | | | 3.7 | |
| Short-Term Investment Funds | | | 4.2 | |
| Other Assets/Liabilities (Net) | | | (1.9 | ) |
| Total | | | 100.0 | % |
* Sector classifications are based upon the Global Industry Classification Standard (GICS®).
Tabular Presentation of Portfolios of Investments (Unaudited) (Continued)
| Touchstone Ohio Tax-Free Bond Fund | | | |
| Credit Quality* | | (% of Fixed Income Securities) | |
| AAA/Aaa | | | 5.2 | % |
| AA/Aa | | | 67.6 | |
| A/A | | | 23.3 | |
| BBB/Baa | | | 3.9 | |
| Total | | | 100.0 | % |
| | | | | |
| Portfolio Allocation | | | (% of Net Assets) | |
| Fixed Rate Revenue Bonds | | | 64.2 | % |
| Pre-refunded/Escrowed to Maturity | | | 18.7 | |
| General Obligation Bonds | | | 15.5 | |
| Variable Rate Demand Notes | | | 1.0 | |
| Other Assets/Liabilities (Net) | | | 0.6 | |
| Total | | | 100.0 | % |
| Touchstone Small Cap Value Opportunities Fund | | | |
| Sector Allocation** | | (% of Net Assets) | |
| Financials | | | 29.3 | % |
| Industrials | | | 17.5 | |
| Information Technology | | | 12.2 | |
| Consumer Discretionary | | | 11.0 | |
| Real Estate | | | 8.2 | |
| Energy | | | 4.6 | |
| Health Care | | | 4.3 | |
| Materials | | | 4.0 | |
| Consumer Staples | | | 3.6 | |
| Utilities | | | 1.9 | |
| Telecommunication Services | | | 1.2 | |
| Short-Term Investment Funds | | | 10.0 | |
| Other Assets/Liabilities (Net) | | | (7.8 | ) |
| Total | | | 100.0 | % |
| Touchstone Value Fund | | | |
| Sector Allocation** | | (% of Net Assets) | |
| Health Care | | | 23.6 | % |
| Financials | | | 19.2 | |
| Energy | | | 11.3 | |
| Information Technology | | | 10.5 | |
| Industrials | | | 10.5 | |
| Consumer Staples | | | 9.6 | |
| Consumer Discretionary | | | 5.7 | |
| Materials | | | 4.2 | |
| Telecommunication Services | | | 3.2 | |
| Short-Term Investment Fund | | | 2.2 | |
| Total | | | 100.0 | % |
| * | Credit quality ratings are from Standard & Poor's (“S&P”) and Moody's Investors Service (“Moody's”). If agency ratings differ, the higher rating will be used. Where no rating has been assigned, it may be for reasons unrelated to the creditworthiness of the issuer. |
** Sector classifications are based upon the Global Industry Classification Standard (GICS®).
Portfolio of Investments
Touchstone Credit Opportunities Fund – June 30, 2017
| Principal | | | | | Market | |
| Amount | | | | | Value | |
| | | | | | | |
| | | | | Corporate Bonds — 77.6% | | | | |
| | | | | | | | | |
| | | | | Consumer Discretionary — 17.8% | | | | |
| $ | 70,000 | | | Altice Luxembourg SA (Luxembourg), 144a, 7.625% 2/15/25 | | $ | 76,738 | |
| | 430,000 | | | Altice Luxembourg SA (Luxembourg), 144a, 7.750% 5/15/22 | | | 456,338 | |
| | 125,000 | | | Booz Allen Hamilton, Inc., 144a, 5.125% 5/1/25 | | | 122,812 | |
| | 165,000 | | | Boyd Gaming Corp. 6.375% 4/1/26 | | | 178,406 | |
| | 300,000 | | | Cablevision Systems Corp. 5.875% 9/15/22 | | | 315,375 | |
| | 110,000 | | | Carlson Travel, Inc., 144a, 6.750% 12/15/23 | | | 111,925 | |
| | 100,000 | | | CCM Merger, Inc., 144a, 6.000% 3/15/22 | | | 102,500 | |
| | 600,000 | | | Cedar Fair LP / Canada's Wonderland Co. / Magnum Management Corp. 5.375% 6/1/24 | | | 627,000 | |
| | 339,000 | | | ClubCorp Club Operations, Inc., 144a, 8.250% 12/15/23 | | | 369,510 | |
| | 100,000 | | | CSC Holdings LLC 5.250% 6/1/24 | | | 102,010 | |
| | 58,000 | | | Grinding Media, Inc. / MC Grinding Media Canada Inc., 144a, 7.375% 12/15/23 | | | 63,075 | |
| | 550,000 | | | Hillman Group, Inc. (The), 144a, 6.375% 7/15/22 | | | 528,000 | |
| | 305,000 | | | Jack Ohio Finance LLC / Jack Ohio Finance 1 Corp., 144a, 6.750% 11/15/21 | | | 318,725 | |
| | 150,000 | | | Jacobs Entertainment, Inc., 144a, 7.875% 2/1/24 | | | 162,750 | |
| | 400,000 | | | JC Penney Corp., Inc., 144a, 5.875% 7/1/23 | | | 397,000 | |
| | 250,000 | | | KAR Auction Services, Inc., 144a, 5.125% 6/1/25 | | | 254,688 | |
| | 110,000 | | | KFC Holding Co./Pizza Hut Holdings LLC/Taco Bell of America LLC, 144a, 4.750% 6/1/27 | | | 112,338 | |
| | 575,000 | | | L Brands, Inc. 6.875% 11/1/35 | | | 554,875 | |
| | 146,000 | | | Masonite International Corp. (Canada), 144a, 5.625% 3/15/23 | | | 152,570 | |
| | 246,000 | | | Mohegan Tribal Gaming Authority, 144a, 7.875% 10/15/24 | | | 255,840 | |
| | 65,000 | | | PetSmart, Inc., 144a, 8.875% 6/1/25 | | | 60,034 | |
| | 140,000 | | | Pinnacle Entertainment, Inc., 144a, 5.625% 5/1/24 | | | 145,600 | |
| | 714,000 | | | Sabre GLBL, Inc., 144a, 5.250% 11/15/23(A) | | | 740,775 | |
| | 125,000 | | | Sally Holdings LLC / Sally Capital, Inc. 5.625% 12/1/25 | | | 127,969 | |
| | 600,000 | | | Seminole Hard Rock Entertainment, Inc. / Seminole Hard Rock International LLC, 144a, 5.875% 5/15/21 | | | 603,000 | |
| | 800,000 | | | SFR Group SA (France), 144a, 6.250% 5/15/24 | | | 845,000 | |
| | 300,000 | | | Sinclair Television Group, Inc., 144a, 5.625% 8/1/24 | | | 307,875 | |
| | 235,000 | | | Sirius XM Radio, Inc., 144a, 4.625% 5/15/23 | | | 241,756 | |
| | 557,000 | | | Six Flags Entertainment Corp., 144a, 4.875% 7/31/24 | | | 560,409 | |
| | 295,000 | | | Summit Materials LLC / Summit Materials Finance Corp. 6.125% 7/15/23 | | | 309,012 | |
| | 60,000 | | | Summit Materials LLC / Summit Materials Finance Corp., 144a, 5.125% 6/1/25 | | | 61,500 | |
| | 250,000 | | | Ziggo Bond Finance BV (Netherlands), 144a, 5.875% 1/15/25 | | | 256,875 | |
| | | | | | | | 9,522,280 | |
| | | | | | | | | |
| | | | | Telecommunication Services — 12.5% | | | | |
| | 500,000 | | | Altice US Finance I Corp., 144a, 5.375% 7/15/23 | | | 520,312 | |
| | 350,000 | | | Block Communications, Inc., 144a, 6.875% 2/15/25 | | | 375,375 | |
| | 200,000 | | | Digicel Group Ltd. (Bermuda), 144a, 8.250% 9/30/20 | | | 186,980 | |
| | 500,000 | | | Digicel Ltd. (Bermuda), 144a, 6.000% 4/15/21 | | | 479,375 | |
| | 100,000 | | | EW Scripps Co. (The), 144a, 5.125% 5/15/25 | | | 103,000 | |
| | 266,000 | | | Frontier Communications Corp. 11.000% 9/15/25 | | | 246,715 | |
| | 399,000 | | | Gray Television, Inc., 144a, 5.125% 10/15/24 | | | 402,990 | |
| | 165,000 | | | Gray Television, Inc., 144a, 5.875% 7/15/26 | | | 168,300 | |
| | 120,000 | | | Intelsat Jackson Holdings SA (Luxembourg), 144a, 8.000% 2/15/24 | | | 129,300 | |
| | 145,000 | | | Lee Enterprises, Inc., 144a, 9.500% 3/15/22 | | | 149,350 | |
| | 500,000 | | | Level 3 Financing, Inc. 5.375% 1/15/24 | | | 521,875 | |
| | 100,000 | | | Level 3 Financing, Inc. 5.375% 5/1/25 | | | 105,250 | |
| | 335,000 | | | NeuStar, Inc. 4.500% 1/15/23 | | | 344,212 | |
| | 449,000 | | | Nexstar Broadcasting, Inc., 144a, 5.625% 8/1/24 | | | 454,612 | |
| | 97,000 | | | Sinclair Television Group, Inc., 144a, 5.125% 2/15/27 | | | 93,848 | |
| | 125,000 | | | Sinclair Television Group, Inc., 144a, 5.875% 3/15/26 | | | 127,812 | |
| | 300,000 | | | Sirius XM Radio, Inc., 144a, 5.375% 7/15/26 | | | 310,500 | |
| | 305,000 | | | Sprint Corp. 7.625% 2/15/25 | | | 351,131 | |
| | 500,000 | | | T-Mobile USA, Inc. 6.375% 3/1/25(A) | | | 540,625 | |
| | 500,000 | | | Tribune Media Co. 5.875% 7/15/22 | | | 523,750 | |
| | 300,000 | | | Univision Communications, Inc., 144a, 5.125% 2/15/25 | | | 297,375 | |
| | 159,000 | | | Videotron Ltd. / Videotron Ltee (Canada), 144a, 5.125% 4/15/27 | | | 163,372 | |
| | 110,000 | | | West Corp., 144a, 5.375% 7/15/22 | | | 111,100 | |
| | | | | | | | 6,707,159 | |
Touchstone Credit Opportunities Fund (Continued)
| Principal | | | | | Market | |
| Amount | | | | | Value | |
| | | | | | | |
| | | | | Corporate Bonds — 77.6% (Continued) | | | | |
| | | | | | | | | |
| | | | | Energy — 12.2% | | | | |
| $ | 160,000 | | | Alta Mesa Holdings LP / Alta Mesa Finance Services Corp., 144a, 7.875% 12/15/24 | | $ | 161,200 | |
| | 145,000 | | | Atwood Oceanics, Inc. 6.500% 2/1/20 | | | 144,275 | |
| | 200,000 | | | Calfrac Holdings LP, 144a, 7.500% 12/1/20 | | | 172,000 | |
| | 215,000 | | | California Resources Corp., 144a, 8.000% 12/15/22 | | | 135,988 | |
| | 100,000 | | | Carrizo Oil & Gas, Inc. 8.250% 7/15/25 | | | 102,250 | |
| | 101,000 | | | Chesapeake Energy Corp., 144a, 8.000% 12/15/22 | | | 106,808 | |
| | 60,000 | | | Chesapeake Energy Corp., 144a, 8.000% 1/15/25 | | | 59,400 | |
| | 298,000 | | | Continental Resources, Inc. 4.500% 4/15/23 | | | 284,590 | |
| | 110,000 | | | Continental Resources, Inc. 5.000% 9/15/22 | | | 107,938 | |
| | 260,000 | | | Extraction Oil & Gas Inc. / Extraction Finance Corp., 144a, 7.875% 7/15/21 | | | 267,150 | |
| | 555,000 | | | FTS International, Inc. 6.250% 5/1/22 | | | 449,550 | |
| | 500,000 | | | Genesis Energy LP / Genesis Energy Finance Corp. 6.000% 5/15/23 | | | 490,000 | |
| | 90,000 | | | Gulfport Energy Corp., 144a, 6.000% 10/15/24 | | | 87,525 | |
| | 110,000 | | | MEG Energy Corp. (Canada), 144a, 6.375% 1/30/23 | | | 84,975 | |
| | 415,000 | | | MEG Energy Corp. (Canada), 144a, 7.000% 3/31/24 | | | 322,662 | |
| | 115,000 | | | MEG Energy Corp.,(Canada), 144a, 6.500% 1/15/25 | | | 104,650 | |
| | 250,000 | | | Murphy Oil Corp. 6.875% 8/15/24 | | | 261,250 | |
| | 193,000 | | | Murray Energy Corp., 144a, 11.250% 4/15/21 | | | 145,715 | |
| | 575,000 | | | New Gold, Inc. (Canada), 144a, 6.250% 11/15/22 | | | 590,812 | |
| | 200,000 | | | Newfield Exploration Co. 5.375% 1/1/26 | | | 207,000 | |
| | 99,000 | | | Parsley Energy LLC / Parsley Finance Corp., 144a, 5.375% 1/15/25 | | | 99,742 | |
| | 500,000 | | | Parsley Energy LLC / Parsley Finance Corp., 144a, 6.250% 6/1/24 | | | 525,000 | |
| | 150,000 | | | PDC Energy, Inc. 7.750% 10/15/22 | | | 155,625 | |
| | 65,000 | | | Peabody Energy Corp., 144a, 6.000% 3/31/22 | | | 64,512 | |
| | 75,000 | | | Peabody Energy Corp., 144a, 6.375% 3/31/25 | | | 73,875 | |
| | 35,000 | | | Precision Drilling Corp. (Canada), 144a, 7.750% 12/15/23 | | | 34,825 | |
| | 50,000 | | | Rowan Cos., Inc. 7.375% 6/15/25 | | | 46,625 | |
| | 207,000 | | | Summit Midstream Holdings LLC / Summit Midstream Finance Corp. 5.500% 8/15/22 | | | 206,741 | |
| | 390,000 | | | Summit Midstream Holdings LLC / Summit Midstream Finance Corp. 5.750% 4/15/25 | | | 391,950 | |
| | 100,000 | | | Whiting Petroleum Corp. 5.750% 3/15/21† | | | 94,000 | |
| | 463,000 | | | Whiting Petroleum Corp. 6.250% 4/1/23† | | | 424,802 | |
| | 152,000 | | | WildHorse Resource Development Corp., 144a, 6.875% 2/1/25 | | | 142,880 | |
| | | | | | | | 6,546,315 | |
| | | | | | | | | |
| | | | | Information Technology — 8.5% | | | | |
| | 105,000 | | | CDW LLC / CDW Finance Corp. 5.000% 9/1/25 | | | 108,938 | |
| | 600,000 | | | First Data Corp., 144a, 5.000% 1/15/24 | | | 617,058 | |
| | 110,000 | | | Genesys Telecommunications Laboratories, Inc. Greeneden Lux 3 SARL/Greeneden US Ho, 144a, 10.000% 11/30/24 | | | 123,612 | |
| | 265,000 | | | j2 Cloud Services LLC / j2 Global Co.-Obligor, Inc., 144a, 6.000% 7/15/25 | | | 272,950 | |
| | 500,000 | | | NCR Corp. 5.000% 7/15/22 | | | 510,000 | |
| | 495,000 | | | Nielsen Co. Luxembourg SARL (The), 144a, (Luxembourg), 5.000% 2/1/25 | | | 507,375 | |
| | 180,000 | | | Open Text Corp. (Canada), 144a, 5.875% 6/1/26 | | | 193,612 | |
| | 370,000 | | | Radiate Holdco LLC / Radiate Finance, Inc., 144a, 6.625% 2/15/25 | | | 370,000 | |
| | 634,000 | | | Sensata Technologies BV (Netherlands), 144a, 5.000% 10/1/25 | | | 663,037 | |
| | 510,000 | | | Solera LLC / Solera Finance, Inc., 144a, 10.500% 3/1/24 | | | 585,862 | |
| | 347,750 | | | Syniverse Foreign Holdings Corp., 144a, 9.125% 1/15/22 | | | 346,446 | |
| | 234,000 | | | TIBCO Software, Inc., 144a, 11.375% 12/1/21 | | | 257,985 | |
| | | | | | | | 4,556,875 | |
| | | | | | | | | |
| | | | | Health Care — 7.3% | | | | |
| | 443,000 | | | BioScrip, Inc. 8.875% 2/15/21 | | | 400,915 | |
| | 130,000 | | | Centene Corp. 6.125% 2/15/24 | | | 140,553 | |
| | 188,000 | | | DaVita, Inc. 5.000% 5/1/25 | | | 188,470 | |
| | 300,000 | | | DaVita, Inc. 5.125% 7/15/24(A) | | | 304,500 | |
| | 460,000 | | | DJO Finco, Inc. / DJO Finance LLC / DJO Finance Corp., 144a, 8.125% 6/15/21 | | | 427,800 | |
| | 100,000 | | | HCA, Inc. 7.690% 6/15/25 | | | 116,000 | |
| | 250,000 | | | Hill-Rom Holdings, Inc., 144a, 5.000% 2/15/25 | | | 255,000 | |
| | 110,000 | | | IASIS Healthcare LLC / IASIS Capital Corp. 8.375% 5/15/19 | | | 110,550 | |
| | 250,000 | | | Mallinckrodt International Finance SA (Luxembourg) 4.750% 4/15/23† | | | 213,125 | |
| | 75,000 | | | Mallinckrodt International Finance SA / Mallinckrodt CB LLC (Luxembourg), 144a, 5.500% 4/15/25 | | | 65,625 | |
Touchstone Credit Opportunities Fund (Continued)
| Principal | | | | | Market | |
| Amount | | | | | Value | |
| | | | |
| | | | | Corporate Bonds — 77.6% (Continued) | | | | |
| | | | | | | | | |
| | | | | Health Care — (Continued) | | | | |
| $ | 295,000 | | | Molina Healthcare, Inc. 5.375% 11/15/22 | | $ | 312,331 | |
| | 70,000 | | | Tenet Healthcare Corp., 144a, 4.625% 7/15/24 | | | 70,088 | |
| | 90,000 | | | THC Escrow Corp. III, 144a, 4.625% 7/15/24 | | | 90,243 | |
| | 155,000 | | | THC Escrow Corp. III, 144a, 5.125% 5/1/25 | | | 155,581 | |
| | 55,000 | | | THC Escrow Corp. III, 144a, 7.000% 8/1/25 | | | 54,794 | |
| | 500,000 | | | Valeant Pharmaceuticals International, Inc. (Canada), 144a, 5.375% 3/15/20 | | | 483,125 | |
| | 440,000 | | | Valeant Pharmaceuticals International, Inc. (Canada), 144a, 6.125% 4/15/25 | | | 372,350 | |
| | 155,000 | | | Valeant Pharmaceuticals International, Inc. (Canada), 144a, 6.500% 3/15/22 | | | 162,556 | |
| | | | | | | | 3,923,606 | |
| | | | | | | | | |
| | | | | Materials — 6.3% | | | | |
| | 110,000 | | | ARD Finance SA (Luxembourg) 7.125% 9/15/23 | | | 117,414 | |
| | 145,000 | | | Ardagh Packaging Finance PLC / Ardagh Holdings USA, Inc. (Ireland), 144a, 6.000% 2/15/25 | | | 152,250 | |
| | 45,000 | | | CF Industries, Inc. 5.150% 3/15/34 | | | 41,625 | |
| | 400,000 | | | Constellium NV (Netherlands), 144a, 5.750% 5/15/24 | | | 370,000 | |
| | 300,000 | | | Constellium NV (Netherlands), 144a, 7.875% 4/1/21 | | | 321,000 | |
| | 69,000 | | | Freeport-McMoRan, Inc. 3.875% 3/15/23 | | | 64,170 | |
| | 110,000 | | | Freeport-McMoRan, Inc. 5.400% 11/14/34 | | | 98,725 | |
| | 110,000 | | | Freeport-McMoRan, Inc. 5.450% 3/15/43 | | | 94,853 | |
| | 300,000 | | | Hecla Mining Co. 6.875% 5/1/21 | | | 311,250 | |
| | 37,000 | | | Hudbay Minerals, Inc. (Canada), 144a, 7.250% 1/15/23 | | | 38,156 | |
| | 108,000 | | | Kraton Polymers LLC / Kraton Polymers Capital Corp., 144a, 7.000% 4/15/25 | | | 113,400 | |
| | 500,000 | | | Owens-Brockway Glass Container, Inc., 144a, 5.875% 8/15/23 | | | 551,250 | |
| | 210,000 | | | SunCoke Energy Partners LP / SunCoke Energy Partners Finance Corp., 144a, 7.500% 6/15/25 | | | 207,375 | |
| | 23,000 | | | Teck Resources Ltd. (Canada), 144a, 8.500% 6/1/24 | | | 26,565 | |
| | 200,000 | | | Tronox Finance LLC 6.375% 8/15/20 | | | 200,500 | |
| | 524,000 | | | Tronox Finance LLC, 144a, 7.500% 3/15/22 | | | 539,720 | |
| | 126,000 | | | Venator Finance SARL / Venator Materials Corp., 144a, 5.750% 7/15/25 | | | 127,260 | |
| | | | | | | | 3,375,513 | |
| | | | | | | | | |
| | | | | Financials — 4.4% | | | | |
| | 360,000 | | | ASP AMC Merger Sub, Inc., 144a, 8.000% 5/15/25 | | | 341,100 | |
| | 750,000 | | | Blue Racer Midstream LLC / Blue Racer Finance Corp., 144a, 6.125% 11/15/22 | | | 755,625 | |
| | 225,000 | | | GEO Group, Inc. (The) REIT 6.000% 4/15/26 | | | 233,438 | |
| | 500,000 | | | HUB International Ltd., 144a, 7.875% 10/1/21 | | | 521,250 | |
| | 400,000 | | | Realogy Group LLC / Realogy Co.-Issuer Corp., 144a, 4.875% 6/1/23 | | | 403,000 | |
| | 70,000 | | | Uniti Group, Inc. / Uniti Fiber Holdings Inc. / CSL Capital LLC, 144a, 7.125% 12/15/24 | | | 69,388 | |
| | | | | | | | 2,323,801 | |
| | | | | | | | | |
| | | | | Industrials — 3.8% | | | | |
| | 462,000 | | | Air Medical Group Holdings, Inc., 144a, 6.375% 5/15/23 | | | 437,745 | |
| | 165,000 | | | Bombardier, Inc. (Canada), 144a, 6.000% 10/15/22 | | | 165,000 | |
| | 111,000 | | | Builders FirstSource, Inc., 144a, 5.625% 9/1/24 | | | 115,579 | |
| | 613,000 | | | Oshkosh Corp. 5.375% 3/1/25 | | | 643,650 | |
| | 115,000 | | | TransDigm, Inc. 6.500% 5/15/25 | | | 117,012 | |
| | 150,000 | | | Tutor Perini Corp., 144a, 6.875% 5/1/25 | | | 157,875 | |
| | 375,000 | | | United Rentals North America, Inc. 5.875% 9/15/26 | | | 399,375 | |
| | 10,000 | | | Vertiv Group Corp., 144a, 9.250% 10/15/24 | | | 10,800 | |
| | | | | | | | 2,047,036 | |
| | | | | | | | | |
| | | | | Consumer Staples — 2.0% | | | | |
| | 165,000 | | | Albertsons Cos. LLC / Safeway, Inc. / New Albertson's, Inc. / Albertson's LLC, 144a, 5.750% 3/15/25 | | | 153,450 | |
| | 175,000 | | | B&G Foods, Inc. 5.250% 4/1/25 | | | 178,500 | |
| | 11,000 | | | Ceridian HCM Holding, Inc., 144a, 11.000% 3/15/21 | | | 11,619 | |
| | 120,000 | | | Clearwater Seafoods, Inc.,(Canada), 144a, 6.875% 5/1/25 | | | 126,300 | |
| | 115,000 | | | Cott Holdings, Inc., 144a, 5.500% 4/1/25 | | | 117,300 | |
| | 50,000 | | | Ferrellgas LP / Ferrellgas Finance Corp. 6.750% 1/15/22 | | | 47,000 | |
| | 155,000 | | | First Quality Finance Co., Inc., 144a, 5.000% 7/1/25 | | | 158,100 | |
| | 255,000 | | | Rite Aid Corp., 144a, 6.125% 4/1/23 | | | 250,378 | |
| | | | | | | | 1,042,647 | |
| | | | | | | | | |
| | | | | Utilities — 1.9% | | | | |
| | 80,000 | | | Dynegy, Inc. 7.625% 11/1/24 | | | 77,600 | |
| | 50,000 | | | Dynegy, Inc., 144a, 8.000% 1/15/25 | | | 48,500 | |
| | 350,000 | | | Ferrellgas LP / Ferrellgas Finance Corp. 6.750% 6/15/23 | | | 326,375 | |
Touchstone Credit Opportunities Fund (Continued)
| Principal | | | | | Market | |
| Amount | | | | | Value | |
| | | | |
| | | | | Corporate Bonds — 77.6% (Continued) | | | | |
| | | | | | | | | |
| | | | | Utilities — (Continued) | | | | |
| $ | 100,000 | | | Ferrellgas Partners LP / Ferrellgas Partners Finance Corp., 144a, 8.625% 6/15/20 | | $ | 94,500 | |
| | 170,000 | | | NGL Energy Partners LP / NGL Energy Finance Corp., 144a, 6.125% 3/1/25 | | | 155,550 | |
| | 280,000 | | | NGL Energy Partners LP / NGL Energy Finance Corp., 144a, 7.500% 11/1/23 | | | 276,150 | |
| | 43,000 | | | Talen Energy Supply LLC, 144a, 4.625% 7/15/19 | | | 41,925 | |
| | | | | | | | 1,020,600 | |
| | | | | | | | | |
| | | | | Real Estate — 0.9% | | | | |
| | 471,000 | | | ESH Hospitality, Inc., REIT, 144a, 5.250% 5/1/25 | | | 488,074 | |
| | | | | Total Corporate Bonds | | $ | 41,553,906 | |
| | | | | | | | | |
| | | | | Bank Loans(B)(C) — 14.0% | | | | |
| | | | | | | | | |
| | | | | Industrials — 3.2% | | | | |
| | 302,575 | | | Air Medical Group Holdings, Inc., Initial Term Loan, 4.474%, 4/28/22 | | | 296,599 | |
| | 100,048 | | | Engility Corp., Term B-2 Loan, 4.976%, 8/12/23 | | | 101,048 | |
| | 57,406 | | | Envigo Laboratories, Dollar Term Loan (First Lien Dollar), 9.540%, 10/28/21 | | | 56,761 | |
| | 148,875 | | | Forterra Finance LLC, Replacement Term Loan, 4.226%, 10/25/23 | | | 140,155 | |
| | 453,490 | | | JELD-WEN, Inc., Term B-3 Loan, 4.296%, 7/1/22 | | | 456,891 | |
| | 134,586 | | | Sequa Mezzanine Holdings LLC, Initial Term Loan (First Lien), 6.672%, 11/28/21 | | | 135,259 | |
| | 156,967 | | | Sequa Mezzanine Holdings LLC, Initial Term Loan (Second Lien), 10.172%, 4/28/22 | | | 159,714 | |
| | 147,415 | | | Syncreon Group BV, Term Loan, 5.546%, 10/28/20 | | | 129,357 | |
| | 249,553 | | | Syniverse Holdings, Inc., Initial Term Loan, 4.172%, 4/23/19 | | | 232,501 | |
| | | | | | | | 1,708,285 | |
| | | | | | | | | |
| | | | | Information Technology — 2.5% | | | | |
| | 148,148 | | | Almonde Inc., Dollar Term Loan (Second Lien), 6/13/25(D) | | | 150,687 | |
| | 192,234 | | | Conduent Business Services LLC, Term B Loan, 5.226%, 12/7/23 | | | 194,397 | |
| | 250,127 | | | EIG Investors Corp., Refinancing Term Loan, 5.242%, 2/9/23 | | | 250,647 | |
| | 292,643 | | | Evergreen Skills Lux SARL, Initial Term Loan (First Lien) (Luxemburg), 5.976%, 4/28/21 | | | 276,182 | |
| | 90,940 | | | Optiv Inc., Initial Term Loan (First Lien), 4.438%, 2/1/24 | | | 89,159 | |
| | 40,000 | | | Optiv Inc., Initial Term Loan (Second Lien), 8.438%, 1/31/25 | | | 39,050 | |
| | 339,459 | | | Veritas US, Inc., Term Loan, B Facility 1, 1/27/23(D) | | | 339,812 | |
| | | | | | | | 1,339,934 | |
| | | | | | | | | |
| | | | | Energy — 2.3% | | | | |
| | 180,000 | | | BCP Raptor LLC, Initial Term Loan, 5.466%, 6/24/24 | | | 177,750 | |
| | 100,000 | | | California Resources Corp., Term Loan, 11.534%, 12/31/21 | | | 105,500 | |
| | 125,000 | | | Chesapeake Energy Corp., Class A Loan, 8.686%, 8/23/21 | | | 132,062 | |
| | 39,548 | | | Emerald 2 Ltd., Facility B-1, 5.296%, 5/14/21 | | | 37,175 | |
| | 125,000 | | | FTS International Inc., Initial Term Loan, 5.976%, 4/16/21 | | | 99,688 | |
| | 71,096 | | | Gulf Finance, LLC, Tranche B Term Loan, 6.550%, 8/25/23 | | | 66,030 | |
| | 316,985 | | | Murray Energy Corp., Term B-2 Loan, Non-PIK, 8.397%, 4/16/20 | | | 309,061 | |
| | 31,833 | | | Pardus Oil and Gas LLC, Tranche A, Term Loan, PIK, 13.000%, 11/12/21(E) | | | 30,560 | |
| | 16,425 | | | Pardus Oil and Gas LLC., Senior Secured Second Lien, PIK, 5.000%, 5/13/22(E) | | | 4,928 | |
| | 414,528 | | | Seadrill Operating LP, Initial Term Loan (Marshall Islands), 4.296%, 2/22/21 | | | 263,640 | |
| | | | | | | | 1,226,394 | |
| | | | | | | | | |
| | | | | Health Care — 1.8% | | | | |
| | 352,985 | | | BPA Laboratories, Inc., Term Loan (Second Lien), 3.672%, 4/29/20(D) | | | 282,388 | |
| | 410,139 | | | General Nutrition Centers, Inc., Tranche B Term Loan, 3.730%, 3/4/19(D) | | | 385,531 | |
| | 283,617 | | | Immucor, Inc., Tranche B-2 Term Loan, 5.000%, 8/17/18 | | | 283,498 | |
| | | | | | | | 951,417 | |
| | | | | | | | | |
| | | | | Telecommunication Services — 1.4% | | | | |
| | 293,199 | | | Acosta, Inc., Tranche B-1 Loan, 4.476%, 9/26/21 | | | 261,534 | |
| | 234,043 | | | Checkout Holding Corp., Term B Loan (First Lien), 4.726%, 4/9/21 | | | 194,548 | |
| | 107,778 | | | Infoblox Inc., Term Loan (First Lien), 6.226%, 11/7/23 | | | 108,317 | |
| | 95,065 | | | Owl Finance PLC, PIK Notes, 9/7/65(D) | | | 203,059 | |
| | | | | | | | 767,458 | |
| | | | | | | | | |
| | | | | Financials — 1.2% | | | | |
| | 450,000 | | | Asurion LLC, Term Loan (Second Lien), 8.726%, 3/3/21 | | | 451,687 | |
| | 200,000 | | | Lonestar Intermediate Super Holdings LLC., Term Loan, 10.226%, 8/31/21 | | | 205,626 | |
| | | | | | | | 657,313 | |
Touchstone Credit Opportunities Fund (Continued)
| Principal | | | | | Market | |
| Amount | | | | | Value | |
| | | | | | | |
| | | | | Bank Loans(B)(C) — 14.0% (Continued) | | | | |
| | | | | | | | | |
| | | | | Materials — 0.9% | | | | |
| $ | 257,193 | | | Fairmount Santrol Inc., Tranche B-2 Term Loan, 4.796%, 9/5/19 | | $ | 242,276 | |
| | 138,654 | | | Kraton Polymers LLC, Replacement Term Loan, 5.226%, 1/6/22 | | | 139,799 | |
| | 75,210 | | | PQ Corp., Tranche B-1 Term Loan, 5.476%, 11/4/22 | | | 75,962 | |
| | | | | | | | 458,037 | |
| | | | | | | | | |
| | | | | Consumer Discretionary — 0.7% | | | | |
| | 256,269 | | | Academy Ltd., Initial Term Loan, 5.200%, 7/1/22 | | | 198,096 | |
| | 155,000 | | | Cumulus Media Holdings, Inc., Term Loan, 4.480%, 12/23/20 | | | 124,930 | |
| | 36,407 | | | York Risk Services Holding Corp. (Onex York Finance LP), Term Loan, 4.976%, 10/1/21 | | | 35,524 | |
| | | | | | | | 358,550 | |
| | | | | Total Bank Loans | | $ | 7,467,388 | |
| | | | | | | | | |
| | | | | Asset-Backed Securities — 3.8% | | | | |
| | 500,000 | | | Clear Creek CLO Ltd., Ser 2015-1A, Class D, 144a, 5.056%, 4/20/27(F) | | | 500,064 | |
| | 250,000 | | | Denali Capital CLO XII Ltd., Ser 2016-1A, Class E, 144a, 8.908%, 4/15/28(F) | | | 250,553 | |
| | 300,000 | | | Madison Park Funding XII Ltd., Ser 2014-12A, Class SUB, 144a, 0.000%, 7/20/26 | | | 222,064 | |
| | 500,000 | | | OZLM XIV Ltd., Ser 2015-14A, Class D, 144a, 7.508%, 1/15/29(F) | | | 501,556 | |
| | 300,000 | | | Symphony CLO XVI Ltd., Ser 2015-16A, Class D, 144a, 4.808%, 7/15/28(F) | | | 301,224 | |
| | 250,000 | | | TICP CLO I Ltd., Ser 2015-1A, Class D, 144a, 4.706%, 7/20/27(F) | | | 248,439 | |
| | | | | Total Asset-Backed Securities | | $ | 2,023,900 | |
| | | | | | | | | |
| | Shares | | | | | | | |
| | | | | | | | | |
| | | | | Common Stocks — 0.7% | | | | |
| | | | | | | | | |
| | | | | Information Technology — 0.0% | | | | |
| | 173,899 | | | Eagle Topco Ltd.(G)(H)* | | | — | |
| | | | | | | | | |
| | | | | Energy — 0.7% | | | | |
| | 2,562 | | | Linn Energy, Inc.* | | | 78,013 | |
| | 7,399 | | | Midstates Petroleum Co., Inc.* | | | 93,745 | |
| | 40 | | | Pardus Oil and Gas LLC(G)(H)* | | | — | |
| | 21,271 | | | Trident, Class A Templar Restructure* | | | 95,720 | |
| | 10,845 | | | Trident, Templar Restructure* | | | 103,026 | |
| | | | | | | | | |
| | | | | Advertising — 0.0% | | | | |
| | 163,444 | | | YH Limited (United Kingdom)(G)(H)* | | | — | |
| | | | | Total Common Stocks | | $ | 370,504 | |
| | | | | | | | | |
| | | | | Warrants — 0.0% | | | | |
| | | | | | | | | |
| | | | | Health Care — 0.0% | | | | |
| | | | | | | | | |
| | 1,179 | | | Lion Holdings, Inc. Series A Warrant(G)(H)* | | | — | |
| | 1,889 | | | Lion Holdings, Inc. Series B Warrant(G)(H)* | | | — | |
| | | | | Total Warrants | | $ | — | |
| | | | | | | | | |
| | | | | Investment Fund — 0.2% | | | | |
| | 6,000 | | | DoubleLine Income Solutions Fund, Common Shares± | | | 123,900 | |
| | | | | | | | | |
| | | | | Short-Term Investment Funds — 5.3% | | | | |
| | 2,163,871 | | | Dreyfus Government Cash Management, Institutional Shares, 0.91%∞Ω | | | 2,163,871 | |
| | 688,446 | | | Invesco Government & Agency Portfolio, Institutional Class, 0.89%**∞Ω | | | 688,446 | |
| | | | | Total Short-Term Investment Funds | | $ | 2,852,317 | |
| | | | | | | | | |
| Total Long Positions —101.6% | | |
| (Cost $52,960,124) | | $ | 54,391,915 | |
| Principal | | | | | | |
| Amount | | | | | | |
| | | | | | | |
| | | | | Securities Sold Short — (0.3%) | | | | |
| | | | | | | | | |
| | | | | Corporate Bonds — (0.3%) | | | | |
| | | | | | | | | |
| | | | | Consumer Discretionary — (0.3%) | | | | |
| $ | (200,000 | ) | | Acosta, Inc. 7.750%, 6/4/16, 144a | | | (151,500 | ) |
| | | | | | | | | |
| Total Securities Sold Short | | | | |
| (Proceeds $194,000) | | $ | (151,500 | ) |
| | | | | | | | | |
| Total —101.3% | | $ | 54,240,415 | |
| | | | | | | | | |
| Liabilities in Excess of Other Assets — (1.3%) | | | (708,930 | ) |
| | | | | | | | | |
| Net Assets — 100.0% | | $ | 53,531,485 | |
| (A) | All or a portion of these securities are held as collateral for securities sold short. The total value of the securities held as collateral as of June 30, 2017 was $1,260,125. |
| (B) | Bank loans pay interest at rates which adjust periodically unless otherwise indicated. The interest rates shown are the current interest rates as of June 30, 2017. |
| (C) | Term Loan has additional unfunded loan commitments. See Note 2 in Notes to Financials Statements. |
Touchstone Credit Opportunities Fund (Continued)
| (D) | All or a portion of this position has not settled. Full contract rates do not take effect until settlement date. |
| (F) | Variable rate security - Rate reflected is the rate in effect as of June 30, 2017. |
| (G) | Level 3 - For more information on valuation inputs, and their aggregation into the levels used in the table below, please refer to the security valuation section in the accompanying Notes to Financial Statements. |
| (H) | This is a restricted security that cannot be sold to qualified institutional buyers. At June 30, 2017, these securities were valued at $0 or 0.0% of net assets. |
| * | Non-income producing security. |
| ** | Represents collateral for securities loaned. |
| † | All or a portion of the security is on loan. The total market value of the securities on loan as of June 30, 2017 was $664,631. |
| Ω | Represents the 7-day SEC yield as of June 30, 2017. |
Portfolio Abbreviations:
CLO - Collateral Loan Obligations
LLC - Limited Liability Company
LP - Limited Partnership
PIK - Pay-in-Kind
PLC - Public Limited Company
REIT - Real Estate Investment Trust
144a - This is a restricted security that was sold in a transaction exempt from Rule 144A of the Securities Act of 1933. This security may be sold in transactions exempt from registration, normally to qualified institutional buyers. At June 30, 2017, these securities were valued at $ 29,854,636 or 55.8% of net assets. These securities were deemed liquid pursuant to procedures approved by the Board of Trustees.
Other Information:
The inputs or methodology used for valuing securities may not be an indication of the risk associated with investing in those securities. For more information on valuation inputs, and their aggregation into the levels used in the table below, please refer to the security valuation section in the accompanying Notes to Financial Statements.
Valuation inputs at Reporting Date:
| Description | | Level 1 | | | Level 2 | | | Level 3 | | | Total | |
| | | | | | | | | | | | | |
| Assets: | | | | | | | | | | | | | | | | |
| Corporate Bonds | | $ | — | | | $ | 41,553,906 | | | $ | — | | | $ | 41,553,906 | |
| Bank Loans | | | — | | | | 7,467,388 | | | | — | | | | 7,467,388 | |
| Asset-Backed Securities | | | — | | | | 2,023,900 | | | | — | | | | 2,023,900 | |
| Common Stocks | | | 370,504 | | | | — | | | | — | | | | 370,504 | |
| Warrants | | | — | | | | — | | | | — | | | | — | |
| Investment Fund | | | 123,900 | | | | — | | | | — | | | | 123,900 | |
| Short-Term Investment Funds | | | 2,852,317 | | | | — | | | | — | | | | 2,852,317 | |
| Total Assets | | $ | 3,346,721 | | | $ | 51,045,194 | | | $ | — | | | $ | 54,391,915 | |
| | | | | | | | | | | | | | | | | |
| Liabilities: | | | | | | | | | | | | | | | | |
| Securities Sold Short | | | | | | | | | | | | | | | | |
| Corporate Bonds | | $ | — | | | $ | (151,500 | ) | | $ | — | | | $ | (151,500 | ) |
| Other Financial Instruments* | | | | | | | | | | | | | | | | |
| Unfunded Loan Commitments | | | — | | | | (432 | ) | | | — | | | | (432 | ) |
| Total Liabilities | | $ | — | | | $ | (151,932 | ) | | $ | — | | | $ | (151,932 | ) |
| Total | | $ | 3,346,721 | | | $ | 50,893,262 | | | $ | — | | | $ | 54,239,983 | |
* Other Financial Instruments include unfunded loan commitments not reflected in total investments. Amounts shown represent unrealized depreciation on unfunded loan commitments.
Touchstone Credit Opportunities Fund (Continued)
Measurements Using Unobservable Inputs (Level 3)
| | | Bank | | | Common | |
| Assets | | Loans | | | Stocks | |
| | | | | | | |
| Beginning balance, June 30, 2016 | | $ | 15,640 | | | $ | 22,200 | |
| Purchases & Sales | | | 785 | | | | — | |
| Accrued discount | | | (1,649 | ) | | | — | |
| Transfer out of Level 3 | | | (4,928 | ) | | | — | |
| Change in unrealized gain (loss) | | | (9,848 | ) | | | (22,200 | ) |
| Ending balance, June 30, 2017 | | $ | — | | | $ | — | |
| Net Change in Unrealized Appreciation/Depreciation for Investments in Securities still held at June 30, 2017 | | $ | — | | | $ | (22,200 | ) |
Transactions in written options for the year ended June 30, 2017.
| | | Number of | | | Premiums | |
| | | Contracts | | | Received | |
| Beginning balance, June 30, 2016 | | | — | | | $ | — | |
| Call Options Written | | | 162 | | | | 8,478 | |
| Call Options Closed | | | (162 | ) | | | (8,478 | ) |
| Ending balance, June 30, 2017 | | | — | | | $ | — | |
See accompanying Notes to Financial Statements.
Portfolio of Investments
Touchstone Global Growth Fund – June 30, 2017
| | | | | | Market | |
| | | Shares | | | Value | |
| | | | | | | |
| Common Stocks — 99.5% | | | | | | | | |
| | | | | | | | | |
| United States — 51.6% | | | | | | | | |
| | | | | | | | | |
| Consumer Discretionary — 8.2% | | | | | | | | |
| Newell Brands Inc. | | | 11,386 | | | $ | 610,517 | |
| Priceline Group, Inc. (The)* | | | 430 | | | | 804,324 | |
| Sirius XM Holdings, Inc.† | | | 103,800 | | | | 567,786 | |
| | | | | | | | | |
| Consumer Staples — 3.1% | | | | | | | | |
| Monster Beverage Corp.* | | | 14,940 | | | | 742,219 | |
| | | | | | | | | |
| Financials — 2.8% | | | | | | | | |
| Charles Schwab Corp. (The) | | | 16,130 | | | | 692,945 | |
| | | | | | | | | |
| Health Care — 8.8% | | | | | | | | |
| Regeneron Pharmaceuticals, Inc.* | | | 2,865 | | | | 1,407,116 | |
| Zoetis, Inc. | | | 11,705 | | | | 730,158 | |
| | | | | | | | | |
| Industrials — 2.5% | | | | | | | | |
| Kansas City Southern | | | 3,065 | | | | 320,752 | |
| Rockwell Collins, Inc. | | | 2,675 | | | | 281,089 | |
| | | | | | | | | |
| Information Technology — 26.2% | | | | | | | | |
| Adobe Systems, Inc.* | | | 6,480 | | | | 916,531 | |
| Alphabet, Inc. - Class A* | | | 1,170 | | | | 1,087,726 | |
| Electronic Arts, Inc.* | | | 6,275 | | | | 663,393 | |
| Facebook, Inc. - Class A* | | | 10,300 | | | | 1,555,094 | |
| Microsoft Corp. | | | 9,595 | | | | 661,383 | |
| PayPal Holdings, Inc.* | | | 9,405 | | | | 504,766 | |
| Visa, Inc. - Class A | | | 10,290 | | | | 964,996 | |
| Total United States | | | | | | | 12,510,795 | |
| | | | | | | | | |
| Cayman Islands — 23.4% | | | | | | | | |
| | | | | | | | | |
| Consumer Discretionary — 7.4% | | | | | | | | |
| ANTA Sports Products Ltd. | | | 142,000 | | | | 469,244 | |
| Ctrip.com International Ltd. ADR* | | | 4,190 | | | | 225,673 | |
| New Oriental Education & Technology Group, Inc. ADR* | | | 5,830 | | | | 410,957 | |
| Wynn Macau Ltd. | | | 295,200 | | | | 689,312 | |
| | | | | | | | | |
| Information Technology — 16.0% | | | | | | | | |
| Alibaba Group Holding Ltd. ADR* | | | 12,150 | | | | 1,711,935 | |
| NetEase, Inc. ADR | | | 1,495 | | | | 449,442 | |
| Tencent Holdings Ltd. | | | 48,125 | | | | 1,726,482 | |
| Total Cayman Islands | | | | | | | 5,683,045 | |
| | | | | | | | | |
| India — 5.0% | | | | | | | | |
| | | | | | | | | |
| Financials — 5.0% | | | | | | | | |
| HDFC Bank Ltd. ADR | | | 9,640 | | | | 838,391 | |
| IndusInd Bank Ltd. | | | 16,300 | | | | 372,666 | |
| Total India | | | | | | | 1,211,057 | |
| | | | | | | | | |
| Liberia — 4.6% | | | | | | | | |
| | | | | | | | | |
| Consumer Discretionary — 4.6% | | | | | | | | |
| Royal Caribbean Cruises Ltd. | | | 10,150 | | | | 1,108,684 | |
| | | | | | | | | |
| Switzerland — 3.6% | | | | | | | | |
| | | | | | | | | |
| Consumer Staples — 1.2% | | | | | | | | |
| Coca-Cola HBC AG* | | | 9,675 | | | | 284,534 | |
| | | | | | | | | |
| Financials — 2.4% | | | | | | | | |
| Julius Baer Group Ltd.* | | | 11,220 | | | | 592,823 | |
| Total Switzerland | | | | | | | 877,357 | |
| | | | | | | | | |
| Jersey — 2.5% | | | | | | | | |
| | | | | | | | | |
| Health Care — 2.5% | | | | | | | | |
| Shire PLC | | | 10,925 | | | | 602,396 | |
| | | | | | | | | |
| Thailand — 2.2% | | | | | | | | |
| | | | | | | | | |
| Consumer Staples — 2.2% | | | | | | | | |
| CP ALL PCL | | | 282,700 | | | | 521,895 | |
| | | | | | | | | |
| Bermuda — 1.8% | | | | | | | | |
| | | | | | | | | |
| Utilities — 1.8% | | | | | | | | |
| Beijing Enterprises Water Group Ltd.* | | | 572,000 | | | | 443,891 | |
| | | | | | | | | |
| Singapore — 1.5% | | | | | | | | |
| | | | | | | | | |
| Financials — 1.5% | | | | | | | | |
| DBS Group Holdings Ltd. | | | 25,000 | | | | 376,269 | |
| | | | | | | | | |
| Spain — 1.2% | | | | | | | | |
| | | | | | | | | |
| Information Technology — 1.2% | | | | | | | | |
| Amadeus IT Group SA | | | 4,800 | | | | 286,924 | |
| | | | | | | | | |
| Mexico — 1.1% | | | | | | | | |
| | | | | | | | | |
| Consumer Staples — 1.1% | | | | | | | | |
| Fomento Economico Mexicano SAB de CV ADR | | | 2,775 | | | | 272,894 | |
| | | | | | | | | |
| United Kingdom — 1.0% | | | | | | | | |
| | | | | | | | | |
| Information Technology — 1.0% | | | | | | | | |
| Just Eat PLC* | | | 28,700 | | | | 244,978 | |
| Total Common Stocks | | | | | | $ | 24,140,185 | |
| | | | | | | | | |
| Short-Term Investment Funds — 3.2% | | | | | | | | |
| Dreyfus Government Cash Management, Institutional Shares, 0.91%∞Ω | | | 212,275 | | | $ | 212,275 | |
| Invesco Government & Agency Portfolio, Institutional Class, 0.89%**∞Ω | | | 565,191 | | | | 565,191 | |
| Total Short-Term Investment Funds | | | | | | $ | 777,466 | |
Touchstone Global Growth Fund (Continued)
| | | Market | |
| | | Value | |
| | | | |
| Total Investment Securities —102.7% | | | | |
| (Cost $19,420,365) | | $ | 24,917,651 | |
| | | | | |
| Liabilities in Excess of Other Assets — (2.7%) | | | (657,391 | ) |
| | | | | |
| Net Assets — 100.0% | | $ | 24,260,260 | |
| * | Non-income producing security. |
| ** | Represents collateral for securities loaned. |
| † | All or a portion of the security is on loan. The total market value of the securities on loan as of June 30, 2017 was $562,108. |
| Ω | Represents the 7-day SEC yield as of June 30, 2017. |
Portfolio Abbreviations:
ADR - American Depositary Receipt
PCL- Public Company Limited
PLC - Public Limited Company
Other Information:
The inputs or methodology used for valuing securities may not be an indication of the risk associated with investing in those securities. For more information on valuation inputs, and their aggregation into the levels used in the table below, please refer to the security valuation section in the accompanying Notes to Financial Statements.
Valuation inputs at Reporting Date:
| | | Level 1 | | | Level 2 | | | Level 3 | | | Total | |
| Common Stocks | | | | | | | | | | | | | | | | |
| United States | | $ | 12,510,795 | | | $ | — | | | $ | — | | | $ | 12,510,795 | |
| Cayman Islands | | | 3,267,251 | | | | 2,415,794 | | | | — | | | | 5,683,045 | |
| India | | | 838,391 | | | | 372,666 | | | | — | | | | 1,211,057 | |
| Liberia | | | 1,108,684 | | | | — | | | | — | | | | 1,108,684 | |
| Switzerland | | | — | | | | 877,357 | | | | — | | | | 877,357 | |
| Jersey | | | — | | | | 602,396 | | | | — | | | | 602,396 | |
| Thailand | | | — | | | | 521,895 | | | | — | | | | 521,895 | |
| Bermuda | | | — | | | | 443,891 | | | | — | | | | 443,891 | |
| Singapore | | | — | | | | 376,269 | | | | — | | | | 376,269 | |
| Spain | | | — | | | | 286,924 | | | | — | | | | 286,924 | |
| Mexico | | | 272,894 | | | | — | | | | — | | | | 272,894 | |
| United Kingdom | | | — | | | | 244,978 | | | | — | | | | 244,978 | |
| Short-Term Investment Funds | | | 777,466 | | | | — | | | | — | | | | 777,466 | |
| Total | | $ | 18,775,481 | | | $ | 6,142,170 | | | $ | — | | | $ | 24,917,651 | |
See accompanying Notes to Financial Statements.
Portfolio of Investments
Touchstone International Small Cap Fund – June 30, 2017
| | | | | | Market | |
| | | Shares | | | Value | |
| | | | | | | |
| Common Stocks — 96.1% | | | | | | | | |
| | | | | | | | | |
| Japan — 21.8% | | | | | | | | |
| | | | | | | | | |
| Consumer Discretionary — 1.9% | | | | | | | | |
| Adastria Co. Ltd. | | | 133,400 | | | $ | 3,717,860 | |
| Nishimatsuya Chain Co. Ltd. | | | 211,700 | | | | 2,169,147 | |
| | | | | | | | | |
| Consumer Staples — 3.1% | | | | | | | | |
| Lion Corp. | | | 173,500 | | | | 3,598,715 | |
| Morinaga & Co. Ltd. | | | 51,299 | | | | 2,908,614 | |
| NH Foods Ltd. | | | 110,000 | | | | 3,346,211 | |
| | | | | | | | | |
| Financials — 2.4% | | | | | | | | |
| Fukuoka Financial Group, Inc. | | | 615,000 | | | | 2,934,295 | |
| Zenkoku Hosho Co. Ltd. | | | 112,800 | | | | 4,618,472 | |
| | | | | | | | | |
| Industrials — 3.1% | | | | | | | | |
| CKD Corp. | | | 26,900 | | | | 411,862 | |
| Kandenko Co. Ltd. | | | 330,000 | | | | 3,473,108 | |
| Kinden Corp. | | | 62,300 | | | | 1,005,858 | |
| Persol Holdings Co. Ltd. | | | 76,900 | | | | 1,444,812 | |
| Toda Corp. | | | 557,000 | | | | 3,479,145 | |
| | | | | | | | | |
| Information Technology — 4.9% | | | | | | | | |
| Azbil Corp. | | | 82,800 | | | | 3,152,171 | |
| Hosiden Corp. | | | 356,200 | | | | 4,094,417 | |
| SCREEN Holdings Co. Ltd. | | | 44,000 | | | | 2,943,271 | |
| Sumida Corp. | | | 35,100 | | | | 555,762 | |
| Ulvac, Inc. | | | 95,800 | | | | 4,622,576 | |
| | | | | | | | | |
| Materials — 3.0% | | | | | | | | |
| Hitachi Chemical Co. Ltd. | | | 88,900 | | | | 2,665,276 | |
| Sumitomo Bakelite Co. Ltd. | | | 514,000 | | | | 3,634,768 | |
| Teijin Ltd. | | | 167,500 | | | | 3,232,262 | |
| | | | | | | | | |
| Real Estate — 3.4% | | | | | | | | |
| Leopalace21 Corp. | | | 632,100 | | | | 3,932,110 | |
| Nomura Real Estate Master Fund, Inc. REIT | | | 1,213 | | | | 1,657,596 | |
| Open House Co. Ltd. | | | 168,500 | | | | 5,199,533 | |
| Total Japan | | | | | | | 68,797,841 | |
| | | | | | | | | |
| United Kingdom — 8.8% | | | | | | | | |
| | | | | | | | | |
| Consumer Discretionary — 1.9% | | | | | | | | |
| JD Sports Fashion PLC | | | 499,561 | | | | 2,277,297 | |
| SSP Group PLC | | | 597,004 | | | | 3,699,685 | |
| | | | | | | | | |
| Consumer Staples — 1.0% | | | | | | | | |
| Britvic PLC | | | 349,225 | | | | 3,147,650 | |
| | | | | | | | | |
| Energy — 0.3% | | | | | | | | |
| Pantheon Resources PLC*† | | | 1,244,341 | | | | 826,557 | |
| | | | | | | | | |
| Financials — 2.6% | | | | | | | | |
| Beazley PLC | | | 737,265 | | | | 4,687,006 | |
| Jupiter Fund Management PLC | | | 545,982 | | | | 3,591,034 | |
| | | | | | | | | |
| Health Care — 2.0% | | | | | | | | |
| Abcam PLC | | | 240,590 | | | | 3,050,539 | |
| Dechra Pharmaceuticals PLC | | | 152,162 | | | | 3,369,133 | |
| | | | | | | | | |
| Materials — 1.0% | | | | | | | | |
| RPC Group PLC | | | 306,783 | | | | 3,006,672 | |
| Total United Kingdom | | | | | | | 27,655,573 | |
| | | | | | | | | |
| France — 7.7% | | | | | | | | |
| | | | | | | | | |
| Consumer Discretionary — 1.9% | | | | | | | | |
| Elior Group, 144a | | | 102,214 | | | | 2,970,824 | |
| IPSOS† | | | 75,860 | | | | 2,846,244 | |
| | | | | | | | | |
| Industrials — 2.0% | | | | | | | | |
| SPIE SA | | | 103,053 | | | | 3,095,495 | |
| Tarkett SA | | | 65,989 | | | | 3,066,030 | |
| | | | | | | | | |
| Information Technology — 2.4% | | | | | | | | |
| Alten SA | | | 55,462 | | | | 4,579,285 | |
| Worldline SA, 144a* | | | 90,221 | | | | 3,091,383 | |
| | | | | | | | | |
| Utilities — 1.4% | | | | | | | | |
| Rubis SCA | | | 39,836 | | | | 4,518,307 | |
| Total France | | | | | | | 24,167,568 | |
| | | | | | | | | |
| Italy — 7.3% | | | | | | | | |
| | | | | | | | | |
| Consumer Discretionary — 2.3% | | | | | | | | |
| Autogrill SpA | | | 392,741 | | | | 4,759,327 | |
| Brembo SpA | | | 171,780 | | | | 2,517,094 | |
| | | | | | | | | |
| Financials — 2.3% | | | | | | | | |
| Azimut Holding SpA | | | 200,159 | | | | 4,026,777 | |
| Banca IFIS SpA | | | 78,184 | | | | 3,176,330 | |
| | | | | | | | | |
| Health Care — 1.5% | | | | | | | | |
| DiaSorin SpA | | | 62,768 | | | | 4,821,193 | |
| | | | | | | | | |
| Industrials — 1.2% | | | | | | | | |
| Interpump Group SpA | | | 133,500 | | | | 3,652,766 | |
| Total Italy | | | | | | | 22,953,487 | |
| | | | | | | | | |
| Germany — 6.9% | | | | | | | | |
| | | | | | | | | |
| Consumer Discretionary — 2.0% | | | | | | | | |
| Grammer AG | | | 34,425 | | | | 1,805,084 | |
| Hella KGaA Hueck & Co. | | | 91,254 | | | | 4,500,322 | |
| | | | | | | | | |
| Financials — 0.8% | | | | | | | | |
| AURELIUS Equity Opportunities SE & Co. KGaA† | | | 50,072 | | | | 2,689,924 | |
| | | | | | | | | |
| Industrials — 2.8% | | | | | | | | |
| Duerr AG | | | 26,716 | | | | 3,179,534 | |
| Rheinmetall AG | | | 57,803 | | | | 5,501,910 | |
| | | | | | | | | |
| Materials — 1.3% | | | | | | | | |
| Salzgitter AG | | | 99,937 | | | | 4,078,502 | |
| Total Germany | | | | | | | 21,755,276 | |
Touchstone International Small Cap Fund (Continued)
| | | | | | Market | |
| | | Shares | | | Value | |
| | | | | | | |
| Common Stocks — 96.1% (Continued) | | | | | | | | |
| | | | | | | | | |
| Canada — 5.4% | | | | | | | | |
| | | | | | | | | |
| Consumer Discretionary — 1.0% | | | | | | | | |
| Corus Entertainment, Inc. - Class B | | | 295,520 | | | $ | 3,106,059 | |
| | | | | | | | | |
| Energy — 0.7% | | | | | | | | |
| Enerflex Ltd. | | | 160,835 | | | | 2,334,141 | |
| | | | | | | | | |
| Industrials — 1.8% | | | | | | | | |
| Aecon Group, Inc. | | | 236,722 | | | | 2,946,247 | |
| Boyd Group Income Fund | | | 34,504 | | | | 2,558,266 | |
| | | | | | | | | |
| Materials — 0.9% | | | | | | | | |
| Intertape Polymer Group, Inc. | | | 155,974 | | | | 2,969,616 | |
| | | | | | | | | |
| Utilities — 1.0% | | | | | | | | |
| Superior Plus Corp. | | | 338,034 | | | | 2,976,826 | |
| Total Canada | | | | | | | 16,891,155 | |
| | | | | | | | | |
| Switzerland — 4.7% | | | | | | | | |
| | | | | | | | | |
| Financials — 2.5% | | | | | | | | |
| Cembra Money Bank AG* | | | 85,248 | | | | 8,063,399 | |
| | | | | | | | | |
| Industrials — 2.2% | | | | | | | | |
| dormakaba Holding AG* | | | 4,470 | | | | 3,890,287 | |
| Georg Fischer AG | | | 3,074 | | | | 2,981,716 | |
| Total Switzerland | | | | | | | 14,935,402 | |
| | | | | | | | | |
| Australia — 4.7% | | | | | | | | |
| | | | | | | | | |
| Energy — 1.0% | | | | | | | | |
| WorleyParsons Ltd.* | | | 359,345 | | | | 3,096,198 | |
| | | | | | | | | |
| Information Technology — 0.9% | | | | | | | | |
| Link Administration Holdings Ltd. | | | 496,943 | | | | 3,017,466 | |
| | | | | | | | | |
| Materials — 2.2% | | | | | | | | |
| BlueScope Steel Ltd. | | | 334,990 | | | | 3,391,449 | |
| Sims Metal Management Ltd. | | | 297,983 | | | | 3,476,662 | |
| | | | | | | | | |
| Real Estate — 0.6% | | | | | | | | |
| Aveo Group | | | 909,056 | | | | 1,943,728 | |
| Total Australia | | | | | | | 14,925,503 | |
| | | | | | | | | |
| Sweden — 4.3% | | | | | | | | |
| | | | | | | | | |
| Industrials — 2.5% | | | | | | | | |
| Intrum Justitia AB† | | | 128,019 | | | | 4,347,563 | |
| Peab AB | | | 280,937 | | | | 3,408,528 | |
| | | | | | | | | |
| Information Technology — 0.8% | | | | | | | | |
| NetEnt AB* | | | 268,657 | | | | 2,348,640 | |
| | | | | | | | | |
| Real Estate — 1.0% | | | | | | | | |
| Hemfosa Fastigheter AB | | | 303,106 | | | | 3,274,371 | |
| Total Sweden | | | | | | | 13,379,102 | |
| | | | | | | | | |
| Netherlands — 3.7% | | | | | | | | |
| | | | | | | | | |
| Financials — 1.5% | | | | | | | | |
| ASR Nederland NV | | | 142,880 | | | | 4,818,205 | |
| | | | | | | | | |
| Information Technology — 1.1% | | | | | | | | |
| ASM International NV | | | 56,467 | | | | 3,283,776 | |
| | | | | | | | | |
| Materials — 1.1% | | | | | | | | |
| AMG Advanced Metallurgical Group NV | | | 120,350 | | | | 3,518,847 | |
| Total Netherlands | | | | | | | 11,620,828 | |
| | | | | | | | | |
| Luxembourg — 3.2% | | | | | | | | |
| | | | | | | | | |
| Industrials — 0.9% | | | | | | | | |
| Stabilus SA | | | 37,122 | | | | 2,882,706 | |
| | | | | | | | | |
| Materials — 1.1% | | | | | | | | |
| APERAM SA | | | 72,337 | | | | 3,359,029 | |
| | | | | | | | | |
| Real Estate — 1.2% | | | | | | | | |
| Grand City Properties SA | | | 182,118 | | | | 3,656,887 | |
| Total Luxembourg | | | | | | | 9,898,622 | |
| | | | | | | | | |
| Ireland — 3.1% | | | | | | | | |
| | | | | | | | | |
| Consumer Staples — 1.0% | | | | | | | | |
| Greencore Group PLC | | | 947,705 | | | | 3,037,603 | |
| | | | | | | | | |
| Health Care — 1.1% | | | | | | | | |
| UDG Healthcare PLC | | | 301,005 | | | | 3,395,116 | |
| | | | | | | | | |
| Industrials — 1.0% | | | | | | | | |
| Kingspan Group PLC | | | 97,139 | | | | 3,334,527 | |
| Total Ireland | | | | | | | 9,767,246 | |
| | | | | | | | | |
| South Korea — 2.1% | | | | | | | | |
| | | | | | | | | |
| Consumer Discretionary — 0.9% | | | | | | | | |
| Mando Corp. | | | 12,776 | | | | 2,875,340 | |
| | | | | | | | | |
| Industrials — 1.2% | | | | | | | | |
| Doosan Bobcat, Inc. | | | 120,267 | | | | 3,746,795 | |
| Total South Korea | | | | | | | 6,622,135 | |
| | | | | | | | | |
| Jersey — 1.8% | | | | | | | | |
| | | | | | | | | |
| Industrials — 1.8% | | | | | | | | |
| Wizz Air Holdings PLC, 144a* | | | 180,381 | | | | 5,688,239 | |
| | | | | | | | | |
| Taiwan — 1.8% | | | | | | | | |
| | | | | | | | | |
| Information Technology — 1.8% | | | | | | | | |
| Lite-On Technology Corp. | | | 1,687,000 | | | | 2,769,083 | |
| Sinbon Electronics Co. Ltd. | | | 1,227,702 | | | | 2,897,974 | |
| Total Taiwan | | | | | | | 5,667,057 | |
| | | | | | | | | |
| Singapore — 1.7% | | | | | | | | |
| | | | | | | | | |
| Industrials — 1.7% | | | | | | | | |
| BOC Aviation Ltd., 144a | | | 428,000 | | | | 2,262,872 | |
Touchstone International Small Cap Fund (Continued)
| | | | | | Market | |
| | | Shares | | | Value | |
| | | | | | | |
| Common Stocks — 96.1% (Continued) | | | | | | | | |
| | | | | | | | | |
| Singapore — (Continued) | | | | | | | | |
| | | | | | | | | |
| Industrials — (Continued) | | | | | | | | |
| SATS Ltd. | | | 853,100 | | | $ | 3,166,400 | |
| Total Singapore | | | | | | | 5,429,272 | |
| | | | | | | | | |
| Denmark — 1.6% | | | | | | | | |
| | | | | | | | | |
| Consumer Staples — 1.6% | | | | | | | | |
| Royal Unibrew A/S | | | 106,591 | | | | 5,113,146 | |
| | | | | | | | | |
| Isle of Man — 1.5% | | | | | | | | |
| | | | | | | | | |
| Information Technology — 1.5% | | | | | | | | |
| Paysafe Group PLC* | | | 727,995 | | | | 4,845,207 | |
| | | | | | | | | |
| United States — 1.5% | | | | | | | | |
| | | | | | | | | |
| Information Technology — 1.5% | | | | | | | | |
| Kulicke & Soffa Industries, Inc.* | | | 241,744 | | | | 4,597,971 | |
| | | | | | | | | |
| Cayman Islands — 0.9% | | | | | | | | |
| | | | | | | | | |
| Health Care — 0.9% | | | | | | | | |
| China Medical System Holdings Ltd. | | | 1,714,000 | | | | 2,963,619 | |
| | | | | | | | | |
| Bermuda — 0.9% | | | | | | | | |
| | | | | | | | | |
| Consumer Discretionary — 0.9% | | | | | | | | |
| Skyworth Digital Holdings Ltd. | | | 4,522,000 | | | | 2,807,656 | |
| | | | | | | | | |
| Spain — 0.7% | | | | | | | | |
| | | | | | | | | |
| Consumer Discretionary — 0.7% | | | | | | | | |
| Atresmedia Corp. de Medios de Comunicacion SA | | | 185,057 | | | | 2,166,993 | |
| | | | | | | | | |
| Austria — 0.0% | | | | | | | | |
| | | | | | | | | |
| Financials — 0.0% | | | | | | | | |
| UNIQA Insurance Group AG | | | 9,821 | | | | 91,531 | |
| Total Common Stocks | | | | | | $ | 302,740,429 | |
| | | | | | | | | |
| Exchange Traded Fund — 1.0% | | | | | | | | |
| | | | | | | | | |
| United States — 1.0% | | | | | | | | |
| iShares MSCI EAFE Small - Cap ETF | | | 55,145 | | | | 3,189,587 | |
| | | | | | | | | |
| Short-Term Investment Funds — 6.6% | | | | | | | | |
| Dreyfus Government Cash Management, Institutional Shares, 0.91%8O | | | 9,350,074 | | | $ | 9,350,074 | |
| Invesco Government & Agency Portfolio, Institutional Class, 0.89%**8O | | | 11,271,986 | | | | 11,271,986 | |
| Total Short-Term Investment Funds | | | | | | $ | 20,622,060 | |
| | | | | | | | | |
| Total Investment Securities —103.7% | | | | | | | | |
| (Cost $278,413,602) | | | | | | $ | 326,552,076 | |
| | | | | | | | | |
| Liabilities in Excess of Other Assets — (3.7%) | | | | | | | (11,523,920 | ) |
| | | | | | | | | |
| Net Assets — 100.0% | | | | | | $ | 315,028,156 | |
| * | Non-income producing security. |
| ** | Represents collateral for securities loaned. |
| † | All or a portion of the security is on loan. The total market value of the securities on loan as of June 30, 2017 was $10,522,169. |
| Ω | Represents the 7-day SEC yield as of June 30, 2017. |
Portfolio Abbreviations:
ETF - Exchange Traded Fund
PLC - Public Limited Company
REIT- Real Estate Investment Trust
144a - This is a restricted security that was sold in a transaction qualifying for the exemption under Rule 144A of the Securities Act of 1933. This security may be sold in transactions exempt from registration, normally to qualified institutional buyers. At June 30, 2017, these securities were valued at $14,013,318 or 4.4% of net assets. These securities were deemed liquid pursuant to procedures approved by the Board of Trustees.
Touchstone International Small Cap Fund (Continued)
Other Information:
The inputs or methodology used for valuing securities may not be an indication of the risk associated with investing in those securities. For more information on valuation inputs, and their aggregation into the levels used in the table below, please refer to the security valuation section in the accompanying Notes to Financial Statements.
Valuation inputs at Reporting Date:
| | | Level 1 | | | Level 2 | | | Level 3 | | | Total | |
| Common Stocks | | | | | | | | | | | | | | | | |
| Japan | | $ | 1,657,596 | | | $ | 67,140,245 | | | $ | — | | | $ | 68,797,841 | |
| United Kingdom | | | 17,910,217 | | | | 9,745,356 | | | | — | | | | 27,655,573 | |
| France | | | 13,582,942 | | | | 10,584,626 | | | | — | | | | 24,167,568 | |
| Italy | | | 12,756,850 | | | | 10,196,637 | | | | — | | | | 22,953,487 | |
| Germany | | | 2,689,924 | | | | 19,065,352 | | | | — | | | | 21,755,276 | |
| Canada | | | 16,891,155 | | | | — | | | | — | | | | 16,891,155 | |
| Switzerland | | | 8,063,399 | | | | 6,872,003 | | | | — | | | | 14,935,402 | |
| Australia | | | 3,476,662 | | | | 11,448,841 | | | | — | | | | 14,925,503 | |
| Sweden | | | 2,348,640 | | | | 11,030,462 | | | | — | | | | 13,379,102 | |
| Netherlands | | | 4,818,205 | | | | 6,802,623 | | | | — | | | | 11,620,828 | |
| Luxembourg | | | 2,882,706 | | | | 7,015,916 | | | | — | | | | 9,898,622 | |
| Ireland | | | 6,729,643 | | | | 3,037,603 | | | | — | | | | 9,767,246 | |
| South Korea | | | 2,875,340 | | | | 3,746,795 | | | | — | | | | 6,622,135 | |
| Jersey | | | — | | | | 5,688,239 | | | | — | | | | 5,688,239 | |
| Taiwan | | | — | | | | 5,667,057 | | | | — | | | | 5,667,057 | |
| Singapore | | | 3,166,400 | | | | 2,262,872 | | | | — | | | | 5,429,272 | |
| Denmark | | | 5,113,146 | | | | — | | | | — | | | | 5,113,146 | |
| Isle of Man | | | 4,845,207 | | | | — | | | | — | | | | 4,845,207 | |
| United States | | | 4,597,971 | | | | — | | | | — | | | | 4,597,971 | |
| Cayman Islands | | | — | | | | 2,963,619 | | | | — | | | | 2,963,619 | |
| Bermuda | | | — | | | | 2,807,656 | | | | — | | | | 2,807,656 | |
| Spain | | | — | | | | 2,166,993 | | | | — | | | | 2,166,993 | |
| Austria | | | 91,531 | | | | — | | | | — | | | | 91,531 | |
| Exchange Traded Fund | | | 3,189,587 | | | | — | | | | — | | | | 3,189,587 | |
| Short-Term Investment Funds | | | 20,622,060 | | | | — | | | | — | | | | 20,622,060 | |
| Total | | $ | 138,309,181 | | | $ | 188,242,895 | | | $ | — | | | $ | 326,552,076 | |
At June 30, 2017, equity securities valued at $31,387,940 were transferred from Level 2 to Level 1. Transfers from Level 1 to Level 2 are due to movements of a designated U.S. market index, triggering a systematic valuation model, provided by an independent third party, when required confidence levels are achieved to fair value the international equity securities. Transfers from Level 2 to Level 1 occur when there is no longer movement of the designated U.S. market index or required confidence levels were not reached in the systematic model.
See accompanying Notes to Financial Statements.
Portfolio of Investments
Touchstone Large Cap Fund – June 30, 2017
| | | | | | Market | |
| | | Shares | | | Value | |
| | | | | | | |
| Common Stocks — 97.0% | | | | | | | | |
| | | | | | | | | |
| Financials — 23.7% | | | | | | | | |
| Alleghany Corp.* | | | 19,383 | | | $ | 11,529,008 | |
| Bank of America Corp. | | | 219,019 | | | | 5,313,401 | |
| Berkshire Hathaway, Inc. - Class B* | | | 134,874 | | | | 22,843,609 | |
| BlackRock, Inc. | | | 30,392 | | | | 12,837,885 | |
| Progressive Corp. (The) | | | 318,435 | | | | 14,039,799 | |
| Wells Fargo & Co. | | | 222,119 | | | | 12,307,614 | |
| | | | | | | | 78,871,316 | |
| | | | | | | | | |
| Consumer Discretionary — 20.4% | | | | | | | | |
| CarMax, Inc.* | | | 213,172 | | | | 13,442,626 | |
| Carnival Corp. (Panama) | | | 258,124 | | | | 16,925,191 | |
| Dollar Tree, Inc.* | | | 176,425 | | | | 12,335,636 | |
| Lowe's Cos., Inc. | | | 99,032 | | | | 7,677,951 | |
| NIKE, Inc. - Class B | | | 171,200 | | | | 10,100,800 | |
| O'Reilly Automotive, Inc.* | | | 34,520 | | | | 7,550,905 | |
| | | | | | | | 68,033,109 | |
| | | | | | | | | |
| Industrials — 16.1% | | | | | | | | |
| Deere & Co. | | | 95,888 | | | | 11,850,798 | |
| FedEx Corp. | | | 35,435 | | | | 7,701,088 | |
| General Dynamics Corp. | | | 73,707 | | | | 14,601,357 | |
| Norfolk Southern Corp. | | | 98,740 | | | | 12,016,658 | |
| Southwest Airlines Co. | | | 122,125 | | | | 7,588,847 | |
| | | | | | | | 53,758,748 | |
| | | | | | | | | |
| Information Technology — 14.6% | | | | | | | | |
| Alphabet, Inc. - Class C* | | | 12,900 | | | | 11,722,617 | |
| Apple, Inc. | | | 112,145 | | | | 16,151,123 | |
| Cisco Systems, Inc. | | | 253,772 | | | | 7,943,064 | |
| Visa, Inc. - Class A | | | 138,327 | | | | 12,972,306 | |
| | | | | | | | 48,789,110 | |
| | | | | | | | | |
| Health Care — 8.8% | | | | | | | | |
| Alexion Pharmaceuticals, Inc.* | | | 83,000 | | | | 10,098,610 | |
| Bristol-Myers Squibb Co. | | | 130,079 | | | | 7,248,002 | |
| Eli Lilly & Co. | | | 145,286 | | | | 11,957,038 | |
| | | | | | | | 29,303,650 | |
| | | | | | | | | |
| Consumer Staples — 6.1% | | | | | | | | |
| Altria Group, Inc. | | | 185,295 | | | | 13,798,919 | |
| Coca-Cola Co. (The) | | | 146,783 | | | | 6,583,217 | |
| | | | | | | | 20,382,136 | |
| | | | | | | | | |
| Materials — 3.6% | | | | | | | | |
| NewMarket Corp. | | | 26,262 | | | | 12,093,126 | |
| | | | | | | | | |
| Energy — 2.2% | | | | | | | | |
| Chevron Corp. | | | 68,691 | | | | 7,166,532 | |
| | | | | | | | | |
| Telecommunication Services — 1.5% | | | | | | | | |
| Verizon Communications, Inc. | | | 112,604 | | | | 5,028,895 | |
| Total Common Stocks | | | | | | $ | 323,426,622 | |
| | | | | | | | | |
| Short-Term Investment Fund — 1.7% | | | | | | | | |
| Dreyfus Government Cash Management, Institutional Shares, 0.91%∞Ω | | | 5,672,267 | | | | 5,672,267 | |
| | | | | | | | | |
| Total Investment Securities —98.7% | | | | | | | | |
| (Cost $275,574,732) | | | | | | $ | 329,098,889 | |
| | | | | | | | | |
| Other Assets in Excess of Liabilities — 1.3% | | | | | | | 4,339,634 | |
| | | | | | | | | |
| Net Assets — 100.0% | | | | | | $ | 333,438,523 | |
| * | Non-income producing security. |
| Ω | Represents the 7-day SEC yield as of June 30, 2017. |
Other Information:
The inputs or methodology used for valuing securities may not be an indication of the risk associated with investing in those securities. For more information on valuation inputs, and their aggregation into the levels used in the table below, please refer to the security valuation section in the accompanying Notes to Financial Statements.
Valuation inputs at Reporting Date:
| Description | | Level 1 | | | Level 2 | | | Level 3 | | | Total | |
| | | | | | | | | | | | | |
| Common Stocks | | $ | 323,426,622 | | | $ | — | | | $ | — | | | $ | 323,426,622 | |
| Short-Term Investment Fund | | | 5,672,267 | | | | — | | | | — | | | | 5,672,267 | |
| Total | | $ | 329,098,889 | | | $ | — | | | $ | — | | | $ | 329,098,889 | |
See accompanying Notes to Financial Statements.
Portfolio of Investments
Touchstone Large Company Growth Fund – June 30, 2017
| | | | | | Market | |
| | | Shares | | | Value | |
| | | | | | | |
| Common Stocks — 97.7% | | | | | | | | |
| | | | | | | | | |
| Information Technology — 46.9% | | | | | | | | |
| Adobe Systems, Inc.* | | | 65,900 | | | $ | 9,320,896 | |
| Alibaba Group Holding Ltd. ADR* | | | 97,875 | | | | 13,790,588 | |
| Alphabet, Inc. - Class A* | | | 14,000 | | | | 13,015,520 | |
| Electronic Arts, Inc.* | | | 71,075 | | | | 7,514,049 | |
| Facebook, Inc. - Class A* | | | 95,700 | | | | 14,448,786 | |
| Microsoft Corp. | | | 95,800 | | | | 6,603,494 | |
| PayPal Holdings, Inc.* | | | 85,675 | | | | 4,598,177 | |
| Tencent Holdings Ltd. ADR | | | 383,025 | | | | 13,773,579 | |
| Visa, Inc. - Class A | | | 112,625 | | | | 10,561,972 | |
| | | | | | | | 93,627,061 | |
| | | | | | | | | |
| Consumer Discretionary — 20.0% | | | | | | | | |
| Ctrip.com International Ltd. ADR* | | | 80,300 | | | | 4,324,958 | |
| Newell Brands, Inc. | | | 112,350 | | | | 6,024,207 | |
| Norwegian Cruise Line Holdings Ltd. (Bermuda)* | | | 66,875 | | | | 3,630,644 | |
| Priceline Group, Inc. (The)* | | | 4,850 | | | | 9,072,022 | |
| Royal Caribbean Cruises Ltd. (Liberia) | | | 85,275 | | | | 9,314,588 | |
| Sirius XM Holdings, Inc.† | | | 889,850 | | | | 4,867,480 | |
| Wynn Resorts Ltd. | | | 20,300 | | | | 2,722,636 | |
| | | | | | | | 39,956,535 | |
| | | | | | | | | |
| Health Care — 18.9% | | | | | | | | |
| Abbott Laboratories | | | 66,325 | | | | 3,224,058 | |
| Alexion Pharmaceuticals, Inc.* | | | 45,350 | | | | 5,517,735 | |
| Allergan PLC (Ireland) | | | 13,275 | | | | 3,227,020 | |
| Regeneron Pharmaceuticals, Inc.* | | | 25,025 | | | | 12,290,779 | |
| Shire PLC ADR | | | 25,975 | | | | 4,292,888 | |
| Zoetis, Inc. | | | 145,975 | | | | 9,105,920 | |
| | | | | | | | 37,658,400 | |
| | | | | | | | | |
| Industrials — 4.4% | | | | | | | | |
| Kansas City Southern | | | 43,000 | | | | 4,499,950 | |
| Rockwell Collins, Inc. | | | 41,875 | | | | 4,400,225 | |
| | | | | | | | 8,900,175 | |
| | | | | | | | | |
| Financials — 3.8% | | | | | | | | |
| Charles Schwab Corp. (The) | | | 174,975 | | | | 7,516,926 | |
| | | | | | | | | |
| Consumer Staples — 3.7% | | | | | | | | |
| Monster Beverage Corp.* | | | 148,105 | | | | 7,357,856 | |
| Total Common Stocks | | | | | | $ | 195,016,953 | |
| | | | | | | | | |
| Short-Term Investment Funds — 4.2% | | | | | | | | |
| Dreyfus Government Cash | | | | | | | | |
| Management, Institutional Shares, | | | | | | | | |
| 0.91%∞Ω | | | 3,441,604 | | | $ | 3,441,604 | |
| Invesco Government & Agency | | | | | | | | |
| Portfolio, Institutional Class, | | | | | | | | |
| 0.89%**∞Ω | | | 4,845,159 | | | | 4,845,159 | |
| Total Short-Term Investment Funds | | | | | | $ | 8,286,763 | |
| | | | | | | | | |
| Total Investment Securities —101.9% | | | | | | | | |
| (Cost $141,605,931) | | | | | | $ | 203,303,716 | |
| | | | | | | | | |
| Liabilities in Excess of Other Assets — (1.9%) | | | | | | | (3,751,238 | ) |
| | | | | | | | | |
| Net Assets — 100.0% | | | | | | $ | 199,552,478 | |
| * | Non-income producing security. |
| ** | Represents collateral for securities loaned. |
| † | All or a portion of the security is on loan. The total market value of the securities on loan as of June 30, 2017 was $4,818,731. |
| Ω | Represents the 7-day SEC yield as of June 30, 2017. |
Portfolio Abbreviations:
ADR - American Depositary Receipt
PLC - Public Limited Company
Other Information:
The inputs or methodology used for valuing securities may not be an indication of the risk associated with investing in those securities. For more information on valuation inputs, and their aggregation into the levels used in the table below, please refer to the security valuation section in the accompanying Notes to Financial Statements.
Valuation inputs at Reporting Date:
| Description | | Level 1 | | | Level 2 | | | Level 3 | | | Total | |
| | | | | | | | | | | | | |
| Common Stocks | | $ | 195,016,953 | | | $ | — | | | $ | — | | | $ | 195,016,953 | |
| Short-Term Investment Funds | | | 8,286,763 | | | | — | | | | — | | | | 8,286,763 | |
| Total | | $ | 203,303,716 | | | $ | — | | | $ | — | | | $ | 203,303,716 | |
See accompanying Notes to Financial Statements.
Portfolio of Investments
Touchstone Ohio Tax-Free Bond Fund – June 30, 2017
| Principal | | | | | Interest | | | Maturity | | Market | |
| Amount | | | | | Rate | | | Date | | Value | |
| | | | | | | | | | | | |
| | | | | Fixed Rate Revenue Bonds — 64.2% | | | | | | | | | | |
| $ | 500,000 | | | New Albany OH Cmnty Auth (Ref) Ser C | | | 5.000 | % | | 10/01/24 | | $ | 578,785 | |
| | 2,000,000 | | | OH St Hosp Fac Rev (Cleveland Clinic Hlth) Ser B | | | 5.125 | | | 01/01/28 | | | 2,111,020 | |
| | 375,000 | | | Univ of Akron OH (Ref) Ser A | | | 5.000 | | | 01/01/28 | | | 433,481 | |
| | 650,000 | | | Greene Co OH Hosp Fac Rev (Kettering Health Network) | | | 5.125 | | | 04/01/29 | | | 684,470 | |
| | 650,000 | | | Montgomery Co OH Rev (Unrefunded Catholic Hlth Initiatives) | | | 5.250 | | | 05/01/29 | | | 718,913 | |
| | 345,000 | | | Univ of Toledo OH Ser B | | | 5.000 | | | 06/01/29 | | | 384,216 | |
| | 460,000 | | | Cleveland OH Income Tax Rev (Ref & Impt Sub Lien Pks & Recr) | | | 4.000 | | | 10/01/29 | | | 501,115 | |
| | 750,000 | | | Cleveland OH Income Tax Rev (Ref Sub Lien) Ser B 2 | | | 5.000 | | | 10/01/29 | | | 877,193 | |
| | 500,000 | | | Hamilton Co OH Hosp Facs Rev (Uc Hlth) | | | 5.000 | | | 02/01/30 | | | 563,980 | |
| | 1,000,000 | | | Butler Co OH Hosp Facs (Ref Cincinnati Children's Hosp) | | | 5.000 | | | 05/15/30 | | | 1,227,650 | |
| | 1,000,000 | | | Hamilton Co OH Student Rev (Ref Stratford Heights Proj) | | | 5.000 | | | 06/01/30 | | | 1,080,350 | |
| | 1,000,000 | | | Green OH Cmnty Learning Ctr (Ref) | | | 4.000 | | | 12/01/30 | | | 1,077,450 | |
| | 500,000 | | | Butler Co OH Hosp Facs (Kettering Health Network Oblig) | | | 5.250 | | | 04/01/31 | | | 547,985 | |
| | 1,000,000 | | | Wright OH St Univ (Gen Recpts) Ser A | | | 5.000 | | | 05/01/31 | | | 1,076,550 | |
| | 750,000 | | | Middleburg Heights OH Hosp Rev (Facs Southwest Gen) | | | 5.125 | | | 08/01/31 | | | 826,020 | |
| | 1,000,000 | | | Kent OH St Univ Rev (Gen Recpts) Ser A | | | 4.500 | | | 05/01/32 | | | 1,081,740 | |
| | 1,000,000 | | | Hamilton Co OH Hlth Care Facs (Christ Hosp Proj) | | | 5.250 | | | 06/01/32 | | | 1,131,060 | |
| | 1,000,000 | | | Cuyahoga Co OH COP (Convention Hotel Proj) | | | 5.000 | | | 12/01/32 | | | 1,138,540 | |
| | 1,060,000 | | | OH St EDR (Enterprise Bd Fd) Ser 7 | | | 4.750 | | | 12/01/32 | | | 1,164,961 | |
| | 500,000 | | | OH St Univ Ser A | | | 4.000 | | | 12/01/32 | | | 533,990 | |
| | 150,000 | | | OH Univ Gen Recpts Athens (Ref) Ser A | | | 5.000 | | | 12/01/32 | | | 176,942 | |
| | 265,000 | | | OH St Hgr Edl Fac Commis (Ref Xavier Univ) Ser C | | | 5.000 | | | 05/01/33 | | | 293,888 | |
| | 1,080,000 | | | Hamilton Co OH Hosp Facs Rev (Ref Cincinnati Childrens Hosp) | | | 5.000 | | | 05/15/33 | | | 1,240,358 | |
| | 1,000,000 | | | Hamilton Co OH EDR (Ref King Highland Cmnty Urban) | | | 5.000 | | | 06/01/33 | | | 1,136,750 | |
| | 250,000 | | | Warren Co OH Hlth Care Facs Rev (Ref & Impt Otterbein Homes) | | | 5.000 | | | 07/01/33 | | | 275,012 | |
| | 2,000,000 | | | Cincinnati OH EDR (U Square The Loop Proj) | | | 5.000 | | | 11/01/33 | | | 2,260,320 | |
| | 525,000 | | | OH St Univ Ser A | | | 4.000 | | | 12/01/33 | | | 558,532 | |
| | 265,000 | | | Cleveland OH Wtr Rev (Ref) Ser Y | | | 4.000 | | | 01/01/34 | | | 280,033 | |
| | 625,000 | | | Hamilton Co OH Hosp Facs Rev (Ref Cincinnati Childrens Hosp) | | | 5.000 | | | 05/15/34 | | | 712,331 | |
| | 250,000 | | | Warren Co OH Hlth Care Facs Rev (Ref & Impt Otterbein Homes) | | | 5.000 | | | 07/01/34 | | | 274,360 | |
| | 500,000 | | | Cuyahoga Co OH Sales Tax Rev (Ref) | | | 5.000 | | | 12/01/34 | | | 582,520 | |
| | 570,000 | | | Miami Univ OH (Ref) | | | 5.000 | | | 09/01/35 | | | 666,096 | |
| | 1,085,000 | | | Cincinnati OH Urban Redev Rev (Mercer Commons Phase 2 Proj) Ser B | | | 5.000 | | | 11/01/35 | | | 1,246,253 | |
| | 500,000 | | | Polaris Career Ctr OH COP | | | 5.000 | | | 11/01/35 | | | 569,570 | |
| | 475,000 | | | Cincinnati OH Wtr Sys Rev Ser A | | | 5.000 | | | 12/01/35 | | | 562,904 | |
| | 200,000 | | | Clermont Co OH Port Auth Lease (W Clermont Local Sch Dist Proj) | | | 5.000 | | | 12/01/35 | | | 225,080 | |
| | 500,000 | | | OH St Hgr Edl Fac Commis (Ref Higher Eductnl Fac John Ca) | | | 5.000 | | | 04/01/36 | | | 554,710 | |
| | 350,000 | | | Warren Co OH Hlth Care Facs Rev (Ref Otterbein Homes) Ser A | | | 5.000 | | | 07/01/36 | | | 390,176 | |
| | 765,000 | | | Columbus-Franklin Co Fin Auth (Ref Dublin Bridge Park West Ga) | | | 4.000 | | | 11/15/36 | | | 760,884 | |
| | 250,000 | | | Marysville OH Wst Wtr Treatment (Ref) | | | 4.000 | | | 12/01/37 | | | 259,025 | |
| | 800,000 | | | OH St Hosp Rev (Ref Univ Hosp Hlth System) Ser A | | | 5.000 | | | 01/15/41 | | | 889,656 | |
| | | | | Total Fixed Rate Revenue Bonds | | | | | | | | $ | 31,654,869 | |
| | | | | | | | | | | | | | | |
| | | | | Pre-refunded/Escrowed to Maturity — 18.7% | | | | | | | | | | |
| | 1,000,000 | | | Lakewood OH CSD (Sch Facs Impt) UTGO Pre-refunded @ $100 | | | 5.000 | | | 12/01/17 | | | 1,016,400 | |
| | 1,000,000 | | | Cleveland OH Income Tax Rev (Sub Lien Brdgs & Roadways) Ser B Pre-refunded @ $100 | | | 5.000 | | | 04/01/18 | | | 1,029,700 | |
| | 1,000,000 | | | Mount Healthy OH CSD (Sch Impt) UTGO Pre-refunded @ $100 | | | 5.000 | | | 06/01/18 | | | 1,035,760 | |
| | 1,500,000 | | | Reynoldsburg OH CSD (Sch Facs Constr & Impt) UTGO Pre-refunded @ $100 | | | 5.250 | | | 06/01/18 | | | 1,557,690 | |
| | 1,000,000 | | | OH St Hgr Edl Fac Commis (Xavier Univ) Ser C Pre-refunded @ $100 | | | 5.750 | | | 11/01/18 | | | 1,061,820 | |
| | 1,000,000 | | | Columbus OH CSD (Sch Facs Constr & Impt) UTGO Pre-refunded @ $100 | | | 4.500 | | | 06/01/19 | | | 1,063,640 | |
Touchstone Ohio Tax-Free Bond Fund (Continued)
| Principal | | | | | Interest | | | Maturity | | Market | |
| Amount | | | | | Rate | | | Date | | Value | |
| | | | | | | | | | | | |
| | | | | Pre-refunded/Escrowed to Maturity — 18.7% (Continued) | | | | | | | | | | |
| $ | 1,000,000 | | | Franklin Co OH Hosp Rev (Nationwide Childrens Hosp Impt) Pre-refunded @ $100 | | | 4.750 | % | | 11/01/19 | | $ | 1,082,390 | |
| | 895,000 | | | Milton Union OH Exempt Vlg Sch Dist (Sch Impt) Pre-refunded @ $100 | | | 4.875 | | | 12/01/19 | | | 973,778 | |
| | 350,000 | | | Montgomery Co OH Rev (Prerefunded Catholic Hlth Initiatives) Pre-refunded @ $100 | | | 5.250 | | | 11/12/23 | | | 413,826 | |
| | | | | Total Pre-refunded/Escrowed to Maturity | | | | | | | | $ | 9,235,004 | |
| | | | | | | | | | | | | | | |
| | | | | General Obligation Bonds — 15.5% | | | | | | | | | | |
| | 850,000 | | | Licking Heights OH LSD UTGO | | | 6.400 | | | 12/01/28 | | | 1,089,709 | |
| | 320,000 | | | Brookfield OH LSD (Sch Facs Impt) UTGO | | | 5.000 | | | 01/15/30 | | | 326,378 | |
| | 1,500,000 | | | Cincinnati OH CSD (Ref Sch Impt) LTGO | | | 5.000 | | | 06/01/31 | | | 1,642,275 | |
| | 1,000,000 | | | Toledo OH CSD (Ref Sch Facs Impt) UTGO | | | 5.000 | | | 12/01/32 | | | 1,167,000 | |
| | 300,000 | | | Upper Arlington OH (Ref Various Purpose) LTGO | | | 4.000 | | | 12/01/32 | | | 326,313 | |
| | 250,000 | | | Lakewood OH CSD (Sch Facs Impt) UTGO Ser A | | | 5.000 | | | 11/01/33 | | | 289,715 | |
| | 345,000 | | | Bowling Green OH CSD (Ref) UTGO | | | 5.000 | | | 12/01/34 | | | 401,121 | |
| | 500,000 | | | Elyria OH CSD (Ref) UTGO | | | 4.000 | | | 12/01/34 | | | 526,030 | |
| | 500,000 | | | Three Rivers OH LSD (Ref) UTGO | | | 5.000 | | | 12/01/34 | | | 569,485 | |
| | 435,000 | | | Miami Trace OH LSD UTGO | | | 5.000 | | | 12/01/35 | | | 500,228 | |
| | 200,000 | | | Milford OH Exempt Vlg Sch Dist (Ref) UTGO | | | 5.000 | | | 12/01/35 | | | 231,918 | |
| | 500,000 | | | Lakewood OH (Ref) LTGO | | | 5.000 | | | 12/01/36 | | | 587,660 | |
| | | | | Total General Obligation Bonds | | | | | | | | $ | 7,657,832 | |
| | | | | | | | | | | | | | | |
| | | | | Variable Rate Demand Notes(A) — 1.0% | | | | | | | | | | |
| | | | | | | | | | | | | | | |
| | 500,000 | | | Montgomery Co OH Hosp Rev (Ref Premier Health Miami Valley Hosp) Ser D (LOC: Barclays Bank PLC) | | | 0.750 | | | 11/15/39 | | | 500,000 | |
| | | | | | | | | | | | | | | |
| | | | | Total Investment Securities —99.4% | | | | | | | | | | |
| | | | | (Cost $46,488,139) | | | | | | | | $ | 49,047,705 | |
| | | | | | | | | | | | | | | |
| | | | | Other Assets in Excess of Liabilities — 0.6% | | | | | | | | | 290,136 | |
| | | | | | | | | | | | | | | |
| | | | | Net Assets — 100.0% | | | | | | | | $ | 49,337,841 | |
| (A) | Demand Feature - Maturities shown are the final maturities, not the date on which principal could be recovered through the demand feature. |
Floating and variable rate demand notes (“put bonds”) earn interest at a coupon rate which fluctuates at specified intervals, usually daily, monthly or semi-annually. The maturity dates shown are the final maturity dates. The interest rates shown are the coupon rates in effect at June 30, 2017.
Put bonds may be redeemed at the discretion of the holder on specified dates prior to maturity. Mandatory put bonds are automatically redeemed at a specified put date unless action is taken by the holder to prevent redemption.
Bonds denoted as pre-refunded are anticipated to be redeemed prior to their scheduled maturity. The dates indicated are the stipulated pre-refunded dates.
Touchstone Ohio Tax-Free Bond Fund (Continued)
As of June 30, 2017, the Touchstone Ohio Tax-Free Bond Fund was invested exclusively in debt obligations issued by the State of Ohio and its political subdivisions, agencies, authorities and instrumentalities and by other issuers, the interest from which is exempt from Ohio personal income tax. The Touchstone Ohio Tax-Free Bond Fund is a non-diversified Fund under the Investment Company Act of 1940. Thus, the Fund may invest in fewer issuers than those of a diversified fund. As of June 30, 2017, there were no investments of 10% or greater in any one issuer held by the Fund.
Portfolio Abbreviations:
COP – Certificates of Participation
CSD – City School District
EDR – Economic Development Revenue
LOC – Letter of Credit
LSD – Local School District
LTGO – Limited Tax General Obligation
PLC – Public Limited Company
UTGO – Unlimited Tax General Obligation
Other Information:
The inputs or methodology used for valuing securities may not be an indication of the risk associated with investing in those securities. For more information on valuation inputs, and their aggregation into the levels used in the table below, please refer to the security valuation section in the accompanying Notes of Financial Statements.
Valuation inputs at Reporting Date:
| Description | | Level 1 | | | Level 2 | | | Level 3 | | | Total | |
| | | | | | | | | | | | | |
| Municipal Bonds | | $ | — | | | $ | 49,047,705 | | | $ | — | | | $ | 49,047,705 | |
See accompanying Notes to Financial Statements.
Portfolio of Investments
Touchstone Small Cap Value Opportunities Fund – June 30, 2017
| | | | | | Market | |
| | | Shares | | | Value | |
| | | | | | | |
| Common Stocks — 97.8% | | | | | | | | |
| | | | | | | | | |
| Financials — 29.3% | | | | | | | | |
| Bancorp, Inc. (The)* | | | 145,860 | | | $ | 1,105,619 | |
| BofI Holding, Inc.*† | | | 48,800 | | | | 1,157,536 | |
| Boston Private Financial Holdings, Inc. | | | 110,000 | | | | 1,688,500 | |
| Columbia Banking System, Inc. | | | 42,100 | | | | 1,677,685 | |
| Cowen Group, Inc. - Class A* | | | 99,975 | | | | 1,624,594 | |
| Customers Bancorp, Inc.* | | | 61,820 | | | | 1,748,269 | |
| Federated National Holding Co. | | | 55,700 | | | | 891,200 | |
| First Bancorp/Southern Pines NC | | | 29,400 | | | | 919,044 | |
| First Busey Corp. | | | 56,600 | | | | 1,659,512 | |
| First Cash, Inc. | | | 31,800 | | | | 1,853,940 | |
| Green Dot Corp. - Class A* | | | 35,600 | | | | 1,371,668 | |
| Greenlight Capital Re Ltd. (Cayman Islands) - Class A* | | | 63,200 | | | | 1,320,880 | |
| Homestreet, Inc.* | | | 66,400 | | | | 1,837,620 | |
| Maiden Holdings Ltd. (Bermuda) | | | 98,300 | | | | 1,091,130 | |
| MBIA, Inc.* | | | 184,300 | | | | 1,737,949 | |
| Nationstar Mortgage Holdings, Inc.* | | | 79,600 | | | | 1,424,044 | |
| Popular, Inc. (Puerto Rico) | | | 28,800 | | | | 1,201,248 | |
| Radian Group, Inc. | | | 84,500 | | | | 1,381,575 | |
| Republic First Bancorp, Inc.*† | | | 75,300 | | | | 696,525 | |
| Simmons First National Corp. - Class A | | | 28,800 | | | | 1,523,520 | |
| South State Corp. | | | 17,100 | | | | 1,465,470 | |
| Stewart Information Services Corp. | | | 27,700 | | | | 1,257,026 | |
| Stifel Financial Corp.* | | | 22,800 | | | | 1,048,344 | |
| Texas Capital Bancshares, Inc.* | | | 25,000 | | | | 1,935,000 | |
| | | | | | | | 33,617,898 | |
| | | | | | | | | |
| Industrials — 17.5% | | | | | | | | |
| Air Transport Services Group, Inc.* | | | 63,000 | | | | 1,372,140 | |
| Apogee Enterprises, Inc. | | | 24,000 | | | | 1,364,160 | |
| Comfort Systems USA, Inc. | | | 43,000 | | | | 1,595,300 | |
| Covanta Holding Corp.† | | | 104,000 | | | | 1,372,800 | |
| Dycom Industries, Inc.* | | | 15,500 | | | | 1,387,560 | |
| EnerSys, Inc. | | | 15,200 | | | | 1,101,240 | |
| Engility Holdings, Inc.* | | | 40,800 | | | | 1,158,720 | |
| Interface, Inc. | | | 78,600 | | | | 1,544,490 | |
| ITT, Inc. | | | 34,900 | | | | 1,402,282 | |
| MRC Global, Inc.* | | | 46,350 | | | | 765,702 | |
| Navigant Consulting, Inc.* | | | 69,900 | | | | 1,381,224 | |
| Patrick Industries, Inc.* | | | 7,700 | | | | 560,945 | |
| SP Plus Corp.* | | | 28,800 | | | | 879,840 | |
| Steelcase, Inc. - Class A | | | 63,400 | | | | 887,600 | |
| Tutor Perini Corp.* | | | 40,100 | | | | 1,152,875 | |
| Viad Corp. | | | 19,450 | | | | 919,012 | |
| YRC Worldwide, Inc.* | | | 107,400 | | | | 1,194,288 | |
| | | | | | | | 20,040,178 | |
| | | | | | | | | |
| Information Technology — 12.2% | | | | | | | | |
| Blackhawk Network Holdings, Inc.* | | | 28,700 | | | | 1,251,320 | |
| CACI International, Inc. - Class A* | | | 9,275 | | | | 1,159,839 | |
| CalAmp Corp.* | | | 43,500 | | | | 884,355 | |
| Diebold Nixdorf, Inc. | | | 59,600 | | | | 1,668,800 | |
| Entegris, Inc.* | | | 25,100 | | | | 550,945 | |
| Finisar Corp.* | | | 30,700 | | | | 797,586 | |
| Methode Electronics, Inc. | | | 27,700 | | | | 1,141,240 | |
| Oclaro, Inc.*† | | | 173,300 | | | | 1,618,622 | |
| Semtech Corp.* | | | 42,500 | | | | 1,519,375 | |
| ShoreTel, Inc.* | | | 164,900 | | | | 956,420 | |
| Super Micro Computer, Inc.* | | | 48,800 | | | | 1,202,920 | |
| TiVo Corp. | | | 66,816 | | | | 1,246,118 | |
| | | | | | | | 13,997,540 | |
| | | | | | | | | |
| Consumer Discretionary — 11.0% | | | | | | | | |
| Amaya, Inc.*† | | | 63,300 | | | | 1,133,070 | |
| AMC Entertainment Holdings, Inc. - Class A | | | 56,300 | | | | 1,280,825 | |
| Bloomin' Brands, Inc. | | | 66,100 | | | | 1,403,303 | |
| Boot Barn Holdings, Inc.*† | | | 88,600 | | | | 627,288 | |
| Finish Line, Inc. (The) - Class A | | | 61,000 | | | | 864,370 | |
| Gentherm, Inc.* | | | 39,700 | | | | 1,540,360 | |
| Motorcar Parts of America, Inc.* | | | 40,100 | | | | 1,132,424 | |
| New Media Investment Group, Inc. | | | 65,687 | | | | 885,461 | |
| Red Robin Gourmet Burgers, Inc.* | | | 15,600 | | | | 1,017,900 | |
| SeaWorld Entertainment, Inc. | | | 75,000 | | | | 1,220,250 | |
| TRI Pointe Group, Inc.* | | | 115,400 | | | | 1,522,126 | |
| | | | | | | | 12,627,377 | |
| | | | | | | | | |
| Real Estate — 8.2% | | | | | | | | |
| Columbia Property Trust, Inc. REIT | | | 57,300 | | | | 1,282,375 | |
| CoreCivic, Inc. REIT | | | 29,400 | | | | 810,852 | |
| Equity Commonwealth REIT* | | | 62,200 | | | | 1,965,520 | |
| FelCor Lodging Trust, Inc. REIT | | | 238,500 | | | | 1,719,585 | |
| HFF, Inc. - Class A | | | 33,600 | | | | 1,168,272 | |
| New Senior Investment Group, Inc. REIT | | | 75,716 | | | | 760,946 | |
| Retail Opportunity Investments Corp. REIT | | | 88,000 | | | | 1,688,720 | |
| | | | | | | | 9,396,270 | |
| | | | | | | | | |
| Energy — 4.6% | | | | | | | | |
| Aegean Marine Petroleum Network, Inc. (Marshall Islands)† | | | 97,000 | | | | 567,450 | |
| Basic Energy Services, Inc.*† | | | 52,300 | | | | 1,302,270 | |
| Delek US Holdings, Inc. | | | 43,500 | | | | 1,150,140 | |
| McDermott International, Inc.* | | | 136,800 | | | | 980,856 | |
| Ring Energy, Inc.* | | | 101,100 | | | | 1,314,300 | |
| | | | | | | | 5,315,016 | |
| | | | | | | | | |
| Health Care — 4.3% | | | | | | | | |
| AMN Healthcare Services, Inc.* | | | 31,325 | | | | 1,223,241 | |
| BioTelemetry, Inc.* | | | 43,600 | | | | 1,458,420 | |
| Lannett Co., Inc.*† | | | 28,200 | | | | 575,280 | |
| Tivity Health, Inc.* | | | 40,500 | | | | 1,613,925 | |
| | | | | | | | 4,870,866 | |
| | | | | | | | | |
| Materials — 4.0% | | | | | | | | |
| Compass Minerals International, Inc.† | | | 22,500 | | | | 1,469,250 | |
| Ferro Corp.* | | | 75,000 | | | | 1,371,750 | |
| Ferroglobe PLC (United Kingdom) | | | 142,900 | | | | 1,707,655 | |
| Ferroglobe Representation and Warranty Insurance Trust(A)(B) | | | 173,700 | | | | — | |
| | | | | | | | 4,548,655 | |
| | | | | | | | | |
| Consumer Staples — 3.6% | | | | | | | | |
| Andersons, Inc. (The) | | | 23,000 | | | | 785,450 | |
Touchstone Small Cap Value Opportunities Fund (Continued)
| | | | | | Market | |
| | | Shares | | | Value | |
| | | | | | | |
| Common Stocks — 97.8% (Continued) | | | | | | | | |
| | | | | | | | | |
| Consumer Staples — (Continued) | | | | | | | | |
| Casey's General Stores, Inc. | | | 15,800 | | | $ | 1,692,338 | |
| United Natural Foods, Inc.* | | | 45,700 | | | | 1,677,190 | |
| | | | | | | | 4,154,978 | |
| | | | | | | | | |
| Utilities — 1.9% | | | | | | | | |
| NorthWestern Corp. | | | 13,400 | | | | 817,668 | |
| Portland General Electric Co. | | | 29,100 | | | | 1,329,579 | |
| | | | | | | | 2,147,247 | |
| | | | | | | | | |
| Telecommunication Services — 1.2% | | | | | | | | |
| Vonage Holdings Corp.* | | | 211,900 | | | | 1,385,826 | |
| Total Common Stocks | | | | | | $ | 112,101,851 | |
| | | | | | | | | |
| Short-Term Investment Funds — 10.0% | | | | | | | | |
| Dreyfus Government Cash Management, Institutional Shares, 0.91%∞Ω | | | 3,460,032 | | | | 3,460,032 | |
| Invesco Government & Agency Portfolio, Institutional Class, 0.89%**∞Ω | | | 7,965,992 | | | | 7,965,992 | |
| Total Short-Term Investment Funds | | | | | | $ | 11,426,024 | |
| | | | | | | | | |
| Total Investment Securities —107.8% | | | | | | | | |
| (Cost $112,692,069) | | | | | | $ | 123,527,875 | |
| | | | | | | | | |
| Liabilities in Excess of Other Assets — (7.8%) | | | | | | | (8,929,275 | ) |
| | | | | | | | | |
| Net Assets — 100.0% | | | | | | $ | 114,598,600 | |
| (A) | Level 3 - For more information on valuation inputs, and their aggregation into the levels used in the table below, please refer to the security valuation section in the accompanying Notes to Financial Statements. |
| (B) | This is a restricted security that cannot be sold to qualified institutional buyers. At June 30, 2017, these securities were valued at $0 or 0.0% of net assets. |
| * | Non-income producing security. |
| ** | Represents collateral for securities loaned. |
| † | All or a portion of the security is on loan. The total market value of the securities on loan as of June 30, 2017 was $7,739,975. |
| Ω | Represents the 7-day SEC yield as of June 30, 2017. |
Portfolio Abbreviations:
PLC - Public Limited Company
REIT - Real Estate Investment Trust
Other Information:
The inputs or methodology used for valuing securities may not be an indication of the risk associated with investing in those securities. For more information on valuation inputs, and their aggregation into the levels used in the table below, please refer to the security valuation section in the accompanying Notes to Financial Statements.
Valuation inputs at Reporting Date:
| Description | | Level 1 | | | Level 2 | | | Level 3 | | | Total | |
| | | | | | | | | | | | | |
| Common Stocks | | $ | 112,101,851 | | | $ | — | | | $ | — | | | $ | 112,101,851 | |
| Short-Term Investment Funds | | | 11,426,024 | | | | — | | | | — | | | | 11,426,024 | |
| Total | | $ | 123,527,875 | | | $ | — | | | $ | — | | | $ | 123,527,875 | |
See accompanying Notes to Financial Statements.
Portfolio of Investments
Touchstone Value Fund – June 30, 2017
| | | | | | Market | |
| | | Shares | | | Value | |
| | | | | | | |
| Common Stocks — 97.8% | | | | | | | | |
| | | | | | | | | |
| Health Care — 23.6% | | | | | | | | |
| Anthem, Inc. | | | 66,660 | | | $ | 12,540,746 | |
| Cardinal Health, Inc. | | | 109,900 | | | | 8,563,408 | |
| Express Scripts Holding Co.* | | | 117,218 | | | | 7,483,197 | |
| Johnson & Johnson | | | 80,640 | | | | 10,667,866 | |
| Medtronic PLC (Ireland) | | | 153,771 | | | | 13,647,176 | |
| Merck & Co., Inc. | | | 118,429 | | | | 7,590,115 | |
| Pfizer, Inc. | | | 289,639 | | | | 9,728,974 | |
| Sanofi ADR | | | 161,628 | | | | 7,743,597 | |
| Teva Pharmaceutical Industries Ltd. ADR | | | 188,538 | | | | 6,263,232 | |
| UnitedHealth Group, Inc. | | | 31,439 | | | | 5,829,419 | |
| | | | | | | | 90,057,730 | |
| | | | | | | | | |
| Financials — 19.2% | | | | | | | | |
| American Express Co. | | | 97,242 | | | | 8,191,666 | |
| American International Group, Inc. | | | 150,777 | | | | 9,426,578 | |
| Bank of America Corp. | | | 360,164 | | | | 8,737,579 | |
| Citigroup, Inc. | | | 143,189 | | | | 9,576,480 | |
| JPMorgan Chase & Co. | | | 134,881 | | | | 12,328,123 | |
| PNC Financial Services Group, Inc. (The) | | | 23,560 | | | | 2,941,937 | |
| State Street Corp. | | | 43,605 | | | | 3,912,677 | |
| Wells Fargo & Co. | | | 226,732 | | | | 12,563,220 | |
| Xl Group Ltd.(Bermuda) | | | 124,000 | | | | 5,431,200 | |
| | | | | | | | 73,109,460 | |
| | | | | | | | | |
| Energy — 11.3% | | | | | | | | |
| BP PLC ADR | | | 308,846 | | | | 10,701,514 | |
| Chevron Corp. | | | 77,400 | | | | 8,075,142 | |
| ConocoPhillips | | | 207,426 | | | | 9,118,447 | |
| Occidental Petroleum Corp. | | | 125,630 | | | | 7,521,468 | |
| Phillips 66 | | | 94,343 | | | | 7,801,223 | |
| | | | | | | | 43,217,794 | |
| | | | | | | | | |
| Information Technology — 10.5% | | | | | | | | |
| Microsoft Corp. | | | 135,094 | | | | 9,312,029 | |
| Oracle Corp. | | | 245,873 | | | | 12,328,072 | |
| Qualcomm, Inc. | | | 202,608 | | | | 11,188,014 | |
| Texas Instruments, Inc. | | | 92,789 | | | | 7,138,258 | |
| | | | | | | | 39,966,373 | |
| | | | | | | | | |
| Industrials — 10.5% | | | | | | | | |
| General Dynamics Corp. | | | 32,164 | | | | 6,371,688 | |
| Honeywell International, Inc. | | | 47,106 | | | | 6,278,759 | |
| Johnson Controls International PLC (Ireland) | | | 259,141 | | | | 11,236,354 | |
| Norfolk Southern Corp. | | | 24,100 | | | | 2,932,970 | |
| Raytheon Co. | | | 20,268 | | | | 3,272,877 | |
| United Technologies Corp. | | | 80,300 | | | | 9,805,433 | |
| | | | | | | | 39,898,081 | |
| | | | | | | | | |
| Consumer Staples — 9.6% | | | | | | | | |
| Altria Group, Inc. | | | 153,288 | | | | 11,415,357 | |
| CVS Health Corp. | | | 148,800 | | | | 11,972,448 | |
| Philip Morris International, Inc. | | | 111,245 | | | | 13,065,725 | |
| | | | | | | | 36,453,530 | |
| | | | | | | | | |
| Consumer Discretionary — 5.7% | | | | | | | | |
| Carnival Corp. (Panama) | | | 76,459 | | | | 5,013,417 | |
| Dollar General Corp. | | | 51,300 | | | | 3,698,217 | |
| Lowe's Cos., Inc. | | | 87,942 | | | | 6,818,143 | |
| Twenty-First Century Fox, Inc. - Class A | | | 219,300 | | | | 6,214,962 | |
| | | | | | | | 21,744,739 | |
| | | | | | | | | |
| Materials — 4.2% | | | | | | | | |
| Air Products & Chemicals, Inc. | | | 83,100 | | | | 11,888,286 | |
| EI du Pont de Nemours & Co. | | | 53,200 | | | | 4,293,772 | |
| | | | | | | | 16,182,058 | |
| | | | | | | | | |
| Telecommunication Services — 3.2% | | | | | | | | |
| AT&T, Inc. | | | 90,359 | | | | 3,409,245 | |
| Verizon Communications, Inc. | | | 193,851 | | | | 8,657,386 | |
| | | | | | | | 12,066,631 | |
| Total Common Stocks | | | | | | $ | 372,696,396 | |
| | | | | | | | | |
| Short-Term Investment Fund — 2.2% | | | | | | | | |
| Dreyfus Government Cash Management, Institutional Shares, 0.91%∞Ω | | | 8,355,754 | | | | 8,355,754 | |
| | | | | | | | | |
| Total Investment Securities —100.0% | | | | | | | | |
| (Cost $282,179,534) | | | | | | $ | 381,052,150 | |
| | | | | | | | | |
| Other Assets in Excess of Liabilities — 0.0% | | | | | | | 66,362 | |
| | | | | | | | | |
| Net Assets — 100.0% | | | | | | $ | 381,118,512 | |
| * | Non-income producing security. |
| Ω | Represents the 7-day SEC yield as of June 30, 2017. |
Portfolio Abbreviations:
ADR - American Depositary Receipt
PLC - Public Limited Company
Touchstone Value Fund (Continued)
Other Information:
The inputs or methodology used for valuing securities may not be an indication of the risk associated with investing in those securities. For more information on valuation inputs, and their aggregation into the levels used in the table below, please refer to the security valuation section in the accompanying Notes to Financial Statements.
Valuation inputs at Reporting Date:
| Description | | Level 1 | | | Level 2 | | | Level 3 | | | Total | |
| | | | | | | | | | | | | |
| Common Stocks | | $ | 372,696,396 | | | $ | — | | | $ | — | | | $ | 372,696,396 | |
| Short-Term Investment Fund | | | 8,355,754 | | | | — | | | | — | | | | 8,355,754 | |
| Total | | $ | 381,052,150 | | | $ | — | | | $ | — | | | $ | 381,052,150 | |
See accompanying Notes to Financial Statements.
This page intentionally left blank.
Statements of Assets and Liabilities
June 30, 2017
| | | Touchstone | | | Touchstone | | | Touchstone | | | | |
| | | Credit | | | Global | | | International | | | Touchstone | |
| | | Opportunities | | | Growth | | | Small Cap | | | Large Cap | |
| | | Fund | | | Fund | | | Fund | | | Fund | |
| Assets | | | | | | | | | | | | | | | | |
| Investments, at cost | | $ | 52,960,124 | | | $ | 19,420,365 | | | $ | 278,413,602 | | | $ | 275,574,732 | |
| Investments, at market value (A) | | $ | 54,391,915 | | | $ | 24,917,651 | | | $ | 326,552,076 | | | $ | 329,098,889 | |
| Cash | | | 58,291 | | | | — | | | | 727 | | | | — | |
| Cash deposits held at prime broker* | | | 69,394 | | | | — | | | | — | | | | — | |
| Foreign currency (B) | | | 24,263 | | | | 2,393 | | | | 2,951,588 | | | | — | |
| Dividends and interest receivable | | | 717,580 | | | | 17,193 | | | | 555,928 | | | | 353,018 | |
| Receivable for capital shares sold | | | 5,786 | | | | — | | | | 548,119 | | | | 4,435,023 | |
| Receivable for investments sold | | | 904,156 | | | | — | | | | 6,758,330 | | | | — | |
| Receivable for securities lending income | | | 1,389 | | | | 1,066 | | | | 14,467 | | | | 969 | |
| Tax reclaim receivable | | | — | | | | 1,337 | | | | 195,423 | | | | — | |
| Other assets | | | 7,139 | | | | 2,352 | | | | 29,711 | | | | 20,860 | |
| Total Assets | | | 56,179,913 | | | | 24,941,992 | | | | 337,606,369 | | | | 333,908,759 | |
| | | | | | | | | | | | | | | | | |
| Liabilities | | | | | | | | | | | | | | | | |
| Unrealized depreciation on unfunded loan commitments** | | | 432 | | | | — | | | | — | | | | — | |
| Securities sold short (C) | | | 151,500 | | | | — | | | | — | | | | — | |
| Dividends and interest payable on securities sold short | | | 3,996 | | | | — | | | | — | | | | — | |
| Bank overdrafts | | | — | | | | 4,944 | | | | — | | | | — | |
| Dividends payable | | | — | | | | — | | | | — | | | | — | |
| Deferred foreign capital gains tax** | | | — | | | | 9,826 | | | | — | | | | — | |
| Payable for return of collateral for securities on loan | | | 688,446 | | | | 565,191 | | | | 11,271,986 | | | | — | |
| Payable for capital shares redeemed | | | 53,392 | | | | — | | | | 746,926 | | | | 143,840 | |
| Payable for investments purchased | | | 1,641,649 | | | | — | | | | 10,112,392 | | | | — | |
| Payable to Investment Advisor | | | 48,369 | | | | 48,822 | | | | 241,212 | | | | 186,858 | |
| Payable to other affiliates | | | 132 | | | | 132 | | | | 43,468 | | | | 13,423 | |
| Payable to Trustees | | | 3,899 | | | | 3,899 | | | | 3,899 | | | | 3,899 | |
| Payable to Transfer Agent | | | 138 | | | | 1,327 | | | | 73,413 | | | | 85,362 | |
| Payable for reports to shareholders | | | 4,175 | | | | 4,198 | | | | 11,399 | | | | 9,923 | |
| Payable for professional services | | | 35,873 | | | | 40,272 | | | | 44,484 | | | | 23,858 | |
| Other accrued expenses and liabilities | | | 16,427 | | | | 3,121 | | | | 29,034 | | | | 3,073 | |
| Total Liabilities | | | 2,648,428 | | | | 681,732 | | | | 22,578,213 | | | | 470,236 | |
| Net Assets | | $ | 53,531,485 | | | $ | 24,260,260 | | | $ | 315,028,156 | | | $ | 333,438,523 | |
| | | | | | | | | | | | | | | | | |
| Net assets consist of: | | | | | | | | | | | | | | | | |
| Paid-in capital | | $ | 51,047,637 | | | $ | 18,791,284 | | | $ | 279,064,115 | | | $ | 297,451,222 | |
| Accumulated net investment income (loss) | | | 73,952 | | | | — | | | | 1,533,686 | | | | 1,334,817 | |
| Accumulated net realized gains (losses) on investments, foreign currency transactions, written options and securities sold short | | | 934,275 | | | | (18,530 | ) | | | (13,742,285 | ) | | | (18,871,673 | ) |
| Net unrealized appreciation on investments, foreign currency transactions, securities sold short and unfunded loan commitments | | | 1,475,621 | | | | 5,487,506 | | | | 48,172,640 | | | | 53,524,157 | |
| Net Assets | | $ | 53,531,485 | | | $ | 24,260,260 | | | $ | 315,028,156 | | | $ | 333,438,523 | |
| (A) Includes market value of securities on loan of: | | $ | 664,631 | | | $ | 562,108 | | | $ | 10,522,169 | | | $ | — | |
| (B) Cost of foreign currency: | | $ | 22,501 | | | $ | 2,397 | | | $ | 2,914,185 | | | $ | — | |
| (C) Proceeds received for securities sold short: | | $ | 194,000 | | | $ | — | | | $ | — | | | $ | — | |
* Represents segregated cash for securities sold short.
** See Note 2 in Notes to Financial Statements.
See accompanying Notes to Financial Statements.
Statements of Assets and Liabilities (Continued)
| Touchstone | | | Touchstone | | | Touchstone | | | | |
| Large Company | | | Ohio Tax-Free | | | Small Cap Value | | | Touchstone | |
| Growth | | | Bond | | | Opportunities | | | Value | |
| Fund | | | Fund | | | Fund | | | Fund | |
| | | | | | | | | | | |
| $ | 141,605,931 | | | $ | 46,488,139 | | | $ | 112,692,069 | | | $ | 282,179,534 | |
| $ | 203,303,716 | | | $ | 49,047,705 | | | $ | 123,527,875 | | | $ | 381,052,150 | |
| | 34 | | | | 12,244 | | | | 145,880 | | | | — | |
| | — | | | | — | | | | — | | | | — | |
| | — | | | | — | | | | — | | | | — | |
| | 77,351 | | | | 382,906 | | | | 97,915 | | | | 592,971 | |
| | 3,202,023 | | | | 7,046 | | | | 23,318 | | | | 712,195 | |
| | — | | | | — | | | | 248,553 | | | | — | |
| | 9,912 | | | | — | | | | 6,016 | | | | — | |
| | — | | | | — | | | | — | | | | — | |
| | 16,166 | | | | 9,683 | | | | 22,057 | | | | 28,689 | |
| | 206,609,202 | | | | 49,459,584 | | | | 124,071,614 | | | | 382,386,005 | |
| | | | | | | | | | | | | | | |
| | | | | | | | | | | | | | | |
| | — | | | | — | | | | — | | | | — | |
| | — | | | | — | | | | — | | | | — | |
| | — | | | | — | | | | — | | | | — | |
| | — | | | | — | | | | — | | | | — | |
| | — | | | | 35,791 | | | | — | | | | — | |
| | — | | | | — | | | | — | | | | — | |
| | 4,845,159 | | | | — | | | | 7,965,992 | | | | — | |
| | 25,200 | | | | 16,639 | | | | 13,895 | | | | 966,762 | |
| | 2,009,300 | | | | — | | | | 1,332,527 | | | | — | |
| | 93,034 | | | | 10,799 | | | | 85,101 | | | | 190,078 | |
| | 37,269 | | | | 13,454 | | | | 8,304 | | | | 15,391 | |
| | 3,899 | | | | 3,899 | | | | 3,899 | | | | 3,899 | |
| | 14,663 | | | | 7,897 | | | | 29,431 | | | | 54,404 | |
| | 4,713 | | | | 4,689 | | | | 8,857 | | | | 10,774 | |
| | 20,981 | | | | 23,112 | | | | 21,459 | | | | 22,795 | |
| | 2,506 | | | | 5,463 | | | | 3,549 | | | | 3,390 | |
| | 7,056,724 | | | | 121,743 | | | | 9,473,014 | | | | 1,267,493 | |
| $ | 199,552,478 | | | $ | 49,337,841 | | | $ | 114,598,600 | | | $ | 381,118,512 | |
| | | | | | | | | | | | | | | |
| | | | | | | | | | | | | | | |
| $ | 132,794,524 | | | $ | 46,819,315 | | | $ | 108,418,257 | | | $ | 271,302,378 | |
| | — | | | | (18,495 | ) | | | 185 | | | | 166,545 | |
| | 5,060,169 | | | | (22,545 | ) | | | (4,655,648 | ) | | | 10,776,973 | |
| | 61,697,785 | | | | 2,559,566 | | | | 10,835,806 | | | | 98,872,616 | |
| $ | 199,552,478 | | | $ | 49,337,841 | | | $ | 114,598,600 | | | $ | 381,118,512 | |
| $ | 4,818,731 | | | $ | — | | | $ | 7,739,975 | | | $ | — | |
| $ | — | | | $ | — | | | $ | — | | | $ | — | |
| $ | — | | | $ | — | | | $ | — | | | $ | — | |
Statements of Assets and Liabilities (Continued)
| | | Touchstone | | | Touchstone | | | Touchstone | | | | |
| | | Credit | | | Global | | | International | | | Touchstone | |
| | | Opportunities | | | Growth | | | Small Cap | | | Large Cap | |
| | | Fund | | | Fund | | | Fund | | | Fund | |
| | | | | | | | | | | | | |
| Pricing of Class A Shares | | | | | | | | | | | | | | | | |
| Net assets applicable to Class A shares | | $ | 45,099 | | | $ | 140,074 | | | $ | 16,529,228 | | | $ | 5,367,555 | |
Shares of beneficial interest outstanding
(unlimited number of shares authorized, no par value) | | | 4,331 | | | | 6,296 | | | | 985,203 | | | | 448,828 | |
| Net asset value price per share* | | $ | 10.41 | | | $ | 22.25 | | | $ | 16.78 | | | $ | 11.96 | |
| Maximum sales charge - Class A shares | | | 5.75 | % | | | 5.75 | % | | | 5.75 | % | | | 5.75 | % |
| Maximum offering price per share (100%/(100%-maximum sales charge) of net asset value adjusted to the nearest cent) - Class A shares | | $ | 11.05 | | | $ | 23.61 | | | $ | 17.80 | | | $ | 12.69 | |
| | | | | | | | | | | | | | | | | |
| Pricing of Class C Shares | | | | | | | | | | | | | | | | |
| Net assets applicable to Class C shares | | $ | 21,744 | | | $ | 2,948 | | | $ | 2,818,130 | | | $ | 8,102,445 | |
Shares of beneficial interest outstanding
(unlimited number of shares authorized, no par value) | | | 2,082 | | | | 133 | | | | 171,142 | | | | 686,659 | |
| Net asset value and offering price per share** | | $ | 10.44 | | | $ | 22.10 | | | $ | 16.47 | | | $ | 11.80 | |
| | | | | | | | | | | | | | | | | |
| Pricing of Class Y Shares | | | | | | | | | | | | | | | | |
| Net assets applicable to Class Y shares | | $ | 315,063 | | | $ | 161,457 | | | $ | 146,743,545 | | | $ | 222,080,195 | |
Shares of beneficial interest outstanding
(unlimited number of shares authorized, no par value) | | | 30,279 | | | | 7,257 | | | | 8,525,557 | | | | 18,508,799 | |
| Net asset value, offering price and redemption price per share | | $ | 10.41 | | | $ | 22.25 | | | $ | 17.21 | | | $ | 12.00 | |
| | | | | | | | | | | | | | | | | |
| Pricing of Institutional Class Shares | | | | | | | | | | | | | | | | |
| Net assets applicable to Institutional Class shares | | $ | 53,149,579 | | | $ | 23,955,781 | | | $ | 148,937,253 | | | $ | 97,888,328 | |
Shares of beneficial interest outstanding
(unlimited number of shares authorized, no par value) | | | 5,106,171 | | | | 1,074,068 | | | | 8,605,829 | | | | 8,146,547 | |
| Net asset value, offering price and redemption price per share | | $ | 10.41 | | | $ | 22.30 | | | $ | 17.31 | | | $ | 12.02 | |
| * | There is no sales load on subscriptions of $1 million or more. Redemptions that were part of a $1 million or more subscription may be subject to a contingent deferred sales load if redeemed within a one-year period from the date of purchase. |
| ** | Redemption price per share varies by length of time shares are held due to the terms of the contingent deferred sales charge. |
See accompanying Notes to Financial Statements.
Statements of Assets and Liabilities (Continued)
| Touchstone | | | Touchstone | | | Touchstone | | | | |
| Large Company | | | Ohio Tax-Free | | | Small Cap Value | | | Touchstone | |
| Growth | | | Bond | | | Opportunities | | | Value | |
| Fund | | | Fund | | | Fund | | | Fund | |
| | | | | | | | | | | |
| | | | | | | | | | | |
| $ | 139,770 | | | $ | 42,818,078 | | | $ | 2,849,349 | | | $ | 43,607,211 | |
| | | | | | | | | | | | | | | |
| | 3,935 | | | | 3,706,291 | | | | 170,016 | | | | 4,303,326 | |
| $ | 35.52 | | | $ | 11.55 | | | $ | 16.76 | | | $ | 10.13 | |
| | 5.75 | % | | | 4.75 | % | | | 5.75 | % | | | 5.75 | % |
| | | | | | | | | | | | | | | |
| | | | | | | | | | | | | | | |
| $ | 37.69 | | | $ | 12.13 | | | $ | 17.78 | | | $ | 10.75 | |
| | | | | | | | | | | | | | | |
| | | | | | | | | | | | | | | |
| $ | 30,608 | | | $ | 6,514,807 | | | $ | 801,223 | | | $ | 4,502,650 | |
| | | | | | | | | | | | | | | |
| | 867 | | | | 563,123 | | | | 49,511 | | | | 445,637 | |
| $ | 35.29 | | | $ | 11.57 | | | $ | 16.18 | | | $ | 10.10 | |
| | | | | | | | | | | | | | | |
| | | | | | | | | | | | | | | |
| $ | 9,938,202 | | | $ | 2,479 | | | $ | 105,691,523 | | | $ | 83,973,813 | |
| | | | | | | | | | | | | | | |
| | 279,184 | | | | 214 | | | | 5,924,568 | | | | 8,256,847 | |
| $ | 35.60 | | | $ | 11.56 | | | $ | 17.84 | | | $ | 10.17 | |
| | | | | | | | | | | | | | | |
| | | | | | | | | | | | | | | |
| $ | 189,443,898 | | | $ | 2,477 | | | $ | 5,256,505 | | | $ | 249,034,838 | |
| | | | | | | | | | | | | | | |
| | 5,316,921 | | | | 214 | | | | 290,391 | | | | 24,547,699 | |
| $ | 35.63 | | | $ | 11.56 | | | $ | 18.10 | | | $ | 10.14 | |
Statements of Operations
For the Year Ended June 30, 2017
| | | Touchstone | | | Touchstone | | | Touchstone | |
| | | Credit | | | Global | | | International | |
| | | Opportunities | | | Growth | | | Small Cap | |
| | | Fund | | | Fund(B) | | | Fund | |
| Investment Income | | | | | | | | | | | | |
| Dividends(A) | | $ | 18,202 | | | $ | 156,132 | | | $ | 6,921,350 | |
| Interest | | | 3,387,948 | | | | — | | | | — | |
| Income from securities loaned | | | 2,699 | | | | 5,016 | | | | 322,373 | |
| Total Investment Income | | | 3,408,849 | | | | 161,148 | | | | 7,243,723 | |
| Expenses | | | | | | | | | | | | |
| Investment advisory fees | | | 594,554 | | | | 157,890 | | | | 3,241,088 | |
| Administration fees | | | 78,373 | | | | 31,144 | | | | 498,011 | |
| Compliance fees and expenses | | | 2,628 | | | | 2,368 | | | | 2,628 | |
| Custody fees | | | 35,355 | | | | 9,572 | | | | 117,902 | |
| Professional fees | | | 40,991 | | | | 51,571 | | | | 78,412 | |
| Transfer Agent fees, Class A | | | 78 | | | | 28 | | | | 29,770 | |
| Transfer Agent fees, Class C | | | 41 | | | | 15 | | | | 5,286 | |
| Transfer Agent fees, Class Y | | | 89 | | | | 16 | | | | 177,681 | |
| Transfer Agent fees, Institutional Class | | | 80 | | | | 14,156 | | | | 58,473 | |
| Registration Fees, Class A | | | 2,884 | | | | 2,176 | | | | 18,572 | |
| Registration Fees, Class C | | | 2,884 | | | | 2,179 | | | | 9,283 | |
| Registration Fees, Class Y | | | 3,136 | | | | 2,179 | | | | 26,926 | |
| Registration Fees, Institutional Class | | | 3,382 | | | | 15,753 | | | | 21,768 | |
| Dividend expense on securities sold short | | | 2,006 | | | | — | | | | — | |
| Interest expense on securities sold short | | | 95,412 | | | | — | | | | — | |
| Reports to Shareholders, Class A | | | 2,905 | | | | 3,083 | | | | 5,615 | |
| Reports to Shareholders, Class C | | | 2,881 | | | | 3,083 | | | | 3,530 | |
| Reports to Shareholders, Class Y | | | 2,885 | | | | 3,083 | | | | 15,085 | |
| Reports to Shareholders, Institutional Class | | | 2,901 | | | | 3,195 | | | | 4,990 | |
| Shareholder servicing fees, Institutional Class | | | — | | | | 351 | | | | — | |
| Distribution expenses, Class A | | | 104 | | | | 32 | | | | 46,945 | |
| Distribution and shareholder servicing expenses, Class C | | | 82 | | | | 22 | | | | 32,739 | |
| Trustee fees | | | 15,582 | | | | 15,582 | | | | 15,582 | |
| Other expenses | | | 43,235 | | | | 17,572 | | | | 87,122 | |
| Total Expenses | | | 932,468 | | | | 335,050 | | | | 4,497,408 | |
| Fees waived and/or reimbursed by the Advisor and/or Affiliates(C) | | | (110,423 | ) | | | (148,884 | ) | | | (154,688 | ) |
| Net Expenses | | | 822,045 | | | | 186,166 | | | | 4,342,720 | |
| Net Investment Income (Loss) | | | 2,586,804 | | | | (25,018 | ) | | | 2,901,003 | |
| Realized and Unrealized Gains (Losses) on Investments | | | | | | | | | | | | |
| Net realized gains (losses) on investments | | | 1,430,829 | | | | 158,650 | | | | 8,172,766 | |
| Net realized gains (losses) on foreign currency transactions | | | 3,993 | | | | (5,110 | ) | | | (183,835 | ) |
| Net realized gains on written options | | | 4,091 | | | | — | | | | — | |
| Net realized losses on securities sold short | | | (88,300 | ) | | | — | | | | — | |
| Net change in unrealized appreciation (depreciation) on investments(D)(E) | | | 934,538 | | | | 4,889,126 | | | | 27,418,520 | |
| Net change in unrealized appreciation (depreciation) on foreign currency transactions | | | (1,709 | ) | | | 178 | | | | 73,927 | |
| Net change in unrealized appreciation (depreciation) on securities sold short | | | 29,200 | | | | — | | | | — | |
| Net change in unrealized appreciation (depreciation) on unfunded loan commitments | | | (351 | ) | | | — | | | | — | |
| Net Realized and Unrealized Gains (Losses) on Investments | | | 2,312,291 | | | | 5,042,844 | | | | 35,481,378 | |
| Change in Net Assets Resulting from Operations | | $ | 4,899,095 | | | $ | 5,017,826 | | | $ | 38,382,381 | |
| (A) Net of foreign tax withholding of: | | $ | — | | | $ | 5,252 | | | $ | 705,025 | |
(B) See Note 8 in Notes to Financial Statements.
(C) See Note 4 in Notes to Financial Statements.
(D) Change in unrealized appreciation (depreciation) on investments does not include net unrealized appreciation of $301,083 for the Global Growth Fund in connection with the Fund's merger. See Note 8 in the Notes to Financial Statements.
(E) Includes change in deferred foreign capital gains tax of $(9,826) for the Global Growth Fund.
See accompanying Notes to Financial Statements.
Statements of Operations (Continued)
| | | | Touchstone | | | Touchstone | | | Touchstone | | | | |
| Touchstone | | | Large Company | | | Ohio | | | Small Cap Value | | | Touchstone | |
| Large Cap | | | Growth | | | Tax-Free Bond | | | Opportunities | | | Value | |
| Fund | | | Fund(B) | | | Fund | | | Fund | | | Fund | |
| | | | | | | | | | | | | | | | | | | |
| $ | 5,376,663 | | | $ | 915,289 | | | $ | — | | | $ | 1,413,523 | | | $ | 10,947,598 | |
| | — | | | | — | | | | 2,093,819 | | | | — | | | | — | |
| | 12,714 | | | | 43,754 | | | | — | | | | 88,715 | | | | 2,063 | |
| | 5,389,377 | | | | 959,043 | | | | 2,093,819 | | | | 1,502,238 | | | | 10,949,661 | |
| | | | | | | | | | | | | | | | | | | |
| | 2,248,327 | | | | 1,434,291 | | | | 273,532 | | | | 1,249,186 | | | | 2,420,893 | |
| | 465,725 | | | | 259,907 | | | | 79,324 | | | | 190,665 | | | | 540,045 | |
| | 2,628 | | | | 2,368 | | | | 2,628 | | | | 2,628 | | | | 2,628 | |
| | 11,977 | | | | 10,777 | | | | 4,031 | | | | 15,205 | | | | 11,543 | |
| | 32,177 | | | | 39,857 | | | | 35,629 | | | | 26,347 | | | | 33,605 | |
| | 4,564 | | | | 54 | | | | 24,758 | | | | 9,030 | | | | 52,446 | |
| | 4,005 | | | | 21 | | | | 3,224 | | | | 1,762 | | | | 5,294 | |
| | 233,558 | | | | 1,128 | | | | 19 | | | | 122,733 | | | | 92,935 | |
| | 11,119 | | | | 111,570 | | | | 17 | | | | 2,035 | | | | 62,514 | |
| | 8,029 | | | | 3,087 | | | | 12,282 | | | | 16,059 | | | | 16,530 | |
| | 10,478 | | | | 3,023 | | | | 9,922 | | | | 8,664 | | | | 6,792 | |
| | 24,355 | | | | 5,142 | | | | 2,641 | | | | 16,259 | | | | 17,309 | |
| | 13,279 | | | | 22,727 | | | | 2,641 | | | | 16,407 | | | | 18,220 | |
| | — | | | | — | | | | — | | | | — | | | | — | |
| | — | | | | — | | | | — | | | | — | | | | — | |
| | 3,332 | | | | 3,086 | | | | 4,286 | | | | 3,673 | | | | 7,324 | |
| | 3,333 | | | | 3,086 | | | | 2,871 | | | | 3,098 | | | | 3,604 | |
| | 17,997 | | | | 3,179 | | | | 3,398 | | | | 10,435 | | | | 8,685 | |
| | 3,381 | | | | 7,751 | | | | 3,398 | | | | 3,308 | | | | 8,825 | |
| | — | | | | 14,114 | | | | — | | | | — | | | | — | |
| | 9,127 | | | | 156 | | | | 119,247 | | | | 11,541 | | | | 116,496 | |
| | 76,279 | | | | 24 | | | | 70,033 | | | | 9,827 | | | | 51,879 | |
| | 15,582 | | | | 15,582 | | | | 15,582 | | | | 15,582 | | | | 15,582 | |
| | 66,680 | | | | 21,909 | | | | 25,621 | | | | 21,294 | | | | 38,699 | |
| | 3,265,932 | | | | 1,962,839 | | | | 695,084 | | | | 1,755,738 | | | | 3,531,848 | |
| | (483,825 | ) | | | (258,347 | ) | | | (177,565 | ) | | | (194,714 | ) | | | (634,346 | ) |
| | 2,782,107 | | | | 1,704,492 | | | | 517,519 | | | | 1,561,024 | | | | 2,897,502 | |
| | 2,607,270 | | | | (745,449 | ) | | | 1,576,300 | | | | (58,786 | ) | | | 8,052,159 | |
| | | | | | | | | | | | | | | | | | | |
| | (4,059,548 | ) | | | 12,366,481 | | | | (11,341 | ) | | | 2,931,189 | | | | 25,998,303 | |
| | — | | | | — | | | | — | | | | — | | | | — | |
| | — | | | | — | | | | — | | | | — | | | | — | |
| | — | | | | — | | | | — | | | | — | | | | — | |
| | 45,267,795 | | | | 34,250,486 | | | | (2,357,140 | ) | | | 14,790,035 | | | | 24,770,144 | |
| | — | | | | — | | | | — | | | | — | | | | — | |
| | — | | | | — | | | | — | | | | — | | | | — | |
| | — | | | | — | | | | — | | | | — | | | | — | |
| | 41,208,247 | | | | 46,616,967 | | | | (2,368,481 | ) | | | 17,721,224 | | | | 50,768,447 | |
| $ | 43,815,517 | | | $ | 45,871,518 | | | $ | (792,181 | ) | | $ | 17,662,438 | | | $ | 58,820,606 | |
| $ | — | | | $ | 17,459 | | | $ | — | | | $ | 19,484 | | | $ | 81,622 | |
Statements of Changes in Net Assets
| | | Touchstone | | | Touchstone | |
| | | Credit Opportunities | | | Global Growth | |
| | | Fund | | | Fund(B) | |
| | | For the Year | | | For the Period | | | For the Year | | | For the Year | |
| | | Ended | | | Ended June 30, | | | Ended | | | Ended June 30, | |
| | | June 30, 2017 | | | 2016(A) | | | June 30, 2017 | | | 2016 | |
| From Operations | | | | | | | | | | | | | | | | |
| Net investment income (loss) | | $ | 2,586,804 | | | $ | 1,522,904 | | | $ | (25,018 | ) | | $ | (14,072 | ) |
| Net realized gains (losses) on investments, foreign currency transactions, written options and securities sold short | | | 1,350,613 | | | | (37,316 | ) | | | 153,540 | | | | 69,769 | |
| Net change in unrealized appreciation (depreciation) on investments, foreign currency transactions, securities sold short and unfunded loan commitments | | | 961,678 | | | | 513,943 | | | | 4,889,304 | | | | (288,817 | ) |
| Change in Net Assets from Operations | | | 4,899,095 | | | | 1,999,531 | | | | 5,017,826 | | | | (233,120 | ) |
| Distributions to Shareholders from: | | | | | | | | | | | | | | | | |
| Net investment income, Class A | | | (1,933 | ) | | | (763 | ) | | | — | | | | — | |
| Net investment income, Class C | | | (408 | ) | | | (71 | ) | | | — | | | | — | |
| Net investment income, Class Y | | | (5,964 | ) | | | (62 | ) | | | — | | | | — | |
| Net investment income, Institutional Class | | | (2,592,322 | ) | | | (1,380,908 | ) | | | — | | | | — | |
| Net realized gains, Class A | | | (203 | ) | | | (6 | ) | | | — | | | | — | |
| Net realized gains, Class C | | | (46 | ) | | | (3 | ) | | | — | | | | — | |
| Net realized gains, Class Y | | | (18 | ) | | | (3 | ) | | | — | | | | — | |
| Net realized gains, Institutional Class | | | (359,674 | ) | | | (76,436 | ) | | | (155,083 | ) | | | (438,950 | ) |
| Total Distributions | | | (2,960,568 | ) | | | (1,458,252 | ) | | | (155,083 | ) | | | (438,950 | ) |
| | | | | | | | | | | | | | | | | |
| Net Increase (Decrease) from Share Transactions(C) | | | (2,870,159 | ) | | | 53,921,838 | | | | 12,979,916 | | | | 1,049,679 | |
| | | | | | | | | | | | | | | | | |
| Total Increase (Decrease) in Net Assets | | | (931,632 | ) | | | 54,463,117 | | | | 17,842,659 | | | | 377,609 | |
| Net Assets | | | | | | | | | | | | | | | | |
| Beginning of period | | | 54,463,117 | | | | — | | | | 6,417,601 | | | | 6,039,992 | |
| End of period | | $ | 53,531,485 | | | $ | 54,463,117 | | | $ | 24,260,260 | | | $ | 6,417,601 | |
| Accumulated Net Investment Income (Loss) | | $ | 73,952 | | | $ | 31,870 | | | $ | — | | | $ | (888 | ) |
(A) Represents the period from commencement of operations (September 1, 2015) through June 30, 2016.
(B) See Note 8 in Notes to Financial Statements.
(C) For details on share transactions by class, see Statements of Changes in Net Assets - Capital Stock Activity on pages 66-67.
See accompanying Notes to Financial Statements.
Statements of Changes in Net Assets (Continued)
| Touchstone | | | Touchstone | |
| International | | | Large Cap | |
| Small Cap Fund | | | Fund | |
| For the Year | | | For the Year | | | For the Year | | | For the Year | |
| Ended | | | Ended | | | Ended June 30, | | | Ended June 30, | |
| June 30, 2017 | | | June 30, 2016 | | | 2017 | | | 2016 | |
| | | | | | | | | | | | | | | |
| $ | 2,901,003 | | | $ | 2,989,888 | | | $ | 2,607,270 | | | $ | 3,273,706 | |
| | | | | | | | | | | | | | | |
| | 7,988,931 | | | | (16,022,203 | ) | | | (4,059,548 | ) | | | (14,607,680 | ) |
| | | | | | | | | | | | | | | |
| | 27,492,447 | | | | (13,027,560 | ) | | | 45,267,795 | | | | 7,920,893 | |
| | 38,382,381 | | | | (26,059,875 | ) | | | 43,815,517 | | | | (3,413,081 | ) |
| | | | | | | | | | | | | | | |
| | (163,775 | ) | | | (170,544 | ) | | | (25,206 | ) | | | (12,125 | ) |
| | — | | | | (26,681 | ) | | | (13,471 | ) | | | (21,929 | ) |
| | (1,895,619 | ) | | | (1,290,541 | ) | | | (1,947,427 | ) | | | (1,492,225 | ) |
| | (2,380,600 | ) | | | (854,764 | ) | | | (921,412 | ) | | | (652,137 | ) |
| | — | | | | — | | | | — | | | | — | |
| | — | | | | — | | | | — | | | | — | |
| | — | | | | — | | | | — | | | | — | |
| | — | | | | — | | | | — | | | | — | |
| | (4,439,994 | ) | | | (2,342,530 | ) | | | (2,907,516 | ) | | | (2,178,416 | ) |
| | | | | | | | | | | | | | | |
| | (110,797,484 | ) | | | 171,734,256 | | | | (12,745,724 | ) | | | 14,369,777 | |
| | | | | | | | | | | | | | | |
| | (76,855,097 | ) | | | 143,331,851 | | | | 28,162,277 | | | | 8,778,280 | |
| | | | | | | | | | | | | | | |
| | 391,883,253 | | | | 248,551,402 | | | | 305,276,246 | | | | 296,497,966 | |
| $ | 315,028,156 | | | $ | 391,883,253 | | | $ | 333,438,523 | | | $ | 305,276,246 | |
| $ | 1,533,686 | | | $ | 2,391,872 | | | $ | 1,334,817 | | | $ | 1,635,063 | |
Statements of Changes in Net Assets (Continued)
| | | Touchstone | | | Touchstone | |
| | | Large Company | | | Ohio Tax-Free | |
| | | Growth Fund(A) | | | Bond Fund | |
| | | For the Year | | | For the Year | | | For the Year | | | For the Year | |
| | | Ended June 30, | | | Ended June 30, | | | Ended June 30, | | | Ended June 30, | |
| | | 2017 | | | 2016 | | | 2017 | | | 2016 | |
| From Operations | | | | | | | | | | | | | | | | |
| Net investment income (loss) | | $ | (745,449 | ) | | $ | (869,368 | ) | | $ | 1,576,300 | | | $ | 1,683,001 | |
| Net realized gains (losses) on investments | | | 12,366,481 | | | | 5,771,672 | | | | (11,341 | ) | | | 146,876 | |
| Net change in unrealized appreciation (depreciation) on investments | | | 34,250,486 | | | | (13,460,937 | ) | | | (2,357,140 | ) | | | 1,611,783 | |
| Change in Net Assets from Operations | | | 45,871,518 | | | | (8,558,633 | ) | | | (792,181 | ) | | | 3,441,660 | |
| Distributions to Shareholders from: | | | | | | | | | | | | | | | | |
| Net investment income, Class A | | | — | | | | — | | | | (1,419,216 | ) | | | (1,513,865 | ) |
| Net investment income, Class C | | | — | | | | — | | | | (155,644 | ) | | | (166,922 | ) |
| Net investment income, Class Y | | | — | | | | — | | | | (66 | ) | | | — | |
| Net investment income, Institutional Class | | | — | | | | — | | | | (66 | ) | | | — | |
| Net realized gains, Class A | | | (642 | ) | | | — | | | | (66,722 | ) | | | (74,693 | ) |
| Net realized gains, Class C | | | (86 | ) | | | — | | | | (10,018 | ) | | | (11,149 | ) |
| Net realized gains, Class Y | | | (167,270 | ) | | | — | | | | (3 | ) | | | — | |
| Net realized gains, Institutional Class | | | (6,208,313 | ) | | | (14,756,448 | ) | | | (3 | ) | | | — | |
| Total Distributions | | | (6,376,311 | ) | | | (14,756,448 | ) | | | (1,651,738 | ) | | | (1,766,629 | ) |
| | | | | | | | | | | | | | | | | |
| Net Increase (Decrease) from Share Transactions(B) | | | (20,047,053 | ) | | | 7,334,923 | | | | (8,137,523 | ) | | | 3,824,832 | |
| | | | | | | | | | | | | | | | | |
| Total Increase (Decrease) in Net Assets | | | 19,448,154 | | | | (15,980,158 | ) | | | (10,581,442 | ) | | | 5,499,863 | |
| Net Assets | | | | | | | | | | | | | | | | |
| Beginning of period | | | 180,104,324 | | | | 196,084,482 | | | | 59,919,283 | | | | 54,419,420 | |
| End of period | | $ | 199,552,478 | | | $ | 180,104,324 | | | $ | 49,337,841 | | | $ | 59,919,283 | |
| Accumulated Net Investment Income (Loss) | | $ | — | | | $ | (347,744 | ) | | $ | (18,495 | ) | | $ | (19,787 | ) |
(A) See Note 8 in Notes to Financial Statements.
(B) For details on share transactions by class, see Statements of Changes in Net Assets - Capital Stock Activity on pages 68-69.
See accompanying Notes to Financial Statements.
Statements of Changes in Net Assets (Continued)
| Touchstone | | | | |
| Small Cap | | | Touchstone | |
| Value Opportunities Fund | | | Value Fund | |
| For the Year | | | For the Year | | | For the Year | | | For the Year | |
| Ended June 30, | | | Ended June 30, | | | Ended June 30, | | | Ended June 30, | |
| 2017 | | | 2016 | | | 2017 | | | 2016 | |
| | | | | | | | | | | | | | | |
| $ | (58,786 | ) | | $ | 37,131 | | | $ | 8,052,159 | | | $ | 7,575,743 | |
| | 2,931,189 | | | | (5,632,369 | ) | | | 25,998,303 | | | | 2,856,372 | |
| | | | | | | | | | | | | | | |
| | 14,790,035 | | | | (19,879,588 | ) | | | 24,770,144 | | | | (15,515,282 | ) |
| | 17,662,438 | | | | (25,474,826 | ) | | | 58,820,606 | | | | (5,083,167 | ) |
| | | | | | | | | | | | | | | |
| | — | | | | — | | | | (828,909 | ) | | | (861,443 | ) |
| | — | | | | — | | | | (51,543 | ) | | | (58,802 | ) |
| | (46,779 | ) | | | — | | | | (1,682,534 | ) | | | (1,653,061 | ) |
| | (13,360 | ) | | | — | | | | (5,503,856 | ) | | | (4,968,698 | ) |
| | (4,935 | ) | | | (664,219 | ) | | | (98,619 | ) | | | (3,619,682 | ) |
| | (1,239 | ) | | | (137,745 | ) | | | (10,992 | ) | | | (441,793 | ) |
| | (136,864 | ) | | | (8,245,264 | ) | | | (167,148 | ) | | | (6,054,784 | ) |
| | (13,210 | ) | | | (2,203,046 | ) | | | (499,295 | ) | | | (16,589,894 | ) |
| | (216,387 | ) | | | (11,250,274 | ) | | | (8,842,896 | ) | | | (34,248,157 | ) |
| | | | | | | | | | | | | | | |
| | (39,330,301 | ) | | | (25,258,785 | ) | | | (19,099,001 | ) | | | (25,949,923 | ) |
| | | | | | | | | | | | | | | |
| | (21,884,250 | ) | | | (61,983,885 | ) | | | 30,878,709 | | | | (65,281,247 | ) |
| | | | | | | | | | | | | | | |
| | 136,482,850 | | | | 198,466,735 | | | | 350,239,803 | | | | 415,521,050 | |
| $ | 114,598,600 | | | $ | 136,482,850 | | | $ | 381,118,512 | | | $ | 350,239,803 | |
| $ | 185 | | | $ | 37,431 | | | $ | 166,545 | | | $ | 201,182 | |
Statements of Changes in Net Assets - Capital Stock Activity
| | | Touchstone
Credit Opportunities Fund | | | Touchstone Global Growth Fund(B) | |
| | | For the | | | For the | | | For the | | | For the | |
| | | Year Ended | | | Period Ended | | | Year Ended | | | Year Ended | |
| | | June 30, 2017 | | | June 30, 2016(A) | | | June 30, 2017 | | | June 30, 2016 | |
| | | Shares | | | Dollars | | | Shares | | | Dollars | | | Shares | | | Dollars | | | Shares | | | Dollars | |
| Class A | | | | | | | | | | | | | | | | | | | | | | | | | | | | | | | | |
| Proceeds from Shares issued | | | 3,736 | | | $ | 38,800 | | | | 4,225 | | | $ | 41,194 | | | | 6,775 | | | $ | 148,131 | | | | — | | | $ | — | |
| Reinvestment of distributions | | | 206 | | | | 2,136 | | | | 78 | | | | 769 | | | | — | | | | — | | | | — | | | | — | |
| Cost of Shares redeemed | | | (3,914 | ) | | | (40,567 | ) | | | — | | | | — | | | | (479 | ) | | | (10,631 | ) | | | — | | | | — | |
| Change from Class A Share Transactions | | | 28 | | | | 369 | | | | 4,303 | | | | 41,963 | | | | 6,296 | | | | 137,500 | | | | — | | | | — | |
| Class C | | | | | | | | | | | | | | | | | | | | | | | | | | | | | | | | |
| Proceeds from Shares issued | | | 2,171 | | | | 22,837 | | | | 631 | | | | 6,354 | | | | 133 | | | | 2,500 | | | | — | | | | — | |
| Reinvestment of distributions | | | 44 | | | | 454 | | | | 7 | | | | 74 | | | | — | | | | — | | | | — | | | | — | |
| Cost of Shares redeemed | | | (771 | ) | | | (7,946 | ) | | | — | | | | — | | | | — | | | | — | | | | — | | | | — | |
| Change from Class C Share Transactions | | | 1,444 | | | | 15,345 | | | | 638 | | | | 6,428 | | | | 133 | | | | 2,500 | | | | — | | | | — | |
| Class Y | | | | | | | | | | | | | | | | | | | | | | | | | | | | | | | | |
| Proceeds from Shares issued | | | 34,418 | | | | 359,007 | | | | 250 | | | | 2,500 | | | | 7,257 | | | | 162,500 | | | | — | | | | — | |
| Reinvestment of distributions | | | 578 | | | | 5,982 | | | | 7 | | | | 65 | | | | — | | | | — | | | | — | | | | — | |
| Cost of Shares redeemed | | | (4,974 | ) | | | (51,431 | ) | | | — | | | | — | | | | — | | | | — | | | | — | | | | — | |
| Change from Class Y Share Transactions | | | 30,022 | | | | 313,558 | | | | 257 | | | | 2,565 | | | | 7,257 | | | | 162,500 | | | | — | | | | — | |
| Institutional Class | | | | | | | | | | | | | | | | | | | | | | | | | | | | | | | | |
| Proceeds from Shares issued | | | 457,954 | | | | 4,766,837 | | | | 6,095,928 | | | | 60,534,513 | | | | 507,635 | | | | 9,148,447 | | | | 65,008 | | | | 1,200,061 | |
| Proceeds from Shares issued in connection with merger(B) | | | — | | | | — | | | | — | | | | — | | | | 263,883 | | | | 4,918,771 | | | | — | | | | — | |
| Reinvestment of distributions | | | 285,920 | | | | 2,951,996 | | | | 148,074 | | | | 1,457,344 | | | | 8,424 | | | | 155,083 | | | | 24,305 | | | | 438,950 | |
| Cost of Shares redeemed | | | (1,053,187 | ) | | | (10,918,264 | ) | | | (828,518 | ) | | | (8,120,975 | ) | | | (70,432 | ) | | | (1,544,885 | ) | | | (30,591 | ) | | | (589,332 | ) |
| Change from Institutional Class Share Transactions | | | (309,313 | ) | | | (3,199,431 | ) | | | 5,415,484 | | | | 53,870,882 | | | | 709,510 | | | | 12,677,416 | | | | 58,722 | | | | 1,049,679 | |
| Change from Share Transactions | | | (277,819 | ) | | $ | (2,870,159 | ) | | | 5,420,682 | | | $ | 53,921,838 | | | | 723,196 | | | $ | 12,979,916 | | | | 58,722 | | | $ | 1,049,679 | |
(A) Represents the period from commencement of operations (September 1, 2015) through June 30, 2016.
(B) See Note 8 in Notes to Financial Statements.
See accompanying Notes to Financial Statements.
Statements of Changes in Net Assets - Capital Stock Activity (Continued)
| Touchstone International Small Cap Fund | | | Touchstone Large Cap Fund | |
| For the | | | For the | | | For the | | | For the | |
| Year Ended | | | Year Ended | | | Year Ended | | | Year Ended | |
| June 30, 2017 | | | June 30, 2016 | | | June 30, 2017 | | | June 30, 2016 | |
| Shares | | | Dollars | | | Shares | | | Dollars | | | Shares | | | Dollars | | | Shares | | | Dollars | |
| | | | | | | | | | | | | | | | | | | | | | | | | | | | | | | |
| | 405,684 | | | $ | 6,216,965 | | | | 1,297,550 | | | $ | 20,328,627 | | | | 247,695 | | | $ | 2,868,502 | | | | 283,256 | | | $ | 2,895,443 | |
| | 9,986 | | | | 142,989 | | | | 9,887 | | | | 158,978 | | | | 2,099 | | | | 23,357 | | | | 1,075 | | | | 11,223 | |
| | (972,387 | ) | | | (14,809,628 | ) | | | (1,256,673 | ) | | | (19,261,081 | ) | | | (149,744 | ) | | | (1,640,326 | ) | | | (124,504 | ) | | | (1,292,569 | ) |
| | | | | | | | | | | | | | | | | | | | | | | | | | | | | | | |
| | (556,717 | ) | | | (8,449,674 | ) | | | 50,764 | | | | 1,226,524 | | | | 100,050 | | | | 1,251,533 | | | | 159,827 | | | | 1,614,097 | |
| | | | | | | | | | | | | | | | | | | | | | | | | | | | | | | |
| | 20,392 | | | | 312,814 | | | | 133,443 | | | | 2,080,162 | | | | 311,441 | | | | 3,370,728 | | | | 539,045 | | | | 5,506,168 | |
| | — | | | | — | | | | 1,418 | | | | 22,400 | | | | 1,143 | | | | 12,600 | | | | 1,994 | | | | 20,656 | |
| | (142,006 | ) | | | (2,104,408 | ) | | | (95,192 | ) | | | (1,430,219 | ) | | | (216,616 | ) | | | (2,361,777 | ) | | | (79,635 | ) | | | (799,302 | ) |
| | | | | | | | | | | | | | | | | | | | | | | | | | | | | | | |
| | (121,614 | ) | | | (1,791,594 | ) | | | 39,669 | | | | 672,343 | | | | 95,968 | | | | 1,021,551 | | | | 461,404 | | | | 4,727,522 | |
| | | | | | | | | | | | | | | | | | | | | | | | | | | | | | | |
| | 1,574,379 | | | | 24,648,465 | | | | 4,883,659 | | | | 78,063,592 | | | | 2,276,554 | | | | 25,680,387 | | | | 4,361,014 | | | | 44,815,433 | |
| | 125,225 | | | | 1,837,046 | | | | 74,065 | | | | 1,222,070 | | | | 169,257 | | | | 1,887,248 | | | | 138,618 | | | | 1,449,935 | |
| | (4,011,935 | ) | | | (62,391,343 | ) | | | (4,303,980 | ) | | | (67,754,238 | ) | | | (3,758,341 | ) | | | (41,934,501 | ) | | | (2,875,579 | ) | | | (29,570,338 | ) |
| | | | | | | | | | | | | | | | | | | | | | | | | | | | | | | |
| | (2,312,331 | ) | | | (35,905,832 | ) | | | 653,744 | | | | 11,531,424 | | | | (1,312,530 | ) | | | (14,366,866 | ) | | | 1,624,053 | | | | 16,695,030 | |
| | | | | | | | | | | | | | | | | | | | | | | | | | | | | | | |
| | 2,784,678 | | | | 44,371,744 | | | | 13,135,958 | | | | 208,924,740 | | | | 2,273,124 | | | | 24,728,676 | | | | 1,791,859 | | | | 18,806,709 | |
| | | | | | | | | | | | | | | | | | | | | | | | | | | | | | | |
| | — | | | | — | | | | — | | | | — | | | | — | | | | — | | | | — | | | | — | |
| | 160,912 | | | | 2,371,845 | | | | 51,285 | | | | 850,301 | | | | 82,562 | | | | 921,390 | | | | 62,285 | | | | 652,122 | |
| | (7,109,360 | ) | | | (111,393,973 | ) | | | (3,197,660 | ) | | | (51,471,076 | ) | | | (2,473,080 | ) | | | (26,302,008 | ) | | | (2,848,371 | ) | | | (28,125,703 | ) |
| | | | | | | | | | | | | | | | | | | | | | | | | | | | | | | |
| | (4,163,770 | ) | | | (64,650,384 | ) | | | 9,989,583 | | | | 158,303,965 | | | | (117,394 | ) | | | (651,942 | ) | | | (994,227 | ) | | | (8,666,872 | ) |
| | (7,154,432 | ) | | $ | (110,797,484 | ) | | | 10,733,760 | | | $ | 171,734,256 | | | | (1,233,906 | ) | | $ | (12,745,724 | ) | | | 1,251,057 | | | $ | 14,369,777 | |
Statements of Changes in Net Assets - Capital Stock Activity (Continued)
| | | Touchstone Large Company Growth Fund(A) | | | Touchstone Ohio Tax-Free Bond Fund | |
| | | For the | | | For the | | | For the | | | For the | |
| | | Year Ended | | | Year Ended | | | Year Ended | | | Year Ended | |
| | | June 30, 2017 | | | June 30, 2016 | | | June 30, 2017 | | | June 30, 2016 | |
| | | Shares | | | Dollars | | | Shares | | | Dollars | | | Shares | | | Dollars | | | Shares | | | Dollars | |
| Class A | | | | | | | | | | | | | | | | | | | | | | | | | | | | | | | | |
| Proceeds from Shares issued | | | 3,914 | | | $ | 118,488 | | | | — | | | $ | — | | | | 69,331 | | | $ | 816,892 | | | | 669,252 | | | $ | 7,902,507 | |
| Reinvestment of distributions | | | 22 | | | | 642 | | | | — | | | | — | | | | 85,777 | | | | 997,012 | | | | 89,976 | | | | 1,064,490 | |
| Cost of Shares redeemed | | | (1 | ) | | | (30 | ) | | | — | | | | — | | | | (816,120 | ) | | | (9,458,089 | ) | | | (421,388 | ) | | | (4,986,447 | ) |
| Change from Class A Share Transactions | | | 3,935 | | | | 119,100 | | | | — | | | | — | | | | (661,012 | ) | | | (7,644,185 | ) | | | 337,840 | | | | 3,980,550 | |
| Class C | | | | | | | | | | | | | | | | | | | | | | | | | | | | | | | | |
| Proceeds from Shares issued | | | 864 | | | | 30,347 | | | | — | | | | — | | | | 23,282 | | | | 274,598 | | | | 65,428 | | | | 779,031 | |
| Reinvestment of distributions | | | 3 | | | | 86 | | | | — | | | | — | | | | 10,784 | | | | 125,431 | | | | 10,974 | | | | 129,973 | |
| Cost of Shares redeemed | | | — | | | | — | | | | — | | | | — | | | | (77,880 | ) | | | (898,506 | ) | | | (89,547 | ) | | | (1,064,722 | ) |
| Change from Class C Share Transactions | | | 867 | | | | 30,433 | | | | — | | | | — | | | | (43,814 | ) | | | (498,477 | ) | | | (13,145 | ) | | | (155,718 | ) |
| Class Y | | | | | | | | | | | | | | | | | | | | | | | | | | | | | | | | |
| Proceeds from Shares issued | | | 318,295 | | | | 10,093,114 | | | | — | | | | — | | | | 208 | | | | 2,501 | | | | — | | | | — | |
| Reinvestment of distributions | | | 2,725 | | | | 80,853 | | | | — | | | | — | | | | 6 | | | | 69 | | | | — | | | | — | |
| Cost of Shares redeemed | | | (41,836 | ) | | | (1,333,534 | ) | | | — | | | | — | | | | — | | | | — | | | | — | | | | — | |
| Change from Class Y Share Transactions | | | 279,184 | | | | 8,840,433 | | | | — | | | | — | | | | 214 | | | | 2,570 | | | | — | | | | — | |
| Institutional Class | | | | | | | | | | | | | | | | | | | | | | | | | | | | | | | | |
| Proceeds from Shares issued | | | 924,524 | | | | 29,335,294 | | | | 1,165,718 | | | | 35,086,926 | | | | 209 | | | | 2,511 | | | | — | | | | — | |
| Reinvestment of distributions | | | 195,271 | | | | 5,795,660 | | | | 452,418 | | | | 13,717,304 | | | | 6 | | | | 69 | | | | — | | | | — | |
| Cost of Shares redeemed | | | (1,981,379 | ) | | | (64,167,973 | ) | | | (1,350,702 | ) | | | (41,469,307 | ) | | | (1 | ) | | | (11 | ) | | | — | | | | — | |
| Change from Institutional Class Share Transactions | | | (861,584 | ) | | | (29,037,019 | ) | | | 267,434 | | | | 7,334,923 | | | | 214 | | | | 2,569 | | | | — | | | | — | |
| Change from Share Transactions | | | (577,598 | ) | | $ | (20,047,053 | ) | | | 267,434 | | | $ | 7,334,923 | | | | (704,398 | ) | | $ | (8,137,523 | ) | | | 324,695 | | | $ | 3,824,832 | |
(A) See Note 8 in Notes to Financial Statements.
See accompanying Notes to Financial Statements.
Statements of Changes in Net Assets - Capital Stock Activity (Continued)
| Touchstone Small Cap Value Opportunities Fund | | | Touchstone Value Fund | |
| For the | | | For the | | | For the | | | For the | |
| Year Ended | | | Year Ended | | | Year Ended | | | Year Ended | |
| June 30, 2017 | | | June 30, 2016 | | | June 30, 2017 | | | June 30, 2016 | |
| Shares | | | Dollars | | | Shares | | | Dollars | | | Shares | | | Dollars | | | Shares | | | Dollars | |
| | | | | | | | | | | | | | | | | | | | | | | | | | | | | | | |
| | 171,483 | | | $ | 2,679,355 | | | | 178,569 | | | $ | 3,110,849 | | | | 332,336 | | | $ | 3,160,227 | | | | 492,806 | | | $ | 4,400,455 | |
| | 269 | | | | 4,727 | | | | 43,225 | | | | 637,999 | | | | 79,899 | | | | 782,692 | | | | 447,991 | | | | 3,878,202 | |
| | (305,138 | ) | | | (4,994,452 | ) | | | (733,688 | ) | | | (11,793,510 | ) | | | (1,531,171 | ) | | | (14,636,648 | ) | | | (1,198,179 | ) | | | (10,762,282 | ) |
| | | | | | | | | | | | | | | | | | | | | | | | | | | | | | | |
| | (133,386 | ) | | | (2,310,370 | ) | | | (511,894 | ) | | | (8,044,662 | ) | | | (1,118,936 | ) | | | (10,693,729 | ) | | | (257,382 | ) | | | (2,483,625 | ) |
| | | | | | | | | | | | | | | | | | | | | | | | | | | | | | | |
| | 9,419 | | | | 148,718 | | | | 13,981 | | | | 223,530 | | | | 22,657 | | | | 211,830 | | | | 54,582 | | | | 478,901 | |
| | 60 | | | | 1,014 | | | | 7,225 | | | | 104,187 | | | | 4,403 | | | | 42,913 | | | | 35,343 | | | | 303,882 | |
| | (37,583 | ) | | | (592,906 | ) | | | (56,888 | ) | | | (830,488 | ) | | | (219,564 | ) | | | (2,088,832 | ) | | | (162,854 | ) | | | (1,464,650 | ) |
| | | | | | | | | | | | | | | | | | | | | | | | | | | | | | | |
| | (28,104 | ) | | | (443,174 | ) | | | (35,682 | ) | | | (502,771 | ) | | | (192,504 | ) | | | (1,834,089 | ) | | | (72,929 | ) | | | (681,867 | ) |
| | | | | | | | | | | | | | | | | | | | | | | | | | | | | | | |
| | 809,738 | | | | 14,256,308 | | | | 937,755 | | | | 15,335,755 | | | | 2,499,249 | | | | 23,943,290 | | | | 1,274,736 | | | | 11,372,831 | |
| | 9,416 | | | | 174,974 | | | | 513,365 | | | | 8,039,304 | | | | 146,549 | | | | 1,442,227 | | | | 713,740 | | | | 6,206,070 | |
| | (1,515,030 | ) | | | (26,650,962 | ) | | | (2,440,654 | ) | | | (41,804,653 | ) | | | (3,050,024 | ) | | | (29,219,678 | ) | | | (3,995,911 | ) | | | (35,656,922 | ) |
| | | | | | | | | | | | | | | | | | | | | | | | | | | | | | | |
| | (695,876 | ) | | | (12,219,680 | ) | | | (989,534 | ) | | | (18,429,594 | ) | | | (404,226 | ) | | | (3,834,161 | ) | | | (2,007,435 | ) | | | (18,078,021 | ) |
| | | | | | | | | | | | | | | | | | | | | | | | | | | | | | | |
| | 58,728 | | | | 998,193 | | | | 345,792 | | | | 6,071,129 | | | | 5,960,527 | | | | 57,086,298 | | | | 7,730,290 | | | | 69,961,732 | |
| | 1,312 | | | | 24,673 | | | | 135,183 | | | | 2,145,352 | | | | 531,286 | | | | 5,213,712 | | | | 2,168,255 | | | | 18,830,820 | |
| | (1,425,430 | ) | | | (25,379,943 | ) | | | (395,931 | ) | | | (6,498,239 | ) | | | (6,779,064 | ) | | | (65,037,032 | ) | | | (10,435,595 | ) | | | (93,498,962 | ) |
| | | | | | | | | | | | | | | | | | | | | | | | | | | | | | | |
| | (1,365,390 | ) | | | (24,357,077 | ) | | | 85,044 | | | | 1,718,242 | | | | (287,251 | ) | | | (2,737,022 | ) | | | (537,050 | ) | | | (4,706,410 | ) |
| | (2,222,756 | ) | | $ | (39,330,301 | ) | | | (1,452,066 | ) | | $ | (25,258,785 | ) | | | (2,002,917 | ) | | $ | (19,099,001 | ) | | | (2,874,796 | ) | | $ | (25,949,923 | ) |
Financial Highlights
Touchstone Credit Opportunities Fund—Class A
Selected Data for a Share Outstanding Throughout Each Period
| | | Year Ended | | | Period Ended | |
| | | June 30, | | | June 30, | |
| | | 2017 | | | 2016(A) | |
| Net asset value at beginning of period | | $ | 10.05 | | | $ | 10.00 | |
| Income from investment operations: | | | | | | | | |
| Net investment income | | | 0.45 | | | | 0.22 | |
| Net realized and unrealized gains on investments | | | 0.45 | | | | 0.07 | |
| Total from investment operations | | | 0.90 | | | | 0.29 | |
| Distributions from: | | | | | | | | |
| Net investment income | | | (0.47 | ) | | | (0.23 | ) |
| Realized capital gains | | | (0.07 | ) | | | (0.01 | ) |
| Total distributions | | | (0.54 | ) | | | (0.24 | ) |
| Net asset value at end of period | | $ | 10.41 | | | $ | 10.05 | |
| Total return(B) | | | 9.08 | % | | | 2.95 | %(C) |
| Ratios and supplemental data: | | | | | | | | |
| Net assets at end of period (000's) | | $ | 45 | | | $ | 43 | |
| Ratio to average net assets: | | | | | | | | |
| Net expenses (including dividend and interest expense on securities sold short)(D) | | | 1.87 | % | | | 1.73 | %(E) |
| Gross expenses (including dividend and interest expense on securities sold short)(F) | | | 16.01 | % | | | 38.32 | %(E) |
| Net investment income | | | 4.44 | % | | | 3.53 | %(E) |
| Portfolio turnover rate | | | 84 | % | | | 91 | %(C) |
Touchstone Credit Opportunities Fund—Class C
Selected Data for a Share Outstanding Throughout Each Period
| | | Year Ended | | | Period Ended | |
| | | June 30, | | | June 30, | |
| | | 2017 | | | 2016(A) | |
| Net asset value at beginning of period | | $ | 10.08 | | | $ | 10.00 | |
| Income from investment operations: | | | | | | | | |
| Net investment income | | | 0.34 | | | | 0.17 | |
| Net realized and unrealized gains on investments | | | 0.48 | | | | 0.08 | |
| Total from investment operations | | | 0.82 | | | | 0.25 | |
| Distributions from: | | | | | | | | |
| Net investment income | | | (0.39 | ) | | | (0.16 | ) |
| Realized capital gains | | | (0.07 | ) | | | (0.01 | ) |
| Total distributions | | | (0.46 | ) | | | (0.17 | ) |
| Net asset value at end of period | | $ | 10.44 | | | $ | 10.08 | |
| Total return(B) | | | 8.31 | % | | | 2.59 | %(C) |
| Ratios and supplemental data: | | | | | | | | |
| Net assets at end of period (000's) | | $ | 22 | | | $ | 6 | |
| Ratio to average net assets: | | | | | | | | |
| Net expenses (including dividend and interest expense on securities sold short)(D) | | | 2.62 | % | | | 2.48 | %(E) |
| Gross expenses (including dividend and interest expense on securities sold short)(F) | | | 73.30 | % | | | 276.34 | %(E) |
| Net investment income | | | 3.69 | % | | | 2.79 | %(E) |
| Portfolio turnover rate | | | 84 | % | | | 91 | %(C) |
| (A) | Represents the period from commencement of operations (September 1, 2015) through June 30, 2016. |
| (B) | Total returns shown exclude the effect of applicable sales loads. If these charges were included, the returns would be lower. |
| (D) | The ratio of net expenses to average net assets excluding dividend and interest expense on securities sold short for Class A is 1.69% and 1.69% and for Class C is 2.44% and 2.44% for the year ended June 30, 2017 and for the period ended June 30, 2016, respectively. |
| (F) | The ratio of gross expenses to average net assets excluding dividend and interest expense on securities sold short for Class A is 15.83% and 38.28% and for Class C is 73.12% and 276.30% for the year ended June 30, 2017 and for the period ended June 30, 2016, respectively. |
See accompanying Notes to Financial Statements.
Financial Highlights (Continued)
Touchstone Credit Opportunities Fund—Class Y
Selected Data for a Share Outstanding Throughout Each Period
| | | Year Ended | | | Period Ended | |
| | | June 30, | | | June 30, | |
| | | 2017 | | | 2016(A) | |
| Net asset value at beginning of period | | $ | 10.04 | | | $ | 10.00 | |
| Income (loss) from investment operations: | | | | | | | | |
| Net investment income | | | 0.39 | | | | 0.31 | |
| Net realized and unrealized gains (losses) on investments | | | 0.54 | | | | (0.02 | ) |
| Total from investment operations | | | 0.93 | | | | 0.29 | |
| Distributions from: | | | | | | | | |
| Net investment income | | | (0.49 | ) | | | (0.24 | ) |
| Realized capital gains | | | (0.07 | ) | | | (0.01 | ) |
| Total distributions | | | (0.56 | ) | | | (0.25 | ) |
| Net asset value at end of period | | $ | 10.41 | | | $ | 10.04 | |
| Total return | | | 9.39 | % | | | 3.04 | %(B) |
| Ratios and supplemental data: | | | | | | | | |
| Net assets at end of period (000's) | | $ | 315 | | | $ | 3 | |
| Ratio to average net assets: | | | | | | | | |
| Net expenses (including dividend and interest expense on securities sold short)(C) | | | 1.62 | % | | | 1.48 | %(D) |
| Gross expenses (including dividend and interest expense on securities sold short)(E) | | | 8.25 | % | | | 355.77 | %(D) |
| Net investment income | | | 4.69 | % | | | 3.79 | %(D) |
| Portfolio turnover rate | | | 84 | % | | | 91 | %(B) |
Touchstone Credit Opportunities Fund—Institutional Class
Selected Data for a Share Outstanding Throughout Each Period
| | | Year Ended | | | Period Ended | |
| | | June 30, | | | June 30, | |
| | | 2017 | | | 2016(A) | |
| Net asset value at beginning of period | | $ | 10.05 | | | $ | 10.00 | |
| Income from investment operations: | | | | | | | | |
| Net investment income | | | 0.50 | | | | 0.28 | |
| Net realized and unrealized gains on investments | | | 0.43 | | | | 0.03 | |
| Total from investment operations | | | 0.93 | | | | 0.31 | |
| Distributions from: | | | | | | | | |
| Net investment income | | | (0.50 | ) | | | (0.25 | ) |
| Realized capital gains | | | (0.07 | ) | | | (0.01 | ) |
| Total distributions | | | (0.57 | ) | | | (0.26 | ) |
| Net asset value at end of period | | $ | 10.41 | | | $ | 10.05 | |
| Total return | | | 9.47 | % | | | 3.22 | %(B) |
| Ratios and supplemental data: | | | | | | | | |
| Net assets at end of period (000's) | | $ | 53,150 | | | $ | 54,411 | |
| Ratio to average net assets: | | | | | | | | |
| Net expenses (including dividend and interest expense on securities sold short)(C) | | | 1.52 | % | | | 1.38 | %(D) |
| Gross expenses (including dividend and interest expense on securities sold short)(E) | | | 1.69 | % | | | 1.65 | %(D) |
| Net investment income | | | 4.79 | % | | | 3.88 | %(D) |
| Portfolio turnover rate | | | 84 | % | | | 91 | %(B) |
| (A) | Represents the period from commencement of operations (September 1, 2015) through June 30, 2016. |
| (C) | The ratio of net expenses to average net assets excluding dividend and interest expense on securities sold short for Class Y is 1.44% and 1.44% and for Institutional Class is 1.34% and 1.34% for the year ended June 30, 2017 and for the period ended June 30, 2016, respectively. |
| (E) | The ratio of gross expenses to average net assets excluding dividend and interest expense on securities sold short for Class Y is 8.07% and 355.73% and for Institutional Class is 1.51% and 1.61% for the year ended June 30, 2017 and for the period ended June 30, 2016, respectively. |
See accompanying Notes to Financial Statements.
Financial Highlights (Continued)
Touchstone Global Growth Fund—Class A
Selected Data for a Share Outstanding Throughout The Period
| | | Period Ended | |
| | | June 30, | |
| | | 2017(A) | |
| Net asset value at beginning of period | | $ | 18.74 | (B) |
| Income (loss) from investment operations: | | | | |
| Net investment loss | | | (0.01 | ) |
| Net realized and unrealized gains on investments | | | 3.52 | |
| Total from investment operations | | | 3.51 | |
| Net asset value at end of period | | $ | 22.25 | |
| Total return(C) | | | 18.73 | %(D) |
| Ratios and supplemental data: | | | | |
| Net assets at end of period (000's) | | $ | 140 | |
| Ratio to average net assets: | | | | |
| Net expenses | | | 1.41 | %(E) |
| Gross expenses | | | 42.93 | %(E) |
| Net investment loss | | | (0.35 | )%(E) |
| Portfolio turnover rate | | | 72 | %(F) |
Touchstone Global Growth Fund—Class C
Selected Data for a Share Outstanding Throughout The Period
| | | Period Ended | |
| | | June 30, | |
| | | 2017(A) | |
| Net asset value at beginning of period | | $ | 18.74 | (B) |
| Income (loss) from investment operations: | | | | |
| Net investment loss | | | (0.19 | ) |
| Net realized and unrealized gains on investments | | | 3.55 | |
| Total from investment operations | | | 3.36 | |
| Net asset value at end of period | | $ | 22.10 | |
| Total return(C) | | | 17.93 | %(D) |
| Ratios and supplemental data: | | | | |
| Net assets at end of period (000's) | | $ | 3 | |
| Ratio to average net assets: | | | | |
| Net expenses | | | 2.16 | %(E) |
| Gross expenses | | | 237.46 | %(E) |
| Net investment loss | | | (1.11 | )%(E) |
| Portfolio turnover rate | | | 72 | %(F) |
| (A) | Represents the period from commencement of operations (August 15, 2016) through June 30, 2017. |
| (B) | Net asset value at the beginning of period is based on the net asset value of Institutional Class shares on August 15, 2016. |
| (C) | Total returns shown exclude the effect of applicable sales loads. If these charges were included, the returns would be lower. |
| (F) | Portfolio turnover excludes the purchases and sales of the DSM Global Growth & Income Fund merger on August 15, 2016 (see Note 8). If these transactions were included, portfolio turnover would have been higher. |
See accompanying Notes to Financial Statements.
Financial Highlights (Continued)
Touchstone Global Growth Fund—Class Y
Selected Data for a Share Outstanding Throughout The Period
| | | Period Ended | |
| | | June 30, | |
| | | 2017(A) | |
| Net asset value at beginning of period | | $ | 18.74 | (B) |
| Income (loss) from investment operations: | | | | |
| Net investment loss | | | (— | )(C) |
| Net realized and unrealized gains on investments | | | 3.51 | |
| Total from investment operations | | | 3.51 | |
| Net asset value at end of period | | $ | 22.25 | |
| Total return | | | 18.73 | %(D) |
| Ratios and supplemental data: | | | | |
| Net assets at end of period (000's) | | $ | 161 | |
| Ratio to average net assets: | | | | |
| Net expenses | | | 1.16 | %(E) |
| Gross expenses | | | 51.68 | %(E) |
| Net investment loss | | | (0.10 | )%(E) |
| Portfolio turnover rate | | | 72 | %(F) |
Touchstone Global Growth Fund—Institutional Class
Selected Data for a Share Outstanding Throughout Each Period
| | | Year Ended June 30, | |
| | | 2017 | | | 2016 | | | 2015 | | | 2014 | | | 2013 | |
| Net asset value at beginning of period | | $ | 17.60 | | | $ | 19.75 | | | $ | 20.26 | | | $ | 16.38 | | | $ | 14.00 | |
| Income (loss) from investment operations: | | | | | | | | | | | | | | | | | | | | |
| Net investment income (loss) | | | (0.02 | ) | | | (0.04 | )(G) | | | (0.02 | )(G) | | | 0.07 | (G) | | | 0.03 | (G) |
| Net realized and unrealized gains (losses) on investments | | | 5.15 | | | | (0.73 | ) | | | 1.56 | | | | 4.48 | | | | 2.39 | |
| Total from investment operations | | | 5.13 | | | | (0.77 | ) | | | 1.54 | | | | 4.55 | | | | 2.42 | |
| Distributions from: | | | | | | | | | | | | | | | | | | | | |
| Net investment income | | | — | | | | — | | | | (0.06 | ) | | | — | | | | (0.04 | ) |
| Realized capital gains | | | (0.43 | ) | | | (1.38 | ) | | | (1.99 | ) | | | (0.67 | ) | | | — | |
| Total distributions | | | (0.43 | ) | | | (1.38 | ) | | | (2.05 | ) | | | (0.67 | ) | | | (0.04 | ) |
| Net asset value at end of period | | $ | 22.30 | | | $ | 17.60 | | | $ | 19.75 | | | $ | 20.26 | | | $ | 16.38 | |
| Total return | | | 29.63 | % | | | (4.06 | )% | | | 8.52 | % | | | 28.04 | % | | | 17.33 | % |
| Ratios and supplemental data: | | | | | | | | | | | | | | | | | | | | |
| Net assets at end of period (000's) | | $ | 23,956 | | | $ | 6,418 | | | $ | 6,040 | | | $ | 5,015 | | | $ | 3,117 | |
| Ratio to average net assets: | | | | | | | | | | | | | | | | | | | | |
| Net expenses | | | 1.06 | % | | | 1.15 | %(H) | | | 1.20 | % | | | 1.20 | % | | | 1.20 | % |
| Gross expenses | | | 1.82 | % | | | 4.12 | % | | | 4.54 | % | | | 5.92 | % | | | 7.46 | % |
| Net investment income (loss) | | | (0.14 | )% | | | (0.23 | )% | | | (0.10 | )% | | | 0.37 | % | | | 0.19 | % |
| Portfolio turnover rate | | | 72 | %(F) | | | 57 | % | | | 91 | % | | | 82 | % | | | 114 | % |
| (A) | Represents the period from commencement of operations (August 15, 2016) through June 30, 2017. |
| (B) | Net asset value at the beginning of period is based on the net asset value of Institutional Class shares on August 15, 2016. |
| (C) | Less than $0.005 per share. |
| (F) | Portfolio turnover excludes the purchases and sales of the DSM Global Growth & Income Fund merger on August 15, 2016 (see Note 8). If these transactions were included, portfolio turnover would have been higher. |
| (G) | The net investment income (loss) per share is based on average shares outstanding for the period. |
| (H) | Expense cap was lowered to 1.10% from 1.20% on January 1, 2016. |
See accompanying Notes to Financial Statements.
Financial Highlights (Continued)
Touchstone International Small Cap Fund—Class A
Selected Data for a Share Outstanding Throughout Each Period
| | | Year Ended June 30, | |
| | | 2017 | | | 2016 | | | 2015 | | | 2014 | | | 2013 | |
| Net asset value at beginning of period | | $ | 14.98 | | | $ | 16.52 | | | $ | 15.48 | | | $ | 12.58 | | | $ | 10.21 | |
| Income (loss) from investment operations: | | | | | | | | | | | | | | | | | | | | |
| Net investment income | | | 0.10 | | | | 0.09 | | | | 0.11 | | | | 0.11 | (A) | | | 0.11 | |
| Net realized and unrealized gains (losses) on investments | | | 1.84 | | | | (1.53 | ) | | | 1.00 | | | | 3.00 | | | | 2.43 | |
| Total from investment operations | | | 1.94 | | | | (1.44 | ) | | | 1.11 | | | | 3.11 | | | | 2.54 | |
| Distributions from: | | | | | | | | | | | | | | | | | | | | |
| Net investment income | | | (0.14 | ) | | | (0.10 | ) | | | (0.07 | ) | | | (0.21 | ) | | | (0.17 | ) |
| Net asset value at end of period | | $ | 16.78 | | | $ | 14.98 | | | $ | 16.52 | | | $ | 15.48 | | | $ | 12.58 | |
| Total return(B) | | | 13.13 | % | | | (8.77 | )% | | | 7.29 | % | | | 24.74 | % | | | 24.99 | % |
| Ratios and supplemental data: | | | | | | | | | | | | | | | | | | | | |
| Net assets at end of period (000's) | | $ | 16,529 | | | $ | 23,095 | | | $ | 24,635 | | | $ | 10,721 | | | $ | 489 | |
| Ratio to average net assets: | | | | | | | | | | | | | | | | | | | | |
| Net expenses | | | 1.55 | % | | | 1.55 | % | | | 1.55 | % | | | 1.55 | % | | | 1.55 | % |
| Gross expenses | | | 1.71 | % | | | 1.66 | % | | | 1.84 | % | | | 2.12 | % | | | 7.77 | % |
| Net investment income | | | 0.56 | % | | | 0.59 | % | | | 0.90 | % | | | 0.76 | % | | | 1.41 | % |
| Portfolio turnover rate | | | 89 | % | | | 90 | % | | | 84 | % | | | 60 | % | | | 79 | % |
Touchstone International Small Cap Fund—Class C
Selected Data for a Share Outstanding Throughout Each Period
| | | Year Ended June 30, | |
| | | 2017 | | | 2016 | | | 2015 | | | 2014 | | | 2013 | |
| Net asset value at beginning of period | | $ | 14.67 | | | $ | 16.28 | | | $ | 15.33 | | | $ | 12.54 | | | $ | 10.19 | |
| Income (loss) from investment operations: | | | | | | | | | | | | | | | | | | | | |
| Net investment income (loss) | | | (0.12 | ) | | | (0.04 | ) | | | 0.06 | | | | — | (A)(C) | | | 0.14 | |
| Net realized and unrealized gains (losses) on investments | | | 1.92 | | | | (1.49 | ) | | | 0.92 | | | | 2.99 | | | | 2.31 | |
| Total from investment operations | | | 1.80 | | | | (1.53 | ) | | | 0.98 | | | | 2.99 | | | | 2.45 | |
| Distributions from: | | | | | | | | | | | | | | | | | | | | |
| Net investment income | | | — | | | | (0.08 | ) | | | (0.03 | ) | | | (0.20 | ) | | | (0.10 | ) |
| Net asset value at end of period | | $ | 16.47 | | | $ | 14.67 | | | $ | 16.28 | | | $ | 15.33 | | | $ | 12.54 | |
| Total return(B) | | | 12.27 | % | | | (9.43 | )% | | | 6.44 | % | | | 23.94 | % | | | 24.08 | % |
| Ratios and supplemental data: | | | | | | | | | | | | | | | | | | | | |
| Net assets at end of period (000's) | | $ | 2,818 | | | $ | 4,294 | | | $ | 4,120 | | | $ | 613 | | | $ | 7 | |
| Ratio to average net assets: | | | | | | | | | | | | | | | | | | | | |
| Net expenses | | | 2.30 | % | | | 2.30 | % | | | 2.30 | % | | | 2.30 | % | | | 2.30 | % |
| Gross expenses | | | 2.73 | % | | | 2.62 | % | | | 2.92 | % | | | 7.28 | % | | | 94.29 | % |
| Net investment income (loss) | | | (0.19 | )% | | | (0.16 | )% | | | 0.15 | % | | | 0.01 | % | | | 0.66 | % |
| Portfolio turnover rate | | | 89 | % | | | 90 | % | | | 84 | % | | | 60 | % | | | 79 | % |
| (A) | The net investment income per share is based on average shares outstanding for the period. |
| (B) | Total returns shown exclude the effect of applicable sales loads. If these charges were included, the returns would be lower. |
| (C) | Less than $0.005 per share. |
See accompanying Notes to Financial Statements.
Financial Highlights (Continued)
Touchstone International Small Cap Fund—Class Y
Selected Data for a Share Outstanding Throughout Each Period
| | | Year Ended June 30, | |
| | | 2017 | | | 2016 | | | 2015 | | | 2014 | | | 2013 | |
| Net asset value at beginning of period | | $ | 15.39 | | | $ | 16.94 | | | $ | 15.86 | | | $ | 12.84 | | | $ | 10.40 | |
| Income (loss) from investment operations: | | | | | | | | | | | | | | | | | | | | |
| Net investment income | | | 0.17 | | | | 0.13 | | | | 0.14 | | | | 0.16 | (A) | | | 0.21 | |
| Net realized and unrealized gains (losses) on investments | | | 1.85 | | | | (1.57 | ) | | | 1.04 | | | | 3.07 | | | | 2.40 | |
| Total from investment operations | | | 2.02 | | | | (1.44 | ) | | | 1.18 | | | | 3.23 | | | | 2.61 | |
| Distributions from: | | | | | | | | | | | | | | | | | | | | |
| Net investment income | | | (0.20 | ) | | | (0.11 | ) | | | (0.10 | ) | | | (0.21 | ) | | | (0.17 | ) |
| Net asset value at end of period | | $ | 17.21 | | | $ | 15.39 | | | $ | 16.94 | | | $ | 15.86 | | | $ | 12.84 | |
| Total return | | | 13.39 | % | | | (8.56 | )% | | | 7.54 | % | | | 25.16 | % | | | 25.38 | % |
| Ratios and supplemental data: | | | | | | | | | | | | | | | | | | | | |
| Net assets at end of period (000's) | | $ | 146,744 | | | $ | 166,801 | | | $ | 172,477 | | | $ | 120,537 | | | $ | 90,125 | |
| Ratio to average net assets: | | | | | | | | | | | | | | | | | | | | |
| Net expenses | | | 1.30 | % | | | 1.30 | % | | | 1.30 | % | | | 1.25 | % | | | 1.24 | % |
| Gross expenses | | | 1.32 | % | | | 1.32 | % | | | 1.38 | % | | | 1.44 | % | | | 1.53 | % |
| Net investment income | | | 0.81 | % | | | 0.84 | % | | | 1.15 | % | | | 1.06 | % | | | 1.71 | % |
| Portfolio turnover rate | | | 89 | % | | | 90 | % | | | 84 | % | | | 60 | % | | | 79 | % |
Touchstone International Small Cap Fund—Institutional Class
Selected Data for a Share Outstanding Throughout Each Period
| | | Year Ended June 30, | |
| | | 2017 | | | 2016 | | | 2015 | | | 2014 | | | 2013 | |
| Net asset value at beginning of period | | $ | 15.48 | | | $ | 17.02 | | | $ | 15.94 | | | $ | 12.90 | | | $ | 10.45 | |
| Income (loss) from investment operations: | | | | | | | | | | | | | | | | | | | | |
| Net investment income | | | 0.16 | | | | 0.12 | | | | 0.18 | | | | 0.18 | (A) | | | 0.23 | |
| Net realized and unrealized gains (losses) on investments | | | 1.90 | | | | (1.55 | ) | | | 1.02 | | | | 3.09 | | | | 2.42 | |
| Total from investment operations | | | 2.06 | | | | (1.43 | ) | | | 1.20 | | | | 3.27 | | | | 2.65 | |
| Distributions from: | | | | | | | | | | | | | | | | | | | | |
| Net investment income | | | (0.23 | ) | | | (0.11 | ) | | | (0.12 | ) | | | (0.23 | ) | | | (0.20 | ) |
| Net asset value at end of period | | $ | 17.31 | | | $ | 15.48 | | | $ | 17.02 | | | $ | 15.94 | | | $ | 12.90 | |
| Total return | | | 13.56 | % | | | (8.43 | )% | | | 7.65 | % | | | 25.38 | % | | | 25.59 | % |
| Ratios and supplemental data: | | | | | | | | | | | | | | | | | | | | |
| Net assets at end of period (000's) | | $ | 148,937 | | | $ | 197,693 | | | $ | 47,319 | | | $ | 30,223 | | | $ | 16,238 | |
| Ratio to average net assets: | | | | | | | | | | | | | | | | | | | | |
| Net expenses | | | 1.18 | % | | | 1.18 | % | | | 1.18 | % | | | 1.08 | % | | | 1.05 | % |
| Gross expenses | | | 1.23 | % | | | 1.23 | % | | | 1.30 | % | | | 1.33 | % | | | 1.50 | % |
| Net investment income | | | 0.93 | % | | | 0.96 | % | | | 1.27 | % | | | 1.23 | % | | | 1.90 | % |
| Portfolio turnover rate | | | 89 | % | | | 90 | % | | | 84 | % | | | 60 | % | | | 79 | % |
(A) The net investment income per share is based on average shares outstanding for the period.
See accompanying Notes to Financial Statements.
Financial Highlights (Continued)
Touchstone Large Cap Fund—Class A
Selected Data for a Share Outstanding Throughout Each Period
| | | | | | Period Ended | |
| | | Year Ended June 30, | | | June 30, | |
| | | 2017 | | | 2016 | | | 2015 (A) | |
| Net asset value at beginning of period | | $ | 10.49 | | | $ | 10.65 | | | $ | 10.00 | |
| Income (loss) from investment operations: | | | | | | | | | | | | |
| Net investment income | | | 0.06 | | | | 0.08 | | | | 0.09 | (B) |
| Net realized and unrealized gains (losses) on investments | | | 1.49 | | | | (0.18 | ) | | | 0.57 | |
| Total from investment operations | | | 1.55 | | | | (0.10 | ) | | | 0.66 | |
| Distributions from: | | | | | | | | | | | | |
| Net investment income | | | (0.08 | ) | | | (0.06 | ) | | | (0.01 | ) |
| Net asset value at end of period | | $ | 11.96 | | | $ | 10.49 | | | $ | 10.65 | |
| Total return(C) | | | 14.82 | % | | | (0.92 | )% | | | 6.57 | %(D) |
| Ratios and supplemental data: | | | | | | | | | | | | |
| Net assets at end of period (000's) | | $ | 5,368 | | | $ | 3,657 | | | $ | 2,013 | |
| Ratio to average net assets: | | | | | | | | | | | | |
| Net expenses | | | 1.12 | % | | | 1.12 | % | | | 1.12 | %(E) |
| Gross expenses | | | 1.57 | % | | | 1.68 | % | | | 4.17 | %(E) |
| Net investment income | | | 0.56 | % | | | 0.87 | % | | | 0.81 | %(E) |
| Portfolio turnover rate | | | 23 | % | | | 33 | % | | | 8 | %(D)(F) |
Touchstone Large Cap Fund—Class C
Selected Data for a Share Outstanding Throughout Each Period
| | | | | | Period Ended | |
| | | Year Ended June 30, | | | June 30, | |
| | | 2017 | | | 2016 | | | 2015 (A) | |
| Net asset value at beginning of period | | $ | 10.37 | | | $ | 10.60 | | | $ | 10.00 | |
| Income (loss) from investment operations: | | | | | | | | | | | | |
| Net investment income | | | (0.02 | ) | | | 0.02 | | | | 0.01 | (B) |
| Net realized and unrealized gains (losses) on investments | | | 1.47 | | | | (0.20 | ) | | | 0.59 | |
| Total from investment operations | | | 1.45 | | | | (0.18 | ) | | | 0.60 | |
| Distributions from: | | | | | | | | | | | | |
| Net investment income | | | (0.02 | ) | | | (0.05 | ) | | | — | |
| Net asset value at end of period | | $ | 11.80 | | | $ | 10.37 | | | $ | 10.60 | |
| Total return(C) | | | 13.98 | % | | | (1.72 | )% | | | 6.00 | %(D) |
| Ratios and supplemental data: | | | | | | | | | | | | |
| Net assets at end of period (000's) | | $ | 8,102 | | | $ | 6,124 | | | $ | 1,370 | |
| Ratio to average net assets: | | | | | | | | | | | | |
| Net expenses | | | 1.87 | % | | | 1.87 | % | | | 1.87 | %(E) |
| Gross expenses | | | 2.12 | % | | | 2.39 | % | | | 4.34 | %(E) |
| Net investment income | | | (0.19 | )% | | | 0.12 | % | | | 0.06 | %(E) |
| Portfolio turnover rate | | | 23 | % | | | 33 | % | | | 8 | %(D)(F) |
| (A) | Represents the period from commencement of operations (July 10, 2014) through June 30, 2015. |
| (B) | The net investment income per share is based on average shares outstanding for the period. |
| (C) | Total returns shown exclude the effect of applicable sales loads. If these charges were included, the returns would be lower. |
| (F) | Portfolio turnover excludes the purchases and sales of the Touchstone Capital Growth Fund acquired on June 26, 2015. If these transactions were included, portfolio turnover would have been higher. |
See accompanying Notes to Financial Statements.
Financial Highlights (Continued)
Touchstone Large Cap Fund—Class Y
Selected Data for a Share Outstanding Throughout Each Period
| | | | | | Period Ended | |
| | | Year Ended June 30, | | | June 30, | |
| | | 2017 | | | 2016 | | | 2015(A) | |
| Net asset value at beginning of period | | $ | 10.52 | | | $ | 10.67 | | | $ | 10.00 | |
| Income (loss) from investment operations: | | | | | | | | | | | | |
| Net investment income | | | 0.09 | | | | 0.11 | | | | 0.11 | (B) |
| Net realized and unrealized gains (losses) on investments | | | 1.49 | | | | (0.19 | ) | | | 0.57 | |
| Total from investment operations | | | 1.58 | | | | (0.08 | ) | | | 0.68 | |
| Distributions from: | | | | | | | | | | | | |
| Net investment income | | | (0.10 | ) | | | (0.07 | ) | | | (0.01 | ) |
| Net asset value at end of period | | $ | 12.00 | | | $ | 10.52 | | | $ | 10.67 | |
| Total return | | | 15.13 | % | | | (0.70 | )% | | | 6.80 | %(C) |
| Ratios and supplemental data: | | | | | | | | | | | | |
| Net assets at end of period (000's) | | $ | 222,080 | | | $ | 208,463 | | | $ | 194,226 | |
| Ratio to average net assets: | | | | | | | | | | | | |
| Net expenses | | | 0.87 | % | | | 0.87 | % | | | 0.87 | %(D) |
| Gross expenses | | | 1.01 | % | | | 1.04 | % | | | 1.19 | %(D) |
| Net investment income | | | 0.81 | % | | | 1.11 | % | | | 1.06 | %(D) |
| Portfolio turnover rate | | | 23 | % | | | 33 | % | | | 8 | %(C)(E) |
Touchstone Large Cap Fund—Institutional Class
Selected Data for a Share Outstanding Throughout Each Period
| | | | | | Period Ended | |
| | | Year Ended June 30, | | | June 30, | |
| | | 2017 | | | 2016 | | | 2015(A) | |
| Net asset value at beginning of period | | $ | 10.53 | | | $ | 10.68 | | | $ | 10.00 | |
| Income (loss) from investment operations: | | | | | | | | | | | | |
| Net investment income | | | 0.11 | | | | 0.13 | | | | 0.12 | (B) |
| Net realized and unrealized gains (losses) on investments | | | 1.49 | | | | (0.20 | ) | | | 0.57 | |
| Total from investment operations | | | 1.60 | | | | (0.07 | ) | | | 0.69 | |
| Distributions from: | | | | | | | | | | | | |
| Net investment income | | | (0.11 | ) | | | (0.08 | ) | | | (0.01 | ) |
| Net asset value at end of period | | $ | 12.02 | | | $ | 10.53 | | | $ | 10.68 | |
| Total return | | | 15.31 | % | | | (0.66 | )% | | | 6.92 | %(C) |
| Ratios and supplemental data: | | | | | | | | | | | | |
| Net assets at end of period (000's) | | $ | 97,888 | | | $ | 87,032 | | | $ | 98,889 | |
| Ratio to average net assets: | | | | | | | | | | | | |
| Net expenses | | | 0.77 | % | | | 0.77 | % | | | 0.77 | %(D) |
| Gross expenses | | | 0.91 | % | | | 0.93 | % | | | 0.98 | %(D) |
| Net investment income | | | 0.91 | % | | | 1.21 | % | | | 1.16 | %(D) |
| Portfolio turnover rate | | | 23 | % | | | 33 | % | | | 8 | %(C)(E) |
| (A) | Represents the period from commencement of operations (July 10, 2014) through June 30, 2015. |
| (B) | The net investment income per share is based on average shares outstanding for the period. |
| (E) | Portfolio turnover excludes the purchases and sales of the Touchstone Capital Growth Fund acquired on June 26, 2015. If these transactions were included, portfolio turnover would have been higher. |
See accompanying Notes to Financial Statements.
Financial Highlights (Continued)
Touchstone Large Company Growth Fund—Class A
Selected Data for a Share Outstanding Throughout The Period
| | | Period Ended | |
| | | June 30, | |
| | | 2017(A) | |
| Net asset value at beginning of period | | $ | 31.38 | (B) |
| Income (Loss) from investment operations: | | | | |
| Net investment loss | | | (0.19 | )(C) |
| Net realized and unrealized gains on investments | | | 5.41 | |
| Total from investment operations | | | 5.22 | |
| Distributions from: | | | | |
| Realized capital gains | | | (1.08 | ) |
| Net asset value at end of period | | $ | 35.52 | |
| Total return(D) | | | 17.31 | %(E) |
| Ratios and supplemental data: | | | | |
| Net assets at end of period (000's) | | $ | 140 | |
| Ratio to average net assets: | | | | |
| Net expenses | | | 1.23 | %(F) |
| Gross expenses | | | 11.14 | %(F) |
| Net investment loss | | | (0.68 | )%(F) |
| Portfolio turnover rate | | | 55 | % |
Touchstone Large Company Growth Fund — Class C
Selected Data for a Share Outstanding Throughout The Period
| | | Period Ended | |
| | | June 30, | |
| | | | 2017(A) | |
| Net asset value at beginning of period | | $ | 31.38 | (B) |
| Income (loss) from investment operations: | | | | |
| Net investment loss | | | (0.38 | )(C) |
| Net realized and unrealized gains on investments | | | 5.37 | |
| Total from investment operations | | | 4.99 | |
| Distributions from: | | | | |
| Realized capital gains | | | (1.08 | ) |
| Net asset value at end of period | | $ | 35.29 | |
| Total return(D) | | | 16.52 | %(E) |
| Ratios and supplemental data: | | | | |
| Net assets at end of period (000's) | | $ | 31 | |
| Ratio to average net assets: | | | | |
| Net expenses | | | 1.98 | %(F) |
| Gross expenses | | | 257.02 | %(F) |
| Net investment loss | | | (1.43 | )%(F) |
| Portfolio turnover rate | | | 55 | % |
| (A) | Represents the period from commencement of operations (August 15, 2016) through June 30, 2017. |
| (B) | Net asset value at the beginning of period is based on the net asset value of Institutional Class shares on August 15, 2016. |
| (C) | The net investment loss per share is based on average shares outstanding for the period. |
| (D) | Total returns shown exclude the effect of applicable sales loads. If these charges were included, the returns would be lower. |
See accompanying Notes to Financial Statements.
Financial Highlights (Continued)
Touchstone Large Company Growth Fund—Class Y
Selected Data for a Share Outstanding Throughout The Period
| | | Period Ended | |
| | | June 30, | |
| | | 2017(A) | |
| Net asset value at beginning of period | | $ | 31.38 | (B) |
| Income (loss) from investment operations: | | | | |
| Net investment loss | | | (0.12 | )(C) |
| Net realized and unrealized gains on investments | | | 5.42 | |
| Total from investment operations | | | 5.30 | |
| Distributions from: | | | | |
| Realized capital gains | | | (1.08 | ) |
| Net asset value at end of period | | $ | 35.60 | |
| Total return | | | 17.57 | %(D) |
| Ratios and supplemental data: | | | | |
| Net assets at end of period (000's) | | $ | 9,938 | |
| Ratio to average net assets: | | | | |
| Net expenses | | | 0.98 | %(E) |
| Gross expenses | | | 1.12 | %(E) |
| Net investment loss | | | (0.42 | )%(E) |
| Portfolio turnover rate | | | 55 | % |
Touchstone Large Company Growth Fund—Institutional Class
Selected Data for a Share Outstanding Throughout Each Period
| | | Year Ended June 30, | |
| | | 2017 | | | 2016 | | | 2015 | | | 2014 | | | 2013 | |
| Net asset value at beginning of period | | $ | 29.15 | | | $ | 33.17 | | | $ | 29.67 | | | $ | 24.25 | | | $ | 20.81 | |
| Income (loss) from investment operations: | | | | | | | | | | | | | | | | | | | | |
| Net investment income (loss) | | | (0.12 | )(C) | | | (0.14 | )(C) | | | (0.08 | )(C) | | | (0.01 | )(C) | | | 0.07 | (C) |
| Net realized and unrealized gains (losses) on investments | | | 7.68 | | | | (1.45 | ) | | | 4.61 | | | | 6.08 | | | | 3.37 | |
| Total from investment operations | | | 7.56 | | | | (1.59 | ) | | | 4.53 | | | | 6.07 | | | | 3.44 | |
| Distributions from: | | | | | | | | | | | | | | | | | | | | |
| Net investment income | | | — | | | | — | | | | — | | | | (0.03 | ) | | | — | |
| Realized capital gains | | | (1.08 | ) | | | (2.43 | ) | | | (1.03 | ) | | | (0.62 | ) | | | — | |
| Total distributions | | | (1.08 | ) | | | (2.43 | ) | | | (1.03 | ) | | | (0.65 | ) | | | — | |
| Proceeds from redemption fees collected | | | — | | | | — | (F) | | | — | | | | — | (F) | | | — | |
| Net asset value at end of period | | $ | 35.63 | | | $ | 29.15 | | | $ | 33.17 | | | $ | 29.67 | | | $ | 24.25 | |
| Total return | | | 26.67 | % | | | (5.08 | )% | | | 15.59 | % | | | 25.19 | % | | | 16.53 | % |
| Ratios and supplemental data: | | | | | | | | | | | | | | | | | | | | |
| Net assets at end of period (000's) | | $ | 189,444 | | | $ | 180,104 | | | $ | 196,084 | | | $ | 152,569 | | | $ | 78,582 | |
| Ratio to average net assets: | | | | | | | | | | | | | | | | | | | | |
| Net expenses | | | 0.89 | % | | | 0.95 | % | | | 0.95 | % | | | 0.95 | % | | | 0.95 | % |
| Gross expenses | | | 1.02 | % | | | 1.00 | % | | | 1.00 | % | | | 1.07 | % | | | 1.23 | % |
| Net investment income (loss) | | | (0.39 | )% | | | (0.46 | )% | | | (0.25 | )% | | | (0.04 | )% | | | 0.30 | % |
| Portfolio turnover rate | | | 55 | % | | | 57 | % | | | 80 | % | | | 56 | % | | | 71 | % |
| (A) | Represents the period from commencement of operations (August 15, 2016) through June 30, 2017. |
| (B) | Net asset value at the beginning of period is based on the net asset value of Institutional Class shares on August 15, 2016. |
| (C) | The net investment income (loss) per share is based on average shares outstanding for the period. |
| (F) | Proceeds from redemption fees are related to the DSM Large Cap Growth Fund and are less than $0.005 per share. |
See accompanying Notes to Financial Statements.
Financial Highlights (Continued)
Touchstone Ohio Tax-Free Bond Fund—Class A
Selected Data for a Share Outstanding Throughout Each Period
| | | Year Ended June 30, | |
| | | 2017 | | | 2016 | | | 2015 | | | 2014 | | | 2013 | |
| Net asset value at beginning of period | | $ | 12.04 | | | $ | 11.70 | | | $ | 11.76 | | | $ | 11.47 | | | $ | 11.90 | |
| Income (loss) from investment operations: | | | | | | | | | | | | | | | | | | | | |
| Net investment income | | | 0.35 | | | | 0.36 | | | | 0.38 | | | | 0.39 | | | | 0.39 | |
| Net realized and unrealized gains (losses) on investments | | | (0.47 | ) | | | 0.36 | | | | (0.06 | ) | | | 0.33 | | | | (0.36 | ) |
| Total from investment operations | | | (0.12 | ) | | | 0.72 | | | | 0.32 | | | | 0.72 | | | | 0.03 | |
| Distributions from: | | | | | | | | | | | | | | | | | | | | |
| Net investment income | | | (0.35 | ) | | | (0.36 | ) | | | (0.38 | ) | | | (0.39 | ) | | | (0.39 | ) |
| Realized capital gains | | | (0.02 | ) | | | (0.02 | ) | | | — | | | | (0.04 | ) | | | (0.07 | ) |
| Total distributions | | | (0.37 | ) | | | (0.38 | ) | | | (0.38 | ) | | | (0.43 | ) | | | (0.46 | ) |
| Net asset value at end of period | | $ | 11.55 | | | $ | 12.04 | | | $ | 11.70 | | | $ | 11.76 | | | $ | 11.47 | |
| Total return(A) | | | (1.03 | )% | | | 6.25 | % | | | 2.72 | % | | | 6.41 | % | | | 0.13 | % |
| Ratios and supplemental data: | | | | | | | | | | | | | | | | | | | | |
| Net assets at end of period (000's) | | $ | 42,818 | | | $ | 52,599 | | | $ | 47,153 | | | $ | 44,939 | | | $ | 46,803 | |
| Ratio to average net assets: | | | | | | | | | | | | | | | | | | | | |
| Net expenses | | | 0.85 | % | | | 0.85 | % | | | 0.85 | % | | | 0.85 | % | | | 0.85 | % |
| Gross expenses | | | 1.13 | % | | | 1.13 | % | | | 1.09 | % | | | 1.10 | % | | | 1.09 | % |
| Net investment income | | | 2.98 | % | | | 3.05 | % | | | 3.20 | % | | | 3.42 | % | | | 3.25 | % |
| Portfolio turnover rate | | | 34 | % | | | 27 | % | | | 23 | % | | | 25 | % | | | 24 | % |
Touchstone Ohio Tax-Free Bond Fund — Class C
Selected Data for a Share Outstanding Throughout Each Period
| | | Year Ended June 30, | |
| | | 2017 | | | 2016 | | | 2015 | | | 2014 | | | 2013 | |
| Net asset value at beginning of period | | $ | 12.06 | | | $ | 11.72 | | | $ | 11.78 | | | $ | 11.48 | | | $ | 11.92 | |
| Income (loss) from investment operations: | | | | | | | | | | | | | | | | | | | | |
| Net investment income | | | 0.26 | | | | 0.27 | | | | 0.29 | | | | 0.31 | | | | 0.30 | |
| Net realized and unrealized gains (losses) on investments | | | (0.47 | ) | | | 0.36 | | | | (0.06 | ) | | | 0.34 | | | | (0.37 | ) |
| Total from investment operations | | | (0.21 | ) | | | 0.63 | | | | 0.23 | | | | 0.65 | | | | (0.07 | ) |
| Distributions from: | | | | | | | | | | | | | | | | | | | | |
| Net investment income | | | (0.26 | ) | | | (0.27 | ) | | | (0.29 | ) | | | (0.31 | ) | | | (0.30 | ) |
| Realized capital gains | | | (0.02 | ) | | | (0.02 | ) | | | — | | | | (0.04 | ) | | | (0.07 | ) |
| Total distributions | | | (0.28 | ) | | | (0.29 | ) | | | (0.29 | ) | | | (0.35 | ) | | | (0.37 | ) |
| Net asset value at end of period | | $ | 11.57 | | | $ | 12.06 | | | $ | 11.72 | | | $ | 11.78 | | | $ | 11.48 | |
| Total return(A) | | | (1.77 | )% | | | 5.45 | % | | | 1.96 | % | | | 5.70 | % | | | (0.70 | )% |
| Ratios and supplemental data: | | | | | | | | | | | | | | | | | | | | |
| Net assets at end of period (000's) | | $ | 6,515 | | | $ | 7,320 | | | $ | 7,266 | | | $ | 7,333 | | | $ | 6,978 | |
| Ratio to average net assets: | | | | | | | | | | | | | | | | | | | | |
| Net expenses | | | 1.60 | % | | | 1.60 | % | | | 1.60 | % | | | 1.60 | % | | | 1.60 | % |
| Gross expenses | | | 2.03 | % | | | 2.09 | % | | | 1.93 | % | | | 2.01 | % | | | 1.99 | % |
| Net investment income | | | 2.23 | % | | | 2.30 | % | | | 2.45 | % | | | 2.67 | % | | | 2.50 | % |
| Portfolio turnover rate | | | 34 | % | | | 27 | % | | | 23 | % | | | 25 | % | | | 24 | % |
(A) Total returns shown exclude the effect of applicable sales loads. If these charges were included, the returns would be lower.
See accompanying Notes to Financial Statements.
Financial Highlights (Continued)
Touchstone Ohio Tax-Free Bond Fund—Class Y
Selected Data for a Share Outstanding Throughout The Period
| | | Period Ended | |
| | | June 30, | |
| | | 2017(A) | |
| Net asset value at beginning of period | | $ | 12.00 | (B) |
| Income (loss) from investment operations: | | | | |
| Net investment income | | | 0.38 | |
| Net realized and unrealized losses on investments | | | (0.49 | ) |
| Total from investment operations | | | (0.11 | ) |
| Distributions from: | | | | |
| Net investment income | | | (0.31 | ) |
| Realized capital gains | | | (0.02 | ) |
| Total distributions | | | (0.33 | ) |
| Net asset value at end of period | | $ | 11.56 | |
| Total return | | | (0.90 | )%(C) |
| Ratios and supplemental data: | | | | |
| Net assets at end of period (000's) | | $ | 2 | |
| Ratio to average net assets: | | | | |
| Net expenses | | | 0.60 | %(D) |
| Gross expenses | | | 298.27 | %(D) |
| Net investment income | | | 4.00 | %(D) |
| Portfolio turnover rate | | | 34 | % |
Touchstone Ohio Tax-Free Bond Fund—Institutional Class
Selected Data for a Share Outstanding Throughout The Period
| | | Period Ended | |
| | | June 30, | |
| | | 2017(A) | |
| Net asset value at beginning of period | | $ | 12.00 | (B) |
| Income (loss) from investment operations: | | | | |
| Net investment income | | | 0.39 | |
| Net realized and unrealized losses on investments | | | (0.50 | ) |
| Total from investment operations | | | (0.11 | ) |
| Distributions from: | | | | |
| Net investment income | | | (0.31 | ) |
| Realized capital gains | | | (0.02 | ) |
| Total distributions | | | (0.33 | ) |
| Net asset value at end of period | | $ | 11.56 | |
| Total return | | | (0.90 | )%(C) |
| Ratios and supplemental data: | | | | |
| Net assets at end of period (000's) | | $ | 2 | |
| Ratio to average net assets: | | | | |
| Net expenses | | | 0.55 | %(D) |
| Gross expenses | | | 298.26 | %(D) |
| Net investment income | | | 4.04 | %(D) |
| Portfolio turnover rate | | | 34 | % |
| (A) | Represents the period from commencement of operations (August 31, 2016) through June 30, 2017. |
| (B) | Net asset value at the beginning of period is based on the net asset value of Class A shares on August 31, 2016. |
See accompanying Notes to Financial Statements.
Financial Highlights (Continued)
Touchstone Small Cap Value Opportunities Fund—Class A
Selected Data for a Share Outstanding Throughout Each Period
| | | Year Ended June 30, | |
| | | 2017 | | | 2016 | | | 2015 | | | 2014 | | | 2013 | |
| Net asset value at beginning of period | | $ | 14.84 | | | $ | 18.67 | | | $ | 20.92 | | | $ | 18.75 | | | $ | 16.97 | |
| Income (loss) from investment operations: | | | | | | | | | | | | | | | | | | | | |
| Net investment income (loss) | | | (0.13 | ) | | | (0.06 | ) | | | 0.04 | | | | (0.05 | ) | | | 0.09 | (A) |
| Net realized and unrealized gains (losses) on investments | | | 2.07 | | | | (2.51 | ) | | | 0.39 | | | | 5.88 | (B) | | | 3.66 | |
| Total from investment operations | | | 1.94 | | | | (2.57 | ) | | | 0.43 | | | | 5.83 | | | | 3.75 | |
| Distributions from: | | | | | | | | | | | | | | | | | | | | |
| Net investment income | | | — | | | | — | | | | (0.31 | ) | | | (0.02 | ) | | | (0.09 | ) |
| Realized capital gains | | | (0.02 | ) | | | (1.26 | ) | | | (2.37 | ) | | | (3.64 | ) | | | (1.88 | ) |
| Total distributions | | | (0.02 | ) | | | (1.26 | ) | | | (2.68 | ) | | | (3.66 | ) | | | (1.97 | ) |
| Net asset value at end of period | | $ | 16.76 | | | $ | 14.84 | | | $ | 18.67 | | | $ | 20.92 | | | $ | 18.75 | |
| Total return(C) | | | 13.08 | % | | | (13.72 | )% | | | 2.68 | % | | | 33.35 | %(B) | | | 24.31 | % |
| Ratios and supplemental data: | | | | | | | | | | | | | | | | | | | | |
| Net assets at end of period (000's) | | $ | 2,849 | | | $ | 4,503 | | | $ | 15,219 | | | $ | 13,332 | | | $ | 1,309 | |
| Ratio to average net assets: | | | | | | | | | | | | | | | | | | | | |
| Net expenses | | | 1.43 | % | | | 1.43 | % | | | 1.45 | % | | | 1.50 | % | | | 1.50 | % |
| Gross expenses | | | 2.03 | % | | | 1.82 | % | | | 1.70 | % | | | 1.93 | % | | | 2.46 | % |
| Net investment income (loss) | | | (0.29 | )% | | | (0.22 | )% | | | 0.31 | % | | | (0.09 | )% | | | 0.53 | % |
| Portfolio turnover rate | | | 59 | % | | | 42 | % | | | 57 | % | | | 73 | % | | | 95 | % |
Touchstone Small Cap Value Opportunities Fund—Class C
Selected Data for a Share Outstanding Throughout Each Period
| | | Year Ended June 30, | |
| | | 2017 | | | 2016 | | | 2015 | | | 2014 | | | 2013 | |
| Net asset value at beginning of period | | $ | 14.44 | | | $ | 18.34 | | | $ | 20.70 | | | $ | 18.69 | | | $ | 16.95 | |
| Income (loss) from investment operations: | | | | | | | | | | | | | | | | | | | | |
| Net investment income (loss) | | | (0.32 | ) | | | (0.20 | ) | | | 0.03 | | | | (0.14 | ) | | | (0.04 | )(A) |
| Net realized and unrealized gains (losses) on investments | | | 2.08 | | | | (2.44 | ) | | | 0.25 | | | | 5.79 | (B) | | | 3.66 | |
| Total from investment operations | | | 1.76 | | | | (2.64 | ) | | | 0.28 | | | | 5.65 | | | | 3.62 | |
| Distributions from: | | | | | | | | | | | | | | | | | | | | |
| Net investment income | | | — | | | | — | | | | (0.27 | ) | | | — | | | | — | |
| Realized capital gains | | | (0.02 | ) | | | (1.26 | ) | | | (2.37 | ) | | | (3.64 | ) | | | (1.88 | ) |
| Total distributions | | | (0.02 | ) | | | (1.26 | ) | | | (2.64 | ) | | | (3.64 | ) | | | (1.88 | ) |
| Net asset value at end of period | | $ | 16.18 | | | $ | 14.44 | | | $ | 18.34 | | | $ | 20.70 | | | $ | 18.69 | |
| Total return(C) | | | 12.19 | % | | | (14.38 | )% | | | 1.93 | % | | | 32.43 | %(B) | | | 23.44 | % |
| Ratios and supplemental data: | | | | | | | | | | | | | | | | | | | | |
| Net assets at end of period (000's) | | $ | 801 | | | $ | 1,121 | | | $ | 2,077 | | | $ | 558 | | | $ | 36 | |
| Ratio to average net assets: | | | | | | | | | | | | | | | | | | | | |
| Net expenses | | | 2.18 | % | | | 2.18 | % | | | 2.19 | % | | | 2.25 | % | | | 2.25 | % |
| Gross expenses | | | 3.53 | % | | | 2.79 | % | | | 2.63 | % | | | 5.09 | % | | | 25.27 | % |
| Net investment loss | | | (1.04 | )% | | | (0.97 | )% | | | (0.44 | )% | | | (0.84 | )% | | | (0.22 | )% |
| Portfolio turnover rate | | | 59 | % | | | 42 | % | | | 57 | % | | | 73 | % | | | 95 | % |
| (A) | The net investment income (loss) per share is based on average shares outstanding for the period. |
| (B) | Impact of payment from affiliate was less than $0.01 per share and 0.01%, respectively. |
| (C) | Total returns shown exclude the effect of applicable sales loads. If these charges were included, the returns would be lower. |
See accompanying Notes to Financial Statements.
Financial Highlights (Continued)
Touchstone Small Cap Value Opportunities Fund— Class Y
Selected Data for a Share Outstanding Throughout Each Period
| | | Year Ended June 30, | |
| | | 2017 | | | 2016 | | | 2015 | | | 2014 | | | 2013 | |
| Net asset value at beginning of period | | $ | 15.77 | | | $ | 19.69 | | | $ | 21.90 | | | $ | 19.45 | | | $ | 17.51 | |
| Income (loss) from investment operations: | | | | | | | | | | | | | | | | | | | | |
| Net investment income (loss) | | | (— | )(A) | | | 0.01 | | | | 0.09 | | | | 0.04 | | | | 0.15 | (B) |
| Net realized and unrealized gains (losses) on investments | | | 2.10 | | | | (2.67 | ) | | | 0.41 | | | | 6.11 | (C) | | | 3.77 | |
| Total from investment operations | | | 2.10 | | | | (2.66 | ) | | | 0.50 | | | | 6.15 | | | | 3.92 | |
| Distributions from: | | | | | | | | | | | | | | | | | | | | |
| Net investment income | | | (0.01 | ) | | | — | | | | (0.34 | ) | | | (0.06 | ) | | | (0.10 | ) |
| Realized capital gains | | | (0.02 | ) | | | (1.26 | ) | | | (2.37 | ) | | | (3.64 | ) | | | (1.88 | ) |
| Total distributions | | | (0.03 | ) | | | (1.26 | ) | | | (2.71 | ) | | | (3.70 | ) | | | (1.98 | ) |
| Net asset value at end of period | | $ | 17.84 | | | $ | 15.77 | | | $ | 19.69 | | | $ | 21.90 | | | $ | 19.45 | |
| Total return | | | 13.30 | % | | | (13.46 | )% | | | 2.92 | % | | | 33.80 | %(C) | | | 24.68 | % |
| Ratios and supplemental data: | | | | | | | | | | | | | | | | | | | | |
| Net assets at end of period (000's) | | $ | 105,692 | | | $ | 104,377 | | | $ | 149,852 | | | $ | 140,689 | | | $ | 96,584 | |
| Ratio to average net assets: | | | | | | | | | | | | | | | | | | | | |
| Net expenses | | | 1.18 | % | | | 1.18 | % | | | 1.20 | % | | | 1.17 | % | | | 1.19 | % |
| Gross expenses | | | 1.29 | % | | | 1.28 | % | | | 1.26 | % | | | 1.24 | % | | | 1.29 | % |
| Net investment income (loss) | | | (0.04 | )% | | | 0.03 | % | | | 0.55 | % | | | 0.24 | % | | | 0.84 | % |
| Portfolio turnover rate | | | 59 | % | | | 42 | % | | | 57 | % | | | 73 | % | | | 95 | % |
Touchstone Small Cap Value Opportunities Fund—Institutional Class
Selected Data for a Share Outstanding Throughout Each Period
| | | Year Ended June 30, | |
| | | 2017 | | | 2016 | | | 2015 | | | 2014 | | | 2013 | |
| Net asset value at beginning of period | | $ | 15.99 | | | $ | 19.94 | | | $ | 22.13 | | | $ | 19.62 | | | $ | 17.63 | |
| Income (loss) from investment operations: | | | | | | | | | | | | | | | | | | | | |
| Net investment income | | | 0.09 | | | | 0.02 | | | | 0.16 | | | | 0.04 | | | | 0.17 | (B) |
| Net realized and unrealized gains (losses) on investments | | | 2.06 | | | | (2.71 | ) | | | 0.37 | | | | 6.18 | (C) | | | 3.82 | |
| Total from investment operations | | | 2.15 | | | | (2.69 | ) | | | 0.53 | | | | 6.22 | | | | 3.99 | |
| Distributions from: | | | | | | | | | | | | | | | | | | | | |
| Net investment income | | | (0.02 | ) | | | — | | | | (0.35 | ) | | | (0.07 | ) | | | (0.12 | ) |
| Realized capital gains | | | (0.02 | ) | | | (1.26 | ) | | | (2.37 | ) | | | (3.64 | ) | | | (1.88 | ) |
| Total distributions | | | (0.04 | ) | | | (1.26 | ) | | | (2.72 | ) | | | (3.71 | ) | | | (2.00 | ) |
| Net asset value at end of period | | $ | 18.10 | | | $ | 15.99 | | | $ | 19.94 | | | $ | 22.13 | | | $ | 19.62 | |
| Total return | | | 13.46 | % | | | (13.44 | )% | | | 3.04 | % | | | 33.90 | %(C) | | | 24.82 | % |
| Ratios and supplemental data: | | | | | | | | | | | | | | | | | | | | |
| Net assets at end of period (000's) | | $ | 5,257 | | | $ | 26,483 | | | $ | 31,318 | | | $ | 26,466 | | | $ | 8,096 | |
| Ratio to average net assets: | | | | | | | | | | | | | | | | | | | | |
| Net expenses | | | 1.10 | % | | | 1.10 | % | | | 1.10 | % | | | 1.10 | % | | | 1.10 | % |
| Gross expenses | | | 1.30 | % | | | 1.24 | % | | | 1.32 | % | | | 1.37 | % | | | 1.46 | % |
| Net investment income | | | 0.04 | % | | | 0.11 | % | | | 0.66 | % | | | 0.31 | % | | | 0.93 | % |
| Portfolio turnover rate | | | 59 | % | | | 42 | % | | | 57 | % | | | 73 | % | | | 95 | % |
| (A) | Less than $0.005 per share. |
| (B) | The net investment income (loss) per share is based on average shares outstanding for the period. |
| (C) | Impact of payment from affiliate was less than $0.01 per share and 0.01%, respectively. |
See accompanying Notes to Financial Statements.
Financial Highlights (Continued)
Touchstone Value Fund—Class A
Selected Data for a Share Outstanding Throughout Each Period
| | | Year Ended June 30, | |
| | | 2017 | | | 2016 | | | 2015 | | | 2014 | | | 2013 | |
| Net asset value at beginning of period | | $ | 8.84 | | | $ | 9.78 | | | $ | 9.56 | | | $ | 8.02 | | | $ | 6.95 | |
| Income (loss) from investment operations: | | | | | | | | | | | | | | | | | | | | |
| Net investment income | | | 0.19 | | | | 0.16 | | | | 0.16 | | | | 0.19 | | | | 0.15 | (A) |
| Net realized and unrealized gains (losses) on investments | | | 1.30 | | | | (0.27 | ) | | | 0.34 | | | | 1.53 | | | | 1.30 | |
| Total from investment operations | | | 1.49 | | | | (0.11 | ) | | | 0.50 | | | | 1.72 | | | | 1.45 | |
| Distributions from: | | | | | | | | | | | | | | | | | | | | |
| Net investment income | | | (0.18 | ) | | | (0.16 | ) | | | (0.11 | ) | | | (0.18 | ) | | | (0.15 | ) |
| Realized capital gains | | | (0.02 | ) | | | (0.67 | ) | | | (0.17 | ) | | | — | | | | (0.23 | ) |
| Total distributions | | | (0.20 | ) | | | (0.83 | ) | | | (0.28 | ) | | | (0.18 | ) | | | (0.38 | ) |
| Net asset value at end of period | | $ | 10.13 | | | $ | 8.84 | | | $ | 9.78 | | | $ | 9.56 | | | $ | 8.02 | |
| Total return(B) | | | 16.92 | % | | | (0.89 | )% | | | 5.26 | % | | | 21.50 | % | | | 21.56 | % |
| Ratios and supplemental data: | | | | | | | | | | | | | | | | | | | | |
| Net assets at end of period (000's) | | $ | 43,607 | | | $ | 47,939 | | | $ | 55,539 | | | $ | 66,000 | | | $ | 53,433 | |
| Ratio to average net assets: | | | | | | | | | | | | | | | | | | | | |
| Net expenses | | | 1.08 | % | | | 1.08 | % | | | 1.08 | % | | | 1.07 | % | | | 1.00 | % |
| Gross expenses | | | 1.24 | % | | | 1.28 | % | | | 1.27 | % | | | 1.31 | % | | | 1.51 | % |
| Net investment income | | | 1.86 | % | | | 1.71 | % | | | 1.54 | % | | | 2.13 | % | | | 1.96 | % |
| Portfolio turnover rate | | | 29 | % | | | 19 | %(C) | | | 20 | % | | | 26 | % | | | 110 | %(D) |
Touchstone Value Fund—Class C
Selected Data for a Share Outstanding Throughout Each Period
| | | Year Ended June 30, | |
| | | 2017 | | | 2016 | | | 2015 | | | 2014 | | | 2013 | |
| Net asset value at beginning of period | | $ | 8.81 | | | $ | 9.75 | | | $ | 9.55 | | | $ | 8.02 | | | $ | 6.95 | |
| Income (loss) from investment operations: | | | | | | | | | | | | | | | | | | | | |
| Net investment income | | | 0.12 | | | | 0.09 | | | | 0.07 | | | | 0.11 | | | | 0.09 | (A) |
| Net realized and unrealized gains (losses) on investments | | | 1.29 | | | | (0.27 | ) | | | 0.35 | | | | 1.54 | | | | 1.30 | |
| Total from investment operations | | | 1.41 | | | | (0.18 | ) | | | 0.42 | | | | 1.65 | | | | 1.39 | |
| Distributions from: | | | | | | | | | | | | | | | | | | | | |
| Net investment income | | | (0.10 | ) | | | (0.09 | ) | | | (0.05 | ) | | | (0.12 | ) | | | (0.09 | ) |
| Realized capital gains | | | (0.02 | ) | | | (0.67 | ) | | | (0.17 | ) | | | — | | | | (0.23 | ) |
| Total distributions | | | (0.12 | ) | | | (0.76 | ) | | | (0.22 | ) | | | (0.12 | ) | | | (0.32 | ) |
| Net asset value at end of period | | $ | 10.10 | | | $ | 8.81 | | | $ | 9.75 | | | $ | 9.55 | | | $ | 8.02 | |
| Total return(B) | | | 16.06 | % | | | (1.65 | )% | | | 4.41 | % | | | 20.61 | % | | | 20.62 | % |
| Ratios and supplemental data: | | | | | | | | | | | | | | | | | | | | |
| Net assets at end of period (000's) | | $ | 4,503 | | | $ | 5,624 | | | $ | 6,932 | | | $ | 5,218 | | | $ | 3,025 | |
| Ratio to average net assets: | | | | | | | | | | | | | | | | | | | | |
| Net expenses | | | 1.83 | % | | | 1.83 | % | | | 1.83 | % | | | 1.82 | % | | | 1.75 | % |
| Gross expenses | | | 2.12 | % | | | 2.16 | % | | | 2.14 | % | | | 2.19 | % | | | 2.30 | % |
| Net investment income | | | 1.11 | % | | | 0.96 | % | | | 0.79 | % | | | 1.38 | % | | | 1.21 | % |
| Portfolio turnover rate | | | 29 | % | | | 19 | %(C) | | | 20 | % | | | 26 | % | | | 110 | %(D) |
| (A) | The net investment income per share is based on average shares outstanding for the period. |
| (B) | Total returns shown exclude the effect of applicable sales loads. If these charges were included, the returns would be lower. |
| (C) | Portfolio turnover rate excludes securities received from processing a subscription-in-kind. |
| (D) | Portfolio turnover excludes the purchases and sales of the Fifth Third Disciplined Large Cap Value Fund acquired on September 10, 2012. If these transactions were included, portfolio turnover would have been higher. |
See accompanying Notes to Financial Statements.
Financial Highlights (Continued)
Touchstone Value Fund—Class Y
Selected Data for a Share Outstanding Throughout Each Period
| | | Year Ended June 30, | |
| | | 2017 | | | 2016 | | | 2015 | | | 2014 | | | 2013 | |
| Net asset value at beginning of period | | $ | 8.87 | | | $ | 9.81 | | | $ | 9.59 | | | $ | 8.05 | | | $ | 6.97 | |
| Income (loss) from investment operations: | | | | | | | | | | | | | | | | | | | | |
| Net investment income | | | 0.20 | | | | 0.18 | | | | 0.18 | | | | 0.21 | | | | 0.16 | (A) |
| Net realized and unrealized gains (losses) on investments | | | 1.32 | | | | (0.27 | ) | | | 0.35 | | | | 1.53 | | | | 1.32 | |
| Total from investment operations | | | 1.52 | | | | (0.09 | ) | | | 0.53 | | | | 1.74 | | | | 1.48 | |
| Distributions from: | | | | | | | | | | | | | | | | | | | | |
| Net investment income | | | (0.20 | ) | | | (0.18 | ) | | | (0.14 | ) | | | (0.20 | ) | | | (0.17 | ) |
| Realized capital gains | | | (0.02 | ) | | | (0.67 | ) | | | (0.17 | ) | | | — | | | | (0.23 | ) |
| Total distributions | | | (0.22 | ) | | | (0.85 | ) | | | (0.31 | ) | | | (0.20 | ) | | | (0.40 | ) |
| Net asset value at end of period | | $ | 10.17 | | | $ | 8.87 | | | $ | 9.81 | | | $ | 9.59 | | | $ | 8.05 | |
| Total return | | | 17.28 | % | | | (0.64 | )% | | | 5.52 | % | | | 21.71 | % | | | 21.91 | % |
| Ratios and supplemental data: | | | | | | | | | | | | | | | | | | | | |
| Net assets at end of period (000's) | | $ | 83,974 | | | $ | 76,852 | | | $ | 104,668 | | | $ | 113,055 | | | $ | 99,398 | |
| Ratio to average net assets: | | | | | | | | | | | | | | | | | | | | |
| Net expenses | | | 0.83 | % | | | 0.83 | % | | | 0.82 | % | | | 0.80 | % | | | 0.77 | % |
| Gross expenses | | | 0.97 | % | | | 0.99 | % | | | 0.97 | % | | | 0.99 | % | | | 1.09 | % |
| Net investment income | | | 2.11 | % | | | 1.96 | % | | | 1.80 | % | | | 2.39 | % | | | 2.19 | % |
| Portfolio turnover rate | | | 29 | % | | | 19 | %(B) | | | 20 | % | | | 26 | % | | | 110 | %(C) |
Touchstone Value Fund—Institutional Class
Selected Data for a Share Outstanding Throughout Each Period
| | | Year Ended June 30, | |
| | | 2017 | | | 2016 | | | 2015 | | | 2014 | | | 2013 | |
| Net asset value at beginning of period | | $ | 8.85 | | | $ | 9.79 | | | $ | 9.57 | | | $ | 8.03 | | | $ | 6.96 | |
| Income (loss) from investment operations: | | | | | | | | | | | | | | | | | | | | |
| Net investment income | | | 0.22 | | | | 0.19 | | | | 0.18 | | | | 0.21 | | | | 0.17 | (A) |
| Net realized and unrealized gains (losses) on investments | | | 1.31 | | | | (0.27 | ) | | | 0.36 | | | | 1.54 | | | | 1.31 | |
| Total from investment operations | | | 1.53 | | | | (0.08 | ) | | | 0.54 | | | | 1.75 | | | | 1.48 | |
| Distributions from: | | | | | | | | | | | | | | | | | | | | |
| Net investment income | | | (0.22 | ) | | | (0.19 | ) | | | (0.15 | ) | | | (0.21 | ) | | | (0.18 | ) |
| Realized capital gains | | | (0.02 | ) | | | (0.67 | ) | | | (0.17 | ) | | | — | | | | (0.23 | ) |
| Total distributions | | | (0.24 | ) | | | (0.86 | ) | | | (0.32 | ) | | | (0.21 | ) | | | (0.41 | ) |
| Net asset value at end of period | | $ | 10.14 | | | $ | 8.85 | | | $ | 9.79 | | | $ | 9.57 | | | $ | 8.03 | |
| Total return | | | 17.38 | % | | | (0.49 | )% | | | 5.68 | % | | | 21.92 | % | | | 21.92 | % |
| Ratios and supplemental data: | | | | | | | | | | | | | | | | | | | | |
| Net assets at end of period (000's) | | $ | 249,035 | | | $ | 219,824 | | | $ | 248,381 | | | $ | 245,573 | | | $ | 186,990 | |
| Ratio to average net assets: | | | | | | | | | | | | | | | | | | | | |
| Net expenses | | | 0.68 | % | | | 0.68 | % | | | 0.68 | % | | | 0.67 | % | | | 0.67 | % |
| Gross expenses | | | 0.86 | % | | | 0.87 | % | | | 0.86 | % | | | 0.87 | % | | | 0.99 | % |
| Net investment income | | | 2.26 | % | | | 2.11 | % | | | 1.94 | % | | | 2.52 | % | | | 2.29 | % |
| Portfolio turnover rate | | | 29 | % | | | 19 | %(B) | | | 20 | % | | | 26 | % | | | 110 | %(C) |
| (A) | The net investment income per share is based on average shares outstanding for the period. |
| (B) | Portfolio turnover rate excludes securities received from processing a subscription-in-kind. |
| (C) | Portfolio turnover excludes the purchases and sales of the Fifth Third Disciplined Large Cap Value Fund acquired on September 10, 2012. If these transactions were included, portfolio turnover would have been higher. |
See accompanying Notes to Financial Statements.
Notes to Financial Statements
June 30, 2017
1. Organization
The Touchstone Strategic Trust (the “Trust”) is registered under the Investment Company Act of 1940, as amended (the “1940 Act”), as an open-end management investment company. The Trust was established as a Massachusetts business trust pursuant to an Agreement and Declaration of Trust dated November 18, 1982. The Trust consists of twenty-one funds including, the following eight funds (individually, a “Fund”, and collectively, the “Funds”):
Touchstone Credit Opportunities Fund (“Credit Opportunities Fund”)
Touchstone Global Growth Fund (“Global Growth Fund”)*
Touchstone International Small Cap Fund (“International Small Cap Fund“)
Touchstone Large Cap Fund (“Large Cap Fund”)
Touchstone Large Company Growth Fund (“Large Company Growth Fund”)*
Touchstone Ohio Tax-Free Bond Fund (”Ohio Tax-Free Bond Fund”)*
Touchstone Small Cap Value Opportunities Fund (“Small Cap Value Opportunities Fund”)
Touchstone Value Fund (“Value Fund”)
* See Note 8 in Notes to Financial Statements for details on the Mergers and Reorganizations.
Each Fund is diversified, with the exception of the Credit Opportunities Fund, the Global Growth Fund, the Large Cap Fund, the Large Company Growth Fund and the Ohio Tax-Free Bond Fund, which are non-diversified.
The Agreement and Declaration of Trust permits the Trust to issue an unlimited number of shares of beneficial interest of each Fund. The Funds are registered to offer the following classes of shares: Class A shares, Class C shares, Class Y shares, and Institutional Class shares. The assets of each Fund are segregated, and a shareholder’s interest is limited to the Fund in which shares are held. The Funds’ prospectus provides a description of each Fund’s investment goals, policies, and strategies along with information on the classes of shares currently being offered.
2. Significant Accounting Policies
The following is a summary of the Funds’ significant accounting policies:
Each Fund is an investment company that follows the accounting and reporting guidance of Accounting Standards Codification Topic 946 applicable to investment companies.
Security valuation and fair value measurements — U.S. generally accepted accounting principles (“U.S. GAAP”) define fair value as the price the Funds would receive to sell an asset or pay to transfer a liability in an orderly transaction between market participants at the measurement date. All investments in securities are recorded at their fair value. The Funds define the term “market value”, as used throughout this report, as the estimated fair value. The Funds use various methods to measure fair value of their portfolio securities on a recurring basis. U.S. GAAP fair value measurement standards require disclosure of a hierarchy that prioritizes inputs to valuation methods.
These inputs are summarized in the three broad levels listed below:
| • | Level 1 – | quoted prices in active markets for identical securities |
| | | |
| • | Level 2 – | other significant observable inputs (including quoted prices for similar securities, interest rates, prepayment speeds, credit risk, etc.) |
| | | |
| • | Level 3 – | significant unobservable inputs (including a Fund’s own assumptions in determining the fair value of investments) |
Notes to Financial Statements (Continued)
The inputs or methodology used for valuing securities are not necessarily an indication of the risk associated with investing in those securities.
The aggregate value by input level, as of June 30, 2017, for each Fund’s investments, as well as a reconciliation of assets for which significant unobservable inputs (Level 3) were used in determining value, if applicable, is included in each Fund’s Portfolio of Investments, which also includes a breakdown of the Fund’s investments by geographic, portfolio or sector allocation. The Credit Opportunities Fund and Small Cap Value Opportunities Fund held Level 3 categorized securities during the year ended June 30, 2017. Refer to the Portfolio of Investments for a reconciliation of Level 3 holdings.
Changes in valuation techniques may result in transfers into or out of an investment’s assigned level within the hierarchy. All transfers in and out of the levels are recognized at the value at the end of the period. At June 30, 2017, there were no transfers between Levels 1, 2 and 3 for the Funds, except as discussed in the Portfolio of Investments for the Credit Opportunities Fund and International Small Cap Fund.
During the year ended June 30, 2017, there were no significant changes to the valuation policies and techniques.
The Funds’ portfolio securities are valued as of the close of the regular session of trading on the New York Stock Exchange (“NYSE”) (currently 4:00 p.m., Eastern Time). Portfolio securities traded on stock exchanges are valued at the last reported sale price, official close price, or last bid price if no sales are reported. Portfolio securities quoted by NASDAQ are valued at the NASDAQ Official Closing Price (“NOCP”) or from the primary exchange on which the security trades. To the extent these securities are actively traded, they are categorized in Level 1 of the fair value hierarchy. Options are valued at the last quoted sales price. If there is no such reported sale on the valuation date, long option positions are valued at the most recent bid price, and short option positions are valued at the most recent ask price on the valuation date and are categorized in Level 1. Shares of mutual funds in which the Funds invest are valued at their respective net asset values (“NAV”) as reported by the underlying funds and are categorized in Level 1.
Debt securities held by the Funds are valued at their evaluated bid by an independent pricing service or at their last broker-quoted bid prices as obtained from one or more of the major market makers for such securities. Independent pricing services use information provided by market makers or estimates of market values through accepted market modeling conventions. Observable inputs to the models may include prepayment speeds, pricing spread, yield, trade information, dealer quotes, market color, cash flow models, the securities’ terms and conditions, among others, and are generally categorized in Level 2. The Credit Opportunities Fund’s investments in bank loans are normally valued at the bid quotation obtained from dealers in loans by an independent pricing service in accordance with the Fund’s valuation policies and procedures approved by the Funds’ Board of Trustees (the “Board”), and are generally categorized in Level 2. The Credit Opportunities Fund’s investments in asset-backed and mortgage-backed securities are valued by independent pricing services using models that consider estimated cash flows of each tranche of the security, establish a benchmark yield and develop an estimated tranche specific spread to the benchmark yield based on the unique attributes of the tranche, and are generally categorized in Level 2. Debt securities with remaining maturities of 60 days or less may be valued at amortized cost, provided such amount approximates market value and are categorized in Level 2. While this method provides consistency in valuation (and may only be used if it approximates market value), it may result in periods during which fair value, as determined by amortized cost, is higher or lower than the price that would be received if the Fund sold the investment.
Foreign currency exchange contracts are valued at the mean between the bid and ask prices and are determined as of the close of regular trading on the NYSE. Interpolated values are derived when the settlement date of the contract is an interim date for which quotations are not available and categorized in Level 2.
Notes to Financial Statements (Continued)
Securities mainly traded on a non-U.S. exchange or denominated in foreign currencies are generally valued according to the preceding closing values on that exchange, translated to U.S. dollars using currency exchange rates as of the close of regular trading on the NYSE, and are generally categorized in Level 1. However, if an event that may change the value of a security occurs after the time that the closing value on the non-U.S. exchange was determined, but before the close of regular trading on the NYSE, the security may be priced based on fair value and generally categorized in Level 2. This may cause the value of the security, if held on the books of a Fund, to be different from the closing value on the non-U.S. exchange and may affect the calculation of the Fund’s NAV.
The Funds may use fair value pricing under the following circumstances, among others:
| · | If the value of a security has been materially affected by events occurring before the Funds’ pricing time but after the close of the primary markets on which the security is traded. |
| · | If the exchange on which a portfolio security is principally traded closes early or if trading in a particular portfolio security was halted during the day and did not resume prior to the Funds’ NAV calculation. |
| · | If a security is so thinly traded that reliable market quotations are unavailable due to infrequent trading. |
| · | If the validity of market quotations is not reliable. |
Securities held by the Funds that do not have readily available market quotations, significant observable inputs, or securities for which the available market quotations are not reliable, are priced at their estimated fair value using procedures approved by the Board and are generally categorized in Level 3.
Bank Loans — The Credit Opportunities Fund may invest in bank loans, which usually take the form of loan participations and assignments. Loan participations and assignments are agreements to make money available to U.S. or foreign corporations, partnerships or other business entities (the “Borrower”) in a specified amount, at a specified rate and within a specified time. A loan is typically originated, negotiated and structured by a U.S. or foreign bank, insurance company or other financial institution (the “Agent”) for a group of loan investors (“Loan Investors”). The Agent typically administers and enforces the loan on behalf of the other Loan Investors in the syndicate and may hold any collateral on behalf of the Loan Investors. Such loan participations and assignments are typically senior, secured and collateralized in nature. The Fund records an investment when the Borrower withdraws money and records interest as earned. These loans pay interest at rates which are periodically reset by reference to a base lending rate plus a spread. These base lending rates are generally the prime rate offered by a designated U.S. bank or London InterBank Offered Rate (“LIBOR”).
The loans in which the Fund invests may be subject to some restrictions on resale. For example, the Fund may be contractually obligated to receive approval from the Agent and/or Borrower prior to the sale of these investments. The Fund generally has no right to enforce compliance with the terms of the loan agreement with the Borrower. As a result, the Fund assumes the credit risk of the Borrower, the selling participant and any other persons interpositioned between the Fund and the Borrower (“Intermediate Participants”). In the event that the Borrower, selling participant or Intermediate Participants become insolvent or enter into bankruptcy, the Fund may incur certain costs and delays in realizing payment or may suffer a loss of principal and/or interest.
Unfunded commitments represent the remaining obligation of the Fund to the Borrower. At any point in time, up to the maturity date of the issue, the Borrower may demand the unfunded portion. Until demanded by the Borrower, unfunded commitments are not recognized as an asset on the Statement of Assets and Liabilities. Unrealized appreciation/depreciation on unfunded commitments presented on the Statement of Assets and Liabilities represents mark to market of the unfunded portion of the Fund’s bank loans.
Notes to Financial Statements (Continued)
As of June 30, 2017, the Credit Opportunities Fund had the following unfunded loan commitments:
| | | Unfunded | |
| | | Loan | |
| | | Commitments | |
| Pardus Oil and Gas LLC | | $ | 10,790 | |
Collateralized Loan Obligations — The Credit Opportunities Fund may invest in collateralized loan obligations (“CLOs”). CLOs are types of asset-backed securities. A CLO is an entity that is backed by syndicated bank loans. The cash flows of the CLO can be split into multiple segments, called “tranches,” which will vary in risk profile and yield. The riskiest segment is the subordinated or “equity” tranche. This tranche bears the greatest risk of defaults from the underlying assets in the CLO and serves to protect the other, more senior, tranches from default in all but the most severe circumstances. Since it is shielded from defaults by the more junior tranches, a “senior” tranche will typically have higher credit ratings and lower yields than their underlying securities, and often receive investment grade ratings from one or more of the nationally recognized rating agencies. Despite the protection from the more junior tranches, senior tranches can experience substantial losses due to actual defaults, increased sensitivity to future defaults and the disappearance of one or more protecting tranches as a result of changes in the credit profile of the underlying pool of assets.
Investment companies — The Funds may invest in securities of other investment companies, including exchange-traded funds (“ETFs”), open-end funds and closed-end funds. Open-end funds are investment companies that issue new shares continuously and redeem shares daily. Closed-end funds are investment companies that typically issue a fixed number of shares that trade on a securities exchange or over-the-counter (“OTC”). An ETF is an investment company that typically seeks to track the performance of an index by holding in its portfolio shares of all the companies, or a representative sample of the companies, that are components of a particular index. ETF shares are traded on a securities exchange based on their market value. The risks of investment in other investment companies typically reflect the risks of the types of securities in which the other investment companies invest. Investments in ETFs and closed-end funds are subject to the additional risk that their shares may trade at a premium or discount to their NAV. When a Fund invests in another investment company, shareholders of the Fund indirectly bear their proportionate share of the other investment company’s fees and expenses, including operating, registration, trustee, licensing and marketing, as well as their share of the Fund’s fees and expenses.
Securities sold short — The Credit Opportunities Fund may engage in selling securities short, which obligates the Fund to replace a security borrowed by purchasing the same security at the current market value. The Fund would incur a loss if the price of the security increases between the date of the short sale and the date on which the Fund replaces the borrowed security. The Fund would realize a gain if the price of the security declines between those dates. As of June 30, 2017, the Credit Opportunities Fund had securities sold short with a fair value of $(151,500) and pledged securities with a fair value of $1,260,125 as collateral and pledged cash collateral of $69,394 for securities sold short.
Options — The Credit Opportunities Fund may write or purchase financial option contracts primarily to hedge against changes in the value of equity securities (or securities that the Fund intends to purchase), against fluctuations in fair value caused by changes in prevailing market interest rates or foreign currency exchange rates and against changes in overall equity market volatility. In addition, the Fund may utilize options in an attempt to generate gains from option premiums or to reduce overall portfolio risk. The Fund’s option strategy primarily focuses on the use of writing and/or purchasing call or put options on equity indexes. When the Fund writes or purchases an option, an amount equal to the premium received or paid by the Fund is recorded as a liability or an asset and is subsequently adjusted to the current market value of the option written or purchased. Premiums received or paid from writing or purchasing options which expire unexercised are treated by the Fund on the expiration date as realized gains or losses. The difference between the premium and the amount
Notes to Financial Statements (Continued)
paid or received on effecting a closing purchase or sale transaction, including brokerage commissions, is also treated as a realized gain or loss. If an option is exercised, the premium paid or received is added to the cost of the purchase or proceeds from the sale in determining whether the Fund has realized a gain or loss on investment transactions. The Fund, as writer of an option, may have no control over whether the underlying securities may be sold (call) or purchased (put) and as a result bears the market risk of an unfavorable change in the price of the security underlying the written option. The Fund, as purchaser of an option, bears the risk that the counterparties to the option may not have the ability to meet the terms of the option contracts. There is minimal counterparty credit risk involved in entering into option contracts since they are exchange-traded instruments and the exchange’s clearinghouse, as counterparty to all exchange-traded options, guarantees the options against default.
As of June 30, 2017, the Credit Opportunities Fund did not hold any options.
Foreign currency translation — The books and records of the Funds are maintained in U.S. dollars and translated into U.S. dollars on the following basis:
| (1) | market value of investment securities, assets and liabilities at the current rate of exchange on the valuation date; and |
| (2) | purchases and sales of investment securities, income, and expenses at the relevant rates of exchange prevailing on the respective dates of such transactions. |
The Funds do not isolate that portion of gains and losses on investments in equity securities that is due to changes in the foreign exchange rates from that which is due to changes in market prices of equity securities.
Forward foreign currency contracts — A forward foreign currency contract is an agreement between two parties to buy and sell a specific currency at a price that is set on the date of the contract. The forward contract calls for delivery of the currency on a future date that is specified in the contract. Risks related to the use of forwards include the possible failure of counterparties to meet the terms of the forward agreement, the failure of the counterparties to timely post collateral, the risk that currency movements will not occur thereby reducing a Fund’s total return, and the potential for losses in excess of a Fund’s initial investment.
The market value of a forward foreign currency contract fluctuates with changes in foreign currency exchange rates. Forward foreign currency contracts are marked to market daily and the change in value is recorded by a Fund as an unrealized gain or loss. Realized gains or losses, equal to the difference between the value of the contract at the time it was opened and the value at the time it was closed, are recorded upon delivery or receipt of the currency.
During the year ended June 30, 2017, the Credit Opportunities Fund used forward foreign currency contracts to enhance potential gains, hedge against anticipated currency exchange rates, maintain diversity and liquidity of the portfolio and/or adjust exposure to foreign currencies. As of June 30, 2017, the Credit Opportunities Fund did not hold any forward foreign currency contracts.
Real Estate Investment Trusts — The Funds may invest in real estate investment trusts (“REITs”) that involve risks not associated with investing in stocks. Risks include declines in the value of real estate, general and economic conditions, changes in the value of the underlying property and defaults by borrowers. The value of assets in the real estate industry may go through cycles of relative underperformance and outperformance in comparison to equity securities markets in general. Dividend income is recorded using management’s estimate of the income included in distributions received from REIT investments. The actual amounts of income, return of capital and capital gains are only determined by each REIT after its fiscal year-end and may differ from the estimated amount. Estimates of income are adjusted in the Funds to the actual amounts when the amounts are determined.
Notes to Financial Statements (Continued)
Pay-In-Kind (“PIK”) Bonds – PIK bonds are securities that, at the issuer’s option, pay interest in either cash or additional securities for a specified period. PIK bonds, like zero coupon bonds, are designed to give an issuer flexibility in managing cash flow. PIK bonds are expected to reflect the market value of the underlying debt plus an amount representing accrued interest since the last payment. PIK bonds are usually less volatile than zero coupon bonds, but more volatile than cash pay securities.
Derivative instruments and hedging activities — The Credit Opportunities Fund may enter into an International Swaps and Derivatives Association, Inc. Master Agreement (“ISDA Master Agreement” or “MNA”) or similar agreement with certain counterparties. An ISDA Master Agreement is a bilateral agreement between the Fund and a counterparty that governs OTC derivatives and foreign exchange contracts, and typically contains, among other things, collateral posting terms and master netting provisions in the event of a default or termination. Under an ISDA Master Agreement, a party may, under certain circumstances, offset with the counterparty certain derivative financial instrument’s payables or receivables with collateral held or posted and create one single net payment. The provisions of the ISDA Master Agreement typically permit a single net payment in the event of default (close-out netting). These default events include bankruptcy or insolvency of the counterparty. Note, however, that bankruptcy or insolvency laws of a particular jurisdiction may impose restrictions on or prohibitions against the right of offset.
When entering into a derivative transaction, the Fund may be required to post and maintain collateral or margin (including both initial and maintenance margin). Collateral and margin requirements differ by type of derivative. Margin requirements are established by the broker or clearing house for exchange traded and centrally cleared derivatives (financial futures contracts, options, and centrally cleared swaps). Brokers can ask for margining in excess of the clearing house’s minimum in certain circumstances. Collateral terms are contract specific for OTC derivatives (foreign currency exchange contracts, options, and swaps). For derivatives traded under an ISDA Master Agreement, the collateral requirements are typically calculated by netting the marked-to-market amount for each transaction under such agreement and comparing that amount to the value of any collateral currently pledged by the Fund and the counterparty. For financial reporting purposes, cash collateral that has been pledged to cover obligations of the Fund and cash collateral received from the counterparty, if any, are reported separately on the Statement of Assets and Liabilities as cash pledged as collateral and cash received as collateral, respectively. Non-cash collateral pledged by the Fund, if any, is noted in the Portfolio of Investments. To the extent amounts due to the Fund from its counterparties are not fully collateralized, contractually or otherwise, the Fund bears the risk of loss from counterparty non-performance.
Certain ISDA Master Agreements allow counterparties to OTC derivatives transactions to terminate derivative contracts prior to maturity in the event the Fund’s net assets decline by a stated percentage or the Fund fails to meet the terms of its ISDA Master Agreement, which would cause the Fund (counterparty) to accelerate payment of any net liability owed to the counterparty (Fund).
For financial reporting purposes, the Credit Opportunities Fund does not offset derivative assets and derivative liabilities that are subject to netting arrangements in the Statement of Assets and Liabilities.
As of June 30, 2017, the Credit Opportunities Fund did not hold any assets and liabilities that were subject to netting arrangements.
Notes to Financial Statements (Continued)
The following table sets forth the effect of the Credit Opportunities Fund’s derivative financial instruments by primary risk exposure on the Statement of Operations for the year ended June 30, 2017:
| The Effect of Derivative Investments on the Statement of Operations |
| for the Year Ended June 30, 2017 |
| | | | | | | | Change in | |
| | | | | | | | Unrealized | |
| | | | | Realized Gain | | | Appreciation | |
| | | | | (Loss) | | | (Depreciation) | |
| | | Derivatives not accounted for as hedging | | on | | | on | |
| Fund | | instruments under ASC 815 | | Derivatives | | | Derivatives | |
| Credit Opportunities Fund | | Forward - Foreign Currency Contracts* | | $ | 20,455 | | | $ | (3,599 | ) |
| | | Purchased Options - Equity Contracts** | | | (20,224 | ) | | | 3,107 | |
| | | Written Options - Equity Contracts*** | | | 4,091 | | | | — | |
* Statements of Operations Location: Net realized gains (losses) on foreign currency transactions and net change in unrealized appreciation (depreciation) on foreign currency transactions, respectively.
** Statements of Operations Location: Net realized gains (losses) on investments and net change in unrealized appreciation (depreciation) on investments.
*** Statements of Operations Location: Net realized gains on written options.
For the year ended June 30, 2017, the average quarterly balances of outstanding derivative financial instruments were as follows:
| | | Credit | |
| | | Opportunities | |
| | | Fund | |
| Equity Contracts: | | | | |
| Purchased Options - Cost | | $ | 2,612 | |
| Written Options - Premiums Received | | | — | * |
| Forward foreign currency contracts: | | | | |
| Average U.S. dollar amount received | | $ | 133,884 | |
* The Fund held no written options contracts at each quarter end.
Portfolio securities loaned — The Funds may lend their portfolio securities. Lending portfolio securities exposes the Funds to the risk that the borrower may fail to return the loaned securities or may not be able to provide additional collateral or that the Funds may experience delays in recovery of the loaned securities or loss of rights in the collateral if the borrower fails financially. To minimize these risks, the borrower must agree to maintain cash collateral with the Funds’ custodian. The loaned securities are secured by collateral valued at least equal, at all times, to the market value of the loaned securities plus accrued interest, if any. When the collateral falls below specified amounts, the lending agent will use its best effort to obtain additional collateral on the next business day to meet required amounts under the security lending agreement. The cash collateral is reinvested by the Funds’ custodian into an approved short-term investment vehicle. The approved short-term investment vehicle is subject to market risk.
Notes to Financial Statements (Continued)
As of June 30, 2017, the following Funds loaned securities and received collateral as follows:
| | | | | Market | | | Market | | | | |
| | | | | Value of | | | Value of | | | | |
| | | | | Securities | | | Collateral | | | Net | |
| Fund | | Security Type | | Loaned* | | | Received** | | | Amount*** | |
| Credit Opportunities Fund | | Corporate Bonds | | $ | 664,631 | | | $ | 688,446 | | | $ | 23,815 | |
| Global Growth Fund | | Common Stocks | | | 562,108 | | | | 565,191 | | | | 3,083 | |
| International Small Cap Fund | | Common Stocks | | | 10,522,169 | | | | 11,271,986 | | | | 749,817 | |
| Large Company Growth Fund | | Common Stocks | | | 4,818,731 | | | | 4,845,159 | | | | 26,428 | |
| Small Cap Value Opportunities Fund | | Common Stocks | | | 7,739,975 | | | | 7,965,992 | | | | 226,017 | |
* The remaining contractual maturity is overnight for all securities.
** Gross amount of recognized liabilities for securities lending is included in the Statements of Assets and Liabilities.
*** Net amount represents the net amount payable due to the borrower in the event of default.
All cash collateral is received, held, and administered by the Funds’ custodian for the benefit of the lending Fund in its custody account or other account established for the purpose of holding collateral.
Funds participating in securities lending receive compensation in the form of fees. Securities lending income is derived from lending long securities from the Funds to creditworthy approved borrowers at rates that are determined based on trading volumes, float, short-term interest rates and market liquidity and is shown net of fees on the Statements of Operations. When a Fund lends securities, it retains the interest or dividends on the investment of any cash received as collateral, and the Fund continues to receive interest or dividends on the loaned securities.
Unrealized gain or loss on the market value of the loaned securities that may occur during the term of the loan is recognized by the Fund. The Fund has the right under the lending agreement to recover any loaned securities from the borrower on demand.
When-issued or delayed delivery transactions — Each Fund may purchase or sell securities on a when-issued or delayed delivery basis. These transactions involve a commitment by the Fund to purchase or sell securities for a predetermined price or yield, with payment and delivery taking place beyond the customary settlement period. When delayed delivery purchases are outstanding, the Fund will set aside liquid assets in an amount sufficient to meet the purchase price. When purchasing a security on a delayed delivery basis, the Fund assumes the rights and risks of ownership of the security, including the risk of price and yield fluctuations, and takes such fluctuations into account when determining NAV. The Fund may dispose of or renegotiate a delayed delivery transaction after it is entered into, and may sell when-issued securities before they are delivered, which may result in a capital gain or loss. When the Fund has sold a security on a delayed delivery basis, the Fund does not participate in future gains and losses with respect to the security.
Share valuation — The NAV per share of each class of shares of each Fund is calculated daily by dividing the total value of a Fund’s assets attributable to that class, less liabilities attributable to that class, by the number of outstanding shares of that class.
The maximum offering price per share of Class A shares of the Funds (except the Ohio Tax-Free Bond Fund) is equal to the NAV per share plus a sales load equal to 6.10% of the NAV (or 5.75% of the offering price). The maximum offering price per share of Class A shares of the Ohio Tax-Free Bond Fund is equal to the NAV per share plus a sales load equal to 4.99% of the NAV (or 4.75% of the offering price). There is no sales load on purchases of $1 million or more of Class A shares. The maximum offering price per share of Classes C, Y, and Institutional Class shares of the Funds is equal to the NAV per share.
The redemption price per share of each class of shares of the Funds is generally equal to the NAV per share. However, Class A redemptions that were part of a no-load $1 million subscription may be subject to a contingent
Notes to Financial Statements (Continued)
deferred sales charge (“CDSC”) of up to 1.00% if redeemed within a one-year period from the date of purchase. Additionally, purchases of Class C shares of the Funds are subject to a CDSC of 1.00%. The CDSC will be assessed on an amount equal to the lesser of (1) the NAV at the time of purchase of the shares being redeemed or (2) the NAV of such shares being redeemed, if redeemed within a one-year period from the date of purchase.
Investment income — Dividend income from securities is recognized on the ex-dividend date, net of foreign withholding taxes, if any, which are reduced by any amounts reclaimable by the Funds, where applicable. Interest income from securities is recorded on the basis of interest accrued, premium amortized and discount accreted. Realized gains and losses resulting from principal paydowns on mortgage-backed and asset-backed securities are included in interest income. Market discounts, original issue discount (“OID”) and market premiums on debt securities are accreted/amortized to interest income over the life of the security with a corresponding adjustment in the cost basis of that security. In addition, it is the Funds’ policy to accrue for foreign capital gains taxes, if applicable, on certain foreign securities held by the Funds. An estimated foreign capital gains tax is recorded daily on net unrealized gains on these securities and is payable upon the sale of such securities when a gain is realized.
Distributions to shareholders — Each Fund intends to distribute to its shareholders substantially all of its income and capital gains. Each Fund, except the Credit Opportunities Fund, Ohio Tax-Free Bond Fund and the Value Fund, declares and distributes net investment income, if any, annually, as a dividend to shareholders. The Credit Opportunities Fund declares and distributes net investment income, if any, quarterly as a dividend to shareholders. The Ohio Tax-Free Bond Fund declares distributions from net investment income on a daily basis and distributes as a dividend to shareholders on a monthly basis. Effective March 29, 2017, the Value Fund declares and distributes net investment income, if any, quarterly as a dividend to shareholders. Prior to March 29, 2017, the Value Fund declared and distributed net investment income, if any, semi-annually as a dividend to shareholders. Each Fund makes distributions of capital gains, if any, at least annually, net of applicable capital loss carryforwards. Income distributions and capital gain distributions are determined in accordance with income tax regulations. Recognition of the Funds’ net investment income from investments in underlying funds is affected by the timing of dividend declarations by the underlying funds.
Allocations — Investment income earned, realized capital gains and losses, and unrealized appreciation and depreciation for a Fund are allocated daily to each class of shares based upon its proportionate share of total net assets of the Fund. Class-specific expenses are charged directly to the class incurring the expense. Common expenses, which are not attributable to a specific class, are allocated daily to each class of shares based upon their proportionate share of total net assets of the Fund. Expenses not directly billed to a Fund are allocated proportionally among all Funds in the Trust, and, if applicable, Touchstone Funds Group Trust, Touchstone Institutional Funds Trust, and Touchstone Variable Series Trust (collectively with the Trust, “Touchstone Fund Complex”), daily in relation to net assets of each Fund or another reasonable measure.
Security transactions — Security transactions are reflected for financial reporting purposes as of the trade date. Realized gains and losses on sales of portfolio securities are calculated using the identified cost basis.
Estimates — The preparation of financial statements in conformity with U.S. GAAP requires management to make estimates and assumptions that affect the reported amounts of assets and liabilities and disclosure of contingent assets and liabilities at the date of the financial statements and the reported amounts of income and expenses during the reporting period. Actual results could differ from those estimates.
Regulatory Updates — In October 2016, the Securities and Exchange Commission (the “SEC”) released its Final Rule on Investment Company Reporting Modernization (the “Rule”). The Rule contains amendments to Regulation S-X which impact financial statement presentation, particularly the presentation of derivative investments. Although still evaluating the impact of the Rule, management believes that many of the Regulation S-X amendments are materially consistent with the Funds’ current financial statement presentation and expects
Notes to Financial Statements (Continued)
that the Funds will comply with the Rule’s Regulation S-X amendments for financial statements with periods ending on or after August 1, 2017.
3. Investment Transactions
Investment transactions (excluding short-term investments and U.S. Government securities) were as follows for the year ended June 30, 2017:
| | | Credit | | | Global | | | International | | | | |
| | | Opportunities | | | Growth | | | Small Cap | | | Large Cap | |
| | | Fund | | | Fund* | | | Fund | | | Fund | |
| Purchases of investment securities | | $ | 44,503,900 | | | $ | 20,251,829 | | | $ | 297,920,396 | | | $ | 73,539,990 | |
| Proceeds from sales and maturities | | $ | 47,849,979 | | | $ | 12,492,811 | | | $ | 405,160,239 | | | $ | 93,950,293 | |
| | | Large | | | Ohio | | | Small Cap | | | | |
| | | Company | | | Tax-Free | | | Value | | | | |
| | | Growth | | | Bond | | | Opportunities | | | Value | |
| | | Fund | | | Fund | | | Fund | | | Fund | |
| Purchases of investment securities | | $ | 104,121,721 | | | $ | 18,463,010 | | | $ | 75,783,725 | | | $ | 104,241,758 | |
| Proceeds from sales and maturities | | $ | 134,384,778 | | | $ | 26,167,098 | | | $ | 115,503,932 | | | $ | 130,447,777 | |
*The costs of purchases and proceeds from sales on the Global Growth Fund excludes the purchases and sales of the DSM Global Growth & Income Fund (see Note 8). If these transactions were included, purchases and sales would have been higher.
There were no purchases or proceeds from sales and maturities of U.S. Government securities by the Funds for the year ended June 30, 2017.
4. Transactions with Affiliates and Other Related Parties
Certain officers of the Trust are also officers of Touchstone Advisors, Inc. (the “Advisor”),Touchstone Securities, Inc. (the “Underwriter”), or The Bank of New York Mellon, the Sub-Administrator to the Funds and BNY Mellon Investment Servicing (U.S.) Inc., the Transfer Agent to the Funds (collectively referenced to herein as “BNY Mellon”). Such officers receive no compensation from the Trust. The Advisor and the Underwriter are each wholly-owned, indirect subsidiaries of Western & Southern Financial Group, Inc. (“Western & Southern”).
On behalf of the Funds, the Advisor pays each Independent Trustee a quarterly retainer plus additional retainers to the Lead Independent Trustee and the chairs of each standing committee. Interested Trustees do not receive compensation from the Funds. Each Independent Trustee also receives compensation for each board meeting and committee meeting attended. Each standing committee chair receives additional compensation for each committee meeting that he or she oversees.The Advisor is reimbursed by the Funds for the Independent Trustees’ compensation and out-of-pocket expenses relating to their services. The Funds accrued Trustee-related expenses of $124,656 for the year ended June 30, 2017.
MANAGEMENT & EXPENSE LIMITATION AGREEMENTS
The Advisor provides general investment supervisory services for the Funds, under terms of an advisory agreement (the “Advisory Agreement”). Under the Advisory Agreement, each Fund pays the Advisor a fee, which is computed and accrued daily and paid monthly, at an annual rate based on average daily net assets of each Fund as shown in the table below.
Notes to Financial Statements (Continued)
| Credit Opportunities Fund | 1.10% |
| Global Growth Fund | 0.90% on the first $500 million |
| | 0.85% on the next $1.5 billion |
| | 0.80% on such assets over $2 billion |
| International Small Cap Fund | 0.95% on the first $300 million |
| | 0.90% on the next $200 million |
| | 0.85% on the next $250 million |
| | 0.80% on the next $250 million |
| | 0.75% on the next $500 million |
| | 0.70% on the next $500 million |
| | 0.65% on such assets over $2 billion |
| Large Cap Fund | 0.70% on the first $500 million |
| | 0.64% on the next $500 million |
| | 0.60% on such assets over $1 billion |
| Large Company Growth Fund | 0.75% on the first $500 million |
| | 0.725% on the next $1.5 billion |
| | 0.70% on such assets over $2 billion |
| Ohio Tax-Free Bond Fund | 0.50% on the first $100 million |
| | 0.45% on the next $100 million |
| | 0.40% on the next $100 million |
| | 0.375% on such assets over $300 million |
| Small Cap Value Opportunities Fund | 0.95% on the first $300 million |
| | 0.90% on the next $200 million |
| | 0.85% on such assets over $500 million |
| Value Fund | 0.65% |
Prior to August 15, 2016, DSM Capital Partners, LLC (the “Former Advisor”) served as the adviser to the Global Growth Fund and the Large Company Growth Fund. For its services, the Global Growth Fund and the Large Company Growth Fund paid the Former Advisor a monthly fee at an annual rate of 0.90% and 0.75%, respectively, based on average daily net assets.
The Advisor has entered into investment sub-advisory agreements with the following parties (each, a “Sub-Advisor”):
| Ares Capital Management II LLC | The London Company |
| Credit Opportunities Fund | Large Cap Fund |
| | |
| Barrow, Hanley, Mewhinney & Strauss, LLC | Thompson Siegel & Walmsley LLC |
| Value Fund | Small Cap Value Opportunities Fund |
| | |
| Copper Rock Capital Partners LLC | Fort Washington Investment Advisors, Inc.** |
| International Small Cap Fund | Ohio Tax-Free Bond Fund |
| | |
| DSM Capital Partners LLC | |
| Global Growth Fund* | |
| Large Company Growth Fund* | |
*Prior to August 15, 2016, the Global Growth Fund and the Large Company Growth Fund did not have a Sub-Advisor.
**Affiliate of the Advisor and wholly-owned indirect subsidiary of Western & Southern.
The Advisor, not the Funds, pays the sub-advisory fees to each Sub-Advisor.
Notes to Financial Statements (Continued)
The Advisor entered into an expense limitation agreement (the “Expense Limitation Agreement”) to contractually limit the annual operating expenses of the Funds, excluding: dividend and interest expenses relating to short sales; interest; taxes; brokerage commissions and other transaction costs; portfolio transactions and investment related expenses; other expenditures which are capitalized in accordance with U.S. GAAP; the cost of “Acquired Fund Fees and Expenses”, if any; and other extraordinary expenses not incurred in the ordinary course of business. The maximum annual operating expense limit in any year with respect to the Funds is based on a percentage of the average daily net assets of the Funds. The Advisor has agreed to separately waive class-level expenses, advisory fees and administration fees, and to reimburse expenses in order to maintain the following expense limitations for the Funds:
| | | | | | | | | | | | Institutional | |
| Fund | | Class A | | | Class C | | | Class Y | | | Class | |
| Credit Opportunities Fund | | | 1.69 | % | | | 2.44 | % | | | 1.44 | % | | | 1.34 | % |
| Global Growth Fund | | | 1.41 | % | | | 2.16 | % | | | 1.16 | % | | | 1.06 | % |
| International Small Cap Fund | | | 1.55 | % | | | 2.30 | % | | | 1.30 | % | | | 1.18 | % |
| Large Cap Fund | | | 1.12 | % | | | 1.87 | % | | | 0.87 | % | | | 0.77 | % |
| Large Company Growth Fund | | | 1.23 | % | | | 1.98 | % | | | 0.98 | % | | | 0.88 | % |
| Ohio Tax-Free Bond Fund | | | 0.85 | % | | | 1.60 | % | | | 0.60 | % | | | 0.55 | % |
| Small Cap Value Opportunities Fund | | | 1.43 | % | | | 2.18 | % | | | 1.18 | % | | | 1.10 | % |
| Value Fund | | | 1.08 | % | | | 1.83 | % | | | 0.83 | % | | | 0.68 | % |
These expense limitations will remain in effect for all Funds through at least October 29, 2017, except for the Ohio Tax-Free Bond Fund, which will remain in effect through at least April 9, 2018, but can be terminated by a vote of the Funds’ Board if it deems the termination to be beneficial to the Funds’ shareholders.
Prior to August 15, 2016, the Former Advisor had contractually agreed to maintain the expenses of the Institutional Class Shares of the Global Growth Fund and the Large Company Growth Fund to 1.10% and 0.95%, respectively. Prior to August 15, 2016, the Global Growth Fund and the Large Company Growth Fund did not issue Class A Shares, Class C Shares or Class Y Shares.
During the year ended June 30, 2017, the Advisor or its affiliates waived investment advisory fees and administration fees or reimbursed expenses, including distribution fees, of the Funds as follows:
| | | Investment | | | | | | Other Operating | | | | |
| | | Advisory | | | | | | Expenses | | | | |
| | | Fees | | | Administration | | | Reimbursed/ | | | | |
| Fund | | Waived | | | Fees Waived | | | Waived | | | Total | |
| Credit Opportunities Fund | | $ | 8,070 | | | $ | 78,373 | | | $ | 23,980 | | | $ | 110,423 | |
| Global Growth Fund* | | | 54,466 | | | | 24,241 | | | | 26,911 | | | | 105,618 | |
| International Small Cap Fund | | | — | | | | — | | | | 154,688 | | | | 154,688 | |
| Large Cap Fund | | | — | | | | 372,601 | | | | 111,224 | | | | 483,825 | |
| Large Company Growth Fund* | | | — | | | | 93,770 | | | | 100,298 | | | | 194,068 | |
| Ohio Tax-Free Bond Fund | | | 42,418 | | | | 79,324 | | | | 55,823 | | | | 177,565 | |
| Small Cap Value Opportunities Fund | | | — | | | | 74,526 | | | | 120,188 | | | | 194,714 | |
| Value Fund | | | — | | | | 530,630 | | | | 103,716 | | | | 634,346 | |
*For the period August 15, 2016 through June 30, 2017.
For the period July 1, 2016 through August 14, 2016, the Former Advisor accrued and reimbursed investment advisory fees of the Global Growth Fund and the Large Company Growth Fund, which are included in the Investment advisory fees and Fees waived and/or reimbursed by the Advisor and/or Affiliates on the Statements of Operations as follows:
Notes to Financial Statements (Continued)
| | | | | | | | | | | | | | | Other | |
| | | | | | | | | | | | | | | Operating | |
| | | | | | | | | Expenses | |
| | | Investment Advisory Fees | | | Administration Fees | | | Reimbursed | |
| Fund | | Accrued | | | Waived | | | Accrued | | | Waived | | | /Waived | |
| Global Growth Fund | | $ | 7,427 | | | $ | 7,427 | | | $ | 6,902 | | | $ | 6,902 | | | $ | 28,937 | |
| Large Company Growth Fund | | | 173,306 | | | | 64,279 | | | | 16,117 | | | | — | | | | — | |
Under the terms of the Expense Limitation Agreement, the Advisor is entitled to recover, subject to approval by the Funds’ Board, such amounts waived or reimbursed for a period of up to three years from the year in which the Advisor reduced its compensation or assumed expenses for the Funds. No recoupment will occur unless a Fund’s operating expenses are below the expense limitation amount in effect at the time of the waiver or reimbursement.
As of June 30, 2017, the Advisor may seek recoupment of previously waived fees and reimbursed expenses as follows:
| | | Expiration | | | Expiration | | | Expiration | | | | |
| | | June 30, | | | June 30, | | | June 30, | | | | |
| Fund | | 2018 | | | 2019 | | | 2020 | | | Total | |
| Credit Opportunities Fund | | $ | — | | | $ | 128,969 | | | $ | 110,236 | | | $ | 239,205 | |
| Global Growth Fund | | | — | | | | — | | | | 105,564 | | | | 105,564 | |
| International Small Cap Fund | | | 146,155 | | | | 101,759 | | | | 109,847 | | | | 357,761 | |
| Large Cap Fund | | | 130,776 | | | | 487,776 | | | | 464,555 | | | | 1,083,107 | |
| Large Company Growth Fund | | | — | | | | — | | | | 193,888 | | | | 193,888 | |
| Ohio Tax-Free Bond Fund | | | — | | | | 15,919 | | | | 133,855 | | | | 149,774 | |
| Small Cap Value Opportunities Fund | | | 145,044 | | | | 174,274 | | | | 173,346 | | | | 492,664 | |
| Value Fund | | | 729,485 | | | | 659,183 | | | | 620,025 | | | | 2,008,693 | |
The Advisor did not recoup any amounts it previously waived or reimbursed during the year ended June 30, 2017.
For the period July 1, 2016 through August 14, 2016, the Former Advisor did not recoup any amounts it previously reimbursed for the Global Growth Fund and the Large Company Growth Fund. Additionally, any amounts previously reimbursed by the Former Advisor are no longer subject to recoupment.
ADMINISTRATION AGREEMENT
The Advisor entered into an Administration Agreement with the Trust, whereby the Advisor is responsible for supplying executive and regulatory compliance services; supervising the preparation of tax returns; coordinating the preparation of reports to shareholders and reports to, and filings with, the SEC and state securities authorities, as well as materials for meetings of the Board; calculating the daily NAV per share; and maintaining the financial books and records of each Fund.
For its services the Advisor’s annual administrative fee is:
0.145% on the first $20 billion of the aggregate average daily net assets;
0.11% on the next $10 billion of aggregate average daily net assets;
0.09% on the next $10 billion of aggregate average daily net assets; and
0.07% on the aggregate average daily net assets over $40 billion.
Notes to Financial Statements (Continued)
The fee is computed and allocated among the Touchstone Fund Complex (excluding Touchstone Institutional Funds Trust) on the basis of relative daily net assets.
The Advisor has engaged BNY Mellon as the Sub-Administrator to theTrust. BNY Mellon provides administrative and accounting services to the Trust and is compensated directly by the Advisor, not the Trust.
Prior to August 15, 2016, U.S. Bancorp Fund Services, LLC (“USBFS”) served as the Administrator to the Global Growth Fund and Large Company Growth Fund. In this capacity, USBFS maintained the books and records, calculated the NAVs, prepared various federal and state regulatory filings, coordinated the payment of fund expenses, reviewed expense accruals and prepared materials supplied to the DSM Board of Trustees. The officers of the DSM Trust and the DSM Chief Compliance Officer were also employees of USBFS. For its services during the period July 1, 2016, through August 14, 2016, USBFS received $6,902 and $16,117, respectively, which are included in the Administration fees on the Statements of Operations.
TRANSFER AGENT AGREEMENT
Under the terms of the Transfer Agent Agreement between the Trust and BNY Mellon, BNY Mellon maintains the records of each shareholder’s account, answers shareholders’ inquiries concerning their accounts, processes purchases and redemptions of each Fund’s shares, acts as dividend and distribution disbursing agent and performs other shareholder service functions. For these services, BNY Mellon receives a monthly fee from each Fund. In addition, each Fund pays out-of-pocket expenses incurred by BNY Mellon, including, but not limited to, postage and supplies.
The Funds may reimburse the Advisor for fees paid to intermediaries such as banks, broker-dealers, financial advisors or other financial institutions for sub-transfer agency, sub-administration and other services provided to investors whose shares of record are held in omnibus, other group accounts, retirement plans or accounts traded through registered securities clearing agents. These fees may vary based on, for example, the nature of services provided, but generally range up to 0.15% of the assets of the class serviced or maintained by the intermediary or up to $22 per sub-account maintained by the intermediary.
Prior to August 15, 2016, USBFS served as the Transfer Agent to the Global Growth Fund and the Large Company Growth Fund.
PLANS OF DISTRIBUTION AND SHAREHOLDER SERVICING FEE ARRANGEMENTS
The Trust has adopted distribution plans pursuant to Rule 12b-1 under the 1940 Act for each class of shares it offers that is subject to 12b-1 distribution fees. The plans allow each Fund to pay distribution and other fees for the sale and distribution of its shares and for services provided to shareholders. The fees charged to the Funds are limited to the actual expenses incurred. Under the Class A plan, each Fund offering Class A shares pays an annual fee of up to 0.25% of average daily net assets that are attributable to Class A shares. Under the Class C plan, each Fund offering Class C shares pays an annual fee of up to 1.00% of average daily net assets that are attributable to Class C shares (of which up to 0.75% is a distribution fee and up to 0.25% is a shareholder servicing fee).
Prior to August 15, 2016, the Global Growth Fund and the Large Company Growth Fund had a Shareholder Servicing Plan. Under the plan, the Global Growth Fund and the Large Company Growth Fund were authorized to pay an annual shareholder servicing fee up to 0.10% of each Fund’s average daily net assets. This fee was used to finance certain activities related to servicing and maintaining shareholder accounts of the Institutional Class Shares and is included in Shareholder servicing fees on the Statements of Operations.
Notes to Financial Statements (Continued)
UNDERWRITING AGREEMENT
The Underwriter is the Funds’ principal underwriter and, as such, acts as exclusive agent for distribution of the Funds’ shares. Under the terms of the Underwriting Agreement between the Trust and the Underwriter, the Underwriter earned underwriting and broker commissions on the sale of Class A shares of the Funds. W&S Brokerage Services, Inc., an affiliate of the Underwriter and the Advisor, also earned broker commissions on the sale of Class A shares of the Funds. Listed below are the total underwriting and broker commissions earned by the Underwriter and its affiliate during the year ended June 30, 2017:
| Fund | | Amount | |
| Global Growth Fund* | | $ | 4 | |
| International Small Cap Fund | | | 2,331 | |
| Large Cap Fund | | | 7,154 | |
| Large Company Growth Fund* | | | 670 | |
| Ohio Tax-Free Bond Fund | | | 4,506 | |
| Small Cap Value Opportunities Fund | | | 2,297 | |
| Value Fund | | | 4,455 | |
* For the period August 15, 2016 through June 30, 2017.
In addition, the Underwriter collected CDSC on the redemption of Class C shares of the Funds listed below during the year ended June 30, 2017:
| Fund | | Amount | |
| Credit Opportunities Fund | | $ | 79 | |
| International Small Cap Fund | | | 35 | |
| Large Cap Fund | | | 210 | |
| Small Cap Value Opportunities Fund | | | 3 | |
INTERFUND TRANSACTIONS
The Funds may engage in purchase and sale transactions with funds that have a common investment advisor (or affiliated investment advisors), common Trustees and/or common Officers. During the year ended June 30, 2017, the Credit Opportunities Fund engaged in purchase transactions that complied with Rule 17a-7 as defined under the 1940 Act in the amount of $199,932.
5. Federal Tax Information
Federal income tax — It is each Fund’s policy to continue to comply with the special provisions of the Internal Revenue Code applicable to regulated investment companies. As provided therein, in any fiscal year in which a Fund so qualifies and distributes at least 90% of its investment company taxable income, the Fund (but not the shareholders) will be relieved of federal income tax on the income distributed. It is each Fund’s policy to distribute all of its taxable income and accordingly, no provision for income taxes has been made.
In order to avoid imposition of the excise tax applicable to regulated investment companies, it is also each Fund’s intention to declare and pay as dividends in each calendar year at least 98% of its investment company taxable income (earned during the calendar year) and 98.2% of its net realized capital gains (earned during the twelve months ending October 31) plus undistributed amounts from prior years.
Notes to Financial Statements (Continued)
The tax character of distributions paid for the years ended June 30, 2017 and June 30, 2016 is as follows:
| | | Credit Opportunities Fund | | | Global Growth Fund | | | International Small Cap Fund | |
| | | Year Ended | | | Period Ended | | | Year Ended | | | Year Ended | | | Year Ended | | | Year Ended | |
| | | June 30, | | | June 30, | | | June 30, | | | June 30, | | | June 30, | | | June 30, | |
| | | 2017 | | | 2016 | | | 2017 | | | 2016 | | | 2017 | | | 2016 | |
| From ordinary income | | $ | 2,960,568 | | | $ | 1,442,278 | | | $ | 15,884 | | | $ | 24,355 | | | $ | 4,439,994 | | | $ | 2,342,530 | |
| From long-term capital gains | | | — | | | | 15,974 | | | | 139,199 | | | | 414,595 | | | | — | | | | — | |
| Total Distributions | | $ | 2,960,568 | | | $ | 1,458,252 | | | $ | 155,083 | | | $ | 438,950 | | | $ | 4,439,994 | | | $ | 2,342,530 | |
| | | Large Cap Fund | | | Large Company Growth Fund | | | Ohio Tax-Free Bond Fund | |
| | | Year Ended | | | Year Ended | | | Year Ended | | | Year Ended | | | Year Ended | | | Year Ended | |
| | | June 30, | | | June 30, | | | June 30, | | | June 30, | | | June 30, | | | June 30, | |
| | | 2017 | | | 2016 | | | 2017 | | | 2016 | | | 2017 | | | 2016 | |
| From ordinary income | | $ | 2,907,516 | | | $ | 2,178,416 | | | $ | — | | | $ | 3,166,845 | | | $ | 8,371 | | | $ | 1,787 | |
| From tax-exempt income | | | — | | | | — | | | | — | | | | — | | | | 1,584,185 | | | | 1,677,057 | |
| From long-term capital gains | | | — | | | | — | | | | 6,376,311 | | | | 11,589,603 | | | | 69,440 | | | | 85,842 | |
| Total Distributions | | $ | 2,907,516 | | | $ | 2,178,416 | | | $ | 6,376,311 | | | $ | 14,756,448 | | | $ | 1,661,996 | | | $ | 1,764,686 | |
| | | Small Cap Value Opportunities Fund | | | Value Fund | |
| | | Year Ended | | | Year Ended | | | Year Ended | | | Year Ended | |
| | | June 30, | | | June 30, | | | June 30, | | | June 30, | |
| | | 2017 | | | 2016 | | | 2017 | | | 2016 | |
| From ordinary income | | $ | 216,387 | | | $ | 3,754,343 | | | $ | 8,066,842 | | | $ | 7,542,099 | |
| From long-term capital gains | | | — | | | | 7,495,931 | | | | 776,054 | | | | 26,706,058 | |
| Total Distributions | | $ | 216,387 | | | $ | 11,250,274 | | | $ | 8,842,896 | | | $ | 34,248,157 | |
The following information is computed on a tax basis for each item as of June 30, 2017:
| | | Credit | | | Global | | | International | | | Large | |
| | | Opportunities | | | Growth | | | Small Cap | | | Cap | |
| | | Fund | | | Fund | | | Fund | | | Fund | |
| Tax cost of portfolio investments | | $ | 53,013,126 | | | $ | 19,444,121 | | | $ | 280,383,197 | | | $ | 276,022,547 | |
| Gross unrealized appreciation | | | 2,022,895 | | | | 5,552,966 | | | | 52,087,525 | | | | 56,210,097 | |
| Gross unrealized depreciation | | | (644,106 | ) | | | (79,436 | ) | | | (5,918,646 | ) | | | (3,133,755 | ) |
| Net unrealized appreciation on investments | | | 1,378,789 | | | | 5,473,530 | | | | 46,168,879 | | | | 53,076,342 | |
| Net unrealized appreciation (depreciation) on foreign currency transactions, securities sold short and unfunded loan commitments | | | 43,830 | | | | 46 | | | | 34,166 | | | | — | |
| Net unrealized appreciation (depreciation) on deferred foreign capital gains tax | | | — | | | | (9,826 | ) | | | — | | | | — | |
| Accumulated capital and other losses | | | — | | | | — | | | | (12,723,551 | ) | | | (18,423,858 | ) |
| Undistributed ordinary income | | | 432,185 | | | | 5,226 | | | | 2,484,547 | | | | 1,334,817 | |
| Undistributed long-term capital gains | | | 629,044 | | | | — | | | | — | | | | — | |
| Accumulated earnings (deficit) | | $ | 2,483,848 | | | $ | 5,468,976 | | | $ | 35,964,041 | | | $ | 35,987,301 | |
Notes to Financial Statements (Continued)
| | | | | | Ohio | | | Small Cap | | | | |
| | | Large Company | | | Tax-Free | | | Value | | | | |
| | | Growth | | | Bond | | | Opportunities | | | Value | |
| | | Fund | | | Fund | | | Fund | | | Fund | |
| Tax cost of portfolio investments | | $ | 142,867,251 | | | $ | 46,488,139 | | | $ | 113,867,193 | | | $ | 284,650,893 | |
| Gross unrealized appreciation | | | 62,859,411 | | | | 2,616,253 | | | | 18,527,944 | | | | 106,987,780 | |
| Gross unrealized depreciation | | | (2,422,946 | ) | | | (56,687 | ) | | | (8,867,262 | ) | | | (10,586,523 | ) |
| Net unrealized appreciation (depreciation) on investments | | | 60,436,465 | | | | 2,559,566 | | | | 9,660,682 | | | | 96,401,257 | |
| Accumulated capital and other losses | | | — | | | | — | | | | (3,480,339 | ) | | | — | |
| Qualified late-year losses | | | — | | | | (22,545 | ) | | | — | | | | — | |
| Undistributed ordinary income | | | 1,615,947 | | | | — | | | | — | | | | 166,545 | |
| Undistributed tax-exempt income | | | — | | | | 17,296 | | | | — | | | | — | |
| Undistributed long-term capital gains | | | 4,705,542 | | | | — | | | | — | | | | 13,248,332 | |
| Other temporary differences | | | — | | | | (35,791 | ) | | | — | | | | — | |
| Accumulated earnings (deficit) | | $ | 66,757,954 | | | $ | 2,518,526 | | | $ | 6,180,343 | | | $ | 109,816,134 | |
The difference between the tax cost of portfolio investments and the financial statement cost is primarily due to wash sale loss deferrals and passive foreign investment company (“PFIC”) adjustments.
As of June 30, 2017, the Funds had the following capital loss carryforwards for federal income tax purposes:
| | | No | | | No | | | | |
| | | Expiration | | | Expiration | | | | |
| | | Short Term | | | Long Term | | | Total | |
| International Small Cap Fund | | $ | 12,723,551 | | | $ | — | | | $ | 12,723,551 | |
| Large Cap Fund | | | 14,093,651 | | | | 4,330,207 | | | | 18,423,858 | |
| Small Cap Value Opportunities Fund | | | — | | | | 3,480,339 | | | | 3,480,339 | |
The capital loss carryforwards may be utilized in future years to offset net realized capital gains, if any, prior to distributing such gains to shareholders.
During the year ended June 30, 2017, the following Funds utilized capital loss carryforwards or had capital loss carryforwards expire as follows:
| Fund | | Utilized | | | Expired | |
| International Small Cap Fund | | $ | 7,696,027 | | | $ | 1,667,378 | |
| Value Fund | | | 10,076,879 | | | | — | |
Notes to Financial Statements (Continued)
Under current laws, certain capital losses realized after October 31 and ordinary losses realized after December 31 may be deferred (and certain ordinary losses after October and/or December 31 may be deferred) and treated as occurring on the first day of the following fiscal year. For the year ended June 30, 2017, the Funds elected to defer the following losses:
| | | Realized | | | Ordinary | | | | |
| Fund | | Capital Losses | | | Losses | | | Total | |
| Ohio Tax-Free Bond Fund | | $ | 22,545 | | | $ | — | | | $ | 22,545 | |
The Funds have analyzed their tax positions taken on federal income tax returns for all open tax years (tax years ended June 30, 2014 through 2017) and have concluded that no provision for income tax is required in their financial statements.
Certain reclassifications, the result of permanent differences between financial statement and income tax reporting requirements, have been made to the components of capital. These reclassifications have no impact on the net assets or NAV per share of the Funds. The following reclassifications, which are primarily attributed to the tax treatment of foreign currency gains/losses, gains/losses from PFICs, expiration of prior year capital loss carryforwards, adjustments on sale of defaulted securities, re-designation of dividends paid, short-term capital gains netted against net operating loss, reclassifications due to DSM fund merger, write-off of net operating losses, overdistributions and deemed distributions on shareholder redemptions, have been made to the following Funds for the year ended June 30, 2017:
| | | | | | Accumulated | | | Accumulated | |
| | | Paid-In | | | Net Investment | | | Net Realized | |
| Fund | | Capital | | | Income(Loss) | | | Gains(Losses) | |
| Credit Opportunities Fund | | $ | — | | | $ | 55,905 | | | $ | (55,905 | ) |
| Global Growth Fund | | | 61,509 | | | | 25,906 | | | | (87,415 | ) |
| International Small Cap Fund | | | (1,667,171 | ) | | | 680,805 | | | | 986,366 | |
| Large Company Growth Fund | | | 1 | | | | 1,093,193 | | | | (1,093,194 | ) |
| Ohio Tax-Free Bond Fund | | | — | | | | (16 | ) | | | 16 | |
| Small Cap Value Opportunities Fund | | | (81,783 | ) | | | 81,679 | | | | 104 | |
| Value Fund | | | 1,603,298 | | | | (19,954 | ) | | | (1,583,344 | ) |
6. Commitments and Contingencies
The Funds indemnify theTrust’s officers andTrustees for certain liabilities that might arise from their performance of their duties to the Funds. Additionally, in the normal course of business, the Funds enter into contracts that contain a variety of representations and warranties and which provide general indemnifications. The Funds’ maximum exposure under these arrangements is unknown, as this would involve future claims that may be made against the Funds.
7. Principal Risks
Risks Associated with Foreign Investments — Some of the Funds may invest in the securities of foreign issuers. Investing in securities issued by companies whose principal business activities are outside the U.S. may involve significant risks not present in domestic investments. For example, there is generally less publicly available information about foreign companies, particularly those not subject to the disclosure and reporting requirements of the U.S. securities laws. Foreign issuers are generally not bound by uniform accounting, auditing, and financial reporting requirements and standards of practice comparable to those applicable to domestic issuers. Investments in foreign securities also involve the risk of possible adverse changes in investment or exchange control regulations, expropriation or confiscatory taxation, limitations on the removal of funds or other assets of a Fund, political or financial instability or diplomatic and other developments which could affect such investments. Foreign stock markets, while growing in volume and sophistication, are generally not as developed as those in the U.S.,
Notes to Financial Statements (Continued)
and securities of some foreign issuers (particularly those located in developing countries) may be less liquid and more volatile than securities of comparable U.S. companies. In general, there is less overall governmental supervision and regulation of foreign securities markets, broker-dealers, and issuers than in the U.S.
Risks Associated with Concentration — Certain Funds may invest a high percentage of their assets in specific sectors of the market in order to achieve a potentially greater investment return. As a result, these Funds may be more susceptible to economic, political, and regulatory developments in a particular sector of the market, positive or negative, and may experience increased volatility on the Funds’ NAVs and magnified effect on the total return.
Risks Associated with Credit — An issuer may be unable to make timely payments of either principal or interest. This may cause the issuer’s securities to decline in value. Credit risk is particularly relevant to those Funds that invest a significant amount of their assets in junk bonds or lower-rated securities.
Risks Associated with Interest Rate Changes — As interest rates rise, the value of fixed-income securities a Fund owns will likely decrease. The price of debt securities is generally linked to the prevailing market interest rates. In general, when interest rates rise, the price of debt securities falls, and when interest rates fall, the price of debt securities rises. The price volatility of a debt security also depends on its maturity. Longer-term securities are generally more volatile, so the longer the average maturity or duration of these securities, the greater their price risk. Duration is a measure of the expected life, taking into account any prepayment or call features of the security, that is used to determine the price sensitivity of the security for a given change in interest rates. Specifically, duration is the change in the value of a fixed-income security that will result from a 1% change in interest rates, and generally is stated in years. For example, as a general rule a 1% rise in interest rates means a 1% fall in value for every year of duration. Maturity, on the other hand, is the date on which a fixed-income security becomes due for payment of principal. The negative impact on fixed income securities if interest rates increase as a result could negatively impact a Fund’s NAV.
Risks Associated with Liquidity — Liquidity risk exists when particular investments are difficult to purchase or sell. This can reduce a Fund’s returns because a Fund may be unable to transact at advantageous times or prices, or at all.
Please see the Funds’ prospectus for a complete discussion of these and other risks.
8. Fund Mergers and Reorganizations
On August 4, 2016, the shareholders of the DSM Global Growth Fund, DSM Global Growth & Income Fund and DSM Large Cap Growth Fund (the “Reorganizing Funds”), each a series of the Professionally Managed Portfolios Trust, approved an Agreement and Plan of Reorganization providing for the transfer of all assets and liabilities of each Reorganizing Fund to the correspondingTouchstone Fund as noted below.The Global Growth Fund and Large Company Growth Fund, each a new series of the Trust, assumed the financial and performance history of the DSM Global Growth Fund and DSM Large Cap Growth Fund, respectively. The tax-free mergers took place on August 15, 2016.
| | | | | Net | | | Shares | |
| Reorganizing Funds | | Touchstone Funds* | | Assets | | | Outstanding | |
| DSM Global Growth Fund | | Global Growth Fund | | $ | 6,948,009 | | | | 372,747 | |
| DSM Global Growth & Income Fund | | Global Growth Fund | | | 4,918,771 | | | | 305,368 | |
| DSM Large Cap Growth Fund | | Large Company Growth Fund | | | 192,530,525 | | | | 6,169,105 | |
*The Reorganizing Funds had Institutional Class shares outstanding immediately prior to the reorganization. On August 15, 2016, theTouchstone Funds began issuing Class A shares, Class C shares and Class Y shares.
Notes to Financial Statements (Continued)
On August 4, 2016, the shareholders of the DSM Global Growth & Income Fund approved an Agreement and Plan of Reorganization providing for the transfer of all assets and liabilities of the DSM Global Growth & Income Fund to the Touchstone Global Growth Fund. The tax-free merger took place on August 15, 2016.
| | | | | | After | |
| | | Before Reorganization | | | Reorganization | |
| | | DSM Global | | | | | | | |
| | | Growth & | | | Touchstone | | | Touchstone | |
| | | Income | | | Global Growth | | | Global Growth | |
| | | Fund | | | Fund | | | Fund | |
| Institutional Class | | | | | | | | | | | | |
| Shares | | | 263,883 | (A) | | | 372,747 | | | | 636,630 | |
| Net Assets | | $ | 4,918,771 | | | $ | 6,948,009 | | | $ | 11,866,780 | |
| Net Asset Value | | $ | 18.64 | (A) | | $ | 18.64 | | | $ | 18.64 | |
| Unrealized Appreciation | | $ | 301,083 | | | $ | 695,380 | | | $ | 996,463 | |
(A)Reflects a 0.864147:1 stock split which occurred on the date of reorganization, August 15, 2016.
Assuming this reorganization had been completed on July 1, 2016, the Global Growth Fund’s results of operations for the year ended June 30, 2017 would have been as follows:
| Net investment loss | | $ | (33,696 | ) |
| Net realized and unrealized gains on investments | | $ | 5,322,345 | |
| Net increase in net assets from operations | | $ | 5,288,649 | |
Because the combined investment portfolios have been managed as a single portfolio since the reorganization was completed, it is not practical to separate the amounts of revenue and earnings to the Global Growth Fund that have been included in its statements of operations since the reorganization.
On December 16, 2016, the Touchstone Ohio Tax-Free Bond Fund, a series of Touchstone Tax-Free Trust (the “Predecessor Fund”), was reorganized into the Ohio Tax-Free Bond Fund, a new series of the Trust. As a result of the tax-free reorganization, the performance and accounting history of the Predecessor Fund was assumed by the Ohio Tax-Free Bond Fund.
9. Subsequent Events
Subsequent events occurring after the date of this report have been evaluated for potential impact to this report through the date the financial statements were issued.
At a meeting of the Board of Trustees (the “Board”) of the Trust held on April 18, 2017, the Board approved an Agreement and Plan of Reorganization for the Touchstone Balanced Fund, Touchstone Large Cap Focused Fund, Touchstone International Equity Fund and Touchstone Small Company Fund (the “Touchstone Funds”) to acquire the assets of the Sentinel Balanced Fund, Sentinel Common Stock Fund, Sentinel International Equity Fund and Sentinel Small Company Fund (the “Sentinel Funds”), respectively. The Sentinel Funds will reorganize into each respective Touchstone Fund, each of which is a new series of Trust (collectively the “Reorganization”). The Reorganization is subject to Sentinel shareholder approval. The Reorganization is expected to occur on or about October 13, 2017.
There were no other subsequent events that necessitated recognition or disclosure in the Funds’ financial statements.
Report of Independent Registered Public Accounting Firm
The Board of Trustees and Shareholders of Touchstone Credit Opportunities Fund, Touchstone Global Growth Fund, Touchstone International Small Cap Fund, Touchstone Large Cap Fund, Touchstone Large Company Growth Fund, Touchstone Ohio Tax-Free Bond Fund, Touchstone Small Cap Value Opportunities Fund, and Touchstone Value Fund.
We have audited the accompanying statements of assets and liabilities, including the portfolios of investments, of Touchstone Credit Opportunities Fund, Touchstone Global Growth Fund, Touchstone International Small Cap Fund, Touchstone Large Cap Fund, Touchstone Large Company Growth Fund, Touchstone Ohio Tax-Free Bond Fund, Touchstone Small Cap Value Opportunities Fund and Touchstone Value Fund (the “Funds”) (eight of the funds constituting Touchstone Strategic Trust) as of June 30, 2017, and the related statements of operations for the year then ended, the statements of changes in net assets and the financial highlights of Touchstone Credit Opportunities Fund, Touchstone International Small Cap Fund, Touchstone Large Cap Fund, Touchstone Ohio Tax-Free Bond Fund, Touchstone Small Cap Value Opportunities Fund and Touchstone Value Fund for each of the years or periods indicated therein, and the statements of changes in net assets and the financial highlights of Touchstone Global Growth Fund and Touchstone Large Company Growth Fund for the year ended June 30, 2017. These financial statements and financial highlights are the responsibility of the Funds’ management. Our responsibility is to express an opinion on these financial statements and financial highlights based on our audits. The financial statements and financial highlights of Touchstone Global Growth Fund and Touchstone Large Company Growth Fund for each of the periods presented through June 30, 2016 of Touchstone Global Growth Fund and Touchstone Large Company Growth Fund were audited by other auditors, whose report dated August 25, 2016 expressed an unqualified opinion on those financial statements and financial highlights.
We conducted our audits in accordance with the standards of the Public Company Accounting Oversight Board (United States). Those standards require that we plan and perform the audit to obtain reasonable assurance about whether the financial statements and financial highlights are free of material misstatement. We were not engaged to perform an audit of the Funds’ internal control over financial reporting. Our audits included consideration of internal control over financial reporting as a basis for designing audit procedures that are appropriate in the circumstances, but not for the purpose of expressing an opinion on the effectiveness of the Funds’ internal control over financial reporting. Accordingly, we express no such opinion. An audit also includes examining, on a test basis, evidence supporting the amounts and disclosures in the financial statements and financial highlights, assessing the accounting principles used and significant estimates made by management, and evaluating the overall financial statement presentation. Our procedures included confirmation of securities owned as of June 30, 2017, by correspondence with the custodian, brokers and agent banks or by other appropriate auditing procedures where replies from brokers and agent banks were not received. We believe that our audits provide a reasonable basis for our opinion.
Report of Independent Registered Public Accounting Firm (Continued)
In our opinion, the financial statements and financial highlights referred to above present fairly, in all material respects, the financial position of Touchstone Credit Opportunities Fund, Touchstone Global Growth Fund, Touchstone International Small Cap Fund, Touchstone Large Cap Fund, Touchstone Large Company Growth Fund, Touchstone Ohio Tax-Free Bond Fund, Touchstone Small Cap Value Opportunities Fund and Touchstone Value Fund (eight of the funds constituting Touchstone Strategic Trust) at June 30, 2017, the results of their operations for the year then ended, the changes in net assets and the financial highlights of Touchstone Credit Opportunities Fund, Touchstone International Small Cap Fund, Touchstone Large Cap Fund, Touchstone Ohio Tax-Free Bond Fund, Touchstone Small Cap Value Opportunities Fund and Touchstone Value Fund for each of the years or periods indicated therein, and the changes in net assets and the financial highlights of Touchstone Global Growth Fund and Touchstone Large Company Growth Fund for the year ended June 30, 2017 in conformity with U.S. generally accepted accounting principles.

Cincinnati, Ohio
August 18, 2017
Other Items (Unaudited)
Supplemental Tax Information
The information set forth below is for the Funds’ fiscal year as required by federal income tax laws. Shareholders, however, must report distributions on a calendar year basis for income tax purposes, which may include distributions for portions of two fiscal years of the Fund. Accordingly, the information needed by shareholders for income tax purposes will be sent to them in February of each year. Please consult your tax advisor for proper treatment of this information.
Qualified Dividend Income
Under the Jobs and Growth Tax Relief Reconciliation Act of 2003 (the “Act”), the following percentages of ordinary dividends paid during the fiscal year ended June 30, 2017 are designated as “qualified dividend income,” as defined in the Act, and are subject to reduced tax rates in 2016. The Fund intends to pass through the maximum allowable percentage for Form 1099 Div.
| International Small Cap Fund | | | 100.00 | % |
| Large Cap Fund | | | 100.00 | % |
| Small Cap Value Opportunities Fund | | | 89.48 | % |
| Value Fund | | | 100.00 | % |
Dividend Received Deduction
For corporate shareholders, the following ordinary distributions paid during the current fiscal year ended June 30, 2017 qualify for the corporate dividends received deduction. The Funds intend to pass through the maximum allowable percentage.
| Large Cap Fund | | | 100.00 | % |
| Small Cap Value Opportunities Fund | | | 89.48 | % |
| Value Fund | | | 100.00 | % |
For the fiscal year ended June 30, 2017, the Funds designated long-term capital gains as follows:
| Credit Opportunities Fund | | $ | 629,044 | |
| Large Company Growth Fund | | $ | 9,982,185 | |
| Ohio Tax-Free Bond Fund | | $ | 69,440 | |
| Value Fund | | $ | 15,607,730 | |
Of the dividends paid from net investment income during the most-recent fiscal year, 99.9% was designated as exempt interest dividends for federal income tax purposes for the Ohio Tax-Free Bond Fund.
Foreign Tax Income and Foreign Tax Credit
The International Small Cap Fund intends to pass through a foreign tax credit to the shareholders. For the fiscal year ended June 30, 2017, the total amount of foreign source income is $7,525,349 or $0.41 per share. The total amount of foreign taxes to be paid is $469,850 or $0.03 per share. Shareholder’s allocable share of the foreign tax credit will be reported on Form 1099 Div.
Proxy Voting Guidelines and Proxy Voting Records
The Sub-Advisors are responsible for exercising the voting rights associated with the securities purchased and held by the Funds. A description of the policies and procedures that the Sub-Advisors use in fulfilling this responsibility is available as an appendix to the most recent Statement of Additional Information, which can be obtained without charge by calling toll free 1.800.543.0407 or by visiting the Touchstone website at TouchstoneInvestments.com or on the Securities and Exchange Commission’s (the “Commission”) website
Other Items (Unaudited) (Continued)
sec.gov. Information regarding how those proxies were voted during the most recent twelve-month period ended June 30 is also available without charge by calling toll free 1.800.543.0407 or on the Commission’s website at sec.gov.
Quarterly Portfolio Disclosure
The Trust files a complete listing of portfolio holdings for each Fund as of the end of the first and third quarters of each fiscal year on Form N-Q. The complete listing (i) is available on the Commission’s website; (ii) may be reviewed and copied at the Commission’s Public Reference Room in Washington, DC; or (iii) will be made available to shareholders upon request by calling 1.800.543.0407. Information on the operation of the Public Reference Room may be obtained by calling 1.800.SEC.0330.
Schedule of Shareholder Expenses
As a shareholder of the Funds, you incur two types of costs: (1) transaction costs, including reinvested dividends or other distributions; and (2) ongoing costs, including investment advisory fees; distribution (12b-1) fees; and other Fund expenses. This example is intended to help you understand your ongoing costs (in dollars) of investing in the Funds and to compare these costs with the ongoing costs of investing in other mutual funds. The example is based on an investment of $1,000 invested at the beginning of the period and held for the entire period (January 1, 2017 through June 30, 2017).
Actual Expenses
The first line of the table below for each share class of a Fund provides information about actual account values and actual expenses. You may use the information in this line, together with the amount you invested, to estimate the expenses that you paid over the period. Simply divide your account value by $1,000 (for example, an $8,600 account value divided by $1,000 = 8.6), then multiply the result by the number in the first line under the heading entitled “Expenses Paid During the Six Months Ended June 30, 2017” to estimate the expenses you paid on your account during this period.
Hypothetical Example for Comparison Purposes
The second line of the table below for each share class of a Fund provides information about hypothetical account values and hypothetical expenses based on the Funds’ actual expense ratio and an assumed rate of return of 5% per year before expenses, which is not the Funds’ actual return. The hypothetical account values and expenses may not be used to estimate the actual ending account balance or expenses you paid for the period. You may use this information to compare the ongoing costs of investing in the Funds and other funds. To do so, compare this 5% hypothetical example with the 5% hypothetical examples that appear in the shareholder reports of the other funds.
Please note that the expenses shown in the table are meant to highlight your ongoing costs only and do not reflect any transactional costs, such as sales charges (loads), redemption fees, or exchange fees. Therefore, the second line of the table below is useful in comparing ongoing costs only, and will not help you determine the relative total costs of owning different funds. In addition, if these transactional costs were included, your costs would have been higher
Other Items (Unaudited) (Continued)
| | | | | | | | | | | | | | Expenses | |
| | | | | Net Expense | | | Beginning | | | Ending | | | Paid During | |
| | | | | Ratio | | | Account | | | Account | | | the Six Months | |
| | | | | Annualized | | | Value | | | Value | | | Ended | |
| | | | | June 30, | | | January 1, | | | June 30, | | | June 30, | |
| | | | | 2017 | | | 2017 | | | 2017 | | | 2017* | |
| Touchstone Credit Opportunities Fund | | | | | | | | | | | | | | | | |
| Class A | | Actual | | | 1.84 | % | | $ | 1,000.00 | | | $ | 1,031.29 | | | $ | 9.27 | ** |
| Class A | | Hypothetical | | | 1.84 | % | | $ | 1,000.00 | | | $ | 1,015.67 | | | $ | 9.20 | ** |
| | | | | | | | | | | | | | | | | | | |
| Class C | | Actual | | | 2.59 | % | | $ | 1,000.00 | | | $ | 1,027.66 | | | $ | 13.02 | ** |
| Class C | | Hypothetical | | | 2.59 | % | | $ | 1,000.00 | | | $ | 1,011.95 | | | $ | 12.92 | ** |
| | | | | | | | | | | | | | | | | | | |
| Class Y | | Actual | | | 1.59 | % | | $ | 1,000.00 | | | $ | 1,032.67 | | | $ | 8.01 | ** |
| Class Y | | Hypothetical | | | 1.59 | % | | $ | 1,000.00 | | | $ | 1,016.91 | | | $ | 7.95 | ** |
| | | | | | | | | | | | | | | | | | | |
| Institutional Class | | Actual | | | 1.49 | % | | $ | 1,000.00 | | | $ | 1,033.93 | | | $ | 7.51 | ** |
| Institutional Class | | Hypothetical | | | 1.49 | % | | $ | 1,000.00 | | | $ | 1,017.41 | | | $ | 7.45 | ** |
| | | | | | | | | | | | | | | | | | | |
| Touchstone Global Growth Fund | | | | | | | | | | | | | | | | |
| Class A | | Actual | | | 1.41 | % | | $ | 1,000.00 | | | $ | 1,259.19 | | | $ | 7.90 | |
| Class A | | Hypothetical | | | 1.41 | % | | $ | 1,000.00 | | | $ | 1,017.80 | | | $ | 7.05 | |
| | | | | | | | | | | | | | | | | | | |
| Class C | | Actual | | | 2.16 | % | | $ | 1,000.00 | | | $ | 1,254.26 | | | $ | 12.07 | |
| Class C | | Hypothetical | | | 2.16 | % | | $ | 1,000.00 | | | $ | 1,014.08 | | | $ | 10.79 | |
| | | | | | | | | | | | | | | | | | | |
| Class Y | | Actual | | | 1.16 | % | | $ | 1,000.00 | | | $ | 1,258.48 | | | $ | 6.50 | |
| Class Y | | Hypothetical | | | 1.16 | % | | $ | 1,000.00 | | | $ | 1,019.04 | | | $ | 5.81 | |
| | | | | | | | | | | | | | | | | | | |
| Institutional Class | | Actual | | | 1.06 | % | | $ | 1,000.00 | | | $ | 1,260.60 | | | $ | 5.94 | |
| Institutional Class | | Hypothetical | | | 1.06 | % | | $ | 1,000.00 | | | $ | 1,019.54 | | | $ | 5.31 | |
| | | | | | | | | | | | | | | | | | | |
| Touchstone International Small Cap Fund | | | | | | | | | | | | | | | | |
| Class A | | Actual | | | 1.55 | % | | $ | 1,000.00 | | | $ | 1,162.85 | | | $ | 8.31 | |
| Class A | | Hypothetical | | | 1.55 | % | | $ | 1,000.00 | | | $ | 1,017.11 | | | $ | 7.75 | |
| | | | | | | | | | | | | | | | | | | |
| Class C | | Actual | | | 2.30 | % | | $ | 1,000.00 | | | $ | 1,159.04 | | | $ | 12.31 | |
| Class C | | Hypothetical | | | 2.30 | % | | $ | 1,000.00 | | | $ | 1,013.39 | | | $ | 11.48 | |
| | | | | | | | | | | | | | | | | | | |
| Class Y | | Actual | | | 1.30 | % | | $ | 1,000.00 | | | $ | 1,164.41 | | | $ | 6.98 | |
| Class Y | | Hypothetical | | | 1.30 | % | | $ | 1,000.00 | | | $ | 1,018.35 | | | $ | 6.51 | |
| | | | | | | | | | | | | | | | | | | |
| Institutional Class | | Actual | | | 1.18 | % | | $ | 1,000.00 | | | $ | 1,164.88 | | | $ | 6.33 | |
| Institutional Class | | Hypothetical | | | 1.18 | % | | $ | 1,000.00 | | | $ | 1,018.94 | | | $ | 5.91 | |
| | | | | | | | | | | | | | | | | | | |
| Touchstone Large Cap Fund | | | | | | | | | | | | | | | | |
| Class A | | Actual | | | 1.12 | % | | $ | 1,000.00 | | | $ | 1,077.48 | | | $ | 5.77 | |
| Class A | | Hypothetical | | | 1.12 | % | | $ | 1,000.00 | | | $ | 1,019.24 | | | $ | 5.61 | |
| | | | | | | | | | | | | | | | | | | |
| Class C | | Actual | | | 1.87 | % | | $ | 1,000.00 | | | $ | 1,073.71 | | | $ | 9.61 | |
| Class C | | Hypothetical | | | 1.87 | % | | $ | 1,000.00 | | | $ | 1,015.52 | | | $ | 9.35 | |
| | | | | | | | | | | | | | | | | | | |
| Class Y | | Actual | | | 0.87 | % | | $ | 1,000.00 | | | $ | 1,079.14 | | | $ | 4.48 | |
| Class Y | | Hypothetical | | | 0.87 | % | | $ | 1,000.00 | | | $ | 1,020.48 | | | $ | 4.36 | |
| | | | | | | | | | | | | | | | | | | |
| Institutional Class | | Actual | | | 0.77 | % | | $ | 1,000.00 | | | $ | 1,079.96 | | | $ | 3.97 | |
| Institutional Class | | Hypothetical | | | 0.77 | % | | $ | 1,000.00 | | | $ | 1,020.98 | | | $ | 3.86 | |
| | | | | | | | | | | | | | | | | | | |
| Touchstone Large Company Growth Fund | | | | | | | | | | | | | | | | |
| Class A | | Actual | | | 1.23 | % | | $ | 1,000.00 | | | $ | 1,219.79 | | | $ | 6.77 | |
| Class A | | Hypothetical | | | 1.23 | % | | $ | 1,000.00 | | | $ | 1,018.70 | | | $ | 6.16 | |
Other Items (Unaudited) (Continued)
| | | | | | | | | | | | | | Expenses | |
| | | | | Net Expense | | | Beginning | | | Ending | | | Paid During | |
| | | | | Ratio | | | Account | | | Account | | | the Six Months | |
| | | | | Annualized | | | Value | | | Value | | | Ended | |
| | | | | June 30, | | | January 1, | | | June 30, | | | June 30, | |
| | | | | 2017 | | | 2017 | | | 2017 | | | 2017* | |
| Touchstone Large Company Growth Fund (continued) | | | | | | | | | | | | | | | | |
| Class C | | Actual | | | 1.98 | % | | $ | 1,000.00 | | | $ | 1,215.29 | | | $ | 10.88 | |
| Class C | | Hypothetical | | | 1.98 | % | | $ | 1,000.00 | | | $ | 1,014.98 | | | $ | 9.89 | |
| | | | | | | | | | | | | | | | | | | |
| Class Y | | Actual | | | 0.98 | % | | $ | 1,000.00 | | | $ | 1,221.69 | | | $ | 5.40 | |
| Class Y | | Hypothetical | | | 0.98 | % | | $ | 1,000.00 | | | $ | 1,019.93 | | | $ | 4.91 | |
| | | | | | | | | | | | | | | | | | | |
| Institutional Class | | Actual | | | 0.88 | % | | $ | 1,000.00 | | | $ | 1,222.29 | | | $ | 4.85 | |
| Institutional Class | | Hypothetical | | | 0.88 | % | | $ | 1,000.00 | | | $ | 1,020.43 | | | $ | 4.41 | |
| | | | | | | | | | | | | | | | | | | |
| Touchstone Ohio Tax-Free Bond Fund | | | | | | | | | | | | | | | | |
| Class A | | Actual | | | 0.85 | % | | $ | 1,000.00 | | | $ | 1,023.90 | | | $ | 4.27 | |
| Class A | | Hypothetical | | | 0.85 | % | | $ | 1,000.00 | | | $ | 1,020.58 | | | $ | 4.26 | |
| | | | | | | | | | | | | | | | | | | |
| Class C | | Actual | | | 1.60 | % | | $ | 1,000.00 | | | $ | 1,020.97 | | | $ | 8.02 | |
| Class C | | Hypothetical | | | 1.60 | % | | $ | 1,000.00 | | | $ | 1,016.86 | | | $ | 8.00 | |
| | | | | | | | | | | | | | | | | | | |
| Class Y | | Actual | | | 0.60 | % | | $ | 1,000.00 | | | $ | 1,025.82 | | | $ | 3.01 | |
| Class Y | | Hypothetical | | | 0.60 | % | | $ | 1,000.00 | | | $ | 1,021.82 | | | $ | 3.01 | |
| | | | | | | | | | | | | | | | | | | |
| Institutional Class | | Actual | | | 0.55 | % | | $ | 1,000.00 | | | $ | 1,025.92 | | | $ | 2.76 | |
| Institutional Class | | Hypothetical | | | 0.55 | % | | $ | 1,000.00 | | | $ | 1,022.07 | | | $ | 2.76 | |
| | | | | | | | | | | | | | | | | | | |
| Touchstone Small Cap Value Opportunities Fund | | | | | | | | | | | | | | | | |
| Class A | | Actual | | | 1.43 | % | | $ | 1,000.00 | | | $ | 970.47 | | | $ | 6.99 | |
| Class A | | Hypothetical | | | 1.43 | % | | $ | 1,000.00 | | | $ | 1,017.70 | | | $ | 7.15 | |
| | | | | | | | | | | | | | | | | | | |
| Class C | | Actual | | | 2.18 | % | | $ | 1,000.00 | | | $ | 967.13 | | | $ | 10.63 | |
| Class C | | Hypothetical | | | 2.18 | % | | $ | 1,000.00 | | | $ | 1,013.98 | | | $ | 10.89 | |
| | | | | | | | | | | | | | | | | | | |
| Class Y | | Actual | | | 1.18 | % | | $ | 1,000.00 | | | $ | 971.67 | | | $ | 5.77 | |
| Class Y | | Hypothetical | | | 1.18 | % | | $ | 1,000.00 | | | $ | 1,018.94 | | | $ | 5.91 | |
| | | | | | | | | | | | | | | | | | | |
| Institutional Class | | Actual | | | 1.10 | % | | $ | 1,000.00 | | | $ | 972.08 | | | $ | 5.38 | |
| Institutional Class | | Hypothetical | | | 1.10 | % | | $ | 1,000.00 | | | $ | 1,019.34 | | | $ | 5.51 | |
| | | | | | | | | | | | | | | | | | | |
| Touchstone Value Fund | | | | | | | | | | | | | | | | |
| Class A | | Actual | | | 1.08 | % | | $ | 1,000.00 | | | $ | 1,063.11 | | | $ | 5.52 | |
| Class A | | Hypothetical | | | 1.08 | % | | $ | 1,000.00 | | | $ | 1,019.44 | | | $ | 5.41 | |
| | | | | | | | | | | | | | | | | | | |
| Class C | | Actual | | | 1.83 | % | | $ | 1,000.00 | | | $ | 1,059.22 | | | $ | 9.34 | |
| Class C | | Hypothetical | | | 1.83 | % | | $ | 1,000.00 | | | $ | 1,015.72 | | | $ | 9.15 | |
| | | | | | | | | | | | | | | | | | | |
| Class Y | | Actual | | | 0.83 | % | | $ | 1,000.00 | | | $ | 1,065.32 | | | $ | 4.25 | |
| Class Y | | Hypothetical | | | 0.83 | % | | $ | 1,000.00 | | | $ | 1,020.68 | | | $ | 4.16 | |
| | | | | | | | | | | | | | | | | | | |
| Institutional Class | | Actual | | | 0.68 | % | | $ | 1,000.00 | | | $ | 1,065.16 | | | $ | 3.48 | |
| Institutional Class | | Hypothetical | | | 0.68 | % | | $ | 1,000.00 | | | $ | 1,021.42 | | | $ | 3.41 | |
| * | Expenses are equal to the Fund's annualized expense ratio, multiplied by the average account value over the period, multiplied by 181/365 (to reflect the one-half year period). |
| ** | Excluding dividend and interest expenses on securities sold short, your actual cost of investment in Class A, Class C, Class Y and Institutional Class would be $8.51, $12.27, $7.26 and $6.76, respectively, and your hypothetical cost of investment in Class A, Class C, Class Y and Institutional Class would be $8.45, $12.18, $7.20, and $6.71, respectively. |
Management of the Trust (Unaudited)
Listed below is required information regarding the Trustees and principal officers of the Trust. The Trust’s Statement of Additional Information includes additional information about the Trustees and is available, without charge, upon request by calling 1.800.543.0407 or by visiting the Touchstone website at TouchstoneInvestments.com.
| Interested Trustee1: | | | | |
| | | | | | | | | Number | | |
| | | | | | | | | of Funds | | |
| | | | | | | | | Overseen | | |
| | | | | Term of | | | | in the | | |
| Name | | Position(s) | | Office And | | | | Touchstone | | Other |
| Address | | Held with | | Length of | | Principal Occupation(s) | | Fund | | Directorships |
| Year of Birth | | Trust | | Time Served | | During Past 5 Years | | Complex2 | | Held During the Past 5 Years3 |
Jill T. McGruder
Touchstone Advisors, Inc.
303 Broadway
Suite 1100
Cincinnati, Ohio 45202
Year of Birth: 1955 | | Trustee and President | | Until retirement at age 75 or until she resigns or is removed Trustee since 1999 | | President and CEO of IFS Financial Services, Inc. (a holding company). | | 41 | | IFS Financial Services, Inc. (a holding company) from 1999 to the present; Integrity and National Integrity Life Insurance Co. from 2005 to the present; Touchstone Securities (the Trust’s distributor) from 1999 to the present; Touchstone Advisors, Inc. (the Trust’s investment advisor and administrator) from 1999 to the present; W&S Brokerage Services (a brokerage company) from 1999 to the present; W&S Financial Group Distributors (a distribution company) from 1999 to the present; Cincinnati Analysts, Inc. from 2012 to the present; Columbus Life Insurance Co. from 2016 to the present; The Lafayette Life Insurance Co. from 2016 to the present; Taft Museum of Art from 2007 to the present; YWCA of Greater Cincinnati from 2012 to the present; and LL Global, Inc. from 2016 to the present. |
| Independent Trustees: | | | | | | | | | | |
Phillip R. Cox
c/o Touchstone Advisors, Inc.
303 Broadway
Suite 1100
Cincinnati, Ohio 45202
Year of Birth: 1947 | | Trustee | | Until retirement at age 75 or until he resigns or is removed Trustee since 1999 | | President and Chief Executive Officer of Cox Financial Corp. (a financial services company) from 1971 to the present. | | 41 | | Director of Cincinnati Bell (a communications company) from 1994 to the present; Bethesda Inc. (a hospital) from 2005 to the present; Timken Co. (a manufacturing company) from 2004 to 2014; TimkenSteel from 2014 to the present; Diebold, Inc. (a technology solutions company) from 2004 to the present; and Ohio Business Alliance for Higher Education and the Economy from 2005 to the present. |
William C. Gale
c/o Touchstone Advisors, Inc.
303 Broadway
Suite 1100
Cincinnati, Ohio 45202
Year of Birth: 1952 | | Trustee | | Until retirement at age 75 or until he resigns or is removed Trustee since 2013 | | Retired; formerly Senior Vice President and Chief Financial Officer (from 2003 to January 2015) of Cintas Corporation (a business services company). | | 41 | | None. |
Management of the Trust (Unaudited) (Continued)
| Independent Trustees (Continued): | | | | |
| | | | | | | | | Number | | |
| | | | | | | | | of Funds | | |
| | | | | | | | | Overseen | | |
| | | | | Term of | | | | in the | | |
| Name | | Position(s) | | Office And | | | | Touchstone | | Other |
| Address | | Held with | | Length of | | Principal Occupation(s) | | Fund | | Directorships |
| Year of Birth | | Trust | | Time Served | | During Past 5 Years | | Complex2 | | Held During the Past 5 Years3 |
Susan J. Hickenlooper
c/o Touchstone Advisors, Inc.
303 Broadway
Suite 1100
Cincinnati, Ohio 45202
Year of Birth: 1946 | | Trustee | | Until retirement at age 75 or until she resigns or is removed Trustee since 2009 | | Retired; formerly Financial Analyst for Impact 100 (charitable organization) from November 2012 to 2013. | | 41 | | Trustee of Diocese of Southern Ohio from 2014 to the present; and Trustee of Cincinnati Parks Foundation from 2000 to 2016. |
Kevin A. Robie
c/o Touchstone Advisors, Inc.
303 Broadway
Suite 1100
Cincinnati, Ohio 45202
Year of Birth: 1956 | | Trustee | | Until retirement at age 75 or until he resigns or is removed Trustee since 2013 | | Vice President of Portfolio Management at Soin International LLC (a multinational holding company) from 2004 to the present. | | 41 | | SaverSystems, Inc. from 2015 to the present; Director of Buckeye EcoCare, Inc. (a lawn care company) from 2013 to the present; Trustee of Dayton Region New Market Fund, LLC (a private fund) from 2010 to the present; and Trustee of the Entrepreneurs Center, Inc. (a small business incubator) from 2006 to the present. |
Edward J. VonderBrink
c/o Touchstone Advisors, Inc.
303 Broadway
Suite 1100
Cincinnati, Ohio 45202
Year of Birth: 1944 | | Trustee | | Until retirement at age 75 or until he resigns or is removed Trustee since 2013 | | Consultant, VonderBrink Consulting LLC from 2000 to the present. | | 41 | | Director of Streamline Health Solutions, Inc. (healthcare IT) from 2006 to 2015; Mercy Health from 2013 to the present; Mercy Health Foundation (healthcare nonprofit) from 2008 to the present; Al Neyer Inc. (a construction company) from 2013 to the present; and BASCO Shower Door from 2011 to the present. |
| 1 | Ms. McGruder, as a director of the Advisor and the Distributor, and an officer of affiliates of the Advisor and the Distributor, is an “interested person” of the Trust within the meaning of Section 2(a) (19) of the 1940 Act. |
| 2 | As of June 30, 2017, the Touchstone Fund Complex consisted of 21 series of the Trust, 13 series of Touchstone Funds Group Trust, 1 series of Touchstone Institutional Funds Trust, and 6 variable annuity series of Touchstone Variable Series Trust. |
| 3 | Each Trustee is also a Trustee of Touchstone Funds Group Trust, Touchstone Institutional Funds Trust, and Touchstone Variable Series Trust. |
Management of the Trust (Unaudited) (Continued)
The following is a list of the Principal Officers of the Trusts, the length of time served, and principal occupations for the past five years.
| Principal Officers: | | | | | | |
| | | | | Term of | | |
| Name | | Position(s) | | Office And | | |
| Address | | Held with | | Length of | | Principal Occupation(s) |
| Year of Birth | | Trust1 | | Time Served | | During the Past 5 Years |
Jill T. McGruder
Touchstone Advisors, Inc.
303 Broadway
Suite 1100
Cincinnati, Ohio 45202
Year of Birth: 1955 | | President and Trustee | | Until resignation, removal or disqualification President since 2006 | | See biography above. |
Steven M. Graziano
Touchstone Advisors, Inc.
303 Broadway
Suite 1100
Cincinnati, Ohio 45202
Year of Birth: 1954 | | Vice President | | Until resignation, removal or disqualification Vice President since 2009 | | President of Touchstone Advisors, Inc. |
Timothy D. Paulin
Touchstone Advisors, Inc.
303 Broadway
Suite 1100
Cincinnati, Ohio 45202
Year of Birth: 1963 | | Vice President | | Until resignation, removal or disqualification Vice President since 2010 | | Senior Vice President of Investment Research and Product Management of Touchstone Advisors, Inc. |
Timothy S. Stearns
Touchstone Advisors, Inc.
303 Broadway
Suite 1100
Cincinnati, Ohio 45202
Year of Birth: 1963 | | Chief Compliance Officer | | Until resignation, removal or disqualification Chief Compliance Officer since 2013 | | Chief Compliance Officer of Touchstone Advisors, Inc.; Chief Compliance Officer of Envestnet Asset Management, Inc. (2009 to 2013). |
Terrie A. Wiedenheft
Touchstone Advisors, Inc.
303 Broadway
Suite 1100
Cincinnati, Ohio 45202
Year of Birth: 1962 | | Controller and Treasurer | | Until resignation, removal or disqualification Controller and Treasurer since 2006 | | Senior Vice President, Chief Financial Officer and Chief Operations Officer, of IFS Financial Services, Inc. (a holding company). |
Ellen Blanchard
The Bank of New York
Mellon
201 Washington St, 11th Fl.
Boston, Massachusetts 02108
Year of Birth: 1973 | | Secretary | | Until resignation, removal or disqualification Secretary since 2015 | | Director of The Bank of New York Mellon |
| 1 | Each officer also holds the same office with Touchstone Funds Group Trust, Touchstone Institutional Funds Trust, and Touchstone Variable Series Trust. |
PRIVACY PROTECTION POLICY
We Respect Your Privacy
Thank you for your decision to invest with us. Touchstone and its affiliates have always placed a high value on the trust and confidence our clients place in us. We believe that confidence must be earned and validated through time. In today’s world, when technology allows the sharing of information at light speeds, trust must be reinforced by our sincere pledge to take the steps necessary to ensure that the information you share with us is treated with respect and confidentiality.
Our Pledge to Our Clients
| · | We collect only the information we need to service your account and administer our business. |
| · | We are committed to keeping your information confidential and we place strict limits and controls on the use and sharing of your information. |
| · | We make every effort to ensure the accuracy of your information. |
We Collect the Following Nonpublic Personal Information About You:
| · | Information we receive from you on or in applications or other forms, correspondence, or conversations, including, but not limited to, your name, address, phone number, social security number, assets, income and date of birth; and |
| · | Information about your transactions with us, our affiliates, or others, including, but not limited to, your account number and balance, payment history, parties to transactions, cost basis information, and other financial information. |
Categories of Information We Disclose and Parties to Whom We Disclose
We do not disclose any nonpublic personal information about our current or former clients to nonaffiliated third parties, except as required or permitted by law.
We Place Strict Limits and Controls on the Use and Sharing of Your Information
| · | We restrict access to nonpublic personal information about you to authorized employees who need the information to administer your business. |
| · | We maintain physical, electronic and procedural safeguards that comply with federal standards to protect this information. |
| · | We do not disclose any nonpublic personal information about our current or former clients to anyone, except as required or permitted by law or as described in this document. |
| · | We will not sell your personal information to anyone. |
We May Provide Information to Service Your Account
Sometimes it is necessary to provide information about you to various companies such as transfer agents, custodians, broker-dealers and marketing service firms to facilitate the servicing of your account. These organizations have a legitimate business need to see some of your personal information in order for us to provide service to you. We may disclose to these various companies the information that we collect as described above. We require that these companies, including our own subsidiaries and affiliates, strictly maintain the confidentiality of this information and abide by all applicable laws. Companies within our corporate family that may receive this information are financial service providers and insurance companies. We do not permit these associated companies to sell the information for their own purposes, and we never sell our customer information.
This policy is applicable to the following affiliated companies: Touchstone Funds Group Trust, Touchstone Strategic Trust, Touchstone Variable Series Trust, Touchstone Institutional Funds Trust, Touchstone Securities, Inc.,* and W&S Brokerage Services, Inc.
* Touchstone Securities, Inc. serves as the underwriter to the Touchstone Funds.
A Member of Western & Southern Financial Group®
The Privacy Protection Policy is not part of the Annual Report.


Touchstone Investments
Distributor
Touchstone Securities, Inc.*
303 Broadway
Cincinnati, Ohio 45202-4203
800.638.8194
www.touchstoneinvestments.com
Investment Advisor
Touchstone Advisors, Inc.*
303 Broadway
Cincinnati, Ohio 45202-4203
Transfer Agent
BNY Mellon Investment Servicing (US) Inc.
4400 Computer Drive
Westborough, Massachusetts 01581
Shareholder Service
800.543.0407
* A Member of Western & Southern Financial Group
TSF-54BB-TST-AR-1706
Item 2. Code of Ethics.
| (a) | The registrant, as of the end of the period covered by this report, has adopted a code of ethics that applies to the registrant’s principal executive officer, principal financial officer, principal accounting officer or controller, or persons performing similar functions, regardless of whether these individuals are employed by the registrant or a third party. |
| (c) | There have been no amendments, during the period covered by this report, to a provision of the code of ethics that applies to the registrant’s principal executive officer, principal financial officer, principal accounting officer or controller, or persons performing similar functions, regardless of whether these individuals are employed by the registrant or a third party, and that relates to any element of the code of ethics description. |
| (d) | The registrant has not granted any waivers, including an implicit waiver, from a provision of the code of ethics that applies to the registrant’s principal executive officer, principal financial officer, principal accounting officer or controller, or persons performing similar functions, regardless of whether these individuals are employed by the registrant or a third party, that relates to one or more of the items set forth in paragraph (b) of this item’s instructions. |
Item 3. Audit Committee Financial Expert.
The registrant’s Board of Trustees has determined that the registrant has at least one audit committee financial expert serving on its audit committee. Mr. William Gale is the registrant’s audit committee financial expert and is an independent trustee within the meaning of the Investment Company Act of 1940, as amended (the “1940 Act”).
Item 4. Principal Accountant Fees and Services.
Audit Fees
| (a) | The Audit fees totaled $150,300 and $90,900 in fiscal 2017 and 2016, respectively, including fees associated with the annual audits and filings of Form N-1A and Form N-SAR. |
Audit-Related Fees
| (b) | The aggregate fees billed in each of the last two fiscal years for assurance and related services by the principal accountant that are reasonably related to the performance of the audit of the registrant's financial statements and are not reported under paragraph (a) of this Item are $16,000 for 2017 and $1,750 for 2016. The fees for 2017 relate to the review of additional SEC filings. The fees for 2016 relate to additional audit procedures. |
Tax Fees
| (c) | The aggregate fees billed in each of the last two fiscal years for professional services rendered by the principal accountant for tax compliance, tax advice, and tax planning were $41,090 for 2017 and $29,820 for 2016. |
Fees for fiscal years ended June 30, 2017 and June 30, 2016 relate to the preparation of federal income and excise tax returns and review of capital gains distribution calculations.
All Other Fees
| (d) | The aggregate fees billed in each of the last two fiscal years for products and services provided by the principal accountant, other than the services reported in paragraphs (a) through (c) of this Item are $22,102 for 2017 and $15,676 for 2016. The fees relate to the PFIC Analyzer and Global Withholding Tax Reporter subscriptions. |
| (e)(1) | Disclose the audit committee's pre-approval policies and procedures described in paragraph (c)(7) of Rule 2-01 of Regulation S-X. |
The Audit Committee’s pre-approval policies describe the types of audit, audit-related, tax and other services that have the general pre-approval of the Audit Committee. The pre-approval policies provide that annual audit service fees, tax services not specifically granted pre-approval, services exceeding pre-approved cost levels and other services that have not received general pre-approval will be subject to specific pre-approval by the Audit Committee. The pre-approval policies further provide that the Committee may grant general pre-approval to other audit services (statutory audits and services associated with SEC registration statements, periodic reports and other documents filed with the SEC or other documents issued in connection with securities offerings), audit-related services (accounting consultations related to accounting, financial reporting or disclosure matters not classified as “audit services,” assistance with understanding and implementing new accounting and financial reporting guidance from rulemaking authorities, agreed-upon or expanded audit procedures related to accounting and/or billing records required to respond to or comply with financial, accounting or regulatory reporting matters and assistance with internal control reporting requirements under Form N-SAR and Form N-CSR), tax services that have historically been provided by the auditor that the Committee believes would not impair the independence of the auditor and are consistent with the SEC’s rules on auditor independence and permissible non-audit services classified as “all other services” that are routine and recurring services.
| (e)(2) | All of the services described in paragraphs (b) through (d) of Item 4 were approved by the Audit Committee. |
| (f) | The percentage of hours expended on the principal accountant's engagement to audit the registrant's financial statements for the most recent fiscal year that were attributed to work performed by persons other than the principal accountant's full-time, permanent employees was less than fifty percent. |
| (g) | The aggregate non-audit fees billed by the registrant's accountant for services rendered to the registrant, and rendered to the registrant's investment adviser (not including any sub-adviser whose role is primarily portfolio management and is subcontracted with or overseen by another investment adviser), and any entity controlling, controlled by, or under common control with the adviser that provides ongoing services to the registrant were $79,192 for 2017 and $47,246 for 2016. |
| (h) | The registrant's audit committee of the board of trustees has considered whether the provision of non-audit services that were rendered to the registrant's investment adviser (not including any sub-adviser whose role is primarily portfolio management and is subcontracted with or overseen by another investment adviser), and any entity controlling, controlled by, or under common control with the investment adviser that provides ongoing services to the registrant that were not pre-approved pursuant to paragraph (c)(7)(ii) of Rule 2-01 of Regulation S-X is compatible with maintaining the principal accountant's independence. |
Item 5. Audit Committee of Listed Registrants.
Not applicable.
Item 6. Investments.
| (a) | Schedule of Investments in securities of unaffiliated issuers as of the close of the reporting period is included as part of the report to shareholders filed under Item 1 of this form. |
Item 7. Disclosure of Proxy Voting Policies and Procedures for Closed-End Management Investment Companies.
Not applicable.
Item 8. Portfolio Managers of Closed-End Management Investment Companies.
Not applicable.
Item 9. Purchases of Equity Securities by Closed-End Management Investment Company and Affiliated Purchasers.
Not applicable.
Item 10. Submission of Matters to a Vote of Security Holders.
There have been no material changes to the procedures by which the shareholders may recommend nominees to the registrant’s board of trustees, where those changes were implemented after the registrant last provided disclosure in response to the requirements of Item 407(c)(2)(iv) of Regulation S-K (17 CFR 229.407) (as required by Item 22(b)(15) of Schedule 14A (17 CFR 240.14a-101)), or this Item.
Item 11. Controls and Procedures.
| (a) | The registrant’s principal executive and principal financial officers, or persons performing similar functions, have concluded that the registrant’s disclosure controls and procedures (as defined in Rule 30a-3(c) under the Investment Company Act of 1940, as amended (the “1940 Act”) (17 CFR 270.30a-3(c))) are effective, as of a date within 90 days of the filing date of the report that includes the disclosure required by this paragraph, based on their evaluation of these controls and procedures required by Rule 30a-3(b) under the 1940 Act (17 CFR 270.30a-3(b)) and Rules 13a-15(b) or 15d-15(b) under the Securities Exchange Act of 1934, as amended (17 CFR 240.13a-15(b) or 240.15d-15(b)). |
| (b) | There were no changes in the registrant’s internal control over financial reporting (as defined in Rule 30a-3(d) under the 1940 Act (17 CFR 270.30a-3(d))) that occurred during the registrant’s second fiscal quarter of the period covered by this report that has materially affected, or is reasonably likely to materially affect, the registrant’s internal control over financial reporting. |
Item 12. Exhibits.
| (a)(1) | Code of ethics, or any amendment thereto, that is the subject of disclosure required by Item 2 is attached hereto. |
| (a)(2) | Certifications pursuant to Rule 30a-2(a) under the 1940 Act and Section 302 of the Sarbanes-Oxley Act of 2002 are attached hereto. |
| (b) | Certifications pursuant to Rule 30a-2(b) under the 1940 Act and Section 906 of the Sarbanes-Oxley Act of 2002 are attached hereto. |
| (12.other) | Not applicable. |
SIGNATURES
Pursuant to the requirements of the Securities Exchange Act of 1934 and the Investment Company Act of 1940, the registrant has duly caused this report to be signed on its behalf by the undersigned, thereunto duly authorized.
(Registrant) Touchstone Strategic Trust
By (Signature and Title)* /s/Jill T. McGruder
Jill T. McGruder, President
(principal executive officer)
Date 8/18/17
Pursuant to the requirements of the Securities Exchange Act of 1934 and the Investment Company Act of 1940, this report has been signed below by the following persons on behalf of the registrant and in the capacities and on the dates indicated.
By (Signature and Title)* /s/Jill T. McGruder
Jill T. McGruder, President
(principal executive officer)
Date 8/18/17
By (Signature and Title)* /s/Terrie A. Wiedenheft
Terrie A. Wiedenheft, Controller and Treasurer
(principal financial officer)
Date 8/18/17
* Print the name and title of each signing officer under his or her signature.