UNITED STATES
SECURITIES AND EXCHANGE COMMISSION
Washington, D.C. 20549
FORM N-CSR
CERTIFIED SHAREHOLDER REPORT OF REGISTERED MANAGEMENT INVESTMENT COMPANIES
Investment Company Act file number 811-03651
Touchstone Strategic Trust – December Funds
(Exact name of registrant as specified in charter)
303 Broadway, Suite 1100
Cincinnati, Ohio 45202-4203
(Address of principal executive offices) (Zip code)
Jill T. McGruder
303 Broadway, Suite 1100
Cincinnati, Ohio 45202-4203
(Name and address of agent for service)
Registrant's telephone number, including area code: 800-638-8194
Date of fiscal year end: December 31
Date of reporting period: December 31, 2016
Form N-CSR is to be used by management investment companies to file reports with the Commission not later than 10 days after the transmission to stockholders of any report that is required to be transmitted to stockholders under Rule 30e-1 under the Investment Company Act of 1940 (17 CFR 270.30e-1). The Commission may use the information provided on Form N-CSR in its regulatory, disclosure review, inspection, and policymaking roles.
A registrant is required to disclose the information specified by Form N-CSR, and the Commission will make this information public. A registrant is not required to respond to the collection of information contained in Form N-CSR unless the Form displays a currently valid Office of Management and Budget ("OMB") control number. Please direct comments concerning the accuracy of the information collection burden estimate and any suggestions for reducing the burden to Secretary, Securities and Exchange Commission, 450 Fifth Street, NW, Washington, DC 20549-0609. The OMB has reviewed this collection of information under the clearance requirements of 44 U.S.C. § 3507.
Item 1. Reports to Stockholders.
The Report to Shareholders is attached herewith.
December 31, 2016
Annual Report
Touchstone Strategic Trust
Touchstone Dynamic Equity Fund
Touchstone Controlled Growth with Income Fund
Touchstone Dynamic Diversified Income Fund
Touchstone Dynamic Global Allocation Fund

Table of Contents
This report identifies the Funds' investments on December 31, 2016. These holdings are subject to change. Not all investments in each Fund performed the same, nor is there any guarantee that these investments will perform as well in the future. Market forecasts provided in this report may not occur.
Letter from the President
Dear Shareholder:
We are pleased to provide you with the Touchstone Strategic Trust Annual Report. Inside you will find key financial information, as well as manager commentaries, for the 12 months ended December 31, 2016.
The fiscal year was eventful, featuring volatility in energy and commodity prices, the United Kingdom’s historic vote to leave the European Union and Donald Trump’s unexpected victory in the U.S. presidential election. The U.S. economy maintained steady but moderate growth. While overall growth in gross domestic product was restrained by continued weakness in business investment, strong gains in the labor market buoyed consumer confidence and spending. With the U.S. economy already on solid ground, expectations for growth have shifted higher as a result of the incoming administration’s proposed agenda of reduced regulations, tax cuts and fiscal stimulus. Outside of the U.S., however, the economic landscape was less positive. Growth in Europe and Japan remained anemic despite monetary policy intervention from central banks. Concern over a slowdown in China’s economy led to declines in commodity prices, weakness for emerging markets and increased volatility in capital markets during early 2016.
From their mid-February bottom to the end of the year, equity markets enjoyed broad gains. The surprise outcome of the U.S. presidential election fueled a late rally in equities and other risk assets, as investors priced in higher growth driven by the new administration’s plans to lower taxes and increase fiscal spending. Small capitalization stocks in particular benefited from renewed optimism, notching significant gains and outperforming their large capitalization peers.
After the U.S. Federal Reserve Board (Fed) raised interest rates in December 2015, it went on to make dovish statements in early 2016 surrounding the pace of future rate hikes. Given weak growth and continued quantitative easing in Europe and Japan, interest rates fell throughout the first half of 2016, eventually bottoming at historic lows in early July. Forecasts for a late year rate hike and improved economic data provided the impetus for a rebound in rates in the second half of 2016. Following the presidential election, the rise in bond yields accelerated in the fourth quarter amid expectations for higher economic growth and inflation. Consistent with the risk-on environment in 2016, corporate bonds outperformed Treasuries, with high yield bonds generating especially strong gains during the period.
After a year of strong returns across many asset classes, we believe that now is a good time to evaluate your financial situation. While determining an appropriate risk/return profile and portfolio allocation is always difficult, the advice of a financial advisor can help illuminate the path to addressing your long-term investment goals.
We appreciate the opportunity you have given us and hope to remain part of your investment plan in the years to come.
Sincerely,

| Jill T. McGruder |
| President |
| Touchstone Strategic Trust |
Management's Discussion of Fund Performance (Unaudited)
Touchstone Dynamic Equity Fund
Sub-Advised by Analytic Investors, LLC
Investment Philosophy
The Fund seeks long-term capital appreciation from hedged equity investments with less risk than a fully invested, unhedged equity portfolio. A proprietary system that ranks stocks according to a quantitative model is utilized in an attempt to create a diversified and hedged portfolio, which invests in a combination of long and short stocks and options, including covered calls. A security’s intrinsic value is determined by evaluating variables such as relative valuation, price momentum, company fundamentals, liquidity and risk.
Fund Performance
The Touchstone Dynamic Equity Fund (Class A Shares) underperformed its benchmark, the S&P 500® Index, for the 12-month period ended December 31, 2016. The Fund’s total return was 4.95 percent (calculated excluding the maximum sales charge) while the total return of the benchmark was 11.96 percent.
Market Environment
U.S. equities posted double-digit gains in 2016 as represented by the S&P 500® Index. Despite some challenging matters that investors faced during the year, returns were relatively consistent as each quarter posted positive results. Investors’ concerns included Britain’s decision to exit the European Union (Brexit), the U.S. presidential election, higher interest rates and the economy in China and other emerging markets.
Although the Brexit vote led to two days of steep market losses, the market recovered nearly all of the losses in a short period of time. In addition, shortly before the U.S. presidential election, the majority of published sell-side research projected that a win by Donald Trump would be a negative catalyst for equity markets. Although the futures market initially moved lower, the equity market quickly turned around and rallied. This theme continued when the U.S. Federal Reserve Board (Fed) raised interest rates by 0.25 percent in December, which was the only increase in 2016. The increase was widely expected by investors and thus did not meaningfully impact markets.
Portfolio Review
The Fund is a hedged equity fund, with a portfolio comprised of equities and options. During the year, the equity component of the Fund posted positive returns but underperformed the S&P 500® Index. The call options component of the Fund posted negative returns as equities moved higher, but outperformed the passive option component of the CBOE S&P 500 BuyWrite Index (BXM Index).
The equity portion of the Fund is structured to be sector-, style- and beta1-neutral relative to the S&P 500® Index, thus trying to deliver outperformance through stock selection. During the year, overall stock selection detracted slightly from performance, which was led by negative results within the Consumer Discretionary and Real Estate sectors.
The Fund’s equity investment process uses a multi-characteristic approach when valuing securities. During the year, an emphasis on quality and valuation characteristics positively impacted results. Specifically, the Fund was overweight companies with above-average profit margins and return on assets. This contributed to performance, as investors rewarded these qualities. In addition, an overweight to certain stocks with strong cash flow and earnings relative to price also benefited performance. Conversely, an overweight to companies with positive analyst earnings estimates negatively impacted Fund performance during the year.
Among the individual stocks that contributed to relative performance during the calendar year were long positions in KeyCorp (Financials sector), Texas Instruments Inc. (Information Technology sector), Altria Group Inc.
Management's Discussion of Fund Performance (Unaudited) (Continued)
(Consumer Staples sector) and Verizon Communications Inc. (Telecommunication Services sector), and a short position in Palo Alto Networks Inc. (Information Technology sector). KeyCorp, a regional bank, moved higher after reporting strong third quarter revenue as its merger with First Niagara Financial Group was completed. Texas Instruments, an analog semiconductor manufacturer, moved higher after the company’s sales and profits beat analyst estimates. Texas Instruments also benefited from increased orders for its chips that are used in cars and industrial machinery. Altria Group, a cigarette and tobacco company, moved higher after the company reported strong fourth quarter earnings-per-share (EPS) growth and margin improvement in early 2016. Verizon, a broadband telecommunications company, rallied after reporting strong EPS. Investors also showed confidence in the company’s recent acquisitions, which are expected to benefit the company going forward. Palo Alto Networks, a network and enterprise security company, moved lower after the company reported weaker than expected quarterly revenues and provided disappointing guidance. In addition, the company’s fourth quarter revenue and EPS were below analyst estimates, which further impacted the stock.
Among the stocks that detracted from Fund performance were long positions in Cardinal Health Inc., Amgen Inc. (both Health Care sector), Robert Half International Inc. and Masco Corp. (both Industrials sector). Cardinal Health is a health care services company that specializes in the distribution of pharmaceuticals and medical products. Cardinal Health declined after rival pharmaceutical distributor McKesson Corp. lowered its earnings outlook for fiscal 2017 amid weak pricing trends. Amgen, a biopharmaceutical company, moved lower despite reporting better than expected quarterly results, as analysts and investors grew concerned that the company’s pricing power for its drug Enbrel® was ending. Robert Half International is a recruiting and placement firm specializing in accounting, financial and information systems positions. The stock’s price fell to historic lows after the company reported weaker than expected profit margins and an analyst downgrade. Masco is a provider of building supplies for new home and industrial construction. The stock moved sharply lower after the company reported earnings and revenue that missed analyst estimates.
Outlook
The Fund’s approach is based on the fundamental belief that there is persistency in the types of characteristics investors prefer. Thus, the sub-advisor believes the Fund should benefit from continuing to be properly positioned as such. The sub-advisor continues to emphasize stocks with certain attractive valuation characteristics, such as stocks with above-average cash flow-to-price ratios, earnings-to-price ratios and dividend yields. In addition, the sub-advisor will continue to focus on companies with what it believes to be strong quality metrics, such as stocks with above-average asset utilization and return on assets. Finally, the sub-advisor will continue to deemphasize risk as investors avoid companies with above-average risk characteristics, such as high sales and cash flow-per-share volatility.
1 Beta is a measure of the volatility of a portfolio relative to its benchmark.
Management's Discussion of Fund Performance (Unaudited) (Continued)
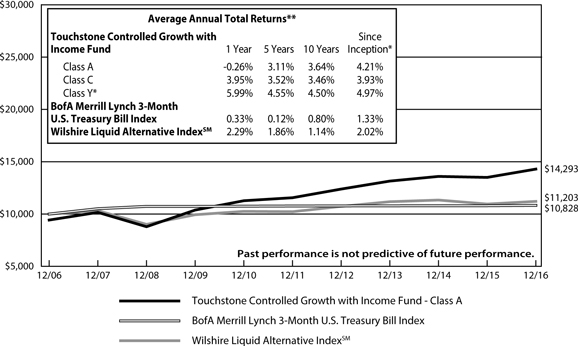
Comparison of the Change in Value of a $10,000 Investment in the Touchstone Dynamic
Equity Fund - Class A*, the S&P 500® Index and the Citigroup 3-Month T-Bill Index

| * | The chart above represents performance of Class A shares only, which will vary from the performance of Class C shares, Class Y shares and Institutional Class shares based on the differences in sales loads and fees paid by shareholders in the different classes. The inception date of Class A shares, Class C shares, Class Y shares and Institutional Class shares was March 31, 2005, March 31, 2005, July 1, 1978 and December 9, 2005, respectively. Class A shares, Class C shares and Institutional Class shares performance information was calculated using the historical performance of Class Y shares for periods prior to March 31, 2005, March 31, 2005 and December 9, 2005, respectively. The returns have been restated for sales loads and fees applicable to Class A, Class C and Institutional Class shares. The returns of the indexes listed above are based on the inception date of the Fund. |
| ** | The average annual total returns shown above are adjusted for maximum sales loads and fees, if applicable. The maximum offering price per share of Class A shares is equal to the net asset value (“NAV”) per share plus a sales load equal to 6.10% of the NAV (or 5.75% of the offering price). Class C shares are subject to a contingent deferred sales charge (“CDSC”) of 1.00%. The CDSC will be assessed on an amount equal to the lesser of (1) the NAV at the time of purchase of the shares being redeemed or (2) the NAV of such shares being redeemed, if redeemed within a one-year period from the date of purchase. Class Y shares and Institutional Class shares are not subject to sales charges. |
The performance of the above Fund does not reflect the deduction of taxes that a shareholder would pay on Fund distributions or the redemption of Fund shares.
Notes to Chart
S&P 500® Index is a group of 500 widely held stocks and is commonly regarded to be representative of the large capitalization stock universe.
Citigroup 3-Month T-Bill Index tracks the performance of U.S. Treasury Bills with a remaining maturity of three months.
Management's Discussion of Fund Performance (Unaudited)
Touchstone Controlled Growth with Income Fund
Sub-Advised by Wilshire Associates Incorporated
Investment Philosophy
The Fund is a “fund-of-funds,” which seeks to achieve its investment goal of providing investors with growth and income by investing primarily in a diversified portfolio of underlying equity, fixed-income and alternative funds (although a portion of its assets may be invested in cash, cash equivalents, or in money market funds). These underlying funds, in turn, invest in a variety of U.S. and foreign equity securities, fixed-income instruments and other investments. The Fund will allocate a significant portion of its assets to underlying funds utilizing alternative or nontraditional investment strategies, such as long-short, merger arbitrage, flexible income and credit opportunities strategies. The majority of the underlying funds in which the Fund invests will be affiliated funds; however, the Fund has the ability to invest in unaffiliated underlying funds, including exchange-traded funds (ETFs) and exchange-traded notes (ETNs), to the extent that the desired asset class exposure is not available through Touchstone Funds.
Fund Performance
The Touchstone Controlled Growth with Income Fund (Class A Shares) outperformed both of its benchmarks, the BofA Merrill Lynch 3-Month U.S. Treasury Bill Index and the Wilshire Liquid Alternative IndexSM for the 12-month period ended December 31, 2016.The Fund’s total return was 5.82 percent (calculated excluding the maximum sales charge) while the total return of the BofA Merrill Lynch 3-Month U.S. Treasury Bill Index was 0.33 percent and the total return for the Wilshire Liquid Alternative IndexSM was 2.29 percent for the same period.
Market Environment
The broad U.S. equity market posted gains during the 12-month period ended December 31, 2016, marking the eighth consecutive annual gain since the Credit Crisis of 2008. Large capitalization stocks generally underperformed smaller capitalization equities while growth stocks trailed value stocks in both the large- and small-cap spaces. Sector performance was mostly positive with the exception of the Health Care sector which finished down. The best performing sectors were Energy, Telecommunication Services and Financials.
In local currency terms, equity markets outside of the U.S. were in mostly positive territory in 2016. However, a strong U.S. dollar resulted in losses for U.S. investors in the broad European market. The European Central Bank (ECB) announced that it would be buying fewer sovereign bonds per month than previously scheduled as part of its current quantitative easing, but extended the buying period to December 2017. Japan also maintained an accommodative stance with a negative overnight rate. Emerging market equities were strong in 2016 despite a difficult finish following the U.S. election as investors feared weakening prospects for global trade and diminishing exports from emerging market countries.
After falling for much of the first half of 2016, U.S. Treasury yields reversed course and moved higher for the remainder of the year, accelerating their rise after the November election. At its December meeting, the Federal Open Market Committee (FOMC) decided to increase the overnight rate by 0.25 percent for only the second time since 2008. Credit spreads widened in the first half of the first quarter in short-lived risk-off selling, but subsequently tightened across both investment grade and high yield bonds throughout the rest of 2016 as sentiment turned more positive. U.S. Treasury Inflation Protected Securities (TIPS) yielded strong returns for the year despite uncertainty over U.S. Federal Reserve Board (Fed) policy and stubbornly-low breakeven inflation statistics as investor outlook favored higher forecast inflation and increased exposure to inflation-linked bonds.
Management's Discussion of Fund Performance (Unaudited) (Continued)
Real estate securities were positive during 2016, both in the U.S. and globally. Commodities were up for the year as crude oil and natural gas prices rose significantly. Master Limited Partnership (MLP) returns were positive as the sector benefitted from an agreement by oil producers that is aimed at balancing supply and demand.
Portfolio Review
During 2016, the Fund’s top performers were Touchstone Credit Opportunities Fund, Touchstone Arbitrage Fund and Touchstone Dynamic Equity Fund. Touchstone Credit Opportunities Fund was the leading contributor as high yield credit positions continued to rally during the latter half of the year alongside equities. The equity and high yield credit rally occurred following the surprise Brexit vote in late June. Despite the unknowns of how Brexit would be implemented, U.S. equities and high yield bonds rose. This rally also provided a tailwind for the Touchstone Dynamic Equity Fund. The Touchstone Arbitrage Fund, which invests in mergers and acquisitions (M&A), generated solid returns during a year which saw a strong supply of announced M&A deals and few broken or cancelled deals.
Throughout the year, a few notable changes were made to the Fund’s holdings. In June, there were two noteworthy changes. The allocation to Touchstone Large Cap Fund was reduced and an allocation to Touchstone Premium Yield Equity Fund was initiated in order to implement a bias towards U.S. value style equities. The second change was a reduction in the Touchstone Dynamic Equity Fund and an increase to Touchstone Flexible Income Fund, which was done in order to reduce the equity beta1 of the portfolio and increase the defensiveness. In the third quarter, following the Brexit vote, the equity risk in the Fund was reduced in exchange for high yield credit risk. This decision was based upon concern surrounding the unknowns of how Brexit will be implemented and the impact those unknowns could have on economic growth and equity market returns. By allocating to high yield credit, the Fund seeks to keep pace with global equities during a modestly rising equity environment, while outperforming during a flat market and adding protection if equities sell off.
Outlook
Although global equities are not cheap, there is little concern of a recession in the near term across most of the world’s major economies. Coupled with generally accommodative central banks, the sub-advisor believes that most asset classes are likely to avoid a short-term drawdown. Although the Fund has modestly reduced risk relative to long-term targets, it seeks to remain invested in risk assets. The sub-advisor believes opportunities are more attractive in lower beta, less economically sensitive equities and also finds fixed income investments with a high coupon to be attractive, since the coupon payment provides income without relying solely on capital appreciation to generate returns.
Domestic equities appear to be fully priced and although the outlook for domestic economic growth is promising, any negative surprise may be met by a negative market reaction. Potential events that could negatively impact the Fund may include disappointing economic stimulus from the U.S. Congress and the incoming administration, which could be manifested through underwhelming spending measures, an inability to consummate an agreement that reduces personal and corporate tax rates, an inability to pass a measure that allows a repatriation of offshore corporate cash or a failure to reduce the regulatory burden across the various sectors. The market appears to be pricing in some optimism regarding the actions listed above. Another risk would be the Fed raising interest rates more quickly, or in a more pronounced manner, than the market expects. Given elevated forward price/earnings (P/E) levels, any disappointment in U.S. corporate earnings growth is likely to be interpreted negatively.
The sub-advisor believes the Fund is positioned well for an equity market sell-off and in a volatile, but generally flat market environment. The majority of the Fund’s investments are to funds that employ defensive or dynamic equity or credit trading strategies. There is also some modest, consistent long-only equity beta that provides the potential for the Fund to participate in a strong domestic equity rally, if one occurs.
1 Beta is a measure of the volatility of a portfolio relative to its benchmark.
Management's Discussion of Fund Performance (Unaudited) (Continued)
Comparison of the Change in Value of a $10,000 Investment in the
Touchstone Controlled Growth with Income Fund – Class A*, the BofA Merrill Lynch 3-Month
U.S. Treasury Bill Index and the Wilshire Liquid Alternative IndexSM
| * | The chart above represents performance of Class A shares only, which will vary from the performance of Class C shares and Class Y shares based on the differences in sales loads and fees paid by shareholders in the different classes. The inception date of Class A shares, Class C shares and Class Y shares was September 30, 2004, September 30, 2004 and December 9, 2005, respectively. Class Y shares performance information is calculated using the historical performance of the Fund's Institutional Class shares, with an inception date of September 30, 2004, for periods prior to December 9, 2005. On November 23, 2015, Institutional Class shares were converted to Class Y shares. The returns have been restated for fees applicable to Class Y shares. The returns of the indexes listed above are based on the inception date of the Fund. |
| ** | The average annual total returns shown above are adjusted for maximum sales loads and fees, if applicable. The maximum offering price per share of Class A shares is equal to the net asset value (“NAV”) per share plus a sales load equal to 6.10% of the NAV (or 5.75% of the offering price). Class C shares are subject to a contingent deferred sales charge (“CDSC”) of 1.00%. The CDSC will be assessed on an amount equal to the lesser of (1) the NAV at the time of purchase of the shares being redeemed or (2) the NAV of such shares being redeemed, if redeemed within a one-year period from the date of purchase. Class Y shares are not subject to sales charges. |
The performance of the above Fund does not reflect the deduction of taxes that a shareholder would pay on Fund distributions or the redemption of Fund shares.
Notes to Chart
BofA Merrill Lynch 3-Month U.S. Treasury Bill Index is an unmanaged index of treasury securities maturing in 90 days that assumes reinvestment of all income.
Wilshire Liquid Alternative IndexSM is an unmanaged index designed to provide a broad measure of the performance of the liquid alternative market.
Management's Discussion of Fund Performance (Unaudited)
Touchstone Dynamic Diversified Income Fund
Sub-Advised by Wilshire Associates Incorporated
Investment Philosophy
The Fund is a “fund-of-funds,” which seeks to achieve its investment goal of providing investors with current income by investing primarily in a diversified portfolio of fixed-income and equity-income oriented underlying funds (although a portion of its assets may be invested in cash, cash equivalents, or in money market funds). The majority of the underlying funds in which the Fund invests will be affiliated funds; however, the Fund has the ability to invest in unaffiliated underlying funds, including exchange-traded funds (ETFs) and exchange-traded notes (ETNs), to the extent that the desired asset class exposure is not available through Touchstone Funds.
Fund Performance
The Touchstone Dynamic Diversified Income Fund (Class A Shares) outperformed both of its benchmarks, the Bloomberg Barclays U.S. Aggregate Bond Index and MSCI All Country World Index for the 12-month period ended December 31, 2016. The Fund’s total return was 8.81 percent (calculated excluding the maximum sales charge) while the total return of the Bloomberg Barclays U.S. Aggregate Bond Index was 2.65 percent and the total return of the MSCI All Country World Index was 7.86 percent for the same period.
Market Environment
The broad U.S. equity market posted gains during the 12-month period ended December 31, 2016, marking the eighth consecutive annual gain since the Credit Crisis of 2008. Large capitalization stocks generally underperformed smaller capitalization equities while growth stocks trailed value stocks in both the large- and small-cap spaces. Sector performance was mostly positive with the exception of the Health Care sector which finished down. The best performing sectors were Energy, Telecommunication Services and Financials.
In local currency terms, equity markets outside of the U.S. were in mostly positive territory in 2016. However, a strong U.S. dollar resulted in losses for U.S. investors in the broad European market. The European Central Bank (ECB) announced that it would be buying fewer sovereign bonds per month than previously scheduled as part of its current quantitative easing, but extended the buying period to December 2017. Japan also maintained an accommodative stance with a negative overnight rate. Emerging market equities were strong in 2016 despite a difficult finish following the U.S. election as investors feared weakening prospects for global trade and diminishing exports from emerging market countries.
After falling for much of the first half of 2016, U.S. Treasury yields reversed course and moved higher for the remainder of the year, accelerating their rise after the November election. At its December meeting, the Federal Open Market Committee (FOMC) decided to increase the overnight rate by 0.25 percent for only the second time since 2008. Credit spreads widened in the first half of the first quarter in short-lived risk-off selling, but subsequently tightened across both investment grade and high yield bonds throughout the rest of 2016 as sentiment turned more positive. U.S. Treasury Inflation Protected Securities (TIPS) yielded strong returns for the year despite uncertainty over U.S. Federal Reserve Board (Fed) policy and stubbornly-low breakeven inflation statistics as investor outlook favored higher forecast inflation and increased exposure to inflation-linked bonds.
Real estate securities were positive during 2016, both in the U.S. and globally. Commodities were up for the year as crude oil and natural gas prices rose significantly. Master Limited Partnership (MLP) returns were positive as the sector benefitted from an agreement by oil producers that is aimed at balancing supply and demand.
Portfolio Review
During 2016, the Fund’s strong performance was attributable to the Touchstone Credit Opportunities Fund, Touchstone High Yield Fund and Touchstone Premium Yield Equity Fund. All three funds were leading contributors
Management's Discussion of Fund Performance (Unaudited) (Continued)
as high yield credit positions continued to rally during the latter half of the year alongside equities. The equity and high yield credit rally occurred following the surprise Brexit vote in late June. Despite the unknowns of how Brexit would be implemented, U.S. equities and high yield bonds rose. The Touchstone Credit Opportunities Fund and Touchstone High Yield Fund benefitted from the credit rally while the Touchstone Premium Yield Equity Fund benefitted from the equity rally.
There were some changes made to the Fund’s holdings during the year. In February, a noteworthy change was made, reducing the allocation to Touchstone Premium Yield Equity Fund and initiating an allocation to the Touchstone Value Fund. This change increased overall portfolio diversification and served to increase the allocation to lower beta1 U.S. large-cap equities and reduce the exposure to U.S. mid-cap equities and real estate investment trusts (REITs). In June, a series of small allocation changes were made to mildly decrease risk, but overall the Fund remained mostly unchanged during the quarter. Credit risk was reduced and a small allocation was moved from international equities and into international REITs as our outlook for REITs improved due to reduced prospects of interest rate hikes. In the third quarter, following the Brexit vote, the Fund chose to reduce equity risk in exchange for credit risk. This decision was based upon concern surrounding the unknowns of how Brexit would be implemented and the impact those unknowns could have on economic growth and equity market returns. By allocating to high yield credit, the Fund is seeking to keep pace with global equities during a modestly rising equity environment, while outperforming during a flat market and adding protection if equities sell off. Given the Fund’s existing overweight to credit securities, the sub-advisor sought to reduce overall portfolio risk by increasing the allocation to Touchstone Total Return Bond Fund and reducing exposure to international value equities.
Outlook
Although global equities are not cheap, there is little concern of a recession in the near term across most of the world’s major economies. Coupled with generally accommodative central banks, the sub-advisor believes that most asset classes are likely to avoid a short-term drawdown. Although the Fund has modestly reduced risk relative to long-term targets, it seeks to remain invested in risk assets. The sub-advisor believes opportunities are more attractive in lower beta, less economically sensitive equities and also finds fixed income investments with a high coupon to be attractive, since the coupon payment provides income without relying solely on capital appreciation to generate returns.
Domestic equities appear to be fully priced and although the outlook for domestic economic growth is promising, any negative surprise may be met by a negative market reaction. Potential events that could negatively impact the Fund may include disappointing economic stimulus from the U.S. Congress and the incoming administration, which could be manifested through underwhelming spending measures, an inability to consummate an agreement that reduces personal and corporate tax rates, an inability to pass a measure that allows a repatriation of offshore corporate cash or a failure to reduce the regulatory burden across the various sectors. The market appears to be pricing in some optimism regarding the actions listed above. Another risk would be the Fed raising interest rates more quickly, or in a more pronounced manner, than the market expects. Given elevated forward price/earnings (P/E) levels, any disappointment in U.S. corporate earnings growth is likely to be interpreted negatively.
The sub-advisor believes the Fund is positioned well for an equity market sell-off and in a volatile, but generally flat market environment. The majority of the Fund’s investments are to funds that employ defensive or dynamic equity or credit trading strategies. There is also some modest, consistent long-only equity beta that provides the potential for the Fund to participate in a strong domestic equity rally, if one occurs.
1 Beta is a measure of the volatility of a portfolio relative to its benchmark.
Management's Discussion of Fund Performance (Unaudited) (Continued)
Comparison of the Change in Value of a $10,000 Investment in the
Touchstone Dynamic Diversified Income Fund – Class A*, the Bloomberg Barclays U.S. Aggregate
Bond Index and the MSCI All Country World Index
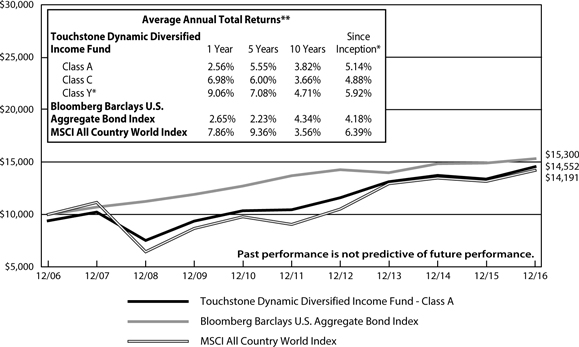
| * | The chart above represents performance of Class A shares only, which will vary from the performance of Class C shares and Class Y shares based on the differences in sales loads and fees paid by shareholders in the different classes. The inception date of Class A shares, Class C shares and Class Y shares was September 30, 2004, September 30, 2004 and December 9, 2005, respectively. Class Y shares performance information is calculated using the historical performance of the Fund's Institutional Class shares, with an inception date of September 30, 2004, for periods prior to December 9, 2005. On November 23, 2015, Institutional Class shares were converted to Class Y shares. The returns have been restated for fees applicable to Class Y shares. The returns of the indexes listed above are based on the inception date of the Fund. |
| ** | The average annual total returns shown above are adjusted for maximum sales loads and fees, if applicable. The maximum offering price per share of Class A shares is equal to the net asset value (“NAV”) per share plus a sales load equal to 6.10% of the NAV (or 5.75% of the offering price). Class C shares are subject to a contingent deferred sales charge (“CDSC”) of 1.00%. The CDSC will be assessed on an amount equal to the lesser of (1) the NAV at the time of purchase of the shares being redeemed or (2) the NAV of such shares being redeemed, if redeemed within a one-year period from the date of purchase. Class Y shares are not subject to sales charges. |
The performance of the above Fund does not reflect the deduction of taxes that a shareholder would pay on Fund distributions or the redemption of Fund shares.
Notes to Chart
Bloomberg Barclays U.S. Aggregate Bond Index is an unmanaged index comprised of U.S. investment grade, fixed rate bond market securities, including government, government agency, corporate and mortgage-backed securities between one and ten years.
MSCI All Country World Index is an unmanaged index that measures the equity market performance of developed and emerging markets.
Source: MSCI. MSCI makes no express or implied warranties or representations and shall have no liability whatsoever with respect to any MSCI data contained herein. The MSCI data may not be further redistributed or used to create indices or financial products. This report is not approved or produced by MSCI.
Management's Discussion of Fund Performance (Unaudited)
Touchstone Dynamic Global Allocation Fund
Sub-Advised by Wilshire Associates Incorporated
Investment Philosophy
The Fund is a “fund-of-funds,” which seeks to achieve its investment goal of providing investors with capital appreciation by primarily investing in a diversified portfolio of underlying equity and fixed-income funds. These underlying funds, in turn, invest in a variety of U.S. and foreign equity and fixed-income securities (although a portion of its assets may be invested in cash, cash equivalents, or in money market funds). The majority of the underlying funds in which the Fund invests will be affiliated funds; however, the Fund has the ability to invest in unaffiliated underlying funds, including exchange-traded funds (ETFs) and exchange-traded notes (ETNs), to the extent that the desired asset class exposure is not available through Touchstone Funds. Under normal circumstances, the Fund (through its investment in underlying funds) will invest at least 40% of its portfolio in securities of issuers outside of the U.S.
Fund Performance
Touchstone Dynamic Global Allocation Fund (Class A Shares) underperformed its first benchmark, the MSCI All Country World Index, and outperformed its second benchmark, the Bloomberg Barclays Global Aggregate Index, for the 12-month period ended December 31, 2016.The Fund’s total return was 2.80 percent (calculated excluding the maximum sales charge) while the total return of the MSCI All Country World Index was 7.86 percent and the total return of the Bloomberg Barclays Global Aggregate Index was 2.09 percent.
Market Environment
The broad U.S. equity market posted gains during the 12-month period ended December 31, 2016, marking the eighth consecutive annual gain since the Credit Crisis of 2008. Large capitalization stocks generally underperformed smaller capitalization equities while growth stocks trailed value stocks in both the large- and small-cap spaces. Sector performance was mostly positive with the exception of the Health Care sector which finished down. The best performing sectors were Energy, Telecommunication Services and Financials.
In local currency terms, equity markets outside of the U.S. were in mostly positive territory in 2016. However, a strong U.S. dollar resulted in losses for U.S. investors in the broad European market. The European Central Bank (ECB) announced that it would be buying fewer sovereign bonds per month than previously scheduled as part of its current quantitative easing, but extended the buying period to December 2017. Japan also maintained an accommodative stance with a negative overnight rate. Emerging market equities were strong in 2016 despite a difficult finish following the U.S. election as investors feared weakening prospects for global trade and diminishing exports from emerging market countries.
After falling for much of the first half of 2016, U.S. Treasury yields reversed course and moved higher for the remainder of the year, accelerating their rise after the November election. At its December meeting, the Federal Open Market Committee (FOMC) decided to increase the overnight rate by 0.25 percent for only the second time since 2008. Credit spreads widened in the first half of the first quarter in short-lived risk-off selling, but subsequently tightened across both investment grade and high yield bonds throughout the rest of 2016 as sentiment turned more positive. U.S. Treasury Inflation Protected Securities (TIPS) yielded strong returns for the year despite uncertainty over U.S. Federal Reserve Board (Fed) policy and stubbornly-low breakeven inflation statistics as investor outlook favored higher forecast inflation and increased exposure to inflation-linked bonds.
Real estate securities were positive during 2016, both in the U.S. and globally. Commodities were up for the year as crude oil and natural gas prices rose significantly. Master Limited Partnership (MLP) returns were positive as the sector benefitted from an agreement by oil producers that is aimed at balancing supply and demand.
Management's Discussion of Fund Performance (Unaudited) (Continued)
Portfolio Review
The Fund’s allocation to equities was the largest detractor from performance during the year. Within U.S. equities, the Fund’s overweight to the Touchstone Value Fund was the biggest contributor to performance while its allocation to Touchstone Sands Capital Institutional Growth Fund had the largest negative impact on performance. All of the Fund’s non-U.S. equity allocations detracted from relative performance. The Fund’s allocation to the Touchstone Dynamic Equity Fund and Real Estate was additive during the year. The Fund’s allocation to fixed income outperformed the Bloomberg Barclays Global Aggregate Index. The overweight to credit led to the outperformance as Touchstone Credit Opportunities Fund and Touchstone High Yield Fund made positive contributions.
During the year, the Fund moved to overweight emerging markets equities versus foreign developed equities. The sub-advisor believed that the improved stability of commodities prices, improving fundamentals and attractive valuations relative to developed market equities was beneficial for emerging markets equities. The Fund’s beta1 to global equities was substantially reduced in an effort to enhance portfolio protection if a risk-off scenario occurred. The changes made to the Fund increased portfolio diversification, reduced equity market risk and reduced the exposure to foreign developed equities. Within fixed income, the Fund increased positioning in investment grade fixed income versus lower quality credit based on rising global risk. Credit, however, continued to offer attractive spreads relative to investment grade fixed income and in the sub-advisor’s view it was not prudent to materially underweight credit.
Outlook
Although global equities are not cheap, there is little concern of a recession in the near term across most of the world’s major economies. Coupled with generally accommodative central banks, the sub-advisor believes that most asset classes are likely to avoid a short-term drawdown. Although the Fund has modestly reduced risk relative to long-term targets, it seeks to remain invested in risk assets. The sub-advisor believes opportunities are more attractive in lower beta, less economically sensitive equities and also finds fixed income investments with a high coupon to be attractive, since the coupon payment provides income without relying solely on capital appreciation to generate returns.
Domestic equities appear to be fully priced and although the outlook for domestic economic growth is promising, any negative surprise may be met by a negative market reaction. Potential events that could negatively impact the Fund may include disappointing economic stimulus from U.S. Congress and the incoming administration, which could be manifested through underwhelming spending measures, an inability to consummate an agreement that reduces personal and corporate tax rates, an inability to pass a measure that allows a repatriation of offshore corporate cash or a failure to reduce the regulatory burden across the various sectors. The market appears to be pricing in some optimism regarding the actions listed above. Another risk would be the Fed raising interest rates more quickly, or in a more pronounced manner, than the market expects. Given elevated forward price/earnings (P/E) levels, any disappointment in U.S. corporate earnings growth is likely to be interpreted negatively.
The sub-advisor believes the Fund is positioned well for an equity market sell-off and in a volatile, but generally flat market environment. The majority of the Fund’s investments are to managers that employ defensive or dynamic equity or credit trading strategies. There is also some modest, consistent long-only equity beta that provides the potential for the Fund to participate in a strong domestic equity rally, if one occurs.
1 Beta is a measure of the volatility of a portfolio relative to its benchmark.
Management's Discussion of Fund Performance (Unaudited) (Continued)
Comparison of the Change in Value of a $10,000 Investment in the
Touchstone Dynamic Global Allocation Fund - Class A*, the MSCI All Country World Index
and the Bloomberg Barclays Global Aggregate Index
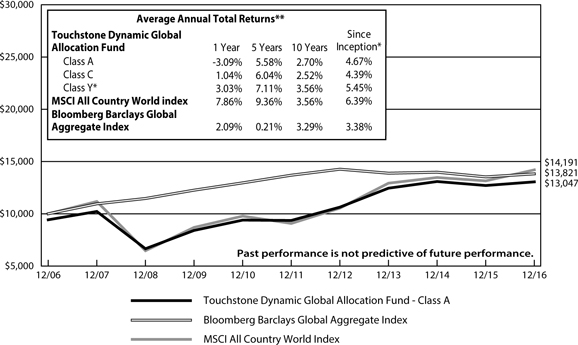
| * | The chart above represents performance of Class A shares only, which will vary from the performance of Class C shares and Class Y shares based on the differences in sales loads and fees paid by shareholders in the different classes. The inception date of Class A shares, Class C shares and Class Y shares was September 30, 2004, September 30, 2004 and December 9, 2005, respectively. Class Y shares performance information is calculated using the historical performance of the Fund's Institutional Class shares, with an inception date of September 30, 2004, for periods prior to December 9, 2005. On November 23, 2015, Institutional Class shares were converted to Class Y shares. The returns have been restated for fees applicable to Class Y shares. The returns of the indexes listed above are based on the inception date of the Fund. |
| ** | The average annual total returns shown above are adjusted for maximum sales loads and fees, if applicable. The maximum offering price per share of Class A shares is equal to the net asset value (“NAV”) per share plus a sales load equal to 6.10% of the NAV (or 5.75% of the offering price). Class C shares are subject to a contingent deferred sales charge (“CDSC”) of 1.00%. The CDSC will be assessed on an amount equal to the lesser of (1) the NAV at the time of purchase of the shares being redeemed or (2) the NAV of such shares being redeemed, if redeemed within a one-year period from the date of purchase. Class Y shares are not subject to sales charges. |
The performance of the above Fund does not reflect the deduction of taxes that a shareholder would pay on Fund distributions or the redemption of Fund shares.
Notes to Chart
MSCI All Country World Index is an unmanaged index that measures the equity market performance of developed and emerging markets.
Bloomberg Barclays Global Aggregate Index is an unmanaged index that measures global investment grade debt from twenty-four local currency markets. This multi-currency benchmark includes treasury, government-related, corporate and securitized fixed-rate bonds from both developed and emerging markets issuers.
Source: MSCI. MSCI makes no express or implied warranties or representations and shall have no liability whatsoever with respect to any MSCI data contained herein. The MSCI data may not be further redistributed or used to create indices or financial products. This report is not approved or produced by MSCI.
Tabular Presentation of Portfolios of Investments (Unaudited)
December 31, 2016
The tables below provide each Fund’s sector allocation. We hope it will be useful to shareholders as it summarizes key information about each Fund’s investments.
| Touchstone Dynamic Equity Fund | | | |
| Sector Allocation* | | (% of Net Assets) | |
| Long Positions | | | | |
| Common Stocks | | | | |
| Information Technology | | | 21.7 | % |
| Financials | | | 16.8 | |
| Health Care | | | 16.7 | |
| Consumer Discretionary | | | 16.6 | |
| Industrials | | | 11.7 | |
| Consumer Staples | | | 10.5 | |
| Energy | | | 7.6 | |
| Telecommunication Services | | | 5.4 | |
| Real Estate | | | 4.0 | |
| Utilities | | | 3.4 | |
| Materials | | | 1.8 | |
| Investment Fund | | | 3.0 | |
| Other Assets/Liabilities (Net) | | | 1.1 | |
| | | | 120.3 | % |
| Short Positions | | | | |
| Common Stocks | | | | |
| Consumer Discretionary | | | (4.8 | )% |
| Financials | | | (3.6 | ) |
| Health Care | | | (3.2 | ) |
| Information Technology | | | (2.7 | ) |
| Energy | | | (1.9 | ) |
| Telecommunication Services | | | (1.9 | ) |
| Consumer Staples | | | (0.6 | ) |
| Industrials | | | (0.3 | ) |
| Written Call and Put Options | | | (1.3 | ) |
| | | | (20.3 | )% |
| Total | | | 100.0 | % |
| Touchstone Controlled Growth with Income Fund |
| Sector Allocation | | (% of Net Assets) | |
| Affiliated Mutual Funds | | | | |
| Alternative Funds | | | 47.3 | % |
| Fixed Income Funds | | | 45.9 | |
| Equity Funds | | | 5.1 | |
| Investment Fund | | | 1.0 | |
| Other Assets/Liabilities (Net) | | | 0.7 | |
| Total | | | 100.0 | % |
| Touchstone Dynamic Diversified Income Fund |
| Sector Allocation | | (% of Net Assets) | |
| Affiliated Mutual Funds | | | | |
| Fixed Income Funds | | | 62.4 | % |
| Equity Funds | | | 18.4 | |
| Exchange Traded Funds | | | 12.0 | |
| Exchange Traded Notes | | | 6.3 | |
| Investment Fund | | | 1.0 | |
| Other Assets/Liabilities (Net) | | | (0.1 | ) |
| Total | | | 100.0 | % |
| Touchstone Dynamic Global Allocation Fund | | | |
| Sector Allocation | | (% of Net Assets) | |
| Affiliated Mutual Funds | | | | |
| Equity Funds | | | 45.3 | % |
| Fixed Income Funds | | | 29.6 | |
| Alternative Fund | | | 8.1 | |
| Exchange Traded Funds | | | 16.2 | |
| Investment Fund | | | 1.0 | |
| Other Assets/Liabilities (Net) | | | (0.2 | ) |
| Total | | | 100.0 | % |
* Sector classifications are based upon the Global Industry Classification Standard (GICS®).
Portfolio of Investments
Touchstone Dynamic Equity Fund – December 31, 2016
| | | | | | Market | |
| | | Shares | | | Value | |
| | | | | | | |
| Common Stocks †† — 116.2% | | | | | | | | |
| | | | | | | | | |
| Information Technology — 21.7% | | | | | | | | |
| Accenture PLC (Ireland) - Class A | | | 26,174 | | | $ | 3,065,761 | |
| Amdocs Ltd. | | | 40,243 | | | | 2,344,155 | |
| Apple, Inc. | | | 21,389 | | | | 2,477,274 | |
| CA, Inc. | | | 10,592 | | | | 336,508 | |
| Cisco Systems, Inc. | | | 151,551 | | | | 4,579,871 | |
| Fortinet, Inc.* | | | 12,560 | | | | 378,307 | |
| Hewlett Packard Enterprise Co. | | | 124,273 | | | | 2,875,677 | |
| Intel Corp. | | | 132,330 | | | | 4,799,609 | |
| Leidos Holdings, Inc. | | | 20,211 | | | | 1,033,591 | |
| Linear Technology Corp. | | | 1,761 | | | | 109,798 | |
| Microsoft Corp. | | | 24,244 | | | | 1,506,522 | |
| Oracle Corp. | | | 120,560 | | | | 4,635,532 | |
| Qualcomm, Inc. | | | 8,247 | | | | 537,704 | |
| Skyworks Solutions, Inc. | | | 2,884 | | | | 215,319 | |
| Texas Instruments, Inc. | | | 16,851 | | | | 1,229,617 | |
| Xerox Corp. | | | 110,469 | | | | 964,394 | |
| | | | | | | | 31,089,639 | |
| | | | | | | | | |
| Financials — 16.8% | | | | | | | | |
| Ameriprise Financial, Inc. | | | 15,203 | | | | 1,686,621 | |
| Bank of America Corp. | | | 111,053 | | | | 2,454,271 | |
| Bank of New York Mellon Corp. (The) | | | 19,357 | | | | 917,135 | |
| Discover Financial Services | | | 4,144 | | | | 298,741 | |
| Donnelley Financial Solutions, Inc.* | | | 29,968 | | | | 688,665 | |
| Federated Investors, Inc. - Class B | | | 81,756 | | | | 2,312,060 | |
| First American Financial Corp. | | | 16,289 | | | | 596,666 | |
| Huntington Bancshares, Inc. | | | 207,928 | | | | 2,748,808 | |
| Invesco Ltd. | | | 9,544 | | | | 289,565 | |
| JPMorgan Chase & Co. | | | 7,212 | | | | 622,323 | |
| KeyCorp | | | 76,173 | | | | 1,391,681 | |
| Navient Corp. | | | 67,948 | | | | 1,116,386 | |
| Popular, Inc. (Puerto Rico) | | | 23,903 | | | | 1,047,429 | |
| Synchrony Financial | | | 91,368 | | | | 3,313,917 | |
| US Bancorp | | | 90,936 | | | | 4,671,382 | |
| | | | | | | | 24,155,650 | |
| | | | | | | | | |
| Health Care — 16.7% | | | | | | | | |
| AbbVie, Inc. | | | 35,400 | | | | 2,216,748 | |
| Amgen, Inc. | | | 23,721 | | | | 3,468,247 | |
| Baxter International, Inc. | | | 19,209 | | | | 851,727 | |
| Cardinal Health, Inc. | | | 7,100 | | | | 510,987 | |
| Cigna Corp. | | | 1,386 | | | | 184,879 | |
| Express Scripts Holding Co.* | | | 7,451 | | | | 512,554 | |
| Gilead Sciences, Inc. | | | 37,778 | | | | 2,705,283 | |
| HCA Holdings, Inc.* | | | 10,216 | | | | 756,188 | |
| Humana, Inc. | | | 749 | | | | 152,818 | |
| Johnson & Johnson | | | 44,260 | | | | 5,099,195 | |
| Merck & Co., Inc. | | | 31,614 | | | | 1,861,116 | |
| Pfizer, Inc. | | | 134,088 | | | | 4,355,178 | |
| Seattle Genetics, Inc.* | | | 3,235 | | | | 170,711 | |
| St Jude Medical, Inc. | | | 1,131 | | | | 90,695 | |
| UnitedHealth Group, Inc. | | | 6,239 | | | | 998,490 | |
| | | | | | | | 23,934,816 | |
| Consumer Discretionary — 16.6% | | | | | | | | |
| Amazon.com, Inc.* | | | 2,283 | | | | 1,711,953 | |
| Best Buy Co., Inc. | | | 25,551 | | | | 1,090,261 | |
| Brunswick Corp. | | | 9,502 | | | | 518,239 | |
| Cinemark Holdings, Inc. | | | 8,867 | | | | 340,138 | |
| Dick's Sporting Goods, Inc. | | | 5,188 | | | | 275,483 | |
| Ford Motor Co. | | | 26,199 | | | | 317,794 | |
| General Motors Co. | | | 12,695 | | | | 442,294 | |
| Genuine Parts Co. | | | 1,702 | | | | 162,609 | |
| Home Depot, Inc. (The) | | | 21,479 | | | | 2,879,904 | |
| Interpublic Group of Cos, Inc. (The) | | | 93,692 | | | | 2,193,330 | |
| Macy's, Inc. | | | 38,801 | | | | 1,389,464 | |
| Michael Kors Holdings Ltd. (United Kingdom)* | | | 18,807 | | | | 808,325 | |
| Murphy USA, Inc.* | | | 425 | | | | 26,125 | |
| Omnicom Group, Inc. | | | 27,775 | | | | 2,363,930 | |
| Starbucks Corp. | | | 15,417 | | | | 855,952 | |
| Target Corp. | | | 19,030 | | | | 1,374,537 | |
| Time Warner, Inc. | | | 33,109 | | | | 3,196,012 | |
| Walt Disney Co. (The) | | | 7,776 | | | | 810,415 | |
| Williams-Sonoma, Inc. | | | 18,934 | | | | 916,215 | |
| Yum China Holdings, Inc.* | | | 1,603 | | | | 41,870 | |
| Yum! Brands, Inc. | | | 33,089 | | | | 2,095,526 | |
| | | | | | | | 23,810,376 | |
| | | | | | | | | |
| Industrials — 11.7% | | | | | | | | |
| 3M Co. | | | 16,311 | | | | 2,912,655 | |
| B/E Aerospace, Inc. | | | 1,631 | | | | 98,170 | |
| Eaton Corp. PLC (Ireland) | | | 11,906 | | | | 798,774 | |
| HD Supply Holdings, Inc.* | | | 9,882 | | | | 420,084 | |
| Honeywell International, Inc. | | | 12,193 | | | | 1,412,559 | |
| Illinois Tool Works, Inc. | | | 8,173 | | | | 1,000,866 | |
| LSC Communications, Inc. | | | 18,075 | | | | 536,466 | |
| ManpowerGroup, Inc. | | | 18,110 | | | | 1,609,436 | |
| Masco Corp. | | | 47,456 | | | | 1,500,559 | |
| Pitney Bowes, Inc. | | | 106,167 | | | | 1,612,677 | |
| Raytheon Co. | | | 15,522 | | | | 2,204,124 | |
| Robert Half International, Inc. | | | 23,188 | | | | 1,131,111 | |
| Southwest Airlines Co. | | | 21,869 | | | | 1,089,951 | |
| United Technologies Corp. | | | 3,604 | | | | 395,070 | |
| | | | | | | | 16,722,502 | |
| | | | | | | | | |
| Consumer Staples — 10.5% | | | | | | | | |
| Altria Group, Inc. | | | 17,138 | | | | 1,158,872 | |
| Colgate-Palmolive Co. | | | 3,057 | | | | 200,050 | |
| Ingredion, Inc. | | | 10,682 | | | | 1,334,823 | |
| Nu Skin Enterprises, Inc. - Class A | | | 5,469 | | | | 261,309 | |
| PepsiCo, Inc. | | | 29,870 | | | | 3,125,298 | |
| Philip Morris International, Inc. | | | 52,007 | | | | 4,758,120 | |
| Reynolds American, Inc. | | | 4,697 | | | | 263,220 | |
| Wal-Mart Stores, Inc. | | | 56,693 | | | | 3,918,620 | |
| | | | | | | | 15,020,312 | |
| | | | | | | | | |
| Energy — 7.6% | | | | | | | | |
| Chesapeake Energy Corp.* | | | 46,725 | | | | 328,010 | |
| ConocoPhillips | | | 53,107 | | | | 2,662,785 | |
| Continental Resources, Inc.* | | | 7,032 | | | | 362,429 | |
| Marathon Petroleum Corp. | | | 57,346 | | | | 2,887,371 | |
| ONEOK, Inc. | | | 10,119 | | | | 580,932 | |
Touchstone Dynamic Equity Fund (Continued)
| | | | | | Market | |
| | | Shares | | | Value | |
| | | | | | | |
| Common Stocks †† — 116.2% (Continued) | | | | | | | | |
| | | | | | | | | |
| Energy — (Continued) | | | | | | | | |
| Phillips 66 | | | 23,135 | | | $ | 1,999,095 | |
| Rice Energy, Inc.* | | | 4,936 | | | | 105,384 | |
| Spectra Energy Corp. | | | 3,203 | | | | 131,611 | |
| World Fuel Services Corp. | | | 39,882 | | | | 1,830,983 | |
| | | | | | | | 10,888,600 | |
| | | | | | | | | |
| Telecommunication Services — 5.4% | | | | | | | | |
| AT&T, Inc. | | | 44,379 | | | | 1,887,439 | |
| Level 3 Communications, Inc.* | | | 838 | | | | 47,230 | |
| Verizon Communications, Inc. | | | 110,160 | | | | 5,880,341 | |
| | | | | | | | 7,815,010 | |
| | | | | | | | | |
| Real Estate — 4.0% | | | | | | | | |
| Apple Hospitality, Inc. REIT | | | 86,341 | | | | 1,725,093 | |
| Communications Sales & Leasing, Inc. REIT* | | | 12,730 | | | | 323,469 | |
| General Growth Properties, Inc. REIT | | | 37,572 | | | | 938,549 | |
| Iron Mountain, Inc. REIT | | | 21,677 | | | | 704,069 | |
| Lamar Advertising Co.- Class A, REIT | | | 20,614 | | | | 1,386,085 | |
| Omega Healthcare Investors, Inc. REIT | | | 18,239 | | | | 570,151 | |
| Simon Property Group, Inc. REIT | | | 721 | | | | 128,100 | |
| | | | | | | | 5,775,516 | |
| | | | | | | | | |
| Utilities — 3.4% | | | | | | | | |
| AES Corp. | | | 32,403 | | | | 376,523 | |
| American Electric Power Co., Inc. | | | 28,436 | | | | 1,790,331 | |
| MDU Resources Group, Inc. | | | 53,754 | | | | 1,546,503 | |
| Pinnacle West Capital Corp. | | | 2,573 | | | | 200,771 | |
| Xcel Energy, Inc. | | | 23,148 | | | | 942,124 | |
| | | | | | | | 4,856,252 | |
| | | | | | | | | |
| Materials — 1.8% | | | | | | | | |
| AdvanSix, Inc.* | | | 45,108 | | | | 998,691 | |
| EI du Pont de Nemours & Co. | | | 6,424 | | | | 471,522 | |
| Huntsman Corp. | | | 13,955 | | | | 266,261 | |
| Monsanto Co. | | | 8,106 | | | | 852,832 | |
| | | | | | | | 2,589,306 | |
| Total Common Stocks | | | | | | $ | 166,657,979 | |
| | | | | | | | | |
| Investment Fund — 3.0% | | | | | | | | |
| Dreyfus Government Cash Management, Institutional Shares, 0.45%¥W | | | 4,372,650 | | | | 4,372,650 | |
| | | | | | | | | |
| Total Long Positions | | | | | | | | |
| (Cost $165,770,423) | | | | | | $ | 171,030,629 | |
| | | | | | | | | |
| Securities Sold Short — (19.0%) | | | | | | | | |
| | | | | | | | | |
| Common Stocks — (19.0%) | | | | | | | | |
| | | | | | | | | |
| Consumer Discretionary — (4.8%) | | | | | | | | |
| Liberty Ventures* | | | (71,036 | ) | | | (2,619,097 | ) |
| Madison Square Garden Co. (The) - Class A* | | | (9,560 | ) | | | (1,639,636 | ) |
| Tesla Motors, Inc.* | | | (12,503 | ) | | | (2,671,766 | ) |
| | | | | | | | (6,930,499 | ) |
| | | | | | | | | |
| Financials — (3.6%) | | | | | | | | |
| CBOE Holdings, Inc. | | | (832 | ) | | | (61,476 | ) |
| Interactive Brokers Group, Inc. - Class A | | | (56,466 | ) | | | (2,061,574 | ) |
| Intercontinental Exchange, Inc. | | | (31,737 | ) | | | (1,790,602 | ) |
| Markel Corp.* | | | (1,476 | ) | | | (1,335,042 | ) |
| | | | | | | | (5,248,694 | ) |
| | | | | | | | | |
| Health Care — (3.2%) | | | | | | | | |
| Acadia Healthcare Co., Inc.* | | | (15,224 | ) | | | (503,914 | ) |
| Alnylam Pharmaceuticals, Inc.* | | | (5,666 | ) | | | (212,135 | ) |
| Bio-Rad Laboratories, Inc. - Class A* | | | (761 | ) | | | (138,715 | ) |
| Envision Healthcare Corp.* | | | (34,996 | ) | | | (2,214,897 | ) |
| Intercept Pharmaceuticals, Inc.* | | | (8,679 | ) | | | (942,973 | ) |
| MEDNAX, Inc.* | | | (5,761 | ) | | | (384,028 | ) |
| Neurocrine Biosciences, Inc.* | | | (4,667 | ) | | | (180,613 | ) |
| | | | | | | | (4,577,275 | ) |
| | | | | | | | | |
| Information Technology — (2.7%) | | | | | | | | |
| FireEye, Inc.* | | | (34,690 | ) | | | (412,811 | ) |
| Palo Alto Networks, Inc.* | | | (17,651 | ) | | | (2,207,258 | ) |
| Pandora Media, Inc.* | | | (61,570 | ) | | | (802,873 | ) |
| VeriSign, Inc.* | | | (6,520 | ) | | | (495,977 | ) |
| | | | | | | | (3,918,919 | ) |
| | | | | | | | | |
| Energy — (1.9%) | | | | | | | | |
| Cheniere Energy, Inc.* | | | (65,322 | ) | | | (2,706,290 | ) |
| | | | | | | | | |
| Telecommunication Services — (1.9%) | | | | | | | | |
| SBA Communications Corp. - Class A - Class A* | | | (26,160 | ) | | | (2,701,282 | ) |
| | | | | | | | | |
| Consumer Staples — (0.6%) | | | | | | | | |
| Monster Beverage Corp.* | | | (18,304 | ) | | | (811,599 | ) |
| | | | | | | | | |
| Industrials — (0.3%) | | | | | | | | |
| Verisk Analytics, Inc.* | | | (4,944 | ) | | | (401,304 | ) |
| Total Common Stocks | | | | | | $ | (27,295,862 | ) |
| Total Securities Sold Short | | | | | | | | |
| (Proceeds $27,954,020) | | | | | | $ | (27,295,862 | ) |
Touchstone Dynamic Equity Fund (Continued)
| | | Number | | | | |
| | | of | | | Market | |
| | | Contracts | | | Value | |
| | | | | | | |
| Written Options — (1.3%) | | | | | | | | |
| | | | | | | | | |
| Call Options — (1.3%) | | | | | | | | |
| Russell 2000 Index | | | | | | | | |
| March 2017 | | | | | | | | |
| Strike Price $1,500 | | | (41 | ) | | $ | (12,505 | ) |
| S&P 500 Index | | | | | | | | |
| January 2017 | | | | | | | | |
| Strike Price $2,175 | | | (195 | ) | | | (1,532,700 | ) |
| S&P 500 Index | | | | | | | | |
| January 2017 | | | | | | | | |
| Strike Price $2,240 | | | (40 | ) | | | (104,600 | ) |
| S&P 500 Index | | | | | | | | |
| January 2017 | | | | | | | | |
| Strike Price $2,260 | | | (40 | ) | | | (15,200 | ) |
| S&P 500 Index | | | | | | | | |
| January 2017 | | | | | | | | |
| Strike Price $2,265 | | | (39 | ) | | | (31,395 | ) |
| S&P 500 Index | | | | | | | | |
| January 2017 | | | | | | | | |
| Strike Price $2,265 | | | (40 | ) | | | (46,320 | ) |
| S&P 500 Index | | | | | | | | |
| January 2017 | | | | | | | | |
| Strike Price $2,280 | | | (96 | ) | | | (67,200 | ) |
| S&P 500 Index | | | | | | | | |
| March 2017 | | | | | | | | |
| Strike Price $2,410 | | | (145 | ) | | | (38,425 | ) |
| Total Call Options | | | | | | $ | (1,848,345 | ) |
| | | | | | | | | |
| Put Options — (0.0%) | | | | | | | | |
| S&P 500 Index | | | | | | | | |
| January 2017 | | | | | | | | |
| Strike Price $2,250 | | | (22 | ) | | | (62,106 | ) |
| | | | | | | | | |
| Total Written Options | | | | | | | | |
| (Premiums received $1,530,905) | | | | | | $ | (1,910,451 | ) |
| | | | | | | | | |
| Total —98.9% | | | | | | $ | 141,824,316 | |
| | | | | | | | | |
| Other Assets in Excess of Liabilities — 1.1% | | | | | | | 1,642,401 | |
| | | | | | | | | |
| Net Assets — 100.0% | | | | | | $ | 143,466,717 | |
| * | Non-income producing security. |
| | |
| †† | All or a portion of these securities are held as collateral for securities sold short and written options. The total value of the securities held as collateral as of December 31, 2016 was $166,657,979. |
| | |
| ¥ | Open-End Fund. |
| | |
| W | Represents the 7-day SEC yield as of December 31, 2016. |
Portfolio Abbreviations:
PLC - Public Limited Company
REIT - Real Estate Investment Trust
Other Information:
The inputs or methodology used for valuing securities may not be an indication of the risk associated with investing in those securities. For more information on valuation inputs, and their aggregation into the levels used in the table below, please refer to the security valuation section in the accompanying Notes to Financial Statements.
| Valuation inputs at Reporting Date: |
| Description | | Level 1 | | | Level 2 | | | Level 3 | | | Total | |
| | | | | | | | | | | | | |
| Assets: | | | | | | | | | | | | | | | | |
| Long Positions | | | | | | | | | | | | | | | | |
| Common Stocks | | $ | 166,657,979 | | | $ | — | | | $ | — | | | $ | 166,657,979 | |
| Investment Fund | | | 4,372,650 | | | | — | | | | — | | | | 4,372,650 | |
| Total Assets | | $ | 171,030,629 | | | $ | — | | | $ | — | | | $ | 171,030,629 | |
| | | | | | | | | | | | | | | | | |
| Liabilities: | | | | | | | | | | | | | | | | |
| Securities Sold Short | | | | | | | | | | | | | | | | |
| Common Stocks | | $ | (27,295,862 | ) | | $ | — | | | $ | — | | | $ | (27,295,862 | ) |
| Other Financial Instruments | | | | | | | | | | | | | | | | |
| Written Options Equity Contracts | | | (1,910,451 | ) | | | — | | | | — | | | | (1,910,451 | ) |
| Total Liabilities | | $ | (29,206,313 | ) | | $ | — | | | $ | — | | | $ | (29,206,313 | ) |
| Total | | $ | 141,824,316 | | | $ | — | | | $ | — | | | $ | 141,824,316 | |
Transactions in written options for the year ended December 31, 2016:
| | | Number of | | | Premiums | |
| | | Contracts | | | Received | |
| Beginning balance, December 31, 2015 | | | 452 | | | $ | 2,634,335 | |
| Call Options Written | | | 10,126 | | | | 27,776,690 | |
| Put Options Written | | | 791 | | | | 1,375,295 | |
| Call Options Closed | | | (8,463 | ) | | | (26,592,726 | ) |
| Put Options Closed | | | (207 | ) | | | (589,052 | ) |
| Call Options Expired | | | (1,464 | ) | | | (2,284,162 | ) |
| Put Options Expired | | | (577 | ) | | | (789,475 | ) |
| Ending balance, December 31, 2016 | | | 658 | | | $ | 1,530,905 | |
See accompanying Notes to Financial Statements.
Portfolio of Investments
Touchstone Controlled Growth with Income Fund – December 31, 2016
| | | | | | Market | |
| | | Shares | | | Value | |
| | | | | | | |
| Affiliated Mutual Funds^¥ — 98.3% | | | | | | | | |
| | | | | | | | | |
| Alternative Funds — 47.3% | | | | | | | | |
| Touchstone Arbitrage Fund | | | 944,248 | | | $ | 9,725,751 | |
| Touchstone Dynamic Equity Fund | | | 565,552 | | | | 8,771,706 | |
| | | | | | | | 18,497,457 | |
| | | | | | | | | |
| Fixed Income Funds — 45.9% | | | | | | | | |
| Touchstone Credit Opportunities Fund | | | 564,426 | | | | 5,813,593 | |
| Touchstone Flexible Income Fund | | | 854,028 | | | | 9,044,153 | |
| Touchstone High Yield Fund | | | 365,144 | | | | 3,067,214 | |
| | | | | | | | 17,924,960 | |
| | | | | | | | | |
| Equity Funds — 5.1% | | | | | | | | |
| Touchstone Premium Yield Equity Fund, Class Y | | | 228,046 | | | | 2,006,801 | |
| Total Affiliated Mutual Funds | | | | | | $ | 38,429,218 | |
| | | | | | | | | |
| Investment Fund — 1.0% | | | | | | | | |
| Dreyfus Government Cash Management, Institutional Shares, 0.45%¥W | | | 401,851 | | | | 401,851 | |
| | | | | | | | | |
| | | | | | | | | |
| Total Investment Securities —99.3% | | | | | | | | |
| (Cost $38,116,728) | | | | | | $ | 38,831,069 | |
| | | | | | | | | |
| Other Assets in Excess of Liabilities — 0.7% | | | | | | | 264,172 | |
| | | | | | | | | |
| Net Assets—100.0% | | | | | | $ | 39,095,241 | |
| ^ | All affiliated funds are invested in the Institutional Class, unless otherwise indicated. The financial statements of the underlying funds can be found on the SEC website. |
| | |
| ¥ | Open-End Fund. |
| | |
| W | Represents the 7-day SEC yield as of December 31, 2016. |
Other Information:
The inputs or methodology used for valuing securities may not be an indication of the risk associated with investing in those securities. For more information on valuation inputs, and their aggregation into the levels used in the table below, please refer to the security valuation section in the accompanying Notes to Financial Statements.
| Valuation inputs at Reporting Date: |
| Description | | Level 1 | | | Level 2 | | | Level 3 | | | Total | |
| Affiliated Mutual Funds | | $ | 38,429,218 | | | $ | — | | | $ | — | | | $ | 38,429,218 | |
| Investment Fund | | | 401,851 | | | | — | | | | — | | | | 401,851 | |
| Total | | $ | 38,831,069 | | | $ | — | | | $ | — | | | $ | 38,831,069 | |
See accompanying Notes to Financial Statements.
Portfolio of Investments
Touchstone Dynamic Diversified Income Fund – December 31, 2016
| | | | | | Market | |
| | | Shares | | | Value | |
| | | | | | | |
| Affiliated Mutual Funds^∞ — 80.8% | | | | | | | | |
| | | | | | | | | |
| Fixed Income Funds — 62.4% | | | | | | | | |
| Touchstone Credit Opportunities Fund | | | 1,315,800 | | | $ | 13,552,739 | |
| Touchstone Flexible Income Fund | | | 583,797 | | | | 6,182,416 | |
| Touchstone High Yield Fund | | | 1,216,941 | | | | 10,222,308 | |
| Touchstone Total Return Bond Fund | | | 992,496 | | | | 9,934,885 | |
| | | | | | | | 39,892,348 | |
| | | | | | | | | |
| Equity Funds — 18.4% | | | | | | | | |
| Touchstone International Value Fund | | | 373,024 | | | | 2,540,292 | |
| Touchstone Premium Yield Equity Fund, Class Y | | | 651,206 | | | | 5,730,612 | |
| Touchstone Value Fund | | | 360,711 | | | | 3,466,431 | |
| | | | | | | | 11,737,335 | |
| Total Affiliated Mutual Funds | | | | | | $ | 51,629,683 | |
| | | | | | | | | |
| Exchange Traded Funds — 12.0% | | | | | | | | |
| iShares International Select Dividend ETF | | | 45,790 | | | | 1,353,552 | |
| VanEck Vectors J.P. Morgan EM Local Currency Bond ETF | | | 70,020 | | | | 1,232,352 | |
| Vanguard Emerging Markets Government Bond ETF | | | 16,390 | | | | 1,270,881 | |
| Vanguard Global ex-U.S. Real Estate ETF | | | 24,800 | | | | 1,229,336 | |
| Vanguard REIT ETF | | | 31,500 | | | | 2,599,695 | |
| Total Exchange Traded Funds | | | | | | $ | 7,685,816 | |
| | | | | | | | | |
| Exchange Traded Notes — 6.3% | | | | | | | | |
| JPMorgan Alerian MLP Index ETN | | | 127,610 | | | | 4,033,752 | |
| | | | | | | | | |
| Investment Fund — 1.0% | | | | | | | | |
| Dreyfus Government Cash Management, Institutional Shares, 0.45%∞Ω | | | 634,396 | | | | 634,396 | |
| | | | | | | | | |
| Total Investment Securities —100.1% | | | | | | | | |
| (Cost $63,721,997) | | | | | | $ | 63,983,647 | |
| | | | | | | | | |
| Liabilities in Excess of Other Assets — (0.1%) | | | | | | | (79,806 | ) |
| | | | | | | | | |
| Net Assets — 100.0% | | | | | | $ | 63,903,841 | |
| ^ | All affiliated funds are invested in the Institutional Class, unless otherwise indicated. The financial statements of the underlying funds can be found on the SEC website. |
Ω | Represents the 7-day SEC yield as of December 31, 2016. |
Portfolio Abbreviations:
ETF - Exchange Traded Fund
ETN - Exchange Traded Notes
MLP - Master Limited Partnership
REIT - Real Estate Investment Trust
Other Information:
The inputs or methodology used for valuing securities may not be an indication of the risk associated with investing in those securities. For more information on valuation inputs, and their aggregation into the levels used in the table below, please refer to the security valuation section in the accompanying Notes to Financial Statements.
Valuation inputs at Reporting Date:
| Description | | Level 1 | | | Level 2 | | | Level 3 | | | Total | |
| Affiliated Mutual Funds | | $ | 51,629,683 | | | $ | — | | | $ | — | | | $ | 51,629,683 | |
| Exchange Traded Funds | | | 7,685,816 | | | | — | | | | — | | | | 7,685,816 | |
| Exchanged Traded Notes | | | 4,033,752 | | | | — | | | | — | | | | 4,033,752 | |
| Investment Fund | | | 634,396 | | | | — | | | | — | | | | 634,396 | |
| Total | | $ | 63,983,647 | | | $ | — | | | $ | — | | | $ | 63,983,647 | |
See accompanying Notes to Financial Statements.
Portfolio of Investments
Touchstone Dynamic Global Allocation Fund – December 31, 2016
| | | | | | Market | |
| | | Shares | | | Value | |
| | | | | | | |
| Affiliated Mutual Funds^∞ — 83.0% | | | | | | | | |
| | | | | | | | | |
| Equity Funds — 45.3% | | | | | | | | |
| Touchstone International Growth Fund | | | 733,231 | | | $ | 7,339,639 | |
| Touchstone International Small Cap Fund | | | 157,784 | | | | 2,344,666 | |
| Touchstone International Value Fund | | | 1,870,940 | | | | 12,741,103 | |
| Touchstone Mid Cap Fund | | | 184,079 | | | | 5,036,398 | |
| Touchstone Sands Capital Emerging Markets Growth Fund* | | | 347,067 | | | | 3,283,257 | |
| Touchstone Sands Capital Institutional Growth Fund | | | 450,066 | | | | 8,236,214 | |
| Touchstone Small Cap Value Opportunities Fund | | | 138,109 | | | | 2,571,586 | |
| Touchstone Value Fund | | | 1,440,363 | | | | 13,841,893 | |
| | | | | | | | 55,394,756 | |
| | | | | | | | | |
| Fixed Income Funds — 29.6% | | | | | | | | |
| Touchstone Credit Opportunities Fund | | | 589,092 | | | | 6,067,647 | |
| Touchstone High Yield Fund | | | 443,493 | | | | 3,725,342 | |
| Touchstone Total Return Bond Fund | | | 2,633,560 | | | | 26,361,933 | |
| | | | | | | | 36,154,922 | |
| | | | | | | | | |
| Alternative Fund — 8.1% | | | | | | | | |
| Touchstone Dynamic Equity Fund | | | 642,656 | | | | 9,967,595 | |
| Total Affiliated Mutual Funds | | | | | | $ | 101,517,273 | |
| | | | | | | | | |
| Exchange Traded Funds — 16.2% | | | | | | | | |
| Vanguard FTSE Emerging Markets ETF | | | 101,100 | | | | 3,617,358 | |
| Vanguard Global ex-U.S. Real Estate ETF | | | 24,516 | | | | 1,215,258 | |
| Vanguard REIT ETF | | | 30,675 | | | | 2,531,608 | |
| Vanguard Total International Bond ETF | | | 230,040 | | | | 12,488,872 | |
| Total Exchange Traded Funds | | | | | | $ | 19,853,096 | |
| | | | | | | | | |
| Investment Fund — 1.0% | | | | | | | | |
| Dreyfus Government Cash Management, Institutional Shares, 0.45%∞Ω | | | 1,179,851 | | | | 1,179,851 | |
| | | | | | | | | |
| Total Investment Securities —100.2% | | | | | | | | |
| (Cost $122,624,157) | | | | | | $ | 122,550,220 | |
| | | | | | | | | |
| Liabilities in Excess of Other Assets — (0.2%) | | | | | | | (237,622 | ) |
| | | | | | | | | |
| Net Assets — 100.0% | | | | | | $ | 122,312,598 | |
| * | Non-income producing security. |
| ^ | All affiliated funds are invested in the Institutional Class, unless otherwise indicated. The financial statements of the underlying funds can be found on the SEC website. |
| Ω | Represents the 7-day SEC yield as of December 31, 2016. |
Portfolio Abbreviations:
ETF - Exchange Traded Fund
REIT - Real Estate Investment Trust
Other Information:
The inputs or methodology used for valuing securities may not be an indication of the risk associated with investing in those securities. For more information on valuation inputs, and their aggregation into the levels used in the table below, please refer to the security valuation section in the accompanying Notes to Financial Statements.
Valuation inputs at Reporting Date:
| Description | | Level 1 | | | Level 2 | | | Level 3 | | | Total | |
| Affiliated Mutual Funds | | $ | 101,517,273 | | | $ | — | | | $ | — | | | $ | 101,517,273 | |
| Exchange Traded Funds | | | 19,853,096 | | | | — | | | | — | | | | 19,853,096 | |
| Investment Fund | | | 1,179,851 | | | | — | | | | — | | | | 1,179,851 | |
| Total | | $ | 122,550,220 | | | $ | — | | | $ | — | | | $ | 122,550,220 | |
See accompanying Notes to Financial Statements.
Statements of Assets and Liabilities
December 31, 2016
| | | | | | Touchstone | | | Touchstone | | | Touchstone | |
| | | Touchstone | | | Controlled | | | Dynamic | | | Dynamic | |
| | | Dynamic | | | Growth | | | Diversified | | | Global | |
| | | Equity | | | with Income | | | Income | | | Allocation | |
| | | Fund | | | Fund | | | Fund | | | Fund | |
| Assets | | | | | | | | | | | | | | | | |
| Investments, at cost | | $ | 165,770,423 | | | $ | 38,116,728 | | | $ | 63,721,997 | | | $ | 122,624,157 | |
| Affiliated securities, at market value | | $ | — | | | $ | 38,429,218 | | | $ | 51,629,683 | | | $ | 101,517,273 | |
| Non-affiliated securities, at market value | | | 171,030,629 | | | | 401,851 | | | | 12,353,964 | | | | 21,032,947 | |
| Investments, at market value | | $ | 171,030,629 | | | $ | 38,831,069 | | | $ | 63,983,647 | | | $ | 122,550,220 | |
| Cash | | | 597 | | | | — | | | | — | | | | — | |
| Cash deposits held at prime broker | | | 1,736,635 | | | | — | | | | — | | | | — | |
| Dividends and interest receivable | | | 334,356 | | | | — | | | | 5,651 | | | | — | |
| Receivable for capital shares sold | | | 238,752 | | | | 336,538 | | | | 16,805 | | | | 21,477 | |
| Receivable for investments sold | | | 111,968 | | | | 48,422 | | | | 123,423 | | | | 222,435 | |
| Receivable from Investment Advisor | | | — | | | | 592 | | | | — | | | | — | |
| Tax reclaim receivable | | | 207 | | | | — | | | | — | | | | — | |
| Other assets | | | 19,413 | | | | 26,778 | | | | 28,632 | | | | 26,796 | |
| Total Assets | | | 173,472,557 | | | | 39,243,399 | | | | 64,158,158 | | | | 122,820,928 | |
| | | | | | | | | | | | | | | | | |
| Liabilities | | | | | | | | | | | | | | | | |
| Bank overdrafts | | | — | | | | 48,409 | | | | 123,422 | | | | 222,434 | |
| Written options, at market value (A) | | | 1,910,451 | | | | — | | | | — | | | | — | |
| Securities sold short (B) | | | 27,295,862 | | | | — | | | | — | | | | — | |
| Dividend and interest payable on securities sold short | | | 6,632 | | | | — | | | | — | | | | — | |
| Payable for capital shares redeemed | | | 403,074 | | | | 60,010 | | | | 59,394 | | | | 147,145 | |
| Payable to cover options | | | 175,335 | | | | — | | | | — | | | | — | |
| Payable to Investment Advisor | | | 111,004 | | | | — | | | | 7,521 | | | | 23,471 | |
| Payable to other affiliates | | | 32,031 | | | | 6,234 | | | | 18,531 | | | | 35,462 | |
| Payable to Trustees | | | 3,927 | | | | 3,927 | | | | 3,927 | | | | 3,927 | |
| Payable for professional services | | | 13,466 | | | | 11,616 | | | | 12,798 | | | | 12,625 | |
| Payable to Transfer Agent | | | 36,357 | | | | 11,259 | | | | 20,790 | | | | 52,311 | |
| Other accrued expenses and liabilities | | | 17,701 | | | | 6,703 | | | | 7,934 | | | | 10,955 | |
| Total Liabilities | | | 30,005,840 | | | | 148,158 | | | | 254,317 | | | | 508,330 | |
| | | | | | | | | | | | | | | | | |
| Net Assets | | $ | 143,466,717 | | | $ | 39,095,241 | | | $ | 63,903,841 | | | $ | 122,312,598 | |
| | | | | | | | | | | | | | | | | |
| Net assets consist of: | | | | | | | | | | | | | | | | |
| Paid-in capital | | $ | 214,266,028 | | | $ | 38,158,943 | | | $ | 76,535,455 | | | $ | 127,733,138 | |
| Accumulated net investment income | | | 1,986,916 | | | | 5,015 | | | | 136,133 | | | | — | |
| Accumulated net realized gains (losses) on investments, written options, securities sold short and capital gain distributions received | | | (78,325,045 | ) | | | 216,942 | | | | (13,029,397 | ) | | | (5,346,603 | ) |
| Net unrealized appreciation (depreciation) on investments, written options and securities sold short | | | 5,538,818 | | | | 714,341 | | | | 261,650 | | | | (73,937 | ) |
| Net Assets | | $ | 143,466,717 | | | $ | 39,095,241 | | | $ | 63,903,841 | | | $ | 122,312,598 | |
| (A) Premiums received for written options: | | $ | 1,530,905 | | | $ | — | | | $ | — | | | $ | — | |
| (B) Proceeds received for securities sold short: | | $ | 27,954,020 | | | $ | — | | | $ | — | | | $ | — | |
Statements of Assets and Liabilities (Continued)
| | | | | | Touchstone | | | Touchstone | | | Touchstone | |
| | | Touchstone | | | Controlled | | | Dynamic | | | Dynamic | |
| | | Dynamic | | | Growth | | | Diversified | | | Global | |
| | | Equity | | | with Income | | | Income | | | Allocation | |
| | | Fund | | | Fund | | | Fund | | | Fund | |
| | | | | | | | | | | | | |
| Pricing of Class A Shares | | | | | | | | | | | | | | | | |
| Net assets applicable to Class A shares | | $ | 15,524,722 | | | $ | 15,327,076 | | | $ | 28,315,739 | | | $ | 62,689,065 | |
| Shares of beneficial interest outstanding (unlimited number of shares authorized, no par value) | | | 1,022,862 | | | | 1,366,521 | | | | 2,224,804 | | | | 5,424,219 | |
| Net asset value per share* | | $ | 15.18 | | | $ | 11.22 | | | $ | 12.73 | | | $ | 11.56 | |
| Maximum sale charge - Class A Shares | | | 5.75 | % | | | 5.75 | % | | | 5.75 | % | | | 5.75 | % |
| Maximum offering price per share (100%/(100%-maximum sales charge) of net asset value adjusted to the nearest cent) - Class A shares | | $ | 16.11 | | | $ | 11.90 | | | $ | 13.51 | | | $ | 12.27 | |
| | | | | | | | | | | | | | | | | |
| Pricing of Class C Shares | | | | | | | | | | | | | | | | |
| Net assets applicable to Class C shares | | $ | 12,255,863 | | | $ | 9,986,395 | | | $ | 25,197,204 | | | $ | 44,945,806 | |
| Shares of beneficial interest outstanding (unlimited number of shares authorized, no par value) | | | 873,749 | | | | 894,644 | | | | 1,976,454 | | | | 3,972,939 | |
| Net asset value and offering price per share** | | $ | 14.03 | | | $ | 11.16 | | | $ | 12.75 | | | $ | 11.31 | |
| | | | | | | | | | | | | | | | | |
| Pricing of Class Y Shares | | | | | | | | | | | | | | | | |
| Net assets applicable to Class Y shares | | $ | 96,806,748 | | | $ | 13,781,770 | | | $ | 10,390,898 | | | $ | 14,677,727 | |
| Shares of beneficial interest outstanding (unlimited number of shares authorized, no par value) | | | 6,265,109 | | | | 1,229,172 | | | | 814,879 | | | | 1,259,072 | |
| Net asset value, offering price and redemption price per share | | $ | 15.45 | | | $ | 11.21 | | | $ | 12.75 | | | $ | 11.66 | |
| | | | | | | | | | | | | | | | | |
| Pricing of Institutional Class Shares | | | | | | | | | | | | | | | | |
| Net assets applicable to Institutional Class Shares | | $ | 18,879,384 | | | $ | — | | | $ | — | | | $ | — | |
| Shares of beneficial interest outstanding (unlimited number of shares authorized, no par value) | | | 1,217,327 | | | | — | | | | — | | | | — | |
| Net asset value, offering price and redemption price per share | | $ | 15.51 | | | $ | — | | | $ | — | | | $ | — | |
* There is no sales load on subscriptions of $1 million or more. Redemptions that were part of a $1 million or more subscription may be subject to a contingent deferred sales load if redeemed within a one-year period from the date of purchase.
** Redemption price per share varies by length of time shares are held due to the terms of the contingent deferred sales charge.
See accompanying Notes to Financial Statements.
Statements of Operations
For the Year Ended December 31, 2016
| | | | | | Touchstone | | | Touchstone | | | Touchstone | |
| | | Touchstone | | | Controlled | | | Dynamic | | | Dynamic | |
| | | Dynamic | | | Growth | | | Diversified | | | Global | |
| | | Equity | | | with Income | | | Income | | | Allocation | |
| | | Fund | | | Fund | | | Fund | | | Fund | |
| Investment Income | | | | | | | | | | | | | | | | |
| Dividends from affiliated funds | | $ | — | | | $ | 653,318 | | | $ | 2,409,959 | | | $ | 3,147,927 | |
| Dividends from non-affiliated securities | | | 4,202,383 | | | | 1,133 | | | | 666,772 | | | | 461,492 | |
| Total Investment Income | | | 4,202,383 | | | | 654,451 | | | | 3,076,731 | | | | 3,609,419 | |
| Expenses | | | | | | | | | | | | | | | | |
| Investment advisory fees | | | 1,113,635 | | | | 70,109 | | | | 145,708 | | | | 328,445 | |
| Administration fees | | | 189,973 | | | | 50,829 | | | | 105,638 | | | | 190,498 | |
| Compliance fees and expenses | | | 2,872 | | | | 2,872 | | | | 2,872 | | | | 2,872 | |
| Custody fees | | | 19,209 | | | | 4,323 | | | | 5,913 | | | | 4,622 | |
| Professional fees | | | 27,908 | | | | 25,314 | | | | 28,824 | | | | 30,903 | |
| Transfer Agent fees, Class A | | | 22,904 | | | | 19,217 | | | | 35,004 | | | | 96,489 | |
| Transfer Agent fees, Class C | | | 16,384 | | | | 8,393 | | | | 23,939 | | | | 61,337 | |
| Transfer Agent fees, Class Y | | | 101,235 | | | | 12,588 | | | | 24,003 | | | | 22,560 | |
| Transfer Agent fees, Institutional Class | | | 138 | | | | — | | | | — | | | | — | |
| Registration Fees, Class A | | | 14,396 | | | | 16,011 | | | | 16,722 | | | | 16,443 | |
| Registration Fees, Class C | | | 14,417 | | | | 15,990 | | | | 16,051 | | | | 16,153 | |
| Registration Fees, Class Y | | | 20,728 | | | | 15,920 | | | | 16,011 | | | | 16,230 | |
| Registration Fees, Institutional Class | | | 14,395 | | | | — | | | | — | | | | — | |
| Dividend expense on securities sold short | | | 225,240 | | | | — | | | | — | | | | — | |
| Interest expense on securities sold short | | | 238,507 | | | | — | | | | — | | | | — | |
| Reports to Shareholders, Class A | | | 5,950 | | | | 6,459 | | | | 8,422 | | | | 13,929 | |
| Reports to Shareholders, Class C | | | 5,393 | | | | 5,650 | | | | 7,564 | | | | 10,384 | |
| Reports to Shareholders, Class Y | | | 12,151 | | | | 5,832 | | | | 6,258 | | | | 6,059 | |
| Reports to Shareholders, Institutional Class | | | 4,232 | | | | — | | | | — | | | | — | |
| Distribution expenses, Class A | | | 44,081 | | | | 38,608 | | | | 74,088 | | | | 166,228 | |
| Distribution and shareholder servicing expenses, Class C | | | 123,100 | | | | 105,168 | | | | 264,710 | | | | 488,000 | |
| Trustee fees | | | 16,153 | | | | 16,153 | | | | 16,153 | | | | 16,153 | |
| Other expenses | | | 22,614 | | | | 12,833 | | | | 22,710 | | | | 49,884 | |
| Total Expenses | | | 2,255,615 | | | | 432,269 | | | | 820,590 | | | | 1,537,189 | |
| Fees waived and/or reimbursed by the Advisor and/or Affiliates(A) | | | (8,574 | ) | | | (204,341 | ) | | | (306,923 | ) | | | (567,634 | ) |
| Fees recouped by the Advisor(A) | | | 7,554 | | | | — | | | | — | | | | — | |
| Net Expenses | | | 2,254,595 | | | | 227,928 | | | | 513,667 | | | | 969,555 | |
| Net Investment Income | | | 1,947,788 | | | | 426,523 | | | | 2,563,064 | | | | 2,639,864 | |
| Realized and Unrealized Gains (Losses) on Investments | | | | | | | | | | | | | | | | |
| Net realized gains on investments from non-affiliated securities | | | 10,843,112 | | | | 325 | | | | 48,059 | | | | 131,689 | |
| Net realized gains (losses) on investments from affiliated securities | | | — | | | | 362,652 | | | | (101,502 | ) | | | 2,665,251 | |
| Net realized losses on written options | | | (5,982,071 | ) | | | — | | | | — | | | | — | |
| Net realized losses on securities sold short | | | (1,975,030 | ) | | | — | | | | — | | | | — | |
| Capital gain distributions received from affiliated funds | | | — | | | | 296,671 | | | | 100,240 | | | | 530,753 | |
| Net change in unrealized appreciation (depreciation) on investments | | | 3,747,405 | | | | 785,013 | | | | 3,531,488 | | | | (2,909,874 | ) |
| Net change in unrealized appreciation (depreciation) on written options | | | (156,011 | ) | | | — | | | | — | | | | — | |
| Net change in unrealized appreciation (depreciation) on securities sold short | | | (683,114 | ) | | | — | | | | — | | | | — | |
| Net Realized and Unrealized Gains (Losses) on Investments | | $ | 5,794,291 | | | $ | 1,444,661 | | | $ | 3,578,285 | | | $ | 417,819 | |
| Change in Net Assets Resulting from Operations | | $ | 7,742,079 | | | $ | 1,871,184 | | | $ | 6,141,349 | | | $ | 3,057,683 | |
| Net of foreign tax withholding of: | | $ | 93 | | | $ | — | | | $ | — | | | $ | — | |
(A)See Note 4 in Notes to Financial Statements.
See accompanying Notes to Financial Statements.
Statements of Changes in Net Assets
| | | | | | Touchstone | |
| | | Touchstone | | | Controlled Growth | |
| | | Dynamic Equity | | | with Income | |
| | | Fund | | | Fund | |
| | | For the | | | For the | | | For the | | | For the | |
| | | Year | | | Year | | | Year | | | Year | |
| | | Ended | | | Ended | | | Ended | | | Ended | |
| | | December 31, | | | December 31, | | | December 31, | | | December 31, | |
| | | 2016 | | | 2015 | | | 2016 | | | 2015 | |
| From Operations | | | | | | | | | | | | | | | | |
| Net investment income | | $ | 1,947,788 | | | $ | 746,280 | | | $ | 426,523 | | | $ | 423,849 | |
| Net realized gains on investments, written options, securities sold short and capital gain distributions received | | | 2,886,011 | | | | 7,575,049 | | | | 659,648 | | | | 701,405 | |
| Net change in unrealized appreciation (depreciation) on investments, written options and securities sold short | | | 2,908,280 | | | | (3,103,769 | ) | | | 785,013 | | | | (1,437,578 | ) |
| Change in Net Assets from Operations | | | 7,742,079 | | | | 5,217,560 | | | | 1,871,184 | | | | (312,324 | ) |
| | | | | | | | | | | | | | | | | |
| Distributions to Shareholders from: | | | | | | | | | | | | | | | | |
| Net investment income, Class A | | | (59,922 | ) | | | — | | | | (321,665 | ) | | | (254,402 | ) |
| Net investment income, Class C | | | — | | | | — | | | | (134,013 | ) | | | (99,568 | ) |
| Net investment income, Class Y | | | (588,508 | ) | | | (93,171 | ) | | | (270,892 | ) | | | (179,736 | ) |
| Net investment income, Institutional Class | | | (110,416 | ) | | | (2,443 | ) | | | — | | | | (745 | ) |
| Net realized gains, Class A | | | — | | | | — | | | | (5,079 | ) | | | — | |
| Net realized gains, Class C | | | — | | | | — | | | | (3,371 | ) | | | — | |
| Net realized gains, Class Y | | | — | | | | — | | | | (4,351 | ) | | | — | |
| Total Distributions | | | (758,846 | ) | | | (95,614 | ) | | | (739,371 | ) | | | (534,451 | ) |
| | | | | | | | | | | | | | | | | |
| Net Increase (Decrease) from Share Transactions(A) | | | 39,315,518 | | | | 14,368,215 | | | | 2,338,838 | | | | (7,297,016 | ) |
| | | | | | | | | | | | | | | | | |
| Total Increase (Decrease) in Net Assets | | | 46,298,751 | | | | 19,490,161 | | | | 3,470,651 | | | | (8,143,791 | ) |
| | | | | | | | | | | | | | | | | |
| Net Assets | | | | | | | | | | | | | | | | |
| Beginning of period | | | 97,167,966 | | | | 77,677,805 | | | | 35,624,590 | | | | 43,768,381 | |
| End of period | | $ | 143,466,717 | | | $ | 97,167,966 | | | $ | 39,095,241 | | | $ | 35,624,590 | |
| Accumulated Net Investment Income | | $ | 1,986,916 | | | $ | 754,478 | | | $ | 5,015 | | | $ | 8,391 | |
| (A) | For details on share transactions by class, see Statements of Changes in Net Assets - Capital Stock Activity on pages 28 to 29. |
See accompanying Notes to Financial Statements.
Statements of Changes in Net Assets (Continued)
| Touchstone | | | Touchstone | |
| Dynamic Diversified | | | Dynamic Global | |
| Income | | | Allocation | |
| Fund | | | Fund | |
| For the | | | For the | | | For the | | | For the | |
| Year | | | Year | | | Year | | | Year | |
| Ended | | | Ended | | | Ended | | | Ended | |
| December 31, | | | December 31, | | | December 31, | | | December 31, | |
| 2016 | | | 2015 | | | 2016 | | | 2015 | |
| | | | | | | | | | | |
| $ | 2,563,064 | | | $ | 1,006,936 | | | $ | 2,639,864 | | | $ | 1,727,922 | |
| | | | | | | | | | | | | | | |
| | 46,797 | | | | 7,724,984 | | | | 3,327,693 | | | | 10,340,034 | |
| | 3,531,488 | | | | (10,816,574 | ) | | | (2,909,874 | ) | | | (16,348,945 | ) |
| | 6,141,349 | | | | (2,084,654 | ) | | | 3,057,683 | | | | (4,280,989 | ) |
| | | | | | | | | | | | | | | |
| | | | | | | | | | | | | | | |
| | (1,100,570 | ) | | | (478,784 | ) | | | (1,487,313 | ) | | | (1,024,931 | ) |
| | (784,960 | ) | | | (207,214 | ) | | | (732,400 | ) | | | (542,509 | ) |
| | (637,523 | ) | | | (341,450 | ) | | | (388,516 | ) | | | (296,691 | ) |
| | — | | | | (289 | ) | | | — | | | | (68 | ) |
| | — | | | | — | | | | (2,642,482 | ) | | | (1,705,447 | ) |
| | — | | | | — | | | | (1,947,391 | ) | | | (1,320,382 | ) |
| | — | | | | — | | | | (617,110 | ) | | | (422,152 | ) |
| | (2,523,053 | ) | | | (1,027,737 | ) | | | (7,815,212 | ) | | | (5,312,180 | ) |
| | | | | | | | | | | | | | | |
| | (15,049,340 | ) | | | (13,705,612 | ) | | | (15,258,866 | ) | | | 34,458,093 | |
| | | | | | | | | | | | | | | |
| | (11,431,044 | ) | | | (16,818,003 | ) | | | (20,016,395 | ) | | | 24,864,924 | |
| | | | | | | | | | | | | | | |
| | | | | | | | | | | | | | | |
| | 75,334,885 | | | | 92,152,888 | | | | 142,328,993 | | | | 117,464,069 | |
| $ | 63,903,841 | | | $ | 75,334,885 | | | $ | 122,312,598 | | | $ | 142,328,993 | |
| $ | 136,133 | | | $ | 14,323 | | | $ | — | | | $ | — | |
Statements of Changes in Net Assets - Capital Stock Activity
| | | | | | Touchstone Controlled Growth with | |
| | | Touchstone Dynamic Equity Fund | | | Income Fund | |
| | | For the Year | | | For the Year | | | For the Year | | | For the Year | |
| | | Ended | | | Ended | | | Ended | | | Ended | |
| | | December 31, 2016 | | | December 31, 2015 | | | December 31, 2016 | | | December 31, 2015 | |
| | | Shares | | | Dollars | | | Shares | | | Dollars | | | Shares | | | Dollars | | | Shares | | | Dollars | |
| Class A | | | | | | | | | | | | | | | | | | | | | | | | | | | | | | | | |
| Proceeds from Shares sold | | | 1,001,521 | | | $ | 14,331,349 | | | | 228,254 | | | $ | 3,247,884 | | | | 474,776 | | | $ | 5,216,104 | | | | 123,929 | | | $ | 1,368,452 | |
| Proceeds from Shares issued in connection with merger(A) | | | — | | | | — | | | | — | | | | — | | | | — | | | | — | | | | — | | | | — | |
| Reinvestment of distributions | | | 3,319 | | | | 50,280 | | | | — | | | | — | | | | 26,381 | | | | 294,829 | | | | 20,482 | | | | 223,312 | |
| Cost of Shares redeemed | | | (810,506 | ) | | | (11,812,741 | ) | | | (249,489 | ) | | | (3,467,534 | ) | | | (569,481 | ) | | | (6,241,121 | ) | | | (280,112 | ) | | | (3,100,234 | ) |
| Change from Class A Share Transactions | | | 194,334 | | | | 2,568,888 | | | | (21,235 | ) | | | (219,650 | ) | | | (68,324 | ) | | | (730,188 | ) | | | (135,701 | ) | | | (1,508,470 | ) |
| Class C | | | | | | | | | | | | | | | | | | | | | | | | | | | | | | | | |
| Proceeds from Shares sold | | | 287,559 | | | | 3,822,949 | | | | 161,500 | | | | 2,105,892 | | | | 63,172 | | | | 699,268 | | | | 31,421 | | | | 343,507 | |
| Proceeds from Shares issued in connection with merger(A) | | | — | | | | — | | | | — | | | | — | | | | — | | | | — | | | | — | | | | — | |
| Reinvestment of distributions | | | — | | | | — | | | | — | | | | — | | | | 10,068 | | | | 112,364 | | | | 7,327 | | | | 79,348 | |
| Cost of Shares redeemed | | | (223,971 | ) | | | (3,020,593 | ) | | | (176,997 | ) | | | (2,298,307 | ) | | | (225,180 | ) | | | (2,467,758 | ) | | | (293,856 | ) | | | (3,220,566 | ) |
| Change from Class C Share Transactions | | | 63,588 | | | | 802,356 | | | | (15,497 | ) | | | (192,415 | ) | | | (151,940 | ) | | | (1,656,126 | ) | | | (255,108 | ) | | | (2,797,711 | ) |
| Class Y | | | | | | | | | | | | | | | | | | | | | | | | | | | | | | | | |
| Proceeds from Shares sold | | | 3,964,309 | | | | 58,202,327 | | | | 2,256,404 | | | | 32,631,257 | | | | 673,437 | | | | 7,536,927 | | | | 187,564 | | | | 2,067,614 | |
| Proceeds from Shares issued in connection with merger(A) | | | — | | | | — | | | | — | | | | — | | | | — | | | | — | | | | 5,266 | | | | 57,554 | |
| Reinvestment of distributions | | | 34,016 | | | | 524,530 | | | | 5,413 | | | | 80,489 | | | | 21,068 | | | | 235,671 | | | | 13,634 | | | | 148,876 | |
| Cost of Shares redeemed | | | (2,135,437 | ) | | | (31,643,034 | ) | | | (1,001,379 | ) | | | (14,117,348 | ) | | | (278,153 | ) | | | (3,047,446 | ) | | | (470,003 | ) | | | (5,193,417 | ) |
| Change from Class Y Share Transactions | | | 1,862,888 | | | | 27,083,823 | | | | 1,260,438 | | | | 18,594,398 | | | | 416,352 | | | | 4,725,152 | | | | (263,539 | ) | | | (2,919,373 | ) |
| Institutional Class | | | | | | | | | | | | | | | | | | | | | | | | | | | | | | | | |
| Proceeds from Shares sold | | | 871,349 | | | | 12,988,892 | | | | 563,055 | | | | 8,370,489 | | | | — | | | | — | | | | — | | | | — | |
| Reinvestment of distributions | | | 7,133 | | | | 110,416 | | | | 164 | | | | 2,443 | | | | — | | | | — | | | | 68 | | | | 745 | |
| Cost of Shares redeemed | | | (284,849 | ) | | | (4,238,857 | ) | | | (828,549 | ) | | | (12,187,050 | ) | | | — | | | | — | | | | (1,354 | ) | | | (14,653 | ) |
| Cost of Shares redeemed in connection with merger(A) | | | — | | | | — | | | | — | | | | — | | | | — | | | | — | | | | (5,259 | ) | | | (57,554 | ) |
| Change from Institutional Class Share Transactions | | | 593,633 | | | | 8,860,451 | | | | (265,330 | ) | | | (3,814,118 | ) | | | — | | | | — | | | | (6,545 | ) | | | (71,462 | ) |
| | | | | | | | | | | | | | | | | | | | | | | | | | | | | | | | | |
| Change from Share Transactions | | | 2,714,443 | | | $ | 39,315,518 | | | | 958,376 | | | $ | 14,368,215 | | | | 196,088 | | | $ | 2,338,838 | | | | (660,893 | ) | | $ | (7,297,016 | ) |
(A)See Note 8 in the Notes to Financial Statements.
See accompanying Notes to Financial Statements.
Statements of Changes in Net Assets - Capital Stock Activity (Continued)
| Touchstone Dynamic Diversified Income Fund | | | Touchstone Dynamic Global Allocation Fund | |
| For the Year | | | For the Year | | | For the Year | | | For the Year | |
| Ended | | | Ended | | | Ended | | | Ended | |
| December 31, 2016 | | | December 31, 2015 | | | December 31, 2016 | | | December 31, 2015 | |
| Shares | | | Dollars | | | Shares | | | Dollars | | | Shares | | | Dollars | | | Shares | | | Dollars | |
| | | | | | | | | | | | | | | | | | | | | | | | | | | | | | | |
| | 202,524 | | | $ | 2,589,244 | | | | 141,444 | | | $ | 1,799,493 | | | | 135,554 | | | $ | 1,615,577 | | | | 208,879 | | | $ | 2,686,288 | |
| | | | | | | | | | | | | | | | | | | | | | | | | | | | | | | |
| | — | | | | — | | | | — | | | | — | | | | — | | | | — | | | | 1,861,288 | | | | 23,665,130 | |
| | 79,161 | | | | 1,000,906 | | | | 35,020 | | | | 430,135 | | | | 323,494 | | | | 3,810,269 | | | | 205,933 | | | | 2,491,951 | |
| | (506,011 | ) | | | (6,403,795 | ) | | | (547,208 | ) | | | (6,898,211 | ) | | | (963,955 | ) | | | (11,540,780 | ) | | | (762,339 | ) | | | (9,819,000 | ) |
| | (224,326 | ) | | | (2,813,645 | ) | | | (370,744 | ) | | | (4,668,583 | ) | | | (504,907 | ) | | | (6,114,934 | ) | | | 1,513,761 | | | | 19,024,369 | |
| | | | | | | | | | | | | | | | | | | | | | | | | | | | | | | |
| | 51,109 | | | | 643,583 | | | | 118,199 | | | | 1,490,712 | | | | 118,517 | | | | 1,379,550 | | | | 141,983 | | | | 1,775,390 | |
| | — | | | | — | | | | — | | | | — | | | | — | | | | — | | | | 1,476,741 | | | | 18,389,246 | |
| | 44,445 | | | | 562,906 | | | | 12,159 | | | | 148,061 | | | | 174,370 | | | | 2,004,795 | | | | 115,127 | | | | 1,359,504 | |
| | (372,001 | ) | | | (4,669,530 | ) | | | (478,345 | ) | | | (6,050,659 | ) | | | (857,963 | ) | | | (10,067,557 | ) | | | (656,628 | ) | | | (8,249,620 | ) |
| | (276,447 | ) | | | (3,463,041 | ) | | | (347,987 | ) | | | (4,411,886 | ) | | | (565,076 | ) | | | (6,683,212 | ) | | | 1,077,223 | | | | 13,274,520 | |
| | | | | | | | | | | | | | | | | | | | | | | | | | | | | | | |
| | 184,646 | | | | 2,312,741 | | | | 225,730 | | | | 2,847,974 | | | | 164,372 | | | | 1,971,060 | | | | 148,568 | | | | 1,922,084 | |
| | | | | | | | | | | | | | | | | | | | | | | | | | | | | | | |
| | — | | | | — | | | | 2,931 | | | | 36,657 | | | | — | | | | — | | | | 407,163 | | | | 5,218,882 | |
| | 48,014 | | | | 607,722 | | | | 26,018 | | | | 320,763 | | | | 75,626 | | | | 898,983 | | | | 52,816 | | | | 646,098 | |
| | (910,971 | ) | | | (11,693,117 | ) | | | (612,658 | ) | | | (7,794,169 | ) | | | (443,819 | ) | | | (5,330,763 | ) | | | (433,253 | ) | | | (5,620,964 | ) |
| | (678,311 | ) | | | (8,772,654 | ) | | | (357,979 | ) | | | (4,588,775 | ) | | | (203,821 | ) | | | (2,460,720 | ) | | | 175,294 | | | | 2,166,100 | |
| | | | | | | | | | | | | | | | | | | | | | | | | | | | | | | |
| | — | | | | — | | | | — | | | | — | | | | — | | | | — | | | | 737 | | | | 9,726 | |
| | — | | | | — | | | | 23 | | | | 289 | | | | — | | | | — | | | | 5 | | | | 68 | |
| | — | | | | — | | | | — | | | | — | | | | — | | | | — | | | | — | | | | — | |
| | — | | | | — | | | | (2,945 | ) | | | (36,657 | ) | | | — | | | | — | | | | (1,308 | ) | | | (16,690 | ) |
| | — | | | | — | | | | (2,922 | ) | | | (36,368 | ) | | | — | | | | — | | | | (566 | ) | | | (6,896 | ) |
| | | | | | | | | | | | | | | | | | | | | | | | | | | | | | | |
| | (1,179,084 | ) | | $ | (15,049,340 | ) | | | (1,079,632 | ) | | $ | (13,705,612 | ) | | | (1,273,804 | ) | | $ | (15,258,866 | ) | | | 2,765,712 | | | $ | 34,458,093 | |
Statement of Cash Flows
For the Year Ended December 31, 2016
| | | Touchstone | |
| | | Dynamic | |
| | | Equity | |
| | | Fund | |
| Cash Flows Used in Operating Activities | | | | |
| | | | | |
| Change in net assets resulting from operations | | $ | 7,742,079 | |
| | | | | |
| Adjustments to reconcile net increase (decrease) in net assets resulting from operations to net cash used in operating activities: | | | | |
| Purchases of investments | | | (411,136,158 | ) |
| Proceeds from disposition of investments | | | 370,451,562 | |
| Net sales of purchased options | | | 908,347 | |
| Premiums on call and put options written | | | 29,151,984 | |
| Covers of written options | | | (36,237,485 | ) |
| Proceeds from securities sold short | | | 97,327,946 | |
| Covers of securities sold short | | | (91,588,766 | ) |
| Net sales of short term securities | | | (3,463,723 | ) |
| Increase in receivable for investments sold | | | (111,968 | ) |
| Proceeds from litigation settlements | | | 2,286 | |
| Return of capital received from investments | | | 79,733 | |
| Decrease in deposits with Prime Broker | | | 701,512 | |
| Increase in dividends and interest receivable | | | (149,445 | ) |
| Increase in other assets | | | (3,375 | ) |
| Decrease in dividend and interest payable on securities sold short | | | (21,332 | ) |
| Decrease in payable to Trustees | | | (3,593 | ) |
| Increase in payable to cover options | | | 175,335 | |
| Increase in payable to Investment Advisor | | | 46,062 | |
| Increase in payable to other affiliates | | | 10,296 | |
| Increase in other accrued expenses and liabilities | | | 9,258 | |
| Net realized (gains) on investments | | | (10,843,112 | ) |
| Net realized losses on written options | | | 5,982,071 | |
| Net realized losses on securities sold short | | | 1,975,030 | |
| Net change in unrealized (appreciation) depreciation on investments | | | (3,747,405 | ) |
| Net change in unrealized (appreciation) depreciation on written options | | | 156,011 | |
| Net change in unrealized (appreciation) depreciation on securities sold short | | | 683,114 | |
| Net cash used in operating activities | | | (41,903,736 | ) |
| | | | | |
| Cash Flows provided by Financing Activities | | | | |
| Proceeds from shares sold | | | 92,316,193 | |
| Cash distributions paid | | | (73,620 | ) |
| Proceeds from shares redeemed | | | (50,338,240 | ) |
| Net cash provided by financing activities | | | 41,904,333 | |
| | | | | |
| Net change in cash | | | 597 | |
| Cash - beginning of the period | | | — | |
| Cash - end of period | | $ | 597 | |
| | | | | |
| Supplemental disclosure of cash flow information: | | | | |
| Reinvestment of dividends and distributions | | $ | 685,226 | |
| Dividend and interest paid | | $ | 485,079 | |
See accompanying Notes to Financial Statements.
Financial Highlights
Touchstone Dynamic Equity Fund—Class A
Selected Data for a Share Outstanding Throughout Each Period
| | | | | | Five | | | | |
| | | | | | Months | | | | |
| | | | | | Ended | | | Year Ended | |
| | | Year Ended December 31, | | | December 31, | | | July 31, | |
| | | 2016 | | | 2015 | | | 2014 | | | 2013 | | | 2012(A) | | | 2012 | |
| Net asset value at beginning of period | | $ | 14.52 | | | $ | 13.59 | | | $ | 13.15 | | | $ | 11.05 | | | $ | 11.20 | | | $ | 10.26 | |
| Income (loss) from investment operations: | | | | | | | | | | | | | | | | | | | | | | | | |
| Net investment income (loss) | | | 0.19 | (B) | | | 0.13 | | | | — | (B)(C) | | | 0.04 | | | | 0.04 | (B) | | | (0.07 | )(B) |
| Net realized and unrealized gains (losses) on investments | | | 0.53 | | | | 0.80 | | | | 0.48 | | | | 2.06 | | | | (0.19 | ) | | | 1.09 | |
| Total from investment operations | | | 0.72 | | | | 0.93 | | | | 0.48 | | | | 2.10 | | | | (0.15 | ) | | | 1.02 | |
| Distributions from: | | | | | | | | | | | | | | | | | | | | | | | | |
| Net investment income | | | (0.06 | ) | | | — | | | | (0.04 | ) | | | — | | | | — | | | | (0.08 | ) |
| Net asset value at end of period | | $ | 15.18 | | | $ | 14.52 | | | $ | 13.59 | | | $ | 13.15 | | | $ | 11.05 | | | $ | 11.20 | |
| Total return(D) | | | 4.95 | % | | | 6.84 | % | | | 3.64 | % | | | 19.01 | % | | | (1.34 | %)(E) | | | 10.00 | % |
| Ratios and supplemental data: | | | | | | | | | | | | | | | | | | | | | | | | |
| Net assets at end of period (000's) | | $ | 15,525 | | | $ | 12,029 | | | $ | 11,546 | | | $ | 15,300 | | | $ | 16,156 | | | $ | 17,919 | |
| Ratio to average net assets: | | | | | | | | | | | | | | | | | | | | | | | | |
| Net expenses (including dividend and interest expense on securities sold short)(F) | | | 1.90 | % | | | 2.01 | % | | | 2.07 | % | | | 2.21 | % | | | 2.46 | %(G) | | | 2.80 | % |
| Gross expenses (including dividend and interest expense on securities sold short)(H) | | | 1.91 | % | | | 2.16 | % | | | 2.18 | % | | | 2.41 | % | | | 2.65 | %(G) | | | 3.08 | % |
| Net investment income (loss) | | | 1.30 | % | | | 0.87 | % | | | 0.01 | % | | | 0.30 | % | | | 0.88 | %(G) | | | (0.63 | %) |
| Portfolio turnover rate | | | 245 | % | | | 235 | % | | | 236 | % | | | 382 | % | | | 105 | %(E) | | | 234 | % |
| (A) | The Fund changed its fiscal year end from July 31 to December 31. |
| (B) | The net investment income (loss) per share is based on average shares outstanding for the period. |
| (C) | Less than $0.005 per share. |
| (D) | Total returns shown exclude the effect of applicable sales loads. If these charges were included, the returns would be lower. |
| (F) | The ratio of net expenses to average net assets excluding dividend and interest expense on securities sold short is 1.55%, 1.55%, 1.55%, 1.55%, 1.55% and 1.55% for the years ended December 31, 2016, 2015, 2014 and 2013, period ended December 31, 2012 and year ended July 31, 2012, respectively. |
| (H) | The ratio of gross expenses to average net assets excluding dividend and interest expense on securities sold short is 1.56%, 1.70%, 1.66%, 1.75%, 1.74% and 1.82% for the years ended December 31, 2016, 2015, 2014 and 2013, period ended December 31, 2012 and year ended July 31, 2012, respectively. |
See accompanying Notes to Financial Statements.
Financial Highlights (Continued)
Touchstone Dynamic Equity Fund—Class C
Selected Data for a Share Outstanding Throughout Each Period
| | | | | | Five | | | | |
| | | | | | Months | | | | |
| | | | | | Ended | | | Year Ended | |
| | | Year Ended December 31, | | | December 31, | | | July 31, | |
| | | 2016 | | | 2015 | | | 2014 | | | 2013 | | | 2012(A) | | | 2012 | |
| Net asset value at beginning of period | | $ | 13.47 | | | $ | 12.70 | | | $ | 12.35 | | | $ | 10.46 | | | $ | 10.63 | | | $ | 9.79 | |
| Income (loss) from investment operations: | | | | | | | | | | | | | | | | | | | | | | | | |
| Net investment income (loss) | | | 0.07 | (B) | | | 0.02 | | | | (0.09 | )(B) | | | (0.08 | ) | | | 0.01 | (B) | | | (0.14 | )(B) |
| Net realized and unrealized gains (losses) on investments | | | 0.49 | | | | 0.75 | | | | 0.44 | | | | 1.97 | | | | (0.18 | ) | | | 1.03 | |
| Total from investment operations | | | 0.56 | | | | 0.77 | | | | 0.35 | | | | 1.89 | | | | (0.17 | ) | | | 0.89 | |
| Distributions from: | | | | | | | | | | | | | | | | | | | | | | | | |
| Net investment income | | | — | | | | — | | | | — | | | | — | | | | — | | | | (0.05 | ) |
| Net asset value at end of period | | $ | 14.03 | | | $ | 13.47 | | | $ | 12.70 | | | $ | 12.35 | | | $ | 10.46 | | | $ | 10.63 | |
| Total return(C) | | | 4.16 | % | | | 6.06 | % | | | 2.83 | % | | | 18.07 | % | | | (1.60 | %)(D) | | | 9.09 | % |
| Ratios and supplemental data: | | | | | | | | | | | | | | | | | | | | | | | | |
| Net assets at end of period (000's) | | $ | 12,256 | | | $ | 10,911 | | | $ | 10,486 | | | $ | 10,261 | | | $ | 10,420 | | | $ | 11,684 | |
| Ratio to average net assets: | | | | | | | | | | | | | | | | | | | | | | | | |
| Net expenses (including dividend and interest expense on securities sold short)(E) | | | 2.65 | % | | | 2.76 | % | | | 2.82 | % | | | 2.96 | % | | | 3.21 | %(F) | | | 3.55 | % |
| Gross expenses (including dividend and interest expense on securities sold short)(G) | | | 2.71 | % | | | 2.90 | % | | | 2.96 | % | | | 3.20 | % | | | 3.48 | %(F) | | | 3.75 | % |
| Net investment income (loss) | | | 0.55 | % | | | 0.12 | % | | | (0.74 | %) | | | (0.45 | %) | | | 0.13 | %(F) | | | (1.38 | %) |
| Portfolio turnover rate | | | 245 | % | | | 235 | % | | | 236 | % | | | 382 | % | | | 105 | %(D) | | | 234 | % |
| (A) | The Fund changed its fiscal year end from July 31 to December 31. |
| (B) | The net investment income (loss) per share is based on average shares outstanding for the period. |
| (C) | Total returns shown exclude the effect of applicable sales loads. If these charges were included, the returns would be lower. |
| (E) | The ratio of net expenses to average net assets excluding dividend and interest expense on securities sold short is 2.30%, 2.30%, 2.30%, 2.30%, 2.30% and 2.30% for the years ended December 31, 2016, 2015, 2014 and 2013, period ended December 31, 2012 and year ended July 31, 2012, respectively. |
| (G) | The ratio of gross expenses to average net assets excluding dividend and interest expense on securities sold short is 2.36%, 2.44%, 2.44%, 2.54%, 2.57% and 2.50% for the years ended December 31, 2016, 2015, 2014 and 2013, period ended December 31, 2012 and year ended July 31, 2012, respectively. |
See accompanying Notes to Financial Statements.
Financial Highlights (Continued)
Touchstone Dynamic Equity Fund—Class Y
Selected Data for a Share Outstanding Throughout Each Period
| | | | | | Five | | | | |
| | | | | | Months | | | | |
| | | | | | Ended | | | Year Ended | |
| | | Year Ended December 31, | | | December 31, | | | July 31, | |
| | | 2016 | | | 2015 | | | 2014 | | | 2013 | | | 2012(A) | | | 2012 | |
| Net asset value at beginning of period | | $ | 14.76 | | | $ | 13.80 | | | $ | 13.37 | | | $ | 11.22 | | | $ | 11.35 | | | $ | 10.40 | |
| Income (loss) from investment operations: | | | | | | | | | | | | | | | | | | | | | | | | |
| Net investment income (loss) | | | 0.24 | (B) | | | 0.17 | | | | 0.04 | (B) | | | 0.07 | | | | 0.05 | (B) | | | (0.04 | )(B) |
| Net realized and unrealized gains (losses) on investments | | | 0.54 | | | | 0.81 | | | | 0.49 | | | | 2.08 | | | | (0.18 | ) | | | 1.09 | |
| Total from investment operations | | | 0.78 | | | | 0.98 | | | | 0.53 | | | | 2.15 | | | | (0.13 | ) | | | 1.05 | |
| Distributions from: | | | | | | | | | | | | | | | | | | | | | | | | |
| Net investment income | | | (0.09 | ) | | | (0.02 | ) | | | (0.10 | ) | | | (— | )(C) | | | — | | | | (0.10 | ) |
| Net asset value at end of period | | $ | 15.45 | | | $ | 14.76 | | | $ | 13.80 | | | $ | 13.37 | | | $ | 11.22 | | | $ | 11.35 | |
| Total return | | | 5.31 | % | | | 7.12 | % | | | 3.95 | % | | | 19.20 | % | | | (1.15 | %)(D) | | | 10.14 | % |
| Ratios and supplemental data: | | | | | | | | | | | | | | | | | | | | | | | | |
| Net assets at end of period (000's) | | $ | 96,807 | | | $ | 64,986 | | | $ | 43,349 | | | $ | 24,066 | | | $ | 20,397 | | | $ | 24,054 | |
| Ratio to average net assets: | | | | | | | | | | | | | | | | | | | | | | | | |
| Net expenses (including dividend and interest expense on securities sold short)(E)(F) | | | 1.57 | % | | | 1.71 | % | | | 1.78 | % | | | 1.96 | % | | | 2.21 | %(G) | | | 2.56 | % |
| Gross expenses (including dividend and interest expense on securities sold short)(H) | | | 1.57 | % | | | 1.71 | % | | | 1.76 | % | | | 1.95 | % | | | 2.31 | %(G) | | | 2.60 | % |
| Net investment income (loss) | | | 1.64 | % | | | 1.17 | % | | | 0.30 | % | | | 0.55 | % | | | 1.13 | %(G) | | | (0.38 | %) |
| Portfolio turnover rate | | | 245 | % | | | 235 | % | | | 236 | % | | | 382 | % | | | 105 | %(D) | | | 234 | % |
| (A) | The Fund changed its fiscal year end from July 31 to December 31. |
| (B) | The net investment income (loss) per share is based on average shares outstanding for the period. |
| (C) | Less than $(0.005) per share. |
| (E) | The ratio of net expenses to average net assets excluding dividend and interest expense on securities sold short is 1.22%, 1.25%, 1.26%, 1.30%, 1.30% and 1.30% for the years ended December 31, 2016, 2015, 2014 and 2013, period ended December 31, 2012 and year ended July 31, 2012, respectively. |
| (F) | Net expenses include amounts recouped by the Advisor. |
| (H) | The ratio of gross expenses to average net assets excluding dividend and interest expense on securities sold short is 1.22%, 1.25%, 1.24%, 1.29%, 1.40% and 1.35% for the years ended December 31, 2016, 2015, 2014 and 2013, period ended December 31, 2012 and year ended July 31, 2012, respectively. |
See accompanying Notes to Financial Statements.
Financial Highlights (Continued)
Touchstone Dynamic Equity Fund—Institutional Class
Selected Data for a Share Outstanding Throughout Each Period
| | | | | | Five | | | | |
| | | | | | Months | | | | |
| | | | | | Ended | | | Year Ended | |
| | | Year Ended December 31, | | | December 31, | | | July 31, | |
| | | 2016 | | | 2015 | | | 2014 | | | 2013 | | | 2012(A) | | | 2012 | |
| Net asset value at beginning of period | | $ | 14.82 | | | $ | 13.83 | | | $ | 13.39 | | | $ | 11.23 | | | $ | 11.36 | | | $ | 10.40 | |
| Income (loss) from investment operations: | | | | | | | | | | | | | | | | | | | | | | | | |
| Net investment income (loss) | | | 0.24 | (B) | | | 0.16 | | | | 0.04 | (B) | | | 0.12 | | | | 0.06 | (B) | | | (0.04 | )(B) |
| Net realized and unrealized gains (losses) on investments | | | 0.54 | | | | 0.83 | | | | 0.49 | | | | 2.05 | | | | (0.19 | ) | | | 1.10 | |
| Total from investment operations | | | 0.78 | | | | 0.99 | | | | 0.53 | | | | 2.17 | | | | (0.13 | ) | | | 1.06 | |
| Distributions from: | | | | | | | | | | | | | | | | | | | | | | | | |
| Net investment income | | | (0.09 | ) | | | (— | )(C) | | | (0.09 | ) | | | (0.01 | ) | | | — | | | | (0.10 | ) |
| Net asset value at end of period | | $ | 15.51 | | | $ | 14.82 | | | $ | 13.83 | | | $ | 13.39 | | | $ | 11.23 | | | $ | 11.36 | |
| Total return | | | 5.27 | % | | | 7.19 | % | | | 3.98 | % | | | 19.29 | % | | | (1.15 | %)(D) | | | 10.27 | % |
| Ratios and supplemental data: | | | | | | | | | | | | | | | | | | | | | | | | |
| Net assets at end of period (000's) | | $ | 18,879 | | | $ | 9,242 | | | $ | 12,297 | | | $ | 15,523 | | | $ | 20,085 | | | $ | 6,168 | |
| Ratio to average net assets: | | | | | | | | | | | | | | | | | | | | | | | | |
| Net expenses (including dividend and interest expense on securities sold short)(E)(F) | | | 1.59 | % | | | 1.71 | % | | | 1.77 | % | | | 1.91 | % | | | 2.16 | %(G) | | | 2.50 | % |
| Gross expenses (including dividend and interest expense on securities sold short)(H) | | | 1.54 | % | | | 1.72 | % | | | 1.76 | % | | | 1.95 | % | | | 2.18 | %(G) | | | 2.95 | % |
| Net investment income (loss) | | | 1.61 | % | | | 1.17 | % | | | 0.31 | % | | | 0.60 | % | | | 1.18 | %(G) | | | (0.33 | %) |
| Portfolio turnover rate | | | 245 | % | | | 235 | % | | | 236 | % | | | 382 | % | | | 105 | %(D) | | | 234 | % |
| (A) | The Fund changed its fiscal year end from July 31 to December 31. |
| (B) | The net investment income (loss)per share is based on average shares outstanding for the period. |
| (C) | Less than $(0.005) per share. |
| (E) | The ratio of net expenses to average net assets excluding dividend and interest expense on securities sold short is 1.24%, 1.25%, 1.25%, 1.25%, 1.25% and 1.25% for the years ended December 31, 2016, 2015, 2014 and 2013, period ended December 31, 2012 and year ended July 31, 2012, respectively. |
| (F) | Net expenses include amounts recouped by the Advisor. |
| (H) | The ratio of gross expenses to average net assets excluding dividend and interest expense on securities sold short is 1.19%, 1.26%, 1.24%, 1.29%, 1.27% and 1.70% for the years ended December 31, 2016, 2015, 2014 and 2013, period ended December 31, 2012 and year ended July 31, 2012, respectively. |
See accompanying Notes to Financial Statements.
Financial Highlights (Continued)
Touchstone Controlled Growth with Income Fund—Class A
Selected Data for a Share Outstanding Throughout Each Period
| | | | | | Five | | | | |
| | | | | | Months | | | | |
| | | | | | Ended | | | Year Ended | |
| | | Year Ended December 31, | | | December 31, | | | July 31, | |
| | | 2016 | | | 2015 | | | 2014 | | | 2013 | | | 2012(A) | | | 2012 | |
| Net asset value at beginning of period | | $ | 10.83 | | | $ | 11.08 | | | $ | 10.93 | | | $ | 10.50 | | | $ | 10.98 | | | $ | 10.87 | |
| Income (loss) from investment operations: | | | | | | | | | | | | | | | | | | | | | | | | |
| Net investment income | | | 0.15 | | | | 0.14 | | | | 0.21 | | | | 0.19 | (B) | | | 0.10 | (B) | | | 0.21 | (B) |
| Net realized and unrealized gains (losses) on investments | | | 0.47 | | | | (0.22 | ) | | | 0.17 | | | | 0.45 | | | | 0.17 | | | | 0.13 | |
| Total from investment operations | | | 0.62 | | | | (0.08 | ) | | | 0.38 | | | | 0.64 | | | | 0.27 | | | | 0.34 | |
| Distributions from: | | | | | | | | | | | | | | | | | | | | | | | | |
| Net investment income | | | (0.23 | ) | | | (0.17 | ) | | | (0.23 | ) | | | (0.21 | ) | | | (0.28 | ) | | | (0.23 | ) |
| Realized capital gains | | | — | (C) | | | — | | | | — | | | | — | | | | (0.47 | ) | | | — | |
| Total distributions | | | (0.23 | ) | | | (0.17 | ) | | | (0.23 | ) | | | (0.21 | ) | | | (0.75 | ) | | | (0.23 | ) |
| Net asset value at end of period | | $ | 11.22 | | | $ | 10.83 | | | $ | 11.08 | | | $ | 10.93 | | | $ | 10.50 | | | $ | 10.98 | |
| Total return(D) | | | 5.82 | % | | | (0.68 | %) | | | 3.51 | % | | | 6.14 | % | | | 2.47 | %(E) | | | 3.23 | % |
| Ratios and supplemental data: | | | | | | | | | | | | | | | | | | | | | | | | |
| Net assets at end of period (000's) | | $ | 15,327 | | | $ | 15,542 | | | $ | 17,408 | | | $ | 24,857 | | | $ | 32,965 | | | $ | 8,466 | |
| Ratio to average net assets: | | | | | | | | | | | | | | | | | | | | | | | | |
| Net expenses(F) | | | 0.49 | % | | | 0.49 | % | | | 0.46 | % | | | 0.35 | % | | | 0.40 | %(G) | | | 0.61 | % |
| Gross expenses(F) | | | 1.04 | % | | | 0.96 | % | | | 0.89 | % | | | 0.89 | % | | | 0.85 | %(G) | | | 1.02 | % |
| Net investment income(F) | | | 1.38 | % | | | 1.25 | % | | | 1.79 | % | | | 1.74 | % | | | 2.28 | %(G) | | | 1.95 | % |
| Portfolio turnover rate | | | 41 | % | | | 92 | % | | | 11 | % | | | 30 | % | | | 79 | %(E)(H) | | | 89 | % |
Touchstone Controlled Growth with Income Fund—Class C
Selected Data for a Share Outstanding Throughout Each Period
| | | | | | Five | | | | |
| | | | | | Months | | | | |
| | | | | | Ended | | | Year Ended | |
| | | Year Ended December 31, | | | December 31, | | | July 31, | |
| | | 2016 | | | 2015 | | | 2014 | | | 2013 | | | 2012(A) | | | 2012 | |
| Net asset value at beginning of period | | $ | 10.78 | | | $ | 11.03 | | | $ | 10.88 | | | $ | 10.45 | | | $ | 10.92 | | | $ | 10.81 | |
| Income (loss) from investment operations: | | | | | | | | | | | | | | | | | | | | | | | | |
| Net investment income | | | 0.07 | | | | 0.06 | | | | 0.12 | | | | 0.11 | (B) | | | 0.07 | (B) | | | 0.13 | (B) |
| Net realized and unrealized gains (losses) on investments | | | 0.46 | | | | (0.22 | ) | | | 0.18 | | | | 0.45 | | | | 0.17 | | | | 0.13 | |
| Total from investment operations | | | 0.53 | | | | (0.16 | ) | | | 0.30 | | | | 0.56 | | | | 0.24 | | | | 0.26 | |
| Distributions from: | | | | | | | | | | | | | | | | | | | | | | | | |
| Net investment income | | | (0.15 | ) | | | (0.09 | ) | | | (0.15 | ) | | | (0.13 | ) | | | (0.24 | ) | | | (0.15 | ) |
| Realized capital gains | | | — | (C) | | | — | | | | — | | | | — | | | | (0.47 | ) | | | — | |
| Total distributions | | | (0.15 | ) | | | (0.09 | ) | | | (0.15 | ) | | | (0.13 | ) | | | (0.71 | ) | | | (0.15 | ) |
| Net asset value at end of period | | $ | 11.16 | | | $ | 10.78 | | | $ | 11.03 | | | $ | 10.88 | | | $ | 10.45 | | | $ | 10.92 | |
| Total return(D) | | | 4.95 | % | | | (1.45 | %) | | | 2.76 | % | | | 5.36 | % | | | 2.18 | %(E) | | | 2.50 | % |
| Ratios and supplemental data: | | | | | | | | | | | | | | | | | | | | | | | | |
| Net assets at end of period (000's) | | $ | 9,986 | | | $ | 11,281 | | | $ | 14,357 | | | $ | 15,275 | | | $ | 17,972 | | | $ | 17,104 | |
| Ratio to average net assets: | | | | | | | | | | | | | | | | | | | | | | | | |
| Net expenses(F) | | | 1.24 | % | | | 1.24 | % | | | 1.21 | % | | | 1.10 | % | | | 1.15 | %(G) | | | 1.36 | % |
| Gross expenses(F) | | | 1.81 | % | | | 1.68 | % | | | 1.65 | % | | | 1.64 | % | | | 1.67 | %(G) | | | 1.70 | % |
| Net investment income(F) | | | 0.63 | % | | | 0.50 | % | | | 1.04 | % | | | 0.99 | % | | | 1.53 | %(G) | | | 1.20 | % |
| Portfolio turnover rate | | | 41 | % | | | 92 | % | | | 11 | % | | | 30 | % | | | 79 | %(E)(H) | | | 89 | % |
| (A) | The Fund changed its fiscal year end from July 31 to December 31. |
| (B) | The net investment income per share is based on average shares outstanding for the period. |
| (C) | Less than $0.005 per share. |
| (D) | Total returns shown exclude the effect of applicable sales loads. If these charges were included, the returns would be lower. |
| (F) | Ratio does not include expenses of the underlying funds. |
| (H) | Portfolio turnover excludes the purchases and sales of the Fifth Third LifeModel Conservative Fund and Fifth Third LifeModel Moderately Conservative Fund acquired on September 10, 2012. If these transactions were included, portfolio turnover would have been higher. |
See accompanying Notes to Financial Statements.
Financial Highlights (Continued)
Touchstone Controlled Growth with Income Fund—Class Y
Selected Data for a Share Outstanding Throughout Each Period
| | | | | | Five | | | | |
| | | | | | Months | | | | |
| | | | | | Ended | | | Year Ended | |
| | | Year Ended December 31, | | | December 31, | | | July 31, | |
| | | 2016 | | | 2015 | | | 2014 | | | 2013 | | | 2012(A) | | | 2012 | |
| Net asset value at beginning of period | | $ | 10.83 | | | $ | 11.08 | | | $ | 10.93 | | | $ | 10.51 | | | $ | 10.99 | | | $ | 10.87 | |
| Income (loss) from investment operations: | | | | | | | | | | | | | | | | | | | | | | | | |
| Net investment income | | | 0.16 | | | | 0.17 | | | | 0.25 | | | | 0.21 | (B) | | | 0.12 | (B) | | | 0.24 | (B) |
| Net realized and unrealized gains (losses) on investments | | | 0.48 | | | | (0.22 | ) | | | 0.16 | | | | 0.45 | | | | 0.16 | | | | 0.14 | |
| Total from investment operations | | | 0.64 | | | | (0.05 | ) | | | 0.41 | | | | 0.66 | | | | 0.28 | | | | 0.38 | |
| Distributions from: | | | | | | | | | | | | | | | | | | | | | | | | |
| Net investment income | | | (0.26 | ) | | | (0.20 | ) | | | (0.26 | ) | | | (0.24 | ) | | | (0.29 | ) | | | (0.26 | ) |
| Realized capital gains | | | — | (C) | | | — | | | | — | | | | — | | | | (0.47 | ) | | | — | |
| Total distributions | | | (0.26 | ) | | | (0.20 | ) | | | (0.26 | ) | | | (0.24 | ) | | | (0.76 | ) | | | (0.26 | ) |
| Net asset value at end of period | | $ | 11.21 | | | $ | 10.83 | | | $ | 11.08 | | | $ | 10.93 | | | $ | 10.51 | | | $ | 10.99 | |
| Total return | | | 5.99 | % | | | (0.43 | %) | | | 3.78 | % | | | 6.31 | % | | | 2.60 | %(D) | | | 3.60 | % |
| Ratios and supplemental data: | | | | | | | | | | | | | | | | | | | | | | | | |
| Net assets at end of period (000's) | | $ | 13,782 | | | $ | 8,802 | | | $ | 11,931 | | | $ | 23,230 | | | $ | 33,329 | | | $ | 2,156 | |
| Ratio to average net assets: | | | | | | | | | | | | | | | | | | | | | | | | |
| Net expenses(E) | | | 0.24 | % | | | 0.24 | % | | | 0.21 | % | | | 0.10 | % | | | 0.15 | %(F) | | | 0.36 | % |
| Gross expenses(E) | | | 0.90 | % | | | 0.79 | % | | | 0.65 | % | | | 0.62 | % | | | 0.57 | %(F) | | | 1.38 | % |
| Net investment income(E) | | | 1.63 | % | | | 1.50 | % | | | 2.04 | % | | | 1.99 | % | | | 2.53 | %(F) | | | 2.20 | % |
| Portfolio turnover rate | | | 41 | % | | | 92 | % | | | 11 | % | | | 30 | % | | | 79 | %(D)(G) | | | 89 | % |
| (A) | The Fund changed its fiscal year end from July 31 to December 31. |
| (B) | The net investment income per share is based on average shares outstanding for the period. |
| (C) | Less than $0.005 per share. |
| (E) | Ratio does not include expenses of the underlying funds. |
| (G) | Portfolio turnover excludes the purchases and sales of the Fifth Third LifeModel Conservative Fund and Fifth Third LifeModel Moderately Conservative Fund acquired on September 10, 2012. If these transactions were included, portfolio turnover would have been higher. |
See accompanying Notes to Financial Statements.
Financial Highlights (Continued)
Touchstone Dynamic Diversified Income Fund—Class A
Selected Data for a Share Outstanding Throughout Each Period
| | | | | | Five | | | | |
| | | | | | Months | | | | |
| | | | | | Ended | | | Year Ended | |
| | | Year Ended December 31, | | | December 31, | | | July 31, | |
| | | 2016 | | | 2015 | | | 2014 | | | 2013 | | | 2012(A) | | | 2012 | |
| Net asset value at beginning of period | | $ | 12.15 | | | $ | 12.66 | | | $ | 12.37 | | | $ | 11.13 | | | $ | 11.18 | | | $ | 11.03 | |
| Income (loss) from investment operations: | | | | | | | | | | | | | | | | | | | | | | | | |
| Net investment income | | | 0.48 | | | | 0.18 | | | | 0.22 | | | | 0.17 | | | | 0.13 | (B) | | | 0.17 | (B) |
| Net realized and unrealized gains (losses) on investments | | | 0.58 | | | | (0.50 | ) | | | 0.33 | | | | 1.30 | | | | 0.35 | | | | 0.14 | |
| Total from investment operations | | | 1.06 | | | | (0.32 | ) | | | 0.55 | | | | 1.47 | | | | 0.48 | | | | 0.31 | |
| Distributions from: | | | | | | | | | | | | | | | | | | | | | | | | |
| Net investment income | | | (0.48 | ) | | | (0.19 | ) | | | (0.26 | ) | | | (0.23 | ) | | | (0.24 | ) | | | (0.16 | ) |
| Realized capital gains | | | — | | | | — | | | | — | | | | — | | | | (0.29 | ) | | | — | |
| Total distributions | | | (0.48 | ) | | | (0.19 | ) | | | (0.26 | ) | | | (0.23 | ) | | | (0.53 | ) | | | (0.16 | ) |
| Net asset value at end of period | | $ | 12.73 | | | $ | 12.15 | | | $ | 12.66 | | | $ | 12.37 | | | $ | 11.13 | | | $ | 11.18 | |
| Total return(C) | | | 8.81 | % | | | (2.54 | %) | | | 4.46 | % | | | 13.28 | % | | | 4.37 | %(D) | | | 2.89 | % |
| Ratios and supplemental data: | | | | | | | | | | | | | | | | | | | | | | | | |
| Net assets at end of period (000's) | | $ | 28,316 | | | $ | 29,754 | | | $ | 35,689 | | | $ | 46,285 | | | $ | 49,118 | | | $ | 9,839 | |
| Ratio to average net assets: | | | | | | | | | | | | | | | | | | | | | | | | |
| Net expenses(E) | | | 0.49 | % | | | 0.49 | % | | | 0.46 | % | | | 0.35 | % | | | 0.41 | %(F) | | | 0.64 | % |
| Gross expenses(E) | | | 0.90 | % | | | 0.86 | % | | | 0.83 | % | | | 0.86 | % | | | 0.83 | %(F) | | | 0.97 | % |
| Net investment income(E) | | | 3.73 | % | | | 1.38 | % | | | 1.61 | % | | | 1.42 | % | | | 2.75 | %(F) | | | 1.58 | % |
| Portfolio turnover rate | | | 32 | % | | | 77 | % | | | 11 | % | | | 32 | % | | | 74 | %(D)(G) | | | 76 | % |
Touchstone Dynamic Diversified Income Fund—Class C
Selected Data for a Share Outstanding Throughout Each Period
| | | | | | Five | | | | |
| | | | | | Months | | | | |
| | | | | | Ended | | | Year Ended | |
| | | Year Ended December 31, | | | December 31, | | | July 31, | |
| | | 2016 | | | 2015 | | | 2014 | | | 2013 | | | 2012(A) | | | 2012 | |
| Net asset value at beginning of period | | $ | 12.17 | | | $ | 12.67 | | | $ | 12.36 | | | $ | 11.12 | | | $ | 11.14 | | | $ | 11.01 | |
| Income (loss) from investment operations: | | | | | | | | | | | | | | | | | | | | | | | | |
| Net investment income | | | 0.38 | | | | 0.09 | | | | 0.11 | | | | 0.08 | | | | 0.09 | (B) | | | 0.09 | (B) |
| Net realized and unrealized gains (losses) on investments | | | 0.58 | | | | (0.50 | ) | | | 0.33 | | | | 1.30 | | | | 0.35 | | | | 0.14 | |
| Total from investment operations | | | 0.96 | | | | (0.41 | ) | | | 0.44 | | | | 1.38 | | | | 0.44 | | | | 0.23 | |
| Distributions from: | | | | | | | | | | | | | | | | | | | | | | | | |
| Net investment income | | | (0.38 | ) | | | (0.09 | ) | | | (0.13 | ) | | | (0.14 | ) | | | (0.17 | ) | | | (0.10 | ) |
| Realized capital gains | | | — | | | | — | | | | — | | | | — | | | | (0.29 | ) | | | — | |
| Total distributions | | | (0.38 | ) | | | (0.09 | ) | | | (0.13 | ) | | | (0.14 | ) | | | (0.46 | ) | | | (0.10 | ) |
| Net asset value at end of period | | $ | 12.75 | | | $ | 12.17 | | | $ | 12.67 | | | $ | 12.36 | | | $ | 11.12 | | | $ | 11.14 | |
| Total return(C) | | | 7.98 | % | | | (3.22 | %) | | | 3.59 | % | | | 12.45 | % | | | 4.03 | %(D) | | | 2.13 | % |
| Ratios and supplemental data: | | | | | | | | | | | | | | | | | | | | | | | | |
| Net assets at end of period (000's) | | $ | 25,197 | | | $ | 27,414 | | | $ | 32,961 | | | $ | 36,681 | | | $ | 38,226 | | | $ | 38,388 | |
| Ratio to average net assets: | | | | | | | | | | | | | | | | | | | | | | | | |
| Net expenses(E) | | | 1.24 | % | | | 1.24 | % | | | 1.21 | % | | | 1.10 | % | | | 1.16 | %(F) | | | 1.39 | % |
| Gross expenses(E) | | | 1.63 | % | | | 1.57 | % | | | 1.57 | % | | | 1.58 | % | | | 1.60 | %(F) | | | 1.59 | % |
| Net investment income(E) | | | 2.98 | % | | | 0.63 | % | | | 0.86 | % | | | 0.67 | % | | | 2.00 | %(F) | | | 0.84 | % |
| Portfolio turnover rate | | | 32 | % | | | 77 | % | | | 11 | % | | | 32 | % | | | 74 | %(D)(G) | | | 76 | % |
| (A) | The Fund changed its fiscal year end from July 31 to December 31. |
| (B) | The net investment income per share is based on average shares outstanding for the period. |
| (C) | Total returns shown exclude the effect of applicable sales loads. If these charges were included, the returns would be lower. |
| (E) | Ratio does not include expenses of the underlying funds. |
| (G) | Portfolio turnover excludes the purchases and sales of the Fifth Third LifeModel Moderate Fund acquired on September 10, 2012. If these transactions were included, portfolio turnover would have been higher. |
See accompanying Notes to Financial Statements.
Financial Highlights (Continued)
Touchstone Dynamic Diversified Income Fund—Class Y
Selected Data for a Share Outstanding Throughout Each Period
| | | | | | Five | | | | |
| | | | | | Months | | | | |
| | | | | | Ended | | | Year Ended | |
| | | Year Ended December 31, | | | December 31, | | | July 31, | |
| | | 2016 | | | 2015 | | | 2014 | | | 2013 | | | 2012(A) | | | 2012 | |
| Net asset value at beginning of period | | $ | 12.17 | | | $ | 12.68 | | | $ | 12.39 | | | $ | 11.15 | | | $ | 11.21 | | | $ | 11.05 | |
| Income (loss) from investment operations: | | | | | | | | | | | | | | | | | | | | | | | | |
| Net investment income | | | 0.55 | | | | 0.22 | | | | 0.27 | | | | 0.22 | | | | 0.14 | (B) | | | 0.20 | (B) |
| Net realized and unrealized gains (losses) on investments | | | 0.54 | | | | (0.51 | ) | | | 0.31 | | | | 1.28 | | | | 0.35 | | | | 0.14 | |
| Total from investment operations | | | 1.09 | | | | (0.29 | ) | | | 0.58 | | | | 1.50 | | | | 0.49 | | | | 0.34 | |
| Distributions from: | | | | | | | | | | | | | | | | | | | | | | | | |
| Net investment income | | | (0.51 | ) | | | (0.22 | ) | | | (0.29 | ) | | | (0.26 | ) | | | (0.26 | ) | | | (0.18 | ) |
| Realized capital gains | | | — | | | | — | | | | — | | | | — | | | | (0.29 | ) | | | — | |
| Total distributions | | | (0.51 | ) | | | (0.22 | ) | | | (0.29 | ) | | | (0.26 | ) | | | (0.55 | ) | | | (0.18 | ) |
| Net asset value at end of period | | $ | 12.75 | | | $ | 12.17 | | | $ | 12.68 | | | $ | 12.39 | | | $ | 11.15 | | | $ | 11.21 | |
| Total return | | | 9.06 | % | | | (2.29 | %) | | | 4.72 | % | | | 13.54 | % | | | 4.45 | %(C) | | | 3.18 | % |
| Ratios and supplemental data: | | | | | | | | | | | | | | | | | | | | | | | | |
| Net assets at end of period (000's) | | $ | 10,391 | | | $ | 18,168 | | | $ | 23,466 | | | $ | 34,079 | | | $ | 47,092 | | | $ | 1,287 | |
| Ratio to average net assets: | | | | | | | | | | | | | | | | | | | | | | | | |
| Net expenses(D) | | | 0.24 | % | | | 0.24 | % | | | 0.21 | % | | | 0.10 | % | | | 0.16 | %(E) | | | 0.39 | % |
| Gross expenses(D) | | | 0.73 | % | | | 0.65 | % | | | 0.58 | % | | | 0.59 | % | | | 0.52 | %(E) | | | 1.40 | % |
| Net investment income(D) | | | 3.98 | % | | | 1.63 | % | | | 1.86 | % | | | 1.67 | % | | | 3.00 | %(E) | | | 1.84 | % |
| Portfolio turnover rate | | | 32 | % | | | 77 | % | | | 11 | % | | | 32 | % | | | 74 | %(C)(F) | | | 76 | % |
| (A) | The Fund changed its fiscal year end from July 31 to December 31. |
| (B) | The net investment income per share is based on average shares outstanding for the period. |
| (D) | Ratio does not include expenses of the underlying funds. |
| (F) | Portfolio turnover excludes the purchases and sales of the Fifth Third LifeModel Moderate Fund acquired on September 10, 2012. If these transactions were included, portfolio turnover would have been higher. |
See accompanying Notes to Financial Statements.
Financial Highlights (Continued)
Touchstone Dynamic Global Allocation Fund—Class A
Selected Data for a Share Outstanding Throughout Each Period
| | | | | | | | | | | | | | | Five | | | | |
| | | | | | | | | | | | | | | Months | | | | |
| | | | | | | | | | | | | | | Ended | | | Year Ended | |
| | | Year Ended December 31, | | | December 31, | | | July 31, | |
| | | 2016 | | | 2015 | | | 2014 | | | 2013 | | | 2012(A) | | | 2012 | |
| Net asset value at beginning of period | | $ | 12.01 | | | $ | 12.89 | | | $ | 12.99 | | | $ | 11.30 | | | $ | 11.13 | | | $ | 11.11 | |
| Income (loss) from investment operations: | | | | | | | | | | | | | | | | | | | | | | | | |
| Net investment income | | | 0.28 | | | | 0.18 | | | | 0.20 | | | | 0.17 | | | | 0.14 | (B) | | | 0.15 | (B) |
| Net realized and unrealized gains (losses) on investments | | | 0.06 | | | | (0.57 | ) | | | 0.46 | | | | 1.77 | | | | 0.51 | | | | 0.02 | (C) |
| Total from investment operations | | | 0.34 | | | | (0.39 | ) | | | 0.66 | | | | 1.94 | | | | 0.65 | | | | 0.17 | |
| Distributions from: | | | | | | | | | | | | | | | | | | | | | | | | |
| Net investment income | | | (0.28 | ) | | | (0.19 | ) | | | (0.25 | ) | | | (0.25 | ) | | | (0.30 | ) | | | (0.15 | ) |
| Realized capital gains | | | (0.51 | ) | | | (0.30 | ) | | | (0.51 | ) | | | — | | | | (0.18 | ) | | | — | |
| Total distributions | | | (0.79 | ) | | | (0.49 | ) | | | (0.76 | ) | | | (0.25 | ) | | | (0.48 | ) | | | (0.15 | ) |
| Net asset value at end of period | | $ | 11.56 | | | $ | 12.01 | | | $ | 12.89 | | | $ | 12.99 | | | $ | 11.30 | | | $ | 11.13 | |
| Total return(D) | | | 2.80 | % | | | (3.09 | %) | | | 5.06 | % | | | 17.23 | % | | | 5.96 | %(E) | | | 1.65 | % |
| Ratios and supplemental data: | | | | | | | | | | | | | | | | | | | | | | | | |
| Net assets at end of period (000's) | | $ | 62,689 | | | $ | 71,201 | | | $ | 56,893 | | | $ | 68,184 | | | $ | 71,235 | | | $ | 15,181 | |
| Ratio to average net assets: | | | | | | | | | | | | | | | | | | | | | | | | |
| Net expenses(F) | | | 0.49 | % | | | 0.49 | % | | | 0.46 | % | | | 0.35 | % | | | 0.39 | %(G) | | | 0.57 | % |
| Gross expenses(F) | | | 0.92 | % | | | 0.90 | % | | | 0.89 | % | | | 0.93 | % | | | 0.90 | %(G) | | | 1.03 | % |
| Net investment income(F) | | | 2.26 | % | | | 1.75 | % | | | 1.44 | % | | | 1.27 | % | | | 2.90 | %(G) | | | 1.38 | % |
| Portfolio turnover rate | | | 39 | % | | | 68 | %(H) | | | 11 | % | | | 38 | % | | | 73 | %(E)(I) | | | 77 | % |
Touchstone Dynamic Global Allocation Fund—Class C
Selected Data for a Share Outstanding Throughout Each Period
| | | | | | | | | | | | | | | Five | | | | |
| | | | | | | | | | | | | | | Months | | | | |
| | | | | | | | | | | | | | | Ended | | | Year Ended | |
| | | Year Ended December 31, | | | December 31, | | | July 31, | |
| | | 2016 | | | 2015 | | | 2014 | | | 2013 | | | 2012(A) | | | 2012 | |
| Net asset value at beginning of period | | $ | 11.77 | | | $ | 12.67 | | | $ | 12.79 | | | $ | 11.13 | | | $ | 10.89 | | | $ | 10.86 | |
| Income (loss) from investment operations: | | | | | | | | | | | | | | | | | | | | | | | | |
| Net investment income | | | 0.19 | | | | 0.10 | | | | 0.09 | | | | 0.06 | | | | 0.10 | (B) | | | 0.07 | (B) |
| Net realized and unrealized gains (losses) on investments | | | 0.05 | | | | (0.58 | ) | | | 0.45 | | | | 1.77 | | | | 0.50 | | | | 0.02 | (C) |
| Total from investment operations | | | 0.24 | | | | (0.48 | ) | | | 0.54 | | | | 1.83 | | | | 0.60 | | | | 0.09 | |
| Distributions from: | | | | | | | | | | | | | | | | | | | | | | | | |
| Net investment income | | | (0.19 | ) | | | (0.12 | ) | | | (0.15 | ) | | | (0.17 | ) | | | (0.18 | ) | | | (0.06 | ) |
| Realized capital gains | | | (0.51 | ) | | | (0.30 | ) | | | (0.51 | ) | | | — | | | | (0.18 | ) | | | — | |
| Total distributions | | | (0.70 | ) | | | (0.42 | ) | | | (0.66 | ) | | | (0.17 | ) | | | (0.36 | ) | | | (0.06 | ) |
| Net asset value at end of period | | $ | 11.31 | | | $ | 11.77 | | | $ | 12.67 | | | $ | 12.79 | | | $ | 11.13 | | | $ | 10.89 | |
| Total return(D) | | | 2.00 | % | | | (3.81 | %) | | | 4.20 | % | | | 16.49 | % | | | 5.52 | %(E) | | | 0.89 | % |
| Ratios and supplemental data: | | | | | | | | | | | | | | | | | | | | | | | | |
| Net assets at end of period (000's) | | $ | 44,946 | | | $ | 53,417 | | | $ | 43,844 | | | $ | 49,601 | | | $ | 48,985 | | | $ | 47,508 | |
| Ratio to average net assets: | | | | | | | | | | | | | | | | | | | | | | | | |
| Net expenses(F) | | | 1.24 | % | | | 1.24 | % | | | 1.21 | % | | | 1.11 | % | | | 1.14 | %(G) | | | 1.32 | % |
| Gross expenses(F) | | | 1.65 | % | | | 1.62 | % | | | 1.62 | % | | | 1.65 | % | | | 1.68 | %(G) | | | 1.74 | % |
| Net investment income (loss)(F) | | | 1.51 | % | | | 1.00 | % | | | 0.69 | % | | | 0.52 | % | | | 2.15 | %(G) | | | 0.63 | % |
| Portfolio turnover rate | | | 39 | % | | | 68 | %(H) | | | 11 | % | | | 38 | % | | | 73 | %(E)(I) | | | 77 | % |
| (A) | The Fund changed its fiscal year end from July 31 to December 31. |
| (B) | The net investment income per share is based on average shares outstanding for the period. |
| (C) | The amounts shown for a share outstanding throughout the period does not accord with the change in net realized and unrealized gains (losses) on investments for the period due to the timing of purchases and sales of fund shares in relation to fluctuating market values during the period. |
| (D) | Total returns shown exclude the effect of applicable sales loads. If these charges were included, the returns would be lower. |
| (F) | Ratio does not include expenses of the underlying funds. |
| (H) | Portfolio turnover excludes the purchases and sales of the Touchstone Growth Allocation Fund acquired on November 23, 2015 (See Note 8 in Notes to Financial Statements). If these transactions were included, portfolio turnover would have been higher. |
| (I) | Portfolio turnover excludes the purchases and sales of the Fifth Third LifeModel Moderately Aggressive Fund acquired on September 10, 2012. If these transactions were included, portfolio turnover would have been higher. |
See accompanying Notes to Financial Statements.
Financial Highlights (Continued)
Touchstone Dynamic Global Allocation Fund—Class Y
Selected Data for a Share Outstanding Throughout Each Period
| | | | | | | | | | | | | | | Five | | | | |
| | | | | | | | | | | | | | | Months | | | | |
| | | | | | | | | | | | | | | Ended | | | Year Ended | |
| | | Year Ended December 31, | | | December 31, | | | July 31, | |
| | | 2016 | | | 2015 | | | 2014 | | | 2013 | | | 2012(A) | | | 2012 | |
| Net asset value at beginning of period | | $ | 12.11 | | | $ | 12.98 | | | $ | 13.09 | | | $ | 11.38 | | | $ | 11.24 | | | $ | 11.23 | |
| Income (loss) from investment operations: | | | | | | | | | | | | | | | | | | | | | | | | |
| Net investment income | | | 0.32 | | | | 0.23 | | | | 0.28 | | | | 0.21 | | | | 0.15 | (B) | | | 0.18 | (B) |
| Net realized and unrealized gains (losses) on investments | | | 0.05 | | | | (0.58 | ) | | | 0.40 | | | | 1.78 | | | | 0.52 | | | | 0.01 | (C) |
| Total from investment operations | | | 0.37 | | | | (0.35 | ) | | | 0.68 | | | | 1.99 | | | | 0.67 | | | | 0.19 | |
| Distributions from: | | | | | | | | | | | | | | | | | | | | | | | | |
| Net investment income | | | (0.31 | ) | | | (0.22 | ) | | | (0.28 | ) | | | (0.28 | ) | | | (0.35 | ) | | | (0.18 | ) |
| Realized capital gains | | | (0.51 | ) | | | (0.30 | ) | | | (0.51 | ) | | | — | | | | (0.18 | ) | | | — | |
| Total distributions | | | (0.82 | ) | | | (0.52 | ) | | | (0.79 | ) | | | (0.28 | ) | | | (0.53 | ) | | | (0.18 | ) |
| Net asset value at end of period | | $ | 11.66 | | | $ | 12.11 | | | $ | 12.98 | | | $ | 13.09 | | | $ | 11.38 | | | $ | 11.24 | |
| Total return | | | 3.03 | % | | | (2.75 | %) | | | 5.21 | % | | | 17.57 | % | | | 6.04 | %(D) | | | 1.84 | % |
| Ratios and supplemental data: | | | | | | | | | | | | | | | | | | | | | | | | |
| Net assets at end of period (000's) | | $ | 14,678 | | | $ | 17,711 | | | $ | 16,719 | | | $ | 30,498 | | | $ | 43,585 | | | $ | 763 | |
| Ratio to average net assets: | | | | | | | | | | | | | | | | | | | | | | | | |
| Net expenses(E) | | | 0.24 | % | | | 0.24 | % | | | 0.21 | % | | | 0.10 | % | | | 0.14 | %(F) | | | 0.32 | % |
| Gross expenses(E) | | | 0.75 | % | | | 0.72 | % | | | 0.62 | % | | | 0.60 | % | | | 0.54 | %(F) | | | 1.89 | % |
| Net investment income(E) | | | 2.51 | % | | | 2.00 | % | | | 1.69 | % | | | 1.53 | % | | | 3.15 | %(F) | | | 1.63 | % |
| Portfolio turnover rate | | | 39 | % | | | 68 | %(G) | | | 11 | % | | | 38 | % | | | 73 | %(D)(H) | | | 77 | % |
| (A) | The Fund changed its fiscal year end from July 31 to December 31. |
| (B) | The net investment income per share is based on average shares outstanding for the period. |
| (C) | The amounts shown for a share outstanding throughout the period does not accord with the change in net realized and unrealized gains (losses) on investments for the period due to the timing of purchases and sales of fund shares in relation to fluctuating market values during the period. |
| (E) | Ratio does not include expenses of the underlying funds. |
| (G) | Portfolio turnover excludes the purchases and sales of the Touchstone Growth Allocation Fund acquired on November 23, 2015 (See Note 8 in Notes to Financial Statements). If these transactions were included, portfolio turnover would have been higher. |
| (H) | Portfolio turnover excludes the purchases and sales of the Fifth Third LifeModel Moderately Aggressive Fund acquired on September 10, 2012. If these transactions were included, portfolio turnover would have been higher. |
See accompanying Notes to Financial Statements.
Notes to Financial Statements
December 31, 2016
1. Organization
The Touchstone Strategic Trust (the “Trust”) is registered under the Investment Company Act of 1940, as amended (the “1940 Act”), as an open-end management investment company. The Trust was established as a Massachusetts business trust pursuant to an Agreement and Declaration of Trust dated November 18, 1982. The Trust consists of twenty one funds, including the following four funds (individually, a “Fund”, and collectively, the “Funds”):
Touchstone Dynamic Equity Fund (“Dynamic Equity Fund”)
Touchstone Controlled Growth with Income Fund (“Controlled Growth with Income Fund”)
Touchstone Dynamic Diversified Income Fund (“Dynamic Diversified Income Fund”)
Touchstone Dynamic Global Allocation Fund (“Dynamic Global Allocation Fund”)
Each Fund is diversified. Additionally, the Controlled Growth with Income Fund, Dynamic Diversified Income Fund and Dynamic Global Allocation Fund (collectively, the “Allocation Funds”) are “Funds of Funds”, sub-advised by Wilshire Associates Incorporated, which seek to achieve their investment goals by primarily investing in a diversified portfolio of affiliated and unaffiliated underlying equity and fixed income funds. These underlying funds (“Underlying Funds”), in turn, invest in a variety of U.S. and foreign equity and fixed income securities. Under normal circumstances, the Allocation Funds expect to invest their assets among equity, fixed-income and alternative funds in the following ranges:
| | | Equity Fund | | Fixed-Income | | Alternative |
| | | Allocation | | Fund Allocation | | Fund Allocation |
| Controlled Growth with Income Fund | | 0-25% | | 25-50% | | 50-75% |
| Dynamic Diversified Income Fund | | 25-55% | | 45-75% | | N/A |
| Dynamic Global Allocation Fund | | 45-75% | | 25-55% | | N/A |
The investment goal of each of the Underlying Funds that the Allocation Funds invested in is as follows:
| Fund | | Investment Goal |
| Touchstone Arbitrage Fund | | Seeks to achieve positive absolute returns over the long-term regardless of market conditions. |
| Touchstone Credit Opportunities Fund | | Seeks absolute total return, primarily from income and capital appreciation. |
| Touchstone Dynamic Equity Fund | | Seeks to obtain long-term capital appreciation from hedged equity investments with less risk than a fully invested, unhedged equity portfolio. |
| Touchstone Flexible Income Fund | | Seeks a high level of income consistent with reasonable risk. The Fund seeks capital appreciation as a secondary goal. |
| Touchstone Global Real Estate Fund | | Seeks income and capital appreciation. |
| Touchstone High Yield Fund | | Seeks to achieve a high level of income as its main goal. Capital appreciation is a secondary consideration. |
| Touchstone International Growth Fund | | Seeks long-term capital growth. |
| Touchstone International Small Cap Fund | | Seeks to provide investors with capital appreciation. |
| Touchstone International Value Fund | | Seeks long-term capital growth. |
| Touchstone Large Cap Fund | | Seeks to provide investors with long-term capital growth. |
| Touchstone Mid Cap Fund | | Seeks long-term capital growth. |
| Touchstone Premium Yield Equity Fund | | Seeks long-term growth of capital and high current income. |
Notes to Financial Statements (Continued)
| Fund | | Investment Goal |
| Touchstone Sands Capital Emerging Markets Growth Fund | | Seeks long-term capital appreciation. |
| Touchstone Sands Capital Institutional Growth Fund | | Seeks long-term capital appreciation. |
| Touchstone Small Cap Value Opportunities Fund | | Seeks to provide investors with long-term capital growth. |
| Touchstone Total Return Bond Fund | | Seeks current income. Capital appreciation is a secondary goal. |
| Touchstone Value Fund | | Seeks to provide investors with long-term capital growth. |
| Dreyfus Government Cash Management | | Seeks as high a level of current income as is consistent with the preservation of capital and the maintenance of liquidity. |
| iShares International Select Dividend ETF | | Seeks to track the investment results of an index composed of relatively high dividend paying equities in non-U.S. developed markets. |
| JPMorgan Alerian MLP Index ETN | | Seeks to replicate, net of expenses, the Alerian MLP Index. The index tracks the performance of midstream energy Master Limited Partnerships. |
| VanEck Vectors J.P. Morgan EM Local Currency Bond ETF | | Seeks to replicate as closely as possible, before fees and expenses, the price and yield performance of the J.P. Morgan GBI-EMG Core Index (GBIEMCOR), which is comprised of bonds issued by emerging market governments and denominated in the local currency of the issuer. |
| Vanguard Emerging Markets Government Bond ETF | | Seeks to track the performance of a benchmark index that measures the investment return of U.S. dollar-denominated bonds issued by governments and government related issuers in emerging market countries. |
| Vanguard FTSE Emerging Markets ETF | | Seeks to track the performance of a benchmark index that measures the investment return of stocks issued by companies located in emerging market countries. |
| Vanguard Global ex-U.S. Real Estate ETF | | Seeks to track the performance of a benchmark index that measures the investment return of international real estate stocks. |
| Vanguard REIT ETF | | Seeks to provide a high level of income and moderate long-term capital appreciation by tracking the performance of a benchmark index that measures the performance of publicly traded equity REITs. |
| Vanguard Total International Bond ETF | | Seeks to track the performance of a benchmark index that measures the investment return of investment-grade bonds issued outside of the United States. |
The Agreement and Declaration of Trust permits the Trust to issue an unlimited number of shares of beneficial interest of each Fund. The Dynamic Equity Fund is registered to offer the following classes of shares: Class A shares, Class C shares, Class Y shares, and Institutional Class shares. The Allocation Funds are registered to offer the following classes of shares: Class A shares, Class C shares and Class Y shares. The assets of each Fund are segregated, and a shareholder’s interest is limited to the Fund in which shares are held. The Funds’ prospectus provides a description of each Fund’s investment goals, policies, and strategies along with information on the classes of shares currently being offered.
2. Significant Accounting Policies
The following is a summary of the Funds’ significant accounting policies:
Each Fund is an investment company that follows the accounting and reporting guidance of Accounting Standards Codification Topic 946 applicable to investment companies.
Security valuation and fair value measurements — U.S. generally accepted accounting principles (“U.S. GAAP”) defines fair value as the price the Funds would receive to sell an asset or pay to transfer a liability in an orderly
Notes to Financial Statements (Continued)
transaction between market participants at the measurement date. All investments in securities are recorded at their fair value. The Funds define the term “market value”, as used throughout this report, as the estimated fair value. The Funds use various methods to measure fair value of their portfolio securities on a recurring basis. U.S. GAAP fair value measurement standards require disclosure of a hierarchy that prioritizes inputs to valuation methods.
These inputs are summarized in the three broad levels listed below:
| · Level 1 – | quoted prices in active markets for identical securities |
| · Level 2 – | other significant observable inputs (including quoted prices for similar securities, interest rates, prepayment speeds, credit risk, etc.) |
| · Level 3 – | significant unobservable inputs (including a Fund’s own assumptions in determining the fair value of investments) |
The inputs or methodology used for valuing securities are not necessarily an indication of the risk associated with investing in those securities.
The aggregate value by input level, as of December 31, 2016, for each Fund’s investments, as well as a reconciliation of assets for which significant unobservable inputs (Level 3) were used in determining value, if applicable, is included in the Funds’ Portfolio of Investments, which also includes a breakdown of the Funds’ investments by sector allocation. The Funds did not hold any Level 3 categorized securities during the year ended December 31, 2016.
Changes in valuation techniques may result in transfers into or out of an investment’s assigned level within the hierarchy. All transfers in and out of the levels are recognized at the value at the end of the period. During the year ended December 31, 2016, there were no transfers between Levels 1, 2 and 3 for all Funds.
The Funds’ portfolio securities are valued as of the close of the regular session of trading on the New York Stock Exchange (“NYSE”)(currently 4:00 p.m., Eastern time). Portfolio securities traded on stock exchanges are valued at the last reported sale price, official close price, or last bid price if no sales are reported. Portfolio securities quoted by NASDAQ are valued at the NASDAQ Official Closing Price (“NOCP”) or from the primary exchange on which the security trades. To the extent these securities are actively traded, they are categorized in Level 1 of the fair value hierarchy. Options are valued at the last quoted sales price. If there is no such reported sale on the valuation date, long option positions are valued at the most recent bid price, and short option positions are valued at the most recent ask price and are categorized in Level 1. Shares of mutual funds in which the Funds invest are valued at their respective net asset values (“NAV”) as reported by the Underlying Funds and are categorized in Level 1.
Securities mainly traded on a non-U.S. exchange or denominated in foreign currencies are generally valued according to the preceding closing values on that exchange, translated to U.S. dollars using currency exchange rates as of the close of regular trading on the NYSE, and are generally categorized in Level 1. However, if an event that may change the value of a security occurs after the time that the closing value on the non-U.S. exchange was determined, but before the close of regular trading on the NYSE, the security may be priced based on fair value and generally categorized in Level 2. This may cause the value of the security, if held on the books of a Fund, to be different from the closing value on the non-U.S. exchange and may affect the calculation of that Fund’s NAV.
Notes to Financial Statements (Continued)
The Funds may use fair value pricing under the following circumstances, among others:
| · | If the value of a security has been materially affected by events occurring before the Fund’s pricing time but after the close of the primary markets on which the security is traded. |
| · | If the exchange on which a portfolio security is principally traded closes early or if trading in a particular portfolio security was halted during the day and did not resume prior to the Fund’s NAV calculation. |
| · | If a security is so thinly traded that reliable market quotations are unavailable due to infrequent trading. |
| · | If the validity of market quotations is not reliable. |
Securities held by the Funds that do not have readily available market quotations, significant observable inputs, or securities for which the available market quotations are not reliable, are priced at their estimated fair value using procedures approved by the Funds’ Board of Trustees and are generally categorized in Level 3.
Allocation Funds — The Allocation Funds invest in securities of affiliated and unaffiliated funds, the Underlying Funds. The value of an investment in the Allocation Funds is based on the performance of the Underlying Funds in which they invest and the allocation of their assets among those funds. Because the Allocation Funds invest in mutual funds, shareholders of the Allocation Funds indirectly bear a proportionate share of the expenses charged by the Underlying Funds in which they invest as well as their share of the Allocation Funds’ fees and expenses. The principal risks of an investment in the Allocation Funds include the principal risks of investing in the Underlying Funds.
Investment companies — The Funds may invest in securities of other investment companies, including exchange-traded funds (“ETFs”), open-end funds and closed-end funds. Open-end funds are investment companies that issue new shares continuously and redeem shares daily. Closed-end funds are investment companies that typically issue a fixed number of shares that trade on a securities exchange or over-the-counter (“OTC”). An ETF is an investment company that typically seeks to track the performance of an index by holding in its portfolio shares of all the companies, or a representative sample of the companies, that are components of a particular index. ETF shares are traded on a securities exchange based on their market value. The risks of investment in other investment companies typically reflect the risks of the types of securities in which the other investment companies invest. Investments in ETFs and closed-end funds are subject to the additional risk that their shares may trade at a premium or discount to their NAV. When a Fund invests in another investment company, shareholders of the Fund indirectly bear their proportionate share of the other investment company’s fees and expenses, including operating, registration, trustee, licensing, and marketing, as well as their share of the Fund’s fees and expenses.
Cash and cash equivalents — The Funds consider liquid assets deposited with a bank, money market funds, and certain short term debt instruments with maturities of 3 months or less to be cash equivalents and are included in the investments on the financial statements. These investments represent amounts held with financial institutions that are readily accessible to pay Fund expenses or investments. Cash and cash equivalents are valued at cost plus accrued interest, which approximates market value. The value of cash equivalents denominated in foreign currencies is determined by converting to U.S. dollars on the date of the Statement of Assets and Liabilities.
Securities sold short — The Dynamic Equity Fund engages in selling securities short, which obligates the Fund to replace a security borrowed by purchasing the same security at the current market value. The Fund would incur a loss if the price of the security increases between the date of the short sale and the date on which the Fund replaces the borrowed security. The Fund would realize a gain if the price of the security declines between those dates. As of December 31, 2016, the Dynamic Equity Fund held securities sold short with a
Notes to Financial Statements (Continued)
fair value of $27,295,862 and had securities with a fair value of $166,657,979 held as collateral and cash collateral of $1,736,635 for both securities sold short and written options.
Options — The Dynamic Equity Fund may write or purchase financial option contracts primarily to hedge against changes in the value of equity securities (or securities that the Fund intends to purchase), against fluctuations in fair value caused by changes in prevailing market interest rates or foreign currency exchange rates and against changes in overall equity market volatility. In addition, the Fund may utilize options in an attempt to generate gains from option premiums or to reduce overall portfolio risk. The Fund’s option strategy primarily focuses on the use of writing and/or purchasing call or put options on equity indexes. When the Fund writes or purchases an option, an amount equal to the premium received or paid by the Fund is recorded as a liability or an asset and is subsequently adjusted to the current market value of the option written or purchased. Premiums received or paid from writing or purchasing options which expire unexercised are treated by the Fund on the expiration date as realized gains or losses. The difference between the premium and the amount paid or received on effecting a closing purchase or sale transaction, including brokerage commissions, is also treated as a realized gain or loss. If an option is exercised, the premium paid or received is added to the cost of the purchase or proceeds from the sale in determining whether the Fund has realized a gain or loss on investment transactions. The Fund, as writer of an option, may have no control over whether the underlying securities may be sold (call) or purchased (put) and as a result bears the market risk of an unfavorable change in the price of the security underlying the written option. The Fund, as purchaser of an option, bears the risk that the counterparties to the option may not have the ability to meet the terms of the option contracts. There is minimal counterparty credit risk involved in entering into option contracts since they are exchange-traded instruments and the exchange’s clearinghouse, as counterparty to all exchange-traded options, guarantees the options against default. As of December 31, 2016, the Dynamic Equity Fund held written options with a fair value of $1,910,451 and had securities with a fair value of $166,657,979 held as collateral and cash collateral of $1,736,635 for both securities sold short and written options.
Real Estate Investment Trusts — Dynamic Equity Fund may invest in real estate investment trusts (“REITs”) that involve risks not associated with investing in stocks. Risks include declines in the value of real estate, general and economic conditions, changes in the value of the underlying property and defaults by borrowers. The value of assets in the real estate industry may go through cycles of relative underperformance and outperformance in comparison to equity securities markets in general. Dividend income is recorded using management’s estimate of the income included in distributions received from REIT investments. The actual amounts of income, return of capital and capital gains are only determined by each REIT after its fiscal year-end and may differ from the estimated amount. Estimates of income are adjusted in the Funds to the actual amounts when the amounts are determined.
Master Limited Partnership — The Funds may invest in Master Limited Partnership (“MLP”) common units that represent limited partnership interests in the MLP. Common units are generally listed and traded on U.S. securities exchanges or OTC with their value fluctuating predominantly based on the success of the MLP. Unlike owners of common stock of a corporation, owners of MLP common units have limited voting rights and have no ability to annually elect directors. MLPs generally distribute all available cash flow (cash flow from operations less maintenance capital expenditures) in the form of quarterly distributions. Common unit holders have first priority to receive quarterly cash distributions up to the minimum quarterly distribution and have arrearage rights. Distributions received from MLPs generally are comprised of income and return of capital. Investment income and return of capital are recorded based on estimates made at the time distributions are received. The actual amounts of income and return of capital are only determined by each MLP after its fiscal year-end and may differ from the estimated amount. Estimates of income are adjusted in the Funds to the actual amounts when the amounts are determined. In the event of liquidation, common unit holders have preference over subordinated units, but not debt holders or preferred unit holders, to the remaining assets of the MLP.
Notes to Financial Statements (Continued)
Derivative instruments and hedging activities — The Dynamic Equity Fund may enter into an International Swaps and Derivatives Association, Inc. Master Agreement (“ISDA Master Agreement” or “MNA”) or similar agreement with certain counterparties. An ISDA Master Agreement is a bilateral agreement between the Fund and a counterparty that governs OTC derivatives and foreign exchange contracts, and typically contains, among other things, collateral posting terms and master netting provisions in the event of a default or termination. Under an ISDA Master Agreement, a party may, under certain circumstances, offset with the counterparty certain derivative financial instrument’s payables or receivables with collateral held or posted and create one single net payment. The provisions of the ISDA Master Agreement typically permit a single net payment in the event of default (close-out netting). These default events include bankruptcy or insolvency of the counterparty. Note, however, that bankruptcy or insolvency laws of a particular jurisdiction may impose restrictions on or prohibitions against the right of offset.
When entering into a derivative transaction, the Fund may be required to post and maintain collateral or margin (including both initial and maintenance margin). Collateral and margin requirements differ by type of derivative. Margin requirements are established by the broker or clearing house for exchange traded and centrally cleared derivatives (financial futures contracts, options, and centrally cleared swaps). Brokers can ask for margining in excess of the clearing house’s minimum in certain circumstances. Collateral terms are contract specific for OTC derivatives (foreign currency exchange contracts, options, and swaps). For derivatives traded under an ISDA Master Agreement, the collateral requirements are typically calculated by netting the marked-to-market amount for each transaction under such agreement and comparing that amount to the value of any collateral currently pledged by the Fund and the counterparty. For financial reporting purposes, cash collateral that has been pledged to cover obligations of the Fund and cash collateral received from the counterparty, if any, is reported separately on the Statements of Assets and Liabilities as cash pledged as collateral and cash received as collateral, respectively. Non-cash collateral pledged by the Fund, if any, is noted in the Portfolio of Investments. To the extent amounts due to the Fund from its counterparties are not fully collateralized, contractually or otherwise, the Fund bears the risk of loss from counterparty non-performance.
Certain ISDA Master Agreements allow counterparties to OTC derivatives transactions to terminate derivative contracts prior to maturity in the event the Fund’s net assets decline by a stated percentage or the Fund fails to meet the terms of its ISDA Master Agreement, which would cause the Fund (counterparty) to accelerate payment of any net liability owed to the counterparty (Fund).
For financial reporting purposes, the Dynamic Equity Fund does not offset derivative assets and derivative liabilities that are subject to netting arrangements in the Statements of Assets and Liabilities.
As of December 31, 2016, the Dynamic Equity Fund’s assets and liabilities that were subject to a MNA on a gross basis were as follows:
| | | Assets | | | Liabilities | |
| Derivative Financial Instruments: | | | | | | | | |
| Written Options | | $ | — | | | $ | 1,910,451 | |
| Total gross amount of assets and liabilities subject to MNA | | $ | — | | | $ | 1,910,451 | |
Notes to Financial Statements (Continued)
The following table presents the Dynamic Equity Fund’s liabilities net of amounts available for offset under a MNA and net of the related collateral pledged by the Fund as of December 31, 2016:
| | | | | | Gross Amounts | | | | | | | | | | |
| | | | | | Available for Offset | | | | | | | | | | |
| | | Gross Amount of | | | in Statement of | | | Non-cash | | | | | | | |
| | | Recognized | | | Assets and | | | Collateral | | | Cash Collateral | | | | |
| | | Liabilities | | | Liabilities | | | Pledged | | | Pledged | | | Net Amount(B) | |
| Written Options(A) | | $ | 1,910,451 | | | $ | — | | | $ | (1,796,854 | ) | | $ | (113,597 | ) | | $ | — | |
(A) Pershing LLC is the counterparty.
(B) Net amount represents the net amount payable due to the counterparty in the event of default.
The following table sets forth the fair value of the Dynamic Equity Fund’s derivative financial instruments by primary risk exposure as of December 31, 2016:
| | | Fair Value of Derivative Investments | | | | | | |
| | | As of December 31, 2016 | | | | | | |
| | | Derivatives not accounted for as hedging | | Asset | | | Liability | |
| Fund | | instruments under ASC 815 | | Derivatives | | | Derivatives* | |
| Dynamic Equity Fund | | Written Options - Equity Contracts* | | $ | — | | | $ | 1,910,451 | |
* Statements of Assets and Liabilities Location: Written options, at market value.
The following table sets forth the effect on the Dynamic Equity Fund’s derivative financial instruments by primary risk exposure on the Statement of Operations for the year ended December 31, 2016:
| The Effect of Derivative Investments on the Statement of Operations |
| for the Year Ended December 31, 2016 |
| | | | | | | | Change in | |
| | | | | | | | Unrealized | |
| | | | | Realized Gains | | | Appreciation | |
| | | Derivatives not accounted for as hedging | | (Losses) | | | (Depreciation) | |
| Fund | | instruments under ASC 815 | | on Derivatives | | | on Derivatives | |
| Dynamic Equity Fund | | Purchased Options -Equity Contracts* | | $ | 908,347 | | | $ | — | |
| | | Written Options - Equity Contacts** | | | (5,982,071 | ) | | | (156,011 | ) |
* Statements of Operations Location: Net realized gains on investments from non-affiliated securities.
** Statements of Operations Location: Net realized losses on written options and net change in unrealized appreciation (depreciation) on written options, respectively.
For the year ended December 31, 2016, the average quarterly balances of outstanding derivative financial instruments were as follows:
| | | Dynamic | |
| | | Equity | |
| Fund | | Fund | |
| Equity contracts: | | | | |
| Purchased Options - Cost* | | $ | — | |
| Written Options - Premiums received | | | 2,822,260 | |
* The balance at each quarter end was zero.
Share valuation — The NAV per share of each class of shares of each Fund is calculated daily by dividing the total value of a Fund’s assets attributable to that class, less liabilities attributable to that class, by the number of outstanding shares of that class.
Notes to Financial Statements (Continued)
The maximum offering price per share of Class A shares of the Funds is equal to the NAV per share plus a sales load equal to 6.10% of the NAV (or 5.75% of the offering price). There is no sales load on purchases of $1 million or more of Class A shares. The maximum offering price per share of Classes C, Y, and Institutional Class shares of the Funds is equal to the NAV per share.
The redemption price per share of each class of shares of the Funds is generally equal to the NAV per share. However, Class A redemptions that were part of a no-load $1 million subscription may be subject to a contingent deferred sales charge (“CDSC”) of up to 1.00% if redeemed within a one-year period from the date of purchase. Additionally, purchases of Class C shares of the Funds are subject to a CDSC of 1.00%. The CDSC will be assessed on an amount equal to the lesser of (1) the NAV at the time of purchase of the shares being redeemed or (2) the NAV of such shares being redeemed, if redeemed within a one-year period from the date of purchase.
Investment income — Dividend income from securities is recognized on the ex-dividend date, net of foreign withholding taxes, if any, which are reduced by any amounts reclaimable by the Funds, where applicable. Interest income from securities is recorded on the basis of interest accrued, premium amortized and discount accreted.
Distributions to shareholders — Each Fund intends to distribute to its shareholders substantially all of its income and capital gains. The Dynamic Equity Fund declares and distributes net investment income, if any, annually as a dividend to shareholders. The Allocation Funds each declare and distribute net investment income, if any, quarterly as a dividend to shareholders. Each Fund makes distributions of capital gains, if any, at least annually, net of applicable capital loss carryforwards. Income distributions and capital gain distributions are determined in accordance with income tax regulations. Recognition of the Funds’ net investment income from investments in Underlying Funds is affected by the timing of dividend declarations by the Underlying Funds.
Allocations — Investment income earned, realized capital gains and losses, and unrealized appreciation and depreciation for a Fund are allocated daily to each class of shares based upon its proportionate share of total net assets of the Fund. Class-specific expenses are charged directly to the class incurring the expense. Common expenses, which are not attributable to a specific class, are allocated daily to each class of shares based upon their proportionate share of total net assets of the Fund. Expenses not directly billed to a Fund are allocated proportionally among all Funds in the Trust, and, if applicable, Touchstone Funds Group Trust, Touchstone Institutional Funds Trust, Touchstone Investment Trust and Touchstone Variable Series Trust (collectively with the Trust, “Touchstone Fund Complex”), daily in relation to net assets of each Fund or another reasonable measure.
Security transactions — Security transactions are reflected for financial reporting purposes as of the trade date. Realized gains and losses on sales of portfolio securities are calculated using the identified cost basis.
Estimates — The preparation of financial statements in conformity with U.S. GAAP requires management to make estimates and assumptions that affect the reported amounts of assets and liabilities and disclosure of contingent assets and liabilities at the date of the financial statements and the reported amounts of income and expenses during the reporting period. Actual results could differ from those estimates.
Regulatory Updates — In October 2016, the Securities and Exchange Commission released its Final Rule on Investment Company Reporting Modernization (the “Rule”). The Rule contains amendments to Regulation S-X which impact financial statement presentation, particularly the presentation of derivative investments. Although still evaluating the impact of the Rule, management believes that many of the Regulation S-X amendments are consistent with the Funds’ current financial statement presentation and expects that the Funds will comply with the Rule’s Regulation S-X amendments by the August 1, 2017 compliance date.
Notes to Financial Statements (Continued)
3. Investment Transactions
Investment transactions (excluding short-term investments and U.S. Government securities) were as follows for the year ended December 31, 2016:
| | | | | | Controlled | | | Dynamic | | | Dynamic | |
| | | Dynamic | | | Growth with | | | Diversified | | | Global | |
| | | Equity | | | Income | | | Income | | | Allocation | |
| | | Fund | | | Fund | | | Fund | | | Fund | |
| Purchases of investment securities | | $ | 411,136,158 | | | $ | 15,956,519 | | | $ | 23,187,929 | | | $ | 52,022,417 | |
| Proceeds from sales and maturities | | $ | 370,451,562 | | | $ | 14,266,815 | | | $ | 38,118,637 | | | $ | 72,323,715 | |
There were no purchases or proceeds from sales and maturities of U.S. Government securities by the Funds for the year ended December 31, 2016.
4. Transactions with Affiliates and Other Related Parties
Certain officers of the Trust are also officers of Touchstone Advisors, Inc. (the “Advisor”), Touchstone Securities, Inc. (the “Underwriter”), or BNY Mellon Investment Servicing (US) Inc. (“BNY Mellon”), the Sub-Administrator and Transfer Agent to the Funds. Such officers receive no compensation from the Trust. The Advisor and the Underwriter are each wholly-owned, indirect subsidiaries of Western & Southern Financial Group, Inc.
On behalf of the Funds, the Advisor pays each Independent Trustee a quarterly retainer plus additional retainers to the Lead Independent Trustee and the chairs of each standing committee. Interested Trustees do not receive compensation from the Funds. Each Independent Trustee also receives compensation for each board meeting and committee meeting attended. Each standing committee chair receives additional compensation for each committee meeting that he or she oversees. The Advisor is reimbursed by the Funds for the Independent Trustees’ compensation and out-of-pocket expenses relating to their services. The Funds accrued Trustee-related expenses of $64,612 for the year ended December 31, 2016.
MANAGEMENT & EXPENSE LIMITATION AGREEMENTS
The Advisor provides general investment supervisory services for the Funds, under terms of an advisory agreement (the “Advisory Agreement”). Under the Advisory Agreement, each Fund pays the Advisor a fee, which is computed and accrued daily and paid monthly, at an annual rate based on average daily net assets of each Fund as shown in the table below.
| Dynamic Equity Fund | 0.85% on the first $300 million of assets |
| | 0.80% on the next $200 million of assets |
| | 0.75% on the next $250 million of assets |
| | 0.70% on the next $250 million of assets |
| | 0.65% on the next $500 million of assets |
| | 0.60% on the next $500 million of assets |
| | 0.55% on such assets over $2 billion |
| Controlled Growth with Income Fund | 0.20% on the first $1 billion of assets |
| Dynamic Diversified Income Fund | 0.175% on the next $1 billion of assets |
| | 0.15% on the next $1 billion of assets |
| | 0.125% on such assets over $3 billion |
| Dynamic Global Allocation Fund | 0.25% on the first $1 billion of assets |
| | 0.225% on the next $1 billion of assets |
| | 0.20% on the next $1 billion of assets |
| | 0.175% on such assets over $3 billion |
Notes to Financial Statements (Continued)
The Advisor has entered into investment sub-advisory agreements with the following parties (each, a “Sub-Advisor”):
| Analytic Investors, LLC | Wilshire Associates Incorporated |
| Dynamic Equity Fund | Controlled Growth with Income Fund |
| | Dynamic Diversified Income Fund |
| | Dynamic Global Allocation Fund |
The Advisor, not the Funds, pays sub-advisory fees to each Sub-Advisor.
The Advisor entered into an expense limitation agreement (the “Expense Limitation Agreement”) to contractually limit the annual operating expenses of the Funds, excluding: dividend and interest expenses relating to short sales; interest; taxes; brokerage commissions and other transaction costs; portfolio transactions and investment related expenses; other expenditures which are capitalized in accordance with U.S.GAAP; the cost of “Acquired Fund Fees and Expenses”, if any; and other extraordinary expenses not incurred in the ordinary course of business. The maximum annual operating expense limit in any year with respect to the Funds is based on a percentage of the average daily net assets of the Funds. The Advisor has agreed to separately waive class-level expenses, advisory fees and administration fees, and to reimburse expenses in order to maintain the following expense limitations for the Funds:
| | | | | | | | | | | | Institutional | | | Termination |
| Fund | | Class A | | | Class C | | | Class Y | | | Class | | | Date |
| Dynamic Equity Fund | | | 1.55 | % | | | 2.30 | % | | | 1.30 | % | | | 1.25 | % | | April 30, 2017 |
| Controlled Growth with Income Fund | | | 0.49 | % | | | 1.24 | % | | | 0.24 | % | | | — | | | April 30, 2017 |
| Dynamic Diversified Income Fund | | | 0.49 | % | | | 1.24 | % | | | 0.24 | % | | | — | | | April 30, 2017 |
| Dynamic Global Allocation Fund | | | 0.49 | % | | | 1.24 | % | | | 0.24 | % | | | — | | | April 30, 2017 |
During the year ended December 31, 2016, the Advisor or its affiliates waived investment advisory fees and administration fees or reimbursed expenses, including distribution fees of the Funds, as follows:
| | | | | | | | | Other | | | | |
| | | Investment | | | | | | Operating | | | | |
| | | Advisory | | | | | | Expenses | | | | |
| | | Fees | | | Administration | | | Reimbursed/ | | | | |
| Fund | | Waived | | | Fees Waived | | | Waived | | | Total | |
| Dynamic Equity Fund | | $ | — | | | $ | — | | | $ | 8,574 | | | $ | 8,574 | |
| Controlled Growth with Income Fund | | | 47,837 | | | | 50,829 | | | | 105,675 | | | | 204,341 | |
| Dynamic Diversified Income Fund | | | 47,103 | | | | 105,638 | | | | 154,182 | | | | 306,923 | |
| Dynamic Global Allocation Fund | | | 117,635 | | | | 190,498 | | | | 259,501 | | | | 567,634 | |
Under the terms of the Expense Limitation Agreement, the Advisor is entitled to recover, subject to approval by the Funds’ Board, such amounts waived or reimbursed for a period of up to three years from the year in which the Advisor reduced its compensation or assumed expenses for the Funds. No recoupment will occur unless a Fund’s operating expenses are below the expense limitation amount in effect at the time of the waiver or reimbursement.
As of December 31, 2016, the Advisor may seek recoupment of previously waived fees and reimbursed expenses as follows:
| | | Expiration | | | Expiration | | | Expiration | | | | |
| | | December 31, | | | December 31, | | | December 31, | | | | |
| Fund | | 2017 | | | 2018 | | | 2019 | | | Total | |
| Controlled Growth with Income Fund | | $ | 191,617 | | | $ | 147,979 | | | $ | 135,822 | | | $ | 475,418 | |
Notes to Financial Statements (Continued)
| | | Expiration | | | Expiration | | | Expiration | | | | |
| | | December 31, | | | December 31, | | | December 31, | | | | |
| Fund | | 2017 | | | 2018 | | | 2019 | | | Total | |
| Dynamic Diversified Income Fund | | $ | 297,197 | | | $ | 229,335 | | | $ | 198,988 | | | $ | 725,520 | |
| Dynamic Global Allocation Fund | | | 407,649 | | | | 332,780 | | | | 352,954 | | | | 1,093,383 | |
For the year ended December 31, 2016, the Advisor recouped previously waived fees or reimbursed expenses from the Dynamic Equity Fund of $7,554.
ADMINISTRATION AGREEMENT
The Advisor entered into an Administration Agreement with the Trust, whereby the Advisor is responsible for: supplying executive and regulatory compliance services; supervising the preparation of tax returns; coordinating the preparation of reports to shareholders and reports to, and filings with, the Securities and Exchange Commission (“SEC”) and state securities authorities, as well as materials for meetings of the Board; calculating the daily NAV per share; and maintaining the financial books and records of each Fund.
For its services, the Advisor’s annual administrative fee is:
0.145% on the first $20 billion of the aggregate average daily net assets;
0.11% on the next $10 billion of aggregate average daily net assets;
0.09% on the next $10 billion of aggregate average daily net assets; and
0.07% on the aggregate average daily net assets over $40 billion.
The fee is computed and allocated among the Touchstone Fund Complex (excluding Touchstone Institutional Funds Trust) on the basis of relative daily net assets.
The Advisor has engaged BNY Mellon as the Sub-Administrator to the Trust. BNY Mellon provides administrative and accounting services to the Trust and is compensated directly by the Advisor, not the Trust.
TRANSFER AGENT AGREEMENT
Under the terms of the Transfer Agent Agreement between the Trust and BNY Mellon, BNY Mellon maintains the records of each shareholder’s account, answers shareholders’ inquiries concerning their accounts, processes purchases and redemptions of each Fund’s shares, acts as dividend and distribution disbursing agent, and performs other shareholder service functions. For these services, BNY Mellon receives a monthly fee from each Fund. In addition, each Fund pays out-of-pocket expenses incurred by BNY Mellon, including, but not limited to, postage and supplies.
The Funds may reimburse the Advisor for fees paid to intermediaries such as banks, broker-dealers, financial advisors or other financial institutions for sub-transfer agency, sub-administration and other services provided to investors whose shares of record are held in omnibus, other group accounts, retirement plans or accounts traded through registered securities clearing agents. These fees may vary based on, for example, the nature of services provided, but generally range up to 0.15% of the assets of the class serviced or maintained by the intermediary or up to $22 per sub-account maintained by the intermediary.
PLANS OF DISTRIBUTION AND SHAREHOLDER SERVICING FEE ARRANGEMENTS
The Trust has adopted distribution plans pursuant to Rule 12b-1 under the 1940 Act for each class of shares it offers that is subject to 12b-1 distribution fees. The plans allow each Fund to pay distribution and other fees for the sale and distribution of its shares and for services provided to shareholders. The fees charged to the
Notes to Financial Statements (Continued)
Funds are limited to the actual expenses incurred. Under the Class A plan, each Fund offering Class A shares pays an annual fee of up to 0.25% of average daily net assets that are attributable to Class A shares. Under the Class C plan, each Fund offering Class C shares pays an annual fee of up to 1.00% of average daily net assets that are attributable to Class C shares (of which up to 0.75% is a distribution fee and up to 0.25% is a shareholder servicing fee).
UNDERWRITING AGREEMENT
The Underwriter is the Funds’ principal underwriter and, as such, acts as exclusive agent for distribution of the Funds’ shares. Under the terms of the Underwriting Agreement between the Trust and the Underwriter, the Underwriter earned underwriting and broker commissions on the sale of Class A shares of the Funds. W&S Brokerage Services, Inc., an affiliate of the Underwriter and the Advisor, also earned broker commissions on the sale of Class A shares of the Funds. Listed below are the total underwriting and broker commissions earned by the Underwriter and its affiliate during the year ended December 31, 2016:
| Fund | | Amount | |
| Dynamic Equity Fund | | $ | 11,463 | |
| Controlled Growth with Income Fund | | | 11,756 | |
| Dynamic Diversified Income Fund | | | 10,757 | |
| Dynamic Global Allocation Fund | | | 24,249 | |
In addition, the Underwriter collected CDSC on the redemption of Class C shares of the Funds listed below during the year ended December 31, 2016:
| Fund | | Amount | |
| Controlled Growth with Income Fund | | $ | 367 | |
| Dynamic Diversified Income Fund | | | 131 | |
| Dynamic Global Allocation Fund | | | 857 | |
INTERFUND TRANSACTIONS
The Funds may engage in purchase and sale transactions with funds that have a common investment advisor (or affiliated investment advisors), common Trustees and/or common Officers. During the year ended, December 31, 2016, the Funds did not engage in any Rule 17a-7 transactions under the 1940 Act.
AFFILIATED INVESTMENTS
A summary of each Allocation Fund’s transactions in affiliated Underlying Funds during the year ended December 31, 2016 is as follows:
Controlled Growth with Income Fund
| | | Purchases at | | | Proceeds | | | Market Value | | | Dividend | | | Net Realized | |
| Underlying Fund* | | cost | | | from sales | | | 12/31/16 | | | Income | | | Gain(Loss) | |
| Touchstone Arbitrage Fund | | $ | 2,651,208 | | | $ | 2,200,545 | | | $ | 9,725,751 | | | $ | — | | | $ | 307,329 | |
| Touchstone Dynamic Equity Fund | | | 2,343,522 | | | | 2,914,523 | | | | 8,771,706 | | | | 51,085 | | | | 219,456 | |
| Touchstone Credit Opportunities Fund | | | 1,804,728 | | | | 2,393,960 | | | | 5,813,593 | | | | 256,288 | | | | 82,272 | |
| Touchstone Flexible Income Fund | | | 2,968,109 | | | | 1,934,747 | | | | 9,044,153 | | | | 242,231 | | | | 31,966 | |
| Touchstone High Yield Fund | | | 3,276,251 | | | | 225,950 | | | | 3,067,214 | | | | 71,281 | | | | 1,846 | |
| Touchstone Premium Yield Equity Fund, Class Y | | | 2,033,338 | | | | 127,668 | | | | 2,006,801 | | | | 32,433 | | | | 3,900 | |
| Touchstone Large Cap Fund | | | 371,575 | | | | 4,006,347 | | | | — | | | | — | | | | 12,554 | |
| Total: | | $ | 15,448,731 | | | $ | 13,803,740 | | | $ | 38,429,218 | | | $ | 653,318 | | | $ | 659,323 | |
Notes to Financial Statements (Continued)
| Dynamic Diversified Income Fund | | | | | | | | | | | | | | | |
| | | Purchases at | | | Proceeds | | | Market Value | | | Dividend | | | Net Realized | |
| Underlying Fund* | | cost | | | from sales | | | 12/31/16 | | | Income | | | Gain(Loss) | |
| Touchstone Credit Opportunities Fund | | $ | 1,407,236 | | | $ | 4,801,039 | | | $ | 13,552,739 | | | $ | 691,502 | | | $ | 258,294 | |
| Touchstone Flexible Income Fund | | | 805,472 | | | | 5,649,206 | | | | 6,182,416 | | | | 282,721 | | | | 191,152 | |
| Touchstone High Yield Fund | | | 1,212,393 | | | | 4,515,125 | | | | 10,222,308 | | | | 633,678 | | | | 70,225 | |
| Touchstone Total Return Bond Fund | | | 6,181,493 | | | | 2,086,084 | | | | 9,934,885 | | | | 238,142 | | | | 14,813 | |
| Touchstone International Value Fund | | | 1,127,936 | | | | 2,653,851 | | | | 2,540,292 | | | | 266,324 | | | | (112,763 | ) |
| Touchstone Premium Yield Equity Fund, Class Y | | | 874,137 | | | | 7,841,914 | | | | 5,730,612 | | | | 203,052 | | | | (606,894 | ) |
| Touchstone Value Fund | | | 4,569,342 | | | | 1,748,687 | | | | 3,466,431 | | | | 94,540 | | | $ | 192,260 | |
| Touchstone Global Real Estate Fund | | | 45,649 | | | | 3,265,187 | | | | — | | | | — | | | | (8,349 | ) |
| Total: | | $ | 16,223,658 | | | $ | 32,561,093 | | | $ | 51,629,683 | | | $ | 2,409,959 | | | $ | (1,262 | ) |
| Dynamic Global Allocation Fund | | | | | | | | | | | | | | | |
| | | Purchases at | | | Proceeds | | | Market Value | | | Dividend | | | Net Realized | |
| Underlying Fund* | | cost | | | from sales | | | 12/31/16 | | | Income | | | Gain(Loss) | |
| Touchstone International Growth Fund | | $ | 10,697,683 | | | $ | 3,144,662 | | | $ | 7,339,639 | | | $ | 37,867 | | | $ | (53,098 | ) |
| Touchstone International Small Cap Fund | | | 112,951 | | | | 4,768,985 | | | | 2,344,666 | | | | 35,629 | | | | 1,307,730 | |
| Touchstone International Value Fund | | | 1,373,584 | | | | 19,648,277 | | | | 12,741,103 | | | | 1,333,330 | | | | (892,580 | ) |
| Touchstone Mid Cap Fund | | | 133,791 | | | | 2,774,588 | | | | 5,036,398 | | | | 32,787 | | | | 955,938 | |
| Touchstone Sands Capital Emerging Markets Growth Fund | | | 321,324 | | | | 4,201,270 | | | | 3,283,257 | | | | — | | | | (478,453 | ) |
| Touchstone Sands Capital Institutional Growth Fund | | | 1,920,892 | | | | 8,894,880 | | | | 8,236,214 | | | | — | | | | 1,093,728 | |
| Touchstone Small Cap Value Opportunities Fund | | | 20,682 | | | | 2,011,073 | | | | 2,571,586 | | | | 3,047 | | | | (182,378 | ) |
| Touchstone Value Fund | | | 1,512,771 | | | | 3,277,040 | | | | 13,841,893 | | | | 326,231 | | | | 1,671,513 | |
| Touchstone Credit Opportunities Fund | | | 367,804 | | | | 6,240,472 | | | | 6,067,647 | | | | 301,550 | | | | 33,670 | |
| Touchstone High Yield Fund | | | 268,094 | | | | 5,270,748 | | | | 3,725,342 | | | | 259,665 | | | | (207,381 | ) |
| Touchstone Total Return Bond Fund | | | 10,263,481 | | | | 3,982,664 | | | | 26,361,933 | | | | 759,315 | | | | 42,146 | |
| Touchstone Dynamic Equity Fund | | | 10,679,380 | | | | 1,126,026 | | | | 9,967,595 | | | | 58,506 | | | | 75,100 | |
| Touchstone Global Real Estate Fund | | | 237 | | | | 3,074,656 | | | | — | | | | — | | | | (169,931 | ) |
| Total: | | $ | 37,672,674 | | | $ | 68,415,341 | | | $ | 101,517,273 | | | $ | 3,147,927 | | | $ | 3,196,004 | |
*All affiliated fund investments are in Institutional Class shares, unless otherwise indicated.
5. Federal Tax Information
Federal income tax — It is each Fund’s policy to continue to comply with the special provisions of the Internal Revenue Code applicable to regulated investment companies. As provided therein, in any fiscal year in which a Fund so qualifies and distributes at least 90% of its investment company taxable income, the Fund (but not the shareholders) will be relieved of federal income tax on the income distributed. It is each Fund’s policy to distribute all of its taxable income and accordingly, no provision for income taxes has been made.
Notes to Financial Statements (Continued)
In order to avoid imposition of the excise tax applicable to regulated investment companies, it is also each Fund’s intention to declare and pay as dividends in each calendar year at least 98% of its investment company taxable income (earned during the calendar year) and 98.2% of its net realized capital gains (earned during the twelve months ending October 31) plus undistributed amounts from prior years.
The tax character of distributions paid for the years ended December 31, 2016 and December 31, 2015 are as follows:
| | | Dynamic | | | Controlled Growth | |
| | | Equity Fund | | | with Income Fund | |
| | | Year Ended | | | Year Ended | | | Year Ended | | | Year Ended | |
| | | December 31, | | | December 31, | | | December 31, | | | December 31, | |
| | | 2016 | | | 2015 | | | 2016 | | | 2015 | |
| From ordinary income | | $ | 758,846 | | | $ | 95,614 | | | $ | 726,570 | | | $ | 534,451 | |
| From long-term capital gains | | | — | | | | — | | | | 12,801 | | | | — | |
| Total distributions | | $ | 758,846 | | | $ | 95,614 | | | $ | 739,371 | | | $ | 534,451 | |
| | | Dynamic Diversified | | | Dynamic Global | |
| | | Income Fund | | | Allocation Fund | |
| | | Year Ended | | | Year Ended | | | Year Ended | | | Year Ended | |
| | | December 31, | | | December 31, | | | December 31, | | | December 31, | |
| | | 2016 | | | 2015 | | | 2016 | | | 2015 | |
| From ordinary income | | $ | 2,523,053 | | | $ | 1,027,948 | | | $ | 3,789,911 | | | $ | 1,874,238 | |
| From long-term capital gains | | | — | | | | — | | | | 4,025,301 | | | | 3,439,667 | |
| Total distributions | | $ | 2,523,053 | | | $ | 1,027,948 | | | $ | 7,815,212 | | | $ | 5,313,905 | |
The following information is computed on a tax basis for each item as of December 31, 2016:
| | | Dynamic | | | Controlled Growth | |
| | | Equity Fund | | | with Income Fund | |
| Tax cost of portfolio investments | | $ | 165,819,506 | | | $ | 38,130,074 | |
| Gross unrealized appreciation | | | 8,995,736 | | | | 714,586 | |
| Gross unrealized depreciation | | | (3,784,613 | ) | | | (13,591 | ) |
| Net unrealized appreciation (depreciation) | | | 5,211,123 | | | | 700,995 | |
| Net unrealized appreciation (depreciation) on written options and short sales | | | 550,296 | | | | — | |
| Capital loss carryforwards | | | (77,442,009 | ) | | | — | |
| Qualified late-year losses | | | (1,105,637 | ) | | | — | |
| Undistributed ordinary income | | | 1,986,916 | | | | 5,015 | |
| Undistributed capital gains | | | — | | | | 230,288 | |
| Accumulated earnings (deficit) | | $ | (70,799,311 | ) | | $ | 936,298 | |
| | | Dynamic
Diversified | | | Dynamic Global | |
| | | Income Fund | | | Allocation Fund | |
| Tax cost of portfolio investments | | $ | 63,832,499 | | | $ | 122,698,879 | |
| Gross unrealized appreciation | | | 1,332,770 | | | | 5,231,924 | |
| Gross unrealized depreciation | | | (1,181,622 | ) | | | (5,380,583 | ) |
| Net unrealized appreciation (depreciation) | | | 151,148 | | | | (148,659 | ) |
| Capital loss carryforwards | | | (12,864,477 | ) | | | (5,271,881 | ) |
| Undistributed ordinary income | | | 81,715 | | | | — | |
| Accumulated earnings (deficit) | | $ | (12,631,614 | ) | | $ | (5,420,540 | ) |
The difference between the tax cost of portfolio investments and the financial statement cost is primarily due to wash sale loss deferrals, non-REIT return of capital outstanding and a non taxable transfer.
Notes to Financial Statements (Continued)
As of December 31, 2016, the Funds had the following capital loss carryforwards for federal income tax purposes:
| | | | | | No | | | No | | | | |
| | | Short Term Expiring In* | | | Expiration | | | Expiration | | | | |
| | | 2017 | | | 2018 | | | Short Term* | | | Long Term* | | | Total | |
| Dynamic Equity Fund | | $ | 77,442,009 | | | $ | — | | | $ | — | | | $ | — | | | $ | 77,442,009 | |
| Dynamic Diversified Income Fund | | | 8,025,856 | | | | 4,801,366 | ** | | | — | | | | 37,255 | | | | 12,864,477 | |
| Dynamic Global Allocation Fund | | | 1,082,641 | ** | | | 4,189,240 | ** | | | — | | | | — | | | | 5,271,881 | |
* The Regulated Investment Company Modernization Act of 2010 (the “Act”) was enacted on December 22, 2010. The Act made changes to several tax rules impacting the Funds. The provisions of the Act first became effective for the Funds’ fiscal year ended December 31, 2012 and are applicable to all subsequent fiscal years. Although the Act provides several benefits, including the unlimited carryover of future capital losses, there may be a greater likelihood that all or a portion of each Fund’s pre-enactment capital loss carryovers may expire without being utilized due to the fact that post-enactment capital losses must be utilized before pre-enactment capital loss carryovers may be utilized. Under the Act, new capital losses may now be carried forward indefinitely, and retain the character of the original loss as compared with pre-enactment law, where capital losses could be carried forward for up to eight years, and carried forward as short-term capital losses, irrespective of the character of the original loss.
**May be subject to limitation.
The capital loss carryforwards may be utilized in future years to offset net realized capital gains, if any, prior to distributing such gains to shareholders.
During the year ended December 31, 2016, the following Funds utilized capital loss carryforwards or had capital loss carryforwards expire:
| Fund | | Utilized | | | Expired | |
| Dynamic Equity Fund | | $ | 3,807,128 | | | $ | 27,919,826 | |
| Controlled Growth with Income Fund | | | 125,314 | | | | — | |
| Dynamic Global Allocation Fund | | | 2,735,259 | | | | — | |
Under current laws, certain capital losses realized after October 31 and ordinary losses realized after December 31 may be deferred (and certain ordinary losses after October and/or December 31 may be deferred) and treated as occurring on the first day of the following fiscal year. For the year ended December 31, 2016, the Dynamic Equity Fund elected to defer $1,105,637 of realized capital losses.
The Funds have analyzed their tax positions taken on federal income tax returns for all open tax years (tax years ended December 31, 2013 through 2016) and have concluded that no provision for income tax is required in their financial statements.
Certain reclassifications, the result of permanent differences between financial statement and income tax reporting requirements, have been made to the components of capital. These reclassifications have no impact on the net assets or NAV per share of the Funds. The following reclassifications, which are primarily attributed to the reclassification of distributions received, non-REIT return of capital reclassifications, the tax treatment of partnership holdings, expiration of prior year capital loss carryforwards and capitalized dividends on short sales have been made to the following Funds for the year ended December 31, 2016:
| | | | | | Accumulated | | | Accumulated | |
| | | Paid-In | | | Net Investment | | | Net Realized | |
| Fund | | Capital | | | Income(Loss) | | | Gains(Losses) | |
| Dynamic Equity Fund | | $ | (27,926,374 | ) | | $ | 43,496 | | | $ | 27,882,878 | |
| Controlled Growth with Income Fund | | | — | | | | 296,671 | | | | (296,671 | ) |
| Dynamic Diversified Income Fund | | | — | | | | 81,799 | | | | (81,799 | ) |
| Dynamic Global Allocation Fund | | | (1,105,403 | ) | | | (31,635 | ) | | | 1,137,038 | |
Notes to Financial Statements (Continued)
6. Commitments and Contingencies
The Funds indemnify the Trust’s officers and Trustees for certain liabilities that might arise from their performance of their duties to the Funds. Additionally, in the normal course of business, the Funds enter into contracts that contain a variety of representations and warranties and which provide general indemnifications. The Funds’ maximum exposure under these arrangements is unknown, as this would involve future claims that may be made against the Funds.
7. Principal Risks
Risks Associated with Concentration — Certain Funds invest a high percentage of their assets in specific sectors of the market in order to achieve a potentially greater investment return. As a result, these Funds may be more susceptible to economic, political, and regulatory developments in a particular sector of the market, positive or negative, and may experience increased volatility in the Funds’ NAVs and magnified effect on the total return.
Risks Associated with Credit — An issuer may be unable to make timely payments of either principal or interest. This may cause the issuer’s securities to decline in value. Credit risk is particularly relevant to those Funds that invest a significant amount of their assets in junk bonds or lower-rated securities.
Risks Associated with Interest Rate Changes — As interest rates rise, the value of fixed-income securities a Fund owns will likely decrease. The price of debt securities is generally linked to the prevailing market interest rates. In general, when interest rates rise, the price of debt securities falls, and when interest rates fall, the price of debt securities rises. The price volatility of a debt security also depends on its maturity. Longer-term securities are generally more volatile, so the longer the average maturity or duration of these securities, the greater their price risk. Duration is a measure of the expected life, taking into account any prepayment or call features of the security, that is used to determine the price sensitivity of the security for a given change in interest rates. Specifically, duration is the change in the value of a fixed-income security that will result from a 1% change in interest rates, and generally is stated in years. For example, as a general rule a 1% rise in interest rates means a 1% fall in value for every year of duration. Maturity, on the other hand, is the date on which a fixed-income security becomes due for payment of principal. The negative impact on fixed income securities if interest rates increase as a result could negatively impact a Fund’s NAV.
Risks Associated with Leverage — By investing the proceeds received from selling securities short, the Dynamic Equity Fund is employing leverage, which creates special risks. The use of leverage may increase the Fund’s exposure to long or short equity positions and may cause the Fund’s NAV to be more volatile than if the Fund had not used leverage. This could result in increased volatility of returns.
Please see the Funds’ prospectus for a complete discussion of these and other risks.
8. Fund Mergers
Allocation Funds’ Class Conversions:
At a meeting held on August 20, 2015, the Board approved the reclassification of Institutional Class shares as Class Y shares for the Allocation Funds, each a series of the Trust. The tax-free reclassification took place November 23, 2015.
Notes to Financial Statements (Continued)
| | | | | | | | | After | |
| | | Before Reclassification | | | Reclassification | |
| | | Institutional | | | | | | | |
| | | Class | | | Class Y | | | Class Y | |
| | | Shares | | | Shares | | | Shares | |
| Controlled Growth with Income Fund | | | | | | | | | | | | |
| Shares | | | 5,266 | (A) | | | 814,012 | | | | 819,278 | |
| Net Assets | | $ | 57,554 | | | $ | 8,897,003 | | | $ | 8,954,557 | |
| Net Asset Value | | $ | 10.93 | (A) | | $ | 10.93 | | | $ | 10.93 | |
| Dynamic Diversified Income Fund | | | | | | | | | | | | |
| Shares | | | 2,931 | (B) | | | 1,490,397 | | | | 1,493,328 | |
| Net Assets | | $ | 36,657 | | | $ | 18,638,857 | | | $ | 18,675,514 | |
| Net Asset Value | | $ | 12.51 | (B) | | $ | 12.51 | | | $ | 12.51 | |
| Dynamic Global Allocation Fund | | | | | | | | | | | | |
| Shares | | | 1,302 | (C) | | | 1,021,516 | | | | 1,022,818 | |
| Net Assets | | $ | 16,690 | | | $ | 13,093,510 | | | $ | 13,110,200 | |
| Net Asset Value | | $ | 12.82 | (C) | | $ | 12.82 | | | $ | 12.82 | |
(A) Reflects a 1.0014:1 reverse stock split which occurred on the date of reorganization, November 23, 2015.
(B) Reflects a 0.9954:1 stock split which occurred on the date of reorganization, November 23, 2015.
(C) Reflects a 0.9956:1 stock split which occurred on the date of reorganization, November 23, 2015.
Dynamic Global Allocation Fund:
At a meeting held on August 20, 2015, the Board approved an Agreement and Plan of Reorganization providing for the transfer of all assets and liabilities of the Touchstone Growth Allocation Fund to the Touchstone Dynamic Global Allocation Fund, each a series of the Trust. The tax-free merger took place November 23, 2015.
| | | Before Reorganization | | | After
Reorganization | |
| | | Touchstone | | | Touchstone | | | Touchstone | |
| | | Growth | | | Dynamic Global | | | Dynamic Global | |
| | | Allocation Fund | | | Allocation Fund | | | Allocation Fund | |
| Class A | | | | | | | | | | | | |
| Shares | | | 1,861,288 | (A) | | | 3,941,804 | | | | 5,803,092 | |
| Net Assets | | $ | 23,665,130 | | | $ | 50,117,759 | | | $ | 73,782,889 | |
| Net Asset Value | | $ | 12.71 | (A) | | $ | 12.71 | | | $ | 12.71 | |
| Class C | | | | | | | | | | | | |
| Shares | | | 1,476,741 | (B) | | | 3,025,813 | | | | 4,502,554 | |
| Net Assets | | $ | 18,389,246 | | | $ | 37,679,221 | | | $ | 56,068,467 | |
| Net Asset Value | | $ | 12.45 | (B) | | $ | 12.45 | | | $ | 12.45 | |
| Class Y* | | | | | | | | | | | | |
| Shares | | | 405,861 | (C) | | | 1,022,818 | | | | 1,428,679 | |
| Net Assets | | $ | 5,202,192 | | | $ | 13,110,200 | | | $ | 18,312,392 | |
| Net Asset Value | | $ | 12.82 | (C) | | $ | 12.82 | | | $ | 12.82 | |
| | | | | | | | | | | | | |
| Fund Total | | | | | | | | | | | | |
| Shares Outstanding | | | 3,417,583 | | | | 7,990,435 | | | | 11,734,325 | |
| Net Assets | | $ | 47,256,568 | | | $ | 100,907,180 | | | $ | 148,163,748 | |
| Unrealized Appreciation (Depreciation) | | $ | 5,285,107 | | | $ | 9,377,991 | | | $ | 14,663,098 | |
(A) Reflects a 1.1045:1 reverse stock split which occurred on the date of reorganization, November 23, 2015.
(B) Reflects a 1.0808:1 reverse stock split which occurred on the date of reorganization, November 23, 2015.
(C) Reflects a 1.1091:1 reverse stock split on Class Y shares and a 1.0070:1 reverse stock split on Institutional Class shares, which occurred on the date of reorganization, November 23, 2015.
* The Touchstone Growth Allocation Fund had Institutional Class shares outstanding immediately prior to the reorganization, which were exchanged for Class Y shares of the Touchstone Dynamic Global Allocation Fund.
Notes to Financial Statements (Continued)
Assuming this reorganization had been completed on January 1, 2015, the Dynamic Global Allocation Fund’s results of operations for the year ended December 31, 2015 would have been as follows:
| Net investment income | | $ | 1,582,980 | |
| Net realized and unrealized loss on investments | | $ | (1,178,410 | ) |
| Net increase in asset from operations | | $ | 404,570 | |
Because the combined investment portfolios have been managed as a single portfolio since the reorganization was completed, it is not practical to separate the amounts of revenue and earnings to the Dynamic Global Allocation Fund that have been included in its statement of operations since the reorganization.
9. Subsequent Events
Subsequent events occurring after the date of this report have been evaluated for potential impact to this report through the date the financial statements were issued. There were no subsequent events that necessitated recognition or disclosure in the Funds’ financial statements.
Report of Independent Registered Public Accounting Firm
The Board of Trustees and Shareholders of Touchstone Dynamic Equity Fund, Touchstone Controlled Growth with Income Fund, Touchstone Dynamic Diversified Income Fund, and Touchstone Dynamic Global Allocation Fund
We have audited the accompanying statements of assets and liabilities, including the portfolios of investments, of Touchstone Dynamic Equity Fund, Touchstone Controlled Growth with Income Fund, Touchstone Dynamic Diversified Income Fund, and Touchstone Dynamic Global Allocation Fund (the “Funds”) (four of the funds constituting the Touchstone Strategic Trust) as of December 31, 2016, and the related statements of operations and the statement of cash flows of Touchstone Dynamic Equity Fund for the year then ended, the statements of changes in net assets for each of the two years in the period then ended and the financial highlights for each of the four years in the period then ended and the five-month period ended December 31, 2012. These financial statements and financial highlights are the responsibility of the Funds’ management. Our responsibility is to express an opinion on these financial statements and financial highlights based on our audits. The financial highlights for the year ended July 31, 2012 were audited by other auditors whose report dated September 21, 2012 expressed an unqualified opinion on those financial highlights.
We conducted our audits in accordance with the standards of the Public Company Accounting Oversight Board (United States). Those standards require that we plan and perform the audit to obtain reasonable assurance about whether the financial statements and financial highlights are free of material misstatement. We were not engaged to perform an audit of the Funds’ internal control over financial reporting. Our audits included consideration of internal control over financial reporting as a basis for designing audit procedures that are appropriate in the circumstances, but not for the purpose of expressing an opinion on the effectiveness of the Funds’ internal control over financial reporting. Accordingly, we express no such opinion. An audit also includes examining, on a test basis, evidence supporting the amounts and disclosures in the financial statements and financial highlights, assessing the accounting principles used and significant estimates made by management, and evaluating the overall financial statement presentation. Our procedures included confirmation of securities owned as of December 31, 2016, by correspondence with the custodian, transfer agent, and brokers or by other appropriate auditing procedures where replies from brokers were not received. We believe that our audits provide a reasonable basis for our opinion.
In our opinion, the financial statements and financial highlights referred to above present fairly, in all material respects, the financial position of Touchstone Dynamic Equity Fund, Touchstone Controlled Growth with Income Fund, Touchstone Dynamic Diversified Income Fund, and Touchstone Dynamic Global Allocation Fund (four of the funds constituting the Touchstone Strategic Trust) at December 31, 2016, the results of their operations and its cash flows for Touchstone Dynamic Equity Fund for the year then ended, the changes in their net assets for each of the two years in the period then ended and the financial highlights for each of the four years in the period then ended and the five-month period ended December 31, 2012, in conformity with U.S generally accepted accounting principles.

| Cincinnati, Ohio |
| February 17, 2017 |
Other Items (Unaudited)
Qualified Dividend Income
Under the Jobs and Growth Tax Relief Reconciliation Act of 2003 (the “Act”), the following percentages of ordinary dividends paid during the fiscal year ended December 31, 2016 are designated as “qualified dividend income,” as defined in the Act, and are subject to reduced tax rates. The Funds intend to pass through the maximum allowable percentage for Form 1099 Div.
| Dynamic Equity Fund | | | 100.00 | % |
| Controlled Growth with Income Fund | | | 23.35 | % |
| Dynamic Diversified Income Fund | | | 23.15 | % |
| Dynamic Global Allocation Fund | | | 28.72 | % |
Dividend Received Deduction
For corporate shareholders, the following ordinary distributions paid during the current fiscal year ended December 31, 2016 qualify for the corporate dividends received deduction. The Funds intend to pass through the maximum allowable percentage.
| Dynamic Equity Fund | | | 100.00 | % |
| Controlled Growth with Income Fund | | | 20.78 | % |
| Dynamic Diversified Income Fund | | | 12.80 | % |
| Dynamic Global Allocation Fund | | | 11.31 | % |
For the year ended December 31, 2016, the Controlled Growth with Income Fund and the Dynamic Global Allocation Fund designated $243,089 and $4,025,301, respectively, as long-term capital gains.
Foreign Tax Income & Foreign Tax Credit
Dynamic Diversified Income Fund and Dynamic Global Allocation Fund intend to pass through a foreign tax credit to their respective shareholders. For the fiscal year ended December 31, 2016, the total amount of foreign source income is $505,735 or $0.02 per share and $1,593,806 or $0.03 per share, respectively. The total amount of foreign taxes to be paid is $30,822 or $0.001 per share and $82,841 or $0.002 per share, respectively. Shareholders’ allocable share of the foreign tax credit will be reported on Form 1099 Div.
Proxy Voting Guidelines
The Sub-Advisors are responsible for exercising the voting rights associated with the securities purchased and held by the Funds. A description of the policies and procedures that the Sub-Advisors use in fulfilling this responsibility is available as an appendix to the most recent Statement of Additional Information, which can be obtained without charge by calling toll free 1.800.543.0407 or by visiting the Touchstone website at TouchstoneInvestments.com or on the Securities and Exchange Commission’s (the “Commission”) website sec.gov. Information regarding how those proxies were voted during the most recent twelve-month period ended June 30 is also available without charge by calling toll free 1.800.543.0407 or on the Commission’s website at sec.gov.
Quarterly Portfolio Disclosure
The Trust files a complete listing of portfolio holdings for each Fund as of the end of the first and third quarters of each fiscal year on Form N-Q. The complete listing (i) is available on the Commission’s website; (ii) may be reviewed and copied at the Commission’s Public Reference Room in Washington, DC; or (iii) will be made available to shareholders upon request by calling 1.800.543.0407. Information on the operation of the Public Reference Room may be obtained by calling 1.800.SEC.0330.
Schedule of Shareholder Expenses
As a shareholder of the Funds, you incur two types of costs: (1) transaction costs, including with respect to reinvested dividends or other distributions; and (2) ongoing costs, including investment advisory fees; distribution (12b-1)
Other Items (Unaudited) (Continued)
fees; and other Fund expenses. This example is intended to help you understand your ongoing costs (in dollars) of investing in the Funds and to compare these costs with the ongoing costs of investing in other mutual funds.
The example is based on an investment of $1,000 invested at the beginning of the period and held for the entire period (July 1, 2016 through December 31, 2016).
Actual Expenses
The first line for each share class of a Fund in the table below provides information about actual account values and actual expenses. You may use the information in this line, together with the amount you invested, to estimate the expenses that you paid over the period. Simply divide your account value by $1,000 (for example, an $8,600 account value divided by $1,000 = 8.6), then multiply the result by the number in the first line under the heading entitled “Expenses Paid During the Six Months Ended December 31, 2016” to estimate the expenses you paid on your account during this period.
Hypothetical Example for Comparison Purposes
The second line for each share class of a Fund in the table below provides information about hypothetical account values and hypothetical expenses based on the Funds’ actual expense ratio and an assumed rate of return of 5% per year before expenses, which is not the Funds’ actual return. The hypothetical account values and expenses may not be used to estimate the actual ending account balance or expenses you paid for the period. You may use this information to compare the ongoing costs of investing in the Funds and other funds. To do so, compare this 5% hypothetical example with the 5% hypothetical examples that appear in the shareholder reports of the other funds.
Please note that the expenses shown in the table below are meant to highlight your ongoing costs only and do not reflect any transactional costs, such as sales charges (loads), redemption fees, or exchange fees. Therefore, the second line for each share class of a Fund in the table below is useful in comparing ongoing costs only, and will not help you determine the relative total costs of owning different funds. In addition, if these transactional costs were included, your costs would have been higher.
| | | | | Net Expense | | | Beginning | | | Ending | | | Expenses | |
| | | | | Ratio | | | Account | | | Account | | | Paid During | |
| | | | | Annualized | | | Value | | | Value | | | the Year Ended | |
| | | | | December 31, | | | July 1, | | | December 31, | | | December 31, | |
| | | | | 2016 | | | 2016 | | | 2016 | | | 2016* | |
| Touchstone Dynamic Equity Fund | | | | | | | | | | | | | | | | |
| Class A | | Actual | | | 1.87 | % | | $ | 1,000.00 | | | $ | 1,034.50 | | | $ | 9.56 | ** |
| Class A | | Hypothetical | | | 1.87 | % | | $ | 1,000.00 | | | $ | 1,015.74 | | | $ | 9.48 | ** |
| | | | | | | | | | | | | | | | | | | |
| Class C | | Actual | | | 2.62 | % | | $ | 1,000.00 | | | $ | 1,030.90 | | | $ | 13.38 | ** |
| Class C | | Hypothetical | | | 2.62 | % | | $ | 1,000.00 | | | $ | 1,011.97 | | | $ | 13.25 | ** |
| | | | | | | | | | | | | | | | | | | |
| Class Y | | Actual | | | 1.55 | % | | $ | 1,000.00 | | | $ | 1,036.30 | | | $ | 7.93 | ** |
| Class Y | | Hypothetical | | | 1.55 | % | | $ | 1,000.00 | | | $ | 1,017.34 | | | $ | 7.86 | ** |
| | | | | | | | | | | | | | | | | | | |
| Institutional Class | | Actual | | | 1.55 | % | | $ | 1,000.00 | | | $ | 1,036.60 | | | $ | 7.93 | ** |
| Institutional Class | | Hypothetical | | | 1.55 | % | | $ | 1,000.00 | | | $ | 1,017.34 | | | $ | 7.86 | ** |
Other Items (Unaudited) (Continued)
| | | | | Net Expense | | | Beginning | | | Ending | | | Expenses | |
| | | | | Ratio | | | Account | | | Account | | | Paid During | |
| | | | | Annualized | | | Value | | | Value | | | the Year Ended | |
| | | | | December 31, | | | July 1, | | | December 31, | | | December 31, | |
| | | | | 2016 | | | 2016 | | | 2016 | | | 2016* | |
| Touchstone Controlled Growth with Income Fund*** | | | | | | | | | | | | | | | | |
| Class A | | Actual | | | 0.49 | % | | $ | 1,000.00 | | | $ | 1,025.00 | | | $ | 2.49 | |
| Class A | | Hypothetical | | | 0.49 | % | | $ | 1,000.00 | | | $ | 1,022.67 | | | $ | 2.49 | |
| | | | | | | | | | | | | | | | | | | |
| Class C | | Actual | | | 1.24 | % | | $ | 1,000.00 | | | $ | 1,021.20 | | | $ | 6.30 | |
| Class C | | Hypothetical | | | 1.24 | % | | $ | 1,000.00 | | | $ | 1,018.90 | | | $ | 6.29 | |
| | | | | | | | | | | | | | | | | | | |
| Class Y | | Actual | | | 0.24 | % | | $ | 1,000.00 | | | $ | 1,026.30 | | | $ | 1.22 | |
| Class Y | | Hypothetical | | | 0.24 | % | | $ | 1,000.00 | | | $ | 1,023.93 | | | $ | 1.22 | |
| | | | | | | | | | | | | | | | | | | |
| Touchstone Dynamic Diversified Income Fund*** | | | | | | | | | | | | | | | | |
| Class A | | Actual | | | 0.49 | % | | $ | 1,000.00 | | | $ | 1,026.80 | | | $ | 2.50 | |
| Class A | | Hypothetical | | | 0.49 | % | | $ | 1,000.00 | | | $ | 1,022.67 | | | $ | 2.49 | |
| | | | | | | | | | | | | | | | | | | |
| Class C | | Actual | | | 1.24 | % | | $ | 1,000.00 | | | $ | 1,022.80 | | | $ | 6.30 | |
| Class C | | Hypothetical | | | 1.24 | % | | $ | 1,000.00 | | | $ | 1,018.90 | | | $ | 6.29 | |
| | | | | | | | | | | | | | | | | | | |
| Class Y | | Actual | | | 0.24 | % | | $ | 1,000.00 | | | $ | 1,028.00 | | | $ | 1.22 | |
| Class Y | | Hypothetical | | | 0.24 | % | | $ | 1,000.00 | | | $ | 1,023.93 | | | $ | 1.22 | |
| | | | | | | | | | | | | | | | | | | |
| Touchstone Dynamic Global Allocation Fund*** | | | | | | | | | | | | | | | | |
| Class A | | Actual | | | 0.49 | % | | $ | 1,000.00 | | | $ | 1,025.20 | | | $ | 2.49 | |
| Class A | | Hypothetical | | | 0.49 | % | | $ | 1,000.00 | | | $ | 1,022.67 | | | $ | 2.49 | |
| | | | | | | | | | | | | | | | | | | |
| Class C | | Actual | | | 1.24 | % | | $ | 1,000.00 | | | $ | 1,021.00 | | | $ | 6.30 | |
| Class C | | Hypothetical | | | 1.24 | % | | $ | 1,000.00 | | | $ | 1,018.90 | | | $ | 6.29 | |
| | | | | | | | | | | | | | | | | | | |
| Class Y | | Actual | | | 0.24 | % | | $ | 1,000.00 | | | $ | 1,026.20 | | | $ | 1.22 | |
| Class Y | | Hypothetical | | | 0.24 | % | | $ | 1,000.00 | | | $ | 1,023.93 | | | $ | 1.22 | |
| * | Expenses are equal to the Fund's annualized expense ratio, multiplied by the average account value over the period, multiplied by 184/366 (to reflect one-half year period). |
| ** | Excluding interest and dividend expenses on securities sold short, your actual cost of investment in Class A, Class C, Class Y and Institutional Class would be $7.93, $11.74, $6.30 and $6.30, respectively, and your hypothetical cost of investment in Class A, Class C, Class Y and Institutional Class would be $7.86, $11.64, $6.24, and $6.24, respectively. |
| *** | The annualized expense ratios for the Allocation Funds do not include fees and expenses of the Underlying Funds in which the Allocation Funds invest. |
Advisory and Sub-Advisory Agreement Approval Disclosure
At a meeting held on November 17, 2016, the Board of Trustees (the “Board” or “Trustees”) of the Touchstone Strategic Trust (the “Trust”), and by a separate vote, the Independent Trustees of the Trust, approved the continuance of the Investment Advisory Agreement between the Trust and the Advisor with respect to each Fund of the Trust, and the continuance of the Sub-Advisory Agreement between the Advisor and each Fund’s respective Sub-Advisor.
In determining whether to approve the continuation of the Investment Advisory Agreement and the Sub-Advisory Agreements, the Advisor furnished information necessary for a majority of the Independent Trustees to make the determination that the continuance of the Investment Advisory Agreement and each Sub-Advisory Agreement was in the best interests of the respective Funds and their shareholders. The information provided to the Board included: (1) industry data comparing advisory fees and expense ratios of comparable investment companies; (2) comparative performance information; (3) the Advisor’s and its affiliates’ revenues and costs of providing
Other Items (Unaudited) (Continued)
services to the Funds; and (4) information about the Advisor’s and Sub-Advisors’ personnel. Prior to voting, the Independent Trustees reviewed the proposed continuance of the Investment Advisory Agreement and the Sub-Advisory Agreements with management and experienced independent legal counsel and received materials from such counsel discussing the legal standards for their consideration of the proposed continuation of the Investment Advisory Agreement and each Sub-Advisory Agreement. The Independent Trustees also reviewed the proposed continuation of the Investment Advisory Agreement and each Sub-Advisory Agreement with independent legal counsel in private sessions at which no representatives of management were present.
In approving the Funds’ Investment Advisory Agreement, the Board considered various factors, among them: (1) the nature, extent and quality of services provided to the Funds, including the personnel providing such services; (2) the Advisor’s compensation and profitability; (3) a comparison of fees and performance with other advisers; (4) economies of scale; and (5) the terms of the Investment Advisory Agreement. The Board’s analysis of these factors is set forth below. The Independent Trustees were advised by independent legal counsel throughout the process.
Nature, Extent and Quality of Advisor Services. The Board considered the level and depth of knowledge of the Advisor, including the professional experience and qualifications of senior personnel. In evaluating the quality of services provided by the Advisor, the Board took into account its familiarity with the Advisor’s senior management through Board meetings, discussions and reports during the preceding year. The Board also took into account the Advisor’s compliance policies and procedures. The quality of administrative and other services, including the Advisor’s role in coordinating the activities of the Funds’ other service providers, was also considered. The Board also considered the Advisor’s relationship with its affiliates and the resources available to them, as well as any potential conflicts of interest.
The Board discussed the Advisor’s effectiveness in monitoring the performance of each Sub-Advisor, and the Advisor’s timeliness in responding to performance issues. The Board considered the Advisor’s process for monitoring each of the Sub-Advisors, which includes an examination of both qualitative and quantitative elements of the Sub-Advisor’s organization, personnel, procedures, investment discipline, infrastructure and performance. The Board considered that the Advisor conducts regular on-site compliance visits with each Sub-Advisor, during which the Advisor examines a wide variety of factors, such as the financial condition of the Sub-Advisor, the quality of the Sub-Advisor’s systems, the effectiveness of the Sub-Advisor’s disaster recovery programs, trade allocation and execution procedures, compliance with the Sub-Advisor’s policies and procedures, results of regulatory examinations and any other factors that might affect the quality of services that the Sub-Advisor provides to the applicable Fund(s). The Board noted that the Advisor’s compliance monitoring processes also include quarterly reviews of compliance reports, and that any significant issues arising from such reports and the Advisor’s compliance visits to the Sub-Advisors are reported to the Board.
The Trustees concluded that they were satisfied with the nature, extent and quality of services provided to each Fund by the Advisor under the Investment Advisory Agreement.
Advisor’s Compensation and Profitability. The Board took into consideration the financial condition and profitability of the Advisor and its affiliates and the direct and indirect benefits derived by the Advisor and its affiliates from the Advisor’s relationship with the Funds. The information considered by the Board included operating profit margin information for the Advisor’s business as a whole. The Board noted that the Advisor had waived a portion of advisory fees and administrative fees and/or reimbursed expenses in order to limit the Funds’ net operating expenses. The Board also noted that the Advisor pays the Sub-Advisors’ sub-advisory fees out of the advisory fees the Advisor receives from the Funds. The Board reviewed the profitability of the Advisor’s relationship with the Funds both before and after tax expenses, and also considered whether the Advisor has the financial wherewithal to continue to provide services to the Funds, noting the ongoing commitment of the Advisor’s parent company with respect to providing support and resources as needed. The Board considered that the
Other Items (Unaudited) (Continued)
Funds’ distributor, an affiliate of the Advisor, receives Rule 12b-1 distribution fees from the Funds and receives a portion of the sales charges on sales or redemptions of certain classes of shares. The Board also noted that the Advisor derives benefits to its reputation and other benefits from its association with the Funds.
The Board recognized that the Advisor should be entitled to earn a reasonable level of profits in exchange for the level of services it provides to each Fund and the entrepreneurial risk that it assumes as Advisor. Based upon their review, the Trustees concluded that the Advisor’s and its affiliates’ level of profitability, if any, from their relationship with each Fund was reasonable and not excessive.
Expenses and Performance. The Board compared the respective advisory fees and total expense ratios for each of the Funds with various comparative data, including the median and average advisory fees and total expense ratios of each Fund’s respective peer group. The Board also considered, among other data, the Funds’ respective performance results during the six-month, twelve-month and thirty-six-month periods ended June 30, 2016, and noted that the Board reviews on a quarterly basis detailed information about each Fund’s performance results, portfolio composition and investment strategies. The Board also took into account current market conditions and their effect on the Funds’ performance.
The Board also considered the effect of each Fund’s growth and size on its performance and expenses. The Board noted that the Advisor had waived a portion of the fees and/or reimbursed expenses of the Funds in order to reduce the Funds’ respective operating expenses to targeted levels. The Board noted that the sub-advisory fees under the Sub-Advisory Agreement with respect to each Fund were paid by the Advisor out of the advisory fees it receives from the Fund and considered the impact of such sub-advisory fees on the profitability of the Advisor. In reviewing the respective expense ratios and performance of each of the Funds, the Board also took into account the nature, extent and quality of the services provided to the Funds by the Advisor and its affiliates.
The Board considered, among other data, the specific factors and related conclusions set forth below with respect to each Fund:
Touchstone Dynamic Equity Fund. The Fund’s advisory fee and total expense ratio (net of applicable expense waivers and reimbursements) were at the median and above the median, respectively, of its peer group. The Board noted that the Advisor and/or affiliates was currently waiving a portion of the Fund’s fees. The Fund’s performance for the six-month period ended June 30, 2016 was in the 2nd quintile of its peer group. The Fund’s performance for the twelve- and thirty-six-month periods ended June 30, 2016 was in the 1st quintile of its peer group. Based upon their review, the Trustees concluded that the Fund’s performance was satisfactory relative to the performance of funds with similar investment objectives and relevant indices, and that the advisory fee was reasonable in light of the services received by the Fund from the Advisor and the other factors considered.
Touchstone Controlled Growth with Income Fund. The Fund’s advisory fee and total expense ratio (net of applicable expense waivers and reimbursements) were below the median of its peer group. The Board noted that the Advisor was currently waiving a portion of the Fund’s fees. The Fund’s performance for the six-month period ended June 30, 2016 was in the 2nd quintile of its peer group. The Fund’s performance for the twelve- and thirty-six month periods ended June 30, 2016 was in the 1st quintile of its peer group. Based upon their review, the Trustees concluded that the Fund’s performance was satisfactory relative to the performance of funds with similar investment objectives and relative indices, and that the advisory fee was reasonable in light of the services received by the Fund and the other factors considered.
Touchstone Dynamic Diversified Income Fund. The Fund’s advisory fee and total expense ratio (net of applicable expense waivers and reimbursements) were above the median of its peer group. The Board noted that the Advisor was currently waiving a portion of the Fund’s fees. The Fund’s performance for the six-, twelve- and thirty-six-month
Other Items (Unaudited) (Continued)
periods ended June 30, 2016 was in the 1st quintile of its peer group. Based upon their review, the Trustees concluded that the Fund’s performance was satisfactory relative to the performance of funds with similar investment objectives and relative indices, and that the advisory fee was reasonable in light of the services received by the Fund and the other factors considered.
Touchstone Dynamic Global Allocation Fund. The Fund’s advisory fee and total expense ratio (net of applicable expense waivers and reimbursements) were above the median of its peer group. The Board noted that the Advisor was currently waiving a portion of the Fund’s fees. The Fund’s performance for the six-month period ended June 30, 2016 was in the 5th quintile of its peer group, the Fund’s performance for the twelve-month period ended June 30, 2016 was in the 4th quintile of its peer group, and the Fund’s performance for the thirty-six-month period ended June 30, 2016 was in the 2nd quintile of its peer group. The Board noted management’s discussion of the Fund’s performance as well as changes to the Fund’s sub-advisor and principal investment strategies which took effect in November 2015. Based upon their review, the Trustees concluded that the Fund’s performance was being addressed, and that the advisory fee was reasonable in light of the services received by the Fund and the other factors considered.
Economies of Scale. The Board considered the effect of each Fund’s current size and potential growth on its performance and expenses. The Board took into account management’s discussion of the Funds’ advisory fee structure. The Board considered the effective advisory fees under the Investment Advisory Agreement as a percentage of assets at different asset levels and possible economies of scale that might be realized if the assets of each Fund increase. The Board noted that the advisory fee schedules for the Funds contain breakpoints that would reduce the respective advisory fee rate on assets above specified levels as the respective Fund’s assets increased. The Board also noted that if a Fund’s assets increase over time, the Fund also might realize other economies of scale if assets increase proportionally more than certain other expenses. The Board also considered the fact that, under the Investment Advisory Agreement, the advisory fee payable to the Advisor by a Fund was reduced by the total sub-advisory fee paid by the Advisor to the Fund’s Sub-Advisor.
Conclusion. In considering the renewal of the Funds’ Investment Advisory Agreement, the Board, including the Independent Trustees, did not identify any single factor as controlling, and each Trustee may have attributed different weights to the various factors. The Trustees evaluated all information available to them on a Fund-by-Fund basis, and their determinations were made separately with respect to each Fund. The Board reached the following conclusions regarding the Funds’ Investment Advisory Agreement with the Advisor, among others: (a) the Advisor demonstrated that it possesses the capability and resources to perform the duties required of it under the Investment Advisory Agreement; (b) the Advisor maintains an appropriate compliance program; (c) the overall performance of each Fund is satisfactory relative to the performance of funds with similar investment objectives and relevant indices or is being addressed; and (d) each Fund’s advisory fee is reasonable in light of the services received by the Fund from the Advisor and the other factors considered. Based on their conclusions, the Trustees determined with respect to each Fund that continuation of the Investment Advisory Agreement was in the best interests of the Fund and its shareholders.
In approving the Funds’ respective Sub-Advisory Agreement, the Board considered various factors with respect to each Fund and the applicable Sub-Advisory Agreement, among them: (1) the nature, extent and quality of services provided to the Fund, including the personnel providing such services; (2) the Sub-Advisor’s compensation; (3) a comparison of the sub-advisory fee and performance with other advisers; and (4) the terms of the Sub-Advisory Agreement. The Board’s analysis of these factors is set forth below. The Independent Trustees were advised by independent legal counsel throughout the process.
Nature, Extent and Quality of Services Provided; Investment Personnel. The Board considered information provided by the Advisor regarding the services provided by each Sub-Advisor, including information presented periodically throughout the previous year. The Board noted that, on a periodic basis, the Board meets with portfolio managers
Other Items (Unaudited) (Continued)
of the Sub-Advisors to discuss their respective performance and investment processes and strategies. The Board considered each Sub-Advisor’s level of knowledge and investment style. The Board reviewed the experience and credentials of the applicable investment personnel who are responsible for managing the investment of portfolio securities with respect to the Funds.
Sub-Advisor’s Compensation, Profitability and Economies of Scale. The Board also took into consideration the financial condition of each Sub-Advisor and any indirect benefits derived by each Sub-Advisor and its affiliates from the Sub-Advisor’s relationship with the Funds. In considering the profitability to each Sub-Advisor of its relationship with the Fund(s), the Board noted the undertaking of the Advisor to maintain expense limitations for the Funds and also noted that the sub-advisory fees under the Sub-Advisory Agreements were paid by the Advisor out of the advisory fees that it receives under the Investment Advisory Agreement and are negotiated at arm’s-length. As a consequence, the profitability to each Sub-Advisor of its relationship with a Fund was not a substantial factor in the Board’s deliberations. For similar reasons, the Board did not consider the potential economies of scale in each Sub-Advisor’s management of the applicable Fund to be a substantial factor in its consideration, although the Board noted that the sub-advisory fee schedule for each Fund contained breakpoints that would reduce the sub-advisory fee rate on assets above specified levels as the applicable Fund’s assets increased.
Sub-Advisory Fees and Fund Performance. The Board considered that each Fund pays an advisory fee to the Advisor and that the Advisor pays a sub-advisory fee to the Sub-Advisor out of the advisory fees it receives from each respective Fund. The Board also compared the sub-advisory fees paid by the Advisor to fees charged by the Sub-Advisor to manage comparable institutional separate accounts. The Board considered the amount retained by the Advisor and the sub-advisory fees paid to each Sub-Advisor with respect to the various services provided by the Advisor and the Sub-Advisor. The Board also noted that the Advisor negotiated the sub-advisory fee with each of the Sub-Advisors at arm’s-length. The Board reviewed the sub-advisory fee for each Fund in relation to various comparative data, including the median and average sub-advisory fees of each Fund’s peer group, and considered the following information:
Touchstone Dynamic Equity Fund. The Fund’s sub-advisory fee was at the median of its peer group. Based upon their review, the Trustees concluded that the sub-advisory fee was reasonable in light of the services received by the Fund from the Sub-Advisor and the other factors considered.
Touchstone Controlled Growth with Income Fund. The Fund’s sub-advisory fee was below the median of its peer group. Based upon their review, the Trustees concluded that the sub-advisory fee was reasonable in light of the services received by the Fund from the Sub-Advisor and the other factors considered.
Touchstone Dynamic Diversified Income Fund. The Fund’s sub-advisory fee was below the median of its peer group. Based upon their review, the Trustees concluded that the sub-advisory fee was reasonable in light of the services received by the Fund from the Sub-Advisor and the other factors considered.
Touchstone Dynamic Global Allocation Fund. The Fund’s sub-advisory fee was below the median of its peer group. Based upon their review, the Trustees concluded that the sub-advisory fee was reasonable in light of the services received by the Fund from the Sub-Advisor and the other factors considered.
As noted above, the Board considered each Fund’s performance during the six-month, twelve-month and thirty-six-month periods ended June 30, 2016, as compared to each Fund’s peer group and noted that the Board reviews on a quarterly basis detailed information about each Fund’s performance results, portfolio composition and investment strategies. The Board also noted the Advisor’s expertise and resources in monitoring the performance, investment style and risk-adjusted performance of each Sub-Advisor. The Board also was mindful of the Advisor’s ongoing monitoring of each Sub-Advisor’s performance and the measures undertaken by the Advisor to address any underperformance.
Other Items (Unaudited) (Continued)
Conclusion. In considering the renewal of the Sub-Advisory Agreement with respect to each applicable Fund, the Board, including the Independent Trustees, did not identify any single factor as controlling, and each Trustee may have attributed different weights to the various factors. The Board reached the following conclusions regarding each Sub-Advisory Agreement, among others: (a) the Sub-Advisor is qualified to manage each Fund’s assets in accordance with the Fund’s investment goals and policies; (b) the Sub-Advisor maintains an appropriate compliance program; (c) the overall performance of each Fund is satisfactory relative to the performance of funds with similar investment objectives and relevant indices or is being addressed; (d) each Fund’s sub-advisory fee is reasonable in light of the services received by the Fund from the Sub-Advisor and the other factors considered; and (e) the Sub-Advisor’s investment strategies are appropriate for pursuing the investment goals of each Fund. Based on its conclusions, the Board determined that approval of the Sub-Advisory Agreement with respect to each applicable Fund was in the best interests of the Fund and its shareholders.
Management of the Trust (Unaudited)
Listed below is required information regarding the Trustees and principal officers of the Trust. The Trust’s Statement of Additional Information includes additional information about the Trustees and is available, without charge, upon request by calling 1.800.543.0407 or by visiting the Touchstone website at TouchstoneInvestments.com.
| Interested Trustees1: | | | | | | | | | | |
| | | | | | | | | Number | | |
| | | | | | | | | of Funds | | |
| | | | | | | | | Overseen | | |
| | | | | Term of | | | | in the | | |
| Name | | Position(s) | | Office And | | | | Touchstone | | Other |
| Address | | Held with | | Length of | | Principal Occupation(s) | | Fund | | Directorships |
| Age | | Trust | | Time Served | | During Past 5 Years | | Complex2 | | Held During the Past 5 Years3 |
Jill T. McGruder Touchstone Advisors, Inc. 303 Broadway Suite 1100 Cincinnati, OH 45202 Year of Birth: 1955 | | Trustee and President | | Until retirement at age 75 or until she resigns or is removed Trustee since 1999 | | President and CEO of IFS Financial Services, Inc. (a holding company). | | 41 | | IFS Financial Services, Inc. (a holding company) from 1999 to the present; Integrity and National Integrity Life Insurance Co. from 2005 to the present; Touchstone Securities (the Trust’s distributor) from 1999 to the present; Touchstone Advisors (the Trust’s investment advisor and administrator) from 1999 to the present; W&S Brokerage Services (a brokerage company) from 1999 to the present; W&S Financial Group Distributors (a distribution company) from 1999 to the present; Cincinnati Analysts, Inc. from 2012 to the present; Columbus Life Insurance Co. from 2016 to the present; Every Child Succeeds (a social services agency) from 2007 to the present; Taft Museum of Art from 2007 to the present; and YWCA of Greater Cincinnati from 2012 to the present. |
| Independent Trustees: | | | | | | | | | | |
Phillip R. Cox c/o Touchstone Advisors, Inc. 303 Broadway Suite 1100 Cincinnati, OH 45202 Year of Birth: 1947 | | Trustee | | Until retirement at age 75 or until he resigns or is removed Trustee since 1999 | | President and Chief Executive Officer of Cox Financial Corp. (a financial services company) from 1971 to the present. | | 41 | | Director of Cincinnati Bell (a communications company) from 1994 to the present; Bethesda Inc. (a hospital) from 2005 to the present; Timken Co. (a manufacturing company) from 2004 to 2014; TimkenSteel from 2014 to the present; Diebold, Inc. (a technology solutions company) from 2004 to the present; and Ohio Business Alliance for Higher Education and the Economy from 2005 to the present. |
William C. Gale c/o Touchstone Advisors, Inc. 303 Broadway Suite 1100 Cincinnati, OH 45202 Year of Birth: 1952 | | Trustee | | Until retirement at age 75 or until he resigns or is removed Trustee since 2013 | | Retired; formerly Senior Vice President and Chief Financial Officer (from 2003 to January 2015) of Cintas Corporation (a business services company). | | 41 | | None. |
Management of the Trust (Unaudited) (Continued)
| Independent Trustees (Continued): | | | | | | | | |
| | | | | | | | | Number | | |
| | | | | | | | | of Funds | | |
| | | | | | | | | Overseen | | |
| | | | | Term of | | | | in the | | |
| Name | | Position(s) | | Office And | | | | Touchstone | | Other |
| Address | | Held with | | Length of | | Principal Occupation(s) | | Fund | | Directorships |
| Age | | Trust | | Time Served | | During Past 5 Years | | Complex2 | | Held During the Past 5 Years3 |
Susan J. Hickenlooper c/o Touchstone Advisors, Inc. 303 Broadway Suite 1100 Cincinnati, OH 45202 Year of Birth: 1946 | | Trustee | | Until retirement at age 75 or until she resigns or is removed Trustee since 2009 | | Retired; formerly Financial Analyst for Impact 100 (charitable organization) from November 2012 to 2013. | | 41 | | Trustee of Diocese of Southern Ohio from 2014 to the present; and Trustee of Cincinnati Parks Foundation from 2000 to 2016. |
Kevin A. Robie c/o Touchstone Advisors, Inc. 303 Broadway Suite 1100 Cincinnati, OH 45202 Year of Birth: 1956 | | Trustee | | Until retirement at age 75 or until he resigns or is removed Trustee since 2013 | | Vice President of Portfolio Management at Soin International LLC (a multinational holding company) from 2004 to the present. | | 41 | | SaverSystems, Inc. from 2015 to the present; Director of Buckeye EcoCare, Inc. (a lawn care company) from 2013 to the present; Trustee of Dayton Region New Market Fund, LLC (a private fund) from 2010 to the present; and Trustee of the Entrepreneurs Center, Inc. (a small business incubator) from 2006 to the present. |
Edward J. VonderBrink c/o Touchstone Advisors, Inc. 303 Broadway Suite 1100 Cincinnati, OH 45202 Year of Birth: 1944 | | Trustee | | Until retirement at age 75 or until he resigns or is removed Trustee since 2013 | | Consultant, VonderBrink Consulting LLC from 2000 to the present. | | 41 | | Director of Streamline Health Solutions, Inc. (healthcare IT) from 2006 to 2015; Mercy Health from 2013 to the present; Mercy Health Foundation (healthcare nonprofit) from 2008 to the present; Al Neyer Inc. (a construction company) from 2013 to the present; and BASCO Shower Door from 2011 to the present. |
| 1 | Ms. McGruder, as a director of the Advisor and the Trust's Distributor, and an officer of affiliates of the Advisor and the Trust' s Distributor, is an “interested person” of the Trust within the meaning of Section 2(a)(19) of the 1940 Act. |
| 2 | As of December 31, 2016, the Touchstone Fund Complex consists of 21 series of the Trust, 11 series of Touchstone Funds Group Trust, 1 series of Touchstone Institutional Funds Trust, 2 series of Touchstone Investment Trust and 6 variable annuity series of Touchstone Variable Series Trust. |
| 3 | Each Trustee is also a Trustee of Touchstone Funds Group Trust, Touchstone Institutional Funds Trust, Touchstone Investment Trust and Touchstone Variable Series Trust. |
Management of the Trust (Unaudited) (Continued)
The following is a list of the Principal Officers of the Trusts, the length of time served and principal occupations for the past five years.
| Principal Officers: | | | | | | |
| | | | | Term of | | |
| Name | | Position(s) | | Office And | | |
| Address | | Held with | | Length of | | Principal Occupation(s) |
| Age | | Trust1 | | Time Served | | During the Past 5 Years |
Jill T. McGruder Touchstone Advisors, Inc. 303 Broadway Suite 1100 Cincinnati, OH 45202 Year of Birth: 1955 | | President and Trustee | | Until resignation, removal or disqualification President since 2006 | | See biography above. |
Steven M. Graziano Touchstone Advisors, Inc. 303 Broadway Suite 1100 Cincinnati, OH 45202 Year of Birth: 1954 | | Vice President | | Until resignation, removal or disqualification Vice President since 2009 | | President of Touchstone Advisors, Inc. |
Timothy D. Paulin Touchstone Advisors, Inc. 303 Broadway Suite 1100 Cincinnati, OH 45202 Year of Birth: 1963 | | Vice President | | Until resignation, removal or disqualification Vice President since 2010 | | Senior Vice President of Investment Research and Product Management of Touchstone Advisors, Inc. |
Timothy S. Stearns Touchstone Advisors, Inc. 303 Broadway Suite 1100 Cincinnati, OH 45202 Year of Birth: 1963 | | Chief Compliance Officer | | Until resignation, removal or disqualification Chief Compliance Officer since 2013 | | Chief Compliance Officer of Touchstone Advisors, Inc.; Chief Compliance Officer of Envestnet Asset Management, Inc. (2009 to 2013). |
Terrie A. Wiedenheft Touchstone Advisors, Inc. 303 Broadway Suite 1100 Cincinnati, OH 45202 Year of Birth: 1962 | | Controller and Treasurer | | Until resignation, removal or disqualification Controller and Treasurer since 2006 | | Senior Vice President, Chief Financial Officer and Chief Operations Officer, of IFS Financial Services, Inc. (a holding company). |
Ellen Blanchard BNY Mellon Investment Servicing (US) Inc. 201 Washington St, 34th Fl. Boston, MA 02108 Year of Birth: 1973 | | Secretary | | Until resignation, removal or disqualification Secretary since 2015 | | Director of BNY Mellon Investment Servicing (US) Inc. |
| 1 | Each officer also holds the same office with the Touchstone Funds Group Trust, Touchstone Institutional Funds Trust, Touchstone Investment Trust and Touchstone Variable Series Trust. |
PRIVACY PROTECTION POLICY
We Respect Your Privacy
Thank you for your decision to invest with us. Touchstone and its affiliates have always placed a high value on the trust and confidence our clients place in us. We believe that confidence must be earned and validated through time. In today’s world, when technology allows the sharing of information at light speeds, trust must be reinforced by our sincere pledge to take the steps necessary to ensure that the information you share with us is treated with respect and confidentiality.
Our Pledge to Our Clients
| · | We collect only the information we need to service your account and administer our business. |
| · | We are committed to keeping your information confidential and we place strict limits and controls on the use and sharing of your information. |
| · | We make every effort to ensure the accuracy of your information. |
We Collect the Following Nonpublic Personal Information About You:
| · | Information we receive from you on or in applications or other forms, correspondence, or conversations, including, but not limited to, your name, address, phone number, social security number, assets, income and date of birth; and |
| · | Information about your transactions with us, our affiliates, or others, including, but not limited to, your account number and balance, payment history, parties to transactions, cost basis information, and other financial information. |
Categories of Information We Disclose and Parties to Whom We Disclose
We do not disclose any nonpublic personal information about our current or former clients to nonaffiliated third parties, except as required or permitted by law.
We Place Strict Limits and Controls on the Use and Sharing of Your Information
| · | We restrict access to nonpublic personal information about you to authorized employees who need the information to administer your business. |
| · | We maintain physical, electronic and procedural safeguards that comply with federal standards to protect this information. |
| · | We do not disclose any nonpublic personal information about our current or former clients to anyone, except as required or permitted by law or as described in this document. |
| · | We will not sell your personal information to anyone. |
We May Provide Information to Service Your Account
Sometimes it is necessary to provide information about you to various companies such as transfer agents, custodians, broker-dealers and marketing service firms to facilitate the servicing of your account. These organizations have a legitimate business need to see some of your personal information in order for us to provide service to you. We may disclose to these various companies the information that we collect as described above. We require that these companies, including our own subsidiaries and affiliates, strictly maintain the confidentiality of this information and abide by all applicable laws. Companies within our corporate family that may receive this information are financial service providers and insurance companies. We do not permit these associated companies to sell the information for their own purposes, and we never sell our customer information.
This policy is applicable to the following affiliated companies: Touchstone Funds Group Trust, Touchstone Investment Trust, Touchstone Strategic Trust, Touchstone Tax-Free Trust, Touchstone Variable Series Trust, Touchstone Institutional Funds Trust, Touchstone Securities, Inc.* and W&S Brokerage Services, Inc.
* Touchstone Securities, Inc. serves as the underwriter to the Touchstone Funds.
A Member of Western & Southern Financial Group®
The Privacy Protection Policy is not part of the Annual Report.


| Touchstone Investments |
| |
| Distributor |
| Touchstone Securities, Inc.* |
| 303 Broadway |
| Cincinnati, Ohio 45202-4203 800.638.8194 |
| www.touchstoneinvestments.com |
| |
| Investment Advisor |
| Touchstone Advisors, Inc.* |
| 303 Broadway |
| Cincinnati, Ohio 45202-4203 |
| |
| Transfer Agent |
| BNY Mellon Investment Servicing (US) Inc. |
| 4400 Computer Drive |
| Westborough, MA 01581 |
| |
| Shareholder Service |
| 800.543.0407 |
| |
| * A Member of Western & Southern Financial Group |
TSF-54CC-TST-AR-1612
Item 2. Code of Ethics.
| (a) | The registrant, as of the end of the period covered by this report, has adopted a code of ethics that applies to the registrant’s principal executive officer, principal financial officer, principal accounting officer or controller, or persons performing similar functions, regardless of whether these individuals are employed by the registrant or a third party. |
| (c) | There have been no amendments, during the period covered by this report, to a provision of the code of ethics that applies to the registrant’s principal executive officer, principal financial officer, principal accounting officer or controller, or persons performing similar functions, regardless of whether these individuals are employed by the registrant or a third party, and that relates to any element of the code of ethics description. |
| (d) | The registrant has not granted any waivers, including an implicit waiver, from a provision of the code of ethics that applies to the registrant’s principal executive officer, principal financial officer, principal accounting officer or controller, or persons performing similar functions, regardless of whether these individuals are employed by the registrant or a third party, that relates to one or more of the items set forth in paragraph (b) of this item’s instructions. |
Item 3. Audit Committee Financial Expert.
The registrant’s Board of Trustees has determined that the registrant has at least one audit committee financial expert serving on its audit committee. Mr. William Gale is the registrant’s audit committee financial expert and is an independent trustee within the meaning of the Investment Company Act of 1940, as amended (the “1940 Act”).
Item 4. Principal Accountant Fees and Services.
Audit Fees
| (a) | Audit fees for Touchstone Strategic Trust (December Funds) totaled $61,400 and $59,800 in fiscal 2016 and 2015, respectively, including fees associated with the annual audit and filing of Form N-1A and Form NSAR. |
Audit-Related Fees
| (b) | Audit related fees totaled $0 for 2016 and $17,000 for 2015, respectively. The fees related to issuing consents for N-1A and N-14 filings. |
Tax Fees
The fees for tax compliance services totaled $13,400 for 2016 and $17,170 for 2015. The fees relate to the preparation of federal income and excise tax returns and review of capital gains distribution calculations
All Other Fees
| (d) | The aggregate fees billed in each of the last two fiscal years for products and services provided by the principal accountant, other than the services reported in paragraphs (a) through (c) of this Item are $541 for 2016 and $573 for 2015, respectively. The fees are related to the PFIC Analyzer and Global Withholding Tax Reporter subscriptions |
| (e)(1) | Disclose the audit committee's pre-approval policies and procedures described in paragraph (c)(7) of Rule 2-01 of Regulation S-X. |
The Audit Committee’s pre-approval policies describe the types of audit, audit-related, tax and other services that have the general pre-approval of the Audit Committee. The pre-approval policies provide that annual audit service fees, tax services not specifically granted pre-approval, services exceeding pre-approved cost levels and other services that have not received general pre-approval will be subject to specific pre-approval by the Audit Committee. The pre-approval policies further provide that the Committee may grant general pre-approval to other audit services (statutory audits and services associated with SEC registration statements, periodic reports and other documents filed with the SEC or other documents issued in connection with securities offerings), audit-related services (accounting consultations related to accounting, financial reporting or disclosure matters not classified as “audit services,” assistance with understanding and implementing new accounting and financial reporting guidance from rulemaking authorities, agreed-upon or expanded audit procedures related to accounting and/or billing records required to respond to or comply with financial, accounting or regulatory reporting matters and assistance with internal control reporting requirements under Form N-SAR and Form N-CSR), tax services that have historically been provided by the auditor that the Committee believes would not impair the independence of the auditor and are consistent with the SEC’s rules on auditor independence and permissible non-audit services classified as “all other services” that are routine and recurring services.
| (e)(2) | All of the services described in paragraphs (b) through (d) of Item 4 were approved by the Audit Committee. |
| (f) | The percentage of hours expended on the principal accountant's engagement to audit the registrant's financial statements for the most recent fiscal year that were attributed to work performed by persons other than the principal accountant's full-time, permanent employees was less than fifty percent. |
| (g) | The aggregate non-audit fees for Touchstone Strategic Trust (December Funds) and certain entities*, totaled approximately $13,941 and $34,743 in 2016 and 2015, respectively. |
* These include the advisors (excluding sub-advisors) and any entity controlling, controlled by or under common control with the advisors that provides ongoing services to the registrant (Funds).
| (h) | The registrant's audit committee of the board of trustees has considered whether the provision of non-audit services that were rendered to the registrant's investment adviser (not including any sub-adviser whose role is primarily portfolio management and is subcontracted with or overseen by another investment adviser), and any entity controlling, controlled by, or under common control with the investment adviser that provides ongoing services to the registrant that were not pre-approved pursuant to paragraph (c)(7)(ii) of Rule 2-01 of Regulation S-X is compatible with maintaining the principal accountant's independence. |
Item 5. Audit Committee of Listed Registrants.
Not applicable.
Item 6. Investments.
| (a) | Schedule of Investments in securities of unaffiliated issuers as of the close of the reporting period is included as part of the report to shareholders filed under Item 1 of this form. |
Item 7. Disclosure of Proxy Voting Policies and Procedures for Closed-End Management Investment Companies.
Not applicable.
Item 8. Portfolio Managers of Closed-End Management Investment Companies.
Not applicable.
Item 9. Purchases of Equity Securities by Closed-End Management Investment Company and Affiliated Purchasers.
Not applicable.
Item 10. Submission of Matters to a Vote of Security Holders.
There have been no material changes to the procedures by which the shareholders may recommend nominees to the registrant’s board of trustees, where those changes were implemented after the registrant last provided disclosure in response to the requirements of Item 407(c)(2)(iv) of Regulation S-K (17 CFR 229.407) (as required by Item 22(b)(15) of Schedule 14A (17 CFR 240.14a-101)), or this Item.
Item 11. Controls and Procedures.
| (a) | The registrant’s principal executive and principal financial officers, or persons performing similar functions, have concluded that the registrant’s disclosure controls and procedures (as defined in Rule 30a-3(c) under the Investment Company Act of 1940, as amended (the “1940 Act”) (17 CFR 270.30a-3(c))) are effective, as of a date within 90 days of the filing date of the report that includes the disclosure required by this paragraph, based on their evaluation of these controls and procedures required by Rule 30a-3(b) under the 1940 Act (17 CFR 270.30a-3(b)) and Rules 13a-15(b) or 15d-15(b) under the Securities Exchange Act of 1934, as amended (17 CFR 240.13a-15(b) or 240.15d-15(b)). |
| (b) | There were no changes in the registrant’s internal control over financial reporting (as defined in Rule 30a-3(d) under the 1940 Act (17 CFR 270.30a-3(d))) that occurred during the registrant’s second fiscal quarter of the period covered by this report that has materially affected, or is reasonably likely to materially affect, the registrant’s internal control over financial reporting. |
Item 12. Exhibits.
| (a)(1) | Code of ethics, or any amendment thereto, that is the subject of disclosure required by Item 2 is attached hereto. |
| (a)(2) | Certifications pursuant to Rule 30a-2(a) under the 1940 Act and Section 302 of the Sarbanes-Oxley Act of 2002 are attached hereto. |
| (b) | Certifications pursuant to Rule 30a-2(b) under the 1940 Act and Section 906 of the Sarbanes- Oxley Act of 2002 are attached hereto. |
| (12.other) | Not applicable. |
SIGNATURES
Pursuant to the requirements of the Securities Exchange Act of 1934 and the Investment Company Act of 1940, the registrant has duly caused this report to be signed on its behalf by the undersigned, thereunto duly authorized.
(Registrant) Touchstone Strategic Trust
By (Signature and Title)* /s/ Jill T. McGruder
Jill T. McGruder, President
(principal executive officer)
Date 2/17/2017
Pursuant to the requirements of the Securities Exchange Act of 1934 and the Investment Company Act of 1940, this report has been signed below by the following persons on behalf of the registrant and in the capacities and on the dates indicated.
By (Signature and Title)* /s/ Jill T. McGruder
Jill T. McGruder, President
(principal executive officer)
Date 2/17/2017
By (Signature and Title)* /s/ Terrie A. Wiedenheft
Terrie A. Wiedenheft, Controller and Treasurer
(principal financial officer)
Date 2/17/2017
* Print the name and title of each signing officer under his or her signature.