UNITED STATES
SECURITIES AND EXCHANGE COMMISSION
Washington, D.C. 20549
FORM N-CSR
CERTIFIED SHAREHOLDER REPORT OF REGISTERED MANAGEMENT INVESTMENT COMPANIES
Investment Company Act file number 811-03651
Touchstone Strategic Trust
(Exact name of registrant as specified in charter)
303 Broadway, Suite 1100
Cincinnati, Ohio 45202-4203
(Address of principal executive offices) (Zip code)
Jill T. McGruder
303 Broadway, Suite 1100
Cincinnati, Ohio 45202-4203
(Name and address of agent for service)
Registrant's telephone number, including area code: 800-638-8194
Date of fiscal year end: March 31
Date of reporting period: March 31, 2017
Form N-CSR is to be used by management investment companies to file reports with the Commission not later than 10 days after the transmission to stockholders of any report that is required to be transmitted to stockholders under Rule 30e-1 under the Investment Company Act of 1940 (17 CFR 270.30e-1). The Commission may use the information provided on Form N-CSR in its regulatory, disclosure review, inspection, and policymaking roles.
A registrant is required to disclose the information specified by Form N-CSR, and the Commission will make this information public. A registrant is not required to respond to the collection of information contained in Form N-CSR unless the Form displays a currently valid Office of Management and Budget ("OMB") control number. Please direct comments concerning the accuracy of the information collection burden estimate and any suggestions for reducing the burden to Secretary, Securities and Exchange Commission, 450 Fifth Street, NW, Washington, DC 20549-0609. The OMB has reviewed this collection of information under the clearance requirements of 44 U.S.C. § 3507.
Item 1. Reports to Stockholders.
The Report to Shareholders is attached herewith.
March 31, 2017
Annual Report
Touchstone Strategic Trust
Touchstone Flexible Income Fund
Touchstone Focused Fund
Touchstone Growth Opportunities Fund
Touchstone International Growth Fund
Touchstone International Value Fund
Touchstone Mid Cap Growth Fund
Touchstone Sands Capital Emerging Markets Growth Fund
Touchstone Small Cap Growth Fund
Touchstone Sustainability and Impact Equity Fund

Table of Contents
This report identifies the Funds' investments on March 31, 2017. These holdings are subject to change. Not all investments in each Fund performed the same, nor is there any guarantee that these investments will perform as well in the future. Market forecasts provided in this report may not occur.
Letter from the President
Dear Shareholder:
We are pleased to provide you with the Touchstone Strategic Trust Annual Report. Inside you will find key financial information, as well as manager commentaries for the Funds, for the 12 months ended March 31, 2017.
The global economy endured two major surprises over the period, Britain’s vote in June to exit the European Union (i.e., “Brexit”), and the election of Donald Trump as U.S. President in November. In spite of the policy uncertainty created by these events, capital markets performed well during the period, led by U.S. small-capitalization stocks. Investor concerns about a slowing global economy and declining commodity prices dissipated in early 2016 when central bank leaders reiterated their willingness to maintain accommodative monetary policies. As a result, global capital markets entered the fiscal year rallying, led by a rebound in equities and commodity prices. U.S. economic data continued to show steady improvement in employment and Gross Domestic Product (GDP) growth throughout the 12-month period while inflation remained constrained. With this stable economic backdrop, the U.S. Federal Reserve Board (Fed) increased short-term rates twice, increasing the Federal Funds Rate by a total of half a percent.
Global equity markets finished the period in strong fashion with most major U.S. and non-U.S. indexes generating double-digit returns. U.S. small-cap stocks were the top performers, followed by U.S. mid-cap, large-cap and emerging market equities. China-led economic concerns abated early in the period and commodity exporting countries (e.g., South Africa, Brazil and Russia) and commodity-consuming emerging market countries (e.g., China and India) saw their equity markets rebound strongly. Developed stock markets posted strong absolute returns as well, led by the British and Japanese equity markets. Within the U.S. equity markets, value stocks outperformed their growth counterparts as the post-Financial Crisis bull market continued to mature.
While the Fed raised rates during the period, other developed market central banks in the European Union, United Kingdom and Japan continued their accommodative monetary policies. Stable U.S. economic growth and short-term rate hikes caused the U.S. Treasury yield curve to rise modestly as the bellwether 10-year Treasury yield increased by approximately half a percentage point during the period. The upward move in Treasury yields led to flat-to-negative returns for U.S. Treasury and Agency debt securities. Similarly non-U.S. government debt securities produced mostly negative returns for the period. Conversely, improvements in the U.S. economy gave investors the confidence to buy bank loans and corporate bonds across the credit quality spectrum. Credit spreads narrowed and these fixed income sectors all posted solid returns for the period.
After a year of strong returns across many asset classes, we believe that now is a good time to evaluate your financial situation. The counsel of a financial advisor can he1p determine an appropriate risk/return profile, prudent portfolio allocation, and the right path to addressing your long-term investment goals.
We greatly appreciate your continued support. Thank you for including Touchstone as part of your investment plan.
Sincerely,

Jill T. McGruder
President
Touchstone Strategic Trust
Management's Discussion of Fund Performance (Unaudited)
Touchstone Flexible Income Fund
Sub-Advised by ClearArc Capital, Inc.
Investment Philosophy
The Touchstone Flexible Income Fund seeks a high level of income consistent with reasonable risk and seeks capital appreciation as a secondary goal. The Fund primarily invests in income-producing securities such as debt securities, common stocks and preferred stocks. The Fund’s sub-advisor seeks to provide value by investing in asset classes that appear to be attractive based on their risks and in companies with attractive price-to-cash flow ratios. The Fund seeks returns by investing across a broader array of investments than traditional investment-grade fixed-income funds, and ClearArc believes that a low correlation between various asset classes leads to stability of expected returns.
Fund Performance
The Touchstone Flexible Income Fund (Class A Shares) outperformed its benchmark, the Bloomberg Barclays U.S. Aggregate Bond Index, for the 12-month period ended March 31, 2017. The Fund’s total return was 3.93 percent (calculated excluding the maximum sales charge), while the total return of the benchmark was 0.44 percent.
Market Environment
Two major unexpected events occurred during the 12-month period ended March 31, 2017: Britain’s June 2016 decision to exit the European Union, known as the “Brexit,” and the November 2016 election of Donald Trump as U.S. President; however, volatility was unusually low for most of the period. The U.S. Federal Reserve Board (Fed) raised interest rates twice with no ill effects and signaled it may step up the pace of rate hikes. During the majority of the period, inflation expectations rose from low levels on anticipated stimulus from Trump’s pro-growth agenda. The increase in inflation expectations started to fade as the 12-month period ended. The Trump Administration realized that Washington works at a slower pace than it had initially envisioned.
During the 12-month period, the S&P 500® Index, developed market non-U.S. equities and high yield corporate bond indexes all posted strong returns. Emerging market equities posted returns in line with U.S. equities. Foreign sovereign bonds performed poorly relative to credit markets as the European Union, Japanese and U.K. central banks maintained highly accommodative monetary policies.
Portfolio Review
There were a number of drivers of the Fund’s outperformance such as asset-backed bonds, preferred equities and dividend-paying common equities. Detractors to the Fund’s performance were in derivative positions in the Chicago Board Options Exchange Volatility Index (VIX), which measures volatility in the S&P 500® Index, and short forward contracts on emerging market currencies.
Outlook
The Fund continues to be defensively positioned. While we do see an improvement in economic growth, it is not clear how much of this is sustainable. We believe the current recovery is still fragile and can be derailed by any number of events. It is certainly possible that the rally in risky assets could last longer. However, we believe failure of the Trump Administration to pass pro-growth policies would mean a reversion to a deflationary environment at the margin. In contrast, we believe strong pro-growth policy progress by the Trump Administration would be more inflationary. Since we expect the overall long-term inflation trend to be upward and at times uneven, we will maintain a higher quality bias. We are emphasizing liquid positions and continue to look for relative value trades. Relative value focuses on price discrepancies among securities with similar economic or financial
Management's Discussion of Fund Performance (Unaudited) (Continued)
characteristics. Absent a major shift in the outlook, we expect the Fund’s duration to remain shorter than the benchmark’s. However, if we see progress on pro-growth Trump Administration policies and we see an increase in inflation expectations, we would likely reduce further the Fund’s duration.
Dividend-paying investments may not experience the same price appreciation as non-dividend paying instruments, dividend-issuing companies may choose not to pay a dividend, or the dividend may be less than what is anticipated.
Management's Discussion of Fund Performance (Unaudited) (Continued)
Comparison of the Change in Value of a $10,000 Investment in the
Touchstone Flexible Income Fund-Class A*and the Bloomberg Barclays U.S. Aggregate Bond Index
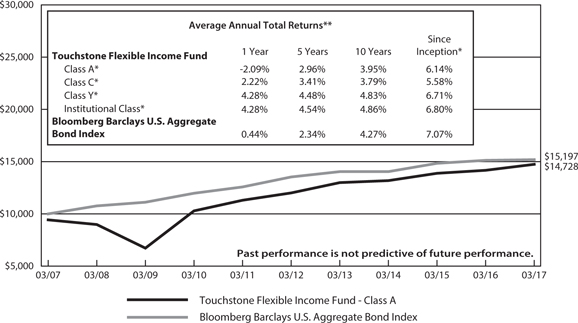
| * | The chart above represents performance of Class A shares only, which will vary from the performance of Class C shares, Class Y shares and Institutional Class shares based on the differences in sales loads and fees paid by shareholders in the different classes. The inception date of Class A shares, Class C shares, Class Y shares and Institutional Class shares was April 1, 2004, October 29, 2001, September 1, 1998 and September 10, 2012, respectively. Class A shares, Class C shares and Class Y shares performance information was calculated using the historical performance of the Fifth Third/Maxus Income Fund Investor shares, with an inception date of March 10, 1985, for periods prior to April 1, 2004, October 29, 2001 and September 1, 1998, respectively. Institutional Class shares performance information was calculated using the historical performance of Class Y shares for the periods prior to September 10, 2012. The returns have been restated for sales loads and fees applicable to Class A, Class C, Class Y and Institutional Class shares. The returns of the index listed above are based on the inception date of the Fund. |
| ** | The average annual total returns shown above are adjusted for maximum sales loads and fees, if applicable. The maximum offering price per share of Class A shares is equal to the net asset value (“NAV”) per share plus a sales load equal to 6.10% of the NAV (or 5.75% of the offering price). Class C shares are subject to a contingent deferred sales charge (“CDSC”) of 1.00%. The CDSC will be assessed on an amount equal to the lesser of (1) the NAV at the time of purchase of the shares being redeemed or (2) the NAV of such shares being redeemed, if redeemed within a one-year period from the date of purchase. Class Y shares and Institutional Class shares are not subject to sales charges. |
The performance of the above Fund does not reflect the deduction of taxes that a shareholder would pay on Fund distributions or the redemption of Fund shares.
Note to Chart
Bloomberg Barclays U.S. Aggregate Bond Index is an unmanaged index comprised of U.S. investment grade, fixed rate bond market securities, including government, government agency, corporate and mortgage-backed securities between one and ten years.
Management's Discussion of Fund Performance (Unaudited)
Touchstone Focused Fund
Sub-Advised by Fort Washington Investment Advisors, Inc.
Investment Philosophy
The Fund seeks to invest in companies of all capitalizations that are trading below what is believed to be the estimate of their intrinsic value and have a sustainable competitive advantage or a high barrier to entry in place. The barrier(s) to entry can be created through a cost advantage, economies of scale, high customer loyalty or a government barrier (e.g. license or subsidy). Fort Washington believes that the strongest barrier to entry is the combination of economies of scale and high customer loyalty.
Fund Performance
The Touchstone Focused Fund (Class A Shares) underperformed its benchmark, the Russell 3000® Index, for the 12-month period ended March 31, 2017. The Fund’s total return was 14.45 percent (calculated excluding the maximum sales charge) while total return of the benchmark was 18.07 percent.
Market Environment
The bull market in U.S. equities that began in 2009 ended the first quarter of 2017 at all-time highs. Investors shrugged off the sting of a positive vote in the U.K. to exit the European Union last June and enjoyed accommodative monetary policies by developed central banks throughout 2016. The market continued to gain momentum at the end of 2016 as investors cheered president-elect Donald Trump’s pro-growth agenda. The top performing sectors within the Russell 3000® Index for the 12-month period were Financials, Information Technology and Materials, while the worst performing sectors during the period were Real Estate, Consumer Staples and Telecommunication Services.
Portfolio Review
The Fund’s top contributing sectors relative to the benchmark were Consumer Discretionary, Consumer Staples, and Telecommunication Services. Sectors which detracted from the Fund’s relative performance were Industrials, Energy, and Financials. Investments made in international companies as well as domestic businesses underperformed the benchmark.
LinkedIn Corp. (Information Technology sector), Amazon.com Inc. (Consumer Discretionary sector) and Bio-Rad Laboratories Inc. (Health Care sector) were among the top Fund contributors during the past twelve months. LinkedIn was acquired by Microsoft Corp. (Information Technology sector) at a significant premium. Amazon.com continued its positive momentum as business fundamentals continued to improve for its core operations. In the past twelve months, Bio-Rad benefited from a stabilization of macro headwinds as well as improving investor confidence as the path to excess economic returns became more transparent.
Companies that detracted from Fund performance included Vista Outdoor Inc. (Industrials sector), World Fuel Services Corp. (Energy sector) and Owens & Minor (Health Care sector). Vista disappointed investors as it announced continued weakness in its core business and a sizable write off of previous acquisitions. World Fuel declined in value after reporting a weak fourth quarter and lowered forward guidance based on weakness in its marine transportation segment. Owens & Minor underperformed when it announced it would be losing a sizable customer to its main competitor.
During the past twelve months, the Fund increased its exposure to the Real Estate, Consumer Discretionary, and Industrials sectors. The Fund’s cash position decreased from a year ago to the end of the period.
From a market cap perspective, the Fund maintained an underweight to smaller-cap companies with a market cap below $2 billion. The benchmark weight for this segment is 4.6 percent compared to 1 percent for the
Management's Discussion of Fund Performance (Unaudited) (Continued)
Fund. The Fund remained underweight to mid-cap businesses which comprised 9.3 percent of assets, compared to a benchmark weight of 14.8 percent. Lastly, the Fund continued to maintain an overweight to larger-cap businesses with a market cap above $10 billion. The weight in that segment is currently 85.2 percent which is higher than the benchmark weight of 80.6 percent. This allocation decision had a positive impact on performance during the past year due to the underperformance of small-cap stocks.
Over the past twelve months, we believe the quality of the overall Fund portfolio remained high. We continued to focus on buying what we believe are high quality businesses with stable returns on capital, solid balance sheets and sustainable barriers to entry.
Outlook
Businesses and consumers are currently optimistic about the U.S. economy’s prospects, but so-called soft data, such as sentiment, has not yet translated into accelerated growth as reflected in hard, quantifiable data. With solid jobs growth and core inflation near 2 percent, the U.S. Federal Reserve Board (Fed) is likely to continue gradually raising interest rates. Looking ahead, we believe the markets will be fixated on pending tax legislation for businesses and households. Although House Republican leaders favor tax reform that is deficit neutral, President Trump campaigned on implementing a big tax cut for the middle class. It is too early to gauge the outcome, but we believe tax cuts are normally easier to pass than cuts in deductions. Amid this uncertainty, we expect market volatility to increase from unusually low levels. We will continue to add what we believe are high quality businesses to the Fund’s portfolio.
Management's Discussion of Fund Performance (Unaudited) (Continued)
Comparison of the Change in Value of a $10,000 Investment in the Touchstone Focused Fund - Class A*, the Russell 3000® Index and the S&P 500® Index
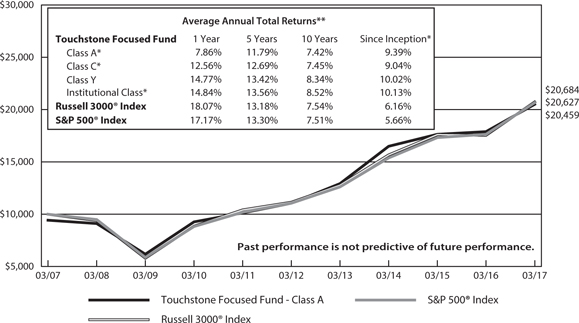
| * | The chart above represents performance of Class A shares only, which will vary from the performance of Class C shares, Class Y shares and Institutional Class shares based on the differences in sales loads and fees paid by shareholders in the different classes. The inception date of Class A shares, Class C shares, Class Y shares and Institutional Class shares was September 30, 2003, April 12, 2012, February 12, 1999 and December 20, 2006, respectively. Class A shares, Class C shares and Institutional Class shares performance information was calculated using the historical performance of Class Y shares for the periods prior to September 30, 2003, April 12, 2012 and December 20, 2006, respectively. The returns have been restated for sales loads and fees applicable to Class A, Class C and Institutional Class shares. The returns of the indexes listed above are based on the inception date of the Fund. |
| ** | The average annual total returns shown above are adjusted for maximum sales loads and fees, if applicable. The maximum offering price per share of Class A shares is equal to the net asset value (“NAV”) per share plus a sales load equal to 6.10% of the NAV (or 5.75% of the offering price). Class C shares are subject to a contingent deferred sales charge (“CDSC”) of 1.00%. The CDSC will be assessed on an amount equal to the lesser of (1) the NAV at the time of purchase of the shares being redeemed or (2) the NAV of such shares being redeemed, if redeemed within a one-year period from the date of purchase. Class Y shares and Institutional Class shares are not subject to sales charges. |
The performance of the above Fund does not reflect the deduction of taxes that a shareholder would pay on Fund distributions or the redemption of Fund shares.
Notes to Chart
Russell 3000® Index measures the performance of the 3,000 largest U.S. companies based on total market capitalization, which represents approximately 98% of the investable U.S. equity market.
S&P 500® Index is a group of 500 widely held stocks and is commonly regarded to be representative of the large capitalization stock universe.
The Frank Russell Company (FRC) is the source and owner of the Russell 3000® Index data contained or reflected in this material and all trademarks and copyrights related thereto. The material may contain confidential information and unauthorized use, disclosure, copying, dissemination or redistribution is strictly prohibited. This is a Touchstone Investments presentation of the data, and FRC is not responsible for the formatting or configuration of this material or for any inaccuracy in the presentation thereof.
Management's Discussion of Fund Performance (Unaudited)
Touchstone Growth Opportunities Fund
Sub-Advised by Westfield Capital Management, L.P.
Investment Philosophy
The Touchstone Growth Opportunities Fund seeks long-term growth of capital by primarily investing in stocks of U.S. companies with large, medium and small market capitalizations. The Fund’s portfolio managers place focus on companies they believe to have demonstrated records of achievement with excellent prospects for earnings growth over a 1 to 3 year period. Westfield looks for companies that it believes are reasonably priced with high forecasted earnings potential.
Fund Performance
The Touchstone Growth Opportunities Fund (Class A Shares) underperformed its benchmark, the Russell 3000® Growth Index, for the 12-month period ended March 31, 2017. The Fund’s total return was 14.38 percent (calculated excluding the maximum sales charge), while the total return of the benchmark was 16.27 percent.
Market Environment
Domestic stocks generated solid returns during the 12-month period ended March 31, 2017, posting gains across all market sectors and capitalizations. Oil prices rose, consumer confidence hit a new five-year high, and unemployment claims continued to drop. In a step toward normalization of financial conditions after a prolonged period of zero-rate interest rates, the U.S. Federal Reserve Board raised short-term rates by 25 basis points twice and signaled a quicker pace of rate increases over the next two years. The past twelve months, however, have highlighted yet again a powerful dichotomy between two forces competing for equity market leadership: growth and safety. During periods of market duress, investors have sought refuge in the most defensive, bond-like segments, such as Utilities, Real Estate Investment Trusts (REITs), and Telecommunication Services sectors. Snapback rallies off the interim lows have been driven by economically-sensitive stocks.
U.S. equities surged following the Presidential election, lifting most stock indices to record highs. The rally began with a rotation into those stocks most exposed to domestic cyclical growth, with lower Price/Earnings, smaller capitalization companies leading the charge. Domestic stocks extended post-election gains into calendar year 2017, propelling most equity indices into new record territories. Their advance came against a stable economic backdrop in the U.S. and signs of improvements in the eurozone. The U.S. unemployment rate suggests that the domestic labor market remains in good shape, and business survey data has been strong, suggesting the potential for increased capital spending ahead. Despite mostly positive economic data and stronger consumer and business confidence, investors remain skeptical of the rally, as billions of dollars continue to pour into bond funds. The market’s advance tapered off by early spring, with cyclical and financial stocks pulling back as the “Trump trade” faded. The first quarter of 2017 witnessed a notable rotation into high-quality, large market capitalization, growth-oriented companies, primarily within the Information Technology and Health Care sectors.
Portfolio Review
Notable relative weakness within the Information Technology sector offset more modest relative strength in the Health Care and Consumer Discretionary sectors.
During the period, the Fund’s relative performance was weakest in the Information Technology sector. Palo Alto Networks, Inc., a provider of network security solutions, was the sector’s largest source of underperformance. Security fundamentals softened over the course of the period after several years of outsized growth. We recently exited the position following the company’s most recent quarterly results, which were weaker-than-expected.
Management's Discussion of Fund Performance (Unaudited) (Continued)
Palo Alto highlighted poor sales execution and lower pipeline conversion rates as reasons for the weakness. The soft results were at odds with both the positive channel feedback we had received and the better results exhibited from other security vendors. Also negatively impacting the sector’s relative performance was the Fund’s position in a manufacturer of computerized bar-code laser printers, Zebra Technologies Corp. We sold the stock after weaker than expected quarterly results indicated a disconnect between our investment case and the operational performance of the business. We had initially invested in the stock given our belief that industry consolidation would produce a stable competitive and pricing environment. Moreover, we anticipated that as retailers pushed into multiple sales channels, having the technology necessary to optimize inventory and logistics operations would become more important, requiring investment in data capture devices and specialty printers. However, a tighter spending environment in the enterprise mobility segment restrained the company’s earnings and revenue growth, leading Zebra to miss earnings expectations for the quarter and restate its full year 2016 earnings guidance. As a result, we exited the position.
The Health Care sector was the Fund’s top relative performing sector during the period and helped to offset a portion of the Fund’s weakness in the Information Technology sector. ARIAD Pharmaceuticals, Inc., an oncology-focused company with two commercial products and a drug candidate in clinical development, was the top relative performer in the sector. In early January, the company announced its agreement to be acquired by Takeda Pharmaceuticals for $24/share, approximately a 75 percent premium to the closing price on the prior day. Following the news, we sold the Fund’s position in the stock. Nektar Therapeutics, a clinical-stage biopharmaceutical company, was also a strong relative performer during the period. The stock price advanced sharply in March after the company’s drug NKTR-181—a “no-high” opioid that provides pain relief without a feeling of euphoria—met its primary and secondary endpoints on a phase 3 study of chronic pain. However, our main reason for investing in the company is its key product—NKTR-214—which is a cell-signaling protein that plays a central role in the immune system’s delicate balance of tolerance immunity. We believe that the upside for NKTR-214 could be significant and the drug could prove to be the backbone of immuno-oncology drugs. Mettler-Toledo International, Inc., a manufacturer of precision instruments for use in laboratory, industrial and food retailing applications, was also a top relative performer in the sector. The stock price responded positively to strong quarterly results posted in early February. We consider the company’s outlook for growth to be as strong as it has ever been, and view Mettler-Toledo as one of the best-managed businesses in the industry. The company is repurchasing a material percentage of its shares outstanding per year, resulting in a share count reduction of 40 percent over the last decade. We believe continued share buybacks along with margin improvement should drive strong earnings per share growth going forward.
Positioning in the Consumer Discretionary sector also provided relative outperformance versus the benchmark. Insulation installer Installed Building Products, Inc. was the sector’s top relative outperformer. The company posted strong quarterly results in late February, with best-in-class organic sales growth. We believe Installed Building Products continues to be a well-run company and is poised to benefit from the rebound in single–family housing starts and housing completions in the U.S. In addition, we believe the company’s acquisition activity should help drive further sales growth. Also positively impacting the sector’s relative gains was the Fund’s position in Charter Communications, Inc., a provider of broadband communications services. Charter is the fastest-growing pay-TV provider in the U.S. It has recently shown strong financial results and subscriber growth ahead of consensus expectations, as it transitions acquired Time Warner Cable markets to its pricing and promotional strategy. Overall, we continue to like Charter as a business that, in our opinion, has strong momentum and a modest risk profile.
Outlook
We are encouraged by the strength and resilience of the domestic economy and are optimistic about a nascent recovery overseas. Our expectation is that earnings growth will pick up this year, which, in combination with a moderate and well-telegraphed monetary policy, should drive equity markets higher. The financial markets
Management's Discussion of Fund Performance (Unaudited) (Continued)
have been remarkably placid for some time now, with measures of volatility remaining low. Additionally, average sector correlations in the S&P 500® Index have continued their decline and now sit at the lowest levels seen since the financial crisis of 2008. We believe lower asset correlations combined with lower market volatility should provide a favorable backdrop for active managers like Westfield, who rely on fundamental analysis and valuation discipline in their investment approach. We believe that our focus on identifying high growth companies that trade at attractive valuations should be rewarded in the current market environment.
Management's Discussion of Fund Performance (Unaudited) (Continued)
Comparison of the Change in Value of a $10,000 Investment in the
Touchstone Growth Opportunities Fund - Class A* and the Russell 3000® Growth Index
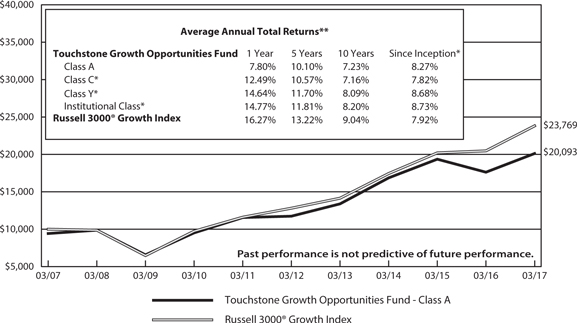
| * | The chart above represents performance of Class A shares only, which will vary from the performance of Class C shares, Class Y shares and Institutional Class shares based on the differences in sales loads and fees paid by shareholders in the different classes. The inception date of Class A shares, Class C shares, Class Y shares and Institutional Class shares was September 29, 1995, August 2, 1999, February 2, 2009 and February 2, 2009, respectively. Class C shares, Class Y shares and Institutional Class shares performance information was calculated using the historical performance of Class A shares for periods prior to August 2, 1999, February 2, 2009 and February 2, 2009, respectively. The returns have been restated for sales loads and fees applicable to Class C, Class Y and Institutional Class shares. The returns of the index listed above are based on the inception date of the Fund. |
| ** | The average annual total returns shown above are adjusted for maximum sales loads and fees, if applicable. The maximum offering price per share of Class A shares is equal to the net asset value (“NAV”) per share plus a sales load equal to 6.10% of the NAV (or 5.75% of the offering price). Class C shares are subject to a contingent deferred sales charge (“CDSC”) of 1.00%. The CDSC will be assessed on an amount equal to the lesser of (1) the NAV at the time of purchase of the shares being redeemed or (2) the NAV of such shares being redeemed, if redeemed within a one-year period from the date of purchase. Class Y shares and Institutional Class shares are not subject to sales charges. |
The performance of the above Fund does not reflect the deduction of taxes that a shareholder would pay on Fund distributions or the redemption of Fund shares.
Notes to Chart
Russell 3000® Growth Index measures the performance of those Russell 3000® companies with higher price-to-book ratios and higher forecasted growth values.
The Frank Russell Company (FRC) is the source and owner of the Index data contained or reflected in this material and all trademarks and copyrights related thereto. The material may contain confidential information and unauthorized use, disclosure, copying, dissemination or redistribution is strictly prohibited. This is a Touchstone Investments presentation of the data, and FRC is not responsible for the formatting or configuration of this material or for any inaccuracy in the presentation thereof.
Management's Discussion of Fund Performance (Unaudited)
Touchstone International Growth Fund
Sub-Advised by Apex Capital Management1
Investment Philosophy
The Touchstone International Growth Fund seeks to achieve long-term capital growth by investing primarily in issuers located in developed markets utilizing an approach that combines “top-down” secular- and macro-economic trend analysis with “bottom-up” security selection. The “top-down” view seeks to provide a framework for “bottom-up” research by identifying sectors, industries and companies that may benefit from the sustainability of the observed trends. Fundamental “bottom-up” research is applied to identify individual companies that exhibit earnings growth potential and may benefit from the sustainability of observed secular- and macro-economic trends. The Fund typically invests in companies that are recognized as “established growth” companies which generally provide more stability and consistency in volatile markets as its core investments. It also invests in companies that are in the earlier stages of their growth cycle that are known as “emerging growth” companies which typically exhibit more aggressive growth characteristics and may experience a significant positive transformation or a favorable catalyst impacting their long-term earnings potential.
Fund Performance
The Touchstone International Growth Fund (Class A Shares) underperformed its benchmark, the MSCI All Country World ex-U.S. Index, for the 12-month period ended March 31, 2017. The Fund’s total return was 8.26 percent (calculated excluding the maximum sales charge), while the total return of the benchmark was 13.13 percent.
Market Environment
During the 12-month period ended March 31, 2017, U.S. equity markets outpaced their international counterparts; however, equities around the globe provided positive absolute returns, reflecting a rise in economic optimism. After trailing U.S. markets for the first nine months of the fiscal year, international stocks gained ground in the most recent quarter. Similarly, it was a period of shifting market leadership from a stylistic perspective. Growth stocks outperformed value stocks at the start and end of the 12-month period, but lower valuation securities outperformed during the middle of the period, driven in large part by returns following the U.S. Presidential election in November.
Portfolio Review
The Fund typically has a bias toward growth stocks. This proved to be a headwind during the period when international value stocks outperformed international growth stocks. From a sector perspective, the largest driver of Fund performance relative to its benchmark was positioning within the Health Care sector. Policy uncertainty stemming from campaign rhetoric in the U.S. caused significant volatility among Health Care stocks. For example, drug price turmoil in the diabetes space hurt the price of Novo Nordisk A/S and detracted from the Fund’s relative performance. Ono Pharmaceutical Co. Ltd. also declined meaningfully. Though its primary drug (Opdivo) was approved as hoped, some tests showed more efficacy from a competing Merck & Co. Inc. drug that also targets cancers. Given the deterioration in Ono Pharmaceuticals earnings outlook, the Fund exited the position.
Offsetting some of the weakness in the Health Care sector, the Fund benefited from strong performance by Sony Corp. (Information Technology sector), the Japanese consumer electronics conglomerate. The stock rose amid a resurgence in Japanese equities. Fund holding Broadcom Ltd. also experienced an increase in price after the announcement that it was being purchased by Avago Technologies Ltd. in one of the largest-ever deals in the Information Technology space.
Management's Discussion of Fund Performance (Unaudited) (Continued)
Outlook
Following the U.S. Presidential election, we were concerned about the potential that protectionist rhetoric would actually materialize in the form of trade wars, as we believe such an outcome would have a profound impact on the global economy. However, early signs from the new administration have reduced our concerns in this regard. Meanwhile, global growth continues and economic optimism appears to be on the rise around the world. Accordingly, we have increased Fund exposure to Industrials, a more economically sensitive sector. From a geographic perspective, the Fund has been notably underexposed to Emerging Markets for several quarters. While this has benefitted returns, we recently reduced that underweight by purchasing high quality stocks across the Emerging Market landscape. Again, this is a reflection of the improving outlook for global economic growth. We are optimistic that the more cyclical tilt in the Fund’s portfolio should benefit the Fund as the global economy continues to expand.
1 On June 1, 2016, Apex Capital Management (APEX) became part of Fiera Capital Inc., the U.S. division of Fiera Capital Corporation. Apex is a trade-name being used by Fiera Capital Inc. (the sub-advisor), a SEC-registered investment advisor.
Management's Discussion of Fund Performance (Unaudited) (Continued)
Comparison of the Change in Value of a $10,000 Investment in the Touchstone International Growth Fund - Class A* and the MSCI All Country World Ex-U.S. Index
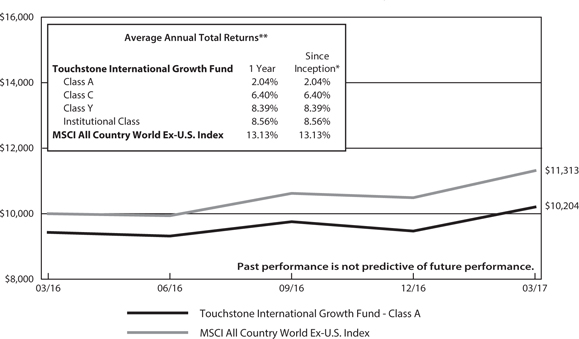
| * | The chart above represents performance of Class A shares only, which will vary from the performance of Class C shares, Class Y shares and Institutional Class shares based on the differences in sales loads and fees paid by shareholders in the different classes. The inception date of Fund is March 31, 2016. The returns of the index listed above are based on the inception date of the Fund. |
| ** | The average annual total returns shown above are adjusted for maximum sales loads and fees, if applicable. The maximum offering price per share of Class A shares is equal to the net asset value (“NAV”) per share plus a sales load equal to 6.10% of the NAV (or 5.75% of the offering price). Class C shares are subject to a contingent deferred sales charge (“CDSC”) of 1.00%. The CDSC will be assessed on an amount equal to the lesser of (1) the NAV at the time of purchase of the shares being redeemed or (2) the NAV of such shares being redeemed, if redeemed within a one-year period from the date of purchase. Class Y shares and Institutional Class shares are not subject to sales charges. |
The performance of the above Fund does not reflect the deduction of taxes that a shareholder would pay on Fund distributions or the redemption of Fund shares.
Notes to Chart
MSCI All Country World Ex-U.S. Index measures the equity market performance of the non U.S. developed and emerging markets.
MSCI makes no express or implied warranties or representations and shall have no liability whatsoever with respect to any MSCI data contained herein. The MSCI data may not be further redistributed or used to create indices or financial products. This report is not approved or produced by MSCI.
Management's Discussion of Fund Performance (Unaudited)
Touchstone International Value Fund
Sub-Advised by Barrow, Hanley, Mewhinney & Strauss, LLC
Investment Philosophy
The Touchstone International Value Fund seeks long-term capital growth by primarily investing in equity securities of non-U.S. companies believed to be undervalued and seeks companies that have price-to-earnings and price-to-book ratios below the market, enterprise-value/free-cash-flow ratios at or below the market and dividend yields above the market.
Fund Performance
The Touchstone International Value Fund (Class A Shares) underperformed both its benchmarks, the MSCI EAFE Value Index and the MSCI EAFE Index, for the 12-month period ended March 31, 2017. The Fund’s total return was 10.80 percent (calculated excluding the maximum sales charge), while the total return of the MSCI EAFE Value Index was 15.98 percent and the total return of the MSCI EAFE Index was 11.67 percent. The MSCI EAFE Value Index was added as the Fund’s primary benchmark to better reflect the investment strategy currently used in the management of the Fund’s portfolio. The MSCI EAFE Value Index represents large and mid cap securities that exhibit overall value style characteristics across international developed market countries. These value style characteristics include lower price/book ratio, lower price/earnings ratio, and higher dividend yield. The MSCI EAFE Index will be maintained as the Fund’s secondary benchmark which will allow for performance comparisons against the non-US equity “market” as a whole, regardless of style.
Market Environment
During the 12-month period ended March 31, 2017, markets experienced robust returns across the majority of geographic regions. Emerging Market stocks led the way as investors’ concerns about increased interest rates in the U.S., a rising U.S. dollar and trade barriers proved unfounded. Global growth indicators such as Purchasing Managers’ Indexes (PMIs) continued to advance during the period, picking up momentum in the latter half of 2016 and continuing into 2017. Markets were also buoyed by expectations for fewer business regulations, stimulative infrastructure spending and tax cuts following the U.S. presidential election. If enacted, we believe these measures would not only boost the U.S. economy, but potentially benefit the global economy as well.
With economic fundamentals improving and market fears abating, value stocks meaningfully outperformed the broader markets during the period. The rally in value stocks was more concentrated in deeper value stocks such as metals and mining and the beleaguered Financials sector stocks. Conversely, sectors such as Consumer Staples, Telecommunication Services and Utilities – defensive areas that were bid up over the last several years as investors sought safety in an uncertain market environment – were shunned and meaningfully lagged the broader market.
Portfolio Review
For the period, the Fund’s stock selection within the Industrials and Consumer Discretionary sectors contributed the most to performance, while positioning in the Health Care and Materials sectors detracted. The Fund’s lower exposure to bond proxy sectors such as Telecommunication Services, Utilities and REITs (Real Estate sector) were key contributors to Fund performance as the market avoided these stocks in favor of deeper cyclicals.
Among the individual stocks that contributed to performance were Fuji Electric Co. Ltd., IHI Corp. (both from the Industrials sector) and Fiat Chrysler Automobiles NV (Consumer Discretionary sector). Fuji Electric, a Japan-based electrical equipment company, benefited from an improving global economy, a weak yen and improvement in China’s economy, an important end market for the company. IHI Corp. is a Japan-based
Management's Discussion of Fund Performance (Unaudited) (Continued)
heavy equipment manufacturer, which stabilized its business during the period after several missteps in its social infrastructure business. This allowed for positive economic improvements in the company’s auto and aerospace divisions, which benefited operating results and ultimately the stock’s price. Fiat Chrysler, a U.K.-based and Italian-controlled automobile manufacturer, posted strong performance resulting from improved operating profits as the company was able to reduce costs and improve margins.
Among the individual stocks that detracted from Fund performance were Teva Pharmaceutical Industries Ltd. (Health Care sector), Dairy Crest Group PLC, Imperial Brands PLC (both from the Consumer Staples sector) and DS Smith PLC (Materials sector). A multinational pharmaceutical company headquartered in Israel, Teva Pharmaceutical Industries declined along with other health care stocks, but was further impacted by untimely changes in corporate management. Further, its key drug COPAXONE® was under pressure from outside competition. We believe these issues are transitory in nature and believe the valuation is sufficiently compelling to warrant continued ownership. The Fund’s holdings in Dairy Crest (a U.K.-based consumer foods business), DS Smith (a U.K.-based packaging company) and Imperial Brands (a U.K.-based cigarette and tobacco manufacturer) were negatively impacted by the U.K.’s decision to exit the European Union (Brexit) and the resulting decline in the British pound. Dairy Crest and Imperial brands were also affected by the market’s shift away from defensive stocks. However, all three of these companies continue to exhibit improved operating fundamentals. We believe the selloff in these stocks was unwarranted and therefore the Fund continued to hold them at the end of the period.
The Fund was also negatively impacted by the stocks it did not own during the year. The metals and mining industry moved significantly higher over the year and represented a meaningful percent of the benchmark. Many of these companies did not meet the Fund’s investment criteria due to weak balance sheets and operating fundamentals that do not show signs of improvement. Additionally, banks based in France and the U.K rallied strongly after the Brexit vote but similarly lacked improved operating fundamentals.
Outlook
Valuations rose sharply during the last eight years and are now well above average. Considering that earnings growth has been flat or negative for several years, the market’s continued move upward was driven by valuation expansion and, more recently, by the expectation of new business-friendly policies from the Trump administration. We believe the selloff in late March was a sign that stocks had moved far ahead of the actual implementation of the potential policies. We believe that if markets cannot rely on new policy and tax initiatives or continued easy money policies as incentives to drive valuations higher, investors must once again look at earnings and fundamentals of underlying companies.
With the exception of the poorly performing Energy sector, operating margins remained at historical highs supported by low wage growth and low interest costs. Recent wage growth, however, has trended upward and, as interest rates increase, interest expense will also move higher thus creating downward earnings and margin pressure. Markets appear to be priced for robust earnings growth with the expectation that margins will remain high and pro-growth policies will be enacted. If markets stumble, as they did toward the end of the 12-month period, we believe the defensive characteristics of the Fund’s value-oriented investment process should benefit.
In light of these risks, and after an eight-year bull market driven not by fundamentals but by waves of easy money and a rising tide benefitting the most popular stocks, we believe that active stock selection is more important than ever. Although we recognize that markets will continue to provide positive returns over the longer term, we expect that markets may stumble in the near term. Accordingly, we believe that the Fund’s
Management's Discussion of Fund Performance (Unaudited) (Continued)
portfolio of stocks that are cheaper than the market with stable-to-improving operating fundamentals will provide protection through a tumultuous period. Further, dividends are a critical component of long-term overall returns, and are especially important if market returns are moderate or turn negative. We believe our philosophy of buying the stocks of companies paying dividends and committed to growing those dividends should provide for further protection of capital in tumultuous market environments.
Dividend-paying investments may not experience the same price appreciation as non-dividend paying instruments, dividend-issuing companies may choose not to pay a dividend, or the dividend may be less than what is anticipated
Management's Discussion of Fund Performance (Unaudited) (Continued)
Comparison of the Change in Value of a $10,000 Investment in the Touchstone International Value Fund - Class A*, the MSCI EAFE Value Index and the MSCI EAFE Index

| * | The chart above represents performance of Class A shares only, which will vary from the performance of Class C shares, Class Y shares and Institutional Class shares based on the differences in sales loads and fees paid by shareholders in the different classes. The inception date of Class A shares, Class C shares, Class Y shares and Institutional Class shares was August 18, 1994, April 25, 1996, October 9, 1998 and September 10, 2012, respectively. Class C shares, Class Y shares and Institutional Class shares performance information was calculated using the historical performance of Class A shares for periods prior to April 25, 1996, October 9, 1998 and September 10, 2012, respectively. The returns have been restated for sales loads and fees applicable to Class C, Class Y, and Institutional Class shares. The returns of the indexes listed above are based on the inception date of the Fund. |
| | | |
| ** | The average annual total returns shown above are adjusted for maximum sales loads and fees, if applicable. The maximum offering price per share of Class A shares is equal to the net asset value (“NAV”) per share plus a sales load equal to 6.10% of the NAV (or 5.75% of the offering price). Class C shares are subject to a contingent deferred sales charge (“CDSC”) of 1.00%. The CDSC will be assessed on an amount equal to the lesser of (1) the NAV at the time of purchase of the shares being redeemed or (2) the NAV of such shares being redeemed, if redeemed within a one-year period from the date of purchase. Class Y shares and Institutional Class shares are not subject to sales charges. |
The performance of the above Fund does not reflect the deduction of taxes that a shareholder would pay on Fund distributions or the redemption of Fund shares.
Notes to Chart
MSCI EAFE Value Index captures large- and mid-cap securities exhibiting overall value style characteristics across developed markets countries around the world, excluding the U.S. and Canada.
MSCI EAFE Index is a free float-adjusted market capitalization index that is designed to measure developed market equity performance excluding the U.S. and Canada.
MSCI makes no express or implied warranties or representations and shall have no liability whatsoever with respect to any MSCI data contained herein. The MSCI data may not be further redistributed or used to create indices or financial products. This report is not approved or produced by MSCI.
Management's Discussion of Fund Performance (Unaudited)
Touchstone Mid Cap Growth Fund
Sub-Advised by Westfield Capital Management, L.P.
Investment Philosophy
The Touchstone Mid Cap Growth Fund seeks to increase the value of Fund shares by primarily investing in stocks of mid-cap U.S. companies. The Fund’s portfolio managers place focus on companies that they believe to have a demonstrated record of achievement with excellent prospects for earnings growth over a 1-to-3-year period. Westfield looks for companies that it believes are reasonably priced with high forecasted earnings potential.
Fund Performance
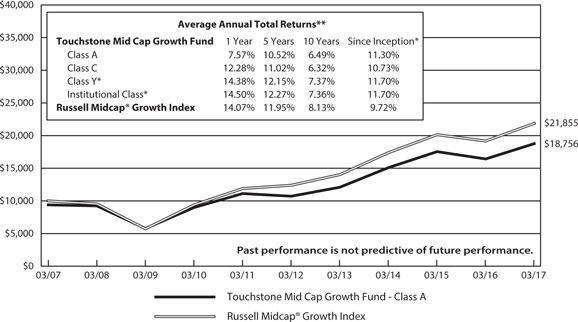
The Touchstone Mid Cap Growth Fund (Class A Shares) outperformed its benchmark, the Russell Midcap® Growth Index, for the 12-month period ended March 31, 2017. The Fund’s total return was 14.13 percent (calculated excluding the maximum sales charge), while the total return of the benchmark was 14.07 percent.
Market Environment
Domestic stocks generated solid returns during the 12-month period ended March 31, 2017, posting gains across all market sectors and capitalizations. Oil prices rose, consumer confidence hit a new five-year high, and unemployment claims continued to drop. In a step toward normalization of financial conditions after a prolonged period of zero-rate interest rates, the U.S. Federal Reserve Board raised short-term rates by 25 bps twice and signaled a quicker pace of rate increases over the next two years. The past twelve months, however, have highlighted yet again a powerful dichotomy between two forces competing for equity market leadership: growth and safety. During periods of market duress, investors have sought refuge in the most defensive, bond-like segments, such as Utilities, Real Estate Investment Trusts (REITs), and Telecommunication Services sectors. Snapback rallies off the interim lows have been driven by economically-sensitive stocks.
U.S. equities surged following the Presidential election, lifting most stock indices to record highs. The rally began with a rotation into those stocks most exposed to domestic cyclical growth, with lower Price/Earnings, smaller capitalization companies leading the charge. Domestic stocks extended post-election gains into calendar year 2017, propelling most equity indices into new record territories. Their advance came against a stable economic backdrop in the U.S. and signs of improvements in the eurozone. The U.S. unemployment rate suggests that the domestic labor market remains in good shape, and business survey data has been strong, suggesting the potential for increased capital spending ahead. Despite mostly positive economic data and stronger consumer and business confidence, investors remain skeptical of the rally, as billions of dollars continue to pour into bond funds. The market’s advance tapered off by early spring, with cyclical and financial stocks pulling back as the “Trump trade” faded. The first quarter of 2017 witnessed a notable rotation into high-quality, large market capitalization, growth-oriented companies, primarily within the Information Technology and Health Care sectors.
Portfolio Review
The Fund’s relative outperformance was fairly broad-based, with seven sectors contributing to positive results. The Consumer Discretionary and Health Care sectors were the Fund’s greatest sources of relative strength, offsetting the relative performance shortfall within the Information Technology and Financials sectors.
The Fund maintained its underweight to the Consumer Discretionary sector, with investments concentrated primarily within less economically-sensitive areas, such as media, leisure, and restaurants. We are incrementally more constructive on the media industry, which has witnessed several important developments over the past few months. Cable broadband providers have merged and telecommunication companies have been acquiring
Management's Discussion of Fund Performance (Unaudited) (Continued)
video distribution and content assets. We think this trend could accelerate, and there are a number of business combinations that we believe would make strategic sense in the converging industry. Liberty Broadband Corp., an owner of communication companies, was the Fund’s top relative performer in the sector. Liberty Broadband was spun out of Liberty Media Corp. two years ago as a vehicle to implement a strategy to roll up cable assets in a tax-efficient manner. Worldwide operator and franchisor of hotels Marriott International, Inc. also contributed to relative performance within the sector. Lodging stocks reacted positively following the November election, with enthusiasm building for acceleration in corporate profit growth as a driver for lodging demand. We think Marriott stands out among its industry peers due to its asset light business model, characterized by high margins, low capital requirements, and consistent returns on invested capital. The company’s Starwood Hotels & Resorts Worldwide, LLC integration remains on track which we believe should deliver significant earnings upside through a combination of unit growth and the potential for increased credit card profits over time.
Investments in the Health Care sector contributed to relative returns, benefiting from positive stock selection across multiple sub-industries. Developer of innovative anti-cancer agents, Clovis Oncology, Inc., was the Fund’s top relative performer during the period as it advanced on improving sentiment for its therapies. The company develops PARP inhibitor therapies for subsets of cancers that do not respond to existing commercial drugs. Clovis had an important Phase III data announcement regarding ovarian cancer this year, owns global rights to its product candidates, and is fully financed. While we still have conviction in the thesis, given the recent price appreciation and risk profile, we trimmed the Fund’s position twice during the period. Veeva Systems Inc., a health care technology company focused on the life science niche, was also a top relative performer in the sector. Veeva’s products are core to the operations of life sciences companies. In addition to performing regular customer relationship management (CRM) functions, the company provides audit trails that ensure field representatives are not marketing drugs for off-label purposes. Following a strong advance, the stock was sold in June as it reached our price target.
The Information Technology sector was the Fund’s greatest source of relative underperformance. A combination of stock specific weakness and a limited exposure to some of the benchmark’s high momentum/high valuation stocks led to the relative performance shortfall. Imperva, Inc., a provider of data security and web application firewall (WAF) software, delivered disappointing results. The company exceeded consensus expectations for earnings in the first quarter of 2016, but missed on license revenues, leading to a sell-off in the stock. While we believe the price weakness could be partially attributed to results falling short of lofty investor expectations, it also highlighted operational and competitive challenges in the company’s core WAF business. We viewed the deceleration in top-line growth as a red flag and sold the Fund’s position. Another relative underperformer that was sold from the Fund was Zebra Technologies Corp., a manufacturer of enterprise mobile computers and specialty printers for barcode labeling. We sold the stock after weaker than expected quarterly results indicated a disconnect between our investment case and the operational performance of the business. We had initially invested in the stock given our belief that industry consolidation would produce a stable competitive and pricing environment. Moreover, we anticipated that as retailers pushed into multiple sales channels, having the technology necessary to optimize inventory and logistics operations would become more important, requiring investment in data capture devices and specialty printers. However, a tighter spending environment in the enterprise mobility segment restrained the company’s earnings and revenue growth, leading Zebra to miss earnings expectations for the quarter and restate its full year 2016 earnings guidance. As a result, we exited the position. Another relative underperformer was NVIDIA Corp., a manufacturer of computer graphics processors and related multimedia software.We believed there was an outsized growth opportunity stemming from the company’s earnings momentum in the gaming and infotainment end markets and bought the stock in the second half of 2016. However, we sold the Fund’s position in December 2016, following a large advance in stock price and based on our channel checks, which indicated that there could be excess inventory in the graphics chip market, so we took advantage of the stock’s advance to lock in gains. The sale proved to be premature, as NVIDIA continued to advance following its exit from the Fund.
Management's Discussion of Fund Performance (Unaudited) (Continued)
The Fund’s holdings within the Financials sector also underperformed, detracting from the Fund’s relative performance. The Financials sector finished the twelve-month period as the benchmark’s third best performer, but most of its impressive gains came in November 2016 on the heels of the U.S. election. Heightened risk aversion in the equity markets in June 2016 following the U.K.’s decision to exit the European Union had a strong negative impact on price action within the sector. Bank United, Inc. traded sharply lower in June 2016, hurting relative performance. This well-capitalized regional bank has a strong footprint in its geographic markets, a robust credit culture, and virtually no exposure to European markets. However, after reviewing the bank’s quarterly operational results, we sold the Fund’s position. We thought the backdrop for banks was extremely challenging, with rock-bottom interest rates constraining lending margins, and Brexit uncertainty keeping investor appetite for banking stocks subdued. At the same time, we could see some potential growth catalysts for the group – a relatively strong domestic economy supported the demand for loans, while credit defaults remained at historically low levels. We think that banks that have a proven ability to grow loans/deposits faster than the market overall could see outsized Earnings per Share (EPS) growth, irrespective of the interest rate environment. In general, we try to maintain a barbell approach to the Financials sector, preferring to invest in idiosyncratic ideas that we believe can perform well regardless of the interest rate environment. We increased the Fund’s exposure to the sector in the past several months and are currently overweight the group versus the benchmark. The Fund’s sector position remains balanced, holding several rate-sensitive stocks while also having exposure to more defensive areas, such as financial exchanges and data analytics.
Outlook
We are encouraged by the strength and resilience of the domestic economy and are optimistic about a nascent recovery overseas. Our expectation is that earnings growth will pick up this year, which, in combination with a moderate and well-telegraphed monetary policy, should drive equity markets higher. The financial markets have been remarkably placid for some time now, with measures of volatility remaining low. Additionally, average sector correlations in the S&P 500 Index have continued their decline and now sit at the lowest levels seen since the financial crisis of 2008. We believe lower asset correlations combined with lower market volatility should provide a favorable backdrop for active managers like Westfield, who rely on fundamental analysis and valuation discipline in their investment approach. We believe that our focus on identifying high growth companies that trade at attractive valuations should be rewarded in the current market environment.
Dividend-paying investments may not experience the same price appreciation as non-dividend paying instruments, dividend-issuing companies may choose not to pay a dividend, or the dividend may be less than what is anticipated.
Management's Discussion of Fund Performance (Unaudited) (Continued)
Comparison of the Change in Value of a $10,000 Investment in the Touchstone Mid Cap Growth Fund - Class A* and the Russell Midcap® Growth Index
| * | The chart above represents performance of Class A shares only, which will vary from the performance of Class C shares, Class Y shares and Institutional Class shares based on the differences in sales loads and fees paid by shareholders in the different classes. The inception date of Class A shares, Class C shares, Class Y shares and Institutional Class shares was October 3, 1994, October 3, 1994, February 2, 2009 and April 1, 2011. Class Y shares and Institutional Class shares performance information was calculated using the historical performance of Class A shares for periods prior to February 2, 2009 and April 1, 2011, respectively. The returns have been restated for fees applicable to Class Y and Institutional Class shares. The returns of the index listed above are based on the inception date of the Fund. |
| ** | The average annual total returns shown above are adjusted for maximum sales loads and fees, if applicable. The maximum offering price per share of Class A shares is equal to the net asset value (“NAV”) per share plus a sales load equal to 6.10% of the NAV (or 5.75% of the offering price). Class C shares are subject to a contingent deferred sales charge (“CDSC”) of 1.00%. The CDSC will be assessed on an amount equal to the lesser of (1) the NAV at the time of purchase of the shares being redeemed or (2) the NAV of such shares being redeemed, if redeemed within a one-year period from the date of purchase. Class Y shares and Institutional Class shares are not subject to sales charges. |
The performance of the above Fund does not reflect the deduction of taxes that a shareholder would pay on Fund distributions or the redemption of Fund shares.
Notes to Chart
Russell Midcap® Growth Index measures the performance of those Russell Midcap® companies with higher price-to-book ratios and higher forecasted growth values.
The Frank Russell Company (FRC) is the source and owner of the Index data contained or reflected in this material and all trademarks and copyrights related thereto. The material may contain confidential information and unauthorized use, disclosure, copying, dissemination or redistribution is strictly prohibited. This is a Touchstone Investments presentation of the data, and FRC is not responsible for the formatting or configuration of this material or for any inaccuracy in the presentation thereof.
Management's Discussion of Fund Performance (Unaudited)
Touchstone Sands Capital Emerging Markets Growth Fund
Sub-Advised by Sands Capital Management, LLC
Investment Philosophy
The Touchstone Sands Capital Emerging Markets Growth Fund seeks long term capital appreciation. The Fund primarily invests in companies located in emerging market countries and opportunistically, in frontier market countries. Sands Capital generally seeks leading growth businesses with sustainable above average earnings growth and with capital appreciation potential. In addition, Sands Capital looks for companies that have a significant competitive advantage, a leadership position or proprietary niche, a clear mission in an understandable business, financial strength and are valued rationally in relation to comparable companies, the market and the business prospects for that particular company.
Fund Performance
The Touchstone Sands Capital Emerging Markets Growth Fund (Class Y Shares) underperformed its benchmark, the MSCI Emerging Markets Index, for the 12-month period ended March 31, 2017. The Fund’s total return was 13.83 percent, while the total return of the benchmark was 17.22 percent.
Market Environment
Oscillation defined the past twelve months in emerging market equities. We believe significant macro events drove share price returns in the second and fourth quarters of 2016, while the third quarter of 2016 and first quarter of 2017 were more sedated and fundamentally steered.
In the second quarter, “Brexit,” or the United Kingdom’s referendum to leave the European Union (EU), ushered in a new wave of uncertainty and trading volatility. We believe the primary investor concern stemmed from speculation about Brexit’s second- and third-order effects on currencies and trade. In the fourth quarter, November 8 saw consequential events on both sides of the globe, with the election of Donald Trump in the U.S. and the announcement of demonetization in India. In the immediate aftermath, we believe investor concerns heightened due to President Trump’s anti-trade campaign rhetoric, as well as the implications for U.S. dollar strength. In India, the surprise announcement of demonetization rendered nearly 90 percent of the country’s currency notes immediately invalid, introducing a headwind to the largely cash-based economy.
While these events drove equity market returns in their respective quarters, investors seemed to take a digestive or “wait and see” approach in the quarters immediately following. If nothing else, the whipsawing nature of share price returns reminded investors of the inherently volatile nature of emerging market equities, and the seeming impossibility of timing the market.
Portfolio Review
During the 12-month period ended March 31, 2017, the top five contributors to relative investment results were MercadoLibre Inc., Alibaba Group Holding Ltd., Housing Development Finance Corp. Ltd., Adani Ports & Special Economic Zone Ltd. and Raia Drogasil SA. Housing Development Finance (HDFC) is a leading Indian mortgage finance company. A first mover with a 30-year history of strong execution, we believe HDFC benefits from the dual secular tailwind of favorable Indian demographics, and a shift away from the state-owned banks that historically controlled a large share of the corporate lending market. Historically, retail mortgage lending was HDFC’s core business; however we have been encouraged by the recent uptick in non-retail/corporate lending. In the most recent quarter, lending in this segment grew at 18 percent year-over-year, accelerating from low-teens growth earlier in the fiscal year. Longer term, we expect this elevated level of growth to persist in HDFC’s non-retail segment, driven by lease rental discounting, developer loans and corporate lending. We
Management's Discussion of Fund Performance (Unaudited) (Continued)
believe the company’s leading market position in an attractive business space, experienced management team and risk management track record should sustain high-teens revenue and earnings growth annually over the next five years.
The top five detractors from relative investment results were Baidu Inc., BIM Birlesik Magazalar AS, Amorepacific Corp., Universal Robina Corp. and Taiwan Semiconductor Manufacturing Co. Ltd. Baidu’s shares came under pressure over the past year, as executive turnover, a medical and scandal and continued investments in its online-to-offline commerce (“O2O”) segment obfuscated otherwise strong results from its core search business. We remain enthused by Baidu’s long-term prospects, which include leadership in mobile search, mobile user engagement and ongoing growth in core search revenues. The company remains a leader in mobile search with over 70 percent share, with 80 percent of all Chinese internet users engaging Baidu’s search on a monthly basis. As monthly user growth has matured, we believe new features like mobile newsfeed and the iQiyi video platform will drive engagement, increasing the amount of daily average users. Management expects a gradual recovery in search revenue during 2017, and we believe prioritization of artificial intelligence will increase targeting, monetization and user experience. We believe Baidu is on its path to recovery and will experience a reacceleration in revenue and earnings growth, ultimately generating earnings growth of more than thirty percent annually over the long term.
During the past 12 months, we purchased the following businesses: Anta Sports Products Ltd., HDFC Bank Ltd., IndusInd Bank Ltd., International Container Terminal Services Inc., MakeMyTrip Ltd., Siloam International Hospitals Tbk PT and Yandex NV.
Anta Sports Products is the leading mass-market sports apparel and footwear company in China, with nearly twice the market share of its next closest domestic brand competitor. The company’s products are primarily sold through wholesale channels to operators of stores located in smaller, less developed Chinese cities. In our view, this market opportunity is distinct from the high-end, top-tier cities that multinational brands tend to target. Following a period of industry overexpansion several years ago, we believe Anta emerged well positioned to continue to take share in these lower-tier cities, due in part to its experienced management team who implemented global best practices in branding, research and development and supply chain management. Overall, we expect the sportswear industry to grow high single-digits, as increasing incomes lead consumers toward more active lifestyles. We believe Anta has several initiatives that should help drive above-average growth, including partnering with provinces to push sports programs, category expansion beyond its core basketball and running franchises and a continued focus on best practices in inventory and financial management.
HFDC Bank is India’s largest private bank, with a customer base of approximately 40 million. Though the company offers both retail and corporate lending, retail is its most visible business, with a distribution network of nearly 5,000 branches. Spanning every Indian geography from major metro cities to rural areas, HDFC Bank’s retail footprint has contributed to its leading position in every major retail lending segment, including auto loans, credit cards and personal loans. Corporate lending accounts for approximately half of HDFC Bank’s loan book and most loans are made to high-quality blue chip and middle-market companies. Outside of lending activities, the bank is a major distributor and provider of other financial products and services, such as insurance, asset management and corporate finance. We believe HDFC Bank’s strong brand, extensive distribution network, business stability and experienced management team will drive continued success over the long term. Growth is further supported by what we believe is a secular shift underway in India; while state-owned banks have historically dominated the corporate lending market, they are becoming increasingly burdened by impaired assets. Over the next five years, we believe HDFC Bank should grow earnings in the high teens, annually.
IndusInd Bank is a leading Indian private bank, with over 1,000 branches and 1,800 ATMs spread across the country. Originally focused on vehicle financing, IndusInd today operates under a “universal” banking model, offering services across several segments of corporate and consumer banking. Despite its universal operating
Management's Discussion of Fund Performance (Unaudited) (Continued)
model, IndusInd seeks opportunities to maximize profits in select business segments where the company believes it has deep and sustainable competitive advantages, namely vehicle finance, gems and jewelry and micro lending. In areas such as mortgages, where IndusInd is less competitive, it has pursued an asset-light distribution model, which we believe adds to the company’s overall operating efficiency. We expect private banks to double their loan market share at the expense of public sector banks over the next decade. Our research indicates that state-owned banks are burdened by impaired assets, which constrains their ability to lend and compete with private banks. Furthermore, public banks generally cater more to corporate lending, which is growing more slowly than loans made to consumers. We believe IndusInd is positioned well to benefit from this shift, given its low loan losses, high capital ratios, experienced management team and innovative banking services.
International Container Terminal Services (ICT) is a global shipping terminal operator with an exclusive focus on containerized cargo. The company operates about 30 terminals in 20 countries across five continents, primarily in emerging and frontier regions. ICT’s strategy is to acquire and operate small to midsize port terminals in markets with what is considered to be superior growth potential. We believe the company should be able to grow organically through gross domestic product-driven (GDP) volume growth, as well as by increasing capacity utilization at its existing facilities. Additionally, ICT has a portfolio of projects under development that should increase its capacity by about 30 percent over the next three to five years. Beyond its current projects, the company has identified more than 400 terminals that fall within its operating sweet spot - too small for larger global competitors, a focus on origin and destination cargo (i.e., less risk of disintermediation or price competition), significant room for operating efficiency gains and attractive risk-adjusted return estimates. In many regions where ICT operates, the rate of containerization is still relatively low compared to the global average. As ICT is a pure container terminal operator, we expect the secular trend from bulk to containerized cargo will provide modest long-term volume growth.
MakeMyTrip is the leading Indian online travel service. Founded in 2000, the company originally only served consumers travelling between the U.S. and India, but has since expanded into domestic booking for flights, packaged tours, hotels, buses, railways and rental cars. Today MakeMyTrip is the leading channel for air and hotel bookings, and we expect a dramatic increase in its share of total travel spending due to a recently announced merger with Goibibo (online travel booking service). Combined, we estimate MakeMyTrip and Goibibo will have more than 50 percent share of Indian travel spending. We view online travel booking as one of the world’s most attractive internet services, and believe India is positioned to be the fastest-growing online travel market over the next decade. India’s travel market is equivalent to only approximately 20 percent of China’s market, and India’s GDP per capita is approaching the sweet spot where we expect travel spending to accelerate. The largest opportunity we see is in hotels, where online penetration is less than 15 percent. Mobile internet usage in India has begun to inflect, and we believe this should bolster hotel bookings, especially because of the last-minute booking habit in India. In our view, MakeMyTrip’s merger with Goibibo has created a leading business, which should greatly benefit from secular changes driving the growth of the Indian online travel market.
Siloam International Hospitals is the largest private hospital operator in Indonesia. With close to 5,000 licensed beds, it has roughly twice the licensed bed capacity of its next closest competitor. Siloam currently operates more than 20 hospitals and we believe the company can increase capacity by about 50 percent over the next three years. In our view, Siloam has a long runway for growth, as Indonesia suffers from an imbalance between hospital supply and demand. Additionally, Siloam should benefit from long-term secular trends in Indonesia, including an aging population, a greater prevalence of lifestyle diseases and a growing middle class. We believe the company’s large scale creates strong competitive advantages through enhanced purchasing power, greater brand presence with doctors and patients, and a more efficient hub-and-spoke model whereby doctors can refer patients among different hospitals. As the majority of its hospitals are relatively new, facilities remain underutilized, presenting a large opportunity for margin expansion as the company’s hospital base matures and costs associated with opening new facilities declines.
Management's Discussion of Fund Performance (Unaudited) (Continued)
Yandex, an abbreviation for “Yet Another iNDEXer,” is the leading online search engine in Russia, with over 50 percent market share. Since its founding in 1997, the company has expanded its business to also include on-demand taxi services, e-commerce and classified ads. While these businesses are exciting opportunities, we expect the core search offering to be the company’s major growth driver over the Fund’s investment horizon. In addition to the secular shift of increased online advertising spending, we believe this business should also benefit from recent government rulings that should improve distribution on smartphones, and an improving macro environment. We believe Yandex’s share in the growing mobile search market will ultimately rise to over 45 percent.
During the period, we sold Bangkok Dusit Medical Services PCL, Bharat Forge Ltd., BIM Birlesik Magazalar AS, Kalbe Farma Tbk PT, LG Household & Health Care Ltd., Shoprite Holdings Ltd. and Shriram Transport Finance Co. Ltd.
Bangkok Dusit Medical Services was sold because we are concerned about its long-term growth potential relative to its valuation. Recent quarterly results revealed a surprising deceleration in the growth of revenues attributed to Thai patients. Though the slowdown could be due to seasonality or other transient factors, we believe that longer-term patient demand may be less than we had originally expected. The potential for slower growth makes Bangkok Dusit a weaker fit with our first criterion, and also results in a lower expected return profile. We reallocated proceeds from this sale to opportunities that are better aligned with the Fund’s investment criteria.
Bharat Forge was sold because we believe a range of issues will challenge its growth prospects over upcoming years. These include excess capacity in the U.S. trucking market stemming from weak retail and industrial activity, slower growth in the Indian commercial vehicle market as a result of the implementation of the Goods and ServicesTax, demonetization, overcapacity in the multi-axle vehicle end-markets and persistent excess equipment supply in the onshore U.S. oil and gas market. We have also become less confident in the timeline of development for Bharat Forge’s new business lines in rail, defense and aerospace, which creates a wider range of outcomes and greater uncertainty in our longer-term estimates. With valuations improving in the Fund’s other India businesses and new opportunities following demonetization, the decision was made to sell Bharat Forge and reallocate to businesses believed to be more strongly aligned with the Fund’s investment criteria.
BIM Birlesik Magazalar was sold due to increased concerns about Turkey’s vulnerable macroeconomic landscape. We believe a deceleration in economic growth, increased currency volatility and geopolitical risks all threaten the sustainability of BIM’s prospects for above-average growth. Furthermore, its competitive environment has grown more unpredictable given the macro-driven pressure on consumers. We view increased competition from aggressive rivals such as A1011 as also contributing to longer-term challenges. At this time, we believe there are other opportunities with better growth potential and with more supportive macro backdrops.
Kalbe Farma was sold due to concerns around valuation and opportunity cost relative to other potential investments. Our research indicates that Kalbe’s valuation was elevated relative to its earnings growth profile, especially considering potential downside risks related to currency and other macroeconomic factors. While we believe Kalbe remains a quality duration-growth business with expected earnings growth in the low teens, its valuation is more consistent with a company growing its earnings at a more accelerated rate. Recent volatility has produced some attractive market dislocations, and we believe there are other opportunities that are more aligned with the Fund’s investment criteria.
LG Household & Health Care (LG H&H) was sold because its business is maturing and we believe greater value can be added over time by adding to other businesses in Korea that are at an earlier stage in their growth lifecycle. In addition, Korea recently implemented a new defense surveillance program that China responded to negatively, creating geopolitical uncertainty. Specifically, there are worries the Chinese government might issue a mandate for reduced tourism to Korea. We believe this would be problematic for LG H&H, as most
Management's Discussion of Fund Performance (Unaudited) (Continued)
of its growth is derived from Chinese tourists. It is unclear whether there will be a real impact, but layering these new macroeconomic uncertainties on top of LG H&H’s maturing growth profile and premium valuation makes the company less attractive relative to others in the Fund’s opportunity set.
Shoprite is a leading food retailer in Africa, operating more than 2,000 stores. The company was sold because its operating results have been negatively impacted by deteriorating macroeconomic backdrops in the primary geographies in which it operates. In South Africa, where most of its stores are located, lower commodity prices are depressing both overall economic growth and delaying the construction of growth-stoking infrastructure. In other markets, such as Namibia and Nigeria, weakening currencies have pressured reported growth. While we still believe Shoprite has the potential to meaningfully expand and grow within Africa, we are concerned about the strength and duration of these headwinds. As there are other companies—both in the Fund’s portfolio and in our new opportunities pipeline—that lack these exogenous pressures, we believed selling Shoprite was a prudent decision.
Shriram Transport Finance was sold as we believe there are other Indian financials businesses that are better fits with our six investment criteria. Though the company has built a strong franchise and a highly profitable business, we have come to view Shriram’s overwhelming focus on commercial vehicles as a vulnerability, given the cyclicality of the sector. Furthermore, we believe management has fallen short of our risk management expectations, especially those related to asset quality and underwriting standards. We continue to view Indian financials as an attractive industry, and are evaluating other opportunities with what we believe are more favorable growth prospects.
Outlook
We seek businesses that are benefiting from structural local demand growth rather than export-driven business models, such as natural resource extraction or low-cost manufacturing. We believe local demand growth is more sustainable because in many developing countries, it is underpinned by long-term secular trends, including increasing productivity, growing discretionary incomes and attractive demographic profiles. When we combine this backdrop with our criteria-driven research, we find growth businesses primarily in the technology, consumer, and health care sectors, as well as companies that are building the needed infrastructure to improve productivity and support growth.
While not the main driver of stock selection, macroeconomic influences are considered when making investment decisions. Within Emerging Markets, we believe certain countries are structurally more attractive than others and have positioned the Fund in a way that reflects our views. For example, we maintain an optimistic view of the long-term prospects for India, which remains the Fund’s largest country weight. We believe real reforms are underway that have the potential to fuel economic growth by increasing domestic consumption and removing barriers to doing business. The Fund also maintains a large exposure to parts of China despite the country’s shift from an investment-driven economy to one propelled by consumption, which is resulting in a slowed rate of growth. The businesses owned within China are largely consumer-facing and we believe benefiting from powerful secular forces such as e-commerce adoption, social networking and rising consumer wealth, which should allow them to grow at rates above GDP. Other countries we view as having stable to positive macroeconomic outlooks include Pakistan, Peru, Philippines and Vietnam, among others.
Management's Discussion of Fund Performance (Unaudited) (Continued)
We continue to view emerging markets as an attractive area for long-term investors and believe the Touchstone Sands Capital Emerging Markets Growth Fund is well positioned to weather the current environment. Emerging Markets have certain attributes that developed markets generally do not, including growing middle classes, increasing demand for healthcare services and expansion of infrastructure, that we believe can create attractive areas for investment. Through our in-depth research, we have selected a group of businesses that we believe can sustain above-average growth through a combination of business-specific drivers and powerful secular tailwinds.
1Not a current holding of the Touchstone Sands Capital Emerging Markets Growth Fund.
Comparison of the Change in Value of a $10,000 Investment in the Touchstone Sands Capital Emerging Markets Growth Fund - Class Y* and the MSCI Emerging Markets Index
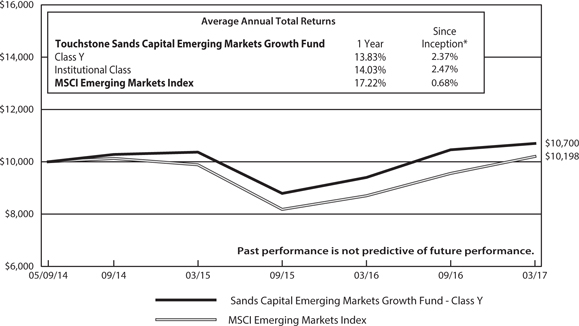
| * | The chart above represents performance of Class Y shares only, which will vary from the performance of Institutional Class shares based on the fees paid by shareholders in the different classes. The inception date of the Fund was May 9, 2014. The returns of the index listed above are based on the inception date of the Fund. |
The performance of the above Fund does not reflect the deduction of taxes that a shareholder would pay on Fund distributions or the redemption of Fund shares.
Notes to Chart
MSCI Emerging Markets Index is a free float-adjusted market capitalization index that is designed to measure equity market performance of emerging markets.
MSCI makes no express or implied warranties or representations and shall have no liability whatsoever with respect to any MSCI data contained herein. The MSCI data may not be further redistributed or used to create indices or financial products. This report is not approved or produced by MSCI.
Management's Discussion of Fund Performance (Unaudited)
Touchstone Small Cap Growth Fund
Sub-Advised by Apex Capital Management1
Investment Philosophy
The Touchstone Small Cap Growth Fund invests in a diversified portfolio of common stocks of small-cap growth-oriented companies that are selected for their long-term capital appreciation potential and which are expected to grow faster than the U.S. economy. The core investments of the portfolio include “established growth” companies which typically provide more stability and consistency in volatile markets. The balance of the portfolio is invested in “emerging growth” companies which typically exhibit more aggressive growth characteristics and may experience positive transformation or a favorable catalyst impacting their long-term growth potential. Fund management uses an approach that combines top-down secular/macro-economic theme analysis with bottom-up security selection.
Fund Performance
The Touchstone Small Cap Growth Fund (Class A Shares) underperformed its benchmark, the Russell 2000® Growth Index, for the 12-month period ended March 31, 2017. The Fund’s total return was 5.51 percent (calculated excluding maximum sales charge), while the total return of the benchmark was 23.03 percent.
Market Environment
During the 12-month period ended March 31, 2017, the markets have seen three major swings: a market recovery from the February 2016 lows, Brexit (the United Kingdom’s vote to leave the European Union) and its aftermath, and the post-election Trump rally. Each spike in volatility was short-lived. Continued accommodation from global central banks allowed equity markets to quickly bounce back, recovering losses and moving to new highs. The most recent rally was driven by the election of Donald Trump. Market expectations for improved growth on the back of tax reform, infrastructure stimulus and deregulation outweighed worries that trade protectionism could act as a headwind to growth. Banks, Industrials, Energy and Materials sectors benefited from the improved outlook for economic growth and reflation.
Portfolio Review
The 12-month period was an unusual one and contained a variety of market themes that detracted from Fund performance. For example, low quality stocks strongly outperformed their higher quality counterparts during the period. Given the Fund’s focus on high quality stocks and profitable companies, the year’s rally in lower quality stocks represented a headwind to its performance. Similarly, other factors used to position the Fund (e.g., sales growth, earnings growth, profitability) were out of favor during the period. In a period of challenged performance, there is a temptation to alter the investment approach to suit the current market. However, we do not believe that is the proper path to achieving long-term goals. We do not use factor rotation nor would we populate the Fund with low quality names. As markets normalize, we believe growth and quality stocks should once again be in favor.
The current secular bull market is now in its ninth year and trading at stretched valuations. We expected weakness, potentially leading to a meaningful market correction. As a result, the Fund was deliberately positioned to be more defensive, which proved beneficial during the market downturn of early 2016. However, as commodity prices bottomed and the market began a sharp rally at the start of the 12-month period, the Fund’s defensive positioning detracted from performance. The rotation away from defensive names accelerated with the election of Donald Trump as well as the market’s expectations for higher economic growth. The lack of commodity exposure and outperformance of low quality companies of the lower market cap portion of the Fund specifically hurt performance. That trend has slowed recently, as the prospects for pro-business policies out of Washington have tapered.
Management's Discussion of Fund Performance (Unaudited) (Continued)
Fund positions in the Information Technology and Health Care sectors detracted from relative performance. Synchronoss Technologies Inc., VeriFone Systems Inc., Infinera Corp. and Synaptics Inc. were among the Fund’s largest detractors due to missed estimates, lowered guidance or industry issues. For instance, payments verification processor VeriFone declined significantly in June after it missed estimates and lowered sales guidance. VeriFone, Infinera, and Synchronoss were sold from the Fund because of poor visibility into their growth prospects and what we believed to be better opportunities elsewhere. Performance in the Health Care sector was particularly challenged in the biotechnology industry, due to both the stocks the Fund held and those it did not hold. Fund holding Opthotech Corp. declined after negative results in a clinical trial for its wet age-related macular degeneration drug. Additionally, the Fund underperformed the benchmark as a result of not owning some of the many index biotechnology companies that increased in value during the period, such as Tesaro Inc., Exelixis Inc. and Ariad Pharmaceutical Inc. which all experienced massive gains to help drive the performance of the benchmark.
The Fund’s best performing stocks were clustered in the Health Care and Consumer Discretionary sectors. Health Care stocks Chemed Corp. (hospice and palliative care services) and Medidata Solutions Inc. (data solutions for cloud-based clinical trials) both outperformed during the period. Within the Consumer Discretionary sector, Burlington Stores Inc. performed well, one of the few brick-and-mortar retailers outperforming amid the growing trend toward online shopping. Conversely, Marriott Vacations Worldwide Corp. was a beneficiary of a shift in consumer behavior. With more consumers focusing on experiences as opposed to things, we believe Marriott (a global operator of hotels) is placed to capture the gains from this new trend. The stock increased on the back of strong operating performance that consistently beat consensus expectations. While technically classified in the Industrials sector, Trex Company Inc. is a manufacturer of non-wood decking alternatives that is tied to consumer demand for new homes and repairs/improvements on existing homes. The stock experienced gains during the year and contributed to the Fund’s performance.
Despite the challenged performance, we remain committed to the Fund’s process and have not made any significant changes to the Fund’s portfolio. Incremental repositioning has occurred due to a slight increase in exposure in the Financials and Materials sectors and a marginal decrease in exposure to the Information Technology and Consumer Discretionary sectors. These changes are part of an ongoing plan to improve the quality of the Fund’s portfolio following the underperformance (and thus, more attractive valuations) of high quality companies over the past year. We also see potential in companies tied to homebuilding and may increase exposure to that area as attractive opportunities arise.
Outlook
In our view, geopolitical risk remains high given the Trump administration’s previous statements on areas such as healthcare, trade protectionism and China. To date, the administration’s actions have not matched its rhetoric, but there remains the potential for increased market volatility stemming from these areas. Additionally, the post-election market rally was largely driven by the anticipation of corporate tax cuts and infrastructure spending. If actual results do not meet these expectations, we believe the equity market could be in for a significant correction.
We have positioned the Fund’s portfolio in lower valued stocks, reflecting our caution and a defensive posture relative to the benchmark. At present, the small cap growth space remains expensive relative to its history, and we remain keenly aware of areas such as Financial Technology (“Fintech”) and biotechnology where valuations seem stretched. Accordingly, the Fund is slightly underweight to both Health Care and Information Technology sectors at this juncture, despite the Fund’s historical overweight in these sectors.
We remain focused, not so much on promises of tax cuts and infrastructure growth that may or may not materialize, but on what we believe are individual, high-quality companies with strong and sustainable organic growth backed by secular trends. Of particular interest are companies on the cutting edge of technology and those that benefit the most from the challenges of uncertainty. Examples include consumer mobility, big data and
Management's Discussion of Fund Performance (Unaudited) (Continued)
cloud computing, virtual reality, e-commerce and personalized medicine and genomics. We believe that these areas of long-term potential will be the key performance drivers in a more normalized market environment.
1On June 1, 2016, Apex Capital Management (Apex) became part of Fiera Capital, Inc., the U.S. division of Fiera Capital Corporation. Apex is a trade-name being used by Fiera Capital Inc. (the sub-advisor), a SEC-registered investment advisor.
Management's Discussion of Fund Performance (Unaudited) (Continued)
Comparison of the Change in Value of a $10,000 Investment in the Touchstone Small Cap Growth Fund - Class A* and the Russell 2000® Growth Index
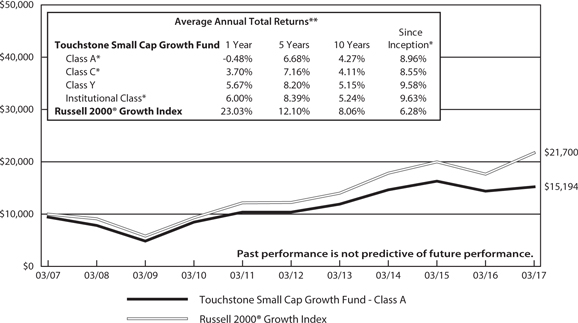
| * | The chart above represents performance of Class A shares only, which will vary from the performance of Class C shares, Class Y shares and Institutional Class shares based on the differences in sales loads and fees paid by shareholders in the different classes. The inception date of Class A shares, Class C shares, Class Y shares and Institutional Class shares was August 13, 2001, August 13, 2001, February 1, 1998 and September 10, 2012, respectively. Class A shares, Class C shares and Institutional Class shares performance information was calculated using the historical performance of Class Y shares for periods prior to August 13, 2001, August 13, 2001 and September 10, 2012, respectively. The returns have been restated for sales loads and fees applicable to Class A, Class C and Institutional Class shares. The returns of the index listed above are based on the inception date of the Fund. |
| ** | The average annual total returns shown above are adjusted for maximum sales loads and fees, if applicable. The maximum offering price per share of Class A shares is equal to the net asset value (“NAV”) per share plus a sales load equal to 6.10% of the NAV (or 5.75% of the offering price). Class C shares are subject to a contingent deferred sales charge (“CDSC”) of 1.00%. The CDSC will be assessed on an amount equal to the lesser of (1) the NAV at the time of purchase of the shares being redeemed or (2) the NAV of such shares being redeemed, if redeemed within a one-year period from the date of purchase. Class Y shares and Institutional Class shares are not subject to sales charges. |
The performance of the above Fund does not reflect the deduction of taxes that a shareholder would pay on Fund distributions or the redemption of Fund shares.
Notes to Chart
Russell 2000® Growth Index measures the performance of those Russell 2000® companies with higher price-to-book ratios and higher forecasted growth values.
The Frank Russell Company (FRC) is the source and owner of the Index data contained or reflected in this material and all trademarks and copyrights related thereto. The material may contain confidential information and unauthorized use, disclosure, copying, dissemination or redistribution is strictly prohibited. This is a Touchstone Investments presentation of the data, and FRC is not responsible for the formatting or configuration of this material or for any inaccuracy in the presentation thereof.
Management's Discussion of Fund Performance (Unaudited)
Touchstone Sustainability and Impact Equity Fund
Sub-Advised by Rockefeller & Co., Inc.1
Investment Philosophy
The Touchstone Sustainability and Impact Equity Fund seeks long-term growth of capital. The Fund primarily invests in equity securities of U.S. and non-U.S. companies and generally focuses on larger, more established companies. The Fund selects investments based on an evaluation of a company’s financial condition and sustainability and impact practices which considers and analyzes the potential environmental, social and governance (ESG) impacts and risks of a company, how well the company manages these impacts and risks and ascertains the company’s willingness and ability to take a leadership position in implementing best practices.
Fund Performance
The Touchstone Sustainability and Impact Equity Fund (Class A Shares) underperformed its benchmark, the MSCI All Country World Index, for the 12-month period ended March 31, 2017. The Fund’s total return was 14.01 percent (calculated excluding the maximum sales charge), while the total return of the benchmark was 15.04 percent.
Market Environment
Global equity markets posted sharp gains for the 12-month period ended March 31, 2017. A portion of the market’s returns were attributable to a rebound effect, as global markets had declined in 2015 and were unchanged during the first quarter of 2016. Investors had been concerned about weak global economic growth, declining commodity prices and the potential for slower growth in China’s economy. Improving economic data in much of the world helped set the stage for the robust rally in equities seen over the last twelve months.
As an indication of how investor confidence was restored in the global economy, the best performing sectors were those with the most sensitivity to economic growth, such as Materials, Information Technology and Financials. Conversely more defensive sectors like Telecommunication Services, Real Estate, Consumer Staples and Utilities lagged.
The U.S. dollar continued to ascend through most of this period as the U.S. Federal Reserve Board (Fed) was the only major central bank in the midst of a tightening cycle. Fed rate hikes in December 2016 and March 2017 drove an increase in interest rates at the short end of the curve, while longer maturity interest rates experienced some upward movement. Despite rising interest rates, credit conditions remained robust which was a potential sign of a stable economy that supported the rise in equities.
Portfolio Review
The Fund’s positioning in the Health Care and Industrials sectors contributed to performance relative to the benchmark. Fund holding St. Jude Medical Inc. benefited from a takeover offer by Abbott Laboratories following the announcement. Strong performance from gene sequencing company Illumina Inc. and medical device manufacturer Becton Dickinson and Co. also contributed to Fund returns in the sector. Within the Industrials sector, Southwest Airlines Co. generated strong returns, benefiting from increased consolidation in the airline industry. The international industrial group Atlas Copco AB (based out of Sweden) and Japanese construction firm Kinden Corp. provided additional relative gains for the Fund.
Conversely, the Fund’s relative performance was challenged in the Information Technology and Materials sectors. Internet search companies Alphabet Inc. (U.S.-based) and Baidu Inc. (China-based) underperformed. While the Fund held Apple Inc. early in the 12-month period, the position was sold on concerns about the iPhone 7 product refresh cycle and its exposure to a hostile business environment in China. The stock advanced further following the exit, detracting from the Fund’s relative performance. Underperformance in the Materials sector
Management's Discussion of Fund Performance (Unaudited) (Continued)
was also negatively impacted by what the Fund did not own, specifically the metals subsector. This group performed well during the period, but is one that the Fund would not typically own due to its potential for toxic environmental impact. Our ESG criteria led us to seek economic exposure in less environmentally-impactful sectors.
Many of the stocks that benefited from low interest rates were trimmed ahead of the November election on our belief that underlying inflation was increasing and interest rates were unsustainably low. Fund holdings were repositioned to securities within the Financials sector that we believed would benefit from higher interest rates. This was beneficial as interest rates climbed higher following the election. The Fund also shifted its geographic tilt away from the U.S. towards overseas markets. Given the high valuations in the U.S., we saw better opportunities arise following the Brexit vote in mid 2016. The Fund had been tilted toward Europe. Given the lingering uncertainties surrounding political events in Europe (e.g., the French Presidential election), we have been cautious in the Fund’s European overweight, but believe the Fund could benefit from a centrist victory in the French election. Should political results provide a more stable environment in Europe, interest rates could increase again, providing a potential benefit to the Fund’s exposure to the Financials sector.
Outlook
In our view, the upcoming French election is the single most important macro-economic event of 2017. A victory by one of the centrist candidates will signal a stronger commitment to the European Union (EU), while a win by the far right or far left candidate would be another indication of discontent with the EU and signal the potential for further fracturing following Brexit (the United Kingdom’s vote to leave the European Union). We are monitoring the polls closely and believe that one of the pro-European centrist candidates will win. We believe such an outcome is vital for the health of the EU and should trigger a rally in those markets as well as the euro.
From a sector perspective, we continue to be bullish about the long-term growth prospects for the travel and leisure industry going forward. Many travel companies were negatively impacted by the effects of terrorism in 2016, but we continued to see positive indicators for growth. Southwest Airlines Co. is a large position in the Fund, reflecting its constructive stance. We also believe interest rates have further room to rise, which would provide a boost to financial stocks. That said, the markets have been driven recently by expectations for stimulus spending and tax cuts. Should the new administration be unable to implement its pro-growth agenda, the U.S. economy might disappoint investors and restrain the potential for further interest rate increases.
In aggregate, we are constructive on equities as an asset class and especially see opportunities outside the U.S. After many years of global markets underperforming the U.S., we believe that non-U.S. companies could be ripe for a reversal of this trend. For example, if our base case scenario for France occurs, the markets could have an immediate and meaningful rally, though risk remains given the binary nature of the election.
1On May 4, 2015, the Fund changed its name, principal investment strategies and sub-advisor. Consequently, prior period performance may have been different if the Fund had not been managed by the prior sub-advisor using that sub-advisor's large cap growth strategy.
Management's Discussion of Fund Performance (Unaudited) (Continued)
Comparison of the Change in Value of a $10,000 Investment in the
Touchstone Sustainability and Impact Equity Fund - Class A* and the MSCI All Country World Index
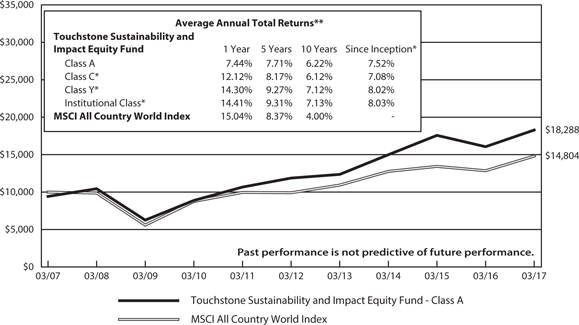
| * | The chart above represents performance of Class A shares only, which will vary from the performance of Class C shares, Class Y shares and Institutional Class shares based on the differences in sales loads and fees paid by shareholders in the different classes. The inception date of Class A shares, Class C shares, Class Y shares and Institutional Class shares was December 19, 1997, October 4, 2003, November 10, 2004 and May 4, 2015, respectively. Class C shares, Class Y shares and Institutional Class shares performance information was calculated using the historical performance of Class A shares for periods prior to October 4, 2003, November 10, 2004 and May 4, 2015, respectively. The returns have been restated for sales loads and fees applicable to Class C, Class Y and Institutional Class shares . The returns of the index listed above are based on the inception date of the Fund. The launch date of the index listed above was after the inception date of the Fund, therefore there is no return for since inception. |
| ** | The average annual total returns shown above are adjusted for maximum sales loads and fees, if applicable. The maximum offering price per share of Class A shares is equal to the net asset value (“NAV”) per share plus a sales load equal to 6.10% of the NAV (or 5.75% of the offering price). Class C shares are subject to a contingent deferred sales charge (“CDSC”) of 1.00%. The CDSC will be assessed on an amount equal to the lesser of (1) the NAV at the time of purchase of the shares being redeemed or (2) the NAV of such shares being redeemed, if redeemed within a one-year period from the date of purchase. Class Y shares and Institutional Class shares are not subject to sales charges. |
The performance of the above Fund does not reflect the deduction of taxes that a shareholder would pay on Fund distributions or the redemption of Fund shares.
Notes to Chart
MSCI All Country World Index measures the equity market performance of developed and emerging markets.
MSCI makes no express or implied warranties or representations and shall have no liability whatsoever with respect to any MSCI data contained herein. The MSCI data may not be further redistributed or used to create indices or financial products. This report is not approved or produced by MSCI.
Tabular Presentation of Portfolios of Investments (Unaudited)
March 31, 2017
The tables below provide each Fund’s geographic allocation, sector allocation and/or credit quality. We hope it will be useful to shareholders as it summarizes key information about each Fund’s investments.
| Touchstone Flexible Income Fund | | | |
| Credit Quality* | | (% of Fixed Income Securities) | |
| AAA/Aaa | | | 41.1 | % |
| AA/Aa | | | 5.1 | |
| A/A | | | 15.8 | |
| BBB/Baa | | | 28.0 | |
| BB/Ba | | | 7.1 | |
| B/B | | | 1.7 | |
| Not Rated | | | 1.2 | |
| | | | 100.0 | % |
| | | | | |
| Credit Quality* | | | (% of Preferred Stocks) | |
| A/A | | | 10.1 | % |
| BBB/Baa | | | 45.2 | |
| BB/Ba | | | 33.9 | |
| B/B | | | 5.5 | |
| Not Rated | | | 5.3 | |
| | | | 100.0 | % |
| | | | | |
| Sector Allocation** | | | (% of Net Assets) | |
| Fixed Income Securities | | | 80.1 | % |
| Common Stocks | | | | |
| Real Estate | | | 3.2 | |
| Information Technology | | | 0.9 | |
| Financials | | | 0.9 | |
| Consumer Discretionary | | | 0.7 | |
| Industrials | | | 0.7 | |
| Health Care | | | 0.4 | |
| Preferred Stocks | | | 6.4 | |
| Exchange Traded Funds | | | 3.3 | |
| Purchased Call Option | | | 0.0 | |
| Investment Funds | | | 0.2 | |
| Short-Term Investment Funds | | | 2.7 | |
| Written Call Options | | | 0.0 | |
| Written Put Options | | | 0.0 | |
| Other Assets/Liabilities (Net) | | | 0.5 | |
| Total | | | 100.0 | % |
| Touchstone Focused Fund | | | |
| Sector Allocation** | | (% of Net Assets) | |
| Information Technology | | | 20.9 | % |
| Consumer Discretionary | | | 15.2 | |
| Health Care | | | 15.0 | |
| Financials | | | 14.4 | |
| Industrials | | | 10.6 | |
| Consumer Staples | | | 6.3 | |
| Energy | | | 4.7 | |
| Real Estate | | | 4.0 | |
| Telecommunication | | | 2.4 | |
| Services | | | | |
| Materials | | | 1.9 | |
| Short-Term Investment | | | 4.2 | |
| Funds | | | | |
| Other Assets/Liabilities (Net) | | | 0.4 | |
| Total | | | 100.0 | % |
| Touchstone Growth Opportunities Fund | | | |
| Sector Allocation** | | (% of Net Assets) | |
| Information Technology | | | 32.6 | % |
| Consumer Discretionary | | | 19.7 | |
| Health Care | | | 19.1 | |
| Industrials | | | 10.8 | |
| Financials | | | 5.1 | |
| Materials | | | 3.7 | |
| Consumer Staples | | | 2.8 | |
| Energy | | | 1.9 | |
| Real Estate | | | 1.3 | |
| Short-Term Investment Fund | | | 2.4 | |
| Other Assets/Liabilities (Net) | | | 0.6 | |
| Total | | | 100.0 | % |
* Credit quality ratings are from Standard & Poor's (“S&P”) and Moody's Investors Service (“Moody's”). If agency ratings differ, the higher rating will be used. Where no rating has been assigned, it may be for reasons unrelated to the creditworthiness of the issuer.
** Sector classifications are based upon the Global Industry Classification Standard (GICS®).
Tabular Presentation of Portfolios of Investments (Unaudited) (Continued)
| Touchstone International Growth Fund | | | |
| Geographic Allocation | | (% of Net Assets) | |
| Common Stocks | | | | |
| Germany | | | 11.4 | % |
| France | | | 10.2 | |
| Japan | | | 9.1 | |
| Cayman Islands | | | 8.7 | |
| Netherlands | | | 8.7 | |
| Singapore | | | 7.1 | |
| Switzerland | | | 5.5 | |
| Canada | | | 5.4 | |
| United Kingdom | | | 4.9 | |
| United States | | | 3.5 | |
| Sweden | | | 3.5 | |
| India | | | 2.9 | |
| Denmark | | | 2.8 | |
| Taiwan | | | 1.7 | |
| Panama | | | 1.6 | |
| Ireland | | | 1.5 | |
| Spain | | | 1.4 | |
| Brazil | | | 1.2 | |
| Philippines | | | 1.2 | |
| China | | | 1.2 | |
| Belgium | | | 0.6 | |
| Israel | | | 0.6 | |
| Short-Term Investment Funds | | | 10.6 | |
| Other Assets/Liabilities (Net) | | | (5.3 | ) |
| Total | | | 100.0 | % |
| Touchstone International Value Fund | | | |
| Geographic Allocation | | (% of Net Assets) | |
| Common Stocks | | | | |
| United Kingdom | | | 18.0 | % |
| Netherlands | | | 15.1 | |
| Japan | | | 13.5 | |
| Germany | | | 9.1 | |
| France | | | 7.8 | |
| Switzerland | | | 5.1 | |
| Italy | | | 4.0 | |
| Singapore | | | 3.8 | |
| Ireland | | | 3.5 | |
| South Korea | | | 3.4 | |
| Austria | | | 2.6 | |
| United States | | | 2.5 | |
| Australia | | | 2.2 | |
| Spain | | | 1.9 | |
| Israel | | | 1.8 | |
| Brazil | | | 1.5 | |
| Thailand | | | 1.2 | |
| Malaysia | | | 0.8 | |
| Colombia | | | 0.5 | |
| Czech Republic | | | 0.2 | |
| Short-Term Investment Funds | | | 1.3 | |
| Other Assets/Liabilities (Net) | | | 0.2 | |
| Total | | | 100.0 | % |
| Touchstone Mid Cap Growth Fund | | | |
| Sector Allocation* | | (% of Net Assets) | |
| Information Technology | | | 21.3 | % |
| Consumer Discretionary | | | 21.0 | |
| Industrials | | | 18.0 | |
| Health Care | | | 14.4 | |
| Financials | | | 7.3 | |
| Materials | | | 6.0 | |
| Consumer Staples | | | 4.5 | |
| Real Estate | | | 3.8 | |
| Energy | | | 1.0 | |
| Short Term Investment | | | 4.9 | |
| Funds | | | | |
| Other Assets/Liabilities (Net) | | | (2.2 | ) |
| Total | | | 100.0 | % |
* Sector classifications are based upon the Global Industry Classification Standard (GICS®).
Tabular Presentation of Portfolios of Investments (Unaudited) (Continued)
| Touchstone Sands Capital Emerging Markets | | | |
| Growth Fund | | | |
| Geographic Allocation | | (% of Net Assets) | |
| Common Stocks | | | | |
| India | | | 30.5 | % |
| Cayman Islands | | | 19.6 | |
| China | | | 6.3 | |
| South Korea | | | 4.4 | |
| United States | | | 4.3 | |
| Philippines | | | 4.0 | |
| South Africa | | | 4.0 | |
| Brazil | | | 4.0 | |
| Indonesia | | | 3.6 | |
| United Kingdom | | | 3.0 | |
| Thailand | | | 2.3 | |
| Peru | | | 2.0 | |
| Taiwan | | | 2.0 | |
| Russia | | | 1.9 | |
| Virgin Islands (British) | | | 1.6 | |
| Netherlands | | | 1.4 | |
| Malaysia | | | 1.2 | |
| Low Exercise Price | | | | |
| Warrants | | | | |
| Saudi Arabia | | | 1.9 | |
| Short-Term Investment | | | 2.6 | |
| Funds | | | | |
| Other Assets/Liabilities (Net) | | | (0.6 | ) |
| Total | | | 100.0 | % |
| Touchstone Small Cap Growth Fund | | | |
| Sector Allocation* | | (% of Net Assets) | |
| Health Care | | | 21.4 | % |
| Information Technology | | | 19.3 | |
| Consumer Discretionary | | | 17.1 | |
| Industrials | | | 15.4 | |
| Financials | | | 10.0 | |
| Consumer Staples | | | 4.4 | |
| Materials | | | 2.8 | |
| Real Estate | | | 1.9 | |
| Energy | | | 1.5 | |
| Short-Term Investment Funds | | | 10.1 | |
| Other Assets/Liabilities (Net) | | | (3.9 | ) |
| Total | | | 100.0 | % |
| Touchstone Sustainability and Impact Equity | | | |
| Fund | | | |
| Geographic Allocation | | (% of Net Assets) | |
| Common Stocks | | | | |
| United States | | | 50.9 | % |
| United Kingdom | | | 10.8 | |
| Japan | | | 9.9 | |
| France | | | 4.2 | |
| Jersey | | | 4.0 | |
| Netherlands | | | 3.6 | |
| Germany | | | 3.2 | |
| Cayman Islands | | | 2.6 | |
| Sweden | | | 2.3 | |
| Switzerland | | | 2.1 | |
| Mexico | | | 1.9 | |
| Italy | | | 1.0 | |
| Indonesia | | | 0.7 | |
| South Korea | | | 0.5 | |
| Short-Term Investment | | | 4.2 | |
| Funds | | | | |
| Other Assets/Liabilities (Net) | | | (1.9 | ) |
| Total | | | 100.0 | % |
* Sector classifications are based upon the Global Industry Classification Standard (GICS®).
Portfolio of Investments
Touchstone Flexible Income Fund – March 31, 2017
| Principal | | | | | Market | |
| Amount | | | | | Value | |
| | | | | | | |
| | | | | Corporate Bonds — 54.4% | | | | |
| | | | | | | | | |
| | | | | Financials — 27.9% | | | | |
| $ | 6,765,000 | | | Aflac, Inc., 2.875%, 10/15/26 | | $ | 6,523,713 | |
| | 2,000,000 | | | Allstate Corp. (The), 5.750%, 8/15/53(A) | | | 2,146,200 | |
| | 375,000 | | | American Financial Group, Inc., 9.875%, 6/15/19 | | | 435,466 | |
| | 13,100,000 | | | Australia & New Zealand Banking Group Ltd/United Kingdom (Australia), 144a, 6.750%(A)(B) | | | 14,400,371 | |
| | 3,480,000 | | | Bank of New York Mellon Corp. (The), Ser E, 4.950%(A)(B) | | | 3,589,836 | |
| | 5,265,000 | | | Berkshire Hathaway, Inc., 3.125%, 3/15/26 | | | 5,259,961 | |
| | 4,900,000 | | | BNP Paribas SA (France), 144a, 6.750%(A)(B) | | | 4,955,125 | |
| | 10,052,000 | | | Catlin Insurance Co. Ltd. (Bermuda), 144a, 4.000%(A)(B) | | | 9,046,800 | |
| | 7,780,000 | | | Charles Schwab Corp. (The), 4.625%(A)(B) | | | 7,663,300 | |
| | 3,585,000 | | | Citigroup, Inc., Ser Q, 5.950%(A)(B) | | | 3,737,362 | |
| | 10,550,000 | | | Citizens Financial Group, Inc., 5.500%(A)(B) | | | 10,826,937 | |
| | 6,000,000 | | | Credit Agricole SA (France), 144a, 8.125%(A)(B) | | | 6,390,000 | |
| | 807,740 | | | Doric Nimrod Air Finance Alpha Ltd. 2012-1 Class B Pass Through Trust (Guernsey), 144a, 6.500%, 5/30/21 | | | 829,626 | |
| | 4,285,000 | | | Ford Motor Credit Co. LLC MTN, 4.389%, 1/8/26 | | | 4,376,523 | |
| | 3,633,000 | | | Goldman Sachs Group, Inc. (The), Ser L, 5.700%(A)(B) | | | 3,756,159 | |
| | 5,300,000 | | | HSBC Holdings PLC (United Kingdom), 6.375%(A)(B) | | | 5,392,750 | |
| | 10,000,000 | | | ING Groep NV (Netherlands), 6.000%(A)(B) | | | 9,963,000 | |
| | 13,166,000 | | | JPMorgan Chase & Co., Ser Z, 5.300%(A)(B) | | | 13,643,268 | |
| | 12,550,000 | | | Lloyds Banking Group PLC (United Kingdom), 7.500%(A)(B)† | | | 13,272,880 | |
| | 6,430,000 | | | MetLife, Inc., Ser C, 5.250%(A)(B) | | | 6,633,079 | |
| | 2,350,000 | | | Prudential Financial, Inc., 5.875%, 9/15/42(A) | | | 2,553,862 | |
| | 1,100,000 | | | QBE Insurance Group Ltd., MTN (Australia), 5.875%, 6/17/46(A) | | | 1,149,260 | |
| | 4,200,000 | | | Reinsurance Group of America, Inc., 3.796%, 12/15/65(A) | | | 3,843,000 | |
| | 14,250,000 | | | Royal Bank of Scotland Group PLC (United Kingdom), 7.500%(A)(B) | | | 14,054,062 | |
| | 9,625,000 | | | Societe Generale SA (France), 144a, 7.375%(A)(B) | | | 9,775,150 | |
| | 5,000,000 | | | UBS Group AG (Switzerland), 7.125%(A)(B) | | | 5,215,010 | |
| | 9,100,000 | | | US Bancorp, Ser I, 5.125%(A)(B) | | | 9,532,250 | |
| | 6,231,000 | | | Wells Fargo & Co., Ser K, 7.980%(A)(B) | | | 6,511,395 | |
| | 2,250,000 | | | Westpac Banking Corp. (Australia) MTN, 4.322%, 11/23/31(A) | | | 2,273,643 | |
| | | | | | | | 187,749,988 | |
| | | | | | | | | |
| | | | | Industrials — 7.9% | | | | |
| | 4,300,000 | | | AerCap Global Aviation Trust, 144a, 6.500%, 6/15/45(A) | | | 4,488,125 | |
| | 574,134 | | | Air Canada 2013-1 Class A Pass Through Trust (Canada), 144a, 4.125%, 5/15/25 | | | 592,759 | |
| | 2,745,000 | | | Asciano Finance Ltd. (Australia), 144a, 5.000%, 4/7/18 | | | 2,810,452 | |
| | 6,523,440 | | | Continental Airlines 2012-2 Class A Pass Through Trust, 4.000%, 10/29/24 | | | 6,776,223 | |
| | 3,861,868 | | | Delta Air Lines 2002-1 Class G-1 Pass Through Trust, 6.718%, 1/2/23 | | | 4,305,983 | |
| | 15,260,000 | | | General Electric Co., Ser D, 5.000%(A)(B) | | | 16,099,300 | |
| | 3,407,811 | | | Hawaiian Airlines 2013-1 Class A Pass Through Certificates, 3.900%, 7/15/27 | | | 3,450,408 | |
| | 2,475,598 | | | Northwest Airlines 2007-1 Class A Pass Through Trust, 7.027%, 5/1/21 | | | 2,735,536 | |
| | 1,500,000 | | | Owens Corning, 3.400%, 8/15/26 | | | 1,452,618 | |
| | 3,180,000 | | | Owens Corning, 4.200%, 12/15/22 | | | 3,326,239 | |
| | 1,201,000 | | | Stanley Black & Decker, Inc., 5.750%, 12/15/53(A) | | | 1,262,611 | |
| | 5,692,248 | | | US Airways 2012-2 Class A Pass Through Trust, 4.625%, 12/3/26 | | | 5,976,860 | |
| | | | | | | | 53,277,114 | |
| | | | | | | | | |
| | | | | Consumer Discretionary — 5.5% | | | | |
| | 6,680,000 | | | CalAtlantic Group, Inc., 5.250%, 6/1/26 | | | 6,654,950 | |
| | 4,175,000 | | | General Motors Financial Co., Inc., 3.700%, 5/9/23 | | | 4,190,740 | |
| | 5,895,000 | | | General Motors Financial Co., Inc., 4.350%, 1/17/27 | | | 5,946,304 | |
| | 3,190,000 | | | Home Depot, Inc. (The), 4.200%, 4/1/43 | | | 3,287,024 | |
| | 700,000 | | | Interpublic Group of Cos., Inc. (The), 3.750%, 2/15/23 | | | 710,176 | |
| | 3,250,000 | | | Interpublic Group of Cos., Inc. (The), 4.200%, 4/15/24 | | | 3,353,048 | |
| | 5,195,000 | | | Time Warner, Inc., 3.875%, 1/15/26 | | | 5,206,741 | |
| | 7,680,000 | | | Toll Brothers Finance Corp., 4.375%, 4/15/23 | | | 7,771,238 | |
| | | | | | | | 37,120,221 | |
| | | | | | | | | |
| | | | | Energy — 3.7% | | | | |
| | 6,810,000 | | | Boardwalk Pipelines LP, 4.450%, 7/15/27 | | | 6,880,286 | |
| | 7,070,000 | | | Buckeye Partners LP, 3.950%, 12/1/26 | | | 6,924,301 | |
| | 6,835,000 | | | Exxon Mobil Corp., 2.709%, 3/6/25 | | | 6,740,076 | |
| | 3,875,000 | | | Transcanada Trust (Canada), 5.875%, 8/15/76(A) | | | 4,112,344 | |
| | | | | | | | 24,657,007 | |
| | | | | | | | | |
| | | | | Consumer Staples — 3.0% | | | | |
| | 7,220,000 | | | Archer-Daniels-Midland Co., 2.500%, 8/11/26 | | | 6,857,563 | |
Touchstone Flexible Income Fund (Continued)
| Principal | | | | | Market | |
| Amount | | | | | Value | |
| | | | | | | |
| | | | | Corporate Bonds — 54.4% (Continued) | | | | |
| | | | | | | | | |
| | | | | Consumer Staples — (Continued) | | | | |
| $ | 6,745,000 | | | CVS Health Corp., 2.125%, 6/1/21 | | $ | 6,616,036 | |
| | 7,150,000 | | | Kroger Co. (The), 2.650%, 10/15/26 | | | 6,586,330 | |
| | | | | | | | 20,059,929 | |
| | | | | | | | | |
| | | | | Telecommunication Services — 2.0% | | | | |
| | 4,260,000 | | | Verizon Communications, Inc., 2.625%, 8/15/26 | | | 3,889,989 | |
| | 9,260,000 | | | Viacom, Inc., 5.875%, 2/28/57(A)† | | | 9,445,200 | |
| | | | | | | | 13,335,189 | |
| | | | | | | | | |
| | | | | Information Technology — 1.7% | | | | |
| | 3,605,000 | | | Alphabet, Inc., 1.998%, 8/15/26 | | | 3,327,768 | |
| | 2,500,000 | | | Altera Corp., 2.500%, 11/15/18 | | | 2,536,740 | |
| | 5,200,000 | | | Microsoft Corp., 4.450%, 11/3/45 | | | 5,488,085 | |
| | | | | | | | 11,352,593 | |
| | | | | | | | | |
| | | | | Utilities — 1.1% | | | | |
| | 1,300,000 | | | NextEra Energy Capital Holdings, Inc., 3.215%, 10/1/66(A) | | | 1,150,500 | |
| | 2,700,000 | | | NextEra Energy Capital Holdings, Inc., 6.650%, 6/15/67(A) | | | 2,409,750 | |
| | 4,001,000 | | | WEC Energy Group, Inc., 6.250%, 5/15/67(A) | | | 3,700,925 | |
| | | | | | | | 7,261,175 | |
| | | | | | | | | |
| | | | | Materials — 1.0% | | | | |
| | 6,915,000 | | | Glencore Funding LLC, 144a, 4.000%, 3/27/27 | | | 6,826,792 | |
| | | | | | | | | |
| | | | | Real Estate — 0.6% | | | | |
| | 1,200,000 | | | American Tower Corp., REIT, 4.500%, 1/15/18 | | | 1,225,606 | |
| | 2,101,000 | | | DDR Corp., MTN, REIT, 7.500%, 7/15/18 | | | 2,235,296 | |
| | 785,000 | | | Essex Portfolio LP, REIT, 3.500%, 4/1/25 | | | 777,656 | |
| | | | | | | | 4,238,558 | |
| | | | | Total Corporate Bonds | | $ | 365,878,566 | |
| | | | | | | | | |
| | | | | Asset-Backed Securities — 12.5% | | | | |
| | 4,034,942 | | | American Homes 4 Rent Trust, Ser 2014-SFR2, Class A, 144a, 3.786%, 10/17/36 | | | 4,161,912 | |
| | 5,435,000 | | | Cabela's Credit Card Master Note Trust, Ser 2013-1A, Class A, 144a, 2.710%, 2/17/26 | | | 5,428,309 | |
| | 3,153,845 | | | Capital Auto Receivables Asset Trust, Ser 2013-1, Class D, 2.190%, 9/20/21 | | | 3,155,494 | |
| | 5,400,000 | | | Chrysler Capital Auto Receivables Trust, Ser 2013-AA, Class C, 144a, 2.280%, 7/15/19 | | | 5,426,458 | |
| | 1,090,000 | | | CNH Equipment Trust, Ser 2013-D, Class B, 1.750%, 4/15/21 | | | 1,091,191 | |
| | 586,050 | | | Conseco Financial Corp., Ser 1998-4, Class A7, 6.870%, 4/1/30(A) | | | 625,911 | |
| | 2,270,303 | | | Countrywide Asset-Backed Certificates, Ser 2004-8, Class M1, 2.032%, 1/25/35(A) | | | 2,254,622 | |
| | 793,989 | | | CWABS, Inc. Asset-Backed Certificates, Ser 2003-5, Class MF1, 5.313%, 1/25/34(A) | | | 791,714 | |
| | 1,300,000 | | | Ford Credit Auto Owner Trust, Ser 2013-A, Class D, 1.860%, 8/15/19 | | | 1,300,191 | |
| | 6,700,000 | | | Merrill Lynch Mortgage Investors Trust, Ser 2006-FF1, Class M3, 1.292%, 8/25/36(A) | | | 6,519,296 | |
| | 651,806 | | | Mid-State Capital Corp. Trust, Ser 2005-1, Class M2, 7.079%, 1/15/40 | | | 713,636 | |
| | 4,815,000 | | | Newcastle Mortgage Securities Trust, Ser 2006-1, Class M2, 1.352%, 3/25/36(A) | | | 4,409,636 | |
| | 7,491,690 | | | Nomura Home Equity Loan, Inc. Home Equity Loan Trust, Ser 2005-FM1, Class M2, 1.472%, 5/25/35(A) | | | 7,158,602 | |
| | 2,240,000 | | | Oscar US Funding Trust, Ser 2014-1A, Class A4, 144a, 2.550%, 12/15/21 | | | 2,209,346 | |
| | 3,194,583 | | | Popular ABS Mortgage Pass-Through Trust, Ser 2004-4, Class AV1, 1.322%, 9/25/34(A) | | | 2,962,538 | |
| | 2,335,000 | | | RAMP Trust, Ser 2005-EFC5, Class M3, 1.442%, 10/25/35(A) | | | 2,066,119 | |
| | 8,455,000 | | | Santander Drive Auto Receivables Trust, Ser 2014-4, Class D, 3.100%, 11/16/20 | | | 8,607,146 | |
| | 6,790,000 | | | Synchrony Credit Card Master Note Trust, Ser 2012-6, Class A, 1.360%, 8/17/20 | | | 6,794,792 | |
| | 3,822,778 | | | Tax Ease Funding LLC, Ser 2016-1A, Class A, 144a, 3.131%, 6/15/28 | | | 3,825,241 | |
| | 2,765,000 | | | Wells Fargo Dealer Floorplan Master Note Trust, Ser 2012-2, Class A, 1.728%, 4/22/19(A) | | | 2,765,921 | |
| | 2,558,649 | | | Wells Fargo Home Equity Asset-Backed Securities Trust, Ser 2005-4, Class M1, 1.442%, 12/25/35(A) | | | 2,539,543 | |
| | 9,350,000 | | | World Financial Network Credit Card Master Trust, Ser 2015-C, Class A, 1.260%, 3/15/21 | | | 9,349,756 | |
| | | | | Total Asset-Backed Securities | | $ | 84,157,374 | |
| | | | | | | | | |
| | | | | U.S. Treasury Obligations — 8.6% | | | | |
| | 11,830,000 | | | U.S. Treasury Note, 1.375%, 10/31/20†† | | | 11,700,603 | |
| | 3,814,200 | | | U.S. Treasury Note, 1.500%, 8/15/26 | | | 3,529,325 | |
| | 6,500,000 | | | U.S. Treasury Note, 2.000%, 10/31/21 | | | 6,529,705 | |
| | 13,075,300 | | | U.S. Treasury Note, 2.250%, 2/15/27 | | | 12,908,289 | |
| | 16,655,000 | | | United States Treasury Inflation Indexed Bonds, 0.375%, 1/15/27 | | | 16,667,422 | |
| | 6,406,900 | | | United States Treasury Inflation Indexed Bonds, 1.000%, 2/15/46 | | | 6,664,869 | |
| | | | | Total U.S. Treasury Obligations | | $ | 58,000,213 | |
Touchstone Flexible Income Fund (Continued)
| Principal | | | | | Market | |
| Amount | | | | | Value | |
| | | | | | | |
| | | | | Agency Collateralized Mortgage Obligations — 2.9% | | | | |
| $ | 1,566,020 | | | Fannie Mae REMICs, Ser 2008-60, Class SA, 5.518%, 7/25/38(A)(C) | | $ | 287,501 | |
| | 33,219,987 | | | FHLMC Multifamily Structured Pass Through Certificates, Ser K006, Class AX1, 0.982%, 1/25/20(A)(C) | | | 762,053 | |
| | 15,080,559 | | | FHLMC Multifamily Structured Pass Through Certificates, Ser K019, Class X1, 1.690%, 3/25/22(A)(C) | | | 1,034,448 | |
| | 26,875,557 | | | FHLMC Multifamily Structured Pass Through Certificates, Ser K025, Class X1, 0.880%, 10/25/22(A)(C) | | | 1,073,012 | |
| | 72,429,386 | | | FHLMC Multifamily Structured Pass Through Certificates, Ser K033, Class X1, 0.311%, 7/25/23(A)(C) | | | 1,256,237 | |
| | 4,235,000 | | | FHLMC Multifamily Structured Pass Through Certificates, Ser K048, Class A2, 3.284%, 6/25/25(A) | | | 4,385,952 | |
| | 34,195,270 | | | FHLMC Multifamily Structured Pass Through Certificates, Ser K710, Class X1, 1.757%, 5/25/19(A)(C) | | | 995,982 | |
| | 3,000,000 | | | FREMF Mortgage Trust, Ser 2012-K19, Class B, 144a, 4.034%, 5/25/45(A) | | | 3,137,599 | |
| | 1,500,000 | | | FREMF Mortgage Trust, Ser 2013-K712, Class C, 144a, 3.365%, 12/25/19(A) | | | 1,502,211 | |
| | 1,900,000 | | | FREMF Mortgage Trust, Ser 2013-K713, Class C, 144a, 3.165%, 4/25/20(A) | | | 1,905,078 | |
| | 1,684,033 | | | GNMA, Ser 2011-83, Class NI, 4.500%, 10/16/37(C) | | | 79,865 | |
| | 16,731,631 | | | GNMA, Ser 2012-27, Class IO, 1.029%, 4/16/53(A)(C) | | | 655,360 | |
| | 30,041,640 | | | GNMA, Ser 2016-110, Class IO, 1.048%, 5/16/58(A)(C) | | | 2,375,906 | |
| | | | | Total Agency Collateralized Mortgage Obligations | | $ | 19,451,204 | |
| | | | | | | | | |
| | | | | Non-Agency Collateralized Mortgage Obligations — 0.9% | | | | |
| | 201,773 | | | Alternative Loan Trust, Ser 2004-30CB, Class 3A1, 5.000%, 2/25/20 | | | 199,957 | |
| | 1,844,221 | | | American Home Mortgage Investment Trust, Ser 2004-4, Class 4A, 3.361%, 2/25/45(A) | | | 1,861,128 | |
| | 118,156 | | | Bear Stearns Asset Backed Securities Trust, Ser 2003-AC7, Class A2, 5.750%, 1/25/34(D) | | | 121,140 | |
| | 1,849,815 | | | GSR Mortgage Loan Trust, Ser 2005-AR4, Class 6A1, 3.217%, 7/25/35(A) | | | 1,820,816 | |
| | 810,237 | | | JP Morgan Mortgage Trust, Ser 2014-2, Class 1A1, 144a, 3.000%, 6/25/29(A) | | | 814,542 | |
| | 6,953 | | | Merrill Lynch Mortgage Investors, Trust, Ser 2003-A1, Class 2A, 3.365%, 12/25/32(A) | | | 6,888 | |
| | 496,263 | | | Morgan Stanley Mortgage Loan Trust, Ser 2004-7AR, Class 2A6, 3.301%, 9/25/34(A) | | | 504,190 | |
| | 225,980 | | | Nomura Asset Acceptance Corp. Alternative Loan Trust, Ser 2005-AR4, Class 1A, 4.169%, 8/25/35(A) | | | 224,516 | |
| | 97,157 | | | RALI Trust, Ser 2004-QS6, Class A1, 5.000%, 5/25/19 | | | 95,889 | |
| | 198,167 | | | Wells Fargo Mortgage Backed Securities Trust, Ser 2004-X, Class 1A5, 3.038%, 11/25/34(A) | | | 200,252 | |
| | | | | Total Non-Agency Collateralized Mortgage Obligations | | $ | 5,849,318 | |
| | | | | | | | | |
| | | | | U.S. Government Mortgage-Backed Obligations — 0.3% | | | | |
| | 54,260 | | | FHLMC, Pool #G03170, 6.500%, 8/1/37 | | | 61,795 | |
| | 78,608 | | | FHLMC, Pool #G12780, 6.500%, 9/1/22 | | | 85,071 | |
| | 101,133 | | | FNMA, Pool #844415, 5.500%, 10/1/35 | | | 113,010 | |
| | 707,054 | | | FNMA, Pool #AB1952, 4.000%, 12/1/40 | | | 749,703 | |
| | 501,505 | | | FNMA, Pool #AB1953, 4.000%, 12/1/40 | | | 530,785 | |
| | 440,463 | | | FNMA, Pool #AB3387, 4.000%, 8/1/41 | | | 463,762 | |
| | 43,150 | | | Freddie Mac Non Gold, Pool #972110, 2.823%, 10/1/32(A) | | | 44,563 | |
| | | | | Total U.S. Government Mortgage-Backed Obligations | | $ | 2,048,689 | |
| | | | | | | | | |
| | | | | Sovereign Government Obligation — 0.3% | | | | |
| | 1,795,000 | | | Svensk Exportkredit AB (Sweden), 1.750%, 5/30/17 | | | 1,797,098 | |
| | | | | | | | | |
| | | | | U.S. Government Agency Obligation — 0.2% | | | | |
| | 1,500,000 | | | FHLMC, 2.375%, 1/13/22 | | | 1,527,120 | |
| | | | | | | | | |
| | Shares | | | | | | | |
| | | | | | | | | |
| | | | | Common Stocks — 6.8% | | | | |
| | | | | | | | | |
| | | | | Real Estate — 3.2% | | | | |
| | 24,194 | | | Boston Properties, Inc. REIT | | | 3,203,528 | |
| | 74,060 | | | Crown Castle International Corp. REIT | | | 6,994,967 | |
| | 32,319 | | | Digital Realty Trust, Inc. REIT | | | 3,438,418 | |
| | 80,248 | | | Kimco Realty Corp., REIT | | | 1,772,678 | |
| | 78,273 | | | Prologis, Inc. REIT | | | 4,060,803 | |
| | 37,418 | | | Ventas, Inc. REIT | | | 2,433,667 | |
| | | | | | | | 21,904,061 | |
| | | | | | | | | |
| | | | | Information Technology — 0.9% | | | | |
| | 12,052 | | | Apple, Inc. | | | 1,731,390 | |
| | 7,716 | | | Broadcom Ltd. (Singapore) | | | 1,689,495 | |
| | 17,268 | | | Texas Instruments, Inc. | | | 1,391,110 | |
| | 15,278 | | | Visa, Inc. - Class A | | | 1,357,756 | |
| | | | | | | | 6,169,751 | |
Touchstone Flexible Income Fund (Continued)
| | | | | | Market | |
| Shares | | | | | Value | |
| | | | | | | |
| | | | | Common Stocks — 6.8% (Continued) | | | | |
| | | | | | | | | |
| | | | | Information Technology — (Continued) | | | | |
| | | | | | | | | |
| | | | | Financials — 0.9% | | | | |
| | 154,269 | | | AGNC Investment Corp. REIT | | $ | 3,068,410 | |
| | 11,987 | | | Ameriprise Financial, Inc. | | | 1,554,474 | |
| | 10,977 | | | CME Group, Inc. | | | 1,304,068 | |
| | | | | | | | 5,926,952 | |
| | | | | | | | | |
| | | | | Consumer Discretionary — 0.7% | | | | |
| | 15,463 | | | Marriott International, Inc. - Class A | | | 1,456,305 | |
| | 14,458 | | | Time Warner, Inc. | | | 1,412,691 | |
| | 19,774 | | | Wyndham Worldwide Corp. | | | 1,666,750 | |
| | | | | | | | 4,535,746 | |
| | | | | | | | | |
| | | | | Industrials — 0.7% | | | | |
| | 8,858 | | | Boeing Co. (The) | | | 1,566,626 | |
| | 7,495 | | | General Dynamics Corp. | | | 1,403,064 | |
| | 9,512 | | | Raytheon Co. | | | 1,450,580 | |
| | | | | | | | 4,420,270 | |
| | | | | | | | | |
| | | | | Health Care — 0.4% | | | | |
| | 21,785 | | | AbbVie, Inc. | | | 1,419,511 | |
| | 8,716 | | | UnitedHealth Group, Inc. | | | 1,429,511 | |
| | | | | | | | 2,849,022 | |
| | | | | Total Common Stocks | | $ | 45,805,802 | |
| | | | | | | | | |
| | | | | Preferred Stocks — 6.4% | | | | |
| | | | | | | | | |
| | | | | Financials — 3.5% | | | | |
| | 89,200 | | | AGNC Investment Corp., Ser B REIT, 7.750%(B) | | | 2,318,308 | |
| | 200,875 | | | Chimera Investment Corp., Ser B, REIT, 8.000%(A)(B)† | | | 5,100,216 | |
| | 75,250 | | | CoBank ACB, Ser H, 6.200%, 12/29/49(A)(B) | | | 7,738,996 | |
| | 144,625 | | | New York Community Bancorp, Inc., 6.375%(A)(B) | | | 3,919,338 | |
| | 45,525 | | | Reinsurance Group of America, Inc., 5.750%, 6/15/56(A) | | | 1,249,206 | |
| | 127,000 | | | WR Berkley Corp., 5.750%, 6/1/56 | | | 3,162,300 | |
| | | | | | | | 23,488,364 | |
| | | | | | | | | |
| | | | | Utilities — 1.5% | | | | |
| | 106,250 | | | Dominion Resources, Inc., 6.375%, 7/1/2017 | | | 5,344,375 | |
| | 171,032 | | | SCE Trust V, Ser K, 5.450%(A)(B) | | | 4,631,547 | |
| | | | | | | | 9,975,922 | |
| | | | | | | | | |
| | | | | Real Estate — 0.5% | | | | |
| | 136,665 | | | PS Business Parks, Inc. REIT, Ser T REIT, 6.000%(B) | | | 3,438,491 | |
| | | | | | | | | |
| | | | | Industrials — 0.5% | | | | |
| | 128,288 | | | Seaspan Corp. (Marshall Island), 6.375%, 4/30/19 | | | 3,220,029 | |
| | | | | | | | | |
| | | | | Consumer Staples — 0.4% | | | | |
| | 104,023 | | | CHS, Inc., Ser 3, 6.750%(A)(B) | | | 2,911,604 | |
| | | | | Total Preferred Stocks | | $ | 43,034,410 | |
| | | | | | | | | |
| | | | | Exchange Traded Funds — 3.3% | | | | |
| | 92,497 | | | iShares China Large-Cap ETF† | | | 3,560,210 | |
| | 79,762 | | | iShares Europe ETF | | | 3,338,040 | |
| | 134,730 | | | iShares MSCI Japan ETF | | | 6,938,595 | |
| | 370,285 | | | VanEck Vectors Gold Miners ETF | | | 8,446,201 | |
| | | | | Total Exchange Traded Funds | | $ | 22,283,046 | |
| Number | | | | | | | |
| of | | | | | | | |
| Contracts | | | | | | | |
| | | | | | | | | |
| Purchased Call Options — 0.0% | | | | |
| | 3,000 | | | VanEck Vectors Goldminers ETF | | | | |
| | | | | June 2017 | | | | |
| | | | | Strike Price $25.00 | | | 213,000 | |
| | | | | Total Purchased Options | | | 213,000 | |
| | | | | | | | | |
| Shares | | | | | | | |
| | | | | | | | |
| | | | | Investment Funds — 0.2% | | | | |
| | 23,600 | | | Eaton Vance Tax-Advantaged Dividend Income Fund± | | | 499,140 | |
| | 135,400 | | | Nuveen Multi-Market Income Fund, Inc.± | | | 1,000,606 | |
| | | | | Total Investment Funds | | $ | 1,499,746 | |
| | | | | | | | | |
| | | | | Short-Term Investment Funds — 2.7% | | | | |
| | 11,144,691 | | | Dreyfus Government Cash Management, Institutional Shares, 0.66%∞Ω | | | 11,144,691 | |
| | 7,135,173 | | | Invesco Government & Agency Portfolio, Institutional Class, 0.61%**∞Ω | | | 7,135,173 | |
| | | | | Total Short-Term Investment Funds | | $ | 18,279,864 | |
| | | | | | | | | |
| Total Long Positions | | | | |
| (Cost $661,038,630) | | $ | 669,825,450 | |
Touchstone Flexible Income Fund (Continued)
| | | Number | | | | |
| | | of | | | Market | |
| | | Contracts | | | Value | |
| | | | | | | |
| Written Options — (0.0%) | | | | | | | | |
| | | | | | | | | |
| Written Call Options — (0.0%) | | | | | | | | |
| VanEck Vectors Goldminers ETF | | | | | | | | |
| June 2017 | | | | | | | | |
| Strike Price $29.00 | | | (3,000 | ) | | $ | (54,000 | ) |
| | | Notional | | | | |
| | | Amount | | | | |
| | | | | | | |
| Written Put Options — (0.0%) | | | | | | |
| NZD Put/USD Call | | | | | | |
| April 2017 | | | | | | |
| Strike Price $0.675 | | $ | 15,000,000 | | | $ | — | |
| | | | | | | | | |
| Total Written Options | | | | | | | | |
| (Premiums received $153,307) | | | | | | $ | (54,000 | ) |
| | | | | | | | | |
| Total —99.5% | | | | | | $ | 669,771,450 | |
| | | | | | | | | |
| Other Assets in Excess of Liabilities — 0.5% | | | | | | | 3,448,871 | |
| | | | | | | | | |
| Net Assets — 100.0% | | | | | | $ | 673,220,321 | |
| (A) | Variable rate security - Rate reflected is the rate in effect as of March 31, 2017. |
| (B) | Perpetual Bond - A Bond with no definite maturity date. |
| (C) | Interest only security. This type of security represents the right to receive the monthly interest payments on an underlying pool of mortgages. Payments of principal on the pool reduce the value of the “interest only” holding. |
| (D) | Step Bond - A bond that pays an initial interest rate for the first period and then a higher interest rate for the following periods until maturity. The interest rate shown reflects the rate in effect as of March 31, 2017. |
| ** | Represents collateral for securities loaned. |
| † | All or a portion of the security is on loan. The total market value of the securities on loan as of March 31, 2017 was $6,935,522. |
| †† | A portion of this security is held as collateral for written options. The total value of the security held as collateral as of March 31, 2017 as $791,248. |
| Ω | Represents the 7-day SEC yield as of March 31, 2017. |
Portfolio Abbreviations:
ETF - Exchange Traded Fund
EUR - Euro
FHLMC - Federal Home Loan Mortgage Corporation
FNMA - Federal National Mortgage Association
FREMF - Finnish Real Estate Management Federation
GNMA - Government National Mortgage Association
LLC - Limited Liability Company
LP - Limited Partnership
MTN - Medium Term Note
NZD - New Zealand Dollar
PLC - Public Limited Company
REIT - Real Estate Investment Trust
REMIC - Real Estate Mortgage Investment Conduit
USD - United States Dollar
144a - This is a restricted security that was sold in a transaction qualifying for the exemption under Rule 144A of the Securities Act of 1933. This security may be sold in transactions exempt from registration, normally to qualified institutional buyers. At March 31, 2017, these securities were valued at $88,525,896 or 13.1% of net assets. These securities were deemed liquid pursuant to procedures approved by the Board of Trustees.
Touchstone Flexible Income Fund (Continued)
Other Information:
The inputs or methodology used for valuing securities may not be an indication of the risk associated with investing in those securities. For more information on valuation inputs, and their aggregation into the levels used in the table below, please refer to the security valuation section in the accompanying Notes to Financial Statements.
| Valuation inputs at Reporting Date: |
| Description | | Level 1 | | | Level 2 | | | Level 3 | | | Total | |
| Assets: | | | | | | | | | | | | | | | | |
| Long Positions | | | | | | | | | | | | | | | | |
| | | | | | | | | | | | | | | | | |
| Corporate Bonds | | $ | — | | | $ | 365,878,566 | | | $ | — | | | $ | 365,878,566 | |
| Asset-Backed Securities | | | — | | | | 84,157,374 | | | | — | | | | 84,157,374 | |
| U.S. Treasury Obligations | | | — | | | | 58,000,213 | | | | — | | | | 58,000,213 | |
| Agency Collateralized Mortgage Obligations | | | — | | | | 19,451,204 | | | | — | | | | 19,451,204 | |
| Non-Agency Collateralized Mortgage Obligations | | | — | | | | 5,849,318 | | | | — | | | | 5,849,318 | |
| U.S. Government Mortgage-Backed Obligations | | | — | | | | 2,048,689 | | | | — | | | | 2,048,689 | |
| Sovereign Government Obligation | | | — | | | | 1,797,098 | | | | — | | | | 1,797,098 | |
| U.S. Government Agency Obligation | | | — | | | | 1,527,120 | | | | — | | | | 1,527,120 | |
| Common Stocks | | | 45,805,802 | | | | — | | | | — | | | | 45,805,802 | |
| Preferred Stocks | | | 43,034,410 | | | | — | | | | — | | | | 43,034,410 | |
| Exchange Traded Funds | | | 22,283,046 | | | | — | | | | — | | | | 22,283,046 | |
| Purchased Options Equity Contracts | | | 213,000 | | | | — | | | | — | | | | 213,000 | |
| Investment Funds | | | 1,499,746 | | | | — | | | | — | | | | 1,499,746 | |
| Short-Term Investment Funds | | | 18,279,864 | | | | — | | | | — | | | | 18,279,864 | |
| Other Financial Instruments*** | | | | | | | | | | | | | | | | |
| Futures Interest Rate Contracts | | | 93,396 | | | | — | | | | — | | | | 93,396 | |
| Futures Equity Contracts | | | 25,704 | | | | — | | | | — | | | | 25,704 | |
| Total Assets | | $ | 131,234,968 | | | $ | 538,709,582 | | | $ | — | | | $ | 669,944,550 | |
| | | | | | | | | | | | | | | | | |
| Liabilities: | | | | | | | | | | | | | | | | |
| Other Financial Instruments*** | | | | | | | | | | | | | | | | |
| Forward Foreign Currency Contracts | | $ | — | | | $ | (93,426 | ) | | $ | — | | | $ | (93,426 | ) |
| Futures Interest Rate Contracts | | | (15,114 | ) | | | — | | | | — | | | | (15,114 | ) |
| Written Options Equity Contracts | | | (54,000 | ) | | | — | | | | — | | | | (54,000 | ) |
| Total Liabilities | | $ | (69,114 | ) | | $ | (93,426 | ) | | $ | — | | | $ | (162,540 | ) |
| Total | | $ | 131,165,854 | | | $ | 538,616,156 | | | $ | — | | | $ | 669,782,010 | |
*** Other Financial Instruments are derivative instruments not reflected in total investments. Amounts shown represent unrealized appreciation (depreciation) on forward foreign currency contracts, futures interest rate contracts and futures equity contracts and market value on written options equity contracts.
Touchstone Flexible Income Fund (Continued)
Transactions in written options for the year ended March 31, 2017.
| | | Number of | | | Notional | | | Premiums | |
| | | Contracts | | | Amount | | | Received | |
| Beginning Balance, March 31, 2016 | | | — | | | $ | — | | | $ | — | |
| Call Options Written | | | 25,220 | | | | 30,000,000 | | | | 889,546 | |
| Put Options Written | | | — | | | | 55,000,000 | | | | 142,323 | |
| Call Options Closed | | | (2,175 | ) | | | — | | | | (160,039 | ) |
| Call Options Expired | | | (20,045 | ) | | | (30,000,000 | ) | | | (630,635 | ) |
| Put Options Expired | | | — | | | | (40,000,000 | ) | | | (87,888 | ) |
| Ending Balance, March 31, 2017 | | | 3,000 | | | $ | 15,000,000 | | | $ | 153,307 | |
Futures Contracts
At March 31, 2017, $2,406,802 was segregated with the broker as collateral for futures contracts. The Fund had the following futures contracts, brokered by Wells Fargo, open at March 31, 2017:
| | | | | | | | | | | Unrealized | |
| | | | | Number of | | | Notional | | | Appreciation/ | |
| Description | | Expiration Date | | Contracts | | | Value | | | (Depreciation) | |
| Short Futures: | | | | | | | | | | | | | | |
| Euro-Bond Futures | | June 2017 | | | 200 | | | $ | 34,534,065 | | | $ | 93,396 | |
| 10-Year JGB Futures | | June 2017 | | | 6 | | | | 8,084,051 | | | | (15,114 | ) |
| | | | | | | | | | | | | $ | 78,282 | |
| Long Futures: | | | | | | | | | | | | | | |
| CBOE Volatility Index Futures | | April 2017 | | | 210 | | | | 2,762,046 | | | | 25,704 | |
| | | | | | | | | | | | | $ | 103,986 | |
Forward Foreign Currency Contracts
| | | | | Contract to | | | Unrealized | |
| Counterparty | | Expiration Date | | Receive | | | Deliver | | | Depreciation | |
| ANZ CAPITAL MARKETS | | 04/21/2017 | | EUR | 6,367,222 | | | USD | 6,887,889 | | | $ | (88,916 | ) |
| ANZ CAPITAL MARKETS | | 04/21/2017 | | USD | 6,794,463 | | | EUR | 6,367,222 | | | | (4,510 | ) |
| | | | | | | | | | | | | $ | (93,426 | ) |
See accompanying Notes to Financial Statements.
Portfolio of Investments
Touchstone Focused Fund – March 31, 2017
| | | | | | Market | |
| | | Shares | | | Value | |
| | | | | | | |
| Common Stocks — 95.4% | | | | | | | | |
| | | | | | | | | |
| Information Technology — 20.9% | | | | | | | | |
| Alphabet, Inc. - Class A* | | | 27,517 | | | $ | 23,328,913 | |
| Alphabet, Inc. - Class C* | | | 40,793 | | | | 33,840,241 | |
| Apple, Inc. | | | 389,406 | | | | 55,942,066 | |
| Avnet, Inc. | | | 586,286 | | | | 26,828,447 | |
| Cisco Systems, Inc. | | | 1,104,317 | | | | 37,325,915 | |
| International Business Machines Corp. | | | 159,441 | | | | 27,765,056 | |
| Microsoft Corp. | | | 656,116 | | | | 43,211,800 | |
| Oracle Corp. | | | 926,051 | | | | 41,311,135 | |
| salesforce.com, Inc.* | | | 270,418 | | | | 22,306,781 | |
| | | | | | | | 311,860,354 | |
| | | | | | | | | |
| Consumer Discretionary — 15.2% | | | | | | | | |
| Amazon.com, Inc.* | | | 71,821 | | | | 63,672,189 | |
| Carnival Corp. (Panama) | | | 459,948 | | | | 27,095,537 | |
| Comcast Corp. - Class A | | | 857,034 | | | | 32,215,908 | |
| Priceline Group, Inc. (The)* | | | 18,706 | | | | 33,296,119 | |
| Twenty-First Century Fox, Inc. - Class A | | | 1,113,372 | | | | 36,062,119 | |
| Vista Outdoor, Inc.* | | | 735,866 | | | | 15,151,481 | |
| Yum China Holdings, Inc.* | | | 702,964 | | | | 19,120,621 | |
| | | | | | | | 226,613,974 | |
| | | | | | | | | |
| Health Care — 15.0% | | | | | | | | |
| Abbott Laboratories | | | 652,519 | | | | 28,978,369 | |
| Biogen, Inc.* | | | 115,238 | | | | 31,508,374 | |
| Bio-Rad Laboratories, Inc. - Class A* | | | 209,455 | | | | 41,752,760 | |
| Bristol-Myers Squibb Co. | | | 746,220 | | | | 40,579,444 | |
| Johnson & Johnson | | | 287,430 | | | | 35,799,406 | |
| Novartis AG ADR | | | 614,397 | | | | 45,631,265 | |
| | | | | | | | 224,249,618 | |
| | | | | | | | | |
| Financials — 14.4% | | | | | | | | |
| Bank of America Corp. | | | 1,152,484 | | | | 27,187,098 | |
| Bank of New York Mellon Corp. (The) | | | 1,159,232 | | | | 54,750,527 | |
| Berkshire Hathaway, Inc. - Class B* | | | 612,579 | | | | 102,104,668 | |
| Goldman Sachs Group, Inc. (The) | | | 135,429 | | | | 31,110,750 | |
| | | | | | | | 215,153,043 | |
| | | | | | | | | |
| Industrials — 10.6% | | | | | | | | |
| General Electric Co. | | | 1,554,643 | | | | 46,328,361 | |
| Johnson Controls International PLC | | | 537,800 | | | | 22,652,136 | |
| Stericycle, Inc.* | | | 335,421 | | | | 27,803,047 | |
| Union Pacific Corp. | | | 283,486 | | | | 30,026,837 | |
| United Technologies Corp. | | | 286,000 | | | | 32,092,060 | |
| | | | | | | | 158,902,441 | |
| | | | | | | | | |
| Consumer Staples — 6.3% | | | | | | | | |
| JM Smucker Co. (The) | | | 183,626 | | | | 24,069,696 | |
| Mondelez International, Inc. - Class A | | | 994,317 | | | | 42,835,176 | |
| Unilever NV (Netherlands)† | | | 556,600 | | | | 27,651,888 | |
| | | | | | | | 94,556,760 | |
| | | | | | | | | |
| Energy — 4.7% | | | | | | | | |
| Exxon Mobil Corp. | | | 262,945 | | | | 21,564,119 | |
| Halliburton Co. | | | 543,327 | | | | 26,737,122 | |
| Schlumberger Ltd. (Curacao) | | | 291,408 | | | | 22,758,965 | |
| | | | | | | | 71,060,206 | |
| | | | | | | | | |
| Real Estate — 4.0% | | | | | | | | |
| Jones Lang LaSalle, Inc. | | | 212,272 | | | | 23,657,714 | |
| Simon Property Group, Inc. REIT | | | 210,082 | | | | 36,140,406 | |
| | | | | | | | 59,798,120 | |
| | | | | | | | | |
| Telecommunication Services — 2.4% | | | | | | | | |
| AT&T, Inc. | | | 863,362 | | | | 35,872,691 | |
| | | | | | | | | |
| Materials — 1.9% | | | | | | | | |
| Agrium, Inc. (Canada) | | | 296,726 | | | | 28,352,169 | |
| Total Common Stocks | | | | | | $ | 1,426,419,376 | |
| | | | | | | | | |
| Short-Term Investment Funds — 4.2% | | | | | | | | |
| Dreyfus Government Cash | | | | | | | | |
| Management, Institutional Shares, 0.66%∞Ω | | | 63,062,535 | | | | 63,062,535 | |
| Invesco Government & Agency | | | | | | | | |
| Portfolio, Institutional Class, 0.61%**∞Ω | | | 264,222 | | | | 264,222 | |
| Total Short-Term Investment Funds | | | | | | $ | 63,326,757 | |
| | | | | | | | | |
| Total Investment Securities —99.6% | | | | | | | | |
| (Cost $1,181,368,111) | | | | | | $ | 1,489,746,133 | |
| | | | | | | | | |
| Other Assets in Excess of Liabilities — 0.4% | | | | | | | 5,443,686 | |
| | | | | | | | | |
| Net Assets — 100.0% | | | | | | $ | 1,495,189,819 | |
| * | Non-income producing security. |
| ** | Represents collateral for securities loaned. |
| † | All or a portion of the security is on loan. The total market value of the securities on loan as of March 31, 2017 was $257,889. |
| Ω | Represents the 7-day SEC yield as of March 31, 2017. |
Portfolio Abbreviations:
ADR - American Depositary Receipt
REIT - Real Estate Investment Trust
PLC - Public Limited Company
Touchstone Focused Fund (Continued)
Other Information:
The inputs or methodology used for valuing securities may not be an indication of the risk associated with investing in those securities. For more information on valuation inputs, and their aggregation into the levels used in the table below, please refer to the security valuation section in the accompanying Notes to Financial Statements.
| | | Valuation inputs at Reporting Date: | | | | |
| Description | | Level 1 | | | Level 2 | | | Level 3 | | | Total | |
| Common Stocks | | $ | 1,426,419,376 | | | $ | — | | | $ | — | | | $ | 1,426,419,376 | |
| Short-Term | | | | | | | | | | | | | | | | |
| Investment | | | | | | | | | | | | | | | | |
| Funds | | | 63,326,757 | | | | — | | | | — | | | | 63,326,757 | |
| Total | | $ | 1,489,746,133 | | | $ | — | | | $ | — | | | $ | 1,489,746,133 | |
See accompanying Notes to Financial Statements.
Portfolio of Investments
Touchstone Growth Opportunities Fund – March 31, 2017
| | | | | | Market | |
| | | Shares | | | Value | |
| | | | | | | |
| Common Stocks — 97.0% | | | | | | | | |
| | | | | | | | | |
| Information Technology — 32.6% | | | | | | | | |
| Adobe Systems, Inc.* | | | 20,150 | | | $ | 2,622,120 | |
| Alliance Data Systems Corp. | | | 12,955 | | | | 3,225,795 | |
| Alphabet, Inc. - Class A* | | | 8,344 | | | | 7,074,043 | |
| Alphabet, Inc. - Class C* | | | 8,400 | | | | 6,968,304 | |
| Apple, Inc. | | | 89,940 | | | | 12,920,780 | |
| Applied Materials, Inc. | | | 51,900 | | | | 2,018,910 | |
| Cavium, Inc.* | | | 43,360 | | | | 3,107,178 | |
| Facebook, Inc. - Class A* | | | 51,780 | | | | 7,355,349 | |
| Lumentum Holdings, Inc.* | | | 44,150 | | | | 2,355,403 | |
| Microsoft Corp. | | | 122,690 | | | | 8,080,363 | |
| PayPal Holdings, Inc.* | | | 80,980 | | | | 3,483,760 | |
| Red Hat, Inc.* | | | 43,920 | | | | 3,799,080 | |
| salesforce.com, Inc.* | | | 62,330 | | | | 5,141,602 | |
| ServiceNow, Inc.* | | | 30,060 | | | | 2,629,348 | |
| Vantiv, Inc. - Class A* | | | 40,840 | | | | 2,618,661 | |
| Visa, Inc. - Class A | | | 70,590 | | | | 6,273,333 | |
| | | | | | | | 79,674,029 | |
| | | | | | | | | |
| Consumer Discretionary — 19.7% | | | | | | | | |
| Amazon.com, Inc.* | | | 8,771 | | | | 7,775,842 | |
| Charter Communications, Inc. - Class A* | | | 15,670 | | | | 5,129,104 | |
| Delphi Automotive PLC (United | | | | | | | | |
| Kingdom) | | | 39,270 | | | | 3,160,842 | |
| Installed Building Products, Inc.* | | | 69,727 | | | | 3,678,099 | |
| Lions Gate Entertainment Corp. - Class B | | | | | | | | |
| (Canada)* | | | 88,300 | | | | 2,152,754 | |
| Marriott International, Inc. - Class A | | | 38,880 | | | | 3,661,718 | |
| McDonald's Corp. | | | 27,910 | | | | 3,617,415 | |
| Newell Brands, Inc. | | | 106,090 | | | | 5,004,265 | |
| NIKE, Inc. - Class B | | | 41,550 | | | | 2,315,582 | |
| Twenty-First Century Fox, Inc. - Class A | | | 75,260 | | | | 2,437,671 | |
| Vail Resorts, Inc. | | | 16,530 | | | | 3,172,107 | |
| Walt Disney Co. (The) | | | 53,945 | | | | 6,116,824 | |
| | | | | | | | 48,222,223 | |
| | | | | | | | | |
| Health Care — 19.1% | | | | | | | | |
| Abbott Laboratories | | | 106,480 | | | | 4,728,777 | |
| Biogen, Inc.* | | | 15,057 | | | | 4,116,885 | |
| Bioverativ, Inc.* | | | 24,360 | | | | 1,326,646 | |
| Bristol-Myers Squibb Co. | | | 46,270 | | | | 2,516,163 | |
| Celgene Corp.* | | | 57,250 | | | | 7,123,618 | |
| Danaher Corp. | | | 41,870 | | | | 3,581,141 | |
| Hill-Rom Holdings, Inc. | | | 62,410 | | | | 4,406,146 | |
| Jazz Pharmaceuticals PLC (Ireland) | | | 23,960 | | | | 3,477,315 | |
| Mettler-Toledo International, Inc.* | | | 8,436 | | | | 4,040,085 | |
| Nektar Therapeutics* | | | 105,381 | | | | 2,473,292 | |
| Pacira Pharmaceuticals, Inc.* | | | 27,690 | | | | 1,262,664 | |
| STERIS PLC (United Kingdom) | | | 67,210 | | | | 4,668,407 | |
| Vertex Pharmaceuticals, Inc.* | | | 26,550 | | | | 2,903,242 | |
| | | | | | | | 46,624,381 | |
| | | | | | | | | |
| Industrials — 10.8% | | | | | | | | |
| AMETEK, Inc. | | | 78,930 | | | | 4,268,534 | |
| General Electric Co. | | | 97,670 | | | | 2,910,566 | |
| HD Supply Holdings, Inc.* | | | 74,210 | | | | 3,051,886 | |
| Ryder System, Inc. | | | 38,558 | | | | 2,908,816 | |
| TransDigm Group, Inc. | | | 11,574 | | | | 2,548,132 | |
| United Continental Holdings, Inc.* | | | 36,176 | | | | 2,555,473 | |
| United Parcel Service, Inc. - Class B | | | 45,900 | | | | 4,925,070 | |
| Wolseley PLC ADR | | | 500,030 | | | | 3,170,190 | |
| | | | | | | | 26,338,667 | |
| | | | | | | | | |
| Financials — 5.1% | | | | | | | | |
| Charles Schwab Corp. (The) | | | 101,520 | | | | 4,143,031 | |
| CME Group, Inc. | | | 28,055 | | | | 3,332,934 | |
| East West Bancorp, Inc. | | | 44,152 | | | | 2,278,685 | |
| S&P Global, Inc. | | | 20,150 | | | | 2,634,411 | |
| | | | | | | | 12,389,061 | |
| | | | | | | | | |
| Materials — 3.7% | | | | | | | | |
| Berry Plastics Group, Inc.* | | | 74,360 | | | | 3,611,665 | |
| Dow Chemical Co. (The) | | | 87,380 | | | | 5,552,125 | |
| | | | | | | | 9,163,790 | |
| | | | | | | | | |
| Consumer Staples — 2.8% | | | | | | | | |
| Constellation Brands, Inc. - Class A | | | 22,460 | | | | 3,640,092 | |
| Kellogg Co. | | �� | 45,410 | | | | 3,297,220 | |
| | | | | | | | 6,937,312 | |
| | | | | | | | | |
| Energy — 1.9% | | | | | | | | |
| Baker Hughes, Inc. | | | 39,820 | | | | 2,382,032 | |
| Tesoro Corp. | | | 29,590 | | | | 2,398,565 | |
| | | | | | | | 4,780,597 | |
| | | | | | | | | |
| Real Estate — 1.3% | | | | | | | | |
| STAG Industrial, Inc. REIT | | | 123,480 | | | | 3,089,470 | |
| Total Common Stocks | | | | | | $ | 237,219,530 | |
| | | | | | | | | |
| Short-Term Investment Fund — 2.4% | | | | | | | | |
| Dreyfus Government Cash | | | | | | | | |
| Management, Institutional Shares, 0.66%∞Ω | | | 5,935,898 | | | | 5,935,898 | |
| | | | | | | | | |
| Total Investment Securities —99.4% | | | | | | | | |
| (Cost $198,533,436) | | | | | | $ | 243,155,428 | |
| | | | | | | | | |
| Other Assets in Excess of Liabilities — 0.6% | | | | | | | 1,430,926 | |
| | | | | | | | | |
| Net Assets — 100.0% | | | | | | $ | 244,586,354 | |
| * | Non-income producing security. |
| Ω | Represents the 7-day SEC yield as of March 31, 2017. |
Touchstone Growth Opportunities Fund (Continued)
Portfolio Abbreviations:
ADR - American Depositary Receipt
PLC - Public Limited Company
REIT - Real Estate Investment Trust
Other Information:
The inputs or methodology used for valuing securities may not be an indication of the risk associated with investing in those securities. For more information on valuation inputs, and their aggregation into the levels used in the table below, please refer to the security valuation section in the accompanying Notes to Financial Statements.
| Valuation inputs at Reporting Date: |
| Description | | Level 1 | | | Level 2 | | | Level 3 | | | Total | |
| Common Stocks | | $ | 237,219,530 | | | $ | — | | | $ | — | | | $ | 237,219,530 | |
| Short-Term | | | | | | | | | | | | | | | | |
| Investment Fund | | | 5,935,898 | | | | — | | | | — | | | | 5,935,898 | |
| Total | | $ | 243,155,428 | | | $ | — | | | $ | — | | | $ | 243,155,428 | |
See accompanying Notes to Financial Statements.
Portfolio of Investments
Touchstone International Growth Fund – March 31, 2017
| | | | | | Market | |
| | | Shares | | | Value | |
| | | | | | | |
| Common Stocks — 94.7% | | | | | | | | |
| | | | | | | | | |
| Germany — 11.4% | | | | | | | | |
| | | | | | | | | |
| Consumer Discretionary — 1.4% | | | | | | | | |
| Continental AG ADR | | | 3,702 | | | $ | 162,925 | |
| | | | | | | | | |
| Consumer Staples — 1.6% | | | | | | | | |
| Henkel AG & Co. KGaA ADR | | | 1,728 | | | | 192,707 | |
| | | | | | | | | |
| Financials — 2.0% | | | | | | | | |
| Allianz SE ADR | | | 12,933 | | | | 239,648 | |
| | | | | | | | | |
| Industrials — 3.1% | | | | | | | | |
| HOCHTIEF AG ADR | | | 5,421 | | | | 179,681 | |
| Siemens AG ADR | | | 2,764 | | | | 189,334 | |
| | | | | | | | | |
| Information Technology — 1.5% | | | | | | | | |
| SAP SE ADR | | | 1,876 | | | | 184,167 | |
| | | | | | | | | |
| Materials — 1.8% | | | | | | | | |
| BASF SE ADR | | | 2,172 | | | | 215,408 | |
| Total Germany | | | | | | | 1,363,870 | |
| | | | | | | | | |
| France — 10.2% | | | | | | | | |
| | | | | | | | | |
| Consumer Discretionary — 1.8% | | | | | | | | |
| LVMH Moet Hennessy Louis Vuitton SE ADR | | | 4,768 | | | | 209,601 | |
| | | | | | | | | |
| Consumer Staples — 3.1% | | | | | | | | |
| L'Oreal SA ADR | | | 4,936 | | | | 189,888 | |
| Remy Cointreau SA ADR | | | 18,430 | | | | 180,896 | |
| | | | | | | | | |
| Health Care — 2.0% | | | | | | | | |
| Cellectis SA ADR*† | | | 2,871 | | | | 68,904 | |
| Essilor International SA ADR | | | 2,834 | | | | 172,505 | |
| | | | | | | | | |
| Information Technology — 3.3% | | | | | | | | |
| Criteo SA ADR* | | | 2,931 | | | | 146,521 | |
| Dassault Systemes ADR | | | 2,814 | | | | 244,044 | |
| Total France | | | | | | | 1,212,359 | |
| | | | | | | | | |
| Japan — 9.1% | | | | | | | | |
| | | | | | | | | |
| Consumer Discretionary — 5.9% | | | | | | | | |
| Fuji Heavy Industries Ltd. ADR | | | 13,122 | | | | 241,051 | |
| Sony Corp. ADR | | | 9,329 | | | | 314,667 | |
| Toyota Motor Corp. ADR | | | 1,382 | | | | 150,113 | |
| | | | | | | | | |
| Industrials — 2.0% | | | | | | | | |
| Kubota Corp. ADR | | | 3,110 | | | | 234,338 | |
| | | | | | | | | |
| Telecommunication Services — 1.2% | | | | | | | | |
| NTT DOCOMO, Inc. ADR | | | 6,417 | | | | 149,837 | |
| Total Japan | | | | | | | 1,090,006 | |
| | | | | | | | | |
| Cayman Islands — 8.7% | | | | | | | | |
| | | | | | | | | |
| Consumer Discretionary — 2.9% | | | | | | | | |
| JD.com, Inc. ADR* | | | 3,801 | | | | 118,249 | |
| Sands China Ltd. ADR | | | 3,342 | | | | 156,773 | |
| Vipshop Holdings Ltd. ADR* | | | 5,665 | | | | 75,571 | |
| | | | | | | | | |
| Information Technology — 5.8% | | | | | | | | |
| Alibaba Group Holding Ltd. ADR* | | | 1,431 | | | | 154,305 | |
| NetEase, Inc. ADR | | | 590 | | | | 167,560 | |
| Tencent Holdings Ltd. ADR | | | 6,342 | | | | 183,030 | |
| Weibo Corp. ADR* | | | 3,520 | | | | 183,674 | |
| Total Cayman Islands | | | | | | | 1,039,162 | |
| | | | | | | | | |
| Netherlands — 8.7% | | | | | | | | |
| | | | | | | | | |
| Consumer Staples — 2.5% | | | | | | | | |
| Heineken NV ADR | | | 2,666 | | | | 113,172 | |
| Unilever NV | | | 3,751 | | | | 186,350 | |
| | | | | | | | | |
| Energy — 1.1% | | | | | | | | |
| Core Laboratories NV | | | 1,086 | | | | 125,455 | |
| | | | | | | | | |
| Financials — 1.0% | | | | | | | | |
| ING Groep NV ADR | | | 7,979 | | | | 120,403 | |
| | | | | | | | | |
| Information Technology — 2.2% | | | | | | | | |
| NXP Semiconductors NV* | | | 2,481 | | | | 256,784 | |
| | | | | | | | | |
| Materials — 1.9% | | | | | | | | |
| LyondellBasell Industries NV - Class A | | | 2,517 | | | | 229,525 | |
| Total Netherlands | | | | | | | 1,031,689 | |
| | | | | | | | | |
| Singapore — 7.1% | | | | | | | | |
| | | | | | | | | |
| Financials — 1.3% | | | | | | | | |
| United Overseas Bank Ltd. ADR | | | 5,035 | | | | 159,509 | |
| | | | | | | | | |
| Information Technology — 5.8% | | | | | �� | | | |
| Broadcom Ltd. | | | 3,159 | | | | 691,695 | |
| Total Singapore | | | | | | | 851,204 | |
| | | | | | | | | |
| Switzerland — 5.5% | | | | | | | | |
| | | | | | | | | |
| Consumer Staples — 2.3% | | | | | | | | |
| Nestle SA ADR | | | 3,505 | | | | 269,534 | |
| | | | | | | | | |
| Health Care — 3.2% | | | | | | | | |
| Novartis AG ADR | | | 2,369 | | | | 175,946 | |
| Roche Holding AG ADR | | | 6,368 | | | | 203,967 | |
| Total Switzerland | | | | | | | 649,447 | |
| | | | | | | | | |
| Canada — 5.4% | | | | | | | | |
| | | | | | | | | |
| Energy — 0.9% | | | | | | | | |
| Suncor Energy, Inc. | | | 3,298 | | | | 101,414 | |
| | | | | | | | | |
| Financials — 2.4% | | | | | | | | |
| Brookfield Asset Management, Inc. - Class A | | | 7,781 | | | | 283,695 | |
| | | | | | | | | |
| Industrials — 2.1% | | | | | | | | |
| Canadian National Railway Co. | | | 3,455 | | | | 255,428 | |
| Total Canada | | | | | | | 640,537 | |
Touchstone International Growth Fund (Continued)
| | | | | | Market | |
| | | Shares | | | Value | |
| | | | | | | |
| Common Stocks — 94.7% (Continued) | | | | | | | | |
| | | | | | | | | |
| United Kingdom — 4.9% | | | | | | | | |
| | | | | | | | | |
| Consumer Staples — 1.8% | | | | | | | | |
| British American Tobacco PLC ADR† | | | 3,159 | | | $ | 209,505 | |
| | | | | | | | | |
| Financials — 3.1% | | | | | | | | |
| Prudential PLC ADR† | | | 8,885 | | | | 376,369 | |
| Total United Kingdom | | | | | | | 585,874 | |
| | | | | | | | | |
| United States — 3.5% | | | | | | | | |
| | | | | | | | | |
| Consumer Discretionary — 2.6% | | | | | | | | |
| Carnival PLC ADR† | | | 3,208 | | | | 185,711 | |
| Samsonite International SA ADR | | | 6,732 | | | | 122,051 | |
| | | | | | | | | |
| Health Care — 0.9% | | | | | | | | |
| Medtronic PLC | | | 1,333 | | | | 107,386 | |
| Total United States | | | | | | | 415,148 | |
| | | | | | | | | |
| Sweden — 3.5% | | | | | | | | |
| | | | | | | | | |
| Financials — 1.9% | | | | | | | | |
| Swedbank AB ADR | | | 9,379 | | | | 217,780 | |
| | | | | | | | | |
| Industrials — 1.6% | | | | | | | | |
| Atlas Copco AB ADR - Class A | | | 5,430 | | | | 193,091 | |
| Total Sweden | | | | | | | 410,871 | |
| | | | | | | | | |
| India — 2.9% | | | | | | | | |
| | | | | | | | | |
| Financials — 2.0% | | | | | | | | |
| HDFC Bank Ltd. ADR | | | 3,159 | | | | 237,620 | |
| | | | | | | | | |
| Information Technology — 0.9% | | | | | | | | |
| WNS Holdings Ltd. ADR* | | | 3,653 | | | | 104,512 | |
| Total India | | | | | | | 342,132 | |
| | | | | | | | | |
| Denmark — 2.8% | | | | | | | | |
| | | | | | | | | |
| Financials — 1.6% | | | | | | | | |
| Danske Bank A/S ADR | | | 10,909 | | | | 186,871 | |
| | | | | | | | | |
| Health Care — 1.2% | | | | | | | | |
| Novo Nordisk A/S ADR | | | 4,393 | | | | 150,592 | |
| Total Denmark | | | | | | | 337,463 | |
| | | | | | | | | |
| Taiwan — 1.7% | | | | | | | | |
| | | | | | | | | |
| Information Technology — 1.7% | | | | | | | | |
| Taiwan Semiconductor | | | | | | | | |
| Manufacturing Co. Ltd. ADR | | | 6,220 | | | | 204,265 | |
| | | | | | | | | |
| Panama — 1.6% | | | | | | | | |
| | | | | | | | | |
| Industrials — 1.6% | | | | | | | | |
| Copa Holdings SA - Class A | | | 1,645 | | | | 184,651 | |
| | | | | | | | | |
| Ireland — 1.5% | | | | | | | | |
| | | | | | | | | |
| Industrials — 1.5% | | | | | | | | |
| Kingspan Group PLC ADR | | | 5,503 | | | | 179,948 | |
| | | | | | | | | |
| Spain — 1.4% | | | | | | | | |
| | | | | | | | | |
| Health Care — 1.4% | | | | | | | | |
| Grifols SA ADR | | | 8,786 | | | | 165,836 | |
| | | | | | | | | |
| Brazil — 1.2% | | | | | | | | |
| | | | | | | | | |
| Financials — 1.2% | | | | | | | | |
| Itau Unibanco Holding SA ADR | | | 12,236 | | | | 147,689 | |
| | | | | | | | | |
| Philippines — 1.2% | | | | | | | | |
| | | | | | | | | |
| Financials — 1.2% | | | | | | | | |
| BDO Unibank, Inc. ADR | | | 6,068 | | | | 145,632 | |
| | | | | | | | | |
| China — 1.2% | | | | | | | | |
| | | | | | | | | |
| Energy — 1.2% | | | | | | | | |
| CNOOC Ltd. ADR | | | 1,185 | | | | 141,963 | |
| | | | | | | | | |
| Belgium — 0.6% | | | | | | | | |
| | | | | | | | | |
| Health Care — 0.6% | | | | | | | | |
| Galapagos NV ADR* | | | 889 | | | | 76,623 | |
| | | | | | | | | |
| Israel — 0.6% | | | | | | | | |
| | | | | | | | | |
| Health Care — 0.6% | | | | | | | | |
| Taro Pharmaceuticals Industries Ltd.*† | | | 629 | | | | 73,354 | |
| Total Common Stocks | | | | | | $ | 11,289,723 | |
| | | | | | | | | |
| Short-Term Investment Funds — 10.6% | | | | | | | | |
| Dreyfus Government Cash Management, Institutional Shares, 0.66%∞Ω | | | 661,549 | | | | 661,549 | |
| Invesco Government & Agency Portfolio, Institutional Class, 0.61%**∞Ω | | | 600,444 | | | | 600,444 | |
| Total Short-Term Investment Funds | | | | | | $ | 1,261,993 | |
| | | | | | | | | |
| Total Investment Securities —105.3% | | | | | | | | |
| (Cost $11,710,129) | | | | | | | 12,551,716 | |
| | | | | | | | | |
| Liabilities in Excess of Other Assets — (5.3%) | | | | | | | (632,192 | ) |
| | | | | | | | | |
| Net Assets — 100.0% | | | | | | $ | 11,919,524 | |
| * | Non-income producing security. |
| ** | Represents collateral for securities loaned. |
| † | All or a portion of the security is on loan. The total market value of the securities on loan as of March 31, 2017 was $586,457. |
| Ω | Represents the 7-day SEC yield as of March 31, 2017. |
Touchstone International Growth Fund (Continued)
Portfolio Abbreviations:
ADR - American Depositary Receipt
PLC - Public Limited Company
Other Information:
The inputs or methodology used for valuing securities may not be an indication of the risk associated with investing in those securities. For more information on valuation inputs, and their aggregation into the levels used in the table below, please refer to the security valuation section in the accompanying Notes to Financial Statements.
| Valuation inputs at Reporting Date: |
| Description | | Level 1 | | | Level 2 | | | Level 3 | | | Total | |
| Common Stocks | | $ | 11,289,723 | | | $ | — | | | $ | — | | | $ | 11,289,723 | |
| Short-Term Investment Funds | | $ | 1,261,993 | | | $ | — | | | $ | — | | | $ | 1,261,993 | |
| Total | | $ | 12,551,716 | | | $ | — | | | $ | — | | | $ | 12,551,716 | |
See accompanying Notes to Financial Statements.
Portfolio of Investments
Touchstone International Value Fund – March 31, 2017
| | | | | | Market | |
| | | Shares | | | Value | |
| | | | | | | |
| Common Stocks — 98.5% | | | | | | | | |
| | | | | | | | | |
| United Kingdom — 18.0% | | | | | | | | |
| | | | | | | | | |
| Consumer Staples — 4.5% | | | | | | | | |
| Dairy Crest Group PLC | | | 51,247 | | | $ | 355,387 | |
| Imperial Brands PLC | | | 13,249 | | | | 642,094 | |
| | | | | | | | | |
| Energy — 5.1% | | | | | | | | |
| BP PLC | | | 67,090 | | | | 386,177 | |
| BP PLC ADR | | | 7,090 | | | | 244,747 | |
| TechnipFMC PLC* | | | 15,060 | | | | 491,461 | |
| | | | | | | | | |
| Health Care — 2.6% | | | | | | | | |
| GlaxoSmitKline PLC | | | 27,890 | | | | 579,914 | |
| | | | | | | | | |
| Industrials — 1.2% | | | | | | | | |
| Babcock International Group PLC | | | 2,900 | | | | 32,047 | |
| Rolls-Royce Holdings PLC | | | 23,760 | | | | 224,462 | |
| | | | | | | | | |
| Materials — 3.4% | | | | | | | | |
| DS Smith PLC | | | 138,888 | | | | 755,618 | |
| | | | | | | | | |
| Utilities — 1.2% | | | | | | | | |
| National Grid PLC | | | 20,505 | | | | 260,152 | |
| Total United Kingdom | | | | | | | 3,972,059 | |
| | | | | | | | | |
| Netherlands — 15.1% | | | | | | | | |
| | | | | | | | | |
| Consumer Discretionary — 3.3% | | | | | | | | |
| Fiat Chrysler Automobiles NV* | | | 66,700 | | | | 728,721 | |
| | | | | | | | | |
| Financials — 4.0% | | | | | | | | |
| Aegon NV | | | 80,300 | | | | 409,037 | |
| ING Groep N.V. | | | 30,873 | | | | 466,315 | |
| | | | | | | | | |
| Industrials — 7.8% | | | | | | | | |
| Airbus Group SE | | | 8,740 | | | | 666,530 | |
| CNH Industrial NV | | | 41,740 | | | | 401,752 | |
| CNH Industrial NV | | | 12,330 | | | | 118,861 | |
| Koninklijke Philips NV | | | 17,000 | | | | 546,114 | |
| Total Netherlands | | | | | | | 3,337,330 | |
| | | | | | | | | |
| Japan — 13.5% | | | | | | | | |
| | | | | | | | | |
| Health Care — 1.5% | | | | | | | | |
| Astellas Pharma, Inc. | | | 25,800 | | | | 340,274 | |
| | | | | | | | | |
| Industrials — 7.4% | | | | | | | | |
| Fuji Electric Co. Ltd. | | | 118,490 | | | | 705,622 | |
| IHI Corp.* | | | 141,160 | | | | 446,516 | |
| Sumitomo Corp. | | | 35,730 | | | | 482,028 | |
| | | | | | | | | |
| Information Technology — 3.3% | | | | | | | | |
| Hitachi Ltd. | | | 75,720 | | | | 411,141 | |
| Trend Micro, Inc. | | | 7,190 | | | | 320,030 | |
| | | | | | | | | |
| Materials — 1.3% | | | | | | | | |
| Sumitomo Osaka Cement Co. Ltd. | | | 67,010 | | | | 279,448 | |
| Total Japan | | | | | | | 2,985,059 | |
| | | | | | | | | |
| Germany — 9.1% | | | | | | | | |
| | | | | | | | | |
| Consumer Discretionary — 0.1% | | | | | | | | |
| HUGO BOSS AG | | | 300 | | | | 21,877 | |
| | | | | | | | | |
| Financials — 4.0% | | | | | | | | |
| Deutsche Boerse AG* | | | 4,476 | | | | 410,221 | |
| Muenchener Rueckversicherungs- Gesellschaft AG in Muenchen | | | 2,400 | | | | 469,807 | |
| | | | | | | | | |
| Health Care — 3.0% | | | | | | | | |
| Bayer AG | | | 5,730 | | | | 660,175 | |
| | | | | | | | | |
| Materials — 2.0% | | | | | | | | |
| Linde AG | | | 2,700 | | | | 449,878 | |
| Total Germany | | | | | | | 2,011,958 | |
| | | | | | | | | |
| France — 7.8% | | | | | | | | |
| | | | | | | | | |
| Consumer Staples — 0.3% | | | | | | | | |
| Casino Guichard Perrachon SA | | | 1,187 | | | | 66,322 | |
| | | | | | | | | |
| Health Care — 3.2% | | | | | | | | |
| Sanofi | | | 7,695 | | | | 695,594 | |
| | | | | | | | | |
| Industrials — 2.6% | | | | | | | | |
| Cie de Saint-Gobain | | | 11,360 | | | | 582,847 | |
| | | | | | | | | |
| Materials — 1.7% | | | | | | | | |
| Air Liquide SA | | | 3,240 | | | | 369,940 | |
| Total France | | | | | | | 1,714,703 | |
| | | | | | | | | |
| Switzerland — 5.1% | | | | | | | | |
| | | | | | | | | |
| Financials — 3.7% | | | | | | | | |
| Credit Suisse Group AG* | | | 31,496 | | | | 468,617 | |
| Swiss Life Holding AG* | | | 1,070 | | | | 345,035 | |
| | | | | | | | | |
| Health Care — 1.4% | | | | | | | | |
| Novartis AG | | | 4,319 | | | | 320,718 | |
| Total Switzerland | | | | | | | 1,134,370 | |
| | | | | | | | | |
| Italy — 4.0% | | | | | | | | |
| | | | | | | | | |
| Energy — 2.2% | | | | | | | | |
| Eni SpA | | | 29,601 | | | | 484,667 | |
| | | | | | | | | |
| Utilities — 1.8% | | | | | | | | |
| Enel SpA | | | 85,700 | | | | 403,260 | |
| Total Italy | | | | | | | 887,927 | |
| | | | | | | | | |
| Singapore — 3.8% | | | | | | | | |
| | | | | | | | | |
| Consumer Discretionary — 1.5% | | | | | | | | |
| Jardine Cycle & Carriage Ltd. | | | 10,670 | | | | 334,205 | |
| | | | | | | | | |
| Financials — 2.3% | | | | | | | | |
| United Overseas Bank Ltd. | | | 32,270 | | | | 509,714 | |
| Total Singapore | | | | | | | 843,919 | |
Touchstone International Value Fund (Continued)
| | | | | | Market | |
| | | Shares | | | Value | |
| | | | | | | |
| Common Stocks — 98.5% (Continued) | | | | | | | | |
| | | | | | | | | |
| Ireland — 3.5% | | | | | | | | |
| | | | | | | | | |
| Materials — 3.5% | | | | | | | | |
| CRH PLC | | | 22,030 | | | $ | 775,877 | |
| | | | | | | | | |
| South Korea — 3.4% | | | | | | | | |
| | | | | | | | | |
| Consumer Discretionary — 1.4% | | | | | | | | |
| Hankook Tire Co. Ltd. | | | 6,120 | | | | 298,256 | |
| | | | | | | | | |
| Financials — 2.0% | | | | | | | | |
| Shinhan Financial Group Co. Ltd. | | | 10,630 | | | | 442,921 | |
| Total South Korea | | | | | | | 741,177 | |
| | | | | | | | | |
| Austria — 2.6% | | | | | | | | |
| | | | | | | | | |
| Financials — 2.6% | | | | | | | | |
| Erste Group Bank AG | | | 17,590 | | | | 572,765 | |
| | | | | | | | | |
| United States — 2.5% | | | | | | | | |
| | | | | | | | | |
| Consumer Staples — 2.5% | | | | | | | | |
| Coca-Cola European Partners PLC | | | 14,800 | | | | 557,812 | |
| | | | | | | | | |
| Australia — 2.2% | | | | | | | | |
| | | | | | | | | |
| Financials — 2.2% | | | | | | | | |
| QBE Insurance Group Ltd. | | | 50,100 | | | | 493,226 | |
| | | | | | | | | |
| Spain — 1.9% | | | | | | | | |
| | | | | | | | | |
| Financials — 1.9% | | | | | | | | |
| Banco de Sabadell SA | | | 224,503 | | | | 411,351 | |
| | | | | | | | | |
| Israel — 1.8% | | | | | | | | |
| | | | | | | | | |
| Health Care — 1.8% | | | | | | | | |
| Teva Pharmaceutical Industries Ltd. ADR | | | 12,000 | | | | 385,080 | |
| | | | | | | | | |
| Brazil — 1.5% | | | | | | | | |
| | | | | | | | | |
| Industrials — 1.5% | | | | | | | | |
| Embraer SA ADR | | | 14,570 | | | | 321,706 | |
| | | | | | | | | |
| Thailand — 1.2% | | | | | | | | |
| | | | | | | | | |
| Consumer Staples — 0.8% | | | | | | | | |
| Charoen Pokphand Foods PCL | | | 209,400 | | | | 169,124 | |
| | | | | | | | | |
| Financials — 0.4% | | | | | | | | |
| Bangkok Bank PCL | | | 15,730 | | | | 85,183 | |
| Total Thailand | | | | | | | 254,307 | |
| | | | | | | | | |
| Malaysia — 0.8% | | | | | | | | |
| | | | | | | | | |
| Financials — 0.8% | | | | | | | | |
| CIMB Group Holdings Bhd | | | 131,700 | | | | 165,754 | |
| | | | | | | | | |
| Colombia — 0.5% | | | | | | | | |
| | | | | | | | | |
| Energy — 0.5% | | | | | | | | |
| Ecopetrol SA ADR*† | | | 12,800 | | | $ | 119,296 | |
| | | | | | | | | |
| Czech Republic — 0.2% | | | | | | | | |
| | | | | | | | | |
| Financials — 0.2% | | | | | | | | |
| Komercni Banka A/S | | | 1,200 | | | | 44,532 | |
| Total Common Stocks | | | | | | $ | 21,730,208 | |
| | | | | | | | | |
| Short-Term Investment Funds — 1.3% | | | | | | | | |
| Dreyfus Government Cash Management, Institutional Shares, 0.66%∞Ω | | | 284,734 | | | | 284,734 | |
| Invesco Government & Agency Portfolio, Institutional Class, 0.61%**∞Ω | | | 17,100 | | | | 17,100 | |
| Total Short-Term Investment Funds | | | | | | $ | 301,834 | |
| | | | | | | | | |
| Total Investment Securities —99.8% | | | | | | | | |
| (Cost $23,738,365) | | | | | | $ | 22,032,042 | |
| | | | | | | | | |
| Other Assets in Excess of Liabilities — 0.2% | | | | | | | 35,538 | |
| | | | | | | | | |
| Net Assets — 100.0% | | | | | | $ | 22,067,580 | |
| * | Non-income producing security. |
| ** | Represents collateral for securities loaned. |
| † | All or a portion of the security is on loan. The total market value of the securities on loan as of March 31, 2017 was $16,776. |
| Ω | Represents the 7-day SEC yield as of March 31, 2017. |
Portfolio Abbreviations:
ADR - American Depositary Receipt
PCL - Public Company Limited
PLC - Public Limited Company
Touchstone International Value Fund (Continued)
Other Information:
The inputs or methodology used for valuing securities may not be an indication of the risk associated with investing in those securities. For more information on valuation inputs, and their aggregation into the levels used in the table below, please refer to the security valuation section in the accompanying Notes to Financial Statements.
| | | Valuation inputs at Reporting Date: | |
| Description | | | Level 1 | | | | Level 2 | | | | Level 3 | | | | Total | |
| Common Stocks | | | | | | | | | | | | | | | | |
| United Kingdom | | $ | 1,123,642 | | | $ | 2,848,417 | | | $ | — | | | $ | 3,972,059 | |
| Netherlands | | | 118,861 | | | | 3,218,469 | | | | — | | | | 3,337,330 | |
| Japan | | | — | | | | 2,985,059 | | | | — | | | | 2,985,059 | |
| Germany | | | 410,221 | | | | 1,601,737 | | | | — | | | | 2,011,958 | |
| France | | | — | | | | 1,714,703 | | | | — | | | | 1,714,703 | |
| Switzerland | | | — | | | | 1,134,370 | | | | — | | | | 1,134,370 | |
| Italy | | | — | | | | 887,927 | | | | — | | | | 887,927 | |
| Singapore | | | — | | | | 843,919 | | | | — | | | | 843,919 | |
| Ireland | | | — | | | | 775,877 | | | | — | | | | 775,877 | |
| South Korea | | | 298,256 | | | | 442,921 | | | | — | | | | 741,177 | |
| Austria | | | — | | | | 572,765 | | | | — | | | | 572,765 | |
| United States | | | 557,812 | | | | — | | | | — | | | | 557,812 | |
| Australia | | | — | | | | 493,226 | | | | — | | | | 493,226 | |
| Spain | | | — | | | | 411,351 | | | | — | | | | 411,351 | |
| Israel | | | 385,080 | | | | — | | | | — | | | | 385,080 | |
| Brazil | | | 321,706 | | | | — | | | | — | | | | 321,706 | |
| Thailand | | | — | | | | 254,307 | | | | — | | | | 254,307 | |
| Malaysia | | | — | | | | 165,754 | | | | — | | | | 165,754 | |
| Colombia | | | 119,296 | | | | — | | | | — | | | | 119,296 | |
| Czech Republic | | | 44,532 | | | | — | | | | — | | | | 44,532 | |
| Short-Term Investment Funds | | | 301,834 | | | | — | | | | — | | | | 301,834 | |
| Total | | $ | 3,681,240 | | | $ | 18,350,802 | | | $ | — | | | $ | 22,032,042 | |
At March 31, 2017, equity securities valued at $298,256 were transferred from Level 2 to Level 1. Transfers from Level 1 to Level 2 are due to movements of a designated U.S. market index, triggering a systematic valuation model, provided by an independent third party, when required confidence levels are achieved to fair value the international equity securities. Transfers from Level 2 to Level 1 occur when there is no longer movement of the designated U.S. market index or required confidence levels were not reached in the systematic model.
See accompanying Notes to Financial Statements.
Portfolio of Investments
Touchstone Mid Cap Growth Fund – March 31, 2017
| | | | | | Market | |
| | | Shares | | | Value | |
| | | | | | | |
| Common Stocks — 97.3% | | | | | | | | |
| | | | | | | | | |
| Information Technology — 21.3% | | | | | | | | |
| Alliance Data Systems Corp. | | | 59,505 | | | $ | 14,816,745 | |
| Ciena Corp.* | | | 532,460 | | | | 12,571,381 | |
| Fidelity National Information Services, Inc. | | | 145,970 | | | | 11,622,131 | |
| Lam Research Corp. | | | 55,460 | | | | 7,118,846 | |
| Micron Technology, Inc.* | | | 271,860 | | | | 7,856,754 | |
| Nice Ltd. ADR | | | 159,843 | | | | 10,866,127 | |
| NXP Semiconductors N.V. | | | | | | | | |
| (Netherlands)* | | | 72,077 | | | | 7,459,969 | |
| ON Semiconductor Corp.* | | | 773,270 | | | | 11,977,952 | |
| Palo Alto Networks, Inc.* | | | 42,735 | | | | 4,815,380 | |
| Red Hat, Inc.* | | | 169,290 | | | | 14,643,585 | |
| ServiceNow, Inc.* | | | 147,630 | | | | 12,913,196 | |
| Splunk Inc.* | | | 123,210 | | | | 7,674,751 | |
| Te Connectivity Ltd. | | | 135,020 | | | | 10,065,741 | |
| Vantiv, Inc. - Class A* | | | 205,610 | | | | 13,183,713 | |
| | | | | | | | 147,586,271 | |
| | | | | | | | | |
| Consumer Discretionary — 21.0% | | | | | | | | |
| AutoNation, Inc.* | | | 191,350 | | | | 8,092,191 | |
| Expedia, Inc. | | | 67,470 | | | | 8,512,690 | |
| Liberty Broadband Corp. - Class A* | | | 154,720 | | | | 13,165,125 | |
| LKQ Corp.* | | | 286,910 | | | | 8,397,856 | |
| Marriott International, Inc. - Class A | | | 178,900 | | | | 16,848,802 | |
| MGM Resorts International | | | 394,910 | | | | 10,820,534 | |
| Newell Brands, Inc. | | | 274,032 | | | | 12,926,089 | |
| O'Reilly Automotive, Inc.* | | | 50,462 | | | | 13,616,666 | |
| PVH Corp. | | | 92,765 | | | | 9,598,395 | |
| Scripps Networks Interactive, Inc. - Class A | | | 164,250 | | | | 12,872,272 | |
| Six Flags Entertainment Corp. | | | 212,310 | | | | 12,630,322 | |
| Ulta Beauty, Inc.* | | | 30,925 | | | | 8,820,738 | |
| Viacom, Inc. - Class B | | | 199,070 | | | | 9,280,643 | |
| | | | | | | | 145,582,323 | |
| | | | | | | | | |
| Industrials — 18.0% | | | | | | | | |
| AMETEK, Inc. | | | 252,320 | | | | 13,645,466 | |
| IHS Markit Ltd.* | | | 341,934 | | | | 14,344,131 | |
| JB Hunt Transport Services, Inc. | | | 134,516 | | | | 12,340,498 | |
| Lennox International, Inc. | | | 71,006 | | | | 11,879,304 | |
| Macquarie Infrastructure Corp. | | | 160,309 | | | | 12,917,699 | |
| Middleby Corp. (The)* | | | 95,790 | | | | 13,070,546 | |
| TransDigm Group, Inc. | | | 44,638 | | | | 9,827,502 | |
| TransUnion* | | | 347,091 | | | | 13,310,940 | |
| United Continental Holdings, Inc.* | | | 142,900 | | | | 10,094,456 | |
| Wolseley PLC ADR† | | | 2,186,470 | | | | 13,862,220 | |
| | | | | | | | 125,292,762 | |
| | | | | | | | | |
| Health Care — 14.4% | | | | | | | | |
| BioMarin Pharmaceutical, Inc.* | | | 126,435 | | | | 11,098,464 | |
| Clovis Oncology, Inc.* | | | 98,470 | | | | 6,269,585 | |
| Cooper Cos., Inc. (The) | | | 61,134 | | | | 12,220,075 | |
| Hill-Rom Holdings, Inc. | | | 276,198 | | | | 19,499,579 | |
| ICON PLC (Ireland)* | | | 179,690 | | | | 14,324,887 | |
| Jazz Pharmaceuticals PLC (Ireland)* | | | 94,949 | | | | 13,779,948 | |
| Mettler-Toledo International, Inc.* | | | 31,056 | | | | 14,873,029 | |
| Vertex Pharmaceuticals, Inc.* | | | 75,315 | | | | 8,235,695 | |
| | | | | | | | 100,301,262 | |
| | | | | | | | | |
| Financials — 7.3% | | | | | | | | |
| Affiliated Managers Group, Inc. | | | 62,040 | | | | 10,170,838 | |
| Arthur J Gallagher & Co. | | | 186,390 | | | | 10,538,491 | |
| MSCI, Inc. | | | 104,540 | | | | 10,160,243 | |
| SVB Financial Group* | | | 54,905 | | | | 10,217,271 | |
| Western Alliance Bancorp* | | | 198,990 | | | | 9,768,419 | |
| | | | | | | | 50,855,262 | |
| | | | | | | | | |
| Materials — 6.0% | | | | | | | | |
| Avery Dennison Corp. | | | 127,540 | | | | 10,279,724 | |
| Celanese Corp. - Series A | | | 116,430 | | | | 10,461,235 | |
| Sealed Air Corp. | | | 206,550 | | | | 9,001,449 | |
| Vulcan Materials Co. | | | 99,650 | | | | 12,005,832 | |
| | | | | | | | 41,748,240 | |
| | | | | | | | | |
| Consumer Staples — 4.5% | | | | | | | | |
| Constellation Brands, Inc. - Class A | | | 66,011 | | | | 10,698,403 | |
| Kellogg Co. | | | 133,610 | | | | 9,701,422 | |
| Pinnacle Foods, Inc. | | | 181,897 | | | | 10,526,379 | |
| | | | | | | | 30,926,204 | |
| | | | | | | | | |
| Real Estate — 3.8% | | | | | | | | |
| Crown Castle International Corp. REIT | | | 77,990 | | | | 7,366,156 | |
| CyrusOne, Inc. REIT | | | 210,410 | | | | 10,829,803 | |
| Life Storage, Inc. REIT | | | 102,800 | | | | 8,441,936 | |
| | | | | | | | 26,637,895 | |
| | | | | | | | | |
| Energy — 1.0% | | | | | | | | |
| Baker Hughes, Inc. | | | 118,090 | | | | 7,064,144 | |
| Total Common Stocks | | | | | | $ | 675,994,363 | |
| | | | | | | | | |
| Short-Term Investment Funds — 4.9% | | | | | | | | |
| Dreyfus Government Cash Management, Institutional Shares, 0.66%∞Ω | | | 30,349,272 | | | | 30,349,272 | |
| Invesco Government & Agency Portfolio, Institutional Class, 0.61%**∞Ω | | | 3,516,750 | | | | 3,516,750 | |
| Total Short-Term Investment Funds | | | | | | $ | 33,866,022 | |
| | | | | | | | | |
| Total Investment Securities —102.2% | | | | | | | | |
| (Cost $577,631,491) | | | | | | $ | 709,860,385 | |
| | | | | | | | | |
| Liabilities in Excess of Other Assets — (2.2%) | | | | | | | (15,224,199 | ) |
| | | | | | | | | |
| Net Assets — 100.0% | | | | | | $ | 694,636,186 | |
Touchstone Mid Cap Growth Fund (Continued)
| * | Non-income producing security. |
| ** | Represents collateral for securities loaned. |
| † | All or a portion of the security is on loan. The total market value of the securities on loan as of March 31, 2017 was $3,303,140. |
| Ω | Represents the 7-day SEC yield as of March 31, 2017. |
Portfolio Abbreviations:
ADR - American Depositary Receipt
PLC - Public Limited Company
REIT - Real Estate Investment Trust
Other Information:
The inputs or methodology used for valuing securities may not be an indication of the risk associated with investing in those securities. For more information on valuation inputs, and their aggregation into the levels used in the table below, please refer to the security valuation section in the accompanying Notes to Financial Statements.
| | | Valuation inputs at Reporting Date: | | | | |
| Description | | Level 1 | | | Level 2 | | | Level 3 | | | Total | |
| Common Stocks | | $ | 675,994,363 | | | $ | — | | | $ | — | | | $ | 675,994,363 | |
| Short-Term Investment Funds | | | 33,866,022 | | | | �� | | | | — | | | | 33,866,022 | |
| Total | | $ | 709,860,385 | | | $ | — | | | $ | — | | | $ | 709,860,385 | |
See accompanying Notes to Financial Statements.
Portfolio of Investments
Touchstone Sands Capital Emerging Markets Growth Fund – March 31, 2017
| | | | | | Market | |
| | | Shares | | | Value | |
| | | | | | | |
| Common Stocks — 96.1% | | | | | | | | |
| | | | | | | | | |
| India — 30.5% | | | | | | | | |
| | | | | | | | | |
| Consumer Discretionary — 6.6% | | | | | | | | |
| Jubilant Foodworks Ltd. | | | 436,400 | | | $ | 7,442,078 | |
| Makemytrip Ltd.*† | | | 149,300 | | | | 5,165,780 | |
| Zee Entertainment Enterprises Ltd. | | | 762,900 | | | | 6,291,276 | |
| | | | | | | | | |
| Consumer Staples — 3.0% | | | | | | | | |
| Britannia Industries Ltd. | | | 55,000 | | | | 2,858,524 | |
| ITC Ltd. | | | 1,344,500 | | | | 5,805,019 | |
| | | | | | | | | |
| Financials — 8.2% | | | | | | | | |
| HDFC Bank Ltd. | | | 223,000 | | | | 4,958,150 | |
| Housing Development Finance Corp. | | | | | | | | |
| Ltd. | | | 542,800 | | | | 12,557,897 | |
| IndusInd Bank Ltd. | | | 269,300 | | | | 5,910,575 | |
| | | | | | | | | |
| Health Care — 2.9% | | | | | | | | |
| Apollo Hospitals Enterprise Ltd. | | | 221,600 | | | | 3,976,446 | |
| Lupin Ltd. | | | 195,800 | | | | 4,358,052 | |
| | | | | | | | | |
| Industrials — 8.4% | | | | | | | | |
| Adani Ports & Special Economic Zone Ltd. | | | 2,443,200 | | | | 12,779,122 | |
| Eicher Motors Ltd. | | | 14,700 | | | | 5,791,004 | |
| Larsen & Toubro Ltd. | | | 221,500 | | | | 5,372,581 | |
| | | | | | | | | |
| Materials — 1.4% | | | | | | | | |
| Asian Paints Ltd. | | | 238,000 | | | | 3,932,725 | |
| Total India | | | | | | | 87,199,229 | |
| | | | | | | | | |
| Cayman Islands — 19.6% | | | | | | | | |
| | | | | | | | | |
| Consumer Discretionary — 4.3% | | | | | | | | |
| NagaCorp Ltd. | | | 6,352,000 | | | | 3,630,020 | |
| Sands China Ltd. | | | 1,848,400 | | | | 8,568,426 | |
| | | | | | | | | |
| Information Technology — 15.3% | | | | | | | | |
| Alibaba Group Holding Ltd. ADR* | | | 197,344 | | | | 21,279,604 | |
| Baidu, Inc. ADR* | | | 72,880 | | | | 12,573,258 | |
| Tencent Holdings Ltd. | | | 345,900 | | | | 9,965,213 | |
| Total Cayman Islands | | | | | | | 56,016,521 | |
| | | | | | | | | |
| China — 6.3% | | | | | | | | |
| | | | | | | | | |
| Consumer Discretionary — 4.8% | | | | | | | | |
| ANTA Sports Products Ltd. | | | 1,692,000 | | | | 4,681,245 | |
| Ctrip.com International Ltd. ADR* | | | 183,200 | | | | 9,004,280 | |
| | | | | | | | | |
| Health Care — 1.5% | | | | | | | | |
| Shandong Weigao Group Medical | | | | | | | | |
| Polymer Co. Ltd. - Class H | | | 5,940,000 | | | | 4,252,162 | |
| Total China | | | | | | | 17,937,687 | |
| | | | | | | | | |
| South Korea — 4.4% | | | | | | | | |
| | | | | | | | | |
| Consumer Staples — 1.5% | | | | | | | | |
| Amorepacific Corp. | | | 17,400 | | | | 4,364,392 | |
| | | | | | | | | |
| Health Care — 2.9% | | | | | | | | |
| Medy-Tox, Inc. | | | 20,075 | | | | 8,311,323 | |
| Total South Korea | | | | | | | 12,675,715 | |
| | | | | | | | | |
| United States — 4.3% | | | | | | | | |
| | | | | | | | | |
| Information Technology — 4.3% | | | | | | | | |
| MercadoLibre, Inc. | | | 58,450 | | | | 12,360,422 | |
| | | | | | | | | |
| Philippines — 4.0% | | | | | | | | |
| | | | | | | | | |
| Consumer Staples — 1.0% | | | | | | | | |
| Universal Robina Corp. | | | 867,500 | | | | 2,826,693 | |
| | | | | | | | | |
| Industrials — 1.4% | | | | | | | | |
| International Container Terminal Services, Inc. | | | 2,302,320 | | | | 4,122,214 | |
| | | | | | | | | |
| Real Estate — 1.6% | | | | | | | | |
| SM Prime Holdings, Inc. | | | 8,167,100 | | | | 4,605,482 | |
| Total Philippines | | | | | | | 11,554,389 | |
| | | | | | | | | |
| South Africa — 4.0% | | | | | | | | |
| | | | | | | | | |
| Consumer Discretionary — 4.0% | | | | | | | | |
| Naspers Ltd. - Class N | | | 66,300 | | | | 11,424,307 | |
| | | | | | | | | |
| Brazil — 4.0% | | | | | | | | |
| | | | | | | | | |
| Consumer Staples — 2.5% | | | | | | | | |
| Raia Drogasil SA | | | 375,000 | | | | 7,063,742 | |
| | | | | | | | | |
| Information Technology — 1.5% | | | | | | | | |
| Cielo SA | | | 478,356 | | | | 4,336,467 | |
| Total Brazil | | | | | | | 11,400,209 | |
| | | | | | | | | |
| Indonesia — 3.6% | | | | | | | | |
| | | | | | | | | |
| Financials — 2.2% | | | | | | | | |
| Bank Rakyat Indonesia Persero Tbk PT | | | 6,374,100 | | | | 6,206,580 | |
| | | | | | | | | |
| Health Care — 1.4% | | | | | | | | |
| Siloam International Hospitals Tbk PT* | | | 3,928,255 | | | | 4,127,092 | |
| Total Indonesia | | | | | | | 10,333,672 | |
| | | | | | | | | |
| United Kingdom — 3.0% | | | | | | | | |
| | | | | | | | | |
| Health Care — 3.0% | | | | | | | | |
| Hikma Pharmaceuticals PLC | | | 341,900 | | | | 8,492,521 | |
| | | | | | | | | |
| Thailand — 2.3% | | | | | | | | |
| | | | | | | | | |
| Consumer Staples — 2.3% | | | | | | | | |
| CP ALL PCL | | | 3,851,100 | | | | 6,610,619 | |
| | | | | | | | | |
| Peru — 2.0% | | | | | | | | |
| | | | | | | | | |
| Financials — 2.0% | | | | | | | | |
| Credicorp Ltd. | | | 34,964 | | | | 5,709,621 | |
Touchstone Sands Capital Emerging Markets Growth Fund (Continued)
| | | | | | Market | |
| | | Shares | | | Value | |
| | | | | | | |
| Common Stocks — 96.1% (Continued) | | | | | | | | |
| | | | | | | | | |
| Taiwan — 2.0% | | | | | | | | |
| | | | | | | | | |
| Information Technology — 2.0% | | | | | | | | |
| Taiwan Semiconductor Manufacturing Co. Ltd. ADR | | | 173,040 | | | $ | 5,682,634 | |
| | | | | | | | | |
| Russia — 1.9% | | | | | | | | |
| | | | | | | | | |
| Consumer Staples — 1.9% | | | | | | | | |
| Magnit OJSC GDR | | | 144,700 | | | | 5,514,404 | |
| | | | | | | | | |
| Virgin Islands (British) — 1.6% | | | | | | | | |
| | | | | | | | | |
| Information Technology — 1.6% | | | | | | | | |
| Mail.Ru Group Ltd. GDR* | | | 206,000 | | | | 4,552,600 | |
| | | | | | | | | |
| Netherlands — 1.4% | | | | | | | | |
| | | | | | | | | |
| Information Technology — 1.4% | | | | | | | | |
| Yandex N.V.* | | | 175,600 | | | | 3,850,908 | |
| | | | | | | | | |
| Malaysia — 1.2% | | | | | | | | |
| | | | | | | | | |
| Health Care — 1.2% | | | | | | | | |
| IHH Healthcare Bhd | | | 2,510,800 | | | | 3,404,090 | |
| Total Common Stocks | | | | | | $ | 274,719,548 | |
| | | Number | | | | |
| | | of Contracts | | | | |
| | | | | | | | | |
| Low Exercise Price Warrants — 1.9% | | | | | | | | |
| | | | | | | | | |
| Saudi Arabia — 1.9% | | | | | | | | |
| | | | | | | | | |
| Almarai Co. Ltd. Strike $0.0001, Exp 04/01/19 | | | 194,233 | | | | 3,634,818 | |
| Almarai Co. Ltd. Strike $0.0001, Exp 4/08/19 | | | 99,133 | | | | 1,855,145 | |
| Total Saudi Arabia | | | | | | | 5,489,963 | |
| Total Low Exercise Price Warrants | | | | | | $ | 5,489,963 | |
| | | Shares | | | | |
| Short-Term Investment Funds — 2.6% | | | | | | | | |
| Dreyfus Government Cash Management, Institutional Shares, 0.66%∞Ω | | | 7,277,278 | | | | 7,277,278 | |
| Invesco Government & Agency Portfolio, Institutional Class, 0.61%**∞Ω | | | 76,450 | | | | 76,450 | |
| Total Short-Term Investment Funds | | | | | | $ | 7,353,728 | |
| Total Investment Securities —100.6% | | | | |
| (Cost $246,629,315) | | $ | 287,563,239 | |
| | | | | |
| Liabilities in Excess of Other Assets — (0.6%) | | | (1,694,180 | ) |
| | | | | |
| Net Assets — 100.0% | | $ | 285,869,059 | |
| * | Non-income producing security. |
| ** | Represents collateral for securities loaned. |
| † | All or a portion of the security is on loan. The total market value of the securities on loan as of March 31, 2017 was $76,120. |
| Ω | Represents the 7-day SEC yield as of March 31, 2017. |
Portfolio Abbreviations:
ADR - American Depositary Receipt
GDR - Global Depositary Receipt
PCL - Public Company Limited
PLC - Public Limited Company
Touchstone Sands Capital Emerging Markets Growth Fund (Continued)
Other Information:
The inputs or methodology used for valuing securities may not be an indication of the risk associated with investing in those securities. For more information on valuation inputs, and their aggregation into the levels used in the table below, please refer to the security valuation section in the accompanying Notes to Financial Statements.
| Valuation inputs at Reporting Date: |
| Description | | Level 1 | | | Level 2 | | | Level 3 | | | Total | |
| Common Stocks | | | | | | | | | | | | | | | | |
| India | | $ | 5,165,780 | | | $ | 82,033,449 | | | $ | — | | | $ | 87,199,229 | |
| Cayman Islands | | | 33,852,862 | | | | 22,163,659 | | | | — | | | | 56,016,521 | |
| China | | | 9,004,280 | | | | 8,933,407 | | | | — | | | | 17,937,687 | |
| South Korea | | | 4,364,392 | | | | 8,311,323 | | | | — | | | | 12,675,715 | |
| United States | | | 12,360,422 | | | | — | | | | — | | | | 12,360,422 | |
| Philippines | | | — | | | | 11,554,389 | | | | — | | | | 11,554,389 | |
| South Africa | | | — | | | | 11,424,307 | | | | — | | | | 11,424,307 | |
| Brazil | | | 11,400,209 | | | | — | | | | — | | | | 11,400,209 | |
| Indonesia | | | 4,127,092 | | | | 6,206,580 | | | | — | | | | 10,333,672 | |
| United Kingdom | | | — | | | | 8,492,521 | | | | — | | | | 8,492,521 | |
| Thailand | | | — | | | | 6,610,619 | | | | — | | | | 6,610,619 | |
| Peru | | | 5,709,621 | | | | — | | | | — | | | | 5,709,621 | |
| Taiwan | | | 5,682,634 | | | | — | | | | — | | | | 5,682,634 | |
| Russia | | | — | | | | 5,514,404 | | | | — | | | | 5,514,404 | |
| Virgin Islands (British) | | | 4,552,600 | | | | — | | | | — | | | | 4,552,600 | |
| Netherlands | | | 3,850,908 | | | | — | | | | — | | | | 3,850,908 | |
| Malaysia | | | 3,404,090 | | | | — | | | | — | | | | 3,404,090 | |
| Low Exercise Price | | | | | | | | | | | | | | | | |
| Warrants | | | | | | | | | | | | | | | | |
| Saudi Arabia | | | — | | | | 5,489,963 | | | | — | | | | 5,489,963 | |
| Short-Term | | | | | | | | | | | | | | | | |
| Investment | | | | | | | | | | | | | | | | |
| Funds | | | 7,353,728 | | | | — | | | | — | | | | 7,353,728 | |
| Total | | $ | 110,828,618 | | | $ | 176,734,621 | | | $ | — | | | $ | 287,563,239 | |
At March 31, 2017, equity securities valued at $4,364,392 were transferred from Level 2 to Level 1. Transfers from Level 1 to Level 2 are due to movements of a designated U.S. market index, triggering a systematic valuation model, provided by an independent third party, when required confidence levels are achieved to fair value the international equity securities. Transfers from Level 2 to Level 1 occur when there is no longer movement of the designated U.S. market index or required confidence levels were not reached in the systematic model.
See accompanying Notes to Financial Statements.
Portfolio of Investments
Touchstone Small Cap Growth Fund – March 31, 2017
| | | | | | Market | |
| | | Shares | | | Value | |
| | | | | | | |
| Common Stocks — 93.8% | | | | | | | | |
| | | | | | | | | |
| Health Care — 21.4% | | | | | | | | |
| ACADIA Pharmaceuticals, Inc.*† | | | 75,410 | | | $ | 2,592,596 | |
| Achaogen, Inc.*† | | | 139,607 | | | | 3,522,285 | |
| Agios Pharmaceuticals, Inc.* | | | 26,660 | | | | 1,556,944 | |
| Akorn, Inc.* | | | 197,553 | | | | 4,757,076 | |
| Alder Biopharmaceuticals, Inc.* | | | 79,492 | | | | 1,653,434 | |
| AMN Healthcare Services, Inc.* | | | 172,082 | | | | 6,986,529 | |
| ANI Pharmaceuticals, Inc.* | | | 75,306 | | | | 3,728,400 | |
| Cambrex Corp.* | | | 168,676 | | | | 9,285,614 | |
| Charles River Laboratories International, Inc.* | | | 69,602 | | | | 6,260,700 | |
| Chemed Corp. | | | 51,542 | | | | 9,416,208 | |
| China Biologic Products, Inc.* | | | 27,949 | | | | 2,798,533 | |
| Globus Medical, Inc. - Class A* | | | 114,182 | | | | 3,382,071 | |
| Horizon Pharma PLC* | | | 235,404 | | | | 3,479,271 | |
| ICON PLC (Ireland)* | | | 96,049 | | | | 7,657,026 | |
| Insulet Corp.* | | | 77,665 | | | | 3,346,585 | |
| Medidata Solutions, Inc.* | | | 115,291 | | | | 6,651,138 | |
| Momenta Pharmaceuticals, Inc.* | | | 263,657 | | | | 3,519,821 | |
| Natus Medical, Inc.* | | | 149,305 | | | | 5,860,221 | |
| Prestige Brands Holdings, Inc.* | | | 73,066 | | | | 4,059,547 | |
| Radius Health, Inc.*† | | | 34,766 | | | | 1,343,706 | |
| | | | | | | | 91,857,705 | |
| | | | | | | | | |
| Information Technology — 19.3% | | | | | | | | |
| Arris International PLC* | | | 173,878 | | | | 4,599,073 | |
| BroadSoft, Inc.* | | | 129,227 | | | | 5,194,925 | |
| Cirrus Logic, Inc.* | | | 101,799 | | | | 6,178,181 | |
| Criteo SA ADR* | | | 68,067 | | | | 3,402,669 | |
| Euronet Worldwide, Inc.* | | | 145,665 | | | | 12,457,271 | |
| ExlService Holdings, Inc.* | | | 100,472 | | | | 4,758,354 | |
| j2 Global, Inc. | | | 47,038 | | | | 3,946,959 | |
| Manhattan Associates, Inc.* | | | 93,850 | | | | 4,884,892 | |
| MAXIMUS, Inc. | | | 108,000 | | | | 6,717,600 | |
| Mellanox Technologies Ltd. (Israel)*† | | | 66,496 | | | | 3,387,971 | |
| Power Integrations, Inc. | | | 90,775 | | | | 5,968,456 | |
| Qualys, Inc.* | | | 96,869 | | | | 3,671,335 | |
| Science Applications International Corp. | | | 82,115 | | | | 6,109,356 | |
| Synaptics, Inc.* | | | 52,310 | | | | 2,589,868 | |
| Travelport Worldwide Ltd. (United Kingdom) | | | 243,943 | | | | 2,871,209 | |
| Ubiquiti Networks, Inc.*† | | | 58,044 | | | | 2,917,291 | |
| Xperi Corp. | | | 100,946 | | | | 3,427,117 | |
| | | | | | | | 83,082,527 | |
| | | | | | | | | |
| Consumer Discretionary — 17.1% | | | | | | | | |
| Big Lots, Inc.† | | | 99,007 | | | | 4,819,661 | |
| Burlington Stores, Inc.* | | | 54,388 | | | | 5,291,409 | |
| Columbia Sportswear Co. | | | 42,288 | | | | 2,484,420 | |
| Cooper Tire & Rubber Co. | | | 144,663 | | | | 6,415,804 | |
| Dave & Buster's Entertainment, Inc.* | | | 107,490 | | | | 6,566,564 | |
| Dorman Products, Inc.* | | | 20,956 | | | | 1,721,116 | |
| Grand Canyon Education, Inc.* | | | 41,062 | | | | 2,940,450 | |
| IMAX Corp. (Canada)* | | | 126,999 | | | | 4,317,966 | |
| La-Z-Boy, Inc. | | | 127,967 | | | | 3,455,109 | |
| LCI Industries | | | 85,130 | | | | 8,495,974 | |
| Lithia Motors, Inc. - Class A | | | 67,505 | | | | 5,781,803 | |
| Marriott Vacations Worldwide Corp. | | | 76,221 | | | | 7,616,765 | |
| Penske Automotive Group, Inc. | | | 130,900 | | | | 6,127,429 | |
| Ruth's Hospitality Group, Inc. | | | 173,097 | | | | 3,470,595 | |
| Skechers U.S.A., Inc. - Class A* | | | 149,089 | | | | 4,092,493 | |
| | | | | | | | 73,597,558 | |
| | | | | | | | | |
| Industrials — 15.4% | | | | | | | | |
| Argan, Inc. | | | 71,163 | | | | 4,707,432 | |
| Beacon Roofing Supply, Inc.* | | | 89,531 | | | | 4,401,344 | |
| Dycom Industries, Inc.* | | | 61,667 | | | | 5,731,948 | |
| EMCOR Group, Inc. | | | 138,622 | | | | 8,726,255 | |
| Hawaiian Holdings, Inc.* | | | 181,238 | | | | 8,418,505 | |
| Hexcel Corp. | | | 110,441 | | | | 6,024,557 | |
| Insperity, Inc. | | | 63,310 | | | | 5,612,432 | |
| Proto Labs, Inc.*† | | | 66,851 | | | | 3,416,086 | |
| Trex Co., Inc.* | | | 89,922 | | | | 6,239,688 | |
| TriNet Group, Inc.* | | | 170,174 | | | | 4,918,029 | |
| WageWorks, Inc.* | | | 91,088 | | | | 6,585,662 | |
| Willdan Group, Inc.* | | | 37,962 | | | | 1,224,654 | |
| | | | | | | | 66,006,592 | |
| | | | | | | | | |
| Financials — 10.0% | | | | | | | | |
| Artisan Partners Asset Management, Inc. - Class A | | | 145,501 | | | | 4,015,828 | |
| Bank of The Ozarks, Inc. | | | 102,760 | | | | 5,344,548 | |
| Evercore Partners, Inc. - Class A | | | 109,416 | | | | 8,523,506 | |
| Financial Engines, Inc. | | | 120,650 | | | | 5,254,307 | |
| Interactive Brokers Group, Inc. - Class A | | | 140,707 | | | | 4,885,347 | |
| National Western Life Group, Inc. - Class A | | | 4,927 | | | | 1,498,596 | |
| Primerica, Inc. | | | 75,849 | | | | 6,234,788 | |
| Western Alliance Bancorp* | | | 150,929 | | | | 7,409,105 | |
| | | | | | | | 43,166,025 | |
| | | | | | | | | |
| Consumer Staples — 4.4% | | | | | | | | |
| B&G Foods, Inc.† | | | 105,871 | | | | 4,261,308 | |
| Boston Beer Co., Inc. (The) - Class A*† | | | 27,139 | | | | 3,925,656 | |
| Central Garden & Pet Co.* | | | 116,715 | | | | 4,326,625 | |
| J&J Snack Foods Corp. | | | 45,740 | | | | 6,200,514 | |
| | | | | | | | 18,714,103 | |
| | | | | | | | | |
| Materials — 2.8% | | | | | | | | |
| KMG Chemicals, Inc. | | | 34,824 | | | | 1,604,342 | |
| Louisiana-Pacific Corp.* | | | 29,098 | | | | 722,212 | |
| PolyOne Corp. | | | 96,504 | | | | 3,289,821 | |
| Trinseo SA | | | 93,189 | | | | 6,252,982 | |
| | | | | | | | 11,869,357 | |
| | | | | | | | | |
| Real Estate — 1.9% | | | | | | | | |
| CoreSite Realty Corp. | | | 57,561 | | | | 5,183,368 | |
| HFF, Inc. - Class A | | | 101,979 | | | | 2,821,759 | |
| | | | | | | | 8,005,127 | |
| | | | | | | | | |
| Energy — 1.5% | | | | | | | | |
| Matrix Service Co.* | | | 176,638 | | | | 2,914,527 | |
| Superior Energy Services, Inc.* | | | 239,368 | | | | 3,413,388 | |
| | | | | | | | 6,327,915 | |
| Total Common Stocks | | | | | | $ | 402,626,909 | |
Touchstone Small Cap Growth Fund (Continued)
| | | | | | Market | |
| | | Shares | | | Value | |
| Short-Term Investment Funds — 10.1% | | | | | | | | |
| Dreyfus Government Cash Management, Institutional Shares, 0.66%∞Ω | | | 19,906,683 | | | $ | 19,906,683 | |
| Invesco Government & Agency Portfolio, Institutional Class, 0.61%**∞Ω | | | 23,404,149 | | | | 23,404,149 | |
| Total Short-Term Investment Funds | | | | | | $ | 43,310,832 | |
| | | | | | | | | |
| Total Investment Securities —103.9% | | | | | | | | |
| (Cost $411,214,726) | | | | | | $ | 445,937,741 | |
| | | | | | | | | |
| Liabilities in Excess of Other Assets — (3.9%) | | | | | | | (16,573,607 | ) |
| | | | | | | | | |
| Net Assets — 100.0% | | | | | | $ | 429,364,134 | |
| * | Non-income producing security. |
| ** | Represents collateral for securities loaned. |
| † | All or a portion of the security is on loan. The total market value of the securities on loan as of March 31, 2017 was $16,393,040. |
| Ω | Represents the 7-day SEC yield as of March 31, 2017. |
Portfolio Abbreviations:
ADR - American Depositary Receipt
PLC - Public Limited Company
Other Information:
The inputs or methodology used for valuing securities may not be an indication of the risk associated with investing in those securities. For more information on valuation inputs, and their aggregation into the levels used in the table below, please refer to the security valuation section in the accompanying Notes to Financial Statements.
| Valuation inputs at Reporting Date: |
| Description | | Level 1 | | | Level 2 | | | Level 3 | | | Total | |
| Common Stocks | | $ | 402,626,909 | | | $ | — | | | $ | — | | | $ | 402,626,909 | |
| Short-Term | | | | | | | | | | | | | | | | |
| Investment | | | | | | | | | | | | | | | | |
| Funds | | | 43,310,832 | | | | — | | | | — | | | | 43,310,832 | |
| Total | | $ | 445,937,741 | | | $ | — | | | $ | — | | | $ | 445,937,741 | |
See accompanying Notes to Financial Statements.
Portfolio of Investments
Touchstone Sustainability and Impact Equity Fund – March 31, 2017
| | | | | | Market | |
| | | Shares | | | Value | |
| | | | | | | |
| Common Stocks — 97.7% | | | | | | | | |
| | | | | | | | | |
| United States — 50.9% | | | | | | | | |
| | | | | | | | | |
| Consumer Discretionary — 4.5% | | | | | | | | |
| Amazon.com, Inc.* | | | 6,598 | | | $ | 5,849,391 | |
| Ford Motor Co. | | | 259,938 | | | | 3,025,678 | |
| NIKE, Inc. - Class B | | | 84,189 | | | | 4,691,853 | |
| | | | | | | | | |
| Consumer Staples — 2.4% | | | | | | | | |
| CVS Health Corp. | | | 94,932 | | | | 7,452,162 | |
| | | | | | | | | |
| Energy — 4.0% | | | | | | | | |
| Apache Corp. | | | 606 | | | | 31,142 | |
| ConocoPhillips | | | 146,450 | | | | 7,303,462 | |
| Newfield Exploration Co.* | | | 75,243 | | | | 2,777,219 | |
| Noble Energy, Inc. | | | 57,143 | | | | 1,962,291 | |
| | | | | | | | | |
| Financials — 8.3% | | | | | | | | |
| Discover Financial Services | | | 53,268 | | | | 3,642,999 | |
| Fifth Third Bancorp | | | 186,744 | | | | 4,743,298 | |
| JPMorgan Chase & Co. | | | 93,487 | | | | 8,211,898 | |
| Reinsurance Group of America, Inc. | | | 35,041 | | | | 4,449,506 | |
| Synchrony Financial | | | 117,258 | | | | 4,021,949 | |
| Wells Fargo & Co. | | | 521 | | | | 28,999 | |
| | | | | | | | | |
| Health Care — 9.4% | | | | | | | | |
| Abbott Laboratories | | | 132,246 | | | | 5,873,045 | |
| Alnylam Pharmaceuticals, Inc.* | | | 31,006 | | | | 1,589,058 | |
| Becton Dickinson & Co. | | | 20,649 | | | | 3,787,853 | |
| Biogen, Inc.* | | | 12,479 | | | | 3,412,008 | |
| Cerner Corp.* | | | 93,409 | | | | 5,497,120 | |
| Illumina, Inc.* | | | 20,336 | | | | 3,470,135 | |
| Regeneron Pharmaceuticals, Inc.* | | | 8,948 | | | | 3,467,439 | |
| Ultragenyx Pharmaceutical, Inc.* | | | 21,802 | | | | 1,477,740 | |
| | | | | | | | | |
| Industrials — 6.9% | | | | | | | | |
| Roper Technologies, Inc. | | | 22,342 | | | | 4,613,400 | |
| Southwest Airlines Co. | | | 223,739 | | | | 12,028,209 | |
| United Continental Holdings, Inc.* | | | 59,677 | | | | 4,215,583 | |
| | | | | | | | | |
| Information Technology — 12.9% | | | | | | | | |
| Alphabet, Inc. - Class A* | | | 12,050 | | | | 10,215,990 | |
| Facebook, Inc. - Class A* | | | 60,857 | | | | 8,644,737 | |
| Microsoft Corp. | | | 107,168 | | | | 7,058,084 | |
| Oracle Corp. | | | 121,743 | | | | 5,430,955 | |
| Visa, Inc. - Class A | | | 87,501 | | | | 7,776,214 | |
| | | | | | | | | |
| Utilities — 2.5% | | | | | | | | |
| American Water Works Co., Inc. | | | 100,062 | | | | 7,781,822 | |
| Total United States | | | | | | | 154,531,239 | |
| | | | | | | | | |
| United Kingdom — 10.8% | | | | | | | | |
| | | | | | | | | |
| Consumer Discretionary — 3.6% | | | | | | | | |
| Berkeley Group Holdings PLC | | | 63,756 | | | | 2,563,593 | |
| Compass Group PLC | | | 288,292 | | | | 5,443,000 | |
| InterContinental Hotels Group | | | 57,760 | | | | 2,829,015 | |
| | | | | | | | | |
| Consumer Staples — 1.1% | | | | | | | | |
| Unilever PLC ADR | | | 64,711 | | | | 3,192,841 | |
| | | | | | | | | |
| Financials — 3.5% | | | | | | | | |
| Lloyds Banking Group PLC | | | 4,524,655 | | | | 3,763,062 | |
| Prudential PLC | | | 329,230 | | | | 6,954,408 | |
| | | | | | | | | |
| Industrials — 2.6% | | | | | | | | |
| Intertek Group PLC | | | 52,921 | | | | 2,604,912 | |
| Pentair PLC | | | 86,718 | | | | 5,444,156 | |
| Total United Kingdom | | | | | | | 32,794,987 | |
| | | | | | | | | |
| Japan — 9.9% | | | | | | | | |
| | | | | | | | | |
| Financials — 1.5% | | | | | | | | |
| ORIX Corp. | | | 315,100 | | | | 4,676,884 | |
| | | | | | | | | |
| Industrials — 3.0% | | | | | | | | |
| Amada Holdings Co. Ltd. | | | 298,500 | | | | 3,416,931 | |
| Kinden Corp. | | | 335,900 | | | | 4,703,596 | |
| Nabtesco Corp. | | | 38,000 | | | | 1,011,188 | |
| | | | | | | | | |
| Information Technology — 2.1% | | | | | | | | |
| Kyocera Corp. | | | 111,200 | | | | 6,212,452 | |
| | | | | | | | | |
| Telecommunication Services — 2.4% | | | | | | | | |
| Nippon Telegraph & Telephone Corp. | | | 170,500 | | | | 7,289,441 | |
| | | | | | | | | |
| Utilities — 0.9% | | | | | | | | |
| Tokyo Gas Co. Ltd. | | | 582,000 | | | | 2,658,052 | |
| Total Japan | | | | | | | 29,968,544 | |
| | | | | | | | | |
| France — 4.2% | | | | | | | | |
| | | | | | | | | |
| Financials — 2.1% | | | | | | | | |
| BNP Paribas SA | | | 96,593 | | | | 6,427,709 | |
| | | | | | | | | |
| Industrials — 2.1% | | | | | | | | |
| Cie de Saint-Gobain | | | 86,593 | | | | 4,442,825 | |
| Schneider Electric SE | | | 27,577 | | | | 2,026,053 | |
| Total France | | | | | | | 12,896,587 | |
| | | | | | | | | |
| Jersey — 4.0% | | | | | | | | |
| | | | | | | | | |
| Consumer Discretionary — 1.9% | | | | | | | | |
| Delphi Automotive PLC | | | 72,826 | | | | 5,861,765 | |
| | | | | | | | | |
| Health Care — 2.1% | | | | | | | | |
| Shire PLC ADR | | | 35,756 | | | | 6,229,768 | |
| Total Jersey | | | | | | | 12,091,533 | |
| | | | | | | | | |
| Netherlands — 3.6% | | | | | | | | �� |
| | | | | | | | | |
| Financials — 3.6% | | | | | | | | |
| ABN AMRO Group NV, 144a | | | 126,722 | | | | 3,072,832 | |
| ING Groep NV | | | 523,208 | | | | 7,902,698 | |
| Total Netherlands | | | | | | | 10,975,530 | |
| | | | | | | | | |
| Germany — 3.2% | | | | | | | | |
| | | | | | | | | |
| Consumer Discretionary — 0.5% | | | | | | | | |
| Bayerische Motoren Werke AG | | | 17,040 | | | | 1,554,765 | |
Touchstone Sustainability and Impact Equity Fund (Continued)
| | | | | | Market | |
| | | Shares | | | Value | |
| Common Stocks — 97.7% (Continued) | | | | | | | | |
| | | | | | | | | |
| Germany — (Continued) | | | | | | | | |
| | | | | | | | | |
| Industrials — 0.7% | | | | | | | | |
| KION Group AG | | | 33,030 | | | $ | 2,155,980 | |
| | | | | | | | | |
| Materials — 2.0% | | | | | | | | |
| HeidelbergCement AG | | | 62,562 | | | | 5,858,830 | |
| Total Germany | | | | | | | 9,569,575 | |
| | | | | | | | | |
| Cayman Islands — 2.6% | | | | | | | | |
| | | | | | | | | |
| Information Technology — 2.6% | | | | | | | | |
| Baidu, Inc. ADR* | | | 18,820 | | | | 3,246,826 | |
| Tencent Holdings Ltd. | | | 163,600 | | | | 4,713,238 | |
| Total Cayman Islands | | | | | | | 7,960,064 | |
| | | | | | | | | |
| Sweden — 2.3% | | | | | | | | |
| | | | | | | | | |
| Financials — 1.1% | | | | | | | | |
| Swedbank AB - Class A† | | | 151,913 | | | | 3,515,031 | |
| | | | | | | | | |
| Industrials — 1.2% | | | | | | | | |
| Atlas Copco AB - Class A | | | 102,059 | | | | 3,597,486 | |
| Total Sweden | | | | | | | 7,112,517 | |
| | | | | | | | | |
| Switzerland — 2.1% | | | | | | | | |
| | | | | | | | | |
| Health Care — 2.1% | | | | | | | | |
| Novartis AG | | | 86,350 | | | | 6,412,141 | |
| | | | | | | | | |
| Mexico — 1.9% | | | | | | | | |
| | | | | | | | | |
| Financials — 0.8% | | | | | | | | |
| Grupo Financiero Banorte SAB de CV - Class O | | | 434,600 | | | | 2,500,971 | |
| | | | | | | | | |
| Materials — 1.1% | | | | | | | | |
| Cemex SAB de CV ADR* | | | 352,814 | | | | 3,200,023 | |
| Total Mexico | | | | | | | 5,700,994 | |
| | | | | | | | | |
| Italy — 1.0% | | | | | | | | |
| | | | | | | | | |
| Consumer Discretionary — 1.0% | | | | | | | | |
| Luxottica Group SpA | | | 54,605 | | | | 3,013,466 | |
| | | | | | | | | |
| Indonesia — 0.7% | | | | | | | | |
| | | | | | | | | |
| Financials — 0.7% | | | | | | | | |
| Bank Rakyat Indonesia Persero Tbk PT | | | 2,057,000 | | | | 2,002,939 | |
| | | | | | | | | |
| South Korea — 0.5% | | | | | | | | |
| | | | | | | | | |
| Telecommunication Services — 0.5% | | | | | | | | |
| KT Corp. ADR* | | | 94,398 | | | | 1,588,718 | |
| Total Common Stocks | | | | | | | 296,618,834 | |
| | | | | | | | | |
| Short-Term Investment Funds — 4.2% | | | | | | | | |
| Dreyfus Government Cash Management, Institutional Shares, 0.66%∞Ω | | | 8,673,227 | | | $ | 8,673,227 | |
| Invesco Government & Agency Portfolio, Institutional Class, 0.61%**∞Ω | | | 3,913,812 | | | | 3,913,812 | |
| Total Short-Term Investment Funds | | | | | | | 12,587,039 | |
| | | | | | | | | |
| Total Investment Securities —101.9% | | | | | | | | |
| (Cost $279,254,490) | | | | | | $ | 309,205,873 | |
| | | | | | | | | |
| Liabilities in Excess of Other Assets — (1.9%) | | | | | | | (5,619,349 | ) |
| | | | | | | | | |
| Net Assets — 100.0% | | | | | | $ | 303,586,524 | |
| * | Non-income producing security. |
| ** | Represents collateral for securities loaned. |
| † | All or a portion of the security is on loan. The total market value of the securities on loan as of March 31, 2017 was $3,477,942. |
| Ω | Represents the 7-day SEC yield as of March 31, 2017. |
Portfolio Abbreviations:
ADR - American Depositary Receipt
PLC - Public Limited Company
144a - This is a restricted security that was sold in a transaction qualifying for the exemption under Rule 144A of the Securities Act of 1933. This security may be sold in transactions exempt from registration, normally to qualified institutional buyers. At March 31, 2017, these securities were valued at $3,072,832 or 1.0% of net assets. These securities were deemed liquid pursuant to procedures approved by the Board of Trustees.
Touchstone Sustainability and Impact Equity Fund (Continued)
Other Information:
The inputs or methodology used for valuing securities may not be an indication of the risk associated with investing in those securities. For more information on valuation inputs, and their aggregation into the levels used in the table below, please refer to the security valuation section in the accompanying Notes to Financial Statements.
| | | Valuation inputs at Reporting Date: | | | | |
| Description | | Level 1 | | | Level 2 | | | Level 3 | | | Total | |
| Common Stocks | | | | | | | | | | | | | | | | |
| United States | | $ | 154,531,239 | | | $ | — | | | $ | — | | | $ | 154,531,239 | |
| United Kingdom | | | 8,636,997 | | | | 24,157,990 | | | | — | | | | 32,794,987 | |
| Japan | | | — | | | | 29,968,544 | | | | — | | | | 29,968,544 | |
| France | | | — | | | | 12,896,587 | | | | — | | | | 12,896,587 | |
| Jersey | | | 12,091,533 | | | | — | | | | — | | | | 12,091,533 | |
| Netherlands | | | — | | | | 10,975,530 | | | | — | | | | 10,975,530 | |
| Germany | | | — | | | | 9,569,575 | | | | — | | | | 9,569,575 | |
| Cayman Islands | | | 3,246,826 | | | | 4,713,238 | | | | — | | | | 7,960,064 | |
| Sweden | | | — | | | | 7,112,517 | | | | — | | | | 7,112,517 | |
| Switzerland | | | — | | | | 6,412,141 | | | | — | | | | 6,412,141 | |
| Mexico | | | 5,700,994 | | | | — | | | | — | | | | 5,700,994 | |
| Italy | | | — | | | | 3,013,466 | | | | — | | | | 3,013,466 | |
| Indonesia | | | — | | | | 2,002,939 | | | | — | | | | 2,002,939 | |
| South Korea | | | 1,588,718 | | | | — | | | | — | | | | 1,588,718 | |
| Short-Term Investment Funds | | | 12,587,039 | | | | — | | | | — | | | | 12,587,039 | |
| Total | | $ | 198,383,346 | | | $ | 110,822,527 | | | $ | — | | | $ | 309,205,873 | |
At March 31, 2017, equity securities valued at $3,072,832 were transferred from Level 1 to Level 2. Transfers from Level 1 to Level 2 are due to movements of a designated U.S. market index, triggering a systematic valuation model, provided by an independent third party, when required confidence levels are achieved to fair value the international equity securities.
See accompanying Notes to Financial Statements.
Statements of Assets and Liabilities
March 31, 2017
| | | Touchstone | | | | | | Touchstone | | | Touchstone | |
| | | Flexible | | | Touchstone | | | Growth | | | International | |
| | | Income | | | Focused | | | Opportunities | | | Growth | |
| | | Fund | | | Fund | | | Fund | | | Fund | |
| Assets | | | | | | | | | | | | | | | | |
| Investments, at cost | | $ | 661,038,630 | | | $ | 1,181,368,111 | | | $ | 198,533,436 | | | $ | 11,710,129 | |
| Investments, at market value (A) | | $ | 669,825,450 | | | $ | 1,489,746,133 | | | $ | 243,155,428 | | | $ | 12,551,716 | |
| Cash | | | — | | | | — | | | | — | | | | 359,485 | |
| Cash deposits held at prime broker* | | | 3,382,590 | | | | — | | | | — | | | | — | |
| Foreign Currency (B) | | | — | | | | — | | | | — | | | | — | |
| Dividends and interest receivable | | | 4,992,499 | | | | 2,718,160 | | | | 101,441 | | | | 41,626 | |
| Receivable for capital shares sold | | | 4,060,061 | | | | 1,368,182 | | | | 1,079,252 | | | | — | |
| Receivable for investments sold | | | 386,149 | | | | 4,138,302 | | | | 640,993 | | | | — | |
| Receivable for variation margin on futures contracts | | | 119,100 | | | | — | | | | — | | | | — | |
| Receivable for securities lending income | | | 776 | | | | 1,175 | | | | — | | | | 927 | |
| Foreign tax refund receivable | | | — | | | | — | | | | — | | | | — | |
| Tax reclaim receivable | | | 18,713 | | | | 144,903 | | | | 1,896 | | | | 3,842 | |
| Other assets | | | 37,503 | | | | 44,270 | | | | 21,118 | | | | 2,616 | |
| Total Assets | | | 682,822,841 | | | | 1,498,161,125 | | | | 245,000,128 | | | | 12,960,212 | |
| Liabilities | | | | | | | | | | | | | | | | |
| Bank overdrafts | | | 2,678 | | | | — | | | | — | | | | — | |
| Foreign currency (B) | | | — | | | | — | | | | — | | | | — | |
| Cash deposits pledged at prime broker** | | | 417 | | | | — | | | | — | | | | — | |
| Written options, at market value (C) | | | 54,000 | | | | — | | | | — | | | | — | |
| Unrealized depreciation on forward foreign currency contracts | | | 93,426 | | | | — | | | | — | | | | — | |
| Payable for return of collateral for securities on loan | | | 7,135,173 | | | | 264,222 | | | | — | | | | 600,444 | |
| Deferred foreign capital gains tax (D) | | | — | | | | — | | | | — | | | | — | |
| Payable for capital shares redeemed | | | 1,624,410 | | | | 858,366 | | | | 120,447 | | | | 6,239 | |
| Payable for investments purchased | | | — | | | | 225,203 | | | | 29,930 | | | | 360,423 | |
| Payable for variation margin on futures contracts | | | 15,114 | | | | — | | | | — | | | | — | |
| Payable to Investment Advisor | | | 356,026 | | | | 795,573 | | | | 147,635 | | | | 29,469 | |
| Payable to other affiliates | | | 79,222 | | | | 297,247 | | | | 29,934 | | | | 234 | |
| Payable to Trustees | | | 3,920 | | | | 3,920 | | | | 3,920 | | | | 3,920 | |
| Payable for professional services | | | 49,876 | | | | 41,496 | | | | 23,850 | | | | 27,742 | |
| Payable to Transfer Agent | | | 151,594 | | | | 433,832 | | | | 41,667 | | | | 35 | |
| Other accrued expenses and liabilities | | | 36,664 | | | | 51,447 | | | | 16,391 | | | | 12,182 | |
| Total Liabilities | | | 9,602,520 | | | | 2,971,306 | | | | 413,774 | | | | 1,040,688 | |
| | | | | | | | | | | | | | | | | |
| Net Assets | | $ | 673,220,321 | | | $ | 1,495,189,819 | | | $ | 244,586,354 | | | $ | 11,919,524 | |
| Net assets consist of: | | | | | | | | | | | | | | | | |
| Paid-in capital | | $ | 676,671,046 | | | $ | 1,133,984,957 | | | $ | 200,590,426 | | | $ | 11,286,421 | |
| Accumulated net investment income (loss) | | | 924,067 | | | | 7,268,626 | | | | — | | | | 36,626 | |
| Accumulated net realized gains (losses) on investments, futures contracts, written options, swap agreements, securities sold short and foreign currency transactions | | | (13,267,143 | ) | | | 45,558,214 | | | | (626,064 | ) | | | (245,110 | ) |
| Net unrealized appreciation (depreciation) on investments, futures contracts, written options and foreign currency transactions | | | 8,892,351 | | | | 308,378,022 | | | | 44,621,992 | | | | 841,587 | |
| Net Assets | | $ | 673,220,321 | | | $ | 1,495,189,819 | | | $ | 244,586,354 | | | $ | 11,919,524 | |
| (A) Includes market value of securities on loan of: | | $ | 6,935,522 | | | $ | 257,889 | | | $ | — | | | $ | 586,457 | |
| (B) Cost of foreign currency: | | $ | — | | | $ | — | | | $ | — | | | $ | — | |
| (C) Premiums received for written options: | | $ | 153,307 | | | $ | — | | | $ | — | | | $ | — | |
| (D) See Note 2 in Notes to Financial Statements. | | | | | | | | | | | | | | | | |
| * | Represents segregated cash for futures contracts and swap contracts. |
| ** | Represents segregated cash for written options. |
See accompanying Notes to Financial Statements.
Statements of Assets and Liabilities (Continued)
| | | | | | | Touchstone | | | | | | | |
| Touchstone | | | Touchstone | | | Sands Capital | | | | | | Touchstone | |
| International | | | Mid Cap | | | Emerging | | | Touchstone | | | Sustainability | |
| Value | | | Growth | | | Markets | | | Small Cap | | | and Impact | |
| Fund | | | Fund | | | Growth Fund | | | Growth Fund | | | Equity Fund | |
| | | | | | | | | | | | | | |
| $ | 23,738,365 | | | $ | 577,631,491 | | | $ | 246,629,315 | | | $ | 411,214,726 | | | $ | 279,254,490 | |
| $ | 22,032,042 | | | $ | 709,860,385 | | | $ | 287,563,239 | | | $ | 445,937,741 | | | $ | 309,205,873 | |
| | — | | | | 7,984,414 | | | | — | | | | — | | | | — | |
| | — | | | | — | | | | — | | | | — | | | | — | |
| | 26,823 | | | | — | | | | 39,684 | | | | — | | | | — | |
| | 71,307 | | | | 168,728 | | | | 353,630 | | | | 98,566 | | | | 738,785 | |
| | 560 | | | | 2,097,937 | | | | 374,779 | | | | 1,979,632 | | | | 519,987 | |
| | 90,835 | | | | — | | | | 3,613,705 | | | | 21,854,412 | | | | 347,927 | |
| | — | | | | — | | | | — | | | | — | | | | — | |
| | 3 | | | | — | | | | 3,115 | | | | 12,647 | | | | 95 | |
| | — | | | | — | | | | 75,609 | | | | — | | | | — | |
| | 68,508 | | | | — | | | | 1,098 | | | | 379 | | | | 90,607 | |
| | 12,990 | | | | 34,659 | | | | 20,682 | | | | 76,459 | | | | 24,944 | |
| | 22,303,068 | | | | 720,146,123 | | | | 292,045,541 | | | | 469,959,836 | | | | 310,928,218 | |
| | | | | | | | | | | | | | | | | | | |
| | 821 | | | | — | | | | — | | | | — | | | | — | |
| | — | | | | — | | | | — | | | | — | | | | 21 | |
| | — | | | | — | | | | — | | | | — | | | | — | |
| | — | | | | — | | | | — | | | | — | | | | — | |
| | — | | | | — | | | | — | | | | — | | | | — | |
| | 17,100 | | | | 3,516,750 | | | | 76,450 | | | | 23,404,149 | | | | 3,913,812 | |
| | — | | | | — | | | | 1,962,995 | | | | — | | | | — | |
| | 27,300 | | | | 1,341,423 | | | | 142,065 | | | | 858,039 | | | | 379,912 | |
| | 117,854 | | | | 19,747,299 | | | | 3,613,705 | | | | 15,755,361 | | | | 2,614,742 | |
| | — | | | | — | | | | — | | | | — | | | | — | |
| | 16,249 | | | | 424,855 | | | | 247,384 | | | | 343,667 | | | | 180,584 | |
| | 234 | | | | 229,434 | | | | 22,018 | | | | 32,337 | | | | 102,919 | |
| | 3,920 | | | | 3,920 | | | | 3,920 | | | | 3,920 | | | | 3,920 | |
| | 25,585 | | | | 30,716 | | | | 47,357 | | | | 25,914 | | | | 40,360 | |
| | 4,897 | | | | 171,417 | | | | 34,657 | | | | 111,112 | | | | 76,794 | |
| | 21,528 | | | | 44,123 | | | | 25,931 | | | | 61,203 | | | | 28,630 | |
| | 235,488 | | | | 25,509,937 | | | | 6,176,482 | | | | 40,595,702 | | | | 7,341,694 | |
| | | | | | | | | | | | | | | | | | | |
| $ | 22,067,580 | | | $ | 694,636,186 | | | $ | 285,869,059 | | | $ | 429,364,134 | | | $ | 303,586,524 | |
| | | | | | | | | | | | | | | | | | | |
| $ | 104,318,763 | | | $ | 524,219,688 | | | $ | 263,565,183 | | | $ | 421,029,478 | | | $ | 284,925,703 | |
| | 162,466 | | | | (866,767 | ) | | | (310,110 | ) | | | (462,497 | ) | | | 678,052 | |
| | | | | | | | | | | | | | | | | | | |
| | | | | | | | | | | | | | | | | | | |
| | (80,704,615 | ) | | | 39,054,371 | | | | (16,378,308 | ) | | | (25,925,862 | ) | | | (11,967,811 | ) |
| | | | | | | | | | | | | | | | | | | |
| | (1,709,034 | ) | | | 132,228,894 | | | | 38,992,294 | | | | 34,723,015 | | | | 29,950,580 | |
| $ | 22,067,580 | | | $ | 694,636,186 | | | $ | 285,869,059 | | | $ | 429,364,134 | | | $ | 303,586,524 | |
| $ | 16,776 | | | $ | 3,303,140 | | | $ | 76,120 | | | $ | 16,393,040 | | | $ | 3,477,942 | |
| $ | 26,823 | | | $ | — | | | $ | 39,664 | | | $ | — | | | $ | (21 | ) |
| $ | — | | | $ | — | | | $ | — | | | $ | — | | | $ | — | |
Statements of Assets and Liabilities (Continued)
| | | Touchstone | | | | | | Touchstone | | | Touchstone | |
| | | Flexible | | | Touchstone | | | Growth | | | International | |
| | | Income | | | Focused | | | Opportunities | | | Growth | |
| | | Fund | | | Fund | | | Fund | | | Fund | |
| Pricing of Class A Shares | | | | | | | | | | | | | | | | |
| Net assets applicable to Class A shares | | $ | 49,543,735 | | | $ | 425,365,755 | | | $ | 38,751,752 | | | $ | 38,781 | |
| Shares of beneficial interest outstanding (unlimited number of shares authorized, no par value) | | | 4,624,514 | | | | 10,257,651 | | | | 1,283,321 | | | | 3,591 | |
| Net asset value price per share* | | $ | 10.71 | | | $ | 41.47 | | | $ | 30.20 | | | $ | 10.80 | |
| Maximum sales charge - Class A shares | | | 5.75 | % | | | 5.75 | % | | | 5.75 | % | | | 5.75 | % |
| Maximum offering price per share (100%/(100%-maximum sales charge) of net asset value adjusted to the nearest cent) - Class A shares | | $ | 11.36 | | | $ | 44.00 | | | $ | 32.04 | | | $ | 11.46 | |
| Pricing of Class C Shares | | | | | | | | | | | | | | | | |
| Net assets applicable to Class C shares | | $ | 55,043,489 | | | $ | 53,775,587 | | | $ | 8,574,393 | | | $ | 2,686 | |
| Shares of beneficial interest outstanding (unlimited number of shares authorized, no par value) | | | 5,207,144 | | | | 1,347,598 | | | | 334,875 | | | | 250 | |
| Net asset value and offering price per share** | | $ | 10.57 | | | $ | 39.90 | | | $ | 25.60 | | | $ | 10.74 | |
| Pricing of Class Y Shares | | | | | | | | | | | | | | | | |
| Net assets applicable to Class Y shares | | $ | 464,002,422 | | | $ | 974,659,551 | | | $ | 47,222,192 | | | $ | 3,732 | |
| Shares of beneficial interest outstanding (unlimited number of shares authorized, no par value) | | | 43,182,530 | | | | 23,093,212 | | | | 1,529,677 | | | | 346 | |
| Net asset value, offering price and redemption price per share | | $ | 10.75 | | | $ | 42.21 | | | $ | 30.87 | | | $ | 10.79 | |
| Pricing of Institutional Class Shares | | | | | | | | | | | | | | | | |
| Net assets applicable to Institutional Class Shares | | $ | 104,630,675 | | | $ | 41,388,926 | | | $ | 150,038,017 | | | $ | 11,874,325 | |
| Shares of beneficial interest outstanding (unlimited number of shares authorized, no par value) | | | 9,740,523 | | | | 976,565 | | | | 4,814,684 | | | | 1,099,968 | |
| Net asset value, offering price and redemption price per share | | $ | 10.74 | | | $ | 42.38 | | | $ | 31.16 | | | $ | 10.80 | |
* There is no sales load on subscriptions of $1 million or more. Redemptions that were part of a $1 million or more subscription may be subject to a contingent deferred sales load if redeemed within a one-year period from the date of purchase.
** Redemption price per share varies by length of time shares are held due to the terms of the contingent deferred sales charge.
See accompanying Notes to Financial Statements.
Statements of Assets and Liabilities (Continued)
| | | | | | | Touchstone | | | | | | | |
| Touchstone | | | Touchstone | | | Sands Capital | | | | | | Touchstone | |
| International | | | Mid Cap | | | Emerging | | | Touchstone | | | Sustainability | |
| Value | | | Growth | | | Markets | | | Small Cap | | | and Impact | |
| Fund | | | Fund | | | Growth Fund | | | Growth Fund | | | Equity Fund | |
| | | | | | | | | | | | | | |
| $ | 3,548,027 | | | $ | 225,381,498 | | | $ | — | | | $ | 44,278,139 | | | $ | 113,062,255 | |
| | | | | | | | | | | | | | | | | | | |
| | 492,822 | | | | 8,698,598 | | | | — | | | | 8,471,012 | | | | 5,254,373 | |
| $ | 7.20 | | | $ | 25.91 | | | $ | — | | | $ | 5.23 | | | $ | 21.52 | |
| | 5.75 | % | | | 5.75 | % | | | — | | | | 5.75 | % | | | 5.75 | % |
| | | | | | | | | | | | | | | | | | | |
| $ | 7.64 | | | $ | 27.49 | | | $ | — | | | $ | 5.55 | | | $ | 22.83 | |
| | | | | | | | | | | | | | | | | | | |
| $ | 226,788 | | | $ | 113,153,192 | | | $ | — | | | $ | 12,311,794 | | | $ | 48,055,011 | |
| | | | | | | | | | | | | | | | | | | |
| | 34,010 | | | | 6,343,715 | | | | — | | | | 2,858,584 | | | | 2,580,565 | |
| $ | 6.67 | | | $ | 17.84 | | | $ | — | | | $ | 4.31 | | | $ | 18.62 | |
| | | | | | | | | | | | | | | | | | | |
| $ | 3,539,505 | | | $ | 311,865,483 | | | $ | 103,467,146 | | | $ | 357,216,491 | | | $ | 112,790,042 | |
| | | | | | | | | | | | | | | | | | | |
| | 491,009 | | | | 11,679,859 | | | | 9,667,233 | | | | 61,176,340 | | | | 5,101,425 | |
| $ | 7.21 | | | $ | 26.70 | | | $ | 10.70 | | | $ | 5.84 | | | $ | 22.11 | |
| | | | | | | | | | | | | | | | | | | |
| $ | 14,753,260 | | | $ | 44,236,013 | | | $ | 182,401,913 | | | $ | 15,557,710 | | | $ | 29,679,216 | |
| | | | | | | | | | | | | | | | | | | |
| | 2,062,915 | | | | 1,644,682 | | | | 17,002,502 | | | | 2,643,190 | | | | 1,341,333 | |
| $ | 7.15 | | | $ | 26.90 | | | $ | 10.73 | | | $ | 5.89 | | | $ | 22.13 | |
Statements of Operations
For the Year Ended March 31, 2017
| | | Touchstone | | | | | | Touchstone | | | Touchstone | |
| | | Flexible | | | Touchstone | | | Growth | | | International | |
| | | Income | | | Focused | | | Opportunities | | | Growth | |
| | | Fund | | | Fund | | | Fund | | | Fund(B) | |
| Investment Income | | | | | | | | | | | | | | | | |
| Dividends(A) | | $ | 3,961,828 | | | $ | 22,965,700 | | | $ | 3,322,601 | | | $ | 182,065 | |
| Interest | | | 21,488,456 | | | | — | | | | — | | | | — | |
| Income from securities loaned | | | 73,036 | | | | 18,535 | | | | 59,391 | | | | 4,160 | |
| Total Investment Income | | | 25,523,320 | | | | 22,984,235 | | | | 3,381,992 | | | | 186,225 | |
| Expenses | | | | | | | | | | | | | | | | |
| Investment advisory fees | | | 4,492,171 | | | | 8,961,057 | | | | 2,059,535 | | | | 88,652 | |
| Administration fees | | | 964,775 | | | | 2,093,089 | | | | 398,177 | | | | 14,283 | |
| Compliance fees and expenses | | | 2,846 | | | | 2,846 | | | | 2,846 | | | | 2,846 | |
| Custody fees | | | 67,677 | | | | 22,846 | | | | 22,107 | | | | 5,488 | |
| Professional fees | | | 67,420 | | | | 70,605 | | | | 30,031 | | | | 38,492 | |
| Transfer Agent fees, Class A | | | 72,945 | | | | 859,058 | | | | 54,052 | | | | 28 | |
| Transfer Agent fees, Class B | | | — | | | | — | | | | — | | | | — | |
| Transfer Agent fees, Class C | | | 48,005 | | | | 51,231 | | | | 12,868 | | | | 20 | |
| Transfer Agent fees, Class Y | | | 547,610 | | | | 890,740 | | | | 61,686 | | | | 23 | |
| Transfer Agent fees, Institutional Class | | | 18,277 | | | | 10,926 | | | | 82,969 | | | | 45 | |
| Registration fees, Class A | | | 23,831 | | | | 31,006 | | | | 15,516 | | | | 1,795 | |
| Registration fees, Class B | | | — | | | | — | | | | — | | | | — | |
| Registration fees, Class C | | | 18,505 | | | | 22,453 | | | | 13,749 | | | | 1,795 | |
| Registration fees, Class Y | | | 51,038 | | | | 34,547 | | | | 16,145 | | | | 1,795 | |
| Registration fees, Institutional Class | | | 27,232 | | | | 15,488 | | | | 21,696 | | | | 1,796 | |
| Dividend expense on securities sold short | | | 35,264 | | | | — | | | | — | | | | — | |
| Interest expense on securities sold short | | | 7,664 | | | | — | | | | — | | | | — | |
| Reports to Shareholders, Class A | | | 13,087 | | | | 45,875 | | | | 7,678 | | | | 5,452 | |
| Reports to Shareholders, Class B | | | — | | | | — | | | | — | | | | — | |
| Reports to Shareholders, Class C | | | 9,942 | | | | 10,143 | | | | 5,966 | | | | 5,457 | |
| Reports to Shareholders, Class Y | | | 29,238 | | | | 59,883 | | | | 5,605 | | | | 5,452 | |
| Reports to Shareholders, Institutional Class | | | 7,113 | | | | 6,488 | | | | 9,625 | | | | 5,498 | |
| Distribution expenses, Class A | | | 149,824 | | | | 1,058,506 | | | | 93,156 | | | | 10 | |
| Distribution expenses, Class B | | | — | | | | — | | | | — | | | | — | |
| Distribution and shareholder servicing expenses, Class C | | | 549,830 | | | | 529,983 | | | | 100,267 | | | | 25 | |
| Trustee fees | | | 15,798 | | | | 15,798 | | | | 15,798 | | | | 15,798 | |
| Other expenses | | | 79,851 | | | | 525,193 | | | | 38,267 | | | | 10,031 | |
| Total Expenses | | | 7,299,943 | | | | 15,317,761 | | | | 3,067,739 | | | | 204,781 | |
| Fees waived and/or reimbursed by the Advisor and/or Affiliates(C) | | | (1,060,020 | ) | | | (375,144 | ) | | | (324,751 | ) | | | (109,190 | ) |
| Net Expenses | | | 6,239,923 | | | | 14,942,617 | | | | 2,742,988 | | | | 95,591 | |
| Net Investment Income (Loss) | | | 19,283,397 | | | | 8,041,618 | | | | 639,004 | | | | 90,634 | |
| Realized and Unrealized Gains (Losses) on Investments | | | | | | | | | | | | | | | | |
| Net realized gains (losses) on investments | | | 2,076,660 | | | | 50,402,184 | | | | 14,884,304 | | | | (245,110 | ) |
| Net realized gains on futures contracts | | | 168,781 | | | | — | | | | — | | | | — | |
| Net realized gains on written options | | | 779,185 | | | | — | | | | — | | | | — | |
| Net realized losses on swap agreements | | | (627,693 | ) | | | — | | | | — | | | | — | |
| Net realized gains (losses) on foreign currency transactions | | | (4,272,712 | ) | | | — | | | | — | | | | — | |
| Net realized losses on securities sold short | | | (184,590 | ) | | | — | | | | — | | | | — | |
| Net change in unrealized appreciation (depreciation) on investments (D) | | | 5,408,335 | | | | 138,441,540 | | | | 18,567,633 | | | | 841,587 | |
| Net change in unrealized appreciation (depreciation) on futures contracts | | | 103,986 | | | | — | | | | — | | | | — | |
| Net change in unrealized appreciation (depreciation) on written options | | | 99,307 | | | | — | | | | — | | | | — | |
| Net change in unrealized appreciation (depreciation) on foreign currency transactions | | | 1,494,732 | | | | — | | | | — | | | | — | |
| Net Realized and Unrealized Gains (Losses) on Investments | | | 5,045,991 | | | | 188,843,724 | | | | 33,451,937 | | | | 596,477 | |
| Change in Net Assets Resulting from Operations | | $ | 24,329,388 | | | $ | 196,885,342 | | | $ | 34,090,941 | | | $ | 687,111 | |
| (A) Net of foreign tax withholding of: | | $ | 4,881 | | | $ | 433,306 | | | $ | 11,674 | | | $ | 24,531 | |
| (B) Represents the period from commencement of operations (April 1, 2016) through March 31, 2017. | | | | | | | | | | | | | | | | |
| (C) See Note 4 in Notes to Financial Statements. | | | | | | | | | | | | | | | | |
| (D) Includes change in deferred foreign capital gains tax of: | | $ | — | | | $ | — | | | $ | — | | | $ | — | |
See accompanying Notes to Financial Statements.
Statements of Operations (Continued)
| | | | | | | Touchstone | | | | | | | |
| Touchstone | | | Touchstone | | | Sands Capital | | | | | | Touchstone | |
| International | | | Mid Cap | | | Emerging | | | Touchstone | | | Sustainability | |
| Value | | | Growth | | | Markets | | | Small Cap | | | and Impact | |
| Fund | | | Fund | | | Growth Fund | | | Growth Fund | | | Equity Fund | |
| | | | | | | | | | | | | | |
| $ | 964,063 | | | $ | 7,493,695 | | | $ | 2,217,426 | | | $ | 2,885,102 | | | $ | 5,810,993 | |
| | — | | | | — | | | | — | | | | — | | | | — | |
| | 12,892 | | | | 86,171 | | | | 11,094 | | | | 505,563 | | | | 33,847 | |
| | 976,955 | | | | 7,579,866 | | | | 2,228,520 | | | | 3,390,665 | | | | 5,844,840 | |
| | 279,205 | | | | 5,341,308 | | | | 2,561,257 | | | | 4,787,107 | | | | 2,078,096 | |
| | 40,485 | | | | 1,054,628 | | | | 322,941 | | | | 707,769 | | | | 409,749 | |
| | 2,846 | | | | 2,846 | | | | 2,846 | | | | 2,846 | | | | 2,846 | |
| | 22,075 | | | | 21,692 | | | | 124,798 | | | | 19,448 | | | | 24,275 | |
| | 43,335 | | | | 45,942 | | | | 62,576 | | | | 37,616 | | | | 48,985 | |
| | 10,893 | | | | 299,946 | | | | — | | | | 59,111 | | | | 177,849 | |
| | — | | | | 2,986 | | | | — | | | | — | | | | 644 | |
| | 330 | | | | 155,657 | | | | — | | | | 25,032 | | | | 65,933 | |
| | 6,654 | | | | 428,809 | | | | 82,961 | | | | 570,874 | | | | 100,186 | |
| | 59 | | | | 15,017 | | | | 42,728 | | | | 1,648 | | | | 8,056 | |
| | 9,370 | | | | 19,027 | | | | — | | | | 18,032 | | | | 16,543 | |
| | — | | | | 13,583 | | | | — | | | | — | | | | 13,986 | |
| | 6,307 | | | | 17,746 | | | | — | | | | 17,519 | | | | 16,467 | |
| | 6,918 | | | | 32,369 | | | | 23,846 | | | | 80,290 | | | | 21,821 | |
| | 5,310 | | | | 25,128 | | | | 21,261 | | | | 7,836 | | | | 12,797 | |
| | — | | | | — | | | | — | | | | — | | | | — | |
| | — | | | | — | | | | — | | | | — | | | | — | |
| | 6,350 | | | | 20,776 | | | | — | | | | 15,724 | | | | 21,881 | |
| | — | | | | 2,811 | | | | — | | | | — | | | | 2,676 | |
| | 5,186 | | | | 15,606 | | | | — | | | | 13,128 | | | | 11,279 | |
| | 5,239 | | | | 59,223 | | | | 11,885 | | | | 139,026 | | | | 12,959 | |
| | 1,793 | | | | 6,277 | | | | 16,054 | | | | 10,626 | | | | 5,209 | |
| | 8,861 | | | | 564,060 | | | | — | | | | 112,511 | | | | 315,305 | |
| | — | | | | 1,806 | | | | — | | | | — | | | | 601 | |
| | 1,286 | | | | 1,205,097 | | | | — | | | | 155,316 | | | | 522,284 | |
| | 15,798 | | | | 15,798 | | | | 15,798 | | | | 15,798 | | | | 15,798 | |
| | 32,049 | | | | 78,588 | | | | 36,958 | | | | 35,381 | | | | 81,041 | |
| | 510,349 | | | | 9,446,726 | | | | 3,325,909 | | | | 6,832,638 | | | | 3,987,266 | |
| | (216,050 | ) | | | (17,832 | ) | | | (148,454 | ) | | | (790,867 | ) | | | (364,653 | ) |
| | 294,299 | | | | 9,428,894 | | | | 3,177,455 | | | | 6,041,771 | | | | 3,622,613 | |
| | 682,656 | | | | (1,849,028 | ) | | | (948,935 | ) | | | (2,651,106 | ) | | | 2,222,227 | |
| | | | | | | | | | | | | | | | | | | |
| | (4,036,655 | ) | | | 87,109,885 | | | | (4,693,447 | ) | | | (25,827,977 | ) | | | 2,695,968 | |
| | — | | | | — | | | | — | | | | — | | | | — | |
| | — | | | | — | | | | — | | | | — | | | | — | |
| | — | | | | — | | | | — | | | | — | | | | — | |
| | (25,041 | ) | | | — | | | | (202,392 | ) | | | — | | | | 24,086 | |
| | — | | | | — | | | | — | | | | — | | | | — | |
| | 5,692,913 | | | | 9,617,026 | | | | 34,802,459 | | | | 54,388,132 | | | | 32,516,938 | |
| | — | | | | — | | | | — | | | | — | | | | — | |
| | — | | | | — | | | | — | | | | — | | | | — | |
| | 1,799 | | | | — | | | | 24,734 | | | | — | | | | (5,302 | ) |
| | 1,633,016 | | | | 96,726,911 | | | | 29,931,354 | | | | 28,560,155 | | | | 35,231,690 | |
| $ | 2,315,672 | | | $ | 94,877,883 | | | $ | 28,982,419 | | | $ | 25,909,049 | | | $ | 37,453,917 | |
| $ | 88,514 | | | $ | 20,387 | | | $ | 172,639 | | | $ | 2,058 | | | $ | 323,710 | |
| | | | | | | | | | | | | | | | | | | |
| $ | — | | | $ | — | | | $ | (1,962,995 | ) | | $ | — | | | $ | — | |
Statements of Changes in Net Assets
| | | Touchstone | |
| | | Flexible Income | |
| | | Fund | |
| | | | | | | |
| | | For the | | | For the | |
| | | Year Ended | | | Year Ended | |
| | | March 31, 2017 | | | March 31, 2016 | |
| From Operations | | | | | | | | |
| Net investment income (loss) | | $ | 19,283,397 | | | $ | 13,151,783 | |
| Net realized gains (losses) on investments, futures contracts, written options, swap agreements, securities sold short and foreign currency transactions | | | (2,060,369 | ) | | | (761,915 | ) |
| Net change in unrealized appreciation (depreciation) on investments, futures contracts, written options and foreign currency transactions | | | 7,106,360 | | | | (1,909,557 | ) |
| Change in Net Assets from Operations | | | 24,329,388 | | | | 10,480,311 | |
| | | | | | | | | |
| Distributions to Shareholders from: | | | | | | | | |
| Net investment income, Class A | | | (1,561,926 | ) | | | (1,150,620 | ) |
| Net investment income, Class C | | | (1,072,545 | ) | | | (745,990 | ) |
| Net investment income, Class Y | | | (13,277,757 | ) | | | (8,778,715 | ) |
| Net investment income, Institutional Class | | | (2,785,703 | ) | | | (1,541,524 | ) |
| Net realized gains, Class A | | | — | | | | — | |
| Net realized gains, Class C | | | — | | | | — | |
| Net realized gains, Class Y | | | — | | | | — | |
| Net realized gains, Institutional Class | | | — | | | | — | |
| Total Distributions | | | (18,697,931 | ) | | | (12,216,849 | ) |
| | | | | | | | | |
| Net Increase (Decrease) from Share Transactions (A) | | | 124,129,348 | | | | 203,835,986 | |
| | | | | | | | | |
| Total Increase (Decrease) in Net Assets | | | 129,760,805 | | | | 202,099,448 | |
| | | | | | | | | |
| Net Assets | | | | | | | | |
| Beginning of period | | | 543,459,516 | | | | 341,360,068 | |
| End of period | | $ | 673,220,321 | | | $ | 543,459,516 | |
| Accumulated Net Investment Income | | $ | 924,067 | | | $ | 487,772 | |
| (A) | For details on share transaction by class, see Statements of Changes in Net Assets - Capital Stock Activity on pages 78 to 80. |
| (B) | Represents the period from commencement of operations (April 1, 2016) through March 31, 2017. |
See accompanying Notes to Financial Statements.
Statements of Changes in Net Assets (Continued)
| | | | Touchstone | | | Touchstone | | | Touchstone | |
| Touchstone | | | Growth Opportunities | | | International | | | International | |
| Focused Fund | | | Fund | | | Growth Fund | | | Value Fund | |
| | | | | | | | | | | | | For the | | | | | | | |
| For the | | | For the | | | For the | | | For the | | | Year Ended | | | For the | | | For the | |
| Year Ended | | | Year Ended | | | Year Ended | | | Year Ended | | | March 31, | | | Year Ended | | | Year Ended | |
| March 31, 2017 | | | March 31, 2016 | | | March 31, 2017 | | | March 31, 2016 | | | 2017(B) | | | March 31, 2017 | | | March 31, 2016 | |
| | | | | | | | | | | | | | | | | | | | |
| $ | 8,041,618 | | | $ | 7,223,804 | | | $ | 639,004 | | | $ | (68,620 | ) | | $ | 90,634 | | | $ | 682,656 | | | $ | 2,138,797 | |
| | | | | | | | | | | | | | | | | | | | | | | | | | | |
| | 50,402,184 | | | | 12,445,754 | | | | 14,884,304 | | | | 13,188,606 | | | | (245,110 | ) | | | (4,061,696 | ) | | | (3,988,868 | ) |
| | | | | | | | | | | | | | | | | | | | | | | | | | | |
| | 138,441,540 | | | | 3,867,659 | | | | 18,567,633 | | | | (38,294,449 | ) | | | 841,587 | | | | 5,694,712 | | | | (12,129,283 | ) |
| | 196,885,342 | | | | 23,537,217 | | | | 34,090,941 | | | | (25,174,463 | ) | | | 687,111 | | | | 2,315,672 | | | | (13,979,354 | ) |
| | | | | | | | | | | | | | | | | | | | | | | | | | | |
| | | | | | | | | | | | | | | | | | | | | | | | | | | |
| | (1,516,379 | ) | | | (2,150,136 | ) | | | — | | | | — | | | | (6 | ) | | | (414,991 | ) | | | (105,908 | ) |
| | (153,587 | ) | | | (177,711 | ) | | | — | | | | — | | | | — | | | | (13,916 | ) | | | (2,309 | ) |
| | (5,279,020 | ) | | | (5,719,362 | ) | | | (48,495 | ) | | | — | | | | (12 | ) | | | (457,565 | ) | | | (141,641 | ) |
| | (274,970 | ) | | | (387,665 | ) | | | (272,809 | ) | | | — | | | | (53,990 | ) | | | (1,942,357 | ) | | | (3,515,661 | ) |
| | (3,669,437 | ) | | | (8,694,608 | ) | | | (1,283,090 | ) | | | (4,005,557 | ) | | | — | | | | — | | | | — | |
| | (489,201 | ) | | | (615,987 | ) | | | (371,428 | ) | | | (1,368,829 | ) | | | — | | | | — | | | | — | |
| | (7,917,486 | ) | | | (17,448,933 | ) | | | (1,725,793 | ) | | | (8,848,646 | ) | | | — | | | | — | | | | — | |
| | (369,490 | ) | | | (1,032,227 | ) | | | (4,752,178 | ) | | | (11,326,115 | ) | | | — | | | | — | | | | — | |
| | (19,669,570 | ) | | | (36,226,629 | ) | | | (8,453,793 | ) | | | (25,549,147 | ) | | | (54,008 | ) | | | (2,828,829 | ) | | | (3,765,519 | ) |
| | | | | | | | | | | | | | | | | | | | | | | | | | | |
| | (34,526,581 | ) | | | 250,157,293 | | | | (90,925,031 | ) | | | 55,533,470 | | | | 11,286,421 | | | | (20,565,880 | ) | | | (52,336,712 | ) |
| | | | | | | | | | | | | | | | | | | | | | | | | | | |
| | 142,689,191 | | | | 237,467,881 | | | | (65,287,883 | ) | | | 4,809,860 | | | | 11,919,524 | | | | (21,079,037 | ) | | | (70,081,585 | ) |
| | | | | | | | | | | | | | | | | | | | | | | | | | | |
| | 1,352,500,628 | | | | 1,115,032,747 | | | | 309,874,237 | | | | 305,064,377 | | | | — | | | | 43,146,617 | | | | 113,228,202 | |
| $ | 1,495,189,819 | | | $ | 1,352,500,628 | | | $ | 244,586,354 | | | $ | 309,874,237 | | | $ | 11,919,524 | | | $ | 22,067,580 | | | $ | 43,146,617 | |
| $ | 7,268,626 | | | $ | 7,223,788 | | | $ | — | | | $ | — | | | $ | 36,626 | | | $ | 162,466 | | | $ | 2,225,347 | |
Statements of Changes in Net Assets (Continued)
| | | Touchstone | |
| | | Mid Cap | |
| | | Growth Fund | |
| | | | | | | |
| | | For the | | | For the | |
| | | Year Ended | | | Year Ended | |
| | | March 31, 2017 | | | March 31, 2016 | |
| From Operations | | | | | | |
| Net investment income (loss) | | $ | (1,849,028 | ) | | $ | (3,237,176 | ) |
| Net realized gains (losses) on investments and foreign currency transactions | | | 87,109,885 | | | | 14,147,440 | |
| Net change in unrealized appreciation (depreciation) on investments and foreign currency transactions | | | 9,617,026 | | | | (67,538,238 | ) |
| Change in Net Assets from Operations | | | 94,877,883 | | | | (56,627,974 | ) |
| | | | | | | | | |
| Distributions to Shareholders from: | | | | | | | | |
| Net investment income, Class A | | | — | | | | — | |
| Net investment income, Class C | | | — | | | | — | |
| Net investment income, Class Y | | | — | | | | (610,615 | ) |
| Net investment income, Institutional Class | | | — | | | | (189,405 | ) |
| Net realized gains, Class A | | | (5,709,545 | ) | | | (19,006,999 | ) |
| Net realized gains, Class B | | | (11,306 | ) | | | (157,363 | ) |
| Net realized gains, Class C | | | (4,186,541 | ) | | | (15,562,432 | ) |
| Net realized gains, Class Y | | | (8,474,706 | ) | | | (27,767,750 | ) |
| Net realized gains, Institutional Class | | | (1,018,216 | ) | | | (6,878,222 | ) |
| Total Distributions | | | (19,400,314 | ) | | | (70,172,786 | ) |
| | | | | | | | | |
| Net Increase (Decrease) from Share Transactions(A) | | | (167,892,838 | ) | | | 84,655,180 | |
| | | | | | | | | |
| Total Increase (Decrease) in Net Assets | | | (92,415,269 | ) | | | (42,145,580 | ) |
| | | | | | | | | |
| Net Assets | | | | | | | | |
| Beginning of period | | | 787,051,455 | | | | 829,197,035 | |
| End of period | | $ | 694,636,186 | | | $ | 787,051,455 | |
| Accumulated Net Investment Income (Loss) | | $ | (866,767 | ) | | $ | 224,351 | |
(A) For details on share transaction by class, see Statements of Changes in Net Assets - Capital Stock Activity on pages 80 to 82.
See accompanying Notes to Financial Statements.
Statements of Changes in Net Assets (Continued)
| Touchstone | | | Touchstone | | | Touchstone | |
| Sands Capital Emerging | | | Small Cap | | | Sustainability and Impact | |
| Markets Growth Fund | | | Growth Fund | | | Equity Fund | |
| | | | | | | | | | | | | | | | | |
| For the | | | For the | | | For the | | | For the | | | For the | | | For the | |
| Year Ended | | | Year Ended | | | Year Ended | | | Year Ended | | | Year Ended | | | Year Ended | |
| March 31, 2017 | | | March 31, 2016 | | | March 31, 2017 | | | March 31, 2016 | | | March 31, 2017 | | | March 31, 2016 | |
| | | | | | | | | | | | | | | | | |
| $ | (948,935 | ) | | $ | (453,786 | ) | | $ | (2,651,106 | ) | | $ | (3,503,797 | ) | | $ | 2,222,227 | | | $ | 857,385 | |
| | (4,895,839 | ) | | | (4,556,734 | ) | | | (25,827,977 | ) | | | 2,826,756 | | | | 2,720,054 | | | | 185,477,079 | |
| | 34,827,193 | | | | (742,942 | ) | | | 54,388,132 | | | | (54,037,671 | ) | | | 32,511,636 | | | | (219,009,602 | ) |
| | 28,982,419 | | | | (5,753,462 | ) | | | 25,909,049 | | | | (54,714,712 | ) | | | 37,453,917 | | | | (32,675,138 | ) |
| | | | | | | | | | | | | | | | | | | | | | | |
| | | | | | | | | | | | | | | | | | | | | | | |
| | — | | | | — | | | | — | | | | — | | | | (653,990 | ) | | | (227,036 | ) |
| | — | | | | — | | | | — | | | | — | | | | (28,717 | ) | | | — | |
| | — | | | | — | | | | — | | | | — | | | | (734,641 | ) | | | (333,095 | ) |
| | — | | | | — | | | | — | | | | — | | | | (155,934 | ) | | | (4 | ) |
| | — | | | | — | | | | (209,932 | ) | | | (416,539 | ) | | | — | | | | (71,291,821 | ) |
| | — | | | | — | | | | — | | | | — | | | | — | | | | (566,514 | ) |
| | — | | | | — | | | | (82,596 | ) | | | (247,389 | ) | | | — | | | | (32,073,111 | ) |
| | — | | | | — | | | | (1,589,859 | ) | | | (3,876,576 | ) | | | — | | | | (66,294,607 | ) |
| | — | | | | — | | | | (90,861 | ) | | | (229,599 | ) | | | — | | | | (797 | ) |
| | — | | | | — | | | | (1,973,248 | ) | | | (4,770,103 | ) | | | (1,573,282 | ) | | | (170,786,985 | ) |
| | | | | | | | | | | | | | | | | | | | | | | |
| | 97,379,901 | | | | 92,975,954 | | | | (192,771,204 | ) | | | 284,669,125 | | | | (972,460 | ) | | | (307,457,200 | ) |
| | | | | | | | | | | | | | | | | | | | | | | |
| | 126,362,320 | | | | 87,222,492 | | | | (168,835,403 | ) | | | 225,184,310 | | | | 34,908,175 | | | | (510,919,323 | ) |
| | | | | | | | | | | | | | | | | | | | | | | |
| | | | | | | | | | | | | | | | | | | | | | | |
| | 159,506,739 | | | | 72,284,247 | | | | 598,199,537 | | | | 373,015,227 | | | | 268,678,349 | | | | 779,597,672 | |
| $ | 285,869,059 | | | $ | 159,506,739 | | | $ | 429,364,134 | | | $ | 598,199,537 | | | $ | 303,586,524 | | | $ | 268,678,349 | |
| $ | (310,110 | ) | | $ | (168,033 | ) | | $ | (462,497 | ) | | $ | (695,134 | ) | | $ | 678,052 | | | $ | — | |
Statements of Changes in Net Assets - Capital Stock Activity
| | | Touchstone | | | Touchstone | |
| | | Flexible Income Fund | | | Focused Fund | |
| | | For the Year | | | For the Year | | | For the Year | | | For the Year | |
| | | Ended | | | Ended | | | Ended | | | Ended | |
| | | March 31, 2017 | | | March 31, 2016 | | | March 31, 2017 | | | March 31, 2016 | |
| | | Shares | | | Dollars | | | Shares | | | Dollars | | | Shares | | | Dollars | | | Shares | | | Dollars | |
| Class A | | | | | | | | | | | | | | | | | | | | | | | | | | | | | | | | |
| Proceeds from Shares issued | | | 3,173,567 | | | $ | 34,165,603 | | | | 4,144,466 | | | $ | 43,577,789 | | | | 2,103,482 | | | $ | 81,569,477 | | | | 4,522,535 | | | $ | 167,698,473 | |
| Reinvestment of distributions | | | 114,811 | | | | 1,232,128 | | | | 88,980 | | | | 934,026 | | | | 116,086 | | | | 4,706,363 | | | | 265,208 | | | | 9,641,766 | |
| Cost of Shares redeemed | | | (4,116,327 | ) | | | (44,045,496 | ) | | | (1,845,689 | ) | | | (19,376,167 | ) | | | (3,017,249 | ) | | | (118,313,282 | ) | | | (1,720,071 | ) | | | (62,801,078 | ) |
| Change from Class A Share Transactions | | | (827,949 | ) | | | (8,647,765 | ) | | | 2,387,757 | | | | 25,135,648 | | | | (797,681 | ) | | | (32,037,442 | ) | | | 3,067,672 | | | | 114,539,161 | |
| Class C | | | | | | | | | | | | | | | | | | | | | | | | | | | | | | | | |
| Proceeds from Shares issued | | | 2,160,399 | | | | 22,964,877 | | | | 2,392,983 | | | | 24,851,358 | | | | 482,137 | | | | 17,925,651 | | | | 1,057,840 | | | | 37,371,654 | |
| Reinvestment of distributions | | | 84,701 | | | | 896,553 | | | | 57,328 | | | | 593,349 | | | | 12,653 | | | | 494,586 | | | | 15,031 | | | | 530,969 | |
| Cost of Shares redeemed | | | (1,355,234 | ) | | | (14,316,266 | ) | | | (586,781 | ) | | | (6,087,647 | ) | | | (394,700 | ) | | | (15,062,303 | ) | | | (89,966 | ) | | | (3,169,913 | ) |
| Change from Class C Share Transactions | | | 889,866 | | | | 9,545,164 | | | | 1,863,530 | | | | 19,357,060 | | | | 100,090 | | | | 3,357,934 | | | | 982,905 | | | | 34,732,710 | |
| Class Y | | | | | | | | | | | | | | | | | | | | | | | | | | | | | | | | |
| Proceeds from Shares issued | | | 25,265,156 | | | | 272,373,506 | | | | 18,472,408 | | | | 194,854,094 | | | | 4,259,573 | | | | 168,900,525 | | | | 4,496,401 | | | | 165,513,223 | |
| Reinvestment of distributions | | | 714,239 | | | | 7,685,777 | | | | 318,651 | | | | 3,356,635 | | | | 299,050 | | | | 12,330,960 | | | | 593,413 | | | | 21,964,792 | |
| Cost of Shares redeemed | | | (16,586,849 | ) | | | (177,812,998 | ) | | | (7,260,579 | ) | | | (76,486,863 | ) | | | (4,362,807 | ) | | | (173,810,089 | ) | | | (2,227,174 | ) | | | (83,643,397 | ) |
| Change from Class Y Share Transactions | | | 9,392,546 | | | | 102,246,285 | | | | 11,530,480 | | | | 121,723,866 | | | | 195,816 | | | | 7,421,396 | | | | 2,862,640 | | | | 103,834,618 | |
| Institutional Class | | | | | | | | | | | | | | | | | | | | | | | | | | | | | | | | |
| Proceeds from Shares issued | | | 5,579,839 | | | | 59,878,292 | | | | 6,063,065 | | | | 63,851,043 | | | | 318,160 | | | | 12,296,441 | | | | 446,318 | | | | 16,652,226 | |
| Reinvestment of distributions | | | 147,977 | | | | 1,589,985 | | | | 79,391 | | | | 837,163 | | | | 15,172 | | | | 628,198 | | | | 38,164 | | | | 1,419,892 | |
| Cost of Shares redeemed | | | (3,747,004 | ) | | | (40,482,613 | ) | | | (2,566,505 | ) | | | (27,068,794 | ) | | | (660,073 | ) | | | (26,193,108 | ) | | | (546,524 | ) | | | (21,021,314 | ) |
| Change from Institutional Class Share Transactions | | | 1,980,812 | | | | 20,985,664 | | | | 3,575,951 | | | | 37,619,412 | | | | (326,741 | ) | | | (13,268,469 | ) | | | (62,042 | ) | | | (2,949,196 | ) |
| | | | | | | | | | | | | | | | | | | | | | | | | | | | | | | | | |
| Change from Share Transactions | | | 11,435,275 | | | $ | 124,129,348 | | | | 19,357,718 | | | $ | 203,835,986 | | | | (828,516 | ) | | $ | (34,526,581 | ) | | | 6,851,175 | | | $ | 250,157,293 | |
(A)Represents the period from commencement of operations (April 1, 2016) through March 31, 2017.
See accompanying Notes to Financial Statements.
Statements of Changes in Net Assets - Capital Stock Activity (Continued)
| Touchstone Growth | | | Touchstone International | |
| Opportunities Fund | | | Growth Fund | |
| For the Year | | | For the Year | | | For the Year | |
| Ended | | | Ended | | | Ended | |
| March 31, 2017 | | | March 31, 2016 | | | March 31, 2017 (A) | |
| Shares | | | Dollars | | | Shares | | | Dollars | | | Shares | | | Dollars | |
| | | | | | | | | | | | | | | | | |
| | 117,538 | | | $ | 3,393,344 | | | | 70,196 | | | $ | 2,177,325 | | | | 3,590 | | | $ | 38,009 | |
| | 42,553 | | | | 1,194,474 | | | | 133,527 | | | | 3,725,398 | | | | 1 | | | | 6 | |
| | (277,080 | ) | | | (7,824,211 | ) | | | (280,258 | ) | | | (8,429,913 | ) | | | — | | | | — | |
| | | | | | | | | | | | | | | | | | | | | | | |
| | (116,989 | ) | | | (3,236,393 | ) | | | (76,535 | ) | | | (2,527,190 | ) | | | 3,591 | | | | 38,015 | |
| | | | | | | | | | | | | | | | | | | | | | | |
| | 15,540 | | | | 374,733 | | | | 54,550 | | | | 1,468,821 | | | | 250 | | | | 2,500 | |
| | 13,561 | | | | 323,436 | | | | 45,779 | | | | 1,100,527 | | | | — | | | | — | |
| | (190,408 | ) | | | (4,593,968 | ) | | | (76,004 | ) | | | (1,995,073 | ) | | | — | | | | — | |
| | | | | | | | | | | | | | | | | | | | | | | |
| | (161,307 | ) | | | (3,895,799 | ) | | | 24,325 | | | | 574,275 | | | | 250 | | | | 2,500 | |
| | | | | | | | | | | | | | | | | | | | | | | |
| | 199,492 | | | | 5,718,823 | | | | 591,080 | | | | 18,203,037 | | | | 345 | | | | 3,500 | |
| | 59,054 | | | | 1,694,188 | | | | 291,572 | | | | 8,292,326 | | | | 1 | | | | 11 | |
| | (1,730,099 | ) | | | (49,539,781 | ) | | | (1,055,096 | ) | | | (31,885,449 | ) | | | — | | | | — | |
| | | | | | | | | | | | | | | | | | | | | | | |
| | (1,471,553 | ) | | | (42,126,770 | ) | | | (172,444 | ) | | | (5,390,086 | ) | | | 346 | | | | 3,511 | |
| | | | | | | | | | | | | | | | | | | | | | | |
| | 739,765 | | | | 21,407,544 | | | | 3,616,634 | | | | 103,753,183 | | | | 1,447,175 | | | | 14,754,377 | |
| | 173,177 | | | | 5,016,254 | | | | 394,776 | | | | 11,326,115 | | | | 5,421 | | | | 53,990 | |
| | (2,357,174 | ) | | | (68,089,867 | ) | | | (1,710,927 | ) | | | (52,202,827 | ) | | | (352,628 | ) | | | (3,565,972 | ) |
| | | | | | | | | | | | | | | | | | | | | | | |
| | (1,444,232 | ) | | | (41,666,069 | ) | | | 2,300,483 | | | | 62,876,471 | | | | 1,099,968 | | | | 11,242,395 | |
| | | | | | | | | | | | | | | | | | | | | | | |
| | (3,194,081 | ) | | $ | (90,925,031 | ) | | | 2,075,829 | | | $ | 55,533,470 | | | | 1,104,155 | | | $ | 11,286,421 | |
Statements of Changes in Net Assets - Capital Stock Activity (Continued)
| | | Touchstone International | | | Touchstone Mid Cap | |
| | | Value Fund | | | Growth Fund | |
| | | For the Year | | | For the Year | | | For the Year | | | For the Year | |
| | | Ended | | | Ended | | | Ended | | | Ended | |
| | | March 31, 2017 | | | March 31, 2016 | | | March 31, 2017 | | | March 31, 2016 | |
| | | Shares | | | Dollars | | | Shares | | | Dollars | | | Shares | | | Dollars | | | Shares | | | Dollars | |
| Class A | | | | | | | | | | | | | | | | | | | | | | | | | | | | | | | | |
| Proceeds from Shares issued | | | 10,152 | | | $ | 72,509 | | | | 41,430 | | | $ | 344,810 | | | | 1,497,124 | | | $ | 36,450,213 | | | | 1,904,282 | | | $ | 47,265,429 | |
| Reinvestment of distributions | | | 55,117 | | | | 378,173 | | | | 12,693 | | | | 96,845 | | | | 220,840 | | | | 5,417,207 | | | | 772,320 | | | | 17,933,276 | |
| Cost of Shares redeemed | | | (74,778 | ) | | | (546,556 | ) | | | (179,854 | ) | | | (1,484,202 | ) | | | (2,734,825 | ) | | | (66,511,120 | ) | | | (2,844,621 | ) | | | (70,651,555 | ) |
| Change from Class A Share Transactions | | | (9,509 | ) | | | (95,874 | ) | | | (125,731 | ) | | | (1,042,547 | ) | | | (1,016,861 | ) | | | (24,643,700 | ) | | | (168,019 | ) | | | (5,452,850 | ) |
| Class B(A) | | | | | | | | | | | | | | | | | | | | | | | | | | | | | | | | |
| Proceeds from Shares issued | | | — | | | | — | | | | — | | | | — | | | | 108 | | | | 1,827 | | | | 1,573 | | | | 29,154 | |
| Reinvestment of distributions | | | — | | | | — | | | | — | | | | — | | | | 491 | | | | 8,558 | | | | 8,303 | | | | 139,566 | |
| Cost of Shares redeemed | | | — | | | | — | | | | — | | | | — | | | | (68,421 | ) | | | (1,190,153 | ) | | | (79,553 | ) | | | (1,508,549 | ) |
| Change from Class B Share Transactions | | | — | | | | — | | | | — | | | | — | | | | (67,822 | ) | | | (1,179,768 | ) | | | (69,677 | ) | | | (1,339,829 | ) |
| Class C | | | | | | | | | | | | | | | | | | | | | | | | | | | | | | | | |
| Proceeds from Shares issued | | | 17,629 | | | | 114,215 | | | | 304 | | | | 2,552 | | | | 232,818 | | | | 3,960,601 | | | | 551,868 | | | | 9,655,543 | |
| Reinvestment of distributions | | | 1,826 | | | | 11,725 | | | | 279 | | | | 1,975 | | | | 189,293 | | | | 3,202,841 | | | | 720,386 | | | | 11,756,699 | |
| Cost of Shares redeemed | | | (3,250 | ) | | | (22,143 | ) | | | (12,727 | ) | | | (97,186 | ) | | | (1,907,512 | ) | | | (32,461,461 | ) | | | (1,396,724 | ) | | | (24,082,215 | ) |
| Change from Class C Share Transactions | | | 16,205 | | | | 103,797 | | | | (12,144 | ) | | | (92,659 | ) | | | (1,485,401 | ) | | | (25,298,019 | ) | | | (124,470 | ) | | | (2,669,973 | ) |
| Class Y | | | | | | | | | | | | | | | | | | | | | | | | | | | | | | | | |
| Proceeds from Shares issued | | | 39,383 | | | | 286,761 | | | | 74,049 | | | | 546,922 | | | | 4,398,245 | | | | 111,297,135 | | | | 6,261,056 | | | | 161,597,769 | |
| Reinvestment of distributions | | | 36,361 | | | | 250,337 | | | | 6,369 | | | | 48,722 | | | | 317,429 | | | | 8,018,203 | | | | 1,114,876 | | | | 26,629,213 | |
| Cost of Shares redeemed | | | (205,148 | ) | | | (1,515,781 | ) | | | (3,636,320 | ) | | | (31,264,810 | ) | | | (7,573,840 | ) | | | (190,634,337 | ) | | | (3,638,884 | ) | | | (89,071,569 | ) |
| Change from Class Y Share Transactions | | | (129,404 | ) | | | (978,683 | ) | | | (3,555,902 | ) | | | (30,669,166 | ) | | | (2,858,166 | ) | | | (71,318,999 | ) | | | 3,737,048 | | | | 99,155,413 | |
| Institutional Class | | | | | | | | | | | | | | | | | | | | | | | | | | | | | | | | |
| Proceeds from Shares issued | | | 114,412 | | | | 842,904 | | | | 6,466,412 | | | | 54,344,378 | | | | 313,502 | | | | 7,980,744 | | | | 827,272 | | | | 21,629,729 | |
| Reinvestment of distributions | | | 284,299 | | | | 1,942,357 | | | | 332,824 | | | | 2,536,116 | | | | 39,334 | | | | 1,000,658 | | | | 293,845 | | | | 7,066,529 | |
| Cost of Shares redeemed | | | (3,060,005 | ) | | | (22,380,381 | ) | | | (10,700,358 | ) | | | (77,412,834 | ) | | | (2,203,846 | ) | | | (54,433,754 | ) | | | (1,302,404 | ) | | | (33,733,839 | ) |
| Change from Institutional Class Share Transactions | | | (2,661,294 | ) | | | (19,595,120 | ) | | | (3,901,122 | ) | | | (20,532,340 | ) | | | (1,851,010 | ) | | | (45,452,352 | ) | | | (181,287 | ) | | | (5,037,581 | ) |
| | | | | | | | | | | | | | | | | | | | | | | | | | | | | | | | | |
| Change from Share Transactions | | | (2,784,002 | ) | | $ | (20,565,880 | ) | | | (7,594,899 | ) | | $ | (52,336,712 | ) | | | (7,279,260 | ) | | $ | (167,892,838 | ) | | | 3,193,595 | | | $ | 84,655,180 | |
(A)Class B shares automatically convert to Class A shares after 8 years from the initial purchase. The conversion will occur in the month following the 8-year anniversary. During the year ended March 31, 2017, all Class B shares were converted to Class A shares as they reached their 8-year anniversary and are shown as share redemptions for Class B shares above.
See accompanying Notes to Financial Statements.
Statements of Changes in Net Assets - Capital Stock Activity (Continued)
| Touchstone Sands Capital | | | Touchstone Small Cap | |
| Emerging Markets Growth Fund | | | Growth Fund | |
| For the Year | | | For the Year | | | For the Year | | | For the Year | |
| Ended | | | Ended | | | Ended | | | Ended | |
| March 31, 2017 | | | March 31, 2016 | | | March 31, 2017 | | | March 31, 2016 | |
| Shares | | | Dollars | | | Shares | | | Dollars | | | Shares | | | Dollars | | | Shares | | | Dollars | |
| | | | | | | | | | | | | | | | | | | | | | | |
| | — | | | $ | — | | | | — | | | $ | — | | | | 3,614,218 | | | $ | 18,626,271 | | | | 6,334,906 | | | $ | 33,165,487 | |
| | — | | | | — | | | | — | | | | — | | | | 36,189 | | | | 192,888 | | | | 69,622 | | | | 364,827 | |
| | — | | | | — | | | | — | | | | — | | | | (4,946,989 | ) | | | (25,080,223 | ) | | | (2,604,243 | ) | | | (13,452,965 | ) |
| | | | | | | | | | | | | | | | | | | | | | | | | | | | | | | |
| | — | | | | — | | | | — | | | | — | | | | (1,296,582 | ) | | | (6,261,064 | ) | | | 3,800,285 | | | | 20,077,349 | |
| | | | | | | | | | | | | | | | | | | | | | | | | | | | | | | |
| | — | | | | — | | | | — | | | | — | | | | — | | | | — | | | | — | | | | — | |
| | — | | | | — | | | | — | | | | — | | | | — | | | | — | | | | — | | | | — | |
| | — | | | | — | | | | — | | | | — | | | | — | | | | — | | | | — | | | | — | |
| | | | | | | | | | | | | | | | | | | | | | | | | | | | | | | |
| | — | | | | — | | | | — | | | | — | | | | — | | | | — | | | | — | | | | — | |
| | | | | | | | | | | | | | | | | | | | | | | | | | | | | | | |
| | — | | | | — | | | | — | | | | — | | | | 487,377 | | | | 2,069,131 | | | | 2,482,325 | | | | 11,675,961 | |
| | — | | | | — | | | | — | | | | — | | | | 15,604 | | | | 68,655 | | | | 48,018 | | | | 209,357 | |
| | — | | | | — | | | | — | | | | — | | | | (2,051,056 | ) | | | (8,714,326 | ) | | | (769,650 | ) | | | (3,344,482 | ) |
| | | | | | | | | | | | | | | | | | | | | | | | | | | | | | | |
| | — | | | | — | | | | — | | | | — | | | | (1,548,075 | ) | | | (6,576,540 | ) | | | 1,760,693 | | | | 8,540,836 | |
| | | | | | | | | | | | | | | | | | | | | | | | | | | | | | | |
| | 5,971,278 | | | | 60,060,093 | | | | 5,987,808 | | | | 55,295,001 | | | | 35,362,616 | | | | 202,195,473 | | | | 75,312,271 | | | | 437,335,735 | |
| | — | | | | — | | | | — | | | | — | | | | 210,558 | | | | 1,250,703 | | | | 471,446 | | | | 2,748,545 | |
| | (2,485,972 | ) | | | (24,267,752 | ) | | | (3,618,045 | ) | | | (32,366,796 | ) | | | (66,031,347 | ) | | | (374,886,480 | ) | | | (33,791,885 | ) | | | (198,401,163 | ) |
| | | | | | | | | | | | | | | | | | | | | | | | | | | | | | | |
| | 3,485,306 | | | | 35,792,341 | | | | 2,369,763 | | | | 22,928,205 | | | | (30,458,173 | ) | | | (171,440,304 | ) | | | 41,991,832 | | | | 241,683,117 | |
| | | | | | | | | | | | | | | | | | | | | | | | | | | | | | | |
| | 9,707,380 | | | | 96,179,684 | | | | 10,054,252 | | | | 92,244,069 | | | | 1,293,710 | | | | 7,420,009 | | | | 4,210,401 | | | | 26,472,516 | |
| | — | | | | — | | | | — | | | | — | | | | 10,078 | | | | 60,366 | | | | 18,374 | | | | 107,673 | |
| | (3,479,384 | ) | | | (34,592,124 | ) | | | (2,436,608 | ) | | | (22,196,320 | ) | | | (2,755,432 | ) | | | (15,973,671 | ) | | | (2,067,243 | ) | | | (12,212,366 | ) |
| | | | | | | | | | | | | | | | | | | | | | | | | | | | | | | |
| | 6,227,996 | | | | 61,587,560 | | | | 7,617,644 | | | | 70,047,749 | | | | (1,451,644 | ) | | | (8,493,296 | ) | | | 2,161,532 | | | | 14,367,823 | |
| | | | | | | | | | | | | | | | | | | | | | | | | | | | | | | |
| | 9,713,302 | | | $ | 97,379,901 | | | | 9,987,407 | | | $ | 92,975,954 | | | | (34,754,474 | ) | | $ | (192,771,204 | ) | | | 49,714,342 | | | $ | 284,669,125 | |
Statements of Changes in Net Assets - Capital Stock Activity (Continued)
| | | Touchstone Sustainability | |
| | | and Impact Equity Fund | |
| | | For the Year | | | For the Year | |
| | | Ended | | | Ended | |
| | | March 31, 2017 | | | March 31, 2016 | |
| | | Shares | | | Dollars | | | Shares | | | Dollars | |
| Class A | | | | | | | | | | | | | | | | |
| Proceeds from Shares issued | | | 345,879 | | | $ | 6,944,695 | | | | 706,280 | | | $ | 14,839,030 | |
| Reinvestment of distributions | | | 29,039 | | | | 585,151 | | | | 3,095,277 | | | | 63,666,766 | |
| Cost of Shares redeemed | | | (2,355,115 | ) | | | (47,349,366 | ) | | | (4,875,781 | ) | | | (110,529,641 | ) |
| Change from Class A Share Transactions | | | (1,980,197 | ) | | | (39,819,520 | ) | | | (1,074,224 | ) | | | (32,023,845 | ) |
| Class B(A) | | | | | | | | | | | | | | | | |
| Proceeds from Shares issued | | | — | | | | — | | | | 8,519 | | | | 156,498 | |
| Reinvestment of distributions | | | — | | | | — | | | | 19,366 | | | | 355,752 | |
| Cost of Shares redeemed | | | (27,123 | ) | | | (470,493 | ) | | | (60,699 | ) | | | (1,082,423 | ) |
| Change from Class B Share Transactions | | | (27,123 | ) | | | (470,493 | ) | | | (32,814 | ) | | | (570,173 | ) |
| Class C | | | | | | | | | | | | | | | | |
| Proceeds from Shares issued | | | 149,007 | | | | 2,569,234 | | | | 759,874 | | | | 13,625,313 | |
| Reinvestment of distributions | | | 1,120 | | | | 19,562 | | | | 1,146,660 | | | | 20,605,480 | |
| Cost of Shares redeemed | | | (996,552 | ) | | | (17,254,366 | ) | | | (2,146,573 | ) | | | (42,123,412 | ) |
| Change from Class C Share Transactions | | | (846,425 | ) | | | (14,665,570 | ) | | | (240,039 | ) | | | (7,892,619 | ) |
| Class Y | | | | | | | | | | | | | | | | |
| Proceeds from Shares issued | | | 3,242,442 | | | | 66,535,198 | | | | 1,864,952 | | | | 39,445,520 | |
| Reinvestment of distributions | | | 31,446 | | | | 650,605 | | | | 2,799,042 | | | | 59,003,816 | |
| Cost of Shares redeemed | | | (1,642,723 | ) | | | (33,852,465) | | | | (14,428,732 | ) | | | (372,515,157 | ) |
| Change from Class Y Share Transactions | | | 1,631,165 | | | | 33,333,338 | | | | (9,764,738 | ) | | | (274,065,821 | ) |
| Institutional Class | | | | | | | | | | | | | | | | |
| Proceeds from Shares issued | | | 1,064,008 | | | | 22,131,021 | | | | 393,939 | | | | 7,896,474 | |
| Reinvestment of distributions | | | 7,533 | | | | 155,934 | | | | 38 | | | | 801 | |
| Cost of Shares redeemed | | | (81,168 | ) | | | (1,637,170 | ) | | | (43,017 | ) | | | (802,017 | ) |
| Change from Institutional Class Share Transactions | | | 990,373 | | | | 20,649,785 | | | | 350,960 | | | | 7,095,258 | |
| | | | | | | | | | | | | | | | | |
| Change from Share Transactions | | | (232,207 | ) | | $ | (972,460) | | | | (10,760,855 | ) | | $ | (307,457,200 | ) |
(A) Class B shares automatically convert to Class A shares after 8 years from the initial purchase. The conversion will occur in the month following the 8-year anniversary. During the year ended March 31, 2017, all Class B shares were converted to Class A shares as they reached their 8-year anniversary and are shown as share redemptions for Class B shares above.
See accompanying Notes to Financial Statements.
Financial Highlights
Touchstone Flexible Income Fund—Class A
Selected Data for a Share Outstanding Throughout Each Period
| | | | | | Eight Months | | | | |
| | | | | | Ended | | | Year Ended | |
| | | Year Ended March 31, | | | March 31, | | | July 31, | |
| | | 2017 | | | 2016 | | | 2015 | | | 2014 | | | 2013(A) | | | 2012 | |
| Net asset value at beginning of period | | $ | 10.58 | | | $ | 10.67 | | | $ | 10.60 | | | $ | 10.94 | | | $ | 10.76 | | | $ | 10.47 | |
| Income (loss) from investment operations: | | | | | | | | | | | | | | | | | | | | | | | | |
| Net investment income | | | 0.30 | | | | 0.32 | | | | 0.43 | | | | 0.51 | | | | 0.35 | (B) | | | 0.49 | (C) |
| Net realized and unrealized gains (losses) on investments | | | 0.11 | | | | (0.10 | ) | | | 0.11 | | | | (0.37 | ) | | | 0.16 | | | | 0.31 | |
| Total from investment operations | | | 0.41 | | | | 0.22 | | | | 0.54 | | | | 0.14 | | | | 0.51 | | | | 0.80 | |
| Distributions from: | | | | | | | | | | | | | | | | | | | | | | | | |
| Net investment income | | | (0.28 | ) | | | (0.31 | ) | | | (0.47 | ) | | | (0.48 | ) | | | (0.33 | ) | | | (0.51 | ) |
| Net asset value at end of period | | $ | 10.71 | | | $ | 10.58 | | | $ | 10.67 | | | $ | 10.60 | | | $ | 10.94 | | | $ | 10.76 | |
| Total return(D) | | | 3.93 | % | | | 2.13 | % | | | 5.22 | % | | | 1.45 | % | | | 4.77 | %(E) | | | 7.86 | % |
| Ratios and supplemental data: | | | | | | | | | | | | | | | | | | | | | | | | |
| Net assets at end of period (000's) | | $ | 49,544 | | | $ | 57,671 | | | $ | 32,695 | | | $ | 25,928 | | | $ | 41,301 | | | $ | 49,458 | |
| Ratio to average net assets: | | | | | | | | | | | | | | | | | | | | | | | | |
| Net expenses (including dividend and interest expense on securities sold short) | | | 1.10 | %(G) | | | 1.09 | % | | | 1.09 | % | | | 0.98 | % | | | 0.94 | %(F) | | | 0.95 | % |
| Gross expenses (including dividend and interest expense on securities sold short) | | | 1.30 | %(H) | | | 1.32 | % | | | 1.35 | % | | | 1.35 | % | | | 1.37 | %(F) | | | 1.60 | % |
| Net investment income | | | 2.74 | % | | | 3.19 | % | | | 3.95 | % | | | 4.82 | % | | | 4.76 | %(B)(F) | | | 4.65 | % |
| Portfolio turnover rate | | | 127 | % | | | 122 | % | | | 102 | % | | | 44 | % | | | 41 | %(E) | | | 47 | % |
| (A) | The Fund changed its fiscal year end from July 31 to March 31. |
| (B) | Reflects the impact of a corporate action event that resulted in a one-time increase to net investment income. If the corporate action event had not occurred, Class A net investment income per share and ratio of net investment income to average net assets would have been lower by $0.01 and 0.13%, respectively. |
| (C) | The net investment income per share is based on average shares outstanding for the period. |
| (D) | Total returns shown exclude the effect of applicable sales loads. If these charges were included, the returns would be lower. |
| (G) | The ratio of net expenses to average net assets excluding dividend and interest expense on securities sold short for Class A is 1.09% for the year ended March 31, 2017. |
| (H) | The ratio of gross expenses to average net assets excluding dividend and interest expense on securities sold short for Class A is 1.29% for the year March 31, 2017. |
See accompanying Notes to Financial Statements.
Financial Highlights (Continued)
Touchstone Flexible Income Fund—Class C
Selected Data for a Share Outstanding Throughout Each Period
| | | | | | Eight Months | | | | | | |
| | | | | | Ended | | | | | Year Ended | |
| | | Year Ended March 31, | | | March 31, | | | | | July 31, | |
| | | 2017 | | | 2016 | | | 2015 | | | 2014 | | | 2013(A) | | | | | 2012 | |
| Net asset value at beginning of period | | $ | 10.44 | | | $ | 10.54 | | | $ | 10.47 | | | $ | 10.82 | | | $ | 10.65 | | | | | | $ | 10.36 | |
| Income (loss) from investment operations: | | | | | | | | | | | | | | | | | | | | | | | | | | | |
| Net investment income | | | 0.20 | | | | 0.26 | | | | 0.34 | | | | 0.43 | | | | 0.29 | (B) | | | | | | 0.40 | (C) |
| Net realized and unrealized gains (losses) on investments | | | 0.13 | | | | (0.12 | ) | | | 0.12 | | | | (0.37 | ) | | | 0.15 | | | | | | | 0.32 | |
| Total from investment operations | | | 0.33 | | | | 0.14 | | | | 0.46 | | | | 0.06 | | | | 0.44 | | | | | | | 0.72 | |
| Distributions from: | | | | | | | | | | | | | | | | | | | | | | | | | | | |
| Net investment income | | | (0.20 | ) | | | (0.24 | ) | | | (0.39 | ) | | | (0.41 | ) | | | (0.27 | ) | | | | | | (0.43 | ) |
| Net asset value at end of period | | $ | 10.57 | | | $ | 10.44 | | | $ | 10.54 | | | $ | 10.47 | | | $ | 10.82 | | | | | | $ | 10.65 | |
| Total return(D) | | | 3.22 | % | | | 1.32 | % | | | 4.52 | % | | | 0.61 | % | | | 4.20 | %(E) | | | | | | 7.16 | % |
| Ratios and supplemental data: | | | | | | | | | | | | | | | | | | | | | | | | | | | |
| Net assets at end of period (000's) | | $ | 55,043 | | | $ | 45,079 | | | $ | 25,853 | | | $ | 21,043 | | | $ | 26,087 | | | | | | $ | 25,115 | |
| Ratio to average net assets: | | | | | | | | | | | | | | | | | | | | | | | | | | | |
| Net expenses (including dividend and interest expense on securities sold short) | | | 1.85 | %(G) | | | 1.84 | % | | | 1.84 | % | | | 1.74 | % | | | 1.69 | %(F) | | | | | | 1.70 | % |
| Gross expenses (including dividend and interest expense on securities sold short) | | | 2.00 | %(H) | | | 2.05 | % | | | 2.10 | % | | | 2.09 | % | | | 2.16 | %(F) | | | | | | 2.35 | % |
| Net investment income | | | 1.99 | % | | | 2.44 | % | | | 3.20 | % | | | 4.07 | % | | | 4.01 | %(B)(F) | | | | | | 3.82 | % |
| Portfolio turnover rate | | | 127 | % | | | 122 | % | | | 102 | % | | | 44 | % | | | 41 | %(E) | | | | | | 47 | % |
| (A) | The Fund changed its fiscal year end from July 31 to March 31. |
| (B) | Reflects the impact of a corporate action event that resulted in a one-time increase to net investment income. If the corporate action event had not occurred, Class C net investment income per share and ratio of net investment income to average net assets would have been lower by $0.01 and 0.13%, respectively. |
| (C) | The net investment income per share is based on average shares outstanding for the period. |
| (D) | Total returns shown exclude the effect of applicable sales loads. If these charges were included, the returns would be lower. |
| (G) | The ratio of net expenses to average net assets excluding dividend and interest expense on securities sold short for Class C is 1.84% for the year ended March 31, 2017. |
| (H) | The ratio of gross expenses to average net assets excluding dividend and interest expense on securities sold short for Class C is 1.99% for the year ended March 31, 2017. |
See accompanying Notes to Financial Statements.
Financial Highlights (Continued)
Touchstone Flexible Income Fund—Class Y
Selected Data for a Share Outstanding Throughout Each Period
| | | | | | | | | | | | | | | Eight Months | | | | |
| | | | | | | | | | | | | | | Ended | | | Year Ended | |
| | | Year Ended March 31, | | | March 31, | | | July 31, | |
| | | 2017 | | | 2016 | | | 2015 | | | 2014 | | | 2013(A)(B) | | | 2012 | |
| Net asset value at beginning of period | | $ | 10.61 | | | $ | 10.70 | | | $ | 10.62 | | | $ | 10.97 | | | $ | 10.79 | | | $ | 10.49 | |
| Income (loss) from investment operations: | | | | | | | | | | | | | | | | | | | | | | | | |
| Net investment income | | | 0.32 | | | | 0.36 | | | | 0.46 | | | | 0.54 | | | | 0.37 | (C) | | | 0.50 | (D) |
| Net realized and unrealized gains (losses) on investments | | | 0.13 | | | | (0.11 | ) | | | 0.12 | | | | (0.38 | ) | | | 0.16 | | | | 0.33 | |
| Total from investment operations | | | 0.45 | | | | 0.25 | | | | 0.58 | | | | 0.16 | | | | 0.53 | | | | 0.83 | |
| Distributions from: | | | | | | | | | | | | | | | | | | | | | | | | |
| Net investment income | | | (0.31 | ) | | | (0.34 | ) | | | (0.50 | ) | | | (0.51 | ) | | | (0.35 | ) | | | (0.53 | ) |
| Net asset value at end of period | | $ | 10.75 | | | $ | 10.61 | | | $ | 10.70 | | | $ | 10.62 | | | $ | 10.97 | | | $ | 10.79 | |
| Total return | | | 4.28 | % | | | 2.38 | % | | | 5.58 | % | | | 1.63 | % | | | 4.96 | %(E) | | | 8.21 | % |
| Ratios and supplemental data: | | | | | | | | | | | | | | | | | | | | | | | | |
| Net assets at end of period (000's) | | $ | 464,002 | | | $ | 358,423 | | | $ | 238,081 | | | $ | 151,652 | | | $ | 199,293 | | | $ | 200,325 | |
| Ratio to average net assets: | | | | | | | | | | | | | | | | | | | | | | | | |
| Net expenses (including dividend and interest expense on securities sold short) | | | 0.85 | %(G) | | | 0.84 | % | | | 0.84 | % | | | 0.71 | % | | | 0.64 | %(F) | | | 0.70 | % |
| Gross expenses (including dividend and interest expense on securities sold short) | | | 1.00 | %(H) | | | 1.05 | % | | | 1.01 | % | | | 1.00 | % | | | 1.05 | %(F) | | | 1.35 | % |
| Net investment income | | | 2.99 | % | | | 3.44 | % | | | 4.21 | % | | | 5.10 | % | | | 5.06 | %(C)(F) | | | 4.80 | % |
| Portfolio turnover rate | | | 127 | % | | | 122 | % | | | 102 | % | | | 44 | % | | | 41 | %(E) | | | 47 | % |
| (A) | Effective September 10, 2012, Institutional Class shares were renamed Class Y shares. |
| (B) | The Fund changed its fiscal year end from July 31 to March 31. |
| (C) | Reflects the impact of a corporate action event that resulted in a one-time increase to net investment income. If the corporate action event had not occurred, the Class Y net investment income per share and ratio of net investment income to average net assets would have been lower by $0.01 and 0.13%, respectively. |
| (D) | The net investment income per share is based on average shares outstanding for the period. |
| (G) | The ratio of net expenses to average net assets excluding dividend and interest expense on securities sold short for Class Y is 0.84% for the year ended March 31, 2017. |
| (H) | The ratio of gross expenses to average net assets excluding dividend and interest expense on securities sold short for Class Y is 0.99% for the year ended March 31, 2017. |
See accompanying Notes to Financial Statements.
Financial Highlights (Continued)
Touchstone Flexible Income Fund—Institutional Class
Selected Data for a Share Outstanding Throughout Each Period
| | | | | | Period Ended | |
| | | Year Ended March 31, | | | March 31, | |
| | | 2017 | | | 2016 | | | 2015 | | | 2014 | | | 2013(A) | |
| Net asset value at beginning of period | | $ | 10.60 | | | $ | 10.69 | | | $ | 10.62 | | | $ | 10.96 | | | $ | 10.86 | |
| Income (loss) from investment operations: | | | | | | | | | | | | | | | | | | | | |
| Net investment income | | | 0.33 | | | | 0.36 | | | | 0.46 | | | | 0.54 | | | | 0.30 | (B) |
| Net realized and unrealized gains (losses) on investments | | | 0.13 | | | | (0.10 | ) | | | 0.12 | | | | (0.36 | ) | | | 0.12 | |
| Total from investment operations | | | 0.46 | | | | 0.26 | | | | 0.58 | | | | 0.18 | | | | 0.42 | |
| Distributions from: | | | | | | | | | | | | | | | | | | | | |
| Net investment income | | | (0.32 | ) | | | (0.35 | ) | | | (0.51 | ) | | | (0.52 | ) | | | (0.32 | ) |
| Net asset value at end of period | | $ | 10.74 | | | $ | 10.60 | | | $ | 10.69 | | | $ | 10.62 | | | $ | 10.96 | |
| Total return | | | 4.28 | % | | | 2.57 | % | | | 5.58 | % | | | 1.81 | % | | | 3.93 | %(C) |
| Ratios and supplemental data: | | | | | | | | | | | | | | | | | | | | |
| Net assets at end of period (000's) | | $ | 104,631 | | | $ | 82,286 | | | $ | 44,732 | | | $ | 41,361 | | | $ | 20,589 | |
| Ratio to average net assets: | | | | | | | | | | | | | | | | | | | | |
| Net expenses (including dividend and interest expense on securities sold short) | | | 0.75 | %(E) | | | 0.74 | % | | | 0.74 | % | | | 0.65 | % | | | 0.59 | %(D) |
| Gross expenses (including dividend and interest expense on securities sold short) | | | 0.92 | %(F) | | | 0.94 | % | | | 0.95 | % | | | 0.95 | % | | | 1.03 | %(D) |
| Net investment income | | | 3.09 | % | | | 3.54 | % | | | 4.30 | % | | | 5.16 | % | | | 5.11 | %(B)(D) |
| Portfolio turnover rate | | | 127 | % | | | 122 | % | | | 102 | % | | | 44 | % | | | 41 | %(C) |
| (A) | Represents the period from commencement of operations (September 10, 2012) through March 31, 2013. |
| (B) | Reflects the impact of a corporate action event that resulted in a one-time increase to net investment income. If the corporate action event had not occurred, the Institutional Class net investment income per share and ratio of net investment income to average net assets would have been lower by $0.01 and 0.13%, respectively. |
| (E) | The ratio of net expenses to average net assets excluding dividend and interest expense on securities sold short for Institutional Class is 0.74%% for the year ended March 31, 2017. |
| (F) | The ratio of gross expenses to average net assets excluding dividend and interest expense on securities sold short for institutional Class is 0.91% for the year ended March 31, 2017. |
See accompanying Notes to Financial Statements.
Financial Highlights (Continued)
Touchstone Focused Fund—Class A
Selected Data for a Share Outstanding Throughout Each Period
| | | Year Ended March 31, | |
| | | 2017 | | | 2016 | | | 2015 | | | 2014 | | | 2013 | |
| Net asset value at beginning of period | | $ | 36.68 | | | $ | 37.19 | | | $ | 34.87 | | | $ | 27.55 | | | $ | 23.63 | |
| Income from investment operations: | | | | | | | | | | | | | | | | | | | | |
| Net investment income(A) | | | 0.15 | | | | 0.16 | | | | 0.20 | | | | 0.11 | | | | 0.16 | |
| Net realized and unrealized gains on investments | | | 5.12 | | | | 0.38 | | | | 2.23 | | | | 7.46 | | | | 3.79 | (B) |
| Total from investment operations | | | 5.27 | | | | 0.54 | | | | 2.43 | | | | 7.57 | | | | 3.95 | |
| Distributions from: | | | | | | | | | | | | | | | | | | | | |
| Net investment income | | | (0.14 | ) | | | (0.20 | ) | | | (0.11 | ) | | | (0.25 | ) | | | (0.03 | ) |
| Realized capital gains | | | (0.34 | ) | | | (0.85 | ) | | | — | | | | — | | | | — | |
| Total distributions | | | (0.48 | ) | | | (1.05 | ) | | | (0.11 | ) | | | (0.25 | ) | | | (0.03 | ) |
| Net asset value at end of period | | $ | 41.47 | $ | | | 36.68 | $ | | | 37.19 | | | $ | 34.87 | | | $ | 27.55 | |
| Total return(C) | | | 14.45 | % | | | 1.47 | % | | | 6.99 | % | | | 27.67 | % | | | 16.75 | %(B) |
| Ratios and supplemental data: | | | | | | | | | | | | | | | | | | | | |
| Net assets at end of period (000's) | | $ | 425,366 | | | $ | 405,458 | $ | | | 297,072 | | | $ | 233,841 | $ | | | 8,497 | |
| Ratio to average net assets: | | | | | | | | | | | | | | | | | | | | |
| Net expenses | | | 1.20 | % | | | 1.20 | % | | | 1.20 | % | | | 1.20 | % | | | 1.20 | % |
| Gross expenses | | | 1.28 | % | | | 1.31 | % | | | 1.37 | % | | | 1.46 | % | | | 1.90 | % |
| Net investment income | | | 0.39 | % | | | 0.43 | % | | | 0.57 | % | | | 0.35 | % | | | 0.66 | % |
| Portfolio turnover rate | | | 20 | % | | | 28 | % | | | 33 | % | | | 27 | %(D) | | | 189 | % |
Touchstone Focused Fund—Class C
Selected Data for a Share Outstanding Throughout Each Period
| | | | | | | | | | | | | | | Period Ended | |
| | | Year Ended March 31, | | March 31, | |
| | | 2017 | | | 2016 | | | 2015 | | | 2014 | | | 2013(E) | |
| Net asset value at beginning of period | | $ | 35.54 | | | $ | 36.34 | | | $ | 34.32 | | | $ | 27.33 | | | $ | 22.61 | |
| Income (loss) from investment operations: | | | | | | | | | | | | | | | | | | | | |
| Net investment loss(A) | | | (0.13 | ) | | | (0.11 | ) | | | (0.06 | ) | | | (0.13 | ) | | | (0.02 | ) |
| Net realized and unrealized gains on investments | | | 4.94 | | | | 0.37 | | | | 2.18 | | | | 7.38 | | | | 4.80 | (B) |
| Total from investment operations | | | 4.81 | | | | 0.26 | | | | 2.12 | | | | 7.25 | | | | 4.78 | |
| Distributions from: | | | | | | | | | | | | | | | | | | | | |
| Net investment income | | | (0.11 | ) | | | (0.21 | ) | | | (0.10 | ) | | | (0.26 | ) | | | (0.06 | ) |
| Realized capital gains | | | (0.34 | ) | | | (0.85 | ) | | | — | | | | — | | | | — | |
| Total distributions | | | (0.45 | ) | | | (1.06 | ) | | | (0.10 | ) | | | (0.26 | ) | | | (0.06 | ) |
| Net asset value at end of period | | $ | 39.90 | | | $ | 35.54 | | | $ | 36.34 | | | $ | 34.32 | | | $ | 27.33 | |
| Total return(C) | | | 13.56 | % | | | 0.73 | % | | | 6.18 | % | | | 26.72 | % | | | 21.19 | %(B)(F) |
| Ratios and supplemental data: | | | | | | | | | | | | | | | | | | | | |
| Net assets at end of period (000's) | | $ | 53,776 | | | $ | 44,338 | | | $ | 9,617 | | | $ | 5,626 | | | $ | 60 | |
| Ratio to average net assets: | | | | | | | | | | | | | | | | | | | | |
| Net expenses | | | 1.95 | % | | | 1.95 | % | | | 1.95 | % | | | 1.95 | % | | | 1.95 | %(G) |
| Gross expenses | | | 1.97 | % | | | 2.00 | % | | | 2.09 | % | | | 2.84 | % | | | 258.39 | %(G) |
| Net investment loss | | | (0.36 | %) | | | (0.32 | %) | | | (0.18 | %) | | | (0.40 | %) | | | (0.09 | %)(G) |
| Portfolio turnover rate | | | 20 | % | | | 28 | % | | | 33 | % | | | 27 | %(D) | | | 189 | % |
| (A) | The net investment income (loss) per share is based on average shares outstanding for the period. |
| (B) | Net realized gains (losses) on investments per share and total return reflect non-recurring litigation settlements. These resulted in an increase in net realized gains per share of $0.18 and an increase in total return of 0.76% and 0.78% for Class A and Class C, respectively. |
| (C) | Total returns shown exclude the effect of applicable sales loads. If these charges were included, the returns would be lower. |
| (D) | Portfolio turnover excludes the purchases and sales of the Touchstone Focused Equity Fund acquired on May 17, 2013. If these transactions were included, portfolio turnover would have been higher. |
| (E) | Represents the period from commencement of operations (April 16, 2012) through March 31, 2013. |
See accompanying Notes to Financial Statements.
Financial Highlights (Continued)
Touchstone Focused Fund—Class Y
Selected Data for a Share Outstanding Throughout Each Period
| | | Year Ended March 31, |
| | | 2017 | | | 2016 | | | 2015 | | | 2014 | | | 2013 | |
| Net asset value at beginning of period | | $ | 37.29 | | | $ | 37.76 | | | $ | 35.34 | | | $ | 27.86 | | | $ | 23.85 | |
| Income from investment operations: | | | | | | | | | | | | | | | | | | | | |
| Net investment income(A) | | | 0.27 | | | | 0.26 | | | | 0.31 | | | | 0.19 | | | | 0.22 | |
| Net realized and unrealized gains on investments | | | 5.22 | | | | 0.39 | | | | 2.26 | | | | 7.54 | | | | 3.84 | (B) |
| Total from investment operations | | | 5.49 | | | | 0.65 | | | | 2.57 | | | | 7.73 | | | | 4.06 | |
| Distributions from: | | | | | | | | | | | | | | | | | | | | |
| Net investment income | | | (0.23 | ) | | | (0.27 | ) | | | (0.15 | ) | | | (0.25 | ) | | | (0.05 | ) |
| Realized capital gains | | | (0.34 | ) | | | (0.85 | ) | | | — | | | | — | | | | — | |
| Total distributions | | | (0.57 | ) | | | (1.12 | ) | | | (0.15 | ) | | | (0.25 | ) | | | (0.05 | ) |
| Net asset value at end of period | | $ | 42.21 | | | $ | 37.29 | | | $ | 37.76 | | | $ | 35.34 | | | $ | 27.86 | |
| Total return | | | 14.77 | % | | | 1.75 | % | | | 7.29 | % | | | 27.95 | % | | | 17.07 | %(B) |
| Ratios and supplemental data: | | | | | | | | | | | | | | | | | | | | |
| Net assets at end of period (000's) | | $ | 974,660 | | | $ | 853,900 | | | $ | 756,579 | | | $ | 736,023 | | | $ | 578,006 | |
| Ratio to average net assets: | | | | | | | | | | | | | | | | | | | | |
| Net expenses | | | 0.92 | % | | | 0.93 | % | | | 0.92 | % | | | 0.94 | % | | | 0.95 | % |
| Gross expenses | | | 0.92 | % | | | 0.94 | % | | | 0.97 | % | | | 1.02 | % | | | 1.05 | % |
| Net investment income | | | 0.68 | % | | | 0.70 | % | | | 0.85 | % | | | 0.61 | % | | | 0.91 | % |
| Portfolio turnover rate | | | 20 | % | | | 28 | % | | | 33 | % | | | 27 | %(C) | | | 189 | % |
Touchstone Focused Fund—Institutional Class
Selected Data for a Share Outstanding Throughout Each Period
| | | Year Ended March 31, | |
| | | 2017 | | | 2016 | | | 2015 | | | 2014 | | | 2013 | |
| Net asset value at beginning of period | | $ | 37.45 | | | $ | 37.91 | | | $ | 35.47 | | | $ | 27.96 | | | $ | 23.91 | |
| Income from investment operations: | | | | | | | | | | | | | | | | | | | | |
| Net investment income(A) | | | 0.30 | | | | 0.31 | | | | 0.35 | | | | 0.24 | | | | 0.25 | |
| Net realized and unrealized gains on investments | | | 5.24 | | | | 0.39 | | | | 2.28 | | | | 7.57 | | | | 3.86 | (B) |
| Total from investment operations | | | 5.54 | | | | 0.70 | | | | 2.63 | | | | 7.81 | | | | 4.11 | |
| Distributions from: | | | | | | | | | | | | | | | | | | | | |
| Net investment income | | | (0.27 | ) | | | (0.31 | ) | | | (0.19 | ) | | | (0.30 | ) | | | (0.06 | ) |
| Realized capital gains | | | (0.34 | ) | | | (0.85 | ) | | | — | | | | — | | | | — | |
| Total distributions | | | (0.61 | ) | | | (1.16 | ) | | | (0.19 | ) | | | (0.30 | ) | | | (0.06 | ) |
| Net asset value at end of period | | $ | 42.38 | | | $ | 37.45 | | | $ | 37.91 | | | $ | 35.47 | | | $ | 27.96 | |
| Total return | | | 14.84 | % | | | 1.89 | % | | | 7.40 | % | | | 28.19 | % | | | 17.24 | %(B) |
| Ratios and supplemental data: | | | | | | | | | | | | | | | | | | | | |
| Net assets at end of period (000's) | | $ | 41,389 | | | $ | 48,805 | | | $ | 51,765 | | | $ | 30,446 | | | $ | 589 | |
| Ratio to average net assets: | | | | | | | | | | | | | | | | | | | | |
| Net expenses | | | 0.83 | % | | | 0.82 | % | | | 0.80 | % | | | 0.80 | % | | | 0.80 | % |
| Gross expenses | | | 0.88 | % | | | 0.90 | % | | | 0.88 | % | | | 1.00 | % | | | 1.16 | % |
| Net investment income | | | 0.76 | % | | | 0.81 | % | | | 0.97 | % | | | 0.75 | % | | | 1.06 | % |
| Portfolio turnover rate | | | 20 | % | | | 28 | % | | | 33 | % | | | 27 | %(C) | | | 189 | % |
| (A) | The net investment income per share is based on average shares outstanding for the period. |
| (B) | Net realized gains (losses) on investments per share and total return reflect non-recurring litigation settlements. These resulted in an increase in net realized gains per share of $0.18 and an increase in total return of 0.76% and 0.75% for Class Y and Institutional Class, respectively. |
| (C) | Portfolio turnover excludes the purchases and sales of the Touchstone Focused Equity Fund acquired on May 17, 2013. If these transactions were included, portfolio turnover would have been higher. |
See accompanying Notes to Financial Statements.
Financial Highlights (Continued)
Touchstone Growth Opportunities Fund—Class A
Selected Data for a Share Outstanding Throughout Each Period
| | | Year Ended March 31, | |
| | | 2017 | | | 2016 | | | 2015 | | | 2014 | | | 2013 | |
| Net asset value at beginning of period | | $ | 27.35 | | | $ | 33.29 | | | $ | 32.61 | | | $ | 27.05 | | | $ | 25.64 | |
| Income (loss) from investment operations: | | | | | | | | | | | | | | | | | | | | |
| Net investment income (loss) | | | (— | )(A) | | | (0.08 | ) | | | (0.15 | ) | | | 0.01 | | | | (0.01 | ) |
| Net realized and unrealized gains (losses) on investments | | | 3.86 | | | | (2.90 | ) | | | 4.82 | | | | 6.91 | | | | 3.35 | |
| Total from investment operations | | | 3.86 | | | | (2.98 | ) | | | 4.67 | | | | 6.92 | | | | 3.34 | |
| Distributions from: | | | | | | | | | | | | | | | | | | | | |
| Realized capital gains | | | (1.01 | ) | | | (2.96 | ) | | | (3.99 | ) | | | (1.36 | ) | | | (1.93 | ) |
| Net asset value at end of period | | $ | 30.20 | | | $ | 27.35 | | | $ | 33.29 | | | $ | 32.61 | | | $ | 27.05 | |
| Total return(B) | | | 14.38 | % | | | (9.12 | %) | | | 14.99 | % | | | 25.84 | % | | | 14.08 | % |
| Ratios and supplemental data: | | | | | | | | | | | | | | | | | | | | |
| Net assets at end of period (000's) | | $ | 38,752 | | | $ | 38,297 | | | $ | 49,162 | | | $ | 47,552 | | | $ | 74,588 | |
| Ratio to average net assets: | | | | | | | | | | | | | | | | | | | | |
| Net expenses | | | 1.24 | % | | | 1.24 | % | | | 1.24 | % | | | 1.22 | % | | | 1.22 | % |
| Gross expenses | | | 1.39 | % | | | 1.38 | % | | | 1.40 | % | | | 1.43 | % | | | 1.37 | % |
| Net investment income (loss) | | | (0.01 | %) | | | (0.24 | %) | | | (0.47 | %) | | | 0.09 | % | | | (0.06 | %) |
| Portfolio turnover rate | | | 90 | % | | | 137 | % | | | 87 | % | | | 79 | % | | | 95 | %(C) |
Touchstone Growth Opportunities Fund—Class C
Selected Data for a Share Outstanding Throughout Each Period
| | | Year Ended March 31, | |
| | | 2017 | | | 2016 | | | 2015 | | | 2014 | | | 2013 | |
| Net asset value at beginning of period | | $ | 23.51 | | | $ | 29.27 | | | $ | 29.32 | | | $ | 24.62 | | | $ | 23.68 | |
| Income (loss) from investment operations: | | | | | | | | | | | | | | | | | | | | |
| Net investment loss | | | (0.23 | ) | | | (0.24 | ) | | | (0.33 | ) | | | (0.18 | ) | | | (0.17 | ) |
| Net realized and unrealized gains (losses) on investments | | | 3.33 | | | | (2.56 | ) | | | 4.27 | | | | 6.24 | | | | 3.04 | |
| Total from investment operations | | | 3.10 | | | | (2.80 | ) | | | 3.94 | | | | 6.06 | | | | 2.87 | |
| Distributions from: | | | | | | | | | | | | | | | | | | | | |
| Realized capital gains | | | (1.01 | ) | | | (2.96 | ) | | | (3.99 | ) | | | (1.36 | ) | | | (1.93 | ) |
| Net asset value at end of period | | $ | 25.60 | | | $ | 23.51 | | | $ | 29.27 | | | $ | 29.32 | | | $ | 24.62 | |
| Total return(B) | | | 13.49 | % | | | (9.78 | %) | | | 14.11 | % | | | 24.92 | % | | | 13.24 | % |
| Ratios and supplemental data: | | | | | | | | | | | | | | | | | | | | |
| Net assets at end of period (000's) | | $ | 8,574 | | | $ | 11,665 | | | $ | 13,813 | | | $ | 12,498 | | | $ | 10,375 | |
| Ratio to average net assets: | | | | | | | | | | | | | | | | | | | | |
| Net expenses | | | 1.99 | % | | | 1.99 | % | | | 1.99 | % | | | 1.97 | % | | | 1.97 | % |
| Gross expenses | | | 2.26 | % | | | 2.20 | % | | | 2.21 | % | | | 2.25 | % | | | 2.37 | % |
| Net investment loss | | | (0.76 | %) | | | (0.99 | %) | | | (1.22 | %) | | | (0.66 | %) | | | (0.81 | %) |
| Portfolio turnover rate | | | 90 | % | | | 137 | % | | | 87 | % | | | 79 | % | | | 95 | %(C) |
| (A) | Less than $(0.005) per share. |
| (B) | Total returns shown exclude the effect of applicable sales loads. If these charges were included, the returns would be lower. |
| (C) | Portfolio turnover excludes the purchases and sales of the Fifth Third Mid Cap Growth Fund acquired on September 10, 2012. If these transactions were included, portfolio turnover would have been higher. |
See accompanying Notes to Financial Statements.
Financial Highlights (Continued)
Touchstone Growth Opportunities Fund—Class Y
Selected Data for a Share Outstanding Throughout Each Period
| | | Year Ended March 31, | |
| | | 2017 | | | 2016 | | | 2015 | | | 2014 | | | 2013 | |
| Net asset value at beginning of period | | $ | 27.90 | | | $ | 33.81 | | | $ | 32.97 | | | $ | 27.27 | | | $ | 25.80 | |
| Income (loss) from investment operations: | | | | | | | | | | | | | | | | | | | | |
| Net investment income (loss) | | | 0.10 | | | | — | (A) | | | (0.06 | ) | | | 0.11 | | | | 0.03 | |
| Net realized and unrealized gains (losses) on investments | | | 3.91 | | | | (2.95 | ) | | | 4.90 | | | | 6.96 | | | | 3.40 | |
| Total from investment operations | | | 4.01 | | | | (2.95 | ) | | | 4.84 | | | | 7.07 | | | | 3.43 | |
| Distributions from: | | | | | | | | | | | | | | | | | | | | |
| Net investment income | | | (0.03 | ) | | | — | | | | (0.01 | ) | | | (0.01 | ) | | | (0.03 | ) |
| Realized capital gains | | | (1.01 | ) | | | (2.96 | ) | | | (3.99 | ) | | | (1.36 | ) | | | (1.93 | ) |
| Total distributions | | | (1.04 | ) | | | (2.96 | ) | | | (4.00 | ) | | | (1.37 | ) | | | (1.96 | ) |
| Net asset value at end of period | | $ | 30.87 | | | $ | 27.90 | | | $ | 33.81 | | | $ | 32.97 | | | $ | 27.27 | |
| Total return | | | 14.64 | % | | | (8.88 | %) | | | 15.32 | % | | | 26.23 | % | | | 14.38 | % |
| Ratios and supplemental data: | | | | | | | | | | | | | | | | | | | | |
| Net assets at end of period (000's) | | $ | 47,222 | | | $ | 83,721 | | | $ | 107,295 | | | $ | 92,063 | | | $ | 35,354 | |
| Ratio to average net assets: | | | | | | | | | | | | | | | | | | | | |
| Net expenses | | | 0.99 | % | | | 0.99 | % | | | 0.94 | % | | | 0.92 | % | | | 0.96 | % |
| Gross expenses | | | 1.07 | % | | | 1.07 | % | | | 1.01 | % | | | 1.03 | % | | | 1.16 | % |
| Net investment income (loss) | | | 0.24 | % | | | 0.01 | % | | | (0.17 | %) | | | 0.39 | % | | | 0.19 | % |
| Portfolio turnover rate | | | 90 | % | | | 137 | % | | | 87 | % | | | 79 | % | | | 95 | %(B) |
Touchstone Growth Opportunities Fund—Institutional Class
Selected data for a Share Outstanding Throughout Each Period
| | | Year Ended March 31, | |
| | | 2017 | | | 2016 | | | 2015 | | | 2014 | | | 2013 | |
| Net asset value at beginning of period | | $ | 28.15 | | | $ | 34.05 | | | $ | 33.18 | | | $ | 27.42 | | | $ | 25.92 | |
| Income (loss) from investment operations: | | | | | | | | | | | | | | | | | | | | |
| Net investment income (loss) | | | 0.12 | | | | 0.01 | | | | (0.04 | ) | | | 0.14 | | | | 0.07 | |
| Net realized and unrealized gains (losses) on investments | | | 3.96 | | | | (2.95 | ) | | | 4.92 | | | | 7.01 | | | | 3.41 | |
| Total from investment operations | | | 4.08 | | | | (2.94 | ) | | | 4.88 | | | | 7.15 | | | | 3.48 | |
| Distributions from: | | | | | | | | | | | | | | | | | | | | |
| Net investment income | | | (0.06 | ) | | | — | | | | (0.02 | ) | | | (0.03 | ) | | | (0.05 | ) |
| Realized capital gains | | | (1.01 | ) | | | (2.96 | ) | | | (3.99 | ) | | | (1.36 | ) | | | (1.93 | ) |
| Total distributions | | | (1.07 | ) | | | (2.96 | ) | | | (4.01 | ) | | | (1.39 | ) | | | (1.98 | ) |
| Net asset value at end of period | | $ | 31.16 | | | $ | 28.15 | | | $ | 34.05 | | | $ | 33.18 | | | $ | 27.42 | |
| Total return | | | 14.77 | % | | | (8.79 | %) | | | 15.39 | % | | | 26.34 | % | | | 14.50 | % |
| Ratios and supplemental data: | | | | | | | | | | | | | | | | | | | | |
| Net assets at end of period (000's) | | $ | 150,038 | | | $ | 176,191 | | | $ | 134,795 | | | $ | 115,769 | | | $ | 93,800 | |
| Ratio to average net assets: | | | | | | | | | | | | | | | | | | | | |
| Net expenses | | | 0.89 | % | | | 0.89 | % | | | 0.87 | % | | | 0.84 | % | | | 0.84 | % |
| Gross expenses | | | 1.00 | % | | | 0.98 | % | | | 0.97 | % | | | 0.98 | % | | | 1.00 | % |
| Net investment income (loss) | | | 0.34 | % | | | 0.11 | % | | | (0.10 | %) | | | 0.47 | % | | | 0.31 | % |
| Portfolio turnover rate | | | 90 | % | | | 137 | % | | | 87 | % | | | 79 | % | | | 95 | %(B) |
| (A) | Less than $0.005 per share. |
| (B) | Portfolio turnover excludes the purchases and sales of the Fifth Third Mid Cap Growth Fund acquired on September 10, 2012. If these transactions were included, portfolio turnover would have been higher. |
See accompanying Notes to Financial Statements.
Financial Highlights (Continued)
Touchstone International Growth Fund—Class A
Selected Data for a Share Outstanding Throughout The Period
| | | Year Ended | |
| | | March 31, | |
| | | 2017(A) | |
| Net asset value at beginning of period | | $ | 10.00 | |
| Income from investment operations: | | | | |
| Net investment income | | | 0.02 | |
| Net realized and unrealized gains on investments | | | 0.80 | |
| Total from investment operations | | | 0.82 | |
| Distributions from: | | | | |
| Net investment income | | | (0.02 | ) |
| Net asset value at end of period | | $ | 10.80 | |
| Total return(B) | | | 8.26 | % |
| Ratios and supplemental data: | | | | |
| Net assets at end of period (000's) | | $ | 39 | |
| Ratio to average net assets: | | | | |
| Net expenses | | | 1.32 | % |
| Gross expenses | | | 190.56 | % |
| Net investment income | | | 0.57 | % |
| Portfolio turnover rate | | | 63 | % |
Touchstone International Growth Fund—Class C
Selected Data for a Share Outstanding Throughout The Period
| | | Year Ended | |
| | | March 31, | |
| | | 2017(A) | |
| Net asset value at beginning of period | | $ | 10.00 | |
| Income from investment operations: | | | | |
| Net investment loss | | | (0.02 | ) |
| Net realized and unrealized gains on investments | | | 0.76 | |
| Total from investment operations | | | 0.74 | |
| Net asset value at end of period | | $ | 10.74 | |
| Total return(B) | | | 7.40 | % |
| Ratios and supplemental data: | | | | |
| Net assets at end of period (000's) | | $ | 3 | |
| Ratio to average net assets: | | | | |
| Net expenses | | | 2.07 | % |
| Gross expenses | | | 291.55 | % |
| Net investment loss | | | (0.18 | %) |
| Portfolio turnover rate | | | 63 | % |
| (A) | Represents the period from commencement of operations (April 1, 2016) through March 31, 2017. |
| (B) | Total returns shown exclude the effect of applicable sales loads. If these charges were included, the returns would be lower. |
See accompanying Notes to Financial Statements.
Financial Highlights (Continued)
Touchstone International Growth Fund—Class Y
Selected Data for a Share Outstanding Throughout The Period
| | | Year Ended | |
| | | March 31, | |
| | | 2017(A) | |
| Net asset value at beginning of period | | $ | 10.00 | |
| Income from investment operations: | | | | |
| Net investment income | | | 0.08 | |
| Net realized and unrealized gains on investments | | | 0.76 | |
| Total from investment operations | | | 0.84 | |
| Distributions from: | | | | |
| Net investment income | | | (0.05 | ) |
| Net asset value at end of period | | $ | 10.79 | |
| Total return | | | 8.39 | % |
| Ratios and supplemental data: | | | | |
| Net assets at end of period (000's) | | $ | 4 | |
| Ratio to average net assets: | | | | |
| Net expenses | | | 1.07 | % |
| Gross expenses | | | 276.18 | % |
| Net investment income | | | 0.82 | % |
| Portfolio turnover rate | | | 63 | % |
Touchstone International Growth Fund—Institutional Class
Selected Data for a Share Outstanding Throughout The Period
| | | Year Ended | |
| | | March 31, | |
| | | 2017(A) | |
| Net asset value at beginning of period | | $ | 10.00 | |
| Income from investment operations: | | | | |
| Net investment income | | | 0.08 | |
| Net realized and unrealized gains on investments | | | 0.77 | |
| Total from investment operations | | | 0.85 | |
| Distributions from: | | | | |
| Net investment income | | | (0.05 | ) |
| Net asset value at end of period | | $ | 10.80 | |
| Total return | | | 8.56 | % |
| Ratios and supplemental data: | | | | |
| Net assets at end of period (000's) | | $ | 11,874 | |
| Ratio to average net assets: | | | | |
| Net expenses | | | 0.97 | % |
| Gross expenses | | | 1.86 | % |
| Net investment income | | | 0.92 | % |
| Portfolio turnover rate | | | 63 | % |
| (A) | Represents the period from commencement of operations (April 1, 2016) through March 31, 2017. |
See accompanying Notes to Financial Statements.
Financial Highlights (Continued)
Touchstone International Value Fund—Class A
Selected Data for a Share Outstanding Throughout Each Period
| | | | | | | | | | | | Eight Months | | | | |
| | | | | | | | | | | | Ended | | | Year Ended | |
| | | Year Ended March 31, | | | March 31, | | | July 31, | |
| | | 2017 | | | 2016 | | | 2015 | | | 2014 | | | 2013(A) | | | 2012 | |
| Net asset value at beginning of period | | $ | 7.37 | | | $ | 8.41 | | | $ | 9.12 | | | $ | 7.62 | | | $ | 7.06 | | | $ | 8.42 | |
| Income (loss) from investment operations: | | | | | | | | | | | | | | | | | | | | | | | | |
| Net investment income | | | 0.16 | (B) | | | 0.14 | (B) | | | 0.18 | | | | 0.24 | | | | 0.06 | (B) | | | 0.14 | (B) |
| Net realized and unrealized gains (losses) on investments | | | 0.57 | | | | (0.97 | ) | | | (0.63 | ) | | | 1.35 | | | | 0.73 | | | | (1.30 | ) |
| Total from investment operations | | | 0.73 | | | | (0.83 | ) | | | (0.45 | ) | | | 1.59 | | | | 0.79 | | | | (1.16 | ) |
| Distributions from: | | | | | | | | | | | | | | | | | | | | | | | | |
| Net investment income | | | (0.90 | ) | | | (0.21 | ) | | | (0.26 | ) | | | (0.09 | ) | | | (0.23 | ) | | | (0.20 | ) |
| Net asset value at end of period | | $ | 7.20 | | | $ | 7.37 | | | $ | 8.41 | | | $ | 9.12 | | | $ | 7.62 | | | $ | 7.06 | |
| Total return(C) | | | 10.80 | % | | | (9.97 | %) | | | (4.95 | %) | | | 20.90 | % | | | 11.15 | %(D) | | | (13.67 | %) |
| Ratios and supplemental data: | | | | | | | | | | | | | | | | | | | | | | | | |
| Net assets at end of period (000's) | | $ | 3,548 | | | $ | 3,700 | | | $ | 5,280 | | | $ | 6,032 | | | $ | 6,394 | | | $ | 7,266 | |
| Ratio to average net assets: | | | | | | | | | | | | | | | | | | | | | | | | |
| Net expenses | | | 1.34 | % | | | 1.36 | % | | | 1.39 | % | | | 1.37 | % | | | 1.36 | %(E)(F) | | | 1.40 | %(F) |
| Gross expenses | | | 2.56 | % | | | 2.10 | % | | | 1.97 | % | | | 1.79 | % | | | 2.22 | %(E) | | | 1.68 | % |
| Net investment income | | | 2.16 | % | | | 1.78 | % | | | 1.89 | % | | | 2.32 | % | | | 1.21 | %(E) | | | 2.00 | % |
| Portfolio turnover rate | | | 23 | % | | | 38 | % | | | 26 | % | | | 31 | % | | | 133 | %(D) | | | 121 | % |
Touchstone International Value Fund—Class C
Selected Data for a Share Outstanding Throughout Each Period
| | | | | | | | | | | | Eight Months | | | | |
| | | | | | | | | | | | Ended Year | | | Ended | |
| | | Year Ended March 31, | | | March 31, | | | July 31, | |
| | | 2017 | | | 2016 | | | 2015 | | | 2014 | | | 2013(A) | | | 2012 | |
| Net asset value at beginning of period | | $ | 6.83 | | | $ | 7.77 | | | $ | 8.46 | | | $ | 7.10 | | | $ | 6.59 | | | $ | 7.85 | |
| Income (loss) from investment operations: | | | | | | | | | | | | | | | | | | | | | | | | |
| Net investment income | | | 0.09 | (B) | | | 0.08 | (B) | | | 0.07 | | | | 0.15 | | | | 0.02 | (B) | | | 0.08 | (B) |
| Net realized and unrealized gains (losses) on investments | | | 0.54 | | | | (0.90 | ) | | | (0.55 | ) | | | 1.27 | | | | 0.67 | | | | (1.21 | ) |
| Total from investment operations | | | 0.63 | | | | (0.82 | ) | | | (0.48 | ) | | | 1.42 | | | | 0.69 | | | | (1.13 | ) |
| Distributions from: | | | | | | | | | | | | | | | | | | | | | | | | |
| Net investment income | | | (0.79 | ) | | | (0.12 | ) | | | (0.21 | ) | | | (0.06 | ) | | | (0.18 | ) | | | (0.13 | ) |
| Net asset value at end of period | | $ | 6.67 | | | $ | 6.83 | | | $ | 7.77 | | | $ | 8.46 | | | $ | 7.10 | | | $ | 6.59 | |
| Total return(C) | | | 10.01 | % | | | (10.61 | %) | | | (5.72 | %) | | | 20.05 | % | | | 10.53 | %(D) | | | (14.37 | %) |
| Ratios and supplemental data: | | | | | | | | | | | | | | | | | | | | | | | | |
| Net assets at end of period (000's) | | $ | 227 | | | $ | 122 | | | $ | 233 | | | $ | 216 | | | $ | 217 | | | $ | 169 | |
| Ratio to average net assets: | | | | | | | | | | | | | | | | | | | | | | | | |
| Net expenses | | | 2.09 | % | | | 2.11 | % | | | 2.14 | % | | | 2.12 | % | | | 2.11 | %(E)(F) | | | 2.15 | %(F) |
Gross expenses | | | 11.75 | % | | | 9.23 | % | | | 8.35 | % | | | 6.04 | % | | | 9.33 | %(E) | | | 2.43 | % |
| Net investment income | | | 1.41 | % | | | 1.03 | % | | | 1.14 | % | | | 1.57 | % | | | 0.46 | %(E) | | | 1.24 | % |
| Portfolio turnover rate | | | 23 | % | | | 38 | % | | | 26 | % | | | 31 | % | | | 133 | %(D) | | | 121 | % |
| (A) | The Fund changed its fiscal year end from July 31 to March 31. |
| (B) | The net investment income per share is based on average shares outstanding for the period. |
| (C) | Total returns shown exclude the effect of applicable sales loads. If these charges were included, the returns would be lower. |
| (F) | Includes interest expense relating to settlement of foreign futures. Interest expense was less than 0.005% for the eight months ended March 31, 2013 and 0.02% for the year ended July 31, 2012. |
See accompanying Notes to Financial Statements.
Financial Highlights (Continued)
Touchstone International Value Fund—Class Y
Selected Data for a Share Outstanding Throughout Each Period
| | | | | | Eight Months | | | | |
| | | | | | Ended | | | Year Ended | |
| | | Year Ended March 31, | | | March 31, | | | July 31, | |
| | | 2017 | | | 2016 | | | 2015 | | | 2014 | | | 2013(A)(B) | | | 2012 | |
| Net asset value at beginning of period | | $ | 7.39 | | | $ | 8.41 | | | $ | 9.13 | | | $ | 7.62 | | | $ | 7.07 | | | $ | 8.44 | |
| Income (loss) from investment operations: | | | | | | | | | | | | | | | | | | | | | | | | |
| Net investment income | | | 0.18 | (C) | | | 0.17 | (C) | | | 0.23 | | | | 0.19 | | | | 0.07 | (C) | | | 0.16 | (C) |
| Net realized and unrealized gains (losses) on investments | | | 0.58 | | | | (0.98 | ) | | | (0.66 | ) | | | 1.43 | | | | 0.73 | | | | (1.31 | ) |
| Total from investment operations | | | 0.76 | | | | (0.81 | ) | | | (0.43 | ) | | | 1.62 | | | | 0.80 | | | | (1.15 | ) |
| Distributions from: | | | | | | | | | | | | | | | | | | | | | | | | |
| Net investment income | | | (0.94 | ) | | | (0.21 | ) | | | (0.29 | ) | | | (0.11 | ) | | | (0.25 | ) | | | (0.22 | ) |
| Net asset value at end of period | | $ | 7.21 | | | $ | 7.39 | | | $ | 8.41 | | | $ | 9.13 | | | $ | 7.62 | | | $ | 7.07 | |
| Total return | | | 11.11 | % | | | (9.77 | %) | | | (4.72 | %) | | | 21.32 | % | | | 11.33 | %(D) | | | (13.47 | %) |
| Ratios and supplemental data: | | | | | | | | | | | | | | | | | | | | | | | | |
| Net assets at end of period (000's) | | $ | 3,540 | | | $ | 4,583 | | | $ | 35,108 | | | $ | 43,794 | | | $ | 31,527 | | | $ | 123,607 | |
| Ratio to average net assets: | | | | | | | | | | | | | | | | | | | | | | | | |
| Net expenses | | | 1.09 | % | | | 1.12 | % | | | 1.09 | % | | | 1.04 | % | | | 1.08 | %(E)(F) | | | 1.15 | %(E) |
| Gross expenses | | | 2.02 | % | | | 1.56 | % | | | 1.36 | % | | | 1.33 | % | | | 1.51 | %(F) | | | 1.43 | % |
| Net investment income | | | 2.41 | % | | | 2.02 | % | | | 2.19 | % | | | 2.65 | % | | | 1.49 | %(F) | | | 2.27 | % |
| Portfolio turnover rate | | | 23 | % | | | 38 | % | | | 26 | % | | | 31 | % | | | 133 | %(D) | | | 121 | % |
Touchstone International Value Fund—Institutional Class
Selected Data for a Share Outstanding Throughout Each Period
| | | | | | | | | | | | | | | Period Ended | |
| | | Year Ended March 31, | | March 31, | |
| | | 2017 | | | 2016 | | | 2015 | | | 2014 | | | 2013(G) | |
| Net asset value at beginning of period | | $ | 7.35 | | | $ | 8.42 | | | $ | 9.14 | | | $ | 7.62 | | | $ | 7.43 | |
| Income (loss) from investment operations: | | | | | | | | | | | | | | | | | | | | |
| Net investment income | | | 0.18 | (C) | | | 0.17 | (C) | | | 0.24 | | | | 0.28 | | | | 0.08 | (C) |
| Net realized and unrealized gains (losses) on investments | | | 0.59 | | | | (0.98 | ) | | | (0.66 | ) | | | 1.36 | | | | 0.36 | |
| Total from investment operations | | | 0.77 | | | | (0.81 | ) | | | (0.42 | ) | | | 1.64 | | | | 0.44 | |
| Distributions from: | | | | | | | | | | | | | | | | | | | | |
| Net investment income | | | (0.97 | ) | | | (0.26 | ) | | | (0.30 | ) | | | (0.12 | ) | | | (0.25 | ) |
| Net asset value at end of period | | $ | 7.15 | | | $ | 7.35 | | | $ | 8.42 | | | $ | 9.14 | | | $ | 7.62 | |
| Total return | | | 11.31 | % | | | (9.74 | %) | | | (4.66 | %) | | | 21.51 | % | | | 5.94 | %(D) |
| Ratios and supplemental data: | | | | | | | | | | | | | | | | | | | | |
| Net assets at end of period (000's) | | $ | 14,753 | | | $ | 34,742 | | | $ | 72,607 | | | $ | 83,628 | | | $ | 88,931 | |
| Ratio to average net assets: | | | | | | | | | | | | | | | | | | | | |
| Net expenses | | | 0.99 | % | | | 0.99 | % | | | 0.99 | % | | | 0.97 | % | | | 0.96 | %(F) |
| Gross expenses | | | 1.60 | % | | | 1.29 | % | | | 1.28 | % | | | 1.29 | % | | | 1.36 | %(F) |
| Net investment income | | | 2.51 | % | | | 2.15 | % | | | 2.29 | % | | | 2.72 | % | | | 1.61 | %(F) |
| Portfolio turnover rate | | | 23 | % | | | 38 | % | | | 26 | % | | | 31 | % | | | 133 | %(D) |
| (A) | Effective September 10, 2012, Institutional Class shares were renamed Class Y shares. |
| (B) | The Fund changed its fiscal year end from July 31 to March 31. |
| (C) | The net investment income per share is based on average shares outstanding for the period. |
| (E) | Includes interest expense relating to settlement of foreign futures. Interest expense was less than 0.005% for the eight months ended March 31, 2013 and 0.02% for the year ended July 31, 2012. |
| (G) | Represents the period from commencement of operations (September 10, 2012) through March 31, 2013. |
See accompanying Notes to Financial Statements.
Financial Highlights (Continued)
Touchstone Mid Cap Growth Fund—Class A
Selected Data for a Share Outstanding Throughout Each Period
| | | Year Ended March 31, | |
| | | 2017 | | | 2016 | | | 2015 | | | 2014 | | | 2013 | |
| Net asset value at beginning of period | | $ | 23.28 | | | $ | 27.06 | | | $ | 26.50 | | | $ | 23.61 | | | $ | 22.41 | |
| Income (loss) from investment operations: | | | | | | | | | | | | | | | | | | | | |
| Net investment loss | | | (0.06 | ) | | | (0.10 | ) | | | (0.14 | ) | | | (0.10 | ) | | | (0.05 | ) |
| Net realized and unrealized gains (losses) on investments | | | 3.31 | | | | (1.62 | ) | | | 4.19 | | | | 5.74 | | | | 2.71 | |
| Total from investment operations | | | 3.25 | | | | (1.72 | ) | | | 4.05 | | | | 5.64 | | | | 2.66 | |
| Distributions from: | | | | | | | | | | | | | | | | | | | | |
| Realized capital gains | | | (0.62 | ) | | | (2.06 | ) | | | (3.49 | ) | | | (2.75 | ) | | | (1.46 | ) |
| Net asset value at end of period | | $ | 25.91 | | | $ | 23.28 | | | $ | 27.06 | | | $ | 26.50 | | | $ | 23.61 | |
| Total return(A) | | | 14.13 | % | | | (6.34 | %) | | | 16.34 | % | | | 24.82 | % | | | 12.73 | % |
| Ratios and supplemental data: | | | | | | | | | | | | | | | | | | | | |
| Net assets at end of period (000's) | | $ | 225,381 | | | $ | 226,201 | | | $ | 267,421 | | | $ | 308,316 | | | $ | 299,834 | |
| Ratio to average net assets: | | | | | | | | | | | | | | | | | | | | |
| Net expenses | | | 1.30 | % | | | 1.31 | % | | | 1.34 | % | | | 1.38 | % | | | 1.40 | % |
| Gross expenses | | | 1.30 | % | | | 1.31 | % | | | 1.34 | % | | | 1.38 | % | | | 1.40 | % |
| Net investment loss | | | (0.26 | %) | | | (0.42 | %) | | | (0.55 | %) | | | (0.41 | %) | | | (0.21 | %) |
| Portfolio turnover rate | | | 95 | % | | | 92 | % | | | 73 | % | | | 79 | % | | | 70 | % |
Touchstone Mid Cap Growth Fund—Class C
Selected Data for a Share Outstanding Throughout Each Period
| | | Year Ended March 31, | |
| | | 2017 | | | 2016 | | | 2015 | | | 2014 | | | 2013 | |
| Net asset value at beginning of period | | $ | 16.33 | | | $ | 19.78 | | | $ | 20.39 | | | $ | 18.84 | | | $ | 18.31 | |
| Income (loss) from investment operations: | | | | | | | | | | | | | | | | | | | | |
| Net investment loss | | | (0.22 | ) | | | (0.21 | ) | | | (0.24 | ) | | | (0.22 | ) | | | (0.18 | ) |
| Net realized and unrealized gains (losses) on investments | | | 2.35 | | | | (1.18 | ) | | | 3.12 | | | | 4.52 | | | | 2.17 | |
| Total from investment operations | | | 2.13 | | | | (1.39 | ) | | | 2.88 | | | | 4.30 | | | | 1.99 | |
| Distributions from: | | | | | | | | | | | | | | | | | | | | |
| Realized capital gains | | | (0.62 | ) | | | (2.06 | ) | | | (3.49 | ) | | | (2.75 | ) | | | (1.46 | ) |
| Net asset value at end of period | | $ | 17.84 | | | $ | 16.33 | | | $ | 19.78 | | | $ | 20.39 | | | $ | 18.84 | |
| Total return(A) | | | 13.28 | % | | | (7.02 | %) | | | 15.51 | % | | | 23.90 | % | | | 11.90 | % |
| Ratios and supplemental data: | | | | | | | | | | | | | | | | | | | | |
| Net assets at end of period (000's) | | $ | 113,153 | | | $ | 127,852 | | | $ | 157,315 | | | $ | 149,927 | | | $ | 141,485 | |
| Ratio to average net assets: | | | | | | | | | | | | | | | | | | | | |
| Net expenses | | �� | 2.06 | % | | | 2.06 | % | | | 2.07 | % | | | 2.11 | % | | | 2.15 | % |
| Gross expenses | | | 2.06 | % | | | 2.06 | % | | | 2.07 | % | | | 2.11 | % | | | 2.15 | % |
| Net investment loss | | | (1.02 | %) | | | (1.17 | %) | | | (1.29 | %) | | | (1.14 | %) | | | (0.95 | %) |
| Portfolio turnover rate | | | 95 | % | | | 92 | % | | | 73 | % | | | 79 | % | | | 70 | % |
| (A) | Total returns shown exclude the effect of applicable sales loads. If these charges were included, the returns would be lower. |
See accompanying Notes to Financial Statements.
Financial Highlights (Continued)
Touchstone Mid Cap Growth Fund—Class Y
Selected Data for a Share Outstanding Throughout Each Period
| | | Year Ended March 31, | |
| | | 2017 | | | 2016 | | | 2015 | | | 2014 | | | 2013 | |
| Net asset value at beginning of period | | $ | 23.92 | | | $ | 27.71 | | | $ | 27.00 | | | $ | 23.93 | | | $ | 22.63 | |
| Income (loss) from investment operations: | | | | | | | | | | | | | | | | | | | | |
| Net investment income (loss) | | | (— | )(A) | | | (0.04 | ) | | | (0.08 | ) | | | (0.05 | ) | | | 0.01 | |
| Net realized and unrealized gains (losses) on investments | | | 3.40 | | | | (1.65 | ) | | | 4.28 | | | | 5.87 | | | | 2.75 | |
| Total from investment operations | | | 3.40 | | | | (1.69 | ) | | | 4.20 | | | | 5.82 | | | | 2.76 | |
| Distributions from: | | | | | | | | | | | | | | | | | | | | |
| Net investment income | | | — | | | | (0.04 | ) | | | — | | | | — | | | | — | |
| Realized capital gains | | | (0.62 | ) | | | (2.06 | ) | | | (3.49 | ) | | | (2.75 | ) | | | (1.46 | ) |
| Total distributions | | | (0.62 | ) | | | (2.10 | ) | | | (3.49 | ) | | | (2.75 | ) | | | (1.46 | ) |
| Net asset value at end of period | | $ | 26.70 | | | $ | 23.92 | | | $ | 27.71 | | | $ | 27.00 | | | $ | 23.93 | |
| Total return | | | 14.38 | % | | | (6.08 | %) | | | 16.69 | % | | | 25.17 | % | | | 13.05 | % |
| Ratios and supplemental data: | | | | | | | | | | | | | | | | | | | | |
| Net assets at end of period (000's) | | $ | 311,865 | | | $ | 347,706 | | | $ | 299,247 | | | $ | 263,578 | | | $ | 164,267 | |
| Ratio to average net assets: | | | | | | | | | | | | | | | | | | | | |
| Net expenses | | | 1.06 | % | | | 1.05 | % | | | 1.07 | % | | | 1.07 | % | | | 1.16 | % |
| Gross expenses | | | 1.06 | % | | | 1.05 | % | | | 1.07 | % | | | 1.07 | % | | | 1.16 | % |
| Net investment income (loss) | | | (0.02 | %) | | | (0.16 | %) | | | (0.29 | %) | | | (0.11 | %) | | | 0.04 | % |
| Portfolio turnover rate | | | 95 | % | | | 92 | % | | | 73 | % | | | 79 | % | | | 70 | % |
Touchstone Mid Cap Growth Fund—Institutional Class
Selected Data for a Share Outstanding Throughout Each Period
| | | Year Ended March 31, | |
| | | 2017 | | | 2016 | | | 2015 | | | 2014 | | | 2013 | |
| Net asset value at beginning of period | | $ | 24.07 | | | $ | 27.85 | | | $ | 27.10 | | | $ | 23.99 | | | $ | 22.65 | |
| Income (loss) from investment operations: | | | | | | | | | | | | | | | | | | | | |
| Net investment income (loss) | | | 0.10 | | | | (0.02 | ) | | | (0.03 | ) | | | 0.03 | | | | 0.04 | |
| Net realized and unrealized gains (losses) on investments | | | 3.35 | | | | (1.65 | ) | | | 4.27 | | | | 5.83 | | | | 2.76 | |
| Total from investment operations | | | 3.45 | | | | (1.67 | ) | | | 4.24 | | | | 5.86 | | | | 2.80 | |
| Distributions from: | | | | | | | | | | | | | | | | | | | | |
| Net investment income | | | — | | | | (0.05 | ) | | | — | | | | — | | | | — | |
| Realized capital gains | | | (0.62 | ) | | | (2.06 | ) | | | (3.49 | ) | | | (2.75 | ) | | | (1.46 | ) |
| Total distributions | | | (0.62 | ) | | | (2.11 | ) | | | (3.49 | ) | | | (2.75 | ) | | | (1.46 | ) |
| Net asset value at end of period | | $ | 26.90 | | | $ | 24.07 | | | $ | 27.85 | | | $ | 27.10 | | | $ | 23.99 | |
| Total return | | | 14.50 | % | | | (5.97 | %) | | | 16.73 | % | | | 25.32 | % | | | 13.23 | % |
| Ratios and supplemental data: | | | | | | | | | | | | | | | | | | | | |
| Net assets at end of period (000's) | | $ | 44,236 | | | $ | 84,152 | | | $ | 102,420 | | | $ | 35,097 | | | $ | 38,821 | |
| Ratio to average net assets: | | | | | | | | | | | | | | | | | | | | |
| Net expenses | | | 0.99 | % | | | 0.95 | % | | | 0.98 | % | | | 0.97 | % | | | 0.98 | % |
| Gross expenses | | | 1.00 | % | | | 0.95 | % | | | 0.98 | % | | | 0.97 | % | | | 0.98 | % |
| Net investment income (loss) | | | 0.05 | % | | | (0.05 | %) | | | (0.20 | %) | | | 0.00 | %(B) | | | 0.21 | % |
| Portfolio turnover rate | | | 95 | % | | | 92 | % | | | 73 | % | | | 79 | % | | | 70 | % |
| (A) | Less than $(0.005) per share. |
See accompanying Notes to Financial Statements.
Financial Highlights (Continued)
Touchstone Sands Capital Emerging Markets Growth Fund—Class Y
Selected Data for a Share Outstanding Throughout Each Period
| | | | | | | | | Period Ended | |
| | | Year Ended March 31, | | March 31, | |
| | | 2017 | | | 2016 | | | 2015(A) | |
| Net asset value at beginning of period | | $ | 9.40 | | | $ | 10.37 | | | $ | 10.00 | |
| Income (loss) from investment operations: | | | | | | | | | | | | |
| Net investment loss | | | (0.03 | ) | | | (0.04 | ) | | | (0.03 | ) |
| Net realized and unrealized gains (losses) on investments | | | 1.33 | | | | (0.93 | ) | | | 0.40 | |
| Total from investment operations | | | 1.30 | | | | (0.97 | ) | | | 0.37 | |
| Net asset value at end of period | | $ | 10.70 | | | $ | 9.40 | | | $ | 10.37 | |
| Total return | | | 13.83 | % | | | (9.35 | %) | | | 3.70 | %(B) |
| Ratios and supplemental data: | | | | | | | | | | | | |
| Net assets at end of period (000's) | | $ | 103,467 | | | $ | 58,106 | | | $ | 39,541 | |
| Ratio to average net assets: | | | | | | | | | | | | |
| Net expenses | | | 1.49 | % | | | 1.49 | % | | | 1.49 | %(C) |
| Gross expenses | | | 1.55 | % | | | 1.59 | % | | | 1.68 | %(C) |
| Net investment loss | | | (0.49 | %) | | | (0.52 | %) | | | (0.46 | %)(C) |
| Portfolio turnover rate | | | 49 | % | | | 32 | % | | | 90 | %(B) |
Touchstone Sands Capital Emerging Markets Growth Fund—Institutional Class
Selected Data for a Share Outstanding Throughout Each Period
| | | | | | Period Ended | |
| | | Year Ended March 31, | | | March 31, | |
| | | 2017 | | | 2016 | | | 2015(A) | |
| Net asset value at beginning of period | | $ | 9.41 | | | $ | 10.37 | | | $ | 10.00 | |
| Income (loss) from investment operations: | | | | | | | | | | | | |
| Net investment loss | | | (0.03 | ) | | | (0.02 | ) | | | (0.03 | ) |
| Net realized and unrealized gains (losses) on investments | | | 1.35 | | | | (0.94 | ) | | | 0.40 | |
| Total from investment operations | | | 1.32 | | | | (0.96 | ) | | | 0.37 | |
| Net asset value at end of period | | $ | 10.73 | | | $ | 9.41 | | | $ | 10.37 | |
| Total return | | | 14.03 | % | | | (9.26 | %) | | | 3.70 | %(B) |
| Ratios and supplemental data: | | | | | | | | | | | | |
| Net assets at end of period (000's) | | $ | 182,402 | | | $ | 101,401 | | | $ | 32,743 | |
| Ratio to average net assets: | | | | | | | | | | | | |
| Net expenses | | | 1.39 | % | | | 1.39 | % | | | 1.39 | %(C) |
| Gross expenses | | | 1.46 | % | | | 1.51 | % | | | 1.59 | %(C) |
| Net investment loss | | | (0.39 | %) | | | (0.42 | %) | | | (0.36 | %)(C) |
| Portfolio turnover rate | | | 49 | % | | | 32 | % | | | 90 | %(B) |
| (A) | Represents the period from commencement of operations (May 12, 2014) through March 31, 2015. |
See accompanying Notes to Financial Statements.
Financial Highlights (Continued)
Touchstone Small Cap Growth Fund—Class A
Selected Data for a Share Outstanding Throughout Each Period
| | | | | | | | | | | | | | | Eight Months | | | | |
| | | | | | | | | | | | | | | Ended | | | Year Ended | |
| | | Year Ended March 31, | | | March 31, | | | July 31, | |
| | | 2017 | | | 2016 | | | 2015 | | | 2014 | | | 2013(A) | | | 2012 | |
| Net asset value at beginning of period | | $ | 4.98 | | | $ | 5.70 | | | $ | 5.24 | | | $ | 4.84 | | | $ | 4.25 | | | $ | 4.24 | |
| Income (loss) from investment operations: | | | | | | | | | | | | | | | | | | | | | | | | |
| Net investment income (loss) | | | (0.04 | ) | | | (0.04 | ) | | | (0.04 | ) | | | (0.01 | ) | | | — | (B)(C) | | | (— | )(B)(C) |
| Net realized and unrealized gains (losses) on investments | | | 0.32 | | | | (0.62 | ) | | | 0.63 | | | | 1.02 | | | | 0.85 | | | | 0.01 | |
| Total from investment operations | | | 0.28 | | | | (0.66 | ) | | | 0.59 | | | | 1.01 | | | | 0.85 | | | | 0.01 | |
| Distributions from: | | | | | | | | | | | | | | | | | | | | | | | | |
| Net investment income | | | — | | | | — | | | | — | | | | — | | | | (0.02 | ) | | | — | |
| Realized capital gains | | | (0.03 | ) | | | (0.06 | ) | | | (0.13 | ) | | | (0.61 | ) | | | (0.24 | ) | | | — | |
| Total distributions | | | (0.03 | ) | | | (0.06 | ) | | | (0.13 | ) | | | (0.61 | ) | | | (0.26 | ) | | | — | |
| Net asset value at end of period | | $ | 5.23 | | | $ | 4.98 | | | $ | 5.70 | | | $ | 5.24 | | | $ | 4.84 | | | $ | 4.25 | |
| Total return(D) | | | 5.51 | % | | | (11.68 | %) | | | 11.52 | % | | | 22.63 | % | | | 20.93 | %(E) | | | 0.24 | % |
| Ratios and supplemental data: | | | | | | | | | | | | | | | | | | | | | | | | |
| Net assets at end of period (000's) | | $ | 44,278 | | | $ | 48,650 | | | $ | 34,017 | | | $ | 35,303 | | | $ | 14,243 | | | $ | 15,010 | |
| Ratio to average net assets: | | | | | | | | | | | | | | | | | | | | | | | | |
| Net expenses | | | 1.44 | % | | | 1.44 | % | | | 1.44 | % | | | 1.45 | % | | | 1.60 | %(F) | | | 1.60 | % |
| Gross expenses | | | 1.60 | % | | | 1.66 | % | | | 1.69 | % | | | 1.81 | % | | | 2.13 | %(F) | | | 2.01 | % |
| Net investment income (loss) | | | (0.74 | %) | | | (0.94 | %) | | | (0.71 | %) | | | (0.48 | %) | | | 0.15 | %(F) | | | (0.07 | %) |
| Portfolio turnover rate | | | 58 | % | | | 36 | % | | | 46 | % | | | 195 | %(G) | | | 45 | %(E)(H) | | | 48 | % |
Touchstone Small Cap Growth Fund—Class C
Selected Data for a Share Outstanding Throughout Each Period
| | | | | | | | | | | | | | | Eight Months | | | | |
| | | | | | | | | | | | | | | Ended | | | Year Ended | |
| | | Year Ended March 31, | | | March 31, | | | July 31, | |
| | | 2017 | | | 2016 | | | 2015 | | | 2014 | | | 2013(A) | | | 2012 | |
| Net asset value at beginning of period | | $ | 4.14 | | | $ | 4.78 | | | $ | 4.45 | | | $ | 4.22 | | | $ | 3.75 | | | $ | 3.77 | |
| Income (loss) from investment operations: | | | | | | | | | | | | | | | | | | | | | | | | |
| Net investment loss | | | (0.10 | ) | | | (0.07 | ) | | | (0.05 | ) | | | (0.04 | ) | | | (0.02 | )(B) | | | (0.03 | )(B) |
| Net realized and unrealized gains (losses) on investments | | | 0.30 | | | | (0.51 | ) | | | 0.51 | | | | 0.88 | | | | 0.74 | | | | 0.01 | |
| Total from investment operations | | | 0.20 | | | | (0.58 | ) | | | 0.46 | | | | 0.84 | | | | 0.72 | | | | (0.02 | ) |
| Distributions from: | | | | | | | | | | | | | | | | | | | | | | | | |
| Net investment income | | | — | | | | — | | | | — | | | | — | | | | (0.01 | ) | | | — | |
| Realized capital gains | | | (0.03 | ) | | | (0.06 | ) | | | (0.13 | ) | | | (0.61 | ) | | | (0.24 | ) | | | — | |
| Total distributions | | | (0.03 | ) | | | (0.06 | ) | | | (0.13 | ) | | | (0.61 | ) | | | (0.25 | ) | | | — | |
| Net asset value at end of period | | $ | 4.31 | | | $ | 4.14 | | | $ | 4.78 | | | $ | 4.45 | | | $ | 4.22 | | | $ | 3.75 | |
| Total return(D) | | | 4.70 | % | | | (12.26 | %) | | | 10.64 | % | | | 21.85 | % | | | 20.17 | %(E) | | | (0.53 | %) |
| Ratios and supplemental data: | | | | | | | | | | | | | | | | | | | | | | | | |
| Net assets at end of period (000's) | | $ | 12,312 | | | $ | 18,237 | | | $ | 12,651 | | | $ | 7,429 | | | $ | 3,509 | | | $ | 3,830 | |
| Ratio to average net assets: | | | | | | | | | | | | | | | | | | | | | | | | |
| Net expenses | | | 2.19 | % | | | 2.19 | % | | | 2.19 | % | | | 2.20 | % | | | 2.35 | %(F) | | | 2.35 | % |
| Gross expenses | | | 2.51 | % | | | 2.46 | % | | | 2.55 | % | | | 2.65 | % | | | 3.16 | %(F) | | | 2.76 | % |
| Net investment loss | | | (1.49 | %) | | | (1.69 | %) | | | (1.46 | %) | | | (1.23 | %) | | | (0.60 | %)(F) | | | (0.82 | %) |
| Portfolio turnover rate | | | 58 | % | | | 36 | % | | | 46 | % | | | 195 | %(G) | | | 45 | %(E)(H) | | | 48 | % |
| (A) | The Fund changed its fiscal year end from July 31 to March 31. |
| (B) | The net investment income (loss) per share is based on average shares outstanding for the period. |
| (C) | Less than $0.005 per share. |
| (D) | Total returns shown exclude the effect of applicable sales loads. If these charges were included, the returns would be lower. |
| (G) | Portfolio turnover excludes the purchases and sales of the Touchstone Diversified Small Cap Growth Fund acquired on August 23, 2013. If these transactions were included, portfolio turnover would have been higher. |
| (H) | Portfolio turnover rate excludes securities delivered from processing a redemption-in-kind. |
See accompanying Notes to Financial Statements.
Financial Highlights (Continued)
Touchstone Small Cap Growth Fund—Class Y
Selected Data for a Share Outstanding Throughout Each Period
| | | | | | | | | | | | | | | | | | | |
| | | | | | | | | | | | | | | Eight Months | | | | |
| | | | | | | | | | | | | | | Ended | | | Year Ended | |
| | | Year Ended March 31, | | | March 31, | | | July 31, | |
| | | 2017 | | | 2016 | | | 2015 | | | 2014 | | | 2013(A)(B) | | | 2012 | |
| Net asset value at beginning of period | | $ | 5.55 | | | $ | 6.33 | | | $ | 5.78 | | | $ | 5.27 | | | $ | 4.61 | | | $ | 4.58 | |
| Income (loss) from investment operations: | | | | | | | | | | | | | | | | | | | | | | | | |
| Net investment income (loss) | | | (0.03 | ) | | | (0.03 | ) | | | (0.01 | ) | | | (0.01 | ) | | | 0.01 | (C) | | | 0.01 | (C) |
| Net realized and unrealized gains (losses) on investments | | | 0.35 | | | | (0.69 | ) | | | 0.69 | | | | 1.13 | | | | 0.92 | | | | 0.02 | |
| Total from investment operations | | | 0.32 | | | | (0.72 | ) | | | 0.68 | | | | 1.12 | | | | 0.93 | | | | 0.03 | |
| Distributions from: | | | | | | | | | | | | | | | | | | | | | | | | |
| Net investment income | | | — | | | | — | | | | — | | | | — | | | | (0.03 | ) | | | — | |
| Realized capital gains | | | (0.03 | ) | | | (0.06 | ) | | | (0.13 | ) | | | (0.61 | ) | | | (0.24 | ) | | | — | |
| Total distributions | | | (0.03 | ) | | | (0.06 | ) | | | (0.13 | ) | | | (0.61 | ) | | | (0.27 | ) | | | — | |
| Net asset value at end of period | | $ | 5.84 | | | $ | 5.55 | | | $ | 6.33 | | | $ | 5.78 | | | $ | 5.27 | | | $ | 4.61 | |
| Total return | | | 5.67 | % | | | (11.46 | %) | | | 12.01 | % | | | 22.88 | % | | | 20.94 | %(E) | | | 0.66 | % |
| Ratios and supplemental data: | | | | | | | | | | | | | | | | | | | | | | | | |
| Net assets at end of period (000's) | | $ | 357,216 | | | $ | 508,450 | | | $ | 314,062 | | | $ | 37,030 | | | $ | 18,123 | | | $ | 23,232 | |
| Ratio to average net assets: | | | | | | | | | | | | | | | | | | | | | | | | |
| Net expenses | | | 1.19 | % | | | 1.19 | % | | | 1.19 | % | | | 1.20 | % | | | 1.35 | %(F) | | | 1.35 | % |
| Gross expenses | | | 1.34 | % | | | 1.31 | % | | | 1.36 | % | | | 1.50 | % | | | 1.77 | %(F) | | | 1.76 | % |
| Net investment income (loss) | | | (0.49 | %) | | | (0.69 | %) | | | (0.46 | %) | | | (0.23 | %) | | | 0.40 | %(F) | | | 0.17 | % |
| Portfolio turnover rate | | | 58 | % | | | 36 | % | | | 46 | % | | | 195 | %(G) | | | 45 | %(E)(H) | | | 48 | % |
Touchstone Small Cap Growth Fund—Institutional Class
Selected Data for a Share Outstanding Throughout Each Period
| | | | | | | | | | | | | | | Period Ended | |
| | | Year Ended March 31, | | | March 31, | |
| | | 2017 | | | 2016 | | | 2015 | | | 2014 | | | 2013(I) | |
| Net asset value at beginning of period | | $ | 5.58 | | | $ | 6.35 | | | $ | 5.80 | | | $ | 5.28 | | | $ | 4.92 | |
| Income (loss) from investment operations: | | | | | | | | | | | | | | | | | | | | |
| Net investment income (loss) | | | (0.03 | ) | | | (0.03 | ) | | | (0.02 | ) | | | (— | )(D) | | | 0.02 | (C) |
| Net realized and unrealized gains (losses) on investments | | | 0.37 | | | | (0.68 | ) | | | 0.70 | | | | 1.13 | | | | 0.61 | |
| Total from investment operations | | | 0.34 | | | | (0.71 | ) | | | 0.68 | | | | 1.13 | | | | 0.63 | |
| Distributions from: | | | | | | | | | | | | | | | | | | | | |
| Net investment income | | | — | | | | — | | | | — | | | | — | | | | (0.03 | ) |
| Realized capital gains | | | (0.03 | ) | | | (0.06 | ) | | | (0.13 | ) | | | (0.61 | ) | | | (0.24 | ) |
| Total distributions | | | (0.03 | ) | | | (0.06 | ) | | | (0.13 | ) | | | (0.61 | ) | | | (0.27 | ) |
| Net asset value at end of period | | $ | 5.89 | | | $ | 5.58 | | | $ | 6.35 | | | $ | 5.80 | | | $ | 5.28 | |
| Total return | | | 6.00 | % | | | (11.27 | %) | | | 11.97 | % | | | 23.04 | % | | | 13.56 | %(E) |
| Ratios and supplemental data: | | | | | | | | | | | | | | | | | | | | |
| Net assets at end of period (000's) | | $ | 15,558 | | | $ | 22,863 | | | $ | 12,285 | | | $ | 12,372 | | | $ | 3 | |
| Ratio to average net assets: | | | | | | | | | | | | | | | | | | | | |
| Net expenses | | | 1.04 | % | | | 1.04 | % | | | 1.04 | % | | | 1.04 | % | | | 1.25 | %(F) |
| Gross expenses | | | 1.24 | % | | | 1.23 | % | | | 1.31 | % | | | 1.40 | % | | | 945.43 | %(F) |
| Net investment income (loss) | | | (0.35 | %) | | | (0.54 | %) | | | (0.32 | %) | | | (0.07 | %) | | | 0.50 | %(F) |
| Portfolio turnover rate | | | 58 | % | | | 36 | % | | | 46 | % | | | 195 | %(G) | | | 45 | %(E)(H) |
| (A) | Effective September 10, 2012, Institutional Class shares were renamed Class Y shares. |
| (B) | The Fund changed its fiscal year end from July 31 to March 31. |
| (C) | The net investment income (loss) per share is based on average shares outstanding for the period. |
| (D) | Less than $0.005 per share. |
| (G) | Portfolio turnover excludes the purchases and sales of the Touchstone Diversified Small Cap Growth Fund acquired on August 23, 2013. If these transactions were included, portfolio turnover would have been higher. |
| (H) | Portfolio turnover rate excludes securities delivered from processing a redemption-in-kind. |
| (I) | Represents the period from commencement of operations (September 10, 2012) through March 31, 2013. |
See accompanying Notes to Financial Statements.
Financial Highlights (Continued)
Touchstone Sustainability and Impact Equity Fund—Class A
Selected Data for a Share Outstanding Throughout Each Period
| | | Year Ended March 31, | |
| | | 2017 | | | 2016 | | | 2015 | | | 2014 | | | 2013 | |
| Net asset value at beginning of period | | $ | 18.98 | | | $ | 30.96 | | | $ | 31.81 | | | $ | 28.74 | | | $ | 27.74 | |
| Income (loss) from investment operations: | | | | | | | | | | | | | | | | | | | | |
| Net investment income | | | 0.18 | | | | 0.06 | (A) | | | 0.11 | | | | 0.02 | | | | 0.11 | |
| Net realized and unrealized gains (losses) on investments | | | 2.47 | | | | (1.99 | ) | | | 4.87 | | | | 5.96 | | | | 1.00 | |
| Total from investment operations | | | 2.65 | | | | (1.93 | ) | | | 4.98 | | | | 5.98 | | | | 1.11 | |
| Distributions from: | | | | | | | | | | | | | | | | | | | | |
| Net investment income | | | (0.11 | ) | | | (0.03 | ) | | | (0.05 | ) | | | (0.05 | ) | | | (0.11 | ) |
| Realized capital gains | | | — | | | | (10.02 | ) | | | (5.78 | ) | | | (2.86 | ) | | | — | |
| Total distributions | | | (0.11 | ) | | | (10.05 | ) | | | (5.83 | ) | | | (2.91 | ) | | | (0.11 | ) |
| Net asset value at end of period | | $ | 21.52 | | | $ | 18.98 | | | $ | 30.96 | | | $ | 31.81 | | | $ | 28.74 | |
| Total return(B) | | | 14.01 | % | | | (8.73 | %) | | | 17.17 | % | | | 21.27 | % | | | 4.05 | % |
| Ratios and supplemental data: | | | | | | | | | | | | | | | | | | | | |
| Net assets at end of period (000's) | | $ | 113,062 | | | $ | 137,306 | | | $ | 257,273 | | | $ | 287,813 | | | $ | 286,572 | |
| Ratio to average net assets: | | | | | | | | | | | | | | | | | | | | |
| Net expenses | | | 1.24 | % | | | 1.24 | % | | | 1.25 | % | | | 1.23 | % | | | 1.22 | % |
| Gross expenses | | | 1.36 | % | | | 1.39 | % | | | 1.28 | % | | | 1.29 | % | | | 1.32 | % |
| Net investment income | | | 0.83 | % | | | 0.31 | % | | | 0.35 | % | | | 0.06 | % | | | 0.47 | % |
| Portfolio turnover rate | | | 53 | % | | | 304 | % | | | 98 | % | | | 92 | % | | | 109 | %(C) |
Touchstone Sustainability and Impact Equity Fund—Class C
Selected Data for a Share Outstanding Throughout Each Period
| | | Year Ended March 31, |
| | | 2017 | | | 2016 | | | 2015 | | | 2014 | | | 2013 | |
| Net asset value at beginning of period | | $ | 16.47 | | | $ | 28.32 | | | $ | 29.72 | | | $ | 27.17 | | | $ | 26.31 | |
| Income (loss) from investment operations: | | | | | | | | | | | | | | | | | | | | |
| Net investment income (loss) | | | 0.01 | | | | (0.08 | )(A) | | | (0.12 | ) | | | (0.21 | ) | | | (0.08 | ) |
| Net realized and unrealized gains (losses) on investments | | | 2.15 | | | | (1.75 | ) | | | 4.50 | | | | 5.62 | | | | 0.94 | |
| Total from investment operations | | | 2.16 | | | | (1.83 | ) | | | 4.38 | | | | 5.41 | | | | 0.86 | |
| Distributions from: | | | | | | | | | | | | | | | | | | | | |
| Net Investment Income | | | (0.01 | ) | | | (10.02 | ) | | | (5.78 | ) | | | (2.86 | ) | | | — | |
| Net asset value at end of period | | $ | 18.62 | | | $ | 16.47 | | | $ | 28.32 | | | $ | 29.72 | | | $ | 27.17 | |
| Total return(B) | | | 13.12 | % | | | (9.41 | %) | | | 16.30 | % | | | 20.35 | % | | | 3.27 | % |
| Ratios and supplemental data: | | | | | | | | | | | | | | | | | | | | |
| Net assets at end of period (000's) | | $ | 48,055 | | | $ | 56,435 | | | $ | 103,861 | | | $ | 111,631 | | | $ | 107,572 | |
| Ratio to average net assets: | | | | | | | | | | | | | | | | | | | | |
| Net expenses | | | 1.99 | % | | | 1.99 | % | | | 2.00 | % | | | 1.98 | % | | | 1.97 | % |
| Gross expenses | | | 2.12 | % | | | 2.15 | % | | | 2.03 | % | | | 2.04 | % | | | 2.08 | % |
| Net investment income (loss) | | | 0.08 | % | | | (0.44 | %) | | | (0.40 | %) | | | (0.69 | %) | | | (0.28 | %) |
| Portfolio turnover rate | | | 53 | % | | | 304 | % | | | 98 | % | | | 92 | % | | | 109 | %(C) |
| (A) | The net investment income (loss) per share is based on average shares outstanding for the period. |
| (B) | Total returns shown exclude the effect of applicable sales loads. If these charges were included, the returns would be lower. |
| (C) | Portfolio turnover excludes the purchases and sales of the Fifth Third Quality Growth Fund acquired on September 10, 2012. If these transactions were included, portfolio turnover would have been higher. |
See accompanying Notes to Financial Statements.
Financial Highlights (Continued)
Touchstone Sustainability and Impact Equity Fund—Class Y
Selected Data for a Share Outstanding Throughout Each Period
| | | Year Ended March 31, | |
| | | 2017 | | | 2016 | | | 2015 | | | 2014 | | | 2013 | |
| Net asset value at beginning of period | | $ | 19.49 | | | $ | 31.49 | | | $ | 32.23 | | | $ | 29.07 | | | $ | 28.09 | |
| Income (loss) from investment operations: | | | | | | | | | | | | | | | | | | | | |
| Net investment income | | | 0.20 | | | | 0.13 | (A) | | | 0.22 | | | | 0.09 | | | | 0.18 | |
| Net realized and unrealized gains (losses) on investments | | | 2.58 | | | | (2.06 | ) | | | 4.92 | | | | 6.06 | | | | 1.00 | |
| Total from investment operations | | | 2.78 | | | | (1.93 | ) | | | 5.14 | | | | 6.15 | | | | 1.18 | |
| Distributions from: | | | | | | | | | | | | | | | | | | | | |
| Net investment income | | | (0.16 | ) | | | (0.05 | ) | | | (0.10 | ) | | | (0.13 | ) | | | (0.20 | ) |
| Realized capital gains | | | — | | | | (10.02 | ) | | | (5.78 | ) | | | (2.86 | ) | | | — | |
| Total distributions | | | (0.16 | ) | | | (10.07 | ) | | | (5.88 | ) | | | (2.99 | ) | | | (0.20 | ) |
| Net asset value at end of period | | $ | 22.11 | | | $ | 19.49 | | | $ | 31.49 | | | $ | 32.23 | | | $ | 29.07 | |
| Total return | | | 14.30 | % | | | (8.54 | %) | | | 17.48 | % | | | 21.62 | % | | | 4.32 | % |
| Ratios and supplemental data: | | | | | | | | | | | | | | | | | | | | |
| Net assets at end of period (000's) | | $ | 112,790 | | | $ | 67,638 | | | $ | 416,741 | | | $ | 577,708 | | | $ | 523,413 | |
| Ratio to average net assets: | | | | | | | | | | | | | | | | | | | | |
| Net expenses | | | 0.99 | % | | | 0.99 | % | | | 0.99 | % | | | 0.97 | % | | | 0.96 | % |
| Gross expenses | | | 1.09 | % | | | 1.14 | % | | | 1.00 | % | | | 1.05 | % | | | 1.08 | % |
| Net investment income | | | 1.08 | % | | | 0.56 | % | | | 0.61 | % | | | 0.32 | % | | | 0.72 | % |
| Portfolio turnover rate | | | 53 | % | | | 304 | % | | | 98 | % | | | 92 | % | | | 109 | %(B) |
Touchstone Sustainability and Impact Equity Fund—Institutional Class
Selected Data for a Share Outstanding Throughout Each Period
| | | Year Ended | | | Period Ended | |
| | | March 31, | | | March 31, | |
| | | 2017 | | | 2016(C) | |
| Net asset value at beginning of period | | $ | 19.50 | | | $ | 31.44 | |
| Income (loss) from investment operations: | | | | | | | | |
| Net Investment income | | | 0.19 | | | | 0.11 | (A) |
| Net realized and unrealized gains (losses) on investments | | | 2.61 | | | | (1.98 | ) |
| Total from investment operations | | | 2.80 | | | | (1.87 | ) |
| Distributions from: | | | | | | | | |
| Net investment income | | | (0.17 | ) | | | (0.05 | ) |
| Realized capital gains | | | — | | | | (10.02 | ) |
| Total distributions | | | (0.17 | ) | | | (10.07 | ) |
| Net asset value at end of period | | $ | 22.13 | | | $ | 19.50 | |
| Total return | | | 14.41 | % | | | (8.49 | %)(D) |
| Ratios and supplemental data: | | | | | | | | |
| Net assets at end of period (000's) | | $ | 29,679 | | | $ | 6,843 | |
| Ratio to average net assets: | | | | | | | | |
| Net expenses | | | 0.89 | % | | | 0.89 | %(E) |
| Gross expenses | | | 1.11 | % | | | 1.48 | %(E) |
| Net investment income | | | 1.18 | % | | | 0.66 | %(E) |
| Portfolio turnover rate | | | 53 | % | | | 304 | % |
| (A) | The net investment income per share is based on average shares outstanding for the period. |
| (B) | Portfolio turnover excludes the purchases and sales of the Fifth Third Quality Growth Fund acquired on September 10, 2012. If these transactions were included, portfolio turnover would have been higher. |
| (C) | Represents the period from commencement of operations (May 4, 2015) through March 31, 2016. |
See accompanying Notes to Financial Statements.
Notes to Financial Statements
March 31, 2017
1. Organization
The Touchstone Strategic Trust (the “Trust”) is registered under the Investment Company Act of 1940, as amended (the “1940 Act”), as an open-end management investment company. The Trust was established as a Massachusetts business trust pursuant to an Agreement and Declaration of Trust dated November 18, 1982. TheTrust consists of twenty one funds, including the following nine funds (individually, a “Fund”, and collectively, the “Funds”):
Touchstone Flexible Income Fund (“Flexible Income Fund”)
Touchstone Focused Fund (“Focused Fund”)
Touchstone Growth Opportunities Fund (“Growth Opportunities Fund”)
Touchstone International Growth Fund (“International Growth Fund”)
Touchstone International Value Fund (“International Value Fund”)
Touchstone Mid Cap Growth Fund (“Mid Cap Growth Fund”)
Touchstone Sands Capital Emerging Markets Growth Fund (“Sands Capital Emerging Markets Growth Fund”)
Touchstone Small Cap Growth Fund (“Small Cap Growth Fund”)
Touchstone Sustainability and Impact Equity Fund (“Sustainability and Impact Equity Fund”)
Each Fund is diversified, with the exception of the Focused Fund, the Growth Opportunities Fund and the Sands Capital Emerging Markets Growth Fund, which are non-diversified.
The Agreement and Declaration of Trust permits the Trust to issue an unlimited number of shares of beneficial interest of each Fund. The table below indicates the classes of shares that each Fund is registered to offer:
| | Class A | Class C | Class Y | Institutional Class |
| Flexible Income Fund | X | X | X | X |
| Focused Fund | X | X | X | X |
| Growth Opportunities Fund | X | X | X | X |
| International Growth Fund | X | X | X | X |
| International Value Fund | X | X | X | X |
| Mid Cap Growth Fund | X | X | X | X |
| Sands Capital Emerging Markets Growth Fund | — | — | X | X |
| Small Cap Growth Fund | X | X | X | X |
| Sustainability and Impact Equity Fund | X | X | X | X |
The assets of each Fund are segregated, and a shareholder’s interest is limited to the Fund in which shares are held. The Funds’ prospectus provides a description of each Fund’s investment goals, policies, and strategies along with information on the classes of shares currently being offered.
2. Significant Accounting Policies
The following is a summary of the Funds’ significant accounting policies:
Each Fund is an investment company that follows the accounting and reporting guidance of Accounting Standards Codification Topic 946 applicable to investment companies.
Security valuation and fair value measurements — U.S. generally accepted accounting principles (“U.S. GAAP”) define fair value as the price the Funds would receive to sell an asset or pay to transfer a liability in an orderly transaction between market participants at the measurement date. All investments in securities are recorded at their fair value. The Funds define the term “market value”, as used throughout this report, as the estimated fair value. The Funds use various methods to measure fair value of their portfolio securities on a recurring basis. U.S. GAAP fair value measurement standards require disclosure of a hierarchy that prioritizes inputs to valuation methods. These inputs are summarized in the three broad levels listed below:
| • | Level 1 – quoted prices in active markets for identical securities |
Notes to Financial Statements (Continued)
| • | Level 2 – other significant observable inputs (including quoted prices for similar securities, interest rates, prepayment speeds, credit risk, etc.) |
| | |
| • | Level 3 – significant unobservable inputs (including a Fund’s own assumptions in determining the fair value of investments) |
The inputs or methodology used for valuing securities are not necessarily an indication of the risk associated with investing in those securities.
The aggregate value by input level, as of March 31, 2017, for each Fund’s investments, as well as a reconciliation of assets for which significant unobservable inputs (Level 3) were used in determining value, if applicable, is included in each Fund’s Portfolio of Investments, which also includes a breakdown of the Fund’s investments by geographic, portfolio or sector allocation. The Funds did not hold any Level 3 categorized securities during the year ended March 31, 2017.
Changes in valuation techniques may result in transfers into or out of an investment’s assigned level within the hierarchy. All transfers in and out of the levels are recognized at the value at the end of the period. At March 31, 2017, there were no transfers between Levels 1, 2 and 3 for all Funds, except as discussed in the Portfolio of Investments for the International Value Fund, Sands Capital Emerging Markets Growth Fund and Sustainability and Impact Equity Fund.
During the year ended March 31, 2017, there were no significant changes to the valuation policies and techniques.
The Funds’ portfolio securities are valued as of the close of the regular session of trading on the New York Stock Exchange (“NYSE”) (currently 4:00 p.m., Eastern Time). Portfolio securities traded on stock exchanges are valued at the last reported sale price, official close price, or last bid price if no sales are reported. Portfolio securities quoted by NASDAQ are valued at the NASDAQ Official Closing Price (“NOCP”) or from the primary exchange on which the security trades. To the extent these securities are actively traded, they are categorized in Level 1 of the fair value hierarchy. Options are valued at the last quoted sales price. If there is no such reported sale on the valuation date, long option positions are valued at the most recent bid price, and short option positions are valued at the most recent ask price and are categorized in Level 1. Shares of mutual funds in which the Funds invest are valued at their respective net asset values (“NAV”) as reported by the underlying funds (“Underlying Funds”) and are categorized in Level 1.
Debt securities held by the Funds are valued at their evaluated bid by an independent pricing service or at their last broker-quoted bid prices as obtained from one or more of the major market makers for such securities. Independent pricing services use information provided by market makers or estimates of market values through accepted market modeling conventions. Observable inputs to the models may include prepayment speeds, pricing spread, yield, trade information, dealer quotes, market color, cash flow models, the securities’ terms and conditions, among others, and are generally categorized in Level 2. Debt securities with a remaining maturity of 60 days or less may be valued at amortized cost, provided such amount approximates market value and are categorized in Level 2. While this method provides consistency in valuation (and may only be used if it approximates market value), it may result in periods during which fair value, as determined by amortized cost, is higher or lower than the price that would be received if the Fund sold the investment.
Foreign currency exchange contracts are valued at the mean between the bid and ask prices and are determined as of the close of regular trading on the NYSE. Interpolated values are derived when the settlement date of the contract is an interim date for which quotations are not available and categorized in Level 2.
Securities mainly traded on a non-U.S. exchange or denominated in foreign currencies are generally valued according to the preceding closing values on that exchange, translated to U.S. dollars using currency exchange
Notes to Financial Statements (Continued)
rates as of the close of regular trading on the NYSE, and are generally categorized in Level 1. However, if an event that may change the value of a security occurs after the time that the closing value on the non-U.S. exchange was determined, but before the close of regular trading on the NYSE, the security may be priced based on fair value and generally categorized in Level 2. This may cause the value of the security, if held on the books of a Fund to be different from the closing value on the non-U.S. exchange and may affect the calculation of that Fund’s NAV.
The Funds may use fair value pricing under the following circumstances, among others:
| • | If the value of a security has been materially affected by events occurring before the Funds’ pricing time but after the close of the primary markets on which the security is traded. |
| • | If the exchange on which a portfolio security is principally traded closes early or if trading in a particular portfolio security was halted during the day and did not resume prior to the Funds’ NAV calculation. |
| • | If a security is so thinly traded that reliable market quotations are unavailable due to infrequent trading. |
| • | If the validity of market quotations is not reliable. |
Securities held by the Funds that do not have readily available market quotations, significant observable inputs, or securities for which the available market quotations are not reliable, are priced at their estimated fair value using procedures approved by the Board of Trustees (the “Board”) and are generally categorized in Level 3.
Investment companies — The Funds may invest in securities of other investment companies, including exchange-traded funds (“ETFs”), open-end funds, and closed-end funds. Open-end funds are investment companies that issue new shares continuously and redeem shares daily. Closed-end funds are investment companies that typically issue a fixed number of shares that trade on a securities exchange or over-the-counter (“OTC”). An ETF is an investment company that typically seeks to track the performance of an index by holding in its portfolio shares of all the companies, or a representative sample of the companies, that are components of a particular index. ETF shares are traded on a securities exchange based on their market value. The risks of investment in other investment companies typically reflect the risks of the types of securities in which the other investment companies invest. Investments in ETFs and closed-end funds are subject to the additional risk that their shares may trade at a premium or discount to their NAV. When a Fund invests in another investment company, shareholders of the Fund indirectly bear their proportionate share of the other investment company’s fees and expenses, including operating, registration, trustee, licensing, and marketing, as well as their share of the Fund’s fees and expenses.
Securities sold short — The Flexible Income Fund may engage in selling securities short, which obligates the Fund to replace a security borrowed by purchasing the same security at the current market value. The Fund would incur a loss if the price of the security increases between the date of the short sale and the date on which the Fund replaces the borrowed security. The Fund would realize a gain if the price of the security declines between those dates. As of March 31, 2017, the Flexible Income Fund did not hold any securities sold short.
Options — The Flexible Income Fund may write or purchase financial option contracts primarily to hedge against changes in the value of equity securities (or securities that the Fund intends to purchase), against fluctuations in fair value caused by changes in prevailing market interest rates or foreign currency exchange rates and against changes in overall equity market volatility. In addition, the Fund may utilize options in an attempt to generate gains from option premiums or to reduce overall portfolio risk. The Fund’s option strategy primarily focuses on the use of writing and/or purchasing call or put options on equity indexes. When the Fund writes or purchases an option, an amount equal to the premium received or paid by the Fund is recorded as a liability or an asset and is subsequently adjusted to the current market value of the option written or purchased. Premiums received or paid from writing or purchasing options which expire unexercised are treated by the Fund on the expiration
Notes to Financial Statements (Continued)
date as realized gains or losses. The difference between the premium and the amount paid or received on effecting a closing purchase or sale transaction, including brokerage commissions, is also treated as a realized gain or loss. If an option is exercised, the premium paid or received is added to the cost of the purchase or proceeds from the sale in determining whether the Fund has realized a gain or loss on investment transactions. The Fund, as writer of an option, may have no control over whether the underlying securities may be sold (call) or purchased (put) and as a result bears the market risk of an unfavorable change in the price of the security underlying the written option. The Fund, as purchaser of an option, bears the risk that the counterparties to the option may not have the ability to meet the terms of the option contracts. There is minimal counterparty credit risk involved in entering into option contracts since they are exchange-traded instruments and the exchange’s clearinghouse, as counterparty to all exchange-traded options, guarantees the options against default. As of March 31, 2017, the Flexible Income Fund held written options with a fair value of $(54,000) and pledged securities with a fair value of $791,248 as collateral and pledged cash collateral of $417. The Flexible Income Fund held purchased options with a fair value of $213,000.
Futures Contracts — The Flexible Income Fund may buy and sell futures contracts and related options to manage its exposure to changing interest rates and securities prices. Some strategies reduce the Fund’s exposure to price fluctuations, while others tend to increase its market exposure. Futures and options on futures can be volatile instruments and involve certain risks that could negatively impact the Fund’s return. In order to avoid leveraging and related risks, when the Fund purchases futures contracts, it will collateralize its position by depositing an amount of cash or liquid securities, equal to the market value of the futures positions held, less margin deposits, in a segregated account with its custodian or otherwise “cover” its position in a manner consistent with the 1940 Act, or the rules of the Securities and Exchange Commission (the “SEC”) or interpretations thereunder. Collateral equal to the current market value of the futures position will be marked to market on a daily basis.
When the contract is closed, the Fund records a realized gain or loss equal to the difference between the proceeds from (or cost of) the closing transactions and the Fund’s basis in the contract. Risks of entering into futures contracts include the possibility that a change in the value of the contract may not correlate with the changes in the value of the underlying instruments. Second, it is possible that a lack of liquidity for futures contracts could exist in the secondary market resulting in an inability to close a futures position prior to its maturity date. Third, the purchase of a futures contract involves the risk that the Fund could lose more than the original margin deposit required to initiate the futures transaction. Finally, the risk exists that losses could exceed amounts disclosed on the Statements of Assets and Liabilities. There is minimal counterparty credit risk involved in entering into futures contracts since they are exchange-traded instruments and the exchange’s clearinghouse, as counterparty to all exchange-traded futures, guarantees the futures against default. As of March 31, 2017, the Flexible Income Fund held futures contracts as shown in the Portfolio of Investments and had cash in the amount of $2,406,802 held as collateral for futures contracts.
Swap Contracts — The Flexible Income Fund may enter into swap transactions to help enhance the value of its portfolio or manage its exposure to different types of investments. Swaps are financial instruments that typically involve the exchange of cash flows between two parties on specified dates (settlement dates), where the cash flows are based on agreed-upon prices, rates, indexes, etc. The nominal amount on which the cash flows are calculated is called the notional amount. Swaps are individually negotiated and structured to include exposure to a variety of different types of investments or market factors, such as interest rates, foreign currency rates, mortgage securities, corporate borrowing rates, security prices, indexes or inflation rates.
Swap agreements may increase or decrease the overall volatility of the investments of the Fund and its share price. The performance of swap agreements may be affected by a change in the specific interest rate, currency, or other factors that determine the amounts of payments due to and from the Fund. If a swap agreement calls for payments by the Fund, the Fund must be prepared to make such payments when due. In addition, if the
Notes to Financial Statements (Continued)
counterparty’s creditworthiness declines, the value of a swap agreement would be likely to decline, potentially resulting in losses.
Generally, bilateral swap agreements, OTC swaps, have a fixed maturity date that will be agreed upon by the parties. The agreement can be terminated before the maturity date only under limited circumstances, such as default by one of the parties or insolvency, among others, and can be transferred by a party only with the prior written consent of the other party. The Fund may be able to eliminate its exposure under a swap agreement either by assignment or by other disposition, or by entering into an offsetting swap agreement with the same party or a similarly creditworthy party. If the counterparty is unable to meet its obligations under the contract, declares bankruptcy, defaults or becomes insolvent, the Fund may not be able to recover the money it expected to receive under the contract.
Cleared swaps are transacted through futures commission merchants that are members of central clearinghouses with the clearinghouses serving as a central counterparty. Pursuant to rules promulgated under the Dodd-Frank Act, central clearing of swap agreements is currently required for certain market participants trading certain instruments, and central clearing for additional instruments is expected to be implemented by regulators until the majority of the swaps market is ultimately subject to central clearing.
Swaps are marked-to-market daily based upon values received from third party vendors or quotations from market makers. For OTC swaps, any upfront premiums paid or received are recorded as assets or liabilities, respectively, and are shown as premium paid on swap agreements or premium received on swap agreements in the Statements of Assets and Liabilities. For swaps that are centrally cleared, initial margins, determined by each relevant clearing agency, are posted and segregated at a broker account registered with the Commodity Futures Trading Commission (“CFTC”), or the applicable regulator. The change in value of swaps, including accruals of periodic amounts of interest to be paid or received on swaps, is recorded as unrealized appreciation or depreciation. Daily changes in the value of centrally cleared swaps are recorded on the Statements of Assets and Liabilities as receivable or payable for variation margin on swap agreements and settled daily. Upfront premiums and liquidation payments received or paid are recorded as realized gains or losses at the termination or maturity of the swap. Net periodic payments received or paid by the Fund are recorded as realized gain or loss.
A swap agreement can be a form of leverage, which can magnify the Fund’s gains or losses. In order to reduce the risk associated with leveraging, the Fund may cover its current obligations under swap agreements according to guidelines established by the SEC. If the Fund enters into a swap agreement on a net basis, it will segregate assets with a daily value at least equal to the excess, if any, of the Fund’s accrued obligations under the swap agreement over the accrued amount the Fund is entitled to receive under the agreement. If the Fund enters into a swap agreement on other than a net basis, it will segregate assets with a value equal to the full amount of the Fund’s accrued obligations under the agreement.
As of March 31, 2017, the Flexible Income Fund did not hold any swap contracts and had cash in the amount of $975,788 held as collateral for swap contracts.
Foreign currency translation — The books and records of the Funds are maintained in U.S. dollars and translated into U.S. dollars on the following basis:
| (1) | market value of investment securities, assets and liabilities at the current rate of exchange on the valuation date; and |
| (2) | purchases and sales of investment securities, income, and expenses at the relevant rates of exchange prevailing on the respective dates of such transactions. |
Notes to Financial Statements (Continued)
The Funds do not isolate that portion of gains and losses on investments in equity securities that is due to changes in the foreign exchange rates from that which is due to changes in market prices of equity securities.
Forward foreign currency contracts — A forward foreign currency contract is an agreement between two parties to buy and sell a specific currency at a price that is set on the date of the contract. The forward contract calls for delivery of the currency on a future date that is specified in the contract. Risks related to the use of forwards include the possible failure of counterparties to meet the terms of the forward agreement, the failure of the counterparties to timely post collateral, the risk that currency movements will not occur thereby reducing a Fund’s total return, and the potential for losses in excess of a Fund’s initial investment.
The market value of a forward foreign currency contract fluctuates with changes in foreign currency exchange rates. Forward foreign currency contracts are marked to market daily and the change in value is recorded by a Fund as an unrealized gain or loss. Realized gains or losses, equal to the difference between the value of the contract at the time it was opened and the value at the time it was closed, are recorded upon delivery or receipt of the currency.
During the year ended March 31, 2017, the Flexible Income Fund used forward foreign currency contracts to enhance potential gains, hedge against anticipated currency exchange rates, maintain diversity and liquidity of the portfolio and adjust exposure to foreign currencies.
Real Estate Investment Trusts — The Funds may invest in real estate investment trusts (“REITs”) that involve risks not associated with investing in stocks. Risks include declines in the value of real estate, general and economic conditions, changes in the value of the underlying property and defaults by borrowers. The value of assets in the real estate industry may go through cycles of relative underperformance and outperformance in comparison to equity securities markets in general. Dividend income is recorded using management’s estimate of the income included in distributions received from REIT investments. The actual amounts of income, return of capital and capital gains are only determined by each REIT after its fiscal year-end and may differ from the estimated amount. Estimates of income are adjusted in the Funds to the actual amounts when the amounts are determined.
Derivative instruments and hedging activities — The Flexible Income Fund may enter into an International Swaps and Derivatives Association, Inc. Master Agreement (“ISDA Master Agreement” or “MNA”) or similar agreement with certain counterparties. An ISDA Master Agreement is a bilateral agreement between the Fund and a counterparty that governs OTC derivatives and foreign exchange contracts, and typically contains, among other things, collateral posting terms and master netting provisions in the event of a default or termination. Under an ISDA Master Agreement, a party may, under certain circumstances, offset with the counterparty certain derivative financial instrument’s payables or receivables with collateral held or posted and create one single net payment. The provisions of the ISDA Master Agreement typically permit a single net payment in the event of default (close-out netting). These default events include bankruptcy or insolvency of the counterparty. Note, however, that bankruptcy or insolvency laws of a particular jurisdiction may impose restrictions on or prohibitions against the right of offset.
When entering into a derivative transaction, the Fund may be required to post and maintain collateral or margin (including both initial and maintenance margin). Collateral and margin requirements differ by type of derivative. Margin requirements are established by the broker or clearing house for exchange traded and centrally cleared derivatives (financial futures contracts, options, and centrally cleared swaps). Brokers can ask for margining in excess of the clearing house’s minimum in certain circumstances. Collateral terms are contract specific for OTC derivatives (foreign currency exchange contracts, options, and swaps). For derivatives traded under an ISDA Master Agreement, the collateral requirements are typically calculated by netting the marked-to-market amount for each transaction under such agreement and comparing that amount to the value of any collateral currently pledged by the Fund and the counterparty. For financial reporting purposes, cash collateral that has been pledged to cover obligations
Notes to Financial Statements (Continued)
of the Fund and cash collateral received from the counterparty, if any, are reported separately on the Statement of Assets and Liabilities as cash pledged as collateral and cash received as collateral, respectively. Non-cash collateral pledged by the Fund, if any, is noted in the Portfolio of Investments. To the extent amounts due to the Fund from its counterparties are not fully collateralized, contractually or otherwise, the Fund bears the risk of loss from counterparty non-performance.
Certain ISDA Master Agreements allow counterparties to OTC derivatives transactions to terminate derivative contracts prior to maturity in the event the Fund’s net assets decline by a stated percentage or the Fund fails to meet the terms of its ISDA Master Agreement, which would cause the Fund (counterparty) to accelerate payment of any net liability owed to the counterparty (Fund).
For financial reporting purposes, the Flexible Income Fund does not offset derivative assets and derivative liabilities that are subject to netting arrangements in the Statement of Assets and Liabilities.
As of March 31, 2017, the Flexible Income Fund’s assets and liabilities that were subject to a MNA on a gross basis were as follows:
| | | Assets | | | Liabilities | |
| Flexible Income Fund | | | | | | | | |
| Forward Foreign Currency Contracts | | $ | — | | | $ | (93,426 | ) |
| Futures Contracts | | | 119,100 | | | | (15,114 | ) |
| Written Options | | | — | | | | (54,000 | ) |
| Total gross amount of assets and liabilities subject to MNA | | $ | 119,100 | | | $ | (162,540 | ) |
The following table presents the Flexible Income Fund’s assets net of amounts available for offset under a MNA and net of the related collateral pledged to the Fund as of March 31, 2017:
| | | | | Gross Amount | | | Gross Amount Available | | | | | | | | | | |
| | | | | of | | | for Offset in Statement | | | Non-Cash | | | Cash | | | | |
| | | Derivative | | Recognized | | | of Assets | | | Collateral | | | Collateral | | | Net | |
| Counterparty | | Type | | Assets | | | and Liabilities | | | Received | | | Received | | | Amount(A) | |
| Wells Fargo | | Futures Contracts | | $ | 119,100 | | | $ | (15,114 | ) | | $ | — | | | $ | (103,986 | ) | | $ | — | |
| (A) | Net amount represents the net amount receivable from the counterparty in the event of default. |
The following table presents the Flexible Income Fund’s liabilities net of amounts available for offset under a MNA and net of the related collateral pledged by the Fund as of March 31, 2017:
| | | | | Gross | | | | | | | | | | | | | |
| | | | | Amount | | | | | | | | | | | | | |
| | | | | of | | | Gross Amount Available | | | Non-Cash | | | Cash | | | | |
| | | Derivative | | Recognized | | | for Offset in Statement of | | | Collateral | | | Collateral | | | Net | |
| Counterparty | | Type | | Liabilities | | | Assets and Liabilities | | | Pledged | | | Pledged | | | Amount(A) | |
| ANZ Capital Markets | | Forward Foreign Currency Contracts | | $ | 93,426 | | | $ | — | | | $ | — | | | $ | | | | $ | 93,426 | |
| Wells Fargo | | Futures Contracts | | | 15,114 | | | | (15,114 | ) | | | — | | | | | | | | — | |
| Pershing LLC | | Written Options | | | 54,000 | | | | — | | | | (53,583 | ) | | | (417 | ) | | | — | |
| (A) | Net amount represents the net amount payable due to the counterparty in the event of default. |
Notes to Financial Statements (Continued)
The following table sets forth the fair value of the Flexible Income Fund’s derivative financial instruments by primary risk exposure as of March 31, 2017:
| Fair Value of Derivative Investments |
| As of March 31, 2017 |
| | | Derivatives not accounted for as hedging | | Asset | | | Liability | |
| Fund | | instruments under ASC 815 | | Derivatives | | | Derivatives | |
| Flexible Income Fund | | Purchased Options - Equity Contracts* | | $ | 213,000 | | | $ | — | |
| | | Written Options - Equity Contracts** | | | — | | | | (54,000 | ) |
| | | Forward Foreign Currency Contracts*** | | | — | | | | (93,426 | ) |
| | | Futures - Interest Rate Contracts**** | | | 93,396 | | | | (15,114 | ) |
| | | Futures - Equity Contracts**** | | | 25,704 | | | | — | |
* Statements of Assets and Liabilities Location: Investments, at market value.
** Statement of Assets and Liabilities Location: Written options, at market value.
*** Statements of Assets and Liabilities Location: Unrealized depreciation on forward foreign currency contracts.
**** Statements of Assets and Liabilities Location: Payable/Receivable for variation margin on futures contracts.
The following table sets forth the effect of the Flexible Income Fund’s derivative financial instruments by primary risk exposure on the Statements of Operations for the year ended March 31, 2017:
| The Effect of Derivative Investments on the Statement of Operations |
| for the Year Ended March 31, 2017 |
| | | | | | | | Change in | |
| | | | | | | | Unrealized | |
| | | | | Realized Gain | | | Appreciation | |
| | | Derivatives not accounted for as hedging | | (Loss) | | | (Depreciation) | |
| Fund | | instruments under ASC 815 | | on Derivatives | | | on Derivatives | |
| Flexible Income Fund | | Purchased Options - Equity Contracts* | | $ | (297,741 | ) | | $ | 82,466 | |
| | | Purchased Options - Interest Rate Contracts* | | | (278,260 | ) | | | — | |
| | | Written Options - Equity Contracts** | | | 523,732 | | | | 54,435 | |
| | | Written Options - Interest Rate Contracts** | | | 85,865 | | | | — | |
| | | Written Options - Foreign Currency | | | | | | | | |
| | | Contracts** | | | 169,588 | | | | 44,872 | |
| | | Forward - Foreign Currency Contracts*** | | | (3,278,381 | ) | | | 1,457,688 | |
| | | Futures - Equity Contracts**** | | | (1,173,678 | ) | | | 25,704 | |
| | | Futures - Interest Rate Contracts**** | | | 1,342,459 | | | | 78,282 | |
| | | Swap Agreements - Credit Contracts***** | | | (627,693 | ) | | | — | |
* Statements of Operations Location: Net realized gains (losses) on investments and net change in unrealized appreciation (depreciation) on investments, respectively.
**Statements of Operations Location: Net realized gains on written options and net change in unrealized appreciation (depreciation) on written options, respectively.
*** Statements of Operations Location: Net realized gains (losses) on foreign currency transactions and net change in unrealized appreciation (depreciation) on foreign currency transactions, respectively.
**** Statements of Operations Location: Net realized gains on futures contracts and net change in unrealized appreciation (depreciation) on futures contracts, respectively.
***** Statements of Operations Location: Net realized losses on swap agreements.
Notes to Financial Statements (Continued)
For the year ended March 31, 2017, the average quarterly balance of outstanding derivative financial instruments for the Flexible Income Fund was as follows:
| | | Flexible | |
| | | Income | |
| | | Fund | |
| Equity contracts: | | | | |
| Purchased Options - Cost | | $ | 126,423 | |
| Written Options - Premiums received | | $ | 42,161 | |
| Futures - Average notional value | | $ | 1,016,509 | |
| Interest rate contracts: | | | | |
| Futures - Average notional value | | $ | 89,737,873 | |
| Credit Contracts: | | | | |
| Credit Default Swaps - Average notional value | | $ | 6,000,000 | |
| Forward foreign currency contracts: | | | | |
| Average number of contracts | | | 7 | |
| Average U.S. dollar amount delivered | | $ | 21,109,756 | |
| Average U.S. dollar amount received | | $ | 23,995,203 | |
Portfolio securities loaned — The Funds may lend their portfolio securities. Lending portfolio securities exposes the Funds to the risk that the borrower may fail to return the loaned securities or may not be able to provide additional collateral or that the Funds may experience delays in recovery of the loaned securities or loss of rights in the collateral if the borrower fails financially. To minimize these risks, the borrower must agree to maintain cash collateral with the Funds’ custodian. The loaned securities are secured by collateral valued at least equal, at all times, to the market value of the loaned securities plus accrued interest, if any. When the collateral falls below specified amounts, the lending agent will use its best effort to obtain additional collateral on the next business day to meet required amounts under the security lending agreement. The cash collateral is reinvested by the Funds’ custodian into an approved short-term investment vehicle. The approved short-term investment vehicle is subject to market risk.
As of March 31, 2017, the following Funds loaned securities and received collateral as follows:
| | | | | Market | | | | | | | |
| | | | | Value of | | | Market Value | | | | |
| | | | | Securities | | | of Collateral | | | Net | |
| Fund | | Security Type | | Loaned* | | | Received** | | | Amount*** | |
| Flexible Income Fund | | Corporate Bonds | | $ | 3,360,368 | | | $ | 3,443,448 | | | $ | 83,080 | |
| | | Exchange Traded Funds | | | 3,521,835 | | | | 3,637,125 | | | | 115,290 | |
| | | Preferred Stocks | | | 53,319 | | | | 54,600 | | | | 1,281 | |
| Total Flexible Income Fund | | | | | 6,935,522 | | | | 7,135,173 | | | | 199,651 | |
| Focused Fund | | Common Stocks | | | 257,889 | | | | 264,222 | | | | 6,333 | |
| International Growth Fund | | Common Stocks | | | 586,457 | | | | 600,444 | | | | 13,987 | |
| International Value Fund | | Common Stocks | | | 16,776 | | | | 17,100 | | | | 324 | |
| Mid Cap Growth Fund | | Common Stocks | | | 3,303,140 | | | | 3,516,750 | | | | 213,610 | |
| Sands Capital Emerging Markets Growth Fund | | Common Stocks | | | 76,120 | | | | 76,450 | | | | 330 | |
| Small Cap Growth Fund | | Common Stocks | | | 16,393,040 | | | | 23,404,149 | | | | 7,011,109 | |
| Sustainability and Impact Equity Fund | | Common Stocks | | | 3,477,942 | | | | 3,913,812 | | | | 435,870 | |
* The remaining contractual maturity is overnight for all securities.
** Gross amount of recognized liabilities for securities lending included in the Statements of Assets and Liabilities.
*** Net amount represents the net amount payable due to the borrower in the event of default.
Notes to Financial Statements (Continued)
All cash collateral is received, held, and administered by the Funds’ custodian for the benefit of the lending Fund in its custody account or other account established for the purpose of holding collateral.
Funds participating in securities lending receive compensation in the form of fees. Securities lending income is derived from lending long securities from the Funds to creditworthy approved borrowers at rates that are determined based on trading volumes, float, short-term interest rates and market liquidity and is shown net of fees on the Statements of Operations. When a Fund lends securities, it retains the interest or dividends on the investment of any cash received as collateral, and the Fund continues to receive interest or dividends on the loaned securities.
Unrealized gain or loss on the market value of the loaned securities that may occur during the term of the loan is recognized by the Fund. The Fund has the right under the lending agreement to recover any loaned securities from the borrower on demand.
Share valuation — The NAV per share of each class of shares of each Fund is calculated daily by dividing the total value of a Fund’s assets attributable to that class, less liabilities attributable to that class, by the number of outstanding shares of that class.
The maximum offering price per share of Class A shares of the Funds is equal to the NAV per share plus a sales load equal to 6.10% of the NAV (or 5.75% of the offering price). There is no sales load on purchases of $1 million or more of Class A shares. The maximum offering price per share of Classes C, Y, and Institutional Class shares of the Funds is equal to the NAV per share.
The redemption price per share of each class of shares of the Funds is generally equal to the NAV per share. However, Class A redemptions that were part of a no-load $1 million subscription may be subject to a contingent deferred sales charge (“CDSC”) of up to 1.00% if redeemed within a one-year period from the date of purchase. During the year ended March 31, 2017, all Class B shares were converted to Class A shares as they reached their 8-year Anniversary. Class B shares of the Funds were subject to a CDSC of 5.00% in the event of a shareholder redemption within a one-year period of purchase. The CDSC was incrementally reduced over time. After the 6th year, there was no CDSC. Additionally, purchases of Class C shares of the Funds are subject to a CDSC of 1.00%. The CDSC will be assessed on an amount equal to the lesser of (1) the NAV at the time of purchase of the shares being redeemed or (2) the NAV of such shares being redeemed, if redeemed within a one-year period from the date of purchase.
Investment income — Dividend income from securities is recognized on the ex-dividend date, net of foreign withholding taxes, if any, which are reduced by any amounts reclaimable by the Funds, where applicable. Interest income from securities is recorded on the basis of interest accrued, premium amortized and discount accreted. Realized gains and losses resulting from principal paydowns on mortgage-backed and asset-backed securities are included in interest income. Market discounts, original issues discount (“OID”) and market premiums on debt securities are accreted/amortized to interest income over the life of the security with a corresponding adjustment in the cost basis of that security. In addition, it is the Funds’ policy to accrue for foreign capital gains taxes, if applicable, on certain foreign securities held by the Funds. An estimated foreign capital gains tax is recorded daily on net unrealized gains on these securities and is payable upon the sale of such securities when a gain is realized.
Distributions to shareholders — Each Fund intends to distribute to its shareholders substantially all of its income and capital gains. Each Fund, except for the Flexible Income Fund and the International Value Fund declares and distributes net investment income, if any, annually, as a dividend to shareholders. The Flexible Income Fund declares and distributes net investment income, if any, monthly, as a dividend to shareholders. Effective March 29, 2017, the International Value Fund declares and distributes net investment income, if any, quarterly as a dividend to shareholders. Prior to March 29, 2017, the International Value Fund declared and distributed
Notes to Financial Statements (Continued)
net investment income, if any, annually as a dividend to shareholders. Each Fund makes distributions of capital gains, if any, at least annually, net of applicable capital loss carryforwards. Income distributions and capital gain distributions are determined in accordance with income tax regulations. Recognition of the Funds’ net investment income from investments in Underlying Funds is affected by the timing of dividend declarations by the Underlying Funds.
Allocations — Investment income earned, realized capital gains and losses, and unrealized appreciation and depreciation for a Fund are allocated daily to each class of shares based upon its proportionate share of total net assets of the Fund. Class-specific expenses are charged directly to the class incurring the expense. Common expenses, which are not attributable to a specific class, are allocated daily to each class of shares based upon their proportionate share of total net assets of the Fund. Expenses not directly billed to a Fund are allocated proportionally among all the Funds in the Trust, and, if applicable, Touchstone Funds Group Trust, Touchstone Institutional Funds Trust, and Touchstone Variable Series Trust (collectively with the Trust, “Touchstone Fund Complex”), daily in relation to net assets of each Fund or another reasonable measure.
Security transactions — Security transactions are reflected for financial reporting purposes as of the trade date. Realized gains and losses on sales of portfolio securities are calculated using the identified cost basis.
Estimates — The preparation of financial statements in conformity with U.S. GAAP requires management to make estimates and assumptions that affect the reported amounts of assets and liabilities and disclosure of contingent assets and liabilities at the date of the financial statements and the reported amounts of income and expenses during the reporting period. Actual results could differ from those estimates.
Regulatory Updates — In October 2016, the Securities and Exchange Commission released its Final Rule on Investment Company Reporting Modernization (the “Rule”). The Rule contains amendments to Regulation S-X which impact financial statement presentation, particularly the presentation of derivative investments. Although still evaluating the impact of the Rule, management believes that many of the Regulation S-X amendments are materially consistent with the Funds’ current financial statement presentation and expects that the Funds will comply with the Rule’s Regulation S-X amendments by the August 1, 2017 compliance date.
3. Investment Transactions
Investment transactions (excluding short-term investments and U.S. Government securities) were as follows for the year ended March 31, 2017:
| | | Flexible | | | | | | Growth | |
| | | Income | | | Focused | | | Opportunities | |
| | | Fund | | | Fund | | | Fund | |
| Purchases of investment securities | | $ | 602,166,270 | | | $ | 269,254,545 | | | $ | 243,789,740 | |
| Proceeds from sales and maturities | | $ | 437,081,922 | | | $ | 265,656,371 | | | $ | 339,220,594 | |
| | | International | | | International | | | Mid Cap | |
| | | Growth | | | Value | | | Growth | |
| | | Fund | | | Fund | | | Fund | |
| Purchases of investment securities | | $ | 16,756,997 | | | $ | 6,246,899 | | | $ | 669,824,138 | |
| Proceeds from sales and maturities | | $ | 6,062,022 | | | $ | 28,289,118 | | | $ | 852,711,522 | |
| | | Sands Capital | | | | | | | |
| | | Emerging | | | | | | Sustainability | |
| | | Markets | | | Small Cap | | | and Impact | |
| | | Growth | | | Growth | | | Equity | |
| | | Fund | | | Fund | | | Fund | |
| Purchases of investment securities | | $ | 200,716,593 | | | $ | 272,127,039 | | | $ | 149,554,887 | |
| Proceeds from sales and maturities | | $ | 105,322,500 | | | $ | 490,006,549 | | | $ | 147,564,643 | |
Notes to Financial Statements (Continued)
For the year ended March 31, 2017, purchases and proceeds from sales and maturities in U.S. Government securities were $320,944,004 and $362,959,312, respectively, for the Flexible Income Fund.
4. Transactions with Affiliates and Other Related Parties
Certain officers of the Trust are also officers of Touchstone Advisors, Inc. (the “Advisor”), Touchstone Securities, Inc. (the “Underwriter”), or BNY Mellon Investment Servicing (U.S.) Inc. (“BNY Mellon”), the Sub-Administrator and Transfer Agent to the Funds. Such officers receive no compensation from the Trust. The Advisor and the Underwriter are each wholly-owned, indirect subsidiaries of Western & Southern Financial Group, Inc. (“Western & Southern”).
On behalf of the Funds, the Advisor pays each Independent Trustee a quarterly retainer plus additional retainers to the Lead Independent Trustee and the chairs of each standing committee. Interested Trustees do not receive compensation from the Funds. Each Independent Trustee also receives compensation for each board meeting and committee meeting attended. Each standing committee chair receives additional compensation for each committee meeting that he or she oversees. The Advisor is reimbursed by the Funds for the Independent Trustees’ compensation and out-of-pocket expenses relating to their services. The Funds accrued Trustee-related expenses of $142,182 for the year ended March 31, 2017.
MANAGEMENT & EXPENSE LIMITATION AGREEMENTS
The Advisor provides general investment supervisory services for the Funds, under terms of an advisory agreement (“Advisory Agreement”). Under the Advisory Agreement, each Fund pays the Advisor a fee, which is computed and accrued daily and paid monthly, at an annual rate based on average daily net assets of each Fund as shown in the table below.
| Flexible Income Fund | 0.70% on the first $500 million |
| | 0.60% on such assets in excess of $500 million |
| Focused Fund | 0.70% on the first $100 million |
| | 0.65% on the next $400 million |
| | 0.60% on such assets in excess of $500 million |
| Growth Opportunities Fund | 0.75% on the first $500 million |
| | 0.70% on the next $500 million |
| | 0.65% on such assets in excess of $1 billion |
| International Growth Fund | 0.90% on the first $500 million |
| | 0.85% on the next $1 billion |
| | 0.80% on such assets in excess of $1.5 billion |
| International Value Fund | 1.00% |
| Mid Cap Growth Fund | 0.75% on the first $500 million |
| | 0.70% on the next $500 million |
| | 0.65% on such assets in excess of $1 billion |
| Sands Capital Emerging Markets Growth Fund | 1.15% |
| Small Cap Growth Fund | 1.00% on the first $300 million |
| | 0.95% on such assets in excess of $300 million |
| Sustainability and Impact Equity Fund | 0.75% on the first $200 million |
| | 0.70% on the next $800 million |
| | 0.65% on such assets in excess of $1 billion |
Notes to Financial Statements (Continued)
The Advisor has entered into investment sub-advisory agreements with the following parties (each, a “Sub-Advisor”):
| Apex Capital Management* | Rockefeller & Co., Inc. |
| International Growth Fund | Sustainability and Impact Equity Fund |
| Small Cap Growth Fund | Sands Capital Management, LLC |
| Barrow, Hanley, Mewhinney & Strauss, LLC | Sands Capital Emerging Markets Growth Fund |
| International Value Fund | Westfield Capital Management Company, L.P. |
| ClearArc Capital, Inc. | Growth Opportunities Fund |
| Flexible Income Fund | Mid Cap Growth Fund |
| Fort Washington Investment Advisors, Inc.** | |
| Focused Fund | |
*Apex Capital Management, Inc. was acquired by Fiera Capital, Inc. Apex Capital Management is a trade name used by Fiera Capital, Inc.
**Affiliate of the Advisor and wholly-owned subsidiary of Western & Southern.
The Advisor, not the Funds, pays sub-advisory fees to each Sub-Advisor.
The Advisor entered into an expense limitation agreement (the “Expense Limitation Agreement”) to contractually limit the annual operating expenses of the Funds, excluding: dividend and interest expenses relating to short sales; interest; taxes; brokerage commissions and other transaction costs; portfolio transactions and investment related expenses; other expenditures which are capitalized in accordance with U.S. GAAP; the cost of “Acquired Fund Fees and Expenses”; if any, and other extraordinary expenses not incurred in the ordinary course of business. The maximum annual operating expense limit in any year with respect to the Funds is based on a percentage of the average daily net assets of the Funds. The Advisor has agreed to separately waive class-level expenses, advisory fees and administration fees, and to reimburse expenses in order to maintain the following expense limitations for the Funds:
| | | | | | | | | | | | Institutional | |
| | | Class A | | | Class C | | | Class Y | | | Class | |
| Flexible Income Fund | | | 1.09 | % | | | 1.84 | % | | | 0.84 | % | | | 0.74 | % |
| Focused Fund | | | 1.20 | % | | | 1.95 | % | | | 0.95 | % | | | 0.83 | % |
| Growth Opportunities Fund | | | 1.24 | % | | | 1.99 | % | | | 0.99 | % | | | 0.89 | % |
| International Growth Fund | | | 1.32 | % | | | 2.07 | % | | | 1.07 | % | | | 0.97 | % |
| International Value Fund | | | 1.34 | % | | | 2.09 | % | | | 1.09 | % | | | 0.99 | % |
| Mid Cap Growth Fund | | | 1.39 | % | | | 2.14 | % | | | 1.14 | % | | | 0.99 | % |
| Sands Capital Emerging Markets Growth Fund | | | — | | | | — | | | | 1.49 | % | | | 1.39 | % |
| Small Cap Growth Fund | | | 1.44 | % | | | 2.19 | % | | | 1.19 | % | | | 1.04 | % |
| Sustainability and Impact Equity Fund | | | 1.24 | % | | | 1.99 | % | | | 0.99 | % | | | 0.89 | % |
These expense limitations will remain in effect for all Funds through at least July 29, 2017, but can be terminated by a vote of the Funds’ Board if it deems the termination to be beneficial to the Fund’s shareholders.
During the year ended March 31, 2017, the Advisor or its affiliates waived investment advisory fees and administration fees or reimbursed expenses, including distribution fees of the Funds, as follows:
| | | Investment | | | | | | Other Operating | | | | |
| | | Advisory | | | | | | Expenses | | | | |
| | | Fees | | | Administration | | | Reimbursed/ | | | | |
| Fund | | Waived | | | Fees Waived | | | Waived | | | Total | |
| Flexible Income Fund | | $ | — | | | $ | 763,608 | | | $ | 296,412 | | | $ | 1,060,020 | |
| Focused Fund | | | — | | | | — | | | | 375,144 | | | | 375,144 | |
| Growth Opportunities Fund | | | — | | | | 128,020 | | | | 196,731 | | | | 324,751 | |
Notes to Financial Statements (Continued)
| | | Investment | | | | | | Other Operating | | | | |
| | | Advisory | | | | | | Expenses | | | | |
| | | Fees | | | Administration | | | Reimbursed/ | | | | |
| Fund | | Waived | | | Fees Waived | | | Waived | | | Total | |
| International Growth Fund | | $ | 72,065 | | | $ | 14,283 | | | $ | 22,842 | | | $ | 109,190 | |
| International Value Fund | | | 118,926 | | | | 40,485 | | | | 56,639 | | | | 216,050 | |
| Mid Cap Growth Fund | | | — | | | | — | | | | 17,832 | | | | 17,832 | |
| Sands Capital Emerging Markets Growth Fund | | | — | | | | 33,582 | | | | 114,872 | | | | 148,454 | |
| Small Cap Growth Fund | | | — | | | | 531,247 | | | | 259,620 | | | | 790,867 | |
| Sustainability and Impact Equity Fund | | | — | | | | 146,523 | | | | 218,130 | | | | 364,653 | |
Under the terms of the Expense Limitation Agreement the Advisor is entitled to recover, subject to approval by the Funds’ Board, such amounts waived or reimbursed for a period of up to three years from the year in which the Advisor reduced its compensation or assumed expenses for the Funds. No recoupment will occur unless a Fund’s operating expenses are below the expense limitation amount in effect at the time of waiver or reimbursement. As of March 31, 2017, the Advisor may seek recoupment of previously waived fees and reimbursed expenses as follows:
| | | Expiration | | | Expiration | | | Expiration | | | | |
| | | March 31, | | | March 31, | | | March 31, | | | | |
| Fund | | 2018 | | | 2019 | | | 2020 | | | Total | |
| Flexible Income Fund | | $ | 506,352 | | | $ | 775,043 | | | $ | 988,671 | | | $ | 2,270,066 | |
| Focused Fund | | | 502,116 | | | | 178,123 | | | | 23,692 | | | | 703,931 | |
| Growth Opportunities Fund | | | 223,185 | | | | 227,669 | | | | 262,643 | | | | 713,497 | |
| International Growth Fund | | | — | | | | — | | | | 109,155 | | | | 109,155 | |
| International Value Fund | | | 357,335 | | | | 327,638 | | | | 205,902 | | | | 890,875 | |
| Mid Cap Growth Fund | | | — | | | | — | | | | 3,217 | | | | 3,217 | |
| Sands Capital Emerging Markets Growth Fund | | | 119,351 | | | | 105,154 | | | | 148,454 | | | | 372,959 | |
| Small Cap Growth Fund | | | 313,619 | | | | 583,974 | | | | 732,807 | | | | 1,630,400 | |
| Sustainability and Impact Equity Fund | | | 65,536 | | | | 358,635 | | | | 218,763 | | | | 642,934 | |
The Advisor did not recoup any amounts it previously waived or reimbursed during the year ended March 31, 2017.
ADMINISTRATION AGREEMENT
The Advisor entered into an Administration Agreement with the Trust, whereby the Advisor is responsible for: supplying executive and regulatory compliance services; supervising the preparation of tax returns; coordinating the preparation of reports to shareholders and reports to, and filings with, the SEC and state securities authorities, as well as materials for meetings of the Board; calculating the daily NAV per share; and maintaining the financial books and records of each Fund.
For its services, the Advisor’s annual administrative fee is:
0.145% on the first $20 billion of the aggregate average daily net assets;
0.11% on the next $10 billion of aggregate average daily net assets;
0.09% on the next $10 billion of aggregate average daily net assets; and
0.07% on the aggregate average daily net assets over $40 billion.
The fee is computed and allocated among the Touchstone Fund Complex (excluding Touchstone Institutional Funds Trust) on the basis of relative daily net assets.
The Advisor has engaged BNY Mellon as the Sub-Administrator to the Trust. BNY Mellon provides administrative and accounting services to the Trust and is compensated directly by the Advisor, not the Trust.
Notes to Financial Statements (Continued)
TRANSFER AGENT AGREEMENT
Under the terms of the Transfer Agent Agreement between the Trust and BNY Mellon, BNY Mellon maintains the records of each shareholder’s account, answers shareholders’ inquiries concerning their accounts, processes purchases and redemptions of each Fund’s shares, acts as dividend and distribution disbursing agent, and performs other shareholder service functions. For these services, BNY Mellon receives a monthly fee from each Fund. In addition, each Fund pays out-of-pocket expenses incurred by BNY Mellon, including, but not limited to, postage and supplies.
The Funds may reimburse the Advisor for fees paid to intermediaries such as banks, broker-dealers, financial advisors or other financial institutions for sub-transfer agency, sub-administration and other services provided to investors whose shares of record are held in omnibus, other group accounts, retirement plans or accounts traded through registered securities clearing agents. These fees may vary based on, for example, the nature of services provided, but generally range up to 0.15% of the assets of the class serviced or maintained by the intermediary or up to $22 per sub-account maintained by the intermediary.
PLANS OF DISTRIBUTION AND SHAREHOLDER SERVICING FEE ARRANGEMENTS
The Trust has adopted distribution plans pursuant to Rule 12b-1 under the 1940 Act for each class of shares it offers that is subject to 12b-1 distribution fees. The plans allow each Fund to pay distribution and other fees for the sale and distribution of its shares and for services provided to shareholders. The fees charged to the Funds are limited to the actual expenses incurred. Under the Class A plan, each Fund offering Class A shares pays an annual fee of up to 0.25% of average daily net assets that are attributable to Class A shares. Under the Class B plan, each Fund that offered Class B shares paid an annual fee of up to 1.00% of average daily net assets that were attributable to Class B shares. Under the Class C plan, each Fund offering Class C shares pays an annual fee of up to 1.00% of average daily net assets that are attributable to Class C shares (of which up to 0.75% is a distribution fee and up to 0.25% is a shareholder servicing fee).
UNDERWRITING AGREEMENT
The Underwriter is the Funds’ principal underwriter and, as such, acts as exclusive agent for distribution of the Funds’ shares. Under the terms of the Underwriting Agreement between the Trust and the Underwriter, the Underwriter earned underwriting and broker commissions on the sale of Class A shares of the Funds. W&S Brokerage Services, Inc., an affiliate of the Underwriter and the Advisor, also earned broker commissions on the sale of Class A shares of the Funds. Listed below are the total underwriting and broker commissions earned by the Underwriter and its affiliates during the year ended March 31, 2017:
| Fund | | Amount | |
| Flexible Income Fund | | $ | 47,663 | |
| Focused Fund | | | 172,700 | |
| Growth Opportunities Fund | | | 31,195 | |
| International Growth Fund | | | 379 | |
| International Value Fund | | | 382 | |
| Mid Cap Growth Fund | | | 162,274 | |
| Small Cap Growth Fund | | | 31,366 | |
| Sustainability and Impact Equity Fund | | | 44,259 | |
In addition, the Underwriter collected CDSC on the redemption of Classes A and C shares of the Funds listed below during the year ended March 31, 2017:
| Fund | | Class A | | | Class C | |
| Flexible Income Fund | | $ | 26 | | | $ | 4,683 | |
| Focused Fund | | | — | | | | 4,541 | |
| Growth Opportunities Fund | | | — | | | | 53 | |
Notes to Financial Statements (Continued)
| Fund | | Class A | | | Class C | |
| Mid Cap Growth Fund | | $ | — | | | $ | 3,989 | |
| Small Cap Growth Fund | | | — | | | | 827 | |
| Sustainability and Impact Equity Fund | | | 2 | | | | 4,145 | |
INTERFUND TRANSACTIONS
The Funds may engage in purchase and sale transactions with funds that have a common investment advisor (or affiliated investment advisors), common Trustees and/or common Officers. During the year ended March 31, 2017, the Funds did not engage in any Rule 17a-7 transactions, as defined under the 1940 Act.
5. Federal Tax Information
Federal income tax — It is each Fund’s policy to continue to comply with the special provisions of the Internal Revenue Code applicable to regulated investment companies. As provided therein, in any fiscal year in which a Fund so qualifies and distributes at least 90% of its investment company taxable income, the Fund (but not the shareholders) will be relieved of federal income tax on the income distributed. It is each Fund’s policy to distribute all of its taxable income and accordingly, no provision for income taxes has been made.
In order to avoid imposition of the excise tax applicable to regulated investment companies, it is also each Fund’s intention to declare and pay as dividends in each calendar year at least 98% of its investment company taxable income (earned during the calendar year) and 98.2% of its net realized capital gains (earned during the twelve months ending October 31) plus undistributed amounts from prior years.
The tax character of distributions paid for the years ended March 31, 2017 and March 31, 2016 are as follows:
| | | Flexible | | | | | | Growth | |
| | | Income Fund | | | Focused Fund | | | Opportunities Fund | |
| | | Year Ended | | | Year Ended | | | Year Ended | | | Year Ended | | | Year Ended | | | Year Ended | |
| | | March 31, | | | March 31, | | | March 31, | | | March 31, | | | March 31, | | | March 31, | |
| | | 2017 | | | 2016 | | | 2017 | | | 2016 | | | 2017 | | | 2016 | |
| From ordinary income | | $ | 18,697,931 | | | $ | 12,216,849 | | | $ | 7,223,956 | | | $ | 8,434,874 | | | $ | 6,735,141 | | | $ | 1,772,322 | |
| From long-term capital gains | | | — | | | | — | | | | 12,445,614 | | | | 27,791,755 | | | | 1,718,652 | | | | 23,776,825 | |
| Total distributions | | $ | 18,697,931 | | | $ | 12,216,849 | | | $ | 19,669,570 | | | $ | 36,226,629 | | | $ | 8,453,793 | | | $ | 25,549,147 | |
| | | International | | | International | | | Mid Cap | |
| | | Growth Fund | | | Value Fund | | | Growth Fund | |
| | | Year Ended | | | Year Ended | | | Year Ended | | | Year Ended | | | Year Ended | |
| | | March 31, | | | March 31, | | | March 31, | | | March 31, | | | March 31, | |
| | | 2017* | | | 2017 | | | 2016 | | | 2017 | | | 2016 | |
| From ordinary income | | $ | 54,008 | | | $ | 2,828,829 | | | $ | 3,765,519 | | | $ | — | | | $ | 8,520,663 | |
| From long-term capital gains | | | — | | | | — | | | | — | | | | 19,400,314 | | | | 61,652,123 | |
| Total distributions | | $ | 54,008 | | | $ | 2,828,829 | | | $ | 3,765,519 | | | $ | 19,400,314 | | | $ | 70,172,786 | |
| | | Sands Capital | | | | | | Sustainability | |
| | | Emerging Markets | | | Small Cap | | | and Impact Equity | |
| | | Growth Fund | | | Growth Fund | | | Fund | |
| | | Year Ended | | | Period Ended | | | Year Ended | | | Year Ended | | | Year Ended | | | Year Ended | |
| | | March 31, | | | March 31, | | | March 31, | | | March 31, | | | March 31, | | | March 31, | |
| | | 2017 | | | 2016 | | | 2017 | | | 2016 | | | 2017 | | | 2016 | |
| From ordinary income | | $ | — | | | $ | — | | | $ | — | | | $ | 870,393 | | | $ | 1,573,282 | | | $ | 54,125,427 | |
| From long-term capital gains | | | — | | | | — | | | | 1,973,248 | | | | 3,899,710 | | | | — | | | | 116,661,558 | |
| Total distributions | | $ | — | | | $ | — | | | $ | 1,973,248 | | | $ | 4,770,103 | | | $ | 1,573,282 | | | $ | 170,786,985 | |
* Represents the period from commencement of operations (April 1, 2016) through March 31, 2017.
Notes to Financial Statements (Continued)
The following information is computed on a tax basis for each item as of March 31, 2017:
| | | Flexible | | | | | | Growth | |
| | | Income | | | Focused | | | Opportunities | |
| | | Fund | | | Fund | | | Fund | |
| Tax cost of portfolio investments | | $ | 661,995,083 | | | $ | 1,181,368,111 | | | $ | 199,159,500 | |
| Gross unrealized appreciation | | | 15,587,620 | | | | 337,186,152 | | | | 46,388,187 | |
| Gross unrealized depreciation | | | (7,757,253 | ) | | | (28,808,130 | ) | | | (2,392,259 | ) |
| Net unrealized appreciation (depreciation) on investments | | | 7,830,367 | | | | 308,378,022 | | | | 43,995,928 | |
| Net unrealized appreciation (depreciation) on written options, futures contracts, foreign currency contracts and translation of other assets and liabilities denominated in foreign currency | | | 198,957 | | | | — | | | | — | |
| Post-October and Qualified Late-Year Losses | | | (6,092,860 | ) | | | — | | | | — | |
| Capital loss carryforwards | | | (6,355,592 | ) | | | — | | | | — | |
| Other temporary differences | | | (2,895 | ) | | | — | | | | — | |
| Undistributed ordinary income | | | 971,298 | | | | 28,449,688 | | | | — | |
| Undistributed capital gains | | | — | | | | 24,377,152 | | | | — | |
| Accumulated earnings (deficit) | | $ | (3,450,725 | ) | | $ | 361,204,862 | | | $ | 43,995,928 | |
| | | International | | | International | | | Mid Cap | |
| | | Growth | | | Value | | | Growth | |
| | | Fund | | | Fund | | | Fund | |
| Tax cost of portfolio investments | | $ | 11,713,754 | | | $ | 23,788,463 | | | $ | 578,300,409 | |
| Gross unrealized appreciation | | | 1,038,389 | | | | 1,152,534 | | | | 137,701,943 | |
| Gross unrealized depreciation | | | (200,427 | ) | | | (2,908,955 | ) | | | (6,141,967 | ) |
| Net unrealized appreciation (depreciation) on investments | | | 837,962 | | | | (1,756,421 | ) | | | 131,559,976 | |
| Net unrealized appreciation (depreciation) on translation of other assets and liabilities denominated in foreign currency | | | — | | | | (2,711 | ) | | | — | |
| Post-October and Qualified Late-Year Losses | | | — | | | | — | | | | (866,767 | ) |
| Capital loss carryforwards | | | (242,452 | ) | | | (80,654,517 | ) | | | — | |
| Undistributed ordinary income | | | 37,593 | | | | 162,466 | | | | — | |
| Undistributed capital gains | | | — | | | | — | | | | 39,723,289 | |
| Accumulated earnings (deficit) | | $ | 633,103 | | | $ | (82,251,183 | ) | | $ | 170,416,498 | |
| | | Sands Capital | | | | | | | |
| | | Emerging Markets | | | Small Cap | | | Sustainability | |
| | | Growth | | | Growth | | | and Impact Equity | |
| | | Fund | | | Fund | | | Fund | |
| Tax cost of portfolio investments | | $ | 250,994,098 | | | $ | 412,985,249 | | | $ | 280,583,746 | |
| Gross unrealized appreciation | | | 46,258,436 | | | | 51,524,944 | | | | 39,026,413 | |
| Gross unrealized depreciation | | | (9,689,295 | ) | | | (18,572,452 | ) | | | (10,404,286 | ) |
| Net unrealized appreciation (depreciation) on investments | | | 36,569,141 | | | | 32,952,492 | | | | 28,622,127 | |
| Net unrealized appreciation (depreciation) on translation of other assets and liabilities denominated in foreign currency | | | 21,365 | | | | — | | | | (634 | ) |
| Net unrealized appreciation (depreciation) on deferred foreign capital gains tax | | | (1,962,995 | ) | | | — | | | | — | |
| Post-October and Qualified Late-Year Losses | | | (310,110 | ) | | | (462,497 | ) | | | — | |
| Capital loss carryforwards | | | (12,013,525 | ) | | | (24,155,339 | ) | | | (11,335,434 | ) |
| Undistributed ordinary income | | | — | | | | — | | | | 1,374,762 | |
| Accumulated earnings (deficit) | | $ | 22,303,876 | | | $ | 8,334,656 | | | $ | 18,660,821 | |
Notes to Financial Statements (Continued)
The difference between the tax cost of portfolio investments and the financial statement cost is primarily due to wash sale loss deferrals, trust preferred securities, mark to market adjustments, non-REIT return of capital and investments in passive foreign investment company (“PFIC”) adjustments.
As of March 31, 2017, the Funds had the following capital loss carryforwards for federal income tax purposes:
| | | | | | No | | | No | | | | |
| | | Short Term Expiring in* | | | Expiration | | | Expiration | | | | |
| Fund | | 2018 | | | 2019 | | | Short Term* | | | Long Term* | | | Total | |
| Flexible Income Fund | | $ | — | | | $ | 6,355,592 | | | $ | — | | | $ | — | | | $ | 6,355,592 | |
| International Growth Fund | | | — | | | | — | | | | 242,452 | | | | — | | | | 242,452 | |
| International Value Fund | | | 70,912,135 | | | | — | | | | 3,193,862 | | | | 6,548,520 | | | | 80,654,517 | |
| Sands Capital Emerging Markets Growth Fund | | | — | | | | — | | | | 9,534,285 | | | | 2,479,240 | | | | 12,013,525 | |
| Small Cap Growth Fund | | | — | | | | — | | | | 8,474,434 | | | | 15,680,905 | | | | 24,155,339 | |
| Sustainability and Impact Equity Fund | | | — | | | | — | | | | 10,982,150 | | | | 353,284 | | | | 11,335,434 | |
* The Regulated Investment Company Modernization Act of 2010 (the “Act”) was enacted on December 22, 2010. The Act made changes to several tax rules impacting the Funds. The provisions of the Act first became effective for the Funds’ fiscal year ended March 31, 2012 and are applicable to all subsequent fiscal years. Although the Act provides several benefits, including the unlimited carryover of future capital losses, there may be a greater likelihood that all or a portion of each Fund’s pre-enactment capital loss carryovers may expire without being utilized due to the fact that post-enactment capital losses must be utilized before pre-enactment capital loss carryovers may be utilized. Under the Act, new capital losses may now be carried forward indefinitely, and retain the character of the original loss as compared with pre-enactment law, where capital losses could be carried forward for up to eight years, and carried forward as short-term capital losses, irrespective of the character of the original loss.
The capital loss carryforwards may be utilized in future years to offset net realized capital gains, if any, prior to distributing such gains to shareholders.
During the year ended March 31, 2017, the following Funds utilized capital loss carryforwards or had capital loss carryforwards expire as follows:
| Fund | | Utilized | | | Expired | |
| Flexible Income Fund | | $ | 6,633,704 | | | $ | — | |
| Growth Opportunities Fund | | | 509,261 | | | | — | |
| International Value Fund | | | — | | | | 46,390,273 | |
| Small Cap Growth Fund | | | — | | | | 809,083 | |
Under current laws, certain capital losses realized after October 31 and ordinary losses realized after December 31 may be deferred (and certain ordinary losses after October and/or December 31 may be deferred) and treated as occurring on the first day of the following fiscal year. For the year ended March 31, 2017, the Funds elected to defer the following losses:
| | | Realized | | | Ordinary | | | | |
| Fund | | Capital Losses | | | Losses | | | Total | |
| Flexible Income Fund | | $ | 6,092,860 | | | $ | — | | | $ | 6,092,860 | |
| Mid Cap Growth Fund | | | — | | | | 866,767 | | | | 866,767 | |
| Sands Capital Emerging Markets Growth Fund | | | — | | | | 310,110 | | | | 310,110 | |
| Small Cap Growth Fund | | | — | | | | 462,497 | | | | 462,497 | |
The Funds have analyzed their tax positions taken on federal income tax returns for all open tax years (tax years ended March 31, 2014 through 2017) and have concluded that no provision for income tax is required in their financial statements.
Certain reclassifications, the result of permanent differences between financial statement and income tax reporting requirements, have been made to the components of capital as presented on the Statements of Assets and Liabilities. These reclassifications have no impact on the net assets or NAV per share of the Funds. The following reclassifications, which are primarily attributed to the tax treatment of foreign currency gains/losses, paydown gains/losses on mortgage backed and asset backed securities, gains/losses from passive foreign investment companies, write-off of net operating losses, re-designation of dividends paid, swap reclassifications, forward currency contracts
Notes to Financial Statements (Continued)
reclassifications, foreign futures reclassifications, non-REIT return of capital reclassifications, trust preferred adjustment for securities sold short, capitalized dividends on short sales, equalization utilized, overdistributions and capital loss carryforwards expiration adjustments have been made to the following Funds for the year ended March 31, 2017:
| | | | | | Accumulated | | | Accumulated | |
| | | Paid-In | | | Net Investment | | | Net Realized | |
| Fund | | Capital | | | Income(Loss) | | | Gains(Losses) | |
| Flexible Income Fund | | $ | — | | | $ | (149,171 | ) | | $ | 149,171 | |
| Focused Fund | | | 5,616,719 | | | | (772,824 | ) | | | (4,843,895 | ) |
| Growth Opportunities Fund | | | (6,096,137 | ) | | | (317,700 | ) | | | 6,413,837 | |
| International Value Fund | | | (46,390,273 | ) | | | 83,292 | | | | 46,306,981 | |
| Mid Cap Growth Fund | | | 1,167,160 | | | | 757,910 | | | | (1,925,070 | ) |
| Sands Capital Emerging Markets Growth Fund | | | (1,009,250 | ) | | | 806,858 | | | | 202,392 | |
| Small Cap Growth Fund | | | (3,692,977 | ) | | | 2,883,743 | | | | 809,234 | |
| Sustainability and Impact Equity Fund | | | — | | | | 29,107 | | | | (29,107 | ) |
6. Commitments and Contingencies
The Funds indemnify the Trust’s officers and Trustees for certain liabilities that might arise from their performance of their duties to the Funds. Additionally, in the normal course of business, the Funds enter into contracts that contain a variety of representations and warranties and which provide general indemnifications. The Funds’ maximum exposure under these arrangements is unknown, as this would involve future claims that may be made against the Funds.
7. Principal Risks
Risks Associated with Foreign Investments — Some of the Funds may invest in the securities of foreign issuers. Investing in securities issued by companies whose principal business activities are outside the U.S. may involve significant risks not present in domestic investments. For example, there is generally less publicly available information about foreign companies, particularly those not subject to the disclosure and reporting requirements of the U.S. securities laws. Foreign issuers are generally not bound by uniform accounting, auditing, and financial reporting requirements and standards of practice comparable to those applicable to domestic issuers. Investments in foreign securities also involve the risk of possible adverse changes in investment or exchange control regulations, expropriation or confiscatory taxation, limitations on the removal of funds or other assets of a Fund, political or financial instability or diplomatic and other developments which could affect such investments. Foreign stock markets, while growing in volume and sophistication, are generally not as developed as those in the U.S., and securities of some foreign issuers (particularly those located in developing countries) may be less liquid and more volatile than securities of comparable U.S. companies. In general, there is less overall governmental supervision and regulation of foreign securities markets, broker-dealers, and issuers than in the U.S.
Risks Associated with Concentration — Certain Funds may invest a high percentage of their assets in specific sectors of the market in order to achieve a potentially greater investment return. As a result, these Funds may be more susceptible to economic, political, and regulatory developments in a particular sector of the market, positive or negative, and may experience increased volatility in the Funds’ NAVs and magnified effect on the total return.
Risks Associated with Credit — An issuer may be unable to make timely payments of either principal or interest. This may cause the issuer’s securities to decline in value. Credit risk is particularly relevant to those Funds that invest a significant amount of their assets in junk bonds or lower-rated securities.
Risks Associated with Interest Rate Changes — As interest rates rise, the value of fixed-income securities a Fund owns will likely decrease. The price of debt securities is generally linked to the prevailing market interest rates.
Notes to Financial Statements (Continued)
In general, when interest rates rise, the price of debt securities falls, and when interest rates fall, the price of debt securities rises. The price volatility of a debt security also depends on its maturity. Longer-term securities are generally more volatile, so the longer the average maturity or duration of these securities, the greater their price risk. Duration is a measure of the expected life, taking into account any prepayment or call features of the security, that is used to determine the price sensitivity of the security for a given change in interest rates. Specifically, duration is the change in the value of a fixed-income security that will result from a 1% change in interest rates, and generally is stated in years. For example, as a general rule a 1% rise in interest rates means a 1% fall in value for every year of duration. Maturity, on the other hand, is the date on which a fixed-income security becomes due for payment of principal. The negative impact on fixed income securities if interest rates increase as a result could negatively impact a Fund’s NAV.
Please see the Funds’ prospectus for a complete discussion of these and other risks.
8. Subsequent Events
Subsequent events occurring after the date of this report have been evaluated for potential impact to this report through the date the financial statements were issued.
At a meeting of the Board of Trustees (the “Board”) of the Trust held on April 18, 2017, the Board approved an Agreement and Plan of Reorganization for the Touchstone Flexible Income Fund to acquire the assets of the Sentinel Multi-Asset Income Fund and the Touchstone Sustainability and Impact Equity Fund to acquire the assets of the Sentinel Sustainable Core Opportunities Fund, collectively the “Reorganization”, subject to Sentinel shareholder approval. The Reorganization is expected to occur on or about October 16, 2017.
There were no other subsequent events that necessitated recognition or disclosure in the Funds’ financial statements.
Report of Independent Registered Public Accounting Firm
The Board of Trustees and Shareholders of Touchstone Flexible Income Fund,Touchstone Focused Fund,Touchstone Growth Opportunities Fund, Touchstone International Growth Fund, Touchstone International Value Fund, Touchstone Mid Cap Growth Fund, Touchstone Sands Capital Emerging Markets Growth Fund, Touchstone Small Cap Growth Fund and Touchstone Sustainability and Impact Equity Fund.
We have audited the accompanying statements of assets and liabilities, including the portfolios of investments, of Touchstone Flexible Income Fund, Touchstone Focused Fund, Touchstone Growth Opportunities Fund, Touchstone International Growth Fund, Touchstone International Value Fund, Touchstone Mid Cap Growth Fund, Touchstone Sands Capital Emerging Markets Growth Fund, Touchstone Small Cap Growth Fund and Touchstone Sustainability and Impact Equity Fund (the “Funds”) (nine of the funds constituting Touchstone Strategic Trust) as of March 31, 2017, and the related statements of operations for the year then ended, the statements of changes in net assets for each of the years or periods indicated therein, the financial highlights of the Touchstone Growth Opportunities Fund, Touchstone International Growth Fund, Touchstone Mid Cap Growth Fund, Touchstone Sands Capital Emerging Markets Growth Fund and Touchstone Sustainability and Impact Equity Fund for each of the years or periods indicated therein, and the financial highlights of the Touchstone Flexible Income Fund, Touchstone Focused Fund,Touchstone International Value Fund and Touchstone Small Cap Growth Fund for each of the four years in the period ended March 31, 2017. These financial statements and financial highlights are the responsibility of the Funds’ management. Our responsibility is to express an opinion on these financial statements and financial highlights based on our audits. The financial highlights for each of the periods presented through March 31, 2013 of Touchstone Flexible Income Fund, Touchstone Focused Fund, Touchstone International Value Fund and Touchstone Small Cap Growth Fund were audited by other auditors, whose report dated May 23, 2013 expressed an unqualified opinion on those financial highlights.
We conducted our audits in accordance with the standards of the Public Company Accounting Oversight Board (United States). Those standards require that we plan and perform the audit to obtain reasonable assurance about whether the financial statements and financial highlights are free of material misstatement. We were not engaged to perform an audit of the Funds’ internal control over financial reporting. Our audits included consideration of internal control over financial reporting as a basis for designing audit procedures that are appropriate in the circumstances, but not for the purpose of expressing an opinion on the effectiveness of the Funds’ internal control over financial reporting. Accordingly, we express no such opinion. An audit also includes examining, on a test basis, evidence supporting the amounts and disclosures in the financial statements and financial highlights, assessing the accounting principles used and significant estimates made by management, and evaluating the overall financial statement presentation. Our procedures included confirmation of securities owned as of March 31, 2017, by correspondence with the custodian, transfer agent and brokers or by other appropriate auditing procedures where replies from brokers were not received. We believe that our audits provide a reasonable basis for our opinion.
In our opinion, the financial statements and financial highlights referred to above present fairly, in all material respects, the financial position of Touchstone Flexible Income Fund, Touchstone Focused Fund, Touchstone Growth Opportunities Fund, Touchstone International Growth Fund, Touchstone International Value Fund, Touchstone Mid Cap Growth Fund, Touchstone Sands Capital Emerging Markets Growth Fund, Touchstone Small Cap Growth Fund and Touchstone Sustainability and Impact Equity Fund (nine of the funds constituting Touchstone Strategic Trust) at March 31, 2017, the results of their operations for the year then ended, the changes in their net assets for each of the years or periods indicated therein, the financial highlights of the Touchstone Growth Opportunities Fund, Touchstone International Growth Fund, Touchstone Mid Cap Growth
Report of Independent Registered Public Accounting Firm (Continued)
Fund, Touchstone Sands Capital Emerging Markets Growth Fund and Touchstone Sustainability and Impact Equity Fund for each of the years or periods indicated therein, and the financial highlights of the Touchstone Flexible Income Fund, Touchstone Focused Fund, Touchstone International Value Fund and Touchstone Small Cap Growth Fund for each of the four years in the period ended March 31, 2017, in conformity with U.S. generally accepted accounting principles.

Cincinnati, Ohio
May 26, 2017
Other Items (Unaudited)
Qualified Dividend Income
Under the Jobs and Growth Tax Relief Reconciliation Act of 2003 (the “Act”), the following percentages of ordinary dividends paid during the fiscal year ended March 31, 2017 are designated as “qualified dividend income,” as defined in the Act, and are subject to reduced tax rates. The Funds intend to pass through the maximum allowable percentage for Form 1099 Div.
| Flexible Income Fund | | | 11.27 | % |
| Focused Fund | | | 90.81 | % |
| Growth Opportunities Fund | | | 100.00 | % |
| International Growth Fund | | | 100.00 | % |
| International Value Fund | | | 89.24 | % |
| Sustainability and Impact Equity Fund | | | 100.00 | % |
Dividend Received Deduction
For corporate shareholders, the following ordinary distributions paid during the current fiscal year ended March 31, 2017 qualify for the corporate dividends received deduction. The Funds intend to pass through the maximum allowable percentage.
| Flexible Income Fund | | | 6.14 | % |
| Focused Fund | | | 87.16 | % |
| Growth Opportunities Fund | | | 100.00 | % |
| International Value Fund | | | 1.34 | % |
| Sustainability and Impact Equity Fund | | | 73.47 | % |
For the fiscal year ended March 31, 2017, the Funds designated long-term capital gains as follows:
| Focused Fund | | $ | 26,969,084 | |
| Growth Opportunities Fund | | | 1,718,652 | |
| Mid Cap Growth Fund | | | 60,988,795 | |
| Small Cap Growth Fund | | | 1,973,248 | |
Foreign Tax Income & Foreign Tax Credit
The International Growth Fund and International Value Fund intend to pass through a foreign tax credit to their shareholders. For the fiscal year ended March 31, 2017, the total amount of foreign source income was $198,442 or $0.18 per share for the International Growth Fund and $1,046,084 or $0.34 per share for the International Value Fund. The total amount of foreign taxes to be paid was $18,801 or $0.017 per share for the International Growth Fund and $50,124 or $0.016 per share for the International Value Fund. Shareholders’ allocable share of the foreign tax credit will be reported on Form 1099 Div.
Proxy Voting Guidelines
The Sub-Advisors are responsible for exercising the voting rights associated with the securities purchased and held by the Funds. A description of the policies and procedures that the Sub-Advisors use in fulfilling this responsibility is available as an appendix to the most recent Statement of Additional Information, which can be obtained without charge by calling toll free 1.800.543.0407 or by visiting the Touchstone website at TouchstoneInvestments.com or on the Securities and Exchange Commission’s (the “Commission”) website sec.gov. Information regarding how those proxies were voted during the most recent twelve-month period ended June 30 is also available without charge by calling toll free 1.800.543.0407 or on the Commission’s website at sec.gov.
Other Items (Unaudited) (Continued)
Quarterly Portfolio Disclosure
The Trust files a complete listing of portfolio holdings for each Fund as of the end of the first and third quarters of each fiscal year on Form N-Q. The complete listing (i) is available on the Commission’s website; (ii) may be reviewed and copied at the Commission’s Public Reference Room in Washington, DC; or (iii) will be made available to shareholders upon request by calling 1.800.543.0407. Information on the operation of the Public Reference Room may be obtained by calling 1-800-SEC-0330.
Schedule of Shareholder Expenses
As a shareholder of the Funds, you incur two types of costs: (1) transaction costs, including reinvested dividends or other distributions; and (2) ongoing costs, including investment advisory fees; distribution (12b-1) fees; and other Fund expenses. This example is intended to help you understand your ongoing costs (in dollars) of investing in the Funds and to compare these costs with the ongoing costs of investing in other mutual funds.
The example is based on an investment of $1,000 invested at the beginning of the period and held for the entire period (October 1, 2016 through March 31, 2017).
Actual Expenses
The first line of the table below for each share class of a Fund provides information about actual account values and actual expenses. You may use the information in this line, together with the amount you invested, to estimate the expenses that you paid over the period. Simply divide your account value by $1,000 (for example, an $8,600 account value divided by $1,000 = 8.6), then multiply the result by the number in the first line under the heading entitled “Expenses Paid During the Six Months Ended March 31, 2017” to estimate the expenses you paid on your account during this period.
Hypothetical Example for Comparison Purposes
The second line of the table below for each share class of a Fund provides information about hypothetical account values and hypothetical expenses based on the Funds’ actual expense ratio and an assumed rate of return of 5% per year before expenses, which is not the Funds’ actual return. The hypothetical account values and expenses may not be used to estimate the actual ending account balance or expenses you paid for the period. You may use this information to compare the ongoing costs of investing in the Funds and other funds. To do so, compare this 5% hypothetical example with the 5% hypothetical examples that appear in the shareholder reports of the other funds.
Please note that the expenses shown in the table are meant to highlight your ongoing costs only and do not reflect any transactional costs, such as sales charges (loads), redemption fees, or exchange fees. Therefore, the second line for each share class of a Fund in the table below is useful in comparing ongoing costs only, and will not help you determine the relative total costs of owning different funds. In addition, if these transactional costs were included, your costs would have been higher.
| | | | | | | | | | | | | | Expenses | |
| | | | | Net Expense | | | Beginning | | | Ending | | | Paid During | |
| | | | | Ratio | | | Account | | | Account | | | the Six Months | |
| | | | | Annualized | | | Value | | | Value | | | Ended | |
| | | | | March 31, | | | October 1, | | | March 31, | | | March 31, | |
| | | | | 2017 | | | 2016 | | | 2017 | | | 2017* | |
| Touchstone Flexible Income Fund | | | | | | | | | | | | | | | | | | |
| Class A | | Actual | | | 1.09 | % | | $ | 1,000.00 | | | $ | 997.70 | | | $ | 5.43 | ** |
| Class A | | Hypothetical | | | 1.09 | % | | $ | 1,000.00 | | | $ | 1,019.50 | | | $ | 5.49 | ** |
| | | | | | | | | | | | | | | | | | | |
| Class C | | Actual | | | 1.84 | % | | $ | 1,000.00 | | | $ | 994.00 | | | $ | 9.15 | ** |
| Class C | | Hypothetical | | | 1.84 | % | | $ | 1,000.00 | | | $ | 1,015.76 | | | $ | 9.25 | ** |
Other Items (Unaudited) (Continued)
Schedule of Shareholder Expenses (continued)
| | | | | | | | | | | | | | Expenses | |
| | | | | Net Expense | | | Beginning | | | Ending | | | Paid During | |
| | | | | Ratio | | | Account | | | Account | | | the Six Months | |
| | | | | Annualized | | | Value | | | Value | | | Ended | |
| | | | | March 31, | | | October 1, | | | March 31, | | | March 31, | |
| | | | | 2017 | | | 2016 | | | 2017 | | | 2017* | |
| Touchstone Flexible Income Fund(Continued) | | | | | | | | | | | | | | | | |
| Class Y | | Actual | | | 0.84 | % | | $ | 1,000.00 | | | $ | 999.90 | | | $ | 4.19 | ** |
| Class Y | | Hypothetical | | | 0.84 | % | | $ | 1,000.00 | | | $ | 1,020.74 | | | $ | 4.23 | ** |
| | | | | | | | | | | | | | | | | | | |
| Institutional Class | | Actual | | | 0.74 | % | | $ | 1,000.00 | | | $ | 999.50 | | | $ | 3.69 | ** |
| Institutional Class | | Hypothetical | | | 0.74 | % | | $ | 1,000.00 | | | $ | 1,021.24 | | | $ | 3.73 | ** |
| | | | | | | | | | | | | | | | | | | |
| Touchstone Focused Fund | | | | | | | | | | | | | | | | | | |
| Class A | | Actual | | | 1.20 | % | | $ | 1,000.00 | | | $ | 1,082.80 | | | $ | 6.23 | |
| Class A | | Hypothetical | | | 1.20 | % | | $ | 1,000.00 | | | $ | 1,018.95 | | | $ | 6.04 | |
| | | | | | | | | | | | | | | | | | | |
| Class C | | Actual | | | 1.95 | % | | $ | 1,000.00 | | | $ | 1,078.60 | | | $ | 10.11 | |
| Class C | | Hypothetical | | | 1.95 | % | | $ | 1,000.00 | | | $ | 1,015.21 | | | $ | 9.80 | |
| | | | | | | | | | | | | | | | | | | |
| Class Y | | Actual | | | 0.91 | % | | $ | 1,000.00 | | | $ | 1,084.30 | | | $ | 4.73 | |
| Class Y | | Hypothetical | | | 0.91 | % | | $ | 1,000.00 | | | $ | 1,020.39 | | | $ | 4.58 | |
| | | | | | | | | | | | | | | | | | | |
| Institutional Class | | Actual | | | 0.83 | % | | $ | 1,000.00 | | | $ | 1,084.70 | | | $ | 4.31 | |
| Institutional Class | | Hypothetical | | | 0.83 | % | | $ | 1,000.00 | | | $ | 1,020.79 | | | $ | 4.18 | |
| | | | | | | | | | | | | | | | | | | |
| Touchstone Growth Opportunities Fund | | | | | | | | | | | | | | | | | |
| Class A | | Actual | | | 1.24 | % | | $ | 1,000.00 | | | $ | 1,095.40 | | | $ | 6.48 | |
| Class A | | Hypothetical | | | 1.24 | % | | $ | 1,000.00 | | | $ | 1,018.75 | | | $ | 6.24 | |
| | | | | | | | | | | | | | | | | | | |
| Class C | | Actual | | | 1.99 | % | | $ | 1,000.00 | | | $ | 1,090.80 | | | $ | 10.37 | |
| Class C | | Hypothetical | | | 1.99 | % | | $ | 1,000.00 | | | $ | 1,015.01 | | | $ | 10.00 | |
| | | | | | | | | | | | | | | | | | | |
| Class Y | | Actual | | | 0.99 | % | | $ | 1,000.00 | | | $ | 1,096.50 | | | $ | 5.17 | |
| Class Y | | Hypothetical | | | 0.99 | % | | $ | 1,000.00 | | | $ | 1,020.00 | | | $ | 4.99 | |
| | | | | | | | | | | | | | | | | | | |
| Institutional Class | | Actual | | | 0.89 | % | | $ | 1,000.00 | | | $ | 1,097.00 | | | $ | 4.65 | |
| Institutional Class | | Hypothetical | | | 0.89 | % | | $ | 1,000.00 | | | $ | 1,020.49 | | | $ | 4.48 | |
| | | | | | | | | | | | | | | | | | | |
| Touchstone International Growth Fund | | | | | | | | | | | | | | | | | | |
| Class A | | Actual | | | 1.32 | % | | $ | 1,000.00 | | | $ | 1,046.00 | | | $ | 6.73 | |
| Class A | | Hypothetical | | | 1.32 | % | | $ | 1,000.00 | | | $ | 1,018.35 | | | $ | 6.64 | |
| | | | | | | | | | | | | | | | | | | |
| Class C | | Actual | | | 2.07 | % | | $ | 1,000.00 | | | $ | 1,041.70 | | | $ | 10.54 | |
| Class C | | Hypothetical | | | 2.07 | % | | $ | 1,000.00 | | | $ | 1,014.61 | | | $ | 10.40 | |
| | | | | | | | | | | | | | | | | | | |
| Class Y | | Actual | | | 1.07 | % | | $ | 1,000.00 | | | $ | 1,046.20 | | | $ | 5.46 | |
| Class Y | | Hypothetical | | | 1.07 | % | | $ | 1,000.00 | | | $ | 1,019.60 | | | $ | 5.39 | |
| | | | | | | | | | | | | | | | | | | |
| Institutional Class | | Actual | | | 0.97 | % | | $ | 1,000.00 | | | $ | 1,047.90 | | | $ | 4.95 | |
| Institutional Class | | Hypothetical | | | 0.97 | % | | $ | 1,000.00 | | | $ | 1,020.09 | | | $ | 4.89 | |
Other Items (Unaudited) (Continued)
Schedule of Shareholder Expenses (continued)
| | | | | | | | | | | | | | Expenses | |
| | | | | Net Expense | | | Beginning | | | Ending | | | Paid During | |
| | | | | Ratio | | | Account | | | Account | | | the Six Months | |
| | | | | Annualized | | | Value | | | Value | | | Ended | |
| | | | | March 31, | | | October 1, | | | March 31, | | | March 31, | |
| | | | | 2017 | | | 2016 | | | 2017 | | | 2017* | |
| Touchstone International Value Fund | | | | | | | | | | | | | | | | | | |
| Class A | | Actual | | | 1.34 | % | | $ | 1,000.00 | | | $ | 1,094.70 | | | $ | 7.00 | |
| Class A | | Hypothetical | | | 1.34 | % | | $ | 1,000.00 | | | $ | 1,018.25 | | | $ | 6.74 | |
| | | | | | | | | | | | | | | | | | | |
| Class C | | Actual | | | 2.09 | % | | $ | 1,000.00 | | | $ | 1,090.60 | | | $ | 10.89 | |
| Class C | | Hypothetical | | | 2.09 | % | | $ | 1,000.00 | | | $ | 1,014.51 | | | $ | 10.50 | |
| | | | | | | | | | | | | | | | | | | |
| Class Y | | Actual | | | 1.09 | % | | $ | 1,000.00 | | | $ | 1,096.30 | | | $ | 5.70 | |
| Class Y | | Hypothetical | | | 1.09 | % | | $ | 1,000.00 | | | $ | 1,019.50 | | | $ | 5.49 | |
| | | | | | | | | | | | | | | | | | | |
| Institutional Class | | Actual | | | 0.99 | % | | $ | 1,000.00 | | | $ | 1,096.60 | | | $ | 5.17 | |
| Institutional Class | | Hypothetical | | | 0.99 | % | | $ | 1,000.00 | | | $ | 1,020.00 | | | $ | 4.99 | |
| | | | | | | | | | | | | | | | | | | |
| Touchstone Mid Cap Growth Fund | | | | | | | | | | | | | | | | | | |
| Class A | | Actual | | | 1.29 | % | | $ | 1,000.00 | | | $ | 1,076.10 | | | $ | 6.68 | |
| Class A | | Hypothetical | | | 1.29 | % | | $ | 1,000.00 | | | $ | 1,018.50 | | | $ | 6.49 | |
| | | | | | | | | | | | | | | | | | | |
| Class C | | Actual | | | 2.04 | % | | $ | 1,000.00 | | | $ | 1,072.30 | | | $ | 10.54 | |
| Class C | | Hypothetical | | | 2.04 | % | | $ | 1,000.00 | | | $ | 1,014.76 | | | $ | 10.25 | |
| | | | | | | | | | | | | | | | | | | |
| Class Y | | Actual | | | 1.06 | % | | $ | 1,000.00 | | | $ | 1,077.10 | | | $ | 5.49 | |
| Class Y | | Hypothetical | | | 1.06 | % | | $ | 1,000.00 | | | $ | 1,019.65 | | | $ | 5.34 | |
| | | | | | | | | | | | | | | | | | | |
| Institutional Class | | Actual | | | 0.99 | % | | $ | 1,000.00 | | | $ | 1,077.80 | | | $ | 5.13 | |
| Institutional Class | | Hypothetical | | | 0.99 | % | | $ | 1,000.00 | | | $ | 1,020.00 | | | $ | 4.99 | |
| | | | | | | | | | | | | | | | | | | |
| Touchstone Sands Capital Emerging Markets Growth Fund | | | | | | | | | | | | | | | | |
| Class Y | | Actual | | | 1.49 | % | | $ | 1,000.00 | | | $ | 1,022.90 | | | $ | 7.51 | |
| Class Y | | Hypothetical | | | 1.49 | % | | $ | 1,000.00 | | | $ | 1,017.50 | | | $ | 7.49 | |
| | | | | | | | | | | | | | | | | | | |
| Class I | | Actual | | | 1.39 | % | | $ | 1,000.00 | | | $ | 1,023.90 | | | $ | 7.01 | |
| Class I | | Hypothetical | | | 1.39 | % | | $ | 1,000.00 | | | $ | 1,018.00 | | | $ | 6.99 | |
| | | | | | | | | | | | | | | | | | | |
| Touchstone Small Cap Growth Fund | | | | | | | | | | | | | | | | | | |
| Class A | | Actual | | | 1.44 | % | | $ | 1,000.00 | | | $ | 1,024.30 | | | $ | 7.27 | |
| Class A | | Hypothetical | | | 1.44 | % | | $ | 1,000.00 | | | $ | 1,017.75 | | | $ | 7.24 | |
| | | | | | | | | | | | | | | | | | | |
| Class C | | Actual | | | 2.19 | % | | $ | 1,000.00 | | | $ | 1,019.90 | | | $ | 11.03 | |
| Class C | | Hypothetical | | | 2.19 | % | | $ | 1,000.00 | | | $ | 1,014.01 | | | $ | 11.00 | |
| | | | | | | | | | | | | | | | | | | |
| Class Y | | Actual | | | 1.19 | % | | $ | 1,000.00 | | | $ | 1,025.30 | | | $ | 6.01 | |
| Class Y | | Hypothetical | | | 1.19 | % | | $ | 1,000.00 | | | $ | 1,019.00 | | | $ | 5.99 | |
| | | | | | | | | | | | | | | | | | | |
| Institutional Class | | Actual | | | 1.04 | % | | $ | 1,000.00 | | | $ | 1,026.80 | | | $ | 5.26 | |
| Institutional Class | | Hypothetical | | | 1.04 | % | | $ | 1,000.00 | | | $ | 1,019.75 | | | $ | 5.24 | |
Other Items (Unaudited) (Continued)
Schedule of Shareholder Expenses (continued)
| | | | | | | | | | | | | | Expenses | |
| | | | | Net Expense | | | Beginning | | | Ending | | | Paid During | |
| | | | | Ratio | | | Account | | | Account | | | the Six Months | |
| | | | | Annualized | | | Value | | | Value | | | Ended | |
| | | | | March 31, | | | October 1, | | | March 31, | | | March 31, | |
| | | | | 2017 | | | 2016 | | | 2017 | | | 2017* | |
| Touchstone Sustainability and Impact Equity Fund | | | | | | | | | | | | | | | | | | |
| Class A | | Actual | | | 1.24 | % | | $ | 1,000.00 | | | $ | 1,076.00 | | | $ | 6.42 | |
| Class A | | Hypothetical | | | 1.24 | % | | $ | 1,000.00 | | | $ | 1,018.75 | | | $ | 6.24 | |
| | | | | | | | | | | | | | | | | | | |
| Class C | | Actual | | | 1.99 | % | | $ | 1,000.00 | | | $ | 1,071.40 | | | $ | 10.28 | |
| Class C | | Hypothetical | | | 1.99 | % | | $ | 1,000.00 | | | $ | 1,015.01 | | | $ | 10.00 | |
| | | | | | | | | | | | | | | | | | | |
| Class Y | | Actual | | | 0.99 | % | | $ | 1,000.00 | | | $ | 1,077.20 | | | $ | 5.13 | |
| Class Y | | Hypothetical | | | 0.99 | % | | $ | 1,000.00 | | | $ | 1,020.00 | | | $ | 4.99 | |
| | | | | | | | | | | | | | | | | | | |
| Institutional Class | | Actual | | | 0.89 | % | | $ | 1,000.00 | | | $ | 1,077.80 | | | $ | 4.61 | |
| Institutional Class | | Hypothetical | | | 0.89 | % | | $ | 1,000.00 | | | $ | 1,020.49 | | | $ | 4.48 | |
* Expenses are equal to the Fund’s annualized expense ratio, multiplied by the average account value over the period, multiplied by 182/365 (to reflect one-half year period).
** Excluding dividend and interest expenses on securities sold short, your actual cost of investment in Class A, Class C, Class Y and Institutional Class would be $5.43, $9.15, $4.19 and $3.69, respectively, and your hypothetical cost of investment in Class A, Class C, ClassY and Institutional Class would be $5.49, $9.25, $4.23 and $3.73, respectively.
Advisory and Sub-Advisory Agreement Approval Disclosure
At a meeting held on November 17, 2016, the Board of Trustees (the “Board” or “Trustees”) of the Touchstone StrategicTrust (the “Trust”), and by a separate vote, the IndependentTrustees of theTrust, approved the continuance of the Investment Advisory Agreement between the Trust and the Advisor with respect to each Fund of the Trust, except the Investment Advisory Agreement for Touchstone International Growth Fund, which was not up for renewal, and the continuance of the Sub-Advisory Agreement between the Advisor and each Fund’s respective Sub-Advisor, except for the Sub-Advisory Agreements for Touchstone Small Cap Growth Fund and Touchstone International Growth Fund, which were not up for renewal.
In determining whether to approve the continuation of the Investment Advisory Agreement and the Sub-Advisory Agreements, the Advisor furnished information necessary for a majority of the Independent Trustees to make the determination that the continuance of the Investment Advisory Agreement and each Sub-Advisory Agreement was in the best interests of the respective Funds and their shareholders. The information provided to the Board included: (1) industry data comparing advisory fees and expense ratios of comparable investment companies; (2) comparative performance information; (3) the Advisor’s and its affiliates’ revenues and costs of providing services to the Funds; and (4) information about the Advisor’s and Sub-Advisor’s personnel. Prior to voting, the Independent Trustees reviewed the proposed continuance of the Investment Advisory Agreement and the Sub-Advisory Agreements with management and experienced independent legal counsel and received materials from such counsel discussing the legal standards for their consideration of the proposed continuation of the Investment Advisory Agreement and each Sub-Advisory Agreement. The Independent Trustees also reviewed the proposed continuation of the Investment Advisory Agreement and each Sub-Advisory Agreement with independent legal counsel in private sessions at which no representatives of management were present.
In approving the funds’ Investment Advisory Agreement, the Board considered various factors, among them: (1) the nature, extent and quality of services provided to the Funds, including the personnel providing such services; (2) the Advisor’s compensation and profitability; (3) a comparison of fees and performance with other
Other Items (Unaudited) (Continued)
advisers; (4) economies of scale; and (5) the terms of the Investment Advisory Agreement. The Board’s analysis of these factors is set forth below. The Independent Trustees were advised by independent legal counsel throughout the process.
Nature, Extent and Quality of Advisor Services. The Board considered the level and depth of knowledge of the Advisor, including the professional experience and qualifications of senior personnel. In evaluating the quality of services provided by the Advisor, the Board took into account its familiarity with the Advisor’s senior management through Board meetings, discussions and reports during the preceding year. The Board also took into account the Advisor’s compliance policies and procedures. The quality of administrative and other services, including the Advisor’s role in coordinating the activities of those funds’ other service providers, was also considered. The Board also considered the Advisor’s relationship with its affiliates and the resources available to them, as well as any potential conflicts of interest.
The Board discussed the Advisor’s effectiveness in monitoring the performance of each Sub-Advisor, including the Sub-Advisor that was an affiliate of the Advisor, and the Advisor’s timeliness in responding to performance issues. The Board considered the Advisor’s process for monitoring each of the Sub-Advisors, which includes an examination of both qualitative and quantitative elements of the Sub-Advisor’s organization, personnel, procedures, investment discipline, infrastructure and performance. The Board considered that the Advisor conducts regular on-site compliance visits with each Sub-Advisor, during which the Advisor examines a wide variety of factors, such as the financial condition of the Sub-Advisor, the quality of the Sub-Advisor’s systems, the effectiveness of the Sub-Advisor’s disaster recovery programs, trade allocation and execution procedures, compliance with the Sub-Advisor’s policies and procedures, results of regulatory examinations and any other factors that might affect the quality of services that the Sub-Advisor provides to the applicable Fund(s). The Board noted that the Advisor’s compliance monitoring processes also include quarterly reviews of compliance reports, and that any issues arising from such reports and the Advisor’s compliance visits to the Sub-Advisors are reported to the Board.
The Trustees concluded that they were satisfied with the nature, extent and quality of services provided to the Fund by the Advisor under the Investment Advisory Agreement.
Advisor’s Compensation and Profitability.The Board took into consideration the financial condition and profitability of the Advisor and its affiliates (including the Sub-Advisor to one of the Funds) and the direct and indirect benefits derived by the Advisor and its affiliates from the Advisor’s relationship with the Funds. The information considered by the Board included operating profit margin information for the Advisor’s business as a whole. The Board noted that the Advisor had waived a portion of advisory fees and administrative fees and/or reimbursed expenses in order to limit each Fund’s net operating expenses. The Board also noted that the Advisor pays the Sub-Advisors’ sub-advisory fees out of the advisory fees the Advisor receives from the Funds. The Board reviewed the profitability of the Advisor’s relationship with the Funds both before and after tax expenses, and also considered whether the Advisor has the financial wherewithal to continue to provide services to the Funds, noting the ongoing commitment of the Advisor’s parent company with respect to providing support and resources as needed. The Board considered that the Funds’ distributor, an affiliate of the Advisor, receives Rule 12b-1 distribution fees from the Funds and receives a portion of the sales charges on sales or redemptions of certain classes of shares. The Board also noted that the Advisor derives benefits to its reputation and other benefits from its association with the Funds.
The Board recognized that the Advisor should be entitled to earn a reasonable level of profits in exchange for the level of services it provides to each Fund and the entrepreneurial risk that it assumes as Advisor. Based upon their review, the Trustees concluded that the Advisor’s and its affiliates’ anticipated level of profitability, if any, from their relationship with each Fund was reasonable and not excessive.
Other Items (Unaudited) (Continued)
Expenses and Performance. The Board compared the respective advisory fees and total expense ratios for each of the Funds with various comparative data, including the median and average advisory fees and total expense ratios of each Fund’s respective peer group. The Board also considered, among other data, the Funds’ respective performance results during the six-month, twelve-month, and thirty-six month periods ended June 30, 2016, as applicable, and noted that the Board reviews on a quarterly basis detailed information about each Fund’s performance results, portfolio composition and investment strategies. The Board also took into account current market conditions and their effect on the Funds’ performance.
The Board also considered the effect of each Fund’s growth and size on its performance and expenses. The Board noted that the Advisor had waived a portion of the fees and/or reimbursed expenses of each Fund in order to reduce the Funds’ respective operating expenses to targeted levels. The Board noted that the sub-advisory fees under the Sub-Advisory Agreement with respect to each Fund were paid by the Advisor out of the advisory fees it receives from the Fund and considered the impact of such sub-advisory fees on the profitability of the Advisor. In reviewing the respective expense ratios and performance of each of the Funds, the Board also took into account the nature, extent and quality of the services provided to the Funds by the Advisor and its affiliates.
The Board considered, among other data, the specific factors and related conclusions set forth below with respect to each Fund:
Touchstone Flexible Income Fund. The Fund’s advisory fee and total expense ratio (net of applicable expense waivers and reimbursements) were above the median and at the median, of its peer group. The Board noted that the Advisor was waiving a portion of the Fund’s fees and/or reimbursing a portion of the Fund’s operating expenses. The Fund’s performance for the six month period ended June 30, 2016 was in the 4th quintile, and the Fund’s performance for the twelve- and thirty-six month periods ended June 30, 2016 was in the 1st quintile of its peer group. Based upon their review, the Trustees concluded that the overall performance of the Fund was satisfactory relative to the performance of funds with similar investment objectives and relevant indices, and that the advisory fee was reasonable in light of the services received by the Fund from the Advisor and the other factors considered.
Touchstone Focused Fund. The Fund’s advisory fee and total expense ratio (net of applicable expense waivers and reimbursements) were at the median and above the median, respectively, of its peer group. The Board noted that the Advisor was waiving a portion of the Fund’s fees and/or reimbursing a portion of the Fund’s operating expenses. The Fund’s performance for the six- and thirty-six-month periods ended June 30, 2016 was in the 1st quintile of its peer group, and the Fund’s performance for the twelve-month period ended June 30, 2016 was in the 2nd quintile of its peer group. Based upon their review, the Trustees concluded that the overall performance of the Fund was satisfactory relative to the performance of funds with similar investment objectives and relevant indices, and that the advisory fee was reasonable in light of the services received by the Fund from the Advisor and the other factors considered.
Touchstone Growth Opportunities Fund. The Fund’s advisory fee and total expense ratio (net of applicable expense waivers and reimbursements) were above the median of its peer group. The Board noted that the Advisor was waiving a portion of the Fund’s fees and/or reimbursing a portion of the Fund’s operating expenses. The Fund’s performance for the six- and the twelve-month periods ended June 30, 2016 was in the 5th quintile of its peer group, and the Fund’s performance for the thirty-six-month period ended June 30, 2016 was in the 4th quintile of its peer group. The Board considered management’s discussion of the Fund’s recent performance and management’s continued monitoring of Fund performance. Based upon their review, theTrustees concluded that the overall performance of the Fund was satisfactory relative to the performance of funds with similar investment objectives and relevant indices, and that the advisory fee was reasonable in light of the services received by the Fund from the Advisor and the other factors considered.
Other Items (Unaudited) (Continued)
Touchstone International Value Fund. The Fund’s advisory fee and total expense ratio (net of applicable expense waivers and reimbursements) were above the median and below the median, respectively, of its peer group. The Board noted that the Advisor was waiving a portion of the Fund’s fees and/or reimbursing a portion of the Fund’s operating expenses. The Fund’s performance for the six-month period ended June 30, 2016 was in the 4th quintile of its peer group. The Fund’s performance for the twelve- and thirty-six-month periods ended June 30, 2016 was in the 3rd quintile of its peer group. Based upon their review, the Trustees concluded that the overall performance of the Fund was satisfactory relative to the performance of funds with similar investment objectives and relevant indices, and that the advisory fee was reasonable in light of the services received by the Fund from the Advisor and the other factors considered.
Touchstone Mid Cap Growth Fund. The Fund’s advisory fee and total expense ratio (net of applicable expense waivers and reimbursements) were below the median and above the median, respectively, of its peer group. The Board noted that the Advisor was waiving a portion of the Fund’s fees and/or reimbursing a portion of the Fund’s operating expenses. The Fund’s performance for the six-month period ended June 30, 2016 was in the 4th quintile of its peer group. The Fund’s performance for the twelve-month period ended June 30, 2016 was in the 2nd quintile of its peer group, and the Fund’s performance for the thirty-six month period ended June 30, 2016 was in the 1st quintile of its peer group. Based upon their review, the Trustees concluded that the overall performance of the Fund was satisfactory relative to the performance of funds with similar investment objectives and relevant indices, and that the advisory fee was reasonable in light of the services received by the Fund from the Advisor and the other factors considered.
Touchstone Sands Capital Emerging Markets Growth Fund. The Fund’s advisory fee and total expense ratio (net of applicable expense waivers and reimbursements) were above the median of its peer group. The Board noted that the Advisor was waiving a portion of the Fund’s fees and/or reimbursing a portion of the Fund’s operating expenses. The Fund’s performance for the six-month period ended June 30, 2016 was in the 4th quintile of its peer group. The Fund’s performance for the twelve-month period ended June 30, 2016 was in the 2nd quintile of its peer group. Based upon their review, the Trustees concluded that the overall performance of the Fund was satisfactory relative to the performance of funds with similar investment objectives and relevant indices, and that the advisory fee was reasonable in light of the services received by the Fund from the Advisor and the other factors considered.
Touchstone Small Cap Growth Fund. The Fund’s advisory fee and total expense ratio (net of applicable expense waivers and reimbursements) were above the median of its peer group. The Board noted that the Advisor was waiving a portion of the Fund’s fees and/or reimbursing a portion of the Fund’s operating expenses. The Fund’s performance for the six- and twelve-month periods ended June 30, 2016 was in the 5th quintile of its peer group. The Fund’s performance for the thirty-six-month period ended June 30, 2016 was in the 4th quintile of its peer group. The Board considered management’s discussion of the Fund’s recent performance and management’s continued monitoring of Fund performance. Based upon their review, the Trustees concluded that the overall performance of the Fund was satisfactory relative to the performance of funds with similar investment objectives and relevant indices, and that the advisory fee was reasonable in light of the services received by the Fund from the Advisor and the other factors considered.
Touchstone Sustainability and Impact Equity Fund. The Fund’s advisory fee and total expense ratio (net of applicable expense waivers and reimbursements) were below the median of its peer group. The Board noted that the Advisor was waiving a portion of the Fund’s fees and/or reimbursing a portion of the Fund’s operating expenses. The Fund’s performance for the six- and twelve-month periods ended June 30, 2016 was in the 4th quintile of its peer group. The Fund’s performance for the thirty-six-month period ended June 30, 2016 was in the 1st quintile of its peer group. The Board considered management’s discussion of the Fund’s recent performance and management’s continued monitoring of Fund performance. Based upon their review, the Trustees concluded that the overall performance of the Fund was satisfactory relative to the performance of
Other Items (Unaudited) (Continued)
funds with similar investment objectives and relevant indices, and that the advisory fee was reasonable in light of the services received by the Fund from the Advisor and the other factors considered.
Economies of Scale. The Board considered the effect of each Fund’s current size and potential growth on its performance and expenses. The Board took into account management’s discussion of the Funds’ advisory fee structure. The Board considered the effective advisory fees under the Investment Advisory Agreement as a percentage of assets at different asset levels and possible economies of scale that might be realized if the assets of each Fund increase. The Board noted that the advisory fee schedule for each Fund, except the Touchstone International Value Fund and the Touchstone Sands Capital Emerging Markets Growth Fund, contains breakpoints that would reduce the respective advisory fee rate on assets above specified levels as the applicable Fund’s assets increased and considered the necessity of adding breakpoints with respect to the Funds that did not currently have such breakpoints in their advisory fee schedules. The Board determined that adding breakpoints at specified levels to the advisory fee schedule of the Touchstone International Value Fund and the Touchstone Sands Capital Emerging Markets Growth Fund would not be appropriate at this time. The Board noted that if a Fund’s assets increase over time, the Fund might realize other economies of scale if assets increase proportionally more than certain other expenses. The Board also considered the fact that, under the Investment Advisory Agreement, the advisory fee payable to the Advisor by a Fund was reduced by the total sub-advisory fee paid by the Advisor to the Fund’s Sub-Advisor.
Conclusion. In considering the renewal of the Funds’ Investment Advisory Agreement, the Board, including the Independent Trustees, did not identify any single factor as controlling, and each Trustee may have attributed different weights to the various factors. The Trustees evaluated all information available to them on a Fund-by-Fund basis, and their determinations were made separately with respect to each Fund. The Board reached the following conclusions regarding the Funds’ Investment Advisory Agreement with the Advisor, among others: (a) the Advisor demonstrated that it possesses the capability and resources to perform the duties required of it under the Investment Advisory Agreement; (b) the Advisor maintains an appropriate compliance program; (c) the overall performance of each Fund is satisfactory relative to the performance of funds with similar investment objectives and relevant indices; and (d) each Fund’s advisory fee is reasonable in light of the services received by the Fund from the Advisor and other factors considered. Based on their conclusions, the Trustees determined with respect to each Fund that continuation of the Investment Advisory Agreement was in the best interests of the Fund and its shareholders.
In approving the Funds’ respective Sub-Advisory Agreements, the Board considered various factors with respect to each Fund and the applicable Sub-Advisory Agreement, among them: (1) the nature, extent and quality of services provided to the Fund, including the personnel providing such services; (2) the Sub-Advisor’s compensation; (3) a comparison of the sub-advisory fee and performance with other advisers; and (4) the terms of the Sub-Advisory Agreement. The Board’s analysis of these factors is set forth below. The Independent Trustees were advised by independent legal counsel throughout the process.
Nature, Extent and Quality of Services Provided; Investment Personnel.The Board considered information provided by the Advisor regarding the services provided by each Sub-Advisor, including information presented periodically throughout the previous year. The Board noted the affiliation of one of the Sub-Advisors with the Advisor, noting any potential conflicts of interest. The Board also noted that, on a periodic basis, the Board meets with portfolio managers of the Sub-Advisors to discuss their respective performance and investment processes and strategies. The Board considered each Sub-Advisor’s level of knowledge and investment style. The Board reviewed the experience and credentials of the applicable investment personnel who are responsible for managing the investment of portfolio securities with respect to the Funds. The Board also noted each Sub-Advisor’s brokerage practices.
Other Items (Unaudited) (Continued)
Sub-Advisor’s Compensation, Profitability and Economies of Scale. The Board also took into consideration the financial condition of each Sub-Advisor and any indirect benefits derived by each Sub-Advisor and its affiliates from the Sub-Advisor’s relationship with the Funds. In considering the profitability to each Sub-Advisor of its relationship with the Funds, the Board noted the undertaking of the Advisor to maintain expense limitations for the Funds and also noted that the sub-advisory fees under the Sub-Advisory Agreements were paid by the Advisor out of the advisory fees that it receives under the Investment Advisory Agreement and in addition, with respect to the unaffiliated Sub-Advisors, are negotiated at arm’s length. As a consequence, the profitability to each Sub-Advisor of its relationship with a Fund was not a substantial factor in the Board’s deliberations. For similar reasons, the Board did not consider the potential economies of scale in each Sub-Advisor’s management of the applicable Fund to be a substantial factor in its consideration, although the Board noted that the sub-advisory fee schedule for all but two of the Funds contained breakpoints that would reduce the sub-advisory fee rate on assets above specified levels as the applicable Fund’s assets increased.
Sub-Advisory Fees and Fund Performance. The Board considered that each Fund pays an advisory fee to the Advisor and that the Advisor pays the sub-advisory fee to the Sub-Advisor out of the advisory fee it receives from the respective Fund. The Board also compared the sub-advisory fees paid by the Advisor to fees charged by the Sub-Advisor to manage comparable institutional separate accounts. The Board considered the amount retained by the Advisor and the sub-advisory fee paid to each Sub-Advisor with respect to the various services provided by the Advisor and the Sub-Advisor. The Board also noted that the Advisor negotiated the sub-advisory fee with each of the unaffiliated Sub-Advisors at arm’s length. The Board reviewed the sub-advisory fee for each Fund in relation to various comparative data, including the median and average sub-advisory fees of each Fund’s peer group, and considered the following information:
Touchstone Flexible Income Fund. The Fund’s sub-advisory fee was above the median of its peer group. Based upon their review, the Trustees concluded that the sub-advisory fee was reasonable in light of the services received by the Fund from the Sub-Advisor and the other factors considered.
Touchstone Focused Fund. The Fund’s sub-advisory fee was above the median of its peer group. Based upon their review, the Trustees concluded that the sub-advisory fee was reasonable in light of the services received by the Fund from the Sub-Advisor and the other factors considered.
Touchstone Growth Opportunities Fund. The Fund’s sub-advisory fee was above the median of its peer group. Based upon their review, the Trustees concluded that the sub-advisory fee was reasonable in light of the services received by the Fund from the Sub-Advisor and the other factors considered.
Touchstone International Value Fund. The Fund’s sub-advisory fee was above the median of its peer group. Based upon their review, the Trustees concluded that the sub-advisory fee was reasonable in light of the services received by the Fund from the Sub-Advisor and the other factors considered.
Touchstone Mid Cap Growth Fund. The Fund’s sub-advisory fee was above the median of its peer group. Based upon their review, the Trustees concluded that the sub-advisory fee was reasonable in light of the services received by the Fund from the Sub-Advisor and the other factors considered.
Touchstone Sands Capital Emerging Markets Growth Fund. The Fund’s sub-advisory fee was above the median of its peer group. Based upon their review, the Trustees concluded that the sub-advisory fee was reasonable in light of the services received by the Fund from the Sub-Advisor and the other factors considered.
Touchstone Sustainability and Impact Equity Fund. The Fund’s sub-advisory fee was below the median of its peer group. Based upon their review, the Trustees concluded that the sub-advisory fee was reasonable in light of the services received by the Fund from the Sub-Advisor and the other factors considered.
Other Items (Unaudited) (Continued)
As noted above, the Board considered each Fund’s performance during the six-month, twelve-month, and thirty-six month periods ended June 30, 2016, as applicable, as compared to each Fund’s peer group and noted that the Board reviews on a quarterly basis detailed information about each Fund’s performance results, portfolio composition and investment strategies. The Board noted the Advisor’s expertise and resources in monitoring the performance, investment style and risk-adjusted performance of each Sub-Advisor. The Board also was mindful of the Advisor’s ongoing monitoring of each Sub-Advisor’s performance and the measures undertaken by the Advisor to address any underperformance.
Conclusion. In considering the renewal of the Sub-Advisory Agreement with respect to each Fund, the Board, including the Independent Trustees, did not identify any single factor as controlling, and each Trustee may have attributed different weights to the various factors. The Board reached the following conclusions regarding each Sub-Advisory Agreement, among others: (a) the Sub-Advisor is qualified to manage each Fund’s assets in accordance with the Fund’s investment goals and policies; (b) the Sub-Advisor maintains an appropriate compliance program; (c) the overall performance of each Fund is satisfactory relative to the performance of funds with similar investment objectives and relevant indices; (d) each Fund’s sub-advisory fees are reasonable in light of the services received by the Fund from the Sub-Advisor and the other factors considered; and (e) the Sub-Advisor’s investment strategies are appropriate for pursuing the investment goals of each Fund. Based on its conclusions, the Board determined that approval of the Sub-Advisory Agreement with respect to each Fund was in the best interests of the Fund and its shareholders.
Management of the Trust (Unaudited)
Listed below is required information regarding the Trustees and principal officers of the Trust. The Trust’s Statement of Additional Information includes additional information about the Trustees and is available, without charge, upon request by calling 1.800.543.0407 or by visiting the Touchstone website at TouchstoneInvestments.com.
| Interested Trustee1: | | | | | | | | | | |
| | | | | | | | | Number | | |
| | | | | | | | | of Funds | | |
| | | | | | | | | Overseen | | |
| | | | | Term of | | | | in the | | |
| Name | | Position(s) | | Office And | | | | Touchstone | | Other |
| Address | | Held with | | Length of | | Principal Occupation(s) | | Fund | | Directorships |
| Age | | Trust | | Time Served | | During Past 5 Years | | Complex2 | | Held During the Past 5 Years3 |
Jill T. McGruder
Touchstone Advisors, Inc.
303 Broadway
Suite 1100
Cincinnati, OH 45202
Year of Birth: 1955 | | Trustee and President | | Until retirement at age 75 or until she resigns or is removed Trustee since 1999 | | President and CEO of IFS Financial Services, Inc. (a holding company). | | 41 | | IFS Financial Services, Inc. (a holding company) from 1999 to the present; Integrity and National Integrity Life Insurance Co. from 2005 to the present; Touchstone Securities (the Trust’s distributor) from 1999 to the present; Touchstone Advisors (the Trust’s investment advisor and administrator) from 1999 to the present; W&S Brokerage Services (a brokerage company) from 1999 to the present; W&S Financial Group Distributors (a distribution company) from 1999 to the present; Cincinnati Analysts, Inc. from 2012 to the present; Columbus Life Insurance Co. from 2016 to the present; The Lafayette Life Insurance Co. from 2016 to the present; Taft Museum of Art from 2007 to the present; YWCA of Greater Cincinnati from 2012 to the present; and LL Global, Inc. from 2016 to the present. |
| Independent Trustees: | | | | | | | | | | |
Phillip R. Cox
c/o Touchstone Advisors, Inc.
303 Broadway
Suite 1100
Cincinnati, OH 45202
Year of Birth: 1947 | | Trustee | | Until retirement at age 75 or until he resigns or is removed Trustee since 1999 | | President and Chief Executive Officer of Cox Financial Corp. (a financial services company) from 1971 to the present. | | 41 | | Director of Cincinnati Bell (a communications company) from 1994 to the present; Bethesda Inc. (a hospital) from 2005 to the present; Timken Co. (a manufacturing company) from 2004 to 2014; TimkenSteel from 2014 to the present; Diebold, Inc. (a technology solutions company) from 2004 to the present; and Ohio Business Alliance for Higher Education and the Economy from 2005 to the present. |
William C. Gale
c/o Touchstone Advisors, Inc.
303 Broadway
Suite 1100
Cincinnati, OH 45202
Year of Birth: 1952 | | Trustee | | Until retirement at age 75 or until he resigns or is removed Trustee since 2013 | | Retired; formerly Senior Vice President and Chief Financial Officer (from 2003 to January 2015) of Cintas Corporation (a business services company). | | 41 | | None. |
Management of the Trust (Unaudited) (Continued)
| Independent Trustees (Continued): | | | | | |
| | | | | | | | | Number | | |
| | | | | | | | | of Funds | | |
| | | | | | | | | Overseen | | |
| | | | | Term of | | | | in the | | |
| Name | | Position(s) | | Office And | | | | Touchstone | | Other |
| Address | | Held with | | Length of | | Principal Occupation(s) | | Fund | | Directorships |
| Age | | Trust | | Time Served | | During Past 5 Years | | Complex2 | | Held During the Past 5 Years3 |
Susan J. Hickenlooper
c/o Touchstone Advisors, Inc.
303 Broadway
Suite 1100
Cincinnati, OH 45202
Year of Birth: 1946 | | Trustee | | Until retirement at age 75 or until she resigns or is removed Trustee since 2009 | | Retired; formerly Financial Analyst for Impact 100 (charitable organization) from November 2012 to 2013. | | 41 | | Trustee of Diocese of Southern Ohio from 2014 to the present; and Trustee of Cincinnati Parks Foundation from 2000 to 2016. |
Kevin A. Robie
c/o Touchstone Advisors, Inc.
303 Broadway
Suite 1100
Cincinnati, OH 45202
Year of Birth: 1956 | | Trustee | | Until retirement at age 75 or until he resigns or is removed Trustee since 2013 | | Vice President of Portfolio Management at Soin International LLC (a multinational holding company) from 2004 to the present. | | 41 | | SaverSystems, Inc. from 2015 to the present; Director of Buckeye EcoCare, Inc. (a lawn care company) from 2013 to the present; Trustee of Dayton Region New Market Fund, LLC (a private fund) from 2010 to the present; and Trustee of the Entrepreneurs Center, Inc. (a small business incubator) from 2006 to the present. |
Edward J. VonderBrink
c/o Touchstone Advisors, Inc.
303 Broadway
Suite 1100
Cincinnati, OH 45202
Year of Birth: 1944 | | Trustee | | Until retirement at age 75 or until he resigns or is removed Trustee since 2013 | | Consultant, VonderBrink Consulting LLC from 2000 to the present. | | 41 | | Director of Streamline Health Solutions, Inc. (healthcare IT) from 2006 to 2015; Mercy Health from 2013 to the present; Mercy Health Foundation (healthcare nonprofit) from 2008 to the present; Al Neyer Inc. (a construction company) from 2013 to the present; and BASCO Shower Door from 2011 to the present. |
| 1 | Ms. McGruder, as a director of the Advisor and the Distributor, and an officer of affiliates of the Advisor and the Distributor, is an “interested person” of the Trust within the meaning of Section 2(a) (19) of the 1940 Act. |
| 2 | As of March 31, 2017, the Touchstone Fund Complex consisted of 21 series of the Trust, 13 series of Touchstone Funds Group Trust, 1 series of Touchstone Institutional Funds Trust and 6 variable annuity series of Touchstone Variable Series Trust. |
| 3 | Each Trustee is also a Trustee of Touchstone Funds Group Trust, Touchstone Institutional Funds Trust and Touchstone Variable Series Trust. |
Management of the Trust (Unaudited) (Continued)
The following is a list of the Principal Officers of the Trusts, the length of time served, and principal occupations for the past five years.
| Principal Officers: | | | | | | |
| | | | | Term of | | |
| Name | | Position(s) | | Office And | | |
| Address | | Held with | | Length of | | Principal Occupation(s) |
| Age | | Trust1 | | Time Served | | During the Past 5 Years |
Jill T. McGruder
Touchstone Advisors, Inc.
303 Broadway
Suite 1100
Cincinnati, OH 45202
Year of Birth: 1955 | | President and Trustee | | Until resignation, removal or disqualification President since 2006 | | See biography above. |
Steven M. Graziano
Touchstone Advisors, Inc.
303 Broadway
Suite 1100
Cincinnati, OH 45202
Year of Birth: 1954 | | Vice President | | Until resignation, removal or disqualification Vice President since 2009 | | President of Touchstone Advisors, Inc. |
Timothy D. Paulin
Touchstone Advisors, Inc.
303 Broadway
Suite 1100
Cincinnati, OH 45202
Year of Birth: 1963 | | Vice President | | Until resignation, removal or disqualification Vice President since 2010 | | Senior Vice President of Investment Research and Product Management of Touchstone Advisors, Inc. |
Timothy S. Stearns
Touchstone Advisors, Inc.
303 Broadway
Suite 1100
Cincinnati, OH 45202
Year of Birth: 1963 | | Chief Compliance Officer | | Until resignation, removal or disqualification Chief Compliance Officer since 2013 | | Chief Compliance Officer of Touchstone Advisors, Inc.; Chief Compliance Officer of Envestnet Asset Management, Inc. (2009 to 2013). |
Terrie A. Wiedenheft
Touchstone Advisors, Inc.
303 Broadway
Suite 1100
Cincinnati, OH 45202
Year of Birth: 1962 | | Controller and Treasurer | | Until resignation, removal or disqualification Controller and Treasurer since 2006 | | Senior Vice President, Chief Financial Officer and Chief Operations Officer, of IFS Financial Services, Inc. (a holding company). |
Ellen Blanchard
BNY Mellon Investment
Servicing (US) Inc.
201 Washington St, 11th Fl.
Boston, MA 02108
Year of Birth: 1973 | | Secretary | | Until resignation, removal or disqualification Secretary since 2015 | | Director of BNY Mellon Investment Servicing (US) Inc. |
| 1 | Each officer also holds the same office with Touchstone Funds Group Trust, Touchstone Institutional Funds Trust and Touchstone Variable Series Trust. |
This page intentionally left blank.
PRIVACY PROTECTION POLICY
We Respect Your Privacy
Thank you for your decision to invest with us. Touchstone and its affiliates have always placed a high value on the trust and confidence our clients place in us. We believe that confidence must be earned and validated through time. In today’s world, when technology allows the sharing of information at light speeds, trust must be reinforced by our sincere pledge to take the steps necessary to ensure that the information you share with us is treated with respect and confidentiality.
Our Pledge to Our Clients
| • | We collect only the information we need to service your account and administer our business. |
| • | We are committed to keeping your information confidential and we place strict limits and controls on the use and sharing of your information. |
| • | We make every effort to ensure the accuracy of your information. |
We Collect the Following Nonpublic Personal Information About You:
| • | Information we receive from you on or in applications or other forms, correspondence, or conversations, including, but not limited to, your name, address, phone number, social security number, assets, income and date of birth; and |
| • | Information about your transactions with us, our affiliates, or others, including, but not limited to, your account number and balance, payment history, parties to transactions, cost basis information, and other financial information. |
Categories of Information We Disclose and Parties to Whom We Disclose
We do not disclose any nonpublic personal information about our current or former clients to nonaffiliated third parties, except as required or permitted by law.
We Place Strict Limits and Controls on the Use and Sharing of Your Information
| • | We restrict access to nonpublic personal information about you to authorized employees who need the information to administer your business. |
| • | We maintain physical, electronic and procedural safeguards that comply with federal standards to protect this information. |
| • | We do not disclose any nonpublic personal information about our current or former clients to anyone, except as required or permitted by law or as described in this document. |
| • | We will not sell your personal information to anyone. |
We May Provide Information to Service Your Account
Sometimes it is necessary to provide information about you to various companies such as transfer agents, custodians, broker-dealers and marketing service firms to facilitate the servicing of your account.These organizations have a legitimate business need to see some of your personal information in order for us to provide service to you. We may disclose to these various companies the information that we collect as described above. We require that these companies, including our own subsidiaries and affiliates, strictly maintain the confidentiality of this information and abide by all applicable laws. Companies within our corporate family that may receive this information are financial service providers and insurance companies. We do not permit these associated companies to sell the information for their own purposes, and we never sell our customer information.
This policy is applicable to the following affiliated companies: Touchstone Funds Group Trust, Touchstone Strategic Trust, Touchstone Variable Series Trust, Touchstone Institutional Funds Trust, Touchstone Securities, Inc.,* and W&S Brokerage Services, Inc.
* Touchstone Securities, Inc. serves as the underwriter to the Touchstone Funds.
A Member of Western & Southern Financial Group®
The Privacy Protection Policy is not part of the Annual Report.


Touchstone Investments
Distributor
Touchstone Securities, Inc.*
303 Broadway
Cincinnati, Ohio 45202-4203
800.638.8194
www.touchstoneinvestments.com
Investment Advisor
Touchstone Advisors, Inc.*
303 Broadway
Cincinnati, Ohio 45202-4203
Transfer Agent
BNY Mellon Investment Servicing (US) Inc.
4400 Computer Drive
Westborough, MA 01581
Shareholder Service
800.543.0407
* A Member of Western & Southern Financial Group
TSF-54-TST-AR-1703
Item 2. Code of Ethics.
| (a) | The registrant, as of the end of the period covered by this report, has adopted a code of ethics that applies to the registrant’s principal executive officer, principal financial officer, principal accounting officer or controller, or persons performing similar functions, regardless of whether these individuals are employed by the registrant or a third party. |
| (c) | There have been no amendments, during the period covered by this report, to a provision of the code of ethics that applies to the registrant’s principal executive officer, principal financial officer, principal accounting officer or controller, or persons performing similar functions, regardless of whether these individuals are employed by the registrant or a third party, and that relates to any element of the code of ethics description. |
| (d) | The registrant has not granted any waivers, including an implicit waiver, from a provision of the code of ethics that applies to the registrant’s principal executive officer, principal financial officer, principal accounting officer or controller, or persons performing similar functions, regardless of whether these individuals are employed by the registrant or a third party, that relates to one or more of the items set forth in paragraph (b) of this item’s instructions. |
Item 3. Audit Committee Financial Expert.
The registrant’s Board of Trustees has determined that the registrant has at least one audit committee financial expert serving on its audit committee. Mr. William Gale is the registrant’s audit committee financial expert and is an independent trustee within the meaning of the Investment Company Act of 1940, as amended (the “1940 Act”).
Item 4. Principal Accountant Fees and Services.
Audit Fees
| (a) | Audit fees for Touchstone Strategic Trust totaled $151,000 and $128,900 in fiscal 2017 and 2016, respectively, including fees associated with the annual audits and filings of Form N-1A and Form N-SAR. |
Audit-Related Fees
| (b) | The aggregate fees billed in each of the last two fiscal years for assurance and related services by the principal accountant that are reasonably related to the performance of the audit of the registrant's financial statements and are not reported under paragraph (a) of this Item are $7,273 for 2017 and $8,000 for 2016. The fees for 2017 relate to additional audit procedures. The fees for 2016 relate to the review of a 485(b) filing and response to SEC letter. |
Tax Fees
| (c) | The Fees for tax compliance services totaled $59,315 and $42,020 in fiscal 2017 and 2016, respectively. The fees relate to the preparation of federal income and excise tax returns and review of capital gains distribution calculations. |
All Other Fees
| (d) | The aggregate fees billed in each of the last two fiscal years for products and services provided by the principal accountant, other than the services reported in paragraphs (a) through (c) of this Item are $32,347 for 2017 and $20,231 for 2016. The fees relate to the PFIC Analyzer and Global Withholding Tax Reporter subscriptions. |
| (e)(1) | Disclose the audit committee's pre-approval policies and procedures described in paragraph (c)(7) of Rule 2-01 of Regulation S-X. |
| | The Audit Committee’s pre-approval policies describe the types of audit, audit-related, tax and other services that have the general pre-approval of the Audit Committee. The pre-approval policies provide that annual audit service fees, tax services not specifically granted pre-approval, services exceeding pre-approved cost levels and other services that have not received general pre-approval will be subject to specific pre-approval by the Audit Committee. The pre-approval policies further provide that the Committee may grant general pre-approval to other audit services (statutory audits and services associated with SEC registration statements, periodic reports and other documents filed with the SEC or other documents issued in connection with securities offerings), audit-related services (accounting consultations related to accounting, financial reporting or disclosure matters not classified as “audit services,” assistance with understanding and implementing new accounting and financial reporting guidance from rulemaking authorities, agreed-upon or expanded audit procedures related to accounting and/or billing records required to respond to or comply with financial, accounting or regulatory reporting matters and assistance with internal control reporting requirements under Form N-SAR and Form N-CSR), tax services that have historically been provided by the auditor that the Committee believes would not impair the independence of the auditor and are consistent with the SEC’s rules on auditor independence and permissible non-audit services classified as “all other services” that are routine and recurring services. |
| (e)(2) | All services described in paragraphs (b) through (d) of Item 4 were approved by the Audit Committee. |
| (f) | The percentage of hours expended on the principal accountant's engagement to audit the registrant's financial statements for the most recent fiscal year that were attributed to work performed by persons other than the principal accountant's full-time, permanent employees was less than fifty percent. |
| (g) | The aggregate non-audit fees for Touchstone Strategic Trust and certain entities*, totaled approximately $98,935 and $70,251 in 2017 and 2016, respectively. |
* These include the advisors (excluding sub-advisors) and any entity controlling, controlled by or under common control with the advisors that provides ongoing services to the registrant (Funds).
| (h) | The registrant's audit committee of the board of trustees has considered whether the provision of non-audit services that were rendered to the registrant's investment adviser (not including any sub-adviser whose role is primarily portfolio management and is subcontracted with or overseen by another investment adviser), and any entity controlling, controlled by, or under common control with the investment adviser that provides ongoing services to the registrant that were not pre-approved pursuant to paragraph (c)(7)(ii) of Rule 2-01 of Regulation S-X is compatible with maintaining the principal accountant's independence. |
Item 5. Audit Committee of Listed Registrants.
Not applicable.
Item 6. Investments.
| (a) | Schedule of Investments in securities of unaffiliated issuers as of the close of the reporting period is included as part of the report to shareholders filed under Item 1 of this form. |
Item 7. Disclosure of Proxy Voting Policies and Procedures for Closed-End Management Investment Companies.
Not applicable.
Item 8. Portfolio Managers of Closed-End Management Investment Companies.
Not applicable.
Item 9. Purchases of Equity Securities by Closed-End Management Investment Company and Affiliated Purchasers.
Not applicable.
Item 10. Submission of Matters to a Vote of Security Holders.
There have been no material changes to the procedures by which the shareholders may recommend nominees to the registrant’s board of trustees, where those changes were implemented after the registrant last provided disclosure in response to the requirements of Item 407(c)(2)(iv) of Regulation S-K (17 CFR 229.407) (as required by Item 22(b)(15) of Schedule 14A (17 CFR 240.14a-101)), or this Item.
Item 11. Controls and Procedures.
| (a) | The registrant’s principal executive and principal financial officers, or persons performing similar functions, have concluded that the registrant’s disclosure controls and procedures (as defined in Rule 30a-3(c) under the Investment Company Act of 1940, as amended (the “1940 Act”) (17 CFR 270.30a-3(c))) are effective, as of a date within 90 days of the filing date of the report that includes the disclosure required by this paragraph, based on their evaluation of these controls and procedures required by Rule 30a-3(b) under the 1940 Act (17 CFR 270.30a-3(b)) and Rules 13a-15(b) or 15d-15(b) under the Securities Exchange Act of 1934, as amended (17 CFR 240.13a-15(b) or 240.15d-15(b)). |
| (b) | There were no changes in the registrant’s internal control over financial reporting (as defined in Rule 30a-3(d) under the 1940 Act (17 CFR 270.30a-3(d))) that occurred during the registrant’s second fiscal quarter of the period covered by this report that has materially affected, or is reasonably likely to materially affect, the registrant’s internal control over financial reporting. |
Item 12. Exhibits.
| (a)(1) | Code of ethics, or any amendment thereto, that is the subject of disclosure required by Item 2 is attached hereto. |
| (a)(2) | Certifications pursuant to Rule 30a-2(a) under the 1940 Act and Section 302 of the Sarbanes-Oxley Act of 2002 are attached hereto. |
| (b) | Certifications pursuant to Rule 30a-2(b) under the 1940 Act and Section 906 of the Sarbanes- Oxley Act of 2002 are attached hereto. |
| (12.other) | Not applicable. |
SIGNATURES
Pursuant to the requirements of the Securities Exchange Act of 1934 and the Investment Company Act of 1940, the registrant has duly caused this report to be signed on its behalf by the undersigned, thereunto duly authorized.
| (Registrant) | Touchstone Strategic Trust |
| | |
| By (Signature and Title)* | /s/ Jill T. McGruder |
| | Jill T. McGruder, President |
| | (principal executive officer) |
Date 5/26/2017
Pursuant to the requirements of the Securities Exchange Act of 1934 and the Investment Company Act of 1940, this report has been signed below by the following persons on behalf of the registrant and in the capacities and on the dates indicated.
| By (Signature and Title)* | /s/ Jill T. McGruder |
| | Jill T. McGruder, President |
| | (principal executive officer) |
| | |
| Date 5/26/2017 | |
| | |
| | |
| By (Signature and Title)* | /s/ Terrie A Wiedenheft |
| | Terrie A. Wiedenheft, Controller and Treasurer |
| | (principal financial officer) |
Date 5/26/2017
* Print the name and title of each signing officer under his or her signature.