UNITED STATES
SECURITIES AND EXCHANGE COMMISSION
Washington, D.C. 20549
FORM N-CSR
CERTIFIED SHAREHOLDER REPORT OF REGISTERED MANAGEMENT
INVESTMENT COMPANIES
Investment Company Act file number 811-03651
| Touchstone Strategic Trust – June Funds |
| (Exact name of registrant as specified in charter) |
| 303 Broadway, Suite 1100 |
| Cincinnati, Ohio 45202-4203 |
| (Address of principal executive offices) (Zip code) |
| Jill T. McGruder |
| 303 Broadway, Suite 1100 |
| Cincinnati, Ohio 45202-4203 |
| (Name and address of agent for service) |
Registrant's telephone number, including area code: 800-638-8194
Date of fiscal year end: June 30
Date of reporting period: June 30, 2016
Form N-CSR is to be used by management investment companies to file reports with the Commission not later than 10 days after the transmission to stockholders of any report that is required to be transmitted to stockholders under Rule 30e-1 under the Investment Company Act of 1940 (17 CFR 270.30e-1). The Commission may use the information provided on Form N-CSR in its regulatory, disclosure review, inspection, and policymaking roles.
A registrant is required to disclose the information specified by Form N-CSR, and the Commission will make this information public. A registrant is not required to respond to the collection of information contained in Form N-CSR unless the Form displays a currently valid Office of Management and Budget ("OMB") control number. Please direct comments concerning the accuracy of the information collection burden estimate and any suggestions for reducing the burden to Secretary, Securities and Exchange Commission, 100 F Street, NE, Washington, DC 20549. The OMB has reviewed this collection of information under the clearance requirements of 44 U.S.C. § 3507.
Item 1. Reports to Stockholders.
The Report to Shareholders is attached herewith.
June 30, 2016
Annual Report
Touchstone Strategic Trust
Touchstone Credit Opportunities Fund
Touchstone International Small Cap Fund
Touchstone Large Cap Fund
Touchstone Small Cap Value Opportunities Fund
Touchstone Value Fund

Table of Contents
This report identifies the Funds' investments on June 30, 2016. These holdings are subject to change. Not all investments in each Fund performed the same, nor is there any guarantee that these investments will perform as well in the future. Market forecasts provided in this report may not occur.
Letter from the President
Dear Shareholder:
We are pleased to provide you with the Touchstone Strategic Trust Annual Report. Inside you will find key financial information, as well as manager commentaries, for the 12 months ended June 30, 2016.
During the fiscal year, investors warily eyed the prospects for global economic growth amid weakness in Europe and Japan and a continued slowdown in China. Concerns about the economic landscape led central bankers around the world to maintain highly accommodative monetary policies. Even in the U.S. - where growth was steady but unspectacular – the Federal Reserve Board (Fed) believed the economic outlook was sufficiently precarious as to warrant only one increase in short-term interest rates. The global environment of low growth and low inflation weighed on interest rates around the world, some of which ended the fiscal year in negative territory. The decline in rates was only exacerbated by the United Kingdom’s June 23rd vote to leave the European Union (EU), which introduced further uncertainty about the future of the EU and economic growth in that region.
U.S. equity markets were mixed during the 12-month period as larger capitalization stocks generated gains and small caps experienced losses. From a style perspective, market leadership transitioned to value-oriented stocks during the year, ending a lengthy run of outperformance by companies with growth characteristics. The relative earnings weakness exhibited outside the U.S. led to negative returns for both developed international and emerging market equities.
Though short-term interest rates rose in anticipation of the Fed’s interest rate hike in late 2015, they quickly retrenched amid concerns about the global economy. Intermediate- to long-term rates, however, continued a downward trend, providing a tailwind for investment grade bonds. The broad-based Barclays U.S. Aggregate Bond Index experienced solid gains for the year. Though they also provided positive returns, high yield bonds managed only slight gains as investors remained cautious about the potential for rising defaults due to weak energy and commodity prices.
In this kind of economic and market environment, we believe that a focus on your long-term goals remains essential to ultimately achieving investment success. The events and market fluctuations of the last year have demonstrated how quickly perceptions of risk and return can swing from bullish to bearish and back again. Consulting with your financial professional can help you determine the appropriate asset allocation to keep your long-term financial goals on track.
We greatly appreciate your continued support. Thank you for including Touchstone as part of your investment plan.
Sincerely,

Jill T. McGruder
President
Touchstone Strategic Trust
Management's Discussion of Fund Performance (Unaudited)
Touchstone Credit Opportunities Fund
Sub-Advised by Ares Capital Management II LLC
Investment Philosophy
The Touchstone Credit Opportunities Fund employs a flexible investment approach by allocating assets among core investments and opportunistic investments as credit market conditions change. It invests in several broad investment categories, including high yield bonds, bank loans, special situations, structured credit and hedges.
Fund Performance
The Touchstone Credit Opportunities Fund (Class A Shares) outperformed its benchmark, the BofA Merrill Lynch 3-Month U.S. Treasury Bill Index, for the 10-month period ended June 30, 2016. The Fund’s total return was 2.95 percent (calculated excluding the maximum sales charge and beginning with the 8/31/2015 inception date), while the total return of the benchmark was 0.18 percent.
Market Environment
The Touchstone Credit Opportunities Fund was launched on August 31, 2015 amidst a challenging market environment where high yield bond and leveraged loan prices were coming under pressure owing largely to global growth concerns. Difficult market conditions continued throughout the fourth quarter of 2015 as elevated concerns related to slowing global growth, continued instability in the commodity sector and the U.S. Federal Reserve Board’s (Fed) first interest rate hike in seven years heightened investor apprehension and drove a widespread aversion to risk assets. Credit markets weakened as investors fled risk, highlighted by the high yield market suffering continued pressure from volatility in energy and commodity related sectors that had further extended to the broader high yield market as the year came to a close. Non-investment grade credit markets were challenged across the board as both levered loan and high yield bond indices posted their first negative performance since 2008. Despite fears around the health of China’s economy, pronounced weakness in the emerging markets and the ongoing rout in the commodities market, equity markets rallied during the fourth quarter of 2015.
The negative sentiment and volatility that prevailed in the U.S. credit markets during late 2015 continued unabated into January, which historically has been a stronger month for credit. The quarter began with a continued collapse in oil prices, concerns about China’s devaluation pace, and U.S. recession fears. Around mid-February, improvements across a number of global issues provided a more constructive macro backdrop for non-investment grade credit markets. The European Central Bank (ECB) provided a larger expansion of monetary policy than anticipated, China gave more reassurance on foreign exchange rates, the Organization Of Petroleum Exporting Countries (OPEC) and non-OPEC members held talks putting a floor under oil prices, U.S. recession concerns faded amidst better economic data and Fed narrative became more meaningfully dovish. As risk appetite resurfaced, a broader set of buyers emerged, leading to heavy inflows to high yield and the first inflows into loans following 33 consecutive weeks of outflows. Following the momentum gained in late February, capital markets firmly advanced through March as a more traditional risk rally took hold amid improving investor sentiment and accommodative central bank action and rhetoric. Leveraged loans, high yield bonds and equities all posted strong returns for the month of March, led primarily by lower rated assets and stressed industries (e.g. Energy), as strong inflows strengthened the technical picture.
U.S. credit markets posted strong results for the second quarter of 2016 despite heightened volatility at the end of June surrounding a somewhat surprising vote by the British populace to leave the European Union (Brexit). While news of this event initially rattled the markets, the subsequent rebound during the final days of June was strong as investors concluded these events should not dramatically set back the U.S. economy. While loans experienced the same reversal of sentiment at month-end, it was not to the same extent as high yield as loans ended the quarter flat. Technical conditions were favorable for the predominance of the quarter
Management's Discussion of Fund Performance (Unaudited) (Continued)
for bank loans which helped positively contribute to return during the second quarter of 2016. Equities recovered during the first two trading days after the Brexit results were announced.
Portfolio Review
Since inception, the high yield bond portion of the Fund has been the largest contributor to performance. Notably, the high yield bond investment category has been positioned more defensively in higher quality assets, which performed well during the fourth quarter of 2015 but were outpaced by lower quality assets in the first half of 2016 as the risk rally ensued. Additionally, high yield bond performance has been buoyed by a sharp rally in Treasuries as of late. Similarly, the loan segment of the Fund contributed positively to since inception performance. The Stressed/Distressed allocation had a slight drag on since inception performance as the pressure on special situations investments, particularly those within the Energy sector, during the fourth quarter of 2015 was more than offset by the rally those assets experienced in 2016.
During the latter part of 2015, the Fund was focused on getting invested, while maintaining an above average cash balance given the elevated market volatility and negative market technicals that prevailed during the fourth quarter of 2015. Over the course of the first quarter, we maintained the Fund’s defensive posture, underweight risk; however, we increased the beta1 of the Fund marginally throughout the quarter. More specifically, we steadily deployed cash to increase the Fund’s allocation to high yield bonds and bank loans as we viewed these asset classes to be relatively cheap. During the second quarter of 2016, we generally continued a barbell strategy of staying more defensively positioned, buying more high quality than high beta securities but selectively adding risk where we saw value. In addition, owing to the rally we saw in high yield bonds over the first half of 2016, we liquidated the Fund’s high yield bond position and redeployed that capital largely in bank loans. Lastly, toward the end of June 2016, we slightly increased the Fund’s cash position in anticipation of increased market volatility.
The yield curve has been flattening since inception of the Fund which has benefited the portfolio given its exposure to longer duration fixed income assets. It is our view that relative interest rates and central bank liquidity are trumping fundamentals. We think rates will be lower for longer and believe if the Fed were to raise rates it would be a curve flattening move, with the long end coming down. In June, the Fed held interest rates steady and signaled a more gradual pace of hikes than previously indicated. While the Fed doesn’t appear to be raising rates anytime soon, the yield curve has been flattening and is being pulled down because of negative interest rates globally. We think this phenomenon will be with us for an extended period of time so we are comfortable going out the curve in higher quality, longer duration assets. Regardless of interest rate direction, the Fund’s ability to toggle between fixed and floating rate assets as well as shorter and longer duration high yield bonds helps us manage interest rate risk.
Outlook
We believe heightened equity valuations, declining earnings and low cost of capital is a recipe for increased strategic mergers and acquisitions (M&A) activity. Accordingly, we have been looking for discounted senior secured paper with ample asset coverage in stressed/distressed companies that may have trouble refinancing on their own and as a result seek to be acquired.
One potential risk we see going forward is a devaluation of the Chinese yuan that surprises the market from a timing or magnitude perspective and creates volatility. In addition, we remain concerned that the Fed might decide to raise interest rates in the face of a slowing growth environment, which could create more volatility and downside in the market. Given the lack of inflationary pressure at present and slowing global growth, we believe the Fed is taking a more dovish approach than originally anticipated. Another potential cause for concern is that we are beginning to see more margin pressure at the company level in the portfolio which increases the likelihood of earnings misses and creates cause for credit spread widening.
Management's Discussion of Fund Performance (Unaudited) (Continued)
We believe the remainder of 2016 is likely to be volatile given rising global growth concerns, the upcoming U.S. presidential election and other possible exogenous shocks like a surprise devaluation of the yuan or an unforeseen geopolitical event. While the leveraged credit markets have rallied meaningfully since mid-February, we believe that the rally was primarily driven by technical factors that may soon be over-shadowed by softer company fundamentals and global recession fears. We also believe credit risk broadly is rising and anticipate default rates will rise steadily through 2016 and 2017. Economic conditions in the U.S. remain stable to positive and the global search for yield continues. In light of these factors, we are continuing to defensively position the Fund in higher quality, longer duration names and selectively adding risk where we see value. In addition, we are looking to increase the Fund’s single-name shorts in credits that have rallied recently alongside the broader market yet face potential earnings headwinds. We believe this positioning will enable the Fund to hold on to the returns generated year-to-date.
We have first focused on ramping the long side of the Fund and have been slowly layering in hedges and shorts. Following the recent rally in the market, we are actively looking to increase the Fund’s shorts, particularly as what we view to be a largely central bank driven rally collides with a weakening earnings environment.
With respect to the Fund’s positioning by investment category, it currently maintains a higher weight to high yield bonds as we are seeing good relative value opportunities in the asset class, particularly in light of the flattening yield curve. We will look to add exposure to stressed first lien loans that are potential M&A targets as noted above. Finally, owing to the recovery experienced year-to-date for structured credit, we are not currently adding exposure and would be better buyers in a more volatile market.
1 Beta is a measure of the volatility of a portfolio relative to its benchmark.
Management's Discussion of Fund Performance (Unaudited) (Continued)
Comparison of the Change in Value of a $10,000 Investment in the Touchstone Credit Opportunities Fund - Class A* and the BofA Merrill Lynch 3-Month U.S. Treasury Bill Index
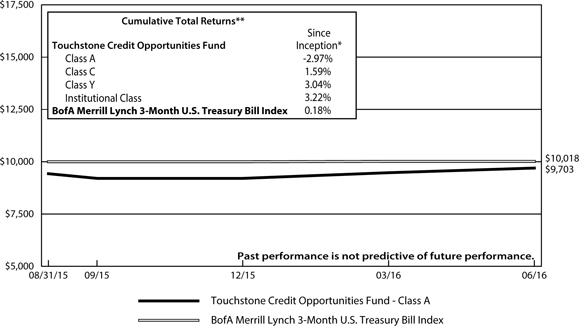
| * | The chart above represents performance of Class A shares only, which will vary from the performance of Class C shares, Class Y shares and Institutional Class shares based on the differences in sales loads and fees paid by shareholders in the different classes. The inception date of the Fund was August 31, 2015. The returns of the index listed above are based on the inception date of the Fund. |
| ** | Not Annualized. The cumulative total returns shown above are adjusted for maximum sales loads and fees, if applicable. The maximum offering price per share of Class A shares is equal to the net asset value (“NAV”) per share plus a sales load equal to 6.10% of the NAV (or 5.75% of the offering price). Class C shares are subject to a contingent deferred sales charge (“CDSC”) of 1.00%. The CDSC will be assessed on an amount equal to the lesser of (1) the NAV at the time of purchase of the shares being redeemed or (2) the NAV of such shares being redeemed, if redeemed within a one-year period from date of purchase. Class Y shares and Institutional Class shares are not subject to sales charges. |
The performance of the above Fund does not reflect the deduction of taxes that a shareholder would pay on Fund distributions or the redemption of Fund shares.
Note to Chart
BofA Merrill Lynch 3-Month U.S. Treasury Bill Index is an unmanaged index of Treasury securities maturing in 90 days that assumes reinvestment of all income.
Management's Discussion of Fund Performance (Unaudited)
Touchstone International Small Cap Fund
Sub-Advised by Copper Rock Capital Partners LLC
Investment Philosophy
The Touchstone International Small Cap Fund seeks capital appreciation by primarily investing in equity securities of non-U.S. small-cap companies diversified across sectors and industries. The Fund’s investment process seeks to add value through bottom-up stock selection and in-depth fundamental research and searches for companies believed to have strong management, superior earnings growth prospects and attractive relative valuations.
Fund Performance
The Touchstone International Small Cap Fund (Class A Shares) underperformed its benchmark, the S&P Developed Ex-U.S. Small Cap Index for the 12-month period ended June 30, 2016. The Fund’s total return was -8.77 percent (calculated excluding the maximum sales charge), while the total return of the benchmark was -3.80 percent.
Market Environment
The global markets posted negative results during the 12-month period, which were driven by a myriad of factors including depressed oil and commodities prices for much of 2015 and muted global growth. In particular, during the third quarter of 2015, China’s stock market suffered steep losses despite the government’s interventionist policies and devaluation of the yuan. Emerging market economies also moved significantly lower, as investors pulled out of debt and equities within those regions. Most of the decline was due to the slowdown in China, as it serves as a major importer of raw materials and commodities. The devaluation of the yuan further stoked investors’ concerns that emerging market economies would be unable to compete globally with cheaper Chinese exports. Within Europe, its Central Bank continued to provide steady stimulus actions aimed at promoting a weaker currency to support European exporters. Despite markets moving precipitously lower in the third quarter, economic data for the continent showed significant growth and global markets rebounded by the end of 2015.
The first quarter of 2016 was characterized by strong market movements caused by a combination of macroeconomic concerns. Investors worried about slowing global growth, the direction in the price of oil, declining growth in the U.S. and the possibility of a recession from poor holiday retail sales and lagging consumer confidence. The pessimism dominated most of the first half of the quarter with 2015’s best performing stocks selling off. As the quarter progressed, a turnaround in oil prices, positive U.S. economic indicators – including labor force participation and employment data – along with renewed confidence in the U.S. and European capital markets helped support an extended market rally.
The second quarter of 2016 began with a continuation of the recoveries that started after oil prices bottomed in February 2016. Cyclical, commodity-driven stocks within the Energy sector and metals and mining industries outperformed. Yield-oriented stocks also began the quarter stronger as declining sovereign interest rates within the developed markets (with some rates moving into negative territory) shifted investor attention to dividend-paying equities. There was a shift in the markets between April and May as investors eventually preferred higher quality stocks rather than deep cyclical, higher beta (a measure of an asset’s risk relative to the broader market) and lower quality stocks. In May, global capital markets began to behave in a more typical fashion as stock prices followed earnings, and strong fundamentals were the key determinants of those earnings. Global markets also began to reward companies that had ongoing expansion stories that produced cash flow. In June, the market was very mixed, exhibiting an almost indiscriminate bias in what was being rewarded. This was a reflection of the market place as commodity prices diverged while a myriad of political events occurred including the vote by the United Kingdom (U.K.) to leave the European Union (EU)(Brexit), the second-round elections in Spain and early positioning for general elections in the U.S., France and Germany. Late in the quarter, equity markets
Management's Discussion of Fund Performance (Unaudited) (Continued)
were volatile and mixed leading up to, and following Brexit. This quickly extended to other markets as investors grew concerned about a renewed slowdown in global trade and a downtick in credit quality.
Portfolio Review
Regionally, stock selection within Continental Europe contributed the most to Fund performance, while stock selection within Japan and the U.K. detracted. Stock selection within Canada and Pacific ex-Japan also detracted from returns. Individual stock selection benefited the Fund within the Consumer Staples and Financials sectors. However, overall stock selection was broadly negative across other sectors as a result of the stocks in the portfolio being out of favor for much of the period, and for the majority of the first half of 2016 in particular.
Among the individual stocks that contributed to performance during the period were Fastighets Balder AB (Financials sector), SalMar ASA, Pola Orbis Holdings Inc. (both from the Consumer Staples sector) and Recordati SpA (Health Care sector). Fastighets Balder owns and manages commercial and residential properties in Sweden. The company also operates in Helsinki and Copenhagen, as well as in the attractive Stockholm and Gothenburg markets. Fastighets Balder outperformed following a significant uptick in the third quarter of 2015. The company consistently reported stronger than expected earnings growth and expanded its valuation multiples as the quality of its portfolio improved over time. In addition, the company’s Copenhagen rental apartment portfolio increased, which also benefited the stock. SalMar is a Norway-based producer and distributor of seafood, primarily salmon and trout. The company benefited from favorable market conditions for salmon production, as supply from Chilean salmon producers came under pressure due to disease and overfarming. Consequently, this created strong demand for SalMar’s products along with an attractive pricing environment. The company also reported stronger than expected results in the first quarter of 2016, which was a catalyst to the stock’s price increase during the second quarter. Pola Orbis Holdings, a Japan-based cosmetics company, outperformed as a result of its long-running sales force conversion from direct sales to fashion retailing, as well as its strong new lineup of premium-range products. Recordati, an Italy-based pharmaceutical company, reported strong first quarter 2016 earnings and an accretive acquisition of the company Italchimici SpA, which focuses on gastrointestinal and food supplement products. The acquisition is expected to bolster Recordati’s scale in Western Europe and strengthen its portfolio of over-the-counter products.
Among the individual stocks that detracted from Fund performance were Virgin Money Holdings (U.K.) PLC, Aldermore Group PLC (both from the Financials sector), Spotless Group Holdings Ltd. and Minebea Co. Ltd. (both from the Industrials sector). Virgin Money Holdings is a U.K.-based retail-only bank, primarily focused on providing residential mortgages, savings and credit cards. The stock declined after the Brexit vote and investors grew concerned that financing new properties and consumer spending would slow as a result of businesses and employees leaving the U.K. market over the next few years. Spotless Group Holdings is an Australia-based provider of outsourced facility services including laundry and linens, catering and food management, and facilities management for customers in the healthcare, education, government, commercial and leisure segments. In December 2015, the company released an update that lowered its profit growth, citing slower than expected new-business wins and delayed benefits from an acquisition integration. Aldermore Group is a U.K.-based company that offers banking services and residential mortgages to small- and medium-sized entities and customers. The stock was sold prior to the Brexit vote, but the company had already come under pressure in late 2015 following the announcement of an increase in a stamp duty in the U.K. Minebea Co. is a Japan-based manufacturer of high-precision ball bearings for the information technology, telecommunications, aerospace, automotive and home appliance industries. Although Minebea’s operating profit increased, the company missed sales guidance in its smartphone LED backlights segment, which led to a decline in the stock during the third quarter of 2015. The stock eventually was sold in favor of other opportunities.
Management's Discussion of Fund Performance (Unaudited) (Continued)
Outlook
We believe recent volatility in the marketplace has created buying opportunities for the Fund. The market’s initial response to Brexit was one of extreme caution due to concerns about continued global expansion. While those concerns appear to have eased, we believe weakness in the British pound created investment opportunities. A lower British pound should benefit some exporters both in terms of transactions and in the translation of reported results. In fact, several U.K.-based companies that we have been analyzing have become even more attractive because of the lower pound.
Similarly, the cooperative efforts of the U.S. Federal Reserve Board (Fed), and further stimulus packages by the Bank of England, European Central Bank and Bank of Japan/Ministry of Finance have presented new areas in which to find international suppliers who can benefit from U.S. consumer demand. Going forward, we believe small- and mid-sized entrepreneurial companies can thrive in an environment where end-demand is supplied by niche companies that have access to ample low-cost capital. Finally, within emerging markets, we have continued to find opportunities in high quality, attractively valued companies that have been overlooked. Furthermore, we believe emerging markets should continue to benefit as country balance sheets improve and global interest rates remain low, further stimulating spending within the home markets.
Management's Discussion of Fund Performance (Unaudited) (Continued)
Comparison of the Change in Value of a $10,000 Investment in the Touchstone International Small Cap Fund - Class A* and the S&P Developed Ex-U.S. Small Cap Index
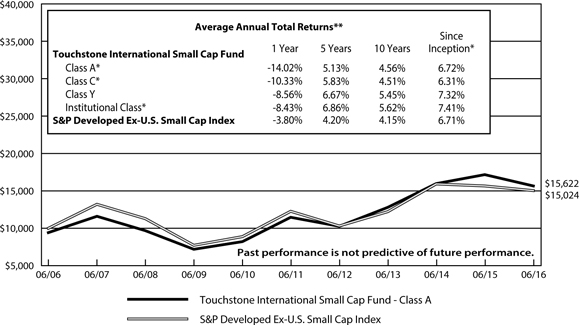
| * | The chart above represents performance of Class A shares only, which will vary from the performance of Class C shares, Class Y shares and Institutional Class shares based on the differences in sales loads and fees paid by shareholders in the different classes. The inception date of Class A shares, Class C shares, Class Y shares and Institutional Class shares was July 31, 2003, April 12, 2012, December 31, 1996 and December 20, 2006, respectively. Class A shares, Class C shares and Institutional Class shares performance was calculated using the historical performance of Class Y shares for the periods prior to July 31, 2003, April 12, 2012 and December 20, 2006, respectively. The returns have been restated for sales loads and fees applicable to Class A, Class C and Institutional Class shares. The returns of the index listed above are based on the inception date of the Fund. |
| ** | The average annual total returns shown above are adjusted for maximum sales loads and fees, if applicable. The maximum offering price per share of Class A shares is equal to the net asset value (“NAV”) per share plus a sales load equal to 6.10% of the NAV (or 5.75% of the offering price). Class C shares are subject to a contingent deferred sales charge (“CDSC”) of 1.00%. The CDSC will be assessed on an amount equal to the lesser of (1) the NAV at the time of purchase of the shares being redeemed or (2) the NAV of such shares being redeemed, if redeemed within a one-year period from date of purchase. Class Y shares and Institutional Class shares are not subject to sales charges. |
The performance of the above Fund does not reflect the deduction of taxes that a shareholder would pay on Fund distributions or the redemption of Fund shares.
Note to Chart
S&P Developed Ex-U.S. Small Cap Index is an unmanaged index of small-cap stocks from developed countries, excluding the United States.
Management's Discussion of Fund Performance (Unaudited)
Touchstone Large Cap Fund
Sub-Advised by The London Company
Investment Philosophy
The Touchstone Large Cap Fund seeks long-term capital growth by investing primarily in common stocks of large-cap U.S. listed companies. The Fund seeks to purchase financially stable large-cap companies that it believes are consistently generating high returns on unleveraged operating capital, run by shareholder-oriented management, and trading at a discount to the company’s respective private market values.
Fund Performance
The Touchstone Large Cap Fund (Class A Shares) underperformed its benchmark, the Russell 1000® Index, for the 12-month period ended June 30, 2016. The Fund’s total return was -0.92 percent (calculated excluding the maximum sales charge), while the benchmark’s total return was 2.93 percent.
Market Environment
For the trailing twelve months, volatility was consistent but the overall market was more or less range bound. Market leadership changed hands as well, as growth stocks outperformed value stocks during the first half of the period, while value outperformed growth during the second half. Economic developments were mixed but were generally more positive than negative. Global concerns also shifted during the period, as investors focused on oil prices, China’s economy, overall debt levels, and Great Britain’s vote to leave the European Union (Brexit). All in all, global gross domestic product (GDP) growth remained tepid and low interest rates helped keep equities in favor.
Investors’ search for income heightened during the period and, as a result, bond proxy stocks outperformed, as did equities within the Utilities and Telecommunication Services sectors. Low interest rates had a significant impact on the market, which included weak performance in the Financials sector and elevated multiples within mergers and acquisitions (M&A) due to cheap financing. During the period, companies that exhibited pricing power, strong free-cash-flow generation and even a small amount of top-line growth performed relatively well. Many out-of-favor securities also outperformed.
During the period, the benchmark was led higher by the Utilities, Telecommunication Services and Consumer Staples sectors, while the Energy, Health Care and Financials sectors detracted from performance. The largest impact to performance was the significant decline in the price of oil during 2015. In addition, pockets of the Health Care sector were weak and the Financials sector was hampered by persistently low interest rates.
Portfolio Review
The Fund’s sector allocation and stock selection both detracted from relative returns during the period. From a sector perspective, the Fund’s lack of exposure to the Utilities sector detracted the most, though the Fund’s overweight to the Industrials sector and underweight to the Health Care sector helped offset this to some degree. Stock selection within the Materials, Industrials and Consumer Discretionary sectors detracted from Fund performance, while stock selection within the Consumer Staples and Health Care sectors helped offset the decline.
Among the individual stocks that contributed to performance during the period were Altria Group Inc. (Consumer Staples sector), Alleghany Corp. (Financials sector), Visa Inc. (Information Technology sector), Dollar Tree Inc. and Lowe’s Cos. Inc. (both from the Consumer Discretionary sector). Altria Group, a cigarette and tobacco company, moved higher after posting solid results including market share gains and margin improvement. The company’s pricing power was evident in the tobacco industry, and Altria continued to return cash to shareholders via dividends and share repurchases. Late last year, Altria’s shares were boosted following the acquisition of
Management's Discussion of Fund Performance (Unaudited) (Continued)
SABMiller PLC, in which Altria owns an interest. Allegheny, a company that engages in the property and casualty, and surety insurance business, moved higher as the company continued to show steady improvement in returns and book value. We remain attracted to Alleghany’s conservative underwriting policy and its long-term investment philosophy. Visa, a payments technology company, posted solid growth in its credit card business. During the second half of 2015, the company acquired the remaining portion of Visa Europe, which we believe should be positive for the long term. In addition, the company recently announced a new share repurchase plan and raised its dividend. Going forward, we believe Visa’s long-term outlook is strong, and it should benefit from its brand and global scale. Dollar Tree, a discount variety store, continued to generate industry-leading operating margins at its legacy stores, and margins at its recently acquired Family Dollar Stores Inc. improved as well. We believe there is significant room for improvement at the acquired stores. Lowe’s, a home improvement retailer, continued to post strong results as growth in its same-store sales reflected a stable to improving U.S. housing market. As Lowe’s store base matures, the company has generated greater cash flow. Capital allocation was also strong as the company aggressively repurchased shares and increased its dividend.
Among the individual stocks that detracted from returns were CarMax Inc., Scripps Networks Interactive Inc. (both from the Consumer Discretionary sector), The Mosaic Co. (Materials sector), ConocoPhillips (Energy sector) and Deere & Co. (Industrials sector). CarMax underperformed despite strength in auto sales overall. CarMax is specifically focused on used car sales, which were negatively impacted by aggressive promotions for new cars. In addition, investors were concerned about weakness in subprime customers, which further weighed on the stock. We remain attracted to the company’s best-in-class stores, strong balance sheet and significant room for square footage growth. Scripps Networks Interactive is a developer of lifestyle content for television and the Internet. The stock sold off along with its competitors as some of them began reporting weaker advertising revenue. We sold the stock during the period after the company stopped its share repurchases in order to support the substantial debt it took on to finance an acquisition. Mosaic is a producer of concentrated phosphate and potash crop nutrients, and the stock struggled all year reflecting the weak agriculture environment. During this difficult period, the company maintained its discipline and matched production with demand. Longer term, we believe the fundamentals will improve. Meantime, the company maintained strong capital allocation and increased its dividend while reducing share count. ConocoPhillips, a producer of crude oil and natural gas, was negatively impacted by the ongoing weakness in the price of oil. We subsequently sold the Fund’s position. Deere is a manufacturer of agricultural, construction and forestry machinery. The stock’s decline reflected weakness in the agriculture market. As the economic situation for farmers has deteriorated, sales at Deere have declined. Longer term, we believe the environment will eventually improve and Deere will benefit from its strong brand and global distribution.
During the period, the Fund sold its positions in Corning Inc., Intel Corp., EMC Corp. Microsoft Corp., International Business Machines Corp. (all from the Information Technology sector), Apache Corp., ConocoPhillips (both from the Energy sector), Energizer Holdings Inc. (Consumer Staples sector), Scripps Networks Interactive Inc., Bed Bath & Beyond Inc. (both from the Consumer Discretionary sector) and Pfizer Inc. (Health Care sector).
The Fund initiated positions in O’Reilly Automotive Inc. (Consumer Discretionary sector), Progressive Corp. (Financials sector), Apple Inc. (Information Technology sector), Norfolk Southern Corp. and General Electric Co. (both from the Industrials sector). O’Reilly Automotive, a high-margin, high-quality auto parts retailer with a proven domestic franchise and business model, has successfully built a widespread, dual-market network that has supported its rapid market share increase. This approach has allowed it to build barriers to entry, increase sale productivity and generate significant amounts of cash that is returned to shareholders through share buybacks. Progressive specializes in insurance products primarily related to motor vehicles. Progressive’s strong brand and conservative underwriting philosophy give the company a wide moat in the volatile insurance market. Progressive also has a low-cost-structure business, giving the company the ability to generate strong returns in competitive
Management's Discussion of Fund Performance (Unaudited) (Continued)
markets. Further, the company has returned significant amounts of capital back to shareholders through its consistent dividend and share buyback program. Apple has generated high margins and returns on capital, driven by its ability to integrate hardware, software and services into differentiated devices such as the iPhone. Apple has a strong track record of innovation and limited downside. Norfolk Southern serves as a low-cost provider with a fuel-efficient form of freight transportation. We believe the company has depressed valuation, little downside risk and high barriers to entry, and thus we have high conviction in the stock. General Electric is a technology-driven industrial and financial services company that develops and manufactures products for the generation, transmission, distribution, control and utilization of electricity. We believe the company’s plan to create a simple, more valuable company by dramatically reducing the size of its financial services businesses will result in an increase in profitability, accountability and shareholder value.
Outlook
Based on recent economic news, it appears the U.S. economy is stable with low single-digit real GDP growth. The labor market continues to expand while housing and manufacturing are improving, and interest rates are expected to remain low for a long period. Further, global growth remains tepid but margins and returns on capital are stable and attractive.
Going forward, we believe that company-specific fundamentals will drive the market, thus lowering equity correlations and creating a tailwind for Fund holdings. Specifically, we believe the Fund’s downside risk is mitigated by the Fund’s focus on those companies with pricing power, copious cash generation and prudent capital allocation. We seek companies with strong returns on capital and the flexibility to enhance shareholder value using the balance sheet. We also expect investors to reward companies that wisely deploy capital, including higher dividends, share repurchases at attractive prices and M&A transactions. Looking ahead, we believe the Fund is positioned well for a slow growth environment that rewards strong capital appreciation.
Management's Discussion of Fund Performance (Unaudited) (Continued)
Comparison of the Change in Value of a $10,000 Investment in the Touchstone Large Cap Fund - Class A* and the Russell 1000® Index
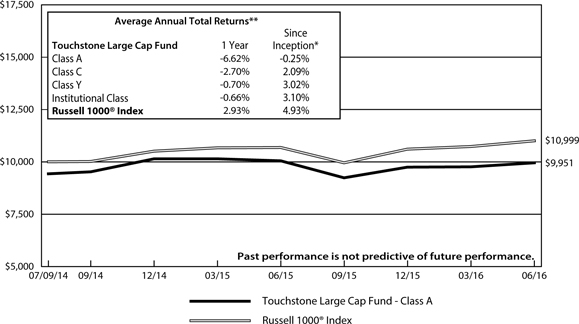
| * | The chart above represents performance of Class A shares only, which will vary from the performance of Class C shares, Class Y shares and Institutional Class shares based on the differences in sales loads and fees paid by shareholders in the different classes. The inception date of the Fund was July 9, 2014. The returns of the index listed above are based on the inception date of the Fund. |
| ** | The average annual total returns shown above are adjusted for maximum sales loads and fees, if applicable. The maximum offering price per share of Class A shares is equal to the net asset value (“NAV”) per share plus a sales load equal to 6.10% of the NAV (or 5.75% of the offering price). Class C shares are subject to a contingent deferred sales charge (“CDSC”) of 1.00%. The CDSC will be assessed on an amount equal to the lesser of (1) the NAV at the time of purchase of the shares being redeemed or (2) the NAV of such shares being redeemed, if redeemed within a one-year period from date of purchase. Class Y shares and Institutional Class shares are not subject to sales charges. |
The performance of the above Fund does not reflect the deduction of taxes that a shareholder would pay on Fund distributions or the redemption of Fund shares.
Note to Chart
Russell 1000® Index measures the performance of the 1,000 largest companies in the Russell 3000® Index.
The Frank Russell Company (FRC) is the source and owner of the data contained or reflected in this material and all trademarks and copyrights related thereto. The material may contain confidential information and unauthorized use, disclosure, copying, dissemination or redistribution is strictly prohibited. This is a Touchstone Investments presentation of the data, and FRC is not responsible for the formatting or configuration of this material or for any inaccuracy in the presentation thereof.
Management's Discussion of Fund Performance (Unaudited)
Touchstone Small Cap Value Opportunities Fund
Sub-Advised by Thompson, Siegel & Walmsley LLC
Investment Philosophy
The Fund seeks long-term capital growth by primarily investing in equity securities of small-cap companies believed to present a value or potential worth that is not recognized by prevailing market prices or that have experienced some fundamental changes and are intrinsically undervalued by the investment community. The sub-advisor uses a combination of quantitative and qualitative methods to assess the outlook for a company.
Fund Performance
The Touchstone Small Cap Value Opportunities Fund (Class A Shares) underperformed its benchmark, the Russell 2000® Value Index, for the 12-month period ended June 30, 2016. The Fund’s total return was -13.72 percent (calculated excluding the maximum sales charge), while the total return of the benchmark was -2.58 percent.
Market Environment
Overall, equity correlations and market volatility increased as periods of rising and falling commodity prices, high yield debt and global growth concerns overwhelmed the influence of individual company fundamentals. Investors were generally risk-averse, which was highlighted by the significant outperformance of large-cap stocks over their smaller cap counterparts. Within the small-cap stock market, as represented by the Russell 2000® Index, there was a wide-divergence of returns between market sectors. The Energy sector, despite recent strong performance, lagged during the period, while generally defensive sectors such as Utilities and Consumer Staples fared the best and ended the 12-month period with double-digit returns.
Portfolio Review
There were several market factors that influenced Fund performance during the period. First, the Fund was skewed toward smaller-cap stocks compared to the benchmark, and these smaller-cap stocks underperformed the larger end of the benchmark range as global growth fears brought on a flight to more liquid and larger-cap stocks. Second, the slowdown in capital markets activity and expectations for a continuation of the U.S. Federal Reserve Board’s low interest rate policy further impacted Fund performance during the period. Lastly, the market’s risk-off focus led the Fund to be considered cheap versus the benchmark.
The most significant detractors to relative Fund performance were stock selection and positioning within the Financials sector. In particular, the Fund was negatively impacted by its bank holdings that declined because of interest rate sensitivity to the lack of rising rates. Also detracting from Fund returns was an underweight exposure to real estate investment trusts (REITs). REITs were among the top performing industry groups due to investors’ appetite for dividend-yielding securities.
Conversely, stock selection within the Consumer Staples sector was a contributor to relative performance. The Fund’s Consumer Discretionary sector was a positive contributor to relative performance as good stock selection more than offset the headwind of exposure to the struggling sector. Specifically, the Fund’s positions in children’s retail, women’s fashion, and media and sports entertainment posted positive returns during the period.
Among the individual stocks that contributed to performance during the period were Anika Therapeutics Inc. (Health Care sector), TreeHouse Foods Inc. (Consumer Staples sector) and Green Dot Corp. (Financials sector). Anika Therapeutics, an orthopedic medicines company offering therapeutic pain management solutions, moved higher as a result of the company’s single-injection product to treat joint pain, MONOVISC®, which has grown rapidly and taken market share. TreeHouse Foods, a food manufacturer servicing primarily the retail grocery and foodservice channels, rallied due to optimism around market share gains in the company’s single-serve
Management's Discussion of Fund Performance (Unaudited) (Continued)
coffee business and accretion potential from the acquisition of ConAgra Foods Inc.’s private label operations. Green Dot is a provider of prepaid debit cards and reloading services as well as a provider of GoBank, an online bank. A rumored potential takeover by PayPal Holdings Inc., combined with the introduction of an activist shareholder with a plan for the company to double earnings by 2018, drove the stock materially higher.
Among the stocks that detracted from performance during the period were Cowen Group Inc. (Financials sector), Delek US Holdings Inc. (Energy sector) and Celadon Group (Industrials sector). Cowen Group provides alternative investment management, investment banking, research, sales and trading, and prime brokerage services. Cowen Group moved lower due to the marked drop-off in capital markets activity during the first half of the year, which saw an unusually large amount of delayed mergers and acquisitions (M&A) deals. Delek US Holdings, a diversified downstream energy company, moved lower due to a narrowing of refining spreads that contributed to a decline in profitability for refiners in general. Celadon Group, a truckload carrier, declined due to overall pressure within the trucking industry as freight volumes failed to meet expectations. While freight market conditions were challenged in the near term, Celadon’s young fleet compared to its peers and multiple growth drivers via recent acquisitions are expected to benefit the company over the long term.
Outlook
Equity correlations and market volatility were once again on the rise, as the more defensive and liquid stocks rallied during the period, with global growth concerns overwhelming the influence of individual company fundamentals. We believe the market’s recent infatuation with macro and short-term events should allow our longer term, valuation-driven process to uncover stocks that we believe have been unfairly punished. At the end of the period, Consumer Discretionary remains the sector with the Fund’s largest overweight position. This is a broadly diverse group where we continue to identify companies with opportunities to exploit certain consumer trends or that have compelling business initiatives. The Fund remains underweight to the Financials sector where we believe most REIT valuations continue to be unattractive and many banks are challenged by muted loan growth and slowing reserve releases. Going forward, we believe the Fund is positioned well due to its valuation discipline and focus on sustainability of cash flows and earnings growth.
Management's Discussion of Fund Performance (Unaudited) (Continued)
Comparison of the Change in Value of a $10,000 Investment in the Touchstone Small Cap Value Opportunities Fund - Class A* and the Russell 2000® Value Index
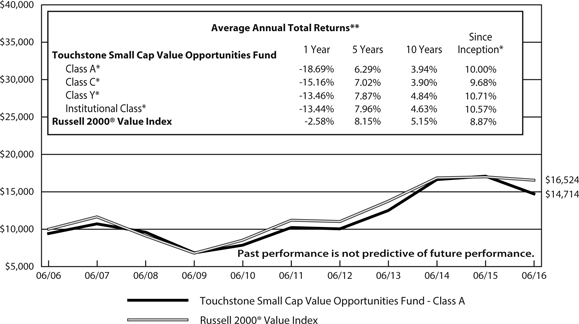
| * | The chart above represents performance of Class A shares only, which will vary from the performance of Class C shares, Class Y shares and Institutional Class shares based on the differences in sales loads and fees paid by shareholders in the different classes. The inception date of Class A shares, Class C shares, Class Y shares and Institutional Class shares was July 31, 2003, April 12, 2012, July 25, 2003 and December 9, 2008, respectively. Performance information presented prior to July 25, 2003 for Class Y shares includes performance of a predecessor fund whose inception date was July 31, 2000. Class A shares, Class C shares and Institutional Class shares performance was calculated using the historical performance of Class Y shares for periods prior to July 31, 2003, April 12, 2012 and December 9, 2008, respectively. The returns have been restated for sales loads and fees applicable to Class A, Class C and Institutional Class shares. The returns of the index listed above are based on the inception date of the Fund. |
| ** | The average annual total returns shown above are adjusted for maximum sales loads and fees, if applicable. The maximum offering price per share of Class A shares is equal to the net asset value (“NAV”) per share plus a sales load equal to 6.10% of the NAV (or 5.75% of the offering price). Class C shares are subject to a contingent deferred sales charge (“CDSC”) of 1.00%. The CDSC will be assessed on an amount equal to the lesser of (1) the NAV at the time of purchase of the shares being redeemed or (2) the NAV of such shares being redeemed, if redeemed within a one-year period from date of purchase. Class Y shares and Institutional Class shares are not subject to sales charges. |
The performance of the above Fund does not reflect the deduction of taxes that a shareholder would pay on Fund distributions or the redemption of Fund shares.
Note to Chart
Russell 2000® Value Index measures the performance of those Russell 2000 companies with lower price-to-book ratios and lower forecasted growth values.
The Frank Russell Company (FRC) is the source and owner of the data contained or reflected in this material and all trademarks and copyrights related thereto. The material may contain confidential information and unauthorized use, disclosure, copying, dissemination or redistribution is strictly prohibited. This is a Touchstone Investments presentation of the data, and FRC is not responsible for the formatting or configuration of this material or for any inaccuracy in the presentation thereof.
Management's Discussion of Fund Performance (Unaudited)
Touchstone Value Fund
Sub-Advised by Barrow, Hanley, Mewhinney & Strauss LLC
Investment Philosophy
The Touchstone Value Fund seeks long-term capital growth by primarily investing in equity securities of large- and mid-cap companies believed to be undervalued. The Fund uses traditional methods of stock selection – research and analysis – to identify companies that have price-to-earnings and price-to-book ratios below the market, that also have above-average dividend yields, and that focus on companies that are out of favor due to internal or external challenges judged to be short-term in nature. Stock selection is driven by fundamental analysis on individual companies rather than by broad market themes.
Fund Performance
The Touchstone Value Fund (Class A Shares) underperformed its benchmark, the Russell 1000® Value Index, for the 12-month period ended June 30, 2016. The Fund’s total return was -0.89 percent (calculated excluding the maximum sales charge), while the total return of the benchmark was 2.86 percent.
Market Environment
There is an old adage that “the market will do what confounds the most.” That has certainly been true, as investors’ expectations about interest rates, bond yields, oil prices, central banks and the European Union (EU), have all been upended. During the period, interest rates were pushed to record lows around the globe with much of the world’s sovereign debt now offering negative yields. Though expectations for U.S. interest rate hikes in 2016 have faded, we believe U.S. yields continue to offer a meaningful premium to the rest of the world, driving higher the demand for U.S. dollar-denominated bonds. In the face of such low absolute levels of yields, investors are desperately searching for higher income. Within U.S. equity markets, this means that investors have bid up those stocks perceived as bond proxies in sectors such as Utilities, Telecommunication Services, Consumer Staples and real estate investment trusts (REITs). Admittedly, they provide relatively high current dividend income, but many of the stocks in these sectors also trade at historically high valuations. Though the perceived safety of these stocks has become commonly accepted wisdom in the markets, we believe that the extended valuations may pose a heightened risk for investors going forward.
Portfolio Review
During the 12-month period, the Fund’s positioning in the Consumer Staples, Health Care and Telecommunication Services sectors were the largest contributors to relative performance, while the Financials sector was the leading detractor. An underweight to the (in our view) overpriced Utilities sector also detracted meaningfully from relative returns.
The decision to own stocks within the Financials sector and, more specifically bank stocks, was primarily driven by the record low valuations coming out of the 2008 financial crisis. However, the success of the Fund’s investments relied heavily on a few main drivers: higher interest rates, credit costs remaining low, declining expenses, improving capital returns and an eventual resumption in the growth of loans. While the latter four drivers played out largely as we expected, interest rates have remained at historically low levels. As a result, financial companies such as banks saw their primary revenue source – the spread they earn between loans and deposits – face a meaningful headwind.
In past economic cycles, growth following a recession reached strong enough levels that the U.S. Federal Reserve Board (Fed) committed to raising short-term interest rates to prevent inflation and general overheating of the economy. However, thus far in this economic cycle, the Fed has raised rates only once. In our view, global growth concerns have limited the Fed’s ability to return to a more traditional interest rate policy.
Management's Discussion of Fund Performance (Unaudited) (Continued)
While the Fund’s investment thesis has been delayed by unintended consequences, the valuations of many stocks that would benefit from higher interest rates have fallen to extremes. While a minor earnings revision is underway from the expected delay in Fed interest rate hikes, we do not believe earnings are on the cusp of major downward revisions. Outside of interest rates, we believe trends in credit, capital expense and loan growth remain favorable for Financials. While the past several years have been painful for investors in many Financials stocks, we feel they are now deeply discounted relative to the market and their history, offering opportunities for patient value investors.
Among the individual stocks that contributed to performance during the period were Altria Group Inc., Philip Morris International Inc. (both from the Consumer Staples sector) and Verizon Communications Inc. (from the Telecommunication Services sector). Tobacco and cigarette maker Altria Group was a strong performer during the year and added to the Fund’s relative performance. Whereas cigarette unit consumption has been steadily declining in recent years, the trends have become more positive over the past 12 months. Relatively lower gasoline prices have put more spending money into the pockets of consumers, who spent the savings on products such as cigarettes. Some consumers upgraded to premium-priced products such as Altria’s Marlboro family of brands, allowing Marlboro to continue to gain market share. Pricing continues to be rational as all three major domestic tobacco companies have supported price increases and are enjoying an expanded profit pool. The combination of stable cigarette consumption, positive pricing trends and a significantly above-average and rising cash dividend all supported Altria’s outperformance. Tobacco and cigarette maker Philip Morris International outperformed meaningfully over the past year as many of its principal markets, such as Europe, Australia and the Philippines, have stabilized. The company also gained market share in challenged geographic areas like Russia as a result of the momentum of its Marlboro (Altria sells Marlboro branded cigarettes within the U.S., while Philip Morris International sells Marlboro cigarettes overseas) and Parliament brands and its ability to raise profits through price increases. Though Philip Morris was hit hard by the strong U.S. dollar in recent years since all of its earnings are derived outside the United States, a weakening dollar towards the latter part of the first quarter in 2016 was a positive for the stock. Further, Philip Morris’ “heat-not-burn” cigarette innovation, iQOS, has achieved strong share gains in Japan, and the company expects to expand its iQOS business in Switzerland and enter six additional international markets. Verizon Communications Inc., a wireless communications service provider, posted a strong year of performance after having been weighed down by price war concerns in the domestic wireless business. However, the company has continued to invest in its networks and, relative to lower-cost competitors, achieved favorable results in third-party quality tests. The stock still trades at a discount to historical relative valuations and provides good yield support through its dividend.
Among the stocks that detracted from performance were Capital One Financial Corp., State Street Corp. and American Express Co. (all three from the Financials sector). Capital One Financial is a mix between a credit card company and a regional bank, and underperformed during the 12-month period in sympathy with private-label credit card company Synchrony Financial. In mid-June, shares of Synchrony Financial sold off after the company announced that credit losses would increase by approximately five percent over the next 12 months. The announcement heightened investors’ fears about a broader turn in consumer credit, which impacted Capital One given its exposure to subprime consumer borrowers. We believe the news was specific to Synchrony, which was supported by Capital One’s management recently re-confirming its 2016 net charge-off guidance. In addition, May 2016 delinquency data, which is generally viewed as a leading indicator for credit trends, continued to show positive developments. We continue to find Capital One’s shares attractive, trading at less than next year’s earnings. State Street is an institutional asset manager and provider of asset servicing solutions. Given its business model, State Street moved lower due to global growth concerns, as the company has an outsized international exposure relative to its peers. At current valuations, State Street trades more cheaply than a regional bank, despite taking much less balance sheet risk and having better growth prospects and higher returns. American Express also sold off during the year, and remained weak after the announcement that its branded partnership with Costco
Management's Discussion of Fund Performance (Unaudited) (Continued)
Wholesale Corp. would end. The company has committed toward working to offset the Costco loss with expense reductions and growth in its remaining loan book. We remain positive on the stock, which trades at a below-market multiple of next year’s earnings, despite a better-than-average business profile.
Outlook
The past several years have been dominated by global growth concerns, such as Greece’s default, China’s economic slowdown and, most recently, Brexit (Britain’s exit from the EU). The response from central bankers around the globe has consistently been to push interest rates to record lows in an effort to move investors out of the risk spectrum, hoping to generate risk taking and economic growth. Despite the extraordinary measures taken, investors have remained risk averse, crowding into the modest yields of U.S. Treasuries or many bond proxies in the equity market. We believe central banks have, in many cases, exacerbated the problem by buying the same bonds as the rest of the crowd, pushing rates to artificially low levels. As is often the case, these conditions have persisted long enough that the consensus has come to view this as the “new normal.” Such consensus thinking is reflected in the yield curve of the bond market, which is projecting slow growth going forward. Given these market expectations, we believe that a focus on fundamentals and valuations is key. Our active, fundamental value process is designed to avoid overvalued areas of the market and focus on companies with both improving fundamentals and the cash flow to support a continued dividend. We believe that this philosophy will benefit fund shareholders in the uncertain market environment ahead.
Dividend-paying investments may not experience the same price appreciation as non-dividend paying instruments, dividend-issuing companies may choose not to pay a dividend, or the dividend may be less than what is anticipated.
Management's Discussion of Fund Performance (Unaudited) (Continued)
Comparison of the Change in Value of a $10,000 Investment in the Touchstone Value Fund - Class A* and the Russell 1000® Value Index
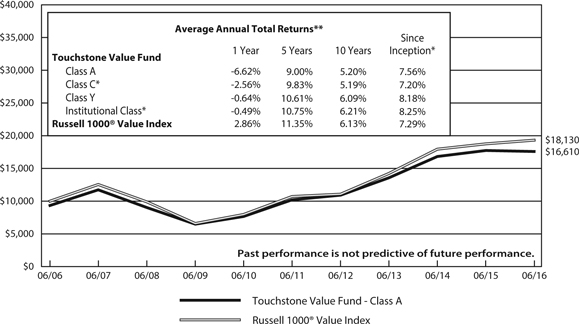
| * | The chart above represents performance of Class A shares only, which will vary from the performance of Class C shares, Class Y shares and Institutional Class shares based on the differences in sales loads and fees paid by shareholders in the different classes. The inception date of Class A shares, Class C shares, Class Y shares and Institutional Class shares was July 31, 2003, April 12, 2012, September 10, 1998 and December 20, 2006, respectively. Class A shares, Class C shares and Institutional Class shares performance was calculated using the historical performance of Class Y shares for the periods prior to July 31, 2003, April 12, 2012 and December 20, 2006, respectively. The returns have been restated for sales loads and fees applicable to Class A, Class C and Institutional Class shares. The returns of the index listed above are based on the inception date of the Fund. |
| ** | The average annual total returns shown above are adjusted for maximum sales loads and fees, if applicable. The maximum offering price per share of Class A shares is equal to the net asset value (“NAV”) per share plus a sales load equal to 6.10% of the NAV (or 5.75% of the offering price). Class C shares are subject to a contingent deferred sales charge (“CDSC”) of 1.00%. The CDSC will be assessed on an amount equal to the lesser of (1) the NAV at the time of purchase of the shares being redeemed or (2) the NAV of such shares being redeemed, if redeemed within a one-year period from date of purchase. Class Y shares and Institutional Class shares are not subject to sales charges. |
The performance of the above Fund does not reflect the deduction of taxes that a shareholder would pay on Fund distributions or the redemption of Fund shares.
Note to Chart
Russell 1000® Value Index measures those Russell 1000 companies with lower price-to-book ratios and lower expected growth values.
The Frank Russell Company (FRC) is the source and owner of the data contained or reflected in this material and all trademarks and copyrights related thereto. The material may contain confidential information and unauthorized use, disclosure, copying, dissemination or redistribution is strictly prohibited. This is a Touchstone Investments presentation of the data, and FRC is not responsible for the formatting or configuration of this material or for any inaccuracy in the presentation thereof.
Tabular Presentation of Portfolios of Investments (Unaudited)
June 30, 2016
The tables below provide each Fund’s geographic allocation, credit quality or sector allocation. We hope it will be useful to shareholders as it summarizes key information about each Fund’s investments.
| Touchstone Credit Opportunities Fund | | | |
| Credit Quality* | | (% of Fixed Income Securities) | |
| BBB/Baa | | | 8.4 | % |
| BB/Ba | | | 49.1 | |
| B/B | | | 34.4 | |
| CCC | | | 2.6 | |
| CC | | | 0.1 | |
| C or Lower | | | 0.4 | |
| Not Rated | | | 5.0 | |
| | | | 100.0 | % |
| Sector Allocation** | | (% of Net Assets) | |
| Long Positions | | | | |
| Corporate Bonds | | | | |
| Consumer Discretionary | | | 19.5 | % |
| Telecommunications Services | | | 11.0 | |
| Health Care | | | 8.9 | |
| Energy | | | 8.4 | |
| Information Technology | | | 6.2 | |
| Industrials | | | 5.1 | |
| Materials | | | 4.0 | |
| Financials | | | 2.8 | |
| Consumer Staples | | | 1.5 | |
| Utilities | | | 0.3 | |
| Bank Loans | | | 24.1 | |
| Asset-Backed Securities | | | 3.9 | |
| Common Stock | | | 0.1 | |
| Purchased Call Options | | | 0.0 | |
| Investment Funds | | | 0.9 | |
| Other Assets/Liabilities (Net) | | | 4.7 | |
| | | | 101.4 | % |
| Short Positions | | | | |
| Corporate Bonds | | | (1.3 | ) |
| Common Stock | | | (0.1 | ) |
| Total | | | 100.0 | % |
| Touchstone International Small Cap Fund | | | |
| Geographic Allocation | | (% of Net Assets) | |
| Common Stocks | | | | |
| Japan | | | 22.9 | % |
| United Kingdom | | | 10.7 | |
| Sweden | | | 8.3 | |
| Canada | | | 7.8 | |
| France | | | 5.9 | |
| Australia | | | 4.2 | |
| Italy | | | 3.7 | |
| Germany | | | 3.6 | |
| Ireland | | | 3.4 | |
| South Korea | | | 3.1 | |
| Luxembourg | | | 2.3 | |
| Denmark | | | 2.1 | |
| New Zealand | | | 1.8 | |
| Austria | | | 1.6 | |
| Switzerland | | | 1.4 | |
| Isle of Man | | | 1.3 | |
| Bermuda | | | 1.2 | |
| Singapore | | | 1.2 | |
| Jersey | | | 1.1 | |
| Norway | | | 1.0 | |
| Finland | | | 1.0 | |
| Faroe Island | | | 0.9 | |
| Taiwan | | | 0.9 | |
| Thailand | | | 0.9 | |
| Portugal | | | 0.7 | |
| Netherlands | | | 0.6 | |
| Cayman Islands | | | 0.6 | |
| Exchange Traded Fund | | | 2.0 | |
| Investment Funds | | | 8.7 | |
| Other Assets/Liabilities (Net) | | | (4.9 | ) |
| Total | | | 100.0 | % |
| * | Credit quality ratings are from Standard & Poor's (“S&P”) and Moody's Investors Service (“Moody's”). If agency ratings differ, the higher rating will be used. Where no rating has been assigned, it may be for reasons unrelated to the creditworthiness of the issuer. |
| ** | Sector classifications are based upon the Global Industry Classification Standard (GICS®). |
Tabular Presentation of Portfolios of Investments (Unaudited) (Continued)
| Touchstone Large Cap Fund | | | |
| Sector Allocation* | | (% of Net Assets) | |
| Financials | | | 23.9 | % |
| Consumer Discretionary | | | 20.8 | |
| Industrials | | | 15.4 | |
| Information Technology | | | 11.2 | |
| Consumer Staples | | | 10.1 | |
| Health Care | | | 7.5 | |
| Materials | | | 5.3 | |
| Energy | | | 2.6 | |
| Telecommunication Services | | | 2.3 | |
| Investment Funds | | | 4.0 | |
| Other Assets/Liabilities (Net) | | | (3.1 | ) |
| Total | | | 100.0 | % |
| Touchstone Small Cap Value Opportunities Fund | | | |
| Sector Allocation* | | (% of Net Assets) | |
| Financials | | | 35.4 | % |
| Consumer Discretionary | | | 15.5 | |
| Industrials | | | 12.5 | |
| Information Technology | | | 7.7 | |
| Health Care | | | 6.6 | |
| Utilities | | | 6.2 | |
| Materials | | | 4.2 | |
| Consumer Staples | | | 4.1 | |
| Energy | | | 3.9 | |
| Telecommunication Services | | | 2.6 | |
| Investment Funds | | | 11.2 | |
| Other Assets/Liabilities (Net) | | | (9.9 | ) |
| Total | | | 100.0 | % |
| Touchstone Value Fund | | | |
| Sector Allocation* | | (% of Net Assets) | |
| Healthcare | | | 24.3 | % |
| Financials | | | 19.9 | |
| Energy | | | 12.1 | |
| Information Technology | | | 11.6 | |
| Industrials | | | 10.0 | |
| Consumer Staples | | | 5.6 | |
| Consumer Discretionary | | | 5.3 | |
| Materials | | | 5.1 | |
| Telecommunications Services | | | 4.6 | |
| Utilities | | | 0.9 | |
| Investment Funds | | | 0.9 | |
| Other Assets/Liabilities (Net) | | | (0.3 | ) |
| Total | | | 100.0 | % |
* Sector classifications are based upon the Global Industry Classification Standard (GICS®).
Portfolio of Investments
Touchstone Credit Opportunities Fund – June 30, 2016
| Principal | | | | | Market | |
| Amount(A) | | | | | Value | |
| | | | | | | | | |
| | | | | Corporate Bonds — 67.7% | | | | |
| | | | | | | | | |
| | | | | Consumer Discretionary — 19.5% | | | | |
| $ | 530,000 | | | Altice Luxembourg SA (Luxembourg), 144a, 7.750% 5/15/22 | | $ | 535,300 | |
| | 300,000 | | | AMC Entertainment, Inc. 5.875% 2/15/22(B) | | | 301,500 | |
| | 62,000 | | | AMC Networks, Inc. 5.000% 4/1/24 | | | 61,372 | |
| | 300,000 | | | American Builders & Contractors Supply Co., Inc., 144a, 5.625% 4/15/21 | | | 309,750 | |
| | 500,000 | | | Ashtead Capital, Inc., 144a, 6.500% 7/15/22 | | | 520,310 | |
| | 165,000 | | | Boyd Gaming Corp., 144a, 6.375% 4/1/26 | | | 172,425 | |
| | 300,000 | | | Cablevision Systems Corp. 5.875% 9/15/22 | | | 268,800 | |
| | 300,000 | | | CCO Holdings LLC / CCO Holdings Capital Corp. 5.125% 2/15/23 | | | 304,653 | |
| | 600,000 | | | Cedar Fair LP / Canada's Wonderland Co. / Magnum Management Corp. 5.375% 6/1/24 | | | 618,000 | |
| | 300,000 | | | Cinemark USA, Inc. 4.875% 6/1/23 | | | 297,000 | |
| | 439,000 | | | ClubCorp Club Operations, Inc., 144a, 8.250% 12/15/23 | | | 436,805 | |
| | 100,000 | | | CSC Holdings LLC 5.250% 6/1/24 | | | 91,000 | |
| | 600,000 | | | Dollar Tree, Inc., 144a, 5.750% 3/1/23(B) | | | 637,500 | |
| | 48,000 | | | JC Penney Corp., Inc., 144a, 5.875% 7/1/23 | | | 48,300 | |
| | 575,000 | | | L Brands, Inc. 6.875% 11/1/35 | | | 582,188 | |
| | 300,000 | | | Lamar Media Corp. 5.375% 1/15/24(B) | | | 310,500 | |
| | 100,000 | | | Lamar Media Corp., 144a, 5.750% 2/1/26 | | | 104,063 | |
| | 80,000 | | | MGM Growth Properties Operating Partnership LP / MGP Escrow Co.-Issuer, Inc., 144a, 5.625% 5/1/24 | | | 84,600 | |
| | 250,000 | | | MGM Resorts International 6.625% 12/15/21 | | | 271,875 | |
| | 800,000 | | | Numericable-SFR SAS (France), 144a, 6.250% 5/15/24 | | | 765,000 | |
| | 140,000 | | | Pinnacle Entertainment, Inc., 144a, 5.625% 5/1/24 | | | 139,650 | |
| | 533,000 | | | Reynolds Group Issuer, Inc. / Reynolds Group Issuer LLC / Reynolds Group Issuer Lu 5.750% 10/15/20 | | | 550,322 | |
| | 555,000 | | | Sabre GLBL, Inc., 144a, 5.250% 11/15/23 | | | 564,712 | |
| | 125,000 | | | Sally Holdings LLC / Sally Capital, Inc. 5.625% 12/1/25 | | | 130,938 | |
| | 300,000 | | | Sally Holdings LLC / Sally Capital, Inc. 5.750% 6/1/22 | | | 310,875 | |
| | 600,000 | | | Seminole Hard Rock Entertainment, Inc. / Seminole Hard Rock International LLC, 144a, 5.875% 5/15/21 | | | 601,500 | |
| | 300,000 | | | Sinclair Television Group, Inc., 144a, 5.625% 8/1/24 | | | 306,750 | |
| | 125,000 | | | Sinclair Television Group, Inc., 144a, 5.875% 3/15/26 | | | 127,500 | |
| | 325,000 | | | Sirius XM Radio, Inc., 144a, 4.625% 5/15/23 | | | 315,276 | |
| | 300,000 | | | Six Flags Entertainment Corp., 144a, 5.250% 1/15/21 | | | 309,375 | |
| | 300,000 | | | Virgin Media Secured Finance PLC (United Kingdom), 144a, 5.250% 1/15/26 | | | 290,250 | |
| | 250,000 | | | Ziggo Bond Finance BV (Netherlands), 144a, 5.875% 1/15/25 | | | 241,250 | |
| | | | | | | | 10,609,339 | |
| | | | | | | | | |
| | | | | Telecommunication Services — 11.0% | | | | |
| | 500,000 | | | Altice US Finance I Corp., 144a, 5.375% 7/15/23 | | | 496,250 | |
| | 97,000 | | | CenturyLink, Inc. 5.625% 4/1/20 | | | 100,638 | |
| | 400,000 | | | CenturyLink, Inc. 5.625% 4/1/25 | | | 356,000 | |
| | 575,000 | | | Charter Communications Operating LLC / Charter Communications Operating Capital, 144a, 4.908% 7/23/25(B) | | | 628,649 | |
| | 151,000 | | | CommScope, Inc., 144a, 5.500% 6/15/24 | | | 153,265 | |
| | 300,000 | | | Digicel Group Ltd. (Bermuda), 144a, 8.250% 9/30/20 | | | 250,500 | |
| | 500,000 | | | Digicel Ltd. (Bermuda), 144a, 6.000% 4/15/21 | | | 428,600 | |
| | 210,000 | | | Frontier Communications Corp. 11.000% 9/15/25 | | | 217,350 | |
| | 642,000 | | | Inmarsat Finance PLC (United Kingdom), 144a, 4.875% 5/15/22 | | | 585,825 | |
| | 50,000 | | | Intelsat Jackson Holdings SA (Luxembourg) 5.500% 8/1/23 | | | 31,750 | |
| | 60,000 | | | Intelsat Jackson Holdings SA (Luxembourg), 144a, 8.000% 2/15/24 | | | 59,100 | |
| | 500,000 | | | Level 3 Financing, Inc. 5.375% 1/15/24 | | | 501,875 | |
| | 300,000 | | | Level 3 Financing, Inc. 5.375% 5/1/25 | | | 297,750 | |
| | 100,000 | | | Neptune Finco Corp., 144a, 6.625% 10/15/25 | | | 105,000 | |
| | 335,000 | | | NeuStar, Inc. 4.500% 1/15/23 | | | 301,500 | |
| | 300,000 | | | Sprint Corp. 7.625% 2/15/25 | | | 237,375 | |
| | 500,000 | | | T-Mobile USA, Inc. 6.375% 3/1/25 | | | 522,500 | |
| | 88,000 | | | Townsquare Media, Inc., 144a, 6.500% 4/1/23 | | | 87,010 | |
| | 300,000 | | | Univision Communications, Inc., 144a, 5.125% 2/15/25 | | | 296,625 | |
| | 148,000 | | | Univision Communications, Inc., 144a, 8.500% 5/15/21 | | | 154,660 | |
| | 95,000 | | | Videotron Ltd., (Canada), 144a, 5.375% 6/15/24 | | | 96,425 | |
| | 110,000 | | | West Corp., 144a, 5.375% 7/15/22 | | | 102,300 | |
| | | | | | | | 6,010,947 | |
| | | | | | | | | |
| | | | | Health Care — 8.9% | | | | |
| | 441,000 | | | Acadia Healthcare Co., Inc. 5.625% 2/15/23 | | | 432,180 | |
| | 130,000 | | | Centene Corp., 144a, 5.625% 2/15/21 | | | 135,525 | |
Touchstone Credit Opportunities Fund (Continued)
| Principal | | | | | Market | |
| Amount(A) | | | | | Value | |
| | | | | | | |
| | | | | Corporate Bonds — 67.7% (Continued) | | | | |
| | | | | | | | | |
| | | | | Health Care — (Continued) | | | | |
| $ | 130,000 | | | Centene Corp., 144a, 6.125% 2/15/24 | | $ | 138,206 | |
| | 100,000 | | | DaVita HealthCare Partners, Inc. 5.000% 5/1/25 | | | 99,125 | |
| | 800,000 | | | DaVita HealthCare Partners, Inc. 5.125% 7/15/24 | | | 808,880 | |
| | 300,000 | | | Fresenius US Finance II, Inc., 144a, 4.500% 1/15/23 | | | 306,750 | |
| | 600,000 | | | Grifols Worldwide Operations Ltd. (Ireland) 5.250% 4/1/22 | | | 610,500 | |
| | 114,000 | | | HCA, Inc. 5.375% 2/1/25 | | | 116,850 | |
| | 620,000 | | | HealthSouth Corp. 5.750% 9/15/25 | | | 613,800 | |
| | 300,000 | | | Kinetic Concepts, Inc. / KCI USA Inc., 144a, 7.875% 2/15/21 | | | 318,936 | |
| | 500,000 | | | LifePoint Health, Inc. 5.500% 12/1/21 | | | 521,250 | |
| | 150,000 | | | Mallinckrodt International Finance SA (Luxembourg) 4.750% 4/15/23 | | | 121,500 | |
| | 100,000 | | | Mallinckrodt International Finance SA / Mallinckrodt CB LLC (Luxembourg), 144a, 5.500% 4/15/25 | | | 89,212 | |
| | 300,000 | | | Mallinckrodt International Finance SA / Mallinckrodt CB LLC (Luxembourg), 144a, 5.625% 10/15/23 | | | 279,375 | |
| | 315,000 | | | Valeant Pharmaceuticals International, Inc. (Canada), 144a, 6.125% 4/15/25 | | | 252,788 | |
| | | | | | | | 4,844,877 | |
| | | | | | | | | |
| | | | | Energy — 8.4% | | | | |
| | 214,000 | | | California Resources Corp., 144a, 8.000% 12/15/22 | | | 151,940 | |
| | 80,000 | | | Chesapeake Energy Corp., 144a, 8.000% 12/15/22 | | | 67,800 | |
| | 198,000 | | | Continental Resources, Inc. OK 4.500% 4/15/23 | | | 184,635 | |
| | 110,000 | | | Continental Resources, Inc. OK 5.000% 9/15/22 | | | 107,525 | |
| | 250,000 | | | Energy Transfer Equity LP 5.500% 6/1/27 | | | 235,000 | |
| | 500,000 | | | Genesis Energy LP / Genesis Energy Finance Corp. 6.000% 5/15/23 | | | 467,500 | |
| | 400,000 | | | Halcon Resources Corp., 144a, 8.625% 2/1/20 | | | 377,248 | |
| | 150,000 | | | MEG Energy Corp. (Canada), 144a, 7.000% 3/31/24 | | | 115,500 | |
| | 400,000 | | | Midstates Petroleum Co., Inc. / Midstates Petroleum Co. LLC 6/1/20(C) | | | 236,000 | |
| | 500,000 | | | MPLX LP, 144a, 4.875% 6/1/25 | | | 488,662 | |
| | 100,000 | | | New Gold, Inc. (Canada), 144a, 6.250% 11/15/22 | | | 97,500 | |
| | 200,000 | | | Newfield Exploration Co. 5.375% 1/1/26 | | | 194,500 | |
| | 500,000 | | | Regency Energy Partners LP / Regency Energy Finance Corp. 5.000% 10/1/22 | | | 513,050 | |
| | 100,000 | | | Sabine Pass Liquefaction LLC 5.625% 2/1/21 | | | 101,000 | |
| | 500,000 | | | Sabine Pass Liquefaction LLC 5.625% 3/1/25 | | | 498,125 | |
| | 240,000 | | | Sabine Pass Liquefaction LLC, 144a, 5.875% 6/30/26 | | | 240,900 | |
| | 89,000 | | | Summit Midstream Holdings LLC / Summit Midstream Finance Corp. 5.500% 8/15/22 | | | 76,540 | |
| | 300,000 | | | Targa Resources Partners LP / Targa Resources Partners Finance Corp. 5.250% 5/1/23 | | | 283,500 | |
| | 105,000 | | | Western Refining, Inc. 6.250% 4/1/21 | | | 95,550 | |
| | 47,000 | | | Whiting Petroleum Corp. 6.250% 4/1/23 | | | 42,065 | |
| | | | | | | | 4,574,540 | |
| | | | | | | | | |
| | | | | Information Technology — 6.2% | | | | |
| | 100,000 | | | Diamond 1 Finance Corp. / Diamond 2 Finance Corp., 144a, 5.875% 6/15/21 | | | 101,977 | |
| | 41,000 | | | Diamond 1 Finance Corp. / Diamond 2 Finance Corp., 144a, 6.020% 6/15/26 | | | 42,742 | |
| | 100,000 | | | Diamond 1 Finance Corp. / Diamond 2 Finance Corp., 144a, 7.125% 6/15/24 | | | 104,442 | |
| | 10,000 | | | Diamond 1 Finance Corp. / Diamond 2 Finance Corp., 144a, 8.100% 7/15/36 | | | 10,780 | |
| | 600,000 | | | First Data Corp., 144a, 5.000% 1/15/24 | | | 601,500 | |
| | 430,000 | | | MSCI, Inc., 144a, 5.750% 8/15/25(B) | | | 446,125 | |
| | 500,000 | | | NCR Corp. 5.000% 7/15/22 | | | 490,000 | |
| | 129,000 | | | NXP BV / NXP Funding LLC, 144a, 4.125% 6/1/21 | | | 130,935 | |
| | 109,000 | | | NXP BV / NXP Funding LLC, 144a, 4.625% 6/1/23 | | | 110,908 | |
| | 180,000 | | | Open Text Corp., 144a, 5.875% 6/1/26 | | | 180,450 | |
| | 634,000 | | | Sensata Technologies BV (Netherlands), 144a, 5.000% 10/1/25 | | | 636,783 | |
| | 423,000 | | | VeriSign, Inc. 4.625% 5/1/23 | | | 428,288 | |
| | 66,000 | | | Western Digital Corp., 144a, 7.375% 4/1/23 | | | 70,290 | |
| | | | | | | | 3,355,220 | |
| | | | | | | | | |
| | | | | Industrials — 5.1% | | | | |
| | 500,000 | | | Air Medical Merger Sub Corp., 144a, 6.375% 5/15/23 | | | 475,000 | |
| | 375,000 | | | Allegion PLC (Ireland) 5.875% 9/15/23 | | | 397,500 | |
| | 700,000 | | | DigitalGlobe, Inc., 144a, 5.250% 2/1/21 | | | 651,000 | |
| | 270,000 | | | Nielsen Finance LLC / Nielsen Finance Co., 144a, 5.000% 4/15/22 | | | 275,400 | |
| | 613,000 | | | Oshkosh Corp. 5.375% 3/1/25 | | | 629,858 | |
| | 375,000 | | | United Rentals North America, Inc. 5.875% 9/15/26 | | | 372,188 | |
| | | | | | | | 2,800,946 | |
Touchstone Credit Opportunities Fund (Continued)
| Principal | | | | | Market | |
| Amount(A) | | | | | Value | |
| | | | | | | |
| | | | | Corporate Bonds — 67.7% (Continued) | | | | |
| | | | | | | | | |
| | | | | Materials — 4.0% | | | | |
| $ | 200,000 | | | Ardagh Packaging Finance PLC / Ardagh Holdings USA, Inc. (Ireland), 144a, 4.625% 5/15/23 | | $ | 197,000 | |
| | 350,000 | | | Ardagh Packaging Finance PLC / Ardagh Holdings USA, Inc. (Ireland), 144a, 7.250% 5/15/24 | | | 357,219 | |
| | 300,000 | | | Ball Corp. 4.000% 11/15/23 | | | 295,500 | |
| | 300,000 | | | Constellium N.V. (Netherlands), 144a, 7.875% 4/1/21 | | | 309,375 | |
| | 500,000 | | | Owens-Brockway Glass Container, Inc., 144a, 5.875% 8/15/23 | | | 525,210 | |
| | 400,000 | | | Scotts Miracle-Gro Co. (The), 144a, 6.000% 10/15/23 | | | 421,000 | |
| | 23,000 | | | Teck Resources Ltd. (Canada), 144a, 8.000% 6/1/21 | | | 23,690 | |
| | 23,000 | | | Teck Resources Ltd. (Canada), 144a, 8.500% 6/1/24 | | | 23,862 | |
| | | | | | | | 2,152,856 | |
| | | | | | | | | |
| | | | | Financials — 2.8% | | | | |
| | 750,000 | | | Blue Racer Midstream LLC / Blue Racer Finance Corp., 144a, 6.125% 11/15/22 | | | 710,625 | |
| | 300,000 | | | Equinix, Inc. REIT 5.375% 4/1/23 | | | 309,750 | |
| | 200,000 | | | HUB International Ltd., 144a, 9.250% 2/15/21 | | | 209,000 | |
| | 300,000 | | | Icahn Enterprises LP / Icahn Enterprises Finance Corp. 6.000% 8/1/20 | | | 296,250 | |
| | | | | | | | 1,525,625 | |
| | | | | | | | | |
| | | | | Consumer Staples — 1.5% | | | | |
| | 85,000 | | | Albertsons Cos. LLC / Safeway, Inc. / New Albertson's Inc. / Albertson's LLC, 144a, 6.625% 6/15/24 | | | 87,762 | |
| | 200,000 | | | Aramark Services, Inc. 5.125% 1/15/24 | | | 204,000 | |
| | 100,000 | | | KFC Holding Co./Pizza Hut Holdings LLC/Taco Bell of America LLC, 144a, 5.000% 6/1/24 | | | 101,750 | |
| | 100,000 | | | KFC Holding Co./Pizza Hut Holdings LLC/Taco Bell of America LLC, 144a, 5.250% 6/1/26 | | | 102,500 | |
| | 300,000 | | | Rite Aid Corp., 144a, 6.125% 4/1/23 | | | 320,250 | |
| | | | | | | | 816,262 | |
| | | | | | | | | |
| | | | | Utilities — 0.3% | | | | |
| | 188,000 | | | Calpine Corp., 144a, 5.250% 6/1/26 | | | 187,530 | |
| | | | | Total Corporate Bonds | | $ | 36,878,142 | |
| | | | | | | | | |
| | | | | Bank Loans(D) — 24.1% | | | | |
| | | | | | | | | |
| | | | | Consumer Discretionary — 5.3% | | | | |
| | 52,629 | | | ClubCorp Club Operations, Inc., Term B Loan, 4.250%, 12/15/22 | | | 52,300 | |
| | 350,000 | | | Cumulus Media Holdings, Inc., Term Loan, 4.250%, 12/23/20 | | | 244,562 | |
| | 236,662 | | | Life Time Fitness, Inc., Closing Date Term Loan, 4.250%, 6/10/22 | | | 230,746 | |
| | 92,905 | | | Mattress Firm, 2016 Incremental Loan, 6.250%, 10/20/21 | | | 90,583 | |
| | 588,035 | | | Mohegan Tribal Gaming Authority, Term B Loan, 5.500%, 6/15/18 | | | 583,184 | |
| | 297,744 | | | Sinclair Television Group, Inc., Incremental Tranche B-1 Term Loan, 3.500%, 7/30/21 | | | 297,000 | |
| | 597,301 | | | Townsquare Media, Inc., Initial Term Loan, 4.250%, 4/1/22 | | | 595,061 | |
| | 319,674 | | | Trans Union LLC, 2015 Term B-2 Loan, 3.500%, 4/9/21 | | | 315,330 | |
| | 176,903 | | | York Risk Services Holding Corp.(Onex York Finance LP), Term Loan, 4.750%, 10/1/21 | | | 154,790 | |
| | 296,925 | | | Zuffa, LLC, Initial Term Loan, 3.750%, 2/25/20 | | | 295,440 | |
| | | | | | | | 2,858,996 | |
| | | | | | | | | |
| | | | | Industrials — 4.5% | | | | |
| | 305,662 | | | Air Medical Group Holdings, Inc., Initial Term Loan, 4.250%, 4/28/22 | | | 297,734 | |
| | 297,750 | | | Beacon Roofing Supply, Inc., Initial Term Loan, 4.000%, 10/1/22 | | | 297,315 | |
| | 595,489 | | | Headwaters, Inc., Term B Loan 4.000%, 3/24/22 | | | 594,744 | |
| | 297,733 | | | Jeld-Wen, Inc., Initial Loan, 5.250%, 10/15/21 | | | 297,548 | |
| | 297,750 | | | Jeld-Wen, Inc. (Onex BP Finance LP), Term B-1 Loan, 4.750%, 7/1/22 | | | 296,633 | |
| | 148,943 | | | Syncreon Global Finance (US), Inc. (Syncreon Group B.V.), Term Loan, 5.250%, 10/28/20 | | | 128,091 | |
| | 162,493 | | | Syniverse Holdings Inc., Initial Term Loan, 4.000%, 4/23/19(E) | | | 120,814 | |
| | 298,500 | | | VWR Funding, Inc., Tranche B Term Loan (EUR), 4.000%, 1/15/22 | | | 330,364 | |
| | 85,000 | | | Zekelman Industries, Inc. (fka JMC Steel Group, Inc.), Term Loan, 6/14/21(E) | | | 84,858 | |
| | | | | | | | 2,448,101 | |
| | | | | | | | | |
| | | | | Health Care — 4.3% | | | | |
| | 468,422 | | | American Renal Holdings Inc., Term B Loan (First Lien), 4.750%, 8/20/19 | | | 467,250 | |
| | 593,020 | | | Envision Healthcare Corp., Tranche B-2 Term Loan, 4.500%, 10/28/22 | | | 592,427 | |
| | 261,408 | | | Multiplan Inc., Initial Term Loan, 5.000%, 6/7/23 | | | 261,996 | |
| | 995,000 | | | US Renal Care, Inc., Term Loan B, 5.250%, 12/30/22 | | | 993,139 | |
| | | | | | | | 2,314,812 | |
Touchstone Credit Opportunities Fund (Continued)
| Principal | | | | | Market | |
| Amount(A) | | | | | Value | |
| | | | | | | |
| | | | | Bank Loans(D) — 24.1% (Continued) | | | | |
| | | | | | | | | |
| | | | | Information Technology — 3.0% | | | | |
| $ | 498,750 | | | Avago Technologies Cayman Finance Ltd., Term B-1 Dollar Loan, 4.250%, 2/1/23 | | $ | 498,984 | |
| | 150,000 | | | Diebold, Inc., Dollar B Term Loan, 5.250%, 11/6/23 | | | 149,187 | |
| | 309,137 | | | Entegris, Inc., Tranche B Term Loan, 3.500%, 4/30/21 | | | 307,847 | |
| | 268,117 | | | Evergreen Skills Lux S.A.R.L., Initial Term Loan (First Lien)(Luxemburg), 5.750%, 4/28/21 | | | 211,142 | |
| | 94,545 | | | MKS Instruments, Inc., Tranche B-1 Term Loan, 4.250%, 4/28/23 | | | 94,545 | |
| | 285,600 | | | ON Semiconductor Corp., Closing Date Term Loan, 5.250%, 3/31/23 | | | 286,314 | |
| | 30,000 | | | Veritas US, Inc., Initial Dollar Term B-1 Loan, 1/27/23(E) | | | 26,400 | |
| | 75,000 | | | Western Digital Corp., U.S. Term B Loan, 6.250%, 4/29/23 | | | 75,235 | |
| | | | | | | | 1,649,654 | |
| | | | | | | | | |
| | | | | Telecommunication Services — 2.5% | | | | |
| | 297,744 | | | Acosta, Inc., Tranche B-1 Loan, 4.250%, 9/26/21 | | | 285,835 | |
| | 270,050 | | | Affinion Group, Inc., Tranche B Term Loan, 6.750%, 4/30/18(E) | | | 244,619 | |
| | 109,425 | | | Endurance Business Media, Inc., Term Loan, 6.480%, 11/9/19 | | | 104,045 | |
| | 250,000 | | | Intelsat Jackson Holdings Ltd., Tranche B-2 Tl, 3.750%, 6/30/19 | | | 227,312 | |
| | 496,241 | | | SBA Finance Communications Corp, Incremental Tranche B-2 Term Loan, 3.250%, 6/10/22 | | | 488,901 | |
| | | | | | | | 1,350,712 | |
| | | | | | | | | |
| | | | | Financials — 2.4% | | | | |
| | 450,000 | | | Asurion LLC, Term Loan (Second Lien), 8.500%, 3/3/21 | | | 432,000 | |
| | 299,250 | | | Equinix, Inc., Dollar Term B Loan, 4.000%, 1/6/23 | | | 297,754 | |
| | 594,678 | | | HUB International Ltd., Initial Term Loan, 4.250%, 10/2/20 | | | 583,278 | |
| | | | | | | | 1,313,032 | |
| | | | | | | | | |
| | | | | Energy — 1.2% | | | | |
| | 18,615 | | | Alinta Energy Finance Pty. Ltd., Delayed Draw Term Loan, 6.380%, 8/13/18 | | | 18,371 | |
| | 279,596 | | | Alinta Energy Finance Pty. Ltd., Term B Loan, 6.380%, 8/13/19 | | | 275,927 | |
| | 39,548 | | | Emerald 2 Ltd., Term Loan B-1, 5/14/21(E) | | | 36,450 | |
| | 27,984 | | | Energy & Exploration Partners, LLC, New Term Loan, 13.000%, 11/10/21(F) | | | 27,774 | |
| | 15,640 | | | Energy & Exploration Partners, LLC., Term Loan 2nd Lien, 5.000%, 5/13/22 | | | 15,640 | |
| | 99,479 | | | MEG Energy Corp., Incremental Term Loan, 3.750%, 3/31/20 | | | 87,187 | |
| | 218,309 | | | Seadrill Operating LP (Seadrill Partners Finco LLC), Initial Term Loan, 4.000%, 2/21/21 | | | 96,929 | |
| | 299,689 | | | Templar Energy, LLC, Incremental Term Loan, 8.500%, 11/25/20 | | | 74,922 | |
| | | | | | | | 633,200 | |
| | | | | | | | | |
| | | | | Consumer Staples — 0.8% | | | | |
| | 100,000 | | | Albertson's LLC., Term B-6 Loan, 6/22/23(E) | | | 99,725 | |
| | 39,260 | | | B&G Foods, Inc., Tranche B Term Loan, 3.760%, 11/2/22 | | | 39,290 | |
| | 325,000 | | | NBTY, INC., Dollar Term B Loan, 5.000%, 5/5/23 | | | 322,098 | |
| | | | | | | | 461,113 | |
| | | | | | | | | |
| | | | | Materials — 0.1% | | | | |
| | 75,969 | | | PQ Corp, Tranche B-1 Term Loan, 5.750%, 11/4/22 | | | 75,893 | |
| | | | | Total Bank Loans | | $ | 13,105,513 | |
| | | | | | | | | |
| | | | | Asset-Backed Securities — 3.9% | | | | |
| | 300,000 | | | Bowman Park CLO Ltd., Ser 2014-1A, Class D1, 144a, 4.354%, 11/23/25(G) | | | 280,777 | |
| | 500,000 | | | Clear Creek CLO Ltd., Ser 2015-1A, Class D, 144a, 4.534%, 4/20/27(G) | | | 464,332 | |
| | 250,000 | | | Denali Capital CLO XII Ltd., Ser 2016-1A, Class E, 144a, 8.379%, 4/15/28(G) | | | 233,762 | |
| | 300,000 | | | Madison Park Funding XII Ltd., Ser 2014-12A, Class SUB, 144a, 0.000%, 7/20/26 | | | 220,915 | |
| | 500,000 | | | OZLM XIV Ltd., Ser 2015-14A, Class D, 144a, 6.732%, 1/15/29(G) | | | 433,643 | |
| | 300,000 | | | Symphony CLO XVI Ltd., Ser 2015-16A, Class D, 144a, 4.278%, 7/15/28(G) | | | 276,230 | |
| | 250,000 | | | TICP CLO I Ltd., Ser 2015-1A, Class D, 144a, 4.184%, 7/20/27(G) | | | 219,621 | |
| | | | | Total Asset-Backed Securities | | $ | 2,129,280 | |
| Shares | | | | | | |
| | | | | | | |
| | | | | Common Stock — 0.1% | | | | |
| | | | | | | | | |
| | | | | Energy — 0.1% | | | | |
| | 40 | | | Energy & Exploration Partners, LLC* | | $ | 22,200 | |
Touchstone Credit Opportunities Fund (Continued)
| | | Number | | | | |
| | | of | | | Market | |
| | | Contracts | | | Value | |
| | | | | | | |
| Purchased Call Options — 0.0% | | | | | | | | |
| VIX, Strike @ $30.00, Exp 08/16(B) | | | 88 | | | $ | 5,280 | |
| Shares | | | | | | |
| | | | | | | |
| | | | | Investment Funds — 0.9% | | | | |
| | 6,000 | | | DoubleLine Income Solutions Fund, Common Shares± | | $ | 110,100 | |
| | 399,132 | | | Dreyfus Cash Management, Institutional Shares, 0.30%∞Ω | | | 399,132 | |
| | | | | Total Investment Funds | | $ | 509,232 | |
| | | | | | | | | |
| Total Long Positions —96.7% | | | | |
| (Cost $52,152,394) | | $ | 52,649,647 | |
| Principal | | | | | | |
| Amount(A) | | | | | | |
| | | | | | | |
| | | | | Securities Sold Short — (1.4%) | | | | |
| | | | | | | | | |
| | | | | Corporate Bonds — (1.3%) | | | | |
| | | | | | | | | |
| | | | | Consumer Discretionary — (1.3%) | | | | |
| $ | (200,000 | ) | | Acosta, Inc. 7.750%, 6/4/16, 144a | | $ | (175,500 | ) |
| | (500,000 | ) | | Gap, Inc. (The), 5.950%, 6/4/16 | | | (521,485 | ) |
| | | | | Total Corporate Bonds | | $ | (696,985 | ) |
| | | | | | | | | |
| Shares | | | | | | | |
| | | | | | | | |
| | | | | Common Stock — (0.1%) | | | | |
| | | | | | | | | |
| | | | | Consumer Staples — (0.1%) | | | | |
| | (1,700 | ) | | Whole Foods Market, Inc. | | | (54,434 | ) |
| | | | | Total Common Stock | | $ | (54,434 | ) |
| | | | | | | | | |
| Total Securities Sold Short | | | | |
| (Proceeds $764,719) | | $ | (751,419 | ) |
| | | | | |
| Total —95.3% | | $ | 51,898,228 | |
| | | | | |
| Other Assets in Excess of Liabilities — 4.7% | | | 2,564,889 | |
| | | | | |
| Net Assets — 100.0% | | $ | 54,463,117 | |
| (A) | Principal amount stated in U.S. dollars unless otherwise noted. |
| (B) | All or a portion of these securities are held as collateral for securities sold short. The total value of the securities held as collateral as of June 30, 2016 was $1,575,271. |
| (C) | The issuer is in default of certain debt covenants. Income is not being accrued. The total value of such securities as of June 30, 2016 was $236,000 or 0.4% of net assets. |
| (D) | Bank loans pay interest at rates which adjust periodically. The interest rates shown are the current interest rates as of June 30, 2016. |
| (E) | All or a portion of this position has not settled. Full contract rates do not take effect until settlement date. |
| (F) | Term Loan has additional unfunded loan commitments. See Note 2 in Notes to Financial Statements. |
| (G) | Variable rate security - Rate reflected is the rate in effect as of June 30, 2016. |
| * | Non-income producing security. |
| Ω | Represents the 7-day SEC yield as of June 30, 2016. |
Touchstone Credit Opportunities Fund (Continued)
Portfolio Abbreviations:
CLO - Collateral Loan Obligations
EUR - Euro
LLC - Limited Liability Company
LP - Limited Partnership
PLC - Public Limited Company
REIT - Real Estate Investment Trust
USD - United States Dollars
144A - This is a restricted security that was sold in a transaction exempt from rule 144A of the Securities Act of 1933. This security may be sold in transactions exempt from registration, normally to qualified institutional buyers. At June 30, 2016, these securities were valued at $ 22,383,752 or 41.1% of net assets. These securities were deemed liquid pursuant to procedures approved by the Board of Trustees.
Other Information:
The inputs or methodology used for valuing securities may not be an indication of the risk associated with investing in those securities. For more information on valuation inputs, and their aggregation into the levels used in the table below, please refer to the security valuation section in the accompanying Notes to Financial Statements.
Valuation inputs at Reporting Date:
| Description | | Level 1 | | | Level 2 | | | Level 3 | | | Total | |
| | | | | | | | | | | | | |
| Assets: | | | | | | | | | | | | | | | | |
| Corporate Bonds | | $ | — | | | $ | 36,878,142 | | | $ | — | | | $ | 36,878,142 | |
| Bank Loans | | | — | | | | 13,089,873 | | | | 15,640 | | | | 13,105,513 | |
| Asset-Backed Securities | | | — | | | | 2,129,280 | | | | — | | | | 2,129,280 | |
| Common Stock | | | — | | | | — | | | | 22,200 | | | | 22,200 | |
| Purchased Call Options Equity Contracts | | | 5,280 | | | | — | | | | — | | | | 5,280 | |
| Investment Funds | | | 509,232 | | | | — | | | | — | | | | 509,232 | |
| Other Financial Instruments* | | | | | | | | | | | | | | | | |
| Forward Foreign Currency Contract | | $ | — | | | $ | 3,599 | | | $ | — | | | $ | 3,599 | |
| Total Assets | | $ | 514,512 | | | $ | 52,100,894 | | | $ | 37,840 | | | $ | 52,653,246 | |
| | | | | | | | | | | | | | | | | |
| Liabilities | | | | | | | | | | | | | | | | |
| Securities Sold Short | | | | | | | | | | | | | | | | |
| Corporate Bonds | | $ | — | | | $ | (696,985 | ) | | $ | — | | | $ | (696,985 | ) |
| Common Stock | | | (54,434 | ) | | | — | | | | — | | | | (54,434 | ) |
| Other Financial Instruments* | | | | | | | | | | | | | | | | |
| Unfunded Loan Commitments | | $ | — | | | $ | (81 | ) | | $ | — | | | $ | (81 | ) |
| Total Liabilities | | $ | (54,434 | ) | | $ | (697,066 | ) | | | — | | | $ | (751,500 | ) |
| Total | | $ | 460,078 | | | $ | 51,403,828 | | | $ | 37,840 | | | $ | 51,901,746 | |
* Other Financial Instruments include derivative instruments and unfunded loan commitments not reflected in total investments. Amounts shown represent unrealized appreciation (depreciation) on forward foreign currency contracts and unfunded loan commitments.
Measurements Using Unobservable Inputs (Level 3)
| | | Bank | | | Common | |
| Assets | | Loans | | | Stock | |
| Beginning balance, September 1, 2015* | | $ | — | | | $ | — | |
| Loan Restructuring | | | 24,370 | | | | 6,054 | |
| Net change in unrealized appreciation/depreciation | | | (8,730 | ) | | | 16,146 | |
| Ending balance, June 30, 2016 | | $ | 15,640 | | | $ | 22,200 | |
| Net Change in Unrealized Appreciation/Depreciation for Investments in Securities Still Held at June 30, 2016 | | $ | (8,730 | ) | | $ | 16,146 | |
* Commencement of operations.
Touchstone Credit Opportunities Fund (Continued)
Forward Foreign Currency Contracts
| | | | | Contract to | | | Unrealized | |
| Counterparty | | Expiration Date | | Receive | | | Deliver | | | Appreciation | |
| | | | | | | | | | | | | | | |
| Bank of America | | 07/25/2016 | | USD | 334,616 | | | EUR | 298,000 | | | $ | 3,599 | |
See accompanying Notes to Financial Statements.
Portfolio of Investments
Touchstone International Small Cap Fund – June 30, 2016
| | | | | | Market | |
| | | Shares | | | Value | |
| | | | | | | |
| Common Stocks — 94.2% | | | | | | | | |
| | | | | | | | | |
| Japan — 22.9% | | | | | | | | |
| | | | | | | | | |
| Consumer Discretionary — 3.2% | | | | | | | | |
| HIS Co. Ltd.† | | | 153,700 | | | $ | 4,963,771 | |
| K's Holdings Corp. | | | 204,100 | | | | 3,808,862 | |
| Temp Holdings Co. Ltd. | | | 225,000 | | | | 3,898,422 | |
| | | | | | | | | |
| Consumer Staples — 7.7% | | | | | | | | |
| Ariake Japan Co. Ltd. | | | 64,400 | | | | 3,834,112 | |
| Coca-Cola West Co. Ltd. | | | 168,500 | | | | 4,765,289 | |
| Ezaki Glico Co. Ltd. | | | 84,400 | | | | 4,937,382 | |
| Lion Corp. | | | 292,000 | | | | 4,817,855 | |
| Morinaga & Co. Ltd/Japan | | | 525,000 | | | | 3,310,149 | |
| NH Foods Ltd. | | | 145,000 | | | | 3,551,629 | |
| Pola Orbis Holdings, Inc. | | | 50,700 | | | | 4,771,384 | |
| | | | | | | | | |
| Financials — 4.2% | | | | | | | | |
| Leopalace21 Corp. | | | 841,900 | | | | 5,913,568 | |
| Nomura Real Estate Master Fund, Inc. REIT | | | 2,992 | | | | 4,729,802 | |
| Zenkoku Hosho Co. Ltd. | | | 159,000 | | | | 5,807,400 | |
| | | | | | | | | |
| Health Care — 1.0% | | | | | | | | |
| Medipal Holdings Corp. | | | 244,970 | | | | 4,027,511 | |
| | | | | | | | | |
| Industrials — 1.5% | | | | | | | | |
| OSG Corp.† | | | 214,600 | | | | 3,574,874 | |
| Takeuchi Manufacturing Co. Ltd. | | | 179,100 | | | | 2,332,732 | |
| | | | | | | | | |
| Information Technology — 2.5% | | | | | | | | |
| Azbil Corp. | | | 154,000 | | | | 4,535,250 | |
| Square Enix Holdings Co. Ltd. | | | 164,200 | | | | 5,330,422 | |
| | | | | | | | | |
| Materials — 2.8% | | | | | | | | |
| Maruichi Steel Tube Ltd. | | | 109,800 | | | | 3,837,533 | |
| Sumitomo Osaka Cement Co. Ltd. | | | 951,000 | | | | 4,080,773 | |
| W-Scope Corp.† | | | 125,400 | | | | 2,966,486 | |
| Total Japan | | | | | | | 89,795,206 | |
| | | | | | | | | |
| United Kingdom — 10.7% | | | | | | | | |
| | | | | | | | | |
| Consumer Discretionary — 2.0% | | | | | | | | |
| Greene King PLC | | | 303,094 | | | | 3,156,400 | |
| Howden Joinery Group PLC | | | 509,103 | | | | 2,614,800 | |
| Lookers PLC | | | 1,431,527 | | | | 2,039,131 | |
| | | | | | | | | |
| Consumer Staples — 1.6% | | | | | | | | |
| Greggs PLC | | | 192,944 | | | | 2,503,273 | |
| McBride PLC | | | 1,868,416 | | | | 3,874,035 | |
| | | | | | | | | |
| Energy — 0.6% | | | | | | | | |
| Pantheon Resources PLC* | | | 1,134,479 | | | | 2,197,462 | |
| | | | | | | | | |
| Financials — 2.6% | | | | | | | | |
| Jupiter Fund Management PLC | | | 726,525 | | | | 3,567,632 | |
| McCarthy & Stone PLC, 144a | | | 1,525,782 | | | | 3,485,553 | |
| Virgin Money Holdings UK PLC | | | 953,998 | | | | 3,200,579 | |
| | | | | | | | | |
| Health Care — 1.0% | | | | | | | | |
| Genus PLC | | | 187,954 | | | | 3,915,866 | |
| | | | | | | | | |
| Information Technology — 2.3% | | | | | | | | |
| Just Eat PLC* | | | 618,762 | | | | 3,532,245 | |
| Micro Focus International PLC | | | 263,867 | | | | 5,692,712 | |
| | | | | | | | | |
| Materials — 0.6% | | | | | | | | |
| Marshalls PLC | | | 704,165 | | | | 2,229,196 | |
| Total United Kingdom | | | | | | | 42,008,884 | |
| | | | | | | | | |
| Sweden — 8.3% | | | | | | | | |
| | | | | | | | | |
| Consumer Discretionary — 2.0% | | | | | | | | |
| Bilia AB | | | 222,265 | | | | 5,495,659 | |
| Nobia AB | | | 271,777 | | | | 2,364,459 | |
| | | | | | | | | |
| Financials — 2.8% | | | | | | | | |
| Fastighets AB Balder, Class B* | | | 262,999 | | | | 6,664,739 | |
| Hemfosa Fastigheter AB | | | 432,854 | | | | 4,456,010 | |
| | | | | | | | | |
| Health Care — 0.1% | | | | | | | | |
| Vitrolife AB | | | 5,010 | | | | 275,350 | |
| | | | | | | | | |
| Information Technology — 0.9% | | | | | | | | |
| NetEnt AB | | | 357,501 | | | | 3,540,478 | |
| | | | | | | | | |
| Materials — 2.5% | | | | | | | | |
| Boliden AB | | | 274,708 | | | | 5,368,920 | |
| Granges AB | | | 518,057 | | | | 4,512,658 | |
| Total Sweden | | | | | | | 32,678,273 | |
| | | | | | | | | |
| Canada — 7.8% | | | | | | | | |
| | | | | | | | | |
| Energy — 3.0% | | | | | | | | |
| Raging River Exploration, Inc.* | | | 741,138 | | | | 5,897,209 | |
| Whitecap Resources, Inc.† | | | 782,778 | | | | 5,986,181 | |
| | | | | | | | | |
| Financials — 0.8% | | | | | | | | |
| Element Financial Corp. | | | 308,720 | | | | 3,273,706 | |
| | | | | | | | | |
| Industrials — 2.3% | | | | | | | | |
| Aecon Group, Inc. | | | 330,378 | | | | 4,495,565 | |
| Boyd Group Income Fund† | | | 77,964 | | | | 4,481,293 | |
| | | | | | | | | |
| Information Technology — 1.0% | | | | | | | | |
| Descartes Systems Group, Inc. (The)* | | | 195,222 | | | | 3,733,841 | |
| | | | | | | | | |
| Materials — 0.7% | | | | | | | | |
| Intertape Polymer Group, Inc. | | | 171,712 | | | | 2,801,725 | |
| Total Canada | | | | | | | 30,669,520 | |
| | | | | | | | | |
| France — 5.9% | | | | | | | | |
| | | | | | | | | |
| Consumer Discretionary — 0.1% | | | | | | | | |
| IPSOS | | | 17,380 | | | | 492,990 | |
| | | | | | | | | |
| Health Care — 1.3% | | | | | | | | |
| Ipsen SA | | | 83,610 | | | | 5,122,882 | |
| | | | | | | | | |
| Industrials — 1.2% | | | | | | | | |
| Tarkett SA | | | 146,084 | | | | 4,762,113 | |
Touchstone International Small Cap Fund (Continued)
| | | | | | Market | |
| | | Shares | | | Value | |
| | | | | | | |
| Common Stocks — 94.2% (Continued) | | | | | | | | |
| | | | | | | | | |
| France — (Continued) | | | | | | | | |
| | | | | | | | | |
| Information Technology — 2.3% | | | | | | | | |
| Alten SA | | | 73,782 | | | $ | 4,331,051 | |
| Worldline SA, 144a* | | | 164,390 | | | | 4,781,538 | |
| | | | | | | | | |
| Utilities — 1.0% | | | | | | | | |
| Rubis SCA | | | 49,581 | | | | 3,790,249 | |
| Total France | | | | | | | 23,280,823 | |
| | | | | | | | | |
| Australia — 4.2% | | | | | | | | |
| | | | | | | | | |
| Consumer Discretionary — 0.9% | | | | | | | | |
| Star Entertainment Grp Ltd (The) | | | 852,337 | | | | 3,473,045 | |
| | | | | | | | | |
| Financials — 2.5% | | | | | | | | |
| Link Administration Holdings Ltd.* | | | 661,273 | | | | 4,051,475 | |
| Magellan Financial Group Ltd. | | | 336,642 | | | | 5,674,639 | |
| | | | | | | | | |
| Health Care — 0.8% | | | | | | | | |
| Estia Health Ltd.† | | | 985,378 | | | | 3,417,665 | |
| Total Australia | | | | | | | 16,616,824 | |
| | | | | | | | | |
| Italy — 3.7% | | | | | | | | |
| | | | | | | | | |
| Health Care — 3.7% | | | | | | | | |
| Amplifon SpA | | | 337,844 | | | | 3,161,858 | |
| DiaSorin SpA | | | 83,509 | | | | 5,097,099 | |
| Recordati SpA | | | 208,219 | | | | 6,263,146 | |
| Total Italy | | | | | | | 14,522,103 | |
| | | | | | | | | |
| Germany — 3.6% | | | | | | | | |
| | | | | | | | | |
| Consumer Discretionary — 1.0% | | | | | | | | |
| Stroeer Media SE† | | | 82,349 | | | | 3,788,005 | |
| | | | | | | | | |
| Financials — 1.5% | | | | | | | | |
| Aurelius AG | | | 100,574 | | | | 5,910,795 | |
| | | | | | | | | |
| Industrials — 1.1% | | | | | | | | |
| KION Group AG | | | 87,998 | | | | 4,265,103 | |
| Total Germany | | | | | | | 13,963,903 | |
| | | | | | | | | |
| Ireland — 3.4% | | | | | | | | |
| | | | | | | | | |
| Consumer Discretionary — 1.1% | | | | | | | | |
| Cairn Homes PLC* | | | 3,911,327 | | | | 4,166,990 | |
| | | | | | | | | |
| Health Care — 1.3% | | | | | | | | |
| UDG Healthcare PLC | | | 615,627 | | | | 4,871,903 | |
| | | | | | | | | |
| Industrials — 1.0% | | | | | | | | |
| Kingspan Group PLC | | | 188,568 | | | | 4,080,653 | |
| Total Ireland | | | | | | | 13,119,546 | |
| | | | | | | | | |
| South Korea — 3.1% | | | | | | | | |
| | | | | | | | | |
| Consumer Discretionary — 0.8% | | | | | | | | |
| Hana Tour Service, Inc.† | | | 42,575 | | | | 3,106,389 | |
| | | | | | | | | |
| Consumer Staples — 1.5% | | | | | | | | |
| Hugel, Inc.*† | | | 20,592 | | | | 5,683,202 | |
| | | | | | | | | |
| Financials — 0.8% | | | | | | | | |
| KIWOOM Securities Co. Ltd. | | | 52,217 | | | | 3,267,592 | |
| Total South Korea | | | | | | | 12,057,183 | |
| | | | | | | | | |
| Luxembourg — 2.3% | | | | | | | | |
| | | | | | | | | |
| Financials — 1.3% | | | | | | | | |
| Grand City Properties SA | | | 242,346 | | | | 4,986,958 | |
| | | | | | | | | |
| Industrials — 1.0% | | | | | | | | |
| Stabilus SA* | | | 87,758 | | | | 4,158,548 | |
| Total Luxembourg | | | | | | | 9,145,506 | |
| | | | | | | | | |
| Denmark — 2.1% | | | | | | | | |
| | | | | | | | | |
| Industrials — 1.2% | | | | | | | | |
| Dfds A/S | | | 110,970 | | | | 4,853,111 | |
| | | | | | | | | |
| Information Technology — 0.9% | | | | | | | | |
| SimCorp A/S | | | 69,704 | | | | 3,420,831 | |
| Total Denmark | | | | | | | 8,273,942 | |
| | | | | | | | | |
| New Zealand — 1.8% | | | | | | | | |
| | | | | | | | | |
| Utilities — 1.8% | | | | | | | | |
| Meridian Energy Ltd. | | | 3,657,222 | | | | 6,902,138 | |
| | | | | | | | | |
| Austria — 1.6% | | | | | | | | |
| | | | | | | | | |
| Industrials — 1.6% | | | | | | | | |
| Flughafen Wien AG | | | 130,396 | | | | 3,524,354 | |
| Wienerberger AG | | | 194,985 | | | | 2,726,458 | |
| Total Austria | | | | | | | 6,250,812 | |
| | | | | | | | | |
| Switzerland — 1.4% | | | | | | | | |
| | | | | | | | | |
| Financials — 1.4% | | | | | | | | |
| Cembra Money Bank AG | | | 75,977 | | | | 5,313,930 | |
| | | | | | | | | |
| Isle of Man — 1.3% | | | | | | | | |
| | | | | | | | | |
| Information Technology — 1.3% | | | | | | | | |
| Paysafe Group PLC* | | | 968,727 | | | | 5,052,636 | |
| | | | | | | | | |
| Bermuda — 1.2% | | | | | | | | |
| | | | | | | | | |
| Information Technology — 1.2% | | | | | | | | |
| Travelport Worldwide Ltd. | | | 367,878 | | | | 4,741,947 | |
| | | | | | | | | |
| Singapore — 1.2% | | | | | | | | |
| | | | | | | | | |
| Industrials — 1.2% | | | | | | | | |
| SATS Ltd. | | | 1,472,200 | | | | 4,491,680 | |
| | | | | | | | | |
| Jersey — 1.1% | | | | | | | | |
| | | | | | | | | |
| Industrials — 1.1% | | | | | | | | |
| Regus PLC | | | 1,112,167 | | | | 4,300,379 | |
Touchstone International Small Cap Fund (Continued)
| | | | | | Market | |
| | | Shares | | | Value | |
| | | | | | | |
| Common Stocks — 94.2% (Continued) | | | | | | | | |
| | | | | | | | | |
| Norway — 1.0% | | | | | | | | |
| | | | | | | | | |
| Consumer Staples — 1.0% | | | | | | | | |
| Salmar ASA | | | 130,782 | | | $ | 3,891,849 | |
| | | | | | | | | |
| Finland — 1.0% | | | | | | | | |
| | | | | | | | | |
| Industrials — 1.0% | | | | | | | | |
| Cramo OYJ | | | 185,886 | | | | 3,829,650 | |
| | | | | | | | | |
| Faroe Islands — 0.9% | | | | | | | | |
| | | | | | | | | |
| Consumer Staples — 0.9% | | | | | | | | |
| Bakkafrost P/F | | | 95,403 | | | | 3,599,483 | |
| | | | | | | | | |
| Taiwan — 0.9% | | | | | | | | |
| | | | | | | | | |
| Industrials — 0.9% | | | | | | | | |
| Sinbon Electronics Co. Ltd. | | | 1,594,000 | | | | 3,599,210 | |
| | | | | | | | | |
| Thailand — 0.9% | | | | | | | | |
| | | | | | | | | |
| Consumer Discretionary — 0.9% | | | | | | | | |
| Major Cineplex Group PCL | | | 3,667,300 | | | | 3,454,435 | |
| | | | | | | | | |
| Portugal — 0.7% | | | | | | | | |
| | | | | | | | | |
| Industrials — 0.7% | | | | | | | | |
| CTT-Correios de Portugal SA | | | 343,250 | | | | 2,715,007 | |
| | | | | | | | | |
| Netherlands — 0.6% | | | | | | | | |
| | | | | | | | | |
| Consumer Staples — 0.6% | | | | | | | | |
| Lucas Bols Holding BV, 144a† | | | 140,056 | | | | 2,515,675 | |
| | | | | | | | | |
| Cayman Islands — 0.6% | | | | | | | | |
| | | | | | | | | |
| Consumer Discretionary — 0.6% | | | | | | | | |
| Fu Shou Yuan International Group Ltd. | | | 3,541,726 | | | | 2,508,436 | |
| Total Common Stocks | | | | | | $ | 369,298,980 | |
| | | | | | | | | |
| Exchange Traded Fund — 2.0% | | | | | | | | |
| | | | | | | | | |
| United States — 2.0% | | | | | | | | |
| iShares MSCI EAFE Small Cap Index Fund† | | | 160,838 | | | | 7,762,042 | |
| | | | | | | | | |
| Investment Funds — 8.7% | | | | | | | | |
| Dreyfus Cash Management, Institutional Shares, 0.30%∞Ω | | | 11,589,600 | | | | 11,589,600 | |
| Invesco Government & Agency Portfolio, Institutional Class, 0.30%**∞Ω | | | 22,456,569 | | | | 22,456,569 | |
| Total Investment Funds | | | | | | $ | 34,046,169 | |
| | | | | | | | | |
| Total Investment Securities —104.9% | | | | | | | | |
| (Cost $390,387,237) | | | | | | $ | 411,107,191 | |
| | | | | | | | | |
| Liabilities in Excess of Other Assets — (4.9%) | | | | | | | (19,223,938 | ) |
| | | | | | | | | |
| Net Assets — 100.0% | | | | | | $ | 391,883,253 | |
| * | Non-income producing security. |
| ** | Represents collateral for securities loaned. |
| † | All or a portion of the security is on loan. The total market value of the securities on loan as of June 30, 2016 was $18,775,860. |
| Ω | Represents the 7-day SEC yield as of June 30, 2016. |
Portfolio Abbreviations:
PCL - Public Company Limited
PLC - Public Limited Company
REIT- Real Estate Investment Trust
144a - This is a restricted security that was sold in a transaction qualifying for the exemption under Rule 144A of the Securities Act of 1933. This security may be sold in transactions exempt from registration, normally to qualified institutional buyers. At June 30, 2016, these securities were valued at $10,782,766 or 2.8% of net assets. These securities were deemed liquid pursuant to procedures approved by the Board of Trustees.
Touchstone International Small Cap Fund (Continued)
Other Information:
The inputs or methodology used for valuing securities may not be an indication of the risk associated with investing in those securities. For more information on valuation inputs, and their aggregation into the levels used in the table below, please refer to the security valuation section in the accompanying Notes to Financial Statements.
Valuation inputs at Reporting Date:
| | | Level 1 | | | Level 2 | | | Level 3 | | | Total | |
| Common Stocks | | | | | | | | | | | | | | | | |
| Japan | | $ | — | | | $ | 89,795,206 | | | $ | — | | | $ | 89,795,206 | |
| United Kingdom | | | 17,741,243 | | | | 24,267,641 | | | | — | | | | 42,008,884 | |
| Sweden | | | 275,350 | | | | 32,402,923 | | | | — | | | | 32,678,273 | |
| Canada | | | 30,669,520 | | | | — | | | | — | | | | 30,669,520 | |
| France | | | 492,990 | | | | 22,787,833 | | | | — | | | | 23,280,823 | |
| Australia | | | — | | | | 16,616,824 | | | | — | | | | 16,616,824 | |
| Italy | | | 5,097,099 | | | | 9,425,004 | | | | — | | | | 14,522,103 | |
| Germany | | | — | | | | 13,963,903 | | | | — | | | | 13,963,903 | |
| Ireland | | | 8,247,643 | | | | 4,871,903 | | | | — | | | | 13,119,546 | |
| South Korea | | | 5,683,202 | | | | 6,373,981 | | | | — | | | | 12,057,183 | |
| Luxembourg | | | 4,158,548 | | | | 4,986,958 | | | | — | | | | 9,145,506 | |
| Denmark | | | 4,853,111 | | | | 3,420,831 | | | | — | | | | 8,273,942 | |
| New Zealand | | | — | | | | 6,902,138 | | | | — | | | | 6,902,138 | |
| Austria | | | 6,250,812 | | | | — | | | | — | | | | 6,250,812 | |
| Switzerland | | | — | | | | 5,313,930 | | | | — | | | | 5,313,930 | |
| Isle of Man | | | — | | | | 5,052,636 | | | | — | | | | 5,052,636 | |
| Bermuda | | | 4,741,947 | | | | — | | | | — | | | | 4,741,947 | |
| Singapore | | | 4,491,680 | | | | — | | | | — | | | | 4,491,680 | |
| Jersey | | | — | | | | 4,300,379 | | | | — | | | | 4,300,379 | |
| Norway | | | — | | | | 3,891,849 | | | | — | | | | 3,891,849 | |
| Finland | | | — | | | | 3,829,650 | | | | — | | | | 3,829,650 | |
| Faroe Islands | | | — | | | | 3,599,483 | | | | — | | | | 3,599,483 | |
| Taiwan | | | — | | | | 3,599,210 | | | | — | | | | 3,599,210 | |
| Thailand | | | — | | | | 3,454,435 | | | | — | | | | 3,454,435 | |
| Portugal | | | — | | | | 2,715,007 | | | | — | | | | 2,715,007 | |
| Netherlands | | | — | | | | 2,515,675 | | | | — | | | | 2,515,675 | |
| Cayman Islands | | | — | | | | 2,508,436 | | | | — | | | | 2,508,436 | |
| Exchange Traded Fund | | | 7,762,042 | | | | — | | | | — | | | | 7,762,042 | |
| Investment Funds | | | 34,046,169 | | | | — | | | | — | | | | 34,046,169 | |
| Total | | $ | 134,511,356 | | | $ | 276,595,835 | | | $ | — | | | $ | 411,107,191 | |
At June 30, 2016, equity securities valued at $26,148,774 and $15,375,432 were transferred from Level 1 to Level 2 and from Level 2 to Level 1, respectively. Transfers from Level 1 to Level 2 are due to movements of a designated U.S. market index, triggering a systematic valuation model, provided by an independent third party, when required confidence levels are achieved to fair value the international equity securities. Transfers from Level 2 to Level 1 occur when there is no longer movement of the designated U.S. market index or required confidence levels were not reached in the systematic model.
See accompanying Notes to Financial Statements.
Portfolio of Investments
Touchstone Large Cap Fund – June 30, 2016
| | | | | | Market | |
| | | Shares | | | Value | |
| | | | | | | |
| Common Stocks — 99.1% | | | | | | | | |
| | | | | | | | | |
| Financials — 23.9% | | | | | | | | |
| Alleghany Corp. | | | 20,918 | | | $ | 11,496,114 | |
| Bank of America Corp. | | | 514,214 | | | | 6,823,620 | |
| Berkshire Hathaway, Inc. - Class B* | | | 146,034 | | | | 21,144,263 | |
| BlackRock, Inc. | | | 33,322 | | | | 11,413,785 | |
| Progressive Corp. (The) | | | 319,000 | | | | 10,686,500 | |
| Wells Fargo & Co. | | | 240,044 | | | | 11,361,283 | |
| | | | | | | | 72,925,565 | |
| | | | | | | | | |
| Consumer Discretionary — 20.8% | | | | | | | | |
| CarMax, Inc.*† | | | 233,717 | | | | 11,459,144 | |
| Carnival Corp. (Panama) | | | 283,439 | | | | 12,528,004 | |
| Dollar Tree, Inc.* | | | 167,320 | | | | 15,768,237 | |
| Lowe's Cos., Inc. | | | 171,882 | | | | 13,607,898 | |
| O'Reilly Automotive, Inc.* | | | 37,930 | | | | 10,282,823 | |
| | | | | | | | 63,646,106 | |
| | | | | | | | | |
| Industrials — 15.4% | | | | | | | | |
| Deere & Co. | | | 105,338 | | | | 8,536,591 | |
| FedEx Corp. | | | 38,890 | | | | 5,902,724 | |
| General Dynamics Corp. | | | 100,677 | | | | 14,018,265 | |
| General Electric Co. | | | 300,000 | | | | 9,444,000 | |
| Norfolk Southern Corp. | | | 108,420 | | | | 9,229,795 | |
| | | | | | | | 47,131,375 | |
| | | | | | | | | |
| Information Technology — 11.2% | | | | | | | | |
| Apple, Inc. | | | 112,900 | | | | 10,793,240 | |
| Cisco Systems, Inc. | | | 278,637 | | | | 7,994,095 | |
| Visa, Inc. - Class A | | | 208,137 | | | | 15,437,521 | |
| | | | | | | | 34,224,856 | |
| | | | | | | | | |
| Consumer Staples — 10.1% | | | | | | | | |
| Altria Group, Inc. | | | 200,745 | | | | 13,843,375 | |
| Coca-Cola Co. (The) | | | 160,938 | | | | 7,295,320 | |
| Edgewell Personal Care Co.* | | | 113,322 | | | | 9,565,510 | |
| | | | | | | | 30,704,205 | |
| | | | | | | | | |
| Health Care — 7.5% | | | | | | | | |
| Bristol-Myers Squibb Co. | | | 141,369 | | | | 10,397,690 | |
| Eli Lilly & Co. | | | 159,526 | | | | 12,562,672 | |
| | | | | | | | 22,960,362 | |
| | | | | | | | | |
| Materials — 5.3% | | | | | | | | |
| Mosaic Co. (The) | | | 165,698 | | | | 4,337,974 | |
| NewMarket Corp. | | | 28,812 | | | | 11,939,117 | |
| | | | | | | | 16,277,091 | |
| | | | | | | | | |
| Energy — 2.6% | | | | | | | | |
| Chevron Corp. | | | 75,406 | | | | 7,904,811 | |
| | | | | | | | | |
| Telecommunication Services — 2.3% | | | | | | | | |
| Verizon Communications, Inc. | | | 123,569 | | | | 6,900,093 | |
| Total Common Stocks | | | | | | $ | 302,674,464 | |
| | | | | | | | | |
| Investment Funds — 4.0% | | | | | | | | |
| Dreyfus Cash Management, Institutional Shares, 0.30%∞Ω | | | 2,399,828 | | | $ | 2,399,828 | |
| Invesco Government & Agency Portfolio, Institutional Class, 0.30%**∞Ω | | | 9,730,371 | | | | 9,730,371 | |
| Total Investment Funds | | | | | | $ | 12,130,199 | |
| | | | | | | | | |
| Total Investment Securities —103.1% | | | | | | | | |
| (Cost $306,548,301) | | | | | | $ | 314,804,663 | |
| | | | | | | | | |
| Liabilities in Excess of Other Assets — (3.1%) | | | | | | | (9,528,417 | ) |
| | | | | | | | | |
| Net Assets — 100.0% | | | | | | $ | 305,276,246 | |
| * | Non-income producing security. |
| ** | Represents collateral for securities loaned. |
| † | All or a portion of the security is on loan. The total market value of the securities on loan as of June 30, 2016 was $9,736,328. |
| Ω | Represents the 7-day SEC yield as of June 30, 2016. |
Other Information:
The inputs or methodology used for valuing securities may not be an indication of the risk associated with investing in those securities. For more information on valuation inputs, and their aggregation into the levels used in the table below, please refer to the security valuation section in the accompanying Notes to Financial Statements.
Valuation inputs at Reporting Date:
| Description | | Level 1 | | | Level 2 | | | Level 3 | | | Total | |
| | | | | | | | | | | | | |
| Common Stocks | | $ | 302,674,464 | | | $ | — | | | $ | — | | | $ | 302,674,464 | |
| Investment Funds | | | 12,130,199 | | | | — | | | | — | | | | 12,130,199 | |
| Total | | $ | 314,804,663 | | | $ | — | | | $ | — | | | $ | 314,804,663 | |
See accompanying Notes to Financial Statements.
Portfolio of Investments
Touchstone Small Cap Value Opportunities Fund – June 30, 2016
| | | | | | Market | |
| | | Shares | | | Value | |
| | | | | | | |
| Common Stocks — 98.7% | | | | | | | | |
| | | | | | | | | |
| Financials — 35.4% | | | | | | | | |
| American Equity Investment Life Holding Co. | | | 86,500 | | | $ | 1,232,625 | |
| Bancorp, Inc. (The)* | | | 150,200 | | | | 904,204 | |
| BofI Holding, Inc.*† | | | 68,000 | | | | 1,204,280 | |
| Boston Private Financial Holdings, Inc. | | | 137,400 | | | | 1,618,572 | |
| Chatham Lodging Trust REIT | | | 66,400 | | | | 1,459,472 | |
| Columbia Banking System, Inc. | | | 59,700 | | | | 1,675,182 | |
| Cowen Group, Inc. - Class A*† | | | 568,000 | | | | 1,681,280 | |
| Customers Bancorp, Inc.* | | | 78,120 | | | | 1,963,156 | |
| Encore Capital Group, Inc.*† | | | 68,700 | | | | 1,616,511 | |
| Endurance Specialty Holdings Ltd. (Bermuda) | | | 28,300 | | | | 1,900,628 | |
| Equity Commonwealth REIT* | | | 86,600 | | | | 2,522,658 | |
| Federated National Holding Co. | | | 75,800 | | | | 1,443,232 | |
| FelCor Lodging Trust, Inc. REIT | | | 228,800 | | | | 1,425,424 | |
| First Busey Corp. | | | 53,200 | | | | 1,137,948 | |
| First Cash Financial Services, Inc. | | | 28,700 | | | | 1,473,171 | |
| Green Dot Corp. - Class A* | | | 93,900 | | | | 2,158,761 | |
| Greenlight Capital Re Ltd. (Cayman Island) - Class A* | | | 55,700 | | | | 1,122,912 | |
| HFF, Inc. - Class A | | | 34,000 | | | | 981,920 | |
| Infinity Property & Casualty Corp. | | | 18,700 | | | | 1,508,342 | |
| Lexington Realty Trust REIT | | | 150,100 | | | | 1,517,511 | |
| Maiden Holdings Ltd. (Bermuda) | | | 168,100 | | | | 2,057,544 | |
| Nationstar Mortgage Holdings, Inc.*† | | | 110,900 | | | | 1,248,734 | |
| New Senior Investment Group, Inc. REIT | | | 177,716 | | | | 1,898,007 | |
| Newcastle Investment Corp. REIT | | | 317,316 | | | | 1,456,480 | |
| Popular, Inc. (Puerto Rico) | | | 60,600 | | | | 1,775,580 | |
| Radian Group, Inc. | | | 152,300 | | | | 1,586,966 | |
| Ramco-Gershenson Properties Trust REIT | | | 73,600 | | | | 1,443,296 | |
| Retail Opportunity Investments Corp. REIT | | | 50,300 | | | | 1,090,001 | |
| Stewart Information Services Corp. | | | 52,700 | | | | 2,182,307 | |
| Stifel Financial Corp.* | | | 36,900 | | | | 1,160,505 | |
| Texas Capital Bancshares, Inc.* | | | 39,300 | | | | 1,837,668 | |
| | | | | | | | 48,284,877 | |
| | | | | | | | | |
| Consumer Discretionary — 15.5% | | | | | | | | |
| Ascent Capital Group, Inc.* | | | 16,000 | | | | 246,240 | |
| Barnes & Noble, Inc. | | | 138,600 | | | | 1,573,110 | |
| Bloomin' Brands, Inc. | | | 75,700 | | | | 1,352,759 | |
| EW Scripps Co. - Class A* | | | 95,400 | | | | 1,511,136 | |
| Finish Line, Inc. (The) - Class A | | | 67,200 | | | | 1,356,768 | |
| Gentherm, Inc.* | | | 40,300 | | | | 1,380,275 | |
| Houghton Mifflin Harcourt Co.* | | | 86,100 | | | | 1,345,743 | |
| Jamba, Inc.*† | | | 109,900 | | | | 1,130,871 | |
| LifeLock, Inc.*† | | | 91,700 | | | | 1,449,777 | |
| M/I Homes, Inc.* | | | 49,300 | | | | 928,319 | |
| Motorcar Parts of America, Inc.* | | | 38,500 | | | | 1,046,430 | |
| New Media Investment Group, Inc. | | | 125,887 | | | | 2,274,778 | |
| SeaWorld Entertainment, Inc.† | | | 96,700 | | | | 1,385,711 | |
| Steven Madden Ltd.* | | | 37,400 | | | | 1,278,332 | |
| Vera Bradley, Inc.* | | | 114,100 | | | | 1,616,797 | |
| World Wrestling Entertainment, Inc. - Class A† | | | 72,000 | | | | 1,325,520 | |
| | | | | | | | 21,202,566 | |
| | | | | | | | | |
| Industrials — 12.5% | | | | | | | | |
| Aerojet Rocketdyne Holdings, Inc.* | | | 77,100 | | | | 1,409,388 | |
| Air Transport Services Group, Inc.* | | | 44,400 | | | | 575,424 | |
| Allegiant Travel Co. | | | 14,300 | | | | 2,166,450 | |
| Celadon Group, Inc. | | | 138,800 | | | | 1,133,996 | |
| Comfort Systems USA, Inc. | | | 42,500 | | | | 1,384,225 | |
| Covanta Holding Corp. | | | 133,900 | | | | 2,202,655 | |
| DigitalGlobe, Inc.* | | | 107,300 | | | | 2,295,147 | |
| H&E Equipment Services, Inc. | | | 69,900 | | | | 1,330,197 | |
| Navigant Consulting, Inc.* | | | 64,600 | | | | 1,043,290 | |
| Steelcase, Inc. - Class A | | | 137,300 | | | | 1,863,161 | |
| Tutor Perini Corp.* | | | 69,000 | | | | 1,624,950 | |
| | | | | | | | 17,028,883 | |
| | | | | | | | | |
| Information Technology — 7.7% | | | | | | | | |
| AVG Technologies NV (Netherlands)* | | | 97,200 | | | | 1,845,828 | |
| ChipMOS Technologies Bermuda Ltd. (Bermuda) | | | 59,002 | | | | 1,068,526 | |
| Epiq Systems, Inc. | | | 75,700 | | | | 1,105,220 | |
| Harmonic, Inc.* | | | 175,800 | | | | 501,030 | |
| Methode Electronics, Inc. | | | 73,900 | | | | 2,529,597 | |
| ShoreTel, Inc.* | | | 210,900 | | | | 1,410,921 | |
| TiVo, Inc.* | | | 114,500 | | | | 1,133,550 | |
| VASCO Data Security International, Inc.*† | | | 56,400 | | | | 924,396 | |
| | | | | | | | 10,519,068 | |
| | | | | | | | | |
| Health Care — 6.6% | | | | | | | | |
| Air Methods Corp.* | | | 40,900 | | | | 1,465,447 | |
| Anika Therapeutics, Inc.* | | | 30,700 | | | | 1,647,055 | |
| BioTelemetry, Inc.* | | | 116,400 | | | | 1,897,320 | |
| Cynosure, Inc. - Class A* | | | 35,000 | | | | 1,702,575 | |
| Lannett Co., Inc.*† | | | 37,100 | | | | 882,609 | |
| Molina Healthcare, Inc.* | | | 27,200 | | | | 1,357,280 | |
| | | | | | | | 8,952,286 | |
| | | | | | | | | |
| Utilities — 6.2% | | | | | | | | |
| NorthWestern Corp. | | | 38,500 | | | | 2,428,195 | |
| PNM Resources, Inc. | | | 86,100 | | | | 3,051,384 | |
| Portland General Electric Co. | | | 68,500 | | | | 3,022,220 | |
| | | | | | | | 8,501,799 | |
| | | | | | | | | |
| Materials — 4.2% | | | | | | | | |
| Compass Minerals International, Inc.† | | | 9,800 | | | | 727,062 | |
| Ferro Corp.* | | | 182,100 | | | | 2,436,498 | |
| Ferroglobe PLC (United kingdom) | | | 196,500 | | | | 1,691,865 | |
| Resolute Forest Products, Inc.* | | | 162,600 | | | | 860,154 | |
| | | | | | | | 5,715,579 | |
| | | | | | | | | |
| Consumer Staples — 4.1% | | | | | | | | |
| Andersons, Inc. (The) | | | 49,600 | | | | 1,762,784 | |
| Casey's General Stores, Inc. | | | 12,100 | | | | 1,591,271 | |
Touchstone Small Cap Value Opportunities Fund (Continued)
| | | | | | Market | |
| | | Shares | | | Value | |
| | | | | | | |
| Common Stocks — 98.7% (Continued) | | | | | | | | |
| | | | | | | | | |
| Consumer Staples — (Continued) | | | | | | | | |
| TreeHouse Foods, Inc.* | | | 21,500 | | | $ | 2,206,975 | |
| | | | | | | | 5,561,030 | |
| | | | | | | | | |
| Energy — 3.9% | | | | | | | | |
| Aegean Marine Petroleum Network, Inc. (Marshall Islands)† | | | 171,000 | | | | 940,500 | |
| Delek U.S. Holdings, Inc. | | | 90,000 | | | | 1,188,900 | |
| Helix Energy Solutions Group, Inc.* | | | 174,400 | | | | 1,178,944 | |
| Newpark Resources, Inc.* | | | 181,200 | | | | 1,049,148 | |
| PBF Energy, Inc. | | | 42,200 | | | | 1,003,516 | |
| | | | | | | | 5,361,008 | |
| | | | | | | | | |
| Telecommunication Services — 2.6% | | | | | | | | |
| FairPoint Communications, Inc.*† | | | 88,500 | | | | 1,299,180 | |
| Vonage Holdings Corp.* | | | 372,900 | | | | 2,274,690 | |
| | | | | | | | 3,573,870 | |
| Total Common Stocks | | | | | | $ | 134,700,966 | |
| | | | | | | | | |
| Investment Funds — 11.2% | | | | | | | | |
| Dreyfus Cash Management, Institutional Shares, 0.30%∞Ω | | | 1,862,415 | | | | 1,862,415 | |
| Invesco Government & Agency Portfolio, Institutional Class, 0.30%**∞Ω | | | 13,452,919 | | | | 13,452,919 | |
| Total Investment Funds | | | | | | $ | 15,315,334 | |
| | | | | | | | | |
| Total Investment Securities —109.9% | | | | | | | | |
| (Cost $153,970,529) | | | | | | $ | 150,016,300 | |
| | | | | | | | | |
| Liabilities in Excess of Other Assets — (9.9%) | | | | | | | (13,533,450 | ) |
| | | | | | | | | |
| Net Assets — 100.0% | | | | | | $ | 136,482,850 | |
| * | Non-income producing security. |
| ** | Represents collateral for securities loaned. |
| † | All or a portion of the security is on loan. The total market value of the securities on loan as of June 30, 2016 was $13,148,575. |
| Ω | Represents the 7-day SEC yield as of June 30, 2016. |
Portfolio Abbreviations:
PLC - Public Limited Company
REIT - Real Estate Investment Trust
Other Information:
The inputs or methodology used for valuing securities may not be an indication of the risk associated with investing in those securities. For more information on valuation inputs, and their aggregation into the levels used in the table below, please refer to the security valuation section in the accompanying Notes to Financial Statements.
Valuation inputs at Reporting Date:
| Description | | Level 1 | | | Level 2 | | | Level 3 | | | Total | |
| | | | | | | | | | | | | |
| Common Stocks | | $ | 134,700,966 | | | $ | — | | | $ | — | | | $ | 134,700,966 | |
| Investment Funds | | | 15,315,334 | | | | — | | | | — | | | | 15,315,334 | |
| Total | | $ | 150,016,300 | | | $ | — | | | $ | — | | | $ | 150,016,300 | |
See accompanying Notes to Financial Statements.
Portfolio of Investments
Touchstone Value Fund – June 30, 2016
| | | | | | Market | |
| | | Shares | | | Value | |
| | | | | | | |
| Common Stocks — 99.4% | | | | | | | | |
| | | | | | | | | |
| Health Care — 24.3% | | | | | | | | |
| Anthem, Inc. | | | 61,932 | | | $ | 8,134,149 | |
| Cardinal Health, Inc. | | | 58,100 | | | | 4,532,381 | |
| Express Scripts Holding Co.* | | | 84,100 | | | | 6,374,780 | |
| Johnson & Johnson | | | 87,640 | | | | 10,630,732 | |
| Medtronic PLC (Ireland) | | | 142,874 | | | | 12,397,177 | |
| Merck & Co., Inc. | | | 145,829 | | | | 8,401,209 | |
| Pfizer, Inc. | | | 330,173 | | | | 11,625,391 | |
| Sanofi ADR | | | 209,528 | | | | 8,768,747 | |
| Teva Pharmaceutical Industries Ltd. ADR | | | 134,974 | | | | 6,779,744 | |
| UnitedHealth Group, Inc. | | | 53,139 | | | | 7,503,227 | |
| | | | | | | | 85,147,537 | |
| | | | | | | | | |
| Financials — 19.9% | | | | | | | | |
| American Express Co. | | | 133,592 | | | | 8,117,050 | |
| American International Group, Inc. | | | 104,477 | | | | 5,525,788 | |
| Bank of America Corp. | | | 469,564 | | | | 6,231,114 | |
| Capital One Financial Corp. | | | 120,230 | | | | 7,635,807 | |
| Citigroup, Inc. | | | 163,089 | | | | 6,913,343 | |
| JPMorgan Chase & Co. | | | 187,165 | | | | 11,630,433 | |
| PNC Financial Services Group, Inc. (The) | | | 107,277 | | | | 8,731,275 | |
| State Street Corp. | | | 112,805 | | | | 6,082,446 | |
| Wells Fargo & Co. | | | 189,032 | | | | 8,946,885 | |
| | | | | | | | 69,814,141 | |
| | | | | | | | | |
| Energy — 12.1% | | | | | | | | |
| BP PLC ADR | | | 296,646 | | | | 10,533,899 | |
| Chevron Corp. | | | 37,200 | | | | 3,899,676 | |
| ConocoPhillips | | | 174,711 | | | | 7,617,400 | |
| Marathon Petroleum Corp. | | | 122,900 | | | | 4,665,284 | |
| Occidental Petroleum Corp. | | | 129,789 | | | | 9,806,857 | |
| Phillips 66 | | | 75,843 | | | | 6,017,384 | |
| | | | | | | | 42,540,500 | |
| | | | | | | | | |
| Information Technology — 11.6% | | | | | | | | |
| Intel Corp. | | | 117,447 | | | | 3,852,262 | |
| Microsoft Corp. | | | 201,394 | | | | 10,305,331 | |
| Oracle Corp. | | | 266,173 | | | | 10,894,461 | |
| QUALCOMM, Inc. | | | 148,108 | | | | 7,934,145 | |
| Texas Instruments, Inc. | | | 121,182 | | | | 7,592,052 | |
| | | | | | | | 40,578,251 | |
| | | | | | | | | |
| Industrials — 10.0% | | | | | | | | |
| Deere & Co. | | | 39,344 | | | | 3,188,438 | |
| General Dynamics Corp. | | | 49,364 | | | | 6,873,443 | |
| Honeywell International, Inc. | | | 57,306 | | | | 6,665,834 | |
| Norfolk Southern Corp. | | | 42,600 | | | | 3,626,538 | |
| Raytheon Co. | | | 31,068 | | | | 4,223,695 | |
| United Technologies Corp. | | | 102,000 | | | | 10,460,100 | |
| | | | | | | | 35,038,048 | |
| | | | | | | | | |
| Consumer Staples — 5.6% | | | | | | | | |
| Altria Group, Inc. | | | 130,988 | | | | 9,032,932 | |
| Philip Morris International, Inc. | | | 105,545 | | | | 10,736,037 | |
| | | | | | | | 19,768,969 | |
| | | | | | | | | |
| Consumer Discretionary — 5.3% | | | | | | | | |
| Carnival Corp. (Panama) | | | 85,296 | | | | 3,770,083 | |
| Johnson Controls, Inc. | | | 252,652 | | | | 11,182,378 | |
| Target Corp. | | | 49,495 | | | | 3,455,741 | |
| | | | | | | | 18,408,202 | |
| | | | | | | | | |
| Materials — 5.1% | | | | | | | | |
| Air Products & Chemicals, Inc. | | | 73,300 | | | | 10,411,532 | |
| CRH PLC ADR† | | | 252,671 | | | | 7,474,008 | |
| | | | | | | | 17,885,540 | |
| | | | | | | | | |
| Telecommunication Services — 4.6% | | | | | | | | |
| AT&T, Inc. | | | 98,059 | | | | 4,237,129 | |
| Verizon Communications, Inc. | | | 210,351 | | | | 11,746,000 | |
| | | | | | | | 15,983,129 | |
| | | | | | | | | |
| Utilities — 0.9% | | | | | | | | |
| Entergy Corp. | | | 37,624 | | | | 3,060,712 | |
| Total Common Stocks | | | | | | $ | 348,225,029 | |
| | | | | | | | | |
| Investment Funds — 0.9% | | | | | | | | |
| Dreyfus Cash Management, Institutional Shares, 0.30%∞Ω | | | 1,453,304 | | | | 1,453,304 | |
| Invesco Government & Agency Portfolio, Institutional Class, 0.30%**∞Ω | | | 1,449,420 | | | | 1,449,420 | |
| Total Investment Funds | | | | | | $ | 2,902,724 | |
| | | | | | | | | |
| Total Investment Securities —100.3% | | | | | | | | |
| (Cost $277,025,281) | | | | | | $ | 351,127,753 | |
| | | | | | | | | |
| Liabilities in Excess of Other Assets — (0.3%) | | | | | | | (887,950 | ) |
| | | | | | | | | |
| Net Assets — 100.0% | | | | | | $ | 350,239,803 | |
| * | Non-income producing security. |
| ** | Represents collateral for securities loaned. |
| † | All or a portion of the security is on loan. The total market value of the securities on loan as of June 30, 2016 was $1,458,294. |
| Ω | Represents the 7-day SEC yield as of June 30, 2016. |
Portfolio Abbreviations:
ADR - American Depositary Receipt
PLC - Public Limited Company
Touchstone Value Fund (Continued)
Other Information:
The inputs or methodology used for valuing securities may not be an indication of the risk associated with investing in those securities. For more information on valuation inputs, and their aggregation into the levels used in the table below, please refer to the security valuation section in the accompanying Notes to Financial Statements.
Valuation inputs at Reporting Date:
| Description | | Level 1 | | | Level 2 | | | Level 3 | | | Total | |
| | | | | | | | | | | | | |
| Common Stocks | | $ | 348,225,029 | | | $ | — | | | $ | — | | | $ | 348,225,029 | |
| Investment Funds | | | 2,902,724 | | | | — | | | | — | | | | 2,902,724 | |
| Total | | $ | 351,127,753 | | | $ | — | | | $ | — | | | $ | 351,127,753 | |
See accompanying Notes to Financial Statements.
This page intentionally left blank.
Statements of Assets and Liabilities
June 30, 2016
| | | Touchstone | | | Touchstone | | | | |
| | | Credit | | | International | | | Touchstone | |
| | | Opportunities | | | Small Cap | | | Large Cap | |
| | | Fund | | | Fund | | | Fund | |
| Assets | | | | | | | | | | | | |
| Investments, at cost | | $ | 52,152,394 | | | $ | 390,387,237 | | | $ | 306,548,301 | |
| Investments, at market value (A) | | $ | 52,649,647 | | | $ | 411,107,191 | | | $ | 314,804,663 | |
| Cash | | | 133,329 | | | | — | | | | — | |
| Cash deposits held at prime broker | | | 743,707 | | | | — | | | | | |
| Foreign currency (B) | | | 15,782 | | | | 1,955,503 | | | | — | |
| Unrealized appreciation on forward foreign currency contracts | | | 3,599 | | | | — | | | | — | |
| Dividends and interest receivable | | | 651,528 | | | | 511,533 | | | | 493,842 | |
| Receivable for capital shares sold | | | — | | | | 857,467 | | | | 166,865 | |
| Receivable for investments sold | | | 1,485,773 | | | | 6,900,207 | | | | — | |
| Receivable for securities lending income | | | — | | | | 52,258 | | | | 2,004 | |
| Tax reclaim receivable | | | — | | | | 296,180 | | | | 22,758 | |
| Other assets | | | 2,492 | | | | 40,767 | | | | 18,172 | |
| Total Assets | | | 55,685,857 | | | | 421,721,106 | | | | 315,508,304 | |
| | | | | | | | | | | | | |
| Liabilities | | | | | | | | | | | | |
| Unrealized depreciation on unfunded loan commitments* | | | 81 | | | | — | | | | — | |
| Securities sold short (C) | | | 751,419 | | | | — | | | | — | |
| Dividends and interest payable on securities sold short | | | 10,926 | | | | — | | | | — | |
| Payable for return of collateral for securities on loan | | | — | | | | 22,456,569 | | | | 9,730,371 | |
| Payable for capital shares redeemed | | | 17,850 | | | | 473,475 | | | | 247,583 | |
| Payable for investments purchased | | | 352,774 | | | | 6,442,991 | | | | — | |
| Payable to Investment Advisor | | | 56,692 | | | | 290,885 | | | | 152,811 | |
| Payable to other affiliates | | | 238 | | | | 51,035 | | | | 6,338 | |
| Payable to Trustees | | | 4,120 | | | | 4,120 | | | | 4,120 | |
| Payable to Transfer Agent | | | 49 | | | | 73,998 | | | | 66,074 | |
| Payable for professional services | | | 9,128 | | | | 11,021 | | | | 9,076 | |
| Other accrued expenses and liabilities | | | 19,463 | | | | 33,759 | | | | 15,685 | |
| Total Liabilities | | | 1,222,740 | | | | 29,837,853 | | | | 10,232,058 | |
| Net Assets | | $ | 54,463,117 | | | $ | 391,883,253 | | | $ | 305,276,246 | |
| | | | | | | | | | | | | |
| Net assets consist of: | | | | | | | | | | | | |
| Paid-in capital | | $ | 53,917,796 | | | $ | 391,528,770 | | | $ | 310,196,946 | |
| Accumulated net investment income | | | 31,870 | | | | 2,391,872 | | | | 1,635,063 | |
| Accumulated net realized losses on investments, foreign currency transactions and securities sold short | | | (492 | ) | | | (22,717,582 | ) | | | (14,812,125 | ) |
| Net unrealized appreciation (depreciation) on investments, foreign currency transactions, securities sold short and unfunded loan commitments | | | 513,943 | | | | 20,680,193 | | | | 8,256,362 | |
| Net Assets | | $ | 54,463,117 | | | $ | 391,883,253 | | | $ | 305,276,246 | |
| (A) Includes market value of securities on loan of: | | $ | — | | | $ | 18,775,860 | | | $ | 9,736,328 | |
| (B) Cost of foreign currency: | | $ | — | | | $ | 1,960,164 | | | $ | — | |
| (C) Proceeds received for securities sold short: | | $ | 764,719 | | | $ | — | | | $ | — | |
* See Note 2 in Notes to Financial Statements.
See accompanying Notes to Financial Statements.
Statements of Assets and Liabilities (Continued)
| Touchstone | | | | |
| Small Cap | | | | |
| Value | | | | |
| Opportunities | | | Touchstone | |
| Fund | | | Value Fund | |
| | | | | | | |
| $ | 153,970,529 | | | $ | 277,025,281 | |
| $ | 150,016,300 | | | $ | 351,127,753 | |
| | — | | | | — | |
| | — | | | | — | |
| | — | | | | — | |
| | — | | | | — | |
| | 179,323 | | | | 646,694 | |
| | 16,376 | | | | 370,830 | |
| | 811,633 | | | | — | |
| | 12,569 | | | | 202 | |
| | — | | | | — | |
| | 21,645 | | | | 26,144 | |
| | 151,057,846 | | | | 352,171,623 | |
| | | | | | | |
| | | | | | | |
| | — | | | | — | |
| | — | | | | — | |
| | — | | | | — | |
| | 13,452,919 | | | | 1,449,420 | |
| | 465,343 | | | | 207,994 | |
| | 495,203 | | | | — | |
| | 101,658 | | | | 180,870 | |
| | 9,215 | | | | 5,690 | |
| | 4,120 | | | | 4,120 | |
| | 26,519 | | | | 58,073 | |
| | 5,541 | | | | 8,480 | |
| | 14,478 | | | | 17,173 | |
| | 14,574,996 | | | | 1,931,820 | |
| $ | 136,482,850 | | | $ | 350,239,803 | |
| | | | | | | |
| | | | | | | |
| $ | 147,830,341 | | | $ | 288,798,081 | |
| | 37,431 | | | | 201,182 | |
| | (7,430,693 | ) | | | (12,861,932 | ) |
| | (3,954,229 | ) | | | 74,102,472 | |
| $ | 136,482,850 | | | $ | 350,239,803 | |
| $ | 13,148,575 | | | $ | 1,458,294 | |
| $ | — | | | $ | — | |
| $ | — | | | $ | — | |
Statements of Assets and Liabilities (Continued)
| | | Touchstone | | | Touchstone | | | | |
| | | Credit | | | International | | | Touchstone | |
| | | Opportunities | | | Small Cap | | | Large Cap | |
| | | Fund | | | Fund | | | Fund | |
| | | | | | | | | | |
| Pricing of Class A Shares | | | | | | | | | | | | |
| Net assets applicable to Class A shares | | $ | 43,264 | | | $ | 23,095,397 | | | $ | 3,657,236 | |
Shares of beneficial interest outstanding
(unlimited number of shares authorized, no par value) | | | 4,303 | | | | 1,541,920 | | | | 348,778 | |
| Net asset value price per share* | | $ | 10.05 | | | $ | 14.98 | | | $ | 10.49 | |
| Maximum sales charge - Class A shares | | | 5.75 | % | | | 5.75 | % | | | 5.75 | % |
Maximum offering price per share
(100%/(100%-maximum sales charge) of net asset value
adjusted to the nearest cent per share - Class A shares) | | $ | 10.66 | | | $ | 15.89 | | | $ | 11.13 | |
| | | | | | | | | | | | | |
| Pricing of Class C Shares | | | | | | | | | | | | |
| Net assets applicable to Class C shares | | $ | 6,433 | | | $ | 4,293,906 | | | $ | 6,124,206 | |
Shares of beneficial interest outstanding
(unlimited number of shares authorized, no par value) | | | 638 | | | | 292,756 | | | | 590,691 | |
| Net asset value, offering price per share** | | $ | 10.08 | | | $ | 14.67 | | | $ | 10.37 | |
| | | | | | | | | | | | | |
| Pricing of Class Y Shares | | | | | | | | | | | | |
| Net assets applicable to Class Y shares | | $ | 2,577 | | | $ | 166,800,723 | | | $ | 208,462,825 | |
Shares of beneficial interest outstanding
(unlimited number of shares authorized, no par value) | | | 257 | | | | 10,837,888 | | | | 19,821,329 | |
| Net asset value, offering price and redemption price per share | | $ | 10.04 | | | $ | 15.39 | | | $ | 10.52 | |
| | | | | | | | | | | | | |
| Pricing of Institutional Class Shares | | | | | | | | | | | | |
| Net assets applicable to Institutional Class shares | | $ | 54,410,843 | | | $ | 197,693,227 | | | $ | 87,031,979 | |
Shares of beneficial interest outstanding
(unlimited number of shares authorized, no par value) | | | 5,415,484 | | | | 12,769,599 | | | | 8,263,941 | |
| Net asset value, offering price and redemption price per share | | $ | 10.05 | | | $ | 15.48 | | | $ | 10.53 | |
* There is no sales load on subscriptions of $1 million or more. Redemptions that were part of a $1 million or more subscription may be subject to a contingent deferred sales load if redeemed within a one-year period from the date of purchase.
** Redemption price per share varies by length of time shares are held due to the terms of the contingent deferred sales charge.
See accompanying Notes to Financial Statements.
Statements of Assets and Liabilities (Continued)
| Touchstone | | | | |
| Small Cap Value | | | Touchstone | |
| Opportunities | | | Value | |
| Fund | | | Fund | |
| | | | | |
| $ | 4,502,843 | | | $ | 47,939,137 | |
| | | | | | | |
| | 303,402 | | | | 5,422,262 | |
| $ | 14.84 | | | $ | 8.84 | |
| | 5.75 | % | | | 5.75 | % |
| | | | | | | |
| | | | | | | |
| $ | 15.75 | | | $ | 9.38 | |
| | | | | | | |
| | | | | | | |
| $ | 1,120,942 | | | $ | 5,623,803 | |
| | | | | | | |
| | 77,615 | | | | 638,141 | |
| $ | 14.44 | | | $ | 8.81 | |
| | | | | | | |
| | | | | | | |
| $ | 104,376,550 | | | $ | 76,852,376 | |
| | | | | | | |
| | 6,620,444 | | | | 8,661,073 | |
| $ | 15.77 | | | $ | 8.87 | |
| | | | | | | |
| | | | | | | |
| $ | 26,482,515 | | | $ | 219,824,487 | |
| | | | | | | |
| | 1,655,781 | | | | 24,834,950 | |
| $ | 15.99 | | | $ | 8.85 | |
Statements of Operations
For the Year Ended June 30, 2016
| | | Touchstone | | | Touchstone | | | | |
| | | Credit | | | International | | | Touchstone | |
| | | Opportunities | | | Small Cap | | | Large Cap | |
| | | Fund(B) | | | Fund | | | Fund | |
| Investment Income | | | | | | | | | | | | |
| Dividends(A) | | $ | 44,715 | | | $ | 7,339,549 | | | $ | 5,745,793 | |
| Interest | | | 2,021,170 | | | | — | | | | — | |
| Income from securities loaned | | | — | | | | 146,354 | | | | 9,451 | |
| Total Investment Income | | | 2,065,885 | | | | 7,485,903 | | | | 5,755,244 | |
| Expenses | | | | | | | | | | | | |
| Investment advisory fees | | | 431,564 | | | | 3,292,966 | | | | 2,029,554 | |
| Administration fees | | | 56,888 | | | | 506,650 | | | | 420,408 | |
| Compliance fees and expenses | | | 2,337 | | | | 2,781 | | | | 2,781 | |
| Custody fees | | | 25,650 | | | | 109,624 | | | | 9,821 | |
| Professional fees | | | 64,501 | | | | 48,493 | | | | 32,798 | |
| Transfer Agent fees, Class A | | | 35 | | | | 39,999 | | | | 3,769 | |
| Transfer Agent fees, Class C | | | 21 | | | | 6,782 | | | | 4,210 | |
| Transfer Agent fees, Class Y | | | 21 | | | | 226,249 | | | | 245,318 | |
| Transfer Agent fees, Institutional Class | | | 57 | | | | 53,893 | | | | 18,378 | |
| Registration Fees, Class A | | | 736 | | | | 16,761 | | | | 3,981 | |
| Registration Fees, Class C | | | 736 | | | | 8,709 | | | | 9,224 | |
| Registration Fees, Class Y | | | 736 | | | | 30,814 | | | | 17,770 | |
| Registration Fees, Institutional Class | | | 736 | | | | 20,068 | | | | 4,811 | |
| Dividend expense on securities sold short | | | 459 | | | | — | | | | — | |
| Interest expense on securities sold short | | | 16,677 | | | | — | | | | — | |
| Reports to Shareholders, Class A | | | 6,540 | | | | 9,305 | | | | 4,711 | |
| Reports to Shareholders, Class C | | | 6,549 | | | | 6,025 | | | | 4,851 | |
| Reports to Shareholders, Class Y | | | 6,548 | | | | 26,169 | | | | 27,754 | |
| Reports to Shareholders, Institutional Class | | | 8,826 | | | | 5,929 | | | | 4,170 | |
| Distribution expenses, Class A | | | 50 | | | | 67,569 | | | | 5,855 | |
| Distribution and shareholder servicing expenses, Class C | | | 27 | | | | 47,040 | | | | 37,238 | |
| Trustee fees | | | 15,822 | | | | 15,822 | | | | 15,822 | |
| Other expenses | | | 26,511 | | | | 101,953 | | | | 86,501 | |
| Total Expenses | | | 672,027 | | | | 4,643,601 | | | | 2,989,725 | |
| Fees waived and/or reimbursed by the Advisor and/or Affiliates(C) | | | (129,046 | ) | | | (147,586 | ) | | | (508,187 | ) |
| Net Expenses | | | 542,981 | | | | 4,496,015 | | | | 2,481,538 | |
| Net Investment Income | | | 1,522,904 | | | | 2,989,888 | | | | 3,273,706 | |
| Realized and Unrealized Gains (Losses) on Investments | | | | | | | | | | | | |
| Net realized gains (losses) on investments | | | (98,779 | ) | | | (15,912,610 | ) | | | (14,607,680 | ) |
| Net realized losses on foreign currency transactions | | | (1,190 | ) | | | (109,593 | ) | | | — | |
| Net realized gains on securities sold short | | | 62,653 | | | | — | | | | — | |
| Net change in unrealized appreciation (depreciation) on investments | | | 497,253 | | | | (13,039,505 | ) | | | 7,920,893 | |
| Net change in unrealized appreciation (depreciation) on foreign currency transactions | | | 3,471 | | | | 11,945 | | | | — | |
| Net change in unrealized appreciation (depreciation) on securities sold short | | | 13,300 | | | | — | | | | — | |
| Net change in unrealized appreciation (depreciation) on unfunded loan commitments | | | (81 | ) | | | — | | | | — | |
| Net Realized and Unrealized Gains (Losses) on Investments | | | 476,627 | | | | (29,049,763 | ) | | | (6,686,787 | ) |
| Change in Net Assets Resulting from Operations | | $ | 1,999,531 | | | $ | (26,059,875 | ) | | $ | (3,413,081 | ) |
| (A) Net of foreign tax withholding of: | | $ | — | | | $ | 656,500 | | | $ | — | |
(B) Represents the period from commencement of operations (September 1, 2015) through June 30, 2016.
(C) See Note 4 in Notes to Financial Statements.
See accompanying Notes to Financial Statements.
Statements of Operations (Continued)
| Touchstone | | | | |
| Small Cap Value | | | Touchstone | |
| Opportunities | | | Value | |
| Fund | | | Fund | |
| | | | | | | |
| $ | 1,648,727 | | | $ | 10,537,677 | |
| | — | | | | — | |
| | 234,897 | | | | 9,957 | |
| | 1,883,624 | | | | 10,547,634 | |
| | | | | | | |
| | 1,474,262 | | | | 2,457,744 | |
| | 225,019 | | | | 548,266 | |
| | 2,781 | | | | 2,781 | |
| | 11,971 | | | | 11,059 | |
| | 27,538 | | | | 36,100 | |
| | 14,501 | | | | 77,388 | |
| | 2,589 | | | | 6,553 | |
| | 122,601 | | | | 113,917 | |
| | 5,071 | | | | 61,780 | |
| | 17,165 | | | | 16,114 | |
| | 2,813 | | | | 8,281 | |
| | 19,077 | | | | 16,870 | |
| | 14,157 | | | | 16,390 | |
| | — | | | | — | |
| | — | | | | — | |
| | 5,737 | | | | 9,406 | |
| | 4,811 | | | | 5,656 | |
| | 15,455 | | | | 8,949 | |
| | 5,473 | | | | 16,491 | |
| | 22,259 | | | | 125,931 | |
| | 15,846 | | | | 61,844 | |
| | 15,822 | | | | 15,822 | |
| | 27,021 | | | | 52,213 | |
| | 2,051,969 | | | | 3,669,555 | |
| | (205,476 | ) | | | (697,664 | ) |
| | 1,846,493 | | | | 2,971,891 | |
| | 37,131 | | | | 7,575,743 | |
| | | | | | | |
| | (5,632,369 | ) | | | 2,856,372 | |
| | — | | | | — | |
| | — | | | | — | |
| | (19,879,588 | ) | | | (15,515,282 | ) |
| | — | | | | — | |
| | — | | | | — | |
| | — | | | | — | |
| | (25,511,957 | ) | | | (12,658,910 | ) |
| $ | (25,474,826 | ) | | $ | (5,083,167 | ) |
| $ | 3,062 | | | $ | 98,776 | |
Statements of Changes in Net Assets
| | | Touchstone | | | | |
| | | Credit | | | Touchstone | |
| | | Opportunities | | | International | |
| | | Fund | | | Small Cap Fund | |
| | | For the Period | | | For the Year | | | For the Year | |
| | | Ended June 30, | | | Ended | | | Ended | |
| | | 2016(B) | | | June 30, 2016 | | | June 30, 2015 | |
| From Operations | | | | | | | | | | | | |
| Net investment income | | $ | 1,522,904 | | | $ | 2,989,888 | | | $ | 1,958,359 | |
| Net realized gains (losses) on investments, foreign currency transactions and securities sold short | | | (37,316 | ) | | | (16,022,203 | ) | | | 11,461,702 | |
| Net change in unrealized appreciation (depreciation) on investments, foreign currency transactions, securities sold short and unfunded loan commitments | | | 513,943 | | | | (13,027,560 | ) | | | (1,899,696 | ) |
| Change in Net Assets from Operations | | | 1,999,531 | | | | (26,059,875 | ) | | | 11,520,365 | |
| Distributions to Shareholders from: | | | | | | | | | | | | |
| Net investment income, Class A | | | (763 | ) | | | (170,544 | ) | | | (37,754 | ) |
| Net investment income, Class C | | | (71 | ) | | | (26,681 | ) | | | (2,327 | ) |
| Net investment income, Class Y | | | (62 | ) | | | (1,290,541 | ) | | | (785,529 | ) |
| Net investment income, Institutional Class | | | (1,380,908 | ) | | | (854,764 | ) | | | (256,269 | ) |
| Net realized gains, Class A | | | (6 | ) | | | — | | | | — | |
| Net realized gains, Class C | | | (3 | ) | | | — | | | | — | |
| Net realized gains, Class Y | | | (3 | ) | | | — | | | | — | |
| Net realized gains, Institutional Class | | | (76,436 | ) | | | — | | | | — | |
| Total Distributions | | | (1,458,252 | ) | | | (2,342,530 | ) | | | (1,081,879 | ) |
| | | | | | | | | | | | | |
| Net Increase (Decrease) from Share Transactions(A) | | | 53,921,838 | | | | 171,734,256 | | | | 76,020,244 | |
| | | | | | | | | | | | | |
| Total Increase (Decrease) in Net Assets | | | 54,463,117 | | | | 143,331,851 | | | | 86,458,730 | |
| Net Assets | | | | | | | | | | | | |
| Beginning of period | | | — | | | | 248,551,402 | | | | 162,092,672 | |
| End of period | | $ | 54,463,117 | | | $ | 391,883,253 | | | $ | 248,551,402 | |
| Accumulated Net Investment Income | | $ | 31,870 | | | $ | 2,391,872 | | | $ | 1,566,468 | |
(A) For details on share transactions by class, see Statements of Changes in Net Assets - Capital Stock Activity on pages 50-52.
(B) Represents the period from commencement of operations (September 1, 2015) through June 30, 2016.
(C) Represents the period from commencement of operations (July 10, 2014) through June 30, 2015.
See accompanying Notes to Financial Statements.
Statements of Changes in Net Assets (Continued)
| Touchstone | | | Touchstone | | | | |
| Large Cap | | | Small Cap | | | Touchstone | |
| Fund | | | Value Opportunities Fund | | | Value Fund | |
| For the Year | | | For the Period | | | For the Year | | | For the Year | | | For the Year | | | For the Year | |
| Ended | | | Ended June 30, | | | Ended | | | Ended | | | Ended | | | Ended | |
| June 30, 2016 | | | 2015(C) | | | June 30, 2016 | | | June 30, 2015 | | | June 30, 2016 | | | June 30, 2015 | |
| | | | | | | | | | | | | | | | | | | | | | | |
| $ | 3,273,706 | | | $ | 633,467 | | | $ | 37,131 | | | $ | 1,026,812 | | | $ | 7,575,743 | | | $ | 7,892,038 | |
| | (14,607,680 | ) | | | (193,216 | ) | | | (5,632,369 | ) | | | 16,058,310 | | | | 2,856,372 | | | | 38,511,219 | |
| | 7,920,893 | | | | (3,324,366 | ) | | | (19,879,588 | ) | | | (11,306,717 | ) | | | (15,515,282 | ) | | | (21,863,427 | ) |
| | (3,413,081 | ) | | | (2,884,115 | ) | | | (25,474,826 | ) | | | 5,778,405 | | | | (5,083,167 | ) | | | 24,539,830 | |
| | | | | | | | | | | | | | | | | | | | | | | |
| | (12,125 | ) | | | (133 | ) | | | — | | | | (269,790 | ) | | | (861,443 | ) | | | (681,294 | ) |
| | (21,929 | ) | | | — | | | | — | | | | (24,922 | ) | | | (58,802 | ) | | | (34,479 | ) |
| | (1,492,225 | ) | | | (1,110 | ) | | | — | | | | (2,673,760 | ) | | | (1,653,061 | ) | | | (1,563,242 | ) |
| | (652,137 | ) | | | (92,451 | ) | | | — | | | | (467,019 | ) | | | (4,968,698 | ) | | | (4,035,735 | ) |
| | — | | | | — | | | | (664,219 | ) | | | (1,781,329 | ) | | | (3,619,682 | ) | | | (1,056,528 | ) |
| | — | | | | — | | | | (137,745 | ) | | | (179,373 | ) | | | (441,793 | ) | | | (98,205 | ) |
| | — | | | | — | | | | (8,245,264 | ) | | | (16,418,203 | ) | | | (6,054,784 | ) | | | (1,898,093 | ) |
| | — | | | | — | | | | (2,203,046 | ) | | | (2,756,437 | ) | | | (16,589,894 | ) | | | (4,392,373 | ) |
| | (2,178,416 | ) | | | (93,694 | ) | | | (11,250,274 | ) | | | (24,570,833 | ) | | | (34,248,157 | ) | | | (13,759,949 | ) |
| | | | | | | | | | | | | | | | | | | | | | | |
| | 14,369,777 | | | | 299,475,775 | | | | (25,258,785 | ) | | | 36,213,437 | | | | (25,949,923 | ) | | | (25,104,709 | ) |
| | | | | | | | | | | | | | | | | | | | | | | |
| | 8,778,280 | | | | 296,497,966 | | | | (61,983,885 | ) | | | 17,421,009 | | | | (65,281,247 | ) | | | (14,324,828 | ) |
| | | | | | | | | | | | | | | | | | | | | | | |
| | 296,497,966 | | | | — | | | | 198,466,735 | | | | 181,045,726 | | | | 415,521,050 | | | | 429,845,878 | |
| $ | 305,276,246 | | | $ | 296,497,966 | | | $ | 136,482,850 | | | $ | 198,466,735 | | | $ | 350,239,803 | | | $ | 415,521,050 | |
| $ | 1,635,063 | | | $ | 539,773 | | | $ | 37,431 | | | $ | 300 | | | $ | 201,182 | | | $ | 167,538 | |
Statements of Changes in Net Assets - Capital Stock Activity
| | | Touchstone | | | | | | | | | | | | | |
| | | Credit Opportunities Fund | | | Touchstone International Small Cap Fund | |
| | | For the | | | For the | | | For the | |
| | | Period Ended | | | Year Ended | | | Year Ended | |
| | | June 30, 2016(B) | | | June 30, 2016 | | | June 30, 2015 | |
| | | Shares | | | Dollars | | | Shares | | | Dollars | | | Shares | | | Dollars | |
| Class A | | | | | | | | | | | | | | | | | | | | | | | | |
| Proceeds from Shares issued | | | 4,225 | | | $ | 41,194 | | | | 1,297,550 | | | $ | 20,328,627 | | | | 1,199,963 | | | $ | 19,218,862 | |
| Proceeds from Shares issued in connection with merger(A) | | | — | | | | — | | | | — | | | | — | | | | — | | | | — | |
| Reinvestment of distributions | | | 78 | | | | 769 | | | | 9,887 | | | | 158,978 | | | | 2,511 | | | | 36,985 | |
| Cost of Shares redeemed | | | — | | | | — | | | | (1,256,673 | ) | | | (19,261,081 | ) | | | (403,993 | ) | | | (6,230,270 | ) |
| Change from Class A Share Transactions | | | 4,303 | | | | 41,963 | | | | 50,764 | | | | 1,226,524 | | | | 798,481 | | | | 13,025,577 | |
| Class C | | | | | | | | | | | | | | | | | | | | | | | | |
| Proceeds from Shares issued | | | 631 | | | | 6,354 | | | | 133,443 | | | | 2,080,162 | | | | 230,566 | | | | 3,680,381 | |
| Proceeds from Shares issued in connection with merger(A) | | | — | | | | — | | | | — | | | | — | | | | — | | | | — | |
| Reinvestment of distributions | | | 7 | | | | 74 | | | | 1,418 | | | | 22,400 | | | | 140 | | | | 2,028 | |
| Cost of Shares redeemed | | | — | | | | — | | | | (95,192 | ) | | | (1,430,219 | ) | | | (17,581 | ) | | | (266,401 | ) |
| Change from Class C Share Transactions | | | 638 | | | | 6,428 | | | | 39,669 | | | | 672,343 | | | | 213,125 | | | | 3,416,008 | |
| Class Y | | | | | | | | | | | | | | | | | | | | | | | | |
| Proceeds from Shares issued | | | 250 | | | | 2,500 | | | | 4,883,659 | | | | 78,063,592 | | | | 4,445,221 | | | | 72,611,024 | |
| Proceeds from Shares issued in connection with merger(A) | | | — | | | | — | | | | — | | | | — | | | | — | | | | — | |
| Reinvestment of distributions | | | 7 | | | | 65 | | | | 74,065 | | | | 1,222,070 | | | | 50,521 | | | | 761,863 | |
| Cost of Shares redeemed | | | — | | | | — | | | | (4,303,980 | ) | | | (67,754,238 | ) | | | (1,911,351 | ) | | | (29,609,710 | ) |
| Change from Class Y Share Transactions | | | 257 | | | | 2,565 | | | | 653,744 | | | | 11,531,424 | | | | 2,584,391 | | | | 43,763,177 | |
| Institutional Class | | | | | | | | | | | | | | | | | | | | | | | | |
| Proceeds from Shares issued | | | 6,095,928 | | | | 60,534,513 | | | | 13,135,958 | | | | 208,924,740 | | | | 1,907,711 | | | | 31,670,146 | |
| Proceeds from Shares issued in connection with merger(A) | | | — | | | | — | | | | — | | | | — | | | | — | | | | — | |
| Reinvestment of distributions | | | 148,074 | | | | 1,457,344 | | | | 51,285 | | | | 850,301 | | | | 16,915 | | | | 256,269 | |
| Cost of Shares redeemed | | | (828,518 | ) | | | (8,120,975 | ) | | | (3,197,660 | ) | | | (51,471,076 | ) | | | (1,040,469 | ) | | | (16,110,933 | ) |
| Change from Institutional Class Share Transactions | | | 5,415,484 | | | | 53,870,882 | | | | 9,989,583 | | | | 158,303,965 | | | | 884,157 | | | | 15,815,482 | |
| Change from Share Transactions | | | 5,420,682 | | | $ | 53,921,838 | | | | 10,733,760 | | | $ | 171,734,256 | | | | 4,480,154 | | | $ | 76,020,244 | |
(A) See Note 8 in the Notes to Financial Statements.
(B) Represents the period from commencement of operations (September 1, 2015) through June 30, 2016.
(C) Represents the period from commencement of operations (July 10, 2014) through June 30, 2015.
See accompanying Notes to Financial Statements.
Statements of Changes in Net Assets - Capital Stock Activity (Continued)
| Touchstone Large Cap Fund | | | Touchstone Small Cap Value Opportunities Fund | |
| For the | | | For the | | | For the | | | For the | |
| Year Ended | | | Period Ended | | | Year Ended | | | Year Ended | |
| June 30, 2016 | | | June 30, 2015(C) | | | June 30, 2016 | | | June 30, 2015 | |
| Shares | | | Dollars | | | Shares | | | Dollars | | | Shares | | | Dollars | | | Shares | | | Dollars | |
| | | | | | | | | | | | | | | | | | | | | | | |
| | 283,256 | | | $ | 2,895,443 | | | | 65,666 | | | $ | 706,463 | | | | 178,569 | | | $ | 3,110,849 | | | | 779,381 | | | $ | 15,358,208 | |
| | — | | | | — | | | | 134,841 | | | | 1,466,300 | | | | — | | | | — | | | | — | | | | — | |
| | 1,075 | | | | 11,223 | | | | 12 | | | | 133 | | | | 43,225 | | | | 637,999 | | | | 111,090 | | | | 2,002,265 | |
| | (124,504 | ) | | | (1,292,569 | ) | | | (11,568 | ) | | | (124,864 | ) | | | (733,688 | ) | | | (11,793,510 | ) | | | (712,392 | ) | | | (13,626,669 | ) |
| | 159,827 | | | | 1,614,097 | | | | 188,951 | | | | 2,048,032 | | | | (511,894 | ) | | | (8,044,662 | ) | | | 178,079 | | | | 3,733,804 | |
| | | | | | | | | | | | | | | | | | | | | | | | | | | | | | | |
| | 539,045 | | | | 5,506,168 | | | | 102,403 | | | | 1,108,828 | | | | 13,981 | | | | 223,530 | | | | 94,954 | | | | 1,819,621 | |
| | — | | | | — | | | | 33,258 | | | | 359,796 | | | | — | | | | — | | | | — | | | | — | |
| | 1,994 | | | | 20,656 | | | | — | | | | — | | | | 7,225 | | | | 104,187 | | | | 8,041 | | | | 142,680 | |
| | (79,635 | ) | | | (799,302 | ) | | | (6,374 | ) | | | (68,848 | ) | | | (56,888 | ) | | | (830,488 | ) | | | (16,666 | ) | | | (308,042 | ) |
| | 461,404 | | | | 4,727,522 | | | | 129,287 | | | | 1,399,776 | | | | (35,682 | ) | | | (502,771 | ) | | | 86,329 | | | | 1,654,259 | |
| | | | | | | | | | | | | | | | | | | | | | | | | | | | | | | |
| | 4,361,014 | | | | 44,815,433 | | | | 1,258,713 | | | | 13,505,190 | | | | 937,755 | | | | 15,335,755 | | | | 2,044,214 | | | | 41,296,768 | |
| | — | | | | — | | | | 16,959,045 | | | | 184,754,062 | | | | — | | | | — | | | | — | | | | — | |
| | 138,618 | | | | 1,449,935 | | | | 102 | | | | 1,110 | | | | 513,365 | | | | 8,039,304 | | | | 963,156 | | | | 18,315,097 | |
| | (2,875,579 | ) | | | (29,570,338 | ) | | | (20,584 | ) | | | (222,527 | ) | | | (2,440,654 | ) | | | (41,804,653 | ) | | | (1,820,526 | ) | | | (36,101,142 | ) |
| | 1,624,053 | | | | 16,695,030 | | | | 18,197,276 | | | | 198,037,835 | | | | (989,534 | ) | | | (18,429,594 | ) | | | 1,186,844 | | | | 23,510,723 | |
| | | | | | | | | | | | | | | | | | | | | | | | | | | | | | | |
| | 1,791,859 | | | | 18,806,709 | | | | 9,192,933 | | | | 97,278,370 | | | | 345,792 | | | | 6,071,129 | | | | 368,491 | | | | 7,441,842 | |
| | — | | | | — | | | | 62,587 | | | | 682,334 | | | | — | | | | — | | | | — | | | | — | |
| | 62,285 | | | | 652,122 | | | | 8,474 | | | | 92,451 | | | | 135,183 | | | | 2,145,352 | | | | 167,477 | | | | 3,223,456 | |
| | (2,848,371 | ) | | | (28,125,703 | ) | | | (5,826 | ) | | | (63,023 | ) | | | (395,931 | ) | | | (6,498,239 | ) | | | (160,953 | ) | | | (3,350,647 | ) |
| | (994,227 | ) | | | (8,666,872 | ) | | | 9,258,168 | | | | 97,990,132 | | | | 85,044 | | | | 1,718,242 | | | | 375,015 | | | | 7,314,651 | |
| | 1,251,057 | | | $ | 14,369,777 | | | | 27,773,682 | | | $ | 299,475,775 | | | | (1,452,066 | ) | | $ | (25,258,785 | ) | | | 1,826,267 | | | $ | 36,213,437 | |
Statements of Changes in Net Assets - Capital Stock Activity (Continued)
| | | Touchstone Value Fund | |
| | | For the Year | | | For the Year | |
| | | Ended | | | Ended | |
| | | June 30, 2016 | | | June 30, 2015 | |
| | | Shares | | | Dollars | | | Shares | | | Dollars | |
| Class A | | | | | | | | | | | | | | | | |
| Proceeds from Shares issued | | | 492,806 | | | $ | 4,400,455 | | | | 762,901 | | | $ | 7,405,973 | |
| Reinvestment of distributions | | | 447,991 | | | | 3,878,202 | | | | 144,696 | | | | 1,410,108 | |
| Cost of Shares redeemed | | | (1,198,179 | ) | | | (10,762,282 | ) | | | (2,129,267 | ) | | | (20,802,496 | ) |
| Change from Class A Share Transactions | | | (257,382 | ) | | | (2,483,625 | ) | | | (1,221,670 | ) | | | (11,986,415 | ) |
| Class C | | | | | | | | | | | | | | | | |
| Proceeds from Shares issued | | | 54,582 | | | | 478,901 | | | | 337,279 | | | | 3,267,904 | |
| Reinvestment of distributions | | | 35,343 | | | | 303,882 | | | | 8,080 | | | | 78,092 | |
| Cost of Shares redeemed | | | (162,854 | ) | | | (1,464,650 | ) | | | (180,803 | ) | | | (1,759,085 | ) |
| Change from Class C Share Transactions | | | (72,929 | ) | | | (681,867 | ) | | | 164,556 | | | | 1,586,911 | |
| Class Y | | | | | | | | | | | | | | | | |
| Proceeds from Shares issued | | | 1,274,736 | | | | 11,372,831 | | | | 2,353,367 | | | | 22,960,959 | |
| Reinvestment of distributions | | | 713,740 | | | | 6,206,070 | | | | 279,262 | | | | 2,733,412 | |
| Cost of Shares redeemed | | | (3,995,911 | ) | | | (35,656,922 | ) | | | (3,748,197 | ) | | | (36,842,800 | ) |
| Change from Class Y Share Transactions | | | (2,007,435 | ) | | | (18,078,021 | ) | | | (1,115,568 | ) | | | (11,148,429 | ) |
| Institutional Class | | | | | | | | | | | | | | | | |
| Proceeds from Shares issued | | | 7,730,290 | | | | 69,961,732 | | | | 5,151,325 | | | | 49,653,209 | |
| Reinvestment of distributions | | | 2,168,255 | | | | 18,830,820 | | | | 733,844 | | | | 7,180,060 | |
| Cost of Shares redeemed | | | (10,435,595 | ) | | | (93,498,962 | ) | | | (6,161,159 | ) | | | (60,390,045 | ) |
| Change from Institutional Class Share Transactions | | | (537,050 | ) | | | (4,706,410 | ) | | | (275,990 | ) | | | (3,556,776 | ) |
| Change from Share Transactions | | | (2,874,796 | ) | | $ | (25,949,923 | ) | | | (2,448,672 | ) | | $ | (25,104,709 | ) |
See accompanying Notes to Financial Statements.
Financial Highlights
| Touchstone Credit Opportunities Fund—Class A | | | |
| Selected Data for a Share Outstanding Throughout Each Period | | | |
| | | Period Ended | |
| | | June 30, | |
| | | 2016(A) | |
| Net asset value at beginning of period | | $ | 10.00 | |
| Income from investment operations: | | | | |
| Net investment income | | | 0.22 | |
| Net realized and unrealized gains on investments | | | 0.07 | |
| Total from investment operations | | | 0.29 | |
| Distributions from: | | | | |
| Net investment income | | | (0.23 | ) |
| Realized capital gains | | | (0.01 | ) |
| Total distributions | | | (0.24 | ) |
| Net asset value at end of period | | $ | 10.05 | |
| Total return(B) | | | 2.95 | %(C) |
| Ratios and supplemental data: | | | | |
| Net assets at end of period (000's) | | $ | 43 | |
| Ratio to average net assets: | | | | |
| Net expenses (including dividend and interest expense on securities sold short)(D) | | | 1.73 | %(E) |
| Gross expenses (including dividend and interest expense on securities sold short)(F) | | | 38.32 | %(E) |
| Net investment income | | | 3.53 | %(E) |
| Portfolio turnover rate | | | 91 | %(C) |
| Touchstone Credit Opportunities Fund—Class C | | | |
| Selected Data for a Share Outstanding Throughout Each Period | | | |
| | | Period Ended | |
| | | June 30, | |
| | | 2016(A) | |
| Net asset value at beginning of period | | $ | 10.00 | |
| Income from investment operations: | | | | |
| Net investment income | | | 0.17 | |
| Net realized and unrealized gains on investments | | | 0.08 | |
| Total from investment operations | | | 0.25 | |
| Distributions from: | | | | |
| Net investment income | | | (0.16 | ) |
| Realized capital gains | | | (0.01 | ) |
| Total distributions | | | (0.17 | ) |
| Net asset value at end of period | | $ | 10.08 | |
| Total return(B) | | | 2.59 | %(C) |
| Ratios and supplemental data: | | | | |
| Net assets at end of period (000's) | | $ | 6 | |
| Ratio to average net assets: | | | | |
| Net expenses (including dividend and interest expense on securities sold short)(D) | | | 2.48 | %(E) |
| Gross expenses (including dividend and interest expense on securities sold short)(F) | | | 276.34 | %(E) |
| Net investment income | | | 2.79 | %(E) |
| Portfolio turnover rate | | | 91 | %(C) |
| (A) | Represents the period from commencement of operations (September 1, 2015) through June 30, 2016. |
| (B) | Total returns shown exclude the effect of applicable sales loads. If these charges were included, the returns would be lower. |
| (D) | The ratio of net expenses to average net assets excluding dividend and interest expense on securities sold short for Class A is 1.69% and for Class C is 2.44% for the period ended June 30, 2016. |
| (F) | The ratio of gross expenses to average net assets excluding dividend and interest expense on securities sold short for Class A is 38.28% and for Class C is 276.30% for the period ended June 30, 2016. |
See accompanying Notes to Financial Statements.
Financial Highlights (Continued)
| Touchstone Credit Opportunities Fund—Class Y | | | |
| Selected Data for a Share Outstanding Throughout Each Period | | | |
| | | Period Ended | |
| | | June 30, | |
| | | 2016(A) | |
| Net asset value at beginning of period | | $ | 10.00 | |
| Income (loss) from investment operations: | | | | |
| Net investment income | | | 0.31 | |
| Net realized and unrealized losses on investments | | | (0.02 | ) |
| Total from investment operations | | | 0.29 | |
| Distributions from: | | | | |
| Net investment income | | | (0.24 | ) |
| Realized capital gains | | | (0.01 | ) |
| Total distributions | | | (0.25 | ) |
| Net asset value at end of period | | $ | 10.04 | |
| Total return | | | 3.04 | %(B) |
| Ratios and supplemental data: | | | | |
| Net assets at end of period (000's) | | $ | 3 | |
| Ratio to average net assets: | | | | |
| Net expenses (including dividend and interest expense on securities sold short)(C) | | | 1.48 | %(D) |
| Gross expenses (including dividend and interest expense on securities sold short)(E) | | | 355.77 | %(D) |
| Net investment income | | | 3.79 | %(D) |
| Portfolio turnover rate | | | 91 | %(B) |
| Touchstone Credit Opportunities Fund—Institutional Class |
| Selected Data for a Share Outstanding Throughout Each Period |
| | | Period Ended | |
| | | June 30, | |
| | | 2016(A) | |
| Net asset value at beginning of period | | $ | 10.00 | |
| Income from investment operations: | | | | |
| Net investment income | | | 0.28 | |
| Net realized and unrealized gains on investments | | | 0.03 | |
| Total from investment operations | | | 0.31 | |
| Distributions from: | | | | |
| Net investment income | | | (0.25 | ) |
| Realized capital gains | | | (0.01 | ) |
| Total distributions | | | (0.26 | ) |
| Net asset value at end of period | | $ | 10.05 | |
| Total return | | | 3.22 | %(B) |
| Ratios and supplemental data: | | | | |
| Net assets at end of period (000's) | | $ | 54,411 | |
| Ratio to average net assets: | | | | |
| Net expenses (including dividend and interest expense on securities sold short)(C) | | | 1.38 | %(D) |
| Gross expenses (including dividend and interest expense on securities sold short)(E) | | | 1.65 | %(D) |
| Net investment income | | | 3.88 | %(D) |
| Portfolio turnover rate | | | 91 | %(B) |
| (A) | Represents the period from commencement of operations (September 1, 2015) through June 30, 2016. |
| (C) | The ratio of net expenses to average net assets excluding dividend and interest expense on securities sold short for Class Y is 1.44% and for Institutional Class is 1.34% for the period ended June 30, 2016. |
| (E) | The ratio of gross expenses to average net assets excluding dividend and interest expense on securities sold short for Class Y is 355.73% and for Institutional Class is 1.61% for the period ended June 30, 2016. |
See accompanying Notes to Financial Statements.
Financial Highlights (Continued)
| Touchstone International Small Cap Fund—Class A |
| Selected Data for a Share Outstanding Throughout Each Period |
| | | | | | | | | | | | | | | Three | | | | |
| | | | | | | | | | | | | | | Months | | | Year | |
| | | | | | | | | | | | | | | Ended | | | Ended | |
| | | Year Ended June 30, | | | June 30, | | | March 31, | |
| | | 2016 | | | 2015 | | | 2014 | | | 2013 | | | 2012(A) | | | 2012 | |
| Net asset value at beginning of period | | $ | 16.52 | | | $ | 15.48 | | | $ | 12.58 | | | $ | 10.21 | | | $ | 11.12 | | | $ | 11.88 | |
| Income (loss) from investment operations: | | | | | | | | | | | | | | | | | | | | | | | | |
| Net investment income | | | 0.09 | | | | 0.11 | | | | 0.11 | (B) | | | 0.11 | | | | 0.09 | (B) | | | 0.03 | (B) |
| Net realized and unrealized gains (losses) on investments | | | (1.53 | ) | | | 1.00 | | | | 3.00 | | | | 2.43 | | | | (0.90 | ) | | | (0.84 | ) |
| Total from investment operations | | | (1.44 | ) | | | 1.11 | | | | 3.11 | | | | 2.54 | | | | (0.81 | ) | | | (0.81 | ) |
| Distributions from: | | | | | | | | | | | | | | | | | | | | | | | | |
| Net investment income | | | (0.10 | ) | | | (0.07 | ) | | | (0.21 | ) | | | (0.17 | ) | | | (0.10 | ) | | | (0.15 | ) |
| Capital contribution | | | — | | | | — | | | | — | | | | — | | | | — | | | | 0.20 | (C) |
| Net asset value at end of period | | $ | 14.98 | | | $ | 16.52 | | | $ | 15.48 | | | $ | 12.58 | | | $ | 10.21 | | | $ | 11.12 | |
| Total return(D) | | | (8.77 | )% | | | 7.29 | % | | | 24.74 | % | | | 24.99 | % | | | (7.28 | )%(E) | | | (4.96 | )%(C) |
| Ratios and supplemental data: | | | | | | | | | | | | | | | | | | | | | | | | |
| Net assets at end of period (000's) | | $ | 23,095 | | | $ | 24,635 | | | $ | 10,721 | | | $ | 489 | | | $ | 199 | | | $ | 143 | |
| Ratio to average net assets: | | | | | | | | | | | | | | | | | | | | | | | | |
| Net expenses | | | 1.55 | % | | | 1.55 | % | | | 1.55 | % | | | 1.55 | % | | | 1.55 | %(F) | | | 1.55 | % |
| Gross expenses | | | 1.66 | % | | | 1.84 | % | | | 2.12 | % | | | 7.77 | % | | | 19.37 | %(F) | | | 10.50 | %(G) |
| Net investment income | | | 0.59 | % | | | 0.90 | % | | | 0.76 | % | | | 1.41 | % | | | 3.36 | %(F) | | | 0.26 | % |
| Portfolio turnover rate | | | 90 | % | | | 84 | % | | | 60 | % | | | 79 | % | | | 21 | %(E) | | | 207 | % |
| Touchstone International Small Cap Fund—Class C |
| Selected Data for a Share Outstanding Throughout Each Period |
| | | | | | | | | | | | | | | Period | |
| | | | | | | | | | | | | | | Ended | |
| | | Year Ended June 30, | | | June 30, | |
| | | 2016 | | | 2015 | | | 2014 | | | 2013 | | | 2012(H) | |
| Net asset value at beginning of period | | $ | 16.28 | | | $ | 15.33 | | | $ | 12.54 | | | $ | 10.19 | | | $ | 10.94 | |
| Income (loss) from investment operations: | | | | | | | | | | | | | | | | | | | | |
| Net investment income (loss) | | | (0.04 | ) | | | 0.06 | | | | — | (B)(I) | | | 0.14 | | | | 0.05 | (B) |
| Net realized and unrealized gains (losses) on investments | | | (1.49 | ) | | | 0.92 | | | | 2.99 | | | | 2.31 | | | | (0.69 | ) |
| Total from investment operations | | | (1.53 | ) | | | 0.98 | | | | 2.99 | | | | 2.45 | | | | (0.64 | ) |
| Distributions from: | | | | | | | | | | | | | | | | | | | | |
| Net investment income | | | (0.08 | ) | | | (0.03 | ) | | | (0.20 | ) | | | (0.10 | ) | | | (0.11 | ) |
| Net asset value at end of period | | $ | 14.67 | | | $ | 16.28 | | | $ | 15.33 | | | $ | 12.54 | | | $ | 10.19 | |
| Total return(D) | | | (9.43 | )% | | | 6.44 | % | | | 23.94 | % | | | 24.08 | % | | | (5.84 | )%(E) |
| Ratios and supplemental data: | | | | | | | | | | | | | | | | | | | | |
| Net assets at end of period (000's) | | $ | 4,294 | | | $ | 4,120 | | | $ | 613 | | | $ | 7 | | | $ | 2 | |
| Ratio to average net assets: | | | | | | | | | | | | | | | | | | | | |
| Net expenses | | | 2.30 | % | | | 2.30 | % | | | 2.30 | % | | | 2.30 | % | | | 2.30 | %(F) |
| Gross expenses | | | 2.62 | % | | | 2.92 | % | | | 7.28 | % | | | 94.29 | % | | | 968.58 | %(F) |
| Net investment income (loss) | | | (0.16 | )% | | | 0.15 | % | | | 0.01 | % | | | 0.66 | % | | | 2.12 | %(F) |
| Portfolio turnover rate | | | 90 | % | | | 84 | % | | | 60 | % | | | 79 | % | | | 21 | %(E) |
| (A) | The Fund changed its fiscal year end from March 31 to June 30. |
| (B) | The net investment income (loss) per share is based on average shares outstanding for the period. |
| (C) | Impact of one time distribution of settlement funds from the Bank of America Fair Fund. If the distribution had not occurred the total return would have been lower. |
| (D) | Total returns shown exclude the effect of applicable sales loads. If these charges were included, the returns would be lower. |
| (G) | Legal, printing and/or compliance audit expenses relating to civil litigation and certain regulatory actions in connection with market timing allegations were incurred, and the former advisor paid these expenses on behalf of the Funds. Had the former advisor not paid these expenses, the expenses for the Funds would have been higher than what is reflected in the financial highlights for the year ended March 31, 2012. |
| (H) | Represents the period from commencement of operations (April 16, 2012) through June 30, 2012. |
| (I) | Less than $0.005 per share. |
See accompanying Notes to Financial Statements.
Financial Highlights (Continued)
| Touchstone International Small Cap Fund—Class Y |
| Selected Data for a Share Outstanding Throughout Each Period |
| | | | | | | | | | | | | | | Three | | | | |
| | | | | | | | | | | | | | | Months | | | Year | |
| | | | | | | | | | | | | | | Ended | | | Ended | |
| | | Year Ended June 30, | | | June 30, | | | March 31, | |
| | | 2016 | | | 2015 | | | 2014 | | | 2013 | | | 2012(A) | | | 2012 | |
| Net asset value at beginning of period | | $ | 16.94 | | | $ | 15.86 | | | $ | 12.84 | | | $ | 10.40 | | | $ | 11.32 | | | $ | 12.14 | |
| Income (loss) from investment operations: | | | | | | | | | | | | | | | | | | | | | | | | |
| Net investment income | | | 0.13 | | | | 0.14 | | | | 0.16 | (B) | | | 0.21 | | | | 0.10 | (B) | | | 0.07 | (B) |
| Net realized and unrealized gains (losses) on investments | | | (1.57 | ) | | | 1.04 | | | | 3.07 | | | | 2.40 | | | | (0.92 | ) | | | (0.88 | ) |
| Total from investment operations | | | (1.44 | ) | | | 1.18 | | | | 3.23 | | | | 2.61 | | | | (0.82 | ) | | | (0.81 | ) |
| Distributions from: | | | | | | | | | | | | | | | | | | | | | | | | |
| Net investment income | | | (0.11 | ) | | | (0.10 | ) | | | (0.21 | ) | | | (0.17 | ) | | | (0.10 | ) | | | (0.21 | ) |
| Capital contribution | | | — | | | | — | | | | — | | | | — | | | | — | | | | 0.20 | (C) |
| Net asset value at end of period | | $ | 15.39 | | | $ | 16.94 | | | $ | 15.86 | | | $ | 12.84 | | | $ | 10.40 | | | $ | 11.32 | |
| Total return | | | (8.56 | )% | | | 7.54 | % | | | 25.16 | % | | | 25.38 | % | | | (7.22 | )%(D) | | | (4.81 | )%(C) |
| Ratios and supplemental data: | | | | | | | | | | | | | | | | | | | | | | | | |
| Net assets at end of period (000's) | | $ | 166,801 | | | $ | 172,477 | | | $ | 120,537 | | | $ | 90,125 | | | $ | 80,754 | | | $ | 90,029 | |
| Ratio to average net assets: | | | | | | | | | | | | | | | | | | | | | | | | |
| Net expenses | | | 1.30 | % | | | 1.30 | % | | | 1.25 | % | | | 1.24 | % | | | 1.30 | %(E) | | | 1.30 | % |
| Gross expenses | | | 1.32 | % | | | 1.38 | % | | | 1.44 | % | | | 1.53 | % | | | 1.74 | %(E) | | | 1.69 | %(F) |
| Net investment income | | | 0.84 | % | | | 1.15 | % | | | 1.06 | % | | | 1.71 | % | | | 3.61 | %(E) | | | 0.60 | % |
| Portfolio turnover rate | | | 90 | % | | | 84 | % | | | 60 | % | | | 79 | % | | | 21 | %(D) | | | 207 | % |
| Touchstone International Small Cap Fund—Institutional Class |
| Selected Data for a Share Outstanding Throughout Each Period |
| | | | | | | | | | | | | | | Three | | | | |
| | | | | | | | | | | | | | | Months | | | Year | |
| | | | | | | | | | | | | | | Ended | | | Ended | |
| | | Year Ended June 30, | | | June 30, | | | March 31, | |
| | | 2016 | | | 2015 | | | 2014 | | | 2013 | | | 2012(A) | | | 2012 | |
| Net asset value at beginning of period | | $ | 17.02 | | | $ | 15.94 | | | $ | 12.90 | | | $ | 10.45 | | | $ | 11.37 | | | $ | 12.20 | |
| Income (loss) from investment operations: | | | | | | | | | | | | | | | | | | | | | | | | |
| Net investment income | | | 0.12 | | | | 0.18 | | | | 0.18 | (B) | | | 0.23 | | | | 0.10 | (B) | | | 0.13 | (B) |
| Net realized and unrealized gains (losses) on investments | | | (1.55 | ) | | | 1.02 | | | | 3.09 | | | | 2.42 | | | | (0.91 | ) | | | (0.93 | ) |
| Total from investment operations | | | (1.43 | ) | | | 1.20 | | | | 3.27 | | | | 2.65 | | | | (0.81 | ) | | | (0.80 | ) |
| Distributions from: | | | | | | | | | | | | | | | | | | | | | | | | |
| Net investment income | | | (0.11 | ) | | | (0.12 | ) | | | (0.23 | ) | | | (0.20 | ) | | | (0.11 | ) | | | (0.24 | ) |
| Capital contribution | | | — | | | | — | | | | — | | | | — | | | | — | | | | 0.21 | (C) |
| Net asset value at end of period | | $ | 15.48 | | | $ | 17.02 | | | $ | 15.94 | | | $ | 12.90 | | | $ | 10.45 | | | $ | 11.37 | |
| Total return | | | (8.43 | )% | | | 7.65 | % | | | 25.38 | % | | | 25.59 | % | | | (7.13 | )%(D) | | | (4.55 | )%(C) |
| Ratios and supplemental data: | | | | | | | | | | | | | | | | | | | | | | | | |
| Net assets at end of period (000's) | | $ | 197,693 | | | $ | 47,319 | | | $ | 30,223 | | | $ | 16,238 | | | $ | 3,869 | | | $ | 6,288 | |
| Ratio to average net assets: | | | | | | | | | | | | | | | | | | | | | | | | |
| Net expenses | | | 1.18 | % | | | 1.18 | % | | | 1.08 | % | | | 1.05 | % | | | 1.05 | %(E) | | | 1.05 | % |
| Gross expenses | | | 1.23 | % | | | 1.30 | % | | | 1.33 | % | | | 1.50 | % | | | 2.05 | %(E) | | | 1.46 | %(F) |
| Net investment income | | | 0.96 | % | | | 1.27 | % | | | 1.23 | % | | | 1.90 | % | | | 3.86 | %(E) | | | 1.15 | % |
| Portfolio turnover rate | | | 90 | % | | | 84 | % | | | 60 | % | | | 79 | % | | | 21 | %(D) | | | 207 | % |
| (A) | The Fund changed its fiscal year end from March 31 to June 30. |
| (B) | The net investment income (loss) per share is based on average shares outstanding for the period. |
| (C) | Impact of one time distribution of settlement funds from the Bank of America Fair Fund. If the distribution had not occurred the total return would have been lower. |
| (F) | Legal, printing and/or compliance audit expenses relating to civil litigation and certain regulatory actions in connection with market timing allegations were incurred, and the former advisor paid these expenses on behalf of the Funds. Had the former advisor not paid these expenses, the expenses for the Funds would have been higher than what is reflected in the financial highlights for the year ended March 31, 2012. |
See accompanying Notes to Financial Statements.
Financial Highlights (Continued)
| Touchstone Large Cap Fund—Class A |
| Selected Data for a Share Outstanding Throughout Each Period |
| | | | | | Period | |
| | | Year Ended | | | Ended | |
| | | June 30, | | | June 30, | |
| | | 2016 | | | 2015(A) | |
| Net asset value at beginning of period | | $ | 10.65 | | | $ | 10.00 | |
| Income (loss) from investment operations: | | | | | | | | |
| Net investment income | | | 0.08 | | | | 0.09 | (B) |
| Net realized and unrealized gains (losses) on investments | | | (0.18 | ) | | | 0.57 | |
| Total from investment operations | | | (0.10 | ) | | | 0.66 | |
| Distributions from: | | | | | | | | |
| Net investment income | | | (0.06 | ) | | | (0.01 | ) |
| Net asset value at end of period | | $ | 10.49 | | | $ | 10.65 | |
| Total return(C) | | | (0.92 | )% | | | 6.57 | %(D) |
| Ratios and supplemental data: | | | | | | | | |
| Net assets at end of period (000's) | | $ | 3,657 | | | $ | 2,013 | |
| Ratio to average net assets: | | | | | | | | |
| Net expenses | | | 1.12 | % | | | 1.12 | %(E) |
| Gross expenses | | | 1.68 | % | | | 4.17 | %(E) |
| Net investment income | | | 0.87 | % | | | 0.81 | %(E) |
| Portfolio turnover rate | | | 33 | % | | | 8 | %(D)(F) |
| Touchstone Large Cap Fund—Class C |
| Selected Data for a Share Outstanding Throughout Each Period |
| | | | | | Period | |
| | | Year Ended | | | Ended | |
| | | June 30, | | | June 30, | |
| | | 2016 | | | 2015(A) | |
| Net asset value at beginning of period | | $ | 10.60 | | | $ | 10.00 | |
| Income (loss) from investment operations: | | | | | | | | |
| Net investment income | | | 0.02 | | | | 0.01 | (B) |
| Net realized and unrealized gains (losses) on investments | | | (0.20 | ) | | | 0.59 | |
| Total from investment operations | | | (0.18 | ) | | | 0.60 | |
| Distributions from: | | | | | | | | |
| Net investment income | | | (0.05 | ) | | | — | |
| Net asset value at end of period | | $ | 10.37 | | | $ | 10.60 | |
| Total return(C) | | | (1.72 | )% | | | 6.00 | %(D) |
| Ratios and supplemental data: | | | | | | | | |
| Net assets at end of period (000's) | | $ | 6,124 | | | $ | 1,370 | |
| Ratio to average net assets: | | | | | | | | |
| Net expenses | | | 1.87 | % | | | 1.87 | %(E) |
| Gross expenses | | | 2.39 | % | | | 4.34 | %(E) |
| Net investment income | | | 0.12 | % | | | 0.06 | %(E) |
| Portfolio turnover rate | | | 33 | % | | | 8 | %(D)(F) |
| (A) | Represents the period from commencement of operations (July 10, 2014) through June 30, 2015. |
| (B) | The net investment income per share is based on average shares outstanding for the period. |
| (C) | Total returns shown exclude the effect of applicable sales loads. If these charges were included, the returns would be lower. |
| (F) | Portfolio turnover excludes the purchases and sales of the Touchstone Capital Growth Fund acquired on June 26, 2015. If these transactions were included, portfolio turnover would have been higher. |
See accompanying Notes to Financial Statements.
Financial Highlights (Continued)
| Touchstone Large Cap Fund—Class Y |
| Selected Data for a Share Outstanding Throughout Each Period |
| | | | | | Period | |
| | | Year Ended | | | Ended | |
| | | June 30, | | | June 30, | |
| | | 2016 | | | 2015(A) | |
| Net asset value at beginning of period | | $ | 10.67 | | | $ | 10.00 | |
| Income (loss) from investment operations: | | | | | | | | |
| Net investment income | | | 0.11 | | | | 0.11 | (B) |
| Net realized and unrealized gains (losses) on investments | | | (0.19 | ) | | | 0.57 | |
| Total from investment operations | | | (0.08 | ) | | | 0.68 | |
| Distributions from: | | | | | | | | |
| Net investment income | | | (0.07 | ) | | | (0.01 | ) |
| Net asset value at end of period | | $ | 10.52 | | | $ | 10.67 | |
| Total return | | | (0.70 | )% | | | 6.80 | %(C) |
| Ratios and supplemental data: | | | | | | | | |
| Net assets at end of period (000's) | | $ | 208,463 | | | $ | 194,226 | |
| Ratio to average net assets: | | | | | | | | |
| Net expenses | | | 0.87 | % | | | 0.87 | %(D) |
| Gross expenses | | | 1.04 | % | | | 1.19 | %(D) |
| Net investment income | | | 1.11 | % | | | 1.06 | %(D) |
| Portfolio turnover rate | | | 33 | % | | | 8 | %(C)(E) |
| Touchstone Large Cap Fund—Institutional Class |
| Selected Data for a Share Outstanding Throughout Each Period |
| | | | | | Period | |
| | | Year Ended | | | Ended | |
| | | June 30, | | | June 30, | |
| | | 2016 | | | 2015(A) | |
| Net asset value at beginning of period | | $ | 10.68 | | | $ | 10.00 | |
| Income (loss) from investment operations: | | | | | | | | |
| Net investment income | | | 0.13 | | | | 0.12 | (B) |
| Net realized and unrealized gains (losses) on investments | | | (0.20 | ) | | | 0.57 | |
| Total from investment operations | | | (0.07 | ) | | | 0.69 | |
| Distributions from: | | | | | | | | |
| Net investment income | | | (0.08 | ) | | | (0.01 | ) |
| Net asset value at end of period | | $ | 10.53 | | | $ | 10.68 | |
| Total return | | | (0.66 | )% | | | 6.92 | %(C) |
| Ratios and supplemental data: | | | | | | | | |
| Net assets at end of period (000's) | | $ | 87,032 | | | $ | 98,889 | |
| Ratio to average net assets: | | | | | | | | |
| Net expenses | | | 0.77 | % | | | 0.77 | %(D) |
| Gross expenses | | | 0.93 | % | | | 0.98 | %(D) |
| Net investment income | | | 1.21 | % | | | 1.16 | %(D) |
| Portfolio turnover rate | | | 33 | % | | | 8 | %(C)(E) |
| (A) | Represents the period from commencement of operations (July 10, 2014) through June 30, 2015. |
| (B) | The net investment income per share is based on average shares outstanding for the period. |
| (E) | Portfolio turnover excludes the purchases and sales of the Touchstone Capital Growth Fund acquired on June 26, 2015. If these transactions were included, portfolio turnover would have been higher. |
See accompanying Notes to Financial Statements.
Financial Highlights (Continued)
| Touchstone Small Cap Value Opportunities Fund—Class A |
| Selected Data for a Share Outstanding Throughout Each Period |
| | | | | | | | | | | | | | | Three | | | | |
| | | | | | | | | | | | | | | Months | | | Year | |
| | | | | | | | | | | | | | | Ended | | | Ended | |
| | | Year Ended June 30, | | | June 30, | | | March 31, | |
| | | 2016 | | | 2015 | | | 2014 | | | 2013 | | | 2012(A) | | | 2012 | |
| Net asset value at beginning of period | | $ | 18.67 | | | $ | 20.92 | | | $ | 18.75 | | | $ | 16.97 | | | $ | 18.08 | | | $ | 19.06 | |
| Income (loss) from investment operations: | | | | | | | | | | | | | | | | | | | | | | | | |
| Net investment income (loss) | | | (0.06 | ) | | | 0.04 | | | | (0.05 | ) | | | 0.09 | (B) | | | (0.01 | ) | | | (0.06 | )(B) |
| Net realized and unrealized gains (losses) on investments | | | (2.51 | ) | | | 0.39 | | | | 5.88 | (C) | | | 3.66 | | | | (0.57 | ) | | | 0.04 | |
| Total from investment operations | | | (2.57 | ) | | | 0.43 | | | | 5.83 | | | | 3.75 | | | | (0.58 | ) | | | (0.02 | ) |
| Distributions from: | | | | | | | | | | | | | | | | | | | | | | | | |
| Net investment income | | | — | | | | (0.31 | ) | | | (0.02 | ) | | | (0.09 | ) | | | — | | | | — | |
| Realized capital gains | | | (1.26 | ) | | | (2.37 | ) | | | (3.64 | ) | | | (1.88 | ) | | | (0.53 | ) | | | (0.96 | ) |
| Total distributions | | | (1.26 | ) | | | (2.68 | ) | | | (3.66 | ) | | | (1.97 | ) | | | (0.53 | ) | | | (0.96 | ) |
| Net asset value at end of period | | $ | 14.84 | | | $ | 18.67 | | | $ | 20.92 | | | $ | 18.75 | | | $ | 16.97 | | | $ | 18.08 | |
| Total return(D) | | | (13.72 | )% | | | 2.68 | % | | | 33.35 | %(C) | | | 24.31 | % | | | (3.09 | )%(E) | | | 0.60 | % |
| Ratios and supplemental data: | | | | | | | | | | | | | | | | | | | | | | | | |
| Net assets at end of period (000's) | | $ | 4,503 | | | $ | 15,219 | | | $ | 13,332 | | | $ | 1,309 | | | $ | 2,023 | | | $ | 2,251 | |
| Ratio to average net assets: | | | | | | | | | | | | | | | | | | | | | | | | |
| Net expenses | | | 1.43 | % | | | 1.45 | % | | | 1.50 | % | | | 1.50 | % | | | 1.50 | %(F) | | | 1.50 | % |
| Gross expenses | | | 1.82 | % | | | 1.70 | % | | | 1.93 | % | | | 2.46 | % | | | 3.31 | %(F) | | | 2.27 | %(G) |
| Net investment income (loss) | | | (0.22 | )% | | | 0.31 | % | | | (0.09 | )% | | | 0.53 | % | | | (0.16 | )%(F) | | | (0.34 | )% |
| Portfolio turnover rate | | | 42 | % | | | 57 | % | | | 73 | % | | | 95 | % | | | 18 | %(E) | | | 49 | % |
| Touchstone Small Cap Value Opportunities Fund—Class C |
| Selected Data for a Share Outstanding Throughout Each Period |
| | | | | | | | | | | | | | | Period | |
| | | | | | | | | | | | | | | Ended | |
| | | Year Ended June 30, | | | June 30, | |
| | | 2016 | | | 2015 | | | 2014 | | | 2013 | | | 2012(H) | |
| Net asset value at beginning of period | | $ | 18.34 | | | $ | 20.70 | | | $ | 18.69 | | | $ | 16.95 | | | $ | 17.58 | |
| Income (loss) from investment operations: | | | | | | | | | | | | | | | | | | | | |
| Net investment income (loss) | | | (0.20 | ) | | | 0.03 | | | | (0.14 | ) | | | (0.04 | )(B) | | | (0.03 | ) |
| Net realized and unrealized gains (losses) on investments | | | (2.44 | ) | | | 0.25 | | | | 5.79 | (C) | | | 3.66 | | | | (0.07 | ) |
| Total from investment operations | | | (2.64 | ) | | | 0.28 | | | | 5.65 | | | | 3.62 | | | | (0.10 | ) |
| Distributions from: | | | | | | | | | | | | | | | | | | | | |
| Net investment income | | | — | | | | (0.27 | ) | | | — | | | | — | | | | — | |
| Realized capital gains | | | (1.26 | ) | | | (2.37 | ) | | | (3.64 | ) | | | (1.88 | ) | | | (0.53 | ) |
| Total distributions | | | (1.26 | ) | | | (2.64 | ) | | | (3.64 | ) | | | (1.88 | ) | | | (0.53 | ) |
| Net asset value at end of period | | $ | 14.44 | | | $ | 18.34 | | | $ | 20.70 | | | $ | 18.69 | | | $ | 16.95 | |
| Total return(D) | | | (14.38 | )% | | | 1.93 | % | | | 32.43 | %(C) | | | 23.44 | % | | | (0.51 | )%(E) |
| Ratios and supplemental data: | | | | | | | | | | | | | | | | | | | | |
| Net assets at end of period (000's) | | $ | 1,121 | | | $ | 2,077 | | | $ | 558 | | | $ | 36 | | | $ | 2 | |
| Ratio to average net assets: | | | | | | | | | | | | | | | | | | | | |
| Net expenses | | | 2.18 | % | | | 2.19 | % | | | 2.25 | % | | | 2.25 | % | | | 2.25 | %(F) |
| Gross expenses | | | 2.79 | % | | | 2.63 | % | | | 5.09 | % | | | 25.27 | % | | | 942.58 | %(F) |
| Net investment loss | | | (0.97 | )% | | | (0.44 | )% | | | (0.84 | )% | | | (0.22 | )% | | | (0.95 | )%(F) |
| Portfolio turnover rate | | | 42 | % | | | 57 | % | | | 73 | % | | | 95 | % | | | 18 | %(E) |
| (A) | The Fund changed its fiscal year end from March 31 to June 30. |
| (B) | The net investment income (loss) per share is based on average shares outstanding for the period. |
| (C) | Impact of payment from affiliate was less than $0.01 per share and 0.01%, respectively. |
| (D) | Total returns shown exclude the effect of applicable sales loads. If these charges were included, the returns would be lower. |
| (G) | Legal, printing and/or compliance audit expenses relating to civil litigation and certain regulatory actions in connection with market timing allegations were incurred, and the former advisor paid these expenses on behalf of the Funds. Had the former advisor not paid these expenses, the expenses for the Funds would have been higher than what is reflected in the financial highlights for the year ended March 31, 2012. |
| (H) | Represents the period from commencement of operations (April 16, 2012) through June 30, 2012. |
See accompanying Notes to Financial Statements.
Financial Highlights (Continued)
| Touchstone Small Cap Value Opportunities Fund— Class Y |
| Selected Data for a Share Outstanding Throughout Each Period |
| | | | | | | | | | | | | | | Three | | | | |
| | | | | | | | | | | | | | | Months | | | Year | |
| | | | | | | | | | | | | | | Ended | | | Ended | |
| | | Year Ended June 30, | | | June 30, | | | March 31, | |
| | | 2016 | | | 2015 | | | 2014 | | | 2013 | | | 2012(A) | | | 2012 | |
| Net asset value at beginning of period | | $ | 19.69 | | | $ | 21.90 | | | $ | 19.45 | | | $ | 17.51 | | | $ | 18.62 | | | $ | 19.55 | |
| Income (loss) from investment operations: | | | | | | | | | | | | | | | | | | | | | | | | |
| Net investment income (loss) | | | 0.01 | | | | 0.09 | | | | 0.04 | | | | 0.15 | (B) | | | 0.01 | | | | (0.02 | )(B) |
| Net realized and unrealized gains (losses) on investments | | | (2.67 | ) | | | 0.41 | | | | 6.11 | (C) | | | 3.77 | | | | (0.59 | ) | | | 0.05 | |
| Total from investment operations | | | (2.66 | ) | | | 0.50 | | | | 6.15 | | | | 3.92 | | | | (0.58 | ) | | | 0.03 | |
| Distributions from: | | | | | | | | | | | | | | | | | | | | | | | | |
| Net investment income | | | — | | | | (0.34 | ) | | | (0.06 | ) | | | (0.10 | ) | | | — | | | | — | |
| Realized capital gains | | | (1.26 | ) | | | (2.37 | ) | | | (3.64 | ) | | | (1.88 | ) | | | (0.53 | ) | | | (0.96 | ) |
| Total distributions | | | (1.26 | ) | | | (2.71 | ) | | | (3.70 | ) | | | (1.98 | ) | | | (0.53 | ) | | | (0.96 | ) |
| Net asset value at end of period | | $ | 15.77 | | | $ | 19.69 | | | $ | 21.90 | | | $ | 19.45 | | | $ | 17.51 | | | $ | 18.62 | |
| Total return | | | (13.46 | )% | | | 2.92 | % | | | 33.80 | %(C) | | | 24.68 | % | | | (3.05 | )%(D) | | | 0.85 | % |
| Ratios and supplemental data: | | | | | | | | | | | | | | | | | | | | | | | | |
| Net assets at end of period (000's) | | $ | 104,377 | | | $ | 149,852 | | | $ | 140,689 | | | $ | 96,584 | | | $ | 82,861 | | | $ | 87,984 | |
| Ratio to average net assets: | | | | | | | | | | | | | | | | | | | | | | | | |
| Net expenses | | | 1.18 | % | | | 1.20 | % | | | 1.17 | % | | | 1.19 | % | | | 1.22 | %(E) | | | 1.25 | % |
| Gross expenses | | | 1.28 | % | | | 1.26 | % | | | 1.24 | % | | | 1.29 | % | | | 1.40 | %(E) | | | 1.27 | %(F) |
| Net investment income (loss) | | | 0.03 | % | | | 0.55 | % | | | 0.24 | % | | | 0.84 | % | | | 0.12 | %(E) | | | (0.09 | )% |
| Portfolio turnover rate | | | 42 | % | | | 57 | % | | | 73 | % | | | 95 | % | | | 18 | %(D) | | | 49 | % |
| Touchstone Small Cap Value Opportunities Fund—Institutional Class |
| Selected Data for a Share Outstanding Throughout Each Period |
| | | | | | | | | | | | | | | Three | | | | |
| | | | | | | | | | | | | | | Months | | | Year | |
| | | | | | | | | | | | | | | Ended | | | Ended | |
| | | Year Ended June 30, | | | June 30, | | | March 31, | |
| | | 2016 | | | 2015 | | | 2014 | | | 2013 | | | 2012(A) | | | 2012 | |
| Net asset value at beginning of period | | $ | 19.94 | | | $ | 22.13 | | | $ | 19.62 | | | $ | 17.63 | | | $ | 18.75 | | | $ | 19.65 | |
| Income (loss) from investment operations: | | | | | | | | | | | | | | | | | | | | | | | | |
| Net investment income (loss) | | | 0.02 | | | | 0.16 | | | | 0.04 | | | | 0.17 | (B) | | | 0.01 | | | | 0.01 | (B) |
| Net realized and unrealized gains (losses) on investments | | | (2.71 | ) | | | 0.37 | | | | 6.18 | (C) | | | 3.82 | | | | (0.60 | ) | | | 0.05 | |
| Total from investment operations | | | (2.69 | ) | | | 0.53 | | | | 6.22 | | | | 3.99 | | | | (0.59 | ) | | | 0.06 | |
| Distributions from: | | | | | | | | | | | | | | | | | | | | | | | | |
| Net investment income | | | — | | | | (0.35 | ) | | | (0.07 | ) | | | (0.12 | ) | | | — | | | | — | |
| Realized capital gains | | | (1.26 | ) | | | (2.37 | ) | | | (3.64 | ) | | | (1.88 | ) | | | (0.53 | ) | | | (0.96 | ) |
| Total distributions | | | (1.26 | ) | | | (2.72 | ) | | | (3.71 | ) | | | (2.00 | ) | | | (0.53 | ) | | | (0.96 | ) |
| Net asset value at end of period | | $ | 15.99 | | | $ | 19.94 | | | $ | 22.13 | | | $ | 19.62 | | | $ | 17.63 | | | $ | 18.75 | |
| Total return | | | (13.44 | )% | | | 3.04 | % | | | 33.90 | %(C) | | | 24.82 | % | | | (3.04 | )%(D) | | | 1.00 | % |
| Ratios and supplemental data: | | | | | | | | | | | | | | | | | | | | | | | | |
| Net assets at end of period (000's) | | $ | 26,483 | | | $ | 31,318 | | | $ | 26,466 | | | $ | 8,096 | | | $ | 7,023 | | | $ | 19,066 | |
| Ratio to average net assets: | | | | | | | | | | | | | | | | | | | | | | | | |
| Net expenses | | | 1.10 | % | | | 1.10 | % | | | 1.10 | % | | | 1.10 | % | | | 1.10 | %(E) | | | 1.10 | % |
| Gross expenses | | | 1.24 | % | | | 1.32 | % | | | 1.37 | % | | | 1.46 | % | | | 1.60 | %(E) | | | 1.18 | %(F) |
| Net investment income | | | 0.11 | % | | | 0.66 | % | | | 0.31 | % | | | 0.93 | % | | | 0.24 | %(E) | | | 0.06 | % |
| Portfolio turnover rate | | | 42 | % | | | 57 | % | | | 73 | % | | | 95 | % | | | 18 | %(D) | | | 49 | % |
| (A) | The Fund changed its fiscal year end from March 31 to June 30. |
| (B) | The net investment income (loss) per share is based on average shares outstanding for the period. |
| (C) | Impact of payment from affiliate was less than $0.01 per share and 0.01%, respectively. |
| (F) | Legal, printing and/or compliance audit expenses relating to civil litigation and certain regulatory actions in connection with market timing allegations were incurred, and the former advisor paid these expenses on behalf of the Funds. Had the former advisor not paid these expenses, the expenses for the Funds would have been higher than what is reflected in the financial highlights for the year ended March 31, 2012. |
See accompanying Notes to Financial Statements.
Financial Highlights (Continued)
| Touchstone Value Fund—Class A |
| Selected Data for a Share Outstanding Throughout Each Period |
| | | | | | | | | | | | | | | Three | | | | |
| | | | | | | | | | | | | | | Months | | | Year | |
| | | | | | | | | | | | | | | Ended | | | Ended | |
| | | Year Ended June 30, | | | June 30, | | | March 31, | |
| | | 2016 | | | 2015 | | | 2014 | | | 2013 | | | 2012(A) | | | 2012 | |
| Net asset value at beginning of period | | $ | 9.78 | | | $ | 9.56 | | | $ | 8.02 | | | $ | 6.95 | | | $ | 7.14 | | | $ | 6.67 | |
| Income (loss) from investment operations: | | | | | | | | | | | | | | | | | | | | | | | | |
| Net investment income | | | 0.16 | | | | 0.16 | | | | 0.19 | | | | 0.15 | (B) | | | 0.03 | (B) | | | 0.12 | (B) |
| Net realized and unrealized gains (losses) on investments | | | (0.27 | ) | | | 0.34 | | | | 1.53 | | | | 1.30 | | | | (0.16 | ) | | | 0.45 | |
| Total from investment operations | | | (0.11 | ) | | | 0.50 | | | | 1.72 | | | | 1.45 | | | | (0.13 | ) | | | 0.57 | |
| Distributions from: | | | | | | | | | | | | | | | | | | | | | | | | |
| Net investment income | | | (0.16 | ) | | | (0.11 | ) | | | (0.18 | ) | | | (0.15 | ) | | | (0.06 | ) | | | (0.10 | ) |
| Realized capital gains | | | (0.67 | ) | | | (0.17 | ) | | | — | | | | (0.23 | ) | | | — | | | | — | |
| Total distributions | | | (0.83 | ) | | | (0.28 | ) | | | (0.18 | ) | | | (0.38 | ) | | | (0.06 | ) | | | (0.10 | ) |
| Net asset value at end of period | | $ | 8.84 | | | $ | 9.78 | | | $ | 9.56 | | | $ | 8.02 | | | $ | 6.95 | | | $ | 7.14 | |
| Total return(C) | | | (0.89 | )% | | | 5.26 | % | | | 21.50 | % | | | 21.56 | % | | | (1.83 | )%(D) | | | 8.77 | % |
| Ratios and supplemental data: | | | | | | | | | | | | | | | | | | | | | | | | |
| Net assets at end of period (000's) | | $ | 47,939 | | | $ | 55,539 | | | $ | 66,000 | | | $ | 53,433 | | | $ | 1,583 | | | $ | 1,606 | |
| Ratio to average net assets: | | | | | | | | | | | | | | | | | | | | | | | | |
| Net expenses | | | 1.08 | % | | | 1.08 | % | | | 1.07 | % | | | 1.00 | % | | | 1.20 | %(E) | | | 1.20 | % |
| Gross expenses | | | 1.28 | % | | | 1.27 | % | | | 1.31 | % | | | 1.51 | % | | | 3.49 | %(E) | | | 1.96 | %(F) |
| Net investment income | | | 1.71 | % | | | 1.54 | % | | | 2.13 | % | | | 1.96 | % | | | 1.68 | %(E) | | | 1.84 | % |
| Portfolio turnover rate | | | 19 | %(G) | | | 20 | % | | | 26 | % | | | 110 | %(H) | | | 13 | %(D) | | | 15 | % |
| Touchstone Value Fund—Class C |
| Selected Data for a Share Outstanding Throughout Each Period |
| | | | | | | | | | | | | | | Period | |
| | | | | | | | | | | | | | | Ended | |
| | | Year Ended June 30, | | | June 30, | |
| | | 2016 | | | 2015 | | | 2014 | | | 2013 | | | 2012(I) | |
| Net asset value at beginning of period | | $ | 9.75 | | | $ | 9.55 | | | $ | 8.02 | | | $ | 6.95 | | | $ | 6.90 | |
| Income (loss) from investment operations: | | | | | | | | | | | | | | | | | | | | |
| Net investment income | | | 0.09 | | | | 0.07 | | | | 0.11 | | | | 0.09 | (B) | | | 0.01 | (B) |
| Net realized and unrealized gains (losses) on investments | | | (0.27 | ) | | | 0.35 | | | | 1.54 | | | | 1.30 | | | | 0.10 | |
| Total from investment operations | | | (0.18 | ) | | | 0.42 | | | | 1.65 | | | | 1.39 | | | | 0.11 | |
| Distributions from: | | | | | | | | | | | | | | | | | | | | |
| Net investment income | | | (0.09 | ) | | | (0.05 | ) | | | (0.12 | ) | | | (0.09 | ) | | | (0.06 | ) |
| Realized capital gains | | | (0.67 | ) | | | (0.17 | ) | | | — | | | | (0.23 | ) | | | — | |
| Total distributions | | | (0.76 | ) | | | (0.22 | ) | | | (0.12 | ) | | | (0.32 | ) | | | (0.06 | ) |
| Net asset value at end of period | | $ | 8.81 | | | $ | 9.75 | | | $ | 9.55 | | | $ | 8.02 | | | $ | 6.95 | |
| Total return(C) | | | (1.65 | )% | | | 4.41 | % | | | 20.61 | % | | | 20.62 | % | | | 1.56 | %(D) |
| Ratios and supplemental data: | | | | | | | | | | | | | | | | | | | | |
| Net assets at end of period (000's) | | $ | 5,624 | | | $ | 6,932 | | | $ | 5,218 | | | $ | 3,025 | | | $ | 3 | |
| Ratio to average net assets: | | | | | | | | | | | | | | | | | | | | |
| Net expenses | | | 1.83 | % | | | 1.83 | % | | | 1.82 | % | | | 1.75 | % | | | 1.95 | %(E) |
| Gross expenses | | | 2.16 | % | | | 2.14 | % | | | 2.19 | % | | | 2.30 | % | | | 929.36 | %(E) |
| Net investment income | | | 0.96 | % | | | 0.79 | % | | | 1.38 | % | | | 1.21 | % | | | 0.93 | %(E) |
| Portfolio turnover rate | | | 19 | %(G) | | | 20 | % | | | 26 | % | | | 110 | %(H) | | | 13 | %(D) |
| (A) | The Fund changed its fiscal year end from March 31 to June 30. |
| (B) | The net investment income per share is based on average shares outstanding for the period. |
| (C) | Total returns shown exclude the effect of applicable sales loads. If these charges were included, the returns would be lower. |
| (F) | Legal, printing and/or compliance audit expenses relating to civil litigation and certain regulatory actions in connection with market timing allegations were incurred, and the former advisor paid these expenses on behalf of the Funds. Had the former advisor not paid these expenses, the expenses for the Funds would have been higher than what is reflected in the financial highlights for the year ended March 31, 2012. |
| (G) | Portfolio turnover rate excludes securities received from processing a subscription-in-kind. |
| (H) | Portfolio turnover excludes the purchases and sales of the Fifth Third Disciplined Large Cap Value Fund acquired on September 10, 2012. If these transactions were included, portfolio turnover would have been higher. |
| (I) | Represents the period from commencement of operations (April 16, 2012) through June 30, 2012. |
See accompanying Notes to Financial Statements.
Financial Highlights (Continued)
| Touchstone Value Fund—Class Y |
| Selected Data for a Share Outstanding Throughout Each Period |
| | | | | | | | | | | | | | | Three | | | | |
| | | | | | | | | | | | | | | Months | | | Year | |
| | | | | | | | | | | | | | | Ended | | | Ended | |
| | | Year Ended June 30, | | | June 30, | | | March 31, | |
| | | 2016 | | | 2015 | | | 2014 | | | 2013 | | | 2012(A) | | | 2012 | |
| Net asset value at beginning of period | | $ | 9.81 | | | $ | 9.59 | | | $ | 8.05 | | | $ | 6.97 | | | $ | 7.16 | | | $ | 6.69 | |
| Income (loss) from investment operations: | | | | | | | | | | | | | | | | | | | | | | | | |
| Net investment income | | | 0.18 | | | | 0.18 | | | | 0.21 | | | | 0.16 | (B) | | | 0.03 | (B) | | | 0.12 | (B) |
| Net realized and unrealized gains (losses) on investments | | | (0.27 | ) | | | 0.35 | | | | 1.53 | | | | 1.32 | | | | (0.15 | ) | | | 0.47 | |
| Total from investment operations | | | (0.09 | ) | | | 0.53 | | | | 1.74 | | | | 1.48 | | | | (0.12 | ) | | | 0.59 | |
| Distributions from: | | | | | | | | | | | | | | | | | | | | | | | | |
| Net investment income | | | (0.18 | ) | | | (0.14 | ) | | | (0.20 | ) | | | (0.17 | ) | | | (0.07 | ) | | | (0.12 | ) |
| Realized capital gains | | | (0.67 | ) | | | (0.17 | ) | | | — | | | | (0.23 | ) | | | — | | | | — | |
| Total distributions | | | (0.85 | ) | | | (0.31 | ) | | | (0.20 | ) | | | (0.40 | ) | | | (0.07 | ) | | | (0.12 | ) |
| Net asset value at end of period | | $ | 8.87 | | | $ | 9.81 | | | $ | 9.59 | | | $ | 8.05 | | | $ | 6.97 | | | $ | 7.16 | |
| Total return | | | (0.64 | )% | | | 5.52 | % | | | 21.71 | % | | | 21.91 | % | | | (1.69 | )%(C) | | | 9.01 | % |
| Ratios and supplemental data: | | | | | | | | | | | | | | | | | | | | | | | | |
| Net assets at end of period (000's) | | $ | 76,852 | | | $ | 104,668 | | | $ | 113,055 | | | $ | 99,398 | | | $ | 51,447 | | | $ | 87,546 | |
| Ratio to average net assets: | | | | | | | | | | | | | | | | | | | | | | | | |
| Net expenses | | | 0.83 | % | | | 0.82 | % | | | 0.80 | % | | | 0.77 | % | | | 0.95 | %(D) | | | 0.95 | % |
| Gross expenses | | | 0.99 | % | | | 0.97 | % | | | 0.99 | % | | | 1.09 | % | | | 1.23 | %(D) | | | 1.03 | %(E) |
| Net investment income | | | 1.96 | % | | | 1.80 | % | | | 2.39 | % | | | 2.19 | % | | | 1.93 | %(D) | | | 1.90 | % |
| Portfolio turnover rate | | | 19 | %(F) | | | 20 | % | | | 26 | % | | | 110 | %(G) | | | 13 | %(C) | | | 15 | % |
| Touchstone Value Fund—Institutional Class |
| Selected Data for a Share Outstanding Throughout Each Period |
| | | | | | | | | | | | | | | Three | | | | |
| | | | | | | | | | | | | | | Months | | | Year | |
| | | | | | | | | | | | | | | Ended | | | Ended | |
| | | Year Ended June 30, | | | June 30, | | | March 31, | |
| | | 2016 | | | 2015 | | | 2014 | | | 2013 | | | 2012(A) | | | 2012 | |
| Net asset value at beginning of period | | $ | 9.79 | | | $ | 9.57 | | | $ | 8.03 | | | $ | 6.96 | | | $ | 7.15 | | | $ | 6.68 | |
| Income (loss) from investment operations: | | | | | | | | | | | | | | | | | | | | | | | | |
| Net investment income | | | 0.19 | | | | 0.18 | | | | 0.21 | | | | 0.17 | (B) | | | 0.03 | (B) | | | 0.13 | (B) |
| Net realized and unrealized gains (losses) on investments | | | (0.27 | ) | | | 0.36 | | | | 1.54 | | | | 1.31 | | | | (0.16 | ) | | | 0.46 | |
| Total from investment operations | | | (0.08 | ) | | | 0.54 | | | | 1.75 | | | | 1.48 | | | | (0.13 | ) | | | 0.59 | |
| Distributions from: | | | | | | | | | | | | | | | | | | | | | | | | |
| Net investment income | | | (0.19 | ) | | | (0.15 | ) | | | (0.21 | ) | | | (0.18 | ) | | | (0.06 | ) | | | (0.12 | ) |
| Realized capital gains | | | (0.67 | ) | | | (0.17 | ) | | | — | | | | (0.23 | ) | | | — | | | | — | |
| Total distributions | | | (0.86 | ) | | | (0.32 | ) | | | (0.21 | ) | | | (0.41 | ) | | | (0.06 | ) | | | (0.12 | ) |
| Net asset value at end of period | | $ | 8.85 | | | $ | 9.79 | | | $ | 9.57 | | | $ | 8.03 | | | $ | 6.96 | | | $ | 7.15 | |
| Total return | | | (0.49 | )% | | | 5.68 | % | | | 21.92 | % | | | 21.92 | % | | | (1.62 | )%(C) | | | 9.13 | % |
| Ratios and supplemental data: | | | | | | | | | | | | | | | | | | | | | | | | |
| Net assets at end of period (000's) | | $ | 219,824 | | | $ | 248,381 | | | $ | 245,573 | | | $ | 186,990 | | | $ | 69,549 | | | $ | 33,727 | |
| Ratio to average net assets: | | | | | | | | | | | | | | | | | | | | | | | | |
| Net expenses | | | 0.68 | % | | | 0.68 | % | | | 0.67 | % | | | 0.67 | % | | | 0.85 | %(D) | | | 0.85 | % |
| Gross expenses | | | 0.87 | % | | | 0.86 | % | | | 0.87 | % | | | 0.99 | % | | | 1.09 | %(D) | | | 0.88 | %(E) |
| Net investment income | | | 2.11 | % | | | 1.94 | % | | | 2.52 | % | | | 2.29 | % | | | 2.04 | %(D) | | | 2.00 | % |
| Portfolio turnover rate | | | 19 | %(F) | | | 20 | % | | | 26 | % | | | 110 | %(G) | | | 13 | %(C) | | | 15 | % |
| (A) | The Fund changed its fiscal year end from March 31 to June 30. |
| (B) | The net investment income per share is based on average shares outstanding for the period. |
| (E) | Legal, printing and/or compliance audit expenses relating to civil litigation and certain regulatory actions in connection with market timing allegations were incurred, and the former advisor paid these expenses on behalf of the Funds. Had the former advisor not paid these expenses, the expenses for the Funds would have been higher than what is reflected in the financial highlights for the year ended March 31, 2012. |
| (F) | Portfolio turnover rate excludes securities received from processing a subscription-in-kind. |
| (G) | Portfolio turnover excludes the purchases and sales of the Fifth Third Disciplined Large Cap Value Fund acquired on September 10, 2012. If these transactions were included, portfolio turnover would have been higher. |
See accompanying Notes to Financial Statements.
Notes to Financial Statements
June 30, 2016
1. Organization
The Touchstone Strategic Trust (the “Trust”) is registered under the Investment Company Act of 1940, as amended (the “1940 Act”), as an open-end management investment company. The Trust was established as a Massachusetts business trust pursuant to an Agreement and Declaration of Trust dated November 18, 1982. The Trust consists of eighteen funds including, the following five funds (individually, a “Fund”, and collectively, the “Funds”):
Touchstone Credit Opportunities Fund (“Credit Opportunities Fund”)
Touchstone International Small Cap Fund (“International Small Cap Fund”)
Touchstone Large Cap Fund (“Large Cap Fund”)
Touchstone Small Cap Value Opportunities Fund (“Small Cap Value Opportunities Fund”)
Touchstone Value Fund (“Value Fund”)
Each Fund is diversified, with the exception of the Credit Opportunities Fund and the Large Cap Fund, which are non-diversified.
The Agreement and Declaration of Trust permits the Trust to issue an unlimited number of shares of beneficial interest of each Fund. The Funds are registered to offer the following classes of shares: Class A shares, Class C shares, Class Y shares, and Institutional Class shares. The assets of each Fund are segregated, and a shareholder’s interest is limited to the Fund in which shares are held. The Funds’ prospectus provides a description of each Fund’s investment goals, policies, and strategies along with information on the classes of shares currently being offered.
2. Significant Accounting Policies
The following is a summary of the Funds’ significant accounting policies:
Each Fund is an investment company that follows the accounting and reporting guidance of Accounting Standards Codification Topic 946 applicable to investment companies.
Security valuation and fair value measurements — U.S. generally accepted accounting principles (“U.S. GAAP”) define fair value as the price the Funds would receive to sell an asset or pay to transfer a liability in an orderly transaction between market participants at the measurement date. All investments in securities are recorded at their estimated fair value. The Funds define the term “market value”, as used throughout this report, as the estimated fair value. The Funds use various methods to measure fair value of their portfolio securities on a recurring basis. U.S. GAAP fair value measurement standards require disclosure of a hierarchy that prioritizes inputs to valuation methods.
These inputs are summarized in the three broad levels listed below:
| · | Level 1 – | quoted prices in active markets for identical securities |
| · | Level 2 – | other significant observable inputs (including quoted prices for similar securities, interest rates, prepayment speeds, credit risk, etc.) |
| · | Level 3 – | significant unobservable inputs (including a Fund’s own assumptions in determining the fair value of investments) |
The inputs or methodology used for valuing securities are not necessarily an indication of the risk associated with investing in those securities.
The aggregate value by input level, as of June 30, 2016, for each Fund’s investments, as well as a reconciliation of assets for which significant unobservable inputs (Level 3) were used in determining value, if applicable, is included in the Fund’s Portfolio of Investments, which also includes a breakdown of the Fund’s investments
Notes to Financial Statements (Continued)
by geographic, portfolio or sector allocation. The Credit Opportunities Fund held Level 3 categorized securities during the year ended June 30, 2016. Refer to the Portfolio of Investments for a reconciliation of Level 3 holdings.
Changes in valuation techniques may result in transfers into or out of an investment’s assigned level within the hierarchy. All transfers in and out of the levels are recognized at the value at the end of the period. During the year ended June 30, 2016, there were no transfers between Levels 1, 2 and 3 for all Funds, except as shown in the Portfolio of Investments for the International Small Cap Fund.
The Funds’ portfolio securities are valued as of the close of the regular session of trading on the New York Stock Exchange (“NYSE”) (currently 4:00 p.m., Eastern Time). Portfolio securities traded on stock exchanges are valued at the last reported sale price, official close price, or last bid price if no sales are reported. Portfolio securities quoted by NASDAQ are valued at the NASDAQ Official Closing Price (“NOCP”) or from the primary exchange on which the security trades. To the extent these securities are actively traded, they are categorized in Level 1 of the fair value hierarchy. Options are valued at the last quoted sales price. If there is no such reported sale on the valuation date, long option positions are valued at the most recent bid price, and short option positions are valued at the most recent ask price and are categorized in Level 1. Shares of mutual funds in which the Funds invest are valued at their respective net asset values (“NAV”) as reported by the underlying funds and are categorized in Level 1.
Debt securities held by the Funds are valued at their evaluated bid by an independent pricing service or at their last broker-quoted bid prices as obtained from one or more of the major market makers for such securities. Independent pricing services use information provided by market makers or estimates of market values through accepted market modeling conventions. Observable inputs to the models may include prepayment speeds, pricing spread, yield, trade information, dealer quotes, market color, cash flow models, the securities’ terms and conditions, among others, and are generally categorized in Level 2. The Credit Opportunities Fund’s investments in bank loans are normally valued at the bid quotation obtained from dealers in loans by an independent pricing service in accordance with the Fund’s valuation policies and procedures approved by the Board, and are generally categorized in Level 2. The Credit Opportunities Fund’s investments in asset-backed and mortgage-backed securities are valued by independent pricing services using models that consider estimated cash flows of each tranche of the security, establish a benchmark yield and develop an estimated tranche specific spread to the benchmark yield based on the unique attributes of the tranche, and are generally categorized in Level 2. Debt securities with remaining maturities of 60 days or less may be valued at amortized cost, provided such amount approximates market value and are categorized in Level 2. While this method provides consistency in valuation (and may only be used if it approximates market value), it may result in periods during which value, as determined by amortized cost, is higher or lower than the price that would be received if the Fund sold the investment.
Foreign currency exchange contracts are valued at the mean between the bid and ask prices and are determined as of the close of regular trading on the NYSE. Interpolated values are derived when the settlement date of the contract is an interim date for which quotations are not available and categorized in Level 2.
Securities mainly traded on a non-U.S. exchange or denominated in foreign currencies are generally valued according to the preceding closing values on that exchange, translated to U.S. dollars using currency exchange rates as of the close of regular trading on the NYSE, and are generally categorized in Level 1. However, if an event that may change the value of a security occurs after the time that the closing value on the non-U.S. exchange was determined, but before the close of regular trading on the NYSE, the security may be priced based on fair value and generally categorized in Level 2. This may cause the value of the security, if held on the books of a Fund to be different from the closing value on the non-U.S. exchange and may affect the calculation of the Fund’s NAV.
Notes to Financial Statements (Continued)
The Funds may use fair value pricing under the following circumstances, among others:
| · | If the value of a security has been materially affected by events occurring before the Funds’ pricing time but after the close of the primary markets on which the security is traded. |
| · | If the exchange on which a portfolio security is principally traded closes early or if trading in a particular portfolio security was halted during the day and did not resume prior to the Funds’ NAV calculation. |
| · | If a security is so thinly traded that reliable market quotations are unavailable due to infrequent trading. |
| · | If the validity of market quotations is not reliable. |
Securities held by the Funds that do not have readily available market quotations, significant observable inputs, or securities for which the available market quotations are not reliable, are priced at their estimated fair value using procedures approved by the Funds’ Board of Trustees and are generally categorized in Level 3.
Bank Loans — The Credit Opportunities Fund may invest in bank loans, which usually take the form of loan participations and assignments. Loan participations and assignments are agreements to make money available to U.S. or foreign corporations, partnerships or other business entities (the “Borrower”) in a specified amount, at a specified rate and within a specified time. A loan is typically originated, negotiated and structured by a U.S. or foreign bank, insurance company or other financial institution (the “Agent”) for a group of loan investors (“Loan Investors”). The Agent typically administers and enforces the loan on behalf of the other Loan Investors in the syndicate and may hold any collateral on behalf of the Loan Investors. Such loan participations and assignments are typically senior, secured and collateralized in nature. The Fund records an investment when the Borrower withdraws money and records interest as earned. These loans pay interest at rates which are periodically reset by reference to a base lending rate plus a spread. These base lending rates are generally the prime rate offered by a designated U.S. bank or London InterBank Offered Rate (“LIBOR”).
The loans in which the Fund invests may be subject to some restrictions on resale. For example, the Fund may be contractually obligated to receive approval from the Agent and/or Borrower prior to the sale of these investments. The Fund generally has no right to enforce compliance with the terms of the loan agreement with the Borrower. As a result, the Fund assumes the credit risk of the Borrower, the selling participant and any other persons interpositioned between the Fund and the Borrower (“Intermediate Participants”). In the event that the Borrower, selling participant or Intermediate Participants become insolvent or enter into bankruptcy, the Fund may incur certain costs and delays in realizing payment or may suffer a loss of principal and/or interest.
Unfunded commitments represent the remaining obligation of the Fund to the Borrower. At any point in time, up to the maturity date of the issue, the Borrower may demand the unfunded portion. Until demanded by the Borrower, unfunded commitments are not recognized as an asset on the Statement of Assets and Liabilities. Unrealized appreciation/depreciation on unfunded commitments presented on the Statement of Assets and Liabilities represents mark to market of the unfunded portion of the Fund’s bank loans. As of June 30, 2016, the Credit Opportunities Fund had the following unfunded loan commitments.
| | | Unfunded | |
| | | Loan | |
| | | Commitments | |
| Energy & Exploration Partners, LLC | | $ | 10,859 | |
Collateralized Loan Obligations — The Credit Opportunities Fund may invest in collateralized loan obligations (“CLOs”). CLOs are types of asset-backed securities. A CLO is an entity that is backed by syndicated bank loans. The cash flows of the CLO can be split into multiple segments, called “tranches,” which will vary in risk profile and yield. The riskiest segment is the subordinated or “equity” tranche. This tranche bears the greatest risk of defaults from the underlying assets in the CLO and serves to protect the other, more senior, tranches from default in all but the most severe circumstances. Since it is shielded from defaults by the more junior
Notes to Financial Statements (Continued)
tranches, a “senior” tranche will typically have higher credit ratings and lower yields than their underlying securities, and often receive investment grade ratings from one or more of the nationally recognized rating agencies. Despite the protection from the more junior tranches, senior tranches can experience substantial losses due to actual defaults, increased sensitivity to future defaults and the disappearance of one or more protecting tranches as a result of changes in the credit profile of the underlying pool of assets.
Investment companies — Certain Funds may invest in securities of other investment companies, including exchange-traded funds (“ETFs”), open-end funds, and closed-end funds. Open-end funds are investment companies that issue new shares continuously and redeem shares daily. Closed-end funds are investment companies that typically issue a fixed number of shares that trade on a securities exchange or over-the-counter. An ETF is an investment company that typically seeks to track the performance of an index by holding in its portfolio shares of all the companies, or a representative sample of the companies, that are components of a particular index. ETF shares are traded on a securities exchange based on their market value. The risks of investment in other investment companies typically reflect the risks of the types of securities in which the other investment companies invest. Investments in ETFs and closed-end funds are subject to the additional risk that their shares may trade at a premium or discount to their NAV. When a Fund invests in another investment company, shareholders of the Fund indirectly bear their proportionate share of the other investment company’s fees and expenses, including operating, registration, trustee, licensing and marketing, as well as their share of the Fund’s fees and expenses.
Securities sold short — The Credit Opportunities Fund engages in selling securities short, which obligates the Fund to replace a security borrowed by purchasing the same security at the current market value. The Fund would incur a loss if the price of the security increases between the date of the short sale and the date on which the Fund replaces the borrowed security. The Fund would realize a gain if the price of the security declines between those dates. As of June 30, 2016, the Credit Opportunities Fund held securities sold short with a fair value of $751,419 and had securities with a fair value of $1,575,271 and cash of $743,707 held as collateral for securities sold short.
Options — The Credit Opportunities Fund may write or purchase financial option contracts primarily to hedge against changes in the value of equity securities (or securities that the Fund intends to purchase), against fluctuations in fair value caused by changes in prevailing market interest rates or foreign currency exchange rates and against changes in overall equity market volatility. In addition, the Fund may utilize options in an attempt to generate gains from option premiums or to reduce overall portfolio risk. The Fund’s option strategy primarily focuses on the use of writing and/or purchasing call or put options on equity indexes. When the Fund writes or purchases an option, an amount equal to the premium received or paid by the Fund is recorded as a liability or an asset and is subsequently adjusted to the current market value of the option written or purchased. Premiums received or paid from writing or purchasing options which expire unexercised are treated by the Fund on the expiration date as realized gains or losses. The difference between the premium and the amount paid or received on effecting a closing purchase or sale transaction, including brokerage commissions, is also treated as a realized gain or loss. If an option is exercised, the premium paid or received is added to the cost of the purchase or proceeds from the sale in determining whether the Fund has realized a gain or loss on investment transactions. The Fund, as writer of an option, may have no control over whether the underlying securities may be sold (call) or purchased (put) and as a result bears the market risk of an unfavorable change in the price of the security underlying the written option. The Fund, as purchaser of an option, bears the risk that the counterparties to the option may not have the ability to meet the terms of the option contracts. There is minimal counterparty credit risk involved in entering into option contracts since they are exchange-traded instruments and the exchange’s clearinghouse, as counterparty to all exchange-traded options, guarantees the options against default.
As of June 30, 2016, the Credit Opportunities Fund held purchased options with a fair value of $5,280.
Notes to Financial Statements (Continued)
Foreign currency translation — The books and records of the Funds are maintained in U.S. dollars and translated into U.S. dollars on the following basis:
| (1) | market value of investment securities, assets and liabilities at the current rate of exchange on the valuation date; and |
| (2) | purchases and sales of investment securities, income, and expenses at the relevant rates of exchange prevailing on the respective dates of such transactions. |
The Funds do not isolate that portion of gains and losses on investments in equity securities that is due to changes in the foreign exchange rates from that which is due to changes in market prices of equity securities.
Forward foreign currency contracts — A forward foreign currency contract is an agreement between two parties to buy and sell a specific currency at a price that is set on the date of the contract. The forward contract calls for delivery of the currency on a future date that is specified in the contract. Risks related to the use of forwards include the possible failure of counterparties to meet the terms of the forward agreement, the failure of the counterparties to timely post collateral, the risk that currency movements will not occur thereby reducing a Fund’s total return, and the potential for losses in excess of a Fund’s initial investment.
The market value of a forward foreign currency contract fluctuates with changes in foreign currency exchange rates. Forward foreign currency contracts are marked to market daily and the change in value is recorded by a Fund as an unrealized gain or loss. Realized gains or losses, equal to the difference between the value of the contract at the time it was opened and the value at the time it was closed, are recorded upon delivery or receipt of the currency.
During the year ended June 30, 2016, the Credit Opportunities Fund used forward foreign currency contracts to enhance potential gains, hedge against anticipated currency exchange rates, maintain diversity and liquidity of the portfolio and/or adjust exposure to foreign currencies.
Real Estate Investment Trusts — The Funds may invest in real estate investment trusts (“REITs”) that involve risks not associated with investing in stocks. Risks include declines in the value of real estate, general and economic conditions, changes in the value of the underlying property and defaults by borrowers. The value of assets in the real estate industry may go through cycles of relative underperformance and outperformance in comparison to equity securities markets in general. Dividend income is recorded using management’s estimate of the income included in distributions received from REIT investments. The actual amounts of income, return of capital and capital gains are only determined by each REIT after its fiscal year-end and may differ from the estimated amount. Estimates of income are adjusted in the Funds to the actual amounts when the amounts are determined.
Derivative instruments and hedging activities — The Credit Opportunities Fund may enter into an International Swaps and Derivatives Association, Inc. Master Agreement (“ISDA Master Agreement” or “MNA”) or similar agreement with certain counterparties. An ISDA Master Agreement is a bilateral agreement between the Fund and a counterparty that governs over-the-counter (“OTC”) derivatives and foreign exchange contracts, and typically contains, among other things, collateral posting terms and master netting provisions in the event of a default or termination. Under an ISDA Master Agreement, a party may, under certain circumstances, offset with the counterparty certain derivative financial instrument’s payables or receivables with collateral held or posted and create one single net payment. The provisions of the ISDA Master Agreement typically permit a single net payment in the event of default (close-out netting). These default events include bankruptcy or insolvency of the counterparty. Note, however, that bankruptcy or insolvency laws of a particular jurisdiction may impose restrictions on or prohibitions against the right of offset.
Notes to Financial Statements (Continued)
When entering into a derivative transaction, the Fund may be required to post and maintain collateral or margin (including both initial and maintenance margin). Collateral and margin requirements differ by type of derivative. Margin requirements are established by the broker or clearing house for exchange traded and centrally cleared derivatives (financial futures contracts, options, and centrally cleared swaps). Brokers can ask for margining in excess of the clearing house’s minimum in certain circumstances. Collateral terms are contract specific for OTC derivatives (foreign currency exchange contracts, options, and swaps). For derivatives traded under an ISDA Master Agreement, the collateral requirements are typically calculated by netting the marked-to-market amount for each transaction under such agreement and comparing that amount to the value of any collateral currently pledged by the Fund and the counterparty. For financial reporting purposes, cash collateral that has been pledged to cover obligations of the Fund and cash collateral received from the counterparty, if any, is reported separately on the Statement of Assets and Liabilities as cash pledged as collateral and cash received as collateral, respectively. Non-cash collateral pledged by the Fund, if any, is noted in the Portfolio of Investments. To the extent amounts due to the Fund from its counterparties are not fully collateralized, contractually or otherwise, the Fund bears the risk of loss from counterparty non-performance.
Certain ISDA Master Agreements allow counterparties to OTC derivatives transactions to terminate derivative contracts prior to maturity in the event the Fund’s net assets decline by a stated percentage or the Fund fails to meet the terms of its ISDA Master Agreement, which would cause the Fund (counterparty) to accelerate payment of any net liability owed to the counterparty (Fund).
For financial reporting purposes, the Credit Opportunities Fund does not offset derivative assets and derivative liabilities that are subject to netting arrangements in the Statement of Assets and Liabilities.
As of June 30, 2016, the Credit Opportunities Fund’s assets and liabilities that were subject to a MNA on a gross basis were as follows:
| | | Assets | | | Liabilities | |
| | | | | | | |
| Derivative Financial Instruments: | | | | | | | | |
| Forward Foreign Currency Contracts | | $ | 3,599 | | | $ | — | |
| Total gross amount of assets and liabilities subject to MNA | | $ | 3,599 | | | $ | — | |
The following table presents the Credit Opportunities Fund’s assets net of amounts available for offset under a MNA and net of the related collateral received by the Fund as of June 30, 2016:
| | | | | | Gross Amounts | | | | | | | | | | |
| | | | | | Available for Offset | | | | | | | | | | |
| | | | | | in Statement of | | | Non-cash | | | | | | | |
| | | Gross Amount of | | | Assets and | | | Collateral | | | Cash Collateral | | | | |
| | | Recognized Assets | | | Liabilities | | | Received | | | Received | | | Net Amount(B) | |
| Forward Foreign Currency Contracts(A) | | $ | 3,599 | | | $ | — | | | $ | — | | | $ | — | | | $ | 3,599 | |
| (A) | Bank of America is the counterparty. |
| (B) | Net amount represents the net amount receivable from the counterparty in the event of default. |
Notes to Financial Statements (Continued)
The following table sets forth the fair value of the Credit Opportunities Fund’s derivative financial instruments by primary risk exposure as of June 30, 2016:
| | | Fair Value of Derivative Investments | | | | | | |
| | | As of June 30, 2016 | | | | | | |
| | | Derivatives not accounted for as hedging | | Asset | | | Liability | |
| Fund | | instruments under ASC 815 | | Derivatives | | | Derivatives | |
| Credit Opportunities Fund | | Forward-Foreign Currency Contracts* | | $ | 3,599 | | | $ | — | |
| | | Purchased Options - Equity Contracts** | | | 5,280 | | | | — | |
* Statements of Assets and Liabilities Location: Unrealized appreciation on forward foreign currency contracts.
** Statements of Assets and Liabilities Location: Investments, at market value.
The following table sets forth the effect of the Credit Opportunities Fund’s derivative financial instruments by primary risk exposure on the Statement of Operations for the year ended June 30, 2016:
| The Effect of Derivative Investments on the Statement of Operations |
| for the Year Ended June 30, 2016 |
| | | | | | | | Change in | |
| | | | | | | | Unrealized | |
| | | | | Realized Gain | | | Appreciation | |
| | | | | (Loss) | | | (Depreciation) | |
| | | Derivatives not accounted for as hedging | | on | | | on | |
| Fund | | instruments under ASC 815 | | Derivatives | | | Derivatives | |
| Credit Opportunities Fund | | Forward-Foreign Currency Contracts* | | $ | 67,597 | | | $ | 3,599 | |
| | | Purchased Options - Equity Contracts** | | | (41,753 | ) | | | (3,107 | ) |
* Statements of Operations Location: Net realized losses on foreign currency transactions and net change in unrealized appreciation (depreciation) on foreign currency transactions, respectively.
** Statements of Operations Location: Net realized gains (losses) on investments and net change in unrealized appreciation (depreciation) on investments, respectively.
For the year ended June 30, 2016, the average quarterly balances of outstanding derivative financial instruments were as follows:
| | | Credit | |
| | | Opportunities | |
| | | Fund | |
| Equity Contracts: | | | | |
| Purchased Options - Cost | | $ | 7,734 | |
| Forward foreign currency contracts: | | | | |
| Average number of contracts | | | 1 | |
| Average U.S. dollar amount purchased | | $ | 706,816 | |
| Average U.S. dollar amount sold | | $ | 461,358 | |
Portfolio securities loaned — The Funds may lend their portfolio securities. Lending portfolio securities exposes the Funds to the risk that the borrower may fail to return the loaned securities or may not be able to provide additional collateral or that the Funds may experience delays in recovery of the loaned securities or loss of rights in the collateral if the borrower fails financially. To minimize these risks, the borrower must agree to maintain cash collateral with the Funds’ custodian. The loaned securities are secured by collateral valued at least equal, at all times, to the market value of the loaned securities plus accrued interest, if any. When the collateral falls below specified amounts, the lending agent will use its best effort to obtain additional collateral on the next business day to meet required amounts under the security lending agreement. The cash collateral is reinvested by the Funds’ custodian into an approved investment vehicle. The approved investment vehicle is subject to market risk.
Notes to Financial Statements (Continued)
As of June 30, 2016, the following Funds loaned securities and received collateral as follows:
| | | | | Market | | | Market | | | | |
| | | | | Value of | | | Value of | | | | |
| | | | | Securities | | | Collateral | | | | |
| Fund | | Security Type | | Loaned* | | | Received** | | | Net Amount | |
| International Small Cap Fund | | Common Stocks | | $ | 18,100,220 | | | $ | 21,773,369 | | | $ | 3,673,149 | |
| | | Exchange Traded Fund | | | 675,640 | | | | 683,200 | | | | 7,560 | |
| Total International Small Cap Fund | | | | | 18,775,860 | | | | 22,456,569 | | | | 3,680,709 | |
| Large Cap Fund | | Common Stocks | | | 9,736,328 | | | | 9,730,371 | | | | (5,957 | ) |
| Small Cap Value Opportunities Fund | | Common Stocks | | | 13,148,575 | | | | 13,452,919 | | | | 304,344 | |
| Value Fund | | Common Stocks | | | 1,458,294 | | | | 1,449,420 | | | | (8,874 | ) |
* The remaining contractual maturity is overnight for all securities.
** Gross amount of recognized liabilities for securities lending is included in the Statements of Assets and Liabilities.
All cash collateral is received, held, and administered by the Funds’ custodian for the benefit of the lending Fund in its custody account or other account established for the purpose of holding collateral.
Funds participating in securities lending receive compensation in the form of fees. Securities lending income is derived from lending long securities from the Funds to creditworthy approved borrowers at rates that are determined based on trading volumes, float, short-term interest rates and market liquidity. When a Fund lends securities, it retains the interest or dividends on the investment of any cash received as collateral, and the Fund continues to receive interest or dividends on the loaned securities.
Unrealized gain or loss on the market value of the loaned securities that may occur during the term of the loan is recognized by the Fund. The Fund has the right under the lending agreement to recover any loaned securities from the borrower on demand.
Share valuation — The NAV per share of each class of shares of each Fund is calculated daily by dividing the total value of a Fund’s assets attributable to that class, less liabilities attributable to that class, by the number of outstanding shares of that class.
The maximum offering price per share of Class A shares of the Funds is equal to the NAV per share plus a sales load equal to 6.10% of the NAV (or 5.75% of the offering price). There is no sales load on purchases of $1 million or more of Class A shares. The maximum offering price per share of Classes C, Y, and Institutional Class shares of the Funds is equal to the NAV per share.
The redemption price per share of each class of shares of the Funds is generally equal to the NAV per share. However, Class A redemptions that were part of a no-load $1 million subscription may be subject to a contingent deferred sales charge (“CDSC”) of up to 1.00% if redeemed within a one-year period from the date of purchase. Additionally, purchases of Class C shares of the Funds are subject to a CDSC of 1.00%. The CDSC will be assessed on an amount equal to the lesser of (1) the NAV at the time of purchase of the shares being redeemed or (2) the NAV of such shares being redeemed, if redeemed within a one-year period from the date of purchase.
Investment income — Dividend income from securities is recognized on the ex-dividend date, net of foreign withholding taxes, if any, which are reduced by any amounts reclaimable by the Funds, where applicable. Interest income from securities is recorded on the basis of interest accrued, premium amortized and discount accreted. Realized gains and losses resulting from principal paydowns on mortgage-backed and asset-backed securities are included in interest income. Market discounts, original issue discount (“OID”) and market premiums on debt securities are accreted/amortized to interest income over the life of the security with a corresponding adjustment in the cost basis of that security.
Notes to Financial Statements (Continued)
Distributions to shareholders — Each Fund intends to distribute to its shareholders substantially all of its income and capital gains. Each Fund, except the Credit Opportunities Fund and the Value Fund, declares and distributes net investment income, if any, annually, as a dividend to shareholders. The Credit Opportunities Fund declares and distributes net investment income, if any, quarterly as a dividend to shareholders. The Value Fund declares and distributes net investment income, if any, semi-annually as a dividend to shareholders. Each Fund makes distributions of capital gains, if any, at least annually, net of applicable capital loss carryforwards. Income distributions and capital gain distributions are determined in accordance with income tax regulations. Recognition of the Funds’ net investment income from investments in underlying funds is affected by the timing of dividend declarations by the underlying funds.
Allocations — Investment income earned, realized capital gains and losses, and unrealized appreciation and depreciation for a Fund are allocated daily to each class of shares based upon its proportionate share of total net assets of the Fund. Class-specific expenses are charged directly to the class incurring the expense. Common expenses, which are not attributable to a specific class, are allocated daily to each class of shares based upon their proportionate share of total net assets of the Fund. Expenses not directly billed to a Fund are allocated proportionally among all Funds in the Trust, and, if applicable, in Touchstone Funds Group Trust, Touchstone Institutional Funds Trust, Touchstone Investment Trust, Touchstone Tax-Free Trust and Touchstone Variable Series Trust (collectively with the Trust, “Touchstone Fund Complex”), daily in relation to net assets of each Fund or another reasonable measure.
Security transactions — Security transactions are reflected for financial reporting purposes as of the trade date. Realized gains and losses on sales of portfolio securities are calculated using the identified cost basis.
Estimates — The preparation of financial statements in conformity with U.S. GAAP requires management to make estimates and assumptions that affect the reported amounts of assets and liabilities and disclosure of contingent assets and liabilities at the date of the financial statements and the reported amounts of income and expenses during the reporting period. Actual results could differ from those estimates.
3. Investment Transactions
Investment transactions (excluding short-term investments and U.S. Government securities) were as follows for the year ended June 30, 2016:
| | | | | | | | | | | | Small Cap | | | | |
| | | Credit | | | International | | | | | | Value | | | | |
| | | Opportunities | | | Small Cap | | | Large Cap | | | Opportunities | | | Value | |
| | | Fund | | | Fund | | | Fund | | | Fund | | | Fund* | |
| Purchases of investment securities | | $ | 89,647,587 | | | $ | 467,889,406 | | | $ | 112,676,805 | | | $ | 64,128,186 | | | $ | 69,585,956 | |
| Proceeds from sales and maturities | | $ | 37,960,191 | | | $ | 299,187,224 | | | $ | 94,551,245 | | | $ | 96,130,090 | | | $ | 135,454,312 | |
*Touchstone Value Fund had a subscription-in-kind in the amount of $15,750,711 on July 22, 2015, which is excluded from the purchases of investment securities. The subscription was comprised of securities, cash and dividends accrued in the amount of $15,449,887, $279,620 and $21,214, respectively.
There were no purchases or proceeds from sales and maturities of U.S. Government securities by the Funds for the year ended June 30, 2016.
4. Transactions with Affiliates and Other Related Parties
Certain officers of the Trust are also officers of Touchstone Advisors, Inc. (the “Advisor”), Touchstone Securities, Inc. (the “Underwriter”), or BNY Mellon Investment Servicing (U.S.) Inc. (“BNY Mellon”), the Sub-Administrator
Notes to Financial Statements (Continued)
and Transfer Agent to the Funds. Such officers receive no compensation from the Trust. The Advisor and the Underwriter are each wholly-owned, indirect subsidiaries of Western & Southern Financial Group, Inc.
On behalf of the Funds, the Advisor pays each Independent Trustee a quarterly retainer plus additional retainers to the Lead Independent Trustee and the chairs of each standing committee. Interested Trustees do not receive compensation from the Funds. Each Independent Trustee also receives compensation for each board meeting and committee meeting attended. Each standing committee chair receives additional compensation for each committee meeting that he or she oversees. The Advisor is reimbursed by the Funds for the IndependentTrustees’ compensation and out-of-pocket expenses relating to their services. The Funds accrued Trustee-related expenses of $79,110 for the year ended June 30, 2016.
MANAGEMENT & EXPENSE LIMITATION AGREEMENTS
The Advisor provides general investment supervisory services for the Funds, under terms of an advisory agreement (the “Advisory Agreement”). Under the Advisory Agreement, each Fund pays the Advisor a fee, which is computed and accrued daily and paid monthly, at an annual rate based on average daily net assets of each Fund as shown in the table below.
| Touchstone Credit Opportunities Fund | | 1.10% |
| Touchstone International Small Cap Fund | | 0.95% on the first $300 million |
| | | 0.90% on the next $200 million |
| | | 0.85% on the next $250 million |
| | | 0.80% on the next $250 million |
| | | 0.75% on the next $500 million |
| | | 0.70% on the next $500 million |
| | | 0.65% on such assets over $2 billion |
| Touchstone Large Cap Fund | | 0.70% on the first $500 million |
| | | 0.64% on the next $500 million |
| | | 0.60% on such assets over $1 billion |
| Touchstone Small Cap Value Opportunities Fund | | 0.95% on the first $300 million |
| | | 0.90% on the next $200 million |
| | | 0.85% on such assets over $500 million |
| Touchstone Value Fund | | 0.65% |
The Advisor has entered into investment sub-advisory agreements with the following parties (each, a “Sub-Advisor”):
| Ares Capital Management II, LLC | | The London Company |
| Credit Opportunities Fund | | Large Cap Fund |
| | | |
| Barrow, Hanley, Mewhinney & Strauss, LLC | | Thompson Siegel & Walmsley LLC |
| Value Fund | | Small Cap Value Opportunities Fund |
| | | |
| Copper Rock Capital Partners LLC | | |
| International Small Cap Fund | | |
The Advisor, not the Funds, pays the sub-advisory fees to each Sub-Advisor.
The Advisor entered into an expense limitation agreement (the “Expense Limitation Agreement”) to contractually limit the annual operating expenses of the Funds, excluding: dividend and interest expenses relating to short sales; interest; taxes; brokerage commissions and other transactions costs; portfolio transactions and investment related expenses; other expenditures which are capitalized in accordance with U.S. GAAP; the cost of “Acquired Fund Fees and Expenses”, if any; and other extraordinary expenses not incurred in the ordinary course of business.
Notes to Financial Statements (Continued)
The maximum annual operating expense limit in any year with respect to the Funds is based on a percentage of the average daily net assets of the Funds. The Advisor has agreed to separately waive class-level expenses, advisory fees and administration fees, and to reimburse expenses in order to maintain the following expense limitations for the Funds:
| | | | | | | | | | | | Institutional | |
| Fund | | Class A | | | Class C | | | Class Y | | | Class | |
| Credit Opportunities Fund | | | 1.69 | % | | | 2.44 | % | | | 1.44 | % | | | 1.34 | % |
| International Small Cap Fund | | | 1.55 | % | | | 2.30 | % | | | 1.30 | % | | | 1.18 | % |
| Large Cap Fund | | | 1.12 | % | | | 1.87 | % | | | 0.87 | % | | | 0.77 | % |
| Small Cap Value Opportunities Fund | | | 1.43 | % | | | 2.18 | % | | | 1.18 | % | | | 1.10 | % |
| Value Fund | | | 1.08 | % | | | 1.83 | % | | | 0.83 | % | | | 0.68 | % |
These expense limitations will remain in effect for all Funds through at least October 29, 2016, but can be terminated by a vote of the Board of Trustees of the Trust if it deems the termination to be beneficial to the Funds’ shareholders.
During the year ended June 30, 2016, the Advisor or its affiliates waived investment advisory fees and administration fees or reimbursed expenses, including distribution fees, of the Funds as follows:
| | | Investment | | | | | | Other Operating | | | | |
| | | Advisory | | | | | | Expenses | | | | |
| | | Fees | | | Administration | | | Reimbursed/ | | | | |
| Fund | | Waived | | | Fees Waived | | | Waived | | | Total | |
| Credit Opportunities Fund | | $ | 40,662 | | | $ | 56,888 | | | $ | 31,496 | | | $ | 129,046 | |
| International Small Cap Fund | | | — | | | | — | | | | 147,586 | | | | 147,586 | |
| Large Cap Fund | | | — | | | | 365,623 | | | | 142,564 | | | | 508,187 | |
| Small Cap Value Opportunities Fund | | | — | | | | 77,887 | | | | 127,589 | | | | 205,476 | |
| Value Fund | | | 5,352 | | | | 548,266 | | | | 144,046 | | | | 697,664 | |
Under the terms of the Expense Limitation Agreement, the Advisor is entitled to recover, subject to approval by the Funds’ Board, such amounts waived or reimbursed for a period of up to three years from the year in which the Advisor reduced its compensation or assumed expenses for the Funds. No recoupment will occur unless a Fund’s operating expenses are below the expense limitation amount in effect at the time of the waiver or reimbursement.
As of June 30, 2016, the Advisor may seek recoupment of previously waived fees and reimbursed expenses as follows:
| | | Expiration | | | Expiration | | | Expiration | | | | |
| | | June 30, | | | June 30, | | | June 30, | | | | |
| Fund | | 2017 | | | 2018 | | | 2019 | | | Total | |
| Credit Opportunities Fund | | $ | — | | | $ | — | | | $ | 128,969 | | | $ | 128,969 | |
| International Small Cap Fund | | | 277,489 | | | | 146,155 | | | | 101,759 | | | | 525,403 | |
| Large Cap Fund | | | — | | | | 130,776 | | | | 487,776 | | | | 618,552 | |
| Small Cap Value Opportunities Fund | | | 129,267 | | | | 145,044 | | | | 174,274 | | | | 448,585 | |
| Value Fund | | | 712,405 | | | | 729,485 | | | | 659,183 | | | | 2,101,073 | |
The Advisor did not recoup any amounts it previously waived or reimbursed during the year ended June 30, 2016.
ADMINISTRATION AGREEMENT
The Advisor entered into an Administration Agreement with the Trust, whereby the Advisor is responsible for supplying executive and regulatory compliance services; supervising the preparation of tax returns; coordinating the preparation of reports to shareholders and reports to, and filings with, the Securities and Exchange Commission
Notes to Financial Statements (Continued)
(the “SEC”) and state securities authorities, as well as materials for meetings of the Board; calculating the daily NAV per share; and maintaining the financial books and records of each Fund.
For its services the Advisor’s annual administrative fee is:
0.145% on the first $20 billion of the aggregate average daily net assets;
0.11% on the next $10 billion of aggregate average daily net assets;
0.09% on the next $10 billion of aggregate average daily net assets; and
0.07% on the aggregate average daily net assets over $40 billion.
The fee is computed and allocated among the Touchstone Fund Complex (excluding Touchstone Institutional Funds Trust) on the basis of relative daily net assets.
The Advisor has engaged BNY Mellon as the Sub-Administrator to the Trust. BNY Mellon provides administrative and accounting services to the Trust and is compensated directly by the Advisor, not the Trust.
TRANSFER AGENT AGREEMENT
Under the terms of the Transfer Agent Agreement between the Trust and BNY Mellon, BNY Mellon maintains the records of each shareholder’s account, answers shareholders’ inquiries concerning their accounts, processes purchases and redemptions of each Fund’s shares, acts as dividend and distribution disbursing agent and performs other shareholder service functions. For these services, BNY Mellon receives a monthly fee from each Fund. In addition, each Fund pays out-of-pocket expenses incurred by BNY Mellon, including, but not limited to, postage and supplies.
The Funds may reimburse the Advisor for fees paid to intermediaries such as banks, broker-dealers, financial advisors or other financial institutions for sub-transfer agency, sub-administration and other services provided to investors whose shares of record are held in omnibus, other group accounts, retirement plans or accounts traded through registered securities clearing agents. These fees may vary based on, for example, the nature of services provided, but generally range up to 0.15% of the assets of the class serviced or maintained by the intermediary or up to $22 per sub-account maintained by the intermediary.
PLANS OF DISTRIBUTION AND SHAREHOLDER SERVICING FEE ARRANGEMENTS
The Trust has adopted distribution plans pursuant to Rule 12b-1 under the 1940 Act for each class of shares it offers that is subject to 12b-1 distribution fees. The plans allow each Fund to pay distribution and other fees for the sale and distribution of its shares and for services provided to shareholders. The fees charged to the Funds are limited to the actual expenses incurred. Under the Class A plan, each Fund offering Class A shares pays an annual fee of up to 0.25% of average daily net assets that are attributable to Class A shares. Under the Class C plan, each Fund offering Class C shares pays an annual fee of up to 1.00% of average daily net assets that are attributable to Class C shares (of which up to 0.75% is a distribution fee and up to 0.25% is a shareholder servicing fee).
UNDERWRITING AGREEMENT
The Underwriter is the Funds’ principal underwriter and, as such, acts as exclusive agent for distribution of the Funds’ shares. Under the terms of the Underwriting Agreement between the Trust and the Underwriter, the Underwriter earned underwriting and broker commissions on the sale of Class A shares of the Funds. W&S Brokerage Services, Inc., an affiliate of the Underwriter and the Advisor, also earned broker commissions on the sale of Class A shares of the Funds. Listed below are the total underwriting and broker commissions earned by the Underwriter and its affiliate during the year ended June 30, 2016:
Notes to Financial Statements (Continued)
| Fund | | Amount | |
| International Small Cap Fund | | $ | 8,882 | |
| Large Cap Fund | | | 4,601 | |
| Small Cap Value Opportunities Fund | | | 2,931 | |
| Value Fund | | | 3,779 | |
In addition, the Underwriter collected CDSC on the redemption of Class C shares of the Funds listed below during the year ended June 30, 2016:
| Fund | | Amount | |
| International Small Cap Fund | | $ | 344 | |
| Value Fund | | | 10 | |
INTERFUND TRANSACTIONS
During the year ended June 30, 2016, the Credit Opportunities Fund engaged in purchase transactions with funds that have a common investment advisor (or affiliated investment advisors), common Trustees and/or common Officers. These purchase transactions complied with Rule 17a-7 under the 1940 Act and amounted to $1,377,074.
5. Federal Tax Information
Federal income tax — It is each Fund’s policy to continue to comply with the special provisions of the Internal Revenue Code applicable to regulated investment companies. As provided therein, in any fiscal year in which a Fund so qualifies and distributes at least 90% of its investment company taxable income, the Fund (but not the shareholders) will be relieved of federal income tax on the income distributed. It is each Fund’s policy to distribute all of its taxable income and accordingly, no provision for income taxes has been made.
In order to avoid imposition of the excise tax applicable to regulated investment companies, it is also each Fund’s intention to declare and pay as dividends in each calendar year at least 98% of its investment company taxable income (earned during the calendar year) and 98.2% of its net realized capital gains (earned during the twelve months ending October 31) plus undistributed amounts from prior years.
The tax character of distributions paid for the years ended June 30, 2016 and June 30, 2015 is as follows:
| | | Credit | | | | | | | | | | | | | |
| | | Opportunities | | | | | | | | | | | | | |
| | | Fund | | | International Small Cap Fund | | | Large Cap Fund | |
| | | Period Ended | | | Year Ended | | | Year Ended | | | Year Ended | | | Period Ended | |
| | | June 30, | | | June 30, | | | June 30, | | | June 30, | | | June 30, | |
| | | 2016 | | | 2016 | | | 2015 | | | 2016 | | | 2015 | |
| From ordinary income | | $ | 1,442,278 | | | $ | 2,342,530 | | | $ | 1,081,879 | | | $ | 2,178,416 | | | $ | 93,694 | |
| From long-term capital gains | | | 15,974 | | | | — | | | | — | | | | — | | | | — | |
| Total Distributions | | $ | 1,458,252 | | | $ | 2,342,530 | | | $ | 1,081,879 | | | $ | 2,178,416 | | | $ | 93,694 | |
| | | Small Cap Value Opportunities Fund | | | Value Fund | |
| | | Year Ended | | | Year Ended | | | Year Ended | | | Year Ended | |
| | | June 30, | | | June 30, | | | June 30, | | | June 30, | |
| | | 2016 | | | 2015 | | | 2016 | | | 2015 | |
| From ordinary income | | $ | 3,754,343 | | | $ | 12,526,378 | | | $ | 7,542,099 | | | $ | 7,924,841 | |
| From long-term capital gains | | | 7,495,931 | | | | 12,044,455 | | | | 26,706,058 | | | | 5,835,108 | |
| Total Distributions | | $ | 11,250,274 | | | $ | 24,570,833 | | | $ | 34,248,157 | | | $ | 13,759,949 | |
Notes to Financial Statements (Continued)
The following information is computed on a tax basis for each item as of June 30, 2016:
| | | Credit | | | International | | | Large | |
| | | Opportunities | | | Small Cap | | | Cap | |
| | | Fund | | | Fund | | | Fund | |
| Tax cost of portfolio investments | | $ | 52,217,677 | | | $ | 393,066,192 | | | $ | 306,573,740 | |
| Gross unrealized appreciation | | | 1,033,705 | | | | 42,543,653 | | | | 21,940,059 | |
| Gross unrealized depreciation | | | (601,735 | ) | | | (24,502,654 | ) | | | (13,709,136 | ) |
| Net unrealized appreciation on investments | | | 431,970 | | | | 18,040,999 | | | | 8,230,923 | |
| Net unrealized appreciation (depreciation) on foreign currency transactions, securities sold short and unfunded loan commitments | | | 13,090 | | | | (39,761 | ) | | | — | |
| Accumulated capital and other losses | | | — | | | | (22,086,956 | ) | | | (11,031,963 | ) |
| Qualified late-year losses deferred | | | — | | | | — | | | | (3,754,723 | ) |
| Undistributed ordinary income | | | 100,261 | | | | 4,440,201 | | | | 1,635,063 | |
| Accumulated earnings (deficit) | | $ | 545,321 | | | $ | 354,483 | | | $ | (4,920,700 | ) |
| | | Small Cap | | | | |
| | | Value | | | | |
| | | Opportunities | | | Value | |
| | | Fund | | | Fund | |
| Tax cost of portfolio investments | | $ | 155,393,905 | | | $ | 279,810,334 | |
| Gross unrealized appreciation | | | 15,513,465 | | | | 81,137,442 | |
| Gross unrealized depreciation | | | (20,891,070 | ) | | | (9,820,023 | ) |
| Net unrealized appreciation (depreciation) on investments | | | (5,377,605 | ) | | | 71,317,419 | |
| Accumulated capital and other losses | | | — | | | | (10,076,879 | ) |
| Qualified late-year losses | | | (6,163,514 | ) | | | — | |
| Undistributed ordinary income | | | 193,628 | | | | 201,182 | |
| Accumulated earnings (deficit) | | $ | (11,347,491 | ) | | $ | 61,441,722 | |
The difference between the tax cost of portfolio investments and the financial statement cost is primarily due to wash sale loss deferrals, defaulted interest and passive foreign investment company (“PFIC”) adjustments.
As of June 30, 2016, the Funds had the following capital loss carryforwards for federal income tax purposes:
| | | | | | | | | No | | | No | | | | |
| | | Short Term Expiring in* | | | Expiration | | | Expiration | | | | |
| | | 2017 | | | 2018 | | | Short Term* | | | Long Term* | | | Total | |
| International Small Cap Fund | | $ | 1,667,378 | | | $ | — | | | $ | 20,419,578 | | | $ | — | | | $ | 22,086,956 | |
| Large Cap Fund | | | — | | | | — | | | | 10,374,045 | | | | 657,918 | | | | 11,031,963 | |
| Value Fund | | | 10,076,879 | | | | — | | | | — | | | | — | | | | 10,076,879 | |
*The Regulated Investment Company Modernization Act of 2010 (the “Act”) was enacted on December 22, 2010. The Act made changes to several tax rules impacting the Funds. The provisions of the Act first became effective for the Funds’ fiscal year ended June 30, 2012 and are applicable to all subsequent fiscal years. Although the Act provides several benefits, including the unlimited carryover of future capital losses, there may be a greater likelihood that all or a portion of each Fund’s pre-enactment capital loss carryovers may expire without being utilized due to the fact that post-enactment capital losses must be utilized before pre-enactment capital loss carryovers may be utilized. Under the Act, new capital losses may now be carried forward indefinitely, and retain the character of the original loss as compared with pre-enactment law, where capital losses could be carried forward for up to eight years, and carried forward as short-term capital losses, irrespective of the character of the original loss.
The capital loss carryforwards may be utilized in future years to offset net realized capital gains, if any, prior to distributing such gains to shareholders.
The Large Cap Fund had capital losses of $1,035,863 that expired in the current year.
Notes to Financial Statements (Continued)
During the year ended June 30, 2016, the following Fund utilized capital loss carryforwards:
| Fund | | Amount | |
| Value Fund | | $ | 3,619,033 | |
Under current laws, certain capital losses realized after October 31 and ordinary losses realized after December 31 may be deferred (and certain ordinary losses after October and/or December 31 may be deferred) and treated as occurring on the first day of the following fiscal year. For the year ended June 30, 2016, the Funds elected to defer the following losses:
| | | Realized | | | Ordinary | | | | |
| Fund | | Capital Losses | | | Losses | | | Total | |
| Large Cap Fund | | $ | 3,754,723 | | | $ | — | | | $ | 3,754,723 | |
| Small Cap Value Opportunities Fund | | | 6,163,514 | | | | — | | | | 6,163,514 | |
The Funds have analyzed their tax positions taken on federal income tax returns for all open tax years (tax years ended June 30, 2013 through 2016) and have concluded that no provision for income tax is required in their financial statements.
Certain reclassifications, the result of permanent differences between financial statement and income tax reporting requirements, have been made to the components of capital. These reclassifications have no impact on the net assets or NAV per share of the Funds. The following reclassifications, which are primarily attributed to the tax treatment of foreign currency gains/losses, gains/losses from PFICs, expiration of prior year capital loss carryforwards, adjustments on sale of defaulted securities, non-deductible expenses and re-designation of dividends paid have been made to the following Funds for the year ended June 30, 2016:
| | | | | | Accumulated | | | Accumulated | |
| | | Paid-In | | | Net Investment | | | Net Realized | |
| Fund | | Capital | | | Income(Loss) | | | Gains(Losses) | |
| Credit Opportunities Fund | | $ | (4,042 | ) | | $ | (109,230 | ) | | $ | 113,272 | |
| International Small Cap Fund | | | — | | | | 178,046 | | | | (178,046 | ) |
| Large Cap Fund | | | (1,035,863 | ) | | | — | | | | 1,035,863 | |
| Value Fund | | | — | | | | (95 | ) | | | 95 | |
6. Commitments and Contingencies
The Funds indemnify the Trust’s officers and Trustees for certain liabilities that might arise from their performance of their duties to the Funds. Additionally, in the normal course of business, the Funds enter into contracts that contain a variety of representations and warranties and which provide general indemnifications. The Funds’ maximum exposure under these arrangements is unknown, as this would involve future claims that may be made against the Funds.
7. Principal Risks
Risks Associated with Foreign Investments — Some of the Funds may invest in the securities of foreign issuers. Investing in securities issued by companies whose principal business activities are outside the U.S. may involve significant risks not present in domestic investments. For example, there is generally less publicly available information about foreign companies, particularly those not subject to the disclosure and reporting requirements of the U.S. securities laws. Foreign issuers are generally not bound by uniform accounting, auditing, and financial reporting requirements and standards of practice comparable to those applicable to domestic issuers. Investments in foreign securities also involve the risk of possible adverse changes in investment or exchange control regulations, expropriation or confiscatory taxation, limitations on the removal of funds or other assets of a Fund, political or financial instability or diplomatic and other developments which could affect such investments. Foreign stock markets, while growing in volume and sophistication, are generally not as developed as those in the U.S.,
Notes to Financial Statements (Continued)
and securities of some foreign issuers (particularly those located in developing countries) may be less liquid and more volatile than securities of comparable U.S. companies. In general, there is less overall governmental supervision and regulation of foreign securities markets, broker-dealers, and issuers than in the U.S.
Risks Associated with Concentration — Certain Funds may invest a high percentage of their assets in specific sectors of the market in order to achieve a potentially greater investment return. As a result, these Funds may be more susceptible to economic, political, and regulatory developments in a particular sector of the market, positive or negative, and may experience increased volatility on the Funds’ NAVs and magnified effect on the total return.
Risks Associated with Credit — An issuer may be unable to make timely payments of either principal or interest. This may cause the issuer’s securities to decline in value. Credit risk is particularly relevant to those Funds that invest a significant amount of their assets in junk bonds or lower-rated securities.
Risks Associated with Interest Rate Changes — As interest rates rise, the value of fixed-income securities a Fund owns will likely decrease. The price of debt securities is generally linked to the prevailing market interest rates. In general, when interest rates rise, the price of debt securities falls, and when interest rates fall, the price of debt securities rises. The price volatility of a debt security also depends on its maturity. Longer-term securities are generally more volatile, so the longer the average maturity or duration of these securities, the greater their price risk. Duration is a measure of the expected life, taking into account any prepayment or call features of the security, that is used to determine the price sensitivity of the security for a given change in interest rates. Specifically, duration is the change in the value of a fixed-income security that will result from a 1% change in interest rates, and generally is stated in years. For example, as a general rule a 1% rise in interest rates means a 1% fall in value for every year of duration. Maturity, on the other hand, is the date on which a fixed-income security becomes due for payment of principal. The negative impact on fixed income securities if interest rates increase as a result could negatively impact a Fund’s NAV.
Risks Associated with Liquidity — Liquidity risk exists when particular investments are difficult to purchase or sell. This can reduce a Fund’s returns because a Fund may be unable to transact at advantageous times or prices, or at all.
Please see the Funds’ prospectus for a complete discussion of these and other risks.
8. Fund Mergers
At a meeting held on February 12, 2015, the Board approved an Agreement and Plan of Reorganization providing for the transfer of all assets and liabilities of the Touchstone Capital Growth Fund to the Touchstone Large Cap Fund, each a series of the Trust. The merger took place on June 26, 2015.
| | | | | | After | |
| | | Before Reorganization | | | Reorganization | |
| | | Touchstone | | | Touchstone | | | Touchstone | |
| | | Capital Growth | | | Large Cap | | | Large Cap | |
| | | Fund | | | Fund | | | Fund | |
| Class A | | | | | | | | | | | | |
| Shares | | | 134,841 | (A) | | | 54,608 | | | | 189,449 | |
| Net Assets | | $ | 1,466,300 | | | $ | 593,819 | | | $ | 2,060,119 | |
| Net Asset Value | | $ | 10.87 | (A) | | $ | 10.87 | | | $ | 10.87 | |
Notes to Financial Statements (Continued)
| | | | | | After | |
| | | Before Reorganization | | | Reorganization | |
| | | Touchstone | | | Touchstone | | | Touchstone | |
| | | Capital Growth | | | Large Cap | | | Large Cap | |
| | | Fund | | | Fund | | | Fund | |
| Class C | | | | | | | | | | | | |
| Shares | | | 33,258 | (B) | | | 90,840 | | | | 124,098 | |
| Net Assets | | $ | 359,796 | | | $ | 982,747 | | | $ | 1,342,543 | |
| Net Asset Value | | $ | 10.82 | (B) | | $ | 10.82 | | | $ | 10.82 | |
| Class Y | | | | | | | | | | | | |
| Shares | | | 16,959,045 | (C) | | | 1,194,116 | | | | 18,153,161 | |
| Net Assets | | $ | 184,754,062 | | | $ | 13,008,812 | | | $ | 197,762,874 | |
| Net Asset Value | | $ | 10.89 | (C) | | $ | 10.89 | | | $ | 10.89 | |
| Institutional Class | | | | | | | | | | | | |
| Shares | | | 62,587 | (D) | | | 9,195,581 | | | | 9,258,168 | |
| Net Assets | | $ | 682,334 | | | $ | 100,252,439 | | | $ | 100,934,773 | |
| Net Asset Value | | $ | 10.90 | (D) | | $ | 10.90 | | | $ | 10.90 | |
| Fund Total | | | | | | | | | | | | |
| Shares Outstanding | | | 11,078,886 | | | | 10,535,145 | | | | 27,724,876 | |
| Net Assets | | $ | 187,262,492 | | | $ | 114,837,817 | | | $ | 302,100,309 | |
| Unrealized Appreciation (Depreciation) | | $ | 3,659,835 | | | $ | 2,863,230 | | | $ | 6,523,065 | |
(A)Reflects a 1.5003:1 reverse stock split which occurred on the date of reorganization, June 26, 2015.
(B)Reflects a 1.4434:1 reverse stock split which occurred on the date of reorganization, June 26, 2015.
(C)Reflects a 1.5522:1 reverse stock split which occurred on the date of reorganization, June 26, 2015.
(D)Reflects a 1.5693:1 reverse stock split which occurred on the date of reorganization, June 26, 2015.
Assuming this reorganization had been completed on July 9, 2014, the Large Cap Fund’s results of operations for the year ended June 30, 2015 would have been as follows:
| Net investment income | | $ | 1,208,935 | |
| Net realized and unrealized gain on investments | | $ | 13,797,528 | |
| Net increase in net assets from operations | | $ | 15,006,463 | |
Because the combined investment portfolios have been managed as a single portfolio since the reorganization was completed, it is not practical to separate the amounts of revenue and earnings to the Large Cap Fund that have been included in its statements of operations since the reorganization.
9. Subsequent Events
Subsequent events occurring after the date of this report have been evaluated for potential impact to this report through the date financial statements were issued. There were no subsequent events that necessitated recognition or disclosure in the Funds’ financial statement.
Report of Independent Registered Public Accounting Firm
The Board of Trustees and Shareholders of Touchstone Strategic Trust
We have audited the accompanying statements of assets and liabilities, including the portfolios of investments, of Touchstone Credit Opportunities Fund, Touchstone International Small Cap Fund, Touchstone Large Cap Fund, Touchstone Small Cap Value Opportunities Fund and Touchstone Value Fund (the “Funds”) (five of the funds constituting Touchstone Strategic Trust) as of June 30, 2016, and the related statements of operations and statements of changes in net assets for each of the years or periods indicated therein, and the financial highlights for each of the years or periods ended June 30, 2013 through June 30, 2016.These financial statements and financial highlights are the responsibility of the Funds’ management. Our responsibility is to express an opinion on these financial statements and financial highlights based on our audits. The financial highlights for each of the periods presented through June 30, 2012 were audited by other auditors, whose report dated August 20, 2012, expressed an unqualified opinion on those financial highlights.
We conducted our audits in accordance with the standards of the Public Company Accounting Oversight Board (United States). Those standards require that we plan and perform the audit to obtain reasonable assurance about whether the financial statements and financial highlights are free of material misstatement. We were not engaged to perform an audit of the Funds’ internal control over financial reporting. Our audits included consideration of internal control over financial reporting as a basis for designing audit procedures that are appropriate in the circumstances, but not for the purpose of expressing an opinion on the effectiveness of the Funds’ internal control over financial reporting. Accordingly, we express no such opinion. An audit also includes examining, on a test basis, evidence supporting the amounts and disclosures in the financial statements and financial highlights, assessing the accounting principles used and significant estimates made by management, and evaluating the overall financial statement presentation. Our procedures included confirmation of securities owned as of June 30, 2016, by correspondence with the custodian and others or by other appropriate auditing procedures where replies from others were not received. We believe that our audits provide a reasonable basis for our opinion.
In our opinion, the financial statements and financial highlights referred to above present fairly, in all material respects, the financial position of Touchstone Credit Opportunities Fund, Touchstone International Small Cap Fund, Touchstone Large Cap Fund, Touchstone Small Cap Value Opportunities Fund and Touchstone Value Fund (five of the funds constituting Touchstone Strategic Trust) at June 30, 2016, the results of their operations and the changes in their net assets for each of the years or periods indicated therein, and the financial highlights for each of the years or periods ended June 30, 2013 through June 30, 2016, in conformity with U.S. generally accepted accounting principles.

Cincinnati, Ohio
August 19, 2016
Other Items (Unaudited)
Qualified Dividend Income
Under the Jobs and Growth Tax Relief Reconciliation Act of 2003 (the “Act”), the following percentages of ordinary dividends paid during the fiscal year ended June 30, 2016 are designated as “qualified dividend income,” as defined in the Act, and are subject to reduced tax rates in 2016. The Fund intends to pass through the maximum allowable percentage for Form 1099 Div.
| Touchstone International Small Cap Fund | | | 100.00 | % |
| Touchstone Large Cap Fund | | | 100.00 | % |
| Touchstone Small Cap Value Opportunities Fund | | | 43.03 | % |
| Touchstone Value Fund | | | 100.00 | % |
Dividend Received Deduction
For corporate shareholders, the following ordinary distributions paid during the current fiscal year ended June 30, 2016 qualify for the corporate dividends received deduction. The Funds intend to pass through the maximum allowable percentage.
| Touchstone International Small Cap Fund | | | 1.84 | % |
| Touchstone Large Cap Fund | | | 100.00 | % |
| Touchstone Small Cap Value Opportunities Fund | | | 42.75 | % |
| Touchstone Value Fund | | | 100.00 | % |
For the fiscal year ended June 30, 2016, the Credit Opportunities Fund, Small Cap Value Opportunities Fund and Value Fund designated $15,974, $7,495,931 and $26,706,058 as long-term capital gains, respectively.
Foreign Tax Income and Foreign Tax Credit
International Small Cap Fund intends to pass through a foreign tax credit to the shareholders. For the fiscal years ended June 30, 2016, the total amount of foreign source income is $7,793,664 or $0.31 per share. The total amount of foreign taxes to be paid is $547,460 or $0.02 per share. Shareholder’s allocable share of the foreign tax credit will be reported on Form 1099Div.
Proxy Voting Guidelines and Proxy Voting Records
The Sub-Advisors are responsible for exercising the voting rights associated with the securities purchased and held by the Funds. A description of the policies and procedures that the Sub-Advisors use in fulfilling this responsibility is available as an appendix to the most recent Statement of Additional Information, which can be obtained without charge by calling toll free 1.800.543.0407 or by visiting the Touchstone website at TouchstoneInvestments.com or on the Securities and Exchange Commission’s (the “Commission”) website sec.gov. Information regarding how those proxies were voted during the most recent twelve-month period ended June 30 is also available without charge by calling toll free 1.800.543.0407 or on the Commission’s website at sec.gov.
Quarterly Portfolio Disclosure
The Trust files a complete listing of portfolio holdings for each Fund as of the end of the first and third quarters of each fiscal year on Form N-Q. The complete listing (i) is available on the Commission’s website; (ii) may be reviewed and copied at the Commission’s Public Reference Room in Washington, DC; or (iii) will be made available to shareholders upon request by calling 1.800.543.0407. Information on the operation of the Public Reference Room may be obtained by calling 1.800.SEC.0330.
Schedule of Shareholder Expenses
As a shareholder of the Funds, you incur two types of costs: (1) transaction costs, including reinvested dividends or other distributions; and (2) ongoing costs, including investment advisory fees; distribution (12b-1) fees;
Other Items (Unaudited) (Continued)
and other Fund expenses. This example is intended to help you understand your ongoing costs (in dollars) of investing in the Funds and to compare these costs with the ongoing costs of investing in other mutual funds. The example is based on an investment of $1,000 invested at the beginning of the period and held for the entire period (January 1, 2016 through June 30, 2016).
Actual Expenses
The first line of the table below for each share class of a Fund provides information about actual account values and actual expenses. You may use the information in this line, together with the amount you invested, to estimate the expenses that you paid over the period. Simply divide your account value by $1,000 (for example, an $8,600 account value divided by $1,000 = 8.6), then multiply the result by the number in the first line under the heading entitled “Expenses Paid During the Six Months Ended June 30, 2016” to estimate the expenses you paid on your account during this period.
Hypothetical Example for Comparison Purposes
The second line of the table below for each share class of a Fund provides information about hypothetical account values and hypothetical expenses based on the Funds’ actual expense ratio and an assumed rate of return of 5% per year before expenses, which is not the Funds’ actual return. The hypothetical account values and expenses may not be used to estimate the actual ending account balance or expenses you paid for the period. You may use this information to compare the ongoing costs of investing in the Funds and other funds. To do so, compare this 5% hypothetical example with the 5% hypothetical examples that appear in the shareholder reports of the other funds.
Please note that the expenses shown in the table are meant to highlight your ongoing costs only and do not reflect any transactional costs, such as sales charges (loads), redemption fees, or exchange fees. Therefore, the second line of the table below is useful in comparing ongoing costs only, and will not help you determine the relative total costs of owning different funds. In addition, if these transactional costs were included, your costs would have been higher
| | | | | | | | | | | | | | Expenses | |
| | | | | Net Expense | | | Beginning | | | Ending | | | Paid During | |
| | | | | Ratio | | | Account | | | Account | | | the Six Months | |
| | | | | Annualized | | | Value | | | Value | | | Ended | |
| | | | | June 30, | | | January 1, | | | June 30, | | | June 30, | |
| | | | | 2016 | | | 2016 | | | 2016 | | | 2016* | |
| Touchstone Credit Opportunities Fund | | | | | | | | | | | | | | | | |
| Class A | | Actual | | | 1.74 | % | | $ | 1,000.00 | | | $ | 1,053.61 | | | | 8.88 | ** |
| Class A | | Hypothetical | | | 1.74 | % | | $ | 1,000.00 | | | $ | 1,016.21 | | | | 8.72 | ** |
| | | | | | | | | | | | | | | | | | | |
| Class C | | Actual | | | 2.49 | % | | $ | 1,000.00 | | | $ | 1,050.04 | | | | 12.69 | ** |
| Class C | | Hypothetical | | | 2.49 | % | | $ | 1,000.00 | | | $ | 1,012.48 | | | | 12.46 | ** |
| | | | | | | | | | | | | | | | | | | |
| Class Y | | Actual | | | 1.49 | % | | $ | 1,000.00 | | | $ | 1,053.79 | | | | 7.61 | ** |
| Class Y | | Hypothetical | | | 1.49 | % | | $ | 1,000.00 | | | $ | 1,017.45 | | | | 7.47 | ** |
| | | | | | | | | | | | | | | | | | | |
| Institutional Class | | Actual | | | 1.39 | % | | $ | 1,000.00 | | | $ | 1,055.34 | | | | 7.10 | ** |
| Institutional Class | | Hypothetical | | | 1.39 | % | | $ | 1,000.00 | | | $ | 1,017.95 | | | | 6.97 | ** |
| | | | | | | | | | | | | | | | | | | |
| Touchstone International Small Cap Fund | | | | | | | | | | | | | | | | |
| Class A | | Actual | | | 1.55 | % | | $ | 1,000.00 | | | $ | 938.60 | | | $ | 7.47 | |
| Class A | | Hypothetical | | | 1.55 | % | | $ | 1,000.00 | | | $ | 1,017.16 | | | $ | 7.77 | |
| | | | | | | | | | | | | | | | | | | |
| Class C | | Actual | | | 2.30 | % | | $ | 1,000.00 | | | $ | 934.99 | | | $ | 11.07 | |
| Class C | | Hypothetical | | | 2.30 | % | | $ | 1,000.00 | | | $ | 1,013.43 | | | $ | 11.51 | |
Other Items (Unaudited) (Continued)
Schedule of Shareholder Expenses (Continued)
| | | | | | | | | | | | | | Expenses | |
| | | | | Net Expense | | | Beginning | | | Ending | | | Paid During | |
| | | | | Ratio | | | Account | | | Account | | | the Six Months | |
| | | | | Annualized | | | Value | | | Value | | | Ended | |
| | | | | June 30, | | | January 1, | | | June 30, | | | June 30, | |
| | | | | 2016 | | | 2016 | | | 2016 | | | 2016* | |
| Touchstone International Small Cap Fund (Continued) | | | | | | | | | | | | | | | | |
| Class Y | | Actual | | | 1.30 | % | | $ | 1,000.00 | | | $ | 939.56 | | | $ | 6.27 | |
| Class Y | | Hypothetical | | | 1.30 | % | | $ | 1,000.00 | | | $ | 1,018.40 | | | $ | 6.52 | |
| | | | | | | | | | | | | | | | | | | |
| Institutional Class | | Actual | | | 1.18 | % | | $ | 1,000.00 | | | $ | 939.88 | | | $ | 5.69 | |
| Institutional Class | | Hypothetical | | | 1.18 | % | | $ | 1,000.00 | | | $ | 1,019.00 | | | $ | 5.92 | |
| | | | | | | | | | | | | | | | | | | |
| Touchstone Large Cap Fund | | | | | | | | | | | | | | | | |
| Class A | | Actual | | | 1.12 | % | | $ | 1,000.00 | | | $ | 1,020.43 | | | $ | 5.63 | |
| Class A | | Hypothetical | | | 1.12 | % | | $ | 1,000.00 | | | $ | 1,019.29 | | | $ | 5.62 | |
| | | | | | | | | | | | | | | | | | | |
| Class C | | Actual | | | 1.87 | % | | $ | 1,000.00 | | | $ | 1,016.66 | | | $ | 9.38 | |
| Class C | | Hypothetical | | | 1.87 | % | | $ | 1,000.00 | | | $ | 1,015.56 | | | $ | 9.37 | |
| | | | | | | | | | | | | | | | | | | |
| Class Y | | Actual | | | 0.87 | % | | $ | 1,000.00 | | | $ | 1,021.36 | | | $ | 4.37 | |
| Class Y | | Hypothetical | | | 0.87 | % | | $ | 1,000.00 | | | $ | 1,020.54 | | | $ | 4.37 | |
| | | | | | | | | | | | | | | | | | | |
| Institutional Class | | Actual | | | 0.77 | % | | $ | 1,000.00 | | | $ | 1,021.34 | | | $ | 3.87 | |
| Institutional Class | | Hypothetical | | | 0.77 | % | | $ | 1,000.00 | | | $ | 1,021.03 | | | $ | 3.87 | |
| | | | | | | | | | | | | | | | | | | |
| Touchstone Small Cap Value Opportunities Fund | | | | | | | | | | | | | | | | |
| Class A | | Actual | | | 1.43 | % | | $ | 1,000.00 | | | $ | 994.64 | | | $ | 7.09 | |
| Class A | | Hypothetical | | | 1.43 | % | | $ | 1,000.00 | | | $ | 1,017.75 | | | $ | 7.17 | |
| | | | | | | | | | | | | | | | | | | |
| Class C | | Actual | | | 2.18 | % | | $ | 1,000.00 | | | $ | 991.07 | | | $ | 10.79 | |
| Class C | | Hypothetical | | | 2.18 | % | | $ | 1,000.00 | | | $ | 1,014.02 | | | $ | 10.92 | |
| | | | | | | | | | | | | | | | | | | |
| Class Y | | Actual | | | 1.18 | % | | $ | 1,000.00 | | | $ | 996.21 | | | $ | 5.86 | |
| Class Y | | Hypothetical | | | 1.18 | % | | $ | 1,000.00 | | | $ | 1,019.00 | | | $ | 5.92 | |
| | | | | | | | | | | | | | | | | | | |
| Institutional Class | | Actual | | | 1.10 | % | | $ | 1,000.00 | | | $ | 996.26 | | | $ | 5.46 | |
| Institutional Class | | Hypothetical | | | 1.10 | % | | $ | 1,000.00 | | | $ | 1,019.39 | | | $ | 5.52 | |
| | | | | | | | | | | | | | | | | | | |
| Touchstone Value Fund | | | | | | | | | | | | | | | | |
| Class A | | Actual | | | 1.08 | % | | $ | 1,000.00 | | | $ | 1,028.14 | | | $ | 5.45 | |
| Class A | | Hypothetical | | | 1.08 | % | | $ | 1,000.00 | | | $ | 1,019.49 | | | $ | 5.42 | |
| | | | | | | | | | | | | | | | | | | |
| Class C | | Actual | | | 1.83 | % | | $ | 1,000.00 | | | $ | 1,024.01 | | | $ | 9.21 | |
| Class C | | Hypothetical | | | 1.83 | % | | $ | 1,000.00 | | | $ | 1,015.76 | | | $ | 9.17 | |
| | | | | | | | | | | | | | | | | | | |
| Class Y | | Actual | | | 0.83 | % | | $ | 1,000.00 | | | $ | 1,029.32 | | | $ | 4.19 | |
| Class Y | | Hypothetical | | | 0.83 | % | | $ | 1,000.00 | | | $ | 1,020.74 | | | $ | 4.17 | |
| | | | | | | | | | | | | | | | | | | |
| Institutional Class | | Actual | | | 0.68 | % | | $ | 1,000.00 | | | $ | 1,030.19 | | | $ | 3.43 | |
| Institutional Class | | Hypothetical | | | 0.68 | % | | $ | 1,000.00 | | | $ | 1,021.48 | | | $ | 3.42 | |
| * | Expenses are equal to the Fund's annualized expense ratio, multiplied by the average account value over the period, multiplied by 182/366 (to reflect the one-half year period). |
| ** | Excluding dividend and interest expenses on securities sold short, your actual cost of investment in Class A, Class C, Class Y and Institutional Class would be $8.63, $12.44, $7.35 and $6.85, respectively, and your hypothetical cost of investment in Class A, Class C, Class Y and Institutional Class would be $8.47, $12.21, $7.22, and $6.72, respectively. |
Management of the Trust (Unaudited)
Listed below is required information regarding the Trustees and principal officers of the Trust. The Trust’s Statement of Additional Information includes additional information about the Trustees and is available, without charge, upon request by calling 1.800.543.0407 or by visiting the Touchstone website at TouchstoneInvestments.com.
| Interested Trustee1: | | | | |
| | | | | | | | | Number | | |
| | | | | | | | | of Funds | | |
| | | | | | | | | Overseen | | |
| | | | | Term of | | | | in the | | |
| Name | | Position(s) | | Office And | | | | Touchstone | | Other |
| Address | | Held with | | Length of | | Principal Occupation(s) | | Fund | | Directorships |
| Age | | Trust | | Time Served | | During Past 5 Years | | Complex2 | | Held During the Past 5 Years3 |
Jill T. McGruder Touchstone Advisors, Inc. 303 Broadway Suite 1100 Cincinnati, OH 45202 Year of Birth: 1955 | | Trustee and President | | Until retirement at age 75 or until she resigns or is removed Trustee since 1999 | | President and CEO of IFS Financial Services, Inc. (a holding company). | | 39 | | Director of LaRosa’s, Inc. (a restaurant chain) from 1999 to 2011; IFS Financial Services, Inc. (a holding company) from 1999 to the present; Integrity and National Integrity Life Insurance Co. from 2005 to the present; Touchstone Securities (the Trust’s distributor) from 1999 to the present; Touchstone Advisors (the Trust’s investment advisor and administrator) from 1999 to the present; W&S Brokerage Services (a brokerage company) from 1999 to the present; W&S Financial Group Distributors (a distribution company) from 1999 to the present; Every Child Succeeds (a social services agency) from 2007 to the present; Taft Museum of Art from 2007 to the present; and YWCA of Greater Cincinnati from 2012 to the present. |
| Independent Trustees: | | | | |
Phillip R. Cox c/o Touchstone Advisors, Inc. 303 Broadway Suite 1100 Cincinnati, OH 45202 Year of Birth: 1947 | | Trustee | | Until retirement at age 75 or until he resigns or is removed Trustee since 1999 | | President and Chief Executive Officer of Cox Financial Corp. (a financial services company) from 1971 to the present. | | 39 | | Director of Cincinnati Bell (a communications company) from 1994 to the present; Bethesda Inc. (a hospital) from 2005 to the present; Timken Co. (a manufacturing company) from 2004 to 2014; TimkenSteel from 2014 to the present; Diebold, Inc. (a technology solutions company) from 2004 to the present; and Ohio Business Alliance for Higher Education and the Economy from 2005 to the present. |
William C. Gale c/o Touchstone Advisors, Inc. 303 Broadway Suite 1100 Cincinnati, OH 45202 Year of Birth: 1952 | | Trustee | | Until retirement at age 75 or until he resigns or is removed Trustee since 2013 | | Retired; formerly Senior Vice President and Chief Financial Officer (from 2003 to January 2015) of Cintas Corporation (a business services company). | | 39 | | None. |
Management of the Trust (Unaudited) (Continued)
| Independent Trustees (Continued): | | | | |
| | | | | | | | | Number | | |
| | | | | | | | | of Funds | | |
| | | | | | | | | Overseen | | |
| | | | | Term of | | | | in the | | |
| Name | | Position(s) | | Office And | | | | Touchstone | | Other |
| Address | | Held with | | Length of | | Principal Occupation(s) | | Fund | | Directorships |
| Age | | Trust | | Time Served | | During Past 5 Years | | Complex2 | | Held During the Past 5 Years3 |
Susan J. Hickenlooper
c/o Touchstone Advisors, Inc.
303 Broadway
Suite 1100
Cincinnati, OH 45202
Year of Birth: 1946 | | Trustee | | Until retirement at age 75 or until she resigns or is removed Trustee since 2009 | | Retired; formerly Financial Analyst for Impact 100 (charitable organization) from November 2012 to 2013. | | 39 | | Trustee of Diocese of Southern Ohio from 2014 to the present; and Trustee of Episcopal Retirement Homes Foundation from 1998 to 2011 (a charitable organization). |
Kevin A. Robie
c/o Touchstone Advisors, Inc.
303 Broadway
Suite 1100
Cincinnati, OH 45202
Year of Birth: 1956 | | Trustee | | Until retirement at age 75 or until he resigns or is removed Trustee since 2013 | | Vice President of Portfolio Management at Soin International LLC (a multinational holding company) from 2004 to the present. | | 39 | | Director of Buckeye EcoCare, Inc. (a lawn care company) from 2013 to the present; Trustee of Dayton Region New Market Fund, LLC (a private fund) from 2010 to the present; Trustee of the Entrepreneurs Center, Inc. (a small business incubator) from 2006 to the present; and Director of Interventional Imaging, Inc. (a medical device company) from 2004 to 2011. |
Edward J. VonderBrink
c/o Touchstone Advisors, Inc.
303 Broadway
Suite 1100
Cincinnati, OH 45202
Year of Birth: 1944 | | Trustee | | Until retirement at age 75 or until he resigns or is removed Trustee since 2013 | | Consultant, VonderBrink Consulting LLC from 2000 to the present. | | 39 | | Director of Streamline Health Solutions, Inc. (healthcare IT) from 2006 to 2015; Mercy Health from 2013 to the present; Mercy Health Foundation (healthcare nonprofit) from 2008 to the present; Al Neyer Inc. (a construction company) from 2013 to the present; and BASCO Shower Door from 2011 to the present. |
| 1 | Ms. McGruder, as a director of the Advisor and the Distributor, and an officer of affiliates of the Advisor and the Distributor, is an “interested person” of the Trust within the meaning of Section 2(a) (19) of the 1940 Act. |
| 2 | As of June 30, 2016, the Touchstone Fund Complex consisted of 18 series of the Trust, 1 series of Touchstone Institutional Funds Trust, 2 series of Touchstone Investment Trust, 11 series of Touchstone Funds Group Trust, 1 series of Touchstone Tax-Free Trust, and 6 variable annuity series of Touchstone Variable Series Trust. |
| 3 | Each Trustee is also a Trustee of Touchstone Institutional Funds Trust, Touchstone Investment Trust, Touchstone Funds Group Trust, Touchstone Tax-Free Trust, and Touchstone Variable Series Trust. |
Management of the Trust (Unaudited) (Continued)
The following is a list of the Principal Officers of the Trusts, the length of time served, and principal occupations for the past five years.
| Principal Officers: |
| | | | | Term of | | |
| Name | | Position(s) | | Office And | | |
| Address | | Held with | | Length of | | Principal Occupation(s) |
| Age | | Trust1 | | Time Served | | During the Past 5 Years |
Jill T. McGruder Touchstone Advisors, Inc. 303 Broadway Suite 1100 Cincinnati, OH 45202 Year of Birth: 1955 | | President and Trustee | | Until resignation, removal or disqualification President since 2006 | | See biography above. |
Steven M. Graziano Touchstone Advisors, Inc. 303 Broadway Suite 1100 Cincinnati, OH 45202 Year of Birth: 1954 | | Vice President | | Until resignation, removal or disqualification Vice President since 2009 | | President of Touchstone Advisors, Inc. |
Timothy D. Paulin Touchstone Advisors, Inc. 303 Broadway Suite 1100 Cincinnati, OH 45202 Year of Birth: 1963 | | Senior Vice President | | Until resignation, removal or disqualification Vice President since 2010 | | Senior Vice President of Investment Research and Product Management of Touchstone Advisors, Inc. |
Timothy S. Stearns Touchstone Advisors, Inc. 303 Broadway Suite 1100 Cincinnati, OH 45202 Year of Birth: 1963 | | Chief Compliance Officer | | Until resignation, removal or disqualification Chief Compliance Officer since 2013 | | Chief Compliance Officer of Touchstone Advisors, Inc.; Chief Compliance Officer of Envestnet Asset Management, Inc. (2009 to 2013). |
Terrie A. Wiedenheft Touchstone Advisors, Inc. 303 Broadway Suite 1100 Cincinnati, OH 45202 Year of Birth: 1962 | | Controller and Treasurer | | Until resignation, removal or disqualification Controller and Treasurer since 2006 | | Senior Vice President, Chief Financial Officer and Chief Operations Officer, of IFS Financial Services, Inc. (a holding company). |
Ellen Blanchard BNY Mellon 201 Washington St, 34th Fl. Boston, MA 02108 Year of Birth: 1973 | | Secretary | | Until resignation, removal or disqualification Secretary since 2015 | | Director and Senior Counsel of BNY Mellon Investment Servicing (US) Inc. |
| 1 | Each officer also holds the same office with Touchstone Institutional Funds Trust, Touchstone Investment Trust, Touchstone Funds Group Trust, Touchstone Tax-Free Trust and Touchstone Variable Series Trust. |
PRIVACY PROTECTION POLICY
We Respect Your Privacy
Thank you for your decision to invest with us. Touchstone and its affiliates have always placed a high value on the trust and confidence our clients place in us. We believe that confidence must be earned and validated through time. In today’s world, when technology allows the sharing of information at light speeds, trust must be reinforced by our sincere pledge to take the steps necessary to ensure that the information you share with us is treated with respect and confidentiality.
Our Pledge to Our Clients
| · | We collect only the information we need to service your account and administer our business. |
| · | We are committed to keeping your information confidential and we place strict limits and controls on the use and sharing of your information. |
| · | We make every effort to ensure the accuracy of your information. |
We Collect the Following Nonpublic Personal Information About You:
| · | Information we receive from you on or in applications or other forms, correspondence, or conversations, including, but not limited to, your name, address, phone number, social security number, assets, income and date of birth; and |
| · | Information about your transactions with us, our affiliates, or others, including, but not limited to, your account number and balance, payment history, parties to transactions, cost basis information, and other financial information. |
Categories of Information We Disclose and Parties to Whom We Disclose
We do not disclose any nonpublic personal information about our current or former clients to nonaffiliated third parties, except as required or permitted by law.
We Place Strict Limits and Controls on the Use and Sharing of Your Information
| · | We restrict access to nonpublic personal information about you to authorized employees who need the information to administer your business. |
| · | We maintain physical, electronic and procedural safeguards that comply with federal standards to protect this information. |
| · | We do not disclose any nonpublic personal information about our current or former clients to anyone, except as required or permitted by law or as described in this document. |
| · | We will not sell your personal information to anyone. |
We May Provide Information to Service Your Account
Sometimes it is necessary to provide information about you to various companies such as transfer agents, custodians, broker-dealers and marketing service firms to facilitate the servicing of your account. These organizations have a legitimate business need to see some of your personal information in order for us to provide service to you. We may disclose to these various companies the information that we collect as described above. We require that these companies, including our own subsidiaries and affiliates, strictly maintain the confidentiality of this information and abide by all applicable laws. Companies within our corporate family that may receive this information are financial service providers and insurance companies. We do not permit these associated companies to sell the information for their own purposes, and we never sell our customer information.
This policy is applicable to the following affiliated companies: Touchstone Funds Group Trust, Touchstone Investment Trust, Touchstone Strategic Trust, Touchstone Tax-Free Trust, Touchstone Variable Series Trust, Touchstone Institutional Funds Trust, Touchstone Securities, Inc.,* and W&S Brokerage Services, Inc.
* Touchstone Securities, Inc. serves as the underwriter to the Touchstone Funds.
A Member of Western & Southern Financial Group®
The Privacy Protection Policy is not part of the Annual Report.


Touchstone Investments
Distributor
Touchstone Securities, Inc.*
303 Broadway
Cincinnati, Ohio 45202-4203 800.638.8194
www.touchstoneinvestments.com
Investment Advisor
Touchstone Advisors, Inc.*
303 Broadway
Cincinnati, Ohio 45202-4203
Transfer Agent
BNY Mellon Investment Servicing (US) Inc.
4400 Computer Drive
Westborough, MA 01581
Shareholder Service
800.543.0407
* A Member of Western & Southern Financial Group
TSF-54BB-TST-AR-1606
Item 2. Code of Ethics.
| (a) | The registrant, as of the end of the period covered by this report, has adopted a code of ethics that applies to the registrant’s principal executive officer, principal financial officer, principal accounting officer or controller, or persons performing similar functions, regardless of whether these individuals are employed by the registrant or a third party. |
| (c) | There have been no amendments, during the period covered by this report, to a provision of the code of ethics that applies to the registrant’s principal executive officer, principal financial officer, principal accounting officer or controller, or persons performing similar functions, regardless of whether these individuals are employed by the registrant or a third party, and that relates to any element of the code of ethics description. |
| (d) | The registrant has not granted any waivers, including an implicit waiver, from a provision of the code of ethics that applies to the registrant’s principal executive officer, principal financial officer, principal accounting officer or controller, or persons performing similar functions, regardless of whether these individuals are employed by the registrant or a third party, that relates to one or more of the items set forth in paragraph (b) of this item’s instructions. |
Item 3. Audit Committee Financial Expert.
The registrant’s Board of Trustees has determined that the registrant has at least one audit committee financial expert serving on its audit committee. Mr. William Gale is the registrant’s audit committee financial expert and is an independent trustee within the meaning of the Investment Company Act of 1940, as amended (the “1940 Act”).
Item 4. Principal Accountant Fees and Services.
Audit Fees
| (a) | The Audit fees totaled $90,100 and $56,200 in fiscal 2016 and 2015, respectively, including fees associated with the annual audits and filings of Form N-1A and Form N-SAR. |
Audit-Related Fees
| (b) | The aggregate fees billed in each of the last two fiscal years for assurance and related services by the principal accountant that are reasonably related to the performance of the audit of the registrant's financial statements and are not reported under paragraph (a) of this Item are $1,750 for 2016 and $0 for 2015. |
Tax Fees
| (c) | The aggregate fees billed in each of the last two fiscal years for professional services rendered by the principal accountant for tax compliance, tax advice, and tax planning were $25,720 for 2016 and $20,800 for 2015. |
All Other Fees
| (d) | The aggregate fees billed in each of the last two fiscal years for products and services provided by the principal accountant, other than the services reported in paragraphs (a) through (c) of this Item are $15,676 for 2016 and $19,688 for 2015. The fees relate to the PFIC Analyzer and Global Withholding Tax Reporter subscriptions. |
| (e)(1) | Disclose the audit committee's pre-approval policies and procedures described in paragraph (c)(7) of Rule 2-01 of Regulation S-X. |
The Audit Committee’s pre-approval policies describe the types of audit, audit-related, tax and other services that have the general pre-approval of the Audit Committee. The pre-approval policies provide that annual audit service fees, tax services not specifically granted pre-approval, services exceeding pre-approved cost levels and other services that have not received general pre-approval will be subject to specific pre-approval by the Audit Committee. The pre-approval policies further provide that the Committee may grant general pre-approval to other audit services (statutory audits and services associated with SEC registration statements, periodic reports and other documents filed with the SEC or other documents issued in connection with securities offerings), audit-related services (accounting consultations related to accounting, financial reporting or disclosure matters not classified as “audit services,” assistance with understanding and implementing new accounting and financial reporting guidance from rulemaking authorities, agreed-upon or expanded audit procedures related to accounting and/or billing records required to respond to or comply with financial, accounting or regulatory reporting matters and assistance with internal control reporting requirements under Form N-SAR and Form N-CSR), tax services that have historically been provided by the auditor that the Committee believes would not impair the independence of the auditor and are consistent with the SEC’s rules on auditor independence and permissible non-audit services classified as “all other services” that are routine and recurring services.
All of the services described in paragraphs (b) through (d) of Item 4 were approved by the Audit Committee.
| (f) | The percentage of hours expended on the principal accountant's engagement to audit the registrant's financial statements for the most recent fiscal year that were attributed to work performed by persons other than the principal accountant's full-time, permanent employees was less than fifty percent. |
| (g) | The aggregate non-audit fees billed by the registrant's accountant for services rendered to the registrant, and rendered to the registrant's investment adviser (not including any sub-adviser whose role is primarily portfolio management and is subcontracted with or overseen by another investment adviser), and any entity controlling, controlled by, or under common control with the adviser that provides ongoing services to the registrant were $43,146 for 2016 and $40,488 for 2015. |
| (h) | The registrant's audit committee of the board of trustees has considered whether the provision of non-audit services that were rendered to the registrant's investment adviser (not including any sub-adviser whose role is primarily portfolio management and is subcontracted with or overseen by another investment adviser), and any entity controlling, controlled by, or under common control with the investment adviser that provides ongoing services to the registrant that were not pre-approved pursuant to paragraph (c)(7)(ii) of Rule 2-01 of Regulation S-X is compatible with maintaining the principal accountant's independence. |
Item 5. Audit Committee of Listed Registrants.
Not applicable.
Item 6. Investments.
| (a) | Schedule of Investments in securities of unaffiliated issuers as of the close of the reporting period is included as part of the report to shareholders filed under Item 1 of this form. |
Item 7. Disclosure of Proxy Voting Policies and Procedures for Closed-End Management Investment Companies.
Not applicable.
Item 8. Portfolio Managers of Closed-End Management Investment Companies.
Not applicable.
Item 9. Purchases of Equity Securities by Closed-End Management Investment Company and Affiliated Purchasers.
Not applicable.
Item 10. Submission of Matters to a Vote of Security Holders.
There have been no material changes to the procedures by which the shareholders may recommend nominees to the registrant’s board of trustees, where those changes were implemented after the registrant last provided disclosure in response to the requirements of Item 407(c)(2)(iv) of Regulation S-K (17 CFR 229.407) (as required by Item 22(b)(15) of Schedule 14A (17 CFR 240.14a-101)), or this Item.
Item 11. Controls and Procedures.
| (a) | The registrant’s principal executive and principal financial officers, or persons performing similar functions, have concluded that the registrant’s disclosure controls and procedures (as defined in Rule 30a-3(c) under the Investment Company Act of 1940, as amended (the “1940 Act”) (17 CFR 270.30a-3(c))) are effective, as of a date within 90 days of the filing date of the report that includes the disclosure required by this paragraph, based on their evaluation of these controls and procedures required by Rule 30a-3(b) under the 1940 Act (17 CFR 270.30a-3(b)) and Rules 13a-15(b) or 15d-15(b) under the Securities Exchange Act of 1934, as amended (17 CFR 240.13a-15(b) or 240.15d-15(b)). |
| (b) | There were no changes in the registrant’s internal control over financial reporting (as defined in Rule 30a-3(d) under the 1940 Act (17 CFR 270.30a-3(d)) that occurred during the registrant’s second fiscal quarter of the period covered by this report that has materially affected, or is reasonably likely to materially affect, the registrant’s internal control over financial reporting. |
Item 12. Exhibits.
| (a)(1) | Code of ethics, or any amendment thereto, that is the subject of disclosure required by Item 2 is attached hereto. |
| (a)(2) | Certifications pursuant to Rule 30a-2(a) under the 1940 Act and Section 302 of the Sarbanes-Oxley Act of 2002 are attached hereto. |
| (b) | Certifications pursuant to Rule 30a-2(b) under the 1940 Act and Section 906 of the Sarbanes-Oxley Act of 2002 are attached hereto. |
| (12.other) | Not applicable. |
SIGNATURES
Pursuant to the requirements of the Securities Exchange Act of 1934 and the Investment Company Act of 1940, the registrant has duly caused this report to be signed on its behalf by the undersigned, thereunto duly authorized.
| (Registrant) | Touchstone Strategic Trust |
| By (Signature and Title)* | /s/ Jill T. McGruder |
| | Jill T. McGruder, President |
| | (principal executive officer) |
Pursuant to the requirements of the Securities Exchange Act of 1934 and the Investment Company Act of 1940, this report has been signed below by the following persons on behalf of the registrant and in the capacities and on the dates indicated.
| By (Signature and Title)* | /s/ Jill T. McGruder |
| | Jill T. McGruder, President |
| | (principal executive officer) |
| By (Signature and Title)* | /s/ Terrie A. Wiedenheft |
| | Terrie A. Wiedenheft, Controller and Treasurer |
| | (principal financial officer) |
* Print the name and title of each signing officer under his or her signature.