UNITED STATES
SECURITIES AND EXCHANGE COMMISSION
Washington, D.C. 20549
FORM N-CSR
CERTIFIED SHAREHOLDER REPORT OF REGISTERED MANAGEMENT INVESTMENT COMPANIES
Investment Company Act file number 811-03651
| Touchstone Strategic Trust – June Funds |
| (Exact name of registrant as specified in charter) |
| 303 Broadway, Suite 1100 |
| Cincinnati, Ohio 45202-4203 |
| (Address of principal executive offices) (Zip code) |
| |
| Jill T. McGruder |
| 303 Broadway, Suite 1100 |
| Cincinnati, Ohio 45202-4203 |
| (Name and address of agent for service) |
Registrant's telephone number, including area code: 800-638-8194
Date of fiscal year end: June 30
Date of reporting period: June 30, 2015
Form N-CSR is to be used by management investment companies to file reports with the Commission not later than 10 days after the transmission to stockholders of any report that is required to be transmitted to stockholders under Rule 30e-1 under the Investment Company Act of 1940 (17 CFR 270.30e-1). The Commission may use the information provided on Form N-CSR in its regulatory, disclosure review, inspection, and policymaking roles.
A registrant is required to disclose the information specified by Form N-CSR, and the Commission will make this information public. A registrant is not required to respond to the collection of information contained in Form N-CSR unless the Form displays a currently valid Office of Management and Budget ("OMB") control number. Please direct comments concerning the accuracy of the information collection burden estimate and any suggestions for reducing the burden to Secretary, Securities and Exchange Commission, 100 F Street, NE, Washington, DC 20549. The OMB has reviewed this collection of information under the clearance requirements of 44 U.S.C. § 3507.
Item 1. Reports to Stockholders.
The Report to Shareholders is attached herewith.
June 30, 2015
Annual Report
Touchstone Strategic Trust
Touchstone International Small Cap Fund
Touchstone Large Cap Fund
Touchstone Small Cap Value Opportunities Fund
Touchstone Value Fund

Table of Contents
This report identifies the Funds’ investments on June 30, 2015. These holdings are subject to change. Not all investments in each Fund performed the same, nor is there any guarantee that these investments will perform as well in the future. Market forecasts provided in this report may not occur.
Letter from the President
Dear Shareholder:
We are pleased to provide you with the Touchstone Strategic Trust Annual Report. Inside you will find key financial information, as well as manager commentaries, for the 12 months ended June 30, 2015.
During the fiscal year, the global markets struggled to maintain an upward trend as investors were unsettled by the decline in oil prices, economic slowing in China and the uncertainty surrounding Greece’s status in the European Union. Oil prices declined sharply during the second half of 2014 with both supply and demand factors playing a part in the decline. Given that China is the second largest economy in the world and has been a significant global growth driver, signs of slower economic growth had investors worried about the broader implications of this slowdown on other major economies. Lastly, the first half of 2015 was punctuated by the debt negotiations between Greece and its creditors which created additional uncertainty for the markets.
U.S. equity markets moved higher during the 12-month period. The U.S. market environment generally favored larger capitalization stocks and companies with stronger growth characteristics. Economic weakness abroad and a rapidly appreciating U.S. dollar led to negative returns for developed international and emerging market equities.
Shorter term interest rates rose as the market began to assume a greater likelihood that the U.S. Federal Reserve Board would make its first foray to raising interest rates during the second half of 2015. Bond returns, as measured by the Barclays U.S. Aggregate Index, were flat as coupon income offset a slight price decline from higher interest rates. High yield bonds outperformed other sectors due to their relatively higher coupon income.
We believe that focusing on the long-term composition of your investment portfolio is essential to balancing risk and return. We recommend that you work with your financial professional on a regular basis to assess and adjust your asset allocation and diversification strategy as needed to help keep your financial goals on track.
We greatly appreciate your continued support. Thank you for including Touchstone as part of your investment plan.
Sincerely,

Jill T. McGruder
President
Touchstone Strategic Trust
Management’s Discussion of Fund Performance (Unaudited)
Touchstone International Small Cap Fund
Sub-Advised by Copper Rock Capital Partners LLC
Investment Philosophy
The Touchstone International Small Cap Fund seeks capital appreciation by primarily investing in equity securities of non-U.S. small-cap companies diversified across sectors and industries. The Fund’s investment process seeks to add value through bottom-up stock selection and in-depth fundamental research and searches for companies believed to have strong management, superior earnings growth prospects and attractive relative valuations.
Fund Performance
The Touchstone International Small Cap Fund (Class A Shares) outperformed its benchmark, the S&P Developed Ex-U.S. Small Cap Index, for the 12-month period ended June 30, 2015. The Fund’s total return was 7.29 percent (calculated excluding the maximum sales charge) while the total return of the benchmark was -1.62 percent.
Market Environment
The global markets posted slightly negative results which fluctuated throughout the 12-month period. Investors experienced turbulent markets during July and August of 2014, which was brought on by concerns about ISIS and the Russia-Ukraine conflict, higher unemployment rates in parts of Europe (specifically France, Austria and Finland) and diverging growth rates on a global basis. As fears loomed that the economic slowdown could lead to a recession in Europe, central banks maintained interest rates at historic lows with the hopes of injecting growth into the economy. China’s economy declined, and Japan’s economy, which had been expected to blossom due to its “Abenomics” reforms, contracted. As such, the third quarter of 2014 cast a negative shadow on the international small cap markets.
The final quarter of 2014 showed modest improvement but returns were sluggish. At the start of 2015, the market began to show signs of life as the heightened economic and political headlines disappeared and improvement in reported macroeconomic data confirmed a slow and steady global recovery. However, this optimistic period started to fade as investors saw corporate earnings deflate, which fueled a selloff. Though sentiment stabilized toward the middle of the quarter as more economic indicators supported already steady but still slow growth throughout the eurozone and Emerging Markets, the markets pulled back by the second quarter’s end in reaction to Greece’s debt crisis. In Asia, “Abenomics” reforms seemed to yield results, as the Japanese market moved higher during the first six months of 2015. Conversely, China’s stock market faced a more serious correction. All of these factors led to the decline in the international small cap markets for the 12-month period.
Portfolio Review
The markets appeared to reward characteristics we favor in our bottom-up, fundamental stock selection process. As a result, the Fund benefited from broad positive stock selection, which was led by strong performance from the Financials, Consumer Discretionary, Industrials, Materials and Information Technology sectors. Individual stock selection within the Health Care sector detracted from relative performance. On a regional basis, the Fund benefited from positive stock selection across all regions, with the leadership from Continental Europe.
Among the individual stocks that contributed to performance during the period were Hanssem Co. Ltd., Stroer Media SE (both from the Consumer Discretionary sector), Alps Electric Co. (Information Technology sector) China Power International Development Ltd. (Utilities sector) and Nippon Paint Holdings Co. (Materials sector). Hanssem Co., a South Korea-based manufacturer and retailer of kitchens and other interior furniture, reported strong results throughout the period. The company maintained its brand leadership in the market and continued to see high demand from the ongoing remodel trend in the Korean property market. Stroer
Management’s Discussion of Fund Performance (Unaudited) (Continued)
Media is a Germany-based provider of outdoor advertising services via traditional billboards, transportation advertising media and other “street furniture.” Stroer’s shares advanced after the company reported both organic growth and a revenue increase in its first-quarter reporting season of 2015, which were widely applauded by the market. The company also signaled strong momentum from its strategic initiatives, which should position it as an integrated digital media company. Alps Electric Co. is a Japan-based manufacturer of electronic components with a strong consumer base from the automobile industry, including General Motors Co. and Volvo AB, as well as electronics technology companies including Apple Inc. The company’s earnings profile improved due to the greater utilization of in-car electronics including backup cameras, LED technology in the dashboard and audio and navigation systems. The company was also a dominant player in the market for camera actuators in mobile handsets, as handset phones have become more sophisticated. China Power International Development is a Hong Kong-based company that engages in the development, construction and management of large-scale power plants in China. The stock moved higher throughout the second quarter of 2015 after the company reported a year-over-year net profit increase in early March. Lower fuel costs for thermal power were also a positive catalyst for the company.
Japan-based Nippon Paint Holdings is a manufacturer and distributor of paint and coatings for both industrial and non-industrial applications. The company’s stock rose during the period on improved pricing power due to a consolidation of industrial paint suppliers and profitable success in the company’s Chinese joint venture. The company also benefited from the sharply lower yen, which helped drive revenues from the Japanese shipbuilding and automotive customers who are largely export driven.
Among the individual stocks that detracted from Fund performance were Kanamoto Co. Ltd. (Industrials sector), BW LPG Ltd. and Pason Systems Inc. (both from the Energy sector). Kanamoto Co. is a Japan-based company that sells and leases construction equipment. The company’s stock posted strong profit growth from increasing construction equipment rental trends amid the early stages of post-earthquake reconstruction in Tohoku as well as a robust pipeline of non-residential construction in the greater Tokyo area. Projects for the 2020 Tokyo Olympics were also expected to sustain future demand for rental equipment. However, as the reconstruction-and Olympic-related revenues took longer than expected to materialize, the stock began to underperform and was sold. BW LPG is a Nordic-based international shipping company primarily involved in the transport of liquefied petroleum gas. During the final quarter of 2014, the company reported weak third-quarter results as strong pricing did not materialize due to a higher proportion of legacy contracts relative to new ones. In addition, investors became increasingly concerned about an oversupply issue developing in the industry and the associated impact on freight rates. Pason Systems is a U.S.-based company that provides instrumentation systems to land-based and offshore rigs. The company’s stock declined in an environment of declining oil prices, cuts in capital expenditures and a decline in the number of rigs in service. The team exited the position as it sought to remove exposure to the oil services segment.
Outlook
Both Japan and Europe remain in the early phases of economic demand growth. Japan has stimulated its capital markets through currency and quantitative easing to lower rates, and has also created new models for corporate returns that are intended to improve returns on capital. Europe has continued to struggle with euro participation standards and with the enforcement of those standards. While Greece and its attempts to repay debts and stay with the European Union have continued to dominate the headlines, we instead are focused on the improving underlying economic trends within the largest European economies. For example, Italy’s and Spain’s 10-year government bond yields are significantly lower than one year ago, which signals stronger economies and less fear of eurozone contagion. Wage growth in Germany and France also remained steady while employment in Spain improved. In addition, a weaker euro has provided a boost to those companies that sell goods outside of Europe, which encourages reinvestment into their businesses for future growth. Perhaps most encouraging have been the real improvements in labor regulation and hiring policies being enacted throughout Europe.
Management’s Discussion of Fund Performance (Unaudited) (Continued)
European business owners are finally empowered to be more flexible in their employment practices and to adjust their businesses to their economic realities. Meanwhile, the United Kingdom has enjoyed the benefits of a strong mandate produced by the most recent election, and its public policy is beginning to support housing and employment through new regulations. All that being said, we remain guardedly optimistic about Europe’s prospects for growth going forward. Within the emerging markets, gross domestic product (GDP) growth has slowed significantly as foreign investors have adjusted to higher costs of capital. Lower gasoline prices have helped stimulate the U.S. economy and those emerging markets that are heavy importers of oil, such as India, Turkey, China and Indonesia. Additionally, actions from central banks remain the center of attention for capital markets with the focus on stimulating consumer activity. Within the U.S., rising employment, a strong U.S. dollar and continued improvement in the U.S. current account balance indicate that the world’s largest consumer economy should continue to support imports.
We believe the Fund is positioned to benefit from the varying stages of growth around the globe, and our strategy remains committed to seeking to identify attractive investment opportunities based on our individual bottom-up investment approach.
Management’s Discussion of Fund Performance (Unaudited) (Continued)
Comparison of the Change in Value of a $10,000 Investment in the
Touchstone International Small Cap Fund - Class A* and the
S&P Developed Ex-U.S. Small Cap Index
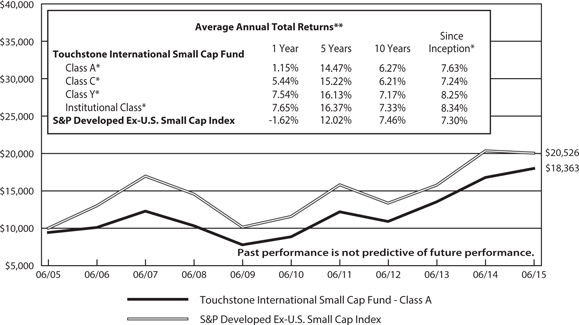
| * | The chart above represents performance of Class A shares only, which will vary from the performance of Class C shares, Class Y shares and Institutional Class shares based on the differences in sales loads and fees paid by shareholders in the different classes. The inception date of Class A shares, Class C shares, Class Y shares and Institutional Class shares was July 31, 2003, April 12, 2012, December 31, 1996 and December 20, 2006, respectively. Class A shares, Class C shares and Institutional Class shares performance was calculated using the historical performance of Class Y shares for the periods prior to July 31, 2003, April 12, 2012 and December 20, 2006, respectively. The returns have been restated for sales loads and for fees applicable to Class A, Class C and Institutional Class shares. The returns of the index listed above are based on the inception date of the Fund. |
| ** | The average annual total returns shown above are adjusted for maximum sales loads and fees, if applicable. The maximum offering price per share of Class A shares is equal to the net asset value (“NAV”) per share plus a sales load equal to 6.10% of the NAV (or 5.75% of the offering price). Class C shares are subject to a contingent deferred sales charge (“CDSC”) of 1.00%. The CDSC will be assessed on an amount equal to the lesser of (1) the NAV at the time of purchase of the shares being redeemed or (2) the NAV of such shares being redeemed if redeemed within a one-year period from date of purchase. Class Y shares and Institutional Class shares are not subject to sales charges. |
The performance of the above Fund does not reflect the deduction of taxes that a shareholder would pay on Fund distributions or the redemption of Fund shares.
Note to Chart
S&P Developed Ex-U.S. Small Cap Index is an unmanaged index of small-cap stocks from developed countries, excluding the United States.
Management’s Discussion of Fund Performance (Unaudited)
Touchstone Large Cap Fund
Sub-Advised by The London Company
Investment Philosophy
The Touchstone Large Cap Fund seeks long-term capital growth by investing primarily in common stocks of large-cap U.S. listed companies. The Fund utilizes a bottom-up security selection process that screens potential investments seeking companies with superior returns on capital plus attractive earnings to enterprise value ratios and free cash flow yields. Its goal is to purchase financially stable companies that consistently generate high returns on unleveraged operating capital, are run by shareholder-oriented managements and are trading at a discount to their respective intrinsic market values.
Fund Performance
The Touchstone Large Cap Fund (Class A Shares) underperformed its benchmark, the Russell 1000® Index, since the Fund’s inception on July 9, 2014 through June 30, 2015. The Fund’s total return was 6.57 percent (excluding the maximum sales charge) while the total return of the benchmark was 6.85 percent.
Market Environment
During the period, the stock market was volatile, equity correlations fell and fundamentals once again dictated performance. The factors that drove returns were mixed over the full 12-month period. Factors driving market performance could be divided into two distinct 6-month periods. During the second half of 2014, growth outperformed value, large-cap stocks outpaced small-cap stocks, low beta1 outperformed high beta and high-quality stocks bettered low-quality stocks. During the first half of 2015, growth outpaced value yet again but, conversely, small-cap stocks outpaced large-cap stocks, high beta outperformed low beta and low-quality stocks outpaced high-quality stocks.
A resurgence in mergers and acquisitions (M&A) activity specifically benefited the Health Care and Information Technology sectors during the period. During the latter part of the period in particular, the environment was favorable for financial engineering and consolidation. Both financial buyers and strategic investors took advantage of low interest rates, as evidenced by the significant number of targeted domestic deals that were announced during the first half of 2015.
During the period, the large-cap stock market was led higher by the Health Care, Consumer Discretionary and Information Technology sectors while the Energy, Utilities and Materials sectors detracted from performance. The largest impact to performance was the significant decline in the Energy sector, which had both direct and indirect effects across a number of industries.
Portfolio Review
The Fund’s top contributing sectors were Industrials, Consumer Discretionary and Consumer Staples. The top detracting sectors were Information Technology, Health Care and Energy.
Among the individual stocks that contributed to performance during the period were Bristol-Myers Squibb Co., Eli Lilly and Co. (both from the Health Care sector), Lowe’s Companies Inc., CarMax Inc. (both from the Consumer Discretionary sector) and Visa Inc. (Information Technology sector). Bristol-Myers Squibb, a global biopharmaceutical company, rallied primarily due to improvements in the company’s drug pipeline. The company’s excellent track record of new drug discovery, along with significant cash flow generation and a strong balance sheet, further benefited performance. Global pharmaceutical company Eli Lilly was a strong performer as a result of promising news from its drug pipeline. We believe the company has a strong balance sheet and is well positioned with new products to help fight cancer, diabetes and Alzheimer’s disease. Lowe’s Companies, an operator of retail home improvement and appliance stores, rallied during the fourth quarter
Management’s Discussion of Fund Performance (Unaudited) (Continued)
of 2014 after the company reported an increase in same-store sales across its vast store network. This fourth quarter 2014 event drove performance for the entire 12-month period. Furthermore, management has been successful in its capital allocation efforts and keeping share repurchases a priority. The company also benefited from an improving housing market during the period. CarMax, a used-car retailer, rallied late in the fourth quarter of 2014 after the company reported its same-store sales exceeded expectations. CarMax also benefited from strong traffic gains at its stores. Similar to Lowe’s, the fourth quarter 2014 price move resulted in CarMax being a top contributor for the entire 12-month period. Going forward, we believe CarMax is well positioned for future store growth. Visa, a digital payments company, moved sharply higher during the fourth quarter of 2014 after the company posted stronger-than-expected results and announced an attractive share repurchase plan. The company also announced its first price increase in four years, which further benefited the stock not only during the fourth quarter of 2014 but for the entire 12-month period.
Among the individual stocks that detracted from Fund performance were Albemarle Corp. (Materials sector), Corning Inc. (Information Technology sector) and Apache Corp., ConocoPhillips and Chevron Corp. (all from the Energy sector). Albemarle, a specialty chemical company, traded lower following an announcement in 2014 that it would acquire Rockwood Holdings. The company also lowered its revenue and earnings guidance soon thereafter. These events led Albemarle to be the leading detractor in the Fund for the full 12-month period. Corning is a manufacturer of glass, ceramics and related materials for industrial and scientific applications. The most significant event that impacted Corning’s stock during the 12-month period was its decline that occurred during the second quarter of 2015. This stock decline was due to pricing concerns in its glass display business and a slightly weaker-than-expected earnings release. Apache Corp. (an oil and gas exploration and production company), ConocoPhillips (an integrated energy company) and Chevron (a multinational energy corporation) all moved lower due to the significant decline in the price of oil, particularly during the second half of 2014. Oil prices remained low throughout the remainder of the 12-month period following the precipitous 2014 decline. While we did not add to the Fund’s Energy holdings, we remained attracted to these stocks based on the strength of each company’s balance sheet and leadership within the sector.
During the period, the Fund reduced its position in NewMarket Corp. (Materials sector) and sold positions in Wal-Mart Stores Inc., Brown-Forman Corp. (both from the Consumer Staples sector), White Mountains Insurance Group Ltd. (Financials sector) and Albemarle (Materials sector). The Fund initiated positions in Alleghany Corp. (Financials sector) and Bed Bath & Beyond Inc. (Consumer Discretionary sector). The Fund invested these proceeds from the sales into Scripps Network Interactive Inc. (Consumer Discretionary sector) and Deere & Co. (Industrials sector). Scripps Network Interactive is a developer of lifestyle content for television and the Internet. The company reported high margins and returns on capital, and aggressively returned capital to shareholders. Deere & Co. is a manufacturer of agricultural, construction and forestry machinery. The company’s strong brand name, high-quality products and loyal customer base has created significant pricing power and a low level of substitution versus competitors in the industry. Bed Bath & Beyond is a retailer of domestic merchandise and home furnishings. The company generated attractive returns on capital from its store format, which has been driven by its effective use of in-store coupons versus promotions, and savings on distribution expense via its limited use of distribution centers. The company recently issued debt for the first time to repurchase shares, and management also recently changed its incentive plans.
Outlook
While we do not attempt to forecast the future, we remain optimistic based on key metrics that we believe should drive shareholder returns over time. Looking ahead, we assume there will be obstacles to overcome to keep the current bull market moving. For example, geopolitical turmoil abroad – in particular, in Greece and China – could obstruct the domestic economy. In Greece, uncertainty abounds as the country’s prime minister called for a referendum on whether to accept the terms demanded by its international creditors, which could set the stage for Greece’s exit from the eurozone. Uncertainty surrounding China’s GDP growth prospects
Management’s Discussion of Fund Performance (Unaudited) (Continued)
was a source of great macroeconomic risk as investors assessed the country’s ability to maintain manufacturing growth while avoiding a hard landing. China’s equity markets experienced extreme volatility, as witnessed by the significant drop in its composite index at the end of the quarter. In the U.S., investors are waiting to see when the Federal Reserve Board will increase interest rates and if the expected tightening will impact their appetite for equity assets.
While we recognize valuations are not cheap and the U.S. equity markets have been strong since March 2009, we continue to seek to identify high-conviction investment ideas. We believe Corporate America is in good condition with high operating margins and strong balance sheets. Consumer confidence is relatively high and employment continues to improve. Interest rates may begin to rise, but interest rates and inflation are still quite low.
Our strategy is to focus on stocks from a bottom-up standpoint. We seek to own companies with strong returns on capital and the flexibility to enhance shareholder value using the balance sheet. Low interest rates and relatively high equity risk premiums enable companies to increase shareholder value by adjusting the capital structure of the company. Separately, with elevated cash levels on corporate balance sheets and dividend payout ratios near historic lows, we expect investors to reward companies that wisely deploy capital including higher dividends, share repurchases and M&A transactions.
Going forward, we expect the slow growth environment to continue and believe stocks could be more volatile in the future. As such, we believe the Fund is positioned well for a slow growth environment that rewards strong capital allocation.
1Beta is a measure of the volatility of a portfolio relative to its benchmark.
Management’s Discussion of Fund Performance (Unaudited) (Continued)
Comparison of the Change in Value of a $10,000 Investment in the Touchstone Large Cap
Fund - Class A* and the Russell 1000® Index
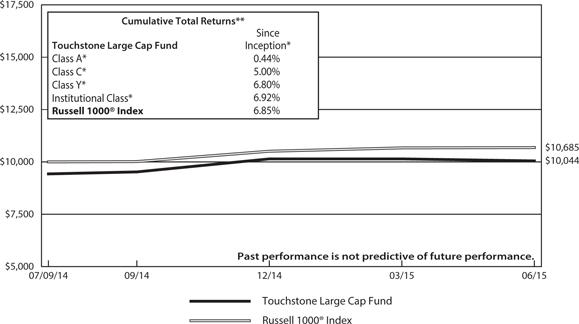
| * | The chart above represents performance of Class A shares only, which will vary from the performance of Class C shares, Class Y shares and Institutional Class shares based on the differences in sales loads and fees paid by shareholders in the different classes. The inception date of the Fund was July 9, 2014. The returns of the index listed above are based on the inception date of the Fund. |
| ** | Not Annualized. The cumulative total returns shown above are adjusted for maximum sales loads, if applicable. The maximum offering price per share of Class A shares is equal to the net asset value (“NAV”) per share plus a sales load equal to 6.10% of the NAV (or 5.75% of the offering price). Class C shares are subject to a contingent deferred sales charge (“CDSC”) of 1.00%. The CDSC will be assessed on an amount equal to the lesser of (1) the NAV at the time of purchase of the shares being redeemed or (2) the NAV of such shares being redeemed if redeemed within a one-year period from date of purchase. Class Y shares and Institutional Class shares are not subject to sales charges. |
The performance of the above Fund does not reflect the deduction of taxes that a shareholder would pay on Fund distributions or the redemption of Fund shares.
Note to Chart
Russell 1000® Index measures the performance of the 1,000 largest companies in the Russell 3000® Index.
The Frank Russell Company (FRC) is the source and owner of the data contained or reflected in this material and all trademarks and copyrights related thereto. The material may contain confidential information and unauthorized use, disclosure, copying, dissemination or redistribution is strictly prohibited. This is a Touchstone Investments presentation of the data, and FRC is not responsible for the formatting or configuration of this material or for any inaccuracy in the presentation thereof.
Management’s Discussion of Fund Performance (Unaudited)
Touchstone Small Cap Value Opportunities Fund
Sub-Advised by Thompson, Siegel & Walmsley LLC
Investment Philosophy
The Fund seeks long-term capital growth by primarily investing in equity securities of small-cap companies that are believed to present value that is not reflected by prevailing market prices or that have experienced fundamental changes and are intrinsically undervalued by the investment community. Using a combination of quantitative and qualitative methods, a company’s attractiveness is assessed in an effort to understand why the market may be mispricing the stocks, what factors are changing that can return the stock to fair value and whether those changes are sustainable over a medium-term investment horizon based on both absolute and sector-relative valuation of cash flows, the relative earnings prospects of the company and the stock’s recent price action.
Fund Performance
The Touchstone Small Cap Value Opportunities Fund (Class A Shares) outperformed its benchmark, the Russell 2000® ValueIndex, for the 12-month period ended June 30, 2015. The Fund’s total return was 2.68 percent (calculated excluding the maximum sales charge) while the total return of the benchmark was 0.78 percent.
Market Environment
U.S. equity markets were driven by a fragile economic recovery, coupled with investors’ concerns about the U.S. Federal Reserve Board’s debate about the appropriate timing for a potential interest rate hike. Global issues further exacerbated concerns as the conflict between Greece and its European creditors escalated.
Performance among market sectors varied widely during the period. Health Care and Consumer Staples sectors posted strong positive returns, while Energy stocks shed more than half their value. The anticipation of rising interest rates weighed on yield-sensitive stocks, especially in the latter part of the period, and dividend-paying stocks (such as some Utilities) generally underperformed their non-dividend-paying counterparts. Growth indexes generally outperformed their value counterparts, and mergers and acquisitions (M&A) activity was prevalent in the growth-oriented sectors of Health Care and Information Technology. Furthermore, peak valuation multiples and profit margins were abundant, and the market displayed encouraging signs that investors were differentiating between stocks based on fundamentals rather than macro developments, which presented a favorable environment for stock picking.
Portfolio Review
Stock selection within the Consumer Discretionary sector contributed to performance. The Fund’s emphasis on company-specific catalysts was rewarded, as positions from multiple industry groups posted double-digit returns for the period. The Energy sector also contributed positively to the Fund’s relative returns. Though Energy stocks were significant market laggards during the fiscal year, the Fund’s underweight exposure to crude oil producers, as well as positive stock selection among refiners and services companies, helped insulate the Fund from the full effect of the energy market decline. Furthermore, the Fund benefited from M&A activity within the Financials, Information Technology and Industrials sectors.
The Financials sector was the primary detractor from the Fund’s relative return. The Fund’s underweight exposure and security selection among real estate investment trusts (REITs) hindered relative performance, as REITs were among the best performing industry groups during the period.
Among the individual stocks that contributed to performance during the period were BofI Holding Inc. (Financials sector), Cynosure Inc. and Molina Healthcare Inc. (both from the Health Care sector). BofI Holding is a branchless, technology-driven, financial services provider. The company benefited from consumers’ shift in banking preferences
Management’s Discussion of Fund Performance (Unaudited) (Continued)
away from brick and mortar branches. Cynosure’s, a laser-based aesthetic treatments provider, experienced a stock price increase after the company received clearance from the U.S. Food and Drug Administration to market a non-invasive fat-reduction device. Molina Healthcare, a managed care provider, experienced a number of positive events during the period, including better-than-expected earnings results, improvements in profitability and the acquisition of additional Medicaid-related assets.
Among the stocks that detracted from performance during the period were Altisource Portfolio Solutions SA (Financial Services sector), GT Advanced Technologies Inc. and Energy XXI Ltd. (both from the Energy sector). Altisource Portfolio Solutions, a mortgage services provider, was hindered by increased industry-wide regulatory scrutiny as well as a disappointing settlement between the company’s largest client, Ocwen Financial Corp., and the New York Department of Financial Services. GT Advanced Technologies, a diversified solar-technology company, filed for bankruptcy protection after a sudden breakdown in its relationship with Apple Inc. Energy XXI, an oil exploration and production company, declined in sympathy with falling crude oil prices during 2014. The Fund’s positions in all three of the companies mentioned were eliminated.
Outlook
As the U.S. economy continues to strengthen, we believe smaller-capitalization companies – which tend to be more cyclical – should benefit from a pickup in both consumer and corporate spending. While the market has displayed periods of increased volatility, economic statistics remain encouraging. Investors are also differentiating between fundamentals and macro developments, which presents a favorable environment for our bottom-up investment approach.
Management’s Discussion of Fund Performance (Unaudited) (Continued)
Comparison of the Change in Value of a $10,000 Investment in the Touchstone
Small Cap Value Opportunities Fund - Class A* and the Russell 2000® Value Index
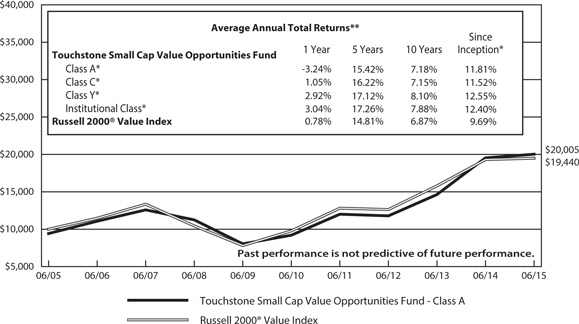
| * | The chart above represents performance of Class A shares only, which will vary from the performance of Class C shares, Class Y shares and Institutional Class shares based on the differences in sales loads and fees paid by shareholders in the different classes. The inception date of Class A shares, Class C shares, Class Y shares and Institutional Class shares was July 31, 2003, April 12, 2012, July 25, 2003 and December 9, 2008, respectively. Performance information presented prior to July 25, 2003 for Class Y shares includes performance of a predecessor fund whose inception date was July 31, 2000. Class A shares, Class C shares and Institutional Class shares performance was calculated using the historical performance of Class Y shares for periods prior to July 31, 2003, April 12, 2012 and December 9, 2008, respectively. The returns have been restated for sales loads and for fees applicable to Class A, Class C and Institutional Class shares. The returns of the index listed above are based on the inception date of the Fund. |
| ** | The average annual total returns shown above are adjusted for maximum sales loads and fees, if applicable. The maximum offering price per share of Class A shares is equal to the net asset value (“NAV”) per share plus a sales load equal to 6.10% of the NAV (or 5.75% of the offering price). Class C shares are subject to a contingent deferred sales charge (“CDSC”) of 1.00%. The CDSC will be assessed on an amount equal to the lesser of (1) the NAV at the time of purchase of the shares being redeemed or (2) the NAV of such shares being redeemed if redeemed within a one-year period from date of purchase. Class Y shares and Institutional Class shares are not subject to sales charges. |
The performance of the above Fund does not reflect the deduction of taxes that a shareholder would pay on Fund distributions or the redemption of Fund shares.
Note to Chart
Russell 2000® Value Index measures the performance of those Russell 2000 companies with lower price-to-book ratios and lower forecasted growth values.
The Frank Russell Company (FRC) is the source and owner of the data contained or reflected in this material and all trademarks and copyrights related thereto. The material may contain confidential information and unauthorized use, disclosure, copying, dissemination or redistribution is strictly prohibited. This is a Touchstone Investments presentation of the data, and FRC is not responsible for the formatting or configuration of this material or for any inaccuracy in the presentation thereof.
Management’s Discussion of Fund Performance (Unaudited)
Touchstone Value Fund
Sub-Advised by Barrow, Hanley, Mewhinney & Strauss, LLC
Investment Philosophy
The Touchstone Value Fund seeks long-term growth by primarily investing in equity securities of large- and mid-cap companies believed to be undervalued. The Fund uses traditional methods of stock selection – research and analysis – to identify companies that have price-to-earnings and price-to-book ratios below the market, that also have above-average dividend yields, and that focus on companies that are out of favor due to internal or external challenges judged to be short-term in nature. Stock selection is driven by fundamental analysis on individual companies rather than by broad market themes.
Fund Performance
The Touchstone Value Fund (Class A Shares) outperformed its benchmark, the Russell 1000® Value Index, for the 12-month period ended June 30, 2015. The Fund’s total return was 5.26 percent (calculated excluding the maximum sales charge) while the total return of the benchmark was 4.13 percent.
Market Environment
During the past year, global markets could be described as a tale of two halves. The last half of 2014 was characterized by a strong upward move in the U.S. dollar, a precipitous drop in oil prices and a strong preference for U.S. stocks and bonds. During the first half of 2015, the strength of the U.S. dollar moderated, the price of oil rebounded modestly, U.S. interest rates increased and investor preference shifted away from the U.S. and toward international markets. Energy earnings were depressed during the period due to dramatically lower oil prices, and earnings growth slowed meaningfully. Additionally, many U.S.-based multi-national companies continued to feel the negative effects of a stronger U.S. dollar. A moderation in U.S. stock and bond returns later in the period reflected a renewed thirst for risk abroad, as central banks around the globe eased monetary conditions while the U.S. Federal Reserve Board (Fed) guided market expectations for higher interest rates.
Portfolio Review
During the 12-month period, the Fund’s outperformance was driven by stock selection, particularly in the Consumer Discretionary, Industrials and Materials sectors. Positioning within the Health Care, Financials and Consumer Staples sectors detracted from the Fund’s relative performance versus the benchmark. In addition, the Fund’s overweight to the Health Care sector and underweight to the Energy sector was also accretive to returns.
Among the individual stocks that contributed to performance during the period were Target Corp. (Consumer Discretionary), Medtronic PLC and Anthem Inc. (both from the Health Care sector). One of the Fund’s largest positions, discount retailer Target benefited from a number of positive events, driving strong performance in the period. During the latter part of 2014, company management resorted to heavy discounts and promotions to draw customers back to its stores following the highly publicized December 2013 credit card data breach. This tactic proved effective, and Target’s same-store sales and profits ticked higher in the U.S., with a strong 2014 holiday season. In January 2015, the company’s new CEO announced that Target would exit its expansion into Canada. The rationale for the move was based on analysis that indicated that the Canadian venture might not turn profitable until 2021. In the interim, the Canadian operations could further drain company cash flow and divert management’s focus from its mission to revitalize U.S. store performance. The first quarter of 2015 provided additional tailwinds, mainly from global macroeconomic developments that favored Target’s positioning as a U.S.-centric retailer. First, the extraordinary drop in retail gasoline prices that began in October 2014 put more discretionary income into consumers’ wallets. This trend was widely expected to help companies such as Target that are levered to consumer spending. Second, the decline in global interest rates, coupled with the
Management’s Discussion of Fund Performance (Unaudited) (Continued)
U.S. dollar’s strength, led to significant global fund flows — especially into those U.S. companies with a high percentage of U.S. earnings, low foreign exposure and compelling cash dividend yields. With an attractive dividend yield and all of its earnings now sourced in the U.S., we believe Target remained an attractive holding during the period. Medtronic develops therapeutic and diagnostic medical devices, particularly for diabetes, cardiac, neurological and skeletal conditions. The company’s shares moved higher during the period as a result of its broad pipeline of new products, a new CEO with a strong track record, and advantages over its competitors in product bundling and service offerings amid a new regime of consolidation and cost reduction by hospital systems. Although concerns surrounding the company’s cardiac rhythm management (CRM) and spine markets weighed on the stock early in the period, the CRM market stabilized and Medtronic’s other business lines performed well. Additionally, we believe Medtronic’s acquisition of Covidien PLC provides greater access to overseas free-cash-flow and may allow for a greater return of capital to shareholders. We also believe that the two companies fit well together, creating a combined company that is a more diverse and durable franchise with less exposure to concerns over the slower-growing CRM and spine markets. Anthem shares climbed as the company continued to make positive operational moves to leverage its competitive advantages as one of the largest managed care providers in the U.S. The company’s significant customer base represents a scale advantage that can be leveraged on the Affordable Care Act exchanges. Anthem also produced steady profit growth through its disciplined cost management and pricing, which further benefited the stock. Although we believe the company has solid growth prospects moving forward, the stock’s strong performance has increased its valuations, which prompted us to trim the Fund’s position.
Among the individual stocks that detracted from performance were American Express Co. (Financials sector), BP PLC and Occidental Petroleum Corp. (both from the Energy sector). Financials holding company American Express sold off during the period after the announcement that its branded partnership with Costco Wholesale Corp. will end. Looking ahead, we believe American Express is positioned to overcome the Costco loss with expense reductions and continue to grow its remaining loan book. With management reiterating its view that American Express expects earnings to grow through 2017, we remain confident in the company’s prospects. BP was impacted by negative sentiment around its ownership stake in Russian producer Rosneft Oil Company, as low oil prices and the troubled Russian currency cast doubts on Rosneft’s ability to pay a dividend. BP was further impacted by the ongoing litigation surrounding the 2010 Macondo oil spill. However, in January 2015, a favorable ruling by a U.S. federal judge revealed BP will have a lower total liability stemming from the Clean Water Act penalty phase of the trial than was previously expected. While the overhang from Russia and the Macondo trial weighed on valuations, we believe the dividend yield is secure and the resolution of either the sanctions or oil spill litigation could drive the share price higher. Occidental Petroleum, an oil and gas exploration and production company, declined following the 2014 crash in oil prices. The stock was also negatively impacted by investors’ disappointment over the company’s valuation, the timing of a spin-off of its California assets and its inability to sell down an interest in its Middle East assets. These transactions were expected to result in a share repurchase program that could have reduced the number of outstanding shares. Looking ahead, we believe the stock will ultimately benefit from its solid balance sheet and preferred position in the Permian Basin.
Outlook
Economic conditions in the U.S. were stable to improving. Meanwhile, the rest of the world seems to be following the U.S. model of using monetary easing to push interest rates to low levels, reflate the stock markets and hope that the underlying economies will eventually improve. We believe that if foreign central banks are successful, we should see a moderation or decline in the dollar. However, if events in Greece, China or elsewhere spark fear among investors, we may see a renewed demand for U.S. dollar assets.
We expect cash flows to remain robust for many companies, making capital allocation extremely important. In our opinion, dividends still have significant room to grow. We expect share repurchases to remain popular but, after a lengthy bull market, many company managements will likely be buying their shares at elevated
Management’s Discussion of Fund Performance (Unaudited) (Continued)
valuations. The mergers and acquisitions market has boomed, as both friendly and hostile deals have received warm receptions from the stock and bond markets alike. However, we believe that may be changing as we enter the latter, more risky phase of the market cycle.
Going forward, higher interest rates may slow the bond market, but we believe the effect on domestic stock markets should be more benign. We believe that if interest rates rise, the Fund is well positioned to benefit. After six years of above average gains, we expect to enter a period of more modest returns in which fundamentals matter. As such, we believe the Fund’s active, concentrated portfolio that trades at a valuation discount to the market and has an earnings growth and dividend yield premium, should provide the opportunity to add meaningful outperformance.
Dividend-paying investments may not experience the same price appreciation as non-dividend paying instruments, dividend-issuing companies may choose not to pay a dividend, or the dividend may be less than what is anticipated.
Management’s Discussion of Fund Performance (Unaudited) (Continued)
Comparison of the Change in Value of a $10,000 Investment in the
Touchstone Value Fund - Class A* and the Russell 1000® Value Index
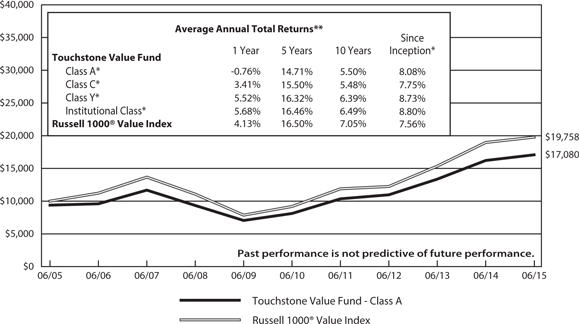
| * | The chart above represents performance of Class A shares only, which will vary from the performance of Class C shares, Class Y shares and Institutional Class shares based on the differences in sales loads and fees paid by shareholders in the different classes. The inception date of Class A shares, Class C shares, Class Y shares and Institutional Class shares was July 31, 2003, April 12, 2012, September 10, 1998 and December 20, 2006, respectively. Class A shares, Class C shares and Institutional Class shares performance was calculated using the historical performance of Class Y shares for the periods prior to July 31, 2003, April 12, 2012 and December 20, 2006, respectively. The returns have been restated for sales loads and for fees applicable to Class A, Class C and Institutional Class shares. The returns of the index listed above are based on the inception date of the Fund. |
| ** | The average annual total returns shown above are adjusted for maximum sales loads and fees, if applicable. The maximum offering price per share of Class A shares is equal to the net asset value (“NAV”) per share plus a sales load equal to 6.10% of the NAV (or 5.75% of the offering price). Class C shares are subject to a contingent deferred sales charge (“CDSC”) of 1.00%. The CDSC will be assessed on an amount equal to the lesser of (1) the NAV at the time of purchase of the shares being redeemed or (2) the NAV of such shares being redeemed if redeemed within a one-year period from date of purchase. Class Y shares and Institutional Class shares are not subject to sales charges. |
The performance of the above Fund does not reflect the deduction of taxes that a shareholder would pay on Fund distributions or the redemption of Fund shares.
Note to Chart
Russell 1000® Value Index measures those Russell 1000 companies with lower price-to-book ratios and lower expected growth values.
The Frank Russell Company (FRC) is the source and owner of the data contained or reflected in this material and all trademarks and copyrights related thereto. The material may contain confidential information and unauthorized use, disclosure, copying, dissemination or redistribution is strictly prohibited. This is a Touchstone Investments presentation of the data, and FRC is not responsible for the formatting or configuration of this material or for any inaccuracy in the presentation thereof.
Tabular Presentation of Portfolios of Investments (Unaudited)
June 30, 2015
The tables below provide each Fund’s geographic allocation and sector allocation. We hope it will be useful to shareholders as it summarizes key information about each Fund’s investments.
| Touchstone International Small Cap Fund | | | |
| Geographic Allocation | | (% of Net Assets) | |
| Common Stocks | | | | |
| Japan | | | 20.9 | % |
| United Kingdom | | | 14.3 | |
| Germany | | | 6.5 | |
| Ireland | | | 6.0 | |
| Italy | | | 5.5 | |
| Canada | | | 5.1 | |
| Australia | | | 4.5 | |
| France | | | 4.3 | |
| Sweden | | | 4.0 | |
| South Korea | | | 2.8 | |
| Hong Kong | | | 2.4 | |
| New Zealand | | | 1.9 | |
| Switzerland | | | 1.7 | |
| Norway | | | 1.7 | |
| Austria | | | 1.7 | |
| Luxembourg | | | 1.7 | |
| Spain | | | 1.6 | |
| Thailand | | | 1.6 | |
| Portugal | | | 1.2 | |
| Denmark | | | 1.1 | |
| Belgium | | | 1.0 | |
| Netherlands | | | 0.7 | |
| Isle of Man | | | 0.4 | |
| Exchange Traded Fund | | | 3.0 | |
| Investment Funds | | | 8.8 | |
| Other Assets/Liabilities (Net) | | | (4.4 | ) |
| Total | | | 100.0 | % |
| Touchstone Large Cap Fund | | | |
| Sector Allocation* | | (% of Net Assets) | |
| Consumer Discretionary | | | 18.7 | % |
| Financials | | | 18.4 | |
| Information Technology | | | 18.3 | |
| Health Care | | | 10.7 | |
| Industrials | | | 9.8 | |
| Consumer Staples | | | 8.3 | |
| Materials | | | 6.6 | |
| Energy | | | 5.6 | |
| Telecommunication Services | | | 1.8 | |
| Investment Fund | | | 1.6 | |
| Other Assets/Liabilities (Net) | | | 0.2 | |
| Total | | | 100.0 | % |
* Sector classifications are based upon the Global Industry Classification Standard (GICS®).
Tabular Presentation of Portfolios of Investments (Unaudited) (Continued)
| Touchstone Small Cap Value Opportunities | | | |
| Fund | | | |
| Sector Allocation* | | (% of Net Assets) | |
| Financials | | | 33.9 | % |
| Consumer Discretionary | | | 18.2 | |
| Industrials | | | 10.8 | |
| Information Technology | | | 8.3 | |
| Health Care | | | 8.0 | |
| Energy | | | 4.4 | |
| Materials | | | 3.9 | |
| Utilities | | | 3.4 | |
| Consumer Staples | | | 3.3 | |
| Telecommunication Services | | | 2.0 | |
| Diversified | | | 1.0 | |
| Investment Funds | | | 15.0 | |
| Other Assets/Liabilities (Net) | | | (12.2 | ) |
| Total | | | 100.0 | % |
| Touchstone Value Fund | | | |
| Sector Allocation* | | (% of Net Assets) | |
| Financials | | | 24.4 | % |
| Health Care | | | 20.4 | |
| Information Technology | | | 12.3 | |
| Consumer Discretionary | | | 10.1 | |
| Industrials | | | 10.0 | |
| Energy | | | 8.5 | |
| Consumer Staples | | | 6.1 | |
| Telecommunications Services | | | 3.9 | |
| Materials | | | 2.5 | |
| Investment Funds | | | 2.5 | |
| Utilities | | | 0.8 | |
| Other Assets/Liabilities (Net) | | | (1.5 | ) |
| Total | | | 100.0 | % |
* Sector classifications are based upon the Global Industry Classification Standard (GICS®).
Portfolio of Investments
Touchstone International Small Cap Fund – June 30, 2015
| | | | | | Market | |
| | | Shares | | | Value | |
| | | | | | | |
| Common Stocks — 92.6% | | | | | | | | |
| | | | | | | | | |
| Japan — 20.9% | | | | | | | | |
| | | | | | | | | |
| Consumer Discretionary — 3.3% | | | | | | | | |
| Calsonic Kansei Corp. | | | 272,000 | | | $ | 1,934,154 | |
| Daiichikosho Co. Ltd. | | | 51,000 | | | | 1,794,923 | |
| Haseko Corp. | | | 215,900 | | | | 2,543,107 | |
| HIS Co. Ltd. | | | 56,400 | | | | 1,920,820 | |
| | | | | | | | | |
| Consumer Staples — 3.1% | | | | | | | | |
| Ezaki Glico Co. Ltd. | | | 47,100 | | | | 2,339,119 | |
| NH Foods Ltd. | | | 103,400 | | | | 2,358,003 | |
| Pola Orbis Holdings, Inc. | | | 50,900 | | | | 2,881,608 | |
| | | | | | | | | |
| Financials — 2.9% | | | | | | | | |
| Leopalace21 Corp.* | | | 348,300 | | | | 2,134,652 | |
| Nomura Real Estate Office Fund, Inc. | | | | | | | | |
| REIT | | | 424 | | | | 1,922,373 | |
| Zenkoku Hosho Co. Ltd. | | | 88,900 | | | | 3,164,255 | |
| | | | | | | | | |
| Health Care — 0.9% | | | | | | | | |
| Medipal Holdings Corp. | | | 137,270 | | | | 2,235,799 | |
| | | | | | | | | |
| Industrials — 5.3% | | | | | | | | |
| Hoshizaki Electric Co. Ltd. | | | 35,200 | | | | 2,070,445 | |
| Minebea Co. Ltd. | | | 163,000 | | | | 2,690,863 | |
| MISUMI Group, Inc. | | | 161,100 | | | | 2,287,090 | |
| OSG Corp. | | | 80,800 | | | | 1,732,017 | |
| Sankyu, Inc. | | | 380,000 | | | | 2,075,140 | |
| Sanwa Holdings Corp. | | | 286,700 | | | | 2,411,900 | |
| | | | | | | | | |
| Information Technology — 3.9% | | | | | | | | |
| Alps Electric Co. Ltd. | | | 112,800 | | | | 3,478,696 | |
| Azbil Corp. | | | 59,600 | | | | 1,541,049 | |
| Iriso Electronics Co. Ltd.† | | | 28,600 | | | | 2,026,898 | |
| Japan Aviation Electronics Industry Ltd. | | | 96,000 | | | | 2,609,769 | |
| | | | | | | | | |
| Materials — 1.5% | | | | | | | | |
| Daicel Corp. | | | 164,900 | | | | 2,116,028 | |
| Tokyo Ohka Kogyo Co. Ltd. | | | 59,800 | | | | 1,696,425 | |
| Total Japan | | | | | | | 51,965,133 | |
| | | | | | | | | |
| United Kingdom — 14.3% | | | | | | | | |
| | | | | | | | | |
| Consumer Discretionary — 2.9% | | | | | | | | |
| Halfords Group PLC | | | 258,229 | | | | 2,141,455 | |
| Howden Joinery Group PLC | | | 416,513 | | | | 3,380,720 | |
| Lookers PLC | | | 722,255 | | | | 1,799,768 | |
| | | | | | | | | |
| Financials — 5.5% | | | | | | | | |
| Aldermore Group PLC* | | | 565,282 | | | | 2,739,189 | |
| Henderson Group PLC | | | 675,051 | | | | 2,769,546 | |
| Jupiter Fund Management PLC | | | 406,653 | | | | 2,848,989 | |
| Savills PLC | | | 196,728 | | | | 2,923,029 | |
| Virgin Money Holdings UK PLC* | | | 343,809 | | | | 2,378,164 | |
| | | | | | | | | |
| Health Care — 0.8% | | | | | | | | |
| Genus PLC | | | 91,984 | | | | 2,062,428 | |
| | | | | | | | | |
| Industrials — 2.2% | | | | | | | | |
| Galliford Try PLC | | | 121,496 | | | | 3,319,714 | |
| Northgate PLC | | | 238,578 | | | | 2,152,874 | |
| | | | | | | | | |
| Information Technology — 2.2% | | | | | | | | |
| Micro Focus International PLC | | | 135,946 | | | | 2,904,094 | |
| Playtech PLC | | | 191,395 | | | | 2,461,130 | |
| | | | | | | | | |
| Materials — 0.7% | | | | | | | | |
| Victrex PLC | | | 57,265 | | | | 1,735,712 | |
| Total United Kingdom | | | | | | | 35,616,812 | |
| | | | | | | | | |
| Germany — 6.5% | | | | | | | | |
| | | | | | | | | |
| Consumer Discretionary — 1.2% | | | | | | | | |
| Stroeer Media SE† | | | 61,316 | | | | 2,864,836 | |
| | | | | | | | | |
| Financials — 2.3% | | | | | | | | |
| Aurelius AG | | | 44,242 | | | | 1,890,983 | |
| Patrizia Immobilien AG* | | | 156,630 | | | | 3,829,284 | |
| | | | | | | | | |
| Industrials — 1.8% | | | | | | | | |
| KUKA AG† | | | 29,104 | | | | 2,424,198 | |
| Norma Group SE | | | 41,339 | | | | 2,090,237 | |
| | | | | | | | | |
| Telecommunication Services — 1.2% | | | | | | | | |
| Freenet AG | | | 91,477 | | | | 3,081,293 | |
| Total Germany | | | | | | | 16,180,831 | |
| | | | | | | | | |
| Ireland — 6.0% | | | | | | | | |
| | | | | | | | | |
| Consumer Discretionary — 1.1% | | | | | | | | |
| Cairn Homes PLC* | | | 2,204,860 | | | | 2,685,466 | |
| | | | | | | | | |
| Consumer Staples — 1.9% | | | | | | | | |
| Greencore Group PLC | | | 945,016 | | | | 4,662,419 | |
| | | | | | | | | |
| Health Care — 0.8% | | | | | | | | |
| UDG Healthcare PLC | | | 273,313 | | | | 2,101,681 | |
| | | | | | | | | |
| Industrials — 1.0% | | | | | | | | |
| Kingspan Group PLC | | | 102,643 | | | | 2,478,485 | |
| | | | | | | | | |
| Materials — 1.2% | | | | | | | | |
| Smurfit Kappa Group PLC | | | 109,835 | | | | 3,027,269 | |
| Total Ireland | | | | | | | 14,955,320 | |
| | | | | | | | | |
| Italy — 5.5% | | | | | | | | |
| | | | | | | | | |
| Financials — 2.3% | | | | | | | | |
| Anima Holding SpA, 144a | | | 390,577 | | | | 3,430,545 | |
| Banca Generali SpA | | | 62,353 | | | | 2,195,661 | |
| | | | | | | | | |
| Health Care — 2.0% | | | | | | | | |
| DiaSorin SpA | | | 46,907 | | | | 2,142,784 | |
| Recordati SpA | | | 142,091 | | | | 2,980,142 | |
| | | | | | | | | |
| Industrials — 1.2% | | | | | | | | |
| Interpump Group SpA | | | 181,464 | | | | 2,929,513 | |
| Total Italy | | | | | | | 13,678,645 | |
Touchstone International Small Cap Fund (Continued)
| | | | | | Market | |
| | | Shares | | | Value | |
| | | | | | | |
| Common Stocks — 92.6% (Continued) | | | | | | | | |
| | | | | | | | | |
| Canada — 5.1% | | | | | | | | |
| | | | | | | | | |
| Consumer Discretionary — 0.8% | | | | | | | | |
| Entertainment One Ltd. | | | 353,373 | | | $ | 1,975,568 | |
| | | | | | | | | |
| Energy — 0.9% | | | | | | | | |
| Whitecap Resources, Inc.† | | | 226,033 | | | | 2,385,200 | |
| | | | | | | | | |
| Financials — 1.4% | | | | | | | | |
| Element Financial Corp.* | | | 216,556 | | | | 3,424,324 | |
| | | | | | | | | |
| Industrials — 0.7% | | | | | | | | |
| WestJet Airlines Ltd. | | | 83,732 | | | | 1,752,406 | |
| | | | | | | | | |
| Materials — 1.3% | | | | | | | | |
| Intertape Polymer Group, Inc. | | | 210,067 | | | | 3,148,482 | |
| Total Canada | | | | | | | 12,685,980 | |
| | | | | | | | | |
| Australia — 4.5% | | | | | | | | |
| | | | | | | | | |
| Consumer Discretionary — 0.9% | | | | | | | | |
| Spotless Group Holdings Ltd. | | | 1,405,779 | | | | 2,262,894 | |
| | | | | | | | | |
| Energy — 0.9% | | | | | | | | |
| Beach Energy Ltd. | | | 2,612,165 | | | | 2,115,053 | |
| | | | | | | | | |
| Financials — 1.2% | | | | | | | | |
| Magellan Financial Group Ltd. | | | 229,550 | | | | 3,073,655 | |
| | | | | | | | | |
| Health Care — 0.7% | | | | | | | | |
| Estia Health Ltd.* | | | 359,697 | | | | 1,665,147 | |
| | | | | | | | | |
| Materials — 0.8% | | | | | | | | |
| CSR Ltd. | | | 735,874 | | | | 2,064,150 | |
| Total Australia | | | | | | | 11,180,899 | |
| | | | | | | | | |
| France — 4.3% | | | | | | | | |
| | | | | | | | | |
| Consumer Discretionary — 0.8% | | | | | | | | |
| Plastic Omnium SA | | | 73,380 | | | | 1,877,218 | |
| | | | | | | | | |
| Health Care — 1.4% | | | | | | | | |
| Ipsen SA | | | 42,849 | | | | 2,375,078 | |
| Virbac SA | | | 5,799 | | | | 1,241,285 | |
| | | | | | | | | |
| Industrials — 2.1% | | | | | | | | |
| Elis SA | | | 126,423 | | | | 2,483,414 | |
| Saft Groupe SA | | | 72,947 | | | | 2,849,229 | |
| Total France | | | | | | | 10,826,224 | |
| | | | | | | | | |
| Sweden — 4.0% | | | | | | | | |
| | | | | | | | | |
| Financials — 2.4% | | | | | | | | |
| Fastighets AB Balder, Class B* | | | 296,128 | | | | 4,565,649 | |
| Hemfosa Fastigheter AB | | | 135,450 | | | | 1,380,061 | |
| | | | | | | | | |
| Health Care — 0.7% | | | | | | | | |
| Recipharm AB | | | 100,038 | | | | 1,869,533 | |
| | | | | | | | | |
| Industrials — 0.2% | | | | | | | | |
| Haldex AB | | | 37,591 | | | | 496,378 | |
| | | | | | | | | |
| Materials — 0.7% | | | | | | | | |
| Granges AB | | | 239,141 | | | | 1,700,215 | |
| Total Sweden | | | | | | | 10,011,836 | |
| | | | | | | | | |
| South Korea — 2.8% | | | | | | | | |
| | | | | | | | | |
| Consumer Discretionary — 1.9% | | | | | | | | |
| Global & Yuasa Battery Co. Ltd. | | | 1,613 | | | | 55,312 | |
| Hanssem Co. Ltd. | | | 18,330 | | | | 4,615,339 | |
| | | | | | | | | |
| Health Care — 0.9% | | | | | | | | |
| Korea United Pharm, Inc. | | | 94,778 | | | | 2,207,898 | |
| Total South Korea | | | | | | | 6,878,549 | |
| | | | | | | | | |
| Hong Kong — 2.4% | | | | | | | | |
| | | | | | | | | |
| Financials — 1.1% | | | | | | | | |
| Dah Sing Banking Group Ltd. | | | 1,305,600 | | | | 2,853,394 | |
| | | | | | | | | |
| Utilities — 1.3% | | | | | | | | |
| China Power International | | | | | | | | |
| Development Ltd. | | | 4,215,000 | | | | 3,209,303 | |
| Total Hong Kong | | | | | | | 6,062,697 | |
| | | | | | | | | |
| New Zealand — 1.9% | | | | | | | | |
| | | | | | | | | |
| Consumer Discretionary — 0.7% | | | | | | | | |
| SKY Network Television Ltd. | | | 402,149 | | | | 1,637,160 | |
| | | | | | | | | |
| Utilities — 1.2% | | | | | | | | |
| Meridian Energy Ltd.† | | | 2,047,068 | | | | 2,996,338 | |
| Total New Zealand | | | | | | | 4,633,498 | |
| | | | | | | | | |
| Switzerland — 1.7% | | | | | | | | |
| | | | | | | | | |
| Financials — 0.8% | | | | | | | | |
| Cembra Money Bank AG | | | 34,605 | | | | 2,111,340 | |
| | | | | | | | | |
| Health Care — 0.9% | | | | | | | | |
| Tecan Group AG | | | 18,268 | | | | 2,188,570 | |
| Total Switzerland | | | | | | | 4,299,910 | |
| | | | | | | | | |
| Norway — 1.7% | | | | | | | | |
| | | | | | | | | |
| Consumer Staples — 0.9% | | | | | | | | |
| Salmar ASA | | | 143,733 | | | | 2,108,079 | |
| | | | | | | | | |
| Materials — 0.8% | | | | | | | | |
| Borregaard ASA | | | 295,547 | | | | 2,088,562 | |
| Total Norway | | | | | | | 4,196,641 | |
| | | | | | | | | |
| Austria — 1.7% | | | | | | | | |
| | | | | | | | | |
| Industrials — 0.8% | | | | | | | | |
| Oesterreichische Post AG | | | 39,884 | | | | 1,834,838 | |
Touchstone International Small Cap Fund (Continued)
| | | | | | Market | |
| | | Shares | | | Value | |
| | | | | | | |
| Common Stocks — 92.6% (Continued) | | | | | | | | |
| | | | | | | | | |
| Austria — (Continued) | | | | | | | | |
| | | | | | | | | |
| Information Technology — 0.9% | | | | | | | | |
| ams AG | | | 52,558 | | | $ | 2,298,662 | |
| Total Austria | | | | | | | 4,133,500 | |
| | | | | | | | | |
| Luxembourg — 1.7% | | | | | | | | |
| | | | | | | | | |
| Financials — 0.9% | | | | | | | | |
| Grand City Properties SA | | | 123,054 | | | | 2,136,687 | |
| | | | | | | | | |
| Industrials — 0.8% | | | | | | | | |
| Stabilus SA* | | | 46,525 | | | | 1,985,185 | |
| Total Luxembourg | | | | | | | 4,121,872 | |
| | | | | | | | | |
| Spain — 1.6% | | | | | | | | |
| | | | | | | | | |
| Health Care — 1.0% | | | | | | | | |
| Almirall SA | | | 131,348 | | | | 2,603,454 | |
| | | | | | | | | |
| Materials — 0.6% | | | | | | | | |
| Acerinox SA | | | 106,342 | | | | 1,472,002 | |
| Total Spain | | | | | | | 4,075,456 | |
| | | | | | | | | |
| Thailand — 1.6% | | | | | | | | |
| | | | | | | | | |
| Consumer Discretionary — 0.7% | | | | | | | | |
| Major Cineplex Group PCL | | | 1,692,600 | | | | 1,691,322 | |
| | | | | | | | | |
| Utilities — 0.9% | | | | | | | | |
| TTW PCL | | | 2,807,002 | | | | 937,812 | |
| TTW PCL- Foreign Shares | | | 3,760,098 | | | | 1,256,239 | |
| Total Thailand | | | | | | | 3,885,373 | |
| | | | | | | | | |
| Portugal — 1.2% | | | | | | | | |
| | | | | | | | | |
| Industrials — 1.2% | | | | | | | | |
| CTT-Correios de Portugal SA | | | 279,646 | | | | 2,886,484 | |
| | | | | | | | | |
| Denmark — 1.1% | | | | | | | | |
| | | | | | | | | |
| Consumer Staples — 1.1% | | | | | | | | |
| Royal Unibrew A/S | | | 80,770 | | | | 2,760,640 | |
| | | | | | | | | |
| Belgium — 1.0% | | | | | | | | |
| | | | | | | | | |
| Health Care — 1.0% | | | | | | | | |
| Ion Beam Applications | | | 90,194 | | | | 2,455,503 | |
| | | | | | | | | |
| Netherlands — 0.7% | | | | | | | | |
| | | | | | | | | |
| Consumer Staples — 0.7% | | | | | | | | |
| Lucas Bols Holding BV, 144a* | | | 95,702 | | | | 1,845,265 | |
| | | | | | | | | |
| Isle of Man — 0.4% | | | | | | | | |
| | | | | | | | | |
| Information Technology — 0.4% | | | | | | | | |
| Optimal Payments PLC* | | | 244,348 | | | | 898,326 | |
| Total Common Stocks | | | | | | $ | 230,235,394 | |
| | | | | | | | | |
| Exchange Traded Fund — 3.0% | | | | | | | | |
| | | | | | | | | |
| United States — 3.0% | | | | | | | | |
| iShares MSCI EAFE Small Cap Index | | | | | | | | |
| Fund | | | 143,242 | | | | 7,308,207 | |
| | | | | | | | |
| | | | Number | | | | | |
| | | | of | | | | | |
| | | | Rights | | | | | |
| | | | | | | | | |
| Rights — 0.0% | | | | | | | | |
| | | | | | | | | |
| Spain — 0.0% | | | | | | | | |
| | | | | | | | | |
| Materials — 0.0% | | | | | | | | |
| Acerinox SA | | | | | | | | |
| Expiration 07/01/15 | | | | | | | | |
| Strike Price $0.00* | | | 100,910 | | | | 44,887 | |
| | | | | | | | | |
| | | | Shares | | | | | |
| | | | | | | | | |
| Investment Funds — 8.8% | | | | | | | | |
| Dreyfus Cash Management, Institutional | | | | | | | | |
| Shares, 0.04%¥W | | | 14,182,135 | | | $ | 14,182,135 | |
| Invesco Government & Agency | | | | | | | | |
| Portfolio, Institutional Class, | | | | | | | | |
| 0.04%**¥W | | | 7,748,806 | | | | 7,748,806 | |
| Total Investment Funds | | | | | | $ | 21,930,941 | |
| | | | | | | | | |
| Total Investment Securities —104.4% | | | | | | | | |
| (Cost $225,759,970) | | | | | | $ | 259,519,429 | |
| | | | | | | | | |
| Liabilities in Excess of Other Assets — (4.4%) | | | | | | | (10,968,027 | ) |
| | | | | | | | | |
| Net Assets — 100.0% | | | | | | $ | 248,551,402 | |
| * | Non-income producing security. |
| ** | Represents collateral for securities loaned. |
| † | All or a portion of the security is on loan. The total market value of the securities on loan as of June 30, 2015 was $7,339,398. |
| W | Represents the 7-day SEC yield as of June 30, 2015. |
Portfolio Abbreviations:
PCL - Public Company Limited
PLC - Public Limited Company
REIT- Real Estate Investment Trust
Touchstone International Small Cap Fund (Continued)
144a - This is a restricted security that was sold in a transaction qualifying for the exemption under Rule 144A of the Securities Act of 1933. This security may be sold in transactions exempt from registration, normally to qualified institutional buyers. At June 30, 2015, these securities were valued at $5,275,810 or 2.1% of net assets. These securities were deemed liquid pursuant to procedures approved by the Board of Trustees.
Other Information:
The inputs or methodology used for valuing securities may not be an indication of the risk associated with investing in those securities. For more information on valuation inputs, and their aggregation into the levels used in the table below, please refer to the security valuation section in the accompanying Notes to Financial Statements.
Valuation inputs at Reporting Date:
| | | Level 1 | | | Level 2 | | | Level 3 | | | Total | |
| Common Stocks | | | | | | | | | | | | | | | | |
| Japan | | $ | — | | | $ | 51,965,133 | | | $ | — | | | $ | 51,965,133 | |
| United Kingdom | | | 4,801,617 | | | | 30,815,195 | | | | — | | | | 35,616,812 | |
| Germany | | | — | | | | 16,180,831 | | | | — | | | | 16,180,831 | |
| Ireland | | | 9,449,566 | | | | 5,505,754 | | | | — | | | | 14,955,320 | |
| Italy | | | — | | | | 13,678,645 | | | | — | | | | 13,678,645 | |
| Canada | | | 10,710,412 | | | | 1,975,568 | | | | — | | | | 12,685,980 | |
| Australia | | | 1,665,147 | | | | 9,515,752 | | | | — | | | | 11,180,899 | |
| France | | | 3,724,699 | | | | 7,101,525 | | | | — | | | | 10,826,224 | |
| Sweden | | | — | | | | 10,011,836 | | | | — | | | | 10,011,836 | |
| South Korea | | | 55,312 | | | | 6,823,237 | | | | — | | | | 6,878,549 | |
| Hong Kong | | | — | | | | 6,062,697 | | | | — | | | | 6,062,697 | |
| New Zealand | | | 2,996,338 | | | | 1,637,160 | | | | — | | | | 4,633,498 | |
| Switzerland | | | — | | | | 4,299,910 | | | | — | | | | 4,299,910 | |
| Norway | | | — | | | | 4,196,641 | | | | — | | | | 4,196,641 | |
| Austria | | | 1,834,838 | | | | 2,298,662 | | | | — | | | | 4,133,500 | |
| Luxembourg | | | 2,136,687 | | | | 1,985,185 | | | | — | | | | 4,121,872 | |
| Spain | | | — | | | | 4,075,456 | | | | — | | | | 4,075,456 | |
| Thailand | | | 1,691,322 | | | | 2,194,051 | | | | — | | | | 3,885,373 | |
| Portugal | | | — | | | | 2,886,484 | | | | — | | | | 2,886,484 | |
| Denmark | | | — | | | | 2,760,640 | | | | — | | | | 2,760,640 | |
| Belgium | | | 2,455,503 | | | | — | | | | — | | | | 2,455,503 | |
| Netherlands | | | 1,845,265 | | | | — | | | | — | | | | 1,845,265 | |
| Isle of Man | | | — | | | | 898,326 | | | | — | | | | 898,326 | |
| Exchange Traded Fund | | | 7,308,207 | | | | — | | | | — | | | | 7,308,207 | |
| Investment Funds | | | 21,930,941 | | | | — | | | | — | | | | 21,930,941 | |
| Rights | | | 44,887 | | | | — | | | | — | | | | 44,887 | |
| | | | | | | | | | | | | | | $ | 259,519,429 | |
At June 30, 2015, equity securities valued at $81,466,271 were transferred from Level 1 to Level 2. Transfers from Level 1 to Level 2 are due to significant movement of a designated U.S. market index, triggering a systematic valuation model provided by an independent third party to fair value the international equity securities.
See accompanying Notes to Financial Statements.
Portfolio of Investments
Touchstone Large Cap Fund – June 30, 2015
| | | | | | Market | |
| | | Shares | | | Value | |
| | | | | | | |
| Common Stocks — 98.2% | | | | | | | | |
| | | | | | | | | |
| Consumer Discretionary — 18.7% | | | | | | | | |
| Bed Bath & Beyond, Inc.* | | | 125,604 | | | $ | 8,664,164 | |
| CarMax, Inc.* | | | 220,737 | | | | 14,614,997 | |
| Carnival Corp. (Panama) | | | 267,869 | | | | 13,230,050 | |
| Lowe’s Cos., Inc. | | | 162,072 | | | | 10,853,962 | |
| Scripps Networks Interactive, Inc. - Class A | | | 122,666 | | | | 8,018,676 | |
| | | | | | | | 55,381,849 | |
| | | | | | | | | |
| Financials — 18.4% | | | | | | | | |
| Alleghany Corp.* | | | 19,698 | | | | 9,233,634 | |
| Bank of America Corp. | | | 483,934 | | | | 8,236,557 | |
| Berkshire Hathaway, Inc. - Class B* | | | 98,824 | | | | 13,450,935 | |
| BlackRock, Inc. | | | 31,462 | | | | 10,885,223 | |
| Wells Fargo & Co. | | | 225,094 | | | | 12,659,287 | |
| | | | | | | | 54,465,636 | |
| | | | | | | | | |
| Information Technology — 18.3% | | | | | | | | |
| Cisco Systems, Inc. | | | 262,107 | | | | 7,197,458 | |
| Corning, Inc. | | | 427,872 | | | | 8,441,915 | |
| EMC Corp. | | | 304,661 | | | | 8,040,004 | |
| Intel Corp. | | | 230,971 | | | | 7,024,983 | |
| International Business Machines Corp. | | | 33,742 | | | | 5,488,474 | |
| Microsoft Corp. | | | 112,986 | | | | 4,988,332 | |
| Visa, Inc. - Class A | | | 196,247 | | | | 13,177,986 | |
| | | | | | | | 54,359,152 | |
| | | | | | | | | |
| Health Care — 10.7% | | | | | | | | |
| Bristol-Myers Squibb Co. | | | 197,879 | | | | 13,166,869 | |
| Eli Lilly & Co. | | | 150,856 | | | | 12,594,967 | |
| Pfizer, Inc. | | | 179,596 | | | | 6,021,854 | |
| | | | | | | | 31,783,690 | |
| | | | | | | | | |
| Industrials — 9.8% | | | | | | | | |
| Deere & Co. | | | 99,048 | | | | 9,612,608 | |
| FedEx Corp. | | | 35,050 | | | | 5,972,520 | |
| General Dynamics Corp. | | | 94,587 | | | | 13,402,032 | |
| | | | | | | | 28,987,160 | |
| | | | | | | | | |
| Consumer Staples — 8.3% | | | | | | | | |
| Altria Group, Inc. | | | 187,864 | | | | 9,188,428 | |
| Coca-Cola Co. (The) | | | 150,858 | | | | 5,918,159 | |
| Energizer SpinCo, Inc.* | | | 72,702 | | | | 9,563,948 | |
| | | | | | | | 24,670,535 | |
| | | | | | | | | |
| Materials — 6.6% | | | | | | | | |
| Mosaic Co. (The) | | | 155,318 | | | | 7,276,648 | |
| NewMarket Corp. | | | 27,642 | | | | 12,270,007 | |
| | | | | | | | 19,546,655 | |
| | | | | | | | | |
| Energy — 5.6% | | | | | | | | |
| Apache Corp. | | | 60,731 | | | | 3,499,928 | |
| Chevron Corp. | | | 71,176 | | | | 6,866,349 | |
| ConocoPhillips | | | 102,647 | | | | 6,303,552 | |
| | | | | | | | 16,669,829 | |
| | | | | | | | | |
| Telecommunication Services — 1.8% | | | | | | | | |
| Verizon Communications, Inc. | | | 115,699 | | | | 5,392,730 | |
| Total Common Stocks | | | | | | $ | 291,257,236 | |
| | | | | | | | | |
| Investment Fund — 1.6% | | | | | | | | |
| Dreyfus Cash Management, Institutional | | | | | | | | |
| Shares, 0.04%¥W | | | 4,684,100 | | | | 4,684,100 | |
| | | | | | | | | |
| Total Investment Securities —99.8% | | | | | | | | |
| (Cost $295,605,867) | | | | | | $ | 295,941,336 | |
| | | | | | | | | |
| Other Assets in Excess of Liabilities — 0.2% | | | | | | | 556,630 | |
| | | | | | | | | |
| Net Assets — 100.0% | | | | | | $ | 296,497,966 | |
| * | Non-income producing security. |
| W | Represents the 7-day SEC yield as of June 30, 2015. |
Other Information:
The inputs or methodology used for valuing securities may not be an indication of the risk associated with investing in those securities. For more information on valuation inputs, and their aggregation into the levels used in the table below, please refer to the security valuation section in the accompanying Notes to Financial Statements.
Valuation inputs at Reporting Date:
| Description | | Level 1 | | | Level 2 | | | Level 3 | | | Total | |
| Common Stocks | | $ | 291,257,236 | | | $ | — | | | $ | — | | | $ | 291,257,236 | |
| Investment Fund | | | 4,684,100 | | | | — | | | | — | | | | 4,684,100 | |
| | | | | | | | | | | | | | | $ | 295,941,336 | |
See accompanying Notes to Financial Statements.
Portfolio of Investments
Touchstone Small Cap Value Opportunities Fund – June 30, 2015
| | | | | | Market | |
| | | Shares | | | Value | |
| | | | | | | |
| Common Stocks — 97.2% | | | | | | | | |
| | | | | | | | | |
| Financials — 33.9% | | | | | | | | |
| American Equity Investment Life Holding Co. | | | 114,300 | | | $ | 3,083,814 | |
| Bancorp, Inc. (The)* | | | 189,100 | | | | 1,754,848 | |
| BofI Holding, Inc.* | | | 28,800 | | | | 3,044,448 | |
| Boston Private Financial Holdings, Inc. | | | 149,900 | | | | 2,010,159 | |
| Chatham Lodging Trust REIT | | | 85,900 | | | | 2,273,773 | |
| Columbia Banking System, Inc. | | | 95,000 | | | | 3,091,300 | |
| Cowen Group, Inc. - Class A* | | | 413,400 | | | | 2,645,760 | |
| Customers Bancorp, Inc.* | | | 127,020 | | | | 3,415,568 | |
| Encore Capital Group, Inc.*† | | | 68,000 | | | | 2,906,320 | |
| Endurance Specialty Holdings Ltd. (Bermuda)† | | | 48,800 | | | | 3,206,160 | |
| Equity Commonwealth REIT* | | | 57,200 | | | | 1,468,324 | |
| Federated National Holding Co. | | | 78,500 | | | | 1,899,700 | |
| First Cash Financial Services, Inc.* | | | 34,900 | | | | 1,591,091 | |
| Green Dot Corp. - Class A* | | | 123,000 | | | | 2,351,760 | |
| Greenlight Capital Re Ltd. (Cayman Island) - Class A* | | | 75,200 | | | | 2,193,584 | |
| Horace Mann Educators Corp. | | | 58,300 | | | | 2,120,954 | |
| Iberiabank Corp. | | | 40,600 | | | | 2,770,138 | |
| Infinity Property & Casualty Corp. | | | 24,400 | | | | 1,850,496 | |
| Maiden Holdings Ltd. (Bermuda) | | | 193,800 | | | | 3,058,164 | |
| Nationstar Mortgage Holdings, Inc.*† | | | 81,800 | | | | 1,374,240 | |
| New Senior Investment Group, Inc. REIT | | | 221,316 | | | | 2,958,995 | |
| Newcastle Investment Corp. REIT | | | 403,716 | | | | 1,784,425 | |
| Popular, Inc. (Puerto Rico)* | | | 77,400 | | | | 2,233,764 | |
| Radian Group, Inc.† | | | 139,300 | | | | 2,613,268 | |
| Stewart Information Services Corp. | | | 91,100 | | | | 3,625,780 | |
| Stifel Financial Corp.* | | | 51,700 | | | | 2,985,158 | |
| Texas Capital Bancshares, Inc.* | | | 47,100 | | | | 2,931,504 | |
| | | | | | | | 67,243,495 | |
| | | | | | | | | |
| Consumer Discretionary — 18.2% | | | | | | | | |
| Children’s Place Retail Stores, Inc. (The) | | | 29,000 | | | | 1,896,890 | |
| EW Scripps Co. - Class A | | | 116,100 | | | | 2,652,885 | |
| Gentherm, Inc.* | | | 49,800 | | | | 2,734,518 | |
| Houghton Mifflin Harcourt Co.* | | | 82,500 | | | | 2,079,000 | |
| Jamba, Inc.*† | | | 91,000 | | | | 1,409,590 | |
| LifeLock, Inc.* | | | 139,900 | | | | 2,294,360 | |
| M I Homes, Inc.* | | | 64,300 | | | | 1,586,281 | |
| Media General, Inc.* | | | 120,508 | | | | 1,990,792 | |
| Motorcar Parts of America, Inc.* | | | 100,700 | | | | 3,030,063 | |
| New Media Investment Group, Inc. | | | 96,387 | | | | 1,728,219 | |
| Shutterfly, Inc.* | | | 50,800 | | | | 2,428,748 | |
| Skullcandy, Inc.* | | | 294,700 | | | | 2,260,349 | |
| Smith & Wesson Holding Corp.*† | | | 129,500 | | | | 2,148,405 | |
| Steiner Leisure Ltd. (Bahamas)* | | | 27,100 | | | | 1,457,438 | |
| Steven Madden Ltd.* | | | 56,300 | | | | 2,408,514 | |
| Vera Bradley, Inc.*† | | | 137,500 | | | | 1,549,625 | |
| World Wrestling Entertainment, Inc. - Class A† | | | 145,900 | | | | 2,407,350 | |
| | | | | | | | 36,063,027 | |
| | | | | | | | | |
| Industrials — 10.8% | | | | | | | | |
| Acacia Research Corp.† | | | 119,800 | | | | 1,050,646 | |
| Aerojet Rocketdyne Holdings, Inc.* | | | 109,100 | | | | 2,248,551 | |
| Celadon Group, Inc. | | | 100,400 | | | | 2,076,272 | |
| Covanta Holding Corp. | | | 135,000 | | | | 2,860,650 | |
| DigitalGlobe, Inc.* | | | 97,800 | | | | 2,717,862 | |
| Generac Holdings, Inc.*† | | | 35,800 | | | | 1,423,050 | |
| H&E Equipment Services, Inc. | | | 85,800 | | | | 1,713,426 | |
| Mueller Water Products, Inc. - Class A | | | 268,500 | | | | 2,443,350 | |
| Steelcase, Inc. - Class A | | | 131,700 | | | | 2,490,447 | |
| Tutor Perini Corp.* | | | 109,500 | | | | 2,363,010 | |
| | | | | | | | 21,387,264 | |
| | | | | | | | | |
| Information Technology — 8.3% | | | | | | | | |
| AVG Technologies N.V. (Netherlands)* | | | 112,400 | | | | 3,058,404 | |
| Avid Technology, Inc.* | | | 155,300 | | | | 2,071,702 | |
| Chipmos Technologies Bermuda Ltd. | | | 73,002 | | | | 1,594,364 | |
| (Bermuda) | | | | | | | | |
| Epiq Systems, Inc. | | | 101,700 | | | | 1,716,696 | |
| Harmonic, Inc.* | | | 207,300 | | | | 1,415,859 | |
| InvenSense, Inc.*† | | | 89,400 | | | | 1,349,940 | |
| Methode Electronics, Inc. | | | 53,600 | | | | 1,471,320 | |
| NeuStar, Inc. - Class A*† | | | 61,300 | | | | 1,790,573 | |
| ShoreTel, Inc.* | | | 296,400 | | | | 2,009,592 | |
| | | | | | | | 16,478,450 | |
| | | | | | | | | |
| Health Care — 8.0% | | | | | | | | |
| Air Methods Corp.* | | | 45,800 | | | | 1,893,372 | |
| Anika Therapeutics, Inc.* | | | 72,600 | | | | 2,397,978 | |
| Cynosure, Inc. - Class A* | | | 77,300 | | | | 2,982,234 | |
| Kindred Healthcare, Inc. | | | 106,300 | | | | 2,156,827 | |
| Lannett Co., Inc.* | | | 17,600 | | | | 1,046,144 | |
| Molina Healthcare, Inc.* | | | 40,600 | | | | 2,854,180 | |
| Providence Service Corp. (The)* | | | 57,000 | | | | 2,523,960 | |
| | | | | | | | 15,854,695 | |
| | | | | | | | | |
| Energy — 4.4% | | | | | | | | |
| Aegean Marine Petroleum Network, Inc. | | | | | | | | |
| (Marshall Islands)† | | | 143,700 | | | | 1,776,132 | |
| Delek U.S. Holdings, Inc. | | | 40,200 | | | | 1,480,164 | |
| Helix Energy Solutions Group, Inc.* | | | 128,400 | | | | 1,621,692 | |
| Newpark Resources, Inc.* | | | 217,000 | | | | 1,764,210 | |
| PBF Energy, Inc. - Class A | | | 73,200 | | | | 2,080,344 | |
| | | | | | | | 8,722,542 | |
| | | | | | | | | |
| Materials — 3.9% | | | | | | | | |
| Ferro Corp.* | | | 169,400 | | | | 2,842,532 | |
| FutureFuel Corp. | | | 123,150 | | | | 1,584,940 | |
| PH Glatfelter Co. | | | 112,350 | | | | 2,470,576 | |
| Resolute Forest Products, Inc.*† | | | 81,000 | | | | 911,250 | |
| | | | | | | | 7,809,298 | |
| | | | | | | | | |
| Utilities — 3.4% | | | | | | | | |
| NorthWestern Corp. | | | 57,200 | | | | 2,788,500 | |
| PNM Resources, Inc. | | | 53,500 | | | | 1,316,100 | |
| Portland General Electric Co. | | | 80,600 | | | | 2,672,696 | |
| | | | | | | | 6,777,296 | |
| | | | | | | | | |
| Consumer Staples — 3.3% | | | | | | | | |
| Andersons, Inc. (The) | | | 59,200 | | | | 2,308,800 | |
| Snyder’s-Lance, Inc. | | | 48,500 | | | | 1,565,095 | |
Touchstone Small Cap Value Opportunities Fund (Continued)
| | | | | | Market | |
| | | Shares | | | Value | |
| | | | | | | |
| Common Stocks — 97.2% (Continued) | | | | | | | | |
| | | | | | | | | |
| Consumer Staples — (Continued) | | | | | | | | |
| TreeHouse Foods, Inc.* | | | 33,200 | | | $ | 2,690,196 | |
| | | | | | | | 6,564,091 | |
| | | | | | | | | |
| Telecommunication Services — 2.0% | | | | | | | | |
| FairPoint Communications, Inc.*† | | | 107,700 | | | | 1,962,294 | |
| Vonage Holdings Corp.* | | | 427,800 | | | | 2,100,498 | |
| | | | | | | | 4,062,792 | |
| | | | | | | | | |
| Diversified — 1.0% | | | | | | | | |
| Lexington Realty Trust REIT | | | 234,600 | | | | 1,989,408 | |
| Total Common Stocks | | | | | | $ | 192,952,358 | |
| | | | | | | | | |
| Investment Funds — 15.0% | | | | | | | | |
| Dreyfus Cash Management, Institutional | | | | | | | | |
| Shares, 0.04%¥W | | | 5,657,947 | | | | 5,657,947 | |
| Invesco Government & Agency | | | | | | | | |
| Portfolio, Institutional Class, | | | | | | | | |
| 0.04%**¥W | | | 24,050,948 | | | | 24,050,948 | |
| Total Investment Funds | | | | | | $ | 29,708,895 | |
| | | | | | | | | |
| Total Investment Securities —112.2% | | | | | | | | |
| (Cost $206,735,894) | | | | | | $ | 222,661,253 | |
| | | | | | | | | |
| Liabilities in Excess of Other Assets — (12.2%) | | | | | | | (24,194,518 | ) |
| | | | | | | | | |
| Net Assets — 100.0% | | | | | | $ | 198,466,735 | |
| * | Non-income producing security. |
| ** | Represents collateral for securities loaned. |
| † | All or a portion of the security is on loan. The total market value of the securities on loan as of June 30, 2015 was $23,578,159. |
| W | Represents the 7-day SEC yield as of June 30, 2015. |
Portfolio Abbreviations:
REIT - Real Estate Investment Trust
Other Information:
The inputs or methodology used for valuing securities may not be an indication of the risk associated with investing in those securities. For more information on valuation inputs, and their aggregation into the levels used in the table below, please refer to the security valuation section in the accompanying Notes to Financial Statements.
Valuation inputs at Reporting Date:
| Description | | Level 1 | | | Level 2 | | | Level 3 | | | Total | |
| Common Stocks | | $ | 192,952,358 | | | $ | — | | | $ | — | | | $ | 192,952,358 | |
| Investment Funds | | | 29,708,895 | | | | — | | | | — | | | | 29,708,895 | |
| | | | | | | | | | | | | | | $ | 222,661,253 | |
See accompanying Notes to Financial Statements.
Portfolio of Investments
Touchstone Value Fund – June 30, 2015
| | | | | | Market | |
| | | Shares | | | Value | |
| | | | | | | |
| Common Stocks — 99.0% | | | | | | | | |
| | | | | | | | | |
| Financials — 24.4% | | | | | | | | |
| American Express Co. | | | 156,939 | | | $ | 12,197,299 | |
| American International Group, Inc. | | | 73,030 | | | | 4,514,715 | |
| Bank of America Corp. | | | 546,696 | | | | 9,304,767 | |
| Capital One Financial Corp. | | | 141,423 | | | | 12,440,981 | |
| Citigroup, Inc. | | | 189,241 | | | | 10,453,673 | |
| JPMorgan Chase & Co. | | | 218,078 | | | | 14,776,965 | |
| PNC Financial Services Group, Inc. (The) | | | 131,628 | | | | 12,590,218 | |
| State Street Corp. | | | 135,045 | | | | 10,398,465 | |
| Wells Fargo & Co. | | | 262,824 | | | | 14,781,222 | |
| | | | | | | | 101,458,305 | |
| | | | | | | | | |
| Health Care — 20.4% | | | | | | | | |
| Anthem, Inc. | | | 39,402 | | | | 6,467,444 | |
| Johnson & Johnson | | | 112,792 | | | | 10,992,708 | |
| Medtronic PLC (Ireland)* | | | 187,071 | | | | 13,861,961 | |
| Merck & Co., Inc. | | | 172,219 | | | | 9,804,428 | |
| Pfizer, Inc. | | | 382,957 | | | | 12,840,548 | |
| Sanofi ADR | | | 250,610 | | | | 12,412,713 | |
| Teva Pharmaceutical Industries Ltd. ADR | | | 147,723 | | | | 8,730,429 | |
| UnitedHealth Group, Inc. | | | 80,034 | | | | 9,764,148 | |
| | | | | | | | 84,874,379 | |
| | | | | | | | | |
| Information Technology — 12.3% | | | | | | | | |
| Intel Corp. | | | 220,887 | | | | 6,718,278 | |
| Microsoft Corp. | | | 292,886 | | | | 12,930,918 | |
| Oracle Corp. | | | 315,974 | | | | 12,733,752 | |
| QUALCOMM, Inc. | | | 173,100 | | | | 10,841,253 | |
| Texas Instruments, Inc. | | | 152,879 | | | | 7,874,797 | |
| | | | | | | | 51,098,998 | |
| | | | | | | | | |
| Consumer Discretionary — 10.1% | | | | | | | | |
| Carnival Corp. (Panama) | | | 95,064 | | | | 4,695,212 | |
| Delphi Automotive PLC (Jersey) | | | 94,861 | | | | 8,071,722 | |
| Ford Motor Co. | | | 552,009 | | | | 8,285,655 | |
| Johnson Controls, Inc. | | | 204,387 | | | | 10,123,288 | |
| Target Corp. | | | 135,096 | | | | 11,027,886 | |
| | | | | | | | 42,203,763 | |
| | | | | | | | | |
| Industrials — 10.0% | | | | | | | | |
| Deere & Co.† | | | 47,169 | | | | 4,577,751 | |
| Emerson Electric Co. | | | 151,759 | | | | 8,412,001 | |
| General Dynamics Corp. | | | 61,637 | | | | 8,733,347 | |
| Honeywell International, Inc. | | | 73,299 | | | | 7,474,299 | |
| Raytheon Co. | | | 61,785 | | | | 5,911,589 | |
| Stanley Black & Decker, Inc. | | | 61,255 | | | | 6,446,476 | |
| | | | | | | | 41,555,463 | |
| | | | | | | | | |
| Energy — 8.5% | | | | | | | | |
| BP PLC ADR | | | 243,524 | | | | 9,731,219 | |
| ConocoPhillips | | | 147,280 | | | | 9,044,465 | |
| Occidental Petroleum Corp. | | | 111,043 | | | | 8,635,814 | |
| Phillips 66 | | | 77,403 | | | | 6,235,586 | |
| Seadrill Ltd. (Bermuda)† | | | 145,671 | | | | 1,506,238 | |
| | | | | | | | 35,153,322 | |
| | | | | | | | | |
| Consumer Staples — 6.1% | | | | | | | | |
| Altria Group, Inc. | | | 153,313 | | | | 7,498,539 | |
| Philip Morris International, Inc. | | | 133,810 | | | | 10,727,548 | |
| Wal-Mart Stores, Inc. | | | 98,181 | | | | 6,963,978 | |
| | | | | | | | 25,190,065 | |
| | | | | | | | | |
| Telecommunication Services — 3.9% | | | | | | | | |
| AT&T, Inc. | | | 113,972 | | | | 4,048,285 | |
| Verizon Communications, Inc. | | | 261,596 | | | | 12,192,990 | |
| | | | | | | | 16,241,275 | |
| | | | | | | | | |
| Materials — 2.5% | | | | | | | | |
| CRH PLC ADR | | | 375,376 | | | | 10,551,819 | |
| | | | | | | | | |
| Utilities — 0.8% | | | | | | | | |
| Entergy Corp. | | | 45,387 | | | | 3,199,784 | |
| Total Common Stocks | | | | | | $ | 411,527,173 | |
| | | | | | | | | |
| Investment Funds — 2.5% | | | | | | | | |
| Dreyfus Cash Management, Institutional | | | | | | | | |
Shares, 0.04%¥W | | | 4,112,164 | | | | 4,112,164 | |
| Invesco Government & Agency | | | | | | | | |
| Portfolio, Institutional Class, | | | | | | | | |
0.04%**¥W | | | 6,060,959 | | | | 6,060,959 | |
| Total Investment Funds | | | | | | $ | 10,173,123 | |
| | | | | | | | | |
| Total Investment Securities —101.5% | | | | | | | | |
| (Cost $332,082,542) | | | | | | $ | 421,700,296 | |
| | | | | | | | | |
| Liabilities in Excess of Other Assets — (1.5%) | | | | | | | (6,179,246 | ) |
| | | | | | | | | |
| Net Assets — 100.0% | | | | | | $ | 415,521,050 | |
| * | Non-income producing security. |
| ** | Represents collateral for securities loaned. |
| † | All or a portion of the security is on loan. The total market value of the securities on loan as of June 30, 2015 was $6,022,971. |
| W | Represents the 7-day SEC yield as of June 30, 2015. |
Portfolio Abbreviations:
ADR - American Depositary Receipt
PLC - Public Limited Company
Touchstone Value Fund (Continued)
Other Information:
The inputs or methodology used for valuing securities may not be an indication of the risk associated with investing in those securities. For more information on valuation inputs, and their aggregation into the levels used in the table below, please refer to the security valuation section in the accompanying Notes to Financial Statements.
Valuation inputs at Reporting Date:
| Description | | Level 1 | | | Level 2 | | | Level 3 | | | Total | |
| Common Stocks | | $ | 411,527,173 | | | $ | — | | | $ | — | | | $ | 411,527,173 | |
| Investment Funds | | | 10,173,123 | | | | — | | | | — | | | | 10,173,123 | |
| | | | | | | | | | | | | | | $ | 421,700,296 | |
See accompanying Notes to Financial Statements.
This page intentionally left blank.
Statements of Assets and Liabilities
June 30, 2015
| | | | | | | | | Touchstone | | | | |
| | | Touchstone | | | | | | Small Cap | | | | |
| | | International | | | Touchstone | | | Value | | | | |
| | | Small Cap | | | Large Cap | | | Opportunities | | | Touchstone | |
| | | Fund | | | Fund | | | Fund | | | Value Fund | |
| Assets | | | | | | | | | | | | | | | | |
| Investments, at cost | | $ | 225,759,970 | | | $ | 295,605,867 | | | $ | 206,735,894 | | | $ | 332,082,542 | |
| Investments, at market value (A) | | $ | 259,519,429 | | | $ | 295,941,336 | | | $ | 222,661,253 | | | $ | 421,700,296 | |
| Foreign currency (B) | | | 946,494 | | | | — | | | | — | | | | — | |
| Dividends and interest receivable | | | 454,826 | | | | 330,268 | | | | 276,495 | | | | 702,998 | |
| Receivable for capital shares sold | | | 4,347,223 | | | | 587,678 | | | | 394,227 | | | | 501,340 | |
| Receivable for investments sold | | | 595,087 | | | | — | | | | 873,154 | | | | — | |
| Receivable for securities lending income | | | 6,737 | | | | — | | | | 17,876 | | | | 524 | |
| Tax reclaim receivable | | | 142,564 | | | | 22,758 | | | | — | | | | — | |
| Other assets | | | 28,279 | | | | 6,242 | | | | 23,531 | | | | 31,471 | |
| Total Assets | | | 266,040,639 | | | | 296,888,282 | | | | 224,246,536 | | | | 422,936,629 | |
| | | | | | | | | | | | | | | | | |
| Liabilities | | | | | | | | | | | | | | | | |
| Bank overdrafts | | | — | | | | — | | | | — | | | | 802 | |
| Payable for return of collateral for securities on loan | | | 7,748,806 | | | | — | | | | 24,050,948 | | | | 6,060,959 | |
| Payable for capital shares redeemed | | | 77,968 | | | | 19,664 | | | | 644,039 | | | | 983,251 | |
| Payable for investments purchased | | | 9,308,391 | | | | — | | | | 826,846 | | | | — | |
| Payable to Investment Advisor | | | 181,537 | | | | 160,092 | | | | 147,955 | | | | 220,124 | |
| Payable to other affiliates | | | 17,185 | | | | 35,742 | | | | 20,439 | | | | 27,864 | |
| Payable to Trustees | | | 3,488 | | | | 3,440 | | | | 3,488 | | | | 3,488 | |
| Payable to Transfer Agent | | | 84,967 | | | | 125,864 | | | | 49,528 | | | | 77,343 | |
| Payable for professional services | | | 30,056 | | | | 24,950 | | | | 19,766 | | | | 20,287 | |
| Other accrued expenses and liabilities | | | 36,839 | | | | 20,564 | | | | 16,792 | | | | 21,461 | |
| Total Liabilities | | | 17,489,237 | | | | 390,316 | | | | 25,779,801 | | | | 7,415,579 | |
| Net Assets | | $ | 248,551,402 | | | $ | 296,497,966 | | | $ | 198,466,735 | | | $ | 415,521,050 | |
| | | | | | | | | | | | | | | | | |
| Net assets consist of: | | | | | | | | | | | | | | | | |
| Paid-in capital | | $ | 219,794,514 | | | $ | 296,863,032 | | | $ | 173,089,126 | | | $ | 314,748,004 | |
| Accumulated net investment income | | | 1,566,468 | | | | 539,773 | | | | 300 | | | | 167,538 | |
| Accumulated net realized gains (losses) on investments and foreign currency transactions | | | (6,517,333 | ) | | | (1,240,308 | ) | | | 9,451,950 | | | | 10,987,754 | |
| Net unrealized appreciation on investments and foreign currency transactions | | | 33,707,753 | | | | 335,469 | | | | 15,925,359 | | | | 89,617,754 | |
| Net Assets | | $ | 248,551,402 | | | $ | 296,497,966 | | | $ | 198,466,735 | | | $ | 415,521,050 | |
| (A) Includes market value of securities on loan of: | | $ | 7,339,398 | | | $ | — | | | $ | 23,578,159 | | | $ | 6,022,971 | |
| (B) Cost of foreign currency: | | $ | 945,977 | | | $ | — | | | $ | — | | | $ | — | |
See accompanying Notes to Financial Statements.
Statements of Assets and Liabilities (Continued)
| | | | | | | | | Touchstone | | | | |
| | | Touchstone | | | | | | Small Cap | | | | |
| | | International | | | Touchstone | | | Value | | | Touchstone | |
| | | Small Cap | | | Large Cap | | | Opportunities | | | Value | |
| | | Fund | | | Fund | | | Fund | | | Fund | |
| | | | | | | | | | | | | |
| Pricing of Class A Shares | | | | | | | | | | | | | | | | |
| Net assets applicable to Class A shares | | $ | 24,634,864 | | | $ | 2,013,028 | | | $ | 15,219,398 | | | $ | 55,539,396 | |
Shares of beneficial interest outstanding
(unlimited number of shares authorized, no par value) | | | 1,491,156 | | | | 188,951 | | | | 815,296 | | | | 5,679,644 | |
| Net asset value and redemption price per share* | | $ | 16.52 | | | $ | 10.65 | | | $ | 18.67 | | | $ | 9.78 | |
| Maximum sales charge - Class A shares | | | 5.75 | % | | | 5.75 | % | | | 5.75 | % | | | 5.75 | % |
Maximum offering price per share
(100%/(100%-maximum sales charge) of net asset value
adjusted to the nearest cent) per share - Class A shares | | $ | 17.53 | | | $ | 11.30 | | | $ | 19.81 | | | $ | 10.38 | |
| | | | | | | | | | | | | | | | | |
| Pricing of Class C Shares | | | | | | | | | | | | | | | | |
| Net assets applicable to Class C shares | | $ | 4,120,256 | | | $ | 1,370,390 | | | $ | 2,077,351 | | | $ | 6,932,407 | |
Shares of beneficial interest outstanding
(unlimited number of shares authorized, no par value) | | | 253,087 | | | | 129,287 | | | | 113,297 | | | | 711,070 | |
| Net asset value, offering price per share** | | $ | 16.28 | | | $ | 10.60 | | | $ | 18.34 | | | $ | 9.75 | |
| | | | | | | | | | | | | | | | | |
| Pricing of Class Y Shares | | | | | | | | | | | | | | | | |
| Net assets applicable to Class Y shares | | $ | 172,476,893 | | | $ | 194,225,632 | | | $ | 149,852,329 | | | $ | 104,668,413 | |
Shares of beneficial interest outstanding
(unlimited number of shares authorized, no par value) | | | 10,184,144 | | | | 18,197,276 | | | | 7,609,978 | | | | 10,668,508 | |
| Net asset value, offering price and redemption price per share | | $ | 16.94 | | | $ | 10.67 | | | $ | 19.69 | | | $ | 9.81 | |
| | | | | | | | | | | | | | | | | |
| Pricing of Institutional Class Shares | | | | | | | | | | | | | | | | |
| Net assets applicable to Institutional Class shares | | $ | 47,319,389 | | | $ | 98,888,916 | | | $ | 31,317,657 | | | $ | 248,380,834 | |
Shares of beneficial interest outstanding
(unlimited number of shares authorized, no par value) | | | 2,780,016 | | | | 9,258,168 | | | | 1,570,737 | | | | 25,372,000 | |
| Net asset value, offering price and redemption price per share | | $ | 17.02 | | | $ | 10.68 | | | $ | 19.94 | | | $ | 9.79 | |
* There is no sales load on subscriptions of $1 million or more. Redemptions that were part of a $1 million or more subscription may be subject to a contingent deferred sales load if redeemed within a one-year period from the date of purchase.
** Redemption price per share varies by length of time shares are held.
See accompanying Notes to Financial Statements.
Statements of Operations
For the Year Ended June 30, 2015
| | | | | | | | | Touchstone | | | | |
| | | Touchstone | | | | | | Small Cap | | | | |
| | | International | | | Touchstone | | | Value | | | Touchstone | |
| | | Small Cap | | | Large Cap | | | Opportunities | | | Value | |
| | | Fund | | | Fund(B) | | | Fund | | | Fund | |
| Investment Income | | | | | | | | | | | | | | | | |
| Dividends from affiliated securities | | $ | 580 | | | $ | 212 | | | $ | 517 | | | $ | 568 | |
| Dividends from non-affiliated securities(A) | | | 4,037,767 | | | | 1,067,581 | | | | 2,958,911 | | | | 11,287,572 | |
| Income from securities loaned | | | 135,985 | | | | 145 | | | | 373,385 | | | | 10,524 | |
| Total Investment Income | | | 4,174,332 | | | | 1,067,938 | | | | 3,332,813 | | | | 11,298,664 | |
| Expenses | | | | | | | | | | | | | | | | |
| Investment advisory fees | | | 1,615,977 | | | | 386,570 | | | | 1,802,631 | | | | 2,806,778 | |
| Administration fees | | | 258,523 | | | | 81,285 | | | | 288,813 | | | | 658,579 | |
| Compliance fees and expenses | | | 1,825 | | | | 1,825 | | | | 1,825 | | | | 1,825 | |
| Custody fees | | | 71,975 | | | | 4,983 | | | | 13,583 | | | | 11,119 | |
| Professional fees | | | 40,683 | | | | 31,789 | | | | 27,821 | | | | 38,403 | |
| Transfer Agent fees, Class A | | | 18,290 | | | | 266 | | | | 23,824 | | | | 90,151 | |
| Transfer Agent fees, Class C | | | 1,886 | | | | 311 | | | | 2,191 | | | | 6,623 | |
| Transfer Agent fees, Class Y | | | 152,542 | | | | 3,038 | | | | 122,441 | | | | 121,059 | |
| Transfer Agent fees, Institutional Class | | | 3,712 | | | | 2,982 | | | | 6,532 | | | | 38,206 | |
| Registration Fees, Class A | | | 15,122 | | | | 1,671 | | | | 15,796 | | | | 16,442 | |
| Registration Fees, Class C | | | 3,641 | | | | 1,468 | | | | 1,409 | | | | 7,117 | |
| Registration Fees, Class Y | | | 18,537 | | | | 2,506 | | | | 18,785 | | | | 23,709 | |
| Registration Fees, Institutional Class | | | 13,063 | | | | 527 | | | | 34,776 | | | | 22,867 | |
| Reports to Shareholders, Class A | | | 6,969 | | | | 5,490 | | | | 6,280 | | | | 11,502 | |
| Reports to Shareholders, Class C | | | 4,201 | | | | 5,436 | | | | 3,719 | | | | 4,975 | |
| Reports to Shareholders, Class Y | | | 15,978 | | | | 5,701 | | | | 17,310 | | | | 12,342 | |
| Reports to Shareholders, Institutional Class | | | 4,664 | | | | 7,737 | | | | 5,134 | | | | 19,692 | |
| Distribution expenses, Class A | | | 28,085 | | | | 627 | | | | 38,194 | | | | 151,821 | |
| Distribution and shareholder servicing expenses, Class C | | | 14,164 | | | | 3,027 | | | | 15,101 | | | | 61,307 | |
| Trustee fees | | | 12,753 | | | | 12,753 | | | | 12,753 | | | | 12,753 | |
| Other expenses | | | 94,286 | | | | 8,909 | | | | 28,491 | | | | 55,136 | |
| Total Expenses | | | 2,396,876 | | | | 568,901 | | | | 2,487,409 | | | | 4,172,406 | |
| Fees waived and/or reimbursed by the Advisor and/or Affiliates(C) | | | (180,903 | ) | | | (134,430 | ) | | | (181,408 | ) | | | (765,780 | ) |
| Net Expenses | | | 2,215,973 | | | | 434,471 | | | | 2,306,001 | | | | 3,406,626 | |
| Net Investment Income | | | 1,958,359 | | | | 633,467 | | | | 1,026,812 | | | | 7,892,038 | |
| Realized and Unrealized Gains (Losses) on Investments | | | | | | | | | | | | | | | | |
| Net realized gains (losses) on investments from non-affiliated securities | | | 11,572,428 | | | | (193,216 | ) | | | 16,058,310 | | | | 38,511,219 | |
| Net realized losses on foreign currency transactions | | | (110,726 | ) | | | — | | | | — | | | | — | |
| Net change in unrealized appreciation (depreciation) on investments(D) | | | (1,839,867 | ) | | | (3,324,366 | ) | | | (11,306,717 | ) | | | (21,863,427 | ) |
| Net change in unrealized appreciation (depreciation) on foreign currency transactions | | | (59,829 | ) | | | — | | | | — | | | | — | |
| Net Realized and Unrealized Gains (Losses) on Investments | | | 9,562,006 | | | | (3,517,582 | ) | | | 4,751,593 | | | | 16,647,792 | |
| Change in Net Assets Resulting from Operations | | $ | 11,520,365 | | | $ | (2,884,115 | ) | | $ | 5,778,405 | | | $ | 24,539,830 | |
| (A)Net of foreign tax withholding of: | | $ | 354,211 | | | $ | — | | | $ | — | | | $ | 112,723 | |
(B)Represents the period from commencement of operations (July 9, 2014) through June 30, 2015.
(C)See Note 4 in Notes to Financial Statements.
(D)Change in unrealized appreciation/(depreciation) does not include net unrealized appreciation of $3,659,835 for the Large Cap Fund in connection with the Fund’s merger. See Note 9 in the Notes to Financial Statements.
See accompanying Notes to Financial Statements.
Statements of Changes in Net Assets
| | | Touchstone | | | Touchstone | |
| | | International | | | Large Cap | |
| | | Small Cap Fund | | | Fund | |
| | | For the Year | | | For the Year | | | For the Period | |
| | | Ended | | | Ended | | | Ended June 30, | |
| | | June 30, 2015 | | | June 30, 2014 | | | 2015(B) | |
| From Operations | | | | | | | | | | | | |
| Net investment income | | $ | 1,958,359 | | | $ | 1,463,348 | | | $ | 633,467 | |
| Net realized gain (loss) on investments and foreign currency transactions and payment by affiliates | | | 11,461,702 | | | | 8,587,676 | | | | (193,216 | ) |
| Net change in unrealized appreciation (depreciation) on investments and foreign currency transactions | | | (1,899,696 | ) | | | 18,843,788 | | | | (3,324,366 | ) |
| Change in Net Assets from Operations | | | 11,520,365 | | | | 28,894,812 | | | | (2,884,115 | ) |
| Distributions to Shareholders from: | | | | | | | | | | | | |
| Net investment income, Class A | | | (37,754 | ) | | | (44,598 | ) | | | (133 | ) |
| Net investment income, Class C | | | (2,327 | ) | | | (1,662 | ) | | | — | |
| Net investment income, Class Y | | | (785,529 | ) | | | (1,419,428 | ) | | | (1,110 | ) |
| Net investment income, Institutional Class | | | (256,269 | ) | | | (442,867 | ) | | | (92,451 | ) |
| Net realized gains, Class A | | | — | | | | — | | | | — | |
| Net realized gains, Class C | | | — | | | | — | | | | — | |
| Net realized gains, Class Y | | | — | | | | — | | | | — | |
| Net realized gains, Institutional Class | | | — | | | | — | | | | — | |
| Total Distributions | | | (1,081,879 | ) | | | (1,908,555 | ) | | | (93,694 | ) |
| | | | | | | | | | | | | |
| Net Increase (Decrease) from Share Transactions(A) | | | 76,020,244 | | | | 28,247,518 | | | | 299,475,775 | |
| | | | | | | | | | | | | |
| Total Increase (Decrease) in Net Assets | | | 86,458,730 | | | | 55,233,775 | | | | 296,497,966 | |
| Net Assets | | | | | | | | | | | | |
| Beginning of period | | | 162,092,672 | | | | 106,858,897 | | | | — | |
| End of period | | $ | 248,551,402 | | | $ | 162,092,672 | | | $ | 296,497,966 | |
| Accumulated Net Investment Income | | $ | 1,566,468 | | | $ | 721,548 | | | $ | 539,773 | |
(A) For details on share transactions by class, see Statements of Changes in Net Assets - Capital Stock Activity on pages 36-37.
(B) Represents the period from commencement of operations (July 9, 2014) through June 30, 2015.
See accompanying Notes to Financial Statements.
Statements of Changes in Net Assets (Continued)
| Touchstone | | | | |
| Small Cap | | | Touchstone | |
| Value Opportunities Fund | | | Value Fund | |
| For the Year | | | For the Year | | | For the Year | | | For the Year | |
| Ended | | | Ended | | | Ended | | | Ended | |
| June 30, 2015 | | | June 30, 2014 | | | June 30, 2015 | | | June 30, 2014 | |
| | | | | | | | | | | |
| $ | 1,026,812 | | | $ | 326,007 | | | $ | 7,892,038 | | | $ | 8,986,049 | |
| | | | | | | | | | | | | | | |
| | 16,058,310 | | | | 25,334,532 | | | | 38,511,219 | | | | 15,695,457 | |
| | | | | | | | | | | | | | | |
| | (11,306,717 | ) | | | 11,521,337 | | | | (21,863,427 | ) | | | 48,490,892 | |
| | 5,778,405 | | | | 37,181,876 | | | | 24,539,830 | | | | 73,172,398 | |
| | | | | | | | | | | | | | | |
| | (269,790 | ) | | | (3,917 | ) | | | (681,294 | ) | | | (1,193,286 | ) |
| | (24,922 | ) | | | — | | | | (34,479 | ) | | | (59,554 | ) |
| | (2,673,760 | ) | | | (336,255 | ) | | | (1,563,242 | ) | | | (2,363,426 | ) |
| | (467,019 | ) | | | (31,300 | ) | | | (4,035,735 | ) | | | (5,163,594 | ) |
| | (1,781,329 | ) | | | (313,414 | ) | | | (1,056,528 | ) | | | — | |
| | (179,373 | ) | | | (14,880 | ) | | | (98,205 | ) | | | — | |
| | (16,418,203 | ) | | | (17,996,689 | ) | | | (1,898,093 | ) | | | — | |
| | (2,756,437 | ) | | | (1,318,126 | ) | | | (4,392,373 | ) | | | — | |
| | (24,570,833 | ) | | | (20,014,581 | ) | | | (13,759,949 | ) | | | (8,779,860 | ) |
| | | | | | | | | | | | | | | |
| | 36,213,437 | | | | 57,853,792 | | | | (25,104,709 | ) | | | 22,607,785 | |
| | | | | | | | | | | | | | | |
| | 17,421,009 | | | | 75,021,087 | | | | (14,324,828 | ) | | | 87,000,323 | |
| | | | | | | | | | | | | | | |
| | 181,045,726 | | | | 106,024,639 | | | | 429,845,878 | | | | 342,845,555 | |
| $ | 198,466,735 | | | $ | 181,045,726 | | | $ | 415,521,050 | | | $ | 429,845,878 | |
| $ | 300 | | | $ | 255,458 | | | $ | 167,538 | | | $ | 206,189 | |
Statements of Changes in Net Assets - Capital Stock Activity
| | | | | | | | | | | | | | | Touchstone Large | |
| | | Touchstone International Small Cap Fund | | | Cap Fund | |
| | | For the | | | For the | | | For the | |
| | | Year Ended | | | Year Ended | | | Period Ended | |
| | | June 30, 2015 | | | June 30, 2014 | | | June 30, 2015(B) | |
| | | Shares | | | Dollars | | | Shares | | | Dollars | | | Shares | | | Dollars | |
| Class A | | | | | | | | | | | | | | | | | | | | | | | | |
| Proceeds from Shares issued | | | 1,199,963 | | | $ | 19,218,862 | | | | 690,059 | | | $ | 10,199,935 | | | | 65,666 | $ | | | 706,463 | |
| Proceeds from Shares issued in connection with merger(A) | | | — | | | | — | | | | — | | | | — | | | | 134,841 | | | | 1,466,300 | |
| Reinvestment of distributions | | | 2,511 | | | | 36,985 | | | | 2,877 | | | | 41,895 | | | | 12 | | | | 133 | |
| Cost of Shares redeemed | | | (403,993 | ) | | | (6,230,270 | ) | | | (39,141 | ) | | | (590,033 | ) | | | (11,568 | ) | | | (124,864 | ) |
| Change from Class A Share Transactions | | | 798,481 | | | | 13,025,577 | | | | 653,795 | | | | 9,651,797 | | | | 188,951 | | | | 2,048,032 | |
| Class C | | | | | | | | | | | | | | | | | | | | | | | | |
| Proceeds from Shares issued | | | 230,566 | | | | 3,680,381 | | | | 39,387 | | | | 588,357 | | | | 102,403 | | | | 1,108,828 | |
| Proceeds from Shares issued in connection with merger(A) | | | — | | | | — | | | | — | | | | — | | | | 33,258 | | | | 359,796 | |
| Reinvestment of distributions | | | 140 | | | | 2,028 | | | | 115 | | | | 1,662 | | | | — | | | | — | |
| Cost of Shares redeemed | | | (17,581 | ) | | | (266,401 | ) | | | (80 | ) | | | (1,108 | ) | | | (6,374 | ) | | | (68,848 | ) |
| Change from Class C Share Transactions | | | 213,125 | | | | 3,416,008 | | | | 39,422 | | | | 588,911 | | | | 129,287 | | | | 1,399,776 | |
| Class Y | | | | | | | | | | | | | | | | | | | | | | | | |
| Proceeds from Shares issued | | | 4,445,221 | | | | 72,611,024 | | | | 1,139,319 | | | | 17,615,548 | | | | 1,258,713 | | | | 13,505,190 | |
| Proceeds from Shares issued in connection with merger(A) | | | — | | | | — | | | | — | | | | — | | | | 16,959,045 | | | | 184,754,062 | |
| Reinvestment of distributions | | | 50,521 | | | | 761,863 | | | | 92,341 | | | | 1,375,877 | | | | 102 | | | | 1,110 | |
| Cost of Shares redeemed | | | (1,911,351 | ) | | | (29,609,710 | ) | | | (649,791 | ) | | | (9,556,736 | ) | | | (20,584 | ) | | | (222,527 | ) |
| Change from Class Y Share Transactions | | | 2,584,391 | | | | 43,763,177 | | | | 581,869 | | | | 9,434,689 | | | | 18,197,276 | | | | 198,037,835 | |
| Institutional Class | | | | | | | | | | | | | | | | | | | | | | | | |
| Proceeds from Shares issued | | | 1,907,711 | | | | 31,670,146 | | | | 1,212,871 | | | | 16,971,950 | | | | 9,192,933 | | | | 97,278,370 | |
| Proceeds from Shares issued in connection with merger(A) | | | — | | | | — | | | | — | | | | — | | | | 62,587 | | | | 682,334 | |
| Reinvestment of distributions | | | 16,915 | | | | 256,269 | | | | 29,603 | | | | 442,867 | | | | 8,474 | | | | 92,451 | |
| Cost of Shares redeemed | | | (1,040,469 | ) | | | (16,110,933 | ) | | | (605,074 | ) | | | (8,842,696 | ) | | | (5,826 | ) | | | (63,023 | ) |
| Change from Institutional Class Share Transactions | | | 884,157 | | | | 15,815,482 | | | | 637,400 | | | | 8,572,121 | | | | 9,258,168 | | | | 97,990,132 | |
| Change from Share Transactions | | | 4,480,154 | | | $ | 76,020,244 | | | | 1,912,486 | | | $ | 28,247,518 | | | | 27,773,682 | | | $ | 299,475,775 | |
(A)See Note 9 in the Notes to Financial Statements.
(B)Represents the period from commencement of operations (July 9, 2014) through June 30, 2015.
See accompanying Notes to Financial Statements.
Statements of Changes in Net Assets - Capital Stock Activity (Continued)
| Touchstone Small Cap Value Opportunities Fund | | | Touchstone Value Fund | |
| For the | | | For the | | | For the | | | For the | |
| Year Ended | | | Year Ended | | | Year Ended | | | Year Ended | |
| June 30, 2015 | | | June 30, 2014 | | | June 30, 2015 | | | June 30, 2014 | |
| Shares | | | Dollars | | | Shares | | | Dollars | | | Shares | | | Dollars | | | Shares | | | Dollars | |
| | | | | | | | | | | | | | | | | | | | | | | |
| | 779,381 | | | $ | 15,358,208 | | | | 694,263 | | | $ | 14,086,155 | | | | 762,901 | | | $ | 7,405,973 | | | | 1,360,322 | | | $ | 12,296,352 | |
| | — | | | | — | | | | — | | | | — | | | | — | | | | — | | | | — | | | | — | |
| | 111,090 | | | | 2,002,265 | | | | 16,104 | | | | 302,907 | | | | 144,696 | | | | 1,410,108 | | | | 103,476 | | | | 967,643 | |
| | (712,392 | ) | | | (13,626,669 | ) | | | (142,999 | ) | | | (2,926,793 | ) | | | (2,129,267 | ) | | | (20,802,496 | ) | | | (1,221,370 | ) | | | (10,869,290 | ) |
| | 178,079 | | | | 3,733,804 | | | | 567,368 | | | | 11,462,269 | | | | (1,221,670 | ) | | | (11,986,415 | ) | | | 242,428 | | | | 2,394,705 | |
| | | | | | | | | | | | | | | | | | | | | | | | | | | | | | | |
| | 94,954 | | | | 1,819,621 | | | | 26,415 | | | | 529,335 | | | | 337,279 | | | | 3,267,904 | | | | 224,263 | | | | 2,036,663 | |
| | — | | | | — | | | | — | | | | — | | | | — | | | | — | | | | — | | | | — | |
| | 8,041 | | | | 142,680 | | | | 633 | | | | 11,799 | | | | 8,080 | | | | 78,092 | | | | 3,548 | | | | 33,419 | |
| | (16,666 | ) | | | (308,042 | ) | | | (1,993 | ) | | | (41,800 | ) | | | (180,803 | ) | | | (1,759,085 | ) | | | (58,418 | ) | | | (519,254 | ) |
| | 86,329 | | | | 1,654,259 | | | | 25,055 | | | | 499,334 | | | | 164,556 | | | | 1,586,911 | | | | 169,393 | | | | 1,550,828 | |
| | | | | | | | | | | | | | | | | | | | | | | | | | | | | | | |
| | 2,044,214 | | | | 41,296,768 | | | | 1,281,068 | | | | 26,940,927 | | | | 2,353,367 | | | | 22,960,959 | | | | 2,484,897 | | | | 22,624,307 | |
| | — | | | | — | | | | — | | | | — | | | | — | | | | — | | | | — | | | | — | |
| | 963,156 | | | | 18,315,097 | | | | 918,330 | | | | 18,084,643 | | | | 279,262 | | | | 2,733,412 | | | | 174,625 | | | | 1,635,689 | |
| | (1,820,526 | ) | | | (36,101,142 | ) | | | (742,017 | ) | | | (15,866,089 | ) | | | (3,748,197 | ) | | | (36,842,800 | ) | | | (3,226,088 | ) | | | (28,595,982 | ) |
| | 1,186,844 | | | | 23,510,723 | | | | 1,457,381 | | | | 29,159,481 | | | | (1,115,568 | ) | | | (11,148,429 | ) | | | (566,566 | ) | | | (4,335,986 | ) |
| | | | | | | | | | | | | | | | | | | | | | | | | | | | | | | |
| | 368,491 | | | | 7,441,842 | | | | 957,175 | | | | 20,689,646 | | | | 5,151,325 | | | | 49,653,209 | | | | 7,075,862 | | | | 64,437,527 | |
| | — | | | | — | | | | — | | | | — | | | | — | | | | — | | | | — | | | | — | |
| | 167,477 | | | | 3,223,456 | | | | 67,787 | | | | 1,349,426 | | | | 733,844 | | | | 7,180,060 | | | | 469,954 | | | | 4,400,212 | |
| | (160,953 | ) | | | (3,350,647 | ) | | | (241,883 | ) | | | (5,306,364 | ) | | | (6,161,159 | ) | | | (60,390,045 | ) | | | (5,178,939 | ) | | | (45,839,501 | ) |
| | 375,015 | �� | | | 7,314,651 | | | | 783,079 | | | | 16,732,708 | | | | (275,990 | ) | | | (3,556,776 | ) | | | 2,366,877 | | | | 22,998,238 | |
| | 1,826,267 | | | $ | 36,213,437 | | | | 2,832,883 | | | $ | 57,853,792 | | | | (2,448,672 | ) | | $ | (25,104,709 | ) | | | 2,212,132 | | | $ | 22,607,785 | |
Financial Highlights
Touchstone International Small Cap Fund—Class A
Selected Data for a Share Outstanding Throughout Each Period
| | | | | | | | | | | | Three | | | | | | | |
| | | | | | | | | | | | Months | | | | | | | |
| | | | | | | | | | | | Ended | | | | | | | |
| | | Year Ended June 30, | | | June 30, | | | Year Ended March 31, | |
| | | 2015 | | | 2014 | | | 2013 | | | 2012(A) | | | 2012 | | | 2011 | |
| Net asset value at beginning of period | | $ | 15.48 | | | $ | 12.58 | | | $ | 10.21 | | | $ | 11.12 | | | $ | 11.88 | | | $ | 9.25 | |
| Income (loss) from investment operations: | | | | | | | | | | | | | | | | | | | | | | | | |
| Net investment income (loss) | | | 0.11 | | | | 0.11 | (B) | | | 0.11 | | | | 0.09 | (B) | | | 0.03 | (B) | | | (0.10 | )(B) |
| Net realized and unrealized gains (losses) on investments | | | 1.00 | | | | 3.00 | | | | 2.43 | | | | (0.90 | ) | | | (0.84 | ) | | | 2.73 | |
| Total from investment operations | | | 1.11 | | | | 3.11 | | | | 2.54 | | | | (0.81 | ) | | | (0.81 | ) | | | 2.63 | |
| Distributions from: | | | | | | | | | | | | | | | | | | | | | | | | |
| Net investment income | | | (0.07 | ) | | | (0.21 | ) | | | (0.17 | ) | | | (0.10 | ) | | | (0.15 | ) | | | — | |
| Capital contribution | | | — | | | | — | | | | — | | | | — | | | | 0.20 | (C) | | | — | |
| Net asset value at end of period | | $ | 16.52 | | | $ | 15.48 | | | $ | 12.58 | | | $ | 10.21 | | | $ | 11.12 | | | $ | 11.88 | |
| Total return(D) | | | 7.29 | % | | | 24.74 | % | | | 24.99 | % | | | (7.28 | )%(E) | | | (4.96 | )%(C) | | | 28.43 | % |
| Ratios and supplemental data: | | | | | | | | | | | | | | | | | | | | | | | | |
| Net assets at end of period (000’s) | | $ | 24,635 | | | $ | 10,721 | | | $ | 489 | | | $ | 199 | | | $ | 143 | | | $ | 207 | |
| Ratio to average net assets: | | | | | | | | | | | | | | | | | | | | | | | | |
| Net expenses | | | 1.55 | % | | | 1.55 | % | | | 1.55 | % | | | 1.55 | %(F) | | | 1.55 | % | | | 1.55 | % |
| Gross expenses | | | 1.84 | % | | | 2.12 | % | | | 7.77 | % | | | 19.37 | %(F) | | | 10.50 | %(G) | | | 3.23 | %(G) |
| Net investment income (loss) | | | 0.90 | % | | | 0.76 | % | | | 1.41 | % | | | 3.36 | %(F) | | | 0.26 | % | | | (1.02 | )% |
| Portfolio turnover rate | | | 84 | % | | | 60 | % | | | 79 | % | | | 21 | %(E) | | | 207 | % | | | 152 | % |
Touchstone International Small Cap Fund—Class C
Selected Data for a Share Outstanding Throughout Each Period
| | | | | | | | | | | | Period | |
| | | | | | | | | | | | Ended | |
| | | Year Ended June 30, | | | June 30, | |
| | | 2015 | | | 2014 | | | 2013 | | | 2012(H) | |
| Net asset value at beginning of period | | $ | 15.33 | | | $ | 12.54 | | | $ | 10.19 | | | $ | 10.94 | |
| Income (loss) from investment operations: | | | | | | | | | | | | | | | | |
| Net investment income | | | 0.06 | | | | — | (B)(I) | | | 0.14 | | | | 0.05 | (B) |
| Net realized and unrealized gains (losses) on investments | | | 0.92 | | | | 2.99 | | | | 2.31 | | | | (0.69 | ) |
| Total from investment operations | | | 0.98 | | | | 2.99 | | | | 2.45 | | | | (0.64 | ) |
| Distributions from: | | | | | | | | | | | | | | | | |
| Net investment income | | | (0.03 | ) | | | (0.20 | ) | | | (0.10 | ) | | | (0.11 | ) |
| Net asset value at end of period | | $ | 16.28 | | | $ | 15.33 | | | $ | 12.54 | | | $ | 10.19 | |
| Total return(D) | | | 6.44 | % | | | 23.94 | % | | | 24.08 | % | | | (5.84 | )%(E) |
| Ratios and supplemental data: | | | | | | | | | | | | | | | | |
| Net assets at end of period (000’s) | | $ | 4,120 | | | $ | 613 | | | $ | 7 | | | $ | 2 | |
| Ratio to average net assets: | | | | | | | | | | | | | | | | |
| Net expenses | | | 2.30 | % | | | 2.30 | % | | | 2.30 | % | | | 2.30 | %(F) |
| Gross expenses | | | 2.92 | % | | | 7.28 | % | | | 94.29 | % | | | 968.58 | %(F) |
| Net investment income | | | 0.15 | % | | | 0.01 | % | | | 0.66 | % | | | 2.12 | %(F) |
| Portfolio turnover rate | | | 84 | % | | | 60 | % | | | 79 | % | | | 21 | %(E) |
| (A) | The Fund changed its fiscal year end from March 31 to June 30. |
| (B) | The net investment income (loss) per share is based on average shares outstanding for the period. |
| (C) | Impact of one time distribution of settlement funds from the Bank of America Fair Fund. If the distribution had not occurred the total return would have been lower. |
| (D) | Total returns shown exclude the effect of applicable sales loads. If these charges were included, the returns would be lower. |
| (G) | Legal, printing and/or compliance audit expenses relating to civil litigation and certain regulatory actions in connection with market timing allegations were incurred, and the former advisor paid these expenses on behalf of the Funds. Had the former advisor not paid these expenses, the expenses for the Funds would have been higher than what is reflected in the financial highlights for the years ended March 31, 2012 and 2011. |
| (H) | Represents the period from commencement of operations (April 16, 2012) through June 30, 2012. |
| (I) | Less than $0.005 per share. |
See accompanying Notes to Financial Statements.
Financial Highlights (Continued)
Touchstone International Small Cap Fund—Class Y
Selected Data for a Share Outstanding Throughout Each Period
| | | | | | Three | | | | |
| | | | | | Months | | | | |
| | | | | | Ended | | | | |
| | | Year Ended June 30, | | | June 30, | | | Year Ended March 31, | |
| | | 2015 | | | 2014 | | | 2013 | | | 2012(A) | | | 2012 | | | 2011 | |
| Net asset value at beginning of period | | $ | 15.86 | | | $ | 12.84 | | | $ | 10.40 | | | $ | 11.32 | | | $ | 12.14 | | | $ | 9.44 | |
| Income (loss) from investment operations: | | | | | | | | | | | | | | | | | | | | | | | | |
| Net investment income (loss) | | | 0.14 | | | | 0.16 | (B) | | | 0.21 | | | | 0.10 | (B) | | | 0.07 | (B) | | | (0.08 | )(B) |
| Net realized and unrealized gains (losses) on investments | | | 1.04 | | | | 3.07 | | | | 2.40 | | | | (0.92 | ) | | | (0.88 | ) | | | 2.80 | |
| Total from investment operations | | | 1.18 | | | | 3.23 | | | | 2.61 | | | | (0.82 | ) | | | (0.81 | ) | | | 2.72 | |
| Distributions from: | | | | | | | | | | | | | | | | | | | | | | | | |
| Net investment income | | | (0.10 | ) | | | (0.21 | ) | | | (0.17 | ) | | | (0.10 | ) | | | (0.21 | ) | | | (0.02 | ) |
| Capital contribution | | | — | | | | — | | | | — | | | | — | | | | 0.20 | (C) | | | — | |
| Net asset value at end of period | | $ | 16.94 | | | $ | 15.86 | | | $ | 12.84 | | | $ | 10.40 | | | $ | 11.32 | | | $ | 12.14 | |
| Total return | | | 7.54 | % | | | 25.16 | % | | | 25.38 | % | | | (7.22 | )%(D) | | | (4.81 | )%(C) | | | 28.82 | % |
| Ratios and supplemental data: | | | | | | | | | | | | | | | | | | | | | | | | |
| Net assets at end of period (000's) | | $ | 172,477 | | | $ | 120,537 | | | $ | 90,125 | | | $ | 80,754 | | | $ | 90,029 | | | $ | 118,679 | |
| Ratio to average net assets: | | | | | | | | | | | | | | | | | | | | | | | | |
| Net expenses | | | 1.30 | % | | | 1.25 | % | | | 1.24 | % | | | 1.30 | %(E) | | | 1.30 | % | | | 1.30 | % |
| Gross expenses | | | 1.38 | % | | | 1.44 | % | | | 1.53 | % | | | 1.74 | %(E) | | | 1.69 | %(F) | | | 1.59 | %(F) |
| Net investment income (loss) | | | 1.15 | % | | | 1.06 | % | | | 1.71 | % | | | 3.61 | %(E) | | | 0.60 | % | | | (0.80 | )% |
| Portfolio turnover rate | | | 84 | % | | | 60 | % | | | 79 | % | | | 21 | %(D) | | | 207 | % | | | 152 | % |
Touchstone International Small Cap Fund—Institutional Class
Selected Data for a Share Outstanding Throughout Each Period
| | | | | | Three | | | | |
| | | | | | Months | | | | |
| | | | | | Ended | | | | |
| | | Year Ended June 30, | | | June 30, | | | Year Ended March 31, | |
| | | 2015 | | | 2014 | | | 2013 | | | 2012(A) | | | 2012 | | | 2011 | |
| Net asset value at beginning of period | | $ | 15.94 | | | $ | 12.90 | | | $ | 10.45 | | | $ | 11.37 | | | $ | 12.20 | | | $ | 9.49 | |
| Income (loss) from investment operations: | | | | | | | | | | | | | | | | | | | | | | | | |
| Net investment income (loss) | | | 0.18 | | | | 0.18 | (B) | | | 0.23 | | | | 0.10 | (B) | | | 0.13 | (B) | | | (0.06 | )(B) |
| Net realized and unrealized gains (losses) on investments | | | 1.02 | | | | 3.09 | | | | 2.42 | | | | (0.91 | ) | | | (0.93 | ) | | | 2.81 | |
| Total from investment operations | | | 1.20 | | | | 3.27 | | | | 2.65 | | | | (0.81 | ) | | | (0.80 | ) | | | 2.75 | |
| Distributions from: | | | | | | | | | | | | | | | | | | | | | | | | |
| Net investment income | | | (0.12 | ) | | | (0.23 | ) | | | (0.20 | ) | | | (0.11 | ) | | | (0.24 | ) | | | (0.04 | ) |
| Capital contribution | | | — | | | | — | | | | — | | | | — | | | | 0.21 | (C) | | | — | |
| Net asset value at end of period | | $ | 17.02 | | | $ | 15.94 | | | $ | 12.90 | | | $ | 10.45 | | | $ | 11.37 | | | $ | 12.20 | |
| Total return | | | 7.65 | % | | | 25.38 | % | | | 25.59 | % | | | (7.13 | )%(D) | | | (4.55 | )%(C) | | | 29.00 | % |
| Ratios and supplemental data: | | | | | | | | | | | | | | | | | | | | | | | | |
| Net assets at end of period (000's) | | $ | 47,319 | | | $ | 30,223 | | | $ | 16,238 | | | $ | 3,869 | | | $ | 6,288 | | | $ | 1,173 | |
| Ratio to average net assets: | | | | | | | | | | | | | | | | | | | | | | | | |
| Net expenses | | | 1.18 | % | | | 1.08 | % | | | 1.05 | % | | | 1.05 | %(E) | | | 1.05 | % | | | 1.05 | % |
| Gross expenses | | | 1.30 | % | | | 1.33 | % | | | 1.50 | % | | | 2.05 | %(E) | | | 1.46 | %(F) | | | 2.22 | %(F) |
| Net investment income (loss) | | | 1.27 | % | | | 1.23 | % | | | 1.90 | % | | | 3.86 | %(E) | | | 1.15 | % | | | (0.61 | )% |
| Portfolio turnover rate | | | 84 | % | | | 60 | % | | | 79 | % | | | 21 | %(D) | | | 207 | % | | | 152 | % |
| (A) | The Fund changed its fiscal year end from March 31 to June 30. |
| (B) | The net investment income (loss) per share is based on average shares outstanding for the period. |
| (C) | Impact of one time distribution of settlement funds from the Bank of America Fair Fund. If the distribution had not occurred the total return would have been lower. |
| (F) | Legal, printing and/or compliance audit expenses relating to civil litigation and certain regulatory actions in connection with market timing allegations were incurred, and the former advisor paid these expenses on behalf of the Funds. Had the former advisor not paid these expenses, the expenses for the Funds would have been higher than what is reflected in the financial highlights for the years ended March 31, 2012 and 2011. |
See accompanying Notes to Financial Statements.
Financial Highlights (Continued)
Touchstone Large Cap Fund—Class A
Selected Data for a Share Outstanding Throughout Each Period
| | | Period | |
| | | Ended | |
| | | June 30, | |
| | | 2015(A) | |
| Net asset value at beginning of period | | $ | 10.00 | |
| Income from investment operations: | | | | |
| Net investment income | | | 0.09 | (B) |
| Net realized and unrealized gains on investments | | | 0.57 | |
| Total from investment operations | | | 0.66 | |
| Distributions from: | | | | |
| Net investment income | | | (0.01 | ) |
| Net asset value at end of period | | $ | 10.65 | |
| Total return(C) | | | 6.57 | %(D) |
| Ratios and supplemental data: | | | | |
| Net assets at end of period (000's) | | $ | 2,013 | |
| Ratio to average net assets: | | | | |
| Net expenses | | | 1.12 | %(E) |
| Gross expenses | | | 4.17 | %(E) |
| Net investment income | | | 0.81 | %(E) |
| Portfolio turnover rate | | | 8 | %(D)(F) |
Touchstone Large Cap Fund—Class C
Selected Data for a Share Outstanding Throughout Each Period
| | | Period | |
| | | Ended | |
| | | June 30, | |
| | | 2015(A) | |
| Net asset value at beginning of period | | $ | 10.00 | |
| Income from investment operations: | | | | |
| Net investment income | | | 0.01 | (B) |
| Net realized and unrealized gains on investments | | | 0.59 | |
| Total from investment operations | | | 0.60 | |
| Net asset value at end of period | | $ | 10.60 | |
| Total return(C) | | | 6.00 | %(D) |
| Ratios and supplemental data: | | | | |
| Net assets at end of period (000's) | | $ | 1,370 | |
| Ratio to average net assets: | | | | |
| Net expenses | | | 1.87 | %(E) |
| Gross expenses | | | 4.34 | %(E) |
| Net investment income | | | 0.06 | %(E) |
| Portfolio turnover rate | | | 8 | %(D)(F) |
| (A) | Represents the period from commencement of operations (July 9, 2014) through June 30, 2015. |
| (B) | The net investment income per share is based on average shares outstanding for the period. |
| (C) | Total returns shown exclude the effect of applicable sales loads. If these charges were included, the returns would be lower. |
| (F) | Portfolio turnover excludes the purchases and sales of the Touchstone Capital Growth Fund merger on June 26, 2015. If these transactions were included, portfolio turnover would have been higher. |
See accompanying Notes to Financial Statements.
Financial Highlights (Continued)
Touchstone Large Cap Fund—Class Y
Selected Data for a Share Outstanding Throughout Each Period
| | | Period | |
| | | Ended | |
| | | June 30, | |
| | | 2015(A) | |
| Net asset value at beginning of period | | $ | 10.00 | |
| Income from investment operations: | | | | |
| Net investment income | | | 0.11 | (B) |
| Net realized and unrealized gains on investments | | | 0.57 | |
| Total from investment operations | | | 0.68 | |
| Distributions from: | | | | |
| Net investment income | | | (0.01 | ) |
| Net asset value at end of period | | $ | 10.67 | |
| Total return | | | 6.80 | %(C) |
| Ratios and supplemental data: | | | | |
| Net assets at end of period (000's) | | $ | 194,226 | |
| Ratio to average net assets: | | | | |
| Net expenses | | | 0.87 | %(D) |
| Gross expenses | | | 1.19 | %(D) |
| Net investment income | | | 1.06 | %(D) |
| Portfolio turnover rate | | | 8 | %(C)(E) |
Touchstone Large Cap Fund—Institutional Class
Selected Data for a Share Outstanding Throughout Each Period
| | | Period | |
| | | Ended | |
| | | June 30, | |
| | | 2015(A) | |
| Net asset value at beginning of period | | $ | 10.00 | |
| Income from investment operations: | | | | |
| Net investment income | | | 0.12 | (B) |
| Net realized and unrealized gains on investments | | | 0.57 | |
| Total from investment operations | | | 0.69 | |
| Distributions from: | | | | |
| Net investment income | | | (0.01 | ) |
| Net asset value at end of period | | $ | 10.68 | |
| Total return | | | 6.92 | %(C) |
| Ratios and supplemental data: | | | | |
| Net assets at end of period (000's) | | $ | 98,889 | |
| Ratio to average net assets: | | | | |
| Net expenses | | | 0.77 | %(D) |
| Gross expenses | | | 0.98 | %(D) |
| Net investment income | | | 1.16 | %(D) |
| Portfolio turnover rate | | | 8 | %(C)(E) |
| (A) | Represents the period from commencement of operations (July 9, 2014) through June 30, 2015. |
| (B) | The net investment income per share is based on average shares outstanding for the period. |
| (E) | Portfolio turnover excludes the purchases and sales of the Touchstone Capital Growth Fund merger on June 26, 2015. If these transactions were included, portfolio turnover would have been higher. |
See accompanying Notes to Financial Statements.
Financial Highlights (Continued)
Touchstone Small Cap Value Opportunities Fund—Class A
Selected Data for a Share Outstanding Throughout Each Period
| | | | | | Three | | | | |
| | | | | | Months | | | | |
| | | | | | Ended | | | | |
| | | Year Ended June 30, | | | June 30, | | | Year Ended March 31, | |
| | | 2015 | | | 2014 | | | 2013 | | | 2012 | | | 2012 | | | 2011 | |
| Net asset value at beginning of period | | $ | 20.92 | | | $ | 18.75 | | | $ | 16.97 | | | $ | 18.08 | | | $ | 19.06 | | | $ | 16.43 | |
| Income (loss) from investment operations: | | | | | | | | | | | | | | | | | | | | | | | | |
| Net investment income (loss) | | | 0.04 | | | | (0.05 | ) | | | 0.09 | (A) | | | (0.01 | ) | | | (0.06 | )(A) | | | (0.08 | )(A) |
| Net realized and unrealized gains (losses) on investments | | | 0.39 | | | | 5.88 | (B) | | | 3.66 | | | | (0.57 | ) | | | 0.04 | | | | 2.71 | |
| Total from investment operations | | | 0.43 | | | | 5.83 | | | | 3.75 | | | | (0.58 | ) | | | (0.02 | ) | | | 2.63 | |
| Distributions from: | | | | | | | | | | | | | | | | | | | | | | | | |
| Net investment income | | | (0.31 | ) | | | (0.02 | ) | | | (0.09 | ) | | | — | | | | — | | | | — | |
| Realized capital gains | | | (2.37 | ) | | | (3.64 | ) | | | (1.88 | ) | | | (0.53 | ) | | | (0.96 | ) | | | — | |
| Total distributions | | | (2.68 | ) | | | (3.66 | ) | | | (1.97 | ) | | | (0.53 | ) | | | (0.96 | ) | | | — | |
| Net asset value at end of period | | $ | 18.67 | | | $ | 20.92 | | | $ | 18.75 | | | $ | 16.97 | | | $ | 18.08 | | | $ | 19.06 | |
| Total return(C) | | | 2.68 | % | | | 33.35 | %(B) | | | 24.31 | % | | | (3.09 | )%(D) | | | 0.60 | % | | | 16.01 | % |
| Ratios and supplemental data: | | | | | | | | | | | | | | | | | | | | | | | | |
| Net assets at end of period (000's) | | $ | 15,219 | | | $ | 13,332 | | | $ | 1,309 | | | $ | 2,023 | | | $ | 2,251 | | | $ | 3,068 | |
| Ratio to average net assets: | | | | | | | | | | | | | | | | | | | | | | | | |
| Net expenses | | | 1.45 | % | | | 1.50 | % | | | 1.50 | % | | | 1.50 | %(E) | | | 1.50 | % | | | 1.50 | % |
| Gross expenses | | | 1.70 | % | | | 1.93 | % | | | 2.46 | % | | | 3.31 | %(E) | | | 2.27 | %(F) | | | 2.10 | %(F) |
| Net investment income (loss) | | | 0.31 | % | | | (0.09 | )% | | | 0.53 | % | | | (0.16 | )%(E) | | | (0.34 | )% | | | (0.46 | )% |
| Portfolio turnover rate | | | 57 | % | | | 73 | % | | | 95 | % | | | 18 | %(D) | | | 49 | % | | | 55 | % |
Touchstone Small Cap Value Opportunities Fund—Class C
Selected Data for a Share Outstanding Throughout Each Period
| | | | | | | | | | | | Period | |
| | | | | | | | | | | | Ended | |
| | | Year Ended June 30, | | | June 30, | |
| | | 2015 | | | 2014 | | | 2013 | | | 2012(G) | |
| Net asset value at beginning of period | | $ | 20.70 | | | $ | 18.69 | | | $ | 16.95 | | | $ | 17.58 | |
| Income (loss) from investment operations: | | | | | | | | | | | | | | | | |
| Net investment income (loss) | | | 0.03 | | | | (0.14 | ) | | | (0.04 | )(A) | | | (0.03 | ) |
| Net realized and unrealized gains (losses) on investments | | | 0.25 | | | | 5.79 | (B) | | | 3.66 | | | | (0.07 | ) |
| Total from investment operations | | | 0.28 | | | | 5.65 | | | | 3.62 | | | | (0.10 | ) |
| Distributions from: | | | | | | | | | | | | | | | | |
| Net investment income | | | (0.27 | ) | | | — | | | | — | | | | — | |
| Realized capital gains | | | (2.37 | ) | | | (3.64 | ) | | | (1.88 | ) | | | (0.53 | ) |
| Total distributions | | | (2.64 | ) | | | (3.64 | ) | | | (1.88 | ) | | | (0.53 | ) |
| Net asset value at end of period | | $ | 18.34 | | | $ | 20.70 | | | $ | 18.69 | | | $ | 16.95 | |
| Total return(C) | | | 1.93 | % | | | 32.43 | %(B) | | | 23.44 | % | | | (0.51 | )%(D) |
| Ratios and supplemental data: | | | | | | | | | | | | | | | | |
| Net assets at end of period (000's) | | $ | 2,077 | | | $ | 558 | | | $ | 36 | | | $ | 2 | |
| Ratio to average net assets: | | | | | | | | | | | | | | | | |
| Net expenses | | | 2.19 | % | | | 2.25 | % | | | 2.25 | % | | | 2.25 | %(E) |
| Gross expenses | | | 2.63 | % | | | 5.09 | % | | | 25.27 | % | | | 942.58 | %(E) |
| Net investment income (loss) | | | (0.44 | )% | | | (0.84 | )% | | | (0.22 | )% | | | (0.95 | )%(E) |
| Portfolio turnover rate | | | 57 | % | | | 73 | % | | | 95 | % | | | 18 | %(D) |
| (A) | The net investment income (loss) per share is based on average shares outstanding for the period. |
| (B) | Impact of payment from affiliate was less than $0.01 per share and 0.01%, respectively. |
| (C) | Total returns shown exclude the effect of applicable sales loads. If these charges were included, the returns would be lower. |
| (F) | Legal, printing and/or compliance audit expenses relating to civil litigation and certain regulatory actions in connection with market timing allegations were incurred, and the former advisor paid these expenses on behalf of the Funds. Had the former advisor not paid these expenses, the expenses for the Funds would have been higher than what is reflected in the financial highlights for the years ended March 31, 2012 and 2011. |
| (G) | Represents the period from commencement of operations (April 16, 2012) through June 30, 2012. |
See accompanying Notes to Financial Statements.
Financial Highlights (Continued)
Touchstone Small Cap Value Opportunities Fund— Class Y
Selected Data for a Share Outstanding Throughout Each Period
| | | | | | Three | | | | |
| | | | | | Months | | | | |
| | | | | | Ended | | | | |
| | | Year Ended June 30, | | | June 30, | | | Year Ended March 31, | |
| | | 2015 | | | 2014 | | | 2013 | | | 2012 | | | 2012 | | | 2011 | |
| Net asset value at beginning of period | | $ | 21.90 | | | $ | 19.45 | | | $ | 17.51 | | | $ | 18.62 | | | $ | 19.55 | | | $ | 16.80 | |
| Income (loss) from investment operations: | | | | | | | | | | | | | | | | | | | | | | | | |
| Net investment income (loss) | | | 0.09 | | | | 0.04 | | | | 0.15 | (A) | | | 0.01 | | | | (0.02 | )(A) | | | (0.04 | )(A) |
| Net realized and unrealized gains (losses) on investments | | | 0.41 | | | | 6.11 | (B) | | | 3.77 | | | | (0.59 | ) | | | 0.05 | | | | 2.79 | |
| Total from investment operations | | | 0.50 | | | | 6.15 | | | | 3.92 | | | | (0.58 | ) | | | 0.03 | | | | 2.75 | |
| Distributions from: | | | | | | | | | | | | | | | | | | | | | | | | |
| Net investment income | | | (0.34 | ) | | | (0.06 | ) | | | (0.10 | ) | | | — | | | | — | | | | — | |
| Realized capital gains | | | (2.37 | ) | | | (3.64 | ) | | | (1.88 | ) | | | (0.53 | ) | | | (0.96 | ) | | | — | |
| Total distributions | | | (2.71 | ) | | | (3.70 | ) | | | (1.98 | ) | | | (0.53 | ) | | | (0.96 | ) | | | — | |
| Net asset value at end of period | | $ | 19.69 | | | $ | 21.90 | | | $ | 19.45 | | | $ | 17.51 | | | $ | 18.62 | | | $ | 19.55 | |
| Total return | | | 2.92 | % | | | 33.80 | %(B) | | | 24.68 | % | | | (3.05 | )%(C) | | | 0.85 | % | | | 16.37 | % |
| Ratios and supplemental data: | | | | | | | | | | | | | | | | | | | | | | | | |
| Net assets at end of period (000's) | | $ | 149,852 | | | $ | 140,689 | | | $ | 96,584 | | | $ | 82,861 | | | $ | 87,984 | | | $ | 98,269 | |
| Ratio to average net assets: | | | | | | | | | | | | | | | | | | | | | | | | |
| Net expenses | | | 1.20 | % | | | 1.17 | % | | | 1.19 | % | | | 1.22 | %(D) | | | 1.25 | % | | | 1.25 | % |
| Gross expenses | | | 1.26 | % | | | 1.24 | % | | | 1.29 | % | | | 1.40 | %(D) | | | 1.27 | %(E) | | | 1.26 | %(E) |
| Net investment income (loss) | | | 0.55 | % | | | 0.24 | % | | | 0.84 | % | | | 0.12 | %(D) | | | (0.09 | )% | | | (0.23 | )% |
| Portfolio turnover rate | | | 57 | % | | | 73 | % | | | 95 | % | | | 18 | %(C) | | | 49 | % | | | 55 | % |
Touchstone Small Cap Value Opportunities Fund—Institutional Class
Selected Data for a Share Outstanding Throughout Each Period
| | | | | | Three | | | | |
| | | | | | Months | | | | |
| | | | | | Ended | | | | |
| | | Year Ended June 30, | | | June 30, | | | Year Ended March 31, | |
| | | 2015 | | | 2014 | | | 2013 | | | 2012 | | | 2012 | | | 2011 | |
| Net asset value at beginning of period | | $ | 22.13 | | | $ | 19.62 | | | $ | 17.63 | | | $ | 18.75 | | | $ | 19.65 | | | $ | 16.87 | |
| Income (loss) from investment operations: | | | | | | | | | | | | | | | | | | | | | | | | |
| Net investment income (loss) | | | 0.16 | | | | 0.04 | | | | 0.17 | (A) | | | 0.01 | | | | 0.01 | (A) | | | (0.01 | )(A) |
| Net realized and unrealized gains (losses) on investments | | | 0.37 | | | | 6.18 | (B) | | | 3.82 | | | | (0.60 | ) | | | 0.05 | | | | 2.79 | |
| Total from investment operations | | | 0.53 | | | | 6.22 | | | | 3.99 | | | | (0.59 | ) | | | 0.06 | | | | 2.78 | |
| Distributions from: | | | | | | | | | | | | | | | | | | | | | | | | |
| Net investment income | | | (0.35 | ) | | | (0.07 | ) | | | (0.12 | ) | | | — | | | | — | | | | — | |
| Realized capital gains | | | (2.37 | ) | | | (3.64 | ) | | | (1.88 | ) | | | (0.53 | ) | | | (0.96 | ) | | | — | |
| Total distributions | | | (2.72 | ) | | | (3.71 | ) | | | (2.00 | ) | | | (0.53 | ) | | | (0.96 | ) | | | — | |
| Net asset value at end of period | | $ | 19.94 | | | $ | 22.13 | | | $ | 19.62 | | | $ | 17.63 | | | $ | 18.75 | | | $ | 19.65 | |
| Total return | | | 3.04 | % | | | 33.90 | %(B) | | | 24.82 | % | | | (3.04 | )%(C) | | | 1.00 | % | | | 16.48 | % |
| Ratios and supplemental data: | | | | | | | | | | | | | | | | | | | | | | | | |
| Net assets at end of period (000's) | | $ | 31,318 | | | $ | 26,466 | | | $ | 8,096 | | | $ | 7,023 | | | $ | 19,066 | | | $ | 20,119 | |
| Ratio to average net assets: | | | | | | | | | | | | | | | | | | | | | | | | |
| Net expenses | | | 1.10 | % | | | 1.10 | % | | | 1.10 | % | | | 1.10 | %(D) | | | 1.10 | % | | | 1.10 | % |
| Gross expenses | | | 1.32 | % | | | 1.37 | % | | | 1.46 | % | | | 1.60 | %(D) | | | 1.18 | %(E) | | | 1.18 | %(E) |
| Net investment income (loss) | | | 0.66 | % | | | 0.31 | % | | | 0.93 | % | | | 0.24 | %(D) | | | 0.06 | % | | | (0.08 | )% |
| Portfolio turnover rate | | | 57 | % | | | 73 | % | | | 95 | % | | | 18 | %(C) | | | 49 | % | | | 55 | % |
| (A) | The net investment income (loss) per share is based on average shares outstanding for the period. |
| (B) | Impact of payment from affiliate was less than $0.01 per share and 0.01%, respectively. |
| (E) | Legal, printing and/or compliance audit expenses relating to civil litigation and certain regulatory actions in connection with market timing allegations were incurred, and the former advisor paid these expenses on behalf of the Funds. Had the former advisor not paid these expenses, the expenses for the Funds would have been higher than what is reflected in the financial highlights for the years ended March 31, 2012 and 2011. |
See accompanying Notes to Financial Statements.
Financial Highlights (Continued)
Touchstone Value Fund—Class A
Selected Data for a Share Outstanding Throughout Each Period
| | | | | | Three | | | | |
| | | | | | Months | | | | |
| | | | | | Ended | | | | |
| | | Year Ended June 30, | | | June 30, | | | Year Ended March 31, | |
| | | 2015 | | | 2014 | | | 2013 | | | 2012 | | | 2012 | | | 2011 | |
| Net asset value at beginning of period | | $ | 9.56 | | | $ | 8.02 | | | $ | 6.95 | | | $ | 7.14 | | | $ | 6.67 | | | $ | 6.17 | |
| Income (loss) from investment operations: | | | | | | | | | | | | | | | | | | | | | | | | |
| Net investment income | | | 0.16 | | | | 0.19 | | | | 0.15 | (A) | | | 0.03 | (A) | | | 0.12 | (A) | | | 0.08 | (A) |
| Net realized and unrealized gains (losses) on investments | | | 0.34 | | | | 1.53 | | | | 1.30 | | | | (0.16 | ) | | | 0.45 | | | | 0.50 | |
| Total from investment operations | | | 0.50 | | | | 1.72 | | | | 1.45 | | | | (0.13 | ) | | | 0.57 | | | | 0.58 | |
| Distributions from: | | | | | | | | | | | | | | | | | | | | | | | | |
| Net investment income | | | (0.11 | ) | | | (0.18 | ) | | | (0.15 | ) | | | (0.06 | ) | | | (0.10 | ) | | | (0.08 | ) |
| Realized capital gains | | | (0.17 | ) | | | — | | | | (0.23 | ) | | | — | | | | — | | | | — | |
| Total distributions | | | (0.28 | ) | | | (0.18 | ) | | | (0.38 | ) | | | (0.06 | ) | | | (0.10 | ) | | | (0.08 | ) |
| Net asset value at end of period | | $ | 9.78 | | | $ | 9.56 | | | $ | 8.02 | | | $ | 6.95 | | | $ | 7.14 | | | $ | 6.67 | |
| Total return(B) | | | 5.26 | % | | | 21.50 | % | | | 21.56 | % | | | (1.83 | )%(C) | | | 8.77 | % | | | 9.59 | % |
| Ratios and supplemental data: | | | | | | | | | | | | | | | | | | | | | | | | |
| Net assets at end of period (000's) | | $ | 55,539 | | | $ | 66,000 | | | $ | 53,433 | | | $ | 1,583 | | | $ | 1,606 | | | $ | 2,325 | |
| Ratio to average net assets: | | | | | | | | | | | | | | | | | | | | | | | | |
| Net expenses | | | 1.08 | % | | | 1.07 | % | | | 1.00 | % | | | 1.20 | %(D) | | | 1.20 | % | | | 1.20 | % |
| Gross expenses | | | 1.27 | % | | | 1.31 | % | | | 1.51 | % | | | 3.49 | %(D) | | | 1.96 | %(E) | | | 2.04 | %(E) |
| Net investment income | | | 1.54 | % | | | 2.13 | % | | | 1.96 | % | | | 1.68 | %(D) | | | 1.84 | % | | | 1.31 | % |
| Portfolio turnover rate | | | 20 | % | | | 26 | % | | | 110 | %(F) | | | 13 | %(C) | | | 15 | % | | | 13 | % |
Touchstone Value Fund—Class C
Selected Data for a Share Outstanding Throughout Each Period
| | | | | | Period | |
| | | | | | Ended | |
| | | Year Ended June 30, | | | June 30, | |
| | | 2015 | | | 2014 | | | 2013 | | | 2012(G) | |
| Net asset value at beginning of period | | $ | 9.55 | | | $ | 8.02 | | | $ | 6.95 | | | $ | 6.90 | |
| Income from investment operations: | | | | | | | | | | | | | | | | |
| Net investment income | | | 0.07 | | | | 0.11 | | | | 0.09 | (A) | | | 0.01 | (A) |
| Net realized and unrealized gains on investments | | | 0.35 | | | | 1.54 | | | | 1.30 | | | | 0.10 | |
| Total from investment operations | | | 0.42 | | | | 1.65 | | | | 1.39 | | | | 0.11 | |
| Distributions from: | | | | | | | | | | | | | | | | |
| Net investment income | | | (0.05 | ) | | | (0.12 | ) | | | (0.09 | ) | | | (0.06 | ) |
| Realized capital gains | | | (0.17 | ) | | | — | | | | (0.23 | ) | | | — | |
| Total distributions | | | (0.22 | ) | | | (0.12 | ) | | | (0.32 | ) | | | (0.06 | ) |
| Net asset value at end of period | | $ | 9.75 | | | $ | 9.55 | | | $ | 8.02 | | | $ | 6.95 | |
| Total return(B) | | | 4.41 | % | | | 20.61 | % | | | 20.62 | % | | | 1.56 | %(C) |
| Ratios and supplemental data: | | | | | | | | | | | | | | | | |
| Net assets at end of period (000's) | | $ | 6,932 | | | $ | 5,218 | | | $ | 3,025 | | | $ | 3 | |
| Ratio to average net assets: | | | | | | | | | | | | | | | | |
| Net expenses | | | 1.83 | % | | | 1.82 | % | | | 1.75 | % | | | 1.95 | %(D) |
| Gross expenses | | | 2.14 | % | | | 2.19 | % | | | 2.30 | % | | | 929.36 | %(D) |
| Net investment income | | | 0.79 | % | | | 1.38 | % | | | 1.21 | % | | | 0.93 | %(D) |
| Portfolio turnover rate | | | 20 | % | | | 26 | % | | | 110 | %(F) | | | 13 | %(C) |
| (A) | The net investment income per share is based on average shares outstanding for the period. |
| (B) | Total returns shown exclude the effect of applicable sales loads. If these charges were included, the returns would be lower. |
| (E) | Legal, printing and/or compliance audit expenses relating to civil litigation and certain regulatory actions in connection with market timing allegations were incurred, and the former advisor paid these expenses on behalf of the Funds. Had the former advisor not paid these expenses, the expenses for the Funds would have been higher than what is reflected in the financial highlights for the years ended March 31, 2012 and 2011. |
| (F) | Portfolio turnover excludes the purchases and sales of the Fifth Third Disciplined Large Cap Value Fund acquired on September 10, 2012. If these transactions were included, portfolio turnover would have been higher. |
| (G) | Represents the period from commencement of operations (April 16, 2012) through June 30, 2012. |
See accompanying Notes to Financial Statements.
Financial Highlights (Continued)
Touchstone Value Fund—Class Y
Selected Data for a Share Outstanding Throughout Each Period
| | | | | | Three | | | | |
| | | | | | Months | | | | |
| | | | | | Ended | | | | |
| | | Year Ended June 30, | | | June 30, | | | Year Ended March 31, | |
| | | 2015 | | | 2014 | | | 2013 | | | 2012 | | | 2012 | | | 2011 | |
| Net asset value at beginning of period | | $ | 9.59 | | | $ | 8.05 | | | $ | 6.97 | | | $ | 7.16 | | | $ | 6.69 | | | $ | 6.19 | |
| Income (loss) from investment operations: | | | | | | | | | | | | | | | | | | | | | | | | |
| Net investment income | | | 0.18 | | | | 0.21 | | | | 0.16 | (A) | | | 0.03 | (A) | | | 0.12 | (A) | | | 0.09 | (A) |
| Net realized and unrealized gains (losses) on investments | | | 0.35 | | | | 1.53 | | | | 1.32 | | | | (0.15 | ) | | | 0.47 | | | | 0.51 | |
| Total from investment operations | | | 0.53 | | | | 1.74 | | | | 1.48 | | | | (0.12 | ) | | | 0.59 | | | | 0.60 | |
| Distributions from: | | | | | | | | | | | | | | | | | | | | | | | | |
| Net investment income | | | (0.14 | ) | | | (0.20 | ) | | | (0.17 | ) | | | (0.07 | ) | | | (0.12 | ) | | | (0.10 | ) |
| Realized capital gains | | | (0.17 | ) | | | — | | | | (0.23 | ) | | | — | | | | — | | | | — | |
| Total distributions | | | (0.31 | ) | | | (0.20 | ) | | | (0.40 | ) | | | (0.07 | ) | | | (0.12 | ) | | | (0.10 | ) |
| Net asset value at end of period | | $ | 9.81 | | | $ | 9.59 | | | $ | 8.05 | | | $ | 6.97 | | | $ | 7.16 | | | $ | 6.69 | |
| Total return | | | 5.52 | % | | | 21.71 | % | | | 21.91 | % | | | (1.69 | )%(B) | | | 9.01 | % | | | 9.86 | % |
| Ratios and supplemental data: | | | | | | | | | | | | | | | | | | | | | | | | |
| Net assets at end of period (000's) | | $ | 104,668 | | | $ | 113,055 | | | $ | 99,398 | | | $ | 51,447 | | | $ | 87,546 | | | $ | 86,659 | |
| Ratio to average net assets: | | | | | | | | | | | | | | | | | | | | | | | | |
| Net expenses | | | 0.82 | % | | | 0.80 | % | | | 0.77 | % | | | 0.95 | %(C) | | | 0.95 | % | | | 0.95 | % |
| Gross expenses | | | 0.97 | % | | | 0.99 | % | | | 1.09 | % | | | 1.23 | %(C) | | | 1.03 | %(D) | | | 1.04 | %(D) |
| Net investment income | | | 1.80 | % | | | 2.39 | % | | | 2.19 | % | | | 1.93 | %(C) | | | 1.90 | % | | | 1.58 | % |
| Portfolio turnover rate | | | 20 | % | | | 26 | % | | | 110 | %(E) | | | 13 | %(B) | | | 15 | % | | | 13 | % |
Touchstone Value Fund—Institutional Class
Selected Data for a Share Outstanding Throughout Each Period
| | | | | | | | | | | | Three | | | | | | | |
| | | | | | | | | | | | Months | | | | | | | |
| | | | | | | | | | | | Ended | | | | | | | |
| | | Year Ended June 30, | | | June 30, | | | Year Ended March 31, | |
| | | 2015 | | | 2014 | | | 2013 | | | 2012 | | | 2012 | | | 2011 | |
| Net asset value at beginning of period | | $ | 9.57 | | | $ | 8.03 | | | $ | 6.96 | | | $ | 7.15 | | | $ | 6.68 | | | $ | 6.18 | |
| Income (loss) from investment operations: | | | | | | | | | | | | | | | | | | | | | | | | |
| Net investment income | | | 0.18 | | | | 0.21 | | | | 0.17 | (A) | | | 0.03 | (A) | | | 0.13 | (A) | | | 0.10 | (A) |
| Net realized and unrealized gains (losses) on investments | | | 0.36 | | | | 1.54 | | | | 1.31 | | | | (0.16 | ) | | | 0.46 | | | | 0.51 | |
| Total from investment operations | | | 0.54 | | | | 1.75 | | | | 1.48 | | | | (0.13 | ) | | | 0.59 | | | | 0.61 | |
| Distributions from: | | | | | | | | | | | | | | | | | | | | | | | | |
| Net investment income | | | (0.15 | ) | | | (0.21 | ) | | | (0.18 | ) | | | (0.06 | ) | | | (0.12 | ) | | | (0.11 | ) |
| Realized capital gains | | | (0.17 | ) | | | — | | | | (0.23 | ) | | | — | | | | — | | | | — | |
| Total distributions | | | (0.32 | ) | | | (0.21 | ) | | | (0.41 | ) | | | (0.06 | ) | | | (0.12 | ) | | | (0.11 | ) |
| Net asset value at end of period | | $ | 9.79 | | | $ | 9.57 | | | $ | 8.03 | | | $ | 6.96 | | | $ | 7.15 | | | $ | 6.68 | |
| Total return | | | 5.68 | % | | | 21.92 | % | | | 21.92 | % | | | (1.62 | )%(B) | | | 9.13 | % | | | 9.99 | % |
| Ratios and supplemental data: | | | | | | | | | | | | | | | | | | | | | | | | |
| Net assets at end of period (000's) | | $ | 248,381 | | | $ | 245,573 | | | $ | 186,990 | | | $ | 69,549 | | | $ | 33,727 | | | $ | 42,106 | |
| Ratio to average net assets: | | | | | | | | | | | | | | | | | | | | | | | | |
| Net expenses | | | 0.68 | % | | | 0.67 | % | | | 0.67 | % | | | 0.85 | %(C) | | | 0.85 | % | | | 0.85 | % |
| Gross expenses | | | 0.86 | % | | | 0.87 | % | | | 0.99 | % | | | 1.09 | %(C) | | | 0.88 | %(D) | | | 0.89 | %(D) |
| Net investment income | | | 1.94 | % | | | 2.52 | % | | | 2.29 | % | | | 2.04 | %(C) | | | 2.00 | % | | | 1.67 | % |
| Portfolio turnover rate | | | 20 | % | | | 26 | % | | | 110 | %(E) | | | 13 | %(B) | | | 15 | % | | | 13 | % |
| (A) | The net investment income per share is based on average shares outstanding for the period. |
| (D) | Legal, printing and/or compliance audit expenses relating to civil litigation and certain regulatory actions in connection with market timing allegations were incurred, and the former advisor paid these expenses on behalf of the Funds. Had the former advisor not paid these expenses, the expenses for the Funds would have been higher than what is reflected in the financial highlights for the years ended March 31, 2012 and 2011. |
| (E) | Portfolio turnover excludes the purchases and sales of the Fifth Third Disciplined Large Cap Value Fund acquired on September 10, 2012. If these transactions were included, portfolio turnover would have been higher. |
See accompanying Notes to Financial Statements.
Notes to Financial Statements
June 30, 2015
1. Organization
The Touchstone Strategic Trust (the “Trust”) is registered under the Investment Company Act of 1940, as amended (the “1940 Act”), as an open-end management investment company. The Trust was established as a Massachusetts business trust pursuant to a Declaration of Trust dated November 18, 1982. The Trust consists of seventeen funds including the following four funds (individually, a “Fund”, and collectively, the “Funds”):
Touchstone International Small Cap Fund (“International Small Cap Fund”)
Touchstone Large Cap Fund (“Large Cap Fund”)
Touchstone Small Cap Value Opportunities Fund (“Small Cap Value Opportunities Fund”)
Touchstone Value Fund (“Value Fund”)
Each Fund is diversified, with the exception of the Large Cap Fund, which is non-diversified.
The Declaration of Trust permits the Trust to issue an unlimited number of shares of beneficial interest of each Fund. The Funds are registered to offer the following classes of shares: Class A shares, Class C shares, Class Y shares, and Institutional Class shares. The assets of each Fund are segregated, and a shareholder’s interest is limited to the Fund in which shares are held. The Funds’ prospectus provides a description of each Fund’s investment goals, policies, and strategies along with information on the classes of shares currently being offered.
2. Significant Accounting Policies
The following is a summary of the Funds’ significant accounting policies:
Each Fund is an investment company that follows the accounting and reporting guidance of Accounting Standards Codification Topic 946 applicable to investment companies.
Security valuation and fair value measurements — U.S. generally accepted accounting principles (“U.S. GAAP”) define fair value as the price the Funds would receive to sell an asset or pay to transfer a liability in an orderly transaction between market participants at the measurement date. All investments in securities are recorded at their estimated fair value. The Funds define the term “market value”, as used throughout this report, as the estimated fair value. The Funds use various methods to measure fair value of their portfolio securities on a recurring basis. U.S. GAAP fair value measurement standards require disclosure of a hierarchy that prioritizes inputs to valuation methods. These inputs are summarized in the three broad levels listed below:
| | • | Level 1 | – | quoted prices in active markets for identical securities |
| | • | Level 2 | – | other significant observable inputs (including quoted prices for similar securities, interest rates, prepayment speeds, credit risk, etc.) |
| | • | Level 3 | – | significant unobservable inputs (including a Fund’s own assumptions in determining the fair value of investments) |
The inputs or methodology used for valuing securities are not necessarily an indication of the risk associated with investing in those securities. For example, money market instruments are valued using amortized cost, in accordance with rules under the 1940 Act. Generally, amortized cost approximates the current fair value of a security, but since the value is not obtained from a quoted price in an active market, such securities are reflected as Level 2.
The aggregate value by input level, as of June 30, 2015, for each Fund’s investments, as well as a reconciliation of assets for which significant unobservable inputs (Level 3) were used in determining value, if applicable, is included in the Fund’s Portfolio of Investments, which also includes a breakdown of the Fund’s investments by geographic or sector allocation. The Funds did not hold any Level 3 categorized securities during the year ended June 30, 2015.
Notes to Financial Statements (Continued)
Changes in valuation techniques may result in transfers into or out of an investment’s assigned level within the hierarchy. All transfers in and out of the levels are recognized at the value at the end of the period. During the year ended June 30, 2015, there were no transfers between Levels 1, 2 and 3 for all Funds, except as shown in the Portfolio of Investments for the International Small Cap Fund.
The Funds’ portfolio securities are valued as of the close of the regular session of trading on the New York Stock Exchange (“NYSE”) (currently 4:00 p.m., Eastern Time). Portfolio securities traded on stock exchanges are valued at the last reported sale price, official close price, or last bid price if no sales are reported. Portfolio securities quoted by NASDAQ are valued at the NASDAQ Official Closing Price (“NOCP”) or from the primary exchange on which the security trades. To the extent these securities are actively traded, they are categorized in Level 1 of the fair value hierarchy. Shares of open-end mutual funds in which the Funds invest are valued at their respective net asset values (“NAV”) as reported by the underlying funds and are categorized in Level 1. Money market instruments and other debt securities with remaining maturities of 60 days or less are valued at amortized cost, provided such amount approximates market value and are categorized in Level 2. While this method provides consistency in valuation (and may only be used if it approximates market value), it may result in periods during which value, as determined by amortized cost, is higher or lower than the price that would be received if the Fund sold the investment.
Securities mainly traded on a non-U.S. exchange or denominated in foreign currency are generally valued according to the preceding closing values on that exchange, translated to U.S. dollars using currency exchange rates as of the close of regular trading on the NYSE, and generally categorized in Level 1. However, if an event that may change the value of a security occurs after the time that the closing value on the non-U.S. exchange was determined, but before the close of regular trading on the NYSE, the security may be priced based on fair value and generally categorized in Level 2. This may cause the value of the security, if held on the books of the Fund to be different from the closing value on the non-U.S. exchange and may affect the calculation of that Fund’s NAV.
The Funds may use fair value pricing under the following circumstances, among others:
| • | If the value of a security has been materially affected by events occurring before the Funds’ pricing time but after the close of the primary markets on which the security is traded. |
| • | If the exchange on which a portfolio security is principally traded closes early or if trading in a particular portfolio security was halted during the day and did not resume prior to the Funds’ NAV calculation. |
| • | If a security is so thinly traded that reliable market quotations are unavailable due to infrequent trading. |
| • | If the validity of market quotations is not reliable. |
Securities held by the Funds that do not have readily available market quotations, significant observable inputs, or securities for which the available market quotations are not reliable, are priced at their estimated fair value using procedures approved by the Funds’ Board of Trustees and are generally categorized in Level 3.
Investment companies — Certain Funds may invest in securities of other investment companies, including exchange-traded funds (“ETFs”), open-end funds, and closed-end funds. Open-end funds are investment companies that issue new shares continuously and redeem shares daily. Closed-end funds are investment companies that typically issue a fixed number of shares that trade on a securities exchange or over-the-counter. An ETF is an investment company that typically seeks to track the performance of an index by holding in its portfolio shares of all the companies, or a representative sample of the companies, that are components of a particular index. ETFs are traded on a securities exchange based on their market value. The risks of investment in other investment companies typically reflect the risks of the types of securities in which the other investment companies invest. Investments in ETFs and closed-end funds are subject to the additional risk that their shares may trade at a
Notes to Financial Statements (Continued)
premium or discount to their NAV. When a Fund invests in another investment company, shareholders of the Fund indirectly bear their proportionate share of the other investment company’s fees and expenses, including operating, registration, trustee, licensing and marketing, as well as their share of the Fund’s fees and expenses.
New accounting pronouncement — In June 2014, the Financial Accounting Standards Board (“FASB”) issued Accounting Standards Update (“ASU”) No. 2014-11, “Repurchase-to-Maturity, Repurchase Financings, and Disclosures”. A repurchase-to-maturity transaction is one where the repurchase agreement settles at the same time as the maturity of the transferred financial asset. These transactions, unlike other repurchase agreements, were accounted for as sales and purchases instead of being treated as secured borrowings. This ASU changes that accounting practice and treats all repurchase agreements as secured borrowings. The ASU additionally requires two new disclosures which are intended to: a) disclose information on transferred assets accounted for as sales in transactions that are economically similar to repurchase agreements, and b) provide increased transparency about the types of collateral pledged in repurchase agreements and similar transactions accounted for as secured borrowings. The ASU impacts all entities that enter into repurchase-to-maturity transactions, entities that account for these transactions as a sale and a purchase, and entities that engage in repurchase agreements and securities lending transactions. The new disclosures are required to be presented for annual periods beginning after December 15, 2014, and interim periods beginning after March 15, 2015. Management is currently evaluating the impact these updates may have on the Funds’ financial statements and disclosures.
Foreign currency translation — The books and records of the Funds are maintained in U.S. dollars and translated into U.S. dollars on the following basis:
| (1) | market value of investment securities, assets and liabilities at the current rate of exchange on the valuation date; and |
| (2) | purchases and sales of investment securities, income, and expenses at the relevant rates of exchange prevailing on the respective dates of such transactions. |
The Funds do not isolate that portion of gains and losses on investments in equity securities that is due to changes in the foreign exchange rates from that which is due to changes in market prices of equity securities.
Real Estate Investment Trusts — The Funds may invest in real estate investment trusts (“REITs”) that involve risks not associated with investing in stocks. Risks include declines in the value of real estate, general and economic conditions, changes in the value of the underlying property and defaults by borrowers. The value of assets in the real estate industry may go through cycles of relative underperformance and outperformance in comparison to equity securities markets in general. Dividend income is recorded using management’s estimate of the income included in distributions received from REIT investments. The actual amounts of income, return of capital and capital gains are only determined by each REIT after its fiscal year-end and may differ from the estimated amount. Estimates of income are adjusted in the Funds to the actual amounts when the amounts are determined.
Portfolio securities loaned — Each Fund may lend its portfolio securities. Lending portfolio securities exposes a Fund to the risk that the borrower may fail to return the loaned securities or may not be able to provide additional collateral or that the Funds may experience delays in recovery of the loaned securities or loss of rights in the collateral if the borrower fails financially. To minimize these risks, the borrower must agree to maintain cash collateral with the Funds’ custodian. The loaned securities are secured by collateral valued at least equal, at all times, to the market value of the loaned securities plus accrued interest, if any. When the collateral falls below specified amounts, the lending agent will use its best effort to obtain additional collateral on the next business day to meet required amounts under the security lending agreement. The cash collateral is reinvested by the Funds’ custodian into an approved investment vehicle. The approved investment vehicle is subject to market risk.
Notes to Financial Statements (Continued)
As of June 30, 2015, the following Funds loaned securities and received collateral as follows:
| | | Market | | | Market | |
| | | Value of | | | Value of | |
| | | Securities | | | Collateral | |
| Fund | | Loaned | | | Received | |
| International Small Cap Fund | | $ | 7,339,398 | | | $ | 7,748,806 | |
| Small Cap Value Opportunities Fund | | | 23,578,159 | | | | 24,050,948 | |
| Value Fund | | | 6,022,971 | | | | 6,060,959 | |
All cash collateral is received, held, and administered by the Funds’ custodian for the benefit of the lending Fund in its custody account or other account established for the purpose of holding collateral.
Funds participating in securities lending receive compensation in the form of fees. Securities lending income is derived from lending long securities from the Funds to creditworthy approved borrowers at rates that are determined based on trading volumes, float, short-term interest rates and market liquidity. A lending Fund retains the interest or dividends on the investment of any cash received as collateral. The lending Fund continues to receive interest or dividends on the loaned securities.
Unrealized gain or loss on the market value of the loaned securities that may occur during the term of the loan is recognized by the lending Fund. The lending Fund has the right under the lending agreement to recover the securities from the borrower on demand.
Share valuation — The NAV per share of each class of shares of each Fund is calculated daily by dividing the total value of a Fund’s assets attributable to that class, less liabilities attributable to that class, by the number of outstanding shares of that class.
The maximum offering price per share of Class A shares of the Funds is equal to the NAV per share plus a sales load equal to 6.10% of the NAV (or 5.75% of the offering price). There is no sales load on purchases of $1 million or more of Class A shares. The maximum offering price per share of Classes C, Y, and Institutional Class shares of the Funds is equal to the NAV per share.
The redemption price per share of each class of shares of the Funds is generally equal to the NAV per share. However, Class A redemptions that were part of a no-load $1 million subscription may be subject to a contingent deferred sales charge (“CDSC”) of up to 1.00% if redeemed within a one-year period from the date of purchase. Additionally, purchases of Class C shares of the Funds are subject to a CDSC of 1.00%. The CDSC will be assessed on an amount equal to the lesser of (1) the NAV at the time of purchase of the shares being redeemed or (2) the NAV of such shares being redeemed if redeemed within a one-year period from the date of purchase.
Investment income — Dividend income from securities is recognized on the ex-dividend date, net of foreign withholding taxes, if any, which are reduced by any amounts reclaimable by the Funds, where applicable. Interest income from securities is recorded on the basis of interest accrued, premium amortized and discount accreted.
Distributions to shareholders — Each Fund intends to distribute to its shareholders substantially all of its income and capital gains. Each Fund, except the Value Fund, declares and distributes net investment income, if any, annually, as a dividend to shareholders. The Value Fund declares and distributes net investment income, if any, semi-annually, as a dividend to shareholders. Each Fund makes distributions of capital gains, if any, at least annually, net of applicable capital loss carryforwards. Income distributions and capital gain distributions are determined in accordance with income tax regulations. Recognition of the Funds’ net investment income that invest in underlying funds is affected by the timing of dividend declarations by those underlying funds.
Allocations — Investment income earned, realized capital gains and losses, and unrealized appreciation and depreciation for a Fund are allocated daily to each class of shares based upon its proportionate share of total net assets of the Fund. Class-specific expenses are charged directly to the class incurring the expense. Common
Notes to Financial Statements (Continued)
expenses, which are not attributable to a specific class, are allocated daily to each class of shares based upon their proportionate share of total net assets of the Fund. Expenses not directly billed to a Fund are allocated proportionally among all Funds in the Trust, and, if applicable, in Touchstone Investment Trust, Touchstone Institutional Funds Trust, Touchstone Variable Series Trust, Touchstone Funds Group Trust, and Touchstone Tax-Free Trust (collectively with the Trust, “Touchstone Fund Complex”), daily in relation to net assets of each Fund or another reasonable measure.
Security transactions — Security transactions are reflected for financial reporting purposes as of the trade date. Realized gains and losses on sales of portfolio securities are calculated using the identified cost basis.
Estimates — The preparation of financial statements in conformity with U.S. GAAP requires management to make estimates and assumptions that affect the reported amounts of assets and liabilities and disclosure of contingent assets and liabilities at the date of the financial statements and the reported amounts of income and expenses during the reporting period. Actual results could differ from those estimates.
3. Investment Transactions
Investment transactions (excluding short-term investments and U.S. Government securities) were as follows for the year ended June 30, 2015:
| | | | | | | | | Small Cap | | | | |
| | | International | | | | | | Value | | | | |
| | | Small Cap | | | Large Cap | | | Opportunities | | | Value | |
| | | Fund | | | Fund | | | Fund | | | Fund | |
| Purchases of investment securities | | $ | 212,527,410 | | | $ | 115,634,115 | | | $ | 120,169,207 | | | $ | 84,388,884 | |
| Proceeds from sales and maturities | | $ | 139,789,652 | | | $ | 5,348,704 | | | $ | 105,441,621 | | | $ | 109,679,174 | |
There were no purchases or proceeds from sales and maturities of U.S. Government securities by the Funds for the year ended June 30, 2015.
4. Transactions with Affiliates and Other Related Parties
Certain officers of the Trust are also officers of Touchstone Advisors, Inc. (the “Advisor”), Touchstone Securities, Inc. (the “Underwriter”), or BNY Mellon Investment Servicing (U.S.) Inc. (“BNY Mellon”), the Sub-Administrator and Transfer Agent to the Funds. Such officers receive no compensation from the Trust. The Advisor and the Underwriter are each wholly-owned, indirect subsidiaries of Western & Southern Financial Group, Inc.
On behalf of the Funds, the Advisor pays each Independent Trustee a quarterly retainer plus additional retainers to the Lead Independent Trustee and the chairs of each standing committee. Interested Trustees do not receive compensation from the Funds. Each Independent Trustee also receives compensation for each board meeting and committee meeting attended. Each standing committee chair receives additional compensation for each committee meeting that he or she oversees. The Advisor is reimbursed by the Funds for the Independent Trustees’ compensation and out-of-pocket expenses relating to their services. The Funds accrued Trustee-related expenses of $51,012 for the year ended June 30, 2015.
Management & Expense Limitation Agreements
The Advisor provides general investment supervisory services for the Funds, under terms of an advisory agreement (the “Advisory Agreement”). Under the Advisory Agreement, each Fund pays the Advisor a fee, which is computed and accrued daily and paid monthly, at an annual rate based on average daily net assets of each Fund as shown in the table below.
| Touchstone International Small Cap Fund | 0.95% on the first $300 million |
Notes to Financial Statements (Continued)
| | 0.90% on the next $200 million |
| | 0.85% on the next $250 million |
| | 0.80% on the next $250 million |
| | 0.75% on the next $500 million |
| | 0.70% on the next $500 million |
| | 0.65% on such assets over $2 billion |
| Touchstone Large Cap Fund | 0.70% on the first $500 million |
| | 0.64% on the next $500 million |
| | 0.60% on such assets over $1 billion |
| Touchstone Small Cap Value Opportunities Fund | 0.95% on the first $300 million |
| | 0.90% on the next $200 million |
| | 0.85% on such assets over $500 million |
| Touchstone Value Fund | 0.65% |
The Advisor has entered into investment sub-advisory agreements with the following parties (each, a “Sub-Advisor”):
| Barrow, Hanley, Mewhinney & Strauss, LLC | The London Company |
| Value Fund | Large Cap Fund |
| | |
| Copper Rock Capital Partners LLC | Thompson Siegel & Walmsley LLC |
| International Small Cap Fund | Small Cap Value Opportunities Fund |
The Advisor, not the Funds, pays the sub-advisory fees to each Sub-Advisor.
The Advisor entered into an expense limitation agreement (the “Expense Limitation Agreement”) to contractually limit operating expenses of the Funds, excluding: dividend and interest expenses relating to short sales; interest; taxes; brokerage commissions and other transactions costs; portfolio transactions and investment related expenses; other expenditures which are capitalized in accordance with U.S. GAAP; the cost of “Acquired Fund Fees and Expenses”, if any; and other extraordinary expenses not incurred in the ordinary course of business. The maximum operating expense limit in any year with respect to the Funds is based on a percentage of the average daily net assets of the Funds. The Advisor has agreed to separately waive class-level expenses, advisory fees and administration fees, and to reimburse expenses in order to maintain the following expense limitations for the Funds:
| | | | | | | | | | | | Institutional | |
| Fund | | Class A | | | Class C | | | Class Y | | | Class | |
| International Small Cap Fund | | | 1.55 | % | | | 2.30 | % | | | 1.30 | % | | | 1.18 | % |
| Large Cap Fund | | | 1.12 | % | | | 1.87 | % | | | 0.87 | % | | | 0.77 | % |
| Small Cap Value Opportunities Fund* | | | 1.43 | % | | | 2.18 | % | | | 1.18 | % | | | 1.10 | % |
| Value Fund | | | 1.08 | % | | | 1.83 | % | | | 0.83 | % | | | 0.68 | % |
* Prior to October 30, 2014, the expense limitations for Classes A, C, Y and Institutional Class shares were 1.50%, 2.25%, 1.25% and 1.10%, respectively.
These expense limitations will remain in effect for all Funds through at least October 29, 2015, except for Large Cap Fund which will remain in effect through October 29, 2016.
Notes to Financial Statements (Continued)
During the year ended June 30, 2015, the Advisor or its affiliates waived investment advisory fees and administration fees or reimbursed expenses, including distribution fees, of the Funds as follows:
| | | | | | | | | Other | | | | |
| | | Investment | | | | | | Operating | | | | |
| | | Advisory | | | Administration | | | Expenses | | | | |
| Fund | | Fees Waived | | | Fees Waived | | | Reimbursed | | | Total | |
| International Small Cap Fund | | $ | — | | | $ | 91,792 | | | $ | 89,111 | | | $ | 180,903 | |
| Large Cap Fund | | | 33,088 | | | | 81,285 | | | | 20,057 | | | | 134,430 | |
| Small Cap Value Opportunities Fund | | | — | | | | 88,460 | | | | 92,948 | | | | 181,408 | |
| Value Fund | | | — | | | | 648,908 | | | | 116,872 | | | | 765,780 | |
Under the terms of the Expense Limitation Agreement, the Advisor is entitled to recover, subject to approval by the Funds’ Board, such amounts waived or reimbursed for a period of up to three years from the year in which the Advisor reduced its compensation or assumed expenses for the Funds. No recoupment will occur unless a Fund’s operating expenses are below the expense limitation amount in effect at the time of the waiver or reimbursement.
As of June 30, 2015, the Advisor may seek recoupment of previously waived fees and reimbursed expenses as follows:
| | | Expiration | | | Expiration | | | Expiration | | | | |
| | | June 30, | | | June 30, | | | June 30, | | | | |
| Fund | | 2016 | | | 2017 | | | 2018 | | | Total | |
| International Small Cap Fund | | $ | 346,008 | | | $ | 277,489 | | | $ | 146,155 | | | $ | 769,652 | |
| Large Cap Fund | | | — | | | | — | | | | 130,776 | | | | 130,776 | |
| Small Cap Value Opportunities Fund | | | 132,190 | | | | 129,267 | | | | 145,044 | | | | 406,501 | |
| Value Fund | | | 897,689 | | | | 712,405 | | | | 729,485 | | | | 2,339,579 | |
The Advisor did not recoup any amounts it previously waived or reimbursed during the year ended June 30, 2015.
ADMINISTRATION AGREEMENT
The Advisor entered into an Administration Agreement with the Trust, whereby the Advisor is responsible for: supplying executive and regulatory compliance services; supervising the preparation of tax returns; coordinating the preparation of reports to shareholders and reports to, and filings with, the Securities and Exchange Commission (the “SEC”) and state securities authorities, as well as materials for meetings of the Board; calculating the daily NAV per share; and maintaining the financial books and records of each Fund.
For its services through December 31, 2014, the Advisor’s annual administrative fee was:
0.20% on the first $6 billion of the aggregate average daily net assets;
0.16% on the next $4 billion of aggregate average daily net assets; and
0.12% on the aggregate average daily net assets of all such assets in excess of $10 billion.
The fee was computed and allocated among the Touchstone Fund Complex (excluding Touchstone Institutional Money Market Fund, Touchstone Institutional Funds Trust, and Touchstone Variable Series Trust) on the basis of relative daily net assets.
Beginning January 1, 2015, the Advisor’s annual administrative fee is:
0.145% on the first $20 billion of the aggregate average daily net assets;
0.11% on the next $10 billion of aggregate average daily net assets;
Notes to Financial Statements (Continued)
0.09% on the next $10 billion of aggregate average daily net assets; and
0.07% on the aggregate average daily net assets over $40 billion.
The fee is computed and allocated among the Touchstone Fund Complex (excluding Touchstone Institutional Funds Trust) on the basis of relative daily net assets.
The Advisor has engaged BNY Mellon as the Sub-Administrator to the Trust. BNY Mellon provides administrative and accounting services to the Trust and is compensated directly by the Advisor, not the Trust.
TRANSFER AGENT AGREEMENT
Under the terms of the Transfer Agent Agreement between the Trust and BNY Mellon, BNY Mellon maintains the records of each shareholder’s account, answers shareholders’ inquiries concerning their accounts, processes purchases and redemptions of each Fund’s shares, acts as dividend and distribution disbursing agent and performs other shareholder service functions. For these services, BNY Mellon receives a monthly fee per shareholder account from each Fund. In addition, each Fund pays out-of-pocket expenses incurred by BNY Mellon, including, but not limited to, postage and supplies.
The Funds may reimburse the Advisor for fees paid to intermediaries such as banks, broker-dealers, financial advisors or other financial institutions for sub-transfer agency, sub-administration and other services provided to investors whose shares of record are held in omnibus, other group accounts, retirement plans or accounts traded through registered securities clearing agents. These fees may vary based on, for example, the nature of services provided, but generally range up to 0.15% of the assets of the class serviced or maintained by the intermediary or up to $22 per sub-account maintained by the intermediary. Prior to December 1, 2014, the Funds reimbursed the Advisor up to $17 per sub-account maintained by the intermediary.
PLANS OF DISTRIBUTION AND SHAREHOLDER SERVICING FEE ARRANGEMENTS
The Trust has adopted distribution plans pursuant to Rule 12b-1 under the 1940 Act for each class of shares it offers that is subject to 12b-1 distribution fees. The plans allow each Fund to pay distribution and other fees for the sale and distribution of its shares and for services provided to shareholders. The fees charged to the Funds are limited to the actual expenses incurred. Under the Class A plan, each Fund offering Class A shares pays an annual fee of up to 0.25% of average daily net assets that are attributable to Class A shares. Under the Class C plan, each Fund offering Class C shares pays an annual fee of up to 1.00% of average daily net assets that are attributable to Class C shares (of which up to 0.75% is a distribution fee and up to 0.25% is a shareholder servicing fee).
UNDERWRITING AGREEMENT
The Underwriter is the Funds’ principal underwriter and, as such, acts as exclusive agent for distribution of the Funds’ shares. Under the terms of the Underwriting Agreement between the Trust and the Underwriter, the Underwriter earned the following from underwriting and broker commissions on the sale of Class A shares of the Funds listed below during the year ended June 30, 2015:
| Fund | | Amount | |
| International Small Cap Fund | | $ | 15,677 | |
| Large Cap Fund | | | 2,217 | |
| Small Cap Value Opportunities Fund | | | 6,085 | |
| Value Fund | | | 7,854 | |
Notes to Financial Statements (Continued)
In addition, the Underwriter collected CDSC on the redemption of Class C shares of the Funds listed below during the year ended June 30, 2015:
| Fund | | Amount | |
| Large Cap Fund | | $ | 40 | |
| Small Cap Value Opportunities Fund | | | 179 | |
| Value Fund | | | 76 | |
| | | | | |
AFFILIATED INVESTMENTS
Each Fund may have invested in the Touchstone Institutional Money Market Fund through June 19, 2015, subject to compliance with several conditions set forth in an exemptive order received by the Trust from the SEC. To the extent that the Funds were invested in the Touchstone Institutional Money Market Fund, the Advisor and Administrator were paid additional fees from the Touchstone Institutional Money Market Fund that were not waived or reimbursed.
A summary of each Fund’s investment, as applicable, in the Touchstone Institutional Money Market Fund for the year ended June 30, 2015, is as follows:
| Fund | | Share Activity | | | | | | | | | | |
| | | | | | | | | | | | | | | | | | Market | |
| | | Balance | | | | | | | | | Balance | | | | | | Value | |
| | | 06/30/14 | | | Purchases | | | Sales | | | 06/30/15 | | | Dividends | | | 06/30/15 | |
| International Small Cap Fund | | | 4,837,156 | | | | 100,707,498 | | | | (105,544,654 | ) | | | — | | | $ | 580 | | | $ | — | |
| Large Cap Fund | | | — | | | | 102,849,871 | | | | (102,849,871 | ) | | | — | | | | 212 | | | | — | |
| Small Cap Value Opportunities Fund | | | 3,423,077 | | | | 76,046,254 | | | | (79,469,331 | ) | | | — | | | | 517 | | | | — | |
| Value Fund | | | 9,606,140 | | | | 75,339,700 | | | | (84,945,840 | ) | | | — | | | | 568 | | | | — | |
5. Federal Tax Information
Federal income tax — It is each Fund’s policy to continue to comply with the special provisions of the Internal Revenue Code applicable to regulated investment companies. As provided therein, in any fiscal year in which a Fund so qualifies and distributes at least 90% of its investment company taxable income, the Fund (but not the shareholders) will be relieved of federal income tax on the income distributed. It is each Fund’s policy to distribute all of its taxable income and accordingly, no provision for income taxes has been made.
In order to avoid imposition of the excise tax applicable to regulated investment companies, it is also each Fund’s intention to declare and pay as dividends in each calendar year at least 98% of its investment company taxable income (earned during the calendar year) and 98.2% of its net realized capital gains (earned during the twelve months ending October 31) plus undistributed amounts from prior years.
Notes to Financial Statements (Continued)
The tax character of distributions paid for the years ended June 30, 2015 and June 30, 2014 is as follows:
| | | International Small Cap Fund | | | Large Cap Fund | |
| | | Year Ended | | | Year Ended | | | Period Ended | |
| | | June 30, | | | June 30, | | | June 30, | |
| | | 2015 | | | 2014 | | | 2015 | |
| From ordinary income | | $ | 1,081,879 | | | $ | 1,908,555 | | | $ | 93,694 | |
| Total Distributions | | $ | 1,081,879 | | | $ | 1,908,555 | | | $ | 93,694 | |
| | | Small Cap Value Opportunities Fund | | | Value Fund | |
| | | Year Ended | | | Year Ended | | | Year Ended | | | Year Ended | |
| | | June 30, | | | June 30, | | | June 30, | | | June 30, | |
| | | 2015 | | | 2014 | | | 2015 | | | 2014 | |
| From ordinary income | | $ | 12,526,378 | | | $ | 9,922,007 | | | $ | 7,924,841 | | | $ | 8,779,860 | |
| From long-term capital gains | | | 12,044,455 | | | | 10,092,574 | | | | 5,835,108 | | | | — | |
| Total Distributions | | $ | 24,570,833 | | | $ | 20,014,581 | | | $ | 13,759,949 | | | $ | 8,779,860 | |
The following information is computed on a tax basis for each item as of June 30, 2015:
| | | | | | | | | Small Cap | | | | |
| | | International | | | Large | | | Value | | | | |
| | | Small Cap | | | Cap | | | Opportunities | | | Value | |
| | | Fund | | | Fund | | | Fund | | | Fund | |
| Tax cost of portfolio investments | | $ | 226,772,672 | | | $ | 295,622,354 | | | $ | 206,787,753 | | | $ | 334,104,934 | |
| Gross unrealized appreciation | | | 37,018,503 | | | | 8,439,606 | | | | 27,425,831 | | | | 97,641,296 | |
| Gross unrealized depreciation | | | (4,271,746 | ) | | | (8,120,624 | ) | | | (11,552,331 | ) | | | (10,045,934 | ) |
| Net unrealized appreciation on investments | | | 32,746,757 | | | | 318,982 | | | | 15,873,500 | | | | 87,595,362 | |
| Net unrealized depreciation on foreign currency transactions | | | (51,706 | ) | | | — | | | | — | | | | — | |
| Accumulated capital and other losses | | | (1,667,378 | ) | | | (1,223,821 | ) | | | — | | | | (13,695,912 | ) |
| Qualified Late-Year Losses deferred | | | (4,613,302 | ) | | | — | | | | — | | | | — | |
| Undistributed ordinary income | | | 2,342,517 | | | | 539,773 | | | | 2,836,056 | | | | 167,538 | |
| Undistributed long-term capital gains | | | — | | | | — | | | | 6,668,053 | | | | 26,706,058 | |
| Accumulated earnings (deficit) | | $ | 28,756,888 | | | $ | (365,066 | ) | | $ | 25,377,609 | | | $ | 100,773,046 | |
The difference between the tax cost of portfolio investments and the financial statement cost is primarily due to wash sale loss deferrals and passive foreign investment company (“PFIC”) adjustments.
As of June 30, 2015, the Funds had the following capital loss carryforwards for federal income tax purposes:
| | | | | | | | | | | | | | | No | | | No | | | | |
| | | Short Term Expiring On* | | | Expiration | | | Expiration | | | | |
| | | 2015 | | | 2016 | | | 2017 | | | 2018 | | | Short Term* | | | Long Term* | | | Total | |
| International Small Cap Fund** | | $ | — | | | $ | — | | | $ | 1,667,378 | | | $ | — | | | $ | — | | | $ | — | | | $ | 1,667,378 | |
| Large Cap Fund | | | — | | | | 1,035,863 | | | | — | | | | — | | | | 187,958 | | | | — | | | | 1,223,821 | |
| Value Fund** | | | — | | | | — | | | | 13,695,912 | | | | — | | | | — | | | | — | | | | 13,695,912 | |
*The Regulated Investment Company Modernization Act of 2010 (the “Act”) was enacted on December 22, 2010. The Act made changes to several tax rules impacting the Funds. The provisions of the Act first became effective for the Funds’ fiscal year ended June 30, 2012 and are applicable to all subsequent fiscal years. Although the Act provides several benefits, including the unlimited carryover of future capital losses, there may be a greater likelihood that all or a portion of each Fund’s pre-enactment capital loss carryovers may expire without being utilized due to the fact that post-enactment capital losses must be utilized before pre-enactment capital loss carryovers may be utilized. Under the Act, new capital losses may now be carried forward indefinitely, and retain the character of the original loss as compared with pre-enactment law, where capital losses could be carried forward for up to eight years, and carried forward as short-term capital losses, irrespective of the character of the original loss.
**Utilization may be limited by current income tax regulations.
The capital loss carryforwards may be utilized in future years to offset net realized capital gains, if any, prior to distributing such gains to shareholders.
Notes to Financial Statements (Continued)
For the year ended June 30, 2015, the Large Cap Fund had $2,882,786 of capital loss carryforwards expiring in the current year.
During the year ended June 30, 2015, the following Funds utilized capital loss carryforwards:
| Fund | | Amount | |
| International Small Cap Fund | | $ | 16,270,339 | |
| Large Cap Fund | | | — | |
| Small Cap Value Opportunities Fund | | | 541,070 | |
| Value Fund | | | 7,128,617 | |
The Funds have analyzed their tax positions taken on federal income tax returns for all open tax years (tax years ended March 31, 2012 through June 30, 2015) and have concluded that no provision for income tax is required in their financial statements.
Certain reclassifications, the result of permanent differences between financial statement and income tax reporting requirements, have been made to the components of capital. These reclassifications have no impact on the net assets or NAV per share of the Funds. The following reclassifications, which are primarily attributed to the tax treatment of foreign currency gains/losses, gains/losses from passive foreign investment companies, adjustments on disposition of partnerships, expiration of prior year capital loss carryovers and carryovers of temporary differences due to mergers, re-designation of dividends paid and deemed distributions on shareholder redemption have been made to the following Funds for the year ended June 30, 2015:
| | | | | | Accumulated | | | Accumulated | |
| | | Paid-In | | | Net Investment | | | Net Realized | |
| Fund | | Capital | | | Income(Loss) | | | Gains(Losses) | |
| International Small Cap Fund | | $ | — | | | $ | (31,560 | ) | | $ | 31,560 | |
| Large Cap Fund | | | 1,047,092 | | | | — | | | | (1,047,092 | ) |
| Small Cap Value Opportunities Fund | | | 871,949 | | | | 2,153,521 | | | | (3,025,470 | ) |
| Value Fund | | | 937,984 | | | | (1,615,939 | ) | | | 677,955 | |
6. Commitments and Contingencies
The Funds indemnify the Trust’s officers and Trustees for certain liabilities that might arise from their performance of their duties to the Funds. Additionally, in the normal course of business, the Funds enter into contracts that contain a variety of representations and warranties and which provide general indemnifications. The Funds’ maximum exposure under these arrangements is unknown, as this would involve future claims that may be made against the Funds.
7. Risks Associated with Foreign Investments
Some of the Funds may invest in the securities of foreign issuers. Investing in securities issued by companies whose principal business activities are outside the U.S. may involve significant risks not present in domestic investments. For example, there is generally less publicly available information about foreign companies, particularly those not subject to the disclosure and reporting requirements of the U.S. securities laws. Foreign issuers are generally not bound by uniform accounting, auditing, and financial reporting requirements and standards of practice comparable to those applicable to domestic issuers. Investments in foreign securities also involve the risk of possible adverse changes in investment or exchange control regulations, expropriation or confiscatory taxation, limitations on the removal of funds or other assets of a Fund, political or financial instability or diplomatic and other developments which could affect such investments. Foreign stock markets, while growing in volume and sophistication, are generally not as developed as those in the U.S., and securities of some foreign issuers (particularly those located in developing countries) may be less liquid and more volatile than securities of comparable U.S. companies. In general, there is less overall governmental supervision and regulation of foreign securities markets, broker-dealers, and issuers than in the U.S.
Notes to Financial Statements (Continued)
8. Risks Associated with Concentration
Certain Funds may invest a high percentage of their assets in specific sectors of the market in order to achieve a potentially greater investment return. As a result, these Funds may be more susceptible to economic, political, and regulatory developments in a particular sector of the market, positive or negative, and may experience increased volatility on the Funds’ NAVs and magnified effect on the total return.
9. Fund Mergers
At a meeting held on February 12, 2015, the Board approved an Agreement and Plan of Reorganization providing for the transfer of all assets and liabilities of the Touchstone Capital Growth Fund to the Touchstone Large Cap Fund, each a series of the Trust. The merger took place on June 26, 2015.
| | | | | | After | |
| | | Before Reorganization | | | Reorganization | |
| | | Touchstone | | | Touchstone | | | Touchstone | |
| | | Capital Growth | | | Large Cap | | | Large Cap | |
| | | Fund | | | Fund | | | Fund | |
| Class A | | | | | | | | | | | | |
| Shares | | | 134,841 | (A) | | | 54,608 | | | | 189,449 | |
| Net Assets | | $ | 1,466,300 | | | $ | 593,819 | | | $ | 2,060,119 | |
| Net Asset Value | | $ | 10.87 | (A) | | $ | 10.87 | | | $ | 10.87 | |
| Class C | | | | | | | | | | | | |
| Shares | | | 33,258 | (B) | | | 90,840 | | | | 124,098 | |
| Net Assets | | $ | 359,796 | | | $ | 982,747 | | | $ | 1,342,543 | |
| Net Asset Value | | $ | 10.82 | (B) | | $ | 10.82 | | | $ | 10.82 | |
| | | | | | | | | | | | | |
| Class Y | | | | | | | | | | | | |
| Shares | | | 16,959,045 | (C) | | | 1,194,116 | | | | 18,153,161 | |
| Net Assets | | $ | 184,754,062 | | | $ | 13,008,812 | | | $ | 197,762,874 | |
| Net Asset Value | | $ | 10.89 | (C) | | $ | 10.89 | | | $ | 10.89 | |
| Institutional Class | | | | | | | | | | | | |
| Shares | | | 62,587 | (D) | | | 9,195,581 | | | | 9,258,168 | |
| Net Assets | | $ | 682,334 | | | $ | 100,252,439 | | | $ | 100,934,773 | |
| Net Asset Value | | $ | 10.90 | (D) | | $ | 10.90 | | | $ | 10.90 | |
| Fund Total | | | | | | | | | | | | |
| Shares Outstanding | | | 11,078,886 | | | | 10,535,145 | | | | 27,724,876 | |
| Net Assets | | $ | 187,262,492 | | | $ | 114,837,817 | | | $ | 302,100,309 | |
| Unrealized Appreciation (Depreciation) | | $ | 3,659,835 | | | $ | 2,863,230 | | | $ | 6,523,065 | |
(A)Reflects a 1.5003:1 reverse stock split which occurred on the date of reorganization, June 26, 2015.
(B)Reflects a 1.4434:1 reverse stock split which occurred on the date of reorganization, June 26, 2015.
(C)Reflects a 1.5522:1 reverse stock split which occurred on the date of reorganization, June 26, 2015.
(D)Reflects a 1.5693:1 reverse stock split which occurred on the date of reorganization, June 26, 2015.
Assuming this reorganization had been completed on July 9, 2014, the Large Cap Fund’s results of operations for the year ended June 30, 2015 would have been as follows:
| Net investment income | | $ | 1,208,935 | |
| Net realized and unrealized gain on investments | | $ | 13,797,528 | |
| Net increase in net assets from operations | | $ | 15,006,463 | |
Because the combined investment portfolios have been managed as a single portfolio since the reorganization was completed, it is not practical to separate the amounts of revenue and earnings to the Large Cap Fund that have been included in its statements of operations since the reorganization.
Notes to Financial Statements (Continued)
10. Subsequent Events
Subsequent events occurring after the date of this report have been evaluated for potential impact to this report through the date financial statements were issued.There were no subsequent events that necessitated recognition or disclosure in the Funds’ financial statement.
Report of Independent Registered Public Accounting Firm
The Board of Trustees and Shareholders of Touchstone International Small Cap Fund, Touchstone Large Cap Fund, Touchstone Small Cap Value Opportunities Fund, and Touchstone Value Fund
We have audited the accompanying statements of assets and liabilities, including the portfolios of investments, of Touchstone International Small Cap Fund, Touchstone Large Cap Fund, Touchstone Small Cap Value Opportunities Fund and Touchstone Value Fund (the “Funds”) (four of the funds constituting the Touchstone Strategic Trust) as of June 30, 2015, and the related statements of operations and statements of changes in net assets for each of the periods indicated therein, and the financial highlights for each of the years or periods ended June 30, 2013 through June 30, 2015. These financial statements and financial highlights are the responsibility of the Funds’ management. Our responsibility is to express an opinion on these financial statements and financial highlights based on our audits. The financial highlights for each of the periods presented through June 30, 2012 were audited by other auditors, whose report dated August 20, 2012, expressed an unqualified opinion on those financial highlights.
We conducted our audits in accordance with the standards of the Public Company Accounting Oversight Board (United States). Those standards require that we plan and perform the audit to obtain reasonable assurance about whether the financial statements and financial highlights are free of material misstatement. We were not engaged to perform an audit of the Funds’ internal control over financial reporting. Our audits included consideration of internal control over financial reporting as a basis for designing audit procedures that are appropriate in the circumstances, but not for the purpose of expressing an opinion on the effectiveness of the Funds’ internal control over financial reporting. Accordingly, we express no such opinion. An audit also includes examining, on a test basis, evidence supporting the amounts and disclosures in the financial statements and financial highlights, assessing the accounting principles used and significant estimates made by management, and evaluating the overall financial statement presentation. Our procedures included confirmation of securities owned as of June 30, 2015, by correspondence with the custodian, transfer agent, and brokers or by other appropriate auditing procedures where replies from brokers were not received. We believe that our audits provide a reasonable basis for our opinion.
In our opinion, the financial statements and financial highlights referred to above present fairly, in all material respects, the financial position of Touchstone International Small Cap Fund, Touchstone Large Cap Fund, Touchstone Small Cap Value Opportunities Fund and Touchstone Value Fund (four of the funds constituting the Touchstone Strategic Trust) at June 30, 2015, the results of their operations and the changes in their net assets for each of the periods indicated therein, and their financial highlights for each of the years or periods ended June 30, 2013 through June 30, 2015, in conformity with U.S. generally accepted accounting principles.

Cincinnati, Ohio
August 21, 2015
Other Items (Unaudited)
Qualified Dividend Income
Under the Jobs and Growth Tax Relief Reconciliation Act of 2003 (the “Act”), the following percentages of ordinary dividends paid during the fiscal year ended June 30, 2015 are designated as “qualified dividend income,” as defined in the Act, and are subject to reduced tax rates in 2015. The Funds intend to pass through the maximum allowable percentage for Form 1099Div.
| Touchstone International Small Cap Fund | | | 100.00 | % |
| Touchstone Large Cap Fund | | | 100.00 | % |
| Touchstone Small Cap Value Opportunities Fund | | | 9.72 | % |
| Touchstone Value Fund | | | 100.00 | % |
Dividend Received Deduction
For corporate shareholders, the following ordinary distributions paid during the current fiscal year ended June 30, 2015 qualify for the corporate dividends received deduction. The Funds intend to pass through the maximum allowable percentage for Form 1099Div.
| Touchstone International Small Cap Fund | | | 4.32 | % |
| Touchstone Large Cap Fund | | | 100.00 | % |
| Touchstone Small Cap Value Opportunities Fund | | | 10.78 | % |
| Touchstone Value Fund | | | 99.79 | % |
For the fiscal year ended June 30, 2015, the Small Cap Value Opportunities Fund and Value Fund designated $12,656,212 and $31,064,286 as long-term capital gains, respectively.
Foreign Tax Income & Foreign Tax Credit
International Small Cap Fund intends to pass through a foreign tax credit to the shareholders. For the fiscal year ended June 30, 2015, the total amount of foreign source income is $4,252,943 or $0.29 per share. The total amount of foreign taxes to be paid is $286,474 or $0.02. Shareholder’s allocable share of the foreign tax credit will be reported on Form 1099Div.
Proxy Voting Guidelines and Proxy Voting Records
The Sub-Advisors are responsible for exercising the voting rights associated with the securities purchased and held by the Funds. A description of the policies and procedures that the Sub-Advisors use in fulfilling this responsibility is available as an appendix to the most recent Statement of Additional Information, which can be obtained without charge by calling toll free 1.800.543.0407 or by visiting the Touchstone website at TouchstoneInvestments.com or on the Securities and Exchange Commission’s (the “Commission”) website sec.gov. Information regarding how those proxies were voted during the most recent twelve-month period ended June 30 is also available without charge by calling toll free 1.800.543.0407 or on the Commission’s website at sec.gov.
Quarterly Portfolio Disclosure
The Trust files a complete listing of portfolio holdings for each Fund as of the end of the first and third quarters of each fiscal year on Form N-Q. The complete listing (i) is available on the Commission’s website; (ii) may be reviewed and copied at the Commission’s Public Reference Room in Washington, DC; or (iii) will be made available to shareholders upon request by calling 1.800.543.0407. Information on the operation of the Public Reference Room may be obtained by calling 1.800.SEC.0330.
Schedule of Shareholder Expenses
As a shareholder of the Funds, you incur two types of costs: (1) transaction costs, including reinvested dividends or other distributions; and (2) ongoing costs, including investment advisory fees; distribution (12b-1) fees;
Other Items (Unaudited) (Continued)
and other Fund expenses. This example is intended to help you understand your ongoing costs (in dollars) of investing in the Funds and to compare these costs with the ongoing costs of investing in other mutual funds. The example is based on an investment of $1,000 invested at the beginning of the period and held for the entire period (January 1, 2015 through June 30, 2015).
Actual Expenses
The first line of the table below for each share class of a Fund provides information about actual account values and actual expenses. You may use the information in this line, together with the amount you invested, to estimate the expenses that you paid over the period. Simply divide your account value by $1,000 (for example, an $8,600 account value divided by $1,000 = 8.6), then multiply the result by the number in the first line under the heading entitled “Expenses Paid During the Six Months Ended June 30, 2015” to estimate the expenses you paid on your account during this period.
Hypothetical Example for Comparison Purposes
The second line of the table below for each share class of a Fund provides information about hypothetical account values and hypothetical expenses based on the Funds’ actual expense ratio and an assumed rate of return of 5% per year before expenses, which is not the Funds’ actual return. The hypothetical account values and expenses may not be used to estimate the actual ending account balance or expenses you paid for the period. You may use this information to compare the ongoing costs of investing in the Funds and other funds. To do so, compare this 5% hypothetical example with the 5% hypothetical examples that appear in the shareholder reports of the other funds.
Please note that the expenses shown in the table are meant to highlight your ongoing costs only and do not reflect any transactional costs, such as sales charges (loads), redemption fees, or exchange fees. Therefore, the second line of each share class of a Fund in the table below is useful in comparing ongoing costs only, and will not help you determine the relative total costs of owning different funds. In addition, if these transactional costs were included, your costs would have been higher.
Other Items (Unaudited) (Continued)
Schedule of Shareholder Expenses (Continued)
| | | | | | | | | | | | | | Expenses | |
| | | | | Net Expense | | | Beginning | | | Ending | | | Paid During | |
| | | | | Ratio | | | Account | | | Account | | | the Six Months | |
| | | | | Annualized | | | Value | | | Value | | | Ended | |
| | | | | June 30, | | | January 1, | | | June 30, | | | June 30, | |
| | | | | 2015 | | | 2015 | | | 2015 | | | 2015* | |
| Touchstone International Small Cap Fund | | | | | | | | | | | | | | | | |
| Class A | | Actual | | | 1.55 | % | | $ | 1,000.00 | | | $ | 1,129.19 | | | $ | 8.18 | |
| Class A | | Hypothetical | | | 1.55 | % | | $ | 1,000.00 | | | $ | 1,017.11 | | | $ | 7.75 | |
| | | | | | | | | | | | | | | | | | | |
| Class C | | Actual | | | 2.30 | % | | $ | 1,000.00 | | | $ | 1,125.09 | | | $ | 12.12 | |
| Class C | | Hypothetical | | | 2.30 | % | | $ | 1,000.00 | | | $ | 1,013.39 | | | $ | 11.48 | |
| | | | | | | | | | | | | | | | | | | |
| Class Y | | Actual | | | 1.30 | % | | $ | 1,000.00 | | | $ | 1,130.85 | | | $ | 6.87 | |
| Class Y | | Hypothetical | | | 1.30 | % | | $ | 1,000.00 | | | $ | 1,018.35 | | | $ | 6.51 | |
| | | | | | | | | | | | | | | | | | | |
| Institutional Class | | Actual | | | 1.18 | % | | $ | 1,000.00 | | | $ | 1,131.64 | | | $ | 6.24 | |
| Institutional Class | | Hypothetical | | | 1.18 | % | | $ | 1,000.00 | | | $ | 1,018.94 | | | $ | 5.91 | |
| | | | | | | | | | | | | | | | | | | |
| Touchstone Large Cap Fund | | | | | | | | | | | | | | | | | | |
| Class A | | Actual | | | 1.12 | % | | $ | 1,000.00 | | | $ | 990.69 | | | $ | 5.53 | |
| Class A | | Hypothetical | | | 1.12 | % | | $ | 1,000.00 | | | $ | 1,019.24 | | | $ | 5.61 | |
| | | | | | | | | | | | | | | | | | | |
| Class C | | Actual | | | 1.87 | % | | $ | 1,000.00 | | | $ | 987.89 | | | $ | 9.22 | |
| Class C | | Hypothetical | | | 1.87 | % | | $ | 1,000.00 | | | $ | 1,015.52 | | | $ | 9.35 | |
| | | | | | | | | | | | | | | | | | | |
| Class Y | | Actual | | | 0.87 | % | | $ | 1,000.00 | | | $ | 991.64 | | | $ | 4.30 | |
| Class Y | | Hypothetical | | | 0.87 | % | | $ | 1,000.00 | | | $ | 1,020.48 | | | $ | 4.36 | |
| | | | | | | | | | | | | | | | | | | |
| Institutional Class | | Actual | | | 0.77 | % | | $ | 1,000.00 | | | $ | 992.57 | | | $ | 3.80 | |
| Institutional Class | | Hypothetical | | | 0.77 | % | | $ | 1,000.00 | | | $ | 1,020.98 | | | $ | 3.86 | |
| | | | | | | | | | | | | | | | | | | |
| Touchstone Small Cap Value Opportunities Fund | | | | | | | | | | | | | | | | |
| Class A | | Actual | | | 1.43 | % | | $ | 1,000.00 | | | $ | 1,028.64 | | | $ | 7.19 | |
| Class A | | Hypothetical | | | 1.43 | % | | $ | 1,000.00 | | | $ | 1,017.70 | | | $ | 7.15 | |
| | | | | | | | | | | | | | | | | | | |
| Class C | | Actual | | | 2.18 | % | | $ | 1,000.00 | | | $ | 1,025.15 | | | $ | 10.95 | |
| Class C | | Hypothetical | | | 2.18 | % | | $ | 1,000.00 | | | $ | 1,013.98 | | | $ | 10.89 | |
| | | | | | | | | | | | | | | | | | | |
| Class Y | | Actual | | | 1.18 | % | | $ | 1,000.00 | | | $ | 1,029.28 | | | $ | 5.94 | |
| Class Y | | Hypothetical | | | 1.18 | % | | $ | 1,000.00 | | | $ | 1,018.94 | | | $ | 5.91 | |
| | | | | | | | | | | | | | | | | | | |
| Institutional Class | | Actual | | | 1.10 | % | | $ | 1,000.00 | | | $ | 1,030.50 | | | $ | 5.54 | |
| Institutional Class | | Hypothetical | | | 1.10 | % | | $ | 1,000.00 | | | $ | 1,019.34 | | | $ | 5.51 | |
| | | | | | | | | | | | | | | | | | | |
| Touchstone Value Fund | | | | | | | | | | | | | | | | | | |
| Class A | | Actual | | | 1.08 | % | | $ | 1,000.00 | | | $ | 1,013.56 | | | $ | 5.39 | |
| Class A | | Hypothetical | | | 1.08 | % | | $ | 1,000.00 | | | $ | 1,019.44 | | | $ | 5.41 | |
| | | | | | | | | | | | | | | | | | | |
| Class C | | Actual | | | 1.83 | % | | $ | 1,000.00 | | | $ | 1,010.09 | | | $ | 9.12 | |
| Class C | | Hypothetical | | | 1.83 | % | | $ | 1,000.00 | | | $ | 1,015.72 | | | $ | 9.15 | |
| | | | | | | | | | | | | | | | | | | |
| Class Y | | Actual | | | 0.83 | % | | $ | 1,000.00 | | | $ | 1,014.75 | | | $ | 4.15 | |
| Class Y | | Hypothetical | | | 0.83 | % | | $ | 1,000.00 | | | $ | 1,020.68 | | | $ | 4.16 | |
| | | | | | | | | | | | | | | | | | | |
| Institutional Class | | Actual | | | 0.68 | % | | $ | 1,000.00 | | | $ | 1,015.60 | | | $ | 3.40 | |
| Institutional Class | | Hypothetical | | | 0.68 | % | | $ | 1,000.00 | | | $ | 1,021.42 | | | $ | 3.41 | |
*Expenses are equal to the Fund’s annualized expense ratio, multiplied by the average account value over the period, multiplied by 181/ 365 (to reflect the one-half period).
Management of the Trust (Unaudited)
Listed below is required information regarding the Trustees and principal officers of the Trust. The Trust’s Statement of Additional Information includes additional information about the Trustees and is available, without charge, upon request by calling 1.800.543.0407 or by visiting the Touchstone website at TouchstoneInvestments.com.
Interested Trustees1:
| | | | | | | | | Number | | |
| | | | | | | | | of Funds | | |
| | | | | | | | | Overseen | | |
| | | | | Term of | | | | in the | | |
| Name | | Position(s) | | Office And | | | | Touchstone | | Other |
| Address | | Held with | | Length of | | Principal Occupation(s) | | Fund | | Directorships |
| Age | | Trust | | Time Served | | During Past 5 Years | | Complex2 | | Held During the Past 5 Years3 |
Jill T. McGruder Touchstone Advisors, Inc. 303 Broadway Suite 1100 Cincinnati, OH 45202 Year of Birth: 1955 | | Trustee and President | | Until retirement at age 75 or until she resigns or is removed Trustee since 1999 | | President and CEO of IFS Financial Services, Inc. (a holding company). | | 43 | | Director of LaRosa’s, Inc. (a restaurant chain) from 1999 to 2011; IFS Financial Services, Inc. (a holding company) from 1999 to the present; Integrity and National Integrity Life Insurance Co. from 2005 to the present; Touchstone Securities (the Trust’s distributor) from 1999 to the present; Touchstone Advisors (the Trust’s investment advisor and administrator) from 1999 to the present; W&S Brokerage Services (a brokerage company) from 1999 to the present; W&S Financial Group Distributors (a distribution company) from 1999 to the present; Every Child Succeeds (a social services company) from 2007 to the present; Taft Museum of Art from 2007 to the present; and YMCA of Greater Cincinnati from 2012 to the present. |
| Independent Trustees: | | | | | | | |
Phillip R. Cox c/o Touchstone Advisors, Inc. 303 Broadway Suite 1100 Cincinnati, OH 45202 Year of Birth: 1947 | | Trustee | | Until retirement at age 75 or until he resigns or is removed Trustee since 1999 | | President and Chief Executive Officer of Cox Financial Corp. (a financial services company) from 1971 to the present. | | 43 | | Director of Cincinnati Bell (a communications company) from 1994 to the present; Bethesda Inc. (a hospital) from 2005 to the present; Timken Co. (a manufacturing company) from 2004 to the 2014; TimkenSteel from 2014 to the present; Diebold, Inc. (a technology solutions company) from 2004 to the present; and Ohio Business Alliance for Higher Education and the Economy from 2005 to the present. |
William C. Gale c/o Touchstone Advisors, Inc. 303 Broadway Suite 1100 Cincinnati, OH 45202 Year of Birth: 1952 | | Trustee | | Until retirement at age 75 or until he resigns or is removed Trustee since 2013 | | Senior Vice President and Chief Financial Officer (from 2003 to January 2015) of Cintas Corporation (a business services company). | | 43 | | None. |
Management of the Trust (Unaudited) (Continued)
Independent Trustees (Continued):
| | | | | | | | | Number | | |
| | | | | | | | | of Funds | | |
| | | | | | | | | Overseen | | |
| | | | | Term of | | | | in the | | |
| Name | | Position(s) | | Office And | | | | Touchstone | | Other |
| Address | | Held with | | Length of | | Principal Occupation(s) | | Fund | | Directorships |
| Age | | Trust | | Time Served | | During Past 5 Years | | Complex2 | | Held During the Past 5 Years3 |
Susan J. Hickenlooper c/o Touchstone Advisors, Inc. 303 Broadway Suite 1100 Cincinnati, OH 45202 Year of Birth: 1946 | | Trustee | | Until retirement at age 75 or until she resigns or is removed Trustee since 2009 | | Financial Analyst for Impact 100 (charitable organization) from November 2012 to 2013. | | 43 | | Trustee of Diocese of Southern Ohio from 2014 to present; and Trustee of Episcopal Retirement Homes Foundation from 1998 to 2011 (a charitable organization). |
Kevin A. Robie c/o Touchstone Advisors, Inc. 303 Broadway Suite 1100 Cincinnati, OH 45202 Year of Birth: 1956 | | Trustee | | Until retirement at age 75 or until he resigns or is removed Trustee since 2013 | | Vice President of Portfolio Management at Soin International LLC (a multinational holding company) from 2004 to the present. | | 43 | | Director of Buckeye EcoCare, Inc. (a lawn care company) from 2013 to the present; Trustee of Dayton Region New Market Fund, LLC (a private fund) from 2010 to present; Trustee of the Entrepreneurs Center, Inc. (a small business incubator) from 2006 to the present; and Director of Interventional Imaging, Inc. (a medical device company) from 2004 to 2011. |
Edward J. VonderBrink c/o Touchstone Advisors, Inc. 303 Broadway Suite 1100 Cincinnati, OH 45202 Year of Birth: 1944 | | Trustee | | Until retirement at age 75 or until he resigns or is removed Trustee since 2013 | | Consultant, VonderBrink Consulting LLC from 2000 to the present. | | 43 | | Director of Streamline Health Solutions, Inc. (healthcare IT) from 2006 to the present; Mercy Health from 2013 to the present; Mercy Health Foundation (healthcare nonprofit) from 2008 to the present; and Al Neyer Inc. (a construction company) from 2013 to the present. |
| 1 | Ms. McGruder, as a director of the Advisor and the Trust’s Distributor, and an officer of affiliates of the Advisor and the Trust’s Distributor, is an “interested person” of the Trust within the meaning of Section 2(a)(19) of the 1940 Act. |
| 2 | As of June 30, 2015, The Touchstone Fund Complex consisted of 17 series of the Trust, 1 series of Touchstone Tax-Free Trust, 13 series of Touchstone Funds Group Trust, 2 series of the Touchstone Investment Trust, 1 series of Touchstone Institutional Funds Trust, and 9 variable annuity series of Touchstone Variable Series Trust. |
| 3 | Each Trustee is also a Trustee of Touchstone Funds Group Trust, Touchstone Tax-Free Trust, Touchstone Investment Trust, Touchstone Institutional Funds Trust, and Touchstone Variable Series Trust. |
Management of the Trust (Unaudited) (Continued)
The following is a list of the Officers of the Trusts, the length of time served, and principal occupations the past five years.
Principal Officers:
| | | | | Term of | | |
| Name | | Position(s) | | Office And | | |
| Address | | Held with | | Length of | | Principal Occupation(s) |
| Age | | Trust1 | | Time Served | | During the Past 5 Years |
Jill T. McGruder Touchstone Advisors, Inc. 303 Broadway Suite 1100 Cincinnati, OH 45202 Year of Birth: 1955 | | President | | Until resignation, removal or disqualification President since 2006 | | See biography above. |
Steven M. Graziano Touchstone Advisors, Inc. 303 Broadway Suite 1100 Cincinnati, OH 45202 Year of Birth: 1954 | | Vice President | | Until resignation, removal or disqualification Vice President since 2009 | | President of Touchstone Advisors, Inc. |
Timothy D. Paulin Touchstone Advisors, Inc. 303 Broadway Suite 1100 Cincinnati, OH 45202 Year of Birth: 1963 | | Vice President | | Until resignation, removal or disqualification Vice President since 2010 | | Senior Vice President of Investment Research and Product Management of Touchstone Advisors, Inc.; Director of Product Design of Klein Decisions, Inc. (2003 to 2010). |
Timothy S. Stearns Touchstone Advisors, Inc. 303 Broadway Suite 1100 Cincinnati, OH 45202 Year of Birth: 1963 | | Chief Compliance Officer | | Until resignation, removal or disqualification Chief Compliance Officer since 2013 | | Chief Compliance Officer of Touchstone Advisors, Inc.; Chief Compliance Officer of Envestnet Asset Management, Inc. (2009 to 2013). |
Terrie A. Wiedenheft Touchstone Advisors, Inc. 303 Broadway Suite 1100 Cincinnati, OH 45202 Year of Birth: 1962 | | Controller and Treasurer | | Until resignation, removal or disqualification Controller and Treasurer since 2006 | | Senior Vice President, Chief Financial Officer and Chief Operations Officer of IFS Financial Services, Inc. (a holding company). |
Ellen Blanchard BNY Mellon 201 Washington St, 34th Fl. Boston, MA 02108 Year of Birth: 1973 | | Secretary | | Until resignation, removal or disqualification Secretary since 2015 | | Director and Senior Counsel of BNY Mellon Investment Servicing (US) Inc. |
| 1 | Each officer also holds the same office with Touchstone Funds Group Trust, Touchstone Institutional Funds Trust, Touchstone Investment Trust, Touchstone Tax-Free Trust, and Touchstone Variable Series Trust. |
This page intentionally left blank.
PRIVACY PROTECTION POLICY
We Respect Your Privacy
Thank you for your decision to invest with us. Touchstone and its affiliates have always placed a high value on the trust and confidence our clients place in us. We believe that confidence must be earned and validated through time. In today’s world, when technology allows the sharing of information at light speeds, trust must be reinforced by our sincere pledge to take the steps necessary to ensure that the information you share with us is treated with respect and confidentiality.
Our Pledge to Our Clients
| • | We collect only the information we need to service your account and administer our business. |
| • | We are committed to keeping your information confidential and we place strict limits and controls on the use and sharing of your information. |
| • | We make every effort to ensure the accuracy of your information. |
We Collect the Following Nonpublic Personal Information About You:
| • | Information we receive from you on or in applications or other forms, correspondence, or conversations, including, but not limited to, your name, address, phone number, social security number, assets, income and date of birth; and |
| • | Information about your transactions with us, our affiliates, or others, including, but not limited to, your account number and balance, payment history, parties to transactions, cost basis information, and other financial information. |
Categories of Information We Disclose and Parties to Whom We Disclose
We do not disclose any nonpublic personal information about our current or former clients to nonaffiliated third parties, except as required or permitted by law.
We Place Strict Limits and Controls on the Use and Sharing of Your Information
| • | We restrict access to nonpublic personal information about you to authorized employees who need the information to administer your business. |
| • | We maintain physical, electronic and procedural safeguards that comply with federal standards to protect this information. |
| • | We do not disclose any nonpublic personal information about our current or former clients to anyone, except as required or permitted by law or as described in this document. |
| • | We will not sell your personal information to anyone. |
We May Provide Information to Service Your Account
Sometimes it is necessary to provide information about you to various companies such as transfer agents, custodians, broker-dealers and marketing service firms to facilitate the servicing of your account. These organizations have a legitimate business need to see some of your personal information in order for us to provide service to you. We may disclose to these various companies the information that we collect as described above. We require that these companies, including our own subsidiaries and affiliates, strictly maintain the confidentiality of this information and abide by all applicable laws. Companies within our corporate family that may receive this information are financial service providers and insurance companies. We do not permit these associated companies to sell the information for their own purposes, and we never sell our customer information.
This policy is applicable to the following affiliated companies: Touchstone Funds Group Trust, Touchstone Investment Trust, Touchstone Strategic Trust, Touchstone Tax-Free Trust, Touchstone Variable Series Trust, Touchstone Institutional Funds Trust, Touchstone Securities, Inc.,* and W&S Brokerage Services, Inc.
* Touchstone Securities, Inc. serves as the underwriter to the Touchstone Funds.
A Member of Western & Southern Financial Group®
The Privacy Protection Policy is not part of the Annual Report.


Touchstone Investments
Distributor
Touchstone Securities, Inc.*
303 Broadway
Cincinnati, Ohio 45202-4203 800.638.8194
www.touchstoneinvestments.com
Investment Advisor
Touchstone Advisors, Inc.*
303 Broadway
Cincinnati, Ohio 45202-4203
Transfer Agent
BNY Mellon Investment Servicing (US) Inc.
4400 Computer Drive
Westborough, MA 01581
Shareholder Service
800.543.0407
* A Member of Western & Southern Financial Group
TSF-54BB-TST-AR-1506
Item 2. Code of Ethics.
| (a) | The registrant, as of the end of the period covered by this report, has adopted a code of ethics that applies to the registrant’s principal executive officer, principal financial officer, principal accounting officer or controller, or persons performing similar functions, regardless of whether these individuals are employed by the registrant or a third party. |
| (c) | There have been no amendments, during the period covered by this report, to a provision of the code of ethics that applies to the registrant’s principal executive officer, principal financial officer, principal accounting officer or controller, or persons performing similar functions, regardless of whether these individuals are employed by the registrant or a third party, and that relates to any element of the code of ethics description. |
| (d) | The registrant has not granted any waivers, including an implicit waiver, from a provision of the code of ethics that applies to the registrant’s principal executive officer, principal financial officer, principal accounting officer or controller, or persons performing similar functions, regardless of whether these individuals are employed by the registrant or a third party, that relates to one or more of the items set forth in paragraph (b) of this item’s instructions. |
Item 3. Audit Committee Financial Expert.
The registrant’s Board of Trustees has determined that the registrant has at least one audit committee financial expert serving on its audit committee. Mr. William Gale is the registrant’s audit committee financial expert and is an independent trustee within the meaning of the Investment Company Act of 1940, as amended (the “1940 Act”).
Item 4. Principal Accountant Fees and Services.
Audit Fees
| (a) | The Audit fees totaled $56,200 and $56,200 in fiscal 2015 and 2014, respectively, including fees associated with the annual audits and filings of Form N-1A and Form N-SAR. |
Audit-Related Fees
There were no audit related fees for the fiscal years ended June 30, 2015 and June 30, 2014.
Tax Fees
| (b) | The aggregate fees billed in each of the last two fiscal years for professional services rendered by the principal accountant for tax compliance, tax advice, and tax planning were $20,800 for 2015 and $20,800 for 2014. |
Fees for fiscal years ended June 30, 2015 and June 30, 2014 relate to the preparation of federal income and excise tax returns and review of capital gains distribution calculations.
All Other Fees
| (c) | The aggregate fees billed in each of the last two fiscal years for products and services provided by the principal accountant, other than the services reported in paragraphs (a) through (c) of this Item are $19,688 for 2015 and $15,794 for 2014. The fees relate to the PFIC Analyzer and Global Withholding Tax Reporter subscriptions. |
| (e)(1) | Disclose the audit committee's pre-approval policies and procedures described in paragraph (c)(7) of Rule 2-01 of Regulation S-X. |
The Audit Committee’s pre-approval policies describe the types of audit, audit-related, tax and other services that have the general pre-approval of the Audit Committee. The pre-approval policies provide that annual audit service fees, tax services not specifically granted pre-approval, services exceeding pre-approved cost levels and other services that have not received general pre-approval will be subject to specific pre-approval by the Audit Committee. The pre-approval policies further provide that the Committee may grant general pre-approval to other audit services (statutory audits and services associated with SEC registration statements, periodic reports and other documents filed with the SEC or other documents issued in connection with securities offerings), audit-related services (accounting consultations related to accounting, financial reporting or disclosure matters not classified as “audit services,” assistance with understanding and implementing new accounting and financial reporting guidance from rulemaking authorities, agreed-upon or expanded audit procedures related to accounting and/or billing records required to respond to or comply with financial, accounting or regulatory reporting matters and assistance with internal control reporting requirements under Form N-SAR and Form N-CSR), tax services that have historically been provided by the auditor that the Committee believes would not impair the independence of the auditor and are consistent with the SEC’s rules on auditor independence and permissible non-audit services classified as “all other services” that are routine and recurring services.
| (e)(2) | All of the services described in paragraphs (b) through (d) of Item 4 were approved by the Audit Committee. |
| (f) | The percentage of hours expended on the principal accountant's engagement to audit the registrant's financial statements for the most recent fiscal year that were attributed to work performed by persons other than the principal accountant's full-time, permanent employees was less than fifty percent. |
| (g) | The aggregate non-audit fees billed by the registrant's accountant for services rendered to the registrant, and rendered to the registrant's investment adviser (not including any sub-adviser whose role is primarily portfolio management and is subcontracted with or overseen by another investment adviser), and any entity controlling, controlled by, or under common control with the adviser that provides ongoing services to the registrant were $40,488 for 2015 and $36,594 for 2014. |
| (h) | The registrant's audit committee of the board of trustees has considered whether the provision of non-audit services that were rendered to the registrant's investment adviser (not including any sub-adviser whose role is primarily portfolio management and is subcontracted with or overseen by another investment adviser), and any entity controlling, controlled by, or under common control with the investment adviser that provides ongoing services to the registrant that were not pre-approved pursuant to paragraph (c)(7)(ii) of Rule 2-01 of Regulation S-X is compatible with maintaining the principal accountant's independence. |
Item 5. Audit Committee of Listed Registrants.
Not applicable.
Item 6. Investments.
| (a) | Schedule of Investments in securities of unaffiliated issuers as of the close of the reporting period is included as part of the report to shareholders filed under Item 1 of this form. |
Item 7. Disclosure of Proxy Voting Policies and Procedures for Closed-End Management Investment Companies.
Not applicable.
Item 8. Portfolio Managers of Closed-End Management Investment Companies.
Not applicable.
Item 9. Purchases of Equity Securities by Closed-End Management Investment Company and Affiliated Purchasers.
Not applicable.
Item 10. Submission of Matters to a Vote of Security Holders.
There have been no material changes to the procedures by which the shareholders may recommend nominees to the registrant’s board of trustees, where those changes were implemented after the registrant last provided disclosure in response to the requirements of Item 407(c)(2)(iv) of Regulation S-K (17 CFR 229.407) (as required by Item 22(b)(15) of Schedule 14A (17 CFR 240.14a-101)), or this Item.
Item 11. Controls and Procedures.
| (a) | The registrant’s principal executive and principal financial officers, or persons performing similar functions, have concluded that the registrant’s disclosure controls and procedures (as defined in Rule 30a-3(c) under the Investment Company Act of 1940, as amended (the “1940 Act”) (17 CFR 270.30a-3(c))) are effective, as of a date within 90 days of the filing date of the report that includes the disclosure required by this paragraph, based on their evaluation of these controls and procedures required by Rule 30a-3(b) under the 1940 Act (17 CFR 270.30a-3(b)) and Rules 13a-15(b) or 15d-15(b) under the Securities Exchange Act of 1934, as amended (17 CFR 240.13a-15(b) or 240.15d-15(b)). |
| (b) | There were no changes in the registrant’s internal control over financial reporting (as defined in Rule 30a-3(d) under the 1940 Act (17 CFR 270.30a-3(d)) that occurred during the registrant’s second fiscal quarter of the period covered by this report that has materially affected, or is reasonably likely to materially affect, the registrant’s internal control over financial reporting. |
Item 12. Exhibits.
| (a)(1) | Code of ethics, or any amendment thereto, that is the subject of disclosure required by Item 2 is attached hereto. |
| (a)(2) | Certifications pursuant to Rule 30a-2(a) under the 1940 Act and Section 302 of the Sarbanes-Oxley Act of 2002 are attached hereto. |
| (b) | Certifications pursuant to Rule 30a-2(b) under the 1940 Act and Section 906 of the Sarbanes-Oxley Act of 2002 are attached hereto. |
| (12.other) | Not applicable. |
SIGNATURES
Pursuant to the requirements of the Securities Exchange Act of 1934 and the Investment Company Act of 1940, the registrant has duly caused this report to be signed on its behalf by the undersigned, thereunto duly authorized.
| (Registrant) | Touchstone Strategic Trust |
| By (Signature and Title)* | /s/ Jill T. McGruder |
| | Jill T. McGruder, President |
| | (principal executive officer) |
Pursuant to the requirements of the Securities Exchange Act of 1934 and the Investment Company Act of 1940, this report has been signed below by the following persons on behalf of the registrant and in the capacities and on the dates indicated.
| By (Signature and Title)* | /s/ Jill T. McGruder |
| | Jill T. McGruder, President |
| | (principal executive officer) |
| By (Signature and Title)* | /s/ Terrie A. Wiedenheft |
| | Terrie A. Wiedenheft, Controller and Treasurer |
| | (principal financial officer) |
* Print the name and title of each signing officer under his or her signature.