UNITED STATES
SECURITIES AND EXCHANGE COMMISSION
Washington, D.C. 20549
FORM N-CSR
CERTIFIED SHAREHOLDER REPORT OF REGISTERED MANAGEMENT
INVESTMENT COMPANIES
Investment Company Act file number 811-03651
Touchstone Strategic Trust – June Funds
(Exact name of registrant as specified in charter)
303 Broadway, Suite 1100
Cincinnati, Ohio 45202-4203
(Address of principal executive offices) (Zip code)
Jill T. McGruder
303 Broadway, Suite 1100
Cincinnati, Ohio 45202-4203
(Name and address of agent for service)
Registrant's telephone number, including area code: 800-638-8194
Date of fiscal year end: June 30
Date of reporting period: June 30, 2014
Form N-CSR is to be used by management investment companies to file reports with the Commission not later than 10 days after the transmission to stockholders of any report that is required to be transmitted to stockholders under Rule 30e-1 under the Investment Company Act of 1940 (17 CFR 270.30e-1). The Commission may use the information provided on Form N-CSR in its regulatory, disclosure review, inspection, and policymaking roles.
A registrant is required to disclose the information specified by Form N-CSR, and the Commission will make this information public. A registrant is not required to respond to the collection of information contained in Form N-CSR unless the Form displays a currently valid Office of Management and Budget ("OMB") control number. Please direct comments concerning the accuracy of the information collection burden estimate and any suggestions for reducing the burden to Secretary, Securities and Exchange Commission, 100 F Street, NE, Washington, DC 20549. The OMB has reviewed this collection of information under the clearance requirements of 44 U.S.C. § 3507.
Item 1. Reports to Stockholders.
The Report to Shareholders is attached herewith.
June 30, 2014
Annual Report
Touchstone Strategic Trust
Touchstone Capital Growth Fund
Touchstone International Small Cap Fund
Touchstone Small Cap Value Opportunities Fund
Touchstone Value Fund

Table of Contents
This report identifies the Funds' investments on June 30, 2014. These holdings are subject to change. Not all investments in each Fund performed the same, nor is there any guarantee that these investments will perform as well in the future. Market forecasts provided in this report may not occur.
Letter from the President
Dear Shareholder:
We are pleased to provide you with the Touchstone Strategic Trust Annual Report. Inside you will find key financial information, as well as manager commentaries, for the 12 months ended June 30, 2014.
For the fiscal year, U.S. economic activity advanced at a moderate pace. Data for housing, employment, consumer confidence and consumption showed improvement overall, despite a contraction in the first quarter of 2014 amid an unseasonably cold winter. Abroad, growth in developed economies outpaced that in emerging economies over the course of the fiscal year. Improved manufacturing activity and expanded global trade were positives. Political uncertainties and conflicts, especially in the Middle East, Russia and Ukraine, were negatives. Continued monetary easing throughout developed economies helped stimulate growth and support equities.
The market continued to shift away from macro-economic and political themes and focus on stock-specific drivers, such as earnings results and forward-year estimates. A defining characteristic of the 12-month period was its calm, as U.S. stock market volatility was the lowest since mid-2007. The U.S. Federal Reserve Board (Fed) continued to take a measured approach to monetary tightening.
During the fiscal year, U.S. stock markets posted positive, double-digit returns and outperformed both developed and emerging markets. Performance of growth stocks exceeded their value counterparts and mid-cap stock returns surpassed those of small- and large-cap stocks, although all capitalizations performed well.
We believe that focusing on the long-term composition of your investment portfolio is essential to balancing risk and return. We recommend that you work with your financial professional on a regular basis to assess and adjust your asset allocation and diversification strategy as needed to help keep your financial goals on track.
We greatly appreciate your continued support. Thank you for including Touchstone as part of your investment plan.
Sincerely,

Jill T. McGruder
President
Touchstone Strategic Trust
Management's Discussion of Fund Performance (Unaudited)
Touchstone Capital Growth Fund
Sub-Advised by Ashfield Capital Partners, LLC
Investment Philosophy and Process
The Fund seeks long-term capital growth by primarily investing in equity securities of large capitalization companies believed to possess above-average growth potential by utilizing an integrated systematic investment process that combines bottom-up fundamental analysis with a top-down, thematic overlay to construct the Fund’s portfolio.
Fund Performance and Market Recap
The Touchstone Capital Growth Fund (Class A Shares) outperformed its benchmark, the Russell 1000® Growth Index, for the 12-month period ended June 30, 2014. The Fund’s total return was 27.68 percent (calculated excluding the maximum sales charge) while the total return of the benchmark was 26.92 percent for the same period.
The one-year period ended June 30, 2014, was defined by a recovering economy in Europe, the emergence of inflation in Japan and strength in the U.S. domestic economy. Additionally, as global growth accelerated during the second half of 2013, aided by manufacturing activity and an improvement in global trade, the market rallied as U.S. corporate profits reached all-time highs. Monetary easing throughout developed economies helped support investments with more risk in general, while slow global growth and a strong U.S. dollar caused many investors to favor U.S. stocks over emerging- and developed-market international stocks.
Portfolio Review
The best performing areas of the large-cap market during the period tended to be those stocks that were smaller in capitalization, higher in beta1, lower in yield and higher in growth. These were all areas in which the Fund tended to have a predisposition, and the result for the one-year period was positive.
While the Fund outperformed during this period of strong returns, there were challenges. From a market sector standpoint, the defensively oriented Telecommunication Services, Utilities and Consumer Staples sectors were significant underperformers, and the Fund was significantly underweight in those areas. The Fund’s largest detracting sector was Information Technology. Specifically, while some high-growth stocks were rewarded, many companies that did not meet expectations were punished.
Among the individual stocks that contributed to performance were Apple Inc. (Information Technology sector), United Rentals Inc. (Industrials sector) and Schlumberger N.V. (Energy sector). Apple, a designer and developer of consumer electronics, personal computers and software, succumbed to investor pressures and announced a major share buyback program and increased its quarterly dividend. The market’s expectations for Apple’s new products and product enhancements also helped drive the stock higher. Additionally, Apple’s acquisition of audio products producer Beats Electronics was viewed favorably, which further benefited the stock. United Rentals, an equipment rental company, continued to exceed its quarterly earnings estimates as construction activity in the U.S. gained momentum during the period. United Rentals also announced two acquisitions (National Pump Co. and Blue-Stream Services LLC) that were viewed favorably by investors. Schlumberger, an oilfield services company, benefited from rising oil and gas prices. The company’s worldwide drilling also continued to grow while its reservoir mapping business experienced significant success. Additionally, Schlumberger increased its dividend and exceeded earnings expectations in all four quarters during the one-year period.
Among the individual stocks that detracted from Fund performance were Lululemon Athletica Inc., Urban Outfitters Inc. (both from the Consumer Discretionary sector) and LinkedIn Corp. (Information Technology sector). Lululemon Athletica, a designer and retailer of athletic apparel, declined based on issues ranging from
Management's Discussion of Fund Performance (Unaudited) (Continued)
a change in management to supply-chain failures. Reductions in the company’s earnings-per-share guidance and a less than favorable reaction to its new chief executive officer also contributed to the stock’s underperformance. The stock was subsequently sold from the Fund’s portfolio. LinkedIn, a business-oriented social networking site, issued guidance below expectations during the period and also issued secondary shares—both of which impacted the stock. Urban Outfitters, a specialty retail company, announced its same-store sales growth had slowed as the weak retail environment weighed on performance. Poor weather in the beginning of 2014 also led to slowing sales trends.
Outlook and Conclusion
We believe the outlook for equities remains positive, but, as we move into the second half of 2014, opportunities for gains and risks of setbacks appear to be more evenly balanced than earlier in the year. We believe that maintaining the economy’s pace depends on a slow but gradually improving economic outlook with few if any pressures from inflation and interest rates. The leading economic indicators, however, have been improving for the last few months, and it appears that the U.S. economy will likely strengthen, on a sustained basis, during the second half of 2014. In our opinion, all of this suggests that the path toward interest-rate and bond-yield normalization could begin in 2015. The result could be an increase in equity market volatility.
We believe equities will require an acceleration of revenue and earnings growth from the low-single-digit levels of recent quarters in order to move meaningfully higher. While we expect this improvement of revenue and earnings growth to begin in the third quarter of 2014, we have yet to see solid evidence of this trend. All of this aside, we do not anticipate a shift back to the risk-on/risk-off markets of years’ past. Instead, we expect a continuation of dispersion in individual stock performance based on individual company performance and fundamentals.
1Beta is a measure of the volatility of a portfolio relative to its benchmark.
Management's Discussion of Fund Performance (Unaudited) (Continued)
Comparison of the Change in Value of a $10,000 Investment in the
Touchstone Capital Growth Fund - Class A* and the Russell 1000® Growth Index

| * | The chart above represents performance for Class A shares only, which will vary from the performance of Class C shares, Class Y shares and Institutional Class shares based on the differences in loads and fees paid by shareholders in the different classes. Class A, Class C, Class Y and Institutional Class shares commenced operations on September 30, 2003, April 12, 2012, November 29, 1996 and December 20, 2006, respectively. Class A shares, Class C shares and Institutional shares performance was calculated using the historical performance of Class Y shares for the periods prior to September 30, 2003, April 12, 2012 and December 20, 2006, respectively. The returns have been restated for sales charges and for fees applicable to Class A, Class C and Institutional Class shares. The Russell 1000® Growth Index's returns are based on the inception date of the Fund. |
| ** | The average annual total returns shown above are adjusted for maximum applicable sales charges. The maximum offering price per share of Class A shares is equal to the net asset value (“NAV”) per share plus a sales load equal to 6.10% of the NAV (or 5.75% of the offering price). Class C shares are subject to a contingent deferred sales charge (“CDSC”) of 1.00%. The CDSC will be assessed on an amount equal to the lesser of (1) the NAV at the time of purchase of the shares being redeemed or (2) the NAV of such shares being redeemed if redeemed within a one-year period from date of purchase. Class Y shares and Institutional Class shares are not subject to sales charges. |
The performance of the above Fund does not reflect the deduction of taxes that a shareholder would pay on Fund distributions or the redemption of Fund shares.
Note to Chart
The Russell 1000® Growth Index measures the performance of those Russell 1000 companies with higher price-to-book ratios and higher forecasted growth values.
The Frank Russell Company (FRC) is the source and owner of the data contained or reflected in this material and all trademarks and copyrights related thereto. The material may contain confidential information and unauthorized use, disclosure, copying, dissemination or redistribution is strictly prohibited. This is a Touchstone Investments presentation of the data, and FRC is not responsible for the formatting or configuration of this material or for any inaccuracy in the presentation thereof.
Management's Discussion of Fund Performance (Unaudited)
Touchstone International Small Cap Fund
Sub-Advised by Copper Rock Capital Partners LLC
Investment Philosophy
TheTouchstone International Small Cap Fund seeks capital appreciation by primarily investing in equity securities of non-U.S. small-cap companies diversified across sectors and industries. The Fund’s investment process seeks to add value through bottom-up stock selection and in-depth fundamental research and searches for companies believed to have strong management, superior earnings growth prospects and attractive relative valuations.
Fund Performance
TheTouchstone International Small Cap Fund (Class A Shares) underperformed its benchmark, the S&P Developed Ex-U.S. Small Cap Index, for the 12-month period ended June 30, 2014. The Fund’s total return was 24.74 percent (calculated excluding the maximum sales charge) while the total return of the benchmark was 29.95 percent.
Market Environment
For the 12-month period ended June 30, 2014, global markets experienced a strong run despite some fits and starts in response to global economic concerns. The beginning of the period was dominated by macroeconomic news which increased stock performance correlations regardless of fundamental differences between stocks. A surge of broad economic expectations advanced markets. The U.S. economy was viewed as strong enough to thrive without monetary stimulus. Overseas, expectations soared for international corporations, which were highly sensitive to the global demand chain driven by the U.S. consumer. Companies with leveraged balance sheets, low or no current earnings, low earnings growth rates and/or low profitability saw their stocks rally the most in response to this upturn in general expectations.
By October 2013, investors witnessed a snapback in the markets. Stocks with strong fundamentals were rewarded over non-earning and lower-quality stocks. Amid generally solid performance across sectors, investors grew more confident that a broad-based recovery was in place. The U.S. Federal Reserve Board (Fed) confirmed that interest rates would remain low, despite the central bank beginning to taper its quantitative easing, and equity markets surged throughout the remainder of 2013. However, emerging markets faltered relative to developed markets during the fourth quarter of 2013, as the financing environment grew more difficult compared to previous periods.
Though the markets sustained their predominantly positive momentum into the first quarter of 2014, it was not without volatility. U.S. investors grew uncertain about the economy, higher valuations and the impact of unusually harsh winter weather. Outside the U.S., worries resurfaced about a softening economy in China and concerns grew over the Fed’s decision to taper quantitative easing. In particular, emerging markets were negatively impacted, as investors in those markets were concerned about a tightening U.S. economy and tougher access to capital. As a result, investors retracted, which led to extreme outflows in the region. Conversely, Europe’s market was more successful as a result of the austerity measures and tight reforms previously enacted by the European Central Bank.
The end of the first quarter of 2014 was marked by slower-than-expected gross domestic product (GDP) data in the U.S. This led to a quick rotation in the global markets at the start of the second quarter, as stocks that had gained in the previous quarter tended to decline with no fundamental reason behind the underperformance. May was positive as investors received favorable news about GDP improvement, sluggish consumer data from the first quarter was blamed on harsh winter weather and consumers seemed willing to engage again. In June, that same rotation came back in fits and starts as deeper value stocks rallied, and winners once again fell to the end of the pack. This turn of events lowered some of the richer valuations, particularly in the U.S., which was
Management's Discussion of Fund Performance (Unaudited) (Continued)
more expensive than the rest of the world given its strong market run. By the end of the 12-month period, global markets were generally resilient and able to weather the various structural shifts occurring around the world. Global markets inched higher, spurred by the steady low-rate environment that benefited dividend-paying stocks. Central banks around the world either continued to pursue quantitative easing or to hold steady. Stocks rallied as the global economy trended toward recovery mode.
Portfolio Review
Stock selection within the Consumer Staples sector contributed most to the Fund’s relative return, while a slight overweight allocation in that sector was a slight detractor. Stock selection within the Telecommunication Services and Industrials sectors also contributed to performance, while stock selection within the Information Technology sector detracted most from relative returns, followed by underperformance within the Financials, Utilities and Consumer Discretionary sectors.
Among the individual stocks that contributed to Fund performance were Greencore Group PLC (Consumer Staples sector), Hanssem Co. Ltd., Plastic Omnium SA (both from the Consumer Discretionary sector) and Hargreaves Lansdown PLC (Financials sector). Greencore Group is an Ireland-based company that prepares packaged foods for convenience stores and the quick-service restaurant market. The company posted strong earnings during the period, as it continued to successfully execute its growth plan in the U.S. via contracts with 7-Eleven Inc. and Starbucks Corp. Hanssem Co., a South-Korea based manufacturer of cabinetry and other furniture for homes and restaurants, continued to reap the benefits of its early entry and dominance of the “B2C” (business to consumer) retail store channel, which significantly raised the company’s brand awareness. Furthermore, Hanssem’s recent broadening into the interior furniture market diversified its target markets and increased its cross sales, and the company now has a sizeable market share of the top interior furniture brands in Korea. Plastic Omnium is a France-based manufacturer of plastic components and emission-control systems for the automobile industry. The company posted rapid growth and improved margins, which were driven by the increased penetration of plastic fuel tanks in emerging markets and emissions control in developed markets. Most recently, in the second quarter of 2014, the stock declined. Following the company’s long-term outperformance and contribution to the Fund, we began to trim the position. Hargreaves Lansdown is a U.K.-based investment management and advisory firm. The company experienced significant revenue growth, which was driven by the rapid accumulation of customers and assets under management via its direct-to-consumer platform. Based on the company’s success, we sold the stock during the final quarter of 2013.
Among the stocks that detracted from relative returns included China Child Care Corp. (Consumer Staples sector), Barco NV (InformationTechnology sector) and Intertape Polymer Group Inc. (Materials sector). China Child Care, formerly known as Prince Frog International Holdings Ltd., is a China-based manufacturer and distributor of infant and children’s products. During the period, China Child Care was the target of a report issued by Glaucus Research Group, which alleged the company had potentially inflated its sale figures and underreported and underpaid income taxes. As a result of this report, the stock price fell and trading was later halted. Trading eventually resumed following the company’s own audit and two external third-party audits, which attempted to reassure investors of no wrongdoing. However, the stock price continued to fall and we exited the position in favor of other opportunities. Barco, a Belgium-based international provider of high-quality audio-visual systems, lagged amid a transition period as the digital conversion of European and American cinemas reached saturation. However, despite having met with company management, we believe that Barco’s new product launches were delayed because costs were too high to drive significant early adoption. We sold the position in favor of other opportunities. Shares of Intertape Polymer Group, a Canada-based commercial adhesives company, declined as the result of profit taking after the stock increased significantly in 2013.
Management's Discussion of Fund Performance (Unaudited) (Continued)
Outlook
Overall, our outlook for the markets has been relatively stable since the start of 2014. Positive growth of global GDP was driven by private industrial spending rather than government spending — led primarily by the developed markets, which have typically outpaced emerging economies.The economic environment in the U.S. has improved, and the Fed’s tapering of bond purchases has been pushed out to later into 2015, implying a longer interval of low short-term interest rates. We believe the strength of the U.S. economy remains at the core of the global growth scenario, and recent U.S. employment and consumer confidence levels imply that steady growth can continue and withstand any inflationary fears. Outside the U.S., continental Europe and U.K. markets have experienced strong performance and valuations have increased. Japan’s bold steps toward domestic stimulus have also showed modest signs of success. Japanese exporters have benefited from the lower yen, and the country’s tax increase in April did not result in a consumer collapse as previously feared. In light of this backdrop, the Fund ended the period with an overweight position to Japan. In addition, due to the value rotation during the second quarter of 2014, multiples in some of the best growth companies have adjusted, thereby offering new entry opportunities for the Fund.
Management's Discussion of Fund Performance (Unaudited) (Continued)
Comparison of the Change in Value of a $10,000 Investment in the
Touchstone International Small Cap Fund - Class A* and the
S&P Developed Ex-U.S. Small Cap Index

| * | The chart above represents performance for Class A shares only, which will vary from the performance of Class C shares, Class Y shares and Institutional Class shares based on the differences in loads and fees paid by shareholders in the different classes. Class A, Class C, Class Y and Institutional Class shares commenced operations on July 31, 2003, April 12, 2012, December 31, 1996 and December 20, 2006, respectively. Class A shares, Class C shares and Institutional shares performance was calculated using the historical performance of Class Y shares for the periods prior to July 31, 2003, April 12, 2012 and December 20, 2006, respectively. The returns have been restated for sales charges and for fees applicable to Class A, Class C and Institutional Class shares. The S&P Developed Ex-U.S. Small Cap Index's returns are based on the inception date of the Fund. |
| ** | The average annual total returns shown above are adjusted for maximum applicable sales charges. The maximum offering price per share of Class A shares is equal to the net asset value (“NAV”) per share plus a sales load equal to 6.10% of the NAV (or 5.75% of the offering price). Class C shares are subject to a contingent deferred sales charge (“CDSC”) of 1.00%. The CDSC will be assessed on an amount equal to the lesser of (1) the NAV at the time of purchase of the shares being redeemed or (2) the NAV of such shares being redeemed if redeemed within a one-year period from date of purchase. Class Y shares and Institutional Class shares are not subject to sales charges. |
The performance of the above Fund does not reflect the deduction of taxes that a shareholder would pay on Fund distributions or the redemption of Fund shares.
Note to Chart
The S&P Developed Ex-U.S. Small Cap Index is an unmanaged index of small-cap stocks from developed countries, excluding the United States.
Management's Discussion of Fund Performance (Unaudited)
Touchstone Small Cap Value Opportunities Fund
Sub-Advised by Thompson, Siegel & Walmsley LLC
Investment Philosophy
The Fund seeks long-term capital growth by primarily investing in equity securities of small-cap companies that are believed to present value that is not reflected by prevailing market prices or that have experienced fundamental changes and are intrinsically undervalued by the investment community. Using a combination of quantitative and qualitative methods, a company’s attractiveness is assessed in an effort to understand why the market may be mispricing the stocks, what factors are changing that can return the stock to fair value and whether those changes are sustainable over a medium term investment horizon based on both absolute and sector-relative valuation of cash flows, the relative earnings prospects of the company and the stock’s recent price action.
Fund Performance
The Touchstone Small Cap Value Opportunities Fund (Class A Shares) outperformed its benchmark, the Russell 2000® Value Index, for the 12-month period ended June 30, 2014. The Fund’s total return was 33.35% (calculated excluding the maximum sales charge) while the total return of the benchmark was 22.54% for the same period.
Market Environment
During the period, the market continued to shift away from macro-economic and political themes, and was increasingly focused on stock-specific drivers such as earnings results and forward-year estimates. While small-cap stocks posted strong absolute returns, they underperformed large-cap stocks during the 12-month period. There was a wide range of sector returns during this period, with the Energy sector leading the small-cap market as oil-sensitive stocks benefited from the increase in crude prices. Conversely, the Consumer Discretionary sector underperformed as the combination of an unseasonably cold winter and weak consumer spending patterns among low-end retailers weighed on many retailing companies. The Financials sector also underperformed. During the period, there was an increase in mergers and acquisitions (M&A) activity, especially within the Health Care sector, as companies searched for growth avenues.
Portfolio Review
Within the Fund, stock selection in the Health Care sector was a top contributor to relative performance, as the Fund’s specialty pharmaceutical positions benefited from multiple catalysts, including M&A activity, positive drug-trial results and increased demand. In addition to Health Care, M&A activity was also evident in other Fund holdings and contributed further to performance in multiple sectors that included Consumer Discretionary, Utilities, Financials and Consumer Staples. Within the Consumer Discretionary sector, weak spending patterns from the low-end-retail consumer base weighed on select retail positions. Within the Financial Services sector, industry-wide regulatory issues and the impact of falling gold prices on pawn-related transactions, negatively impacted the Fund’s consumer finance-related stocks.
Among the individual stocks that contributed to Fund performance were Leap Wireless International Inc. (Utilities sector), Furiex Pharmaceuticals (Health Care sector) and GT Advanced Technologies (Energy sector). Leap Wireless International, a prepaid wireless provider, was acquired by AT&T Inc. at an attractive premium, which benefited the stock. Furiex Pharmaceuticals, a specialty drug maker, rallied after the company announced positive clinical trial results for its drug for irritable bowel syndrome. Furiex Pharmaceuticals was also later acquired at an attractive premium, which further benefited the company’s stock. GT Advanced Technologies, a maker of solar technology, gained traction as a result of its production of sapphire materials, which are used in displays for Apple’s lineup of iOS devices such as the iPhone, iPad and iPod.
Management's Discussion of Fund Performance (Unaudited) (Continued)
Among the individual stocks that detracted from Fund performance were DFC Global Corp. (Financials sector), Rent-A-Center Inc. and World Wrestling Entertainment Inc. (both from the Consumer Discretionary sector). DFC Global, a specialty consumer finance company, came under pressure as a result of new regulations and guidelines from the United Kingdom for short-term loans. Rent-A-Center Inc., a rent-to-own retailer, continued to grow its kiosk business, but weak demand from the lower-end consumer base detracted from overall stock performance. World Wrestling Entertainment, a professional wrestling entertainment company, was weighed down by disappointing television license negotiations and weaker-than-anticipated guidance. However, we believe the company is significantly undervalued at current levels versus other professional sports franchises, and has an opportunity to significantly increase revenues as television viewers’ transition from pay-per-view to the new subscription-based model.
Outlook
As the U.S. economy continues to strengthen, smaller companies, which tend to be more cyclical, will likely benefit from a pickup in both consumer and corporate spending. We believe this trend will present the greatest opportunity for the Fund going forward. Conversely, we have been prompted to trim some of the Fund’s strong performers as stock prices have continued to rally and push up valuations.
We continue to believe the Fund will be at an advantage due to its significant valuation discount and what we believe are attractive growth characteristics relative to its benchmark and peer universe averages. Additionally, the market continues to display encouraging signs that investors are differentiating between stocks based on fundamentals rather than macro developments — an environment in which stock picking is at its best. Based on this outlook, we will continue to search for mispriced securities, on a cash-flow basis, that are exhibiting signs of positive change. While our basis for purchasing positions revolves around a bottom-up approach rather than sector or top-down themes, the Fund exhibits overweight sector positions versus the benchmark. Specifically, we expect to continue to identify what we believe are attractive companies within the Consumer Discretionary and Health Care sectors.
Going forward, we believe conditions are ripe for M&A activity to pick up further. As confidence in the recovery grows, valuations rise and interest-rate hikes loom, we expect companies will feel mounting pressure to make strategic acquisitions in order to bolster their otherwise weak organic growth rates. Increased M&A activity has the potential to benefit the Fund.
Management's Discussion of Fund Performance (Unaudited) (Continued)
Comparison of the Change in Value of a $10,000 Investment in the Touchstone
Small Cap Value Opportunities Fund - Class A* and the Russell 2000® Value Index
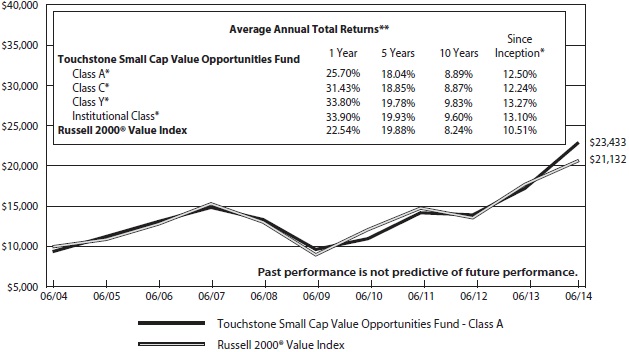
| * | The chart above represents performance for Class A shares only, which will vary from the performance of Class C shares, Class Y shares and Institutional Class shares based on the differences in loads and fees paid by shareholders in the different classes. Class A, Class C, Class Y and Institutional Class shares commenced operations on July 31, 2003 April 12, 2012, July 25, 2003 and December 9, 2008, respectively. Performance information presented prior to July 25, 2003 for Class Y shares includes performance of a predecessor fund whose inception date was July 31, 2000. Class A shares, Class C shares and Institutional Class shares performance was calculated using the historical performance of Class Y shares for periods prior to July 31, 2003, April 12, 2012 and December 9, 2008, respectively. The returns have been restated for sales charges and for fees applicable to Class A, Class C and Institutional Class shares. The Russell 2000® Value Index's returns are based on the inception date of the Fund. |
| ** | The average annual total returns shown above are adjusted for maximum applicable sales charges. The maximum offering price per share of Class A shares is equal to the net asset value (“NAV”) per share plus a sales load equal to 6.10% of the NAV (or 5.75% of the offering price). Class C shares are subject to a contingent deferred sales charge (“CDSC”) of 1.00%. The CDSC will be assessed on an amount equal to the lesser of (1) the NAV at the time of purchase of the shares being redeemed or (2) the NAV of such shares being redeemed if redeemed within a one-year period from date of purchase. Class Y shares and Institutional Class shares are not subject to sales charges. |
The performance of the above Fund does not reflect the deduction of taxes that a shareholder would pay on Fund distributions or the redemption of Fund shares.
Note to Chart
The Russell 2000® Value Index measures the performance of those Russell 2000 companies with lower price-to-book ratios and lower forecasted growth values.
The Frank Russell Company (FRC) is the source and owner of the data contained or reflected in this material and all trademarks and copyrights related thereto. The material may contain confidential information and unauthorized use, disclosure, copying, dissemination or redistribution is strictly prohibited. This is a Touchstone Investments presentation of the data, and FRC is not responsible for the formatting or configuration of this material or for any inaccuracy in the presentation thereof.
Management's Discussion of Fund Performance (Unaudited)
Touchstone Value Fund
Sub-Advised by Barrow, Hanley, Mewhinney & Strauss, LLC
Investment Philosophy and Process
The Touchstone Value Fund seeks long-term growth by primarily investing in equity securities of large- and mid-cap companies believed to be undervalued. The Fund uses traditional methods of stock selection—research and analysis—to identify companies that have price-to-earnings and price-to-book ratios below the market, that also have above-average dividend yields and that focus on companies that are out of favor due to internal or external challenges judged to be short-term in nature. Stock selection is driven by fundamental analysis on individual companies rather than by broad market themes.
Fund Performance
The Touchstone Value Fund (Class A Shares) underperformed its benchmark, the Russell 1000® Value Index, for the 12-month period ended June 30, 2014. The Fund’s total return was 21.50 percent (calculated excluding the maximum sales charge) while the total return of the benchmark was 23.81 percent.
Market Environment
Following strong performance in the latter half of 2013, equity markets around the globe remained resilient through the first half of 2014. Investors continued to drive equities higher despite a number of geopolitical risks, including the Iraqi sectarian violence and its impact on oil prices, concerns that Argentina is on the precipice of a technical default, the continuing dispute between Russia and Ukraine and fears of a slowdown in China. During the period, the market was increasingly focused on stock-specific drivers such as earnings results and estimates, as it shifted away from macroeconomic and political themes. The market was also characterized by a recovering economy in Europe, the emergence of inflation in Japan and strength in the U.S. domestic economy. Monetary easing throughout developed economies helped to keep interest rates in check, while slowing global growth and a strong U.S. dollar caused many investors to favor U.S. stocks over emerging- and developed-market international stocks. During the period, mid-cap stocks outperformed large- and small-capitalization stocks. Low- and non-dividend-paying stocks dominated the benchmark and growth outperformed value, as well.
Portfolio Review
During the 12-month period, sectors that contributed most to the Fund’s absolute performance were Health Care, Financials and Industrials. The Telecommunication Services, Utilities and Materials sectors were the largest detractors.
Among the individual stocks that contributed to performance during the period were Raytheon Co. (Industrials sector), Cardinal Health Inc. (Health Care sector) and ConocoPhillips (Energy sector). Raytheon Co., a defense contractor, continued to execute on its restructuring targets, which drove positive earnings revisions during the period. In general, large defense contractors continued their outperformance as federal budget sequester fears eased and investors started focusing on cash flow. Additionally, the company continued to benefit from increased pension funding. Cardinal Health, a health care service provider, experienced a positive turnaround of its drug distribution business, which was the premise for originally purchasing the stock. The market also realized the company’s potential benefits from patent expirations and a new partnership with CVS Caremark Corp., which would leverage its generic drug purchasing scale. The stock appeared fairly valued and we exited the position during the period. ConocoPhillips, an integrated energy company and refiner, rose during the fiscal year, driven by strong results and renewed investor confidence in the restructuring plan that was laid out by management earlier in the period. Additionally, the company’s production growth exceeded its guidance for the year and cash margins increased, both of which further helped the stock. The improvements came from several initiatives, including the company’s continued drilling success in the prolific, liquids-rich Eagle Ford
Management's Discussion of Fund Performance (Unaudited) (Continued)
shale play in south Texas, where ConocoPhillips identified new drilling locations and expects to grow. As such, we believe ConocoPhillips’ pledge to grow production and achieve margin improvements in order to improve cash flow impressed a previously skeptical market. We think the company’s continued success in executing on production and margin growth should result in the stock bridging the valuation gap with its peer group.
Among the individual stocks that detracted from performance were Target Corp. (Consumer Discretionary sector), Philip Morris International Inc. (Consumer Staples sector) and SLM Corp. (Financials sector). Discount retailer Target Corp. underperformed during the period, as the company’s aggressive launch in Canada proved more difficult than anticipated. The Canadian launch was problematic due to systems challenges, in-stock problems and a pricing perception issue. However, we believe the market is underestimating Target’s potential for recovery and subsequent accretion in Canada. Additionally, weaker-than-expected U.S. customer traffic and sales, the lingering effects of a credit card breach during 2013 and uncertainty surrounding leadership changes, negatively impacted the stock. Going forward, we expect Target’s same-store sales in the U.S. to recover as data breach concerns continue to fade and comparisons ease, with further benefits stemming from Target’s REDcard loyalty-card program, pharmacy benefits program and omni-channel initiatives. Philip Morris International Inc., a producer of cigarettes and tobacco products, declined after the company lowered its earnings-per-share (EPS) growth forecast at its bi-annual investor meeting in June 2014. Philip Morris also noted that heightened trade promotional activity in Australia could cause its EPS growth forecast to be reduced further, depending upon market dynamics over the next several months. On a positive note, demand for the company’s tobacco products in Europe improved and the company continued to gain share in what we believe to be a highly profitable market. Additionally, market shares in the important Indonesian and Japanese markets stabilized, and the company continued to increase share and profitability in North and South America, in Africa and the Middle East and in Southeast Asia. In addition, during the June investor meeting, Philip Morris announced that it was markedly increasing its investments in reduced risk products (RRPs) over the next two to three years. After more than 10 years and $2 billion invested in research and development outlays, the company appears confident that its RRPs have the potential to become strong contributors to earnings growth in the future. And, after positive and convincing results from test markets, the company expects to roll out its first generation RRP heated (not combusted) tobacco products to select Italian and Japanese cities in the near term. SLM, an originator and servicer of student loans, came under pressure during the first quarter of 2014 amid regulatory concerns regarding federal student loans and falling interest rates, which sent company shares lower. In May, SLM spun off its lower-growth loans and student loan servicing business, which we believe will allow SLM to improve returns to shareholders through more specialized strategies. Additionally, we believe SLM is well-positioned to generate solid earnings and loan growth through the company’s more profitable private student loan business. Furthermore, the stock should also experience price-to-earnings expansion as the market begins to value the stock more similarly to that of mid-cap banks.
The Fund’s disciplined process of buying stocks at a valuation discount to the market, with higher quality earnings and balance sheets and dividend yields higher than the market, led to more opportunities in large-and mega-cap companies during the period. We believe it is important to note, the Fund’s process is not beholden to this area of the market it has been simply where value was found. Despite these trends and the Fund’s heavier allocation to higher-quality, higher-yielding, lower-valuation, large- and mega-cap stocks, the Fund was able to participate in and largely keep pace with, the rapid rise of its benchmark over the past 12-month period. Importantly, we believe a reversal of these trends—which started as market returns moderated during the first quarter of 2014—should help to add more meaningful value versus the benchmark going forward.
Outlook
As we move into the second half of the year, markets are continuing to move calmly higher, and the quiet calm is reflected in the lack of market volatility. Whether this market advance reflects an improving, stable outlook or simply reflects investor complacency before a storm, remains to be seen. As the bull market advance is prolonged,
Management's Discussion of Fund Performance (Unaudited) (Continued)
we believe it appears that the market outlook is increasingly dependent upon a continuation of low interest rates and inflation, and/or an acceleration of revenues and earnings.
We have begun to see an important component of inflation—unit labor costs—move sharply higher, which could also pressure interest rates and market valuations going forward. Moreover, as the U.S. Federal Reserve Board continues to taper its quantitative easing and interest rates rise, this key support for the market will likely moderate. As key economic indicators picked up, the debate over revenue and earnings growth forecasts has grown. Part of the controversy stems from the severe winter in the U.S., which meaningfully impacted many companies’ revenues and earnings. While companies have managed to squeeze robust profit growth out of anemic revenue growth, we believe they will become increasingly dependent on increased revenues to fuel future profit growth. At the same time, we believe companies will continue to pursue growth and attempt to create shareholder value by repurchasing stock, increasing dividends and making acquisitions. However, should interest rates rise meaningfully, it is likely that companies would curtail some return or uses of capital until rates stabilize. Should higher interest rates or a slowdown in earnings cause a meaningful pullback in equity markets, we believe the Fund is well-positioned and should exhibit defensive characteristics and meaningful downside protection. While we cannot predict the level of interest rates, we do expect the Financials and Health Care sectors should fare well if interest rates rise. Should interest rates rise sharply (as they did in mid-2013), we believe the most vulnerable areas of the market would likely be the highest-yielding sectors such as Utilities, real estate investment trusts and master limited partnerships. While these sectors led the market in 2014, the Fund had little to no exposure, as we viewed most companies in these areas as richly valued. We seek what we believe to be strong dividend growth opportunities, derived from above-average earnings and cash flow prospects. It is important to remember that companies have different profiles with respect to valuation and earnings, capital deployment and sensitivity to higher interest rates (should rates rise). The Fund’s strategy seeks companies that are out of favor and whose earnings prospects are being questioned. We also place a focus on a company’s capital allocation discipline (preferring growing dividend payouts) and sensitivity to different interest rate scenarios.
Management's Discussion of Fund Performance (Unaudited) (Continued)
Comparison of the Change in Value of a $10,000 Investment in the
Touchstone Value Fund - Class A* and the Russell 1000® Value Index
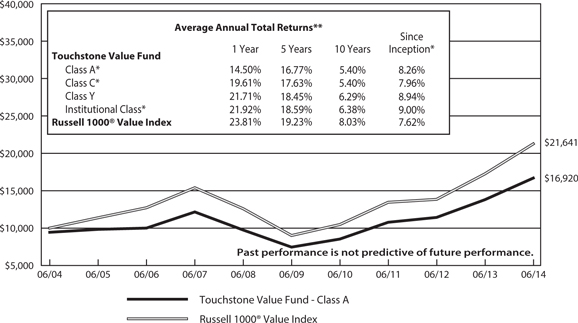
| * | The chart above represents performance for Class A shares only, which will vary from the performance of Class C shares, Class Y shares and Institutional Class shares based on the differences in loads and fees paid by shareholders in the different classes. Class A, Class C, Class Y and Institutional Class shares commenced operations on July 31, 2003, April 12, 2012, September 10, 1998 and December 20, 2006, respectively. Class A shares, Class C shares and Institutional Class shares performance was calculated using the historical performance of Class Y shares for the periods prior to July 31, 2003, April 12, 2012 and December 20, 2006, respectively. The returns have been restated for sales charges and for fees applicable to Class A, Class C and Institutional Class shares. The Russell 1000® Value Index's returns are based on the inception date of the Fund. |
| ** | The average annual total returns shown above are adjusted for maximum applicable sales charges. The maximum offering price per share of Class A shares is equal to the net asset value (“NAV”) per share plus a sales load equal to 6.10% of the NAV (or 5.75% of the offering price). Class C shares are subject to a contingent deferred sales charge (“CDSC”) of 1.00%. The CDSC will be assessed on an amount equal to the lesser of (1) the NAV at the time of purchase of the shares being redeemed or (2) the NAV of such shares being redeemed if redeemed within a one-year period from date of purchase. Class Y shares and Institutional Class shares are not subject to sales charges. |
The performance of the above Fund does not reflect the deduction of taxes that a shareholder would pay on Fund distributions or the redemption of Fund shares.
Note to Chart
The Russell 1000® Value Index measures those Russell 1000 companies with lower price-to-book ratios and lower expected growth values.
The Frank Russell Company (FRC) is the source and owner of the data contained or reflected in this material and all trademarks and copyrights related thereto. The material may contain confidential information and unauthorized use, disclosure, copying, dissemination or redistribution is strictly prohibited. This is a Touchstone Investments presentation of the data, and FRC is not responsible for the formatting or configuration of this material or for any inaccuracy in the presentation thereof.
Tabular Presentation of Portfolios of Investments (Unaudited)
June 30, 2014
The tables below provide each Fund’s sector allocation. We hope it will be useful to shareholders as it summarizes key information about each Fund’s investments.
| Touchstone Capital Growth Fund | | | |
| Sector Allocation* | | (% of Net Assets) | |
| Information Technology | | | 25.4 | % |
| Consumer Discretionary | | | 20.8 | |
| Industrials | | | 15.1 | |
| Health Care | | | 13.9 | |
| Energy | | | 7.9 | |
| Consumer Staples | | | 7.6 | |
| Financials | | | 5.3 | |
| Materials | | | 2.0 | |
| Investment Funds | | | 2.0 | |
| Other Assets/Liabilities (Net) | | | 0.0 | |
| Total | | | 100.0 | % |
| Touchstone International Small Cap Fund | | | |
| Sector Allocation* | | (% of Net Assets) | |
| Industrials | | | 21.5 | % |
| Consumer Discretionary | | | 18.0 | |
| Financials | | | 15.4 | |
| Materials | | | 9.4 | |
| Consumer Staples | | | 8.1 | |
| Health Care | | | 7.2 | |
| Information Technology | | | 6.1 | |
| Energy | | | 2.9 | |
| Telecommunication Services | | | 2.5 | |
| Utilities | | | 1.8 | |
| Exchange Traded Fund | | | 2.9 | |
| Investment Funds | | | 7.2 | |
| Other Assets/Liabilities (Net) | | | (3.0 | ) |
| Total | | | 100.0 | % |
| Touchstone Small Cap Value Opportunities Fund |
| Sector Allocation* | | (% of Net Assets) | |
| Financials | | | 30.2 | % |
| Consumer Discretionary | | | 17.8 | |
| Industrials | | | 14.4 | |
| Information Technology | | | 11.4 | |
| Health Care | | | 7.7 | |
| Energy | | | 5.0 | |
| Materials | | | 3.2 | |
| Utilities | | | 2.8 | |
| Consumer Staples | | | 2.6 | |
| Telecommunication Services | | | 1.0 | |
| Exchange Traded Fund | | | 0.9 | |
| Investment Funds | | | 21.1 | |
| Other Assets/Liabilities (Net) | | | (18.1 | ) |
| Total | | | 100.0 | % |
| Touchstone Value Fund | | | |
| Sector Allocation* | | (% of Net Assets) | |
| Financials | | | 25.1 | % |
| Health Care | | | 19.6 | |
| Energy | | | 11.7 | |
| Information Technology | | | 10.7 | |
| Industrials | | | 9.3 | |
| Consumer Discretionary | | | 8.4 | |
| Consumer Staples | | | 5.9 | |
| Telecommunication Services | | | 4.1 | |
| Materials | | | 2.0 | |
| Utilities | | | 1.1 | |
| Investment Funds | | | 4.0 | |
| Other Assets/Liabilities (Net) | | | (1.9 | ) |
| Total | | | 100.0 | % |
* Sector classifications are based upon the Global Industry Classification Standard (GICS®).
Portfolio of Investments
Touchstone Capital Growth Fund – June 30, 2014
| | | | | | Market | |
| | | Shares | | | Value | |
| | | | | | | |
| Common Stocks — 98.0% | | | | | | | | |
| | | | | | | | | |
| Information Technology — 25.4% | | | | | | | | |
| Adobe Systems, Inc.* | | | 61,730 | | | $ | 4,466,783 | |
| Analog Devices, Inc. | | | 53,230 | | | | 2,878,146 | |
| Apple, Inc. | | | 76,940 | | | | 7,150,034 | |
| ARM Holdings PLC, ADR | | | 64,145 | | | | 2,901,920 | |
| ASML Holding NV, (Netherlands) | | | 21,285 | | | | 1,985,252 | |
| EMC Corp. | | | 77,700 | | | | 2,046,617 | |
| Google, Inc. - Class C* | | | 7,325 | | | | 4,213,926 | |
| Google, Inc. - Class A* | | | 7,325 | | | | 4,282,708 | |
| LinkedIn Corp. - Class A* | | | 13,025 | | | | 2,233,397 | |
| Palo Alto Networks, Inc.* | | | 28,720 | | | | 2,408,172 | |
| Qualcomm, Inc. | | | 25,715 | | | | 2,036,627 | |
| Splunk, Inc.* | | | 53,805 | | | | 2,977,031 | |
| Stratasys Ltd.*† | | | 14,300 | | | | 1,624,909 | |
| Trimble Navigation Ltd.* | | | 112,405 | | | | 4,153,365 | |
| Visa, Inc. - Class A | | | 26,460 | | | | 5,575,387 | |
| | | | | | | | 50,934,274 | |
| | | | | | | | | |
| Consumer Discretionary — 20.8% | | | | | | | | |
| Amazon.com, Inc.* | | | 11,410 | | | | 3,705,740 | |
| Autoliv, Inc.† | | | 20,965 | | | | 2,234,450 | |
| BorgWarner, Inc. | | | 78,205 | | | | 5,098,184 | |
| Las Vegas Sands Corp. | | | 23,850 | | | | 1,817,847 | |
| Michael Kors Holdings Ltd. (British Virgin | | | | | | | | |
| Islands)* | | | 41,415 | | | | 3,671,440 | |
| priceline.com, Inc.* | | | 3,075 | | | | 3,699,225 | |
| Ralph Lauren Corp. | | | 12,585 | | | | 2,022,284 | |
| Restoration Hardware Holdings, Inc.* | | | 26,040 | | | | 2,423,022 | |
| Starbucks Corp. | | | 49,310 | | | | 3,815,608 | |
| Starwood Hotels & Resorts Worldwide, | | | | | | | | |
| Inc. | | | 49,405 | | | | 3,992,912 | |
| Urban Outfitters, Inc.* | | | 73,390 | | | | 2,484,985 | |
| VF Corp. | | | 63,450 | | | | 3,997,350 | |
| Walt Disney Co. (The) | | | 30,795 | | | | 2,640,363 | |
| | | | | | | | 41,603,410 | |
| | | | | | | | | |
| Industrials — 15.1% | | | | | | | | |
| Danaher Corp. | | | 43,735 | | | | 3,443,257 | |
| Flowserve Corp. | | | 42,595 | | | | 3,166,938 | |
| Fluor Corp. | | | 34,990 | | | | 2,690,731 | |
| MasTec, Inc.* | | | 53,335 | | | | 1,643,785 | |
| Precision Castparts Corp. | | | 14,935 | | | | 3,769,594 | |
| Rockwell Automation, Inc. | | | 19,075 | | | | 2,387,427 | |
| Union Pacific Corp. | | | 47,045 | | | | 4,692,739 | |
| United Rentals, Inc.* | | | 40,310 | | | | 4,221,666 | |
| United Technologies Corp. | | | 35,815 | | | | 4,134,842 | |
| | | | | | | | 30,150,979 | |
| | | | | | | | | |
| Health Care — 13.9% | | | | | | | | |
| Biogen Idec, Inc.* | | | 6,665 | | | | 2,101,541 | |
| Celgene Corp.* | | | 53,190 | | | | 4,567,957 | |
| Cerner Corp.* | | | 70,533 | | | | 3,638,092 | |
| Henry Schein, Inc.* | | | 41,490 | | | | 4,923,618 | |
| Shire PLC, ADR | | | 18,755 | | | | 4,416,615 | |
| Thermo Fisher Scientific, Inc. | | | 32,665 | | | | 3,854,470 | |
| Valeant Pharmaceuticals International, | | | | | | | | |
| Inc. (Canada)* | | | 33,620 | | | | 4,240,154 | |
| | | | | | | | 27,742,447 | |
| | | | | | | | | |
| Energy — 7.9% | | | | | | | | |
| Anadarko Petroleum Corp. | | | 27,115 | | | | 2,968,279 | |
| Cameron International Corp.* | | | 49,025 | | | | 3,319,483 | |
| Pioneer Natural Resources Co. | | | 20,990 | | | | 4,823,712 | |
| Schlumberger Ltd. (Cook Islands) | | | 40,595 | | | | 4,788,180 | |
| | | | | | | | 15,899,654 | |
| | | | | | | | | |
| Consumer Staples — 7.6% | | | | | | | | |
| Anheuser-Busch InBev N.V., ADR | | | 34,000 | | | | 3,907,960 | |
| Diageo PLC, ADR | | | 15,950 | | | | 2,029,956 | |
| Estee Lauder Cos., Inc. (The) - Class A | | | 31,115 | | | | 2,310,600 | |
| Hain Celestial Group, Inc. (The)* | | | 27,765 | | | | 2,463,866 | |
| Walgreen Co. | | | 60,635 | | | | 4,494,873 | |
| | | | | | | | 15,207,255 | |
| | | | | | | | | |
| Financials — 5.3% | | | | | | | | |
| Ameriprise Financial, Inc. | | | 48,742 | | | | 5,849,040 | |
| BlackRock, Inc. | | | 14,770 | | | | 4,720,492 | |
| | | | | | | | 10,569,532 | |
| | | | | | | | | |
| Materials — 2.0% | | | | | | | | |
| Monsanto Co. | | | 32,520 | | | | 4,056,545 | |
| Total Common Stocks | | | | | | $ | 196,164,096 | |
| | | | | | | | | |
| Investment Funds — 2.0% | | | | | | | | |
| Invesco Government & Agency | | | | | | | | |
| Portfolio, Institutional Class, | | | | | | | | |
| 0.01%**∞Ω | | | 3,911,290 | | | | 3,911,290 | |
| Touchstone Institutional Money Market | | | | | | | | |
| Fund, 0.01%^∞Ω | | | 13 | | | | 13 | |
| Total Investment Funds | | | | | | $ | 3,911,303 | |
| | | | | | | | | |
| Total Investment Securities —100.0% | | | | | | | | |
| (Cost $121,247,370) | | | | | | $ | 200,075,399 | |
| | | | | | | | | |
| Other Assets in Excess of Liabilities — 0.0% | | | | | | | 23,750 | |
| | | | | | | | | |
| Net Assets — 100.0% | | | | | | $ | 200,099,149 | |
| * | Non-income producing security. |
| ** | Represents collateral for securities loaned. |
| ^ | Affiliated Fund. See Note 4 in Notes to Financial Statements. |
| † | All or a portion of the security is on loan. The total market value of the securities on loan as of June 30, 2014 was $3,799,141. |
Touchstone Capital Growth Fund (Continued)
| Ω | Represents the 7-day SEC yield as of June 30, 2014. |
Portfolio Abbreviations:
ADR - American Depositary Receipt
PLC - Public Limited Company
Other Information:
The inputs or methodology used for valuing securities may not be an indication of the risk associated with investing in those securities. For more information on valuation inputs, and their aggregation into the levels used in the table below, please refer to the security valuation section in the accompanying Notes to Financial Statements.
Valuation inputs at Reporting Date:
| Description | | Level 1 | | | Level 2 | | | Level 3 | | | Total | |
| Common Stocks | | $ | 196,164,096 | | | $ | — | | | $ | — | | | $ | 196,164,096 | |
| Investment Funds | | | 3,911,303 | | | | — | | | | — | | | | 3,911,303 | |
| | | | | | | | | | | | | | | $ | 200,075,399 | |
See accompanying Notes to Financial Statements.
Portfolio of Investments
Touchstone International Small Cap Fund – June 30, 2014
| | | | | | Market | |
| | | Shares | | | Value | |
| | | | | | | | | |
| Common Stocks — 92.9% | | | | | | | | |
| | | | | | | | | |
| Japan — 18.8% | | | | | | | | |
| | | | | | | | | |
| Consumer Discretionary — 3.2% | | | | | | | | |
| Daiichikosho Co. Ltd. | | | 27,100 | | | $ | 777,916 | |
| HIS Co. Ltd. | | | 57,200 | | | | 1,846,345 | |
| Seria Co. Ltd. | | | 33,300 | | | | 1,530,147 | |
| Sumitomo Rubber Industries Ltd. | | | 65,600 | | | | 946,717 | |
| | | | | | | | | |
| Consumer Staples — 0.8% | | | | | | | | |
| Pola Orbis Holdings, Inc.† | | | 32,900 | | | | 1,328,277 | |
| | | | | | | | | |
| Energy — 0.8% | | | | | | | | |
| Japan Petroleum Exploration Co. | | | 30,200 | | | | 1,259,513 | |
| | | | | | | | | |
| Financials — 0.7% | | | | | | | | |
| Monex Group, Inc. | | | 321,000 | | | | 1,188,243 | |
| | | | | | | | | |
| Health Care — 1.9% | | | | | | | | |
| Sawai Pharmaceutical Co. Ltd. | | | 17,400 | | | | 1,025,399 | |
| Ship Healthcare Holdings, Inc. | | | 31,900 | | | | 1,117,862 | |
| Suzuken Co. Ltd. | | | 26,600 | | | | 989,902 | |
| | | | | | | | | |
| Industrials — 6.1% | | | | | | | | |
| COMSYS Holdings Corp. | | | 76,400 | | | | 1,420,080 | |
| Hoshizaki Electric Co. Ltd. | | | 53,200 | | | | 2,651,992 | |
| Kanamoto Co. Ltd. | | | 56,300 | | | | 2,242,441 | |
| Kyowa Exeo Corp. | | | 88,000 | | | | 1,252,613 | |
| Sanwa Holdings Corp. | | | 213,000 | | | | 1,497,024 | |
| Takuma Co. Ltd. | | | 120,000 | | | | 780,613 | |
| | | | | | | | | |
| Information Technology — 2.8% | | | | | | | | |
| Hearts United Group Co. Ltd.† | | | 44,173 | | | | 1,001,583 | |
| Iriso Electronics Co. Ltd.† | | | 38,000 | | | | 2,228,123 | |
| Kakaku.com, Inc. | | | 75,894 | | | | 1,329,765 | |
| | | | | | | | | |
| Materials — 2.5% | | | | | | | | |
| Nippon Paint Co. Ltd. | | | 83,633 | | | | 1,769,993 | |
| Nippon Paper Industries Co. Ltd. | | | 69,000 | | | | 1,298,198 | |
| Tokyo Ohka Kogyo Co. Ltd. | | | 44,400 | | | | 1,059,324 | |
| Total Japan | | | | | | | 30,542,070 | |
| | | | | | | | | |
| United Kingdom — 16.0% | | | | | | | | |
| | | | | | | | | |
| Consumer Discretionary — 4.4% | | | | | | | | |
| boohoo.com PLC* | | | 1,640,553 | | | | 1,235,356 | |
| Halfords Group PLC | | | 181,698 | | | | 1,470,201 | |
| Howden Joinery Group PLC | | | 346,625 | | | | 1,836,581 | |
| Taylor Wimpey PLC | | | 790,053 | | | | 1,541,382 | |
| Thomas Cook Group PLC* | | | 463,792 | | | | 1,059,629 | |
| | | | | | | | | |
| Financials — 2.8% | | | | | | | | |
| Close Brothers Group PLC | | | 64,741 | | | | 1,415,988 | |
| Paragon Group of Cos. PLC | | | 253,484 | | | | 1,527,446 | |
| Savills PLC | | | 141,154 | | | | 1,519,473 | |
| | | | | | | | | |
| Health Care — 0.9% | | | | | | | | |
| Synergy Health PLC | | | 60,494 | | | | 1,459,757 | |
| | | | | | | | | |
| Industrials — 3.9% | | | | | | | | |
| Ashtead Group PLC | | | 101,422 | | | | 1,518,761 | |
| Berendsen PLC | | | 93,888 | | | | 1,573,048 | |
| Northgate PLC | | | 179,681 | | | | 1,612,861 | |
| WS Atkins PLC | | | 70,633 | | | | 1,595,625 | |
| | | | | | | | | |
| Information Technology — 2.1% | | | | | | | | |
| Micro Focus International PLC | | | 136,483 | | | | 2,027,445 | |
| Optimal Payments PLC* | | | 193,831 | | | | 1,326,883 | |
| | | | | | | | | |
| Materials — 0.7% | | | | | | | | |
| Elementis PLC | | | 260,647 | | | | 1,161,117 | |
| | | | | | | | | |
| Telecommunication Services — 1.2% | | | | | | | | |
| TalkTalk Telecom Group PLC | | | 357,767 | | | | 1,992,969 | |
| Total United Kingdom | | | | | | | 25,874,522 | |
| | | | | | | | | |
| Canada — 6.9% | | | | | | | | |
| | | | | | | | | |
| Consumer Discretionary — 0.8% | | | | | | | | |
| Entertainment One Ltd.* | | | 238,053 | | | | 1,262,945 | |
| | | | | | | | | |
| Financials — 2.2% | | | | | | | | |
| Element Financial Corp.* | | | 164,776 | | | | 2,081,609 | |
| Onex Corp. | | | 24,940 | | | | 1,543,076 | |
| | | | | | | | | |
| Industrials — 2.9% | | | | | | | | |
| Horizon North Logistics, Inc. | | | 212,181 | | | | 1,523,177 | |
| Stantec, Inc. | | | 21,013 | | | | 1,301,288 | |
| Westjet Airlines Ltd. | | | 73,150 | | | | 1,796,101 | |
| | | | | | | | | |
| Materials — 1.0% | | | | | | | | |
| Intertape Polymer Group, Inc. | | | 144,868 | | | | 1,607,457 | |
| Total Canada | | | | | | | 11,115,653 | |
| | | | | | | | | |
| Australia — 6.1% | | | | | | | | |
| | | | | | | | | |
| Consumer Discretionary — 2.0% | | | | | | | | |
| Slater & Gordon Ltd. | | | 318,393 | | | | 1,549,182 | |
| Spotless Group Holdings Ltd.* | | | 1,072,274 | | | | 1,668,318 | |
| | | | | | | | | |
| Financials — 1.2% | | | | | | | | |
| Magellan Financial Group Ltd. | | | 191,036 | | | | 1,968,904 | |
| | | | | | | | | |
| Industrials — 0.7% | | | | | | | | |
| Downer EDI Ltd. | | | 283,372 | | | | 1,207,771 | |
| | | | | | | | | |
| Materials — 2.2% | | | | | | | | |
| CSR Ltd. | | | 524,289 | | | | 1,725,382 | |
| DuluxGroup Ltd. | | | 330,588 | | | | 1,764,382 | |
| Total Australia | | | | | | | 9,883,939 | |
| | | | | | | | | |
| Germany — 4.4% | | | | | | | | |
| | | | | | | | | |
| Financials — 1.1% | | | | | | | | |
| Aurelius AG | | | 49,173 | | | | 1,796,433 | |
| | | | | | | | | |
| Industrials — 2.0% | | | | | | | | |
| Jungheinrich AG | | | 23,023 | | | | 1,623,558 | |
| NORMA Group AG | | | 29,416 | | | | 1,627,486 | |
Touchstone International Small Cap Fund (Continued)
| | | | | | Market | |
| | | Shares | | | Value | |
| | | | | | | | | |
| Common Stocks — 92.9% (Continued) | | | | | | | | |
| | | | | | | | | |
| Germany — (Continued) | | | | | | | | |
| | | | | | | | | |
| Telecommunication Services — 1.3% | | | | | | | | |
| Freenet AG | | | 65,185 | | | $ | 2,073,459 | |
| Total Germany | | | | | | | 7,120,936 | |
| | | | | | | | | |
| Denmark — 4.3% | | | | | | | | |
| | | | | | | | | |
| Consumer Discretionary — 0.9% | | | | | | | | |
| Matas A/S*† | | | 49,935 | | | | 1,416,927 | |
| | | | | | | | | |
| Consumer Staples — 1.4% | | | | | | | | |
| Royal UNIBREW A/S* | | | 14,093 | | | | 2,215,600 | |
| | | | | | | | | |
| Energy — 1.0% | | | | | | | | |
| OW Bunker A/S* | | | 51,618 | | | | 1,692,207 | |
| | | | | | | | | |
| Health Care — 1.0% | | | | | | | | |
| GN Store Nord A/S | | | 58,904 | | | | 1,687,654 | |
| Total Denmark | | | | | | | 7,012,388 | |
| | | | | | | | | |
| Italy — 2.9% | | | | | | | | |
| | | | | | | | | |
| Financials — 0.7% | | | | | | | | |
| Banca Generali SpA | | | 45,638 | | | | 1,256,091 | |
| | | | | | | | | |
| Health Care — 1.0% | | | | | | | | |
| Recordati SpA | | | 94,750 | | | | 1,593,222 | |
| | | | | | | | | |
| Industrials — 1.2% | | | | | | | | |
| Interpump Group SpA | | | 139,005 | | | | 1,912,912 | |
| Total Italy | | | | | | | 4,762,225 | |
| | | | | | | | | |
| Ireland — 2.8% | | | | | | | | |
| | | | | | | | | |
| Consumer Staples — 1.9% | | | | | | | | |
| Greencore Group PLC | | | 669,632 | | | | 3,043,782 | |
| | | | | | | | | |
| Materials — 0.9% | | | | | | | | |
| Smurfit Kappa Group PLC* | | | 69,013 | | | | 1,578,614 | |
| Total Ireland | | | | | | | 4,622,396 | |
| | | | | | | | | |
| Switzerland — 2.6% | | | | | | | | |
| | | | | | | | | |
| Consumer Staples — 1.2% | | | | | | | | |
| Aryzta AG | | | 21,187 | | | | 2,006,888 | |
| | | | | | | | | |
| Industrials — 1.4% | | | | | | | | |
| Bucher Industries AG | | | 6,438 | | | | 2,210,612 | |
| Total Switzerland | | | | | | | 4,217,500 | |
| | | | | | | | | |
| Sweden — 2.6% | | | | | | | | |
| | | | | | | | | |
| Consumer Discretionary — 1.0% | | | | | | | | |
| JM AB | | | 41,710 | | | | 1,548,156 | |
| | | | | | | | | |
| Financials — 1.6% | | | | | | | | |
| Fastighets AB Balder, Class B* | | | 193,459 | | | | 2,620,356 | |
| Total Sweden | | | | | | | 4,168,512 | |
| | | | | | | | | |
| Cayman Islands — 2.5% | | | | | | | | |
| | | | | | | | | |
| Consumer Discretionary — 1.8% | | | | | | | | |
| 500.com Ltd. - Class A ADR*† | | | 44,574 | | | | 1,649,238 | |
| NagaCorp Ltd. | | | 1,436,000 | | | | 1,265,468 | |
| | | | | | | | | |
| Utilities — 0.7% | | | | | | | | |
| Towngas China Co. Ltd. | | | 941,342 | | | | 1,108,904 | |
| Total Cayman Islands | | | | | | | 4,023,610 | |
| | | | | | | | | |
| France — 2.4% | | | | | | | | |
| | | | | | | | | |
| Consumer Discretionary — 1.2% | | | | | | | | |
| Plastic Omnium SA | | | 61,768 | | | | 1,939,395 | |
| | | | | | | | | |
| Information Technology — 1.2% | | | | | | | | |
| UBISOFT Entertainment* | | | 103,884 | | | | 1,913,240 | |
| Total France | | | | | | | 3,852,635 | |
| | | | | | | | | |
| Norway — 2.1% | | | | | | | | |
| | | | | | | | | |
| Consumer Staples — 1.2% | | | | | | | | |
| Salmar ASA | | | 107,723 | | | | 1,879,140 | |
| | | | | | | | | |
| Materials — 0.9% | | | | | | | | |
| Borregaard ASA | | | 202,247 | | | | 1,463,969 | |
| Total Norway | | | | | | | 3,343,109 | |
| | | | | | | | | |
| Spain — 2.0% | | | | | | | | |
| | | | | | | | | |
| Financials — 1.1% | | | | | | | | |
| Bankinter SA | | | 229,032 | | | | 1,792,301 | |
| | | | | | | | | |
| Industrials — 0.9% | | | | | | | | |
| Prosegur Cia de Seguridad SA | | | 205,680 | | | | 1,475,781 | |
| Total Spain | | | | | | | 3,268,082 | |
| | | | | | | | | |
| Israel — 2.0% | | | | | | | | |
| | | | | | | | | |
| Energy — 1.1% | | | | | | | | |
| Delek Group Ltd. | | | 4,410 | | | | 1,824,916 | |
| | | | | | | | | |
| Financials — 0.9% | | | | | | | | |
| Mizrahi Tefahot Bank Ltd. | | | 106,767 | | | | 1,380,830 | |
| Total Israel | | | | | | | 3,205,746 | |
| | | | | | | | | |
| South Korea — 1.6% | | | | | | | | |
| | | | | | | | | |
| Consumer Discretionary — 1.6% | | | | | | | | |
| Hanssem Co. Ltd. | | | 33,960 | | | | 2,611,275 | |
| | | | | | | | | |
| Belgium — 1.4% | | | | | | | | |
| | | | | | | | | |
| Health Care — 1.4% | | | | | | | | |
| Arseus NV | | | 39,268 | | | | 2,248,379 | |
| | | | | | | | | |
| Singapore — 1.3% | | | | | | | | |
| | | | | | | | | |
| Consumer Staples — 0.8% | | | | | | | | |
| First Resources Ltd. | | | 657,000 | | | | 1,254,038 | |
Touchstone International Small Cap Fund (Continued)
| | | | | | Market | |
| | | Shares | | | Value | |
| | | | | | | | | |
| Common Stocks — 92.9% (Continued) | | | | | | | | |
| | | | | | | | | |
| Singapore — (Continued) | | | | | | | | |
| | | | | | | | | |
| Industrials — 0.5% | | | | | | | | |
| SATS Ltd. | | | 368,848 | | | $ | 928,850 | |
| Total Singapore | | | | | | | 2,182,888 | |
| | | | | | | | | |
| Jersey — 1.3% | | | | | | | | |
| | | | | | | | | |
| Financials — 1.3% | | | | | | | | |
| Henderson Group PLC | | | 497,209 | | | | 2,050,715 | |
| | | | | | | | | |
| Finland — 1.2% | | | | | | | | |
| | | | | | | | | |
| Materials — 1.2% | | | | | | | | |
| Huhtamaki OYJ | | | 75,525 | | | | 1,975,253 | |
| | | | | | | | | |
| Thailand — 1.1% | | | | | | | | |
| | | | | | | | | |
| Utilities — 1.1% | | | | | | | | |
| TTW PCL | | | 2,807,002 | | | | 934,082 | |
| TTW PCL- Foreign Shares | | | 2,666,198 | | | | 887,227 | |
| Total Thailand | | | | | | | 1,821,309 | |
| | | | | | | | | |
| New Zealand — 1.1% | | | | | | | | |
| | | | | | | | | |
| Consumer Discretionary — 1.1% | | | | | | | | |
| Sky Network Television Ltd. | | | 285,493 | | | | 1,717,247 | |
| | | | | | | | | |
| Portugal — 1.0% | | | | | | | | |
| | | | | | | | | |
| Industrials — 1.0% | | | | | | | | |
| CTT-Correios de Portugal SA | | | 171,191 | | | | 1,701,830 | |
| | | | | | | | | |
| Luxembourg — 1.0% | | | | | | | | |
| | | | | | | | | |
| Health Care — 1.0% | | | | | | | | |
| Eurofins Scientific SE† | | | 5,245 | | | | 1,613,072 | |
| | | | | | | | | |
| Hong Kong — 1.0% | | | | | | | | |
| | | | | | | | | |
| Financials — 1.0% | | | | | | | | |
| Dah Sing Banking Group Ltd. | | | 942,400 | | | | 1,580,718 | |
| | | | | | | | | |
| Austria — 0.9% | | | | | | | | |
| | | | | | | | | |
| Industrials — 0.9% | | | | | | | | |
| Oesterreichische Post AG | | | 28,867 | | | | 1,433,863 | |
| | | | | | | | | |
| Bermuda — 0.8% | | | | | | | | |
| | | | | | | | | |
| Financials — 0.8% | | | | | | | | |
| Catlin Group Ltd. | | | 142,788 | | | | 1,307,359 | |
| | | | | | | | | |
| | | | | | | | | |
| China — 0.8% | | | | | | | | |
| | | | | | | | | |
| Consumer Staples — 0.8% | | | | | | | | |
| Sino Grandness Food Industry Group | | | | | | | | |
| Ltd.* | | | 2,296,000 | | | | 1,270,543 | |
| Total Common Stocks | | | | | | $ | 150,527,774 | |
| | | | | | | | | |
| Exchange Traded Fund — 2.9% | | | | | | | | |
| | | | | | | | | |
| United States — 2.9% | | | | | | | | |
| iShares MSCI EAFE Small Cap Index | | | | | | | | |
| Fund† | | | 89,484 | | | | 4,735,493 | |
| | | | | | | | | |
| Investment Funds — 7.2% | | | | | | | | |
| Invesco Government & Agency | | | | | | | | |
| Portfolio, Institutional Class, | | | | | | | | |
| 0.01%**∞Ω | | | 6,919,666 | | | | 6,919,666 | |
| Touchstone Institutional Money Market | | | | | | | | |
| Fund, 0.01%^∞Ω | | | 4,837,156 | | | | 4,837,156 | |
| Total Investment Funds | | | | | | $ | 11,756,822 | |
| | | | | | | | | |
| Total Investment Securities —103.0% | | | | | | | | |
| (Cost $131,420,762) | | | | | | $ | 167,020,089 | |
| | | | | | | | | |
| Liabilities in Excess of Other Assets — (3.0%) | | | | | | | (4,927,417 | ) |
| | | | | | | | | |
| Net Assets — 100.0% | | | | | | $ | 162,092,672 | |
| * | Non-income producing security. |
| ** | Represents collateral for securities loaned. |
| ^ | AffiliatedFund. SeeNote4inNotestoFinancialStatements. |
| † | All or a portion of the security is on loan. The total market value of the securities on loan as of June 30, 2014 was $6,705,669. |
| Ω | Represents the 7-day SEC yield as of June 30, 2014. |
Portfolio Abbreviations:
ADR - American Depositary Receipt
PCL - Public Company Limited
PLC - Public Limited Company
Other Information:
The inputs or methodology used for valuing securities may not be an indication of the risk associated with investing in those securities. For more information on valuation inputs, and their aggregation into the levels used in the table below, please refer to the security valuation section in the accompanying Notes to Financial Statements.
Touchstone International Small Cap Fund (Continued)
Valuation inputs at Reporting Date:
| | | Level 1 | | | Level 2 | | | Level 3 | | | Total | |
| Common Stocks | | $ | 150,527,774 | | | $ | — | | | $ | — | | | $ | 150,527,774 | |
| Exchange Traded Fund | | | 4,735,493 | | | | — | | | | — | | | | 4,735,493 | |
| Investment Funds | | | 11,756,822 | | | | — | | | | — | | | | 11,756,822 | |
| | | | | | | | | | | | | | | $ | 167,020,089 | |
See accompanying Notes to Financial Statements.
Portfolio of Investments
Touchstone Small Cap Value Opportunities Fund – June 30, 2014
| | | | | | Market | |
| | | Shares | | | Value | |
| | | | | | | | | |
| Common Stocks — 96.1% | | | | | | | | |
| | | | | | | | | |
| Financials — 30.2% | | | | | | | | |
| Altisource Portfolio Solutions SA | | | | | | | | |
| (Luxembourg)* | | | 25,900 | | | $ | 2,967,622 | |
| American Equity Investment Life | | | | | | | | |
| Holding Co. | | | 142,400 | | | | 3,503,040 | |
| Bancorp, Inc. (The)* | | | 113,800 | | | | 1,355,358 | |
| Bofi Holding, Inc.* | | | 21,600 | | | | 1,586,952 | |
| Capstead Mortgage Corp. REIT† | | | 108,900 | | | | 1,432,035 | |
| Columbia Banking System, Inc. | | | 72,600 | | | | 1,910,106 | |
| Customers Bancorp, Inc.* | | | 121,420 | | | | 2,429,614 | |
| Encore Capital Group, Inc.*† | | | 61,100 | | | | 2,775,162 | |
| Endurance Specialty Holdings Ltd. | | | 55,500 | | | | 2,863,245 | |
| First Cash Financial Services, Inc.* | | | 33,500 | | | | 1,929,265 | |
| First Commonwealth Financial Corp. | | | 215,500 | | | | 1,986,910 | |
| Home Loan Servicing Solutions Ltd.† | | | 127,200 | | | | 2,891,256 | |
| Horace Mann Educators Corp. | | | 96,100 | | | | 3,005,047 | |
| Iberiabank Corp. | | | 40,600 | | | | 2,809,114 | |
| Infinity Property & Casualty Corp. | | | 23,800 | | | | 1,600,074 | |
| Lexington Realty Trust REIT | | | 223,200 | | | | 2,457,432 | |
| Maiden Holdings Ltd. | | | 193,800 | | | | 2,343,042 | |
| Newcastle Investment Corp. REIT | | | 520,600 | | | | 2,493,674 | |
| Popular, Inc.* | | | 71,400 | | | | 2,440,452 | |
| Stewart Information Services Corp. | | | 77,100 | | | | 2,390,871 | |
| Stifel Financial Corp.* | | | 55,000 | | | | 2,604,250 | |
| Texas Capital Bancshares, Inc.* | | | 45,300 | | | | 2,443,935 | |
| Wintrust Financial Corp. | | | 54,300 | | | | 2,497,800 | |
| | | | | | | | 54,716,256 | |
| | | | | | | | | |
| Consumer Discretionary — 17.8% | | | | | | | | |
| American Public Education, Inc.* | | | 50,600 | | | | 1,739,628 | |
| Children's Place Retail Stores, Inc. (The)† | | | 55,200 | | | | 2,739,576 | |
| Deckers Outdoor Corp.*† | | | 38,800 | | | | 3,349,604 | |
| EW Scripps Co. - Class A* | | | 88,400 | | | | 1,870,544 | |
| Gentherm, Inc.* | | | 46,000 | | | | 2,044,700 | |
| LifeLock, Inc.* | | | 128,700 | | | | 1,796,652 | |
| LIN Media LLC* | | | 87,800 | | | | 2,392,550 | |
| M I Homes, Inc.* | | | 53,500 | | | | 1,298,445 | |
| Motorcar Parts of America, Inc.* | | | 90,800 | | | | 2,210,980 | |
| New Media Investment Group, Inc.* | | | 116,487 | | | | 1,643,632 | |
| Rent-A-Center, Inc. | | | 58,200 | | | | 1,669,176 | |
| Skullcandy, Inc.* | | | 241,500 | | | | 1,750,875 | |
| Smith & Wesson Holding Corp.*† | | | 102,500 | | | | 1,490,350 | |
| Stage Stores, Inc. | | | 89,100 | | | | 1,665,279 | |
| TravelCenters of America LLC* | | | 118,600 | | | | 1,053,168 | |
| Universal Electronics, Inc.* | | | 43,200 | | | | 2,111,616 | |
| World Wrestling Entertainment, Inc.† | | | 116,500 | | | | 1,389,845 | |
| | | | | | | | 32,216,620 | |
| | | | | | | | | |
| Industrials — 14.4% | | | | | | | | |
| ABM Industries, Inc. | | | 62,450 | | | | 1,684,901 | |
| Acacia Research Corp.† | | | 79,800 | | | | 1,416,450 | |
| Barrett Business Services, Inc. | | | 31,200 | | | | 1,466,400 | |
| Celadon Group, Inc. | | | 78,300 | | | | 1,669,356 | |
| DigitalGlobe, Inc.* | | | 80,000 | | | | 2,224,000 | |
| DXP Enterprises, Inc.* | | | 19,600 | | | | 1,480,584 | |
| GenCorp, Inc.*† | | | 93,900 | | | | 1,793,490 | |
| Generac Holdings, Inc.* | | | 35,800 | | | | 1,744,892 | |
| Greenbrier Cos., Inc.* | | | 30,900 | | | | 1,779,840 | |
| H&E Equipment Services, Inc.* | | | 60,200 | | | | 2,187,668 | |
| JetBlue Airways Corp.*† | | | 211,200 | | | | 2,291,520 | |
| Mueller Water Products, Inc. - Class A | | | 257,100 | | | | 2,221,344 | |
| Tutor Perini Corp.* | | | 53,700 | | | | 1,704,438 | |
| Wabash National Corp.* | | | 161,200 | | | | 2,297,100 | |
| | | | | | | | 25,961,983 | |
| | | | | | | | | |
| Information Technology — 11.4% | | | | | | | | |
| AVG Technologies N.V. (Netherlands)* | | | 107,300 | | | | 2,159,949 | |
| Chipmos Technologies Bermuda Ltd.† | | | 85,600 | | | | 2,065,528 | |
| Cirrus Logic, Inc.* | | | 65,900 | | | | 1,498,566 | |
| DST Systems, Inc. | | | 23,700 | | | | 2,184,429 | |
| GT Advanced Technologies, Inc.*† | | | 132,500 | | | | 2,464,500 | |
| InvenSense, Inc.*† | | | 82,000 | | | | 1,860,580 | |
| Methode Electronics, Inc. | | | 68,400 | | | | 2,613,564 | |
| NeuStar, Inc. - Class A*† | | | 50,000 | | | | 1,301,000 | |
| Silicon Image, Inc.* | | | 279,200 | | | | 1,407,168 | |
| SS&C Technologies Holdings, Inc.* | | | 39,600 | | | | 1,751,112 | |
| Stamps.com, Inc.* | | | 40,700 | | | | 1,371,183 | |
| | | | | | | | 20,677,579 | |
| | | | | | | | | |
| Health Care — 7.7% | | | | | | | | |
| Air Methods Corp.*† | | | 35,800 | | | | 1,849,070 | |
| Anika Therapeutics, Inc.* | | | 13,600 | | | | 630,088 | |
| Cambrex Corp.* | | | 103,900 | | | | 2,150,730 | |
| Cynosure, Inc. - Class A* | | | 110,700 | | | | 2,352,375 | |
| Impax Laboratories, Inc.* | | | 47,900 | | | | 1,436,521 | |
| Kindred Healthcare, Inc. | | | 75,600 | | | | 1,746,360 | |
| Providence Service Corp. (The)* | | | 54,600 | | | | 1,997,814 | |
| Team Health Holdings, Inc.* | | | 34,900 | | | | 1,742,906 | |
| | | | | | | | 13,905,864 | |
| | | | | | | | | |
| Energy — 5.0% | | | | | | | | |
| Delek U.S. Holdings, Inc. | | | 64,500 | | | | 1,820,835 | |
| Energy XXI Bermuda Ltd. (Bermuda)† | | | 76,600 | | | | 1,810,058 | |
| Helix Energy Solutions Group, Inc.* | | | 88,300 | | | | 2,323,173 | |
| Newpark Resources, Inc.* | | | 131,700 | | | | 1,640,982 | |
| PBF Energy, Inc. - Class A | | | 57,000 | | | | 1,519,050 | |
| | | | | | | | 9,114,098 | |
| | | | | | | | | |
| Materials — 3.2% | | | | | | | | |
| FutureFuel Corp. | | | 103,050 | | | | 1,709,600 | |
| Headwaters, Inc.* | | | 129,200 | | | | 1,794,588 | |
| PH Glatfelter Co. | | | 84,250 | | | | 2,235,152 | |
| | | | | | | | 5,739,340 | |
| | | | | | | | | |
| Utilities — 2.8% | | | | | | | | |
| NorthWestern Corp. | | | 52,100 | | | | 2,719,099 | |
| PNM Resources, Inc. | | | 80,700 | | | | 2,366,931 | |
| | | | | | | | 5,086,030 | |
| | | | | | | | | |
| Consumer Staples — 2.6% | | | | | | | | |
| Andersons, Inc. (The) | | | 27,600 | | | | 1,423,608 | |
| TreeHouse Foods, Inc.* | | | 40,600 | | | | 3,250,842 | |
| | | | | | | | 4,674,450 | |
Touchstone Small Cap Value Opportunities Fund (Continued)
| | | | | | Market | |
| | | Shares | | | Value | |
| | | | | | | | | |
| Common Stocks — 96.1% (Continued) | | | | | | | | |
| | | | | | | | | |
| Telecommunication Services — 1.0% | | | | | | | | |
| FairPoint Communications, Inc.* | | | 130,400 | | | $ | 1,821,688 | |
| Total Common Stocks | | | | | | $ | 173,913,908 | |
| | | | | | | | | |
| Exchange Traded Fund — 0.9% | | | | | | | | |
| iShares Russell 2000 Value Index | | | | | | | | |
| Fund† | | | 15,800 | | | | 1,631,508 | |
| | | | | | | | | |
| Investment Funds — 21.1% | | | | | | | | |
| Invesco Government & Agency | | | | | | | | |
| Portfolio, Institutional Class, | | | | | | | | |
| 0.01%**∞Ω | | | 34,803,680 | | | | 34,803,680 | |
| Touchstone Institutional Money Market | | | | | | | | |
| Fund, 0.01%^∞Ω | | | 3,423,077 | | | | 3,423,077 | |
| Total Investment Funds | | | | | | $ | 38,226,757 | |
| | | | | | | | | |
| Total Investment Securities —118.1% | | | | | | | | |
| (Cost $186,540,097) | | | | | | $ | 213,772,173 | |
| | | | | | | | | |
| Liabilities in Excess of Other Assets — (18.1%) | | | | | | | (32,726,447 | ) |
| | | | | | | | | |
| Net Assets — 100.0% | | | | | | $ | 181,045,726 | |
| * | Non-income producing security. |
| | | |
| ** | Represents collateral for securities loaned. |
| | | |
| ^ | AffiliatedFund. SeeNote4inNotestoFinancialStatements. |
| | | |
| † | All or a portion of the security is on loan. The total market value of the securities on loan as of June 30, 2014 was $33,870,564. |
| | | |
| Ω | Represents the 7-day SEC yield as of June 30, 2014. |
Portfolio Abbreviations:
REIT - Real Estate Investment Trust
Other Information:
The inputs or methodology used for valuing securities may not be an indication of the risk associated with investing in those securities. For more information on valuation inputs, and their aggregation into the levels used in the table below, please refer to the security valuation section in the accompanying Notes to Financial Statements.
Valuation inputs at Reporting Date:
| Description | | Level 1 | | | Level 2 | | | Level 3 | | | Total | |
| Common Stocks | | $ | 173,913,908 | | | $ | — | | | $ | — | | | $ | 173,913,908 | |
| Exchanged Traded Fund | | | 1,631,508 | | | | — | | | | — | | | | 1,631,508 | |
| Investment Funds | | | 38,226,757 | | | | — | | | | — | | | | 38,226,757 | |
| | | | | | | | | | | | | | | $ | 213,772,173 | |
See accompanying Notes to Financial Statements.
Portfolio of Investments
Touchstone Value Fund – June 30, 2014
| | | | | | Market | |
| | | Shares | | | Value | |
| | | | | | | |
| Common Stocks — 97.9% | | | | | | | | |
| | | | | | | | | |
| Financials — 25.1% | | | | | | | | |
| American Express Co. | | | 139,679 | | | $ | 13,251,347 | |
| American International Group, Inc. | | | 77,800 | | | | 4,246,323 | |
| Bank of America Corp. | | | 582,343 | | | | 8,950,612 | |
| Capital One Financial Corp. | | | 157,638 | | | | 13,020,899 | |
| Citigroup, Inc. | | | 201,546 | | | | 9,492,817 | |
| JPMorgan Chase & Co. | | | 232,261 | | | | 13,382,879 | |
| Navient Corp. | | | 321,719 | | | | 5,697,643 | |
| PNC Financial Services Group, Inc. | | | 140,178 | | | | 12,482,851 | |
| SLM Corp. | | | 321,719 | | | | 2,673,485 | |
| State Street Corp. | | | 149,687 | | | | 10,067,948 | |
| Wells Fargo & Co. | | | 279,914 | | | | 14,712,280 | |
| | | | | | | | 107,979,084 | |
| | | | | | | | | |
| Health Care — 19.6% | | | | | | | | |
| Johnson & Johnson | | | 112,334 | | | | 11,752,383 | |
| Medtronic, Inc. | | | 217,451 | | | | 13,864,676 | |
| Merck & Co., Inc. | | | 178,085 | | | | 10,302,217 | |
| Pfizer, Inc. | | | 402,706 | | | | 11,952,314 | |
| Sanofi ADR | | | 197,670 | | | | 10,510,114 | |
| Teva Pharmaceutical Industries Ltd. ADR | | | 178,770 | | | | 9,371,123 | |
| UnitedHealth Group, Inc. | | | 102,824 | | | | 8,405,862 | |
| WellPoint, Inc. | | | 75,157 | | | | 8,087,645 | |
| | | | | | | | 84,246,334 | |
| | | | | | | | | |
| Energy — 11.7% | | | | | | | | |
| BP PLC ADR | | | 235,524 | | | | 12,423,891 | |
| ConocoPhillips | | | 145,853 | | | | 12,503,978 | |
| Marathon Oil Corp. | | | 226,860 | | | | 9,056,251 | |
| Occidental Petroleum Corp. | | | 118,238 | | | | 12,134,766 | |
| Phillips 66 | | | 51,090 | | | | 4,109,169 | |
| | | | | | | | 50,228,055 | |
| | | | | | | | | |
| Information Technology — 10.7% | | | | | | | | |
| Intel Corp. | | | 415,675 | | | | 12,844,358 | |
| Microsoft Corp. | | | 320,687 | | | | 13,372,648 | |
| Oracle Corp. | | | 277,800 | | | | 11,259,234 | |
| Texas Instruments, Inc. | | | 180,603 | | | | 8,631,017 | |
| | | | | | | | 46,107,257 | |
| | | | | | | | | |
| Industrials — 9.3% | | | | | | | | |
| Emerson Electric Co. | | | 114,255 | | | | 7,581,962 | |
| General Dynamics Corp. | | | 69,200 | | | | 8,065,260 | |
| Honeywell International, Inc. | | | 92,076 | | | | 8,558,464 | |
| Raytheon Co. | | | 81,335 | | | | 7,503,154 | |
| Stanley Black & Decker, Inc. | | | 93,307 | | | | 8,194,221 | |
| | | | | | | | 39,903,061 | |
| | | | | | | | | |
| Consumer Discretionary — 8.4% | | | | | | | | |
| Carnival Corp. (Paraguay) | | | 164,017 | | | | 6,175,240 | |
| Delphi Automotive PLC (United | | | | | | | | |
| Kingdom) | | | 101,020 | | | | 6,944,115 | |
| Ford Motor Co. | | | 497,400 | | | | 8,575,176 | |
| Johnson Controls, Inc. | | | 60,600 | | | | 3,025,757 | |
| Target Corp. | | | 197,474 | | | | 11,443,618 | |
| | | | | | | | 36,163,906 | |
| | | | | | | | | |
| Consumer Staples — 5.9% | | | | | | | | |
| Altria Group, Inc. | | | 163,348 | | | | 6,850,815 | |
| Philip Morris International, Inc. | | | 142,520 | | | | 12,015,861 | |
| Wal-Mart Stores, Inc. | | | 88,200 | | | | 6,621,174 | |
| | | | | | | | 25,487,850 | |
| | | | | | | | | |
| Telecommunication Services — 4.1% | | | | | | | | |
| AT&T, Inc.† | | | 146,846 | | | | 5,192,475 | |
| Verizon Communications, Inc. | | | 251,252 | | | | 12,293,760 | |
| | | | | | | | 17,486,235 | |
| | | | | | | | | |
| Materials — 2.0% | | | | | | | | |
| CRH PLC ADR† | | | 178,500 | | | | 4,614,225 | |
| EI du Pont de Nemours & Co. | | | 57,920 | | | | 3,790,285 | |
| | | | | | | | 8,404,510 | |
| | | | | | | | | |
| Utilities — 1.1% | | | | | | | | |
| Entergy Corp. | | | 59,011 | | | | 4,844,213 | |
| Total Common Stocks | | | | | | $ | 420,850,505 | |
| | | | | | | | | |
| Investment Funds — 4.0% | | | | | | | | |
| Invesco Government & Agency | | | | | | | | |
| Portfolio, Institutional Class, | | | | | | | | |
| 0.01%**∞Ω | | | 7,393,866 | | | | 7,393,866 | |
| Touchstone Institutional Money Market | | | | | | | | |
| Fund, 0.01%^∞Ω | | | 9,606,140 | | | | 9,606,140 | |
| Total Investment Funds | | | | | | $ | 17,000,006 | |
| | | | | | | | | |
| Total Investment Securities —101.9% | | | | | | | | |
| (Cost $326,369,330) | | | | | | $ | 437,850,511 | |
| | | | | | | | | |
| Liabilities in Excess of Other Assets — (1.9%) | | | | | | | (8,004,633 | ) |
| | | | | | | | | |
| Net Assets — 100.0% | | | | | | $ | 429,845,878 | |
| ** | Represents collateral for securities loaned. |
| | | |
| ^ | Affiliated Fund. See Note 4 in Notes to Financial Statements. |
| | | |
| † | All or a portion of the security is on loan. The total market value of the securities on loan as of June 30, 2014 was $7,193,021. |
| | | |
| Ω | Represents the 7-day SEC yield as of June 30, 2014. |
Portfolio Abbreviations:
ADR - American Depositary Receipt
PLC - Public Limited Company
Touchstone Value Fund (Continued)
Other Information:
The inputs or methodology used for valuing securities may not be an indication of the risk associated with investing in those securities. For more information on valuation inputs, and their aggregation into the levels used in the table below, please refer to the security valuation section in the accompanying Notes to Financial Statements.
Valuation inputs at Reporting Date:
| Description | | Level 1 | | | Level 2 | | | Level 3 | | | Total | |
| Common Stocks | | $ | 420,850,505 | | | $ | — | | | $ | — | | | $ | 420,850,505 | |
| Investment Funds | | | 17,000,006 | | | | — | | | | — | | | | 17,000,006 | |
| | | | | | | | | | | | | | | $ | 437,850,511 | |
See accompanying Notes to Financial Statements.
Statements of Assets and Liabilities
June 30, 2014
| | | | | | | | | Touchstone | | | | |
| | | Touchstone | | | Touchstone | | | Small Cap | | | | |
| | | Capital | | | International | | | Value | | | Touchstone | |
| | | Growth | | | Small Cap | | | Opportunities | | | Value | |
| | | Fund | | | Fund | | | Fund | | | Fund | |
| Assets | | | | | | | | | | | | | | | | |
| Investments, at cost | | $ | 121,247,370 | | | $ | 131,420,762 | | | $ | 186,540,097 | | | $ | 326,369,330 | |
| Affiliated securities, at market value | | $ | 13 | | | $ | 4,837,156 | | | $ | 3,423,077 | | | $ | 9,606,140 | |
| Non-affiliated securities, at market value | | | 200,075,386 | | | | 162,182,933 | | | | 210,349,096 | | | | 428,244,371 | |
| Investments, at market value (A) | | $ | 200,075,399 | | | $ | 167,020,089 | | | $ | 213,772,173 | | | $ | 437,850,511 | |
| Foreign currency (B) | | | — | | | | 409,428 | | | | — | | | | — | |
| Dividends and interest receivable | | | 77,557 | | | | 183,092 | | | | 223,912 | | | | 476,072 | |
| Receivable for capital shares sold | | | 4,099 | | | | 97,732 | | | | 407,396 | | | | 504,718 | |
| Receivable for investments sold | | | 4,634,846 | | | | 1,465,771 | | | | 1,625,568 | | | | — | |
| Receivable for securities lending income | | | 430 | | | | 23,461 | | | | 23,234 | | | | 70 | |
| Tax reclaim receivable | | | 73 | | | | 128,397 | | | | — | | | | — | |
| Other assets | | | 21,587 | | | | 23,204 | | | | 42,861 | | | | 38,177 | |
| Total Assets | | | 204,813,991 | | | | 169,351,174 | | | | 216,095,144 | | | | 438,869,548 | |
| | | | | | | | | | | | | | | | | |
| Liabilities | | | | | | | | | | | | | | | | |
| Bank overdrafts | | | 525,891 | | | | — | | | | — | | | | — | |
| Payable for return of collateral for securities on loan | | | 3,911,290 | | | | 6,919,666 | | | | 34,803,680 | | | | 7,393,866 | |
| Payable for capital shares redeemed | | | 22,024 | | | | 75,545 | | | | 39,054 | | | | 1,284,736 | |
| Payable to Investment Advisor | | | 103,436 | | | | 132,209 | | | | 135,119 | | | | 227,802 | |
| Payable to other affiliates | | | 16,858 | | | | 432 | | | | 15,227 | | | | 21,476 | |
| Payable to Trustees | | | 3,190 | | | | 3,190 | | | | 3,190 | | | | 3,190 | |
| Payable for professional services | | | 18,985 | | | | 35,406 | | | | 19,772 | | | | 20,473 | |
| Other accrued expenses and liabilities | | | 113,168 | | | | 92,054 | | | | 33,376 | | | | 72,127 | |
| Total Liabilities | | | 4,714,842 | | | | 7,258,502 | | | | 35,049,418 | | | | 9,023,670 | |
| | | | | | | | | | | | | | | | | |
| Net Assets | | $ | 200,099,149 | | | $ | 162,092,672 | | | $ | 181,045,726 | | | $ | 429,845,878 | |
| | | | | | | | | | | | | | | | | |
| Net assets consist of: | | | | | | | | | | | | | | | | |
| Paid-in capital | | $ | 124,259,488 | | | $ | 143,774,270 | | | $ | 136,003,740 | | | $ | 338,914,729 | |
| Accumulated net investment income | | | — | | | | 721,548 | | | | 255,458 | | | | 206,189 | |
| Accumulated net realized gains (losses) on investments, foreign currency transactions and payment by affiliates | | | (2,988,368 | ) | | | (18,010,595 | ) | | | 17,554,452 | | | | (20,756,221 | ) |
| Net unrealized appreciation on investments and foreign currency transactions | | | 78,828,029 | | | | 35,607,449 | | | | 27,232,076 | | | | 111,481,181 | |
| | | | | | | | | | | | | | | | | |
| Net Assets | | $ | 200,099,149 | | | $ | 162,092,672 | | | $ | 181,045,726 | | | $ | 429,845,878 | |
| (A) Includes market value of securities on loan of: | | $ | 3,799,141 | | | $ | 6,705,669 | | | $ | 33,870,564 | | | $ | 7,193,021 | |
| (B) Cost of foreign currency: | | $ | — | | | $ | 406,514 | | | $ | — | | | $ | — | |
See accompanying Notes to Financial Statements.
Statements of Assets and Liabilities (Continued)
| | | | | | | | | Touchstone | | | | |
| | | Touchstone | | | Touchstone | | | Small Cap | | | | |
| | | Capital | | | International | | | Value | | | Touchstone | |
| | | Growth | | | Small Cap | | | Opportunities | | | Value | |
| | | Fund | | | Fund | | | Fund | | | Fund | |
| | | | | | | | | | | | | |
| Pricing of Class A Shares | | | | | | | | | | | | | | | | |
| Net assets applicable to Class A shares | | $ | 2,047,243 | | | $ | 10,720,545 | | | $ | 13,332,410 | | | $ | 65,999,699 | |
| Shares of beneficial interest outstanding | | | | | | | | | | | | | | | | |
| (unlimited number of shares authorized, no par value) | | | 73,354 | | | | 692,675 | | | | 637,217 | | | | 6,901,314 | |
| Net asset value price per share* | | $ | 27.91 | | | $ | 15.48 | | | $ | 20.92 | | | $ | 9.56 | |
| Maximum offering price per share | | $ | 29.61 | | | $ | 16.42 | | | $ | 22.20 | | | $ | 10.14 | |
| | | | | | | | | | | | | | | | | |
| Pricing of Class C Shares | | | | | | | | | | | | | | | | |
| Net assets applicable to Class C shares | | $ | 188,295 | | | $ | 612,573 | | | $ | 558,340 | | | $ | 5,218,142 | |
| Shares of beneficial interest outstanding | | | | | | | | | | | | | | | | |
| (unlimited number of shares authorized, no par value) | | | 6,858 | | | | 39,962 | | | | 26,968 | | | | 546,514 | |
| Net asset value, offering price per share** | | $ | 27.46 | | | $ | 15.33 | | | $ | 20.70 | | | $ | 9.55 | |
| | | | | | | | | | | | | | | | | |
| Pricing of Class Y Shares | | | | | | | | | | | | | | | | |
| Net assets applicable to Class Y shares | | $ | 197,784,645 | | | $ | 120,536,512 | | | $ | 140,688,817 | | | $ | 113,055,168 | |
| Shares of beneficial interest outstanding | | | | | | | | | | | | | | | | |
| (unlimited number of shares authorized, no par value) | | | 6,945,558 | | | | 7,599,753 | | | | 6,423,134 | | | | 11,784,076 | |
| Net asset value, offering price and redemption price per share | | $ | 28.48 | | | $ | 15.86 | | | $ | 21.90 | | | $ | 9.59 | |
| | | | | | | | | | | | | | | | | |
| Pricing of Institutional Class Shares | | | | | | | | | | | | | | | | |
| Net assets applicable to Institutional Class shares | | $ | 78,966 | | | $ | 30,223,042 | | | $ | 26,466,159 | | | $ | 245,572,869 | |
| Shares of beneficial interest outstanding | | | | | | | | | | | | | | | | |
| (unlimited number of shares authorized, no par value) | | | 2,755 | | | | 1,895,859 | | | | 1,195,722 | | | | 25,647,990 | |
| Net asset value, offering price and redemption price per share | | $ | 28.66 | | | $ | 15.94 | | | $ | 22.13 | | | $ | 9.57 | |
* There is no sales load on subscriptions of $1 million or more. Redemptions that were part of a $1 million or more subscription may be subject to a contingent deferred sales load if redeemed within a one-year period from the date of purchase.
** Redemption price per share varies by length of time shares are held.
See accompanying Notes to Financial Statements.
Statements of Operations
For the Year Ended June 30, 2014
| | | | | | | | | Touchstone | | | | |
| | | Touchstone | | | Touchstone | | | Small Cap | | | | |
| | | Capital | | | International | | | Value | | | Touchstone | |
| | | Growth | | | Small Cap | | | Opportunities | | | Value | |
| | | Fund | | | Fund | | | Fund | | | Fund | |
| Investment Income | | | | | | | | | | | | | | | | |
| Dividends from affiliated securities | | $ | 250 | | | $ | 388 | | | $ | 479 | | | $ | 977 | |
| Dividends from non-affiliated securities(A) | | | 1,944,300 | | | | 2,963,062 | | | | 1,714,757 | | | | 11,894,779 | |
| Income from securities loaned | | | 3,341 | | | | 162,344 | | | | 236,754 | | | | 6,382 | |
| Total Investment Income | | | 1,947,891 | | | | 3,125,794 | | | | 1,951,990 | | | | 11,902,138 | |
| Expenses | | | | | | | | | | | | | | | | |
| Investment advisory fees | | | 1,348,255 | | | | 1,286,370 | | | | 1,312,684 | | | | 2,470,241 | |
| Administration fees | | | 312,571 | | | | 219,534 | | | | 223,934 | | | | 604,161 | |
| Compliance fees and expenses | | | 1,669 | | | | 1,669 | | | | 1,669 | | | | 1,669 | |
| Custody fees | | | 8,271 | | | | 51,721 | | | | 13,379 | | | | 9,394 | |
| Professional fees | | | 25,632 | | | | 38,657 | | | | 24,395 | | | | 33,547 | |
| Transfer Agent fees, Class A | | | 1,024 | | | | 4,914 | | | | 3,283 | | | | 91,743 | |
| Transfer Agent fees, Class C | | | 245 | | | | 148 | | | | 143 | | | | 5,599 | |
| Transfer Agent fees, Class Y | | | 245,009 | | | | 153,524 | | | | 58,763 | | | | 92,351 | |
| Transfer Agent fees, Institutional Class | | | 88 | | | | 180 | | | | 1,679 | | | | 2,498 | |
| Registration Fees, Class A | | | 15,394 | | | | 15,076 | | | | 14,577 | | | | 17,446 | |
| Registration Fees, Class C | | | 960 | | | | 1,018 | | | | 447 | | | | 1,361 | |
| Registration Fees, Class Y | | | 16,514 | | | | 16,829 | | | | 17,237 | | | | 31,272 | |
| Registration Fees, Institutional Class | | | 12,147 | | | | 12,349 | | | | 20,234 | | | | 17,269 | |
| Reports to Shareholders, Class A | | | 4,646 | | | | 5,099 | | | | 4,666 | | | | 10,340 | |
| Reports to Shareholders, Class C | | | 5,150 | | | | 4,984 | | | | 4,959 | | | | 5,699 | |
| Reports to Shareholders, Class Y | | | 33,882 | | | | 8,862 | | | | 8,456 | | | | 10,344 | |
| Reports to Shareholders, Institutional Class | | | 4,533 | | | | 4,850 | | | | 5,319 | | | | 15,861 | |
| Distribution expenses, Class A | | | 3,576 | | | | 10,244 | | | | 11,113 | | | | 145,994 | |
| Distribution expenses, Class C | | | 912 | | | | 1,224 | | | | 1,901 | | | | 37,481 | |
| Trustee fees | | | 12,994 | | | | 13,000 | | | | 13,002 | | | | 12,981 | |
| Other expenses | | | 104,693 | | | | 101,150 | | | | 26,424 | | | | 55,824 | |
| Total Expenses | | | 2,158,165 | | | | 1,951,402 | | | | 1,768,264 | | | | 3,673,075 | |
| Fees waived and/or reimbursed by the Advisor and/or Affiliates(B) | | | (227,540 | ) | | | (288,956 | ) | | | (142,281 | ) | | | (756,986 | ) |
| Net Expenses | | | 1,930,625 | | | | 1,662,446 | | | | 1,625,983 | | | | 2,916,089 | |
| Net Investment Income | | | 17,266 | | | | 1,463,348 | | | | 326,007 | | | | 8,986,049 | |
| Realized and Unrealized Gains (Losses) on Investments | | | | | | | | | | | | | | | | |
| Net realized gains on investments from non-affiliated securities | | | 21,947,963 | | | | 8,594,974 | | | | 25,324,647 | | | | 15,695,457 | |
| Net realized losses on foreign currency | | | — | | | | (7,298 | ) | | | — | | | | — | |
| Payment by Affiliates | | | — | | | | — | | | | 9,885 | | | | — | |
| Net change in unrealized appreciation (depreciation) on investments | | | 24,617,123 | | | | 18,829,054 | | | | 11,521,337 | | | | 48,490,892 | |
| Net change in unrealized appreciation (depreciation) on foreign currency transactions | | | — | | | | 14,734 | | | | — | | | | — | |
| Net Realized and Unrealized Gains on Investments | | | 46,565,086 | | | | 27,431,464 | | | | 36,855,869 | | | | 64,186,349 | |
| Change in Net Assets Resulting from Operations | | $ | 46,582,352 | | | $ | 28,894,812 | | | $ | 37,181,876 | | | $ | 73,172,398 | |
| (A)Net of foreign tax withholding of: | | $ | 23,066 | | | $ | 248,520 | | | $ | — | | | $ | 90,459 | |
| (B)See Note 4 in Notes to Financial Statements | | | | | | | | | | | | | | | | |
See accompanying Notes to Financial Statements.
Statements of Changes in Net Assets
| | | Touchstone | | | Touchstone | |
| | | Capital | | | International | |
| | | Growth Fund | | | Small Cap Fund | |
| | | For the Year | | | For the Year | | | For the Year | | | For the Year | |
| | | Ended | | | Ended | | | Ended | | | Ended | |
| | | June 30, 2014 | | | June 30, 2013 | | | June 30, 2014 | | | June 30, 2013 | |
| From Operations | | | | | | | | | | | | | | | | |
| Net investment income | | $ | 17,266 | | | $ | 173,556 | | | $ | 1,463,348 | | | $ | 1,766,215 | |
| Net realized gains on investments, foreign currency transactions and payment by affiliates | | | 21,947,963 | | | | 18,725,481 | | | | 8,587,676 | | | | 2,960,500 | |
| Net change in unrealized appreciation on investments and foreign currency transactions | | | 24,617,123 | | | | 5,878,081 | | | | 18,843,788 | | | | 17,012,490 | |
| Change in Net Assets from Operations | | | 46,582,352 | | | | 24,777,118 | | | | 28,894,812 | | | | 21,739,205 | |
| | | | | | | | | | | | | | | | | |
| Distributions to Shareholders from: | | | | | | | | | | | | | | | | |
| Net investment income, Class A | | | — | | | | — | | | | (44,598 | ) | | | (5,381 | ) |
| Net investment income, Class C | | | — | | | | — | (A) | | | (1,662 | ) | | | (22 | ) |
| Net investment income, Class Y | | | (104,219 | ) | | | (218,564 | ) | | | (1,419,428 | ) | | | (1,271,067 | ) |
| Net investment income, Institutional Class | | | (105 | ) | | | (68 | ) | | | (442,867 | ) | | | (249,360 | ) |
| Net realized gains, Class A | | | — | | | | — | | | | — | | | | — | |
| Net realized gains, Class C | | | — | | | | — | | | | — | | | | — | |
| Net realized gains, Class Y | | | — | | | | — | | | | — | | | | — | |
| Net realized gains, Institutional Class | | | — | | | | — | | | | — | | | | — | |
| Total Distributions | | | (104,324 | ) | | | (218,632 | ) | | | (1,908,555 | ) | | | (1,525,830 | ) |
| | | | | | | | | | | | | | | | | |
| Net Increase (Decrease) from Share Transactions(B) | | | (18,864,530 | ) | | | (17,375,158 | ) | | | 28,247,518 | | | | 1,821,419 | |
| | | | | | | | | | | | | | | | | |
| Total Increase in Net Assets | | | 27,613,498 | | | | 7,183,328 | | | | 55,233,775 | | | | 22,034,794 | |
| | | | | | | | | | | | | | | | | |
| Net Assets | | | | | | | | | | | | | | | | |
| Beginning of period | | | 172,485,651 | | | | 165,302,323 | | | | 106,858,897 | | | | 84,824,103 | |
| End of period | | $ | 200,099,149 | | | $ | 172,485,651 | | | $ | 162,092,672 | | | $ | 106,858,897 | |
| | | | | | | | | | | | | | | | | |
| Accumulated Net Investment Income | | $ | — | | | $ | 67,522 | | | $ | 721,548 | | | $ | 801,177 | |
(A) Amount rounds to less than $0.50.
(B) For details on share transactions by class, see Statements of Changes in Net Assets - Capital Stock Activity on pages 34-35.
See accompanying Notes to Financial Statements.
Statements of Changes in Net Assets (Continued)
| Touchstone | | | | |
| Small Cap | | | Touchstone | |
| Value Opportunities Fund | | | Value Fund | |
| For the Year | | | For the Year | | | For the Year | | | For the Year | |
| Ended | | | Ended | | | Ended | | | Ended | |
| June 30, 2014 | | | June 30, 2013 | | | June 30, 2014 | | | June 30, 2013 | |
| | | | | | | | | | | |
| $ | 326,007 | | | $ | 817,524 | | | $ | 8,986,049 | | | $ | 6,260,187 | |
| | | | | | | | | | | | | | | |
| | 25,334,532 | | | | 20,108,352 | | | | 15,695,457 | | | | 33,676,826 | |
| | | | | | | | | | | | | | | |
| | 11,521,337 | | | | 742,439 | | | | 48,490,892 | | | | 16,063,683 | |
| | 37,181,876 | | | | 21,668,315 | | | | 73,172,398 | | | | 56,000,696 | |
| | | | | | | | | | | | | | | |
| | (3,917 | ) | | | (21,532 | ) | | | (1,193,286 | ) | | | (741,258 | ) |
| | — | | | | — | | | | (59,554 | ) | | | (25,816 | ) |
| | (336,255 | ) | | | (534,115 | ) | | | (2,363,426 | ) | | | (1,911,954 | ) |
| | (31,300 | ) | | | (38,047 | ) | | | (5,163,594 | ) | | | (3,581,840 | ) |
| | (313,414 | ) | | | (411,110 | ) | | | — | | | | (1,261,426 | ) |
| | (14,880 | ) | | | (276 | ) | | | — | | | | (80,161 | ) |
| | (17,996,689 | ) | | | (8,672,644 | ) | | | — | | | | (3,086,060 | ) |
| | (1,318,126 | ) | | | (738,390 | ) | | | — | | | | (5,131,975 | ) |
| | (20,014,581 | ) | | | (10,416,114 | ) | | | (8,779,860 | ) | | | (15,820,490 | ) |
| | | | | | | | | | | | | | | |
| | 57,853,792 | | | | 2,863,294 | | | | 22,607,785 | | | | 180,083,499 | |
| | | | | | | | | | | | | | | |
| | 75,021,087 | | | | 14,115,495 | | | | 87,000,323 | | | | 220,263,705 | |
| | | | | | | | | | | | | | | |
| | 106,024,639 | | | | 91,909,144 | | | | 342,845,555 | | | | 122,581,850 | |
| $ | 181,045,726 | | | $ | 106,024,639 | | | $ | 429,845,878 | | | $ | 342,845,555 | |
| | | | | | | | | | | | | | | |
| $ | 255,458 | | | $ | 301,750 | | | $ | 206,189 | | | $ | — | |
Statements of Changes in Net Assets - Capital Stock Activity
| | | Touchstone Capital Growth Fund | | | Touchstone International Small Cap Fund | |
| | | For the | | | For the | | | For the | | | For the | |
| | | Year Ended | | | Year Ended | | | Year Ended | | | Year Ended | |
| | | June 30, 2014 | | | June 30, 2013 | | | June 30, 2014 | | | June 30, 2013 | |
| | | Shares | | | Dollars | | | Shares | | | Dollars | | | Shares | | | Dollars | | | Shares | | | Dollars | |
| Class A | | | | | | | | | | | | | | | | | | | | | | | | | | | | | | | | |
| Proceeds from Shares issued | | | 48,923 | | | $ | 1,286,009 | | | | 54,764 | | | $ | 1,158,223 | | | | 690,059 | | | $ | 10,199,935 | | | | 26,602 | | | $ | 315,859 | |
| Proceeds from Shares issued in connection with merger(A) | | | — | | | | — | | | | — | | | | — | | | | — | | | | — | | | | — | | | | — | |
| Reinvestment of distributions | | | — | | | | — | | | | — | | | | — | | | | 2,877 | | | | 41,895 | | | | 357 | | | | 4,133 | |
| Cost of Shares redeemed | | | (26,050 | ) | | | (645,860 | ) | | | (33,765 | ) | | | (711,164 | ) | | | (39,141 | ) | | | (590,033 | ) | | | (7,570 | ) | | | (91,704 | ) |
| Change from Class A Share Transactions | | | 22,873 | | | | 640,149 | | | | 20,999 | | | | 447,059 | | | | 653,795 | | | | 9,651,797 | | | | 19,389 | | | | 228,288 | |
| Class C | | | | | | | | | | | | | | | | | | | | | | | | | | | | | | | | |
| Proceeds from Shares issued | | | 4,689 | | | | 121,085 | | | | 2,045 | | | | 44,317 | | | | 39,387 | | | | 588,357 | | | | 582 | | | | 7,074 | |
| Proceeds from Shares issued in connection with merger(A) | | | — | | | | — | | | | — | | | | — | | | | — | | | | — | | | | — | | | | — | |
| Reinvestment of distributions | | | — | | | | — | | | | — | | | | — | | | | 115 | | | | 1,662 | | | | 2 | | | | 22 | |
| Cost of Shares redeemed | | | (1 | ) | | | (15 | ) | | | — | | | | — | | | | (80 | ) | | | (1,108 | ) | | | (275 | ) | | | (3,147 | ) |
| Change from Class C Share Transactions | | | 4,688 | | | | 121,070 | | | | 2,045 | | | | 44,317 | | | | 39,422 | | | | 588,911 | | | | 309 | | | | 3,949 | |
| Class Y | | | | | | | | | | | | | | | | | | | | | | | | | | | | | | | | |
| Proceeds from Shares issued | | | 121,971 | | | | 3,146,792 | | | | 282,019 | | | | 6,131,148 | | | | 1,139,319 | | | | 17,615,548 | | | | 116,715 | | | | 1,459,632 | |
| Proceeds from Shares issued in connection with merger(A) | | | — | | | | — | | | | — | | | | — | | | | — | | | | — | | | | — | | | | — | |
| Reinvestment of distributions | | | 3,668 | | | | 98,960 | | | | 10,235 | | | | 209,920 | | | | 92,341 | | | | 1,375,877 | | | | 103,876 | | | | 1,225,021 | |
| Cost of Shares redeemed | | | (874,602 | ) | | | (22,876,413 | ) | | | (1,131,710 | ) | | | (24,100,893 | ) | | | (649,791 | ) | | | (9,556,736 | ) | | | (967,013 | ) | | | (11,575,060 | ) |
| Change from Class Y Share Transactions | | | (748,963 | ) | | | (19,630,661 | ) | | | (839,456 | ) | | | (17,759,825 | ) | | | 581,869 | | | | 9,434,689 | | | | (746,422 | ) | | | (8,890,407 | ) |
| Institutional Class | | | | | | | | | | | | | | | | | | | | | | | | | | | | | | | | |
| Proceeds from Shares issued | | | 383 | | | | 10,000 | | | | 934 | | | | 18,816 | | | | 1,212,871 | | | | 16,971,950 | | | | 1,333,832 | | | | 15,915,712 | |
| Reinvestment of distributions | | | 3 | | | | 91 | | | | 3 | | | | 68 | | | | 29,603 | | | | 442,867 | | | | 20,975 | | | | 248,348 | |
| Cost of Shares redeemed | | | (208 | ) | | | (5,179 | ) | | | (6,191 | ) | | | (125,593 | ) | | | (605,074 | ) | | | (8,842,696 | ) | | | (466,601 | ) | | | (5,684,471 | ) |
| Change from Institutional Class Share Transactions | | | 178 | | | | 4,912 | | | | (5,254 | ) | | | (106,709 | ) | | | 637,400 | | | | 8,572,121 | | | | 888,206 | | | | 10,479,589 | |
| Change from Share Transactions | | | (721,224 | ) | | $ | (18,864,530 | ) | | | (821,666 | ) | | $ | (17,375,158 | ) | | | 1,912,486 | | | $ | 28,247,518 | | | | 161,482 | | | $ | 1,821,419 | |
(A)See Note 9 in the Notes to Financial Statements.
See accompanying Notes to Financial Statements.
Statements of Changes in Net Assets - Capital Stock Activity (Continued)
| Touchstone Small Cap Value Opportunities Fund | | | Touchstone Value Fund | |
| For the | | | For the | | | For the | | | For the | |
| Year Ended | | | Year Ended | | | Year Ended | | | Year Ended | |
| June 30, 2014 | | | June 30, 2013 | | | June 30, 2014 | | | June 30, 2013 | |
| Shares | | | Dollars | | | Shares | | | Dollars | | | Shares | | | Dollars | | | Shares | | | Dollars | |
| | | | | | | | | | | | | | | | | | | | | | | |
| | 694,263 | | | $ | 14,086,155 | | | | 142,142 | | | $ | 2,469,527 | | | | 1,360,322 | | | $ | 12,296,352 | | | | 2,686,402 | | | $ | 19,925,893 | |
| | — | | | | — | | | | — | | | | — | | | | — | | | | — | | | | 4,934,586 | | | | 35,709,582 | |
| | 16,104 | | | | 302,907 | | | | 26,279 | | | | 413,524 | | | | 103,476 | | | | 967,643 | | | | 223,431 | | | | 1,614,615 | |
| | (142,999 | ) | | | (2,926,793 | ) | | | (217,734 | ) | | | (3,726,829 | ) | | | (1,221,370 | ) | | | (10,869,290 | ) | | | (1,413,277 | ) | | | (10,625,867 | ) |
| | | | | | | | | | | | | | | | | | | | | | | | | | | | | | | |
| | 567,368 | | | | 11,462,269 | | | | (49,313 | ) | | | (843,778 | ) | | | 242,428 | | | | 2,394,705 | | | | 6,431,142 | | | | 46,624,223 | |
| | 26,415 | | | | 529,335 | | | | 1,749 | | | | 30,000 | | | | 224,263 | | | | 2,036,663 | | | | 57,700 | | | | 426,590 | |
| | — | | | | — | | | | — | | | | — | | | | — | | | | — | | | | 380,586 | | | | 2,753,770 | |
| | 633 | | | | 11,799 | | | | 17 | | | | 276 | | | | 3,548 | | | | 33,419 | | | | 8,642 | | | | 61,616 | |
| | (1,993 | ) | | | (41,800 | ) | | | — | | | | — | | | | (58,418 | ) | | | (519,254 | ) | | | (70,172 | ) | | | (522,176 | ) |
| | | | | | | | | | | | | | | | | | | | | | | | | | | | | | | |
| | 25,055 | | | | 499,334 | | | | 1,766 | | | | 30,276 | | | | 169,393 | | | | 1,550,828 | | | | 376,756 | | | | 2,719,800 | |
| | 1,281,068 | | | | 26,940,927 | | | | 443,625 | | | | 7,998,195 | | | | 2,484,897 | | | | 22,624,307 | | | | 2,825,877 | | | | 21,698,663 | |
| | — | | | | — | | | | — | | | | — | | | | — | | | | — | | | | 25,947,803 | | | | 188,290,146 | |
| | 918,330 | | | | 18,084,643 | | | | 555,066 | | | | 9,051,359 | | | | 174,625 | | | | 1,635,689 | | | | 597,448 | | | | 4,288,083 | |
| | (742,017 | ) | | | (15,866,089 | ) | | | (766,392 | ) | | | (13,741,561 | ) | | | (3,226,088 | ) | | | (28,595,982 | ) | | | (24,403,044 | ) | | | (178,396,079 | ) |
| | | | | | | | | | | | | | | | | | | | | | | | | | | | | | | |
| | 1,457,381 | | | | 29,159,481 | | | | 232,299 | | | | 3,307,993 | | | | (566,566 | ) | | | (4,335,986 | ) | | | 4,968,084 | | | | 35,880,813 | |
| | 957,175 | | | | 20,689,646 | | | | 157,469 | | | | 2,911,887 | | | | 7,075,862 | | | | 64,437,527 | | | | 26,603,580 | | | | 194,446,619 | |
| | 67,787 | | | | 1,349,426 | | | | 37,917 | | | | 623,558 | | | | 469,954 | | | | 4,400,212 | | | | 970,333 | | | | 7,016,860 | |
| | (241,883 | ) | | | (5,306,364 | ) | | | (180,985 | ) | | | (3,166,642 | ) | | | (5,178,939 | ) | | | (45,839,501 | ) | | | (14,289,720 | ) | | | (106,604,816 | ) |
| | | | | | | | | | | | | | | | | | | | | | | | | | | | | | | |
| | 783,079 | | | | 16,732,708 | | | | 14,401 | | | | 368,803 | | | | 2,366,877 | | | | 22,998,238 | | | | 13,284,193 | | | | 94,858,663 | |
| | 2,832,883 | | | $ | 57,853,792 | | | | 199,153 | | | $ | 2,863,294 | | | | 2,212,132 | | | $ | 22,607,785 | | | | 25,060,175 | | | $ | 180,083,499 | |
Financial Highlights
Touchstone Capital Growth Fund—Class A
Selected Data for a Share Outstanding Throughout Each Period
| | | | | | Three | | | | |
| | | | | | Months | | | | |
| | | | | | Ended | | | | |
| | | Year Ended June 30, | | | June 30, | | | Year Ended March 31, | |
| | | 2014 | | | 2013 | | | 2012 | | | 2012 | | | 2011 | | | 2010 | |
| Net asset value at beginning of period | | $ | 21.86 | | | $ | 18.96 | | | $ | 20.49 | | | $ | 18.95 | | | $ | 15.98 | | | $ | 11.01 | |
| Income (loss) from investment operations: | | | | | | | | | | | | | | | | | | | | | | | | |
| Net investment income (loss)(A) | | | (0.06 | ) | | | (0.03 | ) | | | — | (B) | | | (0.03 | ) | | | (0.01 | ) | | | — | |
| Net realized and unrealized gains (losses) on investments | | | 6.11 | | | | 2.93 | | | | (1.53 | ) | | | 1.57 | | | | 2.98 | | | | 4.98 | |
| Total from investment operations | | | 6.05 | | | | 2.90 | | | | (1.53 | ) | | | 1.54 | | | | 2.97 | | | | 4.98 | |
| Distributions from: | | | | | | | | | | | | | | | | | | | | | | | | |
| Net investment income | | | — | | | | — | | | | — | | | | — | | | | — | | | | (0.01 | ) |
| Net asset value at end of period | | $ | 27.91 | | | $ | 21.86 | | | $ | 18.96 | | | $ | 20.49 | | | $ | 18.95 | | | $ | 15.98 | |
| Total return(C) | | | 27.68 | % | | | 15.30 | % | | | (7.47 | %)(D) | | | 8.13 | % | | | 18.59 | % | | | 45.22 | % |
| Ratios and supplemental data: | | | | | | | | | | | | | | | | | | | | | | | | |
| Net assets at end of period (000's) | | $ | 2,047 | | | $ | 1,104 | | | $ | 559 | | | $ | 705 | | | $ | 1,111 | | | $ | 1,066 | |
| Ratio to average net assets: | | | | | | | | | | | | | | | | | | | | | | | | |
| Net expenses | | | 1.25 | % | | | 1.25 | % | | | 1.23 | %(E) | | | 1.14 | % | | | 1.23 | % | | | 1.36 | % |
| Gross expenses | | | 2.66 | % | | | 3.43 | % | | | 7.09 | %(E) | | | 2.93 | %(F) | | | 2.70 | %(F) | | | 0.36 | %(F) |
| Net investment income (loss) | | | (0.24 | %) | | | (0.15 | %) | | | 0.01 | %(E) | | | (0.15 | %) | | | (0.07 | %) | | | 0.01 | % |
| Portfolio turnover rate | | | 30 | % | | | 38 | % | | | 6 | %(D) | | | 27 | % | | | 33 | % | | | 99 | % |
Touchstone Capital Growth Fund—Class C
Selected Data for a Share Outstanding Throughout Each Period
| | | | | | Period | |
| | | | | | Ended | |
| | | Year Ended June 30, | | | June 30, | |
| | | 2014 | | | 2013 | | | 2012(G) | |
| Net asset value at beginning of period | | $ | 21.66 | | | $ | 18.93 | | | $ | 20.06 | |
| Income (loss) from investment operations: | | | | | | | | | | | | |
| Net investment loss(A) | | | (0.25 | ) | | | (0.19 | ) | | | (0.03 | ) |
| Net realized and unrealized gains (losses) on investments | | | 6.05 | | | | 2.92 | | | | (1.09 | ) |
| Total from investment operations | | | 5.80 | | | | 2.73 | | | | (1.12 | ) |
| Distributions from: | | | | | | | | | | | | |
| Net investment income | | | — | | | | — | (B) | | | (0.01 | ) |
| Net asset value at end of period | | $ | 27.46 | | | $ | 21.66 | | | $ | 18.93 | |
| Total return(C) | | | 26.78 | % | | | 14.42 | % | | | (5.59 | %)(D) |
| Ratios and supplemental data: | | | | | | | | | | | | |
| Net assets at end of period (000's) | | $ | 188 | | | $ | 47 | | | $ | 2 | |
| Ratio to average net assets: | | | | | | | | | | | | |
| Net expenses | | | 2.00 | % | | | 2.00 | % | | | 2.00 | %(E) |
| Gross expenses | | | 8.91 | % | | | 23.11 | % | | | 962.52 | %(E) |
| Net investment loss | | | (0.99 | %) | | | (0.90 | %) | | | (0.76 | %)(E) |
| Portfolio turnover rate | | | 30 | % | | | 38 | % | | | 6 | %(D) |
| (A) | The net investment income (loss) per share is based on average shares outstanding for the period. |
| (B) | Less than $0.005 per share. |
| (C) | Total returns shown exclude the effect of applicable sales loads. If these charges were included, the returns would be lower. |
| (F) | Legal, printing and/or compliance audit expenses relating to civil litigation and certain regulatory actions in connection with market timing allegations were incurred, and the Former Adviser paid these expenses on behalf of the Funds. Had the Former Adviser not paid these expenses, the expenses for the Funds would have been higher than what is reflected in the financial highlights for the years ended March 31, 2012, 2011 and 2010. |
| (G) | The Fund began issuing Class C shares on April 12, 2012. |
See accompanying Notes to Financial Statements.
Financial Highlights (Continued)
Touchstone Capital Growth Fund—Class Y
Selected Data for a Share Outstanding Throughout Each Period
| | | | | | | | | Three | | | | |
| | | | | | | | | Months | | | | |
| | | | | | | | | Ended | | | | |
| | | Year Ended June 30, | | | June 30, | | | Year Ended March 31, | |
| | | 2014 | | | 2013 | | | 2012 | | | 2012 | | | 2011 | | | 2010 | |
| Net asset value at beginning of period | | $ | 22.26 | | | $ | 19.29 | | | $ | 20.83 | | | $ | 19.24 | | | $ | 16.21 | | | $ | 11.18 | |
| Income (loss) from investment operations: | | | | | | | | | | | | | | | | | | | | | | | | |
| Net investment income(A) | | | — | (B) | | | 0.02 | | | | 0.01 | | | | 0.02 | | | | 0.03 | | | | 0.04 | |
| Net realized and unrealized gains (losses) on investments | | | 6.23 | | | | 2.98 | | | | (1.55 | ) | | | 1.59 | | | | 3.04 | | | | 5.05 | |
| Total from investment operations | | | 6.23 | | | | 3.00 | | | | (1.54 | ) | | | 1.61 | | | | 3.07 | | | | 5.09 | |
| Distributions from: | | | | | | | | | | | | | | | | | | | | | | | | |
| Net investment income | | | (0.01 | ) | | | (0.03 | ) | | | — | (B) | | | (0.02 | ) | | | (0.04 | ) | | | (0.05 | ) |
| Return of capital | | | — | | | | — | | | | — | | | | — | | | | — | | | | (0.01 | ) |
| Total distributions | | | (0.01 | ) | | | (0.03 | ) | | | — | | | | (0.02 | ) | | | (0.04 | ) | | | (0.06 | ) |
| Net asset value at end of period | | $ | 28.48 | | | $ | 22.26 | | | $ | 19.29 | | | $ | 20.83 | | | $ | 19.24 | | | $ | 16.21 | |
| Total return | | | 28.01 | % | | | 15.61 | % | | | (7.42 | %)(C) | | | 8.39 | % | | | 18.93 | % | | | 45.52 | % |
| Ratios and supplemental data: | | | | | | | | | | | | | | | | | | | | | | | | |
| Net assets at end of period (000's) | | $ | 197,785 | | | $ | 171,277 | | | $ | 164,589 | | | $ | 182,828 | | | $ | 188,671 | | | $ | 178,941 | |
| Ratio to average net assets: | | | | | | | | | | | | | | | | | | | | | | | | |
| Net expenses | | | 1.00 | % | | | 1.00 | % | | | 0.98 | %(D) | | | 0.89 | % | | | 0.98 | % | | | 1.08 | % |
| Gross expenses | | | 1.10 | % | | | 1.14 | % | | | 1.27 | %(D) | | | 1.30 | %(E) | | | 1.32 | %(E) | | | 1.44 | %(E) |
| Net investment income | | | 0.01 | % | | | 0.10 | % | | | 0.26 | %(D) | | | 0.13 | % | | | 0.18 | % | | | 0.27 | % |
| Portfolio turnover rate | | | 30 | % | | | 38 | % | | | 6 | %(C) | | | 27 | % | | | 33 | % | | | 99 | % |
| Touchstone Capital Growth Fund—Institutional Class |
| Selected Data for a Share Outstanding Throughout Each Period |
| | | | | | Three | | | | |
| | | | | | Months | | | | |
| | | | | | Ended | | | | |
| | | Year Ended June 30, | | | June 30, | | | Year Ended March 31, | |
| | | 2014 | | | 2013 | | | 2012 | | | 2012 | | | 2011 | | | 2010 | |
| Net asset value at beginning of period | | $ | 22.40 | | | $ | 19.38 | | | $ | 20.95 | | | $ | 19.35 | | | $ | 16.31 | | | $ | 11.25 | |
| Income (loss) from investment operations: | | | | | | | | | | | | | | | | | | | | | | | | |
| Net investment income(A) | | | 0.03 | | | | 0.04 | | | | 0.02 | | | | 0.04 | | | | 0.05 | | | | 0.06 | |
| Net realized and unrealized gains (losses) on investments | | | 6.27 | | | | 3.00 | | | | (1.58 | ) | | | 1.60 | | | | 3.04 | | | | 5.07 | |
| Total from investment operations | | | 6.30 | | | | 3.04 | | | | (1.56 | ) | | | 1.64 | | | | 3.09 | | | | 5.13 | |
| Distributions from: | | | | | | | | | | | | | | | | | | | | | | | | |
| Net investment income | | | (0.04 | ) | | | (0.02 | ) | | | (0.01 | ) | | | (0.04 | ) | | | (0.05 | ) | | | (0.05 | ) |
| Return of capital | | | — | | | | — | | | | — | | | | — | | | | — | | | | (0.02 | ) |
| Total distributions | | | (0.04 | ) | | | (0.02 | ) | | | (0.01 | ) | | | (0.04 | ) | | | (0.05 | ) | | | (0.07 | ) |
| Net asset value at end of period | | $ | 28.66 | | | $ | 22.40 | | | $ | 19.38 | | | $ | 20.95 | | | $ | 19.35 | | | $ | 16.31 | |
| Total return | | | 28.13 | % | | | 15.71 | % | | | (7.44 | %)(C) | | | 8.51 | % | | | 18.99 | % | | | 45.69 | % |
| Ratios and supplemental data: | | | | | | | | | | | | | | | | | | | | | | | | |
| Net assets at end of period (000's) | | $ | 79 | | | $ | 58 | | | $ | 152 | | | $ | 14,636 | | | $ | 19,423 | | | $ | 26,977 | |
| Ratio to average net assets: | | | | | | | | | | | | | | | | | | | | | | | | |
| Net expenses | | | 0.90 | % | | | 0.90 | % | | | 0.88 | %(D) | | | 0.79 | % | | | 0.88 | % | | | 0.90 | % |
| Gross expenses | | | 24.91 | % | | | 24.29 | % | | | 1.83 | %(D) | | | 0.90 | %(E) | | | 0.85 | %(E) | | | 0.79 | %(E) |
| Net investment income | | | 0.11 | % | | | 0.20 | % | | | 0.36 | %(D) | | | 0.20 | % | | | 0.28 | % | | | 0.41 | % |
| Portfolio turnover rate | | | 30 | % | | | 38 | % | | | 6 | %(C) | | | 27 | % | | | 33 | % | | | 99 | % |
| (A) | The net investment income per share is based on average shares outstanding for the period. |
| (B) | Less than $0.005 per share. |
| (E) | Legal, printing and/or compliance audit expenses relating to civil litigation and certain regulatory actions in connection with market timing allegations were incurred, and the Former Adviser paid these expenses on behalf of the Funds. Had the Former Adviser not paid these expenses, the expenses for the Funds would have been higher than what is reflected in the financial highlights for the years ended March 31, 2012, 2011 and 2010. |
See accompanying Notes to Financial Statements.
Financial Highlights (Continued)
Touchstone International Small Cap Fund—Class A
Selected Data for a Share Outstanding Throughout Each Period
| | | | | | Three | | | | |
| | | | | | Months | | | | |
| | | | | | Ended | | | | |
| | | Year Ended June 30, | | | June 30, | | | Year Ended March 31, | |
| | | 2014 | | | 2013 | | | 2012 | | | 2012 | | | 2011 | | | 2010 | |
| Net asset value at beginning of period | | $ | 12.58 | | | $ | 10.21 | | | $ | 11.12 | | | $ | 11.88 | | | $ | 9.25 | | | $ | 6.25 | |
| Income (loss) from investment operations: | | | | | | | | | | | | | | | | | | | | | | | | |
| Net investment income (loss) | | | 0.11 | (A) | | | 0.11 | | | | 0.09 | (A) | | | 0.03 | (A) | | | (0.10 | )(A) | | | (0.08 | )(A) |
| Net realized and unrealized gains (losses) on investments | | | 3.00 | | | | 2.43 | | | | (0.90 | ) | | | (0.84 | ) | | | 2.73 | | | | 3.09 | (B) |
| Total from investment operations | | | 3.11 | | | | 2.54 | | | | (0.81 | ) | | | (0.81 | ) | | | 2.63 | | | | 3.01 | |
| Distributions from: | | | | | | | | | | | | | | | | | | | | | | | | |
| Net investment income | | | (0.21 | ) | | | (0.17 | ) | | | (0.10 | ) | | | (0.15 | ) | | | — | | | | (0.01 | ) |
| Capital contribution | | | — | | | | — | | | | — | | | | 0.20 | (C) | | | — | | | | — | |
| Net asset value at end of period | | $ | 15.48 | | | $ | 12.58 | | | $ | 10.21 | | | $ | 11.12 | | | $ | 11.88 | | | $ | 9.25 | |
| Total return(D) | | | 24.74 | % | | | 24.99 | % | | | (7.28 | %)(E) | | | (4.96 | %)(C) | | | 28.43 | % | | | 48.12 | %(B) |
| Ratios and supplemental data: | | | | | | | | | | | | | | | | | | | | | | | | |
| Net assets at end of period (000's) | | $ | 10,721 | | | $ | 489 | | | $ | 199 | | | $ | 143 | | | $ | 207 | | | $ | 918 | |
| Ratio to average net assets: | | | | | | | | | | | | | | | | | | | | | | | | |
| Net expenses | | | 1.55 | % | | | 1.55 | % | | | 1.55 | %(F) | | | 1.55 | % | | | 1.55 | % | | | 1.55 | % |
| Gross expenses | | | 2.12 | % | | | 7.77 | % | | | 19.37 | %(F) | | | 10.50 | %(G) | | | 3.23 | %(G) | | | 0.44 | %(G) |
| Net investment income (loss) | | | 0.76 | % | | | 1.41 | % | | | 3.36 | %(F) | | | 0.26 | % | | | (1.02 | %) | | | (0.97 | %) |
| Portfolio turnover rate | | | 60 | % | | | 79 | % | | | 21 | %(E) | | | 207 | % | | | 152 | % | | | 172 | % |
Touchstone International Small Cap Fund—Class C
Selected Data for a Share Outstanding Throughout Each Period
| | | | | | Period | |
| | | | | | Ended | |
| | | Year Ended June 30, | | | June 30, | |
| | | 2014 | | | 2013 | | | 2012(H) | |
| Net asset value at beginning of period | | $ | 12.54 | | | $ | 10.19 | | | $ | 10.94 | |
| Income (loss) from investment operations: | | | | | | | | | | | | |
| Net investment income | | | — | (A)(I) | | | 0.14 | | | | 0.05 | (A) |
| Net realized and unrealized gains (losses) on investments | | | 2.99 | | | | 2.31 | | | | (0.69 | ) |
| Total from investment operations | | | 2.99 | | | | 2.45 | | | | (0.64 | ) |
| Distributions from: | | | | | | | | | | | | |
| Net investment income | | | (0.20 | ) | | | (0.10 | ) | | �� | (0.11 | ) |
| Net asset value at end of period | | $ | 15.33 | | | $ | 12.54 | | | $ | 10.19 | |
| Total return(D) | | | 23.94 | % | | | 24.08 | % | | | (5.84 | %)(E) |
| Ratios and supplemental data: | | | | | | | | | | | | |
| Net assets at end of period (000's) | | $ | 613 | | | $ | 7 | | | $ | 2 | |
| Ratio to average net assets: | | | | | | | | | | | | |
| Net expenses | | | 2.30 | % | | | 2.30 | % | | | 2.30 | %(F) |
| Gross expenses | | | 7.28 | % | | | 94.29 | % | | | 968.58 | %(F) |
| Net investment income | | | 0.01 | % | | | 0.66 | % | | | 2.12 | %(F) |
| Portfolio turnover rate | | | 60 | % | | | 79 | % | | | 21 | %(E) |
| (A) | The net investment income (loss) per share is based on average shares outstanding for the period. |
| (B) | Impact of payment from affiliate was less than $0.01 per share and 0.01%, respectively. |
| (C) | Impact of one time distribution of settlement funds from the Bank of America Fair Fund. If the distribution had not occurred the total return would have been lower. |
| (D) | Total returns shown exclude the effect of applicable sales loads. If these charges were included, the returns would be lower. |
| (G) | Legal, printing and/or compliance audit expenses relating to civil litigation and certain regulatory actions in connection with market timing allegations were incurred, and the Former Adviser paid these expenses on behalf of the Funds. Had the Former Adviser not paid these expenses, the expenses for the Funds would have been higher than what is reflected in the financial highlights for the years ended March 31, 2012, 2011 and 2010. |
| (H) | The Fund began issuing Class C shares on April 12, 2012. |
| (I) | Less than $0.005 per share. |
See accompanying Notes to Financial Statements.
Financial Highlights (Continued)
Touchstone International Small Cap Fund—Class Y
Selected Data for a Share Outstanding Throughout Each Period
| | | | | | Three | | | | |
| | | | | | Months | | | | |
| | | | | | Ended | | | | |
| | | Year Ended June 30, | | | June 30, | | | Year Ended March 31, | |
| | | 2014 | | | 2013 | | | 2012 | | | 2012 | | | 2011 | | | 2010 | |
| Net asset value at beginning of period | | $ | 12.84 | | | $ | 10.40 | | | $ | 11.32 | | | $ | 12.14 | | | $ | 9.44 | | | $ | 6.37 | |
| Income (loss) from investment operations: | | | | | | | | | | | | | | | | | | | | | | | | |
| Net investment income (loss) | | | 0.16 | (A) | | | 0.21 | | | | 0.10 | (A) | | | 0.07 | (A) | | | (0.08 | )(A) | | | (0.05 | )(A) |
| Net realized and unrealized gains (losses) on investments | | | 3.07 | | | | 2.40 | | | | (0.92 | ) | | | (0.88 | ) | | | 2.80 | | | | 3.14 | (B) |
| Total from investment operations | | | 3.23 | | | | 2.61 | | | | (0.82 | ) | | | (0.81 | ) | | | 2.72 | | | | 3.09 | |
| Distributions from: | | | | | | | | | | | | | | | | | | | | | | | | |
| Net investment income | | | (0.21 | ) | | | (0.17 | ) | | | (0.10 | ) | | | (0.21 | ) | | | (0.02 | ) | | | (0.02 | ) |
| Capital contribution | | | — | | | | — | | | | — | | | | 0.20 | (C) | | | — | | | | — | |
| Net asset value at end of period | | $ | 15.86 | | | $ | 12.84 | | | $ | 10.40 | | | $ | 11.32 | | | $ | 12.14 | | | $ | 9.44 | |
| Total return | | | 25.16 | % | | | 25.38 | % | | | (7.22 | %)(D) | | | (4.81 | %)(C) | | | 28.82 | % | | | 48.56 | %(B) |
| Ratios and supplemental data: | | | | | | | | | | | | | | | | | | | | | | | | |
| Net assets at end of period (000's) | | $ | 120,537 | | | $ | 90,125 | | | $ | 80,754 | | | $ | 90,029 | | | $ | 118,679 | | | $ | 107,478 | |
| Ratio to average net assets: | | | | | | | | | | | | | | | | | | | | | | | | |
| Net expenses | | | 1.25 | % | | | 1.24 | % | | | 1.30 | %(E) | | | 1.30 | % | | | 1.30 | % | | | 1.30 | % |
| Gross expenses | | | 1.44 | % | | | 1.53 | % | | | 1.74 | %(E) | | | 1.69 | %(F) | | | 1.59 | %(F) | | | 1.74 | %(F) |
| Net investment income (loss) | | | 1.06 | % | | | 1.71 | % | | | 3.61 | %(E) | | | 0.60 | % | | | (0.80 | %) | | | (0.65 | %) |
| Portfolio turnover rate | | | 60 | % | | | 79 | % | | | 21 | %(D) | | | 207 | % | | | 152 | % | | | 172 | % |
Touchstone International Small Cap Fund—Institutional Class
Selected Data for a Share Outstanding Throughout Each Period
| | | | | | Three | | | | |
| | | | | | Months | | | | |
| | | | | | Ended | | | | |
| | | Year Ended June 30, | | | June 30, | | | Year Ended March 31, | |
| | | 2014 | | | 2013 | | | 2012 | | | 2012 | | | 2011 | | | 2010 | |
| Net asset value at beginning of period | | $ | 12.90 | | | $ | 10.45 | | | $ | 11.37 | | | $ | 12.20 | | | $ | 9.49 | | | $ | 6.39 | |
| Income (loss) from investment operations: | | | | | | | | | | | | | | | | | | | | | | | | |
| Net investment income (loss) | | | 0.18 | (A) | | | 0.23 | | | | 0.10 | (A) | | | 0.13 | (A) | | | (0.06 | )(A) | | | (0.03 | )(A) |
| Net realized and unrealized gains | | | | | | | | | | | | | | | | | | | | | | | | |
| (losses) on investments | | | 3.09 | | | | 2.42 | | | | (0.91 | ) | | | (0.93 | ) | | | 2.81 | | | | 3.16 | (B) |
| Total from investment operations | | | 3.27 | | | | 2.65 | | | | (0.81 | ) | | | (0.80 | ) | | | 2.75 | | | | 3.13 | |
| Distributions from: | | | | | | | | | | | | | | | | | | | | | | | | |
| Net investment income | | | (0.23 | ) | | | (0.20 | ) | | | (0.11 | ) | | | (0.24 | ) | | | (0.04 | ) | | | (0.03 | ) |
| Capital contribution | | | — | | | | — | | | | — | | | | 0.21 | (C) | | | — | | | | — | |
| Net asset value at end of period | | $ | 15.94 | | | $ | 12.90 | | | $ | 10.45 | | | $ | 11.37 | | | $ | 12.20 | | | $ | 9.49 | |
| Total return | | | 25.38 | % | | | 25.59 | % | | | (7.13 | %)(D) | | | (4.55 | %)(C) | | | 29.00 | % | | | 49.05 | %(B) |
| Ratios and supplemental data: | | | | | | | | | | | | | | | | | | | | | | | | |
| Net assets at end of period (000's) | | $ | 30,223 | | | $ | 16,238 | | | $ | 3,869 | | | $ | 6,288 | | | $ | 1,173 | | | $ | 3,168 | |
| Ratio to average net assets: | | | | | | | | | | | | | | | | | | | | | | | |
| Net expenses | | | 1.08 | % | | | 1.05 | % | | | 1.05 | %(E) | | | 1.05 | % | | | 1.05 | % | | | 1.05 | % |
| Gross expenses | | | 1.33 | % | | | 1.50 | % | | | 2.05 | %(E) | | | 1.46 | %(F) | | | 2.22 | %(F) | | | 1.14 | %(F) |
| Net investment income (loss) | | | 1.23 | % | | | 1.90 | % | | | 3.86 | %(E) | | | 1.15 | % | | | (0.61 | %) | | | (0.35 | %) |
| Portfolio turnover rate | | | 60 | % | | | 79 | % | | | 21 | %(D) | | | 207 | % | | | 152 | % | | | 172 | % |
| (A) | The net investment income (loss) per share is based on average shares outstanding for the period. |
| (B) | Impact of payment from affiliate was less than $0.01 per share and 0.01%, respectively. |
| (C) | Impact of one time distribution of settlement funds from the Bank of America Fair Fund. If the distribution had not occurred the total return would have been lower. |
| (F) | Legal, printing and/or compliance audit expenses relating to civil litigation and certain regulatory actions in connection with market timing allegations were incurred, and the Former Adviser paid these expenses on behalf of the Funds. Had the Former Adviser not paid these expenses, the expenses for the Funds would have been higher than what is reflected in the financial highlights for the years ended March 31, 2012, 2011 and 2010. |
See accompanying Notes to Financial Statements.
Financial Highlights (Continued)
Touchstone Small Cap Value Opportunities Fund—Class A
Selected Data for a Share Outstanding Throughout Each Period
| | | | | | Three | | | | |
| | | | | | Months | | | | |
| | | | | | Ended | | | | |
| | | Year Ended June 30, | | | June 30, | | | Year Ended March 31, | |
| | | 2014 | | | 2013 | | | 2012 | | | 2012 | | | 2011 | | | 2010 | |
| Net asset value at beginning of period | | $ | 18.75 | | | $ | 16.97 | | | $ | 18.08 | | | $ | 19.06 | | | $ | 16.43 | | | $ | 11.05 | |
| Income (loss) from investment operations: | | | | | | | | | | | | | | | | | | | | | | | | |
| Net investment income (loss) | | | (0.05 | ) | | | 0.09 | (A) | | | (0.01 | ) | | | (0.06 | )(A) | | | (0.08 | )(A) | | | (0.01 | )(A) |
| Net realized and unrealized gains (losses) on investments | | | 5.88 | (B) | | | 3.66 | | | | (0.57 | ) | | | 0.04 | | | | 2.71 | | | | 5.39 | |
| Total from investment operations | | | 5.83 | | | | 3.75 | | | | (0.58 | ) | | | (0.02 | ) | | | 2.63 | | | | 5.38 | |
| Distributions from: | | | | | | | | | | | | | | | | | | | | | | | | |
| Net investment income | | | (0.02 | ) | | | (0.09 | ) | | | — | | | | — | | | | — | | | | — | |
| Realized capital gains | | | (3.64 | ) | | | (1.88 | ) | | | (0.53 | ) | | | (0.96 | ) | | | — | | | | — | |
| Total distributions | | | (3.66 | ) | | | (1.97 | ) | | | (0.53 | ) | | | (0.96 | ) | | | — | | | | — | |
| Net asset value at end of period | | $ | 20.92 | | | $ | 18.75 | | | $ | 16.97 | | | $ | 18.08 | | | $ | 19.06 | | | $ | 16.43 | |
| Total return(C) | | | 33.35 | %(B) | | | 24.31 | % | | | (3.09 | %)(D) | | | 0.60 | % | | | 16.01 | % | | | 48.71 | % |
| Ratios and supplemental data: | | | | | | | | | | | | | | | | | | | | | | | | |
| Net assets at end of period (000's) | | $ | 13,332 | | | $ | 1,309 | | | $ | 2,023 | | | $ | 2,251 | | | $ | 3,068 | | | $ | 4,815 | |
| Ratio to average net assets: | | | | | | | | | | | | | | | | | | | | | | | | |
| Net expenses | | | 1.50 | % | | | 1.50 | % | | | 1.50 | %(E) | | | 1.50 | % | | | 1.50 | % | | | 1.50 | % |
| Gross expenses | | | 1.93 | % | | | 2.46 | % | | | 3.31 | %(E) | | | 2.27 | %(F) | | | 2.10 | %(F) | | | 1.47 | %(F) |
| Net investment income (loss) | | | (0.09 | %) | | | 0.53 | % | | | (0.16 | %)(E) | | | (0.34 | %) | | | (0.46 | %) | | | (0.08 | %) |
| Portfolio turnover rate | | | 73 | % | | | 95 | % | | | 18 | %(D) | | | 49 | % | | | 55 | % | | | 83 | % |
Touchstone Small Cap Value Opportunities Fund—Class C
Selected Data for a Share Outstanding Throughout Each Period
| | | | | | Period | |
| | | | | | Ended | |
| | | Year Ended June 30, | | | June 30, | |
| | | 2014 | | | 2013 | | | 2012(G) | |
| Net asset value at beginning of period | | $ | 18.69 | | | $ | 16.95 | | | $ | 17.58 | |
| Income (loss) from investment operations: | | | | | | | | | | | | |
| Net investment loss | | | (0.14 | ) | | | (0.04 | )(A) | | | (0.03 | ) |
| Net realized and unrealized gains (losses) on investments | | | 5.79 | (B) | | | 3.66 | | | | (0.07 | ) |
| Total from investment operations | | | 5.65 | | | | 3.62 | | | | (0.10 | ) |
| Distributions from: | | | | | | | | | | | | |
| Realized capital gains | | | (3.64 | ) | | | (1.88 | ) | | | (0.53 | ) |
| Net asset value at end of period | | $ | 20.70 | | | $ | 18.69 | | | $ | 16.95 | |
| Total return(C) | | | 32.43 | %(B) | | | 23.44 | % | | | (0.51 | %)(D) |
| Ratios and supplemental data: | | | | | | | | | | | | |
| Net assets at end of period (000's) | | $ | 558 | | | $ | 36 | | | $ | 2 | |
| Ratio to average net assets: | | | | | | | | | | | | |
| Net expenses | | | 2.25 | % | | | 2.25 | % | | | 2.25 | %(E) |
| Gross expenses | | | 5.09 | % | | | 25.27 | % | | | 942.58 | %(E) |
| Net investment loss | | | (0.84 | %) | | | (0.22 | %) | | | (0.95 | %)(E) |
| Portfolio turnover rate | | | 73 | % | | | 95 | % | | | 18 | %(D) |
| (A) | The net investment income (loss) per share is based on average shares outstanding for the period. |
| (B) | Impact of payment from affiliate was less than $0.01 per share and 0.01%, respectively. |
| (C) | Total returns shown exclude the effect of applicable sales loads. If these charges were included, the returns would be lower. |
| (F) | Legal, printing and/or compliance audit expenses relating to civil litigation and certain regulatory actions in connection with market timing allegations were incurred, and the Former Adviser paid these expenses on behalf of the Funds. Had the Former Adviser not paid these expenses, the expenses for the Funds would have been higher than what is reflected in the financial highlights for the years ended March 31, 2012, 2011 and 2010. |
| (G) | The Fund began issuing Class C shares on April 12, 2012. |
See accompanying Notes to Financial Statements.
Financial Highlights (Continued)
Touchstone Small Cap Value Opportunities Fund— Class Y
Selected Data for a Share Outstanding Throughout Each Period
| | | | | | Three | | | |
| | | | | | Months | | | |
| | | | | | Ended | | | |
| | | Year Ended June 30, | | June 30, | | Year Ended March 31, |
| | | 2014 | | | 2013 | | | 2012 | | 2012 | | | 2011 | | | 2010 | |
| Net asset value at beginning of period | | $ | 19.45 | | | $ | 17.51 | | | $ | 18.62 | | | $ | 19.55 | | | $ | 16.80 | | | $ | 11.29 | |
| Income (loss) from investment operations: | | | | | | | | | | | | | | | | | | | | | | | | |
| Net investment income (loss) | | | 0.04 | | | | 0.15 | (A) | | | 0.01 | | | | (0.02 | )(A) | | | (0.04 | )(A) | | | 0.03 | (A) |
| Net realized and unrealized gains (losses) on investments | | | 6.11 | (B) | | | 3.77 | | | | (0.59 | ) | | | 0.05 | | | | 2.79 | | | | 5.51 | |
| Total from investment operations | | | 6.15 | | | | 3.92 | | | | (0.58 | ) | | | 0.03 | | | | 2.75 | | | | 5.54 | |
| Distributions from: | | | | | | | | | | | | | | | | | | | | | | | | |
| Net investment income | | | (0.06 | ) | | | (0.10 | ) | | | — | | | | — | | | | — | | | | (0.03 | ) |
| Realized capital gains | | | (3.64 | ) | | | (1.88 | ) | | | (0.53 | ) | | | (0.96 | ) | | | — | | | | — | |
| Total distributions | | | (3.70 | ) | | | (1.98 | ) | | | (0.53 | ) | | | (0.96 | ) | | | — | | | | (0.03 | ) |
| Net asset value at end of period | | $ | 21.90 | | | $ | 19.45 | | | $ | 17.51 | | | $ | 18.62 | | | $ | 19.55 | | | $ | 16.80 | |
| Total return | | | 33.80 | %(B) | | | 24.68 | % | | | (3.05 | %)(C) | | | 0.85 | % | | | 16.37 | % | | | 49.10 | % |
| Ratios and supplemental data: | | | | | | | | | | | | | | | | | | | | | | | | |
| Net assets at end of period (000's) | | $ | 140,689 | | | $ | 96,584 | | | $ | 82,861 | | | $ | 87,984 | | | $ | 98,269 | | | $ | 86,737 | |
| Ratio to average net assets: | | | | | | | | | | | | | | | | | | | | | | | | |
| Net expenses | | | 1.17 | % | | | 1.19 | % | | | 1.22 | %(D) | | | 1.25 | % | | | 1.25 | % | | | 1.25 | % |
| Gross expenses | | | 1.24 | % | | | 1.29 | % | | | 1.40 | %(D) | | | 1.27 | %(E) | | | 1.26 | %(E) | | | 1.30 | %(E) |
| Net investment income (loss) | | | 0.24 | % | | | 0.84 | % | | | 0.12 | %(D) | | | (0.09 | %) | | | (0.23 | %) | | | 0.18 | % |
| Portfolio turnover rate | | | 73 | % | | | 95 | % | | | 18 | %(C) | | | 49 | % | | | 55 | % | | | 83 | % |
Touchstone Small Cap Value Opportunities Fund—Institutional Class
Selected Data for a Share Outstanding Throughout Each Period
| | | | | | Three | | | |
| | | | | | Months | | | |
| | | | | | Ended | | | |
| | | Year Ended June 30, | | June 30, | | Year Ended March 31, |
| | | 2014 | | | 2013 | | | 2012 | | 2012 | | | 2011 | | | 2010 | |
| Net asset value at beginning of period | | $ | 19.62 | | | $ | 17.63 | | | $ | 18.75 | | | $ | 19.65 | | | $ | 16.87 | | | $ | 11.32 | |
| Income (loss) from investment operations: | | | | | | | | | | | | | | | | | | | | | | | | |
| Net investment income (loss) | | | 0.04 | | | | 0.17 | (A) | | | 0.01 | | | | 0.01 | (A) | | | (0.01 | )(A) | | | 0.05 | (A) |
| Net realized and unrealized gains (losses) on investments | | | 6.18 | (B) | | | 3.82 | | | | (0.60 | ) | | | 0.05 | | | | 2.79 | | | | 5.54 | |
| Total from investment operations | | | 6.22 | | | | 3.99 | | | | (0.59 | ) | | | 0.06 | | | | 2.78 | | | | 5.59 | |
| Distributions from: | | | | | | | | | | | | | | | | | | | | | | | | |
| Net investment income | | | (0.07 | ) | | | (0.12 | ) | | | — | | | | — | | | | — | | | | (0.04 | ) |
| Realized capital gains | | | (3.64 | ) | | | (1.88 | ) | | | (0.53 | ) | | | (0.96 | ) | | | — | | | | — | |
| Total distributions | | | (3.71 | ) | | | (2.00 | ) | | | (0.53 | ) | | | (0.96 | ) | | | — | | | | (0.04 | ) |
| Net asset value at end of period | | $ | 22.13 | | | $ | 19.62 | | | $ | 17.63 | | | $ | 18.75 | | | $ | 19.65 | | | $ | 16.87 | |
| Total return | | | 33.90 | %(B) | | | 24.82 | % | | | (3.04 | %)(C) | | | 1.00 | % | | | 16.48 | % | | | 49.46 | % |
| Ratios and supplemental data: | | | | | | | | | | | | | | | | | | | | | | | | |
| Net assets at end of period (000's) | | $ | 26,466 | | | $ | 8,096 | | | $ | 7,023 | | | $ | 19,066 | | | $ | 20,119 | | | $ | 26,915 | |
| Ratio to average net assets: | | | | | | | | | | | | | | | | | | | | | | | | |
| Net expenses | | | 1.10 | % | | | 1.10 | % | | | 1.10 | %(D) | | | 1.10 | % | | | 1.10 | % | | | 1.10 | % |
| Gross expenses | | | 1.37 | % | | | 1.46 | % | | | 1.60 | %(D) | | | 1.18 | %(E) | | | 1.18 | %(E) | | | 1.16 | %(E) |
| Net investment income (loss) | | | 0.31 | % | | | 0.93 | % | | | 0.24 | %(D) | | | 0.06 | % | | | (0.08 | %) | | | 0.34 | % |
| Portfolio turnover rate | | | 73 | % | | | 95 | % | | | 18 | %(C) | | | 49 | % | | | 55 | % | | | 83 | % |
| (A) | The net investment income (loss) per share is based on average shares outstanding for the period. |
| (B) | Impact of payment from affiliate was less than $0.01 per share and 0.01%, respectively. |
| (E) | Legal, printing and/or compliance audit expenses relating to civil litigation and certain regulatory actions in connection with market timing allegations were incurred, and the Former Adviser paid these expenses on behalf of the Funds. Had the Former Adviser not paid these expenses, the expenses for the Funds would have been higher than what is reflected in the financial highlights for the years ended March 31, 2012, 2011 and 2010. |
See accompanying Notes to Financial Statements.
Financial Highlights (Continued)
Touchstone Value Fund—Class A
Selected Data for a Share Outstanding Throughout Each Period
| | | | | | Three | | | |
| | | | | | Months | | | |
| | | | | | Ended | | | |
| | | Year Ended June 30, | | June 30, | | Year Ended March 31, |
| | | 2014 | | | 2013 | | | 2012 | | 2012 | | | 2011 | | | 2010 | |
| Net asset value at beginning of period | | $ | 8.02 | | | $ | 6.95 | | | $ | 7.14 | | | $ | 6.67 | | | $ | 6.17 | | | $ | 4.00 | |
| Income (loss) from investment operations: | | | | | | | | | | | | | | | | | | | | | | | | |
| Net investment income | | | 0.19 | | | | 0.15 | (A) | | | 0.03 | (A) | | | 0.12 | (A) | | | 0.08 | (A) | | | 0.09 | (A) |
| Net realized and unrealized gains (losses) on investments | | | 1.53 | | | | 1.30 | | | | (0.16 | ) | | | 0.45 | | | | 0.50 | | | | 2.17 | |
| Total from investment operations | | | 1.72 | | | | 1.45 | | | | (0.13 | ) | | | 0.57 | | | | 0.58 | | | | 2.26 | |
| Distributions from: | | | | | | | | | | | | | | | | | | | | | | | | |
| Net investment income | | | (0.18 | ) | | | (0.15 | ) | | | (0.06 | ) | | | (0.10 | ) | | | (0.08 | ) | | | (0.09 | ) |
| Realized capital gains | | | — | | | | (0.23 | ) | | | — | | | | — | | | | — | | | | — | |
| Total distributions | | | (0.18 | ) | | | (0.38 | ) | | | (0.06 | ) | | | (0.10 | ) | | | (0.08 | ) | | | (0.09 | ) |
| Net asset value at end of period | | $ | 9.56 | | | $ | 8.02 | | | $ | 6.95 | | | $ | 7.14 | | | $ | 6.67 | | | $ | 6.17 | |
| Total return(B) | | | 21.50 | % | | | 21.56 | % | | | (1.83 | %)(C) | | | 8.77 | % | | | 9.59 | % | | | 57.05 | % |
| Ratios and supplemental data: | | | | | | | | | | | | | | | | | | | | | | | | |
| Net assets at end of period (000's) | | $ | 66,000 | | | $ | 53,433 | | | $ | 1,583 | | | $ | 1,606 | | | $ | 2,325 | | | $ | 2,514 | |
| Ratio to average net assets: | | | | | | | | | | | | | | | | | | | | | | | | |
| Net expenses | | | 1.07 | % | | | 1.00 | % | | | 1.20 | %(D) | | | 1.20 | % | | | 1.20 | % | | | 1.26 | % |
| Gross expenses | | | 1.31 | % | | | 1.51 | % | | | 3.49 | %(D) | | | 1.96 | %(E) | | | 2.04 | %(E) | | | 1.76 | %(E) |
| Net investment income | | | 2.13 | % | | | 1.96 | % | | | 1.68 | %(D) | | | 1.84 | % | | | 1.31 | % | | | 1.72 | % |
| Portfolio turnover rate | | | 26 | % | | | 110 | %(F) | | | 13 | %(C) | | | 15 | % | | | 13 | % | | | 25 | % |
Touchstone Value Fund—Class C
Selected Data for a Share Outstanding Throughout Each Period
| | | | | | | | | Period |
| | | | | | | | | Ended |
| | | Year Ended June 30, | | June 30, |
| | | 2014 | | | 2013 | | | 2012(G) |
| Net asset value at beginning of period | | $ | 8.02 | | | $ | 6.95 | | | $ | 6.90 | |
| Income from investment operations: | | | | | | | | | | | |
| Net investment income | | | 0.11 | | | | 0.09 | (A) | | | 0.01 | (A) |
| Net realized and unrealized gains on investments | | | 1.54 | | | | 1.30 | | | | 0.10 | |
| Total from investment operations | | | 1.65 | | | | 1.39 | | | | 0.11 | |
| Distributions from: | | | | | | | | | | | | |
| Net investment income | | | (0.12 | ) | | | (0.09 | ) | | | (0.06 | ) |
| Realized capital gains | | | — | | | | (0.23 | ) | | | — | |
| Total distributions | | | (0.12 | ) | | | (0.32 | ) | | | (0.06 | ) |
| Net asset value at end of period | | $ | 9.55 | | | $ | 8.02 | | | $ | 6.95 | |
| Total return(B) | | | 20.61 | % | | | 20.62 | % | | | 1.56 | %(C) |
| Ratios and supplemental data: | | | | | | | | | | | | |
| Net assets at end of period (000's) | | $ | 5,218 | | | $ | 3,025 | | | $ | 3 | |
| Ratio to average net assets: | | | | | | | | | | | | |
| Net expenses | | | 1.82 | % | | | 1.75 | % | | | 1.95 | %(D) |
| Gross expenses | | | 2.19 | % | | | 2.30 | % | | | 929.36 | %(D) |
| Net investment income | | | 1.38 | % | | | 1.21 | % | | | 0.93 | %(D) |
| Portfolio turnover rate | | | 26 | % | | | 110 | %(F) | | | 13 | %(C) |
| (A) | The net investment income per share is based on average shares outstanding for the period. |
| (B) | Total returns shown exclude the effect of applicable sales loads. If these charges were included, the returns would be lower. |
| (E) | Legal, printing and/or compliance audit expenses relating to civil litigation and certain regulatory actions in connection with market timing allegations were incurred, and the Former Adviser paid these expenses on behalf of the Funds. Had the Former Adviser not paid these expenses, the expenses for the Funds would have been higher than what is reflected in the financial highlights for the years ended March 31, 2012, 2011 and 2010. |
| (F) | Portfolio turnover excludes the purchases and sales of the Acquired Fund (see Note 9). If these transactions were included, portfolio turnover would have been higher. |
| (G) | The Fund began issuing Class C shares on April 12, 2012. |
See accompanying Notes to Financial Statements.
Financial Highlights (Continued)
Touchstone Value Fund—Class Y
Selected Data for a Share Outstanding Throughout Each Period
| | | | | | Three | | | |
| | | | | | Months | | | |
| | | | | | Ended | | | |
| | | Year Ended June 30, | | June 30, | | Year Ended March 31, |
| | | 2014 | | | 2013 | | | 2012 | | 2012 | | | 2011 | | | 2010 | |
| Net asset value at beginning of period | | $ | 8.05 | | | $ | 6.97 | | | $ | 7.16 | | | $ | 6.69 | | | $ | 6.19 | | | $ | 4.01 | |
| Income (loss) from investment operations: | | | | | | | | | | | | | | | | | | | | | | | | |
| Net investment income | | | 0.21 | | | | 0.16 | (A) | | | 0.03 | (A) | | | 0.12 | (A) | | | 0.09 | (A) | | | 0.10 | (A) |
| Net realized and unrealized gains (losses) on investments | | | 1.53 | | | | 1.32 | | | | (0.15 | ) | | | 0.47 | | | | 0.51 | | | | 2.19 | |
| Total from investment operations | | | 1.74 | | | | 1.48 | | | | (0.12 | ) | | | 0.59 | | | | 0.60 | | | | 2.29 | |
| Distributions from: | | | | | | | | | | | | | | | | | | | | | | | | |
| Net investment income | | | (0.20 | ) | | | (0.17 | ) | | | (0.07 | ) | | | (0.12 | ) | | | (0.10 | ) | | | (0.11 | ) |
| Realized capital gains | | | — | | | | (0.23 | ) | | | — | | | | — | | | | — | | | | — | |
| Total distributions | | | (0.20 | ) | | | (0.40 | ) | | | (0.07 | ) | | | (0.12 | ) | | | (0.10 | ) | | | (0.11 | ) |
| Net asset value at end of period | | $ | 9.59 | | | $ | 8.05 | | | $ | 6.97 | | | $ | 7.16 | | | $ | 6.69 | | | $ | 6.19 | |
| Total return | | | 21.71 | % | | | 21.91 | % | | | (1.69 | %)(B) | | | 9.01 | % | | | 9.86 | % | | | 57.65 | % |
| Ratios and supplemental data: | | | | | | | | | | | | | | | | | | | | | | | | |
| Net assets at end of period (000's) | | $ | 113,055 | | | $ | 99,398 | | | $ | 51,447 | | | $ | 87,546 | | | $ | 86,659 | | | $ | 88,766 | |
| Ratio to average net assets: | | | | | | | | | | | | | | | | | | | | | | | | |
| Net expenses | | | 0.80 | % | | | 0.77 | % | | | 0.95 | %(C) | | | 0.95 | % | | | 0.95 | % | | | 1.00 | % |
| Gross expenses | | | 0.99 | % | | | 1.09 | % | | | 1.23 | %(C) | | | 1.03 | %(D) | | | 1.04 | %(D) | | | 1.07 | %(D) |
| Net investment income | | | 2.39 | % | | | 2.19 | % | | | 1.93 | %(C) | | | 1.90 | % | | | 1.58 | % | | | 1.87 | % |
| Portfolio turnover rate | | | 26 | % | | | 110 | %(E) | | | 13 | %(B) | | | 15 | % | | | 13 | % | | | 25 | % |
Touchstone Value Fund—Institutional Class
Selected Data for a Share Outstanding Throughout Each Period
| | | | | | Three | | | |
| | | | | | Months | | | |
| | | | | | Ended | | | |
| | | Year Ended June 30, | | June 30, | | Year Ended March 31, |
| | | 2014 | | | 2013 | | | 2012 | | 2012 | | | 2011 | | | 2010 | |
| Net asset value at beginning of period | | $ | 8.03 | | | $ | 6.96 | | | $ | 7.15 | | | $ | 6.68 | | | $ | 6.18 | | | $ | 4.01 | |
| Income (loss) from investment operations: | | | | | | | | | | | | | | | | | | | | | | | | |
| Net investment income | | | 0.21 | | | | 0.17 | (A) | | | 0.03 | (A) | | | 0.13 | (A) | | | 0.10 | (A) | | | 0.11 | (A) |
| Net realized and unrealized gains (losses) on investments | | | 1.54 | | | | 1.31 | | | | (0.16 | ) | | | 0.46 | | | | 0.51 | | | | 2.18 | |
| Total from investment operations | | | 1.75 | | | | 1.48 | | | | (0.13 | ) | | | 0.59 | | | | 0.61 | | | | 2.29 | |
| Distributions from: | | | | | | | | | | | | | | | | | | | | | | | | |
| Net investment income | | | (0.21 | ) | | | (0.18 | ) | | | (0.06 | ) | | | (0.12 | ) | | | (0.11 | ) | | | (0.12 | ) |
| Realized capital gains | | | — | | | | (0.23 | ) | | | — | | | | — | | | | — | | | | — | |
| Total distributions | | | (0.21 | ) | | | (0.41 | ) | | | (0.06 | ) | | | (0.12 | ) | | | (0.11 | ) | | | (0.12 | ) |
| Net asset value at end of period | | $ | 9.57 | | | $ | 8.03 | | | $ | 6.96 | | | $ | 7.15 | | | $ | 6.68 | | | $ | 6.18 | |
| Total return | | | 21.92 | % | | | 21.92 | % | | | (1.62 | %)(B) | | | 9.13 | % | | | 9.99 | % | | | 57.64 | % |
| Ratios and supplemental data: | | | | | | | | | | | | | | | | | | | | | | | | |
| Net assets at end of period (000's) | | $ | 245,573 | | | $ | 186,990 | | | $ | 69,549 | | | $ | 33,727 | | | $ | 42,106 | | | $ | 51,274 | |
| Ratio to average net assets: | | | | | | | | | | | | | | | | | | | | | | | | |
| Net expenses | | | 0.67 | % | | | 0.67 | % | | | 0.85 | %(C) | | | 0.85 | % | | | 0.85 | % | | | 0.87 | % |
| Gross expenses | | | 0.87 | % | | | 0.99 | % | | | 1.09 | %(C) | | | 0.88 | %(D) | | | 0.89 | %(D) | | | 0.90 | %(D) |
| Net investment income | | | 2.52 | % | | | 2.29 | % | | | 2.04 | %(C) | | | 2.00 | % | | | 1.67 | % | | | 2.01 | % |
| Portfolio turnover rate | | | 26 | % | | | 110 | %(E) | | | 13 | %(B) | | | 15 | % | | | 13 | % | | | 25 | % |
| (A) | The net investment income per share is based on average shares outstanding for the period. |
| (D) | Legal, printing and/or compliance audit expenses relating to civil litigation and certain regulatory actions in connection with market timing allegations were incurred, and the Former Adviser paid these expenses on behalf of the Funds. Had the Former Adviser not paid these expenses, the expenses for the Funds would have been higher than what is reflected in the financial highlights for the years ended March 31, 2012, 2011 and 2010. |
| (E) | Portfolio turnover excludes the purchases and sales of the Acquired Fund (see Note 9). If these transactions were included, portfolio turnover would have been higher. |
See accompanying Notes to Financial Statements.
Notes to Financial Statements
June 30, 2014
1. Organization
The Touchstone Strategic Trust (the “Trust”) is registered under the Investment Company Act of 1940, as amended (the “1940 Act”), as an open-end management investment company. The Trust was established as a Massachusetts business trust pursuant to a Declaration of Trust dated November 18, 1982. The Trust consists of seventeen funds including the following four funds (individually, a “Fund”, and collectively, the “Funds”):
Touchstone Capital Growth Fund (“Capital Growth Fund”)
Touchstone International Small Cap Fund (“International Small Cap Fund”)
Touchstone Small Cap Value Opportunities Fund (“Small Cap Value Opportunities Fund”)
Touchstone Value Fund (“Value Fund”)
Each Fund is an open-end, diversified management investment company, with the exception of the Capital Growth Fund, which is an open-end, non-diversified management investment company.
The Declaration of Trust permits the Trust to issue an unlimited number of shares of beneficial interest of each Fund. The Funds are registered to offer the following classes of shares: Class A shares, Class C shares, Class Y shares, and Institutional Class shares. The assets of each Fund are segregated, and a shareholder’s interest is limited to the Fund in which shares are held. The Funds’ prospectus provides a description of each Fund’s investment goals, policies, and strategies along with information on the classes of shares currently being offered.
2. Significant Accounting Policies
The following is a summary of the Funds’ significant accounting policies:
Security valuation and fair value measurements — All investments in securities are recorded at their estimated fair value. The Funds define the term “market value”, as used throughout this report, as the estimated fair value. The Funds use various methods to measure fair value of their portfolio securities on a recurring basis. Generally accepted accounting principles in the United States (“U.S. GAAP”) establish a hierarchy that prioritizes inputs to valuation methods. These inputs are summarized in the three broad levels listed below:
| • | Level 1 | – | quoted prices in active markets for identical securities |
| | | | |
| • | Level 2 | – | other significant observable inputs (including quoted prices for similar securities, interest rates, repayment speeds, credit risk, etc.) |
| | | | |
| • | Level 3 | – | significant unobservable inputs (including a Fund’s own assumptions in determining the fair value of investments) |
The inputs or methodology used for valuing securities are not necessarily an indication of the risk associated with investing in those securities. For example, money market instruments are valued using amortized cost, in accordance with rules under the 1940 Act. Generally, amortized cost approximates the current fair value of a security, but since the value is not obtained from a quoted price in an active market, such securities are reflected as Level 2.
The aggregate value by input level, as of June 30, 2014, for each Fund’s investments, as well as a reconciliation of assets for which significant unobservable inputs (Level 3) were used in determining value, if applicable, is included in each Fund’s Portfolio of Investments, which also includes a breakdown of the Fund’s investments by geographic or sector allocation. The Funds did not hold any Level 3 categorized securities during the year ended June 30, 2014.
All transfers in and out of the levels are recognized at the value at the end of the period. During the year ended June 30, 2014, there were no transfers between Levels 1, 2 and 3 for all Funds.
Notes to Financial Statements (Continued)
The Funds’ portfolio securities are valued as of the close of the regular session of trading on the New York Stock Exchange (“NYSE”) (currently 4:00 p.m., Eastern time). Portfolio securities traded on stock exchanges are valued at the last bid price, and to the extent these securities are actively traded, they are categorized in Level 1 of the fair value hierarchy. Portfolio securities quoted by NASDAQ are valued at the NASDAQ Official Closing Price (“NOCP”). Securities not traded on a particular day, or for which the last bid price is not readily available, are valued at their last broker-quoted bid prices as obtained from one or more of the major market makers for such securities by an independent pricing service and are categorized in Level 2. Money market instruments and other debt securities with a remaining maturity of less than 60 days are valued at amortized cost, which approximates market value and are categorized in Level 2. While this method provides consistency in valuation (and may only be used if it approximates market value), it may result in periods during which value, as determined by amortized cost, is higher or lower than the price that would be received if the Fund sold the investment. Securities for which market quotations or the NOCP are not readily available are fair valued as determined by or under the direction of the Board of Trustees (the “Board”) and are categorized in Level 3. Shares of open-end mutual funds in which the Funds invest are valued at their respective net asset values (“NAV”) as reported by the underlying funds and are categorized in Level 1. The prices for foreign securities are reported in local currency and translated into U.S. dollars using currency exchange rates.
Level 2 Valuation— Securities mainly traded on a non-U.S. exchange are generally valued according to the preceding closing values on that exchange. However, if an event that may change the value of a security occurs after the time that the closing value on the non-U.S. exchange was determined, but before the close of regular trading on the NYSE, the security may be priced based on fair value. This may cause the value of the security, if held on the books of a Fund, to be different from the closing value on the non-U.S. exchange and may affect the calculation of that Fund’s NAV.
Level 3 Valuation— Securities held by the Funds that do not have readily available market quotations, significant observable inputs or securities for which the available market quotations are not reliable, are priced at their fair value using procedures approved by the Funds’ Board.
The Funds may use fair value pricing under the following circumstances, among others:
| · | If the value of a security has been materially affected by events occurring before the Funds’ pricing time but after the close of the primary markets on which the security is traded. |
| | |
| · | If the exchange on which a portfolio security is principally traded closes early or if trading in a particular portfolio security was halted during the day and did not resume prior to the Funds’ NAV calculation. |
| | |
| · | If a security is so thinly traded that reliable market quotations are unavailable due to infrequent trading. |
| | |
| · | If the validity of market quotations is not reliable. |
Investment companies— Certain Funds may invest in securities of other investment companies, including exchange-traded funds (“ETFs”), open-end funds, and closed-end funds. Open-end funds are investment companies that issue new shares continuously and redeem shares daily. Closed-end funds are investment companies that typically issue a fixed number of shares that trade on a securities exchange or over-the-counter. An ETF is an investment company that typically seeks to track the performance of an index by holding in its portfolio shares of all the companies, or a representative sample of the companies, that are components of a particular index. ETFs are traded on a securities exchange based on their market value. The risks of investment in other investment companies typically reflect the risks of the types of securities in which investment companies invest. Investments in ETFs and closed-end funds are subject to the additional risk that their shares may trade at a premium or discount to their NAV. When a Fund invests in another investment company, shareholders of the Fund indirectly bear their proportionate share of the other investment company’s fees and expenses, including operating, registration, trustee, licensing and marketing, as well as their share of the Fund’s fees and expenses.
Notes to Financial Statements (Continued)
Foreign currency translation — The books and records of the Funds are maintained in U.S. dollars and translated into U.S. dollars on the following basis:
| (1) | market value of investment securities, assets and liabilities at the current rate of exchange on the valuation date; and |
| (2) | purchases and sales of investment securities, income, and expenses at the relevant rates of exchange prevailing on the respective dates of such transactions. |
The Funds do not isolate that portion of gains and losses on investments in equity securities that is due to changes in the foreign exchange rates from that which is due to changes in market prices of equity securities.
Portfolio securities loaned — Each Fund may lend its portfolio securities. Lending portfolio securities exposes a Fund to the risk that the borrower may fail to return the loaned securities or may not be able to provide additional collateral or that the Funds may experience delays in recovery of the loaned securities or loss of rights in the collateral if the borrower fails financially. To minimize these risks, the borrower must agree to maintain cash collateral with the Funds’ custodian. The loaned securities are secured by collateral valued at least equal, at all times, to the market value of the loaned securities plus accrued interest, if any. When the collateral falls below specified amounts, the lending agent will use its best effort to obtain additional collateral on the next business day to meet required amounts under the security lending agreement. The cash collateral is reinvested by the Funds’ custodian into an approved investment vehicle. The approved investment vehicle is subject to market risk.
As of June 30, 2014, the following Funds loaned securities and received collateral as follows:
| | | Market | | | Market | |
| | | Value of | | | Value of | |
| | | Securities | | | Collateral | |
| Fund | | Loaned | | | Received | |
| Capital Growth Fund | | $ | 3,799,141 | | | $ | 3,911,290 | |
| International Small Cap Fund | | | 6,705,669 | | | | 6,919,666 | |
| Small Cap Value Opportunities Fund | | | 33,870,564 | | | | 34,803,680 | |
| Value Fund | | | 7,193,021 | | | | 7,393,866 | |
All cash collateral is received, held, and administered by the Funds’ custodian for the benefit of the lending Fund in its custody account or other account established for the purpose of holding collateral.
Funds participating in securities lending receive compensation in the form of fees. Security lending income is derived from lending long securities from the Funds to creditworthy approved borrowers at rates that are determined based on trading volumes, float, short-term interest rates and market liquidity. A lending Fund retains the interest or dividends on the investment of any cash received as collateral. The lending Fund also continues to receive interest or dividends on the loaned securities.
Unrealized gain or loss on the market value of the loaned securities that may occur during the term of the loan is recognized by the lending Fund. The lending Fund has the right under the lending agreement to recover the securities from the borrower on demand.
Share valuation — The NAV per share of each class of shares of each Fund is calculated daily by dividing the total value of a Fund’s assets attributable to that class, less liabilities attributable to that class, by the number of outstanding shares of that class.
Notes to Financial Statements (Continued)
The maximum offering price per share of Class A shares of the Funds is equal to the NAV per share plus a sales load equal to 6.10% of the NAV (or 5.75% of the offering price). There is no sales load on purchases of $1 million or more of Class A shares. The maximum offering price per share of Classes C, Y, and Institutional Class shares of the Funds is equal to the NAV per share.
The redemption price per share of each class of shares of the Funds is generally equal to the NAV per share. However, Class A redemptions that were part of a no load $1 million subscription may be subject to a contingent deferred sales charge (“CDSC”) of up to 1% if redeemed within a one-year period from the date of purchase. Additionally, purchases of Class C shares of the Funds are subject to a CDSC of 1.00%. The CDSC will be assessed on an amount equal to the lesser of (1) the NAV at the time of purchase of the shares being redeemed or (2) the NAV of such shares being redeemed if redeemed within a one-year period from the date of purchase.
Investment income — Dividend income from securities is recognized on the ex-dividend date, net of foreign withholding taxes, if any, which are reduced by any amounts reclaimable by the Funds, where applicable. Interest income from securities is recorded on the basis of interest accrued, premium amortized and discount accreted.
Distributions to shareholders — Each Fund intends to distribute to its shareholders substantially all of its income and capital gains. Each Fund, except the Value Fund, declares and distributes net investment income, if any, annually, as a dividend to shareholders. The Value Fund declares and distributes net investment income, if any, semi-annually, as a dividend to shareholders. Each Fund makes distributions of capital gains, if any, at least annually, net of applicable capital loss carryforwards. Income distributions and capital gain distributions are determined in accordance with income tax regulations. Recognition of the Funds’ net investment income that invest in underlying funds is affected by the timing of dividend declarations by underlying funds.
Allocations — Investment income earned, realized capital gains and losses, and unrealized appreciation and depreciation for a Fund are allocated daily to each class of shares based upon its proportionate share of total net assets of the Fund. Class-specific expenses are charged directly to the class incurring the expense. Common expenses, which are not attributable to a specific class, are allocated daily to each class of shares based upon their proportionate share of total net assets of the Fund. Expenses not directly billed to a Fund are allocated proportionally among all Funds in the Trust, and, if applicable, in Touchstone Investment Trust, Touchstone Institutional Funds Trust, Touchstone Variable Series Trust, Touchstone Funds Group Trust, and Touchstone Tax-Free Trust (collectively with the Trust, “Touchstone Fund Complex”), daily in relation to net assets of each Fund or another reasonable measure.
Security transactions — Security transactions are reflected for financial reporting purposes as of the trade date. Realized gains and losses on sales of portfolio securities are calculated using the identified cost basis.
Estimates — The preparation of financial statements in conformity with U.S. GAAP requires management to make estimates and assumptions that affect the reported amounts of assets and liabilities and disclosure of contingent assets and liabilities at the date of the financial statements and the reported amounts of income and expenses during the reporting period. Actual results could differ from those estimates.
Notes to Financial Statements (Continued)
3. Investment Transactions
Investment transactions (excluding short-term investments and U.S. Government securities) were as follows for the year ended June 30, 2014:
| | | | | | | | | Small Cap | | | | |
| | | | | | International | | | Value | | | | |
| | | Capital Growth | | | Small Cap | | | Opportunities | | | Value | |
| | | Fund | | | Fund | | | Fund | | | Fund | |
| Purchases of investment securities | | $ | 57,219,639 | | | $ | 100,358,746 | | | $ | 134,065,193 | | | $ | 115,657,407 | |
| Proceeds from sales and maturities | | $ | 78,558,011 | | | $ | 79,427,328 | | | $ | 98,625,967 | | | $ | 94,100,158 | |
There were no purchases or proceeds from sales and maturities of U.S. government securities by the Funds for the year ended June 30, 2014.
4. Transactions with Affiliates and Other Related Parties
Certain officers of the Trust are also officers of Touchstone Advisors, Inc. (the “Advisor”), Touchstone Securities, Inc. (the “Underwriter”) or BNY Mellon Investment Servicing (U.S.) Inc. (“BNY Mellon”), the Sub-Administrator and Transfer Agent to the Funds. Such officers receive no compensation from the Trust. The Advisor and the Underwriter are each wholly-owned, indirect subsidiaries of Western & Southern Financial Group, Inc.
On behalf of the Funds, the Advisor pays each Independent Trustee a quarterly retainer plus additional retainers to the Lead Independent Trustee and the chairs of each standing committee. Interested Trustees do not receive compensation from the Funds. Each Independent Trustee will also receive compensation for each board meeting and committee meeting attended. Each standing committee chair will receive additional compensation for each committee meeting that he or she oversees. The Advisor is reimbursed by the Funds for the Independent Trustees’ compensation and out-of-pocket expenses relating to their services. The Funds accrued Trustee-related expenses of $51,977 for the year ended June 30, 2014.
Management & Expense Limitation Agreements
The Advisor provides general investment supervisory services for the Funds, under terms of an advisory agreement (the “Advisory Agreement”). Under the Advisory Agreement, each Fund pays the Advisor a fee, which is computed and accrued daily and paid monthly, at an annual rate based on average daily net assets of each Fund as shown in the table below.
| Touchstone Capital Growth Fund | 0.70% on the first $300 million | |
| | 0.685% on the next $200 million | |
| | 0.675% on the next $500 million | |
| | 0.625% on the next $500 million | |
| | 0.575% on the next $500 million | |
| | 0.525% of such assets over $2 billion | |
| Touchstone International Small Cap Fund | 0.95% on the first $300 million | |
| | 0.90% on the next $200 million | |
| | 0.85% on the next $250 million | |
| | 0.80% on the next $250 million | |
| | 0.75% on the next $500 million | |
| | 0.70% on the next $500 million | |
| | 0.65% of such assets over $2 billion | |
| Touchstone Small Cap Value Opportunities Fund | 0.95% on the first $300 million | |
| | 0.90% on the next $200 million | |
| | 0.85% of such assets over $500 million | |
| Touchstone Value Fund* | 0.65% | |
| | | |
Notes to Financial Statements (Continued)
*Prior to August 23, 2013, the Fund paid 0.75% on the first $300 million, 0.73% on the next $200 million, 0.72% on the next $250 million, 0.70% on the next $250 million, 0.68% on the next $500 million, 0.67% on the next $500 million, and 0.66% of such assets over $2 billion.
The Advisor has entered into investment sub-advisory agreements with the following parties (each, a “Sub-Advisor”):
| Ashfield Capital Partners, LLC | Copper Rock Capital Partners LLC |
| Capital Growth Fund | International Small Cap Fund |
| | |
| Barrow, Hanley, Mewhinney & Strauss, LLC | Thompson Siegel & Walmsley LLC |
| Value Fund | Small Cap Value Opportunities Fund |
The Advisor, not the Funds, pays the sub-advisory fees to each Sub-Advisor.
The Advisor entered into an expense limitation agreement (the “Expense Limitation Agreement”) to contractually limit operating expenses of the Funds, excluding: dividend and interest expenses on short sales; interest; taxes; brokerage commissions; other expenditures which are capitalized in accordance with GAAP; the cost of “Acquired Fund Fees and Expenses”, if any; and other extraordinary expenses not incurred in the ordinary course of business. The maximum operating expense limit in any year with respect to the Funds is based on a percentage of the average daily net assets of the Funds. The Advisor has agreed to separately waive class-level expenses, advisory fees and administration fees, and to reimburse expenses in order to maintain the following expense limitations for the Funds:
| | | | | | | | | | | | Institutional | | | Termination |
| | | Class A | | | Class C | | | Class Y | | | Class | | | Date |
| Capital Growth Fund | | | 1.25 | % | | | 2.00 | % | | | 1.00 | % | | | 0.90 | % | | October 30, 2014 |
| International Small Cap Fund* | | | 1.55 | % | | | 2.30 | % | | | 1.30 | % | | | 1.18 | % | | October 30, 2014 |
| Small Cap Value | | | | | | | | | | | | | | | | | | |
| Opportunities Fund | | | 1.50 | % | | | 2.25 | % | | | 1.25 | % | | | 1.10 | % | | October 30, 2014 |
| Value Fund** | | | 1.08 | % | | | 1.83 | % | | | 0.83 | % | | | 0.68 | % | | October 30, 2014 |
* Prior to April 16, 2014, the expense limitations for Classes A, C, Y and Institutional Class shares were 1.55%, 2.30%, 1.30% and 1.05%, respectively.
** Prior to September 10, 2013 the expense limitations for Classes A, C, Y and Institutional Class shares were 1.00%, 1.75%, 0.75% and 0.65%, respectively.
During the year ended June 30, 2014, the Advisor or its affiliates waived investment advisory fees and administration fees or reimbursed expenses, including distribution fees, of the Funds as follows:
| | | | | | | | | Other | | | | |
| | | Investment | | | | | | Operating | | | | |
| | | Advisory | | | Administration | | | Expenses | | | | |
| Fund | | Fees Waived | | | Fees Waived | | | Reimbursed | | | Total | |
| Capital Growth Fund | | $ | — | | | $ | 82,409 | | | $ | 145,131 | | | $ | 227,540 | |
| International Small Cap Fund | | | 28,856 | | | | 219,534 | | | | 40,566 | | | | 288,956 | |
| Small Cap Value Opportunities Fund | | | — | | | | 93,882 | | | | 48,399 | | | | 142,281 | |
| Value Fund | | | 72,807 | | | | 604,161 | | | | 80,018 | | | | 756,986 | |
Under the terms of the Expense Limitation Agreement, the Advisor is entitled to recover, subject to approval by the Funds’ Board, such amounts waived or reimbursed for a period of up to three years from the year in which the Advisor reduced its compensation or assumed expenses for the Funds. No recoupment will occur unless a Fund’s operating expenses are below the expense limitation amount in effect at the time of the waiver or reimbursement.
Notes to Financial Statements (Continued)
As of June 30, 2014, the Advisor may seek recoupment of previously waived fee and reimbursed expenses as follows:
| | | Expiration | | | Expiration | | | Expiration | | | | |
| | | June 30, | | | June 30, | | | June 30, | | | | |
| Funds | | 2015 | | | 2016 | | | 2017 | | | Total | |
| Capital Growth Fund | | $ | 118,022 | | | $ | 283,205 | | | $ | 223,052 | | | $ | 624,279 | |
| International Small Cap Fund | | | 99,781 | | | | 346,008 | | | | 277,489 | | | | 723,278 | |
| Small Cap Value Opportunities Fund | | | 59,559 | | | | 132,190 | | | | 129,267 | | | | 321,016 | |
| Value Fund | | | 81,083 | | | | 897,689 | | | | 712,405 | | | | 1,691,177 | |
The Advisor did not recoup any amounts it previously waived or reimbursed during the year ended June 30, 2014.
ADMINISTRATION AGREEMENT
The Advisor entered into an Administration Agreement with the Trust, whereby the Advisor is responsible for: supplying executive and regulatory compliance services; supervising the preparation of tax returns; coordinating the preparation of reports to shareholders and reports to, and filings with, the Securities and Exchange Commission (the “SEC”) and state securities authorities, as well as materials for meetings of the Board; calculating the daily NAV per share; and maintaining the financial books and records of each Fund. For its services, the Advisor receives an annual fee of 0.20% on the first $6 billion of the aggregate average daily net assets of the Touchstone Fund Complex (excluding Touchstone Institutional Money Market Fund, Touchstone Institutional Funds Trust, and Touchstone Variable Series Trust); 0.16% of the next $4 billion of aggregate average daily net assets; and 0.12% of the aggregate average daily net assets of all such assets in excess of $10 billion. The fee is allocated among the funds of the Touchstone Fund Complex (excluding Touchstone Institutional Money Market Fund, Touchstone Institutional Funds Trust, and Touchstone Variable Series Trust) on the basis of relative daily net assets.
The Advisor has engaged BNY Mellon as the Sub-Administrator to the Trust. BNY Mellon provides administrative and accounting services to the Trust and is compensated directly by the Advisor, not the Trust.
TRANSFER AGENT AGREEMENT
Under the terms of the Transfer Agent Agreement between the Trust and BNY Mellon, BNY Mellon maintains the records of each shareholder’s account, answers shareholders’ inquiries concerning their accounts, processes purchases and redemptions of each Fund’s shares, acts as dividend and distribution disbursing agent and performs other shareholder service functions. For these services, BNY Mellon receives a monthly fee per shareholder account from each Fund. In addition, each Fund pays out-of-pocket expenses incurred by BNY Mellon, including, but not limited to, postage and supplies.
The Funds may reimburse the Advisor for fees paid to intermediaries such as banks, broker-dealers, financial advisors or other financial institutions for sub-transfer agency, sub-administration and other services provided to investors whose shares of record are held in omnibus, other group accounts, retirement plans or accounts traded through registered securities clearing agents. These fees may vary based on, for example, the nature of services provided, but generally range up to 0.15% of the assets of the class serviced or maintained by the intermediary or up to $17 per sub-account maintained by the intermediary. The Funds will only reimburse the Advisor up to $17 per sub-account maintained by the intermediary.
PLANS OF DISTRIBUTION AND SHAREHOLDER SERVICING FEE ARRANGEMENTS
The Trust has adopted distribution plans pursuant to Rule 12b-1 under the 1940 Act for each class of shares it offers that are subject to 12b-1 distribution fees. The plans allow each Fund to pay distribution and other
Notes to Financial Statements (Continued)
fees for the sale and distribution of its shares and for services provided to shareholders. The fees charged to the Funds are limited to the actual expenses incurred. Under the Class A plan, each Fund offering Class A shares pays an annual fee of up to 0.25% of average daily net assets that are attributable to Class A shares. Under the Class C plan, each Fund offering Class C shares pays an annual fee of up to 1.00% of average daily net assets that are attributable to Class C shares (of which up to 0.75% is a distribution fee and up to 0.25% is a shareholder servicing fee).
UNDERWRITING AGREEMENT
The Underwriter is the Funds’ principal underwriter and, as such, acts as exclusive agent for distribution of the Funds’ shares. Under the terms of the Underwriting Agreement between the Trust and the Underwriter, the Underwriter earned the following from underwriting and broker commissions on the sale of Class A shares of the Funds listed below during the year ended June 30, 2014:
| | | Amount | |
| Capital Growth | | $ | 5,882 | |
| International Small Cap Fund | | | 2,989 | |
| Small Cap Value Opportunities Fund | | | 5,590 | |
| Value Fund | | | 7,578 | |
In addition, the Underwriter collected CDSC on the redemption of Class C shares of the Funds listed below during the year ended June 30, 2014:
| | | Amount | |
| International Small Cap Fund | | $ | 10 | |
| Small Cap Value Opportunities Fund | | | 30 | |
| Value Fund | | | 168 | |
AFFILIATED INVESTMENTS
Each Fund may invest in the Touchstone Institutional Money Market Fund, subject to compliance with several conditions set forth in an exemptive order received by the Trust from the SEC. To the extent that the Funds are invested in the Touchstone Institutional Money Market Fund, the Advisor and Administrator will be paid additional fees from the Touchstone Institutional Money Market Fund that will not be waived or reimbursed.
A summary of each Fund’s investment, as applicable, in the Touchstone Institutional Money Market Fund for the year ended June 30, 2014, is as follows:
| | | Share Activity | | | | | | | |
| | | | | | | | | | | | | | | | | | Market | |
| | | Balance | | | | | | | | | Balance | | | | | | Value | |
| | | 06/30/13 | | | Purchases | | | Sales | | | 06/30/14 | | | Dividends | | | 06/30/14 | |
| Capital Growth Fund | | | 1,639,168 | | | | 28,917,091 | | | | (30,556,246 | ) | | | 13 | | | $ | 250 | | | $ | 13 | |
| International Small Cap Fund | | | 699,197 | | | | 55,409,603 | | | | (51,271,644 | ) | | | 4,837,156 | | | | 388 | | | | 4,837,156 | |
| Small Cap Value Opportunities Fund | | | 2,374,756 | | | | 81,310,246 | | | | (80,261,925 | ) | | | 3,423,077 | | | | 479 | | | | 3,423,077 | |
| Value Fund | | | 8,753,580 | | | | 105,667,028 | | | | (104,814,468 | ) | | | 9,606,140 | | | | 977 | | | | 9,606,140 | |
5. Federal Tax Information
Federal income tax — It is each Fund’s policy to continue to comply with the special provisions of the Internal Revenue Code applicable to regulated investment companies. As provided therein, in any fiscal year in which a Fund so qualifies and distributes at least 90% of its investment company taxable income, the Fund (but not the shareholders) will be relieved of federal income tax on the income distributed. It is each Fund’s policy to distribute all of its taxable income and accordingly, no provision for income taxes has been made.
Notes to Financial Statements (Continued)
In order to avoid imposition of the excise tax applicable to regulated investment companies, it is also each Fund’s intention to declare and pay as dividends in each calendar year at least 98% of its investment company taxable income (earned during the calendar year) and 98.2% of its net realized capital gains (earned during the twelve months ending October 31) plus undistributed amounts from prior years.
The tax character of distributions paid are as follows:
| | | Capital Growth Fund | | | International Small Cap Fund | |
| | | Year Ended | | | Year Ended | | | Year Ended | | | Year Ended | |
| | | June 30, | | | June 30, | | | June 30, | | | June 30, | |
| | | 2014 | | | 2013 | | | 2014 | | | 2013 | |
| From ordinary income | | $ | 104,324 | | | $ | 218,632 | | | $ | 1,908,555 | | | $ | 1,525,830 | |
| Total Distributions | | $ | 104,324 | | | $ | 218,632 | | | $ | 1,908,555 | | | $ | 1,525,830 | |
| | | Small Cap Value Opportunities Fund | | | Value Fund | |
| | | Year Ended | | | Year Ended | | | Year Ended | | | Year Ended | |
| | | June 30, | | | June 30, | | | June 30, | | | March 31, | |
| | | 2014 | | | 2013 | | | 2014 | | | 2013 | |
| From ordinary income | | $ | 9,922,007 | | | $ | 1,230,862 | | | $ | 8,779,860 | | | $ | 9,968,846 | |
| From long-term capital gains | | | 10,092,574 | | | | 9,185,252 | | | | — | | | | 5,851,644 | |
| Total Distributions | | $ | 20,014,581 | | | $ | 10,416,114 | | | $ | 8,779,860 | | | $ | 15,820,490 | |
The following information is computed on a tax basis for each item as of June 30, 2014:
| | | | | | | | | Small Cap | | | | |
| | | Capital | | | International | | | Value | | | | |
| | | Growth | | | Small Cap | | | Opportunities | | | Value | |
| | | Fund | | | Fund | | | Fund | | | Fund | |
| Tax cost of portfolio investments | | $ | 121,399,412 | | | $ | 131,593,580 | | | $ | 186,694,234 | | | $ | 328,710,038 | |
| Gross unrealized appreciation | | | 80,826,901 | | | | 38,505,001 | | | | 32,088,518 | | | | 112,268,073 | |
| Gross unrealized depreciation | | | (2,150,914 | ) | | | (3,078,492 | ) | | | (5,010,579 | ) | | | (3,127,600 | ) |
| Net unrealized appreciation on investments | | | 78,675,987 | | | | 35,426,509 | | | | 27,077,939 | | | | 109,140,473 | |
| Net unrealized appreciation on foreign currency transactions | | | — | | | | 8,122 | | | | — | | | | — | |
| Accumulated capital and other losses | | | (6,801,435 | ) | | | (17,937,717 | ) | | | (541,070 | ) | | | (20,824,529 | ) |
| Undistributed ordinary income | | | — | | | | 821,488 | | | | 9,440,865 | | | | 206,189 | |
| Undistributed long-term capital gains | | | 3,965,109 | | | | — | | | | 9,064,252 | | | | 2,409,016 | |
| Accumulated earnings (deficit) | | $ | 75,839,661 | | | $ | 18,318,402 | | | $ | 45,041,986 | | | $ | 90,931,149 | |
The difference between the tax cost of portfolio investments and the financial statement cost is primarily due to wash sale loss deferrals and passive foreign investment company (“PFIC”) adjustments.
Notes to Financial Statements (Continued)
As of June 30, 2014, the Funds had the following capital loss carryforwards for federal income tax purposes:
| | | | | | No | | | No | | | | |
| | | Short Term Expiring On | | | Expiration | | | Expiration | | | | |
| | | 2015 | | | 2016 | | | 2017 | | | 2018 | | | Short Term* | | | Long Term* | | | Total | |
| Capital Growth Fund** | | $ | 2,882,786 | | | $ | 2,882,786 | | | $ | 1,035,863 | | | $ | — | | | $ | — | | | $ | — | | | $ | 6,801,435 | |
| International Small Cap Fund** | | | 8,530,086 | | | | 4,523,327 | | | | 4,884,304 | | | | — | | | | — | | | | — | | | | 17,937,717 | |
| Small Cap Value Opportunities Fund** | | | 541,070 | | | | — | | | | — | | | | — | | | | — | | | | — | | | | 541,070 | |
| Value Fund** | | | — | | | | — | | | | 20,543,868 | | | | 280,661 | | | | — | | | | — | | | | 20,824,529 | |
*The Regulated Investment Company Modernization Act of 2010 (the “Act”) was enacted on December 22, 2010. The Act made changes to several tax rules impacting the Funds. The provisions of the Act are effective for each fiscal year end for the Funds beginning July 1, 2011. Although the Act provides several benefits, including the unlimited carryover of future capital losses, there may be a greater likelihood that all or a portion of each Fund’s pre-enactment capital loss carryovers may expire without being utilized due to the fact that post-enactment capital losses must be utilized before pre-enactment capital loss carryovers may be utilized. Under the Act, new capital losses may now be carried forward indefinitely, and retain the character of the original loss as compared with pre-enactment law, where capital losses could be carried forward for up to eight years, and carried forward as short-term capital losses, irrespective of the character of the original loss.
**Utilization may be limited by current income tax regulations.
The capital loss carryforwards may be utilized in future years to offset net realized capital gains, if any, prior to distributing such gains to shareholders.
During the year ended June 30, 2014, the following Funds utilized capital loss carryforwards:
| Fund | | Amount | |
| Capital Growth Fund | | $ | 17,420,311 | |
| International Small Cap Fund | | | 8,153,054 | |
| Small Cap Value Opportunities Fund | | | 1,287,961 | |
| Value Fund | | | 13,530,355 | |
Under current laws, certain capital losses realized after October 31 and ordinary losses realized after December 31 may be deferred (and certain ordinary losses after October and/or December 31 may be deferred) and treated as occurring on the first day of the following fiscal year. For the year ended June 30, 2014, the Funds did not elect to defer any losses.
The Funds have analyzed their tax positions taken on federal income tax returns for all open tax years (tax years ended March 31, 2011 through June 30, 2014) and have concluded that no provision for income tax is required in their financial statements.
Certain reclassifications, the result of permanent differences between financial statement and income tax reporting requirements, have been made to the components of capital. These reclassifications have no impact on the net assets or NAV per share of the Funds and are designed to present the Funds’ capital accounts on a tax basis. The following reclassifications, which are primarily attributed to the tax treatment of foreign currency gains/losses, investments in PFICs, tax character of distributions paid and distributions paid in excess of earnings have been made to the following Funds for the year ended June 30, 2014:
| | | | | | Accumulated | | | Accumulated | |
| | | Paid-In | | | Net Investment | | | Net Realized | |
| | | Capital | | | Income(Loss) | | | Gains(Losses) | |
| Capital Growth Fund | | $ | — | | | $ | 19,536 | | | $ | (19,536 | ) |
| International Small Cap Fund | | | — | | | | 365,578 | | | | (365,578 | ) |
| Small Cap Value Opportunities Fund | | | — | | | | (827 | ) | | | 827 | |
| Value Fund | | | (975,548 | ) | | | — | | | | 975,548 | |
Notes to Financial Statements (Continued)
6. Commitments and Contingencies
The Funds indemnify the Trust’s officers and Trustees for certain liabilities that might arise from their performance of their duties to the Funds. Additionally, in the normal course of business, the Funds enter into contracts that contain a variety of representations and warranties and which provide general indemnifications. The Funds’ maximum exposure under these arrangements is unknown, as this would involve future claims that may be made against the Funds. However, based on experience, the Funds expect the risk of loss to be remote.
7. Risks Associated with Foreign Investments
Some of the Funds may invest in the securities of foreign issuers. Investing in securities issued by companies whose principal business activities are outside the U.S. may involve significant risks not present in domestic investments. For example, there is generally less publicly available information about foreign companies, particularly those not subject to the disclosure and reporting requirements of the U.S. securities laws. Foreign issuers are generally not bound by uniform accounting, auditing, and financial reporting requirements and standards of practice comparable to those applicable to domestic issuers. Investments in foreign securities also involve the risk of possible adverse changes in investment or exchange control regulations, expropriation or confiscatory taxation, limitations on the removal of funds or other assets of the Fund, political or financial instability or diplomatic and other developments which could affect such investments. Foreign stock markets, while growing in volume and sophistication, are generally not as developed as those in the U.S., and securities of some foreign issuers (particularly those located in developing countries) may be less liquid and more volatile than securities of comparable U.S. companies. In general, there is less overall governmental supervision and regulation of foreign securities markets, broker-dealers, and issuers than in the U.S.
8 Risks Associated with Concentration
Certain Funds may invest a high percentage of their assets in specific sectors of the market in order to achieve a potentially greater investment return. As a result, the Funds may be more susceptible to economic, political, and regulatory developments in a particular sector of the market, positive or negative, and may experience increased volatility on the Funds’ NAV and magnified effect on the total return.
9. Fund Mergers
At a meeting held on March 13, 2012, the Board of Trustees of the Trust approved an Agreement and Plan of Reorganization (the “Plan”) providing for the transfer of all assets and liabilities of the Fifth Third Disciplined Large Cap Value Fund and the Fifth Third All Cap Value Fund (each, an “Acquired Fund”), each a series of the Fifth Third Funds (“Fifth Third”), to the Touchstone Value Fund, (the “Acquiring Fund”). The tax-free mergers took place on September 10, 2012.
Notes to Financial Statements (Continued)
The following is a summary of shares outstanding, net assets, net asset value per share, and unrealized appreciation immediately before and after the reorganization:
| | | | | | | | | | | | After | |
| | | Before Reorganization | | | Reorganization | |
| | | Fifth Third | | | | | | | | | | |
| | | Disciplined | | | Fifth Third | | | Touchstone | | | Touchstone | |
| | | Large Cap | | | All Cap | | | Value | | | Value | |
| | | Value Fund | | | Value Fund | | | Fund | | | Fund | |
| Class A * | | | | | | | | | | | | | | | | |
| Shares | | | 1,419,797 | (A) | | | 3,514,789 | (B) | | | 245,017 | | | | 5,179,603 | |
| Net Assets | | $ | 10,274,502 | | | $ | 25,435,080 | | | $ | 1,773,081 | | | $ | 37,482,663 | |
| Net Asset Value | | $ | 7.24 | (A) | | $ | 7.24 | (B) | | $ | 7.24 | | | $ | 7.24 | |
| Class C | | | | | | | | | | | | | | | | |
| Shares | | | 39,232 | (C) | | | 341,354 | (D) | | | 366 | | | | 380,953 | |
| Net Assets | | $ | 283,871 | | | $ | 2,469,899 | | | $ | 2,651 | | | $ | 2,756,421 | |
| Net Asset Value | | $ | 7.24 | (C) | | $ | 7.24 | (D) | | $ | 7.24 | | | $ | 7.24 | |
| Class Y | | | | | | | | | | | | | | | | |
| Shares | | | 20,691,815 | (E) | | | 5,255,988 | (F) | | | 6,754,404 | | | | 32,702,207 | |
| Net Assets | | $ | 150,150,006 | | | $ | 38,140,140 | | | $ | 49,013,423 | | | $ | 237,303,569 | |
| Net Asset Value | | $ | 7.26 | (E) | | $ | 7.26 | (F) | | $ | 7.26 | | | $ | 7.26 | |
| Institutional Class | | | | | | | | | | | | | | | | |
| Shares | | | — | | | | — | | | | 10,340,227 | | | | 10,340,227 | |
| Net Assets | | $ | — | | | $ | — | | | $ | 74,892,668 | | | $ | 74,892,668 | |
| Net Asset Value | | $ | — | | | $ | — | | | $ | 7.24 | | | $ | 7.24 | |
| Fund Total | | | | | | | | | | | | | | | | |
| Shares Outstanding | | | 13,906,702 | | | | 3,991,534 | | | | 17,340,014 | | | | 48,602,989 | |
| Net Assets | | $ | 160,708,379 | | | $ | 66,045,119 | | | $ | 125,681,823 | | | $ | 352,435,321 | |
| Unrealized Depreciation | | $ | (13,753,975 | ) | | $ | (7,038,724 | ) | | $ | (28,894,804 | ) | | $ | (49,687,503 | ) |
(A)Reflects a 1.5919:1 reverse stock split on Class A Shares and a 1.6123:1 reverse stock split on Class B Shares which occurred on the date of reorganization, September 10, 2012.
(B)Reflects a 2.2762:1 reverse stock split on Class A Shares and a 2.1413:1 reverse stock split on Class B Shares which occurred on the date of reorganization, September 10, 2012.
(C)Reflects a 1.5725:1 reverse stock split which occurred on the date of reorganization, September 10, 2012.
(D)Reflects a 2.1338:1 reverse stock split which occurred on the date of reorganization, September 10, 2012.
(E)Reflects a 1.5929:1 reverse stock split which occurred on the date of reorganization, September 10, 2012.
(F)Reflects a 2.3023:1 reverse stock split which occurred on the date of reorganization, September 10, 2012.
*The Acquired Funds had Class B shares outstanding immediately prior to the reorganization, which were exchanged for Class A shares of the Acquiring Fund.
Notes to Financial Statements (Continued)
Assuming the reorganization had been completed on July 1, 2012, the results of operations for the Value Fund for the year ended June 30, 2013 would have been as follows:
| | | Touchstone | |
| | | Value | |
| | | Fund | |
| Net investment income | | $ | 7,031,003 | |
| Net realized and unrealized gain on investments | | $ | 87,588,530 | |
| Net increase in asset from operations | | $ | 94,619,533 | |
10. Subsequent Events
Subsequent events occurring after the date of this report have been evaluated for potential impact to this report through the date financial statements were issued. There were no subsequent events that necessitated recognition or disclosure in the Funds’ financial statement
Report of Independent Registered Public Accounting Firm
The Board of Trustees and Shareholders of Touchstone Capital Growth Fund, Touchstone International Small Cap Fund, Touchstone Small Cap Value Opportunities Fund, and Touchstone Value Fund
We have audited the accompanying statements of assets and liabilities, including the portfolios of investments, of Touchstone Capital Growth Fund, Touchstone International Small Cap Fund, Touchstone Small Cap Value Opportunities Fund, and Touchstone Value Fund (the “Funds”) (four of the funds constituting the Touchstone Strategic Trust) as of June 30, 2014, and the related statements of operations for the year then ended, and the statements of changes in net assets and the financial highlights for each of the two years in the period then ended. These financial statements and financial highlights are the responsibility of the Funds’ management. Our responsibility is to express an opinion on these financial statements and financial highlights based on our audits. The financial highlights for each of the periods presented through June 30, 2012 were audited by other auditors, whose report dated August 20, 2012, expressed an unqualified opinion on those financial highlights.
We conducted our audits in accordance with the standards of the Public Company Accounting Oversight Board (United States). Those standards require that we plan and perform the audits to obtain reasonable assurance about whether the financial statements are free of material misstatement. We were not engaged to perform an audit of the Funds’ internal control over financial reporting. Our audits included consideration of internal control over financial reporting as a basis for designing audit procedures that are appropriate in the circumstances, but not for the purpose of expressing an opinion on the effectiveness of the Funds’ internal control over financial reporting. Accordingly, we express no such opinion. An audit also includes examining, on a test basis, evidence supporting the amounts and disclosures in the financial statements, assessing the accounting principles used and significant estimates made by management, and evaluating the overall financial statement presentation. Our procedures included confirmation of securities owned as of June 30, 2014, by correspondence with the custodian and transfer agent. We believe that our audits provide a reasonable basis for our opinion.
In our opinion, the financial statements and financial highlights referred to above present fairly, in all material respects, the financial position of Touchstone Capital Growth Fund, Touchstone International Small Cap Fund, Touchstone Small Cap Value Opportunities Fund, and Touchstone Value Fund (four of the funds constituting the Touchstone Strategic Trust) at June 30, 2014, the results of their operations for the year then ended, and the changes in their net assets and the financial highlights for each of the two years in the period then ended, in conformity with U.S. generally accepted accounting principles.

Cincinnati, Ohio
August 22, 2014
Other Items (Unaudited)
Qualified Dividend Income
Under the Jobs and Growth Tax Relief Reconciliation Act of 2003 (the “Act”), the following percentages of ordinary dividends paid during the fiscal year ended June 30, 2014 are designated as “qualified dividend income,” as defined in the Act, and are subject to reduced tax rates in 2011. The Fund intends to pass through the maximum allowable percentage for 1099s.
| Touchstone Capital Growth Fund | | | 100.00 | % |
| Touchstone International Small Cap Fund | | | 100.00 | % |
| Touchstone Small Cap Value Opportunities Fund | | | 11.00 | % |
| Touchstone Value Fund | | | 100.00 | % |
Dividend Received Deduction
For corporate shareholders, the following ordinary distributions paid during the current fiscal year ended June 30, 2014 qualify for the corporate dividends received deduction. The Funds intend to pass through the maximum allowable percentage for 1099s.
| Touchstone Capital Growth Fund | | | 100.00 | % |
| Touchstone International Small Cap Fund | | | 3.61 | % |
| Touchstone Small Cap Value Opportunities Fund | | | 11.68 | % |
| Touchstone Value Fund | | | 92.06 | % |
For the year ended June 30, 2014, the Capital Growth Fund, Small Cap Value Opportunities Fund and Value Fund designate $3,984,645, $11,555,587 and $2,409,016, respectively, as long-term capital gains.
Foreign Tax Income & Foreign Tax Credit
International Small Cap Fund intends to pass through a foreign tax credit to the shareholders. For the fiscal years ended June 30, 2014, the total amounts of foreign source income is $3,075,612 or $0.30 per share. The total amount of foreign taxes to be paid is $160,283 or $0.02 per share. Your allocable share of the foreign tax credit will be reported on Form 1099 Div.
Proxy Voting Guidelines and Proxy Voting Records
The Sub-Advisors are responsible for exercising the voting rights associated with the securities purchased and held by the Funds. A description of the policies and procedures that the Sub-Advisors use in fulfilling this responsibility is available as an appendix to the most recent Statement of Additional Information, which can be obtained without charge by calling toll free 1.800.543.0407 or by visiting the Touchstone website at www.touchstoneinvestments.com or on the Securities and Exchange Commission’s (the “Commission”) website www.sec.gov. Information regarding how those proxies were voted during the most recent twelve-month period ended June 30 is also available without charge by calling toll free 1.800.543.0407 or on the Commission’s website at www.sec.gov.
Quarterly Portfolio Disclosure
The Trust files a complete listing of portfolio holdings for each Fund as of the end of the first and third quarters of each fiscal year on Form N-Q. The complete listing (i) is available on the Commission’s website; (ii) may be reviewed and copied at the Commission’s Public Reference Room in Washington, DC; (iii) will be made available to shareholders upon request by calling 1.800.543.0407; or (iv) can be obtained on the Touchstone website at www.touchstoneinvestments.com. Information on the operation of the Public Reference Room may be obtained by calling 1.800.SEC.0330.
Other Items (Unaudited) (Continued)
Schedule of Shareholder Expenses
As a shareholder of the Funds, you incur two types of costs: (1) transaction costs, including reinvested dividends or other distributions; and (2) ongoing costs, including investment advisory fees; distribution (12b-1) fees; and other Fund expenses. This example is intended to help you understand your ongoing costs (in dollars) of investing in the Funds and to compare these costs with the ongoing costs of investing in other mutual funds. The example is based on an investment of $1,000 invested at the beginning of the period and held for the entire period (January 1, 2014 through June 30, 2014).
Actual Expenses
The first line of the table below for each share class of a Fund provides information about actual account values and actual expenses. You may use the information in this line, together with the amount you invested, to estimate the expenses that you paid over the period. Simply divide your account value by $1,000 (for example, an $8,600 account value divided by $1,000 = 8.6), then multiply the result by the number in the first line under the heading entitled “Expenses Paid During the six months ended June 30, 2014” to estimate the expenses you paid on your account during this period.
Hypothetical Example for Comparison Purposes
The second line of the table below for each share class of a Fund provides information about hypothetical account values and hypothetical expenses based on the Funds’ actual expense ratio and an assumed rate of return of 5% per year before expenses, which is not the Funds’ actual return. The hypothetical account values and expenses may not be used to estimate the actual ending account balance or expenses you paid for the period. You may use this information to compare the ongoing costs of investing in the Funds and other funds. To do so, compare this 5% hypothetical example with the 5% hypothetical examples that appear in the shareholder reports of the other funds.
Please note that the expenses shown in the table are meant to highlight your ongoing costs only and do not reflect any transactional costs, such as sales charges (loads), redemption fees, or exchange fees. Therefore, the second line of the table below is useful in comparing ongoing costs only, and will not help you determine the relative total costs of owning different funds. In addition, if these transactional costs were included, your costs would have been higher.
Schedule of Shareholder Expenses
| | | | | | | | | | | | | | Expenses | |
| | | | | Net Expense | | | Beginning | | | Ending | | | Paid During | |
| | | | | Ratio | | | Account | | | Account | | | the Six Months | |
| | | | | Annualized | | | Value | | | Value | | | Ended | |
| | | | | June 30, | | | January 1, | | | June 30, | | | June 30, | |
| | | | | 2014 | | | 2014 | | | 2014 | | | 2014* | |
| Touchstone Capital Growth Fund | | | | | | | | | | | | | | | | |
| Class A | | Actual | | | 1.25 | % | | $ | 1,000.00 | | | $ | 1,048.90 | | | $ | 6.35 | |
| Class A | | Hypothetical | | | 1.25 | % | | $ | 1,000.00 | | | $ | 1,018.60 | | | $ | 6.26 | |
| | | | | | | | | | | | | | | | | | | |
| Class C | | Actual | | | 2.00 | % | | $ | 1,000.00 | | | $ | 1,044.90 | | | $ | 10.14 | |
| Class C | | Hypothetical | | | 2.00 | % | | $ | 1,000.00 | | | $ | 1,014.88 | | | $ | 9.99 | |
| | | | | | | | | | | | | | | | | | | |
| Class Y | | Actual | | | 1.00 | % | | $ | 1,000.00 | | | $ | 1,050.10 | | | $ | 5.08 | |
| Class Y | | Hypothetical | | | 1.00 | % | | $ | 1,000.00 | | | $ | 1,019.84 | | | $ | 5.01 | |
| | | | | | | | | | | | | | | | | | | |
| Institutional Class | | Actual | | | 0.90 | % | | $ | 1,000.00 | | | $ | 1,050.60 | | | $ | 4.58 | |
| Institutional Class | | Hypothetical | | | 0.90 | % | | $ | 1,000.00 | | | $ | 1,020.33 | | | $ | 4.51 | |
Other Items (Unaudited) (Continued)
Schedule of Shareholder Expenses (Continued)
| | | | | | | | | | | | | | Expenses | |
| | | | | Net Expense | | | Beginning | | | Ending | | | Paid During | |
| | | | | Ratio | | | Account | | | Account | | | the Six Months | |
| | | | | Annualized | | | Value | | | Value | | | Ended | |
| | | | | June 30, | | | January 1, | | | June 30, | | | June 30, | |
| | | | | 2014 | | | 2014 | | | 2014 | | | 2014* | |
| Touchstone International Small Cap Fund | | | | | | | | | | | | | | | | |
| Class A | | Actual | | | 1.55 | % | | $ | 1,000.00 | | | $ | 1,051.70 | | | $ | 7.88 | |
| Class A | | Hypothetical | | | 1.55 | % | | $ | 1,000.00 | | | $ | 1,017.11 | | | $ | 7.75 | |
| | | | | | | | | | | | | | | | | | | |
| Class C | | Actual | | | 2.30 | % | | $ | 1,000.00 | | | $ | 1,048.60 | | | $ | 11.68 | |
| Class C | | Hypothetical | | | 2.30 | % | | $ | 1,000.00 | | | $ | 1,013.39 | | | $ | 11.48 | |
| | | | | | | | | | | | | | | | | | | |
| Class Y | | Actual | | | 1.27 | % | | $ | 1,000.00 | | | $ | 1,053.80 | | | $ | 6.47 | |
| Class Y | | Hypothetical | | | 1.27 | % | | $ | 1,000.00 | | | $ | 1,018.50 | | | $ | 6.36 | |
| | | | | | | | | | | | | | | | | | | |
| Institutional Class | | Actual | | | 1.11 | % | | $ | 1,000.00 | | | $ | 1,054.20 | | | $ | 5.65 | |
| Institutional Class | | Hypothetical | | | 1.11 | % | | $ | 1,000.00 | | | $ | 1,019.29 | | | $ | 5.56 | |
| | | | | | | | | | | | | | | | | | | |
| Touchstone Small Cap Value Opportunities Fund | | | | | | | | | | | | | | | | |
| Class A | | Actual | | | 1.50 | % | | $ | 1,000.00 | | | $ | 1,063.00 | | | $ | 7.67 | |
| Class A | | Hypothetical | | | 1.50 | % | | $ | 1,000.00 | | | $ | 1,017.36 | | | $ | 7.50 | |
| | | | | | | | | | | | | | | | | | | |
| Class C | | Actual | | | 2.25 | % | | $ | 1,000.00 | | | $ | 1,058.80 | | | $ | 11.49 | |
| Class C | | Hypothetical | | | 2.25 | % | | $ | 1,000.00 | | | $ | 1,013.64 | | | $ | 11.23 | |
| | | | | | | | | | | | | | | | | | | |
| Class Y | | Actual | | | 1.17 | % | | $ | 1,000.00 | | | $ | 1,064.70 | | | $ | 5.99 | |
| Class Y | | Hypothetical | | | 1.17 | % | | $ | 1,000.00 | | | $ | 1,018.99 | | | $ | 5.86 | |
| | | | | | | | | | | | | | | | | | | |
| Institutional Class | | Actual | | | 1.10 | % | | $ | 1,000.00 | | | $ | 1,065.00 | | | $ | 5.63 | |
| Institutional Class | | Hypothetical | | | 1.10 | % | | $ | 1,000.00 | | | $ | 1,019.34 | | | $ | 5.51 | |
| | | | | | | | | | | | | | | | | | | |
| Touchstone Value Fund | | | | | | | | | | | | | | | | | | |
| Class A | | Actual | | | 1.08 | % | | $ | 1,000.00 | | | $ | 1,069.50 | | | $ | 5.54 | |
| Class A | | Hypothetical | | | 1.08 | % | | $ | 1,000.00 | | | $ | 1,019.44 | | | $ | 5.41 | |
| | | | | | | | | | | | | | | | | | | |
| Class C | | Actual | | | 1.83 | % | | $ | 1,000.00 | | | $ | 1,066.60 | | | $ | 9.38 | |
| Class C | | Hypothetical | | | 1.83 | % | | $ | 1,000.00 | | | $ | 1,015.72 | | | $ | 9.15 | |
| | | | | | | | | | | | | | | | | | | |
| Class Y | | Actual | | | 0.81 | % | | $ | 1,000.00 | | | $ | 1,070.60 | | | $ | 4.16 | |
| Class Y | | Hypothetical | | | 0.81 | % | | $ | 1,000.00 | | | $ | 1,020.78 | | | $ | 4.06 | |
| | | | | | | | | | | | | | | | | | | |
| Institutional Class | | Actual | | | 0.68 | % | | $ | 1,000.00 | | | $ | 1,071.40 | | | $ | 3.49 | |
| Institutional Class | | Hypothetical | | | 0.68 | % | | $ | 1,000.00 | | | $ | 1,021.42 | | | $ | 3.41 | |
| * | Expenses are equal to the Fund's annualized expense ratio, multiplied by the average account value over the period, multiplied by 181/365 (to reflect the one-half year period). |
Management of the Trust (Unaudited)
Listed below is required information regarding the Trustees and principal officers of the Trust. The Trust’s Statement of Additional Information includes additional information about theTrustees and is available, without charge, upon request by calling 1.800.543.0407 or by visiting the Touchstone website at www.touchstoneinvestments.com.
Interested Trustees1:
| | | | | | | | | Number | | |
| | | | | | | | | of Funds | | |
| | | | | | | | | Overseen | | |
| | | | | Term of | | | | in the | | |
| Name | | Position(s) | | Office2 And | | | | Touchstone | | Other |
| Address | | Held with | | Length of | | Principal Occupation(s) | | Fund | | Directorships |
| Age | | Trust | | Time Served | | During Past 5 Years | | Complex3 | | Held During the Past 5 Years4 |
Jill T. McGruder
Touchstone Advisors, Inc.
303 Broadway
Suite 1100
Cincinnati, OH 45202
Year of Birth: 1955 | | Trustee and President | | Until retirement at age 75 or until she resigns or is removed Trustee since 1999 | | President and CEO of IFS Financial Services, Inc. (a holding company) from 1999 to the present. | | 48 | | Director of LaRosa’s, Inc. (a restaurant chain) from 1999 to the present, IFS Financial Services, Inc. (a holding company) from 1999 to the present, Integrity and National Integrity Life Insurance Co. from 2005 to the present, Touchstone Securities (the Trust’s distributor) from 1999 to the present, Touchstone Advisors (the Trust’s investment advisor and administrator) from 1999 to the present, W&S Brokerage Services ( a brokerage company) from 1999 to the present and W&S Financial Group Distributors (a distribution company) from 1999 to the present. |
| Independent Trustees: | | | | | | | | |
Phillip R. Cox
c/o Touchstone Advisors, Inc.
303 Broadway
Suite 1100
Cincinnati, OH 45202
Year of Birth: 1947 | | Trustee | | Until retirement at age 75 or until he resigns or is removed Trustee since 1999 | | President and Chief Executive Officer of Cox Financial Corp. (a financial services company) from 1971 to the present. | | 48 | | Director of Cincinnati Bell (a communications company) from 1994 to the present, Bethesda Inc. (a hospital) from 2005 to the present, Timken Co. (a manufacturing company) from 2004 to the present, Diebold, Inc. (a technology solutions company) from 2004 to the present. |
William C. Gale
c/o Touchstone Advisors, Inc.
303 Broadway
Suite 1100
Cincinnati, OH 45202
Year of Birth: 1952 | | Trustee | | Until retirement at age 75 or until he resigns or is removed Trustee since 2013 | | Senior Vice President and Chief Financial Officer of Cintas Corporation (a business services company) from 1995 to present. | | 48 | | None. |
Susan J. Hickenlooper, CFA
c/o Touchstone Advisors, Inc.
303 Broadway
Suite 1100
Cincinnati, OH 45202
Year of Birth: 1946 | | Trustee | | Until retirement at age 75 or until she resigns or is removed Trustee since 2009 | | Financial Analyst for Impact 100 (Charitable Organization) from 2012 to present. | | 48 | | Trustee of Cincinnati Parks Foundation (a charitable organization) from 2000 to present and Trustee of Episcopal Retirement Homes Foundation from 1998-2011. |
| | | | | | | | | | | |
Management of the Trust (Unaudited) (Continued)
Independent Trustees (Continued):
| | | | | | | | | Number | | |
| | | | | | | | | of Funds | | |
| | | | | | | | | Overseen | | |
| | | | | Term of | | | | in the | | |
| Name | | Position(s) | | Office2 And | | | | Touchstone | | Other |
| Address | | Held with | | Length of | | Principal Occupation(s) | | Fund | | Directorships |
| Age | | Trust | | Time Served | | During Past 5 Years | | Complex3 | | Held During the Past 5 Years4 |
Kevin A. Robie
c/o Touchstone Advisors, Inc.
303 Broadway
Suite 1100
Cincinnati, OH 45202
Year of Birth: 1956 | | Trustee | | Until retirement at age 75 or until he resigns or is removed Trustee since 2013 | | Vice President of Portfolio Management at Soin International LLC (a multinational holding company) from 2004 to the present. | | 48 | | Director of Buckeye EcoCare, Inc. (a lawn care company) from 2013 to the present, Trustee of Dayton Region New Market Fund, LLC (a private fund) from 2010 to present, Trustee of the Entrepreneurs Center, Inc. (a small business incubator) from 2006 to the present and Director of Interventional Imaging, Inc. (a medical device company) from 2004 to 2011. |
Edward J. VonderBrink
c/o Touchstone Advisors, Inc.
303 Broadway
Suite 1100
Cincinnati, OH 45202
Year of Birth: 1944 | | Trustee | | Until retirement at age 75 or until he resigns or is removed Trustee since 2013 | | Consultant, VonderBrink Consulting LLC from 2000 to the present. | | 48 | | Director of Streamline Health Solutions, Inc. (healthcare IT) from 2006 to the present, Mercy Health Foundation from 2007 to the present. |
| | | | | | | | | | | |
| 1 | Ms. McGruder, as a director of the Advisor and the Trust's Distributor, and an officer of affiliates of the Advisor and the Trust's Distributor, is an “interested person” of the Trust within the meaning of Section 2(a)(19) of the 1940 Act. |
| | | |
| 2 | Each Trustee is elected to serve until the age of 75 or until he or she sooner resigns or is removed. |
| | | |
| 3 | As of June 30, 2014, The Touchstone Fund Complex consisted of 13 series of Touchstone Funds Group Trust, 4 series of Touchstone Investment Trust, 1 series of Touchstone Institutional Funds Trust, 17 series of the Touchstone Strategic Trust, 3 series of Touchstone Tax-Free Trust, and 10 variable annuity series of Touchstone Variable Series Trust. |
| | | |
| 4 | Each Trustee is also a Trustee of Touchstone Funds Group Trust, Touchstone Tax-Free Trust, Touchstone Investment Trust, Touchstone Institutional Funds Trust, and Touchstone Variable Series Trust. |
Management of the Trust (Unaudited) (Continued)
The following is a list of the Officers of the Trusts, the length of time served, and principal occupations for the past five years.
Principal Officers:
| | | | | Term of | | |
| Name | | Position(s) | | Office And | | |
| Address | | Held with | | Length of | | Principal Occupation(s) |
| Age | | Trust3 | | Time Served | | During the Past 5 Years |
| | | | | | | |
Jill T. McGruder1 Year of Birth: 1955 | | President and Trustee | | Until resignation, removal or disqualification President since 2006 | | See biography above. |
| | | | | | | |
Steven M. Graziano1 Year of Birth: 1954 | | Vice President | | Until resignation, removal or disqualification Vice President since 2009 | | President of Touchstone Advisors, Inc. |
| | | | | | | |
Timothy D. Paulin1 Year of Birth: 1963 | | Vice President | | Until resignation, removal or disqualification Vice President since 2010 | | Senior Vice President of Investment Research and Product Management of Touchstone Advisors, Inc.; Director of Product Design of Klein Decisions, Inc. 2003-2010. |
| | | | | | | |
Timothy S. Stearns1 Year of Birth: 1963 | | Chief Compliance Officer | | Until resignation, removal or disqualification Chief Compliance Officer since September 2013 | | Chief Compliance Officer of Touchstone Advisors, Inc., Senior Vice President and Chief Compliance and Ethics Officer of Envestnet Asset Management, Inc. (2009 to 2013) and Chief Compliance Officer, Americas and Compliance Director, Asia of Franklin Templeton Investments (1997 to 2009). |
| | | | | | | |
Terrie A. Wiedenheft1 Year of Birth: 1962 | | Controller and Treasurer | | Until resignation, removal or disqualification Controller and Treasurer since 2006 | | Senior Vice President, Chief Financial Officer and Chief Operations Officer of IFS Financial Services, Inc. (a holding company). |
| | | | | | | |
Elizabeth R. Freeman2 Year of Birth: 1962 | | Secretary | | Until resignation, removal or disqualification Secretary since 2011 | | Managing Director and Senior Counsel at BNY Mellon Investment Servicing (US) Inc. |
| | | | | | | |
| 1 | The address of Touchstone Advisors, Inc. is 303 Broadway, Suite 1100, Cincinnati, OH 45202. |
| | | |
| 2 | Timothy S. Stearns replaced Mr. Moser as the Chief Compliance Officer of the Trust on August 22, 2013. |
| | | |
| 3 | The address of BNY Mellon Investment Servicing (US) Inc. is 201 Washington Street, Boston, MA 02108. |
| | | |
| 4 | Each officer also holds the same office with Touchstone Funds Group Trust, Touchstone Institutional Funds Trust, Touchstone Investment Trust, Touchstone Tax-Free Trust, and Touchstone Variable Series Trust. |
This page intentionally left blank.
This page intentionally left blank.
This page intentionally left blank.
PRIVACY PROTECTION POLICY
We Respect Your Privacy
Thank you for your decision to invest with us. Touchstone and its affiliates have always placed a high value on the trust and confidence our clients place in us. We believe that confidence must be earned and validated through time. In today’s world, when technology allows the sharing of information at light speeds, trust must be reinforced by our sincere pledge to take the steps necessary to ensure that the information you share with us is treated with respect and confidentiality.
Our Pledge to Our Clients
| • | We collect only the information we need to service your account and administer our business. |
| • | We are committed to keeping your information confidential and we place strict limits and controls on the use and sharing of your information. |
| • | We make every effort to ensure the accuracy of your information. |
We Collect the Following Nonpublic Personal Information About You:
| • | Information we receive from you on or in applications or other forms, correspondence, or conversations, including, but not limited to, your name, address, phone number, social security number, assets, income and date of birth; and |
| • | Information about your transactions with us, our affiliates, or others, including, but not limited to, your account number and balance, payment history, parties to transactions, cost basis information, and other financial information. |
Categories of Information We Disclose and Parties to Whom We Disclose
We do not disclose any nonpublic personal information about our current or former clients to nonaffiliated third parties, except as required or permitted by law.
We Place Strict Limits and Controls on the Use and Sharing of Your Information
| • | We restrict access to nonpublic personal information about you to authorized employees who need the information to administer your business. |
| • | We maintain physical, electronic and procedural safeguards that comply with federal standards to protect this information. |
| • | We do not disclose any nonpublic personal information about our current or former clients to anyone, except as required or permitted by law or as described in this document. |
| • | We will not sell your personal information to anyone. |
We May Provide Information to Service Your Account
Sometimes it is necessary to provide information about you to various companies such as transfer agents, custodians, broker-dealers and marketing service firms to facilitate the servicing of your account. These organizations have a legitimate business need to see some of your personal information in order for us to provide service to you. We may disclose to these various companies the information that we collect as described above. We require that these companies, including our own subsidiaries and affiliates, strictly maintain the confidentiality of this information and abide by all applicable laws. Companies within our corporate family that may receive this information are financial service providers and insurance companies. We do not permit these associated companies to sell the information for their own purposes, and we never sell our customer information.
This policy is applicable to the following affiliated companies: Touchstone Funds Group Trust, Touchstone Investment Trust, Touchstone Strategic Trust, Touchstone Tax-Free Trust, Touchstone Variable Series Trust, Touchstone Institutional Funds Trust, Touchstone Securities, Inc.,* and W&S Brokerage Services, Inc.
* Touchstone Securities, Inc. serves as the underwriter to the Touchstone Funds.
A Member of Western & Southern Financial Group®
The Privacy Protection Policy is not part of the Annual Report.


Distributor
Touchstone Securities, Inc.*
303 Broadway
Cincinnati, Ohio 45202-4203 800.638.8194
www.touchstoneinvestments.com
Investment Advisor
Touchstone Advisors, Inc.*
303 Broadway
Cincinnati, Ohio 45202-4203
Transfer Agent
BNY Mellon Investment Servicing (US) Inc.
4400 Computer Drive
Westborough, MA 01581
Shareholder Service
800.543.0407
* A Member of Western & Southern Financial Group
TSF-54BB-TST-AR-1406
Item 2. Code of Ethics.
| (a) | The registrant, as of the end of the period covered by this report, has adopted a code of ethics that applies to the registrant’s principal executive officer, principal financial officer, principal accounting officer or controller, or persons performing similar functions, regardless of whether these individuals are employed by the registrant or a third party. |
| (c) | There have been no amendments, during the period covered by this report, to a provision of the code of ethics that applies to the registrant’s principal executive officer, principal financial officer, principal accounting officer or controller, or persons performing similar functions, regardless of whether these individuals are employed by the registrant or a third party, and that relates to any element of the code of ethics description. |
| (d) | The registrant has not granted any waivers, including an implicit waiver, from a provision of the code of ethics that applies to the registrant’s principal executive officer, principal financial officer, principal accounting officer or controller, or persons performing similar functions, regardless of whether these individuals are employed by the registrant or a third party, that relates to one or more of the items set forth in paragraph (b) of this item’s instructions. |
Item 3. Audit Committee Financial Expert.
The registrant’s Board of Trustees has determined that the registrant has at least one audit committee financial expert serving on its audit committee. Mr. William Gale is the registrant’s audit committee financial expert and is an independent trustee within the meaning of the Investment Company Act of 1940, as amended (the “1940 Act”).
Item 4. Principal Accountant Fees and Services.
Audit Fees
| (a) | The Audit fees totaled $56,200 and $69,200 in fiscal 2014 and 2013, respectively, including fees associated with the annual audits and filings of Form N-1A and Form N-SAR. |
Audit-Related Fees
| (b) | There were no audit related fees for the fiscal years ended June 30, 2014 and June 30, 2013. |
Tax Fees
| (c) | The aggregate fees billed in each of the last two fiscal years for professional services rendered by the principal accountant for tax compliance, tax advice, and tax planning were $20,800 for 2014 and $24,200 for 2013. |
Fees for fiscal years ended June 30, 2014 and June 30, 2013 relate to the preparation of federal income and excise tax returns and review of capital gains distribution calculations.
All Other Fees
| (d) | The aggregate fees billed in each of the last two fiscal years for products and services provided by the principal accountant, other than the services reported in paragraphs (a) through (c) of this Item are $15,794 for 2014 and $0 for 2013. The fees relate to the PFIC Analyzer and Global Withholding Tax Reporter subscriptions. |
| (e)(1) | Disclose the audit committee's pre-approval policies and procedures described in paragraph (c)(7) of Rule 2-01 of Regulation S-X. |
The Audit Committee’s pre-approval policies describe the types of audit, audit-related, tax and other services that have the general pre-approval of the Audit Committee. The pre-approval policies provide that annual audit service fees, tax services not specifically granted pre-approval, services exceeding pre-approved cost levels and other services that have not received general pre-approval will be subject to specific pre-approval by the Audit Committee. The pre-approval policies further provide that the Committee may grant general pre-approval to other audit services (statutory audits and services associated with SEC registration statements, periodic reports and other documents filed with the SEC or other documents issued in connection with securities offerings), audit-related services (accounting consultations related to accounting, financial reporting or disclosure matters not classified as “audit services,” assistance with understanding and implementing new accounting and financial reporting guidance from rulemaking authorities, agreed-upon or expanded audit procedures related to accounting and/or billing records required to respond to or comply with financial, accounting or regulatory reporting matters and assistance with internal control reporting requirements under Form N-SAR and Form N-CSR), tax services that have historically been provided by the auditor that the Committee believes would not impair the independence of the auditor and are consistent with the SEC’s rules on auditor independence and permissible non-audit services classified as “all other services” that are routine and recurring services.
| (e)(2) | All of the services described in paragraphs (b) through (d) of Item 4 were approved by the Audit Committee. |
| (f) | The percentage of hours expended on the principal accountant's engagement to audit the registrant's financial statements for the most recent fiscal year that were attributed to work performed by persons other than the principal accountant's full-time, permanent employees was less than fifty percent. |
| (g) | The aggregate non-audit fees billed by the registrant's accountant for services rendered to the registrant, and rendered to the registrant's investment adviser (not including any sub-adviser whose role is primarily portfolio management and is subcontracted with or overseen by another investment adviser), and any entity controlling, controlled by, or under common control with the adviser that provides ongoing services to the registrant were $36,794 for 2014 and $24,200 for 2013. |
| (h) | The registrant's audit committee of the board of trustees has considered whether the provision of non-audit services that were rendered to the registrant's investment adviser (not including any sub-adviser whose role is primarily portfolio management and is subcontracted with or overseen by another investment adviser), and any entity controlling, controlled by, or under common control with the investment adviser that provides ongoing services to the registrant that were not pre-approved pursuant to paragraph (c)(7)(ii) of Rule 2-01 of Regulation S-X is compatible with maintaining the principal accountant's independence. |
Item 5. Audit Committee of Listed Registrants.
Not applicable.
Item 6. Investments.
| (a) | Schedule of Investments in securities of unaffiliated issuers as of the close of the reporting period is included as part of the report to shareholders filed under Item 1 of this form. |
Item 7. Disclosure of Proxy Voting Policies and Procedures for Closed-End Management Investment Companies.
Not applicable.
Item 8. Portfolio Managers of Closed-End Management Investment Companies.
Not applicable.
Item 9. Purchases of Equity Securities by Closed-End Management Investment Company and Affiliated Purchasers.
Not applicable.
Item 10. Submission of Matters to a Vote of Security Holders.
There have been no material changes to the procedures by which the shareholders may recommend nominees to the registrant’s board of trustees, where those changes were implemented after the registrant last provided disclosure in response to the requirements of Item 407(c)(2)(iv) of Regulation S-K (17 CFR 229.407) (as required by Item 22(b)(15) of Schedule 14A (17 CFR 240.14a-101)), or this Item.
Item 11. Controls and Procedures.
| (a) | The registrant’s principal executive and principal financial officers, or persons performing similar functions, have concluded that the registrant’s disclosure controls and procedures (as defined in Rule 30a-3(c) under the Investment Company Act of 1940, as amended (the “1940 Act”) (17 CFR 270.30a-3(c))) are effective, as of a date within 90 days of the filing date of the report that includes the disclosure required by this paragraph, based on their evaluation of these controls and procedures required by Rule 30a-3(b) under the 1940 Act (17 CFR 270.30a-3(b)) and Rules 13a-15(b) or 15d-15(b) under the Securities Exchange Act of 1934, as amended (17 CFR 240.13a-15(b) or 240.15d-15(b)). |
| (b) | There were no changes in the registrant’s internal control over financial reporting (as defined in Rule 30a-3(d) under the 1940 Act (17 CFR 270.30a-3(d)) that occurred during the registrant’s second fiscal quarter of the period covered by this report that has materially affected, or is reasonably likely to materially affect, the registrant’s internal control over financial reporting. |
Item 12. Exhibits.
| (a)(1) | Code of ethics, or any amendment thereto, that is the subject of disclosure required by Item 2 is attached hereto. |
| | |
| (a)(2) | Certifications pursuant to Rule 30a-2(a) under the 1940 Act and Section 302 of the Sarbanes-Oxley Act of 2002 are attached hereto. |
| | |
| (a)(3) | Not applicable. |
| | |
| (b) | Certifications pursuant to Rule 30a-2(b) under the 1940 Act and Section 906 of the Sarbanes-Oxley Act of 2002 are attached hereto. |
| (12.other) | Not applicable. |
SIGNATURES
Pursuant to the requirements of the Securities Exchange Act of 1934 and the Investment Company Act of 1940, the registrant has duly caused this report to be signed on its behalf by the undersigned, thereunto duly authorized.
(Registrant) Touchstone Strategic Trust
By (Signature and Title)* /s/ Jill T. McGruder
Jill T. McGruder, President
(principal executive officer)
Date 08/22/14
Pursuant to the requirements of the Securities Exchange Act of 1934 and the Investment Company Act of 1940, this report has been signed below by the following persons on behalf of the registrant and in the capacities and on the dates indicated.
By (Signature and Title)* /s/ Jill T. McGruder
Jill T. McGruder, President
(principal executive officer)
Date 08/22/14
By (Signature and Title)* /s/ Terrie A. Wiedenheft
Terrie A. Wiedenheft, Controller and Treasurer
(principal financial officer)
Date 08/22/14
* Print the name and title of each signing officer under his or her signature.