UNITED STATES
SECURITIES AND EXCHANGE COMMISSION
Washington, D.C. 20549
FORM N-CSR
CERTIFIED SHAREHOLDER REPORT OF REGISTERED MANAGEMENT
INVESTMENT COMPANIES
Investment Company Act file number 811-03651
Touchstone Strategic Trust
(Exact name of registrant as specified in charter)
303 Broadway, Suite 1100
Cincinnati, Ohio 45202-4203
(Address of principal executive offices) (Zip code)
Jill T. McGruder
303 Broadway, Suite 1100
Cincinnati, Ohio 45202-4203
(Name and address of agent for service)
Registrant's telephone number, including area code: 800-638-8194
Date of fiscal year end: March 31
Date of reporting period: March 31, 2014
Form N-CSR is to be used by management investment companies to file reports with the Commission not later than 10 days after the transmission to stockholders of any report that is required to be transmitted to stockholders under Rule 30e-1 under the Investment Company Act of 1940 (17 CFR 270.30e-1). The Commission may use the information provided on Form N-CSR in its regulatory, disclosure review, inspection, and policymaking roles.
A registrant is required to disclose the information specified by Form N-CSR, and the Commission will make this information public. A registrant is not required to respond to the collection of information contained in Form N-CSR unless the Form displays a currently valid Office of Management and Budget ("OMB") control number. Please direct comments concerning the accuracy of the information collection burden estimate and any suggestions for reducing the burden to Secretary, Securities and Exchange Commission, 100 F Street, NE, Washington, DC 20549. The OMB has reviewed this collection of information under the clearance requirements of 44 U.S.C. § 3507.
Item 1. Reports to Stockholders.
The Report to Shareholders is attached herewith.
March 31, 2014
Annual Report
Touchstone Strategic Trust
Touchstone Flexible Income Fund
Touchstone Focused Fund
Touchstone Growth Opportunities Fund
Touchstone International Value Fund
Touchstone Large Cap Growth Fund
Touchstone Mid Cap Growth Fund
Touchstone Small Cap Growth Fund

Table of Contents
This report identifies the Funds' investments on March 31, 2014. These holdings are subject to change. Not all investments in each Fund performed the same, nor is there any guarantee that these investments will perform as well in the future. Market forecasts provided in this report may not occur.
Letter from the President
Dear Shareholder:
We are pleased to provide you with the Touchstone Strategic Trust Annual Report. Inside you will find key financial information, as well as manager commentaries for the Funds, for the 12 months ended March 31, 2014.
During the period, the U.S. economy grew at a moderate pace despite challenges that included uncertainty over federal government budget policies, announcement of tapering of the U.S. Federal Reserve Board’s (Fed) quantitative easing (QE) policy and volatile international events. Job creation accelerated while the unemployment rate continued to decline, with areas having the highest unemployment during the recession declining the most. Home prices continued to move upward throughout the period and home construction increased.
Equity markets moved past any negative headlines during the 12-month period and continued their upward trajectory, outperforming bonds significantly. U.S. growth stocks outpaced value stocks for the period while small capitalization stocks outperformed mid- and large-capitalization stocks. Developed markets outperformed emerging markets by a wide margin, but underperformed U.S. equity markets.
The 10-year Treasury note and the 30-year Treasury bond were both down for the period, while high yield bonds outperformed the rest of the bond market, supported by the moderately expanding economy and default rates that are approaching all-time lows.
Despite the brisk growth in equity markets in recent years, ongoing assessment of your asset allocation strategy, risk tolerance and investment timeframe are critical. We believe that diversification is essential to balancing risk and return. Your financial professional can help you evaluate your diversification strategy to help ensure your financial plan stays on track to meet your long-term goals.
We greatly appreciate your continued support. Thank you for including Touchstone as part of your investment plan.
Sincerely,

Jill T. McGruder
President
Touchstone Strategic Trust
Management’s Discussion of Fund Performance (Unaudited)
Touchstone Flexible Income Fund
Sub-Advised by ClearArc Capital, Inc.
(Formerly known as Fifth Third Asset Management, Inc.)
Investment Philosophy
The Touchstone Flexible Income Fund invests in a variety of income-producing asset classes, including debt securities, common stock and preferred stock. The Fund’s investment approach employs a top-down macro perspective along with a bottom-up security selection analysis emphasizing quality, relative value and high current income consistent with reasonable risk. Correlation analysis, the statistical measure of how two securities move in relation to each other, is conducted between asset classes in an effort to build a portfolio with low correlation to both stocks and bonds. Fundamental research, quantitative modeling and capital structure analysis are used to help maximize risk-adjusted returns.
Fund Performance
Touchstone Flexible Income Fund (Class A Shares) outperformed its benchmark, the Barclays U.S. Aggregate Bond Index, for the 12-month period ended March 31, 2014. The Fund’s total return was 1.45 percent (calculated excluding the maximum sales charge), while the total return of the benchmark was -0.10 percent.
Market Environment
The market showed signs of disinflation around the globe and a dovish stance by the U.S. Federal Reserve Board (Fed) and other major central banks. Interest rates rose the last three quarters of 2013, followed by a slight decline in early 2014.
The two biggest surprises during the period were related. The Fed shocked the markets by broaching the subject of ending quantitative easing (QE) in May 2013, hurting bond investors and causing volatility in the equity markets. The announcement sparked a major sell-off in preferred securities triggered by passively managed Exchange Traded Funds (ETFs) that were forced to meet liquidity demands while adhering to index-driven trades. The second surprise was how easily the equity market shrugged off the potential effects of the taper, as well as political noise throughout the year, and continued to roar ahead.
Portfolio Review
Throughout the 12-month period, the Fund was managed within its investment parameters. It seeks to generate a high level of income as well as excess returns from its strategy’s high-quality diversified mix of global assets. With its global, flexible approach, the Fund implemented timely, tactical changes among a variety of income-producing asset classes. The strategy is designed for navigating through changing, unpredictable environments. By investing in corporate bonds and preferreds, the Fund has the potential for outpacing a portfolio of core bonds over time, while maintaining a relatively low correlation to both fixed income vehicles and equities. Over the long term, the strategy may offer attractive, risk-adjusted returns – an objective the strategy achieved transparently over the last year.
Corporate spreads narrowed throughout the period, helping offset some of the effect of rising rates and benefited Fund performance. High yield securities in particular contributed to the Fund’s outperformance. The corporate sector performed in line with the index, and we continued to sell securities that had reached our target. Areas of value within corporates were limited. More recently, asset-backed securities notably contributed to performance of the bond portion of the Fund. Its mortgage allocation slightly outperformed on the strong return of one of the Fund’s interest only (IO) bonds; convertibles also outperformed.
Management's Discussion of Fund Performance (Unaudited) (Continued)
Volatility was relatively subdued for most of the 12-month period, and our efforts to hedge a sustained spike in this area generally dragged returns, whether it was the equity market or the bond market. However, the Fund’s foreign currency hedges and its outright short on the Japanese yen were additive to returns. The Fund also had a slight gain from a position that took advantage of a steepening in forward short-term interest rates.
Throughout the year, we remained cautious on emerging markets. Generally unimpressed with their fundamentals, we focused on country divergence. While South Africa and Turkey, for example, suffered as a result of declining fundamentals, falling commodity prices and poor political environments, other countries like Mexico, which established positive economic structural reforms, weathered the storm more effectively. Without such reforms, other countries that had once benefited from the commodity boom, positive monetary dynamics and capital inflows found themselves struggling through much of the period.
The dividend equity portion of the Fund proved too cautious and detracted from performance. While the Fund was overweight equities, it was not overweight enough in such a strong year. Despite the major sell-off in preferreds, Fund holdings performed well. We added hybrid preferreds as they carry a lower duration than perpetual fixed rate preferreds. Maintaining a fixed rate for five or 10 years, hybrid preferred rates can then float freely and offered a way to temper interest rate risk. They also provided attractive spreads. Because our focus has been on structures that have less susceptibility to rising rates, we sidestepped the wave of new “fixed-for-life” preferred issues that came into the market. However, at the end of the period, these preferreds bounced back, and the Fund was underweight in this sub-sector. Within preferreds, we believe the recent overweight of the asset class has been the right call, especially relative to corporate debt. However, we continued to have a preference for hybrid securities, where the spreads continued to be wider due to the lower duration characteristics.
While we can allocate up to 10 percent of the Fund’s portfolio in equity Real Estate Investment Trusts (REITs), the Fund remained underweight to this sector throughout the period due to the acute sensitivity of REITs to interest rate changes which detracted from results. In 2013, REITs experienced their worst year since 1998, relative to the stock market. While the Fund held some mortgage REITs, our sentiment changed based on our conviction that upward pressure on rates would negatively impact certain REITs, which was later validated. Overall, we avoided the sector except for a few issuers we knew well. One in particular was a hospitality turnaround story with a solid management team. After this REIT appreciated sharply, it reached our target price and it was sold. However, we are seeing some opportunity due to overselling in the sector.
The effective duration of the portfolio related to bonds and preferreds is shorter than the benchmark due to interest rate risk. This contributed to results during the period. We had entered the period expecting rates to rise, but in a limited fashion due to restrained economic progress. We were correct about the fundamentals, but the Fed’s taper talk resulted in rates increasing more than we anticipated. Declining interest rates toward the end of the 12-month period led to certain sector performance reversals, but the portfolio has continued to perform well. Even with the rise and fall of interest rates, security selection across the Fund’s portfolio helped it achieve solid results.
Outlook
In 2013, the stock market had its most impressive performance since 1997. Generally, a positive market year for equities has been followed by another, though slightly less positive year. We think the market will hold true to this view, but the going will be tougher.
Currently, the most interesting dynamic in the market is the assumption of continued and improving growth, with declining inflation virtually everywhere. This is readily apparent in wage growth; without such growth it will be difficult for any economy to reach escape velocity. The new Fed chair, Janet Yellen, is focused on the labor market, and we expect rates will have difficulty breaking out of the present range absent large improvements there. We believe emerging markets will see more volatility and divergence of performance that will represent
Management's Discussion of Fund Performance (Unaudited) (Continued)
opportunity as the year unfolds and anticipate the possibility of a large dislocation in an emerging market. Preferreds continue to offer value relative to other areas within credit, although security selection will become increasingly important everywhere within credit. Instead of a tailwind, the credit markets are expected to be more like a wind whipping around in unpredictable directions.
Rising interest rates could potentially have a larger, more problematic impact on fixed-income markets. Sectors with the greatest exposure to interest rate risk generally offer lower yields. U.S. Treasuries, U.S. Government Agencies and high-quality corporate bonds all fit in this high interest-rate risk category. As we look ahead, we also find ourselves growing increasingly concerned about the impact of narrowing spreads on corporate bonds. To counter risks like these, we employ a wide range of risk management tools within the Fund to navigate through different market environments. With the QE taper now underway and the stock market coming off such a powerful year, we anticipate higher volatility in the quarters ahead.
On the equity side, we believe that margins may be as strong as currently possible, and there is evidence of this as earnings reports are released. With the current economic cycle aging, it will become increasingly difficult for stocks to advance without more good news about investment fundamentals at both corporate and economic policy levels. That said, we think that equities (and convertibles as well) will have a positive year for all of the reasons mentioned. The bull market is still running – or at least walking.
Our outlook for preferreds is positive as well. Spreads have become attractive based on rate worries and the shortening supply of available issues. Despite past difficulties, preferreds present both yield and capital appreciation potential going forward.
We also view international corporate bonds favorably. Selectivity in finding attractive values among developed and emerging market countries is the key. We see municipal bonds as positive, offering some value relative to U.S. Treasuries, but with delayed entry points due to recent bankruptcies. Our sentiment on the mortgage market is mixed. We are positive on select non-agency mortgages, but neutral to slightly negative on agency mortgages. REITs can be a volatile asset class, but offer competitive yields and will likely outperform bonds in a variety of scenarios. However, REITs are vulnerable to a strong and sustained rise in rates as we saw last year.
Even with some disinflation as a possible counterbalance, we anticipate there will be upward pressure on interest rates – which mutes our enthusiasm somewhat for bonds overall. Our corporate bond outlook, accordingly, is neutral at best. We see spreads moving from neutral to negative, although there may be some international opportunities that offer value.
We will be watching the indicators for employment and credit creation to determine if the economy can vault to the next stage of growth. Our outlook for continued economic growth is slightly uncertain, but mostly positive. The Fund’s strategy has been able to perform well in a variety of economic environments, and we believe our team is well experienced to manage through the various upcoming scenarios.
Dividend-paying investments may not experience the same price appreciation as non-dividend paying instruments, dividend-issuing companies may choose not to pay a dividend, or the dividend may be less than what is anticipated.
Diversification neither assures a profit nor guarantees against loss in a declining market.
Management’s Discussion of Fund Performance (Unaudited) (Continued)
Comparison of the Change in Value of a $10,000 Investment in the
Touchstone Flexible Income Fund - Class A* and the Barclays U.S. Aggregate Bond Index
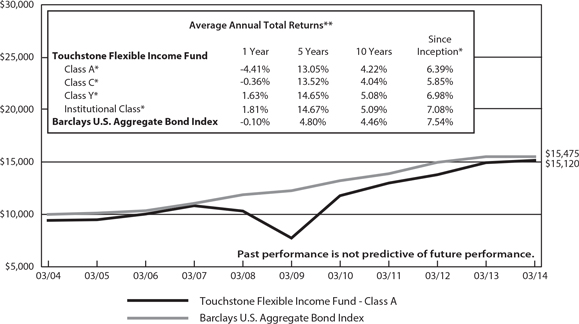
| * | The chart above represents performance of Class A shares only, which will vary from the performance of Class C shares, Class Y shares and Institutional Class shares based on the differences in loads and fees paid by shareholders in the different classes. Class A shares commenced operations on April 1, 2004, Class C shares commenced operations on October 29, 2001, Class Y shares commenced operations on September 1, 1998 and Institutional Class shares commenced operations on September 10, 2012. The Class A shares, Class C shares and Class Y shares performance information was calculated using the historical performance of the Fifth Third/ Maxus Income Fund Investor shares, with an inception date of March 10, 1985, for periods prior to April 1, 2004, October 29, 2001 and September 1, 1998, respectively. Institutional Class shares performance information was calculated using the historical performance of Class Y shares for the periods prior to September 10, 2012. The returns have been restated for sales charges and for fees applicable to Class A, Class C, Class Y and Institutional Class shares. The Barclays U.S. Aggregate Bond Index's returns are based on the inception date of the Fund. |
| ** | The average annual total returns shown above are adjusted for maximum applicable sales charges. The maximum offering price per share of Class A shares is equal to the net asset value (“NAV”) per share plus a sales load equal to 6.10% of the NAV (or 5.75% of the offering price). Class C shares are subject to a contingent deferred sales charge (“CDSC”) of 1.00% that will be assessed on an amount equal to the lesser of (1) the NAV at the time of purchase of the shares being redeemed or (2) the NAV of such shares being redeemed if redeemed within a one-year period from date of purchase. Class Y shares and Institutional Class shares are not subject to sales charges. |
The performance of the above Fund does not reflect the deduction of taxes that a shareholder would pay on Fund distributions or the redemption of Fund shares.
Note to Chart
Barclays U.S. Aggregate Bond Index is an unmanaged index comprised of U.S. investment grade, fixed rate bond market securities, including government, government agency, corporate and mortgage-backed securities between one and ten years.
Management’s Discussion of Fund Performance (Unaudited)
Touchstone Focused Fund
Sub-Advised by Fort Washington Investment Advisors, Inc.
Investment Philosophy
The Fund seeks to invest in companies of all capitalizations that are trading below what is believed to be the estimate of their intrinsic value and have a sustainable competitive advantage or a high barrier to entry in place. The barrier(s) to entry can be created through a cost advantage, economies of scale, high customer loyalty or a government barrier (e.g., license or subsidy). Management believes that the strongest barrier to entry is the combination of economies of scale and high customer loyalty.
Fund Performance
The Touchstone Focused Fund (Class A Shares) outperformed its benchmark, the Russell 3000® Index, for the 12-month period ended March 31, 2014. The Fund’s total return was 27.67 percent (calculated excluding the maximum sales charge), while the total return of the benchmark was 22.61 percent.
Market Environment
Equity markets moved broadly higher the last three quarters of 2013, driven by an improved earnings outlook and diminished policy risks domestically. The market then took a breather in the first quarter of 2014 as January witnessed a 4-5 percent sell-off and a dip in bond yields amid concerns about the U.S. economy and emerging markets. The market subsequently recouped its losses in February and went on to post a record high in March as investors shrugged off economic data as being influenced by severe weather. For the period, the market was led by Health Care, Consumer Discretionary, Industrials and Information Technology sector stocks. Sectors lagging included Telecommunication Services, Consumer Staples, Utilities and Energy.
Portfolio Review
The outperformance of the Touchstone Focused Fund can be attributed to stock selection. Its cash holdings as well as its sector allocation detracted from performance. The Fund’s holdings in the Telecommunication Services, Industrials, Consumer Discretionary, Information Technology, Financials and Energy sectors contributed to performance. Sectors that underperformed were Consumer Staples and Health Care. No positions were held in the Utilities sector.
Alliant Techsystems Inc. (Industrials sector) was a top performing stock during the past 12 months as the market realized that a decline in its core business was overly discounted and the company reported several positive earnings announcements. WellPoint Inc. (Health Care sector) outperformed as the company displayed operating resilience in the face of the rollout of the administration’s healthcare mandate. Helen of Troy Limited (Consumer Discretionary sector), Royal Caribbean Cruises Ltd. (Consumer Discretionary sector) and Bank of America Corp. (Financials sector) also outperformed, driven by positive earnings announcements and an optimistic outlook for the future.
Stocks that detracted from performance included Tesco PLC (Consumer Staples sector), which underperformed due to discounted competition in the retail market, and Sysco Corporation (Consumer Staples sector), which was hit by weak volume growth in the restaurant industry. Goldman Sachs Group Inc. (Financials sector) and Owens & Minor Inc. (Health Care sector) also underperformed, as neither company was able to keep up with strong moves in its respective sector. The Fund continues to hold each of these businesses as we like the combination of positive long-term fundamentals and attractive valuations that each possesses.
Management’s Discussion of Fund Performance (Unaudited) (Continued)
During the 12-month period, we increased the Fund’s weight to the Materials, Health Care, Information Technology and Consumer Staples sectors. We decreased the Fund’s weighting in the Financials, Energy, Industrials and Consumer Discretionary sectors.
Outlook
An investor easily could be perplexed by the continuing stream of articles in the media purporting to see the imminent end to this bull market as investors believe the length of the uptrend is long in nature. Quite frankly, we believe it is not really important how long a bull market has been in place (contrary to popular opinion), or how much the market has gained. As the markets or primary trend matures, more and more stocks may fail to fully participate in the advance. At this point, we are seeing minor signs of increased selectivity but certainly not enough to become defensive in a significant way. However, we fully recognize that markets are jittery as we believe investors are more concerned about remaining in the market too long versus leaving too soon.
From a fundamental standpoint, typically, a bull market ends either when inflation accelerates noticeably or when there is a credit bubble. In this regard, inflation is relatively tame as best measured by unit labor costs, and we do not believe a bearish turn in the credit cycle is imminent as monetary conditions are easy, corporate health is still improving and lending standards are reasonable. With regard to returns on capital for corporate America, sales should drive asset efficiency higher with the economy growing. We believe there are also signs that margins will remain stable (versus the consensus view that margins have peaked). These signs include broad-based improvements in pricing power, tame unit labor costs, inventory build-up that has lagged sales growth and capital spending near historical lows.
Therefore, we still have the Fund’s portfolio structured for an improving economic environment with significant relative positions in diversified financials, mid caps and Industrials sector stocks.
Management’s Discussion of Fund Performance (Unaudited) (Continued)
Comparison of the Change in Value of a $10,000 Investment in the Touchstone Focused
Fund - Class A*, the Russell 3000® Index and the S&P 500® Index
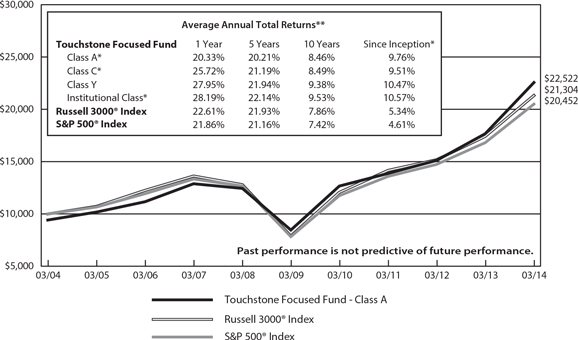
| * | The chart above represents performance for Class A shares only, which will vary from the performance of Class C shares, Class Y shares and Institutional Class shares based on the differences in loads and fees paid by shareholders in the different classes. Class A, Class C, Class Y and Institutional Class shares commenced operations on September 30, 2003, April 12, 2012, February 12, 1999 and December 20, 2006, respectively. Class A shares, Class C shares and Institutional Class shares performance information was calculated using the historical performance of Class Y shares for the periods prior to September 30, 2003, April 12, 2012 and December 20, 2006, respectively. The returns have been restated for sales charges and for fees applicable to Class A, Class C and Institutional Class shares. The Russell® 3000 Index's and the S&P 500® Index's returns are based on the inception date of the Fund. |
| ** | The average annual total returns shown above are adjusted for maximum applicable sales charges. The maximum offering price per share of Class A shares is equal to the net asset value (“NAV”) per share plus a sales load equal to 6.10% of the NAV (or 5.75% of the offering price). Class C shares are subject to a contingent deferred sales charge (“CDSC”) of 1.00% that will be assessed on an amount equal to the lesser of (1) the NAV at the time of purchase of the shares being redeemed or (2) the NAV of such shares being redeemed if redeemed within a one-year period from date of purchase. Class Y shares and Institutional Class shares are not subject to sales charges. |
The performance of the above Fund does not reflect the deduction of taxes that a shareholder would pay on Fund distributions or the redemption of Fund shares.
Notes to Chart
The Russell 3000® Index measures the performance of the 3000 largest U.S. companies based on total market capitalization, which represents approximately 98% of the investable U.S. equity market.
S&P 500® Index is a group of 500 widely held stocks and is commonly regarded to be representative of the large capitalization stock universe.
Management’s Discussion of Fund Performance (Unaudited)
Touchstone Growth Opportunities Fund
Sub-Advised by Westfield Capital Management LP
Investment Philosophy
The Touchstone Growth Opportunities Fund seeks long-term capital appreciation by primarily investing in stocks of U.S. companies with large, medium and small market capitalizations. Fund management places focus on companies that are believed to have demonstrated records of achievement with excellent prospects for earnings growth over a 1-3 year period and incorporates a proprietary, research driven, bottom-up approach that seeks to identify quality growth companies with strong management teams, sustainable business models and solid financials.
Fund Performance
The Touchstone Growth Opportunities Fund (Class A Shares) outperformed its benchmark, the Russell 3000® Growth Index, for the 12-month period ended March 31, 2014. The Fund’s total return was 25.84 percent (calculated excluding the maximum sales charge), while the total return of the benchmark was 23.53 percent.
Market Environment
The strength of the U.S. equity markets was in part due to investor confidence in the U.S. Federal Reserve Board’s (Fed) decision to begin tapering the quantitative easing program. This occurred when a series of leading economic indicators (LEI) suggested that the global economy will continue to recover. For the 12-month period, small caps outperformed mid caps which outperformed large caps. By the end of the 12-month period, there was a broadening of the outperformers which may be indicative of investor confidence in the strengthening of the global economy.
The market advance was largely the result of price/earnings (P/E) gains as corporate earnings grew only modestly. An important change in both the U.S. economy and the underlying stock market leadership may be taking place as major market indices consolidated with 0-2 percent gains at the end of the period. These gains were achieved despite miserable weather conditions across the United States, rising global uncertainty related to China’s growth and Russia’s opportunistic strategy toward its neighbors. The underlying appreciation in the U.S. equity markets during the 12-month period came as high price-to-earnings (P/E) stocks significantly underperformed and short-term interest rates trended higher. The equity markets may be foretelling a further pick-up in the economy. As a result, we believe that future stock price gains will be driven by underlying earnings growth, rather than further increases in price-to-earnings multiples.
Portfolio Review
Strength in the Health Care, Consumer Staples and Financials sectors offset weakness in the Energy and Information Technology sectors.
The Health Care sector contributed to relative performance. Actavis PLC, a pharmaceutical firm focused on manufacturing generic and over-the-counter products, was the top contributor to relative performance. Actavis acquired Warner Chilcott PLC, a pharmaceutical firm with core competencies in urology, gastroenterology and dermatology. The merger of Actavis and Warner Chilcott created a premier specialty pharmaceutical company with more than 25 products in various stages of development. During their quarterly earnings recap in January, the company highlighted the strength of cash flow and depth of the product pipeline, as well as their debt reduction process. Actavis achieved an all-time-high after the company announced a definitive agreement to acquire specialty pharmaceutical firm Forest Laboratories, Inc. The acquisition enables Actavis to realize the 50/50 branded to generic drug balance that the company has historically sought. Separately, Jazz Pharmaceuticals
Management’s Discussion of Fund Performance (Unaudited) (Continued)
announced the acquisition of Fund holding Gentium SpA, a manufacturer of biopharmaceuticals. The Fund’s original investment in the stock centered on the belief this underfollowed, yet profitable, orphan biotechnology company was on the cusp of significant growth following a regulatory opinion on Defibrotide, its product for the treatment of hepatic veno-occlusive disease.
The Consumer Staples sector contributed to relative performance, with the continued underweight to the sector as well as stock selection helping results. The Fund held a position in beverage giant Coca-Cola Company for a short period, but the stock was sold because fundamentals in the carbonated soft drink market remain challenging and the health of emerging markets, to which the company has significant exposure, still remains a question mark for many investors. In September, the Fund’s position in Kraft Foods Group Inc. was sold after food giant ConAgra missed expectations for its quarterly results, perhaps indicative of a more aggressive industry pricing/promotional strategy to follow which could dampen results in the industry. We continue to focus on finding investment opportunities in the Consumer Staples sector that represent compelling fundamental growth stories we believe will resonate with investors and distinguish the companies from their purely defensive and slower growth (albeit predictable) investment peers.
Strong stock selection within the Financials sector contributed to performance. Ameriprise Financial Inc., an asset management company with a sizable insurance services business, outperformed its industry peers. We like this provider for its superior profit margins and disciplined approach to returning capital to shareholders. In addition, if short-term interest rates continue to rise, this will have a positive impact on the company’s profits, which are boosted by higher spreads on cash sweep accounts. Insurance providers and banks are among the biggest beneficiaries of rising interest rates and a steeper yield curve. American International Group Inc., a global insurance company, also enhanced excess gains. We are encouraged by the company’s turnaround efforts in the property and casualty business and management’s commitment to returning capital to shareholders. The company recently authorized an additional share repurchase program and increased its dividend. Starwood Property Trust, Inc. was a top contributor to relative returns within the sector. The company exceeded consensus expectations for earnings for three consecutive quarters, benefiting from higher servicing fees in the LNR Property segment, which Starwood acquired.
The Energy sector detracted from relative performance. Refining companies suffered as the feed stock price differential between the West Texas Intermediate/North Sea Brent crude oil varieties diminished. Refiners recovered but then pulled back again. Tesoro Corp. declined along with its industry peers. Sell-side expectations for Tesoro’s quarterly earnings were skewed to the upside, partially due to different views on the Carson acquisition synergies and California product prices. We think Tesoro has multiple catalysts for earnings acceleration and continue to be enthusiastic about the stock’s appreciation potential. National Oilwell Varco, Inc., a manufacturer of oil and gas field equipment, also detracted from relative results. We sold the stock given our belief that its risk/reward profile was deteriorating. Refiner Valero Energy Corp. was also a relative detractor. The company filed to sell its stake in CST Brands, the retail gas station business the company had spun-off to shareholders earlier in the year. The proceeds from the deal should likely be used for further share repurchases. We expect the company to benefit from its geographic exposure to the Gulf Coast, which is seeing new development in regional pipeline and rail networks that will ultimately connect Cushing-based crude inventories to refineries on the Gulf Coast.
The Information Technology sector detracted from Fund performance. The Fund’s underweight of the sector, coupled with the outperformance of mega cap legacy technology company holdings such as Microsoft Corp., hurt incremental performance. Citrix Systems, a cloud computing company that provides virtualization and optimization services, declined after lowering its earnings forecast in late 2013. The company has a diversified book of products and a large recurring revenue base, but its mobile and desktop business segment – the largest by revenue – had been missing revenue targets. While we believe Citrix is focused on the right product categories, the Fund’s position was sold. The timing of our trade actions in RedHat, Inc. and Facebook, Inc. also hurt relative returns. RedHat surged after the company reported surprisingly good quarterly results in its European
Management’s Discussion of Fund Performance (Unaudited) (Continued)
and U.S. Federal Government business segments relative to prior quarters. The stock was sold after the company lowered guidance for the quarter, citing macroeconomic weakness in Europe. The shares were repurchased, encouraged by signs of acceleration in earnings and the fact that the stock trades at a discount to its software-as-a-service peers. Facebook was added to the Fund’s portfolio in advance of the initial public offering of Twitter shares because of our belief that Facebook would benefit from the event. Qlik Technologies Inc., a provider of business intelligence software solutions, was another significant detractor from relative returns. Qlik Technologies shares declined sharply after the company reported third quarter results that were below consensus expectations. We believe the quarterly weakness came down to a handful of deals in the company’s Europe and Asia business segments and was not a product issue. Its North America segment, which is the most competitive geography, was up on a year-over-year basis. We maintained the Fund’s position given our belief that it carries an attractive risk/reward profile among its peers.
As a result of our fundamental, bottom-up research process, the Fund saw increased weights in the Health Care, Financials, Industrials and Information Technology sectors during the period. Weights were decreased in the Consumer Staples, Consumer Discretionary and Energy sectors.
Outlook
In many instances over the past few months, severe winter weather negatively impacted business conditions. However, time and again, our investment team was struck by how upbeat and bullish management teams have become about the longer-term opportunities in the United States. Large road, bridge, pipeline, power transmission and office building projects are just breaking ground. We believe innovation pipelines in the Health Care and Information Technology sectors are healthier than they have been in a decade. Bank lending is accelerating. Although a better economy is good news as a whole, this change in trend can create disruption and volatility in both equity and debt markets. We recognize that long-lasting impact of the Fed’s accommodative monetary policy on financial assets, an economic slowdown in China, and the prospect of further political instability in the former Soviet bloc region could contribute to wider gyrations in stock prices. Times are changing, and in our opinion, market leadership will change. We expect stock picking and active management will become substantially more important in the years ahead. We are focused on identifying companies with accelerating or underappreciated Earnings Per Share growth, trading at reasonable prices. Perhaps just as important, our investment team strives to anticipate what is to come and identify where we can add the most value. We believe that the current market environment offers ample opportunity to identify companies that fit the Fund’s investment profile.
Dividend-paying investments may not experience the same price appreciation as non-dividend paying instruments, dividend-issuing companies may choose not to pay a dividend, or the dividend may be less than what is anticipated.
Management’s Discussion of Fund Performance (Unaudited) (Continued)
Comparison of the Change in Value of a $10,000 Investment in the
Touchstone Growth Opportunities Fund - Class A* and the Russell 3000® Growth Index
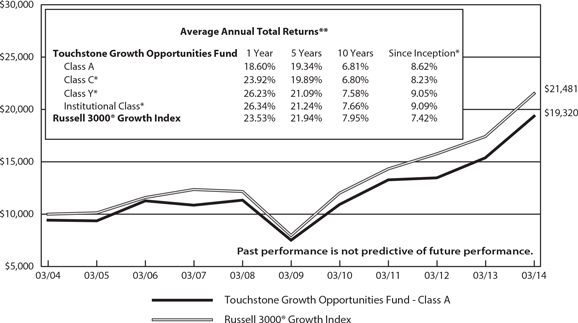
| * | The chart above represents performance of Class A shares only, which will vary from the performance of Class C shares, Class Y shares and Institutional Class shares based on the differences in loads and fees paid by shareholders in the different classes. Class A shares commenced operations on September 29, 1995, Class C shares commenced operations on August 2, 1999, Class Y shares and Institutional Class shares commenced operations on February 2, 2009. The Class C shares performance information was calculated using the historical performance of Class A shares for periods prior to August 2, 1999, Class Y shares and Institutional shares performance information was calculated using the historical performance of Class A shares for periods prior to February 2, 2009. The returns have been restated for sales charge and for fees applicable to Class C, Class Y and Institutional Class shares. The Russell 3000® Growth Index's returns are based on the inception date of the Fund. |
| ** | The average annual total returns shown above are adjusted for maximum applicable sales charges. The maximum offering price per share of Class A shares is equal to the net asset value (“NAV”) per share plus a sales load equal to 6.10% of the NAV (or 5.75% of the offering price). Class C shares are subject to a contingent deferred sales charge (“CDSC”) of 1.00% that will be assessed on an amount equal to the lesser of (1) the NAV at the time of purchase of the shares being redeemed or (2) the NAV of such shares being redeemed if redeemed within a one-year period from date of purchase. Class Y shares and Institutional Class shares are not subject to sales charges. |
The performance of the above Fund does not reflect the deduction of taxes that a shareholder would pay on Fund distributions or the redemption of Fund shares.
Note to Chart
The Russell 3000® Growth Index measures the performance of those Russell 3000® companies with higher price-to-book ratios and higher forecasted growth values.
Management’s Discussion of Fund Performance (Unaudited)
Touchstone International Value Fund
Sub-Advised by Barrow, Hanley, Mewhinney & Strauss, LLC
Investment Philosophy
The Touchstone International Value Fund seeks long-term capital growth by primarily investing in equity securities of non-U.S. companies believed to be undervalued and searches for companies that have price-to-earnings and price-to-book ratios below the market, free cash flow ratios at or below the market and dividend yields above the market.
Fund Performance
The Touchstone International Value Fund (Class A Shares) outperformed its benchmark, the MSCI EAFE Index, for the 12-month period ended March 31, 2014. The Fund’s total return was 20.90 percent (calculated excluding the maximum sales charge), while the total return of the benchmark was 17.56 percent.
Market Environment
At the beginning of the fiscal year, the U.S. Federal Reserve Board (Fed) announced the possibility of scaling back its massive bond-buying program, which sparked a rout in the bond market and a pullback in most equity markets. The rapidity and magnitude of the rise in interest rates shocked investors in both bond and equity markets, challenging investors’ perceptions of safety and risk, and interest rates across the credit spectrum were driven lower and for a longer period of time. In Europe, the eurozone remained in the midst of a deflationary cycle and emerging market equities sold off significantly as China’s economy slowed and commodity producers were particularly hard hit. By mid-year 2013, equity markets displayed sharply higher volatility as global investors worried about the implications from escalating tensions in the Middle East, along with the unwinding of quantitative easing and eventual resumption of monetary tightening by the Fed. By the end of 2013, however, U.S. equities were among the strongest in the world and European markets began to show signs of recovery. However, emerging markets were still impacted as a result of concerns over China’s economy and continued weakness in the commodities complex.
The beginning of 2014 brought with it no shortage of worries for investors. In particular, the crisis in Ukraine, a continuation of troubling economic data from China and other emerging markets and disruptive winter weather in the U.S. plagued investors. Despite the many concerns however, U.S. equity markets displayed an uneasy calm. The perceived safe harbor of U.S. equities contributed to their performance advantage over both developed and emerging international markets, and particularly emerging markets, which remained weak. U.S. bond performance kept pace with stocks during the quarter, which went against the consensus view that interest rates would continue to rise, and European markets remained in the midst of a bounce upward despite the potential for negative consequences from the ongoing unrest between Russia and Ukraine.
Portfolio Review
For the period, the Fund’s holdings within the Financials, Consumer Staples, Materials and Utilities sectors contributed to performance, while stock selection in the Industrials, Consumer Discretionary, Information Technology and Telecommunication Services sectors detracted from performance. Among the stocks that contributed to Fund performance during the period were Daimler AG (Consumer Discretionary sector), DS Smith PLC (Materials sector), Delta Lloyd N.V. and AEGON N.V. (both from the Financials sector). Daimler AG, a Germany-based automotive company, posted solid results across all of its business segments, increased its dividend and provided a positive outlook for the remainder of 2014. Daimler continued to capitalize on a favorable product cycle that includes important model changeovers and new model introductions, both of which have driven strong demand globally for Mercedes-Benz. Daimler’s truck business also experienced a recovery during the period, which further helped the stock. DS Smith PLC, a London-based international packaging business,
Management’s Discussion of Fund Performance (Unaudited) (Continued)
experienced several positive developments during the year. DS Smith continued to profit from an accretive acquisition of a Swedish packaging business in 2012, and the company has been in active negotiations with both small- to medium- and large-sized prospects. Additionally, a major international packaged-goods company approached DS Smith about being the exclusive provider of all of its European corrugated packaging, which further benefited the stock. Delta Lloyd, a Netherlands-based financial services provider, saw strong performance as the company continued to benefit from rising interest rates. It also saw improvement in its underlying business as earnings from one of its largest segments, the Dutch pension buyout market, grew considerably and its capital position improved. AEGON, a global provider of pensions, insurance and savings products, provided an attractive dividend yield during the period and, if interest rates continue their upward trend, we believe the stock could continue to provide meaningful upside going forward.
Among the stocks that detracted from Fund performance were Jardine Cycle & Carriage Ltd. (Consumer Discretionary sector), Anglo American plc and Dongyue Group Ltd. (both from the Materials sector). Jardine Cycle & Carriage, a Singapore-based investment company and management services provider, was plagued by numerous issues during the year. In particular, during the fourth quarter of 2013, the drastic underperformance of the Indonesian stock market and the severe deterioration of the Indonesian rupiah against the Singapore dollar impacted company shares the most. Jardine Cycle & Carriage is also a majority holding of Astra International, an Indonesia-based conglomerate, which further negatively impacted the stock. Anglo American, a multinational mining company, underperformed as a result of the broad-based commodity sell-off in which coal, copper, gold and iron ore prices fell precipitously. The stock was further impacted during the year by the company’s poor capital investment, delays in its large-scale Minas Rio project and deterioration in stripping ratios in its Sishen iron ore project. Dongyue Group is a China-based manufacturer of refrigerants and fluropolymers, which have many industrial and consumer uses, including the familiar Teflon® non-stick coating. It was expected that prices for refrigerants were near trough levels and were due for cyclical improvement; however, refrigerant prices remained stable but polymer prices softened due to significant new industry capacity. This resulted in decreases in both the company’s stock price and aggregate margins during the period.
Outlook
Looking forward, the outlook for global equities remains positive but mixed depending, in some cases, on geographical location and valuations. The impact of a slowdown in China continues to weigh on countries with a heavy dependence on exports to China, and particularly those with a strong correlation to the commodities complex. This has been a source of stress on the currencies of Turkey, Brazil, Indonesia, India and Russia, otherwise known as the “fragile five.” Though this uncertainty may last for some time, we believe it will eventually abate and create opportunities in select emerging markets where valuations are becoming more compelling. Europe is in the midst of a continuing rebound in economic stability as evidenced by the narrowing of credit spreads in many of the peripheral countries such as Spain, Italy and Greece. We believe the Fund’s overweight position to the European region should continue to pay off as the Fund holds a portfolio of high-quality companies at very reasonable valuations, particularly within the Industrials and Financials sectors. We are less bullish on Japan, however, and remain unconvinced that the historically significant monetary stimulus engineered by the country’s government will translate into a wholesale change in the philosophies of Japanese corporate managements, which have been less focused on return of capital and profitability measures. Nevertheless, we are finding potential opportunities where management teams seem to be changing slowly to a strategy focused on shareholders and profitability measures.
Management’s Discussion of Fund Performance (Unaudited) (Continued)
Our investment discipline is driven by fundamental research which we utilize to build the Fund’s portfolio by analyzing and building our own appraisal of values one company at a time. The Fund is comprised of a basket of companies that we believe offers a better return profile relative to the market and, as such, we believe the Fund is well positioned going forward.
Dividend-paying investments may not experience the same price appreciation as non-dividend paying instruments, dividend-issuing companies may choose not to pay a dividend, or the dividend may be less than what is anticipated.
Management’s Discussion of Fund Performance (Unaudited) (Continued)
Comparison of the Change in Value of a $10,000 Investment in the Touchstone International
Value Fund - Class A* and the MSCI EAFE Index
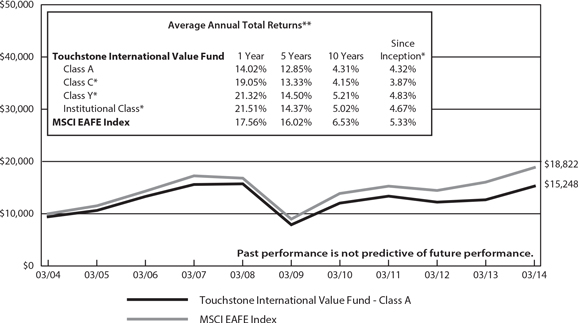
| * | The chart above represents performance of Class A shares only, which will vary from the performance of Class C shares, Class Y shares and Institutional Class shares based on the differences in loads and fees paid by shareholders in the different classes. Class A shares commenced operations on August 18, 1994, Class C shares commenced operations on April 25, 1996, Class Y shares commenced operations on October 9, 1998 and Institutional Class shares commenced operations on September 10, 2012. The Class C shares performance information was calculated using the historical performance of Class A shares for periods prior to April 25,1996, Class Y shares performance information was calculated using the historical performance of Class A shares for periods prior to October 9, 1998 and Institutional Class shares performance information was calculated using the historical performance of Class A shares for periods prior to September 10, 2012. The returns have been restated for sales charges and for fees applicable to Class C, Class Y, and Institutional Class shares. The MSCI EAFE Index's returns are based on the inception date of the Fund. |
| ** | The average annual total returns shown above are adjusted for maximum applicable sales charges. The maximum offering price per share of Class A shares is equal to the net asset value (”NAV“) per share plus a sales load equal to 6.10% of the NAV (or 5.75% of the offering price). Class C shares are subject to a contingent deferred sales charge (”CDSC“) of 1.00% that will be assessed on an amount equal to the lesser of (1) the NAV at the time of purchase of the shares being redeemed or (2) the NAV of such shares being redeemed if redeemed within a one-year period from date of purchase. Class Y shares and Institutional Class shares are not subject to sales charges. |
The performance of the above Fund does not reflect the deduction of taxes that a shareholder would pay on Fund distributions or the redemption of Fund shares.
Note to Chart
MSCI EAFE Index is a free float-adjusted market capitalization index that is designed to measure developed market equity performance excluding the U.S. and Canada.
Management’s Discussion of Fund Performance (Unaudited)
Touchstone Large Cap Growth Fund
Sub-Advised by Navellier & Associates, Inc.
Investment Philosophy
The Touchstone Large Cap Growth Fund seeks long-term growth of capital. The Fund primarily invests in common stocks of large-cap U.S. companies believed to possess strong appreciation potential.
Fund Performance
The Touchstone Large Cap Growth Fund (Class A Shares) underperformed its benchmark, the Russell 1000® Growth Index, for the 12-month period ended March 31, 2014. The Fund’s total return was 21.27 percent (calculated excluding the maximum sales charge), while the total return of the benchmark was 23.22 percent for the same period.
Market Environment
U.S. equity markets finished the period with double-digit gains. Returns were due in part to renewed investor confidence that the U.S Federal Reserve Board’s (Fed) policy to commence tapering of its quantitative easing (QE) program came at the right time – as leading economic indicators suggested that the global economy will stabilize. The gains were achieved despite global volatility and uncertainty related to China’s growth, problems in the Ukraine and the annexation of Crimea as well as one of the harshest winters across the U.S.
The Health Care and Consumer Discretionary sectors led for the first half of the period and small-cap stocks outperformed large caps. The sands shifted in the fourth quarter of 2013 however; as small-cap performance moderated and the Industrials and Information Technology sectors took the lead. Gold was largely down over the first three quarters of the period and then surged during the first quarter of 2014. The resurgence of real estate was evident in the latter half of the period as evidenced by a strong rally in real estate investment trusts (REITs). Investors fled from bonds which saw record outflows last summer during the tapering scare. The selloff in bonds caused interest-rate-sensitive sectors like Utilities, Telecommunication Services and Financials to underperform briefly, but that abated toward the end of the fiscal year.
Portfolio Review
Although the Fund underperformed its benchmark Index for the period, we believe it was a good year for the Touchstone Large Cap Growth Fund.
For the period, sectors that detracted most from Fund performance were Energy, Financials and Consumer Discretionary due to poor stock selection. Of the three sectors, Energy was the largest detractor for the period. The Information Technology and Industrials sectors were the leading contributors to performance due to strong stock selection throughout the fiscal year. The Health Care sector also contributed to performance due to an overweight exposure and stock selection.
Among the stocks that detracted most from performance during the fiscal year were: HollyFrontier Corp. (Energy sector), PulteGroup Inc. (Consumer Discretionary sector) and DaVita HealthCare Partners Inc. (Health Care Sector). HollyFrontier Corp.’s 2013 second quarter earnings fell versus analysts’ forecasts as refinery margins narrowed amid lower production. During the third quarter, oil prices contracted which further hurt the company’s refinery margins and prompted some analyst downgrades. Consequently, HollyFrontier detracted from performance and was sold. PulteGroup Inc.’s second quarter earnings fell as the home builder’s higher costs masked stronger closings and selling prices. Although Pulte’s closings were up at the time, company orders declined compared to a year earlier and the stock was punished when their order and delivery figures fell short of Wall Street consensus estimates and it detracted from Fund performance. DaVita HealthCare reported earnings that were below analyst expectations, which negatively affected the stock’s relative fundamental valuations. In addition, the proposed
Management’s Discussion of Fund Performance (Unaudited) (Continued)
deep cuts in Medicare reimbursements took a toll on kidney dialysis providers, which resulted in The Centers for Medicare and Medicaid Services proposing cut-backs on payments for dialysis patients by 9.4 percent for 2014, more than double the 3 – 4 percent expected. Consequently, the stock was sold.
The Fund had adequate exposure to the more domestically-oriented stocks that outperformed for a significant part of the fiscal year, which aided Fund performance. Among the stocks that contributed to performance were Alliance Data Systems Corp. (Information Technology sector), Actavis PLC (Health Care sector) and Raytheon Co. (Industrials sector). Alliance was the largest contributor due to an improving credit environment and falling unemployment, as well as the continued popularity of tailored electronic marketing. Actavis has been branching out into branded pharmaceuticals and successfully made a series of accretive acquisitions during the period, which affected the share price of the stock positively. Raytheon, maker of the Patriot missile-defense system, contributed to performance. The company is the most diversified of the large U.S. contractors and furthest advanced in winning international business to counter domestic military-budget pressures. In addition, the company managed the latest defense budget cuts well which was also reflected in the share price.
Positions were added to the Fund’s Health Care and Information Technology sectors to take advantage of the strong market performance those sectors began to experience in the third and fourth quarters of 2013. During the period, the Fund began to reduce exposure to the Consumer Discretionary sector due to the effects of the uneven pace of economic growth in the fiscal year. The Fund’s overweight to the Energy sector was reduced from the previous fiscal year due to weakness in refining margins that affected its positions, and the Fund’s overweight to the Utilities sector was also decreased, primarily due to the large swings in long-term interest rates that affected the sector, resulting from QE tapering.
Outlook
The Fund is positioned for a cyclical upswing in the recovering U.S. economy where we believe falling unemployment and a healing housing market will offer opportunities in more cyclical sectors. Should the Russia/Ukraine situation deteriorate, we believe any resulting sanctions against Russia could hurt their largest trading partner, the European Union (EU), thus weakening the recovery in Europe. China has also seen slowing economic numbers. As the largest consumer of commodities and the second largest world economy, should China’s economy further slow, it could affect the world economy disproportionately if that slowdown is not contained. We believe the sector most exposed at this point appears to be Consumer Discretionary, as it encompasses those industries that tend to be most sensitive to economic cycles, such as hotels, restaurants and consumer retailing and services, to name a few.
Going forward, we believe the Fund is positioned to be marginally less exposed to top-down risks. With the U.S. economy outperforming most global economies, the Fund is being positioned to take advantage of the continued economic expansion. We believe QE tapering is a sign from the Fed that the economy can handle slightly higher interest rates, while federal deficits are shrinking and unemployment is falling. Additionally, in this relatively slow earnings growth environment, we believe many of the securities selected for the Fund’s portfolio have the potential to deliver above average earnings-per-share and sales growth in their respective industries.
Management’s Discussion of Fund Performance (Unaudited) (Continued)
Comparison of the Change in Value of a $10,000 Investment in the
Touchstone Large Cap Growth Fund - Class A* and the Russell 1000® Growth Index

| * | The chart above represents performance of Class A shares only, which will vary from the performance of Class B, Class C and Class Y shares based on the differences in loads and fees paid by shareholders in the different classes. Class A shares commenced operations on December 19, 1997, Class B and Class C shares commenced operations on October 4, 2003 and Class Y shares commenced operations on November 10, 2004. The Class B shares and Class C shares performance information was calculated using the historical performance of Class A shares for periods prior to October 4, 2003 and Class Y shares performance information was calculated using the historical performance of Class A shares for periods prior to November 10, 2004. The returns have been restated for sales charges and for fees applicable to Class B, Class C and Class Y shares. The Russell 1000® Growth Index's returns are based on the inception date of the Fund. |
| ** | The average annual total returns shown above are adjusted for maximum applicable sales charges. The maximum offering price per share of Class A shares is equal to the net asset value (“NAV”) per share plus a sales load equal to 6.10% of the NAV (or 5.75% of the offering price). Class B shares are subject to a contingent deferred sales charge (“CDSC”) of 5.00% in the event of a shareholder redemption within a one-year period of purchase. The CDSC will be incrementally reduced over time. After the 6th year, there is no CDSC. Class C shares are subject to a CDSC of 1.00% that will be assessed on an amount equal to the lesser of (1) the NAV at the time of purchase of the shares being redeemed or (2) the NAV of such shares being redeemed if redeemed within a one-year period from date of purchase. Class Y shares shares are not subject to sales charges. |
The performance of the above Fund does not reflect the deduction of taxes that a shareholder would pay on Fund distributions or the redemption of Fund shares.
Notes to Chart
The Russell 1000® Growth Index measures the performance of those Russell 1000® companies with higher price-to-book ratios and higher forecasted growth values.
Management’s Discussion of Fund Performance (Unaudited)
Touchstone Mid Cap Growth Fund
Sub-Advised by Westfield Capital Management LP
Investment Philosophy
The Touchstone Mid Cap Growth Fund seeks long-term growth by primarily investing in stocks of mid-cap U.S. companies. Fund management places focus on companies that are believed to have demonstrated records of achievement with excellent prospects for earnings growth over a 1-3 year period and incorporates a proprietary, research driven, bottom-up approach that seeks to identify quality growth companies with strong management teams, sustainable business models and solid financials.
Fund Performance
The Touchstone Mid Cap Growth Fund (Class A Shares) outperformed its benchmark, the Russell Midcap® Growth Index for the 12-month period ended March 31, 2014. The Fund’s total return was 24.82 percent (calculated excluding the maximum sales charge), while the total return on the benchmark was 24.22 percent.
Market Environment
The strength of the U.S. equity markets was in part due to investor confidence in the U.S. Federal Reserve Board’s (Fed) decision to begin tapering the quantitative easing program. This occurred when a series of leading economic indicators (LEI) suggested that the global economy will continue to recover. For the 12-month period, small caps outperformed mid caps which outperformed large caps. By the end of the 12-month period, there was a broadening of the outperformers which may be indicative of investor confidence in the strengthening of the global economy.
The market advance was largely the result of price/earnings (P/E) gains as corporate earnings grew only modestly. An important change in both the U.S. economy and the underlying stock market leadership may be taking place as major market indices consolidated with 0-2 percent gains at the end of the period. These gains were achieved despite miserable weather conditions across the United States, rising global uncertainty related to China’s growth and Russia’s opportunistic strategy toward its neighbors. The underlying appreciation in the U.S. equity markets during the 12-month period came as high price-to-earnings (P/E) stocks significantly underperformed and short-term interest rates trended higher. The equity markets may be foretelling a further pick-up in the economy. As a result, we believe that future stock price gains will be driven by underlying earnings growth, rather than further increases in price-to-earnings multiples.
Portfolio Review
The Health Care sector was the greatest source of relative gains during the period; the Information Technology and Financials sectors also contributed significantly to outperformance. Investments in the Consumer Discretionary and Energy sectors underperformed.
The Health Care sector exhibited broad-based strength, contributing to relative results. The Fund’s overweight to the sector helped, but it was positive stock selection, particularly within pharmaceuticals, that drove the bulk of the outperformance. Actavis PLC, which focuses on manufacturing generic and over-the-counter products, acquiredWarner Chilcott PLC, a major player in the generic drug industry, and both stocks appreciated substantially. The merger of Actavis and Warner Chilcott created a leading specialty pharmaceutical company with more than 25 products in various stages of development. Actavis achieved an all-time-high after the company announced a definitive agreement to acquire specialty pharmaceutical firm Forest Laboratories, Inc.,The acquisition enables Actavis to realize the 50/50 branded-to-generic drug balance that the company has historically sought. Drug distributor Cardinal Health, Inc. also contributed meaningfully to performance. The company entered into a joint venture with CVS Caremark Corp. creating the largest generic pharmaceutical product sourcing entity
Management’s Discussion of Fund Performance (Unaudited) (Continued)
in the U.S. However, Cardinal was sold in January as we believed the stock reached its full valuation potential. We remain enthusiastic about investment opportunities within the drug distribution segment. We believe it is well positioned to benefit from the current generic up-cycle, higher volumes brought by the Affordable Care Act and aggressive capital deployment.
The Information Technology sector also contributed to performance. Although the large and mid-capitalization technology companies underperformed the broader market during the period, the Fund’s outperformance in this sector stemmed entirely from positive stock selection. Alliance Data Systems Corp., a private label credit card issuer, significantly outpaced its industry peers. We believe the company has multiple catalysts for earnings acceleration going forward including the mobile and private label retail credit card segments. Akamai Technologies, Inc. contributed meaningfully to relative performance. The company provides services for improving the delivery of content over the Internet and has demonstrated strength in its cloud/security segment and acceleration of media delivery revenues. We believe earnings momentum is likely to continue. The Fund’s exposure to the Information Technology sector was reduced given recent data indicating weakness in enterprise spending and emerging markets. Although the Fund is currently underweight to the sector relative to the benchmark, we continue to look for attractive investment candidates in areas of secular growth. We particularly favor companies exposed to the transition to cloud-based business models, the move to mobile platforms from the desktop and the demand for cyber-security solutions. Several new technology investments were added to the Fund’s portfolio including Citrix Systems, Inc., a virtualization software developer, FEI Company, a maker of scientific instruments, and semiconductor manufacturer Xilinx, Inc. All of them were additive to performance.
The Financials sector outperformed broadly; five out of seven holdings contributed to the Fund’s performance. Much of the price action in the sector continued to be dictated by the direction of the U.S. yield curve. We believe the economy is strengthening, and if it continues, interest rates are bound to rise. We believe stocks that benefit from higher interest rates, such as insurance providers and banks, are good areas for Fund investment. Ameriprise Financial Inc., an asset management company with a sizable insurance services business, was the top performer within the sector. Its wealth management business segment has consistently demonstrated profit margins ahead of management’s targets. Improving inflows into the company’s asset management business, increased client activity and equity market appreciation represent potential catalysts for the stock. Regions Financial Corp. was also a contributor to performance within the sector. The company operates in the Southeast region of the U.S., a faster growing geographical market. During the most recent quarterly recap, management guided to incrementally higher loan growth in 2014. Unlike some of its regional bank competitors, Regions is fully compliant with the Liquidity Coverage Ratio and should be poised to benefit from an improving net interest margin outlook.
The Consumer Discretionary sector detracted from relative results. While there were many strong performers in the sector, such as Wynn Resorts, Ltd. and Jarden Corp., the positive impact of these holdings was offset by stock-specific weakness within apparel retail and homebuilding. In addition, the Fund’s underweight to the sector, and particularly its lack of exposure to high momentum, high growth sub-industries, such as automobile manufacturers and Internet retail, held back excess returns. The teen consumer market was weak, and apparel retailer Abercrombie & Fitch Co. was the biggest source of relative weakness in the sector. Aggressive price promotion and fierce competition in apparel retail has made it difficult for Abercrombie to capitalize on measures to improve profitability and led to the sale of the stock. Homebuilder Toll Brothers, Inc. also detracted from performance. Most housing stocks pulled back sharply in conjunction with the bond market sell-off, which followed the move in interest rates triggered by the Fed’s tapering commentary. Although we continue to believe that U.S. housing fundamentals are improving andToll Brothers, which owns an eight-year inventory of Northeast land, has significant intrinsic value, we sold the Fund’s position.
The Energy sector detracted from performance. U.S.-based refiners were volatile, falling under selling pressure when the West Texas Intermediate (WTI)/North Sea Brent price spread narrowed and pulled back again. The
Management’s Discussion of Fund Performance (Unaudited) (Continued)
WTI/Brent price differential has historically been associated with refiner profitability; however, we believe spreads to other oil grades are more important for the Fund’s refinery investments. The Fund’s oil and gas refiner, Tesoro Corp., detracted from relative performance. We believe Tesoro, which processes crude oil from the Bakken basin, should be able to improve profit margins given lower transportation costs and multiple catalysts for earnings acceleration in the second half of the year.
Outlook
In many instances over the past few months, severe winter weather negatively impacted business conditions. However, time and again, our investment team was struck by how upbeat and bullish management teams have become about the longer-term opportunities in the United States. Large road, bridge, pipeline, power transmission and office building projects are just breaking ground. We believe innovation pipelines in the Health Care and Information Technology sectors are healthier than they have been in a decade. Bank lending is accelerating. Although a better economy is good news as a whole, this change in trend can create disruption and volatility in both equity and debt markets. We recognize that long-lasting impact of the Fed’s accommodative monetary policy on financial assets, an economic slowdown in China, and the prospect of further political instability in the former Soviet bloc region could contribute to wider gyrations in stock prices. Times are changing, and in our opinion, market leadership will change. We expect stock picking and active management will become substantially more important in the years ahead. We are focused on identifying companies with accelerating or underappreciated Earnings Per Share growth, trading at reasonable prices. Perhaps just as important, our investment team strives to anticipate what is to come and identify where we can add the most value. We believe that the current market environment offers ample opportunity to identify companies that fit the Fund’s investment profile.
Management’s Discussion of Fund Performance (Unaudited) (Continued)
Comparison of the Change in Value of a $10,000 Investment in the Touchstone Midcap
Growth Fund - Class A* and the Russell Midcap® Growth Index
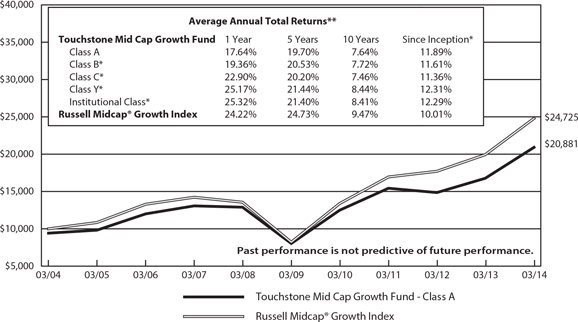
| * | The chart above represents performance of Class A shares only, which will vary from the performance of Class B shares, Class C shares, Class Y shares and Institutional Class shares based on the differences in loads and fees paid by shareholders in the different classes. Class A shares and Class C shares commenced operations on October 3, 1994, Class B shares commenced operations on May 1, 2001, Class Y shares commenced operations on February 2, 2009 and Institutional Class shares commenced operations on April 1, 2011. The Class B shares performance information was calculated using the historical performance of Class A shares for periods prior to May 1, 2001, Class Y shares performance information was calculated using the historical performance of Class A shares for periods prior to February 2, 2009 and Institutional shares performance information was calculated using the historical performance of Class A shares for periods prior to April 1, 2011. The returns have been restated for sales charges and for fees applicable to Class B, Class Y, and Institutional Class shares. The Russell Midcap® Growth Index's returns are based on the inception date of the Fund. |
| ** | The average annual total returns shown above are adjusted for maximum applicable sales charges. The maximum offering price per share of Class A shares is equal to the net asset value (“NAV”) per share plus a sales load equal to 6.10% of the NAV (or 5.75% of the offering price). Class B shares are subject to a contingent deferred sales charge (“CDSC”) of 5.00% in the event of a shareholder redemption within a one-year period of purchase. The CDSC will be incrementally reduced over time. After the 6th year, there is no CDSC. Class C shares are subject to a CDSC of 1.00% that will be assessed on an amount equal to the lesser of (1) the NAV at the time of purchase of the shares being redeemed or (2) the NAV of such shares being redeemed if redeemed within a one-year period from date of purchase. Class Y shares and Institutional Class shares are not subject to sales charges. |
The performance of the above Fund does not reflect the deduction of taxes that a shareholder would pay on Fund distributions or the redemption of Fund shares.
Note to Chart
The Russell Midcap® Growth Index measures the performance of those Russell Midcap® companies with higher price-to-book ratios and higher forecasted growth values.
Management’s Discussion of Fund Performance (Unaudited)
Touchstone Small Cap Growth Fund
Sub-Advised by Apex Capital Management, Inc.
Investment Philosophy
The Touchstone Small Cap Growth Fund invests in a diversified portfolio of common stocks of small-cap growth-oriented companies that are selected for their long-term capital appreciation potential and which are expected to grow faster than the U.S. economy. The majority of the portfolio is invested in “established growth” companies which typically provide more stability and consistency in volatile markets. The balance of the portfolio is invested in “emerging growth” companies which typically exhibit more aggressive growth characteristics and may experience positive transformation or a favorable catalyst impacting their long-term growth potential. Fund management uses an approach that combines top-down secular/macro-economic theme analysis with bottom-up security selection.
Fund Performance
The Touchstone Small Cap Growth Fund (Class A Shares) underperformed its benchmark, the Russell 2000® Growth Index, for the 12-month period ended March 31, 2014. The Fund’s total return was 22.63 percent (calculated excluding maximum sales charge), while the total return of the benchmark was 27.19 percent for the same period.
The strategy of the Fund changed as of April 26, 2013 and therefore, the benchmark index became the Russell 2000® Growth Index at that time.
Market Environment
Improvement in job growth in the U.S. and the prospects of tapering of Treasury bond purchasing stimulus by the U.S. Federal Reserve Board (Fed) was a dominant theme in the 12-month period. There was a steady rotation into high growth stocks and out of the defensive stocks during the 12-month period. High momentum speculative stocks, especially microcap growth stocks in biotechnology and Internet/cloud software industries, became overpriced. Several global events including increasing challenges in China, concerns about Ukraine and the statement by new Fed Chair Janet Yellen about slowly ending the tapering program sobered the market.
Portfolio Review
With concerns about the high and unsustainable valuations in the high momentum speculative stocks, especially microcap growth stocks in biotechnology and Internet/cloud software industries, we underweighted these areas in the Fund’s portfolio.
The Fund was slightly underweight the Information Technology sector, however we liked the attractive valuations and sustainable growth and cash flow characteristics of this sector. Stock selection in the sector detracted from performance because the Fund did not hold the high momentum speculative stocks in the software-as-a-service (SaaS) area. Stocks that contributed to performance in the sector were Interactive Corp., Open Text Corp. and FEI Company. Interactive Corp and Open Text Corp. were sold when the companies’ market capitalization exceeded the Fund’s market cap limits. Two of the Fund’s cloud-based services providers, Solar Winds Inc. and Ixia, were among the biggest detractors to performance. They declined due to margin pressures from rising competition after solid performance the previous few years. Semtech Corp. and Ultratech, Inc., two of the Fund’s holdings in the semiconductor area declined, primarily from lack of capital spending that had been anticipated as the economy improved. Both stocks were sold due to lack of catalysts. Euronet Worldwide, Inc., Arris Group, Inc., Finisar Corp. and Ciena Corp. were added to the Fund’s portfolio.
Management’s Discussion of Fund Performance (Unaudited) (Continued)
The Fund is slightly overweight to the Consumer Discretionary sector, and stock selection contributed to performance in this sector. The strongest performers included Caesars Acquisition Co.,Thor Industries Inc. and Lithia Motors. The Fund’s position in Caesars Acquisition was sold as it met its tactical investment objective of capitalizing on a rights offering. Thor and Lithia benefited as the auto industry showed promise due to high pent-up demand. Cabela’s Inc. detracted from performance, hurt by industry-wide underperformance among specialty retailers. The Fund was underweight to the Consumer Staples sector due to lack of growth prospects in the small-cap universe.
The Fund was under weight to the Health Care sector, especially in emerging biopharmaceuticals, and underperformed the benchmark for the period. Although hurt by emerging biopharmaceuticals, the Fund did well in its stock selection in specialty pharmaceuticals. Stocks that contributed to performance were Jazz Pharmaceuticals PLC, Santarus, Inc. and Salix Pharmaceuticals, Inc. Salix acquired Santarus and the market rewarded them both. All three of these stocks were sold as they exceeded the Fund’s small-cap market caplimit. The Fund’s biopharmaceutical holdings ISIS Pharmaceuticals, Inc. and United Therapeutics Corp. also outperformed for the period. These stocks were sold as they exceeded the Fund’s market cap limit. Positions continued to be added to the Fund to selectively take advantage of key growth areas of biotechnology, specialty pharmaceuticals and medical devices. A position in DexCom, Inc. was added and then trimmed back after a run up. Positions were also initiated in Cardiovascular Systems, Inc. and Globus Medical, Inc.
The Fund is overweight to the Energy sector, which contributed to performance. Matrix Service Company and Carrizo Oil & Gas, Inc. were both top contributors. Energy XXI acquired and merged with EPL Oil & Gas, Inc. We took profits and eliminated the Fund’s position in Western Refining, Inc. because we believe the growth prospects have peaked as the Brent/Western Texas Intermediate spread has steadied. We initiated a Fund position in Diamondback Energy, Inc. as we believe it is a promising emerging play in the Permian basin. We like exploration and production companies with rapidly rising production output benefiting from earlier capital spending. The Fund also remains overweight to the Financials sector, which contributed to performance. In our view, the steep yield curve, better credit standards and declining delinquencies support this attractively valued sector.
The Fund was underweight to the Industrials sector, which was a detractor to performance. Although the Fund is also underweight to the Materials sector, major contributors to outperformance were stock selection of KapStone Paper and Packaging Corp., concentration in the packaging industry and avoidance of commodity-based companies. The Fund does not hold any positions in the Telecommunication Services and Utilities sectors.
Outlook
The U.S. economy is beginning to see an improvement, reflected by most of the leading economic indicators (LEIs) and the likelihood of improvement in others, as the record-breaking cold and snow come to an end. We believe another indication of an improving economic outlook is the recent acceleration of credit growth in the economy. The Fed’s monetary policy remained accommodative, maintaining its quantitative easing program and low Federal Funds rate which will likely continue until inflation becomes a threat. China is opening state coffers for stimulus, Japan is experimenting with record monetary stimulus and the Europeans may be finally developing serious monetary injections. These all provide a positive economic backdrop.
We believe many of the high momentum speculative stocks still look expensive with questionable prospects of earnings in 2014. Economic recovery in the U.S. and Europe is continuing and the overall market is moving ahead based on reasonable fundamentals. We continue to look for growth at a sensible price.
There are several specific economic drivers that make us optimistic that growth will continue in 2014. First, the housing glut has decreased and housing starts have climbed from their low of 400,000-500,000 up to one million. This is an improvement, but more is needed to return to the typical 1.5 million starts per year. Additionally,
Management’s Discussion of Fund Performance (Unaudited) (Continued)
commercial real estate is now the oldest it has been since 1960, according to J.P. Morgan, and it appears new construction is in the works. The average age of the U.S. auto fleet is 11 years, the oldest on record. Car sales have improved and should continue to provide strength to the economy. Industrial equipment is also aging and is the oldest it has been since the end of the Great Depression in 1938. In our opinion, we are overdue for a capital expenditure rebound. Finally, the U.S. energy boom is adding jobs as we set new all-time production records.
This economic strength is reflected in the markets. For example, in 2013 we observed the net profit margin on the S&P 500 was an all-time record; yields for corporate borrowers are at or near record lows and banks have become more willing to lend. Forward indicators such as the LEIs and Purchasing Manager surveys point to continued economic expansion. Consequently, we are optimistic the markets can be positive this year, with one important caveat. There are some pockets of stocks that rose so strongly last year they are bound to fall back at some point, and that could cast a temporary shadow over the whole market. Small-cap biotech is one example. This group outperformed the broader market in 2013 to such an extent that we feel many of those stock prices are unsustainable. If they do retrench, they may pull the broader market down as well, at least temporarily. That concern aside, however, we retain the Fund’s cyclical exposure to participate in the hoped-for market upswing that normally accompanies strong economic conditions such as we currently see.
Earnings and company guidance will be important as we make the much-needed transition away from the Fed stimulus. Rather than relying on Fed liquidity to drive markets higher, we believe investors will attach a much greater weight to the direction of the economy, earnings and the prospects of consumer spending recovery following the extremely cold winter. In our opinion, business capital spending expansion is critical for sustained growth in the global economies.
Longer term, one of the major uncertainties is whether the market will continue to remain at all-time highs as stimulus is slowly withdrawn. Currently, it appears the economy is picking up steadily but there are more important questions outside of the U.S. economy that need to be resolved. With a significant portion of S&P 500 revenues coming from overseas, will corporate profits be able to weather weakness in other parts of the globe? Similarly, will China’s economic slowdown take place gradually and see a soft-landing or, more abruptly with a hard-landing, as many analysts fear?
These economic drivers lend strength to the markets as we look for specific opportunities to take advantage of in these growth areas.
Management’s Discussion of Fund Performance (Unaudited) (Continued)
Comparison of the Change in Value of a $10,000 Investment in the
Touchstone Small Cap Growth Fund - Class A*, Russell 2000® Value Index,
Russell Microcap® Value Index and the Russell 2000® Growth Index
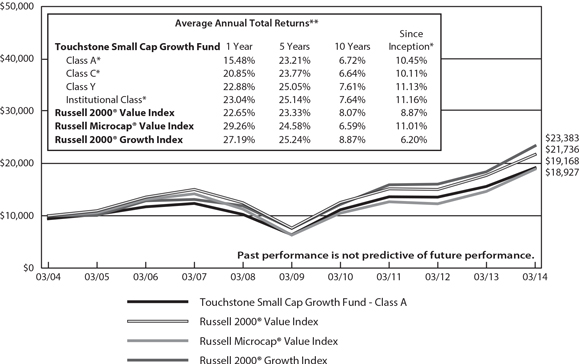
| * | The chart above represents performance of Class A shares only, which will vary from the performance of Class C shares, Class Y shares and Institutional Class shares based on the differences in loads and fees paid by shareholders in the different classes. Class A shares and Class C shares commenced operations on August 13, 2001, Class Y shares commenced operations on February 1, 1998 and Institutional Class shares commenced operations on September 10, 2012. The Class A and Class C shares performance information was calculated using the historical performance of Class Y shares for periods prior to August 13, 2001 and Institutional Class shares performance information was calculated using the historical performance of Class Y shares for periods prior to September 10, 2012. The returns have been restated for sales charges and for fees applicable to Class A, Class C and Institutional Class shares. The Russell 2000® Value Index's and the Russell 2000® Growth Index's returns are based on the inception date of the Fund. The Russell Microcap® Value Index's returns are based on July 3, 2000, the inception date of the Index. |
| ** | The average annual total returns shown above are adjusted for maximum applicable sales charges. The maximum offering price per share of Class A shares is equal to the net asset value (“NAV”) per share plus a sales load equal to 6.10% of the NAV (or 5.75% of the offering price). Class C shares are subject to a contingent deferred sales charge (“CDSC”) of 1.00% that will be assessed on an amount equal to the lesser of (1) the NAV at the time of purchase of the shares being redeemed or (2) the NAV of such shares being redeemed if redeemed within a one-year period from date of purchase. Class Y shares and Institutional Class shares are not subject to sales charges. |
The performance of the above Fund does not reflect the deduction of taxes that a shareholder would pay on Fund distributions or the redemption of Fund shares.
Notes to Chart
The Russell 2000® Value Index measures the performance of those Russell 2000® companies with lower price-to-book ratios and lower forecasted growth values.
The Russell Microcap® Value Index measures the performance of those Russell Microcap® companies with lower price-to-book ratios and lower forecasted growth values.
The Russell 2000® Growth Index measures the performance of those Russell 2000® companies with higher price-to-book ratios and higher forecasted growth values.
Tabular Presentation of Portfolios of Investments (Unaudited)
March 31, 2014
The tables below provide each Fund’s sector allocation and, in the case of Touchstone Flexible Income Fund, its credit quality. We hope it will be useful to shareholders as it summarizes key information about each Fund’s investments.
| Touchstone Flexible Income Fund |
| Credit Quality* | | (% of Fixed Income Securities) | |
| AAA/Aaa | | | 7.6 | % |
| AA/Aa | | | 32.1 | |
| A/A | | | 14.4 | |
| BBB/Baa | | | 33.0 | |
| BB/Ba | | | 5.3 | |
| B/B | | | 4.8 | |
| CCC/Caa | | | 1.6 | |
| NR | | | 1.2 | |
| | | | 100.0 | % |
| | | | | |
| Credit Quality* | | | (% of Preferred Stocks) | |
| A/A | | | 8.9 | % |
| BBB/Baa | | | 54.5 | |
| BB/Ba | | | 30.5 | |
| B/B | | | 1.7 | |
| NR | | | 4.4 | |
| | | | 100.0 | % |
| | | | | |
| Sector Allocation** | | | (% of Net Assets) | |
| Fixed Income Securities | | | 54.1 | % |
| Preferred Stocks | | | 32.0 | |
| Common Stocks | | | | |
| Health Care | | | 2.1 | |
| Financials | | | 1.8 | |
| Utilities | | | 1.3 | |
| Energy | | | 1.2 | |
| Industrials | | | 1.1 | |
| Materials | | | 1.0 | |
| Information Technology | | | 0.8 | |
| Consumer Discretionary | | | 0.5 | |
| Telecommunication Services | | | 0.3 | |
| Investment Funds | | | 2.0 | |
| Other Assets/Liabilities (Net) | | | 1.8 | |
| Total | | | 100.0 | % |
| Touchstone Focused Fund |
| Sector Allocation** | | | (% of Net Assets) | |
| Financials | | | 16.6 | % |
| Industrials | | | 14.7 | |
| Information Technology | | | 14.3 | |
| Consumer Staples | | | 12.3 | |
| Health Care | | | 10.9 | |
| Consumer Discretionary | | | 9.0 | |
| Energy | | | 8.2 | |
| Telecommunication Services | | | 6.0 | |
| Materials | | | 4.2 | |
| Investment Funds | | | 9.4 | |
| Other Assets/Liabilities (Net) | | | (5.6 | ) |
| Total | | | 100.0 | % |
| Touchstone Growth Opportunities Fund |
| Sector Allocation** | | | (% of Net Assets) | |
| Information Technology | | | 26.4 | % |
| Health Care | | | 18.7 | |
| Consumer Discretionary | | | 13.1 | |
| Industrials | | | 12.1 | |
| Financials | | | 8.4 | |
| Energy | | | 6.9 | |
| Consumer Staples | | | 6.6 | |
| Materials | | | 6.3 | |
| Investment Fund | | | 1.0 | |
| Other Assets/Liabilities (Net) | | | 0.5 | |
| Total | | | 100.0 | % |
| * | Credit quality may be rated by Standard & Poor's, Moody's and Fitch. If all three agencies rate the bond, the middle or common rating is used; if two of the agencies rate the bond, the lower rating is used; if one agency rates the bond, that rating is used, if none of the agencies rate the bond, the bond will be classified as not-rated. |
| ** | Sector classifications are based upon the Global Industry Classification Standard (GICS®). |
Tabular Presentation of Portfolios of Investments (Unaudited) (Continued)
| Touchstone International Value Fund |
| Sector Allocation* | | (% of Net Assets) | |
| Financials | | | 31.1 | % |
| Industrials | | | 14.5 | |
| Health Care | | | 12.7 | |
| Consumer Discretionary | | | 9.6 | |
| Consumer Staples | | | 9.4 | |
| Energy | | | 6.8 | |
| Materials | | | 5.8 | |
| Utilities | | | 4.8 | |
| Telecommunication Services | | | 2.2 | |
| Information Technology | | | 2.0 | |
| Investment Funds | | | 2.6 | |
| Other Assets/Liabilities (Net) | | | (1.5 | ) |
| Total | | | 100.0 | % |
| Touchstone Mid Cap Growth Fund |
| Sector Allocation* | | (% of Net Assets) | |
| Industrials | | | 21.2 | % |
| Consumer Discretionary | | | 19.4 | |
| Health Care | | | 15.9 | |
| Information Technology | | | 13.5 | |
| Materials | | | 8.7 | |
| Financials | | | 8.1 | |
| Consumer Staples | | | 6.9 | |
| Energy | | | 5.8 | |
| Investment Funds | | | 1.1 | |
| Other Assets/Liabilities (Net) | | | (0.6 | ) |
| Total | | | 100.0 | % |
| Touchstone Large Cap Growth Fund |
| Sector Allocation* | | (% of Net Assets) | |
| Health Care | | | 30.3 | % |
| Information Technology | | | 26.3 | |
| Industrials | | | 17.1 | |
| Consumer Discretionary | | | 9.5 | |
| Consumer Staples | | | 5.0 | |
| Financials | | | 4.4 | |
| Materials | | | 4.1 | |
| Utilities | | | 2.2 | |
| Investment Funds | | | 5.3 | |
| Other Assets/Liabilities (Net) | | | (4.2 | ) |
| Total | | | 100.0 | % |
| Touchstone Small Cap Growth Fund |
| Sector Allocation* | | (% of Net Assets) | |
| Information Technology | | | 20.6 | % |
| Health Care | | | 19.1 | |
| Consumer Discretionary | | | 16.5 | |
| Industrials | | | 14.9 | |
| Financials | | | 13.5 | |
| Energy | | | 5.3 | |
| Materials | | | 3.3 | |
| Consumer Staples | | | 1.3 | |
| Investment Funds | | | 13.1 | |
| Other Assets/Liabilities (Net) | | | (7.6 | ) |
| Total | | | 100.0 | % |
* Sector classifications are based upon the Global Industry Classification Standard (GICS®).
Portfolio of Investments
Touchstone Flexible Income Fund – March 31, 2014
| Principal | | | | | Market | |
| Amount(A) | | | | | Value | |
| | | | | | | |
| | | | | Corporate Bonds— 29.6% | | | | |
| | | | | | | | | |
| | | | | Financials — 16.1% | | | | |
| $ | 375,000 | | | American Financial Group, Inc., | | | | |
| | | | | 9.875%, 6/15/19 | | $ | 482,941 | |
| | 2,000,000 | | | American Tower Corp., | | | | |
| | | | | 4.500%, 1/15/18 | | | 2,156,874 | |
| | 1,800,000 | | | Barclays PLC, 8.250%, 12/29/49(B) | | | 1,890,000 | |
| | 1,240,000 | | | BioMed Realty LP, 3.850%, 4/15/16 | | | 1,304,523 | |
| | 750,000 | | | Charles Schwab Corp. (The), | | | | |
| | | | | 7.000%, 2/28/49(B) | | | 855,000 | |
| | 1,100,000 | | | Credit Suisse Group Guernsey I Ltd., | | | | |
| | | | | 7.875%, 2/24/41(B) | | | 1,193,500 | |
| | 2,101,000 | | | DDR Corp. MTN, 7.500%, 7/15/18 | | | 2,497,786 | |
| | 2,666,623 | | | Doric Nimrod Air Finance Alpha Ltd. | | | | |
| | | | | 2012-1 Class B Pass Through Trust, | | | | |
| | | | | 144a, 6.500%, 5/30/21 | | | 2,810,823 | |
| | 1,850,000 | | | Export-Import Bank of Korea, | | | | |
| | | | | 4.375%, 9/15/21 | | | 1,981,085 | |
| | 1,650,000 | | | Ford Motor Credit Co. LLC, | | | | |
| | | | | 4.250%, 2/3/17 | | | 1,771,625 | |
| | 3,900,000 | | | General Electric Capital Corp., Ser A, | | | | |
| | | | | 7.125%, 12/15/49(B) | | | 4,446,000 | |
| | 1,550,000 | | | JPMorgan Chase & Co., | | | | |
| | | | | 6.750%, 8/29/49(B) | | | 1,631,375 | |
| | 2,050,000 | | | JPMorgan Chase & Co., | | | | |
| | | | | 7.900%, 4/29/49(B) | | | 2,316,500 | |
| | 1,850,000 | | | M&T Bank Corp., 6.450%, 12/29/49(B) | | | 1,919,375 | |
| | 2,500,000 | | | PNC Financial Services Group, Inc., | | | | |
| | | | | 4.454%, 5/29/49(B) | | | 2,507,500 | |
| | 1,625,000 | | | PNC Financial Services Group, Inc., | | | | |
| | | | | 6.750%, 7/29/49(B) | | | 1,771,250 | |
| | 2,350,000 | | | Prudential Financial, Inc., | | | | |
| | | | | 5.875%, 9/15/42(B) | | | 2,452,812 | |
| | 4,175,000 | | | Wells Fargo & Co., Ser K, | | | | |
| | | | | 7.980%, 3/29/49(B) | | | 4,743,844 | |
| | | | | | | | 38,732,813 | |
| | | | | | | | | |
| | | | | Industrials — 6.9% | | | | |
| | 2,115,000 | | | Asciano Finance Ltd., 144a, | | | | |
| | | | | 5.000%, 4/7/18 | | | 2,271,125 | |
| | 2,000,000 | | | B/E Aerospace, Inc., 5.250%, 4/1/22 | | | 2,057,500 | |
| | 3,075,000 | | | Continental Airlines 2012-2 Class A | | | | |
| | | | | Pass Through Trust, | | | | |
| | | | | 4.000%, 10/29/24 | | | 3,105,750 | |
| | 2,752,336 | | | Delta Air Lines 2002-1 Class G-1 Pass | | | | |
| | | | | Through Trust, 6.718%, 1/2/23 | | | 3,192,710 | |
| | 1,750,000 | | | Hutchison Whampoa International 11 | | | | |
| | | | | Ltd., 144a, 3.500%, 1/13/17 | | | 1,838,490 | |
| | 2,145,000 | | | Stanley Black & Decker, Inc., | | | | |
| | | | | 5.750%, 12/15/53(B) | | | 2,300,512 | |
| | 1,743,994 | | | US Airways 2012-2 Class A Pass | | | | |
| | | | | Through Trust, 4.625%, 6/3/25 | | | 1,826,834 | |
| | | | | | | | 16,592,921 | |
| | | | | | | | | |
| | | | | Energy — 2.8% | | | | |
| | 2,450,000 | | | DCP Midstream LLC, 144a, | | | | |
| | | | | 5.850%, 5/21/43(B) | | | 2,303,000 | |
| | 1,800,000 | | | Enbridge Energy Partners LP, | | | | |
| | | | | 4.200%, 9/15/21 | | | 1,863,518 | |
| | 1,500,000 | | | Kinder Morgan Energy Partners LP, | | | | |
| | | | | 3.950%, 9/1/22 | | | 1,492,062 | |
| | 1,000,000 | | | Petroleos Mexicanos, 5.500%, 1/21/21 | | | 1,092,500 | |
| | | | | | | | 6,751,080 | |
| | | | | | | | | |
| | | | | Consumer Discretionary — 1.9% | | | | |
| | 1,250,000 | | | Dana Holding Corp., 6.500%, 2/15/19 | | | 1,334,375 | |
| | 970,000 | | | MGM Resorts International, | | | | |
| | | | | 4.250%, 4/15/15 | | | 1,411,956 | |
| | 250,000 | | | United States Cellular Corp., | | | | |
| | | | | 6.700%, 12/15/33 | | | 253,362 | |
| | 1,464,000 | | | Visteon Corp., 6.750%, 4/15/19 | | | 1,539,030 | |
| | | | | | | | 4,538,723 | |
| | | | | | | | | |
| | | | | Utilities — 1.1% | | | | |
| | 1,000,000 | | | NextEra Energy Capital Holdings, Inc., | | | | |
| | | | | 6.650%, 6/15/67(B) | | | 1,007,500 | |
| | 875,000 | | | SSE PLC MTN (GBP), 5.453%, 9/29/49(B) | | | 1,503,603 | |
| | | | | | | | 2,511,103 | |
| | | | | | | | | |
| | | | | Materials — 0.8% | | | | |
| | 2,000,000 | | | Freeport-Mcmoran Copper & Gold, | | | | |
| | | | | Inc., 3.550%, 3/1/22 | | | 1,910,038 | |
| | | | | Total Corporate Bonds | | $ | 71,036,678 | |
| | | | | | | | | |
| | | | | Sovereign Government Obligations — 9.2% | | | | |
| | 67,320,000 | | | Mexican Bonos (MXN), | | | | |
| | | | | 6.250%, 6/16/16 | | | 5,395,877 | |
| | 4,300,000 | | | New Zealand Government Bond | | | | |
| | | | | (NZD), 6.000%, 12/15/17 | | | 3,977,761 | |
| | 7,500,000 | | | Poland Government Bond (PLN), | | | | |
| | | | | 5.000%, 4/25/16 | | | 2,577,551 | |
| | 3,700,000 | | | Province of British Columbia (CAD), | | | | |
| | | | | 5.300%, 6/18/14 | | | 3,377,191 | |
| | 850,000 | | | Province of New Brunswick Canada | | | | |
| | | | | (CAD), 4.300%, 12/3/15 | | | 808,526 | |
| | 4,500,000 | | | Province of Ontario Canada (CAD), | | | | |
| | | | | 1.900%, 9/8/17 | | | 4,099,701 | |
| | 1,800,000 | | | South Australian Government | | | | |
| | | | | Financing Authority (AUD), | | | | |
| | | | | 5.750%, 9/20/17 | | | 1,797,352 | |
| | | | | Total Sovereign Government | | | | |
| | | | | Obligations | | $ | 22,033,959 | |
| | | | | | | | | |
| | | | | Agency Collateralized Mortgage | | | | |
| | | | | Obligations — 5.3% | | | | |
| | 803,408 | | | FHLMC REMIC, Ser 2638 Class ST, | | | | |
| | | | | 7.495%, 2/15/18(B)(C) | | | 13,934 | |
| | 2,638,052 | | | FHLMC REMIC, Ser 3199 Class DS, | | | | |
| | | | | 6.995%, 8/15/36(B)(C) | | | 482,718 | |
| | 3,301,741 | | | FNMA REMIC, Ser 2008-60 Class SA, | | | | |
| | | | | 6.346%, 7/25/38(B)(C) | | | 498,847 | |
Touchstone Flexible Income Fund (Continued)
| Principal | | | | | Market | |
| Amount(A) | | | | | Value | |
| | | | | | | |
| | | | | Agency Collateralized Mortgage | | | | |
| | | | | Obligations — 5.3% (Continued) | | | | |
| $ | 12,374,134 | | | GNMA, Ser 2010-66 Class IO, | | | | |
| | | | | 1.101%, 6/16/52(B)(C) | | $ | 567,639 | |
| | 14,098,514 | | | GNMA, Ser 2011-126 Class IO, | | | | |
| | | | | 1.575%, 4/16/53(B)(C) | | | 1,007,973 | |
| | 8,287,272 | | | GNMA, Ser 2011-64 Class IX, | | | | |
| | | | | 0.703%, 10/16/44(B)(C) | | | 450,944 | |
| | 14,213,304 | | | GNMA, Ser 2011-78, Class IX, | | | | |
| | | | | 1.193%, 8/16/46(B)(C) | | | 862,222 | |
| | 5,073,623 | | | GNMA, Ser 2011-83, Class NI, | | | | |
| | | | | 4.500%, 10/16/37(C) | | | 620,827 | |
| | 28,173,337 | | | GNMA, Ser 2012-22, Class IO, | | | | |
| | | | | 1.591%, 10/16/53(B)(C) | | | 2,088,912 | |
| | 12,478,385 | | | GNMA, Ser 2012-27 Class IO, | | | | |
| | | | | 1.291%, 4/16/53(B)(C) | | | 829,126 | |
| | 19,319,519 | | | GNMA, Ser 2012-33 Class IO, | | | | |
| | | | | 1.342%, 6/16/52(B)(C) | | | 1,322,556 | |
| | 16,628,865 | | | GNMA, Ser 2012-46 Class IO, | | | | |
| | | | | 1.390%, 9/16/53(B)(C) | | | 1,126,522 | |
| | 15,060,972 | | | GNMA, Ser 2012-67 Class IO, | | | | |
| | | | | 1.506%, 10/16/53(B)(C) | | | 1,208,929 | |
| | 9,763,998 | | | GNMA, Ser 2012-86 Class IO, | | | | |
| | | | | 1.286%, 12/16/53(B)(C) | | | 730,728 | |
| | 12,986,008 | | | GNMA, Ser 2014-31, Class IO, | | | | |
| | | | | 1.046%, 9/16/55(B)(C) | | | 916,358 | |
| | | | | Total Agency Collateralized | | | | |
| | | | | Mortgage Obligations | | $ | 12,728,235 | |
| | | | | | | | | |
| | | | | Commercial Mortgage-Backed Securities — 4.6% | | | | |
| | 2,300,000 | | | Bear Stearns Commercial Mortgage | | | | |
| | | | | Securities Trust 2005-PWR8, Ser | | | | |
| | | | | 2005-PWR8, Class AJ, | | | | |
| | | | | 4.750%, 6/11/41 | | | 2,374,193 | |
| | 9,528,761 | | | FHLMC Multifamily Structured Pass | | | | |
| | | | | Through Certificates, Ser K006 Class | | | | |
| | | | | AX1, 1.043%, 1/25/20(B)(C) | | | 463,088 | |
| | 1,575,000 | | | JP Morgan Chase Commercial | | | | |
| | | | | Mortgage Securities Trust, Ser | | | | |
| | | | | 2005-LDP3, Class C, | | | | |
| | | | | 5.094%, 8/15/42(B) | | | 1,613,691 | |
| | 815,251 | | | Morgan Stanley Mortgage Loan Trust | | | | |
| | | | | Ser 2004-7AR, Class 2A6, | | | | |
| | | | | 2.465%, 9/25/34(B) | | | 811,851 | |
| | 2,530,000 | | | Mortgage Pass Through Certificates, | | | | |
| | | | | Ser 2001-CIB2, Class D, | | | | |
| | | | | 6.847%, 4/15/35(B) | | | 2,584,565 | |
| | 672,488 | | | Nomura Asset Acceptance Corp. | | | | |
| | | | | Alternative Loan Trust Series | | | | |
| | | | | 2005-AR4, 4.186%, 8/25/35(B) | | | 659,024 | |
| | 2,375,000 | | | Wachovia Bank Commercial Mortgage | | | | |
| | | | | Trust Series 2006-C23, | | | | |
| | | | | 5.466%, 1/15/45(B) | | | 2,548,819 | |
| | | | | Total Commercial | | | | |
| | | | | Mortgage-Backed Securities | | $ | 11,055,231 | |
| | | | | | | | | |
| | | | | Asset-Backed Securities — 2.0% | | | | |
| | 1,085,179 | | | Conseco Financial Corp., Ser 1998-4, | | | | |
| | | | | Class A7, 6.870%, 4/1/30(B) | | | 1,150,347 | |
| | 1,023,261 | | | Countrywide Asset-Backed | | | | |
| | | | | Certificates, Ser 2007-1, Class 2A2, | | | | |
| | | | | 0.254%, 7/25/37(B) | | | 977,987 | |
| | 930,000 | | | Ford Credit Auto Owner Trust 2013-A, | | | | |
| | | | | 1.860%, 8/15/19 | | | 921,772 | |
| | 830,128 | | | Mid-State Capital Corp. Trust, Ser | | | | |
| | | | | 2005-1, Class M2, 7.079%, 1/15/40 | | | 888,484 | |
| | 794,229 | | | RAMP Trust, Ser 2003-RZ5, Class A7, | | | | |
| | | | | 5.470%, 9/25/33(D) | | | 820,560 | |
| | | | | Total Asset-Backed Securities | | $ | 4,759,150 | |
| | | | | | | | | |
| | | | | U.S. Government Mortgage-Backed | | | | |
| | | | | Obligations — 1.4% | | | | |
| | 49,586 | | | FHLMC, Pool #972110, | | | | |
| | | | | 2.350%, 10/1/32(B) | | | 50,312 | |
| | 135,741 | | | FHLMC, Pool #G03170, 6.500%, 8/1/37 | | | 152,070 | |
| | 164,372 | | | FHLMC, Pool #G12780, 6.500%, 9/1/22 | | | 185,024 | |
| | 23,582 | | | FNMA, Pool #738900, | | | | |
| | | | | 2.560%, 7/1/18(B) | | | 23,664 | |
| | 205,847 | | | FNMA, Pool #844415, 5.500%, 10/1/35 | | | 226,908 | |
| | 1,055,641 | | | FNMA, Pool #AB1952, 4.000%, 12/1/40 | | | 1,101,154 | |
| | 769,922 | | | FNMA, Pool #AB1953, 4.000%, 12/1/40 | | | 802,436 | |
| | 894,464 | | | FNMA, Pool #AB3387, 4.000%, 8/1/41 | | | 931,812 | |
| | | | | Total U.S. Government | | | | |
| | | | | Mortgage-Backed Obligations | | $ | 3,473,380 | |
| | | | | | | | | |
| | | | | U.S. Treasury Obligation — 1.3% | | | | |
| | 3,000,000 | | | U.S. Treasury Note, 2.750%, 11/15/23 | | | 3,013,593 | |
| | | | | | | | | |
| | | | | Non-Agency Collateralized Mortgage | | | | |
| | | | | Obligations — 0.7% | | | | |
| | 214,089 | | | Bear Stearns Asset Backed Securities | | | | |
| | | | | Trust, Ser 2003-AC7, Class A2, | | | | |
| | | | | 5.750%, 1/25/34(D) | | | 223,329 | |
| | 566,043 | | | Countrywide Alternative Loan Trust, | | | | |
| | | | | Ser 2004-30CB, Class 3A1, | | | | |
| | | | | 5.000%, 2/25/20 | | | 579,702 | |
| | 8,529 | | | Merrill Lynch Mortgage Investors, Inc., | | | | |
| | | | | Ser 2003-A1, Class 2A, | | | | |
| | | | | 2.188%, 12/25/32(B) | | | 8,810 | |
| | 394,817 | | | RALI Trust, Series 2004-QS6 Class A1, | | | | |
| | | | | 5.000%, 5/25/19 | | | 401,539 | |
| | 424,366 | | | Wells Fargo Mortgage Backed | | | | |
| | | | | Securities Trust, Ser 2004-X Class | | | | |
| | | | | 1A5, 2.617%, 11/25/34(B) | | | 430,392 | |
| | | | | Total Non-Agency Collateralized | | | | |
| | | | | Mortgage Obligations | | $ | 1,643,772 | |
Touchstone Flexible Income Fund (Continued)
| | | | | | Market | |
| Shares | | | | | Value | |
| | | | | | | |
| | | | | Preferred Stocks— 32.0% | | | | |
| | | | | | | | | |
| | | | | Financials — 24.1% | | | | |
| | 38,000 | | | Aegon N.V. (Netherlands), 6.38% | | $ | 976,980 | |
| | 54,000 | | | Alexandria Real Estate Equities, Inc., | | | | |
| | | | | Ser E REIT, 6.45% | | | 1,341,360 | |
| | 36,900 | | | Allstate Corp. (The), 6.75% | | | 933,939 | |
| | 71,500 | | | American Capital Agency Corp., 8.00% | | | 1,879,020 | |
| | 79,250 | | | American Financial Group, Inc., 7.00% | | | 2,050,198 | |
| | 107,000 | | | Arch Capital Group Ltd., Ser C | | | | |
| | | | | (Bermuda), 6.75% | | | 2,687,840 | |
| | 96,750 | | | Aviva PLC (United Kingdom), 8.25% | | | 2,676,105 | |
| | 53,450 | | | Citigroup Capital XIII, 7.88%(B) | | | 1,482,703 | |
| | 46,000 | | | Citigroup, Inc., 6.88%(B) | | | 1,199,220 | |
| | 50,000 | | | Corporate-Backed Trust Certificates, | | | | |
| | | | | Ser AIG, 6.13% | | | 1,234,000 | |
| | 44,600 | | | Countrywide Capital IV, 6.75% | | | 1,130,610 | |
| | 93,629 | | | Countrywide Capital V, 7.00% | | | 2,387,540 | |
| | 110,600 | | | Digital Realty Trust, Inc., Ser E REIT, | | | | |
| | | | | 7.00% | | | 2,695,322 | |
| | 35,700 | | | Duke Realty Corp. REIT, 6.50% | | | 867,153 | |
| | 142,555 | | | Endurance Specialty Holdings Ltd., Ser | | | | |
| | | | | B (Bermuda), 7.50% | | | 3,730,664 | |
| | 1,000 | | | First Tennessee Bank NA, 144a, | | | | |
| | | | | 3.75%(B) | | | 690,312 | |
| | 66,880 | | | Kimco Realty Corp., Ser H REIT, 6.90% | | | 1,723,498 | |
| | 80,000 | | | Kimco Realty Corp., Ser I REIT, 6.00% | | | 1,816,000 | |
| | 87,000 | | | Lloyds Banking Group PLC (United | | | | |
| | | | | Kingdom), 7.75% | | | 2,331,600 | |
| | 43,779 | | | Merrill Lynch Preferred Capital Trust III, | | | | |
| | | | | 7.00% | | | 1,111,987 | |
| | 96,000 | | | Morgan Stanley, 6.88%(B) | | | 2,488,320 | |
| | 29,000 | | | Morgan Stanley, 7.13%(B) | | | 769,370 | |
| | 21,000 | | | PNC Financial Services Group, Inc., Ser | | | | |
| | | | | P, 6.13%(B) | | | 560,910 | |
| | 46,000 | | | PS Business Parks, Inc., Ser S REIT, | | | | |
| | | | | 6.45% | | | 1,106,300 | |
| | 67,000 | | | PS Business Parks, Inc., Ser U REIT, | | | | |
| | | | | 5.75% | | | 1,434,470 | |
| | 30,000 | | | Public Storage, Ser P REIT, 6.35% | | | 756,300 | |
| | 72,000 | | | Public Storage REIT, 5.90% | | | 1,703,520 | |
| | 62,925 | | | Public Storage REIT, 6.50% | | | 1,615,914 | |
| | 82,800 | | | Realty Income Corp., Ser F REIT, 6.63% | | | 2,085,732 | |
| | 88,000 | | | Regency Centers Corp., Ser 6 REIT, | | | | |
| | | | | 6.63% | | | 2,094,400 | |
| | 28,500 | | | Stifel Financial Corp., 6.70% | | | 741,285 | |
| | 57,575 | | | US Bancorp, Ser F, 6.50%(B) | | | 1,635,130 | |
| | 78,400 | | | US Bancorp, Ser G, 6.00%(B) | | | 2,152,080 | |
| | 119,275 | | | Vornado Realty LP REIT, 7.88% | | | 3,077,295 | |
| | 26,000 | | | Vornado Realty Trust, Ser J REIT, 6.88% | | | 670,540 | |
| | | | | | | | 57,837,617 | |
| | | | | | | | | |
| | | | | Utilities — 5.1% | | | | |
| | 35,000 | | | Alabama Power Co., 6.45% | | | 917,000 | |
| | 44,000 | | | Dominion Resources, Inc. VA, 6.13% | | | 2,530,000 | |
| | 31,000 | | | DTE Energy Co., 6.50% | | | 790,500 | |
| | 21,000 | | | Entergy Louisiana LLC, 6.00% | | | 526,680 | |
| | 20,000 | | | Entergy Louisiana LLC, 5.88% | | | 495,200 | |
| | 84,000 | | | Entergy Mississippi, Inc., 6.00% | | | 2,110,920 | |
| | 20,000 | | | Georgia Power Co., Ser 07-A, 6.50% | | | 2,085,000 | |
| | 27,288 | | | Southern California Edison Co., | | | | |
| | | | | 5.07%(B) | | | 2,770,586 | |
| | | | | | | | 12,225,886 | |
| | | | | | | | | |
| | | | | Industrials — 1.9% | | | | |
| | 129,100 | | | Seaspan Corp. (Marshall Islands), | | | | |
| | | | | 9.50% | | | 3,560,578 | |
| | 13,650 | | | United Technologies Corp., 7.50%† | | | 908,680 | |
| | | | | | | | 4,469,258 | |
| | | | | | | | | |
| | | | | Consumer Discretionary — 0.9% | | | | |
| | 87,442 | | | Telephone & Data Systems, Inc., 6.88% | | | 2,217,529 | |
| | | | | Total Preferred Stocks | | $ | 76,750,290 | |
| | | | | | | | | |
| | | | | Common Stocks— 10.1% | | | | |
| | | | | | | | | |
| | | | | Health Care — 2.1% | | | | |
| | 8,793 | | | AstraZeneca PLC ADR | | | 570,491 | |
| | 23,612 | | | Covidien PLC (Iran) | | | 1,739,261 | |
| | 38,017 | | | Pfizer, Inc. | | | 1,221,106 | |
| | 37,458 | | | Roche Holding AG ADR | | | 1,412,916 | |
| | | | | | | | 4,943,774 | |
| | | | | | | | | |
| | | | | Financials — 1.8% | | | | |
| | 84,736 | | | Home Loan Servicing Solutions Ltd. | | | 1,830,298 | |
| | 70,177 | | | Starwood Property Trust, Inc. REIT | | | 1,655,475 | |
| | 93,142 | | | Two Harbors Investment Corp. REIT | | | 954,706 | |
| | | | | | | | 4,440,479 | |
| | | | | | | | | |
| | | | | Utilities — 1.3% | | | | |
| | 56,220 | | | PPL Corp. | | | 3,075,234 | |
| | | | | | | | | |
| | | | | Energy — 1.2% | | | | |
| | 37,087 | | | BP PLC ADR | | | 1,783,885 | |
| | 12,516 | | | Occidental Petroleum Corp. | | | 1,192,650 | |
| | | | | | | | 2,976,535 | |
| | | | | | | | | |
| | | | | Industrials — 1.1% | | | | |
| | 15,140 | | | Honeywell International, Inc. | | | 1,404,386 | |
| | 4,252 | | | Lockheed Martin Corp., | | | 694,096 | |
| | 6,829 | | | Ryder System, Inc. | | | 545,774 | |
| | | | | | | | 2,644,256 | |
| | | | | | | | | |
| | | | | Materials — 1.0% | | | | |
| | 6,965 | | | Eastman Chemical Co. | | | 600,453 | |
| | 6,923 | | | LyondellBasell Industries N.V. - Class A | | | 615,732 | |
| | 11,373 | | | Monsanto Co. | | | 1,293,906 | |
| | | | | | | | 2,510,091 | |
| | | | | | | | | |
| | | | | Information Technology — 0.8% | | | | |
| | 8,000 | | | QUALCOMM, Inc. | | | 630,880 | |
| | 22,275 | | | Xilinx, Inc. | | | 1,208,864 | |
| | | | | | | | 1,839,744 | |
| | | | | | | | | |
| | | | | Consumer Discretionary — 0.5% | | | | |
| | 32,531 | | | General Motors Co., | | | 1,119,717 | |
Touchstone Flexible Income Fund (Continued)
| | | | | | Market | |
| Shares | | | | | Value | |
| | | | | | | |
| | | | | Common Stocks — 10.1% (Continued) | | | | |
| | | | | | | | | |
| | | | | Telecommunication Services — 0.3% | | | | |
| | 17,530 | | | BCE, Inc. (Canada) | | $ | 756,244 | |
| | | | | Total Common Stocks | | $ | 24,306,074 | |
| | | | | | | | | |
| | | | | Investment Funds— 2.0% | | | | |
| | 135,400 | | | American Income Fund, Inc.± | | | 1,026,332 | |
| | 23,600 | | | Eaton Vance Tax-Advantaged | | | | |
| | | | | Dividend Income Fund± | | | 463,976 | |
| | 904,500 | | | Invesco Government & Agency | | | | |
| | | | | Portfolio, Institutional Class, | | | | |
| | | | | 0.02%**¥W | | | 904,500 | |
| | 2,507,785 | | | Touchstone Institutional Money | | | | |
| | | | | Market Fund, 0.01%^¥W | | | 2,507,785 | |
| | | | | Total Investment Funds | | $ | 4,902,593 | |
| | | | | | | | | |
| Total Investment Securities —98.2% | | | | |
| (Cost $232,718,950) | | $ | 235,702,955 | |
| | | | | | | | | |
| Other Assets in Excess of Liabilities — 1.8% | | | 4,281,202 | |
| | | | | | | | | |
| Net Assets — 100.0% | | $ | 239,984,157 | |
| (A) | Principal amount stated in U.S. dollars unless otherwise noted. |
| (B) | Variable rate security - Rate reflected is the rate in effect as of March 31, 2014. |
| (C) | Interest rate security. This type of security represents the right to receive the monthly interest payments on an underlying pool of mortgages. Payments of principal on the pool reduce the value of the “interest only” holding. |
| (D) | Step Bond - A bond that pays an initial interest rate for the first period and then a higher interest rate for the following periods until maturity. The interest rate shown reflects the rate in effect at March 31, 2014. |
| ** | Represents collateral for securities loaned. |
| ^ | Affiliated Fund. See Note 4 in Notes to Financial Statements. |
| † | All or a portion of the security is on loan. The total market value of the securities on loan as of March 31, 2014 was $898,695. |
| W | Represents the 7-day SEC yield as of March 31, 2014. |
Portfolio Abbreviations:
ADR - American Depositary Receipt
AUD - Australian Dollar
CAD - Canadian Dollar
FHLMC - Federal Home Loan Mortgage Association
FNMA - Federal National Mortgage Association
GBP - British Pound
GNMA - Government National Mortgage Association
JPY - Japanese Yen
LLC - Limited Liability Company
MTN - Medium Term Note
MXN - Mexican Peso
NOK - Norwegian Krone
NZD - New Zealand Dollar
PLC - Public Limited Company
PLN - Polish Zloty
REIT - Real Estate Investment Trust
REMIC - Real Estate Mortgage Investment Conduit
SEK - Swedish Krona
USD - United States Dollar
144a - This is a restricted security that was sold in a transaction qualifying for the exemption under Rule 144A of the Securities Act of 1933. This security may be sold in transactions exempt from registration, normally to qualified institutional buyers. At March 31, 2014, these securities were valued at $9,913,750 or 4.1% of net assets. These securities were deemed liquid pursuant to procedures approved by the Board of Trustees.
Touchstone Flexible Income Fund (Continued)
Other Information:
The inputs or methodology used for valuing securities may not be an indication of the risk associated with investing in those securities. For more information on valuation inputs, and their aggregation into the levels used in the table below, please refer to the security valuation section in the accompanying Notes to Financial Statements.
| Valuation inputs at Reporting Date: |
| Description | | Level 1 | | | Level 2 | | | Level 3 | | | Total | |
| Assets: | | | | | | | | | | | | | | | | |
| Corporate Bonds | | $ | — | | | $ | 71,036,678 | | | $ | — | | | $ | 71,036,678 | |
| Sovereign Government Obligations | | | — | | | | 22,033,959 | | | | — | | | | 22,033,959 | |
| Agency Collateralized Mortgage Obligations | | | — | | | | 12,728,235 | | | | — | | | | 12,728,235 | |
| Commercial Mortgage-Backed Securities | | | — | | | | 11,055,231 | | | | — | | | | 11,055,231 | |
| Asset-Backed Securities | | | — | | | | 4,759,150 | | | | — | | | | 4,759,150 | |
| U.S. Government Mortgage-Backed Obligations | | | — | | | | 3,473,380 | | | | — | | | | 3,473,380 | |
| U.S. Treasury Obligation | | | — | | | | 3,013,593 | | | | — | | | | 3,013,593 | |
| Non-Agency Collateralized Mortgage Obligations | | | — | | | | 1,643,772 | | | | — | | | | 1,643,772 | |
| Preferred Stocks | | | 76,750,290 | | | | — | | | | — | | | | 76,750,290 | |
| Common Stocks | | | 24,306,074 | | | | — | | | | — | | | | 24,306,074 | |
| Investment Funds | | | 4,902,593 | | | | — | | | | — | | | | 4,902,593 | |
| | | | | | | | | | | | | | | $ | 235,702,955 | |
Valuation inputs at Reporting Date:
| Description | | Level 1 | | | Level 2 | | | Level 3 | | | Total | |
| Other Financial Instruments*** | | | | | | | | | | | | | | | | |
| Assets: | | | | | | | | | | | | | | | | |
| Forward Currency Contracts | | $ | — | | | $ | 114,751 | | | $ | — | | | $ | 114,751 | |
| | | | | | | | | | | | | | | $ | 114,751 | |
| Liabilities: | | | | | | | | | | | | | | | | |
| Forward Currency Contracts | | $ | — | | | $ | (230,813 | ) | | $ | — | | | $ | (230,813 | ) |
| Interest Rate Contracts - Futures | | | (30,000 | ) | | | — | | | | — | | | | (30,000 | ) |
| | | | | | | | | | | | | | | $ | (260,813 | ) |
*** Other Financial Instruments are derivative instruments not reflected in total investments. Amounts shown represent unrealized appreciation (depreciation).
Touchstone Flexible Income Fund (Continued)
Futures Contracts
At March 31, 2014, $660,325 was segregated with the broker as collateral for futures contracts. The Fund had the following futures contracts, brokered by Morgan Stanley, open at March 31, 2014:
| | | Expiration | | Number of | | | Notional | | | Unrealized | |
| Description | | Date | | Contracts | | | Value | | | Depreciation | |
| Long Futures: | | | | | | | | | | | | | | |
| CBOE Volatility Index Futures | | April 2014 | | | 50 | | | | 757,500 | | | $ | (30,000 | ) |
Forward Foreign Currency Exchange Contracts
| | | | | | | | Unrealized | |
| | | | | Contract to | | | Appreciation/ | |
| Counterparty | | Expiration Date | | Receive | | | Deliver | | | (Depreciation) | |
| BNY ConvergEx | | 04/22/2014 | | USD | 1,636,139 | | | AUD | 1,800,000 | | | $ | (30,672 | ) |
| BNY ConvergEx | | 04/22/2014 | | USD | 8,481,919 | | | CAD | 9,300,000 | | | | 73,703 | |
| BNY ConvergEx | | 04/22/2014 | | USD | 3,864,168 | | | NZD | 4,670,000 | | | | (181,379 | ) |
| BNY ConvergEx | | 04/23/2014 | | USD | 2,441,242 | | | JPY | 250,000,000 | | | | 18,808 | |
| BNY ConvergEx | | 05/05/2014 | | NOK | 14,523,600 | | | USD | 2,400,000 | | | | 22,240 | |
| BNY ConvergEx | | 05/05/2014 | | USD | 2,400,000 | | | SEK | 15,663,600 | | | | (18,762 | ) |
| | | | | | | | | | | | | $ | (116,062 | ) |
See accompanying Notes to Financial Statements.
Portfolio of Investments
Touchstone Focused Fund – March 31, 2014
| | | | | | Market | |
| | | Shares | | | Value | |
| | | | | | | |
| Common Stocks— 96.2% | | | | | | | | |
| | | | | | | | | |
| Financials — 16.6% | | | | | | | | |
| Bank of America Corp. | | | 3,036,133 | | | $ | 52,221,488 | |
| Bank of New York Mellon Corp. (The) | | | 1,550,506 | | | | 54,717,357 | |
| CME Group, Inc. | | | 169,816 | | | | 12,568,082 | |
| Goldman Sachs Group, Inc. (The) | | | 286,907 | | | | 47,009,712 | |
| | | | | | | | 166,516,639 | |
| | | | | | | | | |
| Industrials — 14.7% | | | | | | | | |
| AGCO Corp. | | | 464,100 | | | | 25,599,755 | |
| Alliant Techsystems, Inc. | | | 232,401 | | | | 33,035,802 | |
| Esterline Technologies Corp.* | | | 281,882 | | | | 30,031,708 | |
| II-VI, Inc.* | | | 1,141,364 | | | | 17,611,247 | |
| Joy Global, Inc.† | | | 395,583 | | | | 22,943,813 | |
| Kennametal, Inc. | | | 427,204 | | | | 18,925,137 | |
| | | | | | | | 148,147,462 | |
| | | | | | | | | |
| Information Technology — 14.3% | | | | | | | | |
| Apple, Inc. | | | 51,890 | | | | 27,851,439 | |
| Avnet, Inc. | | | 517,981 | | | | 24,101,656 | |
| Google, Inc. - Class A* | | | 36,555 | | | | 40,740,913 | |
| Microsoft Corp. | | | 600,448 | | | | 24,612,364 | |
| Oracle Corp. | | | 650,370 | | | | 26,606,637 | |
| | | | | | | | 143,913,009 | |
| | | | | | | | | |
| Consumer Staples — 12.3% | | | | | | | | |
| CVS Caremark Corp. | | | 274,150 | | | | 20,522,869 | |
| Mondelez International, Inc. - Class A | | | 1,264,463 | | | | 43,687,197 | |
| Sysco Corp. | | | 899,613 | | | | 32,503,018 | |
| TESCO PLC ADR | | | 1,816,834 | | | | 27,125,332 | |
| | | | | | | | 123,838,416 | |
| | | | | | | | | |
| Health Care — 10.9% | | | | | | | | |
| Abbott Laboratories | | | 921,520 | | | | 35,487,735 | |
| Bio-Rad Laboratories, Inc. Class A* | | | 150,589 | | | | 19,293,463 | |
| Owens & Minor, Inc. | | | 765,706 | | | | 26,822,681 | |
| WellPoint, Inc. | | | 286,238 | | | | 28,494,993 | |
| | | | | | | | 110,098,872 | |
| | | | | | | | | |
| Consumer Discretionary — 9.0% | | | | | | | | |
| Carnival Corp. | | | 655,988 | | | | 24,835,706 | |
| Helen of Troy Ltd.* | | | 370,971 | | | | 25,682,322 | |
| International Speedway Corp. - Class A | | | 365,683 | | | | 12,429,565 | |
| Royal Caribbean Cruises Ltd. | | | 505,434 | | | | 27,576,479 | |
| | | | | | | | 90,524,072 | |
| | | | | | | | | |
| Energy — 8.2% | | | | | | | | |
| Devon Energy Corp. | | | 316,692 | | | | 21,196,196 | |
| Halliburton Co. | | | 337,630 | | | | 19,883,031 | |
| National Oilwell Varco, Inc. | | | 277,775 | | | | 21,630,339 | |
| World Fuel Services Corp. | | | 439,890 | | | | 19,399,149 | |
| | | | | | | | 82,108,715 | |
| | | | | | | | | |
| Telecommunication Services — 6.0% | | | | | | | | |
| KDDI Corp. ADR | | | 2,217,910 | | | | 32,204,053 | |
| Orange SA ADR† | | | 1,933,974 | | | | 28,410,078 | |
| | | | | | | | 60,614,131 | |
| | | | | | | | | |
| Materials — 4.2% | | | | | | | | |
| Agrium, Inc.† | | | 266,615 | | | | 26,000,295 | |
| Berry Plastics Group, Inc.* | | | 700,333 | | | | 16,212,709 | |
| | | | | | | | 42,213,004 | |
| Total Common Stocks | | | | | | $ | 967,974,320 | |
| | | | | | | | | |
| Investment Funds— 9.4% | | | | | | | | |
| Invesco Government & Agency | | | | | | | | |
| Portfolio, Institutional Class, | | | | | | | | |
| 0.02%**∞Ω | | | 55,461,620 | | | | 55,461,620 | |
| Touchstone Institutional Money Market | | | | | | | | |
| Fund, 0.01%^∞Ω | | | 39,213,944 | | | | 39,213,944 | |
| Total Investment Funds | | | | | | $ | 94,675,564 | |
| | | | | | | | | |
| Total Investment Securities —105.6% | | | | | | | | |
| (Cost $871,303,069) | | | | | | $ | 1,062,649,884 | |
| | | | | | | | | |
| Liabilities in Excess of Other Assets — (5.6%) | | | | | | | (56,713,581 | ) |
| | | | | | | | | |
| Net Assets — 100.0% | | | | | | $ | 1,005,936,303 | |
| * | Non-income producing security. |
| ** | Represents collateral for securities loaned. |
| ^ | Affiliated Fund. See Note 4 in Notes to Financial Statements. |
| † | All or a portion of the security is on loan. The total market value of the securities on loan as of March 31, 2014 was $54,686,657. |
| Ω | Represents the 7-day SEC yield as of March 31, 2014. |
Portfolio Abbreviations:
ADR - American Depositary Receipt
PLC - Public Limited Company
Touchstone Focused Fund (Continued)
Other Information:
The inputs or methodology used for valuing securities may not be an indication of the risk associated with investing in those securities. For more information on valuation inputs, and their aggregation into the levels used in the table below, please refer to the security valuation section in the accompanying Notes to Financial Statements.
Valuation inputs at Reporting Date:
| Description | | Level 1 | | | Level 2 | | | Level 3 | | | Total | |
| Common Stocks | | $ | 967,974,320 | | | $ | — | | | $ | — | | | $ | 967,974,320 | |
| Investment Funds | | | 94,675,564 | | | | — | | | | — | | | | 94,675,564 | |
| | | | | | | | | | | | | | | $ | 1,062,649,884 | |
See accompanying Notes to Financial Statements.
Portfolio of Investments
Touchstone Growth Opportunities Fund – March 31, 2014
| | | | | | Market | |
| | | Shares | | | Value | |
| | | | | | | |
| Common Stocks— 98.5% | | | | | | | | |
| | | | | | | | | |
| Information Technology — 26.4% | | | | | | | | |
| Alliance Data Systems Corp.* | | | 17,505 | | | $ | 4,769,237 | |
| Apple, Inc. | | | 22,809 | | | | 12,242,503 | |
| Aruba Networks, Inc.* | | | 134,010 | | | | 2,512,688 | |
| Autodesk, Inc.* | | | 38,610 | | | | 1,898,840 | |
| Cavium, Inc.* | | | 50,330 | | | | 2,200,931 | |
| Citrix Systems, Inc.* | | | 10,020 | | | | 575,449 | |
| eBay, Inc.* | | | 42,730 | | | | 2,360,405 | |
| Facebook, Inc. - Class A* | | | 61,480 | | | | 3,703,555 | |
| Google, Inc. - Class A* | | | 8,966 | | | | 9,992,697 | |
| International Business Machines Corp. | | | 27,950 | | | | 5,380,096 | |
| Oracle Corp. | | | 77,860 | | | | 3,185,253 | |
| Qlik Technologies, Inc.* | | | 90,870 | | | | 2,416,233 | |
| QUALCOMM, Inc. | | | 28,659 | | | | 2,260,049 | |
| Red Hat, Inc.* | | | 50,530 | | | | 2,677,079 | |
| Salesforce.com, Inc.* | | | 46,880 | | | | 2,676,379 | |
| ServiceNow, Inc.* | | | 38,770 | | | | 2,323,098 | |
| VeriFone Systems, Inc.* | | | 92,116 | | | | 3,115,363 | |
| Visa, Inc. - Class A | | | 29,490 | | | | 6,365,711 | |
| | | | | | | | 70,655,566 | |
| | | | | | | | | |
| Health Care — 18.7% | | | | | | | | |
| Actavis PLC* | | | 34,280 | | | | 7,056,538 | |
| Alkermes PLC (Ireland)* | | | 22,490 | | | | 991,584 | |
| Amgen, Inc. | | | 6,330 | | | | 780,742 | |
| ArthroCare Corp.* | | | 122,440 | | | | 5,900,384 | |
| Bristol-Myers Squibb Co. | | | 99,210 | | | | 5,153,960 | |
| Celgene Corp.* | | | 66,070 | | | | 9,223,372 | |
| Cooper Cos., Inc. (The) | | | 33,140 | | | | 4,552,110 | |
| Cubist Pharmaceuticals, Inc.* | | | 69,610 | | | | 5,091,972 | |
| Teva Pharmaceutical Industries Ltd. ADR | | | 91,490 | | | | 4,834,332 | |
| Thermo Fisher Scientific, Inc. | | | 54,920 | | | | 6,603,581 | |
| | | | | | | | 50,188,575 | |
| | | | | | | | | |
| Consumer Discretionary — 13.1% | | | | | | | | |
| Comcast Corp. - Class A | | | 74,610 | | | | 3,731,992 | |
| Home Depot, Inc. (The) | | | 53,980 | | | | 4,271,437 | |
| Liberty Global PLC - Class A, | | | | | | | | |
| (United Kingdom)* | | | 46,060 | | | | 1,916,095 | |
| Liberty Global PLC - Class C, | | | | | | | | |
| (United Kingdom)* | | | 46,060 | | | | 1,875,103 | |
| priceline.com, Inc.* | | | 4,480 | | | | 5,339,667 | |
| Shutterfly, Inc.* | | | 85,660 | | | | 3,655,969 | |
| Signet Jewelers Ltd. (Bermuda) | | | 38,770 | | | | 4,104,192 | |
| Starbucks Corp. | | | 36,260 | | | | 2,660,759 | |
| Walt Disney Co. (The) | | | 56,060 | | | | 4,488,724 | |
| Williams-Sonoma, Inc. | | | 43,770 | | | | 2,916,833 | |
| | | | | | | | 34,960,771 | |
| | | | | | | | | |
| Industrials — 12.1% | | | | | | | | |
| AMETEK, Inc. | | | 63,150 | | | | 3,251,594 | |
| B/E Aerospace, Inc.* | | | 46,061 | | | | 3,997,634 | |
| Caterpillar, Inc. | | | 37,100 | | | | 3,686,627 | |
| Danaher Corp. | | | 56,690 | | | | 4,251,750 | |
| Hexcel Corp.* | | | 94,623 | | | | 4,119,885 | |
| IHS, Inc. - Class A* | | | 34,080 | | | | 4,140,720 | |
| Norfolk Southern Corp. | | | 50,440 | | | | 4,901,255 | |
| United Technologies Corp. | | | 35,220 | | | | 4,115,105 | |
| | | | | | | | 32,464,570 | |
| | | | | | | | | |
| Financials — 8.4% | | | | | | | | |
| Alexander & Baldwin, Inc. | | | 108,375 | | | | 4,612,440 | |
| American International Group, Inc. | | | 110,250 | | | | 5,513,602 | |
| Ameriprise Financial, Inc. | | | 44,810 | | | | 4,932,237 | |
| CBRE Group, Inc. - Class A* | | | 164,860 | | | | 4,522,110 | |
| Starwood Property Trust, Inc. REIT | | | 122,970 | | | | 2,900,862 | |
| | | | | | | | 22,481,251 | |
| | | | | | | | | |
| Energy — 6.9% | | | | | | | | |
| CONSOL Energy, Inc. | | | 107,960 | | | | 4,313,002 | |
| Halliburton Co. | | | 72,740 | | | | 4,283,659 | |
| National Oilwell Varco, Inc. | | | 51,380 | | | | 4,000,961 | |
| Suncor Energy, Inc. (Canada) | | | 91,900 | | | | 3,212,823 | |
| Valero Energy Corp. | | | 50,190 | | | | 2,665,089 | |
| | | | | | | | 18,475,534 | |
| | | | | | | | | |
| Consumer Staples — 6.6% | | | | | | | | |
| B&G Foods, Inc. | | | 104,830 | | | | 3,156,431 | |
| Costco Wholesale Corp. | | | 39,390 | | | | 4,399,075 | |
| Hershey Co. (The) | | | 49,810 | | | | 5,200,164 | |
| Mondelez International, Inc. - Class A | | | 143,180 | | | | 4,946,869 | |
| | | | | | | | 17,702,539 | |
| | | | | | | | | |
| Materials — 6.3% | | | | | | | | |
| Eastman Chemical Co. | | | 45,230 | | | | 3,899,278 | |
| Huntsman Corp. | | | 19,090 | | | | 466,178 | |
| Monsanto Co. | | | 48,140 | | | | 5,476,888 | |
| PPG Industries, Inc. | | | 16,565 | | | | 3,204,665 | |
| Rockwood Holdings, Inc. | | | 51,690 | | | | 3,845,736 | |
| | | | | | | | 16,892,745 | |
| Total Common Stocks | | | | | | $ | 263,821,551 | |
| | | | | | | | | |
| Investment Fund — 1.0% | | | | | | | | |
| Touchstone Institutional Money Market | | | | | | | | |
| Fund, 0.01%^∞Ω | | | 2,639,703 | | | | 2,639,703 | |
| | | | | | | | | |
| Total Investment Securities —99.5% | | | | | | | | |
| (Cost $208,645,696) | | | | | | $ | 266,461,254 | |
| | | | | | | | | |
| Other Assets in Excess of Liabilities — 0.5% | | | | | | | 1,419,811 | |
| | | | | | | | | |
| Net Assets — 100.0% | | | | | | $ | 267,881,065 | |
| * | Non-income producing security. |
| ^ | Affiliated Fund. See Note 4 in Notes to Financial Statements. |
| Ω | Represents the 7-day SEC yield as of March 31, 2014. |
Touchstone Growth Opportunities Fund (Continued)
Portfolio Abbreviations:
ADR - American Depositary Receipt
PLC - Public Limited Company
REIT - Real Estate Investment Trust
Other Information:
The inputs or methodology used for valuing securities may not be an indication of the risk associated with investing in those securities. For more information on valuation inputs, and their aggregation into the levels used in the table below, please refer to the security valuation section in the accompanying Notes to Financial Statements.
| Valuation inputs at Reporting Date: | |
| Description | | Level 1 | | | Level 2 | | | Level 3 | | | Total | |
| Common Stocks | | $ | 263,821,551 | | | $ | — | | | $ | — | | | $ | 263,821,551 | |
| Investment Fund | | | 2,639,703 | | | | — | | | | — | | | | 2,639,703 | |
| | | | | | | | | | | | | | | $ | 266,461,254 | |
See accompanying Notes to Financial Statements.
Portfolio of Investments
Touchstone International Value Fund – March 31, 2014
| | | | | | Market | |
| | | Shares | | | Value | |
| | | | | | | |
| Common Stocks— 98.9% | | | | | | | | |
| | | | | | | | | |
| United Kingdom — 18.7% | | | | | | | | |
| Barclays PLC | | | 339,763 | | | $ | 1,322,053 | |
| BP PLC | | | 483,746 | | | | 3,871,065 | |
| Dairy Crest Group PLC | | | 238,147 | | | | 1,920,009 | |
| DS Smith PLC | | | 607,028 | | | | 3,283,940 | |
| Glaxosmithkline PLC | | | 135,300 | | | | 3,589,850 | |
| Imperial Tobacco Group PLC | | | 99,639 | | | | 4,024,895 | |
| National Grid PLC | | | 260,905 | | | | 3,575,411 | |
| Royal Dutch Shell PLC - Class A | | | 93,522 | | | | 3,416,870 | |
| | | | | | | | 25,004,093 | |
| | | | | | | | | |
| Switzerland — 13.7% | | | | | | | | |
| ABB Ltd. | | | 69,172 | | | | 1,783,973 | |
| ABB Ltd. ADR† | | | 33,200 | | | | 856,228 | |
| Credit Suisse Group AG | | | 93,456 | | | | 3,022,348 | |
| Helvetia Holding AG | | | 2,077 | | | | 1,063,698 | |
| Lonza Group AG | | | 22,400 | | | | 2,284,215 | |
| Novartis AG | | | 53,349 | | | | 4,525,960 | |
| Swiss Life Holding AG | | | 9,000 | | | | 2,209,151 | |
| Zurich Insurance Group AG | | | 8,362 | | | | 2,567,102 | |
| | | | | | | | 18,312,675 | |
| | | | | | | | | |
| Japan — 9.6% | | | | | | | | |
| Amada Co. Ltd. | | | 345,000 | | | | 2,426,682 | |
| Canon, Inc. | | | 78,000 | | | | 2,411,452 | |
| ITOCHU Corp. | | | 221,100 | | | | 2,583,409 | |
| Mabuchi Motor Co. Ltd. | | | 44,400 | | | | 2,907,949 | |
| Sumitomo Corp. | | | 174,300 | | | | 2,217,274 | |
| Yokogawa Electric Corp. | | | 16,100 | | | | 260,027 | |
| | | | | | | | 12,806,793 | |
| | | | | | | | | |
| Netherlands — 8.0% | | | | | | | | |
| Aegon N.V. | | | 359,400 | | | | 3,299,051 | |
| Delta Lloyd N.V. | | | 135,800 | | | | 3,765,102 | |
| ING Groep NV* | | | 260,243 | | | | 3,683,850 | |
| | | | | | | | 10,748,003 | |
| | | | | | | | | |
| Germany — 5.2% | | | | | | | | |
| Daimler AG | | | 44,400 | | | | 4,195,511 | |
| Deutsche Boerse AG | | | 34,506 | | | | 2,746,237 | |
| | | | | | | | 6,941,748 | |
| | | | | | | | | |
| France — 5.2% | | | | | | | | |
| Casino Guichard Perrachon SA | | | 25,431 | | | | 3,026,340 | |
| Sanofi | | | 37,325 | | | | 3,891,545 | |
| | | | | | | | 6,917,885 | |
| | | | | | | | | |
| Singapore — 4.9% | | | | | | | | |
| Jardine Cycle & Carriage Ltd. | | | 105,000 | | | | 3,783,806 | |
| United Overseas Bank Ltd. | | | 157,000 | | | | 2,702,162 | |
| | | | | | | | 6,485,968 | |
| | | | | | | | | |
| Norway — 4.4% | | | | | | | | |
| DNB ASA | | | 189,401 | | | | 3,292,803 | |
| Marine Harvest ASA | | | 63,967 | | | | 724,300 | |
| Orkla ASA | | | 224,367 | | | | 1,912,879 | |
| | | | | | | | 5,929,982 | |
| | | | | | | | | |
| Denmark — 4.3% | | | | | | | | |
| Danske Bank A/S | | | 114,725 | | | | 3,196,596 | |
| TDC A/S | | | 281,000 | | | | 2,597,747 | |
| | | | | | | | 5,794,343 | |
| | | | | | | | | |
| Italy — 3.2% | | | | | | | | |
| Eni SpA | | | 74,191 | | | | 1,861,240 | |
| Snam SpA | | | 410,308 | | | | 2,402,371 | |
| | | | | | | | 4,263,611 | |
| | | | | | | | | |
| South Korea — 3.0% | | | | | | | | |
| Hankook Tire Co. Ltd. | | | 29,600 | | | | 1,679,590 | |
| Shinhan Financial Group Co. Ltd. | | | 52,550 | | | | 2,320,306 | |
| | | | | | | | 3,999,896 | |
| | | | | | | | | |
| Spain — 2.6% | | | | | | | | |
| Banco Santander SA | | | 362,088 | | | | 3,452,424 | |
| | | | | | | | | |
| Ireland — 2.3% | | | | | | | | |
| CRH PLC | | | 109,200 | | | | 3,049,364 | |
| | | | | | | | | |
| Austria — 2.2% | | | | | | | | |
| Erste Group Bank AG | | | 85,200 | | | | 2,910,934 | |
| | | | | | | | | |
| Brazil — 2.1% | | | | | | | | |
| Brookfield Incorporacoes SA* | | | 506,000 | | | | 327,818 | |
| Embraer SA ADR | | | 70,400 | | | | 2,498,496 | |
| | | | | | | | 2,826,314 | |
| | | | | | | | | |
| Sweden — 2.1% | | | | | | | | |
| Sandvik AB | | | 195,900 | | | | 2,767,958 | |
| | | | | | | | | |
| Israel — 2.0% | | | | | | | | |
| Teva Pharmaceutical Industries Ltd. ADR | | | 51,000 | | | | 2,694,840 | |
| | | | | | | | | |
| United States — 1.7% | | | | | | | | |
| Joy Global, Inc.† | | | 23,100 | | | | 1,339,800 | |
| Philip Morris International, Inc. | | | 11,200 | | | | 916,944 | |
| | | | | | | | 2,256,744 | |
| | | | | | | | | |
| Hong Kong — 1.2% | | | | | | | | |
| Guangdong Investment Ltd. | | | 393,900 | | | | 376,304 | |
| Yue Yuen Industrial Holdings Ltd. | | | 396,800 | | | | 1,291,717 | |
| | | | | | | | 1,668,021 | |
| | | | | | | | | |
| India — 1.2% | | | | | | | | |
| Tata Motors Ltd. ADR | | | 45,200 | | | | 1,600,532 | |
| | | | | | | | | |
| Luxembourg — 1.0% | | | | | | | | |
| Arcelormittal | | | 86,388 | | | | 1,391,857 | |
| | | | | | | | | |
| Indonesia — 0.3% | | | | | | | | |
| Telekomunikasi Indonesia Persero Tbk | | | | | | | | |
| PT | | | 2,060,000 | | | | 402,670 | |
| Total Common Stocks | | | | | | $ | 132,226,655 | |
Touchstone International Value Fund (Continued)
| | | | | | Market | |
| | | Shares | | | Value | |
| | | | | | | |
| Investment Funds— 2.6% | | | | | | | | |
| Invesco Government & Agency | | | | | | | | |
| Portfolio, Institutional Class, 0.02%**∞Ω | | | 2,182,280 | | | $ | 2,182,280 | |
| Touchstone Institutional Money Market | | | | | | | | |
| Fund, 0.01%∞Ω | | | 1,265,134 | | | | 1,265,134 | |
| Total Investment Funds | | | | | | $ | 3,447,414 | |
| | | | | | | | | |
| Total Investment Securities —101.5% | | | | | | | | |
| (Cost $117,765,705) | | | | | | $ | 135,674,069 | |
| | | | | | | | | |
| Liabilities in Excess of Other Assets — (1.5%) | | | | | | | (2,005,392 | ) |
| | | | | | | | | |
| Net Assets — 100.0% | | | | | | $ | 133,668,677 | |
| * | Non-income producing security. |
| ** | Represents collateral for securities loaned. |
| ^ | Affiliated Fund. See Note 4 in Notes to Financial Statements. |
| † | All or a portion of the security is on loan. The total market value of the securities on loan as of March 31, 2014 was $2,143,868. |
| Ω | Represents the 7-day SEC yield as of March 31, 2014. |
Portfolio Abbreviations:
ADR - American Depositary Receipt
PLC - Public Limited Company
Other Information:
The inputs or methodology used for valuing securities may not be an indication of the risk associated with investing in those securities. For more information on valuation inputs, and their aggregation into the levels used in the table below, please refer to the security valuation section in the accompanying Notes to Financial Statements.
| Valuation inputs at Reporting Date: | |
| Description | | Level 1 | | | Level 2 | | | Level 3 | | | Total | |
| Common Stocks | | | | | | | | | | | | | | | | |
| United Kingdom | | $ | 25,004,093 | | | $ | — | | | | $— | | | $ | 25,004,093 | |
| Switzerland | | | 18,312,675 | | | | — | | | | — | | | | 18,312,675 | |
| Japan | | | 12,806,793 | | | | — | | | | — | | | | 12,806,793 | |
| Netherlands | | | 10,748,003 | | | | — | | | | — | | | | 10,748,003 | |
| Germany | | | 6,941,748 | | | | — | | | | — | | | | 6,941,748 | |
| France | | | 6,917,885 | | | | — | | | | — | | | | 6,917,885 | |
| Singapore | | | 6,485,968 | | | | — | | | | — | | | | 6,485,968 | |
| Norway | | | 5,929,982 | | | | — | | | | — | | | | 5,929,982 | |
| Denmark | | | 5,794,343 | | | | — | | | | — | | | | 5,794,343 | |
| Italy | | | 4,263,611 | | | | — | | | | — | | | | 4,263,611 | |
| South Korea | | | 3,999,896 | | | | — | | | | — | | | | 3,999,896 | |
| Spain | | | 3,452,424 | | | | — | | | | — | | | | 3,452,424 | |
| Ireland | | | 3,049,364 | | | | — | | | | — | | | | 3,049,364 | |
| Austria | | | 2,910,934 | | | | — | | | | — | | | | 2,910,934 | |
| Brazil | | | 2,826,314 | | | | — | | | | — | | | | 2,826,314 | |
| Sweden | | | 2,767,958 | | | | — | | | | — | | | | 2,767,958 | |
| Israel | | | 2,694,840 | | | | — | | | | — | | | | 2,694,840 | |
| United States | | | 2,256,744 | | | | — | | | | — | | | | 2,256,744 | |
| Hong Kong | | | 1,668,021 | | | | — | | | | — | | | | 1,668,021 | |
| India | | | 1,600,532 | | | | — | | | | — | | | | 1,600,532 | |
| Luxembourg | | | 1,391,857 | | | | — | | | | — | | | | 1,391,857 | |
| Indonesia | | | — | | | | 402,670 | | | | — | | | | 402,670 | |
| Investment Funds | | | 3,447,414 | | | | — | | | | — | | | | 3,447,414 | |
| | | | | | | | | | | | | | | $ | 135,674,069 | |
| See accompanying Notes to Financial Statements. |
Portfolio of Investments
Touchstone Large Cap Growth Fund – March 31, 2014
| | | | | | Market | |
| | | Shares | | | Value | |
| | | | | | | |
| Common Stocks— 98.9% | | | | | | | | |
| | | | | | | | | |
| Health Care — 30.3% | | | | | | | | |
| Actavis PLC*† | | | 193,600 | | | $ | 39,852,560 | |
| AmerisourceBergen Corp. | | | 554,600 | | | | 36,376,214 | |
| Amgen, Inc. | | | 136,900 | | | | 16,885,246 | |
| Biogen Idec, Inc.* | | | 103,825 | | | | 31,756,953 | |
| Celgene Corp.* | | | 144,900 | | | | 20,228,040 | |
| CIGNA Corp. | | | 225,900 | | | | 18,914,607 | |
| Illumina, Inc.* | | | 145,800 | | | | 21,674,628 | |
| Johnson & Johnson | | | 152,500 | | | | 14,980,075 | |
| McKesson Corp. | | | 148,700 | | | | 26,255,959 | |
| Mylan, Inc.* | | | 595,800 | | | | 29,092,914 | |
| Thermo Fisher Scientific, Inc. | | | 338,800 | | | | 40,737,312 | |
| | | | | | | | 296,754,508 | |
| | | | | | | | | |
| Information Technology — 26.3% | | | | | | | | |
| Alliance Data Systems Corp.*† | | | 150,010 | | | | 40,870,224 | |
| Facebook, Inc. - Class A* | | | 368,900 | | | | 22,222,536 | |
| Fidelity National Information Services, Inc. | | | 473,700 | | | | 25,319,265 | |
| FleetCor Technologies, Inc.* | | | 183,300 | | | | 21,097,830 | |
| Micron Technology, Inc.* | | | 1,507,300 | | | | 35,662,718 | |
| Qihoo 360 Technology Co. Ltd. ADR*† | | | 318,900 | | | | 31,756,062 | |
| SouFun Holdings Ltd. ADR† | | | 320,506 | | | | 21,929,021 | |
| Visa, Inc. - Class A | | | 167,254 | | | | 36,103,448 | |
| Yahoo!, Inc.* | | | 627,500 | | | | 22,527,250 | |
| | | | | | | | 257,488,354 | |
| | | | | | | | | |
| Industrials — 17.1% | | | | | | | | |
| 3M Co. | | | 199,900 | | | | 27,118,434 | |
| B/E Aerospace, Inc.* | | | 243,906 | | | | 21,168,602 | |
| Delta Air Lines, Inc. | | | 922,200 | | | | 31,954,230 | |
| Lockheed Martin Corp. | | | 154,400 | | | | 25,204,256 | |
| Raytheon Co. | | | 349,530 | | | | 34,530,069 | |
| Southwest Airlines Co. | | | 1,192,000 | | | | 28,143,120 | |
| | | | | | | | 168,118,711 | |
| | | | | | | | | |
| Consumer Discretionary — 9.5% | | | | | | | | |
| Lear Corp. | | | 296,300 | | | | 24,806,236 | |
| Lowe's Cos., Inc. | | | 603,400 | | | | 29,506,260 | |
| Melco Crown Entertainment Ltd. ADR | | | 540,100 | | | | 20,874,865 | |
| Time Warner, Inc. | | | 276,300 | | | | 18,050,679 | |
| | | | | | | | 93,238,040 | |
| | | | | | | | | |
| Consumer Staples — 5.0% | | | | | | | | |
| Hershey Co. (The) | | | 190,880 | | | | 19,927,872 | |
| Safeway, Inc. | | | 792,600 | | | | 29,278,644 | |
| | | | | | | | 49,206,516 | |
| | | | | | | | | |
| Financials — 4.4% | | | | | | | | |
| IntercontinentalExchange Group, Inc.* | | | 109,300 | | | | 21,622,819 | |
| Principal Financial Group, Inc. | | | 478,100 | | | | 21,987,819 | |
| | | | | | | | 43,610,638 | |
| | | | | | | | | |
| Materials — 4.1% | | | | | | | | |
| Ecolab, Inc. | | | 181,700 | | | | 19,621,783 | |
| PPG Industries, Inc. | | | 107,000 | | | | 20,700,220 | |
| | | | | | | | 40,322,003 | |
| | | | | | | | | |
| Utilities — 2.2% | | | | | | | | |
| NiSource, Inc. | | | 607,725 | | | $ | 21,592,469 | |
| Total Common Stocks | | | | | | $ | 970,331,239 | |
| | | | | | | | | |
| Investment Funds— 5.3% | | | | | | | | |
| Invesco Government & Agency | | | | | | | | |
| Portfolio, Institutional Class, | | | | | | | | |
| 0.02%**∞Ω | | | 39,853,925 | | | | 39,853,925 | |
| Touchstone Institutional Money Market | | | | | | | | |
| Fund, 0.01%∞Ω | | | 11,965,055 | | | | 11,965,055 | |
| Total Investment Funds | | | | | | $ | 51,818,980 | |
| | | | | | | | | |
| Total Investment Securities —104.2% | | | | | | | | |
| (Cost $798,859,666) | | | | | | $ | 1,022,150,219 | |
| | | | | | | | | |
| Liabilities in Excess of Other Assets — (4.2%) | | | | | | | (41,327,526 | ) |
| | | | | | | | | |
| Net Assets — 100.0% | | | | | | $ | 980,822,693 | |
| * | Non-income producing security. |
| ** | Represents collateral for securities loaned. |
| ^ | Affiliated Fund. See Note 4 in Notes to Financial Statements. |
| † | All or a portion of the security is on loan. The total market value of the securities on loan as of March 31, 2014 was $39,346,706. |
| Ω | Represents the 7-day SEC yield as of March 31, 2014. |
Portfolio Abbreviations:
ADR - American Depositary Receipt
PLC - Public Limited Company
Touchstone Large Cap Growth Fund (Continued)
Other Information:
The inputs or methodology used for valuing securities may not be an indication of the risk associated with investing in those securities. For more information on valuation inputs, and their aggregation into the levels used in the table below, please refer to the security valuation section in the accompanying Notes to Financial Statements.
| Valuation inputs at Reporting Date: | |
| Description | | Level 1 | | | Level 2 | | | Level 3 | | | Total | |
| Common Stocks | | $ | 970,331,239 | $ | | | — | $ | | | — | | | $ | 970,331,239 | |
| Investment Funds | | | 51,818,980 | | | | — | | | | — | | | | 51,818,980 | |
| | | | | | | | | | | | | | | $ | 1,022,150,219 | |
See accompanying Notes to Financial Statements.
Portfolio of Investments
Touchstone Mid Cap Growth Fund – March 31, 2014
| | | | | | Market | |
| | | Shares | | | Value | |
| | | | | | | |
| Common Stocks— 99.5% | | | | | | | | |
| | | | | | | | | |
| Industrials — 21.2% | | | | | | | | |
| AMETEK, Inc. | | | 291,240 | | | $ | 14,995,948 | |
| Copart, Inc.* | | | 373,110 | | | | 13,577,473 | |
| Donaldson Co., Inc. | | | 300,633 | | | | 12,746,839 | |
| Generac Holdings, Inc. | | | 132,870 | | | | 7,835,345 | |
| IHS, Inc. - Class A* | | | 92,610 | | | | 11,252,115 | |
| JB Hunt Transport Services, Inc. | | | 171,810 | | | | 12,356,575 | |
| Lincoln Electric Holdings, Inc. | | | 186,550 | | | | 13,433,466 | |
| Masco Corp. | | | 471,080 | | | | 10,462,687 | |
| Nielsen Holdings N.V. | | | 250,971 | | | | 11,200,836 | |
| Norfolk Southern Corp. | | | 144,950 | | | | 14,084,792 | |
| Sensata Technologies Holding N.V. | | | | | | | | |
| (Netherlands)* | | | 366,400 | | | | 15,623,296 | |
| TransDigm Group, Inc. | | | 67,105 | | | | 12,427,846 | |
| United Continental Holdings, Inc.* | | | 253,660 | | | | 11,320,846 | |
| | | | | | | | 161,318,064 | |
| | | | | | | | | |
| Consumer Discretionary — 19.4% | | | | | | | | |
| Allison Transmission Holdings, Inc. | | | 454,965 | | | | 13,621,652 | |
| AMC Networks, Inc. - Class A* | | | 139,580 | | | | 10,201,902 | |
| Discovery Communications, Inc. - Class A* | | | 45,630 | | | | 3,773,601 | |
| Dollar General Corp.* | | | 131,530 | | | | 7,297,284 | |
| GNC Holdings, Inc. - Class A | | | 142,260 | | | | 6,262,285 | |
| Jarden Corp.* | | | 219,435 | | | | 13,128,796 | |
| Kate Spade & Co.* | | | 230,840 | | | | 8,561,856 | |
| Liberty Global PLC - Class A, | | | | | | | | |
| (United Kingdom)* | | | 127,500 | | | | 5,304,000 | |
| Liberty Global PLC - Class C, | | | | | | | | |
| (United Kingdom)* | | | 127,500 | | | | 5,190,525 | |
| Mohawk Industries, Inc.* | | | 106,030 | | | | 14,417,959 | |
| NVR, Inc.* | | | 5,045 | | | | 5,786,615 | |
| Polaris Industries, Inc. | | | 103,340 | | | | 14,437,631 | |
| PVH Corp. | | | 92,610 | | | | 11,554,950 | |
| Starwood Hotels & Resorts Worldwide, Inc. | | | 118,110 | | | | 9,401,556 | |
| Tiffany & Co. | | | 130,190 | | | | 11,215,868 | |
| Urban Outfitters, Inc.* | | | 214,740 | | | | 7,831,568 | |
| | | | | | | | 147,988,048 | |
| | | | | | | | | |
| Health Care — 15.9% | | | | | | | | |
| Actavis PLC* | | | 159,576 | | | | 32,848,720 | |
| Alkermes PLC (Ireland)* | | | 64,198 | | | | 2,830,490 | |
| Cooper Cos., Inc. (The) | | | 111,394 | | | | 15,301,080 | |
| Cubist Pharmaceuticals, Inc.* | | | 175,820 | | | | 12,861,233 | |
| ICON PLC (Ireland)* | | | 174,470 | | | | 8,296,048 | |
| IDEXX Laboratories, Inc.* | | | 98,490 | | | | 11,956,686 | |
| Jazz Pharmaceuticals PLC (Ireland)* | | | 88,575 | | | | 12,283,581 | |
| Mettler-Toledo International, Inc.* | | | 55,699 | | | | 13,127,140 | |
| MWI Veterinary Supply, Inc.* | | | 74,840 | | | | 11,646,601 | |
| | | | | | | | 121,151,579 | |
| | | | | | | | | |
| Information Technology — 13.5% | | | | | | | | |
| Akamai Technologies, Inc.* | | | 234,870 | | | | 13,671,783 | |
| Alliance Data Systems Corp.*† | | | 59,055 | | | | 16,089,535 | |
| Autodesk, Inc.* | | | 109,650 | | | | 5,392,587 | |
| Citrix Systems, Inc.* | | | 27,360 | | | | 1,571,285 | |
| F5 Networks, Inc.* | | | 75,160 | | | | 8,014,311 | |
| FEI Co. | | | 115,420 | | | | 11,890,568 | |
| LinkedIn Corp. - Class A* | | | 45,096 | | | | 8,340,054 | |
| NICE Systems Ltd. ADR | | | 225,473 | | | | 10,069,624 | |
| NXP Semiconductors N.V., | | | | | | | | |
| (Netherlands)* | | | 132,870 | | | | 7,814,085 | |
| Red Hat, Inc.* | | | 143,480 | | | | 7,601,570 | |
| Total System Services, Inc. | | | 365,052 | | | | 11,101,231 | |
| Xilinx, Inc. | | | 28,360 | | | | 1,539,097 | |
| | | | | | | | 103,095,730 | |
| | | | | | | | | |
| Materials — 8.7% | | | | | | | | |
| Albemarle Corp. | | | 97,970 | | | | 6,507,167 | |
| Crown Holdings, Inc.* | | | 173,137 | | | | 7,746,149 | |
| Eastman Chemical Co. | | | 121,734 | | | | 10,494,688 | |
| FMC Corp. | | | 169,110 | | | | 12,947,062 | |
| MeadWestvaco Corp. | | | 310,030 | | | | 11,669,529 | |
| Vulcan Materials Co. | | | 249,630 | | | | 16,587,914 | |
| | | | | | | | 65,952,509 | |
| | | | | | | | | |
| Financials — 8.1% | | | | | | | | |
| Ameriprise Financial, Inc. | | | 99,320 | | | | 10,932,152 | |
| Aon PLC (United Kingdom) | | | 158,370 | | | | 13,347,424 | |
| CBRE Group, Inc. - Class A* | | | 461,683 | | | | 12,663,965 | |
| Regions Financial Corp. | | | 1,113,950 | | | | 12,375,984 | |
| Reinsurance Group of America, Inc. | | | 155,690 | | | | 12,397,595 | |
| | | | | | | | 61,717,120 | |
| | | | | | | | | |
| Consumer Staples — 6.9% | | | | | | | | |
| Church & Dwight Co., Inc. | | | 216,080 | | | | 14,924,646 | |
| Mead Johnson Nutrition Co. | | | 182,530 | | | | 15,175,544 | |
| WhiteWave Foods Co. - Class A* | | | 526,104 | | | | 15,015,008 | |
| Whole Foods Market, Inc. | | | 143,606 | | | | 7,282,260 | |
| | | | | | | | 52,397,458 | |
| | | | | | | | | |
| Energy — 5.8% | | | | | | | | |
| CONSOL Energy, Inc. | | | 373,200 | | | | 14,909,340 | |
| Ensco PLC- Class A (United Kingdom) | | | 139,580 | | | | 7,367,032 | |
| Tesoro Corp. | | | 269,760 | | | | 13,647,158 | |
| Valero Energy Corp. | | | 147,630 | | | | 7,839,153 | |
| | | | | | | | 43,762,683 | |
| Total Common Stocks | | | | | | $ | 757,383,191 | |
| | | | | | | | | |
| Investment Funds— 1.1% | | | | | | | | |
| Invesco Government & Agency | | | | | | | | |
| Portfolio, Institutional Class, 0.02%**∞Ω | | | 615,450 | | | | 615,450 | |
| Touchstone Institutional Money Market | | | | | | | | |
| Fund, 0.01%^∞Ω | | | 8,029,360 | | | | 8,029,360 | |
| Total Investment Funds | | | | | | $ | 8,644,810 | |
| | | | | | | | | |
| | | | | | | | | |
| Total Investment Securities —100.6% | | | | | | | | |
| (Cost $615,162,504) | | | | | | $ | 766,028,001 | |
| | | | | | | | | |
| Liabilities in Excess of Other Assets — (0.6%) | | | | | | | (4,401,975 | ) |
| | | | | | | | | |
| Net Assets — 100.0% | | | | | | $ | 761,626,026 | |
Touchstone Mid Cap Growth Fund (Continued)
| * | Non-income producing security. |
| ** | Represents collateral for securities loaned. |
| ^ | Affiliated Fund. See Note 4 in Notes to Financial Statements. |
| † | All or a portion of the security is on loan. The total market value of the securities on loan as of March 31, 2014 was $599,390. |
| Ω | Represents the 7-day SEC yield as of March 31, 2014. |
Portfolio Abbreviations:
ADR - American Depositary Receipt
PLC - Public Limited Company
Other Information:
The inputs or methodology used for valuing securities may not be an indication of the risk associated with investing in those securities. For more information on valuation inputs, and their aggregation into the levels used in the table below, please refer to the security valuation section in the accompanying Notes to Financial Statements.
Valuation inputs at Reporting Date:
| Description | | Level 1 | | | Level 2 | | | Level 3 | | | Total | |
| Common Stocks | | $ | 757,383,191 | | | $ | — | | | $ | — | | | $ | 757,383,191 | |
| Investment Funds | | | 8,644,810 | | | | — | | | | — | | | | 8,644,810 | |
| | | | | | | | | | | | | | | $ | 766,028,001 | |
See accompanying Notes to Financial Statements.
Portfolio of Investments
Touchstone Small Cap Growth Fund – March 31, 2014
| | | | | | Market | |
| | | Shares | | | Value | |
| | | | | | | | | |
| Common Stocks— 94.5% | | | | | | | | |
| | | | | | | | | |
| Information Technology — 20.6% | | | | | | | | |
| AOL, Inc.* | | | 24,995 | | | $ | 1,094,031 | |
| ARRIS Group, Inc.* | | | 39,233 | | | | 1,105,586 | |
| Ciena Corp.* | | | 42,097 | | | | 957,286 | |
| Entegris, Inc.* | | | 72,049 | | | | 872,513 | |
| Euronet Worldwide, Inc.* | | | 36,362 | | | | 1,512,296 | |
| FEI Co. | | | 14,510 | | | | 1,494,820 | |
| Finisar Corp.* | | | 43,631 | | | | 1,156,658 | |
| Heartland Payment Systems, Inc.† | | | 33,728 | | | | 1,398,026 | |
| InterXion Holding NV (Netherlands)* | | | 28,733 | | | | 689,017 | |
| MAXIMUS, Inc. | | | 24,616 | | | | 1,104,274 | |
| Mentor Graphics Corp. | | | 43,060 | | | | 948,181 | |
| Netscout Systems, Inc.* | | | 12,116 | | | | 455,319 | |
| Power Integrations, Inc. | | | 14,335 | | | | 942,956 | |
| PTC, Inc.* | | | 36,496 | | | | 1,293,053 | |
| Semtech Corp.* | | | 32,579 | | | | 825,552 | |
| Syntel, Inc.* | | | 14,602 | | | | 1,312,720 | |
| ViaSat, Inc.* | | | 12,457 | | | | 860,031 | |
| Virtusa Corp.* | | | 27,832 | | | | 932,650 | |
| | | | | | | | 18,954,969 | |
| | | | | | | | | |
| Health Care — 19.1% | | | | | | | | |
| ABIOMED, Inc.*† | | | 39,086 | | | | 1,017,799 | |
| Acadia Pharmaceuticals, Inc.*† | | | 17,193 | | | | 418,306 | |
| Air Methods Corp.* | | | 18,992 | | | | 1,014,743 | |
| Akorn, Inc.* | | | 45,027 | | | | 990,594 | |
| Auxilium Pharmaceuticals, Inc.* | | | 15,906 | | | | 432,325 | |
| Cardiovascular Systems, Inc.* | | | 24,535 | | | | 779,968 | |
| Celldex Therapeutics, Inc.* | | | 9,798 | | | | 173,131 | |
| Centene Corp.* | | | 21,116 | | | | 1,314,471 | |
| Charles River Laboratories International, Inc.* | | | 32,866 | | | | 1,983,134 | |
| DexCom, Inc.* | | | 17,646 | | | | 729,839 | |
| Enanta Pharmaceuticals, Inc.* | | | 12,091 | | | | 483,519 | |
| Globus Medical, Inc. - Class A* | | | 25,880 | | | | 688,149 | |
| Hanger, Inc.* | | | 11,249 | | | | 378,866 | |
| ICON PLC (Ireland)* | | | 31,271 | | | | 1,486,936 | |
| Insulet Corp.* | | | 9,123 | | | | 432,613 | |
| Keryx Biopharmaceuticals, Inc.*† | | | 43,053 | | | | 733,623 | |
| Ligand Pharmaceuticals, Inc.*† | | | 6,169 | | | | 414,927 | |
| MedAssets, Inc.* | | | 31,979 | | | | 790,201 | |
| Momenta Pharmaceuticals, Inc.* | | | 22,529 | | | | 262,463 | |
| Natus Medical, Inc.* | | | 17,735 | | | | 457,563 | |
| PerkinElmer, Inc. | | | 27,770 | | | | 1,251,316 | |
| WuXi PharmaTech Cayman, Inc. ADR* | | | 36,160 | | | | 1,332,858 | |
| | | | | | | | 17,567,344 | |
| | | | | | | | | |
| Consumer Discretionary — 16.5% | | | | | | | | |
| ANN, Inc.* | | | 21,834 | | | | 905,674 | |
| Arctic Cat, Inc. | | | 16,246 | | | | 776,396 | |
| Brinker International, Inc. | | | 17,484 | | | | 917,036 | |
| Cabela's, Inc.* | | | 16,137 | | | | 1,057,135 | |
| Caesars Acquisition Co. - Class A* | | | 851 | | | | 12,093 | |
| Cracker Barrel Old Country Store, Inc. | | | 18,477 | | | | 1,796,703 | |
| Dana Holding Corp. | | | 44,489 | | | | 1,035,259 | |
| Dillard's, Inc. - Class A | | | 12,616 | | | | 1,165,718 | |
| Finish Line, Inc. (The) - Class A | | | 33,418 | | | | 905,294 | |
| Iconix Brand Group, Inc.* | | | 31,556 | | | | 1,239,204 | |
| Lithia Motors, Inc. - Class A | | | 29,206 | | | | 1,941,031 | |
| Pinnacle Entertainment, Inc.* | | | 19,785 | | | | 468,904 | |
| Thor Industries, Inc. | | | 20,063 | | | | 1,225,047 | |
| Visteon Corp.* | | | 19,852 | | | | 1,755,711 | |
| | | | | | | | 15,201,205 | |
| | | | | | | | | |
| Industrials — 14.9% | | | | | | | | |
| Astronics Corp.* | | | 15,933 | | | | 1,010,312 | |
| Astronics Corp. - Class B* | | | 2,548 | | | | 160,779 | |
| AZZ, Inc. | | | 16,819 | | | | 751,473 | |
| Chart Industries, Inc.* | | | 6,078 | | | | 483,505 | |
| DXP Enterprises, Inc.* | | | 11,949 | | | | 1,134,319 | |
| EnerSys, Inc. | | | 16,283 | | | | 1,128,249 | |
| Hexcel Corp.* | | | 24,851 | | | | 1,082,013 | |
| Kirby Corp.* | | | 16,768 | | | | 1,697,760 | |
| Korn/Ferry International* | | | 30,512 | | | | 908,342 | |
| Lindsay Corp.† | | | 10,983 | | | | 968,481 | |
| Middleby Corp.* | | | 3,948 | | | | 1,043,101 | |
| On Assignment, Inc.* | | | 30,677 | | | | 1,183,825 | |
| Primoris Services Corp. | | | 23,775 | | | | 712,774 | |
| Valmont Industries, Inc. | | | 7,711 | | | | 1,147,705 | |
| voxeljet AG ADR (Germany)*† | | | 12,993 | | | | 327,034 | |
| | | | | | | | 13,739,672 | |
| | | | | | | | | |
| Financials — 13.5% | | | | | | | | |
| Amtrust Financial Services, Inc.† | | | 11,969 | | | | 450,154 | |
| BOK Financial Corp. | | | 12,460 | | | | 860,363 | |
| CBOE Holdings, Inc. | | | 26,226 | | | | 1,484,392 | |
| City National Corp. | | | 16,371 | | | | 1,288,725 | |
| E-House China Holdings Ltd. ADR† | | | 59,201 | | | | 715,740 | |
| Evercore Partners, Inc. - Class A | | | 26,165 | | | | 1,445,616 | |
| HFF, Inc. - Class A | | | 64,350 | | | | 2,162,804 | |
| Interactive Brokers Group, Inc. - Class A | | | 41,052 | | | | 889,597 | |
| MarketAxess Holdings, Inc. | | | 8,957 | | | | 530,434 | |
| Portfolio Recovery Associates, Inc.* | | | 13,093 | | | | 757,561 | |
| Virtus Investment Partners, Inc.* | | | 6,320 | | | | 1,094,434 | |
| WisdomTree Investments, Inc.* | | | 57,254 | | | | 751,172 | |
| | | | | | | | 12,430,992 | |
| | | | | | | | | |
| Energy — 5.3% | | | | | | | | |
| Carrizo Oil & Gas, Inc.* | | | 28,893 | | | | 1,544,620 | |
| Diamondback Energy, Inc.* | | | 13,001 | | | | 875,097 | |
| Kodiak Oil & Gas Corp. (Canada)* | | | 93,053 | | | | 1,129,663 | |
| Matrix Service Co.* | | | 39,554 | | | | 1,336,134 | |
| | | | | | | | 4,885,514 | |
| | | | | | | | | |
| Materials — 3.3% | | | | | | | | |
| Constellium NV - Class A* | | | 23,620 | | | | 693,247 | |
| KapStone Paper and Packaging Corp.* | | | 43,871 | | | | 1,265,240 | |
| Silgan Holdings, Inc. | | | 21,944 | | | | 1,086,667 | |
| | | | | | | | 3,045,154 | |
| | | | | | | | | |
| Consumer Staples — 1.3% | | | | | | | | |
| Revlon, Inc. - Class A* | | | 29,736 | | | | 759,755 | |
Touchstone Small Cap Growth Fund (Continued)
| | | | | | Market | |
| | | Shares | | | Value | |
| | | | | | | |
| Common Stocks — 94.5% (Continued) | | | | | | | | |
| | | | | | | | | |
| Consumer Staples — (Continued) | | | | | | | | |
| United Natural Foods, Inc.* | | | 6,339 | | | $ | 449,562 | |
| | | | | | | | 1,209,317 | |
| Total Common Stocks | | | | | | $ | 87,034,167 | |
| | | | | | | | | |
| Investment Funds— 13.1% | | | | | | | | |
| Invesco Government & Agency | | | | | | | | |
| Portfolio, Institutional Class, 0.02%**∞Ω | | | 7,275,844 | | | | 7,275,844 | |
| Touchstone Institutional Money Market | | | | | | | | |
| Fund, 0.01%^∞Ω | | | 4,787,968 | | | | 4,787,968 | |
| Total Investment Funds | | | | | | $ | 12,063,812 | |
| | | | | | | | | |
| | | | | | | | | |
| Total Investment Securities —107.6% | | | | | | | | |
| (Cost $88,737,166) | | | | | | $ | 99,097,979 | |
| | | | | | | | | |
| Liabilities in Excess of Other Assets — (7.6%) | | | | | | | (6,965,102 | ) |
| | | | | | | | | |
| Net Assets — 100.0% | | | | | | $ | 92,132,877 | |
| * | Non-income producing security. |
| ** | Represents collateral for securities loaned. |
| ^ | Affiliated Fund. See Note 4 in Notes to Financial Statements. |
| † | All or a portion of the security is on loan. The total market value of the securities on loan as of March 31, 2014 was $6,193,555. |
| Ω | Represents the 7-day SEC yield as of March 31, 2014. |
Portfolio Abbreviations:
ADR - American Depositary Receipt
PLC - Public Limited Company
Other Information:
The inputs or methodology used for valuing securities may not be an indication of the risk associated with investing in those securities. For more information on valuation inputs, and their aggregation into the levels used in the table below, please refer to the security valuation section in the accompanying Notes to Financial Statements.
Valuation inputs at Reporting Date:
| Description | | Level 1 | | | Level 2 | | | Level 3 | | | Total | |
| | | | | | | | | | | | | | | | | |
| Common Stocks | | $ | 87,034,167 | | | $ | — | | | $ | — | | | $ | 87,034,167 | |
| Investment Funds | | | 12,063,812 | | | | — | | | | — | | | | 12,063,812 | |
| | | | | | | | | | | | | | | $ | 99,097,979 | |
See accompanying Notes to Financial Statements.
Statements of Assets and Liabilities
March 31, 2014
| | | Touchstone | | | | | | Touchstone | | | Touchstone | |
| | | Flexible | | | Touchstone | | | Growth | | | International | |
| | | Income | | | Focused | | | Opportunities | | | Value | |
| | | Fund | | | Fund | | | Fund | | | Fund | |
| Assets | | | | | | | | | | | | | | | | |
| Investments, at cost | | $ | 232,718,950 | | | $ | 871,303,069 | | | $ | 208,645,696 | | | $ | 117,765,705 | |
| Affiliated securities, at market value | | $ | 2,507,785 | | | $ | 39,213,944 | | | $ | 2,639,703 | | | $ | 1,265,134 | |
| Non-affiliated securities, at market value | | | 233,195,170 | | | | 1,023,435,940 | | | | 263,821,551 | | | | 134,408,935 | |
| Investments, at market value (A) | | $ | 235,702,955 | | | $ | 1,062,649,884 | | | $ | 266,461,254 | | | $ | 135,674,069 | |
| Cash | | | 2,713,850 | | | | — | | | | — | | | | — | |
| Cash deposits held at prime broker* | | | 660,325 | | | | — | | | | — | | | | — | |
| Foreign Currency (B) | | | 86,663 | | | | — | | | | — | | | | 61,959 | |
| Unrealized appreciation on forward foreign currency contracts | | | 114,751 | | | | — | | | | — | | | | — | |
| Dividends and interest receivable | | | 2,228,598 | | | | 363,488 | | | | 161,499 | | | | 322,910 | |
| Receivable for capital shares sold | | | 195,547 | | | | 1,269,755 | | | | 124,087 | | | | 189 | |
| Receivable for investments sold | | | 134 | | | | 841,537 | | | | 13,947,135 | | | | 41,332 | |
| Receivable for securities lending income | | | 1,517 | | | | 9,300 | | | | 632 | | | | 5,772 | |
| Tax reclaim receivable | | | 24,803 | | | | — | | | | — | | | | 158,232 | |
| Other assets | | | 19,435 | | | | 46,125 | | | | 20,208 | | | | 9,868 | |
| Total Assets | | | 241,748,578 | | | | 1,065,180,089 | | | | 280,714,815 | | | | 136,274,331 | |
| | | | | | | | | | | | | | | | | |
| Liabilities | | | | | | | | | | | | | | | | |
| Unrealized depreciation on forward foreign currency contracts | | | 230,813 | | | | — | | | | — | | | | — | |
| Payable for return of collateral for securities on loan | | | 904,500 | | | | 55,461,620 | | | | — | | | | 2,182,280 | |
| Payable for capital shares redeemed | | | 328,303 | | | | 614,599 | | | | 135,851 | | | | 248,756 | |
| Payable for variation margin for futures contracts | | | 30,000 | | | | — | | | | — | | | | — | |
| Payable for investments purchased | | | — | | | | 1,975,039 | | | | 12,400,493 | | | | — | |
| Payable to Investment Advisor | | | 140,526 | | | | 540,917 | | | | 182,986 | | | | 101,493 | |
| Payable to other affiliates | | | 21,546 | | | | 17,726 | | | | 29,013 | | | | 8,145 | |
| Payable to Trustees | | | 3,228 | | | | 3,314 | | | | 3,231 | | | | 3,213 | |
| Payable for professional services | | | 21,049 | | | | 24,612 | | | | 19,688 | | | | 21,239 | |
| Other accrued expenses and liabilities | | | 84,456 | | | | 605,959 | | | | 62,488 | | | | 40,528 | |
| Total Liabilities | | | 1,764,421 | | | | 59,243,786 | | | | 12,833,750 | | | | 2,605,654 | |
| | | | | | | | | | | | | | | | | |
| Net Assets | | $ | 239,984,157 | | | $ | 1,005,936,303 | | | $ | 267,881,065 | | | $ | 133,668,677 | |
| | | | | | | | | | | | | | | | | |
| Net assets consist of: | | | | | | | | | | | | | | | | |
| Paid-in capital | | $ | 252,550,399 | | | $ | 873,651,637 | | | $ | 215,618,074 | | | $ | 234,983,660 | |
| Accumulated net investment income | | | 48,722 | | | | 4,384,888 | | | | — | | | | 3,064,727 | |
| Accumulated net realized gains (losses) on investments, futures contracts and foreign currency transactions | | | (15,463,724 | ) | | | (63,447,037 | ) | | | (5,552,567 | ) | | | (122,292,715 | ) |
| Net unrealized appreciation on investments, futures contracts and foreign currency transactions | | | 2,848,760 | | | | 191,346,815 | | | | 57,815,558 | | | | 17,913,005 | |
| Net Assets | | $ | 239,984,157 | | | $ | 1,005,936,303 | | | $ | 267,881,065 | | | $ | 133,668,677 | |
| (A) Includes market value of securities on loan of: | | $ | 898,695 | | | $ | 54,686,657 | | | $ | — | | | $ | 2,143,868 | |
| (B) Cost of foreign currency: | | $ | 85,284 | | | $ | — | | | $ | — | | | $ | 61,667 | |
| * Represents segregated cash for futures contracts. | | | | | | | | | | | | | | | | |
See accompanying Notes to Financial Statements.
Statements of Assets and Liabilities (Continued)
| | | | Touchstone | | | Touchstone | |
| Touchstone | | | Mid Cap | | | Small Cap | |
| Large Cap | | | Growth | | | Growth | |
| Growth Fund | | | Fund | | | Fund | |
| | | | | | | | | | | |
| $ | 798,859,666 | | | $ | 615,162,504 | | | $ | 88,737,166 | |
| $ | 11,965,055 | | | $ | 8,029,360 | | | $ | 4,787,968 | |
| | 1,010,185,164 | | | | 757,998,641 | | | | 94,310,011 | |
| $ | 1,022,150,219 | | | $ | 766,028,001 | | | $ | 99,097,979 | |
| | — | | | | — | | | | — | |
| | — | | | | — | | | | — | |
| | — | | | | — | | | | — | |
| | — | | | | — | | | | — | |
| | 516,727 | | | | 322,081 | | | | 12,510 | |
| | 803,493 | | | | 5,092,195 | | | | 761,201 | |
| | — | | | | 18,485,450 | | | | 4,076,765 | |
| | 6,035 | | | | 894 | | | | 14,733 | |
| | — | | | | 9,561 | | | | 900 | |
| | 33,532 | | | | 39,758 | | | | 18,107 | |
| | 1,023,510,006 | | | | 789,977,940 | | | | 103,982,195 | |
| | | | | | | | | | | |
| | | | | | | | | | | |
| | — | | | | — | | | | — | |
| | 39,853,925 | | | | 615,450 | | | | 7,275,844 | |
| | 1,580,062 | | | | 4,861,612 | | | | 43,624 | |
| | — | | | | — | | | | — | |
| | — | | | | 21,769,438 | | | | 4,349,589 | |
| | 588,544 | | | | 479,142 | | | | 82,463 | |
| | 299,928 | | | | 302,358 | | | | 25,936 | |
| | 3,318 | | | | 3,290 | | | | 3,207 | |
| | 26,216 | | | | 23,782 | | | | 16,754 | |
| | 335,320 | | | | 296,842 | | | | 51,901 | |
| | 42,687,313 | | | | 28,351,914 | | | | 11,849,318 | |
| | | | | | | | | | | |
| $ | 980,822,693 | | | $ | 761,626,026 | | | $ | 92,132,877 | |
| | | | | | | | | | | |
| | | | | | | | | | | |
| $ | 709,014,715 | | | $ | 560,573,455 | | | $ | 81,679,256 | |
| | — | | | | — | | | | — | |
| | | | | | | | | | | |
| | 48,517,425 | | | | 50,187,074 | | | | 92,808 | |
| | | | | | | | | | | |
| | 223,290,553 | | | | 150,865,497 | | | | 10,360,813 | |
| $ | 980,822,693 | | | $ | 761,626,026 | | | $ | 92,132,877 | |
| $ | 39,346,706 | | | $ | 599,390 | | | $ | 6,193,555 | |
| $ | — | | | $ | — | | | $ | — | |
Statements of Assets and Liabilities (Continued)
| | | Touchstone | | | | | | Touchstone | | | Touchstone | |
| | | Flexible | | | Touchstone | | | Growth | | | International | |
| | | Income | | | Focused | | | Opportunities | | | Value | |
| | | Fund | | | Fund | | | Fund | | | Fund | |
| | | | | | | | | | | | | |
| Pricing of Class A Shares | | | | | | | | | | | | | | | | |
| Net assets applicable to Class A shares | | $ | 25,927,836 | | | $ | 233,840,992 | | | $ | 47,551,684 | | | $ | 6,031,776 | |
| Shares of beneficial interest outstanding | | | | | | | | | | | | | | | | |
| (unlimited number of shares authorized, no par value) | | | 2,446,603 | | | | 6,706,467 | | | | 1,458,404 | | | | 661,205 | |
| Net asset value price per share* | | $ | 10.60 | | | $ | 34.87 | | | $ | 32.61 | | | $ | 9.12 | |
| Maximum offering price per share | | $ | 11.25 | | | $ | 37.00 | | | $ | 34.60 | | | $ | 9.68 | |
| | | | | | | | | | | | | | | | | |
| Pricing of Class B Shares | | | | | | | | | | | | | | | | |
| Net assets applicable to Class B shares | | $ | — | | | $ | — | | | $ | — | | | $ | — | |
| Shares of beneficial interest outstanding | | | | | | | | | | | | | | | | |
| (unlimited number of shares authorized, no par value) | | | — | | | | — | | | | — | | | | — | |
| Net asset value, offering price per share** | | $ | — | | | $ | — | | | $ | — | | | $ | — | |
| | | | | | | | | | | | | | | | | |
| Pricing of Class C Shares | | | | | | | | | | | | | | | | |
| Net assets applicable to Class C shares | | $ | 21,043,178 | | | $ | 5,626,473 | | | $ | 12,498,044 | | | $ | 215,546 | |
| Shares of beneficial interest outstanding | | | | | | | | | | | | | | | | |
| (unlimited number of shares authorized, no par value) | | | 2,009,108 | | | | 163,959 | | | | 426,228 | | | | 25,470 | |
| Net asset value, offering price per share** | | $ | 10.47 | | | $ | 34.32 | | | $ | 29.32 | | | $ | 8.46 | |
| | | | | | | | | | | | | | | | | |
| Pricing of Class Y Shares | | | | | | | | | | | | | | | | |
| Net assets applicable to Class Y shares | | $ | 151,651,823 | | | $ | 736,023,312 | | | $ | 92,062,521 | | | $ | 43,793,791 | |
| Shares of beneficial interest outstanding | | | | | | | | | | | | | | | | |
| (unlimited number of shares authorized, no par value) | | | 14,274,569 | | | | 20,826,240 | | | | 2,792,218 | | | | 4,798,110 | |
| Net asset value, offering price and redemption price per share | | $ | 10.62 | | | $ | 35.34 | | | $ | 32.97 | | | $ | 9.13 | |
| | | | | | | | | | | | | | | | | |
| Pricing of Institutional Class Shares | | | | | | | | | | | | | | | | |
| Net assets applicable to Institutional Class Shares | | $ | 41,361,320 | | | $ | 30,445,526 | | | $ | 115,768,816 | | | $ | 83,627,564 | |
| Shares of beneficial interest outstanding | | | | | | | | | | | | | | | | |
| (unlimited number of shares authorized, no par value) | | | 3,894,917 | | | | 858,227 | | | | 3,489,219 | | | | 9,153,485 | |
| Net asset value, offering price and redemption price per share | | $ | 10.62 | | | $ | 35.47 | | | $ | 33.18 | | | $ | 9.14 | |
* There is no sales load on subscriptions of $1 million or more. Redemptions that were part of a $1 million or more subscription may be subject to a contingent deferred sales load if redeemed within a one-year period from the date of purchase.
** Redemption price per share varies by length of time shares are held.
See accompanying Notes to Financial Statements.
Statements of Assets and Liabilities (Continued)
| Touchstone | | | Touchstone | | | Touchstone | |
| Large Cap | | | Mid Cap | | | Small Cap | |
| Growth | | | Growth | | | Growth | |
| Fund | | | Fund | | | Fund | |
| | | | | | | | |
| | | | | | | | | | | |
| $ | 287,812,824 | | | $ | 308,315,643 | | | $ | 35,302,767 | |
| | | | | | | | | | | |
| | 9,046,931 | | | | 11,633,712 | | | | 6,742,674 | |
| $ | 31.81 | | | $ | 26.50 | | | $ | 5.24 | |
| $ | 33.75 | | | $ | 28.12 | | | $ | 5.56 | |
| | | | | | | | | | | |
| | | | | | | | | | | |
| $ | 3,671,294 | | | $ | 4,709,322 | | | $ | — | |
| | | | | | | | | | | |
| | 122,052 | | | | 226,181 | | | | — | |
| $ | 30.08 | | | $ | 20.82 | | | $ | — | |
| | | | | | | | | | | |
| | | | | | | | | | | |
| $ | 111,630,532 | | | $ | 149,926,597 | | | $ | 7,428,661 | |
| | | | | | | | | | | |
| | 3,755,549 | | | | 7,352,336 | | | | 1,670,871 | |
| $ | 29.72 | | | $ | 20.39 | | | $ | 4.45 | |
| | | | | | | | | | | |
| | | | | | | | | | | |
| $ | 577,708,043 | | | $ | 263,577,916 | | | $ | 37,029,571 | |
| | | | | | | | | | | |
| | 17,926,401 | | | | 9,763,241 | | | | 6,403,276 | |
| $ | 32.23 | | | $ | 27.00 | | | $ | 5.78 | |
| | | | | | | | | | | |
| | | | | | | | | | | |
| $ | — | | | $ | 35,096,548 | | | $ | 12,371,878 | |
| | | | | | | | | | | |
| | — | | | | 1,295,178 | | | | 2,133,000 | |
| $ | — | | | $ | 27.10 | | | $ | 5.80 | |
Statements of Operations
For the Year Ended March 31, 2014
| | | Touchstone | | | | | | Touchstone | | | Touchstone | |
| | | Flexible | | | Touchstone | | | Growth | | | International | |
| | | Income | | | Focused | | | Opportunities | | | Value | |
| | | Fund | | | Fund | | | Fund | | | Fund | |
| Investment Income | | | | | | | | | | | | | | | | |
| Dividends from affiliated funds | | $ | 1,937 | | | $ | 6,583 | | | $ | 1,208 | | | $ | 479 | |
| Dividends from non-affiliated securities(A) | | | 6,870,477 | | | | 12,943,179 | | | | 3,155,518 | | | | 4,438,595 | |
| Interest | | | 8,480,370 | | | | — | | | | — | | | | — | |
| Income from securities loaned | | | 46,413 | | | | 88,988 | | | | 15,511 | | | | 174,160 | |
| Total Investment Income | | | 15,399,197 | | | | 13,038,750 | | | | 3,172,237 | | | | 4,613,234 | |
| Expenses | | | | | | | | | | | | | | | | |
| Investment advisory fees | | | 1,856,398 | | | | 5,359,567 | | | | 1,816,683 | | | | 1,248,984 | |
| Administration fees | | | 436,808 | | | | 1,383,447 | | | | 397,554 | | | | 205,392 | |
| Compliance fees and expenses | | | 1,652 | | | | 1,652 | | | | 1,652 | | | | 1,652 | |
| Custody fees | | | 25,366 | | | | 17,186 | | | | 12,356 | | | | 29,389 | |
| Professional fees | | | 34,063 | | | | 47,554 | | | | 26,657 | | | | 31,802 | |
| Transfer Agent fees, Class A | | | 31,473 | | | | 456,732 | | | | 74,413 | | | | 12,203 | |
| Transfer Agent fees, Class B | | | — | | | | — | | | | — | | | | — | |
| Transfer Agent fees, Class C | | | 23,283 | | | | 1,640 | | | | 17,323 | | | | 658 | |
| Transfer Agent fees, Class Y | | | 109,673 | | | | 824,905 | | | | 31,195 | | | | 14,140 | |
| Transfer Agent fees, Institutional Class | | | 196 | | | | 6,329 | | | | 1,927 | | | | 139 | |
| Registration fees, Class A | | | 13,215 | | | | 18,860 | | | | 13,544 | | | | 4,928 | |
| Registration fees, Class B | | | — | | | | — | | | | — | | | | — | |
| Registration fees, Class C | | | 9,634 | | | | 2,816 | | | | 9,587 | | | | 5,787 | |
| Registration fees, Class Y | | | 11,417 | | | | 18,088 | | | | 14,118 | | | | 4,548 | |
| Registration fees, Institutional Class | | | 6,205 | | | | 12,882 | | | | 7,697 | | | | 4,068 | |
| Reports to Shareholders, Class A | | | 9,733 | | | | 57,677 | | | | 8,874 | | | | 358 | |
| Reports to Shareholders, Class B | | | — | | | | — | | | | — | | | | — | |
| Reports to Shareholders, Class C | | | 7,494 | | | | 15,714 | | | | 5,622 | | | | 1,944 | |
| Reports to Shareholders, Class Y | | | 13,723 | | | | 77,452 | | | | 6,562 | | | | 2,366 | |
| Reports to Shareholders, Institutional Class | | | 2,946 | | | | 13,810 | | | | 5,265 | | | | 20,467 | |
| Distribution expenses, Class A | | | 78,045 | | | | 406,103 | | | | 115,424 | | | | 15,756 | |
| Distribution expenses, Class B | | | — | | | | — | | | | — | | | | — | |
| Distribution and shareholder servicing expenses, Class C | | | 235,884 | | | | 20,962 | | | | 114,595 | | | | 2,223 | |
| Trustee fees | | | 14,784 | | | | 13,360 | | | | 13,301 | | | | 14,790 | |
| Other expenses | | | 78,494 | | | | 602,548 | | | | 69,205 | | | | 46,618 | |
| Total Expenses | | | 3,000,486 | | | | 9,359,284 | | | | 2,763,554 | | | | 1,668,212 | |
| Fees waived and/or reimbursed by the Advisor and/or Affiliates(B) | | | (811,789 | ) | | | (1,020,322 | ) | | | (370,965 | ) | | | (407,602 | ) |
| Fees recouped by the Advisor(B) | | | — | | | | 458 | | | | 9,102 | | | | — | |
| Net Expenses | | | 2,188,697 | | | | 8,339,420 | | | | 2,401,691 | | | | 1,260,610 | |
| Net Investment Income (Loss) | | | 13,210,500 | | | | 4,699,330 | | | | 770,546 | | | | 3,352,624 | |
| Realized and Unrealized Gains (Losses) on Investments | | | | | | | | | | | | | | | | |
| Net realized gains on investments from non-affiliated securities | | | 742,342 | | | | 36,541,971 | | | | 27,186,499 | | | | 3,481,569 | |
| Net realized losses on futures contracts | | | (426,416 | ) | | | — | | | | — | | | | — | |
| Net realized losses on foreign currency | | | (465,481 | ) | | | — | | | | — | | | | (59,890 | ) |
| Net change in unrealized appreciation (depreciation) on investments(C) | | | (11,131,306 | ) | | | 161,165,217 | | | | 28,041,471 | | | | 17,195,843 | |
| Net change in unrealized appreciation (depreciation) on futures contracts | | | 107,150 | | | | — | | | | — | | | | — | |
| Net change in unrealized appreciation (depreciation) on foreign currency transactions | | | (98,192 | ) | | | — | | | | — | | | | 53,806 | |
| Net Realized and Unrealized Gains (Losses) on Investments | | | (11,271,903 | ) | | | 197,707,188 | | | | 55,227,970 | | | | 20,671,328 | |
| Change in Net Assets Resulting from Operations | | $ | 1,938,597 | | | $ | 202,406,518 | | | $ | 55,998,516 | | | $ | 24,023,952 | |
| (A) Net of foreign tax withholding of: | | $ | 37,889 | | | $ | 506,972 | | | $ | 7,792 | | | $ | 451,836 | |
(B)See Note 4 in Notes to Financial Statements.
(C)Change in unrealized appreciation (depreciation) does not include net unrealized appreciation of $22,524,353 and $193,301 for the Focused Fund and Small Cap Growth Fund, respectively, in connection with the Funds' merger. See Note 11 in the Notes to Financial Statements.
See accompanying Notes to Financial Statements.
Statements of Operations (Continued)
| Touchstone | | | Touchstone | | | Touchstone | |
| Large Cap | | | Mid Cap | | | Small Cap | |
| Growth Fund | | | Growth Fund | | | Growth Fund | |
| | | | | | | | |
| $ | 2,664 | | | $ | 3,147 | | | $ | 552 | |
| | 12,076,106 | | | | 6,644,258 | | | | 558,224 | |
| | — | | | | — | | | | — | |
| | 187,248 | | | | 89,044 | | | | 33,522 | |
| | 12,266,018 | | | | 6,736,449 | | | | 592,298 | |
| | | | | | | | | | | |
| | 6,779,404 | | | | 5,119,109 | | | | 612,610 | |
| | 1,568,142 | | | | 1,142,261 | | | | 100,321 | |
| | 1,652 | | | | 1,652 | | | | 1,652 | |
| | 27,305 | | | | 19,720 | | | | 16,946 | |
| | 49,886 | | | | 40,700 | | | | 26,603 | |
| | 341,901 | | | | 508,597 | | | | 33,550 | |
| | 10,363 | | | | 13,781 | | | | — | |
| | 117,032 | | | | 208,085 | | | | 7,933 | |
| | 724,216 | | | | 269,496 | | | | 29,201 | |
| | — | | | | 159 | | | | 96 | |
| | 20,335 | | | | 14,853 | | | | 10,083 | |
| | 10,631 | | | | 5,527 | | | | — | |
| | 16,390 | | | | 14,348 | | | | 4,653 | |
| | 22,731 | | | | 15,242 | | | | 8,421 | |
| | — | | | | 7,217 | | | | 5,493 | |
| | 32,316 | | | | 29,685 | | | | 8,132 | |
| | 7,968 | | | | 5,348 | | | | — | |
| | 17,369 | | | | 21,788 | | | | 4,784 | |
| | 58,875 | | | | 26,060 | | | | 6,946 | |
| | — | | | | 4,788 | | | | 3,391 | |
| | 712,406 | | | | 719,019 | | | | 53,005 | |
| | 18,069 | | | | 15,896 | | | | — | |
| | 1,097,109 | | | | 1,438,888 | | | | 51,890 | |
| | 13,318 | | | | 13,316 | | | | 14,792 | |
| | 203,243 | | | | 174,145 | | | | 32,831 | |
| | 11,850,661 | | | | 9,829,680 | | | | 1,033,333 | |
| | (693,067 | ) | | | — | | | | (210,942 | ) |
| | — | | | | — | | | | — | |
| | 11,157,594 | | | | 9,829,680 | | | | 822,391 | |
| | 1,108,424 | | | | (3,093,231 | ) | | | (230,093 | ) |
| | | | | | | | | | | |
| | 116,170,988 | | | | 109,410,184 | | | | 9,463,241 | |
| | — | | | | — | | | | — | |
| | — | | | | — | | | | — | |
| | 66,832,014 | | | | 48,014,661 | | | | 2,600,759 | |
| | — | | | | — | | | | — | |
| | — | | | | — | | | | — | |
| | 183,003,002 | | | | 157,424,845 | | | | 12,064,000 | |
| $ | 184,111,426 | | | $ | 154,331,614 | | | $ | 11,833,907 | |
| $ | 50,349 | | | $ | 53,022 | | | $ | 2,139 | |
Statements of Changes in Net Assets
| | | | | | Touchstone | | | | |
| | | Flexible Income Fund | |
| | | | | | For the | | | | |
| | | | | | Eight Months | | | | |
| | | For the | | | Ended | | | For the | |
| | | Year Ended | | | March 31, | | | Year Ended | |
| | | March 31, 2014 | | | 2013(A) | | | July 31, 2012 | |
| From Operations | | | | | | | | | | | | |
| Net investment income | | $ | 13,210,500 | | | $ | 9,421,815 | | | $ | 9,855,913 | |
| Net realized gains (losses) on investments, futures contracts and foreign currency | | | (149,555 | ) | | | 2,829,774 | | | | 1,572,178 | |
| Net change in unrealized appreciation (depreciation) on investments, futures contracts and foreign currency transactions | | | (11,122,348 | ) | | | 1,388,214 | | | | 6,431,184 | |
| Change in Net Assets from Operations | | | 1,938,597 | | | | 13,639,803 | | | | 17,859,275 | |
| | | | | | | | | | | | | |
| Distributions to Shareholders from: | | | | | | | | | | | | |
| Net investment income, Class A | | | (1,413,413 | ) | | | (1,539,970 | ) | | | (1,802,345 | ) |
| Net investment income, Class B(B) | | | — | | | | (682 | ) | | | (18,189 | ) |
| Net investment income, Class C | | | (914,420 | ) | | | (637,497 | ) | | | (872,785 | ) |
| Net investment income, Class Y(B) | | | (8,411,708 | ) | | | (6,227,808 | ) | | | (7,695,009 | ) |
| Net investment income, Institutional Class | | | (1,839,935 | ) | | | (525,064 | ) | | | — | |
| Net realized gains, Class A | | | — | | | | — | | | | — | |
| Net realized gains, Class C | | | — | | | | — | | | | — | |
| Net realized gains, Class Y(B) | | | — | | | | — | | | | — | |
| Net realized gains, Institutional Class | | | — | | | | — | | | | — | |
| Total Distributions | | | (12,579,476 | ) | | | (8,931,021 | ) | | | (10,388,328 | ) |
| | | | | | | | | | | | | |
| Net Increase (Decrease) from Share Transactions(C) | | | (36,644,688 | ) | | | 7,310,988 | | | | 102,918,716 | |
| | | | | | | | | | | | | |
| Total Increase (Decrease) in Net Assets | | | (47,285,567 | ) | | | 12,019,770 | | | | 110,389,663 | |
| | | | | | | | | | | | | |
| Net Assets | | | | | | | | | | | | |
| Beginning of period | | | 287,269,724 | | | | 275,249,954 | | | | 164,860,291 | |
| End of period | | $ | 239,984,157 | | | $ | 287,269,724 | | | $ | 275,249,954 | |
| Accumulated Net Investment Income (Loss) | | $ | 48,722 | | | $ | (404,037 | ) | | $ | (662,710 | ) |
(A) The Fund changed its fiscal year end from July 31 to March 31. See Note 11 in the Notes to Financial Statements.
(B) Effective September 10, 2012, Touchstone Flexible Income Fund's Class B shares were exchanged for Class A shares and Institutional Class shares became Class Y shares. Amounts prior to September 10, 2012 of Class Y shares represent the former Fifth Third Institutional Class shares. See Note 11 in the Notes to Financial Statements.
(C) For details on share transaction by class, see Statements of Changes in Net Assets - Capital Stock Activity on pages 62 and 63.
See accompanying Notes to Financial Statements.
Statements of Changes in Net Assets (Continued)
| Touchstone | | | Touchstone | |
| Focused Fund | | | Growth Opportunities Fund | |
| | | | | | | | | | | |
| | | | | | | | | | | |
| For the | | | For the | | | For the | | | For the | |
| Year Ended | | | Year Ended | | | Year Ended | | | Year Ended | |
| March 31, 2014 | | | March 31, 2013 | | | March 31, 2014 | | | March 31, 2013 | |
| | | | | | | | | | | |
| $ | 4,699,330 | | | $ | 5,036,882 | | | $ | 770,546 | | | $ | 154,211 | |
| | 36,541,971 | | | | 172,637,373 | | | | 27,186,499 | | | | 9,297,658 | |
| | | | | | | | | | | | | | | |
| | 161,165,217 | | | | (91,495,030 | ) | | | 28,041,471 | | | | 15,641,909 | |
| | 202,406,518 | | | | 86,179,225 | | | | 55,998,516 | | | | 25,093,778 | |
| | | | | | | | | | | | | | | |
| | | | | | | | | | | | | | | |
| | (166,736 | ) | | | (9,453 | ) | | | — | | | | — | |
| | — | | | | — | | | | — | | | | — | |
| | (1,440 | ) | | | (8 | ) | | | — | | | | — | |
| | (5,166,618 | ) | | | (1,148,749 | ) | | | (33,838 | ) | | | (41,946 | ) |
| | (5,691 | ) | | | (422 | ) | | | (103,133 | ) | | | (146,571 | ) |
| | — | | | | — | | | | (1,915,424 | ) | | | (5,159,128 | ) |
| | — | | | | — | | | | (556,202 | ) | | | (739,390 | ) |
| | — | | | | — | | | | (3,785,821 | ) | | | (2,210,044 | ) |
| | — | | | | — | | | | (4,539,084 | ) | | | (5,223,167 | ) |
| | (5,340,485 | ) | | | (1,158,632 | ) | | | (10,933,502 | ) | | | (13,520,246 | ) |
| | | | | | | | | | | | | | | |
| | 221,717,909 | | | | (90,240,781 | ) | | | 8,699,074 | | | | 48,241,353 | |
| | | | | | | | | | | | | | | |
| | 418,783,942 | | | | (5,220,188 | ) | | | 53,764,088 | | | | 59,814,885 | |
| | | | | | | | | | | | | | | |
| | | | | | | | | | | | | | | |
| | 587,152,361 | | | | 592,372,549 | | | | 214,116,977 | | | | 154,302,092 | |
| $ | 1,005,936,303 | | | $ | 587,152,361 | | | $ | 267,881,065 | | | $ | 214,116,977 | |
| $ | 4,384,888 | | | $ | 5,026,043 | | | $ | — | | | $ | (30,071 | ) |
Statements of Changes in Net Assets (Continued)
| | | | | | Touchstone | | | | |
| | | International Value Fund | |
| | | | | | For the | | | | |
| | | | | | Eight Months | | | | |
| | | For the | | | Ended | | | For the | |
| | | Year Ended | | | March 31, | | | Year Ended | |
| | | March 31, 2014 | | | 2013(A) | | | July 31, 2012 | |
| From Operations | | | | | | | | | | | | |
| Net investment income (loss) | | $ | 3,352,624 | | | $ | 1,157,831 | | | $ | 3,442,761 | |
| Net realized gains (losses) on investments and foreign currency | | | 3,421,679 | | | | 13,591,202 | | | | (17,953,383 | ) |
| Net change in unrealized appreciation (depreciation) on investments and foreign currency transactions | | | 17,249,649 | | | | (2,577,494 | ) | | | (11,138,358 | ) |
| Change in Net Assets from Operations | | | 24,023,952 | | | | 12,171,539 | | | | (25,648,980 | ) |
| | | | | | | | | | | | | |
| Distributions to Shareholders from: | | | | | | | | | | | | |
| Net investment income, Class A | | | (62,082 | ) | | | (200,165 | ) | | | (235,511 | ) |
| Net investment income, Class B(B) | | | — | | | | — | | | | (2,271 | ) |
| Net investment income, Class C | | | (1,681 | ) | | | (5,583 | ) | | | (4,001 | ) |
| Net investment income, Class Y(B) | | | (404,720 | ) | | | (1,045,091 | ) | | | (4,485,965 | ) |
| Net investment income, Institutional Class | | | (1,070,089 | ) | | | (2,282,278 | ) | | | — | |
| Net realized gains, Class A | | | — | | | | — | | | | — | |
| Net realized gains, Class B | | | — | | | | — | | | | — | |
| Net realized gains, Class C | | | — | | | | — | | | | — | |
| Net realized gains, Class Y(B) | | | — | | | | — | | | | — | |
| Net realized gains, Institutional Class | | | — | | | | — | | | | — | |
| Total Distributions | | | (1,538,572 | ) | | | (3,533,117 | ) | | | (4,727,748 | ) |
| | | | | | | | | | | | | |
| Net Increase (Decrease) from Share Transactions(C) | | | (15,884,732 | ) | | | (12,774,869 | ) | | | (25,818,561 | ) |
| | | | | | | | | | | | | |
| Total Increase (Decrease) in Net Assets | | | 6,600,648 | | | | (4,136,447 | ) | | | (56,195,289 | ) |
| | | | | | | | | | | | | |
| Net Assets | | | | | | | | | | | | |
| Beginning of period | | | 127,068,029 | | | | 131,204,476 | | | | 187,399,765 | |
| End of period | | $ | 133,668,677 | | | $ | 127,068,029 | | | $ | 131,204,476 | |
| Accumulated Net Investment Income (Loss) | | $ | 3,064,727 | | | $ | 1,169,304 | | | $ | 3,519,170 | |
(A)The Fund changed its fiscal year end from July 31 to March 31. See Note 11 in the Notes to Financial Statements.
(B)Effective September 10, 2012, Touchstone International Value Fund's Class B shares were exchanged for Class A shares and Institutional Class shares became Class Y shares. Amounts prior to September 10, 2012 of Class Y shares represent the former Fifth Third Institutional Class shares. See Note 11 in the Notes to Financial Statements.
(C) For details on share transaction by class, see Statements of Changes in Net Assets - Capital Stock Activity on pages 64 and 65.
See accompanying Notes to Financial Statements.
Statements of Changes in Net Assets (Continued)
| Touchstone | | | Touchstone | |
| Large Cap Growth Fund | | | Mid Cap Growth Fund | |
| | | | | | | | | | | |
| | | | | | | | | | | |
| For the | | | For the | | | For the | | | For the | |
| Year Ended | | | Year Ended | | | Year Ended | | | Year Ended | |
| March 31, 2014 | | | March 31, 2013 | | | March 31, 2014 | | | March 31, 2013 | |
| | | | | | | | | | | |
| $ | 1,108,424 | | | $ | 4,283,378 | | | $ | (3,093,231 | ) | | $ | (1,873,542 | ) |
| | 116,170,988 | | | | 140,659,752 | | | | 109,410,184 | | | | 54,036,573 | |
| | | | | | | | | | | | | | | |
| | 66,832,014 | | | | (109,844,938 | ) | | | 48,014,661 | | | | 18,142,249 | |
| | 184,111,426 | | | | 35,098,192 | | | | 154,331,614 | | | | 70,305,280 | |
| | | | | | | | | | | | | | | |
| | | | | | | | | | | | | | | |
| | (504,736 | ) | | | (1,172,771 | ) | | | — | | | | — | |
| | — | | | | — | | | | — | | | | — | |
| | — | | | | — | | | | — | | | | — | |
| | (2,365,788 | ) | | | (3,626,210 | ) | | | — | | | | — | |
| | — | | | | — | | | | — | | | | — | |
| | (24,957,494 | ) | | | — | | | | (28,966,943 | ) | | | (18,417,345 | ) |
| | (446,705 | ) | | | — | | | | (607,372 | ) | | | (484,000 | ) |
| | (10,190,455 | ) | | | — | | | | (18,515,631 | ) | | | (10,898,841 | ) |
| | (47,776,919 | ) | | | — | | | | (24,268,590 | ) | | | (9,174,939 | ) |
| | — | | | | — | | | | (3,464,048 | ) | | | (2,425,223 | ) |
| | (86,242,097 | ) | | | (4,798,981 | ) | | | (75,822,584 | ) | | | (41,400,348 | ) |
| | | | | | | | | | | | | | | |
| | (41,273,702 | ) | | | 142,730,157 | | | | 32,829,729 | | | | (31,943,096 | ) |
| | | | | | | | | | | | | | | |
| | 56,595,627 | | | | 173,029,368 | | | | 111,338,759 | | | | (3,038,164 | ) |
| | 924,227,066 | | | | 751,197,698 | | | | 650,287,267 | | | | 653,325,431 | |
| $ | 980,822,693 | | | $ | 924,227,066 | | | $ | 761,626,026 | | | $ | 650,287,267 | |
| $ | — | | | $ | 123,507 | | | $ | — | | | $ | 340,463 | |
Statements of Changes in Net Assets (Continued)
| | | | | | Touchstone | | | | |
| | | Small Cap Growth Fund | |
| | | | | | For the | | | | |
| | | | | | Eight Months | | | | |
| | | For the | | | Ended | | | For the | |
| | | Year Ended | | | March 31, | | | Year Ended | |
| | | March 31, 2014 | | | 2013(A) | | | July 31, 2012 | |
| From Operations | | | | | | | | | | | | |
| Net investment income (loss) | | $ | (230,093 | ) | | $ | 49,621 | | | $ | (7,695 | ) |
| Net realized gains on investments | | | 9,463,241 | | | | 1,691,134 | | | | 3,937,528 | |
| Net change in unrealized appreciation (depreciation) on investments | | | 2,600,759 | | | | 5,365,978 | | | | (3,692,332 | ) |
| Change in Net Assets from Operations | | | 11,833,907 | | | | 7,106,733 | | | | 237,501 | |
| | | | | | | | | | | | | |
| Distributions to Shareholders from: | | | | | | | | | | | | |
| Net investment income, Class A(B) | | | — | | | | (70,758 | ) | | | — | |
| Net investment income, Class C | | | — | | | | (9,054 | ) | | | — | |
| Net investment income, Class Y(B) | | | — | | | | (92,350 | ) | | | — | |
| Net investment income, Institutional Class | | | — | | | | (14 | ) | | | — | |
| Net realized gains, Class A | | | (1,906,417 | ) | | | (809,691 | ) | | | — | |
| Net realized gains, Class C | | | (545,775 | ) | | | (224,449 | ) | | | — | |
| Net realized gains, Class Y(B) | | | (2,418,021 | ) | | | (872,692 | ) | | | — | |
| Net realized gains, Institutional Class | | | (1,432,011 | ) | | | (123 | ) | | | — | |
| Total Distributions | | | (6,302,224 | ) | | | (2,079,131 | ) | | | — | |
| | | | | | | | | | | | | |
| Net Increase (Decrease) from Share Transactions(C) | | | 50,722,552 | | | | (11,363,965 | ) | | | (8,557,753 | ) |
| | | | | | | | | | | | | |
| Total Increase (Decrease) in Net Assets | | | 56,254,235 | | | | (6,336,363 | ) | | | (8,320,252 | ) |
| | | | | | | | | | | | | |
| Net Assets | | | | | | | | | | | | |
| Beginning of period | | | 35,878,642 | | | | 42,215,005 | | | | 50,535,257 | |
| End of period | | $ | 92,132,877 | | | $ | 35,878,642 | | | $ | 42,215,005 | |
| Accumulated Net Investment Income (Loss) | | $ | — | | | $ | (28,681 | ) | | $ | 43,435 | |
(A)The Fund changed its fiscal year end from July 31 to March 31. See Note 11 in the Notes to Financial Statements.
(B)Effective September 10, 2012, Class B shares were exchanged for Class A shares and Institutional Class shares became Class Y shares. Amounts prior to September 10, 2012 of Class Y shares represent the former Fifth Third Institutional Class shares. See Note 11 in the Notes to Financial Statements.
(C)For details on share transaction by class, see Statements of Changes in Net Assets - Capital Stock Activity on page 66.
See accompanying Notes to Financial Statements.
This page intentionally left blank.
Statements of Changes in Net Assets - Capital Stock Activity
| | | Touchstone | |
| | | Flexible Income Fund | |
| | | For the Year | | | For the Eight Months | | | For the Year | |
| | | Ended | | | Ended | | | Ended | |
| | | March 31, 2014 | | | March 31, 2013(A) | | | July 31, 2012 | |
| | | Shares | | | Dollars | | | Shares | | | Dollars | | | Shares | | | Dollars | |
| Class A(B) | | | | | | | | | | | | | | | | | | | | | | | | |
| Proceeds from Shares issued | | | 478,902 | | | $ | 5,101,992 | | | | 1,349,724 | | | $ | 14,643,752 | | | | 3,151,163 | | | $ | 32,993,481 | |
| Proceeds from Shares issued in connection with merger(C) | | | — | | | | — | | | | 32,891 | | | | 356,537 | | | | — | | | | — | |
| Reinvestment of distributions | | | 112,892 | | | | 1,185,530 | | | | 110,758 | | | | 1,199,074 | | | | 108,355 | | | | 1,138,265 | |
| Cost of Shares redeemed | | | (1,920,074 | ) | | | (20,305,857 | ) | | | (2,314,002 | ) | | | (25,179,450 | ) | | | (1,090,958 | ) | | | (11,399,562 | ) |
| Change in Class A Share Transactions | | | (1,328,280 | ) | | | (14,018,335 | ) | | | (820,629 | ) | | | (8,980,087 | ) | | | 2,168,560 | | | | 22,732,184 | |
| Class B(B) | | | | | | | | | | | | | | | | | | | | | | | | |
| Proceeds from Shares issued | | | — | | | | — | | | | 2,142 | | | | 23,134 | | | | 10,853 | | | | 112,457 | |
| Reinvestment of distributions | | | — | | | | — | | | | 49 | | | | 524 | | | | 1,224 | | | | 12,788 | |
| Cost of Shares redeemed | | | — | | | | — | | | | (1,976 | ) | | | (22,352 | ) | | | (28,737 | ) | | | (299,913 | ) |
| Cost of Shares redeemed in connection with merger(C) | | | — | | | | — | | | | (32,946 | ) | | | (356,537 | ) | | | — | | | | — | |
| Change in Class B Share Transactions | | | — | | | | — | | | | (32,731 | ) | | | (355,231 | ) | | | (16,660 | ) | | | (174,668 | ) |
| Class C(D) | | | | | | | | | | | | | | | | | | | | | | | | |
| Proceeds from Shares issued | | | 592,026 | | | | 6,179,415 | | | | 448,682 | | | | 4,810,637 | | | | 995,418 | | | | 10,267,593 | |
| Proceeds from Shares issued in connection with merger(C) | | | — | | | | — | | | | — | | | | — | | | | — | | | | — | |
| Reinvestment of distributions | | | 67,886 | | | | 704,337 | | | | 39,465 | | | | 422,591 | | | | 52,091 | | | | 540,105 | |
| Cost of Shares redeemed | | | (1,062,018 | ) | | | (11,004,750 | ) | | | (436,212 | ) | | | (4,674,418 | ) | | | (311,646 | ) | | | (3,227,988 | ) |
| Change in Class C Share Transactions | | | (402,106 | ) | | | (4,120,998 | ) | | | 51,935 | | | | 558,810 | | | | 735,863 | | | | 7,579,710 | |
| Class Y(B) | | | | | | | | | | | | | | | | | | | | | | | | |
| Proceeds from Shares issued | | | 4,954,381 | | | | 53,071,881 | | | | 5,371,767 | | | | 58,425,257 | | | | 9,153,874 | | | | 96,044,311 | |
| Proceeds from Shares issued in connection with merger(C) | | | — | | | | — | | | | — | | | | — | | | | — | | | | — | |
| Reinvestment of distributions | | | 304,968 | | | | 3,211,530 | | | | 197,464 | | | | 2,142,709 | | | | 242,894 | | | | 2,554,364 | |
| Cost of Shares redeemed | | | (9,155,539 | ) | | | (96,251,878 | ) | | | (5,969,106 | ) | | | (64,914,120 | ) | | | (2,467,026 | ) | | | (25,817,185 | ) |
| Change in Class Y Share Transactions | | | (3,896,190 | ) | | | (39,968,467 | ) | | | (399,875 | ) | | | (4,346,154 | ) | | | 6,929,742 | | | | 72,781,490 | |
| Class Z | | | | | | | | | | | | | | | | | | | | | | | | |
| Proceeds from Shares issued | | | — | | | | — | | | | — | | | | — | | | | — | | | | — | |
| Cost of Shares redeemed | | | — | | | | — | | | | — | | | | — | | | | — | | | | — | |
| Cost of Shares redeemed in connection with merger(C) | | | — | | | | — | | | | — | | | | — | | | | — | | | | — | |
| Change in Class Z Share Transactions | | | — | | | | — | | | | — | | | | — | | | | — | | | | — | |
| Institutional Class(E) | | | | | | | | | | | | | | | | | | | | | | | | |
| Proceeds from Shares issued | | | 2,541,308 | | | | 26,938,080 | | | | 2,297,269 | | | | 24,996,202 | | | | — | | | | — | |
| Proceeds from Shares issued in connection with merger(C) | | | — | | | | — | | | | — | | | | — | | | | — | | | | — | |
| Reinvestment of distributions | | | 150,682 | | | | 1,580,008 | | | | 47,620 | | | | 516,651 | | | | — | | | | — | |
| Cost of Shares redeemed | | | (674,863 | ) | | | (7,054,976 | ) | | | (467,099 | ) | | | (5,079,203 | ) | | | — | | | | — | |
| Change in Institutional Class Share Transactions | | | 2,017,127 | | | | 21,463,112 | | | | 1,877,790 | | | | 20,433,650 | | | | — | | | | — | |
| Change from Share Transactions | | | (3,609,449 | ) | | $ | (36,644,688 | ) | | | 676,490 | | | $ | 7,310,988 | | | | 9,817,505 | | | $ | 102,918,716 | |
(A)The Fund changed its fiscal year from July 31 to March 31. See Note 11 in the Notes to Financial Statements.
(B)Effective September 10, 2012, Touchstone Flexible Income Fund's Class B shares were exchanged for Class A shares and Institutional Class shares became Class Y shares. Amounts prior to September 10, 2012 of Class Y shares represent the former Fifth Third Institutional Class shares. See Note 11 in the Notes to Financial Statements.
(C)See Note 11 in the Notes to Financial Statements.
(D)The Touchstone Focused Fund began issuing Class C shares on April 12, 2012.
(E)The Touchstone Flexible Income Fund began issuing Institutional Class shares on September 10, 2012.
See accompanying Notes to Financial Statements.
Statements of Changes in Net Assets - Capital Stock Activity (Continued)
| Touchstone | | | Touchstone | |
| Focused Fund | | | Growth Opportunities Fund | |
| For the Year | | | For the Year | | | For the Year | | | For the Year | |
| Ended | | | Ended | | | Ended | | | Ended | |
| March 31, 2014 | | | March 31, 2013 | | | March 31, 2014 | | | March 31, 2013 | |
| Shares | | | Dollars | | | Shares | | | Dollars | | | Shares | | | Dollars | | | Shares | | | Dollars | |
| | | | | | | | | | | | | | | | | | | | | | | |
| | 3,233,110 | | | $ | 101,371,386 | | | | 112,274 | | | $ | 2,873,473 | | | | 224,602 | | | $ | 6,685,637 | | | | 180,224 | | | $ | 4,566,737 | |
| | 4,327,516 | | | | 125,354,407 | | | | — | | | | — | | | | — | | | | — | | | | 572,780 | | | | 14,817,828 | |
| | 5,319 | | | | 152,669 | | | | 332 | | | | 8,190 | | | | 58,105 | | | | 1,796,018 | | | | 202,698 | | | | 4,816,112 | |
| | (1,167,836 | ) | | | (37,461,827 | ) | | | (115,378 | ) | | | (2,748,855 | ) | | | (1,581,923 | ) | | | (42,548,372 | ) | | | (626,709 | ) | | | (15,670,784 | ) |
| | 6,398,109 | | | | 189,416,635 | | | | (2,772 | ) | | | 132,808 | | | | (1,299,216 | ) | | | (34,066,717 | ) | | | 328,993 | | | | 8,529,893 | |
| | | | | | | | | | | | | | | | | | | | | | | | | | | | | | | |
| | — | | | | — | | | | — | | | | — | | | | — | | | | — | | | | — | | | | — | |
| | — | | | | — | | | | — | | | | — | | | | — | | | | — | | | | — | | | | — | |
| | — | | | | — | | | | — | | | | — | | | | — | | | | — | | | | — | | | | — | |
| | — | | | | — | | | | — | | | | — | | | | — | | | | — | | | | — | | | | — | |
| | — | | | | — | | | | — | | | | — | | | | — | | | | — | | | | — | | | | — | |
| | | | | | | | | | | | | | | | | | | | | | | | | | | | | | | |
| | 147,209 | | | | 4,739,202 | | | | 2,376 | | | | 62,009 | | | | 54,444 | | | | 1,488,773 | | | | 55,149 | | | | 1,263,952 | |
| | 24,433 | | | | 701,039 | | | | — | | | | — | | | | — | | | | — | | | | 20,324 | | | | 483,997 | |
| | 34 | | | | 971 | | | | 1 | | | | 8 | | | | 15,674 | | | | 436,672 | | | | 25,496 | | | | 552,757 | |
| | (9,911 | ) | | | (318,605 | ) | | | (183 | ) | | | (4,090 | ) | | | (65,332 | ) | | | (1,778,183 | ) | | | (65,099 | ) | | | (1,468,714 | ) |
| | 161,765 | | | | 5,122,607 | | | | 2,194 | | | | 57,927 | | | | 4,786 | | | | 147,262 | | | | 35,870 | | | | 831,992 | |
| | | | | | | | | | | | | | | | | | | | | | | | | | | | | | | |
| | 1,651,183 | | | | 54,120,220 | | | | 617,934 | | | | 14,769,988 | | | | 2,057,827 | | | | 57,663,059 | | | | 269,749 | | | | 6,812,833 | |
| | 215,356 | | | | 6,308,617 | | | | 23,156,289 | | | | 361,810,951 | | | | — | | | | — | | | | 1,938,310 | | | | 50,516,751 | |
| | 173,246 | | | | 5,029,335 | | | | 44,855 | | | | 1,117,779 | | | | 116,122 | | | | 3,627,585 | | | | 85,054 | | | | 2,039,117 | |
| | (1,962,109 | ) | | | (61,819,037 | ) | | | (3,070,514 | ) | | | (74,072,119 | ) | | | (678,318 | ) | | | (20,781,626 | ) | | | (1,471,416 | ) | | | (38,150,160 | ) |
| | 77,676 | | | | 3,639,135 | | | | 20,748,564 | | | | 303,626,599 | | | | 1,495,631 | | | | 40,509,018 | | | | 821,697 | | | | 21,218,541 | |
| | | | | | | | | | | | | | | | | | | | | | | | | | | | | | | |
| | — | | | | — | | | | 25,967 | | | | 610,958 | | | | — | | | | — | | | | — | | | | — | |
| | — | | | | — | | | | (148,721 | ) | | | (3,480,856 | ) | | | — | | | | — | | | | — | | | | — | |
| | — | | | | — | | | | (23,156,289 | ) | | | (361,810,951 | ) | | | — | | | | — | | | | — | | | | — | |
| | — | | | | — | | | | (23,279,043 | ) | | | (364,680,849 | ) | | | — | | | | — | | | | — | | | | — | |
| | | | | | | | | | | | | | | | | | | | | | | | | | | | | | | |
| | 533,929 | | | | 16,892,087 | | | | 476,520 | | | | 11,769,115 | | | | 553,354 | | | | 16,857,399 | | | | 2,162,798 | | | | 56,497,953 | |
| | 966,069 | | | | 28,372,347 | | | | — | | | | — | | | | — | | | | — | | | | — | | | | — | |
| | 195 | | | | 5,691 | | | | 17 | | | | 422 | | | | 147,309 | | | | 4,634,843 | | | | 222,045 | | | | 5,355,334 | |
| | (663,046 | ) | | | (21,730,593 | ) | | | (1,704,884 | ) | | | (41,146,803 | ) | | | (631,902 | ) | | | (19,382,731 | ) | | | (1,689,678 | ) | | | (44,192,360 | ) |
| | 837,147 | | | | 23,539,532 | | | | (1,228,347 | ) | | | (29,377,266 | ) | | | 68,761 | | | | 2,109,511 | | | | 695,165 | | | | 17,660,927 | |
| | 7,474,697 | | | $ | 221,717,909 | | | | (3,759,404 | ) | | $ | (90,240,781 | ) | | | 269,962 | | | $ | 8,699,074 | | | | 1,881,725 | | | $ | 48,241,353 | |
Statements of Changes in Net Assets - Capital Stock Activity (Continued)
| | | Touchstone | |
| | | International Value Fund | |
| | | For the Year | | | For the Eight Months | | | For the Year | |
| | | Ended | | | Ended | | | Ended | |
| | | March 31, 2014 | | | March 31, 2013(A) | | | July 31, 2012 | |
| | | Shares | | | Dollars | | | Shares | | | Dollars | | | Shares | | | Dollars | |
| Class A(B) | | | | | | | | | | | | | | | | | | | | | | | | |
| Proceeds from Shares issued | | | 29,607 | | | $ | 247,397 | | | | 26,590 | | | $ | 200,145 | | | | 58,685 | | | $ | 425,756 | |
| Proceeds from Shares issued in connection with merger(C) | | | — | | | | — | | | | 20,734 | | | | 154,261 | | | | — | | | | — | |
| Reinvestment of distributions | | | 6,444 | | | | 56,838 | | | | 24,523 | | | | 185,642 | | | | 32,566 | �� | | | 220,471 | |
| Cost of Shares redeemed | | | (214,235 | ) | | | (1,807,090 | ) | | | (261,494 | ) | | | (1,966,252 | ) | | | (279,814 | ) | | | (1,978,776 | ) |
| Change in Class A Share Transactions | | | (178,184 | ) | | | (1,502,855 | ) | | | (189,647 | ) | | | (1,426,204 | ) | | | (188,563 | ) | | | (1,332,549 | ) |
| Class B(B) | | | | | | | | | | | | | | | | | | | | | | | | |
| Proceeds from Shares issued | | | — | | | | — | | | | — | | | | — | | | | 760 | | | | 5,040 | |
| Reinvestment of distributions | | | — | | | | — | | | | — | | | | — | | | | 249 | | | | 1,675 | |
| Cost of Shares redeemed | | | — | | | | — | | | | (2,292 | ) | | | (16,594 | ) | | | (19,681 | ) | | | (140,313 | ) |
| Cost of Shares redeemed in connection with merger(C) | | | — | | | | — | | | | (20,936 | ) | | | (154,261 | ) | | | — | | | | — | |
| Change in Class B Share Transactions | | | — | | | | — | | | | (23,228 | ) | | | (170,855 | ) | | | (18,672 | ) | | | (133,598 | ) |
| Class C | | | | | | | | | | | | | | | | | | | | | | | | |
| Proceeds from Shares issued | | | 5,415 | | | | 41,269 | | | | 7,598 | | | | 53,916 | | | | 80 | | | | 577 | |
| Proceeds from Shares issued in connection with merger(C) | | | — | | | | — | | | | — | | | | — | | | | — | | | | — | |
| Reinvestment of distributions | | | 144 | | | | 1,176 | | | | 760 | | | | 5,380 | | | | 592 | | | | 3,764 | |
| Cost of Shares redeemed | | | (10,603 | ) | | | (81,715 | ) | | | (3,522 | ) | | | (24,767 | ) | | | (10,005 | ) | | | (68,022 | ) |
| Change in Class C Share Transactions | | | (5,044 | ) | | | (39,270 | ) | | | 4,836 | | | | 34,529 | | | | (9,333 | ) | | | (63,681 | ) |
| Class Y(B) | | | | | | | | | | | | | | | | | | | | | | | | |
| Proceeds from Shares issued | | | 1,285,819 | | | | 11,605,788 | | | | 197,996 | | | | 1,450,615 | | | | 1,674,072 | | | | 11,922,066 | |
| Proceeds from Shares issued in connection with merger(C) | | | — | | | | — | | | | — | | | | — | | | | — | | | | — | |
| Reinvestment of distributions | | | 36,098 | | | | 318,381 | | | | 96,638 | | | | 731,549 | | | | 563,720 | | | | 3,810,747 | |
| Cost of Shares redeemed | | | (663,667 | ) | | | (5,346,773 | ) | | | (13,645,820 | ) | | | (101,181,970 | ) | | | (5,663,691 | ) | | | (40,021,546 | ) |
| Change in Class Y Share Transactions | | | 658,250 | | | | 6,577,396 | | | | (13,351,186 | ) | | | (98,999,806 | ) | | | (3,425,899 | ) | | | (24,288,733 | ) |
| Institutional Class(D) | | | | | | | | | | | | | | | | | | | | | | | | |
| Proceeds from Shares issued | | | 905,130 | | | | 7,621,905 | | | | 13,290,532 | | | | 100,202,828 | | | | — | | | | — | |
| Reinvestment of distributions | | | 121,325 | | | | 1,070,089 | | | | 301,490 | | | | 2,282,278 | | | | — | | | | — | |
| Cost of Shares redeemed | | | (3,544,077 | ) | | | (29,611,997 | ) | | | (1,920,915 | ) | | | (14,697,639 | ) | | | — | | | | — | |
| Change in Institutional Class Share Transactions | | | (2,517,622 | ) | | | (20,920,003 | ) | | | 11,671,107 | | | | 87,787,467 | | | | — | | | | — | |
| Change from Share Transactions | | | (2,042,600 | ) | | $ | (15,884,732 | ) | | | (1,888,118 | ) | | $ | (12,774,869 | ) | | | (3,642,467 | ) | | $ | (25,818,561 | ) |
(A)The Fund changed its fiscal year from July 31 to March 31. See Note 11 in the Notes to Financial Statements.
(B)Effective September 10, 2012, Touchstone International Value Fund's Class B shares were exchanged for Class A shares and Institutional Class shares became Class Y shares. Amounts prior to September 10, 2012 of Class Y shares represent the former Fifth Third Institutional Class shares. See Note 11 in the Notes to Financial Statements.
(C)See Note 11 in the Notes to Financial Statements.
(D)The Touchstone International Value Fund began issuing Institutional Class shares on September 10, 2012.
See accompanying Notes to Financial Statements.
Statements of Changes in Net Assets - Capital Stock Activity (Continued)
| Touchstone | | | Touchstone | |
| Large Cap Growth Fund | | | Mid Cap Growth Fund | |
| For the Year | | | For the Year | | | For the Year | | | For the Year | |
| Ended | | | Ended | | | Ended | | | Ended | |
| March 31, 2014 | | | March 31, 2013 | | | March 31, 2014 | | | March 31, 2013 | |
| Shares | | | Dollars | | | Shares | | | Dollars | | | Shares | | | Dollars | | | Shares | | | Dollars | |
| | | | | | | | | | | | | | | | | | | | | | | |
| | 1,123,148 | | | $ | 34,813,790 | | | | 2,222,843 | | | $ | 60,535,369 | | | | 1,942,968 | | | $ | 49,444,583 | | | | 1,794,520 | | | $ | 39,393,178 | |
| | — | | | | — | | | | 2,188,990 | | | | 60,528,345 | | | | — | | | | — | | | | — | | | | — | |
| | 743,623 | | | | 22,704,422 | | | | 38,426 | | | | 1,006,760 | | | | 1,108,223 | | | | 27,317,700 | | | | 824,088 | | | | 17,223,430 | |
| | (2,791,139 | ) | | | (85,461,658 | ) | | | (3,075,425 | ) | | | (83,265,864 | ) | | | (4,115,507 | ) | | | (101,578,937 | ) | | | (4,683,199 | ) | | | (102,084,460 | ) |
| | (924,368 | ) | | | (27,943,446 | ) | | | 1,374,834 | | | | 38,804,610 | | | | (1,064,316 | ) | | | (24,816,654 | ) | | | (2,064,591 | ) | | | (45,467,852 | ) |
| | | | | | | | | | | | | | | | | | | | | | | | | | | | | | | |
| | 5,030 | | | | 145,108 | | | | 156 | | | | 4,132 | | | | 7,694 | | | | 149,046 | | | | 5,963 | | | | 100,899 | |
| | 8,824 | | | | 254,580 | | | | — | | | | — | | | | 21,555 | | | | 417,516 | | | | 20,246 | | | | 342,555 | |
| | (135,149 | ) | | | (3,963,000 | ) | | | (170,437 | ) | | | (4,422,468 | ) | | | (110,587 | ) | | | (2,229,438 | ) | | | (296,664 | ) | | | (5,298,747 | ) |
| | — | | | | — | | | | — | | | | — | | | | — | | | | — | | | | — | | | | — | |
| | (121,295 | ) | | | (3,563,312 | ) | | | (170,281 | ) | | | (4,418,336 | ) | | | (81,338 | ) | | | (1,662,876 | ) | | | (270,455 | ) | | | (4,855,293 | ) |
| | | | | | | | | | | | | | | | | | | | | | | | | | | | | | | |
| | 324,155 | | | | 9,355,889 | | | | 602,640 | | | | 15,503,826 | | | | 494,544 | | | | 9,680,428 | | | | 379,773 | | | | 6,592,246 | |
| | — | | | | — | | | | 39,069 | | | | 1,021,152 | | | | — | | | | — | | | | — | | | | — | |
| | 237,079 | | | | 6,763,867 | | | | — | | | | — | | | | 705,343 | | | | 13,401,513 | | | | 454,431 | | | | 7,593,546 | |
| | (765,143 | ) | | | (22,150,290 | ) | | | (1,104,532 | ) | | | (28,341,315 | ) | | | (1,355,516 | ) | | | (26,975,200 | ) | | | (2,209,885 | ) | | | (39,087,303 | ) |
| | (203,909 | ) | | | (6,030,534 | ) | | | (462,823 | ) | | | (11,816,337 | ) | | | (155,629 | ) | | | (3,893,259 | ) | | | (1,375,681 | ) | | | (24,901,511 | ) |
| | | | | | | | | | | | | | | | | | | | | | | | | | | | | | | |
| | 2,472,115 | | | | 76,607,666 | | | | 4,221,132 | | | | 116,536,395 | | | | 4,981,764 | | | | 125,685,812 | | | | 3,268,468 | | | | 73,633,412 | |
| | — | | | | — | | | | 6,984,781 | | | | 195,449,178 | | | | — | | | | — | | | | — | | | | — | |
| | 1,531,276 | | | | 47,463,243 | | | | 124,261 | | | | 3,312,864 | | | | 893,059 | | | | 22,397,917 | | | | 386,674 | | | | 8,185,883 | |
| | (4,080,740 | ) | | | (127,807,319 | ) | | | (7,049,406 | ) | | | (195,138,217 | ) | | | (2,975,353 | ) | | | (76,834,857 | ) | | | (2,252,318 | ) | | | (49,413,318 | ) |
| | (77,349 | ) | | | (3,736,410 | ) | | | 4,280,768 | | | | 120,160,220 | | | | 2,899,470 | | | | 71,248,872 | | | | 1,402,824 | | | | 32,405,977 | |
| | | | | | | | | | | | | | | | | | | | | | | | | | | | | | | |
| | — | | | | — | | | | — | | | | — | | | | 155,510 | | | | 4,050,162 | | | | 876,872 | | | | 19,715,384 | |
| | — | | | | — | | | | — | | | | — | | | | 137,626 | | | | 3,464,048 | | | | 114,397 | | | | 2,425,218 | |
| | — | | | | — | | | | — | | | | — | | | | (615,940 | ) | | | (15,560,564 | ) | | | (501,132 | ) | | | (11,265,019 | ) |
| | — | | | | — | | | | — | | | | — | | | | (322,804 | ) | | | (8,046,354 | ) | | | 490,137 | | | | 10,875,583 | |
| | (1,326,921 | ) | | $ | (41,273,702 | ) | | | 5,022,498 | | | $ | 142,730,157 | | | | 1,275,383 | | | $ | 32,829,729 | | | | (1,817,766 | ) | | $ | (31,943,096 | ) |
Statements of Changes in Net Assets - Capital Stock Activity (Continued)
| | | | | | Touchstone | | | | |
| | | | | | Small Cap Growth Fund | | | | |
| | | For the Year | | | For the Eight Months | | | For the Year | |
| | | Ended | | | Ended | | | Ended | |
| | | March 31, 2014 | | | March 31, 2013(A) | | | July 31, 2012 | |
| | | Shares | | | Dollars | | | Shares | | | Dollars | | | Shares | | | Dollars | |
| Class A(B) | | | | | | | | | | | | | | | | | | | | | | | | |
| Proceeds from Shares issued | | | 3,189,765 | | | $ | 16,400,309 | | | | 349,757 | | | $ | 1,570,570 | | | | 1,111,506 | | | $ | 4,596,130 | |
| Proceeds from Shares issued in connection with merger(C) | | | 1,739,693 | | | | 8,196,736 | | | | 31,683 | | | | 143,842 | | | | — | | | | — | |
| Reinvestment of distributions | | | 362,909 | | | | 1,709,144 | | | | 156,038 | | | | 662,719 | | | | — | | | | — | |
| Cost of Shares redeemed | | | (1,493,248 | ) | | | (7,236,957 | ) | | | (1,122,269 | ) | | | (5,095,473 | ) | | | (1,855,492 | ) | | | (7,747,734 | ) |
| Change in Class A Share Transactions | | | 3,799,119 | | | | 19,069,232 | | | | (584,791 | ) | | | (2,718,342 | ) | | | (743,986 | ) | | | (3,151,604 | ) |
| Class B(B) | | | | | | | | | | | | | | | | | | | | | | | | |
| Proceeds from Shares issued | | | — | | | | — | | | | — | | | | — | | | | 1,027 | | | | 3,419 | |
| Reinvestment of distributions | | | — | | | | — | | | | — | | | | — | | | | — | | | | — | |
| Cost of Shares redeemed | | | — | | | | — | | | | (2,255 | ) | | | (8,898 | ) | | | (105,845 | ) | | | (370,269 | ) |
| Cost of Shares redeemed in connection with merger(C) | | | — | | | | — | | | | (36,022 | ) | | | (143,842 | ) | | | — | | | | — | |
| Change in Class B Share Transactions | | | — | | | | — | | | | (38,277 | ) | | | (152,740 | ) | | | (104,818 | ) | | | (366,850 | ) |
| Class C | | | | | | | | | | | | | | | | | | | | | | | | |
| Proceeds from Shares issued | | | 621,723 | | | | 2,672,634 | | | | 61,800 | | | | 234,905 | | | | 157,093 | | | | 581,866 | |
| Proceeds from Shares issued in connection with merger(C) | | | 427,646 | | | | 1,723,545 | | | | — | | | | — | | | | — | | | | — | |
| Reinvestment of distributions | | | 79,640 | | | | 321,556 | | | | 29,506 | | | | 109,265 | | | | — | | | | — | |
| Cost of Shares redeemed | | | (289,351 | ) | | | (1,235,254 | ) | | | (281,272 | ) | | | (1,113,971 | ) | | | (613,063 | ) | | | (2,258,494 | ) |
| Change in Class C Share Transactions | | | 839,658 | | | | 3,482,481 | | | | (189,966 | ) | | | (769,801 | ) | | | (455,970 | ) | | | (1,676,628 | ) |
| Class Y(B) | | | | | | | | | | | | | | | | | | | | | | | | |
| Proceeds from Shares issued | | | 5,615,489 | | | | 31,321,212 | | | | 642,908 | | | | 3,133,798 | | | | 1,583,163 | | | | 7,015,294 | |
| Proceeds from Shares issued in connection with merger(C) | | | 3,022,354 | | | | 15,683,603 | | | | — | | | | — | | | | — | | | | — | |
| Reinvestment of distributions | | | 410,137 | | | | 2,118,342 | | | | 184,691 | | | | 854,583 | | | | — | | | | — | |
| Cost of Shares redeemed | | | (6,082,905 | ) | | | (32,782,345 | ) | | | (2,428,927 | ) | | | (11,714,100 | ) | | | (2,285,257 | ) | | | (10,377,965 | ) |
| Change in Class Y Share Transactions | | | 2,965,075 | | | | 16,340,812 | | | | (1,601,328 | ) | | | (7,725,719 | ) | | | (702,094 | ) | | | (3,362,671 | ) |
| Institutional Class(D) | | | | | | | | | | | | | | | | | | | | | | | | |
| Proceeds from Shares issued | | | 2,520,844 | | | | 14,095,605 | | | | 508 | | | | 2,500 | | | | — | | | | — | |
| Reinvestment of distributions | | | 257,444 | | | | 1,333,085 | | | | 30 | | | | 137 | | | | — | | | | — | |
| Cost of Shares redeemed | | | (645,826 | ) | | | (3,598,663 | ) | | | — | | | | — | | | | — | | | | — | |
| Change in Institutional Class Share Transactions | | | 2,132,462 | | | | 11,830,027 | | | | 538 | | | | 2,637 | | | | — | | | | — | |
| Change from Share Transactions | | | 9,736,314 | | | $ | 50,722,552 | | | | (2,413,824 | ) | | $ | (11,363,965 | ) | | | (2,006,868 | ) | | $ | (8,557,753 | ) |
(A)The Fund changed its fiscal year from July 31 to March 31. See Note 11 in the Notes to Financial Statements.
(B)Effective September 10, 2012, Class B shares were exchanged for Class A shares and Institutional Class shares became Class Y shares. Amounts prior to September 10, 2012 of Class Y shares represent the former Fifth Third Institutional Class shares. See Note 11 in the Notes to Financial Statements.
(C)See Note 11 in the Notes to Financial Statements.
(D) The Fund began issuing Institutional Class shares on September 10, 2012.
See accompanying Notes to Financial Statements.
Financial Highlights
Touchstone Flexible Income Fund—Class A
Selected Data for a Share Outstanding Throughout Each Period |
| | | | | | Eight Months | | | | |
| | | Year Ended | | | Ended | | | | |
| | | March 31, | | | March 31, | | | Year Ended July 31, | |
| | | 2014 | | | 2013(A) | | | 2012 | | | 2011 | | | 2010 | | | 2009 | |
| Net asset value at beginning of period | | $ | 10.94 | | | $ | 10.76 | | | $ | 10.47 | | | $ | 10.00 | | | $ | 8.93 | | | $ | 9.36 | |
| Income (loss) from investment operations: | | | | | | | | | | | | | | | | | | | | | | | | |
| Net investment income | | | 0.51 | | | | 0.35 | (B) | | | 0.49 | (C) | | | 0.52 | (C) | | | 0.51 | (C) | | | 0.56 | (C) |
| Net realized and unrealized gains (losses) on investments | | | (0.37 | ) | | | 0.16 | | | | 0.31 | | | | 0.44 | | | | 1.26 | | | | (0.39 | ) |
| Total from investment operations | | | 0.14 | | | | 0.51 | | | | 0.80 | | | | 0.96 | | | | 1.77 | | | | 0.17 | |
| Distributions from: | | | | | | | | | | | | | | | | | | | | | | | | |
| Net investment income | | | (0.48 | ) | | | (0.33 | ) | | | (0.51 | ) | | | (0.49 | ) | | | (0.70 | ) | | | (0.59 | ) |
| Realized capital gains | | | — | | | | — | | | | — | | | | — | | | | — | | | | (0.01 | ) |
| Total distributions | | | (0.48 | ) | | | (0.33 | ) | | | (0.51 | ) | | | (0.49 | ) | | | (0.70 | ) | | | (0.60 | ) |
| Net asset value at end of period | | $ | 10.60 | | | $ | 10.94 | | | $ | 10.76 | | | $ | 10.47 | | | $ | 10.00 | | | $ | 8.93 | |
| Total return(D) | | | 1.45 | % | | | 4.77 | %(E) | | | 7.86 | % | | | 9.90 | % | | | 20.27 | % | | | 3.02 | % |
| Ratios and supplemental data: | | | | | | | | | | | | | | | | | | | | | | | | |
| Net assets at end of period (000's) | | $ | 25,928 | | | $ | 41,301 | | | $ | 49,458 | | | $ | 25,400 | | | $ | 19,461 | | | $ | 13,406 | |
| Ratio to average net assets: | | | | | | | | | | | | | | | | | | | | | | | | |
| Net expenses | | | 0.98 | % | | | 0.94 | %(F) | | | 0.95 | % | | | 1.02 | % | | | 1.12 | % | | | 1.18 | % |
| Gross expenses | | | 1.35 | % | | | 1.37 | %(F) | | | 1.60 | % | | | 1.61 | % | | | 1.65 | % | | | 1.65 | % |
| Net investment income | | | 4.82 | % | | | 4.76 | %(B)(F) | | | 4.65 | % | | | 4.99 | % | | | 5.27 | % | | | 7.05 | % |
| Portfolio turnover rate | | | 44 | % | | | 41 | %(E) | | | 47 | % | | | 42 | % | | | 31 | % | | | 32 | % |
Touchstone Flexible Income Fund—Class C
Selected Data for a Share Outstanding Throughout Each Period |
| | | | | | Eight Months | | | | |
| | | Year Ended | | | Ended | | | | |
| | | March 31, | | | March 31, | | | Year Ended July 31, | |
| | | 2014 | | | 2013(A) | | | 2012 | | | 2011 | | | 2010 | | | 2009 | |
| Net asset value at beginning of period | | $ | 10.82 | | | $ | 10.65 | | | $ | 10.36 | | | $ | 9.90 | | | $ | 8.85 | | | $ | 9.29 | |
| Income (loss) from investment operations: | | | | | | | | | | | | | | | | | | | | | | | | |
| Net investment income | | | 0.43 | | | | 0.29 | (B) | | | 0.40 | (C) | | | 0.44 | (C) | | | 0.43 | (C) | | | 0.49 | (C) |
| Net realized and unrealized gains (losses) on investments | | | (0.37 | ) | | | 0.15 | | | | 0.32 | | | | 0.44 | | | | 1.25 | | | | (0.38 | ) |
| Total from investment operations | | | 0.06 | | | | 0.44 | | | | 0.72 | | | | 0.88 | | | | 1.68 | | | | 0.11 | |
| Distributions from: | | | | | | | | | | | | | | | | | | | | | | | | |
| Net investment income | | | (0.41 | ) | | | (0.27 | ) | | | (0.43 | ) | | | (0.42 | ) | | | (0.63 | ) | | | (0.54 | ) |
| Realized capital gains | | | — | | | | — | | | | — | | | | — | | | | — | | | | (0.01 | ) |
| Total distributions | | | (0.41 | ) | | | (0.27 | ) | | | (0.43 | ) | | | (0.42 | ) | | | (0.63 | ) | | | (0.55 | ) |
| Net asset value at end of period | | $ | 10.47 | | | $ | 10.82 | | | $ | 10.65 | | | $ | 10.36 | | | $ | 9.90 | | | $ | 8.85 | |
| Total return(D) | | | 0.61 | % | | | 4.20 | %(E) | | | 7.16 | % | | | 9.09 | % | | | 19.20 | % | | | 2.29 | % |
| Ratios and supplemental data: | | | | | | | | | | | | | | | | | | | | | | | | |
| Net assets at end of period (000's) | | $ | 21,043 | | | $ | 26,087 | | | $ | 25,115 | | | $ | 16,818 | | | $ | 12,504 | | | $ | 8,468 | |
| Ratio to average net assets: | | | | | | | | | | | | | | | | | | | | | | | | |
| Net expenses | | | 1.74 | % | | | 1.69 | %(F) | | | 1.70 | % | | | 1.77 | % | | | 1.87 | % | | | 1.93 | % |
| Gross expenses | | | 2.09 | % | | | 2.16 | %(F) | | | 2.35 | % | | | 2.36 | % | | | 2.40 | % | | | 2.40 | % |
| Net investment income | | | 4.07 | % | | | 4.01 | %(B)(F) | | | 3.82 | % | | | 4.25 | % | | | 4.53 | % | | | 6.32 | % |
| Portfolio turnover rate | | | 44 | % | | | 41 | %(E) | | | 47 | % | | | 42 | % | | | 31 | % | | | 32 | % |
| (A) | The Fund changed its fiscal year end from July 31 to March 31. See Note 11 in the Notes to Financial Statements. |
| (B) | Reflects the impact of a corporate action event that resulted in a one-time increase to net investment income. If the corporate action event had not occurred, the Class A and Class C net investment income per share and ratio of net investment income to average net assets would have been lower by $0.01 and 0.13%, respectively. |
| (C) | The net investment income per share is based on average shares outstanding for the period. |
| (D) | Total returns shown exclude the effect of applicable sales loads. If these charges were included, the returns would be lower. |
See accompanying Notes to Financial Statements.
Financial Highlights (Continued)
Touchstone Flexible Income Fund - Class Y
Selected Data for a Share Outstanding Throughout Each Period |
| | | | | | Eight Months | | | | |
| | | Year Ended | | | Ended | | | | |
| | | March 31, | | | March 31, | | | Year Ended July 31, | |
| | | 2014 | | | 2013(A)(B) | | | 2012 | | | 2011 | | | 2010 | | | 2009 | |
| Net asset value at beginning of period | | $ | 10.97 | | | $ | 10.79 | | | $ | 10.49 | | | $ | 10.02 | | | $ | 8.95 | | | $ | 9.38 | |
| Income (loss) from investment operations: | | | | | | | | | | | | | | | | | | | | | | | | |
| Net investment income | | | 0.54 | | | | 0.37 | (C) | | | 0.50 | (D) | | | 0.54 | (D) | | | 0.53 | (D) | | | 0.57 | (D) |
| Net realized and unrealized gains (losses) on investments | | | (0.38 | ) | | | 0.16 | | | | 0.33 | | | | 0.45 | | | | 1.26 | | | | (0.38 | ) |
| Total from investment operations | | | 0.16 | | | | 0.53 | | | | 0.83 | | | | 0.99 | | | | 1.79 | | | | 0.19 | |
| Distributions from: | | | | | | | | | | | | | | | | | | | | | | | | |
| Net investment income | | | (0.51 | ) | | | (0.35 | ) | | | (0.53 | ) | | | (0.52 | ) | | | (0.72 | ) | | | (0.61 | ) |
| Realized capital gains | | | — | | | | — | | | | — | | | | — | | | | — | | | | (0.01 | ) |
| Total distributions | | | (0.51 | ) | | | (0.35 | ) | | | (0.53 | ) | | | (0.52 | ) | | | (0.72 | ) | | | (0.62 | ) |
| Net asset value at end of period | | $ | 10.62 | | | $ | 10.97 | | | $ | 10.79 | | | $ | 10.49 | | | $ | 10.02 | | | $ | 8.95 | |
| Total return | | | 1.63 | % | | | 4.96 | %(E) | | | 8.21 | % | | | 10.15 | % | | | 20.39 | % | | | 3.38 | % |
| Ratios and supplemental data: | | | | | | | | | | | | | | | | | | | | | | | | |
| Net assets at end of period (000's) | | $ | 151,652 | | | $ | 199,293 | | | $ | 200,325 | | | $ | 122,125 | | | $ | 80,807 | | | $ | 59,493 | |
| Ratio to average net assets: | | | | | | | | | | | | | | | | | | | | | | | | |
| Net expenses | | | 0.71 | % | | | 0.64 | %(F) | | | 0.70 | % | | | 0.77 | % | | | 0.87 | % | | | 0.93 | % |
| Gross expenses | | | 1.00 | % | | | 1.05 | %(F) | | | 1.35 | % | | | 1.36 | % | | | 1.40 | % | | | 1.40 | % |
| Net investment income | | | 5.10 | % | | | 5.06 | %(C)(F) | | | 4.80 | % | | | 5.22 | % | | | 5.51 | % | | | 7.29 | % |
| Portfolio turnover rate | | | 44 | % | | | 41 | %(E) | | | 47 | % | | | 42 | % | | | 31 | % | | | 32 | % |
| Touchstone Flexible Income Fund—Institutional Class |
| Selected Data for a Share Outstanding Throughout Each Period |
| | | Year Ended | | | Period Ended | |
| | | March 31, | | | March 31, | |
| | | 2014 | | | 2013(B)(G) | |
| Net asset value at beginning of period | | $ | 10.96 | | | $ | 10.86 | |
| Income (loss) from investment operations: | | | | | | | | |
| Net investment income | | | 0.54 | | | | 0.30 | (C) |
| Net realized and unrealized gains (losses) on investments | | | (0.36 | ) | | | 0.12 | |
| Total from investment operations | | | 0.18 | | | | 0.42 | |
| Distributions from: | | | | | | | | |
| Net investment income | | | (0.52 | ) | | | (0.32 | ) |
| Net asset value at end of period | | $ | 10.62 | | | $ | 10.96 | |
| Total return | | | 1.81 | % | | | 3.93 | %(E) |
| Ratios and supplemental data: | | | | | | | | |
| Net assets at end of period (000's) | | $ | 41,361 | | | $ | 20,589 | |
| Ratio to average net assets: | | | | | | | | |
| Net expenses | | | 0.65 | % | | | 0.59 | %(F) |
| Gross expenses | | | 0.95 | % | | | 1.03 | %(F) |
| Net investment income | | | 5.16 | % | | | 5.11 | %(C)(F) |
| Portfolio turnover rate | | | 44 | % | | | 41 | %(E) |
| (A) | Effective September 10, 2012, Institutional Class shares were renamed Class Y shares. See Note 11 in the Notes to Financial Statements. |
| (B) | The Fund changed its fiscal year end from July 31 to March 31. See Note 11 in the Notes to Financial Statements. |
| (C) | Reflects the impact of a corporate action event that resulted in a one-time increase to net investment income. If the corporate action event had not occurred, the Class Y and Institutional Class net investment income per share and ratio of net investment income to average net assets would have been lower by $0.01 and 0.13%, respectively. |
| (D) | The net investment income per share is based on average shares outstanding for the period. |
| (G) | The Fund began issuing Institutional Class shares on September 10, 2012. |
See accompanying Notes to Financial Statements.
Financial Highlights (Continued)
| Touchstone Focused Fund—Class A |
| Selected Data for a Share Outstanding Throughout Each Period |
| | | | | | Year Ended March 31, | |
| | | 2014 | | | 2013 | | | 2012 | | | 2011 | | | 2010 | |
| Net asset value at beginning of period | | $ | 27.55 | | | $ | 23.63 | | | $ | 21.92 | | | $ | 21.49 | | | $ | 14.44 | |
| Income from investment operations: | | | | | | | | | | | | | | | | | | | | |
| Net investment income(A) | | | 0.11 | | | | 0.16 | | | | 0.12 | | | | 0.08 | | | | 0.10 | |
| Net realized and unrealized gains on investments | | | 7.46 | | | | 3.79 | (B) | | | 1.67 | | | | 1.66 | | | | 7.08 | |
| Total from investment operations | | | 7.57 | | | | 3.95 | | | | 1.79 | | | | 1.74 | | | | 7.18 | |
| Distributions from: | | | | | | | | | | | | | | | | | | | | |
| Net investment income | | | (0.25 | ) | | | (0.03 | ) | | | (0.24 | ) | | | (0.05 | ) | | | (0.13 | ) |
| Realized capital gains | | | — | | | | — | | | | — | | | | (1.26 | ) | | | — | |
| Total distributions | | | (0.25 | ) | | | (0.03 | ) | | | (0.24 | ) | | | (1.31 | ) | | | (0.13 | ) |
| Capital Contribution | | | — | | | | — | | | | 0.16 | (C) | | | — | | | | — | |
| Net asset value at end of period | | $ | 34.87 | | | $ | 27.55 | | | $ | 23.63 | | | $ | 21.92 | | | $ | 21.49 | |
| Total return(D) | | | 27.67 | % | | | 16.75 | %(B) | | | 9.08 | %(C) | | | 9.34 | % | | | 49.80 | % |
| Ratios and supplemental data: | | | | | | | | | | | | | | | | | | | | |
| Net assets at end of period (000's) | | $ | 233,841 | | | $ | 8,497 | | | $ | 7,352 | | | $ | 12,226 | | | $ | 33,875 | |
| Ratio to average net assets: | | | | | | | | | | | | | | | | | | | | |
| Net expenses | | | 1.20 | % | | | 1.20 | % | | | 1.20 | % | | | 1.20 | % | | | 1.20 | % |
| Gross expenses | | | 1.46 | % | | | 1.90 | % | | | 1.44 | % | | | 1.42 | % | | | 1.38 | % |
| Net investment income | | | 0.35 | % | | | 0.66 | % | | | 0.58 | % | | | 0.40 | % | | | 0.49 | % |
| Portfolio turnover rate | | | 27 | %(E) | | | 189 | % | | | 99 | % | | | 115 | % | | | 318 | % |
| Touchstone Focused Fund—Class C |
| Selected Data for a Share Outstanding Throughout Each Period |
| | | Year Ended | | | Period Ended | |
| | | March 31, | | | March 31, | |
| | | 2014 | | | 2013(F) | |
| Net asset value at beginning of period | | $ | 27.33 | | | $ | 22.61 | |
| Income (loss) from investment operations: | | | | | | | | |
| Net investment loss(A) | | | (0.13 | ) | | | (0.02 | ) |
| Net realized and unrealized gains on investments | | | 7.38 | | | | 4.80 | (B) |
| Total from investment operations | | | 7.25 | | | | 4.78 | |
| Distributions from: | | | | | | | | |
| Net investment income | | | (0.26 | ) | | | (0.06 | ) |
| Net asset value at end of period | | $ | 34.32 | | | $ | 27.33 | |
| Total return(D) | | | 26.72 | % | | | 21.19 | %(B)(G) |
| Ratios and supplemental data: | | | | | | | | |
| Net assets at end of period (000's) | | $ | 5,626 | | | $ | 60 | |
| Ratio to average net assets: | | | | | | | | |
| Net expenses | | | 1.95 | % | | | 1.95 | %(H) |
| Gross expenses | | | 2.84 | % | | | 258.39 | %(H) |
| Net investment loss | | | (0.40 | )% | | | (0.09 | )%(H) |
| Portfolio turnover rate | | | 27 | %(E) | | | 189 | % |
| (A) | The net investment income (loss) per share is based on average shares outstanding for the period. |
| (B) | Net realized gains (losses) on investments per share and total return reflect non-recurring litigation settlements. These resulted in an increase in net realized gains per share of $0.18 and an increase in total return of 0.76% and 0.78% for Class A and Class C, respectively. |
| (C) | Impact of one time distribution of settlement funds from the Bank of America Fair Fund. If the distribution had not occurred the total return would have been lower. |
| (D) | Total returns shown exclude the effect of applicable sales loads. If these charges were included, the returns would be lower. |
| (E) | Portfolio turnover excludes the purchases and sales of the Touchstone Focused Equity Fund (see Note 11). If these transactions were included, portfolio turnover would have been higher. |
| (F) | Represents the period from commencement of operations (April 16, 2012) through March 31, 2013. |
See accompanying Notes to Financial Statements.
Financial Highlights (Continued)
| Touchstone Focused Fund - Class Y |
| Selected Data for a Share Outstanding Throughout Each Period |
| | | Year Ended March 31, | |
| | | 2014 | | | 2013 | | | 2012 | | | 2011 | | | 2010 | |
| Net asset value at beginning of period | | $ | 27.86 | | | $ | 23.85 | | | $ | 22.17 | | | $ | 21.75 | | | $ | 14.58 | |
| Income (loss) from investment operations: | | | | | | | | | | | | | | | | | | | | |
| Net investment income(A) | | | 0.19 | | | | 0.22 | | | | 0.18 | | | | 0.12 | | | | 0.10 | |
| Net realized and unrealized gains on investments | | | 7.54 | | | | 3.84 | (B) | | | 1.66 | | | | 1.71 | | | | 7.20 | |
| Total from investment operations | | | 7.73 | | | | 4.06 | | | | 1.84 | | | | 1.83 | | | | 7.30 | |
| Distributions from: | | | | | | | | | | | | | | | | | | | | |
| Net investment income | | | (0.25 | ) | | | (0.05 | ) | | | (0.32 | ) | | | (0.15 | ) | | | (0.13 | ) |
| Realized capital gains | | | — | | | | — | | | | — | | | | (1.26 | ) | | | — | |
| Total distributions | | | (0.25 | ) | | | (0.05 | ) | | | (0.32 | ) | | | (1.41 | ) | | | (0.13 | ) |
| Capital Contribution | | | — | | | | — | | | | 0.16 | (C) | | | — | | | | — | |
| Net asset value at end of period | | $ | 35.34 | | | $ | 27.86 | | | $ | 23.85 | | | $ | 22.17 | | | $ | 21.75 | |
| Total return | | | 27.95 | % | | | 17.07 | %(B) | | | 9.29 | %(C) | | | 9.71 | % | | | 50.14 | % |
| Ratios and supplemental data: | | | | | | | | | | | | | | | | | | | | |
| Net assets at end of period (000's) | | $ | 736,023 | | | $ | 578,006 | | | $ | 555,142 | | | $ | 595,397 | | | $ | 577,028 | |
| Ratio to average net assets: | | | | | | | | | | | | | | | | | | | | |
| Net expenses | | | 0.94 | % | | | 0.95 | % | | | 0.95 | % | | | 0.95 | % | | | 0.95 | % |
| Gross expenses | | | 1.02 | % | | | 1.05 | % | | | 1.28 | % | | | 1.32 | % | | | 1.38 | % |
| Net investment income | | | 0.61 | % | | | 0.91 | % | | | 0.85 | % | | | 0.60 | % | | | 0.50 | % |
| Portfolio turnover rate | | | 27 | %(D) | | | 189 | % | | | 99 | % | | | 115 | % | | | 318 | % |
| Touchstone Focused Fund—Institutional Class |
| Selected Data for a Share Outstanding Throughout Each Period |
| | | Year Ended March 31, | |
| | | 2014 | | | 2013 | | | 2012 | | | 2011 | | | 2010 | |
| Net asset value at beginning of period | | $ | 27.96 | | | $ | 23.91 | | | $ | 22.23 | | | $ | 21.81 | | | $ | 14.62 | |
| Income (loss) from investment operations: | | | | | | | | | | | | | | | | | | | | |
| Net investment income(A) | | | 0.24 | | | | 0.25 | | | | 0.22 | | | | 0.15 | | | | 0.18 | |
| Net realized and unrealized gains on investments | | | 7.57 | | | | 3.86 | (B) | | | 1.66 | | | | 1.71 | | | | 7.18 | |
| Total from investment operations | | | 7.81 | | | | 4.11 | | | | 1.88 | | | | 1.86 | | | | 7.36 | |
| Distributions from: | | | | | | | | | | | | | | | | | | | | |
| Net investment income | | | (0.30 | ) | | | (0.06 | ) | | | (0.36 | ) | | | (0.18 | ) | | | (0.17 | ) |
| Realized capital gains | | | — | | | | — | | | | — | | | | (1.26 | ) | | | — | |
| Total distributions | | | (0.30 | ) | | | (0.06 | ) | | | (0.36 | ) | | | (1.44 | ) | | | (0.17 | ) |
| Capital Contribution | | | — | | | | — | | | | 0.16 | (C) | | | — | | | | — | |
| Net asset value at end of period | | $ | 35.47 | | | $ | 27.96 | | | $ | 23.91 | | | $ | 22.23 | | | $ | 21.81 | |
| Total return | | | 28.19 | % | | | 17.24 | %(B) | | | 9.45 | %(C) | | | 9.86 | % | | | 50.44 | % |
| Ratios and supplemental data: | | | | | | | | | | | | | | | | | | | | |
| Net assets at end of period (000's) | | $ | 30,446 | | | $ | 589 | | | $ | 29,879 | | | $ | 28,879 | | | $ | 31,166 | |
| Ratio to average net assets: | | | | | | | | | | | | | | | | | | | | |
| Net expenses | | | 0.80 | % | | | 0.80 | % | | | 0.80 | % | | | 0.80 | % | | | 0.80 | % |
| Gross expenses | | | 1.00 | % | | | 1.16 | % | | | 0.89 | % | | | 0.95 | % | | | 0.91 | % |
| Net investment income | | | 0.75 | % | | | 1.06 | % | | | 1.02 | % | | | 0.75 | % | | | 0.91 | % |
| Portfolio turnover rate | | | 27 | %(D) | | | 189 | % | | | 99 | % | | | 115 | % | | | 318 | % |
| (A) | The net investment income per share is based on average shares outstanding for the period. |
| (B) | Net realized gains (losses) on investments per share and total return reflect non-recurring litigation settlements. These resulted in an increase in net realized gains per share of $0.18 and an increase in total return of 0.76% and 0.75% for Class Y and Institutional Class, respectively. |
| (C) | Impact of one time distribution of settlement funds from the Bank of America Fair Fund. If the distribution had not occurred the total return would have been lower. |
| (D) | Portfolio turnover excludes the purchases and sales of the Touchstone Focused Equity Fund (see Note 11). If these transactions were included, portfolio turnover would have been higher. |
See accompanying Notes to Financial Statements.
Financial Highlights (Continued)
Touchstone Growth Opportunities—Class A
Selected Data for a Share Outstanding Throughout Each Period
| | | Year Ended March 31, | |
| | | 2014 | | | 2013 | | | 2012 | | | 2011 | | | 2010 | |
| Net asset value at beginning of period | | $ | 27.05 | | | $ | 25.64 | | | $ | 25.27 | | | $ | 20.88 | | | $ | 14.41 | |
| Income (loss) from investment operations: | | | | | | | | | | | | | | | | | | | | |
| Net investment income (loss) | | | 0.01 | | | | (0.01 | ) | | | (0.16 | ) | | | 0.07 | | | | (0.03 | ) |
| Net realized and unrealized gains on investments | | | 6.91 | | | | 3.35 | | | | 0.53 | | | | 4.44 | | | | 6.50 | |
| Total from investment operations | | | 6.92 | | | | 3.34 | | | | 0.37 | | | | 4.51 | | | | 6.47 | |
| Distributions from: | | | | | | | | | | | | | | | | | | | | |
| Net Investment Income | | | — | | | | — | | | | — | | | | (0.12 | ) | | | — | |
| Realized capital gains | | | (1.36 | ) | | | (1.93 | ) | | | — | | | | — | | | | — | |
| Total distributions | | | (1.36 | ) | | | (1.93 | ) | | | — | | | | (0.12 | ) | | | — | |
| Net asset value at end of period | | $ | 32.61 | | | $ | 27.05 | | | $ | 25.64 | | | $ | 25.27 | | | $ | 20.88 | |
| Total return(A) | | | 25.84 | % | | | 14.08 | % | | | 1.47 | % | | | 21.71 | % | | | 44.90 | % |
| Ratios and supplemental data: | | | | | | | | | | | | | | | | | | | | |
| Net assets at end of period (000's) | | $ | 47,552 | | | $ | 74,588 | | | $ | 62,274 | | | $ | 96,930 | | | $ | 32,182 | |
| Ratio to average net assets: | | | | | | | | | | | | | | | | | | | | |
| Net expenses | | | 1.22 | % | | | 1.22 | % | | | 1.21 | % | | | 1.16 | % | | | 1.24 | % |
| Gross expenses | | | 1.43 | % | | | 1.37 | % | | | 1.43 | % | | | 1.50 | % | | | 1.85 | % |
| Net investment income (loss) | | | 0.09 | % | | | (0.06 | )% | | | (0.52 | )% | | | 0.10 | % | | | (0.22 | )% |
| Portfolio turnover rate | | | 79 | % | | | 95 | %(B) | | | 204 | % | | | 130 | % | | | 100 | % |
Touchstone Growth Opportunities Fund — Class C
Selected Data for a Share Outstanding Throughout Each Period
| | | Year Ended March 31, | |
| | | 2014 | | | 2013 | | | 2012 | | | 2011 | | | 2010 | |
| Net asset value at beginning of period | | $ | 24.62 | | | $ | 23.68 | | | $ | 23.50 | | | $ | 19.49 | | | $ | 13.55 | |
| Income (loss) from investment operations: | | | | | | | | | | | | | | | | | | | | |
| Net investment loss | | | (0.18 | ) | | | (0.17 | ) | | | (0.29 | ) | | | (0.07 | ) | | | (0.17 | ) |
| Net realized and unrealized gains on investments | | | 6.24 | | | | 3.04 | | | | 0.47 | | | | 4.12 | | | | 6.11 | |
| Total from investment operations | | | 6.06 | | | | 2.87 | | | | 0.18 | | | | 4.05 | | | | 5.94 | |
| Distributions from: | | | | | | | | | | | | | | | | | | | | |
| Net Investment Income | | | — | | | | — | | | | — | | | | (0.04 | ) | | | — | |
| Realized capital gains | | | (1.36 | ) | | | (1.93 | ) | | | — | | | | — | | | | — | |
| Total distributions | | | (1.36 | ) | | | (1.93 | ) | | | — | | | | (0.04 | ) | | | — | |
| Net asset value at end of period | | $ | 29.32 | | | $ | 24.62 | | | $ | 23.68 | | | $ | 23.50 | | | $ | 19.49 | |
| Total return(A) | | | 24.92 | % | | | 13.24 | % | | | 0.77 | % | | | 20.82 | % | | | 43.84 | % |
| Ratios and supplemental data: | | | | | | | | | | | | | | | | | | | | |
| Net assets at end of period (000's) | | $ | 12,498 | | | $ | 10,375 | | | $ | 9,132 | | | $ | 10,592 | | | $ | 8,085 | |
| Ratio to average net assets: | | | | | | | | | | | | | | | | | | | | |
| Net expenses | | | 1.97 | % | | | 1.97 | % | | | 1.96 | % | | | 1.93 | % | | | 1.99 | % |
| Gross expenses | | | 2.25 | % | | | 2.37 | % | | | 2.45 | % | | | 2.58 | % | | | 2.63 | % |
| Net investment loss | | | (0.66 | )% | | | (0.81 | )% | | | (1.27 | )% | | | (0.43 | )% | | | (0.96 | )% |
| Portfolio turnover rate | | | 79 | % | | | 95 | %(B) | | | 204 | % | | | 130 | % | | | 100 | % |
| (A) | Total returns shown exclude the effect of applicable sales loads. If these charges were included, the returns would be lower. |
| (B) | Portfolio turnover excludes the purchases and sales of the Acquired Fifth Third Fund (see Note 11). If these transactions were included, portfolio turnover would have been higher. |
See accompanying Notes to Financial Statements.
Financial Highlights (Continued)
Touchstone Growth Opportunities—Class Y
Selected Data for a Share Outstanding Throughout Each Period
| | | Year Ended March 31, | |
| | | 2014 | | | 2013 | | | 2012 | | | 2011 | | | 2010 | |
| Net asset value at beginning of period | | $ | 27.27 | | | $ | 25.80 | | | $ | 25.38 | | | $ | 20.94 | | | $ | 14.41 | |
| Income (loss) from investment operations: | | | | | | | | | | | | | | | | | | | | |
| Net investment income (loss) | | | 0.11 | | | | 0.03 | | | | (0.05 | ) | | | 0.14 | | | | (— | )(A) |
| Net realized and unrealized gains on investments | | | 6.96 | | | | 3.40 | | | | 0.47 | | | | 4.45 | | | | 6.53 | |
| Total from investment operations | | | 7.07 | | | | 3.43 | | | | 0.42 | | | | 4.59 | | | | 6.53 | |
| Distributions from: | | | | | | | | | | | | | | | | | | | | |
| Net investment income | | | (0.01 | ) | | | (0.03 | ) | | | — | | | | (0.15 | ) | | | — | |
| Realized capital gains | | | (1.36 | ) | | | (1.93 | ) | | | — | | | | — | | | | — | |
| Total distributions | | | (1.37 | ) | | | (1.96 | ) | | | — | | | | (0.15 | ) | | | — | |
| Net asset value at end of period | | $ | 32.97 | | | $ | 27.27 | | | $ | 25.80 | | | $ | 25.38 | | | $ | 20.94 | |
| Total return | | | 26.23 | % | | | 14.38 | % | | | 1.66 | % | | | 22.06 | % | | | 45.32 | % |
| Ratios and supplemental data: | | | | | | | | | | | | | | | | | | | | |
| Net assets at end of period (000's) | | $ | 92,063 | | | $ | 35,354 | | | $ | 12,254 | | | $ | 2,947 | | | $ | 2,223 | |
| Ratio to average net assets: | | | | | | | | | | | | | | | | | | | | |
| Net expenses | | | 0.92 | % | | | 0.96 | % | | | 0.96 | % | | | 0.93 | % | | | 0.98 | % |
| Gross expenses | | | 1.03 | % | | | 1.16 | % | | | 1.42 | % | | | 1.73 | % | | | 3.73 | % |
| Net investment income (loss) | | | 0.39 | % | | | 0.19 | % | | | (0.27 | )% | | | 0.63 | % | | | (0.04 | )% |
| Portfolio turnover rate | | | 79 | % | | | 95 | %(B) | | | 204 | % | | | 130 | % | | | 100 | % |
Touchstone Growth Opportunities Fund — Institutional Class
Selected Data for a Share Outstanding Throughout Each Period
| | | Year Ended March 31, | |
| | | 2014 | | | 2013 | | | 2012 | | | 2011 | | | 2010 | |
| Net asset value at beginning of period | | $ | 27.42 | | | $ | 25.92 | | | $ | 25.46 | | | $ | 20.98 | | | $ | 14.42 | |
| Income (loss) from investment operations: | | | | | | | | | | | | | | | | | | | | |
| Net Investment income (loss) | | | 0.14 | | | | 0.07 | | | | (0.03 | ) | | | 0.16 | | | | 0.01 | |
| Net realized and unrealized gains on investments | | | 7.01 | | | | 3.41 | | | | 0.49 | | | | 4.48 | | | | 6.55 | |
| Total from investment operations | | | 7.15 | | | | 3.48 | | | | 0.46 | | | | 4.64 | | | | 6.56 | |
| Distributions from: | | | | | | | | | | | | | | | | | | | | |
| Net investment income | | | (0.03 | ) | | | (0.05 | ) | | | — | | | | (0.16 | ) | | | — | |
| Realized capital gains | | | (1.36 | ) | | | (1.93 | ) | | | — | | | | — | | | | — | |
| Total distributions | | | (1.39 | ) | | | (1.98 | ) | | | — | | | | (0.16 | ) | | | — | |
| Net asset value at end of period | | $ | 33.18 | | | $ | 27.42 | | | $ | 25.92 | | | $ | 25.46 | | | $ | 20.98 | |
| Total return | | | 26.34 | % | | | 14.50 | % | | | 1.81 | % | | | 22.25 | % | | | 45.49 | % |
| Ratios and supplemental data: | | | | | | | | | | | | | | | | | | | | |
| Net assets at end of period (000's) | | $ | 115,769 | | | $ | 93,800 | | | $ | 70,643 | | | $ | 56,381 | | | $ | 21,807 | |
| Ratio to average net assets: | | | | | | | | | | | | | | | | | | | | |
| Net expenses | | | 0.84 | % | | | 0.84 | % | | | 0.81 | % | | | 0.75 | % | | | 0.84 | % |
| Gross expenses | | | 0.98 | % | | | 1.00 | % | | | 1.06 | % | | | 1.15 | % | | | 1.49 | % |
| Net investment income (loss) | | | 0.47 | % | | | 0.31 | % | | | (0.12 | )% | | | 0.78 | % | | | 0.15 | % |
| Portfolio turnover rate | | | 79 | % | | | 95 | %(B) | | | 204 | % | | | 130 | % | | | 100 | % |
| (A) | Less than $0.005 per share. |
| (B) | Portfolio turnover excludes the purchases and sales of the Acquired Fifth Third Fund (see Note 11). If these transactions were included, portfolio turnover would have been higher. |
See accompanying Notes to Financial Statements.
Financial Highlights (Continued)
Touchstone International Value Fund—Class A
Selected Data for a Share Outstanding Throughout Each Period
| | | | | | Eight Months | | | | |
| | | Year Ended | | | Ended | | | | |
| | | March 31, | | | March 31, | | | Year Ended July 31, | |
| | | 2014 | | | 2013(A) | | | 2012 | | | 2011 | | | 2010 | | | 2009 | |
| Net asset value at beginning of period | | $ | 7.62 | | | $ | 7.06 | | | $ | 8.42 | | | $ | 7.33 | | | $ | 7.24 | | | $ | 12.23 | |
| Income (loss) from investment operations: | | | | | | | | | | | | | | | | | | | | | | | | |
| Net investment income | | | 0.24 | | | | 0.06 | (B) | | | 0.14 | (B) | | | 0.17 | (B) | | | 0.14 | (B) | | | 0.20 | (B) |
| Net realized and unrealized gains (losses) on investments | | | 1.35 | | | | 0.73 | | | | (1.30 | ) | | | 1.09 | | | | 0.19 | | | | (3.59 | ) |
| Total from investment operations | | | 1.59 | | | | 0.79 | | | | (1.16 | ) | | | 1.26 | | | | 0.33 | | | | (3.39 | ) |
| Distributions from: | | | | | | | | | | | | | | | | | | | | | | | | |
| Net investment income | | | (0.09 | ) | | | (0.23 | ) | | | (0.20 | ) | | | (0.17 | ) | | | (0.24 | ) | | | (0.17 | ) |
| Realized capital gains | | | — | | | | — | | | | — | | | | — | | | | — | | | | (1.43 | ) |
| Total distributions | | | (0.09 | ) | | | (0.23 | ) | | | (0.20 | ) | | | (0.17 | ) | | | (0.24 | ) | | | (1.60 | ) |
| Net asset value at end of period | | $ | 9.12 | | | $ | 7.62 | | | $ | 7.06 | | | $ | 8.42 | | | $ | 7.33 | | | $ | 7.24 | |
| Total return(C) | | | 20.90 | % | | | 11.15 | %(D) | | | (13.67 | )% | | | 17.17 | % | | | 4.34 | % | | | (24.64 | )% |
| Ratios and supplemental data: | | | | | | | | | | | | | | | | | | | | | | | | |
| Net assets at end of period (000's) | | $ | 6,032 | | | $ | 6,394 | | | $ | 7,266 | | | $ | 10,258 | | | $ | 10,216 | | | $ | 11,754 | |
| Ratio to average net assets: | | | | | | | | | | | | | | | | | | | | | | | | |
| Net expenses | | | 1.37 | % | | | 1.36 | %(E)(F) | | | 1.40 | %(F) | | | 1.42 | %(F) | | | 1.43 | %(F) | | | 1.47 | %(F) |
| Gross expenses | | | 1.79 | % | | | 2.22 | %(E) | | | 1.68 | % | | | 1.61 | % | | | 1.59 | % | | | 1.59 | % |
| Net investment income | | | 2.32 | % | | | 1.21 | %(E) | | | 2.00 | % | | | 2.10 | % | | | 1.87 | % | | | 2.74 | % |
| Portfolio turnover rate | | | 31 | % | | | 133 | %(D) | | | 121 | % | | | 131 | % | | | 137 | % | | | 104 | % |
Touchstone International Value Fund—Class C
Selected Data for a Share Outstanding Throughout Each Period
| | | | | | Eight Months | | | | |
| | | Year Ended | | | Ended | | | | |
| | | March 31, | | | March 31, | | | Year Ended July 31, | |
| | | 2014 | | | 2013(A) | | | 2012 | | | 2011 | | | 2010 | | | 2009 | |
| Net asset value at beginning of period | | $ | 7.10 | | | $ | 6.59 | | | $ | 7.85 | | | $ | 6.84 | | | $ | 6.79 | | | $ | 11.61 | |
| Income (loss) from investment operations: | | | | | | | | | | | | | | | | | | | | | | | | |
| Net investment income | | | 0.15 | | | | 0.02 | (B) | | | 0.08 | (B) | | | 0.10 | (B) | | | 0.08 | (B) | | | 0.14 | (B) |
| Net realized and unrealized gains (losses) on investments | | | 1.27 | | | | 0.67 | | | | (1.21 | ) | | | 1.01 | | | | 0.18 | | | | (3.42 | ) |
| Total from investment operations | | | 1.42 | | | | 0.69 | | | | (1.13 | ) | | | 1.11 | | | | 0.26 | | | | (3.28 | ) |
| Distributions from: | | | | | | | | | | | | | | | | | | | | | | | | |
| Net investment income | | | (0.06 | ) | | | (0.18 | ) | | | (0.13 | ) | | | (0.10 | ) | | | (0.21 | ) | | | (0.11 | ) |
| Realized capital gains | | | — | | | | — | | | | — | | | | — | | | | — | | | | (1.43 | ) |
| Total distributions | | | (0.06 | ) | | | (0.18 | ) | | | (0.13 | ) | | | (0.10 | ) | | | (0.21 | ) | | | (1.54 | ) |
| Net asset value at end of period | | $ | 8.46 | | | $ | 7.10 | | | $ | 6.59 | | | $ | 7.85 | | | $ | 6.84 | | | $ | 6.79 | |
| Total return(C) | | | 20.05 | % | | | 10.53 | %(D) | | | (14.37 | )% | | | 16.23 | % | | | 3.59 | % | | | (25.18 | )% |
| Ratios and supplemental data: | | | | | | | | | | | | | | | | | | | | | | | | |
| Net assets at end of period (000's) | | $ | 216 | | | $ | 217 | | | $ | 169 | | | $ | 275 | | | $ | 310 | | | $ | 378 | |
| Ratio to average net assets: | | | | | | | | | | | | | | | | | | | | | | | | |
| Net expenses | | | 2.12 | % | | | 2.11 | %(E)(F) | | | 2.15 | %(F) | | | 2.17 | %(F) | | | 2.18 | %(F) | | | 2.22 | %(F) |
| Gross expenses | | | 6.04 | % | | | 9.33 | %(E) | | | 2.43 | % | | | 2.36 | % | | | 2.34 | % | | | 2.34 | % |
| Net investment income | | | 1.57 | % | | | 0.46 | %(E) | | | 1.24 | % | | | 1.28 | % | | | 1.11 | % | | | 2.01 | % |
| Portfolio turnover rate | | | 31 | % | | | 133 | %(D) | | | 121 | % | | | 131 | % | | | 137 | % | | | 104 | % |
| (A) | The Fund changed its fiscal year end from July 31 to March 31. See Note 11 in the Notes to Financial Statements. |
| (B) | The net investment income per share is based on average shares outstanding for the period. |
| (C) | Total returns shown exclude the effect of applicable sales loads. If these charges were included, the returns would be lower. |
| (F) | Includes interest expense relating to settlement of foreign futures. Interest expense was less than 0.005% for the eight months ended March 31, 2013 and 0.02%, 0.01%, 0.01% and 0.02% for the years ended July 31, 2012, 2011, 2010 and 2009, respectively. |
See accompanying Notes to Financial Statements.
Financial Highlights (Continued)
Touchstone International Value Fund—Class Y
Selected Data for a Share Outstanding Throughout Each Period
| | | | | | Eight Months | | | | | | | | | | | | | |
| | | Year Ended | | | Ended | | | | | | | | | | | | | |
| | | March 31, | | | March 31, | | | Year Ended July 31, | |
| | | 2014 | | | 2013(A)(B) | | | 2012 | | | 2011 | | | 2010 | | | 2009 | |
| Net asset value at beginning of period | | $ | 7.62 | | | $ | 7.07 | | | $ | 8.44 | | | $ | 7.35 | | | $ | 7.25 | | | $ | 12.24 | |
| Income (loss) from investment operations: | | | | | | | | | | | | | | | | | | | | | | | | |
| Net investment income | | | 0.19 | | | | 0.07 | (C) | | | 0.16 | (C) | | | 0.18 | (C) | | | 0.16 | (C) | | | 0.22 | (C) |
| Net realized and unrealized gains (losses) on investments | | | 1.43 | | | | 0.73 | | | | (1.31 | ) | | | 1.10 | | | | 0.19 | | | | (3.59 | ) |
| Total from investment operations | | | 1.62 | | | | 0.80 | | | | (1.15 | ) | | | 1.28 | | | | 0.35 | | | | (3.37 | ) |
| Distributions from: | | | | | | | | | | | | | | | | | | | | | | | | |
| Net investment income | | | (0.11 | ) | | | (0.25 | ) | | | (0.22 | ) | | | (0.19 | ) | | | (0.25 | ) | | | (0.19 | ) |
| Realized capital gains | | | — | | | | — | | | | — | | | | — | | | | — | | | | (1.43 | ) |
| Total distributions | | | (0.11 | ) | | | (0.25 | ) | | | (0.22 | ) | | | (0.19 | ) | | | (0.25 | ) | | | (1.62 | ) |
| Net asset value at end of period | | $ | 9.13 | | | $ | 7.62 | | | $ | 7.07 | | | $ | 8.44 | | | $ | 7.35 | | | $ | 7.25 | |
| Total return | | | 21.32 | % | | | 11.33 | %(D) | | | (13.47 | )% | | | 17.42 | % | | | 4.61 | % | | | (24.36 | )% |
| Ratios and supplemental data: | | | | | | | | | | | | | | | | | | | | | | | | |
| Net assets at end of period (000's) | | $ | 43,794 | | | $ | 31,527 | | | $ | 123,607 | | | $ | 176,521 | | | $ | 229,888 | | | $ | 233,968 | |
| Ratio to average net assets: | | | | | | | | | | | | | | | | | | | | | | | | |
| Net expenses | | | 1.04 | % | | | 1.08 | %(E)(F) | | | 1.15 | %(F) | | | 1.17 | %(F) | | | 1.18 | %(F) | | | 1.22 | %(F) |
| Gross expenses | | | 1.33 | % | | | 1.51 | %(E) | | | 1.43 | % | | | 1.36 | % | | | 1.34 | % | | | 1.34 | % |
| Net investment income | | | 2.65 | % | | | 1.49 | %(E) | | | 2.27 | % | | | 2.22 | % | | | 2.18 | % | | | 3.01 | % |
| Portfolio turnover rate | | | 31 | % | | | 133 | %(D) | | | 121 | % | | | 131 | % | | | 137 | % | | | 104 | % |
Touchstone International Value Fund—Institutional Class
Selected Data for a Share Outstanding Throughout Each Period
| | | | | | Period | |
| | | Year Ended | | | Ended | |
| | | March 31, | | | March 31, | |
| | | 2014 | | | 2013(B)(G) | |
| Net asset value at beginning of period | | $ | 7.62 | | | $ | 7.43 | |
| Income from investment operations: | | | | | | | | |
| Net investment income | | | 0.28 | | | | 0.08 | (C) |
| Net realized and unrealized gains on investments | | | 1.36 | | | | 0.36 | |
| Total from investment operations | | | 1.64 | | | | 0.44 | |
| Distributions from: | | | | | | | | |
| Net investment income | | | (0.12 | ) | | | (0.25 | ) |
| Net asset value at end of period | | $ | 9.14 | | | $ | 7.62 | |
| Total return | | | 21.51 | % | | | 5.94 | %(D) |
| Ratios and supplemental data: | | | | | | | | |
| Net assets at end of period (000's) | | $ | 83,628 | | | $ | 88,931 | |
| Ratio to average net assets: | | | | | | | | |
| Net expenses | | | 0.97 | % | | | 0.96 | %(E) |
| Gross expenses | | | 1.29 | % | | | 1.36 | %(E) |
| Net investment income | | | 2.72 | % | | | 1.61 | %(E) |
| Portfolio turnover rate | | | 31 | % | | | 133 | %(D) |
| (A) | Effective September 10, 2012, Institutional Class shares were renamed Class Y shares. See Note 11 in the Notes to Financial Statements. |
| (B) | The Fund changed its fiscal year end from July 31 to March 31. See Note 11 in the Notes to Financial Statements. |
| (C) | The net investment income per share is based on average shares outstanding for the period. |
(E) Annualized.
| (F) | Includes interest expense relating to settlement of foreign futures. Interest expense was less than 0.005% for the eight months ended March 31, 2013 and 0.02%, 0.01%, 0.01% and 0.02% for the years ended July 31, 2012, 2011, 2010 and 2009, respectively. |
| (G) | The Fund began issuing Institutional Class shares on September 10, 2012. |
See accompanying Notes to Financial Statements.
Financial Highlights (Continued)
Touchstone Large Cap Growth Fund—Class A
Selected Data for a Share Outstanding Throughout Each Period
| | | Year Ended March 31, | |
| | | 2014 | | | 2013 | | | 2012 | | | 2011 | | | 2010 | |
| Net asset value at beginning of period | | $ | 28.74 | | | $ | 27.74 | | | $ | 24.95 | | | $ | 20.74 | | | $ | 14.73 | |
| Income (loss) from investment operations: | | | | | | | | | | | | | | | | | | | | |
| Net investment income (loss) | | | 0.02 | | | | 0.11 | | | | 0.02 | (A) | | | (0.09 | ) | | | (0.02 | ) |
| Net realized and unrealized gains on investments | | | 5.96 | | | | 1.00 | | | | 2.77 | | | | 4.30 | | | | 6.08 | |
| Total from investment operations | | | 5.98 | | | | 1.11 | | | | 2.79 | | | | 4.21 | | | | 6.06 | |
| Distributions from: | | | | | | | | | | | | | | | | | | | | |
| Net investment income | | | (0.05 | ) | | | (0.11 | ) | | | — | | | | — | | | | (0.04 | ) |
| Realized capital gains | | | (2.86 | ) | | | — | | | | — | | | | — | | | | (0.01 | ) |
| Total distributions | | | (2.91 | ) | | | (0.11 | ) | | | — | | | | — | | | | (0.05 | ) |
| Net asset value at end of period | | $ | 31.81 | | | $ | 28.74 | | | $ | 27.74 | | | $ | 24.95 | | | $ | 20.74 | |
| Total return(B) | | | 21.27 | % | | | 4.05 | % | | | 11.18 | % | | | 20.30 | % | | | 41.15 | % |
| Ratios and supplemental data: | | | | | | | | | | | | | | | | | | | | |
| Net assets at end of period (000's) | | $ | 287,813 | | | $ | 286,572 | | | $ | 238,488 | | | $ | 291,827 | | | $ | 334,465 | |
| Ratio to average net assets: | | | | | | | | | | | | | | | | | | | | |
| Net expenses | | | 1.23 | % | | | 1.22 | % | | | 1.25 | % | | | 1.25 | % | | | 1.25 | % |
| Gross expenses | | | 1.29 | % | | | 1.32 | % | | | 1.35 | % | | | 1.36 | % | | | 1.37 | % |
| Net investment income (loss) | | | 0.06 | % | | | 0.47 | % | | | 0.08 | % | | | (0.36 | )% | | | (0.29 | )% |
| Portfolio turnover rate | | | 92 | % | | | 109 | %(C) | | | 91 | % | | | 76 | % | | | 83 | % |
Touchstone Large Cap Growth Fund — Class B
Selected Data for a Share Outstanding Throughout Each Period
| | | Year Ended March 31, | |
| | | 2014 | | | 2013 | | | 2012 | | | 2011 | | | 2010 | |
| Net asset value at beginning of period | | $ | 27.41 | | | $ | 26.47 | | | $ | 23.85 | | | $ | 19.93 | | | $ | 14.22 | |
| Income (loss) from investment operations: | | | | | | | | | | | | | | | | | | | | |
| Net investment income (loss) | | | (0.19 | ) | | | 0.01 | | | | (0.03 | )(A) | | | (0.20 | ) | | | (0.44 | ) |
| Net realized and unrealized gains on investments | | | 5.72 | | | | 0.93 | | | | 2.65 | | | | 4.12 | | | | 6.15 | |
| Total from investment operations | | | 5.53 | | | | 0.94 | | | | 2.62 | | | | 3.92 | | | | 5.71 | |
| Distributions from: | | | | | | | | | | | | | | | | | | | | |
| Realized capital gains | | | (2.86 | ) | | | — | | | | — | | | | — | | | | — | |
| Net asset value at end of period | | $ | 30.08 | | | $ | 27.41 | | | $ | 26.47 | | | $ | 23.85 | | | $ | 19.93 | |
| Total return(B) | | | 20.62 | % | | | 3.55 | % | | | 10.99 | % | | | 19.67 | % | | | 40.15 | % |
| Ratios and supplemental data: | | | | | | | | | | | | | | | | | | | | |
| Net assets at end of period (000's) | | $ | 3,671 | | | $ | 6,671 | | | $ | 10,949 | | | $ | 13,467 | | | $ | 14,897 | |
| Ratio to average net assets: | | | | | | | | | | | | | | | | | | | | |
| Net expenses | | | 1.79 | % | | | 1.68 | % | | | 1.45 | % | | | 1.74 | % | | | 2.00 | % |
| Gross expenses | | | 1.79 | % | | | 1.68 | % | | | 1.45 | % | | | 1.83 | % | | | 2.29 | % |
| Net investment income (loss) | | | (0.50 | )% | | | 0.00 | %(D) | | | (0.12 | )% | | | (0.85 | )% | | | (1.05 | )% |
| Portfolio turnover rate | | | 92 | % | | | 109 | %(C) | | | 91 | % | | | 76 | % | | | 83 | % |
| (A) | The net investment income (loss) per share is based on average shares outstanding for the period. |
| (B) | Total returns shown exclude the effect of applicable sales loads. If these charges were included, the returns would be lower. |
| (C) | Portfolio turnover excludes the purchases and sales of the Acquired Fifth Third Fund (see Note 11). If these transactions were included, portfolio turnover would have been higher. |
See accompanying Notes to Financial Statements.
Financial Highlights (Continued)
Touchstone Large Cap Growth Fund—Class C
Selected Data for a Share Outstanding Throughout Each Period
| | | Year Ended March 31, | |
| | | 2014 | | | 2013 | | | 2012 | | | 2011 | | | 2010 | |
| Net asset value at beginning of period | | $ | 27.17 | | | $ | 26.31 | | | $ | 23.84 | | | $ | 19.97 | | | $ | 14.25 | |
| Income (loss) from investment operations: | | | | | | | | | | | | | | | | | | | | |
| Net investment loss | | | (0.21 | ) | | | (0.08 | ) | | | (0.16 | )(A) | | | (0.27 | ) | | | (0.22 | ) |
| Net realized and unrealized gains on investments | | | 5.62 | | | | 0.94 | | | | 2.63 | | | | 4.14 | | | | 5.94 | |
| Total from investment operations | | | 5.41 | | | | 0.86 | | | | 2.47 | | | | 3.87 | | | | 5.72 | |
| Distributions from: | | | | | | | | | | | | | | | | | | | | |
| Realized capital gains | | | (2.86 | ) | | | — | | | | — | | | | — | | | | — | |
| Net asset value at end of period | | $ | 29.72 | | | $ | 27.17 | | | $ | 26.31 | | | $ | 23.84 | | | $ | 19.97 | |
| Total return(B) | | | 20.35 | % | | | 3.27 | % | | | 10.36 | % | | | 19.38 | % | | | 40.14 | % |
| Ratios and supplemental data: | | | | | | | | | | | | | | | | | | | | |
| Net assets at end of period (000's) | | $ | 111,631 | | | $ | 107,572 | | | $ | 116,350 | | | $ | 127,172 | | | $ | 142,179 | |
| Ratio to average net assets: | | | | | | | | | | | | | | | | | | | | |
| Net expenses | | | 1.98 | % | | | 1.97 | % | | | 2.00 | % | | | 2.00 | % | | | 2.00 | % |
| Gross expenses | | | 2.04 | % | | | 2.08 | % | | | 2.09 | % | | | 2.13 | % | | | 2.16 | % |
| Net investment loss | | | (0.69 | %) | | | (0.28 | %) | | | (0.67 | %) | | | (1.11 | %) | | | (1.05 | %) |
| Portfolio turnover rate | | | 92 | % | | | 109 | %(C) | | | 91 | % | | | 76 | % | | | 83 | % |
Touchstone Large Cap Growth Fund — Class Y
Selected Data for a Share Outstanding Throughout Each Period
| | | Year Ended March 31, | |
| | | 2014 | | | 2013 | | | 2012 | | | 2011 | | | 2010 | |
| Net asset value at beginning of period | | $ | 29.07 | | | $ | 28.09 | | | $ | 25.19 | | | $ | 20.89 | | | $ | 14.84 | |
| Income (loss) from investment operations: | | | | | | | | | | | | | | | | | | | | |
| Net investment income (loss) | | | 0.09 | | | | 0.18 | | | | 0.09 | (A) | | | (0.02 | ) | | | (0.01 | ) |
| Net realized and unrealized gains on investments | | | 6.06 | | | | 1.00 | | | | 2.81 | | | | 4.32 | | | | 6.17 | |
| Total from investment operations | | | 6.15 | | | | 1.18 | | | | 2.90 | | | | 4.30 | | | | 6.16 | |
| Distributions from: | | | | | | | | | | | | | | | | | | | | |
| Net investment income | | | (0.13 | ) | | | (0.20 | ) | | | — | | | | — | | | | (0.10 | ) |
| Realized capital gains | | | (2.86 | ) | | | — | | | | — | | | | — | | | | (0.01 | ) |
| Total distributions | | | (2.99 | ) | | | (0.20 | ) | | | — | | | | — | | | | (0.11 | ) |
| Net asset value at end of period | | $ | 32.23 | | | $ | 29.07 | | | $ | 28.09 | | | $ | 25.19 | | | $ | 20.89 | |
| Total return | | | 21.62 | % | | | 4.32 | % | | | 11.47 | % | | | 20.58 | % | | | 41.53 | % |
| Ratios and supplemental data: | | | | | | | | | | | | | | | | | | | | |
| Net assets at end of period (000's) | | $ | 577,708 | | | $ | 523,413 | | | $ | 385,411 | | | $ | 331,733 | | | $ | 352,847 | |
| Ratio to average net assets: | | | | | | | | | | | | | | | | | | | | |
| Net expenses | | | 0.97 | % | | | 0.96 | % | | | 0.99 | % | | | 0.99 | % | | | 0.99 | % |
| Gross expenses | | | 1.05 | % | | | 1.08 | % | | | 1.14 | % | | | 1.13 | % | | | 1.06 | % |
| Net investment income (loss) | | | 0.32 | % | | | 0.72 | % | | | 0.34 | % | | | (0.10 | %) | | | (0.06 | %) |
| Portfolio turnover rate | | | 92 | % | | | 109 | %(C) | | | 91 | % | | | 76 | % | | | 83 | % |
| (A) | The net investment income (loss) per share is based on average shares outstanding for the period. |
| (B) | Total returns shown exclude the effect of applicable sales loads. If these charges were included, the returns would be lower. |
| (C) | Portfolio turnover excludes the purchases and sales of the Acquired Fifth Third Fund (see Note 11). If these transactions were included, portfolio turnover would have been higher. |
See accompanying Notes to Financial Statements.
Financial Highlights (Continued)
Touchstone Mid Cap Growth Fund—Class A
Selected Data for a Share Outstanding Throughout Each Period
| | | Year Ended March 31, | |
| | | 2014 | | | 2013 | | | 2012 | | | 2011 | | | 2010 | |
| Net asset value at beginning of period | | $ | 23.61 | | | $ | 22.41 | | | $ | 24.91 | | | $ | 20.18 | | | $ | 12.95 | |
| Income (loss) from investment operations: | | | | | | | | | | | | | | | | | | | | |
| Net investment loss | | | (0.10 | ) | | | (0.05 | ) | | | (0.16 | ) | | | (0.03 | ) | | | (0.03 | ) |
| Net realized and unrealized gains (losses) on investments | | | 5.74 | | | | 2.71 | | | | (1.05 | ) | | | 4.76 | | | | 7.26 | |
| Total from investment operations | | | 5.64 | | | | 2.66 | | | | (1.21 | ) | | | 4.73 | | | | 7.23 | |
| Distributions from: | | | | | | | | | | | | | | | | | | | | |
| Realized capital gains | | | (2.75 | ) | | | (1.46 | ) | | | (1.29 | ) | | | — | | | | — | |
| Net asset value at end of period | | $ | 26.50 | | | $ | 23.61 | | | $ | 22.41 | | | $ | 24.91 | | | $ | 20.18 | |
| Total return(A) | | | 24.82 | % | | | 12.73 | % | | | (3.68 | %) | | | 23.44 | % | | | 55.83 | % |
| Ratios and supplemental data: | | | | | | | | | | | | | | | | | | | | |
| Net assets at end of period (000's) | | $ | 308,316 | | | $ | 299,834 | | | $ | 330,808 | | | $ | 584,089 | | | $ | 583,543 | |
| Ratio to average net assets: | | | | | | | | | | | | | | | | | | | | |
| Net expenses | | | 1.38 | % | | | 1.40 | % | | | 1.40 | % | | | 1.47 | % | | | 1.50 | % |
| Gross expenses | | | 1.38 | % | | | 1.40 | % | | | 1.40 | % | | | 1.47 | % | | | 1.51 | % |
| Net investment loss | | | (0.41 | %) | | | (0.21 | %) | | | (0.79 | %) | | | (0.13 | %) | | | (0.15 | %) |
| Portfolio turnover rate | | | 79 | % | | | 70 | % | | | 64 | % | | | 99 | % | | | 62 | % |
Touchstone Mid Cap Growth Fund — Class B
Selected Data for a Share Outstanding Throughout Each Period
| | | Year Ended March 31, | |
| | | 2014 | | | 2013 | | | 2012 | | | 2011 | | | 2010 | |
| Net asset value at beginning of period | | $ | 19.12 | | | $ | 18.48 | | | $ | 20.89 | | | $ | 16.98 | | | $ | 10.98 | |
| Income (loss) from investment operations: | | | | | | | | | | | | | | | | | | | | |
| Net investment loss | | | (0.19 | ) | | | (0.12 | ) | | | (0.48 | ) | | | (0.10 | ) | | | (0.16 | ) |
| Net realized and unrealized gains (losses) on investments | | | 4.64 | | | | 2.22 | | | | (0.64 | ) | | | 4.01 | | | | 6.16 | |
| Total from investment operations | | | 4.45 | | | | 2.10 | | | | (1.12 | ) | | | 3.91 | | | | 6.00 | |
| Distributions from: | | | | | | | | | | | | | | | | | | | | |
| Realized capital gains | | | (2.75 | ) | | | (1.46 | ) | | | (1.29 | ) | | | — | | | | — | |
| Net asset value at end of period | | $ | 20.82 | | | $ | 19.12 | | | $ | 18.48 | | | $ | 20.89 | | | $ | 16.98 | |
| Total return(A) | | | 24.36 | % | | | 12.41 | % | | | (3.99 | %) | | | 23.03 | % | | | 54.64 | % |
| Ratios and supplemental data: | | | | | | | | | | | | | | | | | | | | |
| Net assets at end of period (000's) | | $ | 4,709 | | | $ | 5,880 | | | $ | 10,681 | | | $ | 23,376 | | | $ | 32,762 | |
| Ratio to average net assets: | | | | | | | | | | | | | | | | | | | | |
| Net expenses | | | 1.73 | % | | | 1.72 | % | | | 1.59 | % | | | 1.77 | % | | | 2.25 | % |
| Gross expenses | | | 1.73 | % | | | 1.72 | % | | | 1.59 | % | | | 1.82 | % | | | 2.38 | % |
| Net investment loss | | | (0.76 | %) | | | (0.52 | %) | | | (0.97 | %) | | | (0.43 | %) | | | (0.90 | %) |
| Portfolio turnover rate | | | 79 | % | | | 70 | % | | | 64 | % | | | 99 | % | | | 62 | % |
| (A) | Total returns shown exclude the effect of applicable sales loads. If these charges were included, the returns would be lower. |
See accompanying Notes to Financial Statements.
Financial Highlights (Continued)
Touchstone Mid Cap Growth Fund—Class C
Selected Data for a Share Outstanding Throughout Each Period
| | | Year Ended March 31, | |
| | | 2014 | | | 2013 | | | 2012 | | | 2011 | | | 2010 | |
| Net asset value at beginning of period | | $ | 18.84 | | | $ | 18.31 | | | $ | 20.81 | | | $ | 17.00 | | | $ | 10.99 | |
| Income (loss) from investment operations: | | | | | | | | | | | | | | | | | | | | |
| Net investment loss | | | (0.22 | ) | | | (0.18 | ) | | | (0.36 | ) | | | (0.17 | ) | | | (0.14 | ) |
| Net realized and unrealized gains (losses) on investments | | | 4.52 | | | | 2.17 | | | | (0.85 | ) | | | 3.98 | | | | 6.15 | |
| Total from investment operations | | | 4.30 | | | | 1.99 | | | | (1.21 | ) | | | 3.81 | | | | 6.01 | |
| Distributions from: | | | | | | | | | | | | | | | | | | | | |
| Realized capital gains | | | (2.75 | ) | | | (1.46 | ) | | | (1.29 | ) | | | — | | | | — | |
| Net asset value at end of period | | $ | 20.39 | | | $ | 18.84 | | | $ | 18.31 | | | $ | 20.81 | | | $ | 17.00 | |
| Total return(A) | | | 23.90 | % | | | 11.90 | % | | | (4.43 | %) | | | 22.41 | % | | | 54.69 | % |
| Ratios and supplemental data: | | | | | | | | | | | | | | | | | | | | |
| Net assets at end of period (000's) | | $ | 149,927 | | | $ | 141,485 | | | $ | 162,693 | | | $ | 223,376 | | | $ | 218,413 | |
| Ratio to average net assets: | | | | | | | | | | | | | | | | | | | | |
| Net expenses | | | 2.11 | % | | | 2.15 | % | | | 2.17 | % | | | 2.24 | % | | | 2.25 | % |
| Gross expenses | | | 2.11 | % | | | 2.15 | % | | | 2.17 | % | | | 2.27 | % | | | 2.31 | % |
| Net investment loss | | | (1.14 | %) | | | (0.95 | %) | | | (1.56 | %) | | | (0.90 | %) | | | (0.90 | %) |
| Portfolio turnover rate | | | 79 | % | | | 70 | % | | | 64 | % | | | 99 | % | | | 62 | % |
Touchstone Mid Cap Growth Fund — Class Y
Selected Data for a Share Outstanding Throughout Each Period
| | | Year Ended March 31, | |
| | | 2014 | | | 2013 | | | 2012 | | | 2011 | | | 2010 | |
| Net asset value at beginning of period | | $ | 23.93 | | | $ | 22.63 | | | $ | 25.07 | | | $ | 20.27 | | | $ | 12.96 | |
| Income (loss) from investment operations: | | | | | | | | | | | | | | | | | | | | |
| Net investment income (loss) | | | (0.05 | ) | | | 0.01 | | | | (0.10 | ) | | | 0.01 | | | | 0.01 | |
| Net realized and unrealized gains (losses) on investments | | | 5.87 | | | | 2.75 | | | | (1.05 | ) | | | 4.79 | | | | 7.30 | |
| Total from investment operations | | | 5.82 | | | | 2.76 | | | | (1.15 | ) | | | 4.80 | | | | 7.31 | |
| Distributions from: | | | | | | | | | | | | | | | | | | | | |
| Realized capital gains | | | (2.75 | ) | | | (1.46 | ) | | | (1.29 | ) | | | — | | | | — | |
| Net asset value at end of period | | $ | 27.00 | | | $ | 23.93 | | | $ | 22.63 | | | $ | 25.07 | | | $ | 20.27 | |
| Total return | | | 25.17 | % | | | 13.05 | % | | | (3.42 | %) | | | 23.68 | % | | | 56.40 | % |
| Ratios and supplemental data: | | | | | | | | | | | | | | | | | | | | |
| Net assets at end of period (000's) | | $ | 263,578 | | | $ | 164,267 | | | $ | 123,593 | | | $ | 47,470 | | | $ | 26,162 | |
| Ratio to average net assets: | | | | | | | | | | | | | | | | | | | | |
| Net expenses | | | 1.07 | % | | | 1.16 | % | | | 1.11 | % | | | 1.24 | % | | | 1.25 | % |
| Gross expenses | | | 1.07 | % | | | 1.16 | % | | | 1.11 | % | | | 1.24 | % | | | 1.26 | % |
| Net investment income (loss) | | | (0.11 | %) | | | 0.04 | % | | | (0.49 | %) | | | 0.05 | % | | | 0.14 | % |
| Portfolio turnover rate | | | 79 | % | | | 70 | % | | | 64 | % | | | 99 | % | | | 62 | % |
| (A) | Total returns shown exclude the effect of applicable sales loads. If these charges were included, the returns would be lower. |
See accompanying Notes to Financial Statements.
Financial Highlights (Continued)
Touchstone Mid Cap Growth Fund—Institutional Class
Selected Data for a Share Outstanding Throughout Each Period
| | | | | | | | | Period | |
| | | | | | | | | Ended | |
| | | Year Ended March 31, | | | March 31, | |
| | | 2014 | | | 2013 | | | 2012(A) | |
| Net asset value at beginning of period | | $ | 23.99 | | | $ | 22.65 | | | $ | 25.30 | |
| Income (loss) from investment operations: | | | | | | | | | | | | |
| Net investment income (loss) | | | 0.03 | | | | 0.04 | | | | (0.03 | ) |
| Net realized and unrealized gains (losses) on investments | | | 5.83 | | | | 2.76 | | | | (1.33 | ) |
| Total from investment operations | | | 5.86 | | | | 2.80 | | | | (1.36 | ) |
| Distributions from: | | | | | | | | | | | | |
| Realized capital gains | | | (2.75 | ) | | | (1.46 | ) | | | (1.29 | ) |
| Net asset value at end of period | | $ | 27.10 | | | $ | 23.99 | | | $ | 22.65 | |
| Total return | | | 25.32 | % | | | 13.23 | % | | | (4.22 | %)(B) |
| Ratios and supplemental data: | | | | | | | | | | | | |
| Net assets at end of period (000's) | | $ | 35,097 | | | $ | 38,821 | | | $ | 25,550 | |
| Ratio to average net assets: | | | | | | | | | | | | |
| Net expenses | | | 0.97 | % | | | 0.98 | % | | | 1.03 | %(C) |
| Gross expenses | | | 0.97 | % | | | 0.98 | % | | | 1.17 | %(C) |
| Net investment income (loss) | | | (0.00 | %)(D) | | | 0.21 | % | | | (0.41 | %)(C) |
| Portfolio turnover rate | | | 79 | % | | | 70 | % | | | 64 | % |
| (A) | Represents the period from commencement of operations (April 1, 2011) through March 31, 2012. |
See accompanying Notes to Financial Statements.
Financial Highlights (Continued)
Touchstone Small Cap Growth Fund—Class A
Selected Data for a Share Outstanding Throughout Each Period
| | | | | | Eight Months | | | | | | | | | | | | | |
| | | Year Ended | | | Ended | | | | | | | | | | | | | |
| | | March 31, | | | March 31, | | | Year Ended July 31, | |
| | | 2014 | | | 2013(A) | | | 2012 | | | 2011 | | | 2010 | | | 2009 | |
| Net asset value at beginning of period | | $ | 4.84 | | | $ | 4.25 | | | $ | 4.24 | | | $ | 3.63 | | | $ | 3.01 | | | $ | 3.49 | |
| Income (loss) from investment operations: | | | | | | | | | | | | | | | | | | | | | | | | |
| Net investment income (loss) | | | (0.01 | ) | | | — | (B)(C) | | | (— | )(B)(C) | | | (0.01 | )(B) | | | (0.01 | )(B) | | | 0.01 | (B) |
| Net realized and unrealized gains (losses) on investments | | | 1.02 | | | | 0.85 | | | | 0.01 | | | | 0.62 | | | | 0.63 | | | | (0.47 | ) |
| Total from investment operations | | | 1.01 | | | | 0.85 | | | | 0.01 | | | | 0.61 | | | | 0.62 | | | | (0.46 | ) |
| Distributions from: | | | | | | | | | | | | | | | | | | | | | | | | |
| Net investment income | | | — | | | | (0.02 | ) | | | — | | | | — | | | | — | | | | (0.01 | ) |
| Realized capital gains | | | (0.61 | ) | | | (0.24 | ) | | | — | | | | — | | | | — | | | | (0.01 | ) |
| Total distributions | | | (0.61 | ) | | | (0.26 | ) | | | — | | | | — | | | | — | | | | (0.02 | ) |
| Net asset value at end of period | | $ | 5.24 | | | $ | 4.84 | | | $ | 4.25 | | | $ | 4.24 | | | $ | 3.63 | | | $ | 3.01 | |
| Total return(D) | | | 22.63 | % | | | 20.93 | %(E) | | | 0.24 | % | | | 16.80 | % | | | 20.60 | % | | | (13.18 | %) |
| Ratios and supplemental data: | | | | | | | | | | | | | | | | | | | | | | | | |
| Net assets at end of period (000's) | | $ | 35,303 | | | $ | 14,243 | | | $ | 15,010 | | | $ | 18,117 | | | $ | 11,649 | | | $ | 7,497 | |
| Ratio to average net assets: | | | | | | | | | | | | | | | | | | | | | | | | |
| Net expenses | | | 1.45 | % | | | 1.60 | %(F) | | | 1.60 | % | | | 1.60 | % | | | 1.60 | % | | | 1.60 | % |
| Gross expenses | | | 1.81 | % | | | 2.13 | %(F) | | | 2.01 | % | | | 1.96 | % | | | 2.07 | % | | | 2.14 | % |
| Net investment income (loss) | | | (0.48 | %) | | | 0.15 | %(F) | | | (0.07 | %) | | | (0.33 | %) | | | (0.41 | %) | | | 0.40 | % |
| Portfolio turnover rate | | | 195 | %(G) | | | 45 | %(E)(H) | | | 48 | % | | | 59 | % | | | 56 | % | | | 46 | % |
Touchstone Small Cap Growth Fund—Class C
Selected Data for a Share Outstanding Throughout Each Period
| | | | | | Eight Months | | | | | | | | | | | | | |
| | | Year Ended | | | Ended | | | | | | | | | | | | | |
| | | March 31, | | | March 31, | | | Year Ended July 31, | |
| | | 2014 | | | 2013(A) | | | 2012 | | | 2011 | | | 2010 | | | 2009 | |
| Net asset value at beginning of period | | $ | 4.22 | | | $ | 3.75 | | | $ | 3.77 | | | $ | 3.25 | | | $ | 2.72 | | | $ | 3.17 | |
| Income (loss) from investment operations: | | | | | | | | | | | | | | | | | | | | | | | | |
| Net investment loss | | | (0.04 | ) | | | (0.02 | )(B) | | | (0.03 | )(B) | | | (0.04 | )(B) | | | (0.04 | )(B) | | | (0.01 | )(B) |
| Net realized and unrealized gains (losses) on investments | | | 0.88 | | | | 0.74 | | | | 0.01 | | | | 0.56 | | | | 0.57 | | | | (0.43 | ) |
| Total from investment operations | | | 0.84 | | | | 0.72 | | | | (0.02 | ) | | | 0.52 | | | | 0.53 | | | | (0.44 | ) |
| Distributions from: | | | | | | | | | | | | | | | | | | | | | | | | |
| Net investment income | | | — | | | | (0.01 | ) | | | — | | | | — | | | | — | | | | — | |
| Realized capital gains | | | (0.61 | ) | | | (0.24 | ) | | | — | | | | — | | | | — | | | | (0.01 | ) |
| Total distributions | | | (0.61 | ) | | | (0.25 | ) | | | — | | | | — | | | | — | | | | (0.01 | ) |
| Net asset value at end of period | | $ | 4.45 | | | $ | 4.22 | | | $ | 3.75 | | | $ | 3.77 | | | $ | 3.25 | | | $ | 2.72 | |
| Total return(D) | | | 21.85 | % | | | 20.17 | %(E) | | | (0.53 | %) | | | 16.00 | % | | | 19.49 | % | | | (13.75 | %) |
| Ratios and supplemental data: | | | | | | | | | | | | | | | | | | | | | | | | |
| Net assets at end of period (000's) | | $ | 7,429 | | | $ | 3,509 | | | $ | 3,830 | | | $ | 5,563 | | | $ | 2,876 | | | $ | 1,446 | |
| Ratio to average net assets: | | | | | | | | | | | | | | | | | | | | | | | | |
| Net expenses | | | 2.20 | % | | | 2.35 | %(F) | | | 2.35 | % | | | 2.35 | % | | | 2.35 | % | | | 2.35 | % |
| Gross expenses | | | 2.65 | % | | | 3.16 | %(F) | | | 2.76 | % | | | 2.71 | % | | | 2.82 | % | | | 2.88 | % |
| Net investment loss | | | (1.23 | %) | | | (0.60 | %)(F) | | | (0.82 | %) | | | (1.10 | %) | | | (1.17 | %) | | | (0.35 | %) |
| Portfolio turnover rate | | | 195 | %(G) | | | 45 | %(E)(H) | | | 48 | % | | | 59 | % | | | 56 | % | | | 46 | % |
| (A) | The Fund changed its fiscal year end from July 31 to March 31. See Note 11 in the Notes to Financial Statements. |
| (B) | The net investment income (loss) per share is based on average shares outstanding for the period. |
| (C) | Less than $0.005 per share. |
| (D) | Total returns shown exclude the effect of applicable sales loads. If these charges were included, the returns would be lower. |
| (G) | Portfolio turnover excludes the purchases and sales of the Touchstone Diversified Small Cap Growth Fund (see Note 11). If these transactions were included, portfolio turnover would have been higher. |
| (H) | Portfolio turnover rate excludes securities delivered from processing a redemption-in-kind. |
See accompanying Notes to Financial Statements.
Financial Highlights (Continued)
| Touchstone Small Cap Growth Fund—Class Y |
| Selected Data for a Share Outstanding Throughout Each Period |
| | | | | | Eight Months | | | | | | | | | | | | | |
| | | Year Ended | | | Ended | | | | | | | | | | | | | |
| | | March 31, | | | March 31, | | | Year Ended July 31, | |
| | | 2014 | | | 2013(A)(B) | | | 2012 | | | 2011 | | | 2010 | | | 2009 | |
| Net asset value at beginning of period | | $ | 5.27 | | | $ | 4.61 | | | $ | 4.58 | | | $ | 3.92 | | | $ | 3.24 | | | $ | 3.75 | |
| Income (loss) from investment operations: | | | | | | | | | | | | | | | | | | | | | | | | |
| Net investment income (loss) | | | (0.01 | ) | | | 0.01 | (C) | | | 0.01 | (C) | | | — | (C)(D) | | | (0.01 | )(C) | | | 0.02 | (C) |
| Net realized and unrealized gains (losses) on investments | | | 1.13 | | | | 0.92 | | | | 0.02 | | | | 0.66 | | | | 0.69 | | | | (0.51 | ) |
| Total from investment operations | | | 1.12 | | | | 0.93 | | | | 0.03 | | | | 0.66 | | | | 0.68 | | | | (0.49 | ) |
| Distributions from: | | | | | | | | | | | | | | | | | | | | | | | | |
| Net investment income | | | — | | | | (0.03 | ) | | | — | | | | — | | | | — | | | | (0.01 | ) |
| Realized capital gains | | | (0.61 | ) | | | (0.24 | ) | | | — | | | | — | | | | — | | | | (0.01 | ) |
| Total distributions | | | (0.61 | ) | | | (0.27 | ) | | | — | | | | — | | | | — | | | | (0.02 | ) |
| Net asset value at end of period | | $ | 5.78 | | | $ | 5.27 | | | $ | 4.61 | | | $ | 4.58 | | | $ | 3.92 | | | $ | 3.24 | |
| Total return | | | 22.88 | % | | | 20.94 | %(E) | | | 0.66 | % | | | 16.84 | % | | | 20.99 | % | | | (12.86 | %) |
| Ratios and supplemental data: | | | | | | | | | | | | | | | | | | | | | | | | |
| Net assets at end of period (000's) | | $ | 37,030 | | | $ | 18,123 | | | $ | 23,232 | | | $ | 26,317 | | | $ | 21,195 | | | $ | 17,394 | |
| Ratio to average net assets: | | | | | | | | | | | | | | | | | | | | | | | | |
| Net expenses | | | 1.20 | % | | | 1.35 | %(F) | | | 1.35 | % | | | 1.35 | % | | | 1.35 | % | | | 1.35 | % |
| Gross expenses | | | 1.50 | % | | | 1.77 | %(F) | | | 1.76 | % | | | 1.71 | % | | | 1.82 | % | | | 1.89 | % |
| Net investment income (loss) | | | (0.23 | %) | | | 0.40 | %(F) | | | 0.17 | % | | | (0.08 | %) | | | (0.16 | %) | | | 0.64 | % |
| Portfolio turnover rate | | | 195 | %(G) | | | 45 | %(E)(H) | | | 48 | % | | | 59 | % | | | 56 | % | | | 46 | % |
| Touchstone Small Cap Growth Fund—Institutional Class |
| Selected Data for a Share Outstanding Throughout Each Period |
| | | | | | Period | |
| | | Year Ended | | | Ended | |
| | | March 31, | | | March 31, | |
| | | 2014 | | | 2013(B)(I) | |
| Net asset value at beginning of period | | $ | 5.28 | | | $ | 4.92 | |
| Income (loss) from investment operations: | | | | | | | | |
| Net investment income (loss) | | | (— | )(D) | | | 0.02 | (C) |
| Net realized and unrealized gains on investments | | | 1.13 | | | | 0.61 | |
| Total from investment operations | | | 1.13 | | | | 0.63 | |
| Distributions from: | | | | | | | | |
| Net investment income | | | — | | | | (0.03 | ) |
| Realized capital gains | | | (0.61 | ) | | | (0.24 | ) |
| Total distributions | | | (0.61 | ) | | | (0.27 | ) |
| Net asset value at end of period | | $ | 5.80 | | | $ | 5.28 | |
| Total return | | | 23.04 | % | | | 13.56 | %(E) |
| Ratios and supplemental data: | | | | | | | | |
| Net assets at end of period (000's) | | $ | 12,372 | | | $ | 3 | |
| Ratio to average net assets: | | | | | | | | |
| Net expenses | | | 1.04 | % | | | 1.25 | %(F) |
| Gross expenses | | | 1.40 | % | | | 945.43 | %(F) |
| Net investment income (loss) | | | (0.07 | %) | | | 0.50 | %(F) |
| Portfolio turnover rate | | | 195 | %(G) | | | 45 | %(E)(H) |
| (A) | Effective September 10, 2012, Institutional Class shares were renamed Class Y shares. See Note 11 in the Notes to Financial Statements. |
| (B) | The Fund changed its fiscal year end from July 31 to March 31. See Note 11 in the Notes to Financial Statements. |
| (C) | The net investment income (loss) per share is based on average shares outstanding for the period. |
| (D) | Less than $0.005 per share. |
| (G) | Portfolio turnover excludes the purchases and sales of the Touchstone Diversified Small Cap Growth Fund (see Note 11). If these transactions were included, portfolio turnover would have been higher. |
| (H) | Portfolio turnover rate excludes securities delivered from processing a redemption-in-kind. |
| (I) | The Fund began issuing Institutional Class shares on September 10, 2012. |
See accompanying Notes to Financial Statements.
Notes to Financial Statements
March 31, 2014 (Unaudited)
1. Organization
The Touchstone Strategic Trust (the “Trust”) is registered under the Investment Company Act of 1940, as amended (the “1940 Act”), as an open-end management investment company. The Trust was established as a Massachusetts business trust pursuant to a Declaration of Trust dated November 18, 1982. The Trust consists of sixteen funds, including the following seven funds (individually, a “Fund”, and collectively, the “Funds”):
Touchstone Flexible Income Fund (“Flexible Income Fund”)
Touchstone Focused Fund (“Focused Fund”)
Touchstone Growth Opportunities Fund (“Growth Opportunities Fund”)
Touchstone International Value Fund (“International Value Fund”)
Touchstone Large Cap Growth Fund (“Large Cap Growth Fund”)
Touchstone Mid Cap Growth Fund (“Mid Cap Growth Fund”)
Touchstone Small Cap Growth Fund (“Small Cap Growth Fund”)
Each Fund is an open-end, diversified management investment company, with the exception of the Focused Fund, the Growth Opportunities Fund, and the Large Cap Growth Fund, each of which is an open-end, non-diversified management investment company.
The Declaration of Trust permits the Trust to issue an unlimited number of shares of beneficial interest of each Fund. The table below indicates the classes of shares that each Fund is registered to offer:
| | | | | | Institutional |
| | Class A | Class B | Class C | Class Y | Class |
| Flexible Income Fund | X | — | X | X | X |
| Focused Fund | X | — | X | X | X |
| Growth Opportunities Fund | X | — | X | X | X |
| International Value Fund | X | — | X | X | X |
| Large Cap Growth Fund | X | X | X | X | — |
| Mid Cap Growth Fund | X | X | X | X | X |
| Small Cap Growth Fund | X | — | X | X | X |
Class B shares are closed to new investors and subsequent purchases. The assets of each Fund are segregated, and a shareholder’s interest is limited to the Fund in which shares are held. The Funds’ prospectus provides a description of each Fund’s investment goals, policies, and strategies along with information on the classes of shares currently being offered.
2. Significant Accounting Policies
The following is a summary of the Funds’ significant accounting policies:
Security valuation and fair value measurements — All investments in securities are recorded at their estimated fair value. The Funds define the term “market value”, as used throughout this report, as the estimated fair value. The Funds use various methods to measure fair value of their portfolio securities on a recurring basis. Generally accepted accounting principles in the United States (“U.S. GAAP”) establish a hierarchy that prioritizes inputs to valuation methods. These inputs are summarized in the three broad levels listed below:
| • | Level 1 | – | quoted prices in active markets for identical securities |
| | | | |
| • | Level 2 | – | other significant observable inputs (including quoted prices for similar securities, interest rates, |
| | | | prepayment speeds, credit risk, etc.) |
| | | | |
| • | Level 3 | – | significant unobservable inputs (including the Fund’s own assumptions in determining the fair |
| | | | value of investments) |
Notes to Financial Statements (Continued)
The inputs or methodology used for valuing securities are not necessarily an indication of the risk associated with investing in those securities. For example, money market instruments are valued using amortized cost, in accordance with rules under the 1940 Act. Generally, amortized cost approximates the current fair value of a security, but since the value is not obtained from a quoted price in an active market, such securities are reflected as Level 2.
The aggregate value by input level, as of March 31, 2014, for each Fund’s investments, as well as a reconciliation of assets for which significant unobservable inputs (Level 3) were used in determining value, if applicable, is included in each Fund’s Portfolio of Investments, which also includes a breakdown of the Fund’s investments by geographic or sector allocation. The Funds did not hold any Level 3 categorized securities during the year ended March 31, 2014.
All transfers in and out of the levels are recognized at the value at the end of the period. During the year ended March 31, 2014, there were no transfers between Levels 1, 2 and 3 for all Funds.
The Funds’ portfolio securities are valued as of the close of the regular session of trading on the New York Stock Exchange (“NYSE”) (currently 4:00 p.m., Eastern time). Portfolio securities traded on stock exchanges are valued at the last sale price, and to the extent these securities are actively traded, they are categorized in Level 1 of the fair value hierarchy. Portfolio securities quoted by NASDAQ are valued at the NASDAQ Official Closing Price (“NOCP”). Securities not traded on a particular day, or for which the last sale price is not readily available, are valued at their last broker-quoted bid prices as obtained from one or more of the major market makers for such securities by an independent pricing service and are categorized in Level 2. Debt securities for which market quotations are readily available are valued at their most recent bid prices as obtained from one or more of the major market makers for such securities by an independent pricing service and are categorized in Level 2. Money market instruments and other debt securities with a remaining maturity of less than 60 days are valued at amortized cost, which approximates market value and are categorized in Level 2. While this method provides consistency in valuation (and may only be used if it approximates market value), it may result in periods during which value, as determined by amortized cost, is higher or lower than the price that would be received if the Fund sold the investment. Securities for which market quotations or the NOCP are not readily available are fair valued as determined by or under the direction of the Board of Trustees (the “Board”) and are categorized in Level 3. Shares of open-end mutual funds in which the Funds invest are valued at their respective net asset values (“NAV”) as reported by the underlying funds and are categorized in Level 1. The prices for foreign securities are reported in local currency and translated into U.S. dollars using currency exchange rates.
Level 2 Valuation— Securities mainly traded on a non-U.S. exchange are generally valued according to the preceding closing values on that exchange. However, if an event that may change the value of a security occurs after the time that the closing value on the non-U.S. exchange was determined, but before the close of regular trading on the NYSE, the security may be priced based on fair value. This may cause the value of the security, if held on the books of a Fund, to be significantly different from the closing value on the non-U.S. exchange and may affect the calculation of that Fund’s NAV. Any debt securities held by a Fund for which market quotations are not readily available are generally priced at their most recent bid prices as obtained from one or more of the major market makers for such securities.
Level 3 Valuation— Securities held by the Funds that do not have readily available market quotations, or securities for which the available market quotations are not reliable, are priced at their fair value using procedures approved by the Funds’ Board.
The Funds may use fair value pricing under the following circumstances, among others:
| • | If the value of a security has been materially affected by events occurring before the Funds’ pricing time but after the close of the primary markets on which the security is traded. |
Notes to Financial Statements (Continued)
| • | If the exchange on which a portfolio security is principally traded closes early or if trading in a particular portfolio security was halted during the day and did not resume prior to the Funds’ NAV calculation. |
| • | If a security is so thinly traded that reliable market quotations are unavailable due to infrequent trading. |
| • | If the validity of market quotations is not reliable. |
Investment companies — Certain Funds invest in securities of other investment companies, including exchange-traded funds (“ETFs”), open-end funds, and closed-end funds. Open-end funds are investment companies that issue new shares continuously and redeem shares daily. Closed-end funds are investment companies that typically issue a fixed number of shares that trade on a securities exchange or over-the-counter. An ETF is an investment company that typically seeks to track the performance of an index by holding in its portfolio shares of all the companies, or a representative sample of the companies, that are components of a particular index. ETFs are traded on a securities exchange based on their market value. The risks of investment in other investment companies typically reflect the risks of the types of securities in which investment companies invest. Investments in ETFs and closed-end funds are subject to the additional risk that shares of the fund may trade at a premium or discount to their NAV. When a Fund invests in another investment company, shareholders of the Fund indirectly bear their proportionate share of the other investment company’s fees and expenses, including operating, registration, trustee, licensing, and marketing, as well as their share of the Funds’ fees and expenses.
Options — The Flexible Income Fund may write or purchase financial option contracts primarily to hedge against changes in the value of equity securities (or securities that the Fund intends to purchase), against fluctuations in fair value caused by changes in prevailing market interest rates or foreign currency exchange rates and against changes in overall equity market volatility. In addition, the Fund may utilize options in an attempt to generate gains from option premiums or to reduce overall portfolio risk. The Fund’s option strategy primarily focuses on the use of writing call options on equity indexes. When the Fund writes or purchases an option, an amount equal to the premium received or paid by the Fund is recorded as a liability or an asset and is subsequently adjusted to the current market value of the option written or purchased. Premiums received or paid from writing or purchasing options which expire unexercised are treated by the Fund on the expiration date as realized gains or losses. The difference between the premium and the amount paid or received on effecting a closing purchase or sale transaction, including brokerage commissions, is also treated as a realized gain or loss. If an option is exercised, the premium paid or received is added to the cost of the purchase or proceeds from the sale in determining whether the Fund has realized a gain or loss on investment transactions. The Fund, as writer of an option, may have no control over whether the underlying securities may be sold (call) or purchased (put) and as a result bear the market risk of an unfavorable change in the price of the security underlying the written option. The Fund, as purchaser of an option, bears the risk that the counterparties to the option may not have the ability to meet the terms of the option contracts. There is minimal counterparty credit risk involved in entering into option contracts since they are exchange-traded instruments and the exchange’s clearinghouse, as counterparty to all exchange-traded options, guarantees the options against default. Options are valued at the last quoted sales price. If there is no such reported sale on the valuation date, long option positions are valued at the most recent bid price, and short option positions are valued at the most recent ask price. As of March 31, 2014, and the year then ended, the Fund did not hold any written options.
Futures Contracts — The Flexible Income Fund may buy and sell futures contracts and related options to manage its exposure to changing interest rates and securities prices. Some strategies reduce a Fund’s exposure to price fluctuations, while others tend to increase its market exposure. Futures and options on futures can be volatile instruments and involve certain risks that could negatively impact a Fund’s return. In order to avoid leveraging and related risks, when a Fund purchases futures contracts, it will collateralize its position by depositing
Notes to Financial Statements (Continued)
an amount of cash or liquid securities, equal to the market value of the futures positions held, less margin deposits, in a segregated account with its custodian or otherwise “cover” its position in a manner consistent with the 1940 Act, the rules thereunder, or the Securities and Exchange Commission (the “SEC”) interpretations thereof. Collateral equal to the current market value of the futures position will be marked to market on a daily basis.
When the contract is closed, the Fund records a realized gain or loss equal to the difference between the proceeds from (or cost of) the closing transactions and the Fund’s basis in the contract. Risks of entering into futures contracts include the possibility that a change in the value of the contract may not correlate with the changes in the value of the underlying instruments. Second, it is possible that a lack of liquidity for futures contracts could exist in the secondary market resulting in an inability to close a futures position prior to its maturity date. Third, the purchase of a futures contract involves the risk that the purchasing Fund could lose more than the original margin deposit required to initiate the futures transaction. Finally, a Fund’s losses could exceed amounts disclosed on its Statements of Assets and Liabilities. There is minimal counterparty credit risk involved in entering into futures contracts since they are exchange-traded instruments and the exchange’s clearinghouse, as counterparty to all exchange-traded futures, guarantees the futures against default. As of March 31, 2014, the Flexible Income Fund held future contracts as shown on the Portfolio of Investments and had cash in the amount of $660,325 held as collateral for future contracts.
Swap Contracts — The Flexible Income Fund may enter into swap transactions, which are financial instruments that typically involve the exchange of cash flows between two parties on specified dates (settlement dates), where the cash flows are based on agreed-upon prices, rates, indexes, etc. The nominal amount on which the cash flows are calculated is called the notional amount. Swaps may be individually negotiated, or exchange traded and are structured to include exposure to a variety of different types of investments or market factors, such as interest rates, foreign currency rates, mortgage securities, corporate borrowing rates, security prices, indexes, or inflation rates.
Swap agreements may increase or decrease the overall volatility of the investments of a Fund and its share price. The performance of swap agreements may be affected by a change in the specific interest rate, currency, or other factors that determine the amounts of payments due to and from a Fund. If a swap agreement calls for payments by a Fund, the Fund must be prepared to make such payments when due. In addition, if the counterparty’s creditworthiness declines, the value of a swap agreement would be likely to decline, potentially resulting in losses.
Generally, bilateral swap agreements have a fixed maturity date that will be agreed upon by the parties. The agreement can be terminated before the maturity date only under limited circumstances, such as default by one of the parties or insolvency, among others, and can be transferred by a party only with the prior written consent of the other party. A Fund may be able to eliminate its exposure under a swap agreement either by assignment or by other disposition, or by entering into an offsetting swap agreement with the same party or a similarly creditworthy party. If the counter-party is unable to meet its obligations under the contract, declares bankruptcy, defaults or becomes insolvent, a Fund may not be able to recover the money it expected to receive under the contract.
Cleared swaps are transacted through futures commission merchants that are members of central clearinghouses with the clearinghouses servicing as a central counterparty. Pursuant to rules promulgated under the Dodd-Frank Act, central clearing of swap agreements is currently required for certain market participants trading certain instruments, and central clearing for additional instruments is expected to be implemented by regulators until the majority of the swaps market is ultimately subject to central clearing.
Notes to Financial Statements (Continued)
A swap agreement can be a form of leverage, which can magnify a Fund’s gains or losses. In order to reduce the risk associated with leveraging, a Fund may cover its current obligations under swap agreements according to guidelines established by the SEC. If a Fund enters into a swap agreement on a net basis, it will segregate assets with a daily value at least equal to the excess, if any, of the Fund’s accrued obligations under the swap agreement over the accrued amount the Fund is entitled to receive under the agreement. If a Fund enters into a swap agreement on other than a net basis, it will segregate assets with a value equal to the full amount of the Fund’s accrued obligations under the agreement.
Swaps other than security-based swaps are included in the definition of “commodity interests” under the Commodity Exchange Act (the “CEA”). Under recent amendments to Rule 4.5 under the CEA, a Fund may be considered a commodity pool if it trades more than a de minimis amount of commodity interests (including swaps). Under such circumstances, the Fund and its investment advisor may be subject to regulation by the Commodity Futures Trading Commission (“CFTC”). None of the Touchstone Funds intends to trade above the de minimis limitation, and the Flexible Income Fund’s investment advisor has claimed an exclusion from registering with the CFTC as a commodity pool operator and an exemption from registering with the CFTC as a commodity trading advisor.
As of March 31, 2014 and for the year then ended, the Fund did not hold any swap contracts.
Foreign currency translation — The books and records of the Funds are maintained in U.S. dollars and translated into U.S. dollars on the following basis:
| (1) | market value of investment securities, assets and liabilities at the current rate of exchange on the valuation date; and |
| (2) | purchases and sales of investment securities, income, and expenses at the relevant rates of exchange prevailing on the respective dates of such transactions. |
The Funds do not isolate that portion of gains and losses on investments in equity securities that is due to changes in the foreign exchange rates from that which is due to changes in market prices of equity securities.
Forward foreign currency contracts — A forward foreign currency contract is an agreement between two parties to buy and sell a specific currency at a price that is set on the date of the contract. The forward contract calls for delivery of the currency on a future date that is specified in the contract. Risks related to the use of forwards include the possible failure of counterparties to meet the terms of the forward agreement, the failure of the counterparties to timely post collateral, the risk that currency movements will not occur thereby reducing the Fund’s total return, and the potential for losses in excess of the Fund’s initial investment.
The market value of a forward foreign currency contract fluctuates with changes in foreign currency exchange rates. Forward foreign currency contracts are marked to market daily and the change in value is recorded by a Fund as an unrealized gain or loss. Realized gains or losses, equal to the difference between the value of the contract at the time it was opened and the value at the time it was closed, are recorded upon delivery or receipt of the currency.
During the year ended March 31, 2014, the Flexible Income Fund used forward foreign currency contracts to enhance potential gains, hedge against anticipated currency exchange rates, maintain diversity and liquidity of the portfolio and adjust exposure to foreign currencies.
Derivative instruments and hedging activities — In order to better define its contractual rights and to secure rights that will help the Funds mitigate their counterparty risk, Flexible Income Fund may enter into an International Swaps and Derivatives Association, Inc. Master Agreements (“ISDA Master Agreement” or “MNA”) or similar agreement with certain counterparties. An ISDA Master Agreement is a bilateral agreement between a Fund and a counterparty that governs over-the-counter (“OTC”) derivatives and foreign exchange contracts, and
Notes to Financial Statements (Continued)
typically contains, among other things, collateral posting terms and master netting provisions in the event of a default or termination. Under an ISDA Master Agreement, a party may, under certain circumstances, offset with the counterparty certain derivative financial instrument’s payables or receivables with collateral held or posted and create one single net payment. The provisions of the ISDA Master Agreement typically permit a single net payment in the event of default (close-out netting). These default events include bankruptcy or insolvency of the counterparty. Note, however, that bankruptcy or insolvency laws of a particular jurisdiction may impose restrictions on or prohibitions against the right of offset.
When entering into a derivative transaction, a Fund may be required to post and maintain collateral or margin (including both initial and maintenance margin). Collateral and margin requirements differ by type of derivative. Margin requirements are established by the broker or clearing house for exchange traded and centrally cleared derivatives (financial futures contracts, options, and centrally cleared swaps). Brokers can ask for margining in excess of the clearing house’s minimum in certain circumstances. Collateral terms are contract specific for OTC derivatives (foreign currency exchange contracts, options, and swaps). For derivatives traded under an ISDA Master Agreement, the collateral requirements are typically calculated by netting the marked-to-market amount for each transaction under such agreement and comparing that amount to the value of any collateral currently pledged by the Fund and the counterparty. For financial reporting purposes, cash collateral that has been pledged to cover obligations of the Fund and cash collateral received from the counterparty, if any, is reported separately on the Statements of Assets and Liabilities as cash pledged as collateral and cash received as collateral, respectively. Non-cash collateral pledged by the Fund, if any, is noted in the Portfolio of Investments. To the extent amounts due to the Fund from its counterparties are not fully collateralized, contractually or otherwise, the Fund bears the risk of loss from counterparty non-performance. A Fund attempts to mitigate counterparty risk by only entering into agreements with counterparties that it believes have the financial resources to honor their obligations and by monitoring the financial stability of those counterparties.
Certain ISDA Master Agreements allow counterparties to OTC derivatives transactions to terminate derivative contracts prior to maturity in the event the Fund’s net assets decline by a stated percentage or the Fund fails to meet the terms of their ISDA Master Agreement, which would cause the Fund to accelerate payment of any net liability owed to the counterparty.
For financial reporting purposes, the Funds do not offset derivative assets and derivative liabilities that are subject to netting arrangements in the Statements of Assets and Liabilities.
As of March 31, 2014, the Flexible Income Fund’s derivative assets and liabilities (by type) on a gross basis were as follows:
| | | Assets | | | Liabilities | |
| Derivative Financial Instruments: | | | | | | | | |
| Forward Foreign Currency Contracts | | $ | 114,751 | | | $ | (230,813 | ) |
| Futures Contracts | | | — | | | | (30,000 | ) |
| Total gross amount of assets and liabilities subject to MNA | | $ | 114,751 | | | $ | (260,813 | ) |
The following table presents the Flexible Income Fund’s derivative assets and liabilities net of amounts available for offset under a MNA and net of the related collateral pledged by the Fund as of March 31, 2014:
| | | | | | Gross Amounts Available | | | | | | | |
| | | Gross Amount of | | | for Offset in Statement | | | | | | Net Amount of | |
| | | Recognized Assets | | | of Assets and Liabilities | | | Cash Collateral Pledged | | | Derivative Assets(B) | |
| Forward Foreign Currency | | | | | | | | | | | | | | | | |
| Contracts(A) | | $ | 114,751 | | | $ | (114,751 | ) | | $ | — | | | $ | — | |
| Total | | $ | 114,751 | | | $ | (114,751 | ) | | $ | — | | | $ | — | |
Notes to Financial Statements (Continued)
| | | | | | Gross Amount Available | | | | | | | |
| | | Gross Amount of | | | for Offset in Statement | | | | | | Net Amount of | |
| | | Recognized Liabilities | | | of Assets and Liabilities | | | Cash Collateral Pledged | | | Derivative Liabilities(D) | |
| Forward Foreign Currency | | | | | | | | | | | | | | | | |
| Contracts(A) | | $ | 230,813 | | | $ | (114,751 | ) | | $ | — | | | $ | 116,062 | |
| Futures(C) | | | 30,000 | | | | — | | | | (30,000 | ) | | | — | |
| Total | | $ | 260,813 | | | $ | (114,751 | ) | | $ | (30,000 | ) | | $ | 116,062 | |
| (A) | BNY ConvergEx is the counterparty. |
| (B) | Net amount represents the net amount receivable from the counterparty in the event of default. |
| (C) | Morgan Stanley is the counterparty. |
| (D) | Net amount represents the net amount payable due to the counterparty in the event of default. |
The following table sets forth the fair value of the Funds’ derivative financial instruments by primary risk exposure as of March 31, 2014:
| Fair Value of Derivative Investments |
| As of March 31, 2014 |
| | | | | Asset | | | Liability | |
| | | | | Derivatives | | | Derivatives | |
| | | Derivatives not accounted for as hedging | | Unrealized | | | Unrealized | |
| Fund | | instruments under ASC 815 | | Appreciation | | | Depreciation | |
| Flexible Income Fund | | Forward - Foreign Currency Exchange Contracts* | | $ | 114,751 | | | $ | (230,813 | ) |
| | | Futures - Interest Rate Contracts** | | | — | | | | (30,000 | ) |
* Statements of Assets and Liabilities Location: Unrealized appreciation on forward foreign currency contracts and unrealized depreciation on forward foreign currency contracts, respectively.
** Statements of Assets and Liabilities Location: Payable for variation margin for futures contracts. Only current day’s variation margin is reported within the payables of the Statement of Assets and Liabilities. Includes cumulative unrealized appreciation/(depreciation) of future contracts as reported in the Portfolio of Investments and within the components of net assets section of the Statement of Assets and Liabilities.
The following table sets forth the operations of the Funds’ derivative financial instruments by primary risk exposure as of March 31, 2014:
| The Effect of Derivative Investments on the Statement of Operations |
| for the Year Ended March 31, 2014 |
| | | | | | | | Change in | |
| | | | | | | | Unrealized | |
| | | | | Realized Gain | | | Appreciation | |
| | | Derivatives not accounted for as hedging | | (Loss) | | | (Depreciation) | |
| Fund | | instruments under ASC 815 | | on Derivatives | | | on Derivatives | |
| Flexible Income Fund | | Purchased Options - Interest Rate Contracts* | | $ | 115,477 | | | $ | — | |
| | | Futures - Interest Rate Contracts** | | | (426,416 | ) | | | 107,150 | |
| | | Forward - Foreign Currency Exchange Contracts*** | | | (417,087 | ) | | | (118,310 | ) |
* Statements of Operations Location: Net realized gains on investments from non-affiliated securities and net change in unrealized appreciation (depreciation) on investments, respectively.
** Statements of Operations Location: Net realized losses on futures contracts and net change in unrealized appreciation (depreciation) on futures contracts, respectively.
*** Statements of Operations Location: Net realized losses on foreign currency and net change in unrealized appreciation (depreciation) on foreign currency transactions, respectively.
Notes to Financial Statements (Continued)
For the year ended March 31, 2014, the average quarterly balance of outstanding derivative financial instruments were as follows:
| | | Flexible | | | International | |
| | | Income | | | Value | |
| | | Fund | | | Fund | |
| Equity contracts: | | | | | | | | |
| Rights - Average number of contracts | | | — | | | | 26,247 | |
| Interest rate contracts: | | | | | | | | |
| Futures - Average notional value | | $ | 52,486,781 | | | | — | |
| Foreign currency exchange contracts: | | | | | | | | |
| Average number of contracts | | | 6 | | | | — | |
| Average U.S. dollar amount purchased | | $ | 16,549,629 | | | | — | |
| Average U.S. dollar amount sold | | $ | 2,034,671 | | | | — | |
Portfolio securities loaned — Each Fund may lend its portfolio securities. Lending portfolio securities exposes a Fund to the risk that the borrower may fail to return the loaned securities or may not be able to provide additional collateral or that the Funds may experience delays in recovery of the loaned securities or loss of rights in the collateral if the borrower fails financially. To minimize these risks, the borrower must agree to maintain cash collateral with the Funds’ custodian. The loaned securities are secured by collateral valued at least equal, at all times, to the market value of the loaned securities plus accrued interest, if any. When the collateral falls below specified amounts, the lending agent will use its best effort to obtain additional collateral on the next business day to meet required amounts under the security lending agreement. The cash collateral is reinvested by the Funds’ custodian into an approved investment vehicle. The approved investment vehicle is subject to market risk.
As of March 31, 2014, the following Funds loaned securities and received collateral as follows:
| | | Market Value of | | | Market Value of | |
| | | Securities | | | Collateral | |
| Fund | | Loaned | | | Received | |
| Flexible Income Fund | | $ | 898,695 | | | $ | 904,500 | |
| Focused Fund | | | 54,686,657 | | | | 55,461,620 | |
| International Value Fund | | | 2,143,868 | | | | 2,182,280 | |
| Large Cap Growth Fund | | | 39,346,706 | | | | 39,853,925 | |
| Mid Cap Growth Fund | | | 599,390 | | | | 615,450 | |
| Small Cap Growth Fund | | | 6,193,555 | | | | 7,275,844 | |
All cash collateral is received, held, and administered by the Funds’ custodian for the benefit of the lending Fund in its custody account or other account established for the purpose of holding collateral.
Funds participating in securities lending receive compensation in the form of fees. Securities lending income is derived from lending long securities from the Funds to creditworthy approved borrowers at rates that are determined based on daily trading volumes, float, short-term interest rates and market liquidity. A lending Fund retains the interest or dividends on the investment of any cash received as collateral. The lending Fund continues to receive interest or dividends on the loaned securities.
Unrealized gain or loss on the market value of the loaned securities that may occur during the term of the loan is recognized by the lending Fund. The lending Fund has the right under the lending agreement to recover the securities from the borrower on demand.
Share valuation — The NAV per share of each class of shares of each Fund is calculated daily by dividing the total value of a Fund’s assets attributable to that class, less liabilities attributable to that class, by the number of outstanding shares of that class.
Notes to Financial Statements (Continued)
The maximum offering price per share of Class A shares of the Funds is equal to the NAV per share plus a sales load equal to 6.10% of the NAV (or 5.75% of the offering price). There is no sales load on purchases of $1 million or more of Class A shares. The maximum offering price per share of Classes B, C, Y, and Institutional Class shares of the Funds is equal to the NAV per share.
The redemption price per share of each class of shares of the Funds is generally equal to the NAV per share. However, Class A redemptions that were part of a no-load $1 million subscription may be subject to a contingent deferred sales charge (“CDSC”) of up to 1% if redeemed within a one-year period from the date of purchase. Class B shares of the Funds are subject to a CDSC of 5.00% in the event of a shareholder redemption within a one-year period of purchase. The CDSC will be incrementally reduced over time. After the 6th year, there is no CDSC. Class C shares of the Funds are subject to a CDSC of 1.00% that will be assessed on an amount equal to the lesser of (1) the NAV at the time of purchase of the shares being redeemed or (2) the NAV of such shares being redeemed if redeemed within a one-year period from the date of purchase.
Investment income — Dividend income from securities is recognized on the ex-dividend date, net of foreign withholding taxes, if any, which are reduced by any amounts reclaimable by the Funds, where applicable. Interest income from securities is recorded on the basis of interest accrued, premium amortized and discount accreted. Realized gains and losses resulting from principal paydowns on mortgage-backed and asset-backed securities are included in interest income. Market discounts, original issues discount (“OID”) and market premiums on debt securities are accreted/amortized to interest income over the life of the security with a corresponding adjustment in the cost basis of that security.
Distributions to shareholders — Each Fund intends to distribute to its shareholders substantially all of its income and capital gains. Each Fund, except for the Flexible Income Fund, declares and distributes net investment income, if any, annually, as a dividend to shareholders. The Flexible Income Fund declares and distributes net investment income, if any, monthly, as a dividend to shareholders. Each Fund makes distributions of capital gains, if any, at least annually, net of applicable capital loss carryforwards. Income distributions and capital gain distributions are determined in accordance with income tax regulations. Recognition of the Funds’ net investment income that invest in underlying funds is affected by the timing of dividend declarations by underlying funds.
Allocations — Investment income earned, realized capital gains and losses, and unrealized appreciation and depreciation for a Fund are allocated daily to each class of shares based upon its proportionate share of total net assets of the Fund. Class specific expenses are charged directly to the class incurring the expense. Common expenses, which are not attributable to a specific class, are allocated daily to each class of shares based upon their proportionate share of total net assets of the Fund. Expenses not directly billed to a Fund are allocated proportionally among all the Funds in the Trust, and, if applicable, Touchstone Investment Trust, Touchstone Institutional Funds Trust, Touchstone Variable Series Trust, Touchstone Funds Group Trust, and Touchstone Tax-Free Trust (collectively with the Trust, “Touchstone Fund Complex”), daily in relation to net assets of each Fund or another reasonable measure.
Security transactions — Security transactions are reflected for financial reporting purposes as of the trade date. Realized gains and losses on sales of portfolio securities are calculated using the identified cost basis.
Estimates — The preparation of financial statements in conformity with U.S. GAAP requires management to make estimates and assumptions that affect the reported amounts of assets and liabilities and disclosure of contingent assets and liabilities at the date of the financial statements and the reported amounts of income and expenses during the reporting period. Actual results could differ from those estimates.
Notes to Financial Statements (Continued)
3. Investment Transactions
Investment transactions (excluding short-term investments and U.S. Government securities) were as follows for the year ended March 31, 2014:
| | | Flexible | | | | | | Growth | | | International | |
| | | Income | | | Focused | | | Opportunities | | | Value | |
| | | Fund | | | Fund | | | Fund | | | Fund | |
| Purchases of investment securities* | | $ | 98,290,082 | | | $ | 257,764,957 | | | $ | 186,998,822 | | | $ | 37,726,432 | |
| Proceeds from sales and maturities* | | $ | 139,371,950 | | | $ | 213,725,835 | | | $ | 187,349,550 | | | $ | 50,593,722 | |
| | | Large Cap | | | Mid Cap | | | Small Cap | |
| | | Growth | | | Growth | | | Growth | |
| | | Fund | | | Fund | | | Fund | |
| Purchases of investment securities* | | $ | 860,051,987 | | | $ | 535,183,916 | | | $ | 130,373,402 | |
| Proceeds from sales and maturities* | | $ | 982,508,135 | | | $ | 572,477,853 | | | $ | 115,524,835 | |
* The cost of purchases and proceeds from sales on the Focused Fund and Small Cap Growth Fund excludes the purchases and sales of the Touchstone Focused Equity Fund and the Touchstone Diversified Small Cap Growth Fund (See Note 11). If these transactions were included, purchases and sales would have been higher.
For the year ended March 31, 2014, purchases and proceeds from sales and maturities in U.S. Government Securities were $14,917,806 and $178,849,908 for the Flexible Income Fund, respectively.
4. Transactions with Affiliates and Other Related Parties
Certain officers of the Trust are also officers of Touchstone Advisors, Inc. (the “Advisor”), Touchstone Securities, Inc. (the “Underwriter”), or BNY Mellon Investment Servicing (U.S) Inc. (“BNY Mellon”), the Sub-Administrator and Transfer Agent to the Funds. Such officers receive no compensation from the Trust. The Advisor and the Underwriter are each wholly-owned, indirect subsidiaries of Western & Southern Financial Group, Inc. (“Western & Southern”).
On behalf of the Funds, the Advisor pays each Independent Trustee a quarterly retainer plus additional retainers to the Lead Independent Trustee and the chairs of each standing committee. Interested Trustees do not receive compensation from the Funds. Each IndependentTrustee will also receive compensation for each board meeting and committee meeting attended. Each standing committee chair will receive additional compensation for each committee meeting that he or she oversees. The Advisor is reimbursed by the Funds for the Independent Trustees’ compensation and out-of-pocket expenses relating to their services. The Funds accrued expenses of $97,661 for the fiscal year ended March 31, 2014.
MANAGEMENT & EXPENSE LIMITATION AGREEMENTS
The Advisor provides general investment supervisory services for the Funds, under terms of an advisory agreement (“Advisory Agreement”). Under the Advisory Agreement, each Fund pays the Advisor a fee, which is computed and accrued daily and paid monthly, at an annual rate based on average daily net assets as shown in the table below.
| Flexible Income Fund* | 0.70% on the first $500 million |
| | 0.60% on such assets in excess of $500 million |
| Focused Fund | 0.70% on the first $100 million |
| | 0.65% of the next $400 million |
| | 0.60% on such assets in excess of $500 million |
Notes to Financial Statements (Continued)
| Growth Opportunities Fund | 0.75% on the first $500 million |
| | 0.70% of the next $500 million |
| | 0.65% on such assets in excess of $1 billion |
| International Value Fund | 1.00% |
| Large Cap Growth Fund | 0.75% on the first $200 million |
| | 0.70% of the next $800 million |
| | 0.65% on such assets in excess of $1 billion |
| Mid Cap Growth Fund | 0.75% on the first $500 million |
| | 0.70% of the next $500 million |
| | 0.65% on such assets in excess of $1 billion |
| Small Cap Growth Fund* | 1.00% on the first $300 million |
| | 0.95% on such assets in excess of $300 million |
*Prior to May 31, 2013 and April 26, 2013, the Flexible Income Fund and the Small Cap Growth Fund paid an advisory fee of 0.70% and 1.00%, respectively.
The Advisor has entered into investment sub-advisory agreements with the following parties (each, a “Sub-Advisor”):
| Apex Capital Management, Inc.* | Fort Washington Investment Advisors, Inc.** |
| Small Cap Growth Fund | Focused Fund |
| Barrow, Hanley, Mewhinney & Strauss, LLC | Navellier & Associates, Inc. |
| International Value Fund | Large Cap Growth Fund |
| ClearArc Capital, Inc. | Westfield Capital Management Company, L.P. |
| (formerly known as Fifth Third Asset Management, Inc.) | Growth Opportunities Fund |
| Flexible Income Fund | Mid Cap Growth Fund |
*Effective April 26, 2013, Apex Capital Management, Inc. became the sub-advisor of the Small Cap Growth Fund. Prior to April 26, 2013, Russell Implementation, Inc. was the interim sub-advisor.
**Affiliate of the Advisor and wholly-owned subsidiary of Western & Southern.
The Advisor, not the Funds, pays sub-advisory fees to each Sub-Advisor.
The Advisor entered into an expense limitation agreement (the “Expense Limitation Agreement”) to contractually limit operating expenses of the Funds, excluding: dividend and interest expenses on short sales; interest; taxes; brokerage commissions; other expenditures which are capitalized in accordance with U.S. GAAP; the cost of “Acquired Fund Fees and Expenses”; if any, and other extraordinary expenses not incurred in the ordinary course of business. The maximum operating expense limit in any year with respect to the Funds is based on a percentage of the average daily net assets of the Funds. The Advisor has agreed to separately waive class-level expenses, advisory fees, administration fees, and to reimburse expenses in order to maintain expense limitations for the Funds:
| | | | | | | | | | | | | | | Institutional | |
| | | Class A | | | Class B | | | Class C | | | Class Y | | | Class | |
| Flexible Income Fund* | | | 1.09 | % | | | — | | | | 1.84 | % | | | 0.84 | % | | | 0.74 | % |
| Focused Fund | | | 1.20 | % | | | — | | | | 1.95 | % | | | 0.95 | % | | | 0.80 | % |
| Growth Opportunities Fund** | | | 1.24 | % | | | — | | | | 1.99 | % | | | 0.99 | % | | | 0.84 | % |
| International Value Fund*** | | | 1.39 | % | | | — | | | | 2.14 | % | | | 1.14 | % | | | 0.99 | % |
| Large Cap Growth Fund**** | | | 1.25 | % | | | 2.00 | % | | | 2.00 | % | | | 0.99 | % | | | — | |
| Mid Cap Growth Fund | | | 1.43 | % | | | 2.18 | % | | | 2.18 | % | | | 1.18 | % | | | 1.03 | % |
| Small Cap Growth Fund***** | | | 1.44 | % | | | — | | | | 2.19 | % | | | 1.19 | % | | | 1.04 | % |
Notes to Financial Statements (Continued)
*Prior to November 30, 2013, the expense limitation for Classes A, C, Y, and Institutional Class shares were 0.94%, 1.69%, 0.69% and 0.59%, respectively.
**Prior to September 10, 2013, the expense limitation for Classes A, C, Y, and Institutional Class shares were 1.20%, 1.95%, 0.95% and 0.84%, respectively.
***Prior to November 30, 2013, the expense limitation for Classes A, C, Y, and Institutional Class shares were 1.36%, 2.11%, 1.11% and 0.96%, respectively.
****Prior to September 10, 2013, the expense limitation for Classes A, B, C, and Class Y shares were 1.20%, 1.95%, 1.95% and 0.95%, respectively.
*****Prior to April 26, 2013, the expense limitation for Classes A, C, Y, and Institutional Class shares were 1.60%, 2.35%, 1.35% and 1.25%, respectively.
These expense limitations will remain in effect for all Funds, except for Small Cap Growth Fund through at least July 28, 2014. The expense limitation for Small Cap Growth Fund will remain in effect through at least August 30, 2014.
During the year ended March 31, 2014, the Advisor or its affiliates waived investment advisory fees and administration fees or reimbursed expenses, including distribution fees of the Funds as follows:
| | | | | | | | | Other | | | | |
| | | Investment | | | | | | Operating | | | | |
| | | Advisory | | | Administration | | | Expenses | | | | |
| Fund | | Fees Waived | | | Fees Waived | | | Reimbursed | | | Total | |
| Flexible Income Fund | | $ | 326,135 | | | $ | 436,808 | | | $ | 48,846 | | | $ | 811,789 | |
| Focused Fund | | | — | | | | 679,675 | | | | 340,647 | | | | 1,020,322 | |
| Growth Opportunities Fund | | | — | | | | 303,148 | | | | 67,817 | | | | 370,965 | |
| International Value Fund | | | 161,685 | | | | 205,392 | | | | 40,525 | | | | 407,602 | |
| Large Cap Growth Fund | | | — | | | | — | | | | 693,067 | | | | 693,067 | |
| Small Cap Growth Fund | | | 63,165 | | | | 100,321 | | | | 47,456 | | | | 210,942 | |
Effective September 10, 2012, under the terms of the Expense Limitation Agreement the Advisor is entitled to recover, subject to approval by the Funds’ Board, such amounts waived or reimbursed for a period of up to three years from the year in which the Advisor reduced its compensation or assumed expenses for the Funds. No recoupment will occur unless a Fund’s operating expenses are below the expense limitation amount in effect at the time of waiver or reimbursement. As of March 31, 2014, the Advisor may seek recoupment of previously waived fees and reimbursed expenses as follows:
| | | Expiration | | | Expiration | | | | |
| | | March 31, | | | March 31, | | | | |
| Funds | | 2016 | | | 2017 | | | Total | |
| Flexible Income Fund | | $ | 560,578 | | | $ | 772,157 | | | $ | 1,332,735 | |
| Focused Fund | | | 590,230 | | | | 712,383 | | | | 1,302,613 | |
| Growth Opportunities Fund | | | 178,636 | | | | 317,974 | | | | 496,610 | |
| International Value Fund | | | 258,059 | | | | 397,344 | | | | 655,403 | |
| Large Cap Growth Fund | | | 390,044 | | | | 432,998 | | | | 823,042 | |
| Small Cap Growth Fund | | | 56,376 | | | | 180,962 | | | | 237,338 | |
For the year ended March 31, 2014, the Advisor recouped previously waived fees or reimbursed expenses from the Focused Fund and Growth Opportunities Fund of $458 and $9,102, respectively.
Notes to Financial Statements (Continued)
ADMINISTRATION AGREEMENT
The Advisor entered into an Administration Agreement with the Trust, whereby the Advisor is responsible for: supplying executive and regulatory compliance services; supervising the preparation of tax returns; coordinating the preparation of reports to shareholders and reports to, and filings with, the SEC and state securities authorities, as well as materials for meetings of the Board of Trustees; calculating the daily NAV per share; and maintaining the financial books and records of each Fund. For its services, the Advisor receives an annual fee of 0.20% on the first $6 billion of the aggregate average daily net assets of the Touchstone Fund Complex (excluding Touchstone Institutional Money Market Fund, the Touchstone Institutional Funds Trust, and the Touchstone Variable Series Trust); 0.16% of the next $4 billion of aggregate average daily net assets; and 0.12% of the aggregate average daily net assets over $10 billion. The fee is allocated among the funds of the Touchstone Fund Complex (excluding Touchstone Institutional Money Market Fund, the Touchstone Institutional Funds Trust, and the Touchstone Variable Series Trust) on the basis of relative daily net assets.
The Advisor has engaged BNY Mellon as the Sub-Administrator to the Trust. BNY Mellon provides administrative and accounting services to the Trust and is compensated directly by the Advisor, not the Trust.
TRANSFER AGENT AGREEMENT
Under the terms of the Transfer Agent Agreement between the Trust and BNY Mellon, BNY Mellon maintains the records of each shareholder’s account, answers shareholders’ inquiries concerning their accounts, processes purchases and redemptions of each Fund’s shares, acts as dividend and distribution disbursing agent, and performs other shareholder service functions. For these services, BNY Mellon receives a monthly fee per shareholder account from each Fund. In addition, each Fund pays out-of-pocket expenses incurred by BNY Mellon, including, but not limited to, postage and supplies.
The Funds may reimburse the Advisor for fees paid to intermediaries such as banks, broker-dealers, financial advisors or other financial institutions for sub-transfer agency, sub-administration and other services provided to investors whose shares of record are held in omnibus, other group accounts, retirement plans or accounts traded through registered securities clearing agents. These fees may vary based on, for example, the nature of services provided, but generally range up to 0.15% of the assets of the class serviced or maintained by the intermediary or up to $17 per sub-account maintained by the intermediary. The Funds will only reimburse the Advisor up to $17 per sub-account maintained by the intermediary.
PLANS OF DISTRIBUTION AND SHAREHOLDER SERVICING FEE ARRANGEMENTS
The Trust has adopted distribution plans pursuant to Rule 12b-1 under the 1940 Act for each class of shares it offers that are subject to 12b-1 distribution fees. The plans allow each Fund to pay distribution and other fees for the sale and distribution of its shares and for services provided to shareholders. The fees charged to the Funds are limited to the actual expenses incurred. Under the Class A plan, each Fund offering Class A shares pays an annual fee of up to 0.25% of average daily net assets that are attributable to Class A shares. Under the Class B plan, each Fund offering Class B shares pays an annual fee of up to 1.00% of average daily net assets that are attributable to Class B shares. Under the Class C plan, each Fund offering Class C shares pays an annual fee of up to 1.00% of average daily net assets that are attributable to Class C shares (of which up to 0.75% is a distribution fee and up to 0.25% is a shareholder servicing fee).
UNDERWRITING AGREEMENT
The Underwriter is the Funds’ principal underwriter and, as such, acts as exclusive agent for distribution of the Funds’ shares. Under the terms of the Underwriting Agreement between the Trust and the Underwriter, the Underwriter earned the following from underwriting and broker commissions on the sale of Class A shares of the Funds listed below during the year ended March 31, 2014:
Notes to Financial Statements (Continued)
| Fund | | Amount | |
| Flexible Income Fund | | $ | 12,644 | |
| Focused Fund | | | 23,014 | |
| Growth Opportunities Fund | | | 13,680 | |
| International Value Fund | | | 670 | |
| Large Cap Growth Fund | | | 30,166 | |
| Mid Cap Growth Fund | | | 24,688 | |
| Small Cap Growth Fund | | | 13,398 | |
In addition, the Underwriter collected CDSC on the redemption of Classes A, B, and C shares of the Funds listed below during the year ended March 31, 2014:
| Fund | | Class A | | | Class B | | | Class C | |
| Flexible Income Fund | | $ | — | | | $ | — | | | $ | 1,341 | |
| Growth Opportunities Fund | | | 11,888 | | | | — | | | | 42 | |
| Large Cap Growth Fund | | | 1 | | | | 1,077 | | | | 6,739 | |
| Mid Cap Growth Fund | | | 4 | | | | 760 | | | | 3,712 | |
| Small Cap Growth Fund | | | — | | | | — | | | | 35 | |
AFFILIATED INVESTMENTS
Each Fund may invest in the Touchstone Institutional Money Market Fund, subject to compliance with several conditions set forth in an exemptive order received by the Trust from the SEC. To the extent that the Funds are invested in the Touchstone Institutional Money Market Fund, the Advisor and Administrator will be paid additional fees from the Touchstone Institutional Money Market Fund that will not be waived or reimbursed.
A summary of each Fund’s investment, as applicable, in the Touchstone Institutional Money Market Fund for the year ended March 31, 2014, is as follows:
| | | Share Activity | | | | | | | |
| | | Balance | | | | | | | | | Balance | | | | | | Value | |
| Fund | | 03/31/13 | | | Purchases | | | Sales | | | 03/31/14 | | | Dividends | | | 03/31/14 | |
| Flexible Income Fund | | | 3,418,157 | | | | 131,247,131 | | | | (132,157,503 | ) | | | 2,507,785 | | | $ | 1,937 | | | $ | 2,507,785 | |
| Focused Fund | | | 21,612,357 | | | | 177,975,812 | | | | (160,374,225 | ) | | | 39,213,944 | | | | 6,583 | | | | 39,213,944 | |
| Growth Opportunities Fund | | | 13,082,761 | | | | 121,754,309 | | | | (132,197,367 | ) | | | 2,639,703 | | | | 1,208 | | | | 2,639,703 | |
| International Value Fund | | | 21,291,834 | | | | 42,654,267 | | | | (62,680,967 | ) | | | 1,265,134 | | | | 479 | | | | 1,265,134 | |
| Large Cap Growth Fund | | | 3,768,527 | | | | 460,590,446 | | | | (452,393,918 | ) | | | 11,965,055 | | | | 2,664 | | | | 11,965,055 | |
| Mid Cap Growth Fund | | | 13,517,237 | | | | 291,529,826 | | | | (297,017,703 | ) | | | 8,029,360 | | | | 3,147 | | | | 8,029,360 | |
| Small Cap Growth Fund | | | 689,381 | | | | 60,973,242 | | | | (56,874,655 | ) | | | 4,787,968 | | | | 552 | | | | 4,787,968 | |
5. Federal Tax Information
Federal income tax — It is each Fund’s policy to continue to comply with the special provisions of the Internal Revenue Code applicable to regulated investment companies. As provided therein, in any fiscal year in which a Fund so qualifies and distributes at least 90% of its investment company taxable income, the Fund (but not the shareholders) will be relieved of federal income tax on the income distributed. It is each Fund’s policy to distribute all of its taxable income and accordingly, no provision for income taxes has been made.
In order to avoid imposition of the excise tax applicable to regulated investment companies, it is also each Fund’s intention to declare and pay as dividends in each calendar year at least 98% of its investment company taxable income (earned during the calendar year) and 98.2% of its net realized capital gains (earned during the twelve months ending October 31) plus undistributed amounts from prior years.
Notes to Financial Statements (Continued)
The tax character of distributions paid are as follows:
| | | | | | Flexible | | | | | | | | | | |
| | | | | | Income Fund | | | | | | Focused Fund | | | | |
| | | | | | Eight Months | | | | | | | | | | |
| | | Year Ended | | | Ended | | | Year Ended | | | Year Ended | | | Year Ended | |
| | | March 31, | | | March 31, | | | July 31, | | | March 31, | | | March 31, | |
| | | 2014 | | | 2013 | | | 2012 | | | 2014 | | | 2013 | |
| From ordinary income | | $ | 12,579,476 | | | $ | 8,931,021 | | | $ | 10,351,922 | | | $ | 5,340,485 | | | $ | 1,158,632 | |
| From long-term capital gains | | | — | | | | — | | | | — | | | | — | | | | — | |
| | | $ | 12,579,476 | | | $ | 8,931,021 | | | $ | 10,351,922 | | | $ | 5,340,485 | | | $ | 1,158,632 | |
| | | Growth | | | | | | International | | | | |
| | | Opportunities Fund | | | | | | Value Fund | | | | |
| | | | | | | | | | | | Eight Months | | | | |
| | | Year Ended | | | Year Ended | | | Year Ended | | | Ended | | | Year Ended | |
| | | March 31, | | | March 31, | | | March 31, | | | March 31, | | | July 31, | |
| | | 2014 | | | 2013 | | | 2014 | | | 2013 | | | 2012 | |
| From ordinary income | | $ | 740,475 | | | $ | 13,520,246 | | | $ | 1,538,572 | | | $ | 3,533,117 | | | $ | 4,727,748 | |
| From long-term capital gains | | | 10,193,027 | | | | — | | | | — | | | | — | | | | — | |
| | | $ | 10,933,502 | | | $ | 13,520,246 | | | $ | 1,538,572 | | | $ | 3,533,117 | | | $ | 4,727,748 | |
| | | Large Cap | | | Mid Cap | | | | | | Small Cap | | | | |
| | | Growth Fund | | | Growth Fund | | | | | | Growth Fund | | | | |
| | | | | | | | | | | | | | | | | | Eight | | | | |
| | | | | | | | | | | | | | | | | | Months | | | | |
| | | Year Ended | | | Year Ended | | | Year Ended | | | Year Ended | | | Year Ended | | | Ended | | | Year Ended | |
| | | March 31, | | | March 31, | | | March 31, | | | March 31, | | | March 31, | | | March 31, | | | July 31, | |
| | | 2014 | | | 2013 | | | 2014 | | | 2013 | | | 2014 | | | 2013 | | | 2012 | |
| From ordinary income | | $ | 14,481,879 | | | $ | 4,798,981 | | | $ | 14,379,637 | | | $ | 5,551,913 | | | $ | 1,065,782 | | | $ | 172,176 | | | $ | — | |
| From long-term capital gains | | | 71,760,218 | | | | — | | | | 61,442,947 | | | | 35,848,435 | | | | 5,236,442 | | | | 1,906,955 | | | | — | |
| | | $ | 86,242,097 | | | $ | 4,798,981 | | | $ | 75,822,584 | | | $ | 41,400,348 | | | $ | 6,302,224 | | | $ | 2,079,131 | | | $ | — | |
The following information is computed on a tax basis for each item as of March 31, 2014:
| | | Flexible | | | | | | Growth | | | International | |
| | | Income | | | Focused | | | Opportunities | | | Value | |
| | | Fund | | | Fund | | | Fund | | | Fund | |
| Tax cost of portfolio investments | | $ | 232,751,741 | | | $ | 871,345,404 | | | $ | 209,015,972 | | | $ | 118,529,780 | |
| Gross unrealized appreciation | | | 9,032,238 | | | | 194,086,958 | | | | 59,872,484 | | | | 19,916,978 | |
| Gross unrealized depreciation | | | (6,081,024 | ) | | | (2,782,478 | ) | | | (2,427,202 | ) | | | (2,772,689 | ) |
| Net unrealized appreciation on investments | | | 2,951,214 | | | | 191,304,480 | | | | 57,445,282 | | | | 17,144,289 | |
| Net unrealized appreciation (depreciation) on future contracts, foreign currency contracts and translation of other assets and liabilities denominated in foreign currency | | | 10,817 | | | | — | | | | — | | | | 4,641 | |
| Accumulated capital and other losses | | | (15,470,309 | ) | | | (63,404,702 | ) | | | (5,325,925 | ) | | | (122,251,093 | ) |
| Other temporary differences | | | (576,777 | ) | | | — | | | | — | | | | — | |
| Undistributed ordinary income | | | 518,813 | | | | 4,384,888 | | | | — | | | | 3,787,180 | |
| Undistributed capital gains | | | — | | | | — | | | | 143,634 | | | | — | |
| Accumulated earnings (deficit) | | $ | (12,566,242 | ) | | $ | 132,284,666 | | | $ | 52,262,991 | | | $ | (101,314,983 | ) |
Notes to Financial Statements (Continued)
| | | Large Cap | | | Mid Cap | | | Small Cap | |
| | | Growth | | | Growth | | | Growth | |
| | | Fund | | | Fund | | | Fund | |
| Tax cost of portfolio investments | | $ | 798,859,666 | | | $ | 618,372,147 | | | $ | 88,955,720 | |
| Gross unrealized appreciation | | | 240,029,904 | | | | 151,221,226 | | | | 11,621,083 | |
| Gross unrealized depreciation | | | (16,739,351 | ) | | | (3,565,372 | ) | | | (1,478,824 | ) |
| Net unrealized appreciation on investments | | | 223,290,553 | | | | 147,655,854 | | | | 10,142,259 | |
| Accumulated capital and other losses | | | — | | | | — | | | | (2,427,249 | ) |
| Undistributed ordinary income | | | 2,912,353 | | | | 16,331,591 | | | | 2,738,611 | |
| Undistributed capital gains | | | 45,605,072 | | | | 37,065,126 | | | | — | |
| Accumulated earnings (deficit) | | $ | 271,807,978 | | | $ | 201,052,571 | | | $ | 10,453,621 | |
The difference between the tax cost of portfolio investments and the financial statement cost is primarily due to wash sale loss deferrals, investments in passive foreign investment companies (“PFIC”), preferred securities and differences in tax character of income received from underlying investments.
As of March 31, 2014, the Funds had the following capital loss carryforwards for federal income tax purposes:
| | | | | | | | | | | | No | | | No | | | | |
| | | Short Term Expiring On | | | Expiration | | | Expiration | | | | |
| Fund | | 2017 | | | 2018 | | | 2019 | | | Short Term * | | | Long Term * | | | Total | |
| Flexible Income Fund | | $ | — | | | $ | 5,269,097 | | | $ | 10,201,212 | | | $ | — | | | $ | — | | | $ | 15,470,309 | |
| Focused Fund | | | 63,404,702 | | | | — | | | | — | | | | — | | | | — | | | | 63,404,702 | |
| Growth Opportunities Fund | | | 4,662,931 | ** | | | 662,994 | ** | | | — | | | | — | | | | — | | | | 5,325,925 | |
| International Value Fund | | | 49,777,567 | | | | 70,912,135 | | | | — | | | | 1,561,391 | | | | — | | | | 122,251,093 | |
| Small Cap Growth Fund | | | 2,427,249 | ** | | | — | | | | — | | | | — | | | | — | | | | 2,427,249 | |
* The Regulated Investment Company Modernization Act of 2010 (the “Act”) was enacted on December 22, 2010. The Act made changes to several tax rules impacting the Funds. The provisions of the Act are effective for each fiscal year end for the Funds beginning April 1, 2011. Although the Act provides several benefits, including the unlimited carryover of future capital losses, there may be a greater likelihood that all or a portion of each Fund’s pre-enactment capital loss carryovers may expire without being utilized due to the fact that post-enactment capital losses must be utilized before pre-enactment capital loss carryovers may be utilized. Under the Act, new capital losses may now be carried forward indefinitely, and retain the character of the original loss as compared with pre-enactment law, where capital losses could be carried forward for up to eight years, and carried forward as short-term capital losses, irrespective of the character of the original loss.
** Future utilization maybe limited under current tax law.
The capital loss carryforwards may be utilized in future years to offset net realized capital gains, if any, prior to distributing such gains to shareholders.
The following Fund had capital loss carryforwards that were deemed to expire in 2014:
| Fund | | Amount | |
| Small Cap Growth Fund | | $ | 736,215 | |
During the year ended March 31, 2014, the following Funds utilized capital loss carryforwards:
| Fund | | Amount | |
| Flexible Income Fund | | $ | 143,720 | |
| Focused Fund | | | 36,541,971 | |
| Growth Opportunities Fund | | | 15,701,755 | |
| International Value Fund | | | 3,355,018 | |
| Small Cap Growth Fund | | | 483,233 | |
Under current laws, certain capital losses realized after October 31 and ordinary losses realized after December 31 may be deferred (and certain ordinary losses after October and/or December 31 may be deferred) and treated as occurring on the first day of the following fiscal year. For the year ended March 31, 2014, the Funds did not elect to defer any losses.
Notes to Financial Statements (Continued)
The Funds have analyzed their tax positions taken on federal income tax returns for all open tax years (tax years ended July 31, 2010 through March 31, 2014) and have concluded that no provision for income tax is required in their financial statements.
Certain reclassifications, the result of permanent differences between financial statement and income tax reporting requirements, have been made to the components of capital. These reclassifications have no impact on the net assets or NAV per share of the Funds and are designed to present the Funds’ capital accounts on a tax basis. The following reclassifications, which are primarily attributed to the tax treatment of reclassifications of currency from capital gains to ordinary income, paydown gains/losses on pooled investments, investments in passive foreign investment companies, redesignation of dividends paid, net operating loss netted against short-term gains, adjustments for preferred securities and carryovers of temporary differences due to mergers have been made to the following Funds for the year ended March 31, 2014:
| | | | | | Accumulated | | | Accumulated | |
| | | Paid-In | | | Net Investment | | | Net Realized | |
| Fund | | Capital | | | Income(Loss) | | | Gains(Losses) | |
| Flexible Income Fund | | $ | 12,943 | | | $ | (178,265 | ) | | $ | 165,322 | |
| Focused Fund | | | 8,000,116 | | | | — | | | | (8,000,116 | ) |
| Growth Opportunities Fund | | | — | | | | (603,504 | ) | | | 603,504 | |
| International Value Fund | | | — | | | | 81,371 | | | | (81,371 | ) |
| Large Cap Growth Fund | | | — | | | | 1,638,593 | | | | (1,638,593 | ) |
| Mid Cap Growth Fund | | | — | | | | 2,752,768 | | | | (2,752,768 | ) |
| Small Cap Growth Fund | | | 3,072,183 | | | | 258,774 | | | | (3,330,957 | ) |
6. Commitments and Contingencies
The Funds indemnify the Trust’s officers and Trustees for certain liabilities that might arise from their performance of their duties to the Funds. Additionally, in the normal course of business, the Funds enter into contracts that contain a variety of representations and warranties and which provide general indemnifications. The Funds’ maximum exposure under these arrangements is unknown, as this would involve future claims that may be made against the Funds. However, based on experience, the Funds expect the risk of loss to be remote.
7. Risks Associated with Foreign Investments
Some of the Funds may invest in the securities of foreign issuers. Investing in securities issued by companies whose principal business activities are outside the U.S. may involve significant risks not present in domestic investments. For example, there is generally less publicly available information about foreign companies, particularly those not subject to the disclosure and reporting requirements of the U.S. securities laws. Foreign issuers are generally not bound by uniform accounting, auditing, and financial reporting requirements and standards of practice comparable to those applicable to domestic issuers. Investments in foreign securities also involve the risk of possible adverse changes in investment or exchange control regulations, expropriation or confiscatory taxation, limitations on the removal of funds or other assets of the Fund, political or financial instability or diplomatic and other developments which could affect such investments. Foreign stock markets, while growing in volume and sophistication, are generally not as developed as those in the U.S., and securities of some foreign issuers (particularly those located in developing countries) may be less liquid and more volatile than securities of comparable U.S. companies. In general, there is less overall governmental supervision and regulation of foreign securities markets, broker-dealers, and issuers than in the U.S.
Notes to Financial Statements (Continued)
8. Risks Associated with Credit
An issuer may be unable to make timely payments of either principal or interest. This may cause the issuer’s securities to decline in value. Credit risk is particularly relevant to those portfolios that invest a significant amount of their assets in junk bonds or lower-rated securities.
9. Risks Associated with Interest Rate Changes
As interest rates rise, the value of fixed-income securities a Fund owns will likely decrease. The price of debt securities is generally linked to the prevailing market interest rates. In general, when interest rates rise, the price of debt securities falls, and when interest rates fall, the price of debt securities rises. The price volatility of a debt security also depends on its maturity. Longer-term securities are generally more volatile, so the longer the average maturity or duration of these securities, the greater their price risk. Duration is a measure of the expected life, taking into account any prepayment or call features of the security, that is used to determine the price sensitivity of the security for a given change in interest rates. Specifically, duration is the change in the value of a fixed-income security that will result from a 1% change in interest rates, and generally is stated in years. For example, as a general rule a 1% rise in interest rates means a 1% fall in value for every year of duration. Maturity, on the other hand, is the date on which a fixed-income security becomes due for payment of principal. There may be less governmental intervention in the securities markets in the near future. The negative impact on fixed income securities if interest rates increase as a result could negatively impact a Fund’s net asset value.
10. Risk Associated with Concentration
Certain Funds invest a high percentage of their assets in specific sectors of the market in order to achieve a potentially greater investment return. As a result, these Funds may be more susceptible to economic, political, and regulatory developments in a particular sector of the market, positive or negative, and may experience increased volatility on the Fund’s NAV and magnified effect on the total return.
11. Fund Mergers
Focused Fund:
On February 10, 2012, the shareholders of the Old Mutual Focused Fund (the “Reorganizing Fund”) approved an Agreement and Plan of Reorganization providing for the transfer of all assets and liabilities of the Reorganizing Fund to the corresponding Touchstone Fund as noted below, effectively acting as a shell organization. In a shell reorganization, the surviving shell fund assumes the financial and performance history of the acquired fund. The merger took place on April 13, 2012.
| | | | | Net | | | Shares | |
| Reorganizing Fund* | | Touchstone Fund | | Assets | | | Outstanding | |
| Old Mutual Focused Fund | | Focused Fund | | $ | 563,962,037 | | | | 24,707,139 | |
*Fund had Class Z Shares outstanding immediately prior to the reorganization, which were exchanged for Class Y Shares of the corresponding Touchstone Fund.
Notes to Financial Statements (Continued)
Growth Opportunities Fund and Large Cap Growth Fund:
At a meeting held on March 13, 2012, the Board approved an Agreement and Plan of Reorganization providing for the transfer of all assets and liabilities of the Fifth Third Mid Cap Growth Fund and the Fifth Third Quality Growth Fund (each an “Acquired Fifth Third Fund”), each a series of Fifth Third Funds (“Fifth Third”), to the Touchstone Growth Opportunities Fund and the Touchstone Large Cap Growth Fund (each an “Acquiring Fund”), respectively. The mergers took place on September 10, 2012.
The following is a summary of shares outstanding, net assets, net asset value per share and unrealized appreciation immediately before and after the reorganization.
| | | | | | | | | After | |
| | | Before Reorganization | | | Reorganization | |
| | | | | | Touchstone | | | Touchstone | |
| | | Fifth Third | | | Growth | | | Growth | |
| | | Mid Cap | | | Opportunities | | | Opportunities | |
| | | Growth Fund | | | Fund | | | Fund | |
| Class A* | | | | | | | | | | | | |
| Shares | | | 572,780 | (A) | | | 2,248,976 | | | | 2,821,757 | |
| Net Assets | | $ | 14,817,828 | | | $ | 58,180,948 | | | $ | 72,998,776 | |
| Net Asset Value | | $ | 25.87 | (A) | | $ | 25.87 | | | $ | 25.87 | |
| Class C | | | | | | | | | | | | |
| Shares | | | 20,324 | (B) | | | 366,835 | | | | 387,159 | |
| Net Assets | | $ | 483,997 | | | $ | 8,736,093 | | | $ | 9,220,090 | |
| Net Asset Value | | $ | 23.81 | (B) | | $ | 23.81 | | | $ | 23.81 | |
| Class Y * | | | | | | | | | | | | |
| Shares | | | 1,938,310 | (C) | | | 515,855 | | | | 2,454,164 | |
| Net Assets | | $ | 50,516,751 | | | $ | 13,444,300 | | | $ | 63,691,051 | |
| Net Asset Value | | $ | 26.06 | (C) | | $ | 26.06 | | | $ | 26.06 | |
| Institutional Class | | | | | | | | | | | | |
| Shares | | | — | | | $ | 2,695,048 | | | $ | 2,695,048 | |
| Net Assets | | $ | — | | | $ | 70,607,136 | | | $ | 70,607,136 | |
| Net Asset Value | | $ | — | | | $ | 26.20 | | | $ | 26.20 | |
| Total Fund | | | | | | | | | | | | |
| Shares Outstanding | | | 4,987,746 | | | | 5,826,714 | | | | 8,358,128 | |
| Net Assets | | $ | 65,818,576 | | | $ | 150,968,477 | | | $ | 216,787,053 | |
| Unrealized Appreciation (Depreciation) | | $ | 10,318,769 | | | $ | 9,176,645 | | | $ | 19,495,414 | |
(A)Reflects a 0.4885:1 stock split on Class A Shares and a 0.4272:1 stock split on Class B Shares which occurred on the date of reorganization, September 10, 2012.
(B)Reflects a 0.4334:1 stock split which occurred on the date of reorganization, September 10, 2012.
(C)Reflects a 0.5149:1 stock split which occurred on the date of reorganization, September 10, 2012.
*The Acquired Fifth Third Funds had Class B shares and Institutional Class shares outstanding immediately prior to the reorganization, which were exchanged for Class A shares and Class Y shares, respectively, of the Acquiring Funds.
Notes to Financial Statements (Continued)
| | | | | | | | | After | |
| | | Before Reorganization | | | Reorganization | |
| | | Fifth Third | | | Touchstone | | | Touchstone | |
| | | Quality | | | Large Cap | | | Large Cap | |
| | | Growth Fund | | | Growth Fund | | | Growth Fund | |
| Class A * | | | | | | | | | | | | |
| Shares | | | 2,188,990 | (A) | | | 8,811,417 | | | | 11,000,407 | |
| Net Assets | | $ | 60,528,345 | | | $ | 243,647,557 | | | $ | 304,175,902 | |
| Net Asset Value | | $ | 27.65 | (A) | | $ | 27.65 | | | $ | 27.65 | |
| Class B | | | | | | | | | | | | |
| Shares | | | — | | | | 336,597 | | | | 336,597 | |
| Net Assets | | $ | — | | | $ | 8,863,111 | | | $ | 8,863,111 | |
| Net Asset Value | | $ | — | | | $ | 26.33 | | | $ | 26.33 | |
| Class C | | | | | | | | | | | | |
| Shares | | | 39,069 | (B) | | | 4,454,876 | | | | 4,493,945 | |
| Net Assets | | $ | 1,021,152 | | | $ | 116,437,117 | | | $ | 117,458,269 | |
| Net Asset Value | | $ | 26.14 | (B) | | $ | 26.14 | | | $ | 26.14 | |
| Class Y * | | | | | | | | | | | | |
| Shares | | | 6,984,781 | (C) | | | 14,937,356 | | | | 21,922,137 | |
| Net Assets | | $ | 195,449,178 | | | $ | 417,980,580 | | | $ | 613,429,758 | |
| Net Asset Value | | $ | 27.98 | (C) | | $ | 27.98 | | | $ | 27.98 | |
| Total Fund | | | | | | | | | | | | |
| Shares Outstanding | | | 14,565,867 | | | | 28,540,246 | | | | 37,753,086 | |
| Net Assets | | $ | 256,998,675 | | | $ | 786,928,365 | | | $ | 1,043,927,040 | |
| Unrealized Appreciation (Depreciation) | | $ | 83,525,041 | | | $ | 164,097,186 | | | $ | 247,622,227 | |
(A)Reflects a 0.6217:1 stock split on Class A Shares and a 0.5655 stock split on Class B Shares which occurred on the date of reorganization, September 10, 2012.
(B)Reflects a 0.5782:1 stock split which occurred on the date of reorganization, September 10, 2012.
(C)Reflects a 0.6364:1 stock split which occurred on the date of reorganization, September 10, 2012.
*The Acquired Fifth Third Funds had Class B shares and Institutional Class shares outstanding immediately prior to the reorganization, which were exchanged for Class A shares and Class Y shares, respectively, of the Acquiring Funds.
Assuming the reorganization had been completed on April 1, 2012, the results of operations for the Growth Opportunities Fund and the Large Cap Growth Fund for the year ended March 31, 2013 would have been as follows:
| | | Touchstone | | | | |
| | | Growth | | | Touchstone | |
| | | Opportunities | | | Large Cap | |
| | | Fund | | | Growth Fund | |
| Net investment income (loss) | | $ | (12,235 | ) | | $ | 4,631,816 | |
| Net realized and unrealized gains (losses) on investments | | $ | 37,735,938 | | | $ | 110,353,868 | |
| Net increase in asset from operations | | $ | 37,723,703 | | | $ | 114,985,684 | |
Because the combined investment portfolios have been managed as single portfolios since the reorganizations were completed, it is not practical to separate the amounts of revenue and earnings to the Acquiring Funds that have been included in their statements of operations since the reorganizations.
Notes to Financial Statements (Continued)
Flexible Income Fund, International Value Fund and Small Cap Growth Fund:
On September 5, 2012, the Shareholders of the Fifth Third Funds (the “Reorganizing Fifth Third Funds”) approved an Agreement and Plan of Reorganization providing for the transfer of all assets and liabilities of each Reorganizing Fifth Third Fund to the corresponding Touchstone shell Fund as noted below, effectively acting as a shell organization. In a shell reorganization, the surviving shell fund assumes the financial and performance history of the acquired fund. The merger took place on September 10, 2012. The Funds’ fiscal year end was changed to March 31.
| | | | | Net | | | Shares | |
| Reorganizing Fifth Third Funds* | | Touchstone Funds | | Assets | | | Outstanding | |
| Fifth Third Strategic Income Fund | | Flexible Income Fund | | $ | 272,087,369 | | | | 25,088,186 | |
| Fifth Third International Equity Fund | | International Value Fund | | | 112,680,107 | | | | 15,128,870 | |
| Fifth Third Micro Cap Value Fund | | Small Cap Growth Fund | | | 37,623,112 | | | | 8,102,256 | |
*The Funds had Class B shares and Institutional Class shares outstanding immediately prior to the reorganization. Class B shares were exchanged for Class A shares and Institutional Class shares became Class Y shares of the corresponding Touchstone Fund. On September 10, 2012, the Funds began issuing new Institutional Class shares.
The following is a summary of shares outstanding, net assets and net asset value per share for the merger of Class B into Class A immediately before and after the September 10, 2012 reorganization.
| | | Before Reorganization | | | Class A Shares Issued | | | After Reorganization | |
| | | Class A | | | Class B | | | | | | Class A | |
| Flexible Income Fund | | | | | | | | | | | | | | | | |
| Shares outstanding | | | 4,641,586 | | | | 32,946 | | | | — | | | | 4,674,477 | |
| Shares Issued | | | — | | | | — | | | | 32,891 | (A) | | | — | |
| Net Assets | | $ | 50,303,845 | | | $ | 356,537 | | | | — | | | $ | 50,660,382 | |
| Net Asset Value | | $ | 10.84 | | | $ | 10.82 | | | | — | | | $ | 10.84 | |
| | | | | | | | | | | | | | | | | |
| International Value Fund | | | | | | | | | | | | | | | | |
| Shares outstanding | | | 970,419 | | | | 20,936 | | | | — | | | | 991,153 | |
| Shares Issued | | | — | | | | — | | | | 20,734 | (B) | | | — | |
| Net Assets | | $ | 7,220,692 | | | $ | 154,261 | | | | — | | | $ | 7,374,953 | |
| Net Asset Value | | $ | 7.44 | | | $ | 7.37 | | | | — | | | $ | 7.44 | |
| | | | | | | | | | | | | | | | | |
| Small Cap Growth Fund | | | | | | | | | | | | | | | | |
| Shares outstanding | | | 3,407,681 | | | | 36,022 | | | | — | | | | 3,439,364 | |
| Shares Issued | | | — | | | | — | | | | 31,683 | (C) | | | — | |
| Net Assets | | $ | 15,470,242 | | | $ | 143,842 | | | | — | | | $ | 15,614,084 | |
| Net Asset Value | | $ | 4.54 | | | $ | 3.99 | | | | — | | | $ | 4.54 | |
(A)Reflects a 0.9986:1 stock split which occurred on the date of reorganization, September 10, 2012.
(B)Reflects a 0.9903:1 stock split which occurred on the date of reorganization, September 10, 2012.
(C)Reflects a 0.8796:1 stock split which occurred on the date of reorganization, September 10, 2012.
Focused Fund:
At a meeting held on February 21, 2013, the Board approved an Agreement and Plan of Reorganization (the “Plan”) providing for the transfer of all assets and liabilities of the Touchstone Focused Equity Fund, a series of Touchstone Funds Group Trust, to the Touchstone Focused Fund, a series of the Trust. The merger took place on May 17, 2013.
Notes to Financial Statements (Continued)
| | | | | | | | | After | |
| | | Before Reorganization | | | Reorganization | |
| | | Touchstone | | | | | | | |
| | | Focused | | | Touchstone | | | Touchstone | |
| | | Equity | | | Focused | | | Focused | |
| | | Fund | | | Fund | | | Fund | |
| Class A | | | | | | | | | | | | |
| Shares | | | 4,327,516 | (A) | | | 675,503 | | | | 5,003,019 | |
| Net Assets | | $ | 125,354,407 | | | $ | 19,567,121 | | | $ | 144,921,528 | |
| Net Asset Value | | $ | 28.97 | (A) | | $ | 28.97 | | | $ | 28.97 | |
| Class C | | | | | | | | | | | | |
| Shares | | | 24,433 | (B) | | | 5,930 | | | | 30,363 | |
| Net Assets | | $ | 701,039 | | | $ | 170,147 | | | $ | 871,186 | |
| Net Asset Value | | $ | 28.69 | (B) | | $ | 28.69 | | | $ | 28.69 | |
| Class Y | | | | | | | | | | | | |
| Shares | | | 215,356 | (C) | | | 20,691,506 | | | | 20,906,862 | |
| Net Assets | | $ | 6,308,617 | | | $ | 606,136,778 | | | $ | 612,445,395 | |
| Net Asset Value | | $ | 29.29 | (C) | | $ | 29.29 | | | $ | 29.29 | |
| Institutional Class | | | | | | | | | | | | |
| Shares | | | 966,069 | (D) | | | 19,411 | | | | 985,480 | |
| Net Assets | | $ | 28,372,347 | | | $ | 570,075 | | | $ | 28,942,422 | |
| Net Asset Value | | $ | 29.37 | (D) | | $ | 29.37 | | | $ | 29.37 | |
| Fund Total | | | | | | | | | | | | |
| Shares Outstanding | | | 11,617,300 | | | | 21,392,350 | | | | 26,925,724 | |
| Net Assets | | $ | 160,736,410 | | | $ | 626,444,121 | | | $ | 787,180,531 | |
| Unrealized Appreciation (Depreciation) | | $ | 22,524,353 | | | $ | 42,269,274 | | | $ | 64,793,569 | |
(A)Reflects a 0.4800:1 stock split which occurred on the date of reorganization, May 17, 2013.
(B)Reflects a 0.4773:1 stock split which occurred on the date of reorganization, May 17, 2013.
(C)Reflects a 0.4794:1 stock split which occurred on the date of reorganization, May 17, 2013.
(D)Reflects a 0.4596:1 stock split which occurred on the date of reorganization, May 17, 2013.
Assuming this reorganization had been completed on April 1, 2013, the Focused Fund’s results of operations for the year ended March 31, 2014 would have been as follows:
| Net investment income | | $ | 4,751,931 | |
| Net realized and unrealized gains (losses) on investments | | $ | 229,820,866 | |
| Net increase in asset from operations | | $ | 234,572,797 | |
Because the combined investment portfolios have been managed as a single portfolio since the reorganization was completed, it is not practical to separate the amounts of revenue and earnings to the Focused Fund that have been included in its statements of operations since the reorganization.
Small Cap Growth Fund:
At a meeting held on May 23, 2013, the Board approved an Agreement and Plan of Reorganization providing for the transfer of all assets and liabilities of the Touchstone Diversified Small Cap Growth Fund to the Touchstone Small Cap Growth Fund, each a series of the Trust. The merger took place on August 23, 2013.
Notes to Financial Statements (Continued)
| | | | | | | | | After | |
| | | Before Reorganization | | | Reorganization | |
| | | Touchstone | | | | | | | |
| | | Diversified | | | Touchstone | | | Touchstone | |
| | | Small Cap | | | Small Cap | | | Small Cap | |
| | | Growth | | | Growth | | | Growth | |
| | | Fund | | | Fund | | | Fund | |
| Class A | | | | | | | | | | | | |
| Shares | | | 1,739,693 | (A) | | | 3,075,664 | | | | 4,815,357 | |
| Net Assets | | $ | 8,196,736 | | | $ | 14,491,331 | | | $ | 22,688,067 | |
| Net Asset Value | | $ | 4.71 | (A) | | $ | 4.71 | | | $ | 4.71 | |
| Class C | | | | | | | | | | | | |
| Shares | | | 427,646 | (B) | | | 866,512 | | | | 1,294,158 | |
| Net Assets | | $ | 1,723,545 | | | $ | 3,492,344 | | | $ | 5,215,889 | |
| Net Asset Value | | $ | 4.03 | (B) | | $ | 4.03 | | | $ | 4.03 | |
| Class Y | | | | | | | | | | | | |
| Shares | | | 3,022,354 | (C) | | | 4,301,850 | | | | 7,324,204 | |
| Net Assets | | $ | 15,683,603 | | | $ | 22,323,365 | | | $ | 38,006,968 | |
| Net Asset Value | | $ | 5.19 | (C) | | $ | 5.19 | | | $ | 5.19 | |
| Institutional Class | | | | | | | | | | | | |
| Shares | | | — | | | | 2,538,312 | | | | 2,538,312 | |
| Net Assets | | $ | — | | | $ | 13,196,652 | | | $ | 13,196,652 | |
| Net Asset Value | | $ | — | | | $ | 5.20 | | | $ | 5.20 | |
| Fund Total | | | | | | | | | | | | |
| Shares Outstanding | | | 1,838,239 | | | | 10,782,338 | | | | 15,972,031 | |
| Net Assets | | $ | 25,603,884 | | | $ | 53,503,692 | | | $ | 79,107,576 | |
| Unrealized Appreciation (Depreciation) | | $ | 193,301 | | | $ | 4,179,561 | | | $ | 4,372,862 | |
(A)Reflects a 2.9349:1 reverse stock split which occurred on the date of reorganization, August 23, 2013.
(B)Reflects a 3.2805:1 reverse stock split which occurred on the date of reorganization, August 23, 2013.
(C)Reflects a 2.7104:1 reverse stock split which occurred on the date of reorganization, August 23, 2013.
Assuming this reorganization had been completed on April 1, 2013, the Small Cap Growth Fund’s results of operations for the year ended March 31, 2014 would have been as follows:
| Net investment loss | | $ | (316,566 | ) |
| Net realized and unrealized gains (losses) on investments | | $ | 15,459,525 | |
| Net increase in asset from operations | | $ | 15,142,959 | |
Because the combined investment portfolios have been managed as a single portfolio since the reorganization was completed, it is not practical to separate the amounts of revenue and earnings to the Small Cap Growth Fund that have been included in its statements of operations since the reorganization.
12. Subsequent Events
Subsequent events occurring after the date of this report have been evaluated for potential impact to this report through the date financial statements were issued. There were no subsequent events that necessitated recognition or disclosure on the Funds’ financial statement.
Report of Independent Registered Public Accounting Firm
To the Board of Trustees and Shareholders of Touchstone Flexible Income Fund, Touchstone Focused Fund, Touchstone Growth Opportunities Fund, Touchstone International Value Fund, Touchstone Large Cap Growth Fund, Touchstone Mid Cap Growth Fund and Touchstone Small Cap Growth Fund of Touchstone Strategic Trust
We have audited the accompanying statements of assets and liabilities, including the portfolios of investments, of Touchstone Flexible Income Fund, Touchstone Focused Fund, Touchstone Growth Opportunities Fund, Touchstone International Value Fund, Touchstone Large Cap Growth Fund, Touchstone Mid Cap Growth Fund, and Touchstone Small Cap Growth Fund (seven of the funds constituting the Touchstone Strategic Trust) (the “Funds”), as of March 31, 2014, and the related statements of operations, the statements of changes in net assets, and the financial highlights for the year then ended. We have also audited the statements of changes in net assets for the year ended March 31, 2013 and the financial highlights for each of the periods presented through March 31, 2013 of Touchstone Growth Opportunities Fund, Touchstone Large Cap Growth Fund, and Touchstone Mid Cap Growth Fund. These financial statements and financial highlights are the responsibility of the Funds’ management. Our responsibility is to express an opinion on these financial statements and financial highlights based on our audits. The statements of changes in net assets and financial highlights for each of the periods presented through March 31, 2013 of Touchstone Flexible Income Fund, Touchstone Focused Fund, Touchstone International Value Fund, and Touchstone Small Cap Growth Fund were audited by other auditors, whose report dated May 23, 2013 expressed an unqualified opinion on those financial statements and financial highlights.
We conducted our audits in accordance with the standards of the Public Company Accounting Oversight Board (United States). Those standards require that we plan and perform the audits to obtain reasonable assurance about whether the financial statements are free of material misstatement. We were not engaged to perform an audit of the Funds’ internal control over financial reporting. Our audits included consideration of internal control over financial reporting as a basis for designing audit procedures that are appropriate in the circumstances, but not for the purpose of expressing an opinion on the effectiveness of the Funds’ internal control over financial reporting. Accordingly, we express no such opinion. An audit also includes examining, on a test basis, evidence supporting the amounts and disclosures in the financial statements, assessing the accounting principles used and significant estimates made by management, and evaluating the overall financial statement presentation. Our procedures included confirmation of securities owned as of March 31, 2014, by correspondence with the custodian, transfer agent, and brokers or by other appropriate auditing procedures where replies from brokers were not received. We believe that our audits provide a reasonable basis for our opinion.
In our opinion, the financial statements and financial highlights referred to above present fairly, in all material respects, the financial position of Touchstone Flexible Income Fund, Touchstone Focused Fund, Touchstone Growth Opportunities Fund, Touchstone International Value Fund, Touchstone Large Cap Growth Fund, Touchstone Mid Cap Growth Fund and Touchstone Small Cap Growth Fund (seven of the funds constituting the Touchstone Strategic Trust) at March 31, 2014, the results of their operations, the changes in their net assets, and their financial highlights for the year then ended, and the changes in net assets and financial highlights for each of the periods presented through March 31, 2013 for Touchstone Growth Opportunities Fund, Touchstone Large Cap Growth Fund, and Touchstone Mid Cap Growth Fund, in conformity with U.S. generally accepted accounting principles.

Cincinnati, Ohio
May 23, 2014
Other Items (Unaudited)
Qualified Dividend Income
Under the Jobs and Growth Tax Relief Reconciliation Act of 2003 (the “Act”), the following percentages of ordinary dividends paid during the fiscal year ended March 31, 2014 are designated as “qualified dividend income,” as defined in the Act, and are subject to reduced tax rates in 2014. The Funds intend to pass through the maximum allowable percentage for 1099s.
| Flexible Income Fund | | | 29.86 | % |
| Focused Fund | | | 100.00 | % |
| Growth Opportunities Fund | | | 100.00 | % |
| International Value Fund | | | 96.60 | % |
| Large Cap Growth Fund | | | 64.39 | % |
| Mid Cap Growth Fund | | | 20.56 | % |
| Small Cap Growth Fund | | | 38.81 | % |
Dividend Received Deduction
For corporate shareholders, the following ordinary distributions paid during the current fiscal period ended March 31, 2014 qualify for the corporate dividends received deduction. The Funds intend to pass through the maximum allowable percentage for 1099s.
| Flexible Income Fund | | | 20.33 | % |
| Focused Fund | | | 100.00 | % |
| Growth Opportunities Fund | | | 100.00 | % |
| International Value Fund | | | 3.99 | % |
| Large Cap Growth Fund | | | 62.90 | % |
| Mid Cap Growth Fund | | | 17.96 | % |
| Small Cap Growth Fund | | | 41.41 | % |
For the fiscal year ended March 31, 2014, the Funds designated long-term capital gains as follows:
| Growth Opportunities Fund | | | 10,336,661 | |
| Large Cap Growth Fund | | | 99,939,390 | |
| Mid Cap Growth Fund | | | 73,926,448 | |
| Small Cap Growth Fund | | | 5,236,442 | |
Foreign Tax Income & Foreign Tax Credit
International Value Fund intends to pass through a foreign tax credit to their respective shareholders. For the year ended March 31, 2014, the total amount of foreign source income is $4,823,988 or $0.33 per share. The total amount of foreign taxes to be paid is $190,074 or $0.013 per share. Shareholders’ allocable share of the foreign tax credit will be reported on Form 1099 Div.
Proxy Voting Guidelines
The Sub-Advisors are responsible for exercising the voting rights associated with the securities purchased and held by the Funds. A description of the policies and procedures that the Sub-Advisors use in fulfilling this responsibility is available as an appendix to the most recent Statement of Additional Information, which can be obtained without charge by calling toll free 1.800.543.0407 or by visiting the Touchstone website at www.touchstoneinvestments.com or on the Securities and Exchange Commission’s (the “Commission”) website www.sec.gov. Information regarding how those proxies were voted during the most recent twelve-month period ended June 30 is also available without charge by calling toll free 1.800.543.0407 or on the Commission’s website at www.sec.gov
Other Items (Unaudited) (Continued)
Quarterly Portfolio Disclosure
The Trust files a complete listing of portfolio holdings for each Fund as of the end of the first and third quarters of each fiscal year on Form N-Q. The complete listing (i) is available on the Commission’s website; (ii) may be reviewed and copied at the Commission’s Public Reference Room in Washington, DC; and (iii) will be made available to shareholders upon request by calling 1.800.543.0407; or (iv) can be obtained on the Touchstone website at www.touchstoneinvestments.com. Information on the operation of the Public Reference Room may be obtained by calling 1-800-SEC-0330.
Change in Independent Registered Public Accounting Firm
On May 22, 2013, the Audit Committee of the Board for the Touchstone Flexible Income Fund, the Touchstone Focused Fund, the Touchstone International Value Fund, and the Touchstone Small Cap Growth Fund (collectively, the “Funds”), engaged Ernst & Young LLP as its independent registered public accountant firm to audit the Funds’ financial statements for the fiscal year ended March 31, 2014. The Funds’ previous independent public accounting firm was PricewaterhouseCoopers (“PWC”). The reports of PWC on the financial statements of the Funds for the fiscal year ended March 31, 2013 contained no adverse opinion or disclaimer of opinion and were not qualified or modified as to uncertainty, audit scope or accounting principle. During the fiscal year ended March 31, 2013, there have been no disagreements with PWC on any matter of accounting principles or practices, financial statement disclosure, or auditing scope or procedure, which disagreements if not resolved to the satisfaction of PWC would have caused them to make reference thereto in their reports on the financial statements for such years. Furthermore, during the fiscal year ended March 31, 2013, and through May 22, 2013, there have been no reportable events (as defined in S-K 304 (a) (1) (v)) .
Schedule of Shareholder Expenses
As a shareholder of the Funds, you incur two types of costs: (1) transaction costs, including reinvested dividends or other distributions; and (2) ongoing costs, including investment advisory fees; distribution (12b-1) fees; and other Fund expenses. This example is intended to help you understand your ongoing costs (in dollars) of investing in the Funds and to compare these costs with the ongoing costs of investing in other mutual funds. The example is based on an investment of $1,000 invested at the beginning of the period and held for the entire period (October 1, 2013 through March 31, 2014).
Actual Expenses
The first line of the table below for each share class of a Fund provides information about actual account values and actual expenses. You may use the information in this line, together with the amount you invested, to estimate the expenses that you paid over the period. Simply divide your account value by $1,000 (for example, an $8,600 account value divided by $1,000 = 8.6), then multiply the result by the number in the first line under the heading entitled “Expenses Paid During the Period Ended March 31, 2014” to estimate the expenses you paid on your account during this period.
Hypothetical Example for Comparison Purposes
The second line of the table below for each share class of a Fund provides information about hypothetical account values and hypothetical expenses based on the Funds’ actual expense ratio and an assumed rate of return of 5% per year before expenses, which is not the Funds’ actual return. The hypothetical account values and expenses may not be used to estimate the actual ending account balance or expenses you paid for the period. You may use this information to compare the ongoing costs of investing in the Funds and other funds. To do so, compare this 5% hypothetical example with the 5% hypothetical examples that appear in the shareholder reports of the other funds.
Please note that the expenses shown in the table are meant to highlight your ongoing costs only and do not reflect any transactional costs, such as sales charges (loads), redemption fees, or exchange fees. Therefore, the second line for each share class of a Fund in the table below is useful in comparing ongoing costs only, and will not help you determine the relative total costs of owning different funds. In addition, if these transactional costs were included, your costs would have been higher.
Other Items (Unaudited) (Continued)
Schedule of Shareholder Expenses (continued)
| | | | | | | | | | | | | | Expenses | |
| | | | | Net Expense | | | Beginning | | | Ending | | | Paid During | |
| | | | | Ratio | | | Account | | | Account | | | the Period | |
| | | | | Annualized | | | Value | | | Value | | | Ended | |
| | | | | March 31, | | | October 1, | | | March 31, | | | March 31, | |
| | | | | 2014 | | | 2013 | | | 2014 | | | 2014* | |
| Touchstone Flexible Income Fund | | | | | | | | | | | | | | | | |
| Class A | | Actual | | | 1.04 | % | | $ | 1,000.00 | | | $ | 1,052.30 | | | $ | 5.32 | ** |
| Class A | | Hypothetical | | | 1.04 | % | | $ | 1,000.00 | | | $ | 1,019.75 | | | $ | 5.24 | ** |
| | | | | | | | | | | | | | | | | | | |
| Class C | | Actual | | | 1.79 | % | | $ | 1,000.00 | | | $ | 1,048.00 | | | $ | 9.14 | ** |
| Class C | | Hypothetical | | | 1.79 | % | | $ | 1,000.00 | | | $ | 1,016.01 | | | $ | 9.00 | ** |
| | | | | | | | | | | | | | | | | | | |
| Class Y | | Actual | | | 0.79 | % | | $ | 1,000.00 | | | $ | 1,053.50 | | | $ | 4.04 | ** |
| Class Y | | Hypothetical | | | 0.79 | % | | $ | 1,000.00 | | | $ | 1,020.99 | | | $ | 3.98 | ** |
| | | | | | | | | | | | | | | | | | | |
| Institutional Class | | Actual | | | 0.69 | % | | $ | 1,000.00 | | | $ | 1,054.10 | | | $ | 3.53 | ** |
| Institutional Class | | Hypothetical | | | 0.69 | % | | $ | 1,000.00 | | | $ | 1,021.49 | | | $ | 3.48 | ** |
| | | | | | | | | | | | | | | | | | | |
| Touchstone Focused Fund | | | | | | | | | | | | | | | | |
| Class A | | Actual | | | 1.20 | % | | $ | 1,000.00 | | | $ | 1,151.20 | | | $ | 6.44 | |
| Class A | | Hypothetical | | | 1.20 | % | | $ | 1,000.00 | | | $ | 1,018.95 | | | $ | 6.04 | |
| | | | | | | | | | | | | | | | | | | |
| Class C | | Actual | | | 1.95 | % | | $ | 1,000.00 | | | $ | 1,146.70 | | | $ | 10.44 | |
| Class C | | Hypothetical | | | 1.95 | % | | $ | 1,000.00 | | | $ | 1,015.21 | | | $ | 9.80 | |
| | | | | | | | | | | | | | | | | | | |
| Class Y | | Actual | | | 0.93 | % | | $ | 1,000.00 | | | $ | 1,152.70 | | | $ | 4.99 | |
| Class Y | | Hypothetical | | | 0.93 | % | | $ | 1,000.00 | | | $ | 1,020.29 | | | $ | 4.68 | |
| | | | | | | | | | | | | | | | | | | |
| Institutional Class | | Actual | | | 0.80 | % | | $ | 1,000.00 | | | $ | 1,153.50 | | | $ | 4.30 | |
| Institutional Class | | Hypothetical | | | 0.80 | % | | $ | 1,000.00 | | | $ | 1,020.94 | | | $ | 4.03 | |
| | | | | | | | | | | | | | | | | | | |
| Touchstone Growth Opportunities Fund | | | | | | | | | | | | | | | | |
| Class A | | Actual | | | 1.24 | % | | $ | 1,000.00 | | | $ | 1,128.90 | | | $ | 6.58 | |
| Class A | | Hypothetical | | | 1.24 | % | | $ | 1,000.00 | | | $ | 1,018.75 | | | $ | 6.24 | |
| | | | | | | | | | | | | | | | | | | |
| Class C | | Actual | | | 1.99 | % | | $ | 1,000.00 | | | $ | 1,124.90 | | | $ | 10.54 | |
| Class C | | Hypothetical | | | 1.99 | % | | $ | 1,000.00 | | | $ | 1,015.01 | | | $ | 10.00 | |
| | | | | | | | | | | | | | | | | | | |
| Class Y | | Actual | | | 0.90 | % | | $ | 1,000.00 | | | $ | 1,130.80 | | | $ | 4.78 | |
| Class Y | | Hypothetical | | | 0.90 | % | | $ | 1,000.00 | | | $ | 1,020.44 | | | $ | 4.53 | |
| | | | | | | | | | | | | | | | | | | |
| Institutional Class | | Actual | | | 0.84 | % | | $ | 1,000.00 | | | $ | 1,131.00 | | | $ | 4.46 | |
| Institutional Class | | Hypothetical | | | 0.84 | % | | $ | 1,000.00 | | | $ | 1,020.74 | | | $ | 4.23 | |
| | | | | | | | | | | | | | | | | | | |
| Touchstone International Value Fund | | | | | | | | | | | | | | | | |
| Class A | | Actual | | | 1.38 | % | | $ | 1,000.00 | | | $ | 1,107.30 | | | $ | 7.25 | |
| Class A | | Hypothetical | | | 1.38 | % | | $ | 1,000.00 | | | $ | 1,018.05 | | | $ | 6.94 | |
| | | | | | | | | | | | | | | | | | | |
| Class C | | Actual | | | 2.13 | % | | $ | 1,000.00 | | | $ | 1,104.10 | | | $ | 11.17 | |
| Class C | | Hypothetical | | | 2.13 | % | | $ | 1,000.00 | | | $ | 1,014.31 | | | $ | 10.70 | |
| | | | | | | | | | | | | | | | | | | |
| Class Y | | Actual | | | 1.02 | % | | $ | 1,000.00 | | | $ | 1,109.80 | | | $ | 5.37 | |
| Class Y | | Hypothetical | | | 1.02 | % | | $ | 1,000.00 | | | $ | 1,019.85 | | | $ | 5.14 | |
| | | | | | | | | | | | | | | | | | | |
| Institutional Class | | Actual | | | 0.98 | % | | $ | 1,000.00 | | | $ | 1,110.20 | | | $ | 5.16 | |
| Institutional Class | | Hypothetical | | | 0.98 | % | | $ | 1,000.00 | | | $ | 1,020.04 | | | $ | 4.94 | |
Other Items (Unaudited) (Continued)
Schedule of Shareholder Expenses (continued)
| | | | | | | | | | | | | | Expenses | |
| | | | | Net Expense | | | Beginning | | | Ending | | | Paid During | |
| | | | | Ratio | | | Account | | | Account | | | the Period | |
| | | | | Annualized | | | Value | | | Value | | | Ended | |
| | | | | March 31, | | | October 1, | | | March 31, | | | March 31, | |
| | | | | 2014 | | | 2013 | | | 2014 | | | 2014* | |
| Touchstone Large Cap Growth Fund | | | | | | | | | | | | | | | | |
| Class A | | Actual | | | 1.25 | % | | $ | 1,000.00 | | | $ | 1,117.80 | | | $ | 6.60 | |
| Class A | | Hypothetical | | | 1.25 | % | | $ | 1,000.00 | | | $ | 1,018.70 | | | $ | 6.29 | |
| | | | | | | | | | | | | | | | | | | |
| Class B | | Actual | | | 1.77 | % | | $ | 1,000.00 | | | $ | 1,115.10 | | | $ | 9.33 | |
| Class B | | Hypothetical | | | 1.77 | % | | $ | 1,000.00 | | | $ | 1,016.11 | | | $ | 8.90 | |
| | | | | | | | | | | | | | | | | | | |
| Class C | | Actual | | | 2.00 | % | | $ | 1,000.00 | | | $ | 1,113.80 | | | $ | 10.54 | |
| Class C | | Hypothetical | | | 2.00 | % | | $ | 1,000.00 | | | $ | 1,014.96 | | | $ | 10.05 | |
| | | | | | | | | | | | | | | | | | | |
| Class Y | | Actual | | | 0.99 | % | | $ | 1,000.00 | | | $ | 1,119.50 | | | $ | 5.23 | |
| Class Y | | Hypothetical | | | 0.99 | % | | $ | 1,000.00 | | | $ | 1,020.00 | | | $ | 4.99 | |
| | | | | | | | | | | | | | | | | | | |
| Touchstone Mid Cap Growth Fund | | | | | | | | | | | | | | | | |
| Class A | | Actual | | | 1.35 | % | | $ | 1,000.00 | | | $ | 1,144.90 | | | $ | 7.22 | |
| Class A | | Hypothetical | | | 1.35 | % | | $ | 1,000.00 | | | $ | 1,018.20 | | | $ | 6.79 | |
| | | | | | | | | | | | | | | | | | | |
| Class B | | Actual | | | 1.65 | % | | $ | 1,000.00 | | | $ | 1,142.60 | | | $ | 8.81 | |
| Class B | | Hypothetical | | | 1.65 | % | | $ | 1,000.00 | | | $ | 1,016.70 | | | $ | 8.30 | |
| | | | | | | | | | | | | | | | | | | |
| Class C | | Actual | | | 2.09 | % | | $ | 1,000.00 | | | $ | 1,140.40 | | | $ | 11.15 | |
| Class C | | Hypothetical | | | 2.09 | % | | $ | 1,000.00 | | | $ | 1,014.51 | | | $ | 10.50 | |
| | | | | | | | | | | | | | | | | | | |
| Class Y | | Actual | | | 1.06 | % | | $ | 1,000.00 | | | $ | 1,146.30 | | | $ | 5.67 | |
| Class Y | | Hypothetical | | | 1.06 | % | | $ | 1,000.00 | | | $ | 1,019.65 | | | $ | 5.34 | |
| | | | | | | | | | | | | | | | | | | |
| Institutional Class | | Actual | | | 0.96 | % | | $ | 1,000.00 | | | $ | 1,147.00 | | | $ | 5.14 | |
| Institutional Class | | Hypothetical | | | 0.96 | % | | $ | 1,000.00 | | | $ | 1,020.14 | | | $ | 4.84 | |
| | | | | | | | | | | | | | | | | | | |
| Touchstone Small Cap Growth Fund | | | | | | | | | | | | | | | | |
| Class A | | Actual | | | 1.44 | % | | $ | 1,000.00 | | | $ | 1,106.70 | | | $ | 7.56 | |
| Class A | | Hypothetical | | | 1.44 | % | | $ | 1,000.00 | | | $ | 1,017.75 | | | $ | 7.24 | |
| | | | | | | | | | | | | | | | | | | |
| Class C | | Actual | | | 2.19 | % | | $ | 1,000.00 | | | $ | 1,102.90 | | | $ | 11.48 | |
| Class C | | Hypothetical | | | 2.19 | % | | $ | 1,000.00 | | | $ | 1,014.01 | | | $ | 11.00 | |
| | | | | | | | | | | | | | | | | | | |
| Class Y | | Actual | | | 1.19 | % | | $ | 1,000.00 | | | $ | 1,106.30 | | | $ | 6.25 | |
| Class Y | | Hypothetical | | | 1.19 | % | | $ | 1,000.00 | | | $ | 1,019.00 | | | $ | 5.99 | |
| | | | | | | | | | | | | | | | | | | |
| Institutional Class | | Actual | | | 1.04 | % | | $ | 1,000.00 | | | $ | 1,107.90 | | | $ | 5.47 | |
| Institutional Class | | Hypothetical | | | 1.04 | % | | $ | 1,000.00 | | | $ | 1,019.75 | | | $ | 5.24 | |
* Expenses are equal to the Fund’s annualized expense ratio, multiplied by the average account value over the period, multiplied by 182/365 (to reflect one-half year period).
** The expense limitations of the Flexible Income Fund was changed effective 11/29/2013. Had the new expense limitations been in place for the full six months the Actual expenses paid during the period ended 3/31/2014 would have been $5.58, $9.39, $4.30, and $3.79 for Classes A, C, Y and the Institutional Class shares, respectively. The Hypothetical expenses for the same time period would have been $5.49, $9.25, $4.23, and $3.73 for Classes A, C, Y and the Institutional Class shares, respectively.
Other Items (Unaudited) (Continued)
Advisory and Sub-Advisory Agreement Approval Disclosure.
At a meeting held on November 21, 2013, the Board of the Trust, and by a separate vote, the Independent Trustees of the Trust, approved the continuance of the Investment Advisory Agreement between the Trust and the Advisor with respect to each Fund of the Trust, and the continuance of each Sub-Advisory Agreement between the Advisor and each Fund’s respective Sub-Advisor, with the exception of the Sub-Advisory Agreement relating to Touchstone Small Cap Growth Fund, which was not up for renewal because it had been approved in February 2013.
In determining whether to approve the continuation of the Investment Advisory Agreement and the Sub-Advisory Agreements, the Advisor furnished information necessary for a majority of the Independent Trustees to make the determination that the continuance of the Investment Advisory Agreement and each Sub-Advisory Agreement was in the best interests of the respective Funds and their shareholders. The information provided to the Board included: (1) industry data comparing advisory fees and expense ratios of comparable investment companies; (2) comparative performance information; (3) the Advisor’s and its affiliates’ revenues and costs of providing services to the Funds; and (4) information about the Advisor’s and Sub-Advisors’ personnel. Prior to voting, the Independent Trustees reviewed the proposed continuance of the Investment Advisory Agreement and the Sub-Advisory Agreements with management and with experienced independent legal counsel and received materials from such counsel discussing the legal standards for their consideration of the proposed continuation of the Investment Advisory Agreement and each Sub-Advisory Agreement. The Independent Trustees also reviewed the proposed continuation of the Investment Advisory Agreement and each Sub-Advisory Agreement with independent legal counsel in private sessions at which no representatives of management were present.
In approving the Funds’ Investment Advisory Agreement, the Board considered various factors, among them: (1) the nature, extent and quality of services provided to the Funds, including the personnel providing such services; (2) the Advisor’s compensation and profitability; (3) a comparison of fees and performance with other advisers; (4) economies of scale; and (5) the terms of the Investment Advisory Agreement. The Board’s analysis of these factors is set forth below. The Independent Trustees were advised by independent legal counsel throughout the process.
Nature, Extent and Quality of Advisor Services. The Board considered the level and depth of knowledge of the Advisor, including the professional experience and qualifications of senior personnel. In evaluating the quality of services provided by the Advisor, the Board took into account its familiarity with the Advisor’s senior management through Board meetings, discussions and reports during the preceding year. The Board also took into account the Advisor’s compliance policies and procedures. The quality of administrative and other services, including the Advisor’s role in coordinating the activities of the Funds’ other service providers, was also considered. The Board also considered the Advisor’s relationship with its affiliates and the resources available to them, as well as any potential conflicts of interest.
The Board discussed the Advisor’s effectiveness in monitoring the performance of each Sub-Advisor, including the Sub-Advisor that was an affiliate of the Advisor, and the Advisor’s timeliness in responding to performance issues. The Board considered the Advisor’s process for monitoring each of the Sub-Advisors, which includes an examination of both qualitative and quantitative elements of the Sub-Advisor’s organization, personnel, procedures, investment discipline, infrastructure and performance. The Board considered that the Advisor conducts regular on-site compliance visits with each Sub-Advisor, during which the Advisor examines a wide variety of factors, such as the financial condition of the Sub-Advisor, the quality of the Sub-Advisor’s systems, the effectiveness of the Sub-Advisor’s disaster recovery programs, trade allocation and execution procedures, compliance with the Sub-Advisor’s policies and procedures, results of regulatory examinations and any other factors that might affect the quality of services that the Sub-Advisor provides to the applicable Fund(s). The Board noted that
Other Items (Unaudited) (Continued)
the Advisor’s compliance monitoring processes also include quarterly reviews of compliance reports, and that any issues arising from such reports and the Advisor’s compliance visits to the Sub-Advisors are reported to the Board.
The Trustees concluded that they were satisfied with the nature, extent and quality of services provided to each Fund by the Advisor under the Investment Advisory Agreement.
Advisor’s Compensation and Profitability. The Board took into consideration the financial condition and profitability of the Advisor and its affiliates (including the Sub-Advisor to one of the Funds) and the direct and indirect benefits derived by the Advisor and its affiliates from the Advisor’s relationship with the Funds. The information considered by the Board included operating profit margin information for the Advisor’s business as a whole. The Board noted that the Advisor had waived a portion of advisory fees and administrative fees and/or reimbursed expenses in order to limit the net operating expenses of each Fund except the Touchstone Mid Cap Growth Fund. The Board also noted that the Advisor pays the Sub-Advisors’ sub-advisory fees out of the advisory fees the Advisor receives from the Funds. The Board reviewed the profitability of the Advisor’s relationship with the Funds both before and after tax expenses, and also considered whether the Advisor has the financial wherewithal to continue to provide services to the Funds, noting the ongoing commitment of the Advisor’s parent company with respect to providing support and resources as needed. The Board considered that the Funds’ distributor, an affiliate of the Advisor, receives Rule 12b-1 distribution fees from the Funds and receives a portion of the sales charges on sales or redemptions of certain classes of shares. The Board also noted that the Advisor derives benefits to its reputation and other benefits from its association with the Funds.
The Board recognized that the Advisor should be entitled to earn a reasonable level of profits in exchange for the level of services it provides to each Fund and the entrepreneurial risk that it assumes as Advisor. Based upon their review, the Trustees concluded that the Advisor’s and its affiliates’ level of profitability, if any, from their relationship with each Fund was reasonable and not excessive.
Expenses and Performance. The Board compared the respective advisory fees and total expense ratios for each of the Funds with various comparative data, including the median and average advisory fees and total expense ratios of each Fund’s respective peer group. The Board also considered, among other data, the Funds’ respective performance results during the six-month, twelve-month and thirty-six-month periods ended June 30, 2013, as applicable, and noted that the Board reviews on a quarterly basis detailed information about each Fund’s performance results, portfolio composition and investment strategies. The Board also took into account current market conditions and their effect on the Funds’ performance.
The Board also considered the effect of each Fund’s growth and size on its performance and expenses. The Board noted that the Advisor had waived portions of the fees and/or reimbursed expenses of each Fund except Touchstone Mid Cap Growth Fund in order to reduce the Funds’ respective operating expenses to targeted levels. The Board noted that the sub-advisory fees under the Sub-Advisory Agreement with respect to each Fund were paid by the Advisor out of the advisory fees it receives from the Fund and considered the impact of such sub-advisory fees on the profitability of the Advisor. In reviewing the respective expense ratios and performance of each of the Funds, the Board also took into account the nature, extent and quality of the services provided to the Funds by the Advisor and its affiliates.
The Board also discussed with management certain factors as set forth in the conditions to the Funds’ exemptive order issued by the Securities and Exchange Commission relating to investments by the non-money market Funds in the Touchstone Institutional Money Market Fund. The Board considered the nature and extent of the services provided by the Advisor and the Sub-Advisors to each Fund and a discussion by management regarding the amount of the Advisory fees paid by the Fund and the Sub-advisory fees paid by the Advisor in light of the level of Fund assets invested in the Touchstone Institutional Money Market Fund. Based on these factors, the Board concluded that the advisory fee and the sub-advisory fee associated with the management
Other Items (Unaudited) (Continued)
of each non-money market Fund were based on services that were in addition to, rather than duplicative of, services provided under the Investment Advisory and Sub-Advisory Agreements with respect to the Touchstone Institutional Money Market Fund.
The Board considered, among other data, the specific factors and related conclusions set forth below with respect to each Fund:
Touchstone Flexible Income Fund. The Fund’s advisory fee and total expense ratio (net of applicable expense waivers and reimbursements) were above the median of its peer group. The Board noted that the Advisor was currently waiving a portion of the Fund’s fees and/or reimbursing a portion of the Fund’s operating expenses. The Fund’s performance was in the 5th quintile of the Fund’s peer group for the six-month period ended June 30, 2013, the Fund’s performance was in the 4th quintile for the twelve-month period ended June 30, 2013 and the Fund’s performance was in the 3rd quintile for the thirty-six-month period ended June 30, 2013. The Board noted management’s discussion of the Fund’s underperformance and management’s continued monitoring of the Fund. Based upon their review, the Trustees concluded that the Fund’s performance was being addressed and that the advisory fee was reasonable in light of the services received by the Fund and the other factors considered.
Touchstone Focused Fund. The Fund’s advisory fee and total expense ratio (net of applicable expense waivers and reimbursements) were below the median and above the median, respectively, of its peer group. The Board noted that the Advisor was waiving a portion of the Fund’s fees and/or reimbursing a portion of the Fund’s operating expenses. The Fund’s performance was in the 2nd quintile of the Fund’s peer group for the six-month period ended June 30, 2013, and the Fund’s performance was in the 1st quintile for the twelve- and thirty-six-month periods ended June 30, 2013. Based upon their review, the Trustees concluded that the Fund’s overall performance was satisfactory in relation to the performance of funds with similar investment objectives and relevant indices, and that the advisory fee was reasonable in light of the services received by the Fund and the other factors considered.
Touchstone Growth Opportunities Fund. The Fund’s advisory fee and total expense ratio (net of applicable expense waivers and reimbursements) were above the median and below the median, respectively, of its peer group. The Board noted that the Advisor was currently waiving a portion of the Fund’s fees and/or reimbursing a portion of the Fund’s operating expenses. The Fund’s performance was in the 2nd quintile of the Fund’s peer group for the six-month period ended June 30, 2013, and the Fund’s performance was in the 1st quintile for the twelve- and thirty-six-month periods ended June 30, 2013. Based upon their review, the Trustees concluded that the Fund’s overall performance was satisfactory in relation to the performance of funds with similar investment objectives and relevant indices, and also found that the advisory fee was reasonable in light of the services received by the Fund and the other factors considered.
Touchstone International Value Fund. The Fund’s advisory fee and total expense ratio (net of applicable expense waivers and reimbursements) were above the median and below the median, respectively, of its peer group. The Board noted that the Advisor was currently waiving a portion of the Fund’s fees and/or reimbursing a portion of the Fund’s operating expenses. The Fund’s performance was in the 5th quintile of the Fund’s peer group for the six- and twelve-month periods ended June 30, 2013, and the Fund’s performance was in the 4th quintile for the thirty-six-month period ended June 30, 2013. The Board noted management’s discussion of the Fund’s underperformance and management’s continued monitoring of the Fund. Based upon their review, the Trustees concluded that the Fund’s performance was being addressed and that the advisory fee was reasonable in light of the services received by the Fund and the other factors considered.
Touchstone Large Cap Growth Fund. The Fund’s advisory fee and total expense ratio (net of applicable expense waivers and reimbursements) were below the median and at the median, respectively, of its peer group. The Board noted that the Advisor was currently waiving a portion of the Fund’s fees and/or reimbursing a portion
Other Items (Unaudited) (Continued)
of the Fund’s operating expenses. The Fund’s performance was in the 5th quintile of the Fund’s peer group for the six- and twelve-month periods ended June 30, 2013, and the Fund’s performance was in the 4th quintile for the thirty-six-month period ended June 30, 2013. The Board noted management’s discussion of the Fund’s underperformance and management’s continued monitoring of the Fund’s performance. Based upon their review, the Trustees concluded that the Fund’s performance was being addressed, and that the advisory fee was reasonable in light of the services received by the Fund and the other factors considered.
Touchstone Mid Cap Growth Fund. The Fund’s advisory fee and total expense ratio were below the median and above the median, respectively, of its peer group. The Fund’s performance was in the 4th quintile of the Fund’s peer group for the six- and thirty-six-month periods ended June 30, 2013, and the Fund’s performance was in the 3rd quintile for the twelve-month period ended June 30, 2013. The Board noted management’s discussion of the Fund’s performance and management’s continued monitoring of the Fund’s performance. Based upon their review, the Trustees concluded that the Fund’s performance was being addressed and that the advisory fee was reasonable in light of the services received by the Fund and the other factors considered.
Touchstone Small Cap Growth Fund. The Fund’s advisory fee and total expense ratio (net of applicable expense waivers and reimbursements) were above the median and below the median, respectively, of its peer group. The Board noted that the Advisor was currently waiving a portion of the Fund’s fees and/or reimbursing a portion of the Fund’s operating expenses. The Fund’s performance was in the 4th quintile of the Fund’s peer group for the six-, twelve- and thirty-six-month periods ended June 30, 2013. The Board noted that a new sub-advisor had begun managing the Fund in April 2013 using new investment strategies. Based upon their review, the Trustees concluded that the Fund’s performance had been addressed and that the advisory fee was reasonable in light of the services received by the Fund and the other factors considered.
Economies of Scale. The Board considered the effect of each Fund’s current size and potential growth on its performance and expenses. The Board took into account management’s discussion of the Funds’ advisory fee structure. The Board considered the effective advisory fees under the Investment Advisory Agreement as a percentage of assets at different asset levels and possible economies of scale that might be realized if the assets of each Fund increase. The Board noted that the advisory fee schedule for each Fund, except the Touchstone International Value Fund, contains breakpoints that would reduce the respective advisory fee rate on assets above specified levels as the applicable Fund’s assets increased. The Board noted that the current advisory fee for the Touchstone Focused Fund, the Touchstone Large Cap Growth Fund and the Touchstone Mid Cap Growth Fund currently reflected such economies of scale. The Board determined that adding breakpoints at specified levels to the advisory fee schedule of the Touchstone International Value Fund would not be appropriate at this time. The Board noted that if a Fund’s assets increase over time, the Fund might realize other economies of scale if assets increase proportionally more than certain other expenses. The Board also considered the fact that, under the Investment Advisory Agreement, the advisory fee payable to the Advisor by a Fund was reduced by the total sub-advisory fee paid by the Advisor to the Fund’s Sub-Advisor.
Conclusion. In considering the renewal of the Funds’ Investment Advisory Agreement, the Board, including the Independent Trustees, did not identify any single factor as controlling, and each Trustee may have attributed different weights to the various factors. The Trustees evaluated all information available to them on a Fund-by-Fund basis, and their determinations were made separately with respect to each Fund. The Board reached the following conclusions regarding the Funds’ Investment Advisory Agreement with the Advisor, among others: (a) the Advisor demonstrated that it possesses the capability and resources to perform the duties required of it under the Investment Advisory Agreement; (b) the Advisor maintains an appropriate compliance program; (c) the overall performance of each Fund is satisfactory relative to the performance of funds with similar investment objectives and relevant indices or, as discussed above, is being addressed; and (d) each Fund’s advisory fee is reasonable in light of the services received by the Fund from the Advisor and other factors considered. Based on their conclusions, the
Other Items (Unaudited) (Continued)
Trustees determined with respect to each Fund that continuation of the Investment Advisory Agreement was in the best interests of the Fund and its shareholders.
In approving the Funds’ respective Sub-Advisory Agreements, the Board considered various factors with respect to each Fund and the applicable Sub-Advisory Agreement, among them: (1) the nature, extent and quality of services provided to the Fund, including the personnel providing such services; (2) the Sub-Advisor’s compensation; (3) a comparison of the sub-advisory fee and performance with other advisers; and (4) the terms of the Sub-Advisory Agreement. The Board’s analysis of these factors is set forth below. The Independent Trustees were advised by independent legal counsel throughout the process.
Nature, Extent and Quality of Services Provided; Investment Personnel. The Board considered information provided by the Advisor regarding the services provided by each Sub-Advisor, including information presented periodically throughout the previous year. The Board noted the affiliation of one of the Sub-Advisors with the Advisor, noting any potential conflicts of interest. The Board also noted that, on a periodic basis, the Board meets with portfolio managers of the Sub-Advisors to discuss their respective performance and investment processes and strategies. The Board considered each Sub-Advisor’s level of knowledge and investment style. The Board reviewed the experience and credentials of the applicable investment personnel who are responsible for managing the investment of portfolio securities with respect to the Funds. The Board also noted each Sub-Advisor’s brokerage practices.
Sub-Advisor’s Compensation, Profitability and Economies of Scale. The Board also took into consideration the financial condition of each Sub-Advisor and any indirect benefits derived by each Sub-Advisor and its affiliates from the Sub-Advisor’s relationship with the Funds. In considering the profitability to each Sub-Advisor of its relationship with the Funds, the Board noted the undertakings of the Advisor to maintain expense limitations for the Funds and also noted that the sub-advisory fees under the Sub-Advisory Agreements were paid by the Advisor out of the advisory fees that it receives under the Investment Advisory Agreement and in addition, with respect to the unaffiliated Sub-Advisors, are negotiated at arm’s length. As a consequence, the profitability to each Sub-Advisor of its relationship with a Fund was not a substantial factor in the Board’s deliberations. For similar reasons, the Board did not consider the potential economies of scale in each Sub-Advisor’s management of the applicable Fund to be a substantial factor in its consideration, although the Board noted that the sub-advisory fee schedule for each of the Funds contained breakpoints that would reduce the sub-advisory fee rate on assets above specified levels as the applicable Fund’s assets increased.
Sub-Advisory Fees and Fund Performance. The Board considered that each Fund pays an advisory fee to the Advisor and that the Advisor pays the sub-advisory fee to the Sub-Advisor out of the advisory fee it receives from the respective Fund. The Board also compared the sub-advisory fees paid by the Advisor to fees charged by the Sub-Advisor to manage comparable institutional separate accounts. The Board considered the amount retained by the Advisor and the sub-advisory fee paid to each Sub-Advisor with respect to the various services provided by the Advisor and the Sub-Advisor. The Board also noted that the Advisor negotiated the sub-advisory fee with each of the unaffiliated Sub-Advisors at arm’s length. The Board reviewed the sub-advisory fee for each Fund in relation to various comparative data, including the median and average sub-advisory fees of each Fund’s peer group, and considered the following information:
Touchstone Flexible Income Fund. The Fund’s sub-advisory fee was above the median of its peer group. Based upon their review, the Trustees concluded that the Fund’s sub-advisory fee was reasonable in light of the services received by the Fund from the Sub-Advisor and the other factors considered.
Touchstone Focused Fund. The Fund’s sub-advisory fee was above the median of its peer group. Based upon their review, the Trustees concluded that the sub-advisory fee was reasonable in light of the services received by the Fund from the Sub-Advisor and the other factors considered.
Other Items (Unaudited) (Continued)
Touchstone Growth Opportunities Fund. The Fund’s sub-advisory fee was above the median of its peer group. Based upon their review, the Trustees concluded that the sub-advisory fee was reasonable in light of the services received by the Fund from the Sub-Advisor and the other factors considered.
Touchstone International Value Fund. The Fund’s sub-advisory fee was above the median of its peer group. Based upon their review, the Trustees concluded that the Fund’s sub-advisory fee was reasonable in light of the services received by the Fund from the Sub-Advisor and the other factors considered.
Touchstone Large Cap Growth Fund. The Fund’s sub-advisory fee was above the median of its peer group. Based upon their review, the Trustees concluded that the sub-advisory fee was reasonable in light of the services received by the Fund from the Sub-Advisor and the other factors considered.
Touchstone Mid Cap Growth Fund. The Fund’s sub-advisory fee was above the median of its peer group. Based upon their review, the Trustees concluded that the sub-advisory fees were reasonable in light of the services received by the Fund from the Sub-Advisor and the other factors considered.
As noted above, the Board considered each Fund’s performance during the six-month, twelve-month and thirty-six-month periods ended June 30, 2013, as applicable, as compared to each Fund’s peer group and noted that the Board reviews on a quarterly basis detailed information about each Fund’s performance results, portfolio composition and investment strategies. The Board noted the Advisor’s expertise and resources in monitoring the performance, investment style and risk-adjusted performance of each Sub-Advisor. The Board was mindful of the Advisor’s focus on each Sub-Advisor’s performance and the Advisor’s ways of addressing underperformance.
Conclusion. In considering the renewal of the Sub-Advisory Agreement with respect to each Fund, the Board, including the Independent Trustees, did not identify any single factor as controlling, and each Trustee may have attributed different weights to the various factors. The Board reached the following conclusions regarding each Sub-Advisory Agreement, among others: (a) the Sub-Advisor is qualified to manage each Fund’s assets in accordance with the Fund’s investment goals and policies; (b) the Sub-Advisor maintains an appropriate compliance program; (c) the overall performance of each Fund is satisfactory relative to the performance of funds with similar investment objectives and relevant indices or, as discussed above, is being addressed; (d) each Fund’s sub-advisory fees are reasonable in light of the services received by the Fund from the Sub-Advisor and the other factors considered; and (e) the Sub-Advisor’s investment strategies are appropriate for pursuing the investment goals of each Fund. Based on its conclusions, the Board determined that approval of the Sub-Advisory Agreement with respect to each Fund was in the best interests of the Fund and its shareholders.
Management of the Trust (Unaudited)
Listed below is required information regarding the Trustees and principal officers of the Trust. The Trust’s Statement of Additional Information includes additional information about the Trustees and is available, without charge, upon request by calling 1.800.543.0407 or by visiting the Touchstone website at www.touchstoneinvestments.com.
Interested Trustees1:
| | | | | | | | | Number | | |
| | | | | | | | | of Funds | | |
| | | | | | | | | Overseen | | |
| | | | | Term of | | | | in the | | |
| Name | | Position(s) | | Office2 And | | | | Touchstone | | Other |
| Address | | Held with | | Length of | | Principal Occupation(s) | | Fund | | Directorships |
| Age | | Trust | | Time Served | | During Past 5 Years | | Complex3 | | Held During the Past 5 Years4 |
Jill T. McGruder Touchstone Advisors, Inc. 303 Broadway Suite 1100 Cincinnati, OH 45202 Year of Birth: 1955 | | Trustee and President | | Until retirement at age 75 or until she resigns or is removed Trustee since 1999 | | President and CEO of IFS Financial Services, Inc. (a holding company) from 1999 to the present. | | 47 | | Director of LaRosa’s, Inc. (a restaurant chain) from 1999 to the present, IFS Financial Services, Inc. (a holding company) from 1999 to the present, Integrity and National Integrity Life Insurance Co. from 2005 to the present, Touchstone Securities (the Trust’s distributor) from 1999 to the present, Touchstone Advisors (the Trust’s investment advisor and administrator) from 1999 to the present, W&S Brokerage Services ( a brokerage company) from 1999 to the present and W&S Financial Group Distributors (a distribution company) from 1999 to the present. |
| | | | | | | | | | | |
| Independent Trustees: | | | | | | | |
Phillip R. Cox c/o Touchstone Advisors, Inc. 303 Broadway Suite 1100 Cincinnati, OH 45202 Year of Birth: 1947 | | Trustee | | Until retirement at age 75 or until he resigns or is removed Trustee since 1999 | | President and Chief Executive Officer of Cox Financial Corp. (a financial services company) from 1971 to the present. | | 47 | | Director of Cincinnati Bell (a communications company) from 1994 to the present, Bethesda Inc. (a hospital) from 2005 to the present, Timken Co. (a manufacturing company) from 2004 to the present, Diebold, Inc. (a technology solutions company) from 2004 to the present. |
| | | | | | | | | | | |
William C. Gale c/o Touchstone Advisors, Inc. 303 Broadway Suite 1100 Cincinnati, OH 45202 Year of Birth: 1952 | | Trustee | | Until retirement at age 75 or until he resigns or is removed Trustee since 2013 | | Senior Vice President and Chief Financial Officer of Cintas Corporation (a business services company) from 1995 to present. | | 47 | | None. |
| | | | | | | | | | | |
Susan J. Hickenlooper, CFA c/o Touchstone Advisors, Inc. 303 Broadway Suite 1100 Cincinnati, OH 45202 Year of Birth: 1946 | | Trustee | | Until retirement at age 75 or until she resigns or is removed Trustee since 2009 | | Financial Analyst for Impact 100 (Charitable Organization) from 2012 to present. | | 47 | | Trustee of Cincinnati Parks Foundation (a charitable organization) from 2000 to present and Trustee of Episcopal Retirement Homes Foundation from 1998-2011. |
Management of the Trust (Unaudited) (Continued)
Independent Trustees (Continued):
| | | | | | | | | Number | | |
| | | | | | | | | of Funds | | |
| | | | | | | | | Overseen | | |
| | | | | Term of | | | | in the | | |
| Name | | Position(s) | | Office2 And | | | | Touchstone | | Other |
| Address | | Held with | | Length of | | Principal Occupation(s) | | Fund | | Directorships |
| Age | | Trust | | Time Served | | During Past 5 Years | | Complex3 | | Held During the Past 5 Years4 |
Kevin A. Robie5 c/o Touchstone Advisors, Inc. 303 Broadway Suite 1100 Cincinnati, OH 45202 Year of Birth: 1956 | | Trustee | | Until retirement at age 75 or until he resigns or is removed Trustee since 2013 | | Vice President of Portfolio Management at Soin International LLC (a multinational holding company) from 2004 to the present. | | 47 | | Director of Buckeye EcoCare, Inc. (a lawn care company) from 2013 to the present, Trustee of Dayton Region New Market Fund, LLC (a private fund) from 2010 to present, Trustee of the Entrepreneurs Center, Inc. (a small business incubator) from 2006 to the present and Director of Interventional Imaging, Inc. (a medical device company) from 2004 to 2011. |
| | | | | | | | | | | |
Edward J. VonderBrink5 c/o Touchstone Advisors, Inc. 303 Broadway Suite 1100 Cincinnati, OH 45202 Year of Birth: 1944 | | Trustee | | Until retirement at age 75 or until he resigns or is removed Trustee since 2013 | | Consultant, VonderBrink Consulting LLC from 2000 to the present. | | 47 | | Director of Streamline Health Solutions, Inc. (healthcare IT) from 2006 to the present, Mercy Health Foundation from 2007 to the present. |
| 1 | Ms. McGruder, as a director of the Advisor and the Trust’s Distributor, and an officer of affiliates of the Advisor and the Trust’s Distributor, is an “interested person” of the Trust within the meaning of Section 2(a)(19) of the 1940 Act. |
| 2 | Each Trustee is elected to serve until the age of 75 or until he or she sooner resigns or is removed. |
| 3 | As of March 31, 2014, the Touchstone Fund Complex consists of 16 series of the Trust, 3 series of Touchstone Tax-Free Trust, 13 series of Touchstone Funds Group Trust, 4 series of Touchstone Investment Trust, 1 series of Touchstone Institutional Funds Trust, and 10 variable annuity series of Touchstone Variable Series Trust. |
| 4 | Each Trustee is also a Trustee of Touchstone Funds Group Trust, Touchstone Tax-Free Trust, Touchstone Investment Trust, Touchstone Institutional Funds Trust, and Touchstone Variable Series Trust. |
| 5 | Mr. Robie and Mr. VonderBrink were elected to the Board of Trustees at a shareholder meeting held on August 2, 2013. |
Management of the Trust (Unaudited) (Continued)
The following is a list of the Officers of the Trusts, the length of time served and principal occupations for the past five years.
| Principal Officers: | | | | | | |
| | | | | Term of | | |
| Name | | Position(s) | | Office And | | |
| Address | | Held with | | Length of | | Principal Occupation(s) |
| Age | | Trust3 | | Time Served | | During the Past 5 Years |
Jill T. McGruder1 Year of Birth: 1955 | | President and Trustee | | Until resignation, removal or disqualification President since 2006 | | See biography above. |
| | | | | | | |
Steven M. Graziano1 Year of Birth: 1954 | | Vice President | | Until resignation, removal or disqualification Vice President since 2009 | | President of Touchstone Advisors, Inc. |
| | | | | | | |
Timothy D. Paulin1 Year of Birth: 1963 | | Vice President | | Until resignation, removal or disqualification Vice President since 2010 | | Senior Vice President of Investment Research and Product Management of Touchstone Advisors, Inc.; Director of Product Design of Klein Decisions, Inc. 2003-2010. |
| | | | | | | |
Timothy S. Stearns1 Year of Birth: 1963 | | Chief Compliance Officer | | Until resignation, removal or disqualification Chief Compliance Officer since September 2013 | | Chief Compliance Officer of Touchstone Advisors, Inc., Senior Vice President and Chief Compliance and Ethics Officer of Envestnet Asset Management, Inc. (2009 to 2013) and Chief Compliance Officer, Americas and Compliance Director, Asia of Franklin Templeton Investments (1997 to 2009). |
| | | | | | | |
Terrie A. Wiedenheft1 Year of Birth: 1962 | | Controller and Treasurer | | Until resignation, removal or disqualification Controller and Treasurer since 2006 | | Senior Vice President, Chief Financial Officer and Chief Operations Officer of IFS Financial Services, Inc. (a holding company). |
| | | | | | | |
Elizabeth R. Freeman2 Year of Birth: 1962 | | Secretary | | Until resignation, removal or disqualification Secretary since 2011 | | Managing Director and Senior Counsel at BNY Mellon Investment Servicing (US) Inc. |
| 1 | The address of Touchstone Advisors, Inc. is 303 Broadway, Suite 1100, Cincinnati, OH 45202. |
| 2 | The address of BNY Mellon Investment Servicing (US) Inc. is 201 Washington Street, Boston, MA 02108. |
| 3 | Each officer also holds the same office with Touchstone Funds Group Trust, Touchstone Institutional Funds Trust, Touchstone Investment Trust, Touchstone Tax-Free Trust and Touchstone Variable Series Trust. |
PRIVACY PROTECTION POLICY
We Respect Your Privacy
Thank you for your decision to invest with us. Touchstone and its affiliates have always placed a high value on the trust and confidence our clients place in us. We believe that confidence must be earned and validated through time. In today’s world, when technology allows the sharing of information at light speeds, trust must be reinforced by our sincere pledge to take the steps necessary to ensure that the information you share with us is treated with respect and confidentiality.
Our Pledge to Our Clients
| • | We collect only the information we need to service your account and administer our business. |
| • | We are committed to keeping your information confidential and we place strict limits and controls on the use and sharing of your information. |
| • | We make every effort to ensure the accuracy of your information. |
We Collect the Following Nonpublic Personal Information About You:
| • | Information we receive from you on or in applications or other forms, correspondence, or conversations, including, but not limited to, your name, address, phone number, social security number, assets, income and date of birth; and |
| • | Information about your transactions with us, our affiliates, or others, including, but not limited to, your account number and balance, payment history, parties to transactions, cost basis information, and other financial information. |
Categories of Information We Disclose and Parties to Whom We Disclose
We do not disclose any nonpublic personal information about our current or former clients to nonaffiliated third parties, except as required or permitted by law.
We Place Strict Limits and Controls on the Use and Sharing of Your Information
| • | We restrict access to nonpublic personal information about you to authorized employees who need the information to administer your business. |
| • | We maintain physical, electronic and procedural safeguards that comply with federal standards to protect this information. |
| • | We do not disclose any nonpublic personal information about our current or former clients to anyone, except as required or permitted by law or as described in this document. |
| • | We will not sell your personal information to anyone. |
We May Provide Information to Service Your Account
Sometimes it is necessary to provide information about you to various companies such as transfer agents, custodians, broker-dealers and marketing service firms to facilitate the servicing of your account. These organizations have a legitimate business need to see some of your personal information in order for us to provide service to you. We may disclose to these various companies the information that we collect as described above. We require that these companies, including our own subsidiaries and affiliates, strictly maintain the confidentiality of this information and abide by all applicable laws. Companies within our corporate family that may receive this information are financial service providers and insurance companies. We do not permit these associated companies to sell the information for their own purposes, and we never sell our customer information.
This policy is applicable to the following affiliated companies: Touchstone Funds Group Trust, Touchstone Investment Trust, Touchstone Strategic Trust, Touchstone Tax-Free Trust, Touchstone Variable Series Trust, Touchstone Institutional Funds Trust, Touchstone Securities, Inc.,* and W&S Brokerage Services, Inc.
* Touchstone Securities, Inc. serves as the underwriter to the Touchstone Funds.
A Member of Western & Southern Financial Group®
The Privacy Protection Policy is not part of the Annual Report.


Touchstone Investments
Distributor
Touchstone Securities, Inc.*
303 Broadway
Cincinnati, Ohio 45202-4203 800.638.8194
www.touchstoneinvestments.com
Investment Advisor
Touchstone Advisors, Inc.*
303 Broadway
Cincinnati, Ohio 45202-4203
Transfer Agent
BNY Mellon Investment Servicing (US) Inc.
4400 Computer Drive
Westborough, MA 01581
Shareholder Service
800.543.0407
* A Member of Western & Southern Financial Group
TSF-54-TST-AR-1403
Item 2. Code of Ethics.
| (a) | The registrant, as of the end of the period covered by this report, has adopted a code of ethics that applies to the registrant’s principal executive officer, principal financial officer, principal accounting officer or controller, or persons performing similar functions, regardless of whether these individuals are employed by the registrant or a third party. |
| (c) | There have been no amendments, during the period covered by this report, to a provision of the code of ethics that applies to the registrant’s principal executive officer, principal financial officer, principal accounting officer or controller, or persons performing similar functions, regardless of whether these individuals are employed by the registrant or a third party, and that relates to any element of the code of ethics description. |
| (d) | The registrant has not granted any waivers, including an implicit waiver, from a provision of the code of ethics that applies to the registrant’s principal executive officer, principal financial officer, principal accounting officer or controller, or persons performing similar functions, regardless of whether these individuals are employed by the registrant or a third party, that relates to one or more of the items set forth in paragraph (b) of this item’s instructions. |
Item 3. Audit Committee Financial Expert.
The registrant’s Board of Trustees has determined that the registrant has at least one audit committee financial expert serving on its audit committee. Mr. William Gale is the registrant’s audit committee financial expert and is an independent trustee within the meaning of the Investment Company Act of 1940, as amended (the “1940 Act”).
Item 4. Principal Accountant Fees and Services.
Audit Fees
| (a) | Audit fees for Touchstone Strategic Trust totaled $96,700 and $166,600 in fiscal 2014 and 2013, respectively, including fees associated with the annual audits and filings of Form N-1A and Form N-SAR. |
Audit-Related Fees
| (b) | The aggregate fees billed in each of the last two fiscal years for assurance and related services by the principal accountant that are reasonably related to the performance of the audit of the registrant's financial statements and are not reported under paragraph (a) of this Item are $0 for 2014 and $10,000 for 2013. The fees relate to the preparation of federal income and excise tax returns and review of capital gains distribution calculations. |
Tax Fees
| (c) | The Fees for tax compliance services totaled $40,800 and $38,800 in fiscal 2014 and 2013, respectively. |
All Other Fees
| (d) | The aggregate fees billed in each of the last two fiscal years for products and services provided by the principal accountant, other than the services reported in paragraphs (a) through (c) of this Item are $13,688 for 2014 and $0 for 2013. The fees relate to the PFIC Analyzer and Global Withholding Tax Reporter subscriptions. |
| (e)(1) | Disclose the audit committee's pre-approval policies and procedures described in paragraph (c)(7) of Rule 2-01 of Regulation S-X. |
The Audit Committee’s pre-approval policies describe the types of audit, audit-related, tax and other services that have the general pre-approval of the Audit Committee. The pre-approval policies provide that annual audit service fees, tax services not specifically granted pre-approval, services exceeding pre-approved cost levels and other services that have not received general pre-approval will be subject to specific pre-approval by the Audit Committee. The pre-approval policies further provide that the Committee may grant general pre-approval to other audit services (statutory audits and services associated with SEC registration statements, periodic reports and other documents filed with the SEC or other documents issued in connection with securities offerings), audit-related services (accounting consultations related to accounting, financial reporting or disclosure matters not classified as “audit services,” assistance with understanding and implementing new accounting and financial reporting guidance from rulemaking authorities, agreed-upon or expanded audit procedures related to accounting and/or billing records required to respond to or comply with financial, accounting or regulatory reporting matters and assistance with internal control reporting requirements under Form N-SAR and Form N-CSR), tax services that have historically been provided by the auditor that the Committee believes would not impair the independence of the auditor and are consistent with the SEC’s rules on auditor independence and permissible non-audit services classified as “all other services” that are routine and recurring services.
| (e)(2) | All services described in paragraphs (b) through (d) of Item 4 were approved by the Audit Committee. |
| (f) | The percentage of hours expended on the principal accountant's engagement to audit the registrant's financial statements for the most recent fiscal year that were attributed to work performed by persons other than the principal accountant's full-time, permanent employees was less than fifty percent. |
| (g) | The aggregate non-audit fees for Touchstone Strategic Trust and certain entities*, totaled approximately $54,488 and $38,800 in 2014 and 2013, respectively. |
* These include the advisors (excluding sub-advisors) and any entity controlling, controlled by or under common control with the advisors that provides ongoing services to the registrant (Funds).
| (h) | The registrant's audit committee of the board of trustees has considered whether the provision of non-audit services that were rendered to the registrant's investment adviser (not including any sub-adviser whose role is primarily portfolio management and is subcontracted with or overseen by another investment adviser), and any entity controlling, controlled by, or under common control with the investment adviser that provides ongoing services to the registrant that were not pre-approved pursuant to paragraph (c)(7)(ii) of Rule 2-01 of Regulation S-X is compatible with maintaining the principal accountant's independence. |
Item 5. Audit Committee of Listed Registrants.
Not applicable.
Item 6. Investments.
| (a) | Schedule of Investments in securities of unaffiliated issuers as of the close of the reporting period is included as part of the report to shareholders filed under Item 1 of this form. |
Item 7. Disclosure of Proxy Voting Policies and Procedures for Closed-End Management Investment Companies.
Not applicable.
Item 8. Portfolio Managers of Closed-End Management Investment Companies.
Not applicable.
Item 9. Purchases of Equity Securities by Closed-End Management Investment Company and Affiliated Purchasers.
Not applicable.
Item 10. Submission of Matters to a Vote of Security Holders.
There have been no material changes to the procedures by which the shareholders may recommend nominees to the registrant’s board of trustees, where those changes were implemented after the registrant last provided disclosure in response to the requirements of Item 407(c)(2)(iv) of Regulation S-K (17 CFR 229.407) (as required by Item 22(b)(15) of Schedule 14A (17 CFR 240.14a-101)), or this Item.
Item 11. Controls and Procedures.
| (a) | The registrant’s principal executive and principal financial officers, or persons performing similar functions, have concluded that the registrant’s disclosure controls and procedures (as defined in Rule 30a-3(c) under the Investment Company Act of 1940, as amended (the “1940 Act”) (17 CFR 270.30a-3(c))) are effective, as of a date within 90 days of the filing date of the report that includes the disclosure required by this paragraph, based on their evaluation of these controls and procedures required by Rule 30a-3(b) under the 1940 Act (17 CFR 270.30a-3(b)) and Rules 13a-15(b) or 15d-15(b) under the Securities Exchange Act of 1934, as amended (17 CFR 240.13a-15(b) or 240.15d-15(b)). |
| (b) | There were no changes in the registrant’s internal control over financial reporting (as defined in Rule 30a-3(d) under the 1940 Act (17 CFR 270.30a-3(d)) that occurred during the registrant’s second fiscal quarter of the period covered by this report that has materially affected, or is reasonably likely to materially affect, the registrant’s internal control over financial reporting. |
Item 12. Exhibits.
| (a)(1) | Code of ethics, or any amendment thereto, that is the subject of disclosure required by Item 2 is attached hereto. |
| (a)(2) | Certifications pursuant to Rule 30a-2(a) under the 1940 Act and Section 302 of the Sarbanes-Oxley Act of 2002 are attached hereto. |
| (b) | Certifications pursuant to Rule 30a-2(b) under the 1940 Act and Section 906 of the Sarbanes- Oxley Act of 2002 are attached hereto. |
| (12.other) | Not applicable. |
SIGNATURES
Pursuant to the requirements of the Securities Exchange Act of 1934 and the Investment Company Act of 1940, the registrant has duly caused this report to be signed on its behalf by the undersigned, thereunto duly authorized.
| (Registrant) Touchstone Strategic Trust |
| | |
| By (Signature and Title)* | /s/ Jill T. McGruder |
| | Jill T. McGruder, President |
| | (principal executive officer) |
Date 06/03/14
Pursuant to the requirements of the Securities Exchange Act of 1934 and the Investment Company Act of 1940, this report has been signed below by the following persons on behalf of the registrant and in the capacities and on the dates indicated.
| By (Signature and Title)* | /s/ Jill T. McGruder |
| | Jill T. McGruder, President |
| | (principal executive officer) |
Date 06/03/14
| By (Signature and Title)* | /s/ Terrie A. Wiedenheft |
| | Terrie A. Wiedenheft, Controller and Treasurer |
| | (principal financial officer) |
Date 06/03/14
* Print the name and title of each signing officer under his or her signature.