UNITED STATES
SECURITIES AND EXCHANGE COMMISSION
Washington, D.C. 20549
FORM N-CSR
CERTIFIED SHAREHOLDER REPORT OF REGISTERED MANAGEMENT INVESTMENT COMPANIES
Investment Company Act file number 811-03651
Touchstone Strategic Trust
(Exact name of registrant as specified in charter)
303 Broadway, Suite 1100
Cincinnati, Ohio 45202-4203
(Address of principal executive offices) (Zip code)
Jill T. McGruder
303 Broadway, Suite 1100
Cincinnati, Ohio 45202-4203
(Name and address of agent for service)
Registrant's telephone number, including area code: 800-638-8194
Date of fiscal year end: March 31
Date of reporting period: March 31, 2016
Form N-CSR is to be used by management investment companies to file reports with the Commission not later than 10 days after the transmission to stockholders of any report that is required to be transmitted to stockholders under Rule 30e-1 under the Investment Company Act of 1940 (17 CFR 270.30e-1). The Commission may use the information provided on Form N-CSR in its regulatory, disclosure review, inspection, and policymaking roles.
A registrant is required to disclose the information specified by Form N-CSR, and the Commission will make this information public. A registrant is not required to respond to the collection of information contained in Form N-CSR unless the Form displays a currently valid Office of Management and Budget ("OMB") control number. Please direct comments concerning the accuracy of the information collection burden estimate and any suggestions for reducing the burden to Secretary, Securities and Exchange Commission, 100 F Street, NE, Washington, DC 20549. The OMB has reviewed this collection of information under the clearance requirements of 44 U.S.C. § 3507.
Item 1. Reports to Stockholders.
The Report to Shareholders is attached herewith.
March 31, 2016
Annual Report
Touchstone Strategic Trust
Touchstone Flexible Income Fund
Touchstone Focused Fund
Touchstone Growth Opportunities Fund
Touchstone International Value Fund
Touchstone Mid Cap Growth Fund
Touchstone Sands Capital Emerging Markets Growth Fund
Touchstone Small Cap Growth Fund
Touchstone Sustainability and Impact Equity Fund

Table of Contents
This report identifies the Funds’ investments on March 31, 2016. These holdings are subject to change. Not all investments in each Fund performed the same, nor is there any guarantee that these investments will perform as well in the future. Market forecasts provided in this report may not occur.
Letter from the President
Dear Shareholder:
We are pleased to provide you with the Touchstone Strategic Trust Annual Report. Inside you will find key financial information, as well as manager commentaries for the Funds, for the 12 months ended March 31, 2016.
Concerns about global economic growth dominated the market landscape during the period. While growth in Europe and Japan remained anemic, it was a potential slowdown in China’s economy that was most concerning. This was most directly reflected in the continued decline of commodity and crude oil prices, which in turn caused emerging market economies (such as Brazil and Russia) most levered to those markets to struggle. More broadly, China’s economy had a strong impact on investor sentiment. Weaker economic data releases were followed by sharp, but temporary sell-offs in the equity markets. Recognizing the downside risks to the global economy, central banks maintained highly accommodative monetary policies. Even in the U.S. – where economic growth had been unspectacular but stable – the U.S. Federal Reserve Board raised short-term rates by a marginal amount in December, but provided new guidance in early 2016 that indicated a more gradual path for potential future interest rate hikes.
The global growth fears resulted in mixed performance for equity markets. Domestic markets generally outperformed their non-U.S. counterparts, but still struggled. In a period of elevated market volatility, the perceived safety of large-capitalization stocks was rewarded with small gains, while smaller-capitalization companies reported losses. Growth stocks ended a multi-year run of outperformance as analysts questioned whether growth could be maintained in a weak global economy.
Despite the first interest rate hike in the U.S. in nearly a decade, monetary policy around the world remained accommodative. The increased economic uncertainty caused investors to seek the safety of bonds, and U.S. Treasury yields actually declined during the period. Reflecting the increased risk, credit spreads – particularly in energy and commodity-related sectors – widened, which favored investment grade bonds over high yield securities.
After a multi-year bull market, the volatility experienced this year provided a sober reminder of the risks of investing. It is our belief that risk must be viewed in the context of one’s long-term goals, and not seen through the prism of short-term market movements. A financial professional can help you determine your risk-return profile and create an asset allocation plan that may be suitable for the diverse market environments ahead.
We greatly appreciate your continued support. Thank you for including Touchstone as part of your investment plan.
Sincerely,

Jill T. McGruder
President
Touchstone Strategic Trust
Management’s Discussion of Fund Performance (Unaudited)
Touchstone Flexible Income Fund
Sub-Advised by ClearArc Capital, Inc.
Investment Philosophy
The Touchstone Flexible Income Fund seeks a high level of income consistent with reasonable risk and seeks capital appreciation as a secondary goal. The Fund primarily invests in income-producing securities such as debt securities, common stocks, and preferred stocks. Its investment approach seeks to maximize risk-adjusted returns through fundamental research, quantitative modeling, quantitative analysis, and capital structure analysis. In performing this research, modeling and analysis, companies are evaluated based on such factors as sales, assets, earnings, markets, and management, as well as debt-to-equity ratios. The Fund seeks returns by investing across a broader array of investments than traditional investment-grade fixed-income funds, and ClearArc believes that a low correlation between various asset classes leads to stability of expected returns.
Fund Performance
Touchstone Flexible Income Fund (Class A Shares) outperformed its benchmark, the Barclays U.S. Aggregate Bond Index, for the 12-month period ended March 31, 2016. The Fund’s total return was 2.13 percent (calculated excluding the maximum sales charge), while the total return of the benchmark was 1.96 percent.
Market Environment
The 12-month period that ended on March 31, 2016 was largely a tale of two environments. Many trends that held during the first three quarters of the period began to change during the final quarter. For much of 2015, the first increase in the U.S. Federal Funds rate since 2006 appeared to be just around the corner. This caused market volatility to increase. A false alarm about a possible interest rate hike in September caused volatility to spike in many markets. The U.S. Federal Reserve Board (Fed) finally raised rates in December. The immediate aftermath of that action was increased market volatility, as well as an equity sell-off, which subsided in March 2016 when the Fed turned dovish, citing sluggish global growth as the reason for its more cautious view.
Across global capital markets, interest rates fell over the 12-month period. The European and Japanese economies showed encouraging signs of recovery early in the period but later stagnated. U.S. corporate credit spreads, the yield premium that corporate credit offers over U.S. Treasuries of similar maturities, widened significantly, resulting in poor performance among corporate bonds. In currencies, the euro and Japanese yen both delivered strong returns. The U.S. dollar initially performed well but weakened in early 2016.
Performance of the U.S. stock market, measured by the S&P 500® Index, was slightly positive for the period while most other global equity markets generated negative returns. Emerging market equities finished the 12-month period in negative territory led by commodity producing countries.
Portfolio Review
There were a number of drivers of the Fund’s outperformance such as derivatives positions and preferred equities. The strong derivatives performance was led by short positions on the currencies of Brazil, South Africa, Colombia, South Korea and New Zealand. A Eurodollar/Euribor convergence trade expressed our view that the Fed would be dovish relative to the European Central Bank (ECB). Ultimately, the position profited when the gap narrowed between short-term forward rates in the U.S. and Europe. Finally, the Fund’s positions in equities and in the Chicago Board Options Exchange Volatility Index (VIX), which measures volatility in the S&P 500® Index, also added to the outperformance. Among preferred equities, banks remained under scrutiny and operated with much higher capital levels, so we had anticipated incremental return there. It proved to be the right move as preferreds outperformed other credit sectors.
Management’s Discussion of Fund Performance (Unaudited) (Continued)
The Fund’s performance detractors included bond sectors the Fund did not own. Fund weights in U.S. Treasury and Agency bonds were less than the benchmark and were not quite enough to keep up with benchmark performance. As such, an underweight to U.S. Treasuries hurt as yields fell and prices increased.
Outlook
The current pulse of the macroeconomic outlook is for inflation to increase. With the weaker U.S. dollar, this may take months to play out. As a result, we prefer the Japanese and European equity markets over U.S. equities. We also like U.S. housing, which continues to recover from weak levels. Ongoing job growth and wage hikes in the U.S. should help maintain this recovery. However, we expect market volatility to remain elevated. Economic data has varied, members of the Fed are providing conflicting and evolving views, and we believe China can show some improved economic growth for a quarter or two but feel it is unsustainable longer-term. We believe the market is fairly pricing on the chance of future interest rate hikes, but this may change quickly if inflation data surprises to the upside.
Looking a little further into the future, we believe central banks may need to confront higher inflation while economic growth remains weak. This may be an unpleasant set of circumstances. We believe attempting to stimulate economic activity through lower rates is not working. Central banks may become more creative, so be prepared to hear the term “helicopter money” more as the year progresses. This is a monetary policy in which central banks distribute money to consumers in order to increase the rate of inflation. It is more of a direct approach than lowering interest rates, which has not been working well given the weak demand for credit.
We also believe the large divergence between the U.S. equity market and the Japanese and European equity markets will not be sustained. Credit market rallies are likely unsustainable, in our view. This is due to high corporate balance sheet leverage and weak growth. Finally, we believe emerging markets will relapse at some point later this year. Emerging market fundamentals are very weak and credit growth is anticipated to turn negative.
The Fund will remain defensively positioned overall, and for the next few quarters we are positioning it for the possibility of a reflationary environment. This positioning includes the move to higher quality bonds and preferred equities that we mentioned earlier. We expect the Fund’s quality to stay neutral or continue to rise versus the benchmark. The Fund’s overall duration is shorter than the benchmark’s. We manage duration for both the bond allocation and the preferred allocation, as well as at a portfolio level. We expect to maintain preferred positioning at neutral to the benchmark or slightly higher, unless risk of recession rises. The Fund’s equity exposure may increase on opportunities in Japan and Europe. Equity exposure may also rise in sectors that are a beneficiary of reflationary policies, such as Industrials or Materials.
Dividend-paying investments may not experience the same price appreciation as non-dividend paying instruments, dividend-issuing companies may choose not to pay a dividend, or the dividend may be less than what is anticipated.
Diversification neither assures a profit nor guarantees against loss in a declining market.
Management’s Discussion of Fund Performance (Unaudited) (Continued)
Comparison of the Change in Value of a $10,000 Investment in the
Touchstone Flexible Income Fund - Class A* and the Barclays U.S. Aggregate Bond Index

| * | The chart above represents performance of Class A shares only, which will vary from the performance of Class C shares, Class Y shares and Institutional Class shares based on the differences in sales loads and fees paid by shareholders in the different classes. The inception date of Class A shares, Class C shares, Class Y shares and Institutional Class shares was April 1, 2004, October 29, 2001, September 1, 1998 and September 10, 2012, respectively. Class A shares, Class C shares and Class Y shares performance information was calculated using the historical performance of the Fifth Third/ Maxus Income Fund Investor shares, with an inception date of March 10, 1985, for periods prior to April 1, 2004, October 29, 2001 and September 1, 1998, respectively. Institutional Class shares performance information was calculated using the historical performance of Class Y shares for the periods prior to September 10, 2012. The returns have been restated for sales loads and fees applicable to Class A, Class C, Class Y and Institutional Class shares. The returns of the index listed above are based on the inception date of the Fund. |
| ** | The average annual total returns shown above are adjusted for maximum sales loads and fees, if applicable. The maximum offering price per share of Class A shares is equal to the net asset value (“NAV”) per share plus a sales load equal to 6.10% of the NAV (or 5.75% of the offering price). Class C shares are subject to a contingent deferred sales charge (“CDSC”) of 1.00%. The CDSC will be assessed on an amount equal to the lesser of (1) the NAV at the time of purchase of the shares being redeemed or (2) the NAV of such shares being redeemed, if redeemed within a one-year period from date of purchase. Class Y shares and Institutional Class shares are not subject to sales charges. |
The performance of the above Fund does not reflect the deduction of taxes that a shareholder would pay on Fund distributions or the redemption of Fund shares.
Note to Chart
Barclays U.S. Aggregate Bond Index is an unmanaged index comprised of U.S. investment grade, fixed rate bond market securities, including government, government agency, corporate and mortgage-backed securities between one and ten years.
Management’s Discussion of Fund Performance (Unaudited)
Touchstone Focused Fund
Sub-Advised by Fort Washington Investment Advisors, Inc.
Investment Philosophy
The Fund seeks to invest in companies of all capitalizations that are trading below what is believed to be the estimate of their intrinsic value and have a sustainable competitive advantage or a high barrier to entry in place. The barrier(s) to entry can be created through a cost advantage, economies of scale, high customer loyalty or a government barrier (e.g. license or subsidy). Management believes that the strongest barrier to entry is the combination of economies of scale and high customer loyalty.
Fund Performance
The Touchstone Focused Fund (Class A Shares) outperformed its benchmark, the Russell 3000® Index, for the 12-month period ended March 31, 2016. The Fund’s total return was 1.47 percent (calculated excluding the maximum sales charge), while the total return of the benchmark was -0.34 percent.
Market Environment
For the twelve months ended March 31, 2016, domestic equity markets experienced a higher than normal level of volatility as the broader indices declined moderately in value. The first quarter of 2016 ended with positive momentum however, as the U.S. Federal Reserve Board (Fed) provided language that suggested it planned to take a more cautious approach to future interest rate increases. Also helping market sentiment was the decision by Chinese officials to bolster its economy as well as reports that Saudi Arabia was considering freezing its oil production in an attempt to establish a floor for oil prices. Top performing sectors from the past twelve months included Telecommunication Services, Utilities, Consumer Staples, Information Technology and Consumer Discretionary. Energy was the worst performing sector with Materials, Health Care and Financials also lagging. The Industrials sector finished in-line with the benchmark.
Portfolio Review
Stock selection accounted for all of the outperformance for the Touchstone Focused Fund. Sector allocation detracted from performance with cash holdings detracting slightly. The majority of the sector allocation impact was due to underweights in both the Utilities and Telecommunication Services sectors. The leading sector contributors came from overweights to the Consumer Staples and Information Technology sectors. Sector weights are mainly a function of the Fund’s stock selection process. On an absolute basis, seven of the nine sectors in which the Fund was invested outperformed the benchmark. Investments made in international companies underperformed the benchmark while domestic holdings outperformed.
Amazon.com Inc. (Consumer Discretionary sector) was the top performing stock during the past 12 months. Throughout the past year, Amazon benefited from an improving core business as well as a better than expected holiday season and positive momentum in its U.S. eCommerce and cloud businesses. Alphabet Inc. (Information Technology sector; formerly known as Google) benefited from positive momentum in its YouTube and mobile segments and an announced $5 billion buyback. SYSCO Corp. (Consumer Staples sector) benefited from the company reporting stronger than expected revenue growth following a failed attempt to acquire its largest competitor.
Stocks that detracted from performance included Joy Global Inc. (Industrials sector) which reported several weak quarters as it warned investors of continued weakness due to the impact from falling commodity prices, particularly iron ore and copper. Kennametal Inc. (Industrials sector) reduced guidance throughout the year due to general weakness in its end markets. Novartis (Health Care sector) guided earnings down for 2016 due to generic erosion of top selling drug Glivec and slowing revenue growth at its eye care division.
Management’s Discussion of Fund Performance (Unaudited) (Continued)
During the past 12 months, we increased the Fund’s weight to the Health Care and Information Technology sectors. We also decreased the weight to Industrials, Energy, Financials and Consumer Discretionary sectors. The Fund’s cash position stood at 7.8 percent as of March 31, 2016 which is an increase from 2.2 percent a year ago.
From a market cap perspective, we exited the Fund’s remaining positions in smaller-cap stocks (companies with a market cap below $2 billion). The Fund now has no exposure to that segment, compared to the benchmark weight of 5.4 percent. The Fund remained underweight in mid-cap businesses. While we continued to increase the Fund’s exposure to larger-cap businesses (companies with a market cap above $10 billion), it remains underweight compared to the benchmark. This allocation decision added slightly to performance during the year.
Over the past twelve months, we have focused on buying high quality businesses with stable returns on capital, solid balance sheets and sustainable barriers to entry. As a result, the Fund portfolio’s weight to high barrier businesses has increased over the past year. The weighted average return on capital for the companies held in the Fund (ex Financials) is currently significantly more than the weighted average cost of capital. Overall, the Fund is fully invested in companies that we believe are sheltered by barriers to entry indicating that these businesses should continue to earn attractive returns on capital in the future.
Outlook
Due to increased concerns over the quality of the market rally and corporate earnings, along with rising concerns internationally, we have decreased the Fund’s cyclical exposure and operational leverage over the last few quarters. Additionally, exposure to financial leverage in the Fund, excluding the Financials sector (leverage is a part of the financial service business model in most cases), is below the level in the benchmark. We continue to focus on buying what we believe are high quality businesses with stable returns on capital, solid balance sheets and sustainable barriers to entry.
Management’s Discussion of Fund Performance (Unaudited) (Continued)
Comparison of the Change in Value of a $10,000 Investment in the Touchstone Focused
Fund - Class A* and the Russell 3000® Index
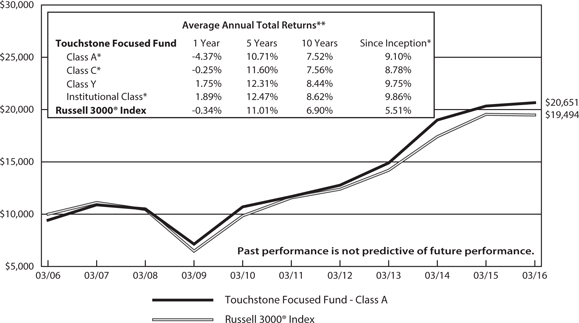
| * | The chart above represents performance of Class A shares only, which will vary from the performance of Class C shares, Class Y shares and Institutional Class shares based on the differences in sales loads and fees paid by shareholders in the different classes. The inception date of Class A shares, Class C shares, Class Y shares and Institutional Class shares was September 30, 2003, April 12, 2012, February 12, 1999 and December 20, 2006, respectively. Class A shares, Class C shares and Institutional Class shares performance information was calculated using the historical performance of Class Y shares for the periods prior to September 30, 2003, April 12, 2012 and December 20, 2006, respectively. The returns have been restated for sales loads and fees applicable to Class A, Class C and Institutional Class shares. The returns of the index listed above are based on the inception date of the Fund. |
| ** | The average annual total returns shown above are adjusted for maximum sales loads and fees, if applicable. The maximum offering price per share of Class A shares is equal to the net asset value (“NAV”) per share plus a sales load equal to 6.10% of the NAV (or 5.75% of the offering price). Class C shares are subject to a contingent deferred sales charge (“CDSC”) of 1.00%. The CDSC will be assessed on an amount equal to the lesser of (1) the NAV at the time of purchase of the shares being redeemed or (2) the NAV of such shares being redeemed, if redeemed within a one-year period from date of purchase. Class Y shares and Institutional Class shares are not subject to sales charges. |
The performance of the above Fund does not reflect the deduction of taxes that a shareholder would pay on Fund distributions or the redemption of Fund shares.
Notes to Chart
Russell 3000® Index measures the performance of the 3,000 largest U.S. companies based on total market capitalization, which represents approximately 98% of the investable U.S. equity market.
The Frank Russell Company (FRC) is the source and owner of the Index data contained or reflected in this material and all trademarks and copyrights related thereto. The material may contain confidential information and unauthorized use, disclosure, copying, dissemination or redistribution is strictly prohibited. This is a Touchstone Investments presentation of the data, and FRC is not responsible for the formatting or configuration of this material or for any inaccuracy in the presentation thereof.
Management’s Discussion of Fund Performance (Unaudited)
Touchstone Growth Opportunities Fund
Sub-Advised by Westfield Capital Management, L. P.
Investment Philosophy
The Touchstone Growth Opportunities Fund seeks long-term growth of capital by primarily investing in stocks of U.S. companies with large, medium and small market capitalizations. The Fund’s portfolio managers place focus on companies they believe to have demonstrated records of achievement with excellent prospects for earnings growth over a 1 to 3 year period. Westfield looks for companies that it believes are reasonably priced with high forecasted earnings potential.
Fund Performance
The Touchstone Growth Opportunities Fund (Class A Shares) underperformed its benchmark, the Russell 3000® Growth Index, for the 12-month period ended March 31, 2016. The Fund’s total return was -9.12 percent (calculated excluding the maximum sales charge), while the total return of the benchmark was 1.34 percent.
Market Environment
Despite several bouts with volatility, the broad U.S. equity markets finished the period nearly where they started. A consistent theme throughout the period was the oscillation of investors’ views on the global economy. Fears of a slowdown sparked sharp sell-offs, only for the market to rebound when investor sentiment improved. The period began with a steady market advance, which came to an abrupt halt in the last week of June 2015 when Greece effectively defaulted on its scheduled $1.7 billion debt payment to the International Monetary Fund (IMF). Although this European nation of 11 million people contributes less than 0.4 percent to the global Gross Domestic Product (GDP), the prospect of its economic demise undermined confidence in financial markets more broadly. Perhaps more of a concern to investors was the eroding business confidence in Germany, Europe’s economic powerhouse, and China’s large stock market sell-off. The month of August brought a broad downturn across global financial markets, triggered by China’s surprise yuan devaluation and fears that China’s cooling economy would lead to an overall slowdown in global growth. The U.S. economy, on the other hand, proved to be more resilient than earlier economic forecasts had predicted. Consumer and business spending continued to improve, the unemployment rate dropped to 5 percent, and the gradual tightening of labor markets manifested itself in modest wage growth. By year-end, headline inflation actually firmed despite further weakness in energy prices and a strong U.S. dollar. The U.S. Federal Reserve Board (Fed) expressed confidence in the prospects for the U.S. economy by taking the first step to end the extended period of its unconventional easy money policy by slightly raising the target rate for Fed Funds in December. Investor sentiment, however, continued to reflect caution in the early trading days of 2016. This reversed in mid-February, and U.S. markets turned around to finish the first quarter of 2016 and the 12-month period higher than they began.
Portfolio Review
Stock selection accounted for the majority of the underperformance with sector allocation also detracting from returns. Weakness particularly in the Health Care, Industrials, and Consumer Discretionary sectors offset moderate strength in the Materials sector.
The Health Care sector detracted from relative performance. The substantial amount of the sector’s losses stemmed from the Fund’s position in PTC Therapeutics, Inc., a developer of biopharmaceutical products. The stock traded down sharply in February after the company received a refuse to file (RTF) letter from the Food & Drug Administration. Our initial investment in PTC was predicated on our belief that the company’s Duchenne’s Muscular Dystrophy and Cystic Fibrosis drug Translarna had a multibillion dollar potential and the ability to generate significant operating leverage given the low infrastructure needs of the orphan drug space. The FDA’s
Management’s Discussion of Fund Performance (Unaudited) (Continued)
RTF letter has significantly delayed any potential roll-out of Translarna. Additionally, we found that management’s remarks around the RTF letter raised significant questions around other statements the company had made. Given these two factors, we determined that an outright sale was the most prudent course of action. Also detracting from the Fund’s relative performance was Ireland-domiciled Jazz Pharmaceuticals PLC. After reaching an all-time high at the end of July, the stock declined in August and September in tandem with its peers in the specialty pharmaceutical space. We maintain an investment in the company, which has a portfolio of products in the orphan space focused on the areas of oncology and psychiatry. Jazz’s lead asset Xyrem, which is used for the treatment of severe narcolepsy, is protected from competitive threats by multiple layers of patents and regulatory barriers. To help diversify its portfolio of products without sacrificing high growth and margin profile, Jazz has been building a commercial portfolio in pediatric oncology and rare diseases. The company’s seasoned management team and low tax infrastructure further differentiates Jazz from other firms within the specialty pharma universe, which is why we maintain a position in the stock.
The Industrials sector also detracted from relative performance. Steelcase Inc., a provider of office furniture systems, was the sector’s biggest source of weakness. Shortly after initiating a position in October, the stock traded lower following the release of the company’s quarterly results, which came in shy of Wall Street expectations. While orders in its Europe, Middle East, and Asia business segments were up 20 percent organically, Steelcase saw fewer large orders in its Americas segment due to lower business spending. As a result, the company guided fourth quarter sales and earnings down to below consensus estimates. Steelcase also declined in part due to competitor Herman Miller as well as smaller competitors, and noted that it would bring a number of new products to market in an effort to stem the market share erosion. We continue to hold the position but are monitoring it closely given the weak results. Airline operator United Continental Holdings, Inc. declined in late spring of 2015, along with all the other airlines, following a decision by Southwest Airlines Co. to raise its guidance for available seat miles (ASM). ASM is a measure of an airline flight’s passenger carrying capacity, and it is closely monitored by investors who are concerned that added seats, along with lower airfares, will pressure profit margins. The stock was sold, but we have since reinitiated a position given our belief that the company is poised to cut capacity and to execute on sequentially better PRASM (passenger revenue per available seat mile) trends going forward. Commercial vehicle dealership operator Rush Enterprises, Inc. also detracted from relative performance.
The Consumer Discretionary sector detracted from relative performance during the period. We had resisted building a position in the on-line retail phenomenon Amazon.com, Inc. given the company’s lofty valuation. We finally bought the stock in mid-July, after Amazon reported better-than-expected profits across all of its business lines. The cloud computing platform Amazon Web Services (AWS), which was launched by the company in 2006 but did not report a profitable quarter until the spring of 2015, was the greatest driver of the earnings upside. A sum of parts valuation approach, which is based on both the AWS segment and the core retail business, yielded a much more palatable entry point for us. The stock exited 2015 near its all-time highs, but moderated in early 2016 as fourth quarter earnings failed to meet consensus expectations. Despite the recent quarterly results, we remain invested in the stock due to the company driving an increasing share of all retail sales growth in the U.S. Amazon announced in February that it had authorized a $5 billion share repurchase program. Historically, the company’s repurchases have been positive signals of future outperformance. Clothing manufacturer V.F. Corp. was the Fund’s weakest performer in the Consumer Discretionary sector. The stock suffered after the company reported quarterly results shy of Wall Street expectations and lowered forward guidance in late October. Despite the weakness, we initially chose to remain invested in the stock given the company’s diversified global brands, which we believed made it less volatile than other apparel players. However, we sold the stock in February given worsening retail data points and our determination that the stock was expensive relative to its peers.
Management’s Discussion of Fund Performance (Unaudited) (Continued)
The Materials sector contributed to relative performance, due primarily to stock selection. Vulcan Materials Company, the largest producer of construction aggregates in the U.S., was one of the sector’s top performers in 2015. The stock continued to trade higher in the first quarter of 2016. The company reported robust operational results for its fourth fiscal quarter, with higher-than-expected volumes driving sales and 80 percent incremental margins boosting profits. Management’s upbeat earnings guidance for 2016 and its confident tone during the quarterly investor call left us optimistic that there is further upside potential for the stock. A timely sale of the Fund’s investment in Monsanto Co. , a supplier of agricultural products to farmers, also benefited relative performance. This leader in the agricultural seed and traits industry traded higher in April and May, powered by investor optimism for the company’s product pipeline, organic sales growth and margin expansion. However, the stock was sold in May after evaluating Monsanto’s proposed acquisition of peer Syngenta. This sale proved to be the right decision, as the stock subsequently sold off during the summer of 2015.
Outlook
Recent economic data have shown improvement in the U.S. economy. The employment picture continues to look bright, oil prices appear to have stabilized, the service sector is expanding, industrial production is ticking up, and consumer spending is stable. Investor concerns about other global economies have also receded somewhat. China’s industrial profits have been showing signs of life this year and its consumer-driven segments have been an area of growth. The economic recovery continues in Europe, albeit at a tepid pace. Global manufacturing statistics have stabilized and emerging markets appear to be bottoming. In short, economic growth around the world is slow, but we do not think a recession is likely. We think this economic backdrop is good for domestic growth equities. We believe we have positioned the Fund to benefit from pockets of secular strength, focusing on those companies that have sustainable pricing power, a competitive edge, and attractive fundamentals.
Management’s Discussion of Fund Performance (Unaudited) (Continued)
Comparison of the Change in Value of a $10,000 Investment in the
Touchstone Growth Opportunities Fund - Class A* and the Russell 3000® Growth Index

| * | The chart above represents performance of Class A shares only, which will vary from the performance of Class C shares, Class Y shares and Institutional Class shares based on the differences in sales loads and fees paid by shareholders in the different classes. The inception date of Class A shares, Class C shares, Class Y shares and Institutional Class shares was September 29, 1995, August 2, 1999, February 2, 2009 and February 2, 2009, respectively. Class C shares, Class Y shares and Institutional Class shares performance information was calculated using the historical performance of Class A shares for periods prior to August 2, 1999, February 2, 2009 and February 2, 2009, respectively. The returns have been restated for sales loads and fees applicable to Class C, Class Y and Institutional Class shares. The returns of the index listed above are based on the inception date of the Fund. |
| ** | The average annual total returns shown above are adjusted for maximum sales loads and fees, if applicable. The maximum offering price per share of Class A shares is equal to the net asset value (“NAV”) per share plus a sales load equal to 6.10% of the NAV (or 5.75% of the offering price). Class C shares are subject to a contingent deferred sales charge (“CDSC”) of 1.00%. The CDSC will be assessed on an amount equal to the lesser of (1) the NAV at the time of purchase of the shares being redeemed or (2) the NAV of such shares being redeemed, if redeemed within a one-year period from date of purchase. Class Y shares and Institutional Class shares are not subject to sales charges. |
The performance of the above Fund does not reflect the deduction of taxes that a shareholder would pay on Fund distributions or the redemption of Fund shares.
Note to Chart
Russell 3000® Growth Index measures the performance of those Russell 3000® companies with higher price-to-book ratios and higher forecasted growth values.
The Frank Russell Company (FRC) is the source and owner of the Index data contained or reflected in this material and all trademarks and copyrights related thereto. The material may contain confidential information and unauthorized use, disclosure, copying, dissemination or redistribution is strictly prohibited. This is a Touchstone Investments presentation of the data, and FRC is not responsible for the formatting or configuration of this material or for any inaccuracy in the presentation thereof.
Management’s Discussion of Fund Performance (Unaudited)
Touchstone International Value Fund
Sub-Advised by Barrow, Hanley, Mewhinney & Strauss, LLC
Investment Philosophy
The Touchstone International Value Fund seeks long-term capital growth by primarily investing in equity securities of non-U.S. companies believed to be undervalued and seeks companies that have price-to-earnings and price-to-book ratios below the market, enterprise-value/free-cash-flow ratios at or below the market and dividend yields above the market.
Fund Performance
The Touchstone International Value Fund (Class A Shares) underperformed its benchmark the MSCI EAFE Index, for the 12-month period ended March 31, 2016. The Fund’s total return was -9.97 percent (calculated excluding the maximum sales charge), while the total return of the benchmark was -8.27 percent.
Market Environment
At the beginning of the 12-month period, the U.S. economy led global markets as the U.S. dollar strengthened and the U.S. Federal Reserve Board (Fed) guided market expectations for higher interest rates. In sharp contrast, central banks around the world eased monetary conditions by lowering interest rates in response to weak economic growth and deflationary pressures. Despite a weak fundamental backdrop, many countries saw positive market responses as a result of accommodative monetary policy from central banks. However, in August 2015, equity markets fell sharply around the globe following China’s currency devaluation. A number of emerging market currencies collapsed in response, sparking heavy outflows from those markets. Contagion fears spread to developed markets, including Europe and the U.S., which further highlighted the risk of increased global dependence on China as a driver of global economic growth. Emerging market commodity exporters such as Russia and Brazil suffered most from China’s problems, and the decline in oil prices contributed additional uncertainty to an already volatile Middle East region. As 2015 came to a close, the U.S. economy and its policy responses continued to diverge from the rest of the world, primarily because of a stronger dollar and the likelihood of higher interest rates.
At the start of 2016, there was a strong consensus that lower oil prices and actions from the world’s central banks – aggressive monetary easing and lower interest rates – would benefit major world markets, including Europe, Japan and China. Many investors also believed that the U.S. would continue on its path toward a strengthening economy and higher interest rates, resulting in continued strength for the U.S. dollar. This consensus view proved wrong as the U.S. dollar weakened, interest rates in the U.S. did not rise and equity markets with the most aggressive monetary easing policies moved lower. By mid-February, however, economic readings – along with oil and commodity prices – stabilized, rekindling investors’ appetite and rallied equity markets. Commodity exporters saw their stock markets rise, and emerging markets overall also moved higher.
Portfolio Review
For the period, the Fund’s stock selection within the Materials, Consumer Discretionary and Consumer Staples sectors contributed most to performance, while stock selection within the Information Technology, Health Care and Telecommunication Services sectors detracted from performance.
Among the individual stocks that contributed to Fund performance during the period were Imperial Brands PLC, Dairy Crest Group PLC (both from the Consumer Staples sector), DS Smith PLC (Materials sector) and National Grid PLC (Utilities sector). Imperial Brands PLC, a U.K.-based cigarette, cigar and tobacco manufacturer, outperformed after the U.S. Federal Trade Commission (FTC) approved the merger between Reynolds American Inc. and Lorillard Inc. in June 2015. As part of that transaction, Imperial purchased five brands – KOOL,
Management’s Discussion of Fund Performance (Unaudited) (Continued)
Salem, Winston, Maverick and blueCigs – from Reynolds and Lorillard. The transaction also included Imperial’s acquisition of Lorillard’s manufacturing facilities and its U.S. sales and marketing teams. These acquisitions drove Imperial’s U.S. market share higher. Dairy Crest Group, a U.K.-based consumer foods business, outperformed due in part to the company’s sale of its dairy business to competitor Müeller Dairy Ltd. Meanwhile, Dairy Crest’s core business also performed well, making additional market share gains in its profitable Cathedral City cheese business. Materials company DS Smith endured a volatile 12 months, but ultimately outperformed. The U.K.-based packaging company benefited from its long-term strategy of focusing on packaging solutions for fast-moving consumer packaged goods (FMCG) companies and utilizing its integrated recycled paper products as raw material inputs. Furthermore, the company reported continued market share gains, rising margins and increased volume growth. DS Smith also benefited from growth via acquisitions during the period. National Grid is a U.K.-based utility company with high quality assets and solid regulatory constructs. National Grid briefly underperformed early in the period, as income-producing equities suffered amid concerns of interest rate action by central banks. As the economic environment weakened and the risk of policy tightening subsided, the stock recovered lost ground and advanced to new highs in March 2016. National Grid’s U.K. utilities have rate structures that automatically adjust for changes in interest rates and inflation, which help to reduce earnings volatility and improve transparency. The Fund remains invested in the stock due to our belief that National Grid will continue to deliver consistent growth in earnings and dividends.
Among the stocks that detracted from Fund performance were Delta Lloyd NV (Financials sector), Casino Guichard-Perrachon SA (Consumer Staples sector), Joy Global Inc. and IHI Corp. (both from the Industrials sector). Delta Lloyd is a Netherlands-based financial services provider offering insurance products, fund management and banking products and services. A transition in the European Union’s regulatory regime has been in process for more than ten years and is scheduled to finally be implemented in January 2016. Dutch regulators have forced companies to be compliant with the new Solvency II standards at the beginning of 2016. This compressed transition period for compliance has put pressure on Dutch insurance companies like Delta Lloyd. The company attempted to address its capital issues by repositioning its investment portfolio to lower risk-weighted assets and by selling businesses it viewed as non-core, but these actions were insufficient to cover the capital shortfall in the short time the regulators allotted. As a result, Delta Lloyd announced that it would implement an equity issuance, which we believe will likely be dilutive to existing shareholders. Casino Guichard-Perrachon is a France-based company that owns and operates retail outlets in France and abroad. Latin America accounted for approximately one-third of its business, and the stock declined as the Brazilian economy weakened and investors grew concerned about the company’s Brazil-based consumer electronic retailing business, Via Varejo SA. An additional negative factor was the depreciation of the Brazilian real against the euro. Joy Global is a U.S.-based manufacturer and distributor of mining equipment for the extraction of minerals and ores. Amid the continued decline in commodity prices, Joy’s customers decreased their maintenance and capital expenditures due to declines in copper prices and the negative impact that lower natural gas prices had on coal as a substitute. The decrease in capital expenditure spending negatively impacted Joy Global, causing the company to reduce its full-year earnings outlook. Though it was only owned for a portion of the period, IHI Corp. also detracted from relative results. This Japan-based heavy equipment manufacturer generates about half of its income from aircraft engines, but also has substantial exposure to turbo chargers and power plant construction. As a Japanese company, the stock faced general headwinds due to concerns about an economic slowdown in China, a significant trading partner for Japan and its industrial companies. The stock was further pressured due to an unexpected loss provision in its power plant construction business. However, we view the stock’s declines as an overreaction and the Fund remains invested in the company. Based solely on the earnings from the turbo charger and aircraft engine segments, we estimate the company to be undervalued.
Management’s Discussion of Fund Performance (Unaudited) (Continued)
Outlook
Our view remains that many of the central banks’ initiatives are not expanding liquidity or the global economy, and that sustainable growth will likely be accompanied by more normal (i.e., higher) interest rates and a banking system that is not constricting growth. Once central bankers reach this conclusion, we believe the market should begin to reward many financial stocks for their cheapness and improving fundamentals. We believe the largest concern for investors and central banks continues to be China and its effect on developed and emerging markets. Profits in both mature and emerging markets have been decelerating for some time in response to China’s slowdown, and investors continue to watch global GDP and manufacturing for signals as to the direction of corporate profits. In March, however, many countries, including the U.S. and several in the eurozone, showed improvement in their Purchasing Manager’s Index (PMI) data, which tend to be leading indicators of global corporate profits. We believe that a continuation of this trend should boost investor confidence going forward.
Our investment discipline is driven by fundamental research, which includes analyzing and building our own appraisals of fair value one company at a time. We strive to comprise a relatively concentrated basket of companies that we believe offers a better return profile relative to the market.
Dividend-paying investments may not experience the same price appreciation as non-dividend paying instruments, dividend-issuing companies may choose not to pay a dividend, or the dividend may be less than what is anticipated.
Management’s Discussion of Fund Performance (Unaudited) (Continued)
Comparison of the Change in Value of a $10,000 Investment in the Touchstone International
Value Fund - Class A* and the MSCI EAFE Index
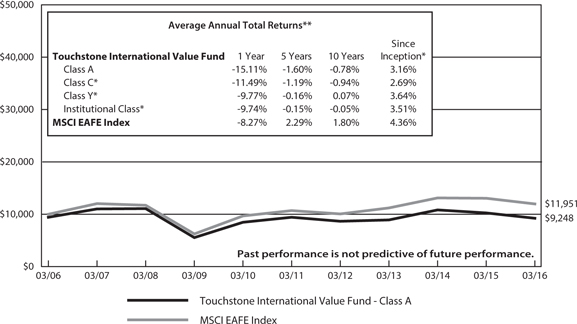
| * | The chart above represents performance of Class A shares only, which will vary from the performance of Class C shares, Class Y shares and Institutional Class shares based on the differences in sales loads and fees paid by shareholders in the different classes. The inception date of Class A shares, Class C shares, Class Y shares and Institutional Class shares was August 18, 1994, April 25, 1996, October 9, 1998 and September 10, 2012, respectively. Class C shares, Class Y shares and Institutional Class shares performance information was calculated using the historical performance of Class A shares for periods prior to April 25, 1996, October 9, 1998 and September 10, 2012, respectively. The returns have been restated for sales loads and fees applicable to Class C, Class Y, and Institutional Class shares. The returns of the index listed above are based on the inception date of the Fund. |
| ** | The average annual total returns shown above are adjusted for maximum sales loads and fees, if applicable. The maximum offering price per share of Class A shares is equal to the net asset value (“NAV”) per share plus a sales load equal to 6.10% of the NAV (or 5.75% of the offering price). Class C shares are subject to a contingent deferred sales charge (“CDSC”) of 1.00%. The CDSC will be assessed on an amount equal to the lesser of (1) the NAV at the time of purchase of the shares being redeemed or (2) the NAV of such shares being redeemed, if redeemed within a one-year period from date of purchase. Class Y shares and Institutional Class shares are not subject to sales charges. |
The performance of the above Fund does not reflect the deduction of taxes that a shareholder would pay on Fund distributions or the redemption of Fund shares.
Note to Chart
MSCI EAFE Index is a free float-adjusted market capitalization index that is designed to measure developed market equity performance excluding the U.S. and Canada.
MSCI makes no express or implied warranties or representations and shall have no liability whatsoever with respect to any MSCI data contained herein. The MSCI data may not be further redistributed or used to create indices or financial products. This report is not approved or produced by MSCI.
Management’s Discussion of Fund Performance (Unaudited)
Touchstone Mid Cap Growth Fund
Sub-Advised by Westfield Capital Management, L. P.
Investment Philosophy
The Touchstone Mid Cap Growth Fund seeks to increase the value of Fund shares by primarily investing in stocks of mid-cap U.S. companies. The Fund’s portfolio managers place focus on companies that they believe to have a demonstrated record of achievement with excellent prospects for earnings growth over a 1 to 3 year period. Westfield looks for companies that it believes are reasonably priced with high forecasted earnings potential.
Fund Performance
The Touchstone Mid Cap Growth Fund (Class A Shares) underperformed its benchmark, the Russell Midcap® Growth Index, for the 12-month period ended March 31, 2016. The Fund’s total return was -6.34 percent (calculated excluding the maximum sales charge), while the total return on the benchmark was -4.75 percent.
Market Environment
Despite several bouts with volatility, the U.S. broad equity markets finished the period nearly where they started. A consistent theme throughout the period was the oscillation of investors’ views on the global economy. Fears of a slowdown sparked sharp sell-offs, only for the market to rebound when investor sentiment improved. The period began with steady advance, which came to an abrupt halt in the last week of June 2015 when Greece effectively defaulted on its scheduled $1.7 billion debt payment to the International Monetary Fund (IMF). Although this European nation of 11 million people contributes less than 0.4 percent to the global Gross Domestic Product (GDP), the prospect of its economic demise undermined confidence in financial markets more broadly. Perhaps more of a concern to investors was the eroding business confidence in Germany, Europe’s economic powerhouse, and China’s large stock market sell-off. The month of August brought a broad downturn across global financial markets, triggered by China’s surprise yuan devaluation and fears that China’s cooling economy would lead to an overall slowdown in global growth. The U.S. economy, on the other hand, proved to be more resilient than earlier economic forecasts had predicted. Consumer and business spending continued to improve, the unemployment rate dropped to 5 percent, and the gradual tightening of labor markets manifested itself in modest wage growth. By year-end, headline inflation actually firmed despite further weakness in energy prices and a strong U.S. dollar. The U.S. Federal Reserve Board (Fed) expressed confidence in the prospects for the U.S. economy by taking the first step to end the extended period of its unconventional easy money policy by slightly raising the target rate for Fed Funds in December. Investor sentiment, however, continued to reflect caution in the early trading days of 2016. This reversed in mid-February, and U.S. markets turned around to finish the first quarter of 2016 and the 12-month period higher than they began.
Portfolio Review
Positive contributions from strong stocks election particularly within Information Technology, Consumer Discretionary and Materials was offset by an underweight to Consumer Staples and overweights to the Health Care and Energy sectors.
The Health Care sector was the biggest detractor from relative performance during the period. After a solid start to the period, AMAG Pharmaceuticals, Inc., a specialty pharmaceutical company, suffered severe losses in the second half of 2015. Investors were scared by the news that a relatively unknown company, McGruff Pharmaceuticals, had received approval for a generic drug that had the same active ingredient as AMAG’s Makena, an orphan-status product for the treatment of pre-term birth. The Fund remained invested given our belief that we were not likely to see a meaningful impact on Makena sales from the generic drug. Later in the year,
Management’s Discussion of Fund Performance (Unaudited) (Continued)
the company announced a delay for the approval of Makena. AMAG requested an expedited review by the Food & Drug Administration, and it was an encouraging sign that the request was accepted. We continue to believe that AMAG enjoys strong operating margins, strong free cash flow and that management intends to aggressively redeploy cash into new growth acquisitions. However, the Fund exited the position in February to fund the purchase of another stock with a more favorable risk/reward. Also detracting from the Fund’s relative performance was Ireland-domiciled Jazz Pharmaceuticals PLC. After reaching an all-time high at the end of July, the stock declined in August and September in tandem with its peers in the specialty pharmaceutical space. We maintain an investment in the company, which has a portfolio of products in the orphan space focused on the areas of oncology and psychiatry. Jazz’s lead asset Xyrem, which is used for the treatment of severe narcolepsy, is protected from competitive threats by multiple layers of patents and regulatory barriers. To help diversify its portfolio of products without sacrificing high growth and margin profile, Jazz has been building a commercial portfolio in pediatric oncology and rare diseases. The company’s seasoned management team and low tax infrastructure further differentiates Jazz from other firms within the specialty pharmaceutical universe, which is why we maintain a position in the stock.
Fund positions in the Energy sector detracted from relative performance. CONSOL Energy Inc., a producer of coal and gas and provider of electric services, detracted from performance during the period. Although we believed that the company’s assets could prove to be highly valued in the right economic context, the Fund sold the stock as we believed its coal exposure and financial leverage could limit the stock upside. Offsetting the poor performance in CONSOL were the Fund positions in refiners. U.S. refiners benefited late in 2015 from strong gasoline demand globally and limited access to refining capacity. However, the Fund’s exposure to refiners has trended lower recently, as slowing production growth is a headwind for earnings.
The Consumer Staples sector also detracted from relative performance. Although stock selection benefited relative returns, it could not make up for the Fund being underweight in the sector, which was the benchmark’s top performer during the period. Additionally, Mead Johnson Nutrition Company, a producer of infant and children’s nutrition products, traded down and was sold in September given the company’s heavy exposure to weakening markets in China/Brazil. The stock advanced subsequent to its sale from the Fund’s portfolio, further negatively impacting the Fund’s incremental results. Consumer Staples, in general, run contrary to the Westfield investment discipline and approach. Specifically, Consumer Staples stocks offer, on average, slower rates of growth combined with above average multiples. While exceptions exist, they are just that—exceptions, and not the rule. As fewer companies in the Consumer Staples sector meet our growth and valuation criteria, it is likely that we will continue to remain underweight the group. While this positioning can hurt relative performance at times of high market uncertainty (i.e., where visibility is highly valued, and arguably overvalued), we would expect the allocation impact to reverse as valuations revert to levels more consistent with the companies’ reported rates of growth.
The Information Technology sector contributed to relative performance. Total System Services, Inc., a provider of outsourced payment services, was the sector’s top performer. The stock enjoyed a prolonged advance through most of 2015, beating earnings expectations in each quarter of the year. We had maintained a position in the stock based on growth in the company’s card issuer processing business and generation of ample cash flow, which management uses to fund strategic mergers and acquisitions (M&A), share repurchases and dividends. However, given how much the stock had gained, we sold the stock in early January to fund the purchase of another position with a more favorable risk/reward. Splunk Inc. is a provider of a software platform that enables organizations to gain real-time operational intelligence by harnessing the value of their machine data. We purchased the stock in early February, which was a source of strength in the sector. The company continues to take market share from legacy vendors in application performance management/IT operations. Its topline growth is benefiting from increased security spending and the company continues to grow its customer base as its product evolves.
Management’s Discussion of Fund Performance (Unaudited) (Continued)
We believe high-profile security breaches will also bolster demand. The stock traded higher into the company’s recent quarterly report, which beat Wall Street estimates.
The Materials sector was also a contributor to relative performance. Vulcan Materials Company, the largest producer of construction aggregates in the U.S., was one of the sector’s top performers in 2015. The stock continued to trade higher in the first quarter of 2016. The company reported robust operational results for its fourth fiscal quarter, with higher-than-expected volumes driving sales and 80 percent incremental margins boosting profits. Management’s upbeat earnings guidance for 2016 and its confident tone during the quarterly investor call left us optimistic that there is further upside potential for the stock. Scotts Miracle-Gro Co., a manufacturer of consumer lawn and garden products, also contributed to the Fund’s relative performance. Strong results out of home improvement retailer Home Depot, Inc.—which at more than 30 percent of sales is Scotts’ largest customer—helped Scotts advance in late February. Scotts reported better-than-expected first quarter results, and reiterated forward guidance for 2016. The company also announced a minority position in Bonnie Plants, a potted vegetable and herb company, which we view as being aligned with its strategy to grow the business through product extensions and to tap into faster-growing gardening segments. We trimmed the position in the stock given its big move to the upside but remain invested in the stock, given the company’s positive fundamental trends, including structural improvements in margins and a focus on faster-growing segments in the U.S.
The Consumer Discretionary sector also contributed to relative performance. Amusement park operator Six Flags Entertainment Corp. was the Fund’s top source of relative strength. The stock rallied strongly into the end of 2015, declined early in 2016, before rallying again to reach new highs by the end of the period. The company announced strong third and fourth quarter results. Though the fourth quarter is less significant due to park closures during the holiday season and winter months, third quarter results exhibited sales growth driven by strong attendance and a 25 percent year-over-year increase in active passes/memberships. Since bringing the company out of bankruptcy in 2010, the management team at Six Flags has focused on disciplined capital allocation and revenue growth. As a result, shareholder value has flourished. In December, the company significantly increased its dividend yield, which should offer a degree of downside protection for investors, while ongoing international park ventures offer long-term potential for further growth. Ulta Salon, Cosmetics & Fragrance, Inc., a retailer of prestige and mass beauty products, was also a driver of the sector’s outperformance. The stock advanced sharply following recent quarterly results, which were highlighted by strong gross margins due to reduced promotional activity. We believe Ulta is one of the better growth stories in traditional retail.
Outlook
Recent economic data have shown improvement in the U.S. economy. The employment picture continues to look bright, oil prices appear to have stabilized, the service sector is expanding, industrial production is ticking up and consumer spending is stable. Investor concerns about other global economies have also receded somewhat. China’s industrial profits have been showing signs of life this year and its consumer-driven segments have been an area of growth. The economic recovery continues in Europe, albeit at a tepid pace. Global manufacturing statistics have stabilized and emerging markets appear to be bottoming. In short, economic growth around the world is slow, but we do not think a recession is likely. We think this economic backdrop is good for domestic growth equities. We believe we have positioned the Fund to benefit from pockets of secular strength, focusing on those companies that have sustainable pricing power, a competitive edge and attractive fundamentals.
Dividend-paying investments may not experience the same price appreciation as non-dividend paying instruments, dividend-issuing companies may choose not to pay a dividend, or the dividend may be less than what is anticipated.
Management’s Discussion of Fund Performance (Unaudited) (Continued)
Comparison of the Change in Value of a $10,000 Investment in the Touchstone Mid Cap
Growth Fund - Class A* and the Russell Midcap® Growth Index

| * | The chart above represents performance of Class A shares only, which will vary from the performance of Class B shares, Class C shares, Class Y shares and Institutional Class shares based on the differences in sales loads and fees paid by shareholders in the different classes. The inception date of Class A shares, Class B shares, Class C shares, Class Y shares and Institutional Class shares was October 3, 1994, May 1, 2001, October 3, 1994, February 2, 2009 and April 1, 2011. Class B shares, Class Y shares and Institutional Class shares performance information was calculated using the historical performance of Class A shares for periods prior to May 1, 2001, February 2, 2009 and April 1, 2011, respectively. The returns have been restated for sales loads and fees applicable to Class B, Class Y, and Institutional Class shares. The returns of the index listed above are based on the inception date of the Fund. |
| ** | The average annual total returns shown above are adjusted for maximum sales loads and fees, if applicable. The maximum offering price per share of Class A shares is equal to the net asset value (“NAV”) per share plus a sales load equal to 6.10% of the NAV (or 5.75% of the offering price). Class B shares are subject to a contingent deferred sales charge (“CDSC”) of 5.00% in the event of a shareholder redemption within a one-year period of purchase. The CDSC will be incrementally reduced over time. After the 6th year, there is no CDSC. Class C shares are subject to a CDSC of 1.00%. The CDSC will be assessed on an amount equal to the lesser of (1) the NAV at the time of purchase of the shares being redeemed or (2) the NAV of such shares being redeemed, if redeemed within a one-year period from date of purchase. Class Y shares and Institutional Class shares are not subject to sales charges. |
The performance of the above Fund does not reflect the deduction of taxes that a shareholder would pay on Fund distributions or the redemption of Fund shares.
Note to Chart
Russell Midcap® Growth Index measures the performance of those Russell Midcap® companies with higher price-to-book ratios and higher forecasted growth values.
The Frank Russell Company (FRC) is the source and owner of the Index data contained or reflected in this material and all trademarks and copyrights related thereto. The material may contain confidential information and unauthorized use, disclosure, copying, dissemination or redistribution is strictly prohibited. This is a Touchstone Investments presentation of the data, and FRC is not responsible for the formatting or configuration of this material or for any inaccuracy in the presentation thereof.
Management’s Discussion of Fund Performance (Unaudited)
Touchstone Sands Capital Emerging Markets Growth Fund
Sub-Advised by Sands Capital Management, LLC
Investment Philosophy
The Touchstone Sands Capital Emerging Markets Growth Fund seeks long-term capital appreciation. The Fund primarily invests in companies in emerging market or frontier market countries. Sands Capital uses a “bottom-up” approach to investment selection, as opposed to sector or regional allocations that focuses on a company’s long-term business fundamentals. Therefore, the Fund may overweight certain geographies or sectors and may underweight other geographies or sectors. Sands Capital looks for companies that have sustainable above-average earnings growth, a leadership position in a promising business space, significant competitive advantages such as profitability, superior quality and distribution relative to competitors, strong brand and consumer loyalty, a clear mission in an understandable business model, financial strength and a rational valuation in relation to competitors, the market and business prospects.
Fund Performance
The Touchstone Sands Capital Emerging Markets Growth Fund (Class Y Shares) outperformed its benchmark, the MSCI Emerging Markets Index, for the 12-month period ended March 31, 2016. The Fund’s total return was -9.35 percent, while the total return of the benchmark was -12.03 percent.
Market Environment
Investing in emerging markets has been fraught with challenges in recent years, as a confluence of macroeconomic forces has not only undermined some countries’ key growth tailwinds, but also inflated certain problematic headwinds. Overall, growth around the world appears to be slowing. It’s up for debate as to the causes of the slowdown, but there appear to be both cyclical and structural factors at work.
Despite shifting macroeconomic factors that can cause short-term challenges for investors, the emerging markets opportunity set has evolved over the past decade to include much more than just companies that engage in natural resource extraction and low-cost manufacturing. There are businesses across a variety of geographies that are benefiting from structural local demand growth instead of simply relying on export-driven business models. We believe local demand growth is more sustainable because in many developing countries, it is underpinned by long-term secular trends, including increasing productivity, growing discretionary incomes and attractive demographic profiles. We tend to find investment ideas that reflect these trends in the Information Technology, Health Care and Consumer sectors of the economy.
In our view, India remains a relative bright spot in emerging markets. India has many favorable fundamentals, including strong demographics, a relatively insulated, consumer-driven economy, improving internal and external balances and a government that is pushing toward needed reform in key growth-stoking areas, such as infrastructure and power generation. That said, the country is still recovering from a cyclical slowdown. The effects of this are apparent in relative investment results over the past 12 months, as four out of the top five detractors over the period were Indian businesses. Prime Minister Narendra Modi’s government has started the reform process, but it will take time to bear fruit. However, once initiatives to reduce bureaucracy, implement tax and permitting changes and develop major infrastructure projects kick into gear, we believe the economy will begin firing on all cylinders.
Portfolio Review
During the 12-month period, the top five contributors to relative investment results were Raia Drogasi SA, Qunar Cayman Islands Ltd., BIM Birlesik Magazalar AS, Sands China Ltd. and Mail.ru Group Ltd. At Raia Drogasil’s investor day event in December, the company increased its guidance for new store openings. Raia
Management’s Discussion of Fund Performance (Unaudited) (Continued)
is now targeting 165 gross store openings in 2016, and 195 per year thereafter. This compares to 130 new stores in 2014 and 145 in 2015. Increasing its store opening capacity has been a focus for the company and was many years in the making. Specifically, Raia has taken steps to expand its real estate development team, streamline the store opening process and invest in enhanced training and recruitment initiatives to develop a larger pool of new store managers. More importantly, as the largest retail operator in Brazil (based on the number of stores) and one of the select few that is free-cash-flow positive with a strong balance sheet, Raia has been able to secure prime real estate locations at relatively attractive prices, as many of its competitors have had to direct their own cash to meeting rising interest payments. While new stores combined with modest same-store-sales growth will drive revenue, we believe the company can also deliver meaningful margin leverage over time. We expect Raia to accomplish this by driving growth at existing stores at or above inflation, increasing generic and private label penetration and investing in productivity initiatives. We continue to view Raia as a strong operator in an attractive industry and believe it can grow for many years.
The top five detractors from relative investment results were Adani Ports & Special Economic Zone Ltd., Housing Development Finance Corp. Ltd., Jubilant Foodworks Ltd., Almarai Company Ltd. and Larsen & Toubro Ltd. Jubilant Foodworks is the master franchisee for the Domino’s Pizza Inc. brand in India, Bangladesh, Nepal and Sri Lanka and holds the exclusive rights for developing and operating Dunkin’ Donuts Brands Group Inc. restaurants in the same countries. While industry-wide pressure on consumer spending continues to weigh on the company’s near-term performance, the Fund’s long-term investment case remains intact. We believe Jubilant remains on track to build a business that will benefit from the long-term structural growth of the Indian quick service restaurant (QSR) industry. The company continues to invest in its business by building out its footprint and is on pace to open approximately 150 new stores per year for the foreseeable future.
During the past 12 months the following businesses were purchased: Amorepacific Corp., Bharat Forge Ltd., Britannia Industries Ltd., Ctrip.com International Ltd., Eicher Motors Ltd., IHH Healthcare Berhad, Medy-Tox Inc., SM Prime Holdings Inc.,Taiwan Semiconductor Manufacturing Co. Ltd. and Zee Entertainment Enterprises Ltd.
Amorepacific is the top cosmetic skincare business in Korea (based on sales) with a portfolio of 34 brands across a spectrum of price points, from mass market to prestige. Amorepacific’s continued innovation and delivery of high-quality products has helped it build consumer trust and strong brand equity, which we believe is its core competitive advantage. The company is leveraging its market-leading position in Korea to expand into China, where the cosmetics market is nearly triple the size and growing fast.
Bharat Forge is India’s largest metal forging company by capacity, with a global presence in the supply of forged and machined parts to original equipment manufacturers (OEMs) for commercial vehicles, personal vehicles and a range of non-auto verticals. Additionally, the company has made significant investments in its engineering capabilities over the past 10 years, allowing it to expand into higher margin non-auto industries, such as aerospace, rail, power, oil and gas, marine and mining. We believe the potential upside from market share gains in these new areas could be multiple times the size of its existing revenue base, providing a long tailwind for growth.
Britannia is the leading biscuit manufacturer in India with an estimated 35 percent market share. In India, biscuits are similar to cookies or crackers in the United States. The company is increasingly focused on the premium segment of the market. We believe Britannia will leverage its leadership position to achieve above-average growth by increasing penetration of its premium products and continuing to drive improved profitability. In our view, Britannia’s scale creates significant competitive advantages in terms of sourcing, manufacturing, selling and innovation.
Ctrip.com is the leading provider of online travel services in China based on gross merchandise value. Within China’s highly fragmented travel industry, the company plays an important role as an aggregator of availability information, pricing and reviews. We expect Ctrip.com to gain market share, particularly in hotels, due to its
Management’s Discussion of Fund Performance (Unaudited) (Continued)
leading position. Ctrip.com now owns stakes in both of its next closest competitors, which we believe will lessen the competitive intensity of the industry and facilitate increased pricing power and margin expansion.
Eicher Motors designs and manufactures Royal Enfield motorcycles, the leading mid-size motorcycle (200 to 800 cubic centimeter engines) brand in India. Royal Enfield is an iconic brand in India targeted toward the country’s growing middle class as an affordable luxury vehicle. The company’s brand awareness and reputation for quality have enabled it to capture over 90 percent of the mid-size motorcycle market.
IHH Healthcare is a leading premium hospital operator in Asia, with more than 6,000 licensed beds across Singapore, Malaysia and Turkey. The company focuses exclusively on the tertiary care market, which generally involves advanced procedures and complex treatments performed by highly-trained medical staff. Due to this specialized level of care, IHH benefits from reduced competitive intensity, and its revenue per patient is typically higher than hospitals that treat basic, primary care needs. IHH also treats a higher proportion of affluent and medical tourism patients who tend to be less price-sensitive. In addition, over the next three to five years, IHH plans to increase its number of beds by 50 percent, with expansion projects in both existing and new markets.
Medy-Tox is a South Korea-based biopharmaceutical company that develops and manufactures injectable products for aesthetic and therapeutic purposes. The company’s core products use botulinum bacteria, which temporarily relaxes the underlying muscle when injected beneath the skin. Medy-Tox primarily markets these products for the reduction of fine lines on the face, but there are expanding use cases in cosmetic treatments for the body, as well as medical indications.
SM Prime is the largest mall operator in the Philippines with 50 malls that have a cumulative gross square footage greater than its next two competitors combined. SM Prime pursues a mass-market strategy whereby they offer affordable shopping, quick-service restaurants, government services (e.g., driver’s licenses) and a variety of entertainment facilities. We believe this strategy is the key driver behind the company’s ability to garner over half of the average daily Philippine mall foot traffic.
Taiwan Semiconductor Manufacturing (TSMC) is the world’s largest outsourced semiconductor foundry for logic chips (as opposed to memory chips) based on production capacity. Its customers include vertically-integrated OEMs, as well as semiconductor companies that outsource their chip production. TSMC is the only large-scale, customer-dedicated foundry capable of producing leading-edge chips, which are the most advanced chips available in terms of the computing power. We believe TSMC is well-positioned within this leading-edge market.
Zee Entertainment is one of the largest pay-TV broadcasters in India with 33 channels that account for approximately 20 to 25 percent of the country’s viewership share. Zee’s content comprises all major genres, including movies, sports and general entertainment programming, both in Hindi and regional dialects. The company earns a majority of its revenue from subscriptions and advertising sales (about 40 and 50 percent, respectively).
During the period, we sold Jerónimo Martins SGPS SA, Kroton Educacional SA, LARGAN Precision Co. Ltd., Mindray Medical International Ltd., Multiplus SA, Odontoprev SA, Perusahaan Gas Negara Persero Tbk TP, Qunar Cayman Islands Ltd. and Unilever Indonesia Tbk TP.
Jerónimo Martins was sold because we believe the business is entering a sustained period of slower growth. Jerónimo operates the largest supermarket chain in Portugal (Pingo Doce), and the largest food retailer in Poland (Biedronka). Our investment case for Jerónimo is primarily dependent on growth of Biedronka stores in Poland. However, Jerónimo has reduced its guidance for Biedronka growth in Poland and, as a result, we believe the company is now on a structurally lower growth path.
Kroton Educacional remains a leading provider of post-secondary education in Brazil. However, the company was sold because we believe Brazil’s deepening recession is creating a meaningful headwind to its ability to grow at above-average rates, due to growing concerns about the ongoing viability of FIES, a Brazilian
Management’s Discussion of Fund Performance (Unaudited) (Continued)
government-sponsored student loan program and rising unemployment, which we believe poses a threat to Kroton on multiple fronts.
LARGAN Precision is a leading manufacturer of plastic camera lenses. Its products are used in smartphones, tablets, digital cameras, laptops and cars, however, the mobile device end-market is its largest source of revenue. As smartphones approach saturation levels worldwide, we expect slowing unit growth to negatively impact LARGAN. Given mounting headwinds, we believed it prudent to exit the investment in LARGAN.
Mindray Medical International was sold after the company received an offer from its co-founders and co-CEOs to buy out the company and take it private. The co-founders own the majority of Mindray’s voting shares so we do not expect any other buyer to bid for the company. We see little upside from here, and as such Mindray was sold to fund positions in other businesses that we believe are more attractive.
Multiplus was sold due to concerns around the sustainability of its growth prospects, the durability of its competitive advantage and the strength of its corporate governance. Our research indicates Brazil’s economy is stagnating and unlikely to reaccelerate without the implementation of major reforms. As long as Brazilian consumers remain constrained, we believe Multiplus’ ability to grow at above-average rates will be hampered.
The continued deterioration of Brazil’s macro environment led the decision to sell Odontoprev, the country’s largest provider of dental coverage for corporations, small businesses and individuals. An increasingly difficult operating environment has slowed the business’s growth, and we believe it is unlikely to re-accelerate over the Fund’s investment horizon.
Perusahaan Gas Negara (PGAS) was sold because we no longer believe it is capable of generating above-average growth over the Fund’s investment horizon. The primary driver of PGAS’s growth is increasing the volume of gas transmitted through its distribution network; our research indicates that volume growth will likely remain depressed over the next five years.
Qunar was sold because we believe the company’s growth potential has been meaningfully impaired. In October, 2015, Baidu Inc. (China’s leading search engine) and Ctrip.com (one of China’s leading online travel agencies) announced an agreement in which Baidu will swap almost all of its ownership of Qunar for a stake in and a strategic partnership with Ctrip.com. As such, we have concerns around what its influence could mean for Qunar’s future ability to take market share and grow at above-average rates.
Unilever Indonesia, one of Indonesia’s leading fast-moving consumer goods companies, was sold because of growing concerns around its macroeconomic environment and premium valuation. While Indonesia’s GDP is growing faster than many other emerging, as well as developed markets, it is decelerating on the margin. As growth has slowed, so has demand for Unilever Indonesia’s products.
Outlook
We seek businesses that are benefiting from structural local demand growth rather than export-driven business models, such as natural resource extraction or low-cost manufacturing. We believe local demand growth is more sustainable because in many developing countries, it is underpinned by long-term secular trends, including increasing productivity, growing discretionary incomes and attractive demographic profiles. When we combine this backdrop with our criteria-driven research, we find growth businesses primarily in the Information Technology, Consumer, and Health Care sectors, as well as companies that are building the needed infrastructure to improve productivity and support growth.
We continue to view emerging markets as an attractive area for long-term investors and believe the Touchstone Sands Capital Emerging Markets Growth Fund is well positioned to weather the current environment. Emerging markets have certain attributes that developed markets generally do not, including growing middle classes, increasing demand for healthcare services and expansion of infrastructure that we believe can create attractive
Management’s Discussion of Fund Performance (Unaudited) (Continued)
areas for investment. Through our in-depth research, we have selected a group of businesses that we believe can sustain above-average growth through a combination of business-specific drivers and powerful secular tailwinds.
As the rising tides that lifted most emerging markets in the past may be turning, we remain business-focused and macro-aware. We believe the current macro-driven uncertainties actually help re-emphasize the benefits of thoroughly understanding individual companies and regions. Because the only certainty in emerging markets might be the constant of change, we expect that selectively owning the right businesses and effectively managing the Fund’s sector and geographic positioning will be the main drivers of our ability to add value with prudence over time.
Comparison of the Change in Value of a $10,000 Investment in the Touchstone Sands Capital Emerging Markets Growth Fund - Class Y* and the MSCI Emerging Markets Index
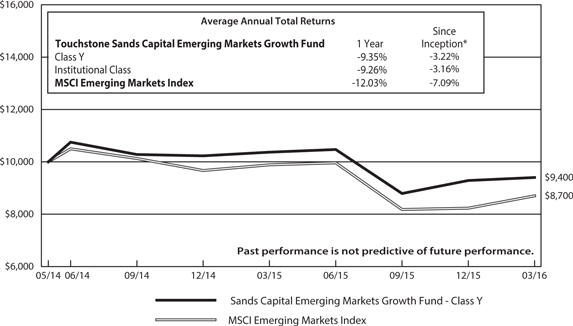
| * | The chart above represents performance of Class Y shares only, which will vary from the performance of Institutional Class shares based on the fees paid by shareholders in the different classes. The inception date of the Fund was May 9, 2014. The returns of the index listed above are based on the inception date of the Fund. |
The performance of the above Fund does not reflect the deduction of taxes that a shareholder would pay on Fund distributions or the redemption of Fund shares.
Note to Chart
MSCI Emerging Markets Index is a free float-adjusted market capitalization index that is designed to measure equity market performance of emerging markets.
MSCI makes no express or implied warranties or representations and shall have no liability whatsoever with respect to any MSCI data contained herein. The MSCI data may not be further redistributed or used to create indices or financial products. This report is not approved or produced by MSCI.
Management’s Discussion of Fund Performance (Unaudited)
Touchstone Small Cap Growth Fund
Sub-Advised by Apex Capital Management, Inc.
Investment Philosophy
The Touchstone Small Cap Growth Fund invests in a diversified portfolio of common stocks of small-cap growth-oriented companies that are selected for their long-term capital appreciation potential and which are expected to grow faster than the U.S. economy. The core investments of the portfolio include “established growth” companies which typically provide more stability and consistency in volatile markets. The balance of the portfolio is invested in “emerging growth” companies which typically exhibit more aggressive growth characteristics and may experience positive transformation or a favorable catalyst impacting their long-term growth potential. Fund management uses an approach that combines top-down secular/macro-economic theme analysis with bottom-up security selection.
Fund Performance
The Touchstone Small Cap Growth Fund (Class A Shares) outperformed its benchmark, the Russell 2000® Growth Index, for the 12-month period ended March 31, 2016. The Fund’s total return was -11.68 percent (calculated excluding maximum sales charge), while the total return of the benchmark was -11.84 percent.
Market Environment
During the 12 months ended March 31, 2016, U.S. equity markets were extremely volatile. The cause of market volatility was multi-faceted and varied by sector and quarter, but primary drivers included fears of the U.S. Federal Reserve Board (Fed) raising interest rates, the economic slowdown in China, a lack of capital spending by corporations and concerns of potential price caps on pharmaceutical companies. After steadily appreciating from April through July, equity markets suffered a sharp pullback in the third quarter of 2015, only to bounce back again in the fourth quarter with strong gains. The start of 2016 again saw a resumption of global growth fears and a sell-off in equities. Once more, the market rebounded as investor sentiment turned positive.
Portfolio Review
During the period, worries about a potential global recession and tepid growth in the U.S. brought a shift to larger cap stocks. Fundamentals and quality companies became a point of emphasis for investors, which provided a tailwind for the Fund. Though stock selection drove the Fund’s outperformance, advantageous positioning within sectors also contributed. For example, a large underweight was maintained in the Biotechnology industry based on what appeared to be high valuations. This positioning was rewarded, as biotech stocks sold-off sharply during the period. The Fund was also underweight to the Industrials sector based on our belief that fiscal concerns would limit infrastructure spending. While underweighting Industrials benefited Fund performance for much of the year, the sector rebounded strongly in the first quarter of 2016, which detracted from relative performance for the overall period. A similar narrative played out in the Materials sector, which also detracted from relative performance. We do not believe that Industrials and Materials stocks can maintain the performance witnessed in early 2016 given the lack of capital expenditures by both corporations and governments.
During the 12-month period the Fund benefited from its positions in the Health Care and Information Technology sectors. Strong stock selection in both sectors contributed to Fund performance relative to its benchmark. Within the Health Care sector, Abiomed Inc., maker of the world’s smallest heart pump, was a strong performer. Similarly, DexCom Inc. also generated strong returns and contributed to performance. DexCom is a medical device company that specializes in glucose monitoring and has produced a continuous glucose monitoring system that is used in a hospital setting and by individuals. DexCom and Abiomed both accomplished strong returns during a period when the overall Health Care sector experienced double-digit losses.
Management’s Discussion of Fund Performance (Unaudited) (Continued)
Information Technology stocks also contributed to Fund performance. Payment processor Heartland Payment Systems Inc. was acquired by Global Payments Inc. at a premium to its market value at the time of the approach. The position was sold after the stock jumped to reflect the acquisition offer. Our emphasis on the secular growth theme of Payment Processing was realized as Euronet Worldwide Inc. and Green Dot Corp. also contributed to performance. Despite suffering a decline following an earnings miss in the fourth quarter of 2015, Consumer Discretionary stock Skechers USA Inc. still managed to contribute to relative performance for the 12-month period overall.
In the Consumer Discretionary sector, Restoration Hardware Holdings Inc., detracted from performance. The company suffered in the latter half of the period due to missed earnings estimates and lowered guidance. The company also struggled with supply chain issues surrounding their best-selling RH Modern line. The products were more successful than anticipated with consumers and the high demand overwhelmed Restoration Hardware’s supply chain, which resulted in shortages and an inability to stock enough merchandise. We believe these issues are close to resolution and that demand for the RH Modern line will remain high, justifying the continued position in the stock. Materials stock Kapstone Paper and Packaging Corp. also performed poorly, as the stronger U.S. dollar reduced revenues and margins. Selling prices decreased, while the company’s input costs grew due to increases in the price of wood fiber. In the Industrials sector, Astronics Corp. and Caesarstone Sdot-Yam Ltd. detracted from relative performance as both companies lowered 2016 guidance.
Outlook
There has been substantial volatility in the markets thus far in 2016, and we would not be surprised should that trend continue for the remainder of the year. Concerns remain of a global slowdown in economic growth. Given the anemic growth in sales, there are additional questions about the ability of companies to sustain current profit margins and drive future earnings growth. However, the U.S economy has shown improvement and resiliency with strength showing up in improving home prices, employment and consumer sentiment. We continue to believe in the strength of the U.S. economy which has benefited the consumer.
New business models and disruptive technologies have continued to transform the competitive landscape, and we believe the Fund is well positioned to take advantage of these changes. Perhaps as importantly, high valuations (particularly in the biotech and cloud computing space) have come down and price multiples are at more reasonable levels. We continue to look for opportunities to add to some of these sectors where growth appears to be available at more sensible prices.
We continue to focus on the long-term sustainability of secular growth trends. During challenging times, we remain committed to the opportunities provided in such areas as consumer mobility, big data and cloud computing, personalized medicine and genomics and to the benefits of declining energy prices. As we navigate through the early stages of the self-sustaining U.S. economy coupled with global growth anxieties, we will continue to put emphasis on selective opportunities at sensible prices that could benefit the Fund in this environment.
Management’s Discussion of Fund Performance (Unaudited) (Continued)
Comparison of the Change in Value of a $10,000 Investment in the Touchstone Small Cap Growth Fund - Class A* and the Russell 2000® Growth Index
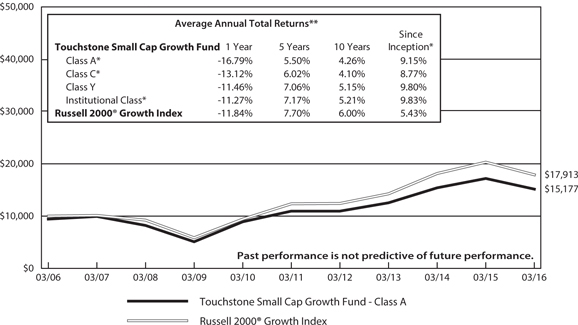
| * | The chart above represents performance of Class A shares only, which will vary from the performance of Class C shares, Class Y shares and Institutional Class shares based on the differences in sales loads and fees paid by shareholders in the different classes. The inception date of Class A shares, Class C shares, Class Y shares and Institutional Class shares was August 13, 2001, August 13, 2001, February 1, 1998 and September 10, 2012, respectively. Class A shares, Class C shares and Institutional Class shares performance information was calculated using the historical performance of Class Y shares for periods prior to August 13, 2001, August 13, 2001 and September 10, 2012, respectively. The returns have been restated for sales loads and fees applicable to Class A, Class C and Institutional Class shares. The returns of the index listed above are based on the inception date of the Fund. |
| ** | The average annual total returns shown above are adjusted for maximum sales loads and fees, if applicable. The maximum offering price per share of Class A shares is equal to the net asset value (“NAV”) per share plus a sales load equal to 6.10% of the NAV (or 5.75% of the offering price). Class C shares are subject to a contingent deferred sales charge (“CDSC”) of 1.00%. The CDSC will be assessed on an amount equal to the lesser of (1) the NAV at the time of purchase of the shares being redeemed or (2) the NAV of such shares being redeemed, if redeemed within a one-year period from date of purchase. Class Y shares and Institutional Class shares are not subject to sales charges. |
The performance of the above Fund does not reflect the deduction of taxes that a shareholder would pay on Fund distributions or the redemption of Fund shares.
Notes to Chart
Russell 2000® Growth Index measures the performance of those Russell 2000® companies with higher price-to-book ratios and higher forecasted growth values.
The Frank Russell Company (FRC) is the source and owner of the Index data contained or reflected in this material and all trademarks and copyrights related thereto. The material may contain confidential information and unauthorized use, disclosure, copying, dissemination or redistribution is strictly prohibited. This is a Touchstone Investments presentation of the data, and FRC is not responsible for the formatting or configuration of this material or for any inaccuracy in the presentation thereof.
Management’s Discussion of Fund Performance (Unaudited)
Touchstone Sustainability and Impact Equity Fund
Sub-Advised by Rockefeller & Co., Inc.
On May 4, 2015, Rockefeller was appointed sub-advisor to the Touchstone Large Cap Growth Fund. Concurrent with this change, the Fund was renamed the Touchstone Sustainability and Impact Equity Fund and its Principal Investment Strategies, Principal Risks and benchmark index were changed.
Investment Philosophy
The Touchstone Sustainability and Impact Equity Fund seeks long-term growth of capital. The Fund primarily invests in equity securities of U.S. and non-U.S. companies and generally focuses on larger, more established companies. The Fund selects investments based on an evaluation of a company’s sustainability and impact practices which considers and analyzes the potential environmental, social and governance impacts and risks of a company, how well the company manages these impacts and risks and ascertains the company’s willingness and ability to take a leadership position in implementing best practices.
Fund Performance
The Touchstone Sustainability and Impact Equity Fund (Class A Shares) under performed both its new benchmark, the MSCI All Country World Index and its old benchmark, the Russell 1000® Growth Index, for the 12 - month period ended March 31, 2016. The Fund’s total return was -8.73 percent (calculated excluding the maximum sales charge), while the total return of the MSCI All Country World Index was -4.34 percent and the total return of the Russell 1000® Growth Index was 2.52 percent.
Market Environment
On May 4, 2015, Rockefeller & Co. took over management of the Fund. Shortly thereafter, global equity markets, as measured by the MSCI All Country World Index, reached a post-Great Financial Crisis peak on May 21, 2015. Since that point, markets have zigzagged lower due to a number of macro challenges.
China became a source of concern for global investors during the summer of 2015. From its peak in early June to late August 2015, the Shanghai Stock Exchange Composite Index declined in spite of serious market support measures by the government. Various economic indicators also started to indicate that growth was slowing in the world’s second largest economy. The negative spillover effects from China were initially limited to emerging markets. However, in August, the People’s Bank of China (PBC) surprised the world by devaluing the renminbi vs. the U.S. dollar, the first official devaluation in over two decades. This move sent shock waves across global markets as it introduced the potential for a global currency war. Global markets were hit with another wave of correction at the start of 2016, as China’s foreign exchange reserves experienced several months of sizeable decline, signaling further devaluation pressure on its currency.
The Bank of Japan’s (BOJ) surprise move to implement negative interest rates was also poorly received by investors, as it raised concerns about the ability of the banking system to maintain its profitability levels. The sell-off briefly took the MSCI All Country Word Index to bear market territory. Crude oil prices also continued their collapse to reach the mid-$20s per barrel, leading many to re-examine the assumption that low oil prices are a net benefit to the global economy. However, on February 12, 2016, crude oil prices found a bottom and began to rebound. A rally in the equity markets ensued. The rebound in stock prices was further fueled by the European Central Bank’s (ECB) expanded quantitative easing (QE) program, which was increased to allow corporate bond purchases.
Amid significant market volatility in the third quarter of 2015, the U.S. Federal Reserve Board (Fed) chose to push back to December an interest rate hike that had been widely anticipated by investors. However, by that time, financial conditions had already tightened substantially. Corporate bond spreads were widening as falling
Management’s Discussion of Fund Performance (Unaudited) (Continued)
oil prices had raised the default risk for many energy companies. The strengthening U.S. dollar was also pressuring U.S. exports. The Fed also reduced its guidance from an expectation of four interest rate hikes in 2016 to the more dovish guidance for just two upward moves. Fed Chair Yellen repeatedly mentioned uncertainty over the global economic outlook as the reason for renewed caution on policy normalization.
Sharp currency movements also had a significant impact on financial markets. The U.S. dollar began to weaken in late January as investors anticipated the more dovish Fed stance. The greenback’s newfound weakness, however, helped to alleviate the devaluation pressure on the Chinese renminbi. The downward movement in the dollar also triggered a rally in emerging market currencies and asset prices, as it made it easier for emerging market debtors to service their U.S. dollar-denominated debt. Among the ten MSCI industry sectors, Energy and Materials were unsurprisingly the biggest laggards. Consumer Staples and Utilities were the best performing sectors given their relatively defensive characteristics.
Portfolio Review
The Fund’s holdings in the Information Technology sector contributed to relative returns. While strength was evident across the sector, the Fund’s largest contributors were clustered in the mega cap space. Alphabet Inc. was the largest contributor from the sector, while Microsoft Corp., Apple Inc. and Visa Inc. also provided strong contribution to relative returns.
Flattening yield curves around the world pressured banks’ net interest margins and pushed the Financial Services sector to negative returns. The Financials sector was the third-worst performing during the period. In this difficult environment for the sector, the Fund’s holdings declined less than those of the benchmark, which contributed to positive relative performance. Notable outperformers included Annaly Capital Management Inc., Reinsurance Group of America Inc. and Aflac Inc.
The Health Care sector has been a consistent outperformer for several years, and we expected its defensive characteristics with less economic sensitivity to make it an outperformer in an environment of macro uncertainties. However, the sector underperformed during the first calendar quarter of 2016, as the front-runners in both the Republican and Democratic parties’ presidential race supported rather tough political rhetoric against the industry. Biotechnology stocks, the darling of investors for much of the last five years, also experienced a valuation contraction. The Fund’s holdings in the sector detracted from relative results during the 12-month period.
The Fund continues to maintain an overweight to the Health Care sector as we believe the sector’s longer-term prospects remain solid while the valuations are attractive, especially compared to other defensive sectors. The Fund has scaled back its exposure to biotechnology, and increased its holdings in medical technology. Among the Fund’s Health Care holdings, Mallinckrodt PLC and Novartis AG were the largest detractors to performance. Mallinckrodt PLC’s sell-off can be attributed to the sector wide valuation contraction triggered by Valeant Pharmaceuticals International Inc.s’ high profile accounting issues. We continue to view Mallinckrodt as an undervalued stock, a view shared by management given their recently expanded share repurchase program. Novartis has been an underperformer since mid-2015, but we believe the turnaround in its Alcon division should be a catalyst for outperformance going forward. Given our positive outlook for both stocks, the Fund remains invested in them.
Rather than poor stock selection, the Fund’s underperformance in the Consumer Staples sector was mostly due to its sizeable underweight to what turned out to be the best performing sector during the period. We believe investors have been overpaying for the sector’s safety and that its valuation appears rather rich relative to other defensive sectors. Given the lack of compelling valuations, we remain underweight in the sector.
Due to our concern over the slowing global growth prospect and our expectation for more dovish monetary policies, the Fund has been gradually increasing its exposure to less economically sensitive sectors since August 2015, including Telecommunication Services and Utilities. In addition, we continue to opportunistically evaluate
Management’s Discussion of Fund Performance (Unaudited) (Continued)
“fallen angels” that have sold off due to issues that we believe to be temporary. For example, the Fund added Apple Inc. and Shire PLC on these stocks’ recent pullback in early 2016.
Outlook
Markets are grappling with a number of macro uncertainties, unconventional monetary policies (e.g., impact of negative interest rate policy), the Fed’s policy stance (hawkish or dovish) and the lack of clear global growth catalysts. On the earnings front, we expect corporate earnings growth in 2016 to remain subdued, but potentially re-accelerate in 2017 if commodity prices bottom out and create easier year-over-year comparison. Such an environment is likely to lead to higher market volatility that could open up potential investments for opportunistic investors. For example, we believe that the recent underperformance in Health Care stocks due to populist rhetoric against drug companies in the U.S. election season should be viewed as a potential opportunity for patient long-term investors. We believe the equity markets are likely to be range-bound in the near term as markets grapple with the aforementioned issues. We believe low interest rates and the continued easing stance of most major central banks should offer support to equities on pull-backs. However, the lack of clear growth drivers and macro uncertainties are likely to cap the upside. In the event corporate earnings growth starts to turn positive by the second half of the year, we believe an upward trend could resume.
Consistent with this macro view, we have positioned the Fund for an environment of subdued economic growth with highly accommodative monetary policies. Such an environment tends to make companies that have free-cash-flow and dividend growth more attractive. Accordingly, the Fund has increased its exposure to income-producing stocks as well as companies that tend to experience less economic sensitivity. We seek to be opportunistic in picking up shares of companies that have come under heavy selling pressure due to either broader market dislocation or company-specific issues that we believe are only temporary in nature.
Management’s Discussion of Fund Performance (Unaudited) (Continued)
Comparison of the Change in Value of a $10,000 Investment in the
Touchstone Sustainability and Impact Equity Fund - Class A* the MSCI All Country World Index and the Russell 1000® Growth Index

| * | The chart above represents performance of Class A shares only, which will vary from the performance of Class B shares, Class C shares, Class Y shares and Institutional Class shares based on the differences in sales loads and fees paid by shareholders in the different classes. The inception date of Class A shares, Class B shares, Class C shares, Class Y shares and Institutional Class shares was December 19, 1997, October 4, 2003, October 4, 2003, November 10, 2004 and May 4, 2015, respectively. Class B shares, Class C shares, Class Y shares and Institutional Class shares performance information was calculated using the historical performance of Class A shares for periods prior to October 4, 2003, October 4, 2003, November 10, 2004 and May 4, 2015, respectively. The returns have been restated for sales loads and fees applicable to Class B, Class C, Class Y and Institutional Class shares . The returns of the indexes listed above are based on the inception date of the Fund. |
| ** | The average annual total returns shown above are adjusted for maximum sales loads and fees, if applicable. The maximum offering price per share of Class A shares is equal to the net asset value (“NAV”) per share plus a sales load equal to 6.10% of the NAV (or 5.75% of the offering price). Class B shares are subject to a contingent deferred sales charge (“CDSC”) of 5.00% in the event of a shareholder redemption within a one-year period of purchase. The CDSC will be incrementally reduced over time. After the 6th year, there is no CDSC. Class C shares are subject to a CDSC of 1.00%. The CDSC will be assessed on an amount equal to the lesser of (1) the NAV at the time of purchase of the shares being redeemed or (2) the NAV of such shares being redeemed, if redeemed within a one-year period from date of purchase. Class Y shares and Institutional Class shares are not subject to sales charges. |
The performance of the above Fund does not reflect the deduction of taxes that a shareholder would pay on Fund distributions or the redemption of Fund shares.
Notes to Chart
MSCI All Country World Index measures the equity market performance of developed and emerging markets.
Russell 1000® Growth Index measures the performance of those Russell 1000® companies with higher price-to-book ratios and higher forecasted growth values.
The Frank Russell Company (FRC) is the source and owner of the Russell 1000® Growth Index data contained or reflected in this material and all trademarks and copyrights related thereto. The material may contain confidential information and unauthorized use, disclosure, copying, dissemination or redistribution is strictly prohibited. This is a Touchstone Investments presentation of the data, and FRC is not responsible for the formatting or configuration of this material or for any inaccuracy in the presentation thereof.
MSCI makes no express or implied warranties or representations and shall have no liability whatsoever with respect to any MSCI data contained herein. The MSCI data may not be further redistributed or used to create indices or financial products. This report is not approved or produced by MSCI.
Tabular Presentation of Portfolios of Investments (Unaudited)
March 31, 2016
The tables below provide each Fund’s geographic allocation, sector allocation and/or credit quality. We hope it will be useful to shareholders as it summarizes key information about each Fund’s investments.
| Touchstone Flexible Income Fund |
| Credit Quality* | | | (% of Fixed Income Securities) | |
| AAA/Aaa | | | 59.9% | |
| AA/Aa | | | 6.9 | |
| A/A | | | 10.5 | |
| BBB/Baa | | | 13.3 | |
| BB/Ba | | | 5.8 | |
| B/B | | | 1.7 | |
| Not Rated | | | 1.9 | |
| | | | 100.0 | % |
| | | | | |
| Credit Quality* | | | (% of Preferred Stocks) | |
| A/A | | | 15.2 | % |
| BBB/Baa | | | 53.0 | |
| BB/Ba | | | 21.7 | |
| B/B | | | 2.3 | |
| Not Rated | | | 7.8 | |
| | | | 100.0 | % |
| | | | | |
| Sector Allocation** | | | (% of Net Assets) | |
| Fixed Income Securities | | | 78.5 | % |
| Preferred Stocks | | | 13.1 | |
| Investment Funds | | | 8.1 | |
| Common Stocks | | | | |
| Financials | | | 2.0 | |
| Industrials | | | 0.3 | |
| Exchange Traded Fund | | | 1.8 | |
| Purchased Call Option | | | 0.0 | |
| Other Assets/Liabilities (Net) | | | (3.8 | ) |
| Total | | | 100.0 | % |
| Touchstone Focused Fund |
| Sector Allocation** | | | (% of Net Assets) | |
| Information Technology | | | 20.2 | % |
| Health Care | | | 14.8 | |
| Financials | | | 13.8 | |
| Consumer Discretionary | | | 11.6 | |
| Consumer Staples | | | 9.2 | |
| Industrials | | | 8.9 | |
| Energy | | | 6.5 | |
| Materials | | | 4.1 | |
| Telecommunication Services | | | 2.3 | |
| Investment Funds | | | 9.8 | |
| Other Assets/Liabilities (Net) | | | (1.2 | ) |
| Total | | | 100.0 | % |
| Touchstone Growth Opportunities Fund |
| Sector Allocation** | | | (% of Net Assets) | |
| Information Technology | | | 31.5 | % |
| Consumer Discretionary | | | 19.4 | |
| Health Care | | | 15.0 | |
| Industrials | | | 11.8 | |
| Consumer Staples | | | 7.4 | |
| Financials | | | 5.7 | |
| Materials | | | 3.6 | |
| Energy | | | 2.2 | |
| Investment Funds | | | 8.0 | |
| Other Assets/Liabilities (Net) | | | (4.6 | ) |
| Total | | | 100.0 | % |
| * | | Credit quality ratings are from Standard & Poor’s (“S&P”) and Moody’s Investors Service (“Moody’s”). If agency ratings differ, the higher rating will be used. Where no rating has been assigned, it may be for reasons unrelated to the creditworthiness of the issuer. |
| ** | | Sector classifications are based upon the Global Industry Classification Standard (GICS®). |
Tabular Presentation of Portfolios of Investments (Unaudited) (Continued)
| Touchstone International Value Fund |
| Geographic Allocation | | (% of Net Assets) | |
| Common Stocks | | | |
| United Kingdom | | 22.7 | % |
| Netherlands | | 13.6 | |
| Japan | | 12.2 | |
| Switzerland | | 8.0 | |
| France | | 6.7 | |
| Singapore | | 4.9 | |
| Spain | | 3.3 | |
| Denmark | | 3.1 | |
| South Korea | | 3.0 | |
| Germany | | 3.0 | |
| Ireland | | 3.0 | |
| Israel | | 2.5 | |
| Austria | | 2.3 | |
| Thailand | | 2.1 | |
| Italy | | 2.0 | |
| Norway | | 1.9 | |
| Brazil | | 1.8 | |
| Hong Kong | | 0.9 | |
| United States | | 0.8 | |
| Indonesia | | 0.5 | |
| Rights | | 0.2 | |
| Investment Fund | | 2.2 | |
| Other Assets/Liabilities (Net) | | (0.7 | ) |
| Total | | 100.0 | % |
| Touchstone Mid Cap Growth Fund |
| Sector Allocation* | | (% of Net Assets) | |
| Consumer Discretionary | | 20.6 | % |
| Industrials | | 17.1 | |
| Information Technology | | 16.4 | |
| Health Care | | 16.3 | |
| Financials | | 10.8 | |
| Materials | | 8.0 | |
| Consumer Staples | | 4.3 | |
| Energy | | 3.4 | |
| Investment Funds | | 5.4 | |
| Other Assets/Liabilities (Net) | | (2.3 | ) |
| Total | | 100.0 | % |
| * | | Sector classifications are based upon the Global Industry Classification Standard (GICS®). |
Tabular Presentation of Portfolios of Investments (Unaudited) (Continued)
| Touchstone Sands Capital Emerging Markets Growth Fund |
| Geographic Allocation | | (% of Net Assets) | |
| Common Stocks | | | |
| Cayman Islands | | 19.5 | % |
| South Africa | | 6.4 | |
| Brazil | | 5.2 | |
| South Korea | | 4.3 | |
| Philippines | | 4.0 | |
| Indonesia | | 3.8 | |
| Thailand | | 3.2 | |
| China | | 3.0 | |
| United States | | 2.8 | |
| United Kingdom | | 2.8 | |
| Peru | | 2.4 | |
| Turkey | | 2.1 | |
| Taiwan | | 1.8 | |
| Virgin Islands (British) | | 1.8 | |
| Russia | | 1.8 | |
| Malaysia | | 1.7 | |
| Low Exercise Price | | | |
| Warrants | | | |
| India | | 27.2 | |
| Saudi Arabia | | 2.0 | |
| Investment Funds | | 8.0 | |
| Other Assets/Liabilities (Net) | | (3.8 | ) |
| Total | | 100.0 | % |
| Touchstone Small Cap Growth Fund |
| Sector Allocation* | | (% of Net Assets) | |
| Information Technology | | 26.2 | % |
| Health Care | | 25.7 | |
| Consumer Discretionary | | 19.1 | |
| Industrials | | 9.7 | |
| Financials | | 9.5 | |
| Energy | | 3.5 | |
| Consumer Staples | | 3.3 | |
| Materials | | 2.0 | |
| Investment Funds | | 8.8 | |
| Other Assets/Liabilities (Net) | | (7.8 | ) |
| Total | | 100.0 | % |
| Touchstone Sustainability and Impact Equity Fund |
| Geographic Allocation | | (% of Net Assets) | |
| Common Stocks | | | |
| United States | | 58.0 | % |
| Japan | | 10.4 | |
| United Kingdom | | 9.5 | |
| Netherlands | | 3.6 | |
| Germany | | 3.3 | |
| Switzerland | | 3.0 | |
| China | | 2.4 | |
| France | | 2.1 | |
| Ireland | | 2.0 | |
| Sweden | | 1.3 | |
| Indonesia | | 0.7 | |
| South Korea | | 0.3 | |
| Investment Fund | | 3.2 | |
| Other Assets/Liabilities (Net) | | 0.2 | |
| Total | | 100.0 | % |
| * | | Sector classifications are based upon the Global Industry Classification Standard (GICS®). |
Portfolio of Investments
Touchstone Flexible Income Fund – March 31, 2016
| Principal | | | | | Market | |
| Amount(A) | | | | | Value | |
| | | | | | | | | |
| | | | | Corporate Bonds — 39.7% | | | | |
| | | | | | | | | |
| | | | | Financials — 27.1% | | | | |
| $ | 1,425,000 | | | Aflac, Inc., 3.250%, 3/17/25 | | $ | 1,436,704 | |
| | 2,000,000 | | | Allstate Corp. (The), 5.750%, 8/15/53(B) | | | 2,032,500 | |
| | 375,000 | | | American Financial Group, Inc., 9.875%, 6/15/19 | | | 452,797 | |
| | 1,200,000 | | | American Tower Corp., REIT, 4.500%, 1/15/18 | | | 1,250,398 | |
| | 3,480,000 | | | Bank of New York Mellon Corp. (The), Ser E, 4.950%, 12/29/49(B)(C) | | | 3,475,650 | |
| | 955,000 | | | Berkshire Hathaway, Inc., 3.125%, 3/15/26 | | | 979,205 | |
| | 6,850,000 | | | Capital One Financial Corp., Ser E, 5.550%, 12/29/49(B)(C) | | | 6,850,000 | |
| | 2,350,000 | | | Charles Schwab Corp. (The), 7.000%, 2/28/49(B)(C) | | | 2,679,000 | |
| | 4,000,000 | | | Citigroup, Inc., 6.125%, 12/29/49(B)(C) | | | 4,009,880 | |
| | 6,849,000 | | | Citigroup, Inc., Ser Q, 5.950%, 12/29/49(B)(C) | | | 6,554,493 | |
| | 1,000,000 | | | Compass Bank, 3.875%, 4/10/25 | | | 937,912 | |
| | 4,000,000 | | | Credit Agricole SA, 144a, 8.125%, 12/29/49(B)(C) | | | 3,990,320 | |
| | 1,000,000 | | | CubeSmart LP, REIT, 4.000%, 11/15/25 | | | 1,022,804 | |
| | 2,101,000 | | | DDR Corp., MTN REIT, 7.500%, 7/15/18 | | | 2,323,090 | |
| | 1,388,876 | | | Doric Nimrod Air Finance Alpha Ltd. 2012-1 Class B Pass Through Trust, 144a, 6.500%, 5/30/21 | | | 1,397,613 | |
| | 785,000 | | | Essex Portfolio LP, REIT, 3.500%, 4/1/25 | | | 784,706 | |
| | 1,500,000 | | | Federal Home Loan Mortgage Corp., 2.375%, 1/13/22 | | | 1,572,564 | |
| | 4,285,000 | | | Ford Motor Credit Co. LLC MTN, 4.389%, 1/8/26 | | | 4,538,368 | |
| | 10,067,000 | | | Goldman Sachs Group, Inc. (The), Ser L, 5.700%, 12/29/49(B)(C) | | | 9,840,492 | |
| | 3,000,000 | | | HSBC Holdings PLC, 6.375%, 12/29/49(B)(C)† | | | 2,835,000 | |
| | 5,700,000 | | | ING Groep N.V., 6.000%, 12/29/49(B)(C) | | | 5,333,062 | |
| | 10,516,000 | | | JPMorgan Chase & Co., Ser Z, 5.300%, 12/29/49,(B)(C) | | | 10,542,290 | |
| | 5,200,000 | | | Lloyds Banking Group PLC, 7.500%, 12/29/49(B)(C) | | | 5,147,480 | |
| | 2,750,000 | | | M&T Bank Corp., Ser E, 6.450%, 12/29/49(B)(C) | | | 2,949,375 | |
| | 5,430,000 | | | MetLife, Inc., Ser C, 5.250%, 12/29/49,(B)(C) | | | 5,189,044 | |
| | 2,850,000 | | | MGIC Investment Corp., 144a, 9.000%, 4/1/63 | | | 3,250,781 | |
| | 2,437,000 | | | Morgan Stanley, Ser J, 5.550%, 12/29/49(B)(C) | | | 2,402,273 | |
| | 500,000 | | | Nippon Life Insurance Co., 144a, 4.700%, 1/20/46(B) | | | 520,625 | |
| | 2,350,000 | | | Nippon Life Insurance Co., 144a, 5.100%, 10/16/44(B) | | | 2,508,625 | |
| | 7,063,000 | | | PNC Financial Services Group, Inc., 6.750%, 7/29/49(B)(C) | | | 7,724,450 | |
| 2,350,000 | | | Prudential Financial, Inc., 5.875%, 9/15/42(B) | | | 2,455,750 | |
| | 5,450,000 | | | Royal Bank of Scotland Group PLC, 7.500%, 12/29/49(B)(C) | | | 5,068,500 | |
| | 7,624,000 | | | SunTrust Banks, Inc., 5.625%, 12/29/49(B)(C)† | | | 7,547,760 | |
| | 3,500,000 | | | UBS Group AG, 7.125%, 12/29/49(B)(C) | | | 3,538,500 | |
| | 8,500,000 | | | US Bancorp, Ser I, 5.125%, 12/29/49(B)(C) | | | 8,659,800 | |
| | 9,765,000 | | | Wells Fargo & Co., Ser K, 7.980%, 3/29/49(B)(C) | | | 10,105,798 | |
| | 343,000 | | | Zions Bancorporation, 5.800%, 12/29/49(B)(C) | | | 325,850 | |
| | 4,870,000 | | | Zions Bancorporation, Ser J, 7.200%, 9/29/49(B)(C) | | | 4,979,575 | |
| | | | | | | | 147,213,034 | |
| | | | | | | | | |
| | | | | Industrials — 7.1% | | | | |
| | 606,090 | | | Air Canada 2013-1 Class A Pass Through Trust, 144a, 4.125%, 5/15/25 | | | 615,181 | |
| | 2,745,000 | | | Asciano Finance Ltd., 144a, 5.000%, 4/7/18 | | | 2,792,700 | |
| | 2,758,187 | | | Continental Airlines 2012-2 Class A Pass Through Trust, 4.000%, 10/29/24 | | | 2,840,932 | |
| | 885,360 | | | Delta Air Lines 2002-1 Class G-1 Pass Through Trust, 6.718%, 1/2/23 | | | 1,004,884 | |
| | 13,460,000 | | | General Electric Co., 5.000%, 12/29/49(B)(C) | | | 13,863,800 | |
| | 2,934,745 | | | Hawaiian Airlines 2013-1 Class A Pass Through Certificates, 3.900%, 1/15/26 | | | 2,846,703 | |
| | 3,180,000 | | | Owens Corning, 4.200%, 12/15/22 | | | 3,222,701 | |
| | 8,320,000 | | | Stanley Black & Decker, Inc., 5.750%, 12/15/53(B) | | | 8,736,000 | |
| | 2,603,528 | | | US Airways 2012-2 Class A Pass Through Trust, 4.625%, 6/3/25 | | | 2,758,126 | |
| | | | | | | | 38,681,027 | |
| | | | | | | | | |
| | | | | Consumer Discretionary — 2.1% | | | | |
| | 1,835,000 | | | Harley-Davidson, Inc., 3.500%, 7/28/25 | | | 1,906,824 | |
| | 2,000,000 | | | Home Depot, Inc. (The), 4.200%, 4/1/43 | | | 2,148,360 | |
| | 700,000 | | | Interpublic Group of Cos., Inc. (The), 3.750%, 2/15/23 | | | 691,090 | |
| | 3,185,000 | | | Time Warner, Inc., 3.875%, 1/15/26 | | | 3,340,129 | |
| | 3,535,000 | | | Toll Brothers Finance Corp., 4.375%, 4/15/23 | | | 3,455,462 | |
| | | | | | | | 11,541,865 | |
| | | | | | | | | |
| | | | | Energy — 1.3% | | | | |
| | 2,255,000 | | | EOG Resources, Inc., 2.625%, 3/15/23 | | | 2,136,822 | |
| | 4,825,000 | | | Exxon Mobil Corp., 2.709%, 3/6/25 | | | 4,852,025 | |
| | | | | | | | 6,988,847 | |
Touchstone Flexible Income Fund (Continued)
| Principal | | | | | Market | |
| Amount(A) | | | | | Value | |
| | | | | | | | | |
| | | | | Corporate Bonds — 39.7% (Continued) | | | | |
| | | | | | | | | |
| | | | | Information Technology — 0.7% | | | | |
| $ | 2,500,000 | | | Altera Corp., 2.500%, 11/15/18 | | $ | 2,571,198 | |
| | 1,200,000 | | | Microsoft Corp., 4.450%, 11/3/45 | | | 1,330,999 | |
| | | | | | | | 3,902,197 | |
| | | | | | | | | |
| | | | | Utilities — 0.6% | | | | |
| | 1,590,000 | | | Duke Energy Progress LLC, 4.200%, 8/15/45 | | | 1,686,626 | |
| | 1,850,000 | | | NextEra Energy Capital Holdings, Inc., 6.650%, 6/15/67(B) | | | 1,433,750 | |
| | | | | | | | 3,120,376 | |
| | | | | | | | | |
| | | | | Technology — 0.5% | | | | |
| | 2,725,000 | | | NXP BV, 144a, 4.125%, 6/15/20 | | | 2,752,250 | |
| | | | | | | | | |
| | | | | Telecommunication Services — 0.3% | | | | |
| | 250,000 | | | United States Cellular Corp., 6.700%, 12/15/33 | | | 225,000 | |
| | 1,388,000 | | | Verizon Communications, Inc., 4.672%, 3/15/55 | | | 1,332,480 | |
| | 144,000 | | | Verizon Communications, Inc., 6.550%, 9/15/43 | | | 189,681 | |
| | | | | | | | 1,747,161 | |
| | | | | Total Corporate Bonds | | $ | 215,946,757 | |
| | | | | | | | | |
| | | | | U.S. Treasury Obligations — 19.0% | | | | |
| | 17,921,100 | | | U.S. Treasury Bond, 3.000%, 11/15/45 | | | 19,347,082 | |
| | 15,000,000 | | | U.S. Treasury Note, 0.750%, 2/28/18 | | | 15,003,510 | |
| | 2,565,000 | | | U.S. Treasury Note, 1.000%, 9/15/17 | | | 2,576,022 | |
| | 12,615,000 | | | U.S. Treasury Note, 1.375%, 10/31/20 | | | 12,716,021 | |
| | 7,260,000 | | | U.S. Treasury Note, 1.750%, 5/15/23 | | | 7,359,825 | |
| | 1,315,000 | | | U.S. Treasury Note, 1.875%, 11/30/21 | | | 1,350,700 | |
| | 2,605,000 | | | U.S. Treasury Note, 2.000%, 11/30/22 | | | 2,684,067 | |
| | 20,982,400 | | | U.S. Treasury Note, 2.125%, 5/15/25 | | | 21,630,714 | |
| | 3,150,000 | | | U.S. Treasury Note, 2.250%, 3/31/21 | | | 3,302,580 | |
| | 3,844,100 | | | U.S. Treasury Note, 2.250%, 11/15/24 | | | 4,007,774 | |
| | 12,500,000 | | | U.S. Treasury Note, 2.250%, 11/15/25 | | | 13,009,275 | |
| | | | | Total U.S. Treasury Obligations | | $ | 102,987,570 | |
| | | | | | | | | |
| | | | | Asset-Backed Securities — 12.3% | | | | |
| | 1,499,447 | | | American Homes 4 Rent, Ser 2014-SFR2, Class A, 144a, 3.786%, 10/17/36 | | | 1,561,794 | |
| | 3,750,000 | | | Cabela’s Credit Card Master Note Trust, Ser 2011-2A, Class A2, 144a, 1.036%, 6/17/19(B) | | | 3,751,527 | |
| | 5,435,000 | | | Cabela’s Credit Card Master Note Trust, Ser 2013-1A, Class A, 144a, 2.710%, 2/17/26 | | | 5,528,296 | |
| | 3,930,000 | | | Capital Auto Receivables Asset Trust / Ally, Ser 2013-1, Class D, 2.190%, 9/20/21 | | | 3,910,679 | |
| | 2,900,000 | | | Capital One Multi-Asset Execution Trust, Ser 2013, Class A2, 0.616%, 2/15/19(B) | | | 2,900,000 | |
| 5,400,000 | | | Chrysler Capital Auto Receivables Trust, Ser 2013-AA, Class C, 144a, 2.280%, 7/15/19 | | | 5,403,021 | |
| | 6,500,000 | | | Citibank Credit Card Issuance Trust, Ser 2013, Class A3, 1.110%, 7/23/18 | | | 6,506,922 | |
| | 1,090,000 | | | CNH Equipment Trust, Ser 2013-D, Class B, 1.750%, 4/15/21 | | | 1,090,907 | |
| | 737,803 | | | Conseco Financial Corp., Ser 1998-4, Class A7, 6.870%, 4/1/30(B) | | | 791,914 | |
| | 2,270,303 | | | Countrywide Asset-Backed Certificates, Ser 2004-8, Class M1, 1.483%, 1/25/35(B) | | | 2,265,190 | |
| | 954,138 | | | CWABS, Inc. Asset-Backed Certificates, Ser 2003-5, Class MF1, 5.413%, 1/25/34(B) | | | 953,942 | |
| | 2,469,169 | | | Encore Credit Receivables Trust 2005-4, Ser 2005-4, Class M2, 0.873%, 1/25/36(B) | | | 2,270,646 | |
| | 1,300,000 | | | Ford Credit Auto Owner Trust, Ser 2013-A, Class D, 1.860%, 8/15/19 | | | 1,299,921 | |
| | 4,045,000 | | | GE Dealer Floorplan Master Note Trust, Ser 2013-1, Class A, 0.832%, 4/20/18(B) | | | 4,045,000 | |
| | 6,700,000 | | | Merrill Lynch Mortgage Investors Trust, Ser 2006-FF1, Class M3, 0.743%, 8/25/36(B) | | | 6,227,882 | |
| | 722,532 | | | Mid-State Capital Corp.Trust, Ser 2005-1, Class M2, 7.079%, 1/15/40 | | | 793,671 | |
| | 2,240,000 | | | Oscar US Funding Trust, Ser 2014-1A, Class A4, 144a, 2.550%, 12/15/21 | | | 2,251,726 | |
| | 261,583 | | | RAMP Series Trust, Ser 2003-RZ5, Class A7, 5.470%, 9/25/33(D) | | | 269,035 | |
| | 2,335,000 | | | RAMP Series Trust, Ser 2005-EFC5, Class M3, 0.893%, 10/25/35(B) | | | 1,958,022 | |
| | 4,625,000 | | | Santander Drive Auto Receivables Trust, Ser 2014-4, Class D, 3.100%, 11/16/20 | | | 4,659,621 | |
| | 325,247 | | | Structured Asset Securities Corp. Mortgage Loan Trust, Ser 2005-S3, Class M3, 5.730%, 6/25/35(D) | | | 327,850 | |
| | 4,325,000 | | | Synchrony Credit Card Master Note Trust, Ser 2011-2, Class B, 1.436%, 5/15/19(B) | | | 4,326,931 | |
| | 2,660,000 | | | Wells Fargo Home Equity Asset-Backed Securities Trust, Ser 2005-4, Class M1, 0.893%, 12/25/35(B) | | | 2,538,990 | |
| | 1,368,000 | | | World Financial Network Credit Card Master Trust, Ser 2013-B, Class A, 0.910%, 3/16/20 | | | 1,367,984 | |
| | | | | Total Asset-Backed Securities | | $ | 67,001,471 | |
| | | | | | | | | |
| | | | | Agency Collateralized Mortgage Obligations — 3.6% | | | | |
| | 34,860,670 | | | FHLMC Multifamily Structured Pass Through Certificates, Ser K006, Class AX1, 1.009%, 1/25/20(B)(E) | | | 1,099,906 | |
Touchstone Flexible Income Fund (Continued)
| Principal | | | | | Market | |
| Amount(A) | | | | | Value | |
| | | | | | | | | |
| | | | | Agency Collateralized Mortgage Obligations — 3.6% (Continued) | | | | |
| $ | 15,404,201 | | | FHLMC Multifamily Structured Pass Through Certificates, Ser K019, Class X1, 1.707%, 3/25/22(B)(E) | | $ | 1,265,836 | |
| | 27,329,472 | | | FHLMC Multifamily Structured Pass Through Certificates, Ser K025, Class X1, 0.891%, 10/25/22(B)(E) | | | 1,265,825 | |
| | 73,650,161 | | | FHLMC Multifamily Structured Pass Through Certificates, Ser K033, Class X1, 0.314%, 7/25/23(B)(E) | | | 1,455,931 | |
| | 4,235,000 | | | FHLMC Multifamily Structured Pass Through Certificates, Ser K048, Class A2, 3.284%, 6/25/25(B) | | | 4,559,391 | |
| | 34,942,061 | | | FHLMC Multifamily Structured Pass Through Certificates, Ser K710, Class X1, 1.765%, 5/25/19(B)(E) | | | 1,611,241 | |
| | 1,790,388 | | | FHLMC REMIC, Ser 3199, Class DS, 6.714%, 8/15/36(B)(E) | | | 393,459 | |
| | 1,950,896 | | | FNMA REMIC, Ser 2008-60, Class SA, 6.067%, 7/25/38(B)(E) | | | 386,570 | |
| | 1,500,000 | | | FREMF Mortgage Trust, Ser 2013-K712, Class C, 144a, 3.369%, 12/25/19(B) | | | 1,513,557 | |
| | 1,900,000 | | | FREMF Mortgage Trust, Ser 2013-K713, Class C, 144a, 3.165%, 4/25/20(B) | | | 1,873,176 | |
| | 3,104,531 | | | GNMA, Ser 2011-83, Class NI, 4.500%, 10/16/37(E) | | | 168,225 | |
| | 18,950,397 | | | GNMA, Ser 2012-22, Class IO, 1.085%, 10/16/53(B)(E) | | | 909,801 | |
| | 19,839,515 | | | GNMA, Ser 2012-27, Class IO, 1.155%, 4/16/53(B)(E) | | | 1,067,193 | |
| | 12,302,129 | | | GNMA, Ser 2012-46, Class IO, 0.942%, 9/16/53(B)(E) | | | 479,569 | |
| | 27,939,847 | | | GNMA, Ser 2012-86, Class IO, 0.992%, 12/16/53(B)(E) | | | 1,452,671 | |
| | | | | Total Agency Collateralized Mortgage Obligations | | $ | 19,502,351 | |
| | | | | | | | | |
| | | | | Non-Agency Collateralized Mortgage Obligations — 1.4% | | | | |
| | 2,300,873 | | | American Home Mortgage Investment Trust 2004-4, Ser 2004-4, Class 4A, 2.881%, 2/25/45(B) | | | 2,299,073 | |
| | 148,061 | | | Bear Stearns Asset Backed Securities Trust, Ser 2003-AC7, Class A2, 5.750%, 1/25/34(D) | | | 152,086 | |
| | 301,683 | | | Countrywide Alternative Loan Trust, Ser 2004-30CB, Class 3A1, 5.000%, 2/25/20 | | | 302,014 | |
| | 2,375,299 | | | GSR Mortgage Loan Trust, Ser 2005-AR4, Class 6A1, 2.869%, 7/25/35(B) | | | 2,326,083 | |
| | 987,276 | | | JP Morgan Mortgage Trust, Ser 2014-2, Class 1A1, 144a, 3.000%, 6/25/29(B) | | | 1,011,495 | |
| 7,748 | | | Merrill Lynch Mortgage Investors, Inc., Ser 2003-A1, Class 2A, 2.786%, 12/25/32 | | | 7,621 | |
| | 621,389 | | | Morgan Stanley Mortgage Loan Trust, Ser 2004-7AR, Class 2A6, 2.702%, 9/25/34(B) | | | 606,475 | |
| | 589,577 | | | Nomura Asset Acceptance Corp. Alternative Loan Trust, Ser 2005-AR4, Class 1A, 4.332%, 8/25/35(B) | | | 580,658 | |
| | 169,107 | | | RALI Trust, Ser 2004-QS6, Class A1, 5.000%, 5/25/19 | | | 168,944 | |
| | 266,526 | | | Wells Fargo Mortgage Backed Securities Trust, Ser 2004-X, Class 1A5, 2.756%, 11/25/34(B) | | | 268,325 | |
| | | | | Total Non-Agency Collateralized Mortgage Obligations | | $ | 7,722,774 | |
| | | | | | | | | |
| | | | | Municipal Bond — 0.7% | | | | |
| | 3,285,000 | | | City of New York, NY, Public Improvements, Txbl, Subser F 3, UTGO, 4.000%, 6/1/26 | | | 3,617,573 | |
| | | | | | | | | |
| | | | | U.S. Government Mortgage-Backed Obligations — 0.5% | | | | |
| | 45,323 | | | FHLMC, Pool #972110, 2.475%, 10/1/32(B) | | | 46,935 | |
| | 68,512 | | | FHLMC, Pool #G03170, 6.500%, 8/1/37 | | | 79,865 | |
| | 113,605 | | | FHLMC, Pool #G12780, 6.500%, 9/1/22 | | | 127,201 | |
| | 8,896 | | | FNMA, Pool #738900, 2.560%, 7/1/18(B) | | | 8,951 | |
| | 127,092 | | | FNMA, Pool #844415, 5.500%, 10/1/35 | | | 143,271 | |
| | 821,914 | | | FNMA, Pool #AB1952, 4.000%, 12/1/40 | | | 893,143 | |
| | 601,703 | | | FNMA, Pool #AB1953, 4.000%, 12/1/40 | | | 650,526 | |
| | 575,205 | | | FNMA, Pool #AB3387, 4.000%, 8/1/41 | | | 617,455 | |
| | | | | Total U.S. Government Mortgage-Backed Obligations | | $ | 2,567,347 | |
| | | | | | | | | |
| | | | | Sovereign Government Obligations — 1.3% | | | | |
| | 65,381,000,000 | | | Indonesia Treasury Bond, (IDR), 8.750%, 5/15/31 | | | 5,166,578 | |
| | 1,795,000 | | | Svensk Exportkredit AB, 1.750%, 5/30/17 | | | 1,812,178 | |
| | | | | Total Sovereign Government Obligations | | $ | 6,978,756 | |
| | | | | | | | | |
| | | | | Commercial Mortgage-Backed Security — 0.0% | | | | |
| | 119,341 | | | Bear Stearns Commercial Mortgage Securities Trust, Ser 2005-PWR9, Class AJ, 4.985%, 9/11/42(B) | | | 119,467 | |
Touchstone Flexible Income Fund (Continued)
| | | | | | Market | |
| Shares | | | | | Value | |
| | | | | | | | | |
| | | | | Preferred Stocks — 13.1% | | | | |
| | | | | | | | | |
| | | | | Financials — 6.7% | | | | |
| | 39,050 | | | Alexandria Real Estate Equities, Inc., Ser E REIT, 6.45% | | $ | 1,011,395 | |
| | 89,200 | | | American Capital Agency Corp., Ser B REIT, 7.75% | | | 2,185,400 | |
| | 91,756 | | | Arch Capital Group Ltd., Ser C (Bermuda), 6.75% | | | 2,441,627 | |
| | 134,115 | | | Aviva PLC, (United Kingdom), 8.25% | | | 3,531,248 | |
| | 85,150 | | | CoBank ACB, Ser H, 6.20%(B) | | | 8,621,438 | |
| | 31,600 | | | Digital Realty Trust, Inc., Ser E REIT, 7.00% | | | 805,484 | |
| | 86,000 | | | Digital Realty Trust, Inc., Ser H REIT, 7.35% | | | 2,386,500 | |
| | 126,555 | | | Endurance Specialty Holdings Ltd., Ser B (Bermuda), 7.50% | | | 3,230,949 | |
| | 96,000 | | | Morgan Stanley, Ser F, 6.88%(B) | | | 2,605,440 | |
| | 46,000 | | | PS Business Parks, Inc., Ser S REIT, 6.45% | | | 1,186,800 | |
| | 175,000 | | | PS Business Parks, Inc., Ser T REIT, 6.00% | | | 4,516,750 | |
| | 30,000 | | | Public Storage, Ser R REIT, 6.35% | | | 768,300 | |
| | 67,000 | | | Public Storage, Ser Y REIT, 6.38% | | | 1,866,620 | |
| | 53,400 | | | Realty Income Corp., Ser F REIT, 6.63% | | | 1,390,002 | |
| | 2,028 | | | Vornado Realty Trust, Ser J REIT, 6.68% | | | 51,308 | |
| | | | | | | | 36,599,261 | |
| | | | | | | | | |
| | | | | Utilities — 3.3% | | | | |
| | 35,000 | | | Alabama Power Co., 6.45% | | | 941,500 | |
| | 44,000 | | | Dominion Resources, Inc., 6.38% | | | 2,213,200 | |
| | 68,000 | | | DTE Energy Co., 6.50% | | | 1,754,400 | |
| | 88,500 | | | Entergy Louisiana LLC, 5.88% | | | 2,237,280 | |
| | 91,357 | | | Entergy Mississippi, Inc., 6.00% | | | 2,347,875 | |
| | 160,848 | | | SCE Trust IV, Ser J, 5.38%(B) | | | 4,186,873 | |
| | 161,800 | | | SCE Trust V, Ser K, 5.45%(B) | | | 4,311,970 | |
| | | | | | | | 17,993,098 | |
| | | | | | | | | |
| | | | | Materials — 1.3% | | | | |
| | 114,746 | | | CHS, Inc., Ser 2, 7.10%(B) | | | 3,177,317 | |
| | 147,941 | | | CHS, Inc., Ser 3, 6.75%(B) | | | 3,930,792 | |
| | | | | | | | 7,108,109 | |
| | | | | | | | | |
| | | | | Industrials — 1.3% | | | | |
| | 166,600 | | | Seaspan Corp., (Marshall Islands), 9.50% | | | 4,213,314 | |
| | 114,838 | | | Seaspan Corp., (Marshall Islands), 6.38% | | | 2,843,393 | |
| | | | | | | | 7,056,707 | |
| | | | | | | | | |
| | | | | Telecommunication Services — 0.5% | | | | |
| | 93,242 | | | Telephone & Data Systems, Inc., 6.88% | | | 2,366,482 | |
| | | | | Total Preferred Stocks | | $ | 71,123,657 | |
| | | | | | | | | |
| | | | | Common Stocks — 2.3% | | | | |
| | | | | | | | | |
| | | | | Financials — 2.0% | | | | |
| | 52,859 | | | American Capital Agency Corp. REIT | | | 984,763 | |
| | 12,472 | | | Camden Property Trust REIT | | | 1,048,770 | |
| | 45,844 | | | Duke Realty Corp. REIT | | | 1,033,324 | |
| | 35,313 | | | Kimco Realty Corp. REIT | | | 1,016,308 | |
| | 47,542 | | | ProLogis, Inc. REIT | | | 2,100,406 | |
| | 4,166 | | | Public Storage REIT | | | 1,149,108 | |
| | 11,325 | | | Simon Property Group, Inc. REIT | | | 2,352,089 | |
| | 22,657 | | | Ventas, Inc. REIT | | | 1,426,485 | |
| | | | | | | | 11,111,253 | |
| | | | | | | | | |
| | | | | Industrials — 0.3% | | | | |
| | 5,978 | | | Cintas Corp. | | | 536,884 | |
| | 17,221 | | | Republic Services, Inc. | | | 820,581 | |
| | | | | | | | 1,357,465 | |
| | | | | Total Common Stocks | | $ | 12,468,718 | |
| | | | | | | | | |
| | | | | Exchange Traded Fund — 1.8% | | | | |
| | 502,588 | | | Market Vectors Gold Miners ETF | | | 10,041,708 | |
| | | | | Number | | | | |
| | | | | of | | | | |
| | | | | Contracts | | | | |
| | | | | | | | | | | |
| Purchased Call Options — 0.0% | | | | | | | |
| Vix, Strike @ 14.00, Exp 4/16 | | | 260 | | | | 55,900 | |
| Vix, Strike @ 15, Exp 5/16 | | | 250 | | | | 82,500 | |
| | | Total Purchased Options | | | | | | $ | 138,400 | |
| | | | | Investment Funds — 8.1% | | | | |
| | 31,614,088 | | | Dreyfus Cash Management, Institutional Shares, 0.30%∞Ω | | | 31,614,088 | |
| | 23,600 | | | Eaton Vance Tax-Advantaged Dividend Income Fund±† | | | 452,884 | |
| | 10,694,764 | | | Invesco Government & Agency Portfolio, Institutional Class, 0.26%**∞Ω | | | 10,694,764 | |
| | 135,400 | | | Nuveen Multi-Market Income Fund, Inc.± | | | 976,234 | |
| | | | | Total Investment Funds | | $ | 43,737,970 | |
| | | | | | | | | |
| Total Investment Securities —103.8% | | | | |
| (Cost $560,576,034) | | $ | 563,954,519 | |
| | | | | | | | | |
| Liabilities in Excess of Other Assets — (3.8%) | | $ | (20,495,003 | ) |
| | | | | | | | | |
| Net Assets — 100.0% | | $ | 543,459,516 | |
| (A) | Principal amount stated in U.S. dollars unless otherwise noted. |
| (B) | Variable rate security - Rate reflected is the rate in effect as of March 31, 2016. |
| (C) | Perpetual Bond - A Bond with no definite maturity date. |
Touchstone Flexible Income Fund (Continued)
| (D) | Step Bond - A bond that pays an initial interest rate for the first period and then a higher interest rate for the following periods until maturity. The interest rate shown reflects the rate in effect as of March 31, 2016. |
| (E) | Interest only security. This type of security represents the right to receive the monthly interest payments on an underlying pool of mortgages. Payments of principal on the pool reduce the value of the “interest only” holding. |
| ** | Represents collateral for securities loaned. |
| † | All or a portion of the security is on loan. The total market value of the securities on loan as of March 31, 2016 was $10,313,899. |
| Ω | Represents the 7-day SEC yield as of March 31, 2016. |
| Portfolio Abbreviations: |
| |
| BRL - Brazilian Real |
| |
| CAD - Canadian Dollar |
| |
| ETF - Exchange Traded Fund |
| |
| FHLMC - Federal Home Loan Mortgage Association |
| |
| FNMA - Federal National Mortgage Association |
| |
| FREMF - Finnish Real Estate Management Federation |
| |
| GNMA - Government National Mortgage Association |
| |
| IDR - Indonesian Rupiah |
| |
| JPY - Japanese Yen |
| |
| KRW - South Korean Won |
| |
| LLC - Limited Liability Company |
| |
| LP - Limited Partnership |
| |
| MTN - Medium Term Note |
| |
| PLC - Public Limited Company |
| |
| REIT - Real Estate Investment Trust |
| |
| REMIC - Real Estate Mortgage Investment Conduit |
| |
| TRY - Turkish Lira |
| |
| TWD - Taiwan Dollar |
| |
| USD - United States Dollar |
| UTGO - Unlimited Tax General Obligation |
| |
| ZAR - South African Rand |
| |
| 144a - This is a restricted security that was sold in a transaction qualifying for the exemption under Rule 144A of the Securities Act of 1933. This security may be sold in transactions exempt from registration, normally to qualified institutional buyers. At March 31, 2016, these securities were valued at $40,722,687 or 7.5% of net assets. These securities were deemed liquid pursuant to procedures approved by the Board of Trustees. |
Touchstone Flexible Income Fund (Continued)
| Other Information: |
| |
| The inputs or methodology used for valuing securities may not be an indication of the risk associated with investing in those securities. For more information on valuation inputs, and their aggregation into the levels used in the table below, please refer to the security valuation section in the accompanying Notes to Financial Statements. |
Valuation inputs at Reporting Date:
| Description | | Level 1 | | | Level 2 | | | Level 3 | | | Total | |
| | | | | | | | | | | | | | | | | |
| Assets: | | | | | | | | | | | | | | | | |
| Corporate Bonds | | $ | — | | | $ | 215,946,757 | | | $ | — | | | $ | 215,946,757 | |
| U.S. Treasury Obligations | | | — | | | | 102,987,570 | | | | — | | | | 102,987,570 | |
| Asset-Backed Securities | | | — | | | | 67,001,471 | | | | — | | | | 67,001,471 | |
| Agency Collateralized Mortgage Obligations | | | — | | | | 19,502,351 | | | | — | | | | 19,502,351 | |
| Non-Agency Collateralized Mortgage Obligations | | | — | | | | 7,722,774 | | | | — | | | | 7,722,774 | |
| Municipal Bond | | | — | | | | 3,617,573 | | | | — | | | | 3,617,573 | |
| U.S. Government Mortgage-Backed Obligations | | | — | | | | 2,567,347 | | | | — | | | | 2,567,347 | |
| Sovereign Government Obligations | | | — | | | | 6,978,756 | | | | — | | | | 6,978,756 | |
| Commercial Mortgage-Backed Security | | | — | | | | 119,467 | | | | — | | | | 119,467 | |
| Preferred Stocks | | | 71,123,657 | | | | — | | | | — | | | | 71,123,657 | |
| Common Stocks | | | 12,468,718 | | | | — | | | | — | | | | 12,468,718 | |
| Exchanged Traded Fund | | | 10,041,708 | | | | — | | | | — | | | | 10,041,708 | |
| Purchased Option Equity Contracts | | | 138,400 | | | | — | | | | — | | | | 138,400 | |
| Investment Funds | | | 43,737,970 | | | | — | | | | — | | | | 43,737,970 | |
| Total Assets | | $ | 137,510,453 | | | $ | 426,444,066 | | | $ | — | | | $ | 563,954,519 | |
Valuation inputs at Reporting Date:
| Description | | Level 1 | | | Level 2 | | | Level 3 | | | Total | |
| | | | | | | | | | | | | | | | | |
| Other Financial Instruments*** | | | | | | | | | | | | | | | | |
| | | | | | | | | | | | | | | | | |
| Assets: | | | | | | | | | | | | | | | | |
| Forward Foreign Currency Contracts | | $ | — | | | $ | 124,674 | | | $ | — | | | $ | 124,674 | |
| | | | | | | | | | | | | | | | 124,674 | |
| Liabilities: | | | | | | | | | | | | | | | | |
| Forward Foreign Currency Contracts | | | — | | | | (1,675,788 | ) | | | — | | | | (1,675,788 | ) |
| | | | | | | | | | | | | | | $ | (1,675,788 | ) |
| *** | | Other Financial Instruments are derivative instruments not reflected in total investments. Amounts shown represent unrealized appreciation (depreciation) on forward foreign currency contracts. |
Transactions in written options for the year ended March 31, 2016.
| | | Number of | | | Premiums | |
| | | Contracts | | | Received | |
| | | | | | | | | |
| Beginning of Period, March 31, 2015 | | | — | | | $ | — | |
| Call Options Written | | | 5,750 | | | | 111,786 | |
| Call Options Closed | | | (550 | ) | | | (35,176 | ) |
| Call Options Expired | | | (5,200 | ) | | | (76,610 | ) |
| End of Period, March 31, 2016 | | | — | | | $ | — | |
Touchstone Flexible Income Fund (Continued)
Forward Foreign Currency Contracts
| | | | | | | Unrealized | |
| | | | | Contract to | | Appreciation/ | |
| Counterparty | | Expiration Date | | Receive | | | Deliver | | | | (Depreciation) | |
| | | | | | | | | | | | | | | | | | | |
| ANZ CAPITAL MARKETS | | 04/07/2016 | | USD | | | 4,855,753 | | | KRW | | | 5,903,964,190 | | | $ | (305,912 | ) |
| ANZ CAPITAL MARKETS | | 04/14/2016 | | USD | | | 4,911,161 | | | ZAR | | | 76,290,905 | | | | (242,077 | ) |
| BNY CONVERGEX | | 04/11/2016 | | USD | | | 9,630,734 | | | TRY | | | 28,171,629 | | | | (334,813 | ) |
| MORGAN STANLEY | | 04/07/2016 | | BRL | | | 21,788,535 | | | USD | | | 5,933,051 | | | | 114,947 | |
| MORGAN STANLEY | | 04/07/2016 | | USD | | | 5,601,310 | | | BRL | | | 21,788,535 | | | | (446,688 | ) |
| MORGAN STANLEY | | 04/11/2016 | | JPY | | | 548,500,168 | | | USD | | | 4,865,522 | | | | 9,727 | |
| MORGAN STANLEY | | 04/11/2016 | | USD | | | 4,907,303 | | | CAD | | | 6,563,895 | | | | (146,784 | ) |
| MORGAN STANLEY | | 04/14/2016 | | USD | | | 4,908,666 | | | BRL | | | 18,084,998 | | | | (101,645 | ) |
| MORGAN STANLEY | | 04/14/2016 | | USD | | | 2,497,755 | | | TWD | | | 82,089,982 | | | | (53,260 | ) |
| MORGAN STANLEY | | 04/14/2016 | | ZAR | | | 76,290,905 | | | USD | | | 5,197,847 | | | | (44,609 | ) |
| | | | | | | | | | | | | | | | | $ | (1,551,114 | ) |
See accompanying Notes to Financial Statements.
Portfolio of Investments
Touchstone Focused Fund – March 31, 2016
| | | | | | Market | |
| | | Shares | | | Value | |
| | | | | | | | | |
| Common Stocks — 91.4% | | | | | | | | |
| | | | | | | | | |
| Information Technology — 20.2% | | | | | | | | |
| Alphabet, Inc. - Class A* | | | 34,115 | | | $ | 26,026,333 | |
| Alphabet, Inc. - Class C* | | | 40,451 | | | | 30,133,972 | |
| Apple, Inc. | | | 371,503 | | | | 40,490,112 | |
| Avnet, Inc. | | | 581,366 | | | | 25,754,514 | |
| Cisco Systems, Inc. | | | 1,246,778 | | | | 35,495,770 | |
| International Business Machines Corp. | | | 158,103 | | | | 23,944,699 | |
| LinkedIn Corp. - Class A* | | | 153,593 | | | | 17,563,360 | |
| Microsoft Corp. | | | 650,610 | | | | 35,933,190 | |
| Oracle Corp. | | | 918,280 | | | | 37,566,835 | |
| | | | | | | | 272,908,785 | |
| | | | | | | | | |
| Health Care — 14.8% | | | | | | | | |
| Abbott Laboratories | | | 904,502 | | | | 37,835,319 | |
| Biogen, Inc.* | | | 84,730 | | | | 22,056,914 | |
| Bio-Rad Laboratories, Inc. - Class A* | | | 207,698 | | | | 28,396,471 | |
| Johnson & Johnson | | | 248,454 | | | | 26,882,723 | |
| Novartis AG ADR | | | 572,437 | | | | 41,467,336 | |
| Owens & Minor, Inc. | | | 1,080,040 | | | | 43,655,217 | |
| | | | | | | | 200,293,980 | |
| | | | | | | | | |
| Financials — 13.8% | | | | | | | | |
| Bank of America Corp. | | | 1,215,470 | | | | 16,433,154 | |
| Bank of New York Mellon Corp. (The) | | | 1,280,307 | | | | 47,153,707 | |
| Berkshire Hathaway, Inc. - Class B* | | | 534,919 | | | | 75,894,308 | |
| Goldman Sachs Group, Inc. (The) | | | 134,293 | | | | 21,081,315 | |
| Simon Property Group, Inc. REIT | | | 124,611 | | | | 25,880,458 | |
| | | | | | | | 186,442,942 | |
| | | | | | | | | |
| Consumer Discretionary — 11.6% | | | | | | | | |
| Amazon. com, Inc.* | | | 71,219 | | | | 42,278,447 | |
| Carnival Corp. (Panama) | | | 462,381 | | | | 24,399,845 | |
| Comcast Corp. - Class A | | | 424,921 | | | | 25,954,175 | |
| Priceline Group, Inc. (The)* | | | 18,550 | | | | 23,910,208 | |
| Twenty-First Century Fox, Inc. - Class A | | | 863,856 | | | | 24,084,305 | |
| Vista Outdoor, Inc.* | | | 309,692 | | | | 16,076,112 | |
| | | | | | | | 156,703,092 | |
| | | | | | | | | |
| Consumer Staples — 9.2% | | | | | | | | |
| JM Smucker Co. (The) | | | 239,523 | | | | 31,099,666 | |
| Mondelez International, Inc. - Class A | | | 1,177,556 | | | | 47,243,547 | |
| Sysco Corp. | | | 992,820 | | | | 46,394,479 | |
| | | | | | | | 124,737,692 | |
| | | | | | | | | |
| Industrials — 8.9% | | | | | | | | |
| CSX Corp. | | | 568,053 | | | | 14,627,365 | |
| General Electric Co. | | | 1,541,597 | | | | 49,007,369 | |
| Union Pacific Corp. | | | 281,107 | | | | 22,362,062 | |
| United Technologies Corp. | | | 162,655 | | | | 16,281,765 | |
| WESCO International, Inc.*† | | | 320,409 | | | | 17,516,760 | |
| | | | | | | | 119,795,321 | |
| | | | | | | | | |
| Energy — 6.5% | | | | | | | | |
| Exxon Mobil Corp. | | | 260,739 | | | | 21,795,173 | |
| Halliburton Co. | | | 538,768 | | | | 19,244,793 | |
| Schlumberger Ltd. (Curacao) | | | 288,963 | | | | 21,311,021 | |
| World Fuel Services Corp. | | | 532,816 | | | | 25,884,201 | |
| | | | | | | | 88,235,188 | |
| | | | | | | | | |
| Materials — 4.1% | | | | | | | | |
| Agrium, Inc. (Canada)† | | | 294,236 | | | | 25,978,096 | |
| Reliance Steel & Aluminum Co. | | | 425,701 | | | | 29,454,252 | |
| | | | | | | | 55,432,348 | |
| | | | | | | | | |
| Telecommunication Services — 2.3% | | | | | | | | |
| AT&T, Inc. | | | 810,274 | | | | 31,738,433 | |
| Total Common Stocks | | | | | | $ | 1,236,287,781 | |
| | | | | | | | | |
| Investment Funds — 9.8% | | | | | | | | |
| Dreyfus Cash Management, Institutional Shares, 0.30%∞ Ω | | | 104,864,200 | | | | 104,864,200 | |
| Invesco Government & Agency Portfolio, Institutional Class, 0.26%**∞ Ω | | | 27,236,852 | | | | 27,236,852 | |
| Total Investment Funds | | | | | | $ | 132,101,052 | |
| | | | | | | | | |
| Total Investment Securities —101.2% | | | | | | | | |
| (Cost $1,198,452,351) | | | | | | $ | 1,368,388,833 | |
| | | | | | | | | |
| Liabilities in Excess of Other Assets — (1.2%) | | | | | | | (15,888,205 | ) |
| | | | | | | | | |
| Net Assets — 100.0% | | | | | | $ | 1,352,500,628 | |
| * | Non-income producing security. |
| ** | Represents collateral for securities loaned. |
| † | All or a portion of the security is on loan. The total market value of the securities on loan as of March 31, 2016 was $26,090,591. |
| Ω | Represents the 7-day SEC yield as of March 31, 2016. |
Portfolio Abbreviations:
ADR - American Depositary Receipt
REIT - Real Estate Investment Trust
Touchstone Focused Fund (Continued)
Other Information:
The inputs or methodology used for valuing securities may not be an indication of the risk associated with investing in those securities. For more information on valuation inputs, and their aggregation into the levels used in the table below, please refer to the security valuation section in the accompanying Notes to Financial Statements.
Valuation inputs at Reporting Date:
| Description | | Level 1 | | | Level 2 | | | Level 3 | | | Total | |
| Common Stocks | | $ | 1,236,287,781 | | | $ | — | | | $ | — | | | $ | 1,236,287,781 | |
| Investment Funds | | | 132,101,052 | | | | — | | | | — | | | | 132,101,052 | |
| Total | | $ | 1,368,388,833 | | | $ | — | | | $ | — | | | $ | 1,368,388,833 | |
See accompanying Notes to Financial Statements.
Portfolio of Investments
Touchstone Growth Opportunities Fund – March 31, 2016
| | | | | | Market | |
| | | Shares | | | Value | |
| | | | | | | | | |
| Common Stocks — 96.6% | | | | | | | | |
| | | | | | | | | |
| Information Technology — 31.5% | | | | | | | | |
| Alliance Data Systems Corp.* | | | 11,735 | | | $ | 2,581,700 | |
| Alphabet, Inc. - Class A* | | | 11,261 | | | | 8,591,017 | |
| Alphabet, Inc. - Class C* | | | 11,297 | | | | 8,415,700 | |
| Apple, Inc. | | | 133,560 | | | | 14,556,704 | |
| Arris International PLC* | | | 106,330 | | | | 2,437,084 | |
| Broadcom Ltd. | | | 30,510 | | | | 4,713,795 | |
| Facebook, Inc. - Class A* | | | 76,440 | | | | 8,721,804 | |
| Imperva, Inc.* | | | 78,830 | | | | 3,980,915 | |
| MasterCard, Inc. - Class A | | | 50,070 | | | | 4,731,615 | |
| Microsoft Corp. | | | 151,270 | | | | 8,354,642 | |
| Palo Alto Networks, Inc.* | | | 40,080 | | | | 6,538,651 | |
| Red Hat, Inc.* | | | 66,580 | | | | 4,960,876 | |
| Salesforce.com, Inc.* | | | 82,680 | | | | 6,104,264 | |
| Vantiv, Inc. - Class A* | | | 59,920 | | | | 3,228,490 | |
| Visa, Inc. - Class A | | | 83,890 | | | | 6,415,907 | |
| Zebra Technologies Corp. - Class A* | | | 47,137 | | | | 3,252,453 | |
| | | | | | | | 97,585,617 | |
| | | | | | | | | |
| Consumer Discretionary — 19.4% | | | | | | | | |
| Amazon.com, Inc.* | | | 10,338 | | | | 6,137,050 | |
| BorgWarner, Inc. | | | 92,150 | | | | 3,538,560 | |
| Charter Communications, Inc.*† | | | 30,050 | | | | 6,083,022 | |
| Dollar Tree, Inc.* | | | 56,370 | | | | 4,648,270 | |
| Home Depot, Inc.(The) | | | 50,340 | | | | 6,716,866 | |
| Liberty Interactive Corp. QVC Group - Class A* | | | 169,650 | | | | 4,283,663 | |
| Lululemon Athletica, Inc.*† | | | 46,990 | | | | 3,181,693 | |
| Newell Rubbermaid, Inc.† | | | 147,550 | | | | 6,534,990 | |
| Starbucks Corp. | | | 79,370 | | | | 4,738,389 | |
| TJX Cos., Inc. | | | 78,830 | | | | 6,176,331 | |
| Twenty-First Century Fox, Inc. - Class A | | | 176,580 | | | | 4,923,050 | |
| Vail Resorts, Inc. | | | 24,240 | | | | 3,240,888 | |
| | | | | | | | 60,202,772 | |
| | | | | | | | | |
| Health Care — 15.0% | | | | | | | | |
| ARIAD Pharmaceuticals, Inc.* | | | 313,470 | | | | 2,003,073 | |
| Baxter International, Inc. | | | 116,390 | | | | 4,781,301 | |
| Bristol-Myers Squibb Co. | | | 98,810 | | | | 6,311,983 | |
| Celgene Corp.* | | | 75,900 | | | | 7,596,831 | |
| Jazz Pharmaceuticals PLC (Ireland)* | | | 55,688 | | | | 7,270,068 | |
| Merrimack Pharmaceuticals, Inc.*† | | | 238,380 | | | | 1,995,241 | |
| Mettler-Toledo International, Inc.* | | | 14,219 | | | | 4,902,142 | |
| Steris PLC (United Kingdom) | | | 101,470 | | | | 7,209,444 | |
| Teva Pharmaceutical Industries Ltd. ADR | | | 80,430 | | | | 4,303,809 | |
| | | | | | | | 46,373,892 | |
| | | | | | | | | |
| Industrials — 11.8% | | | | | | | | |
| Lennox International, Inc. | | | 39,945 | | | | 5,400,165 | |
| Lockheed Martin Corp. | | | 27,030 | | | | 5,987,145 | |
| ManpowerGroup, Inc. | | | 55,400 | | | | 4,510,668 | |
| Steelcase, Inc. - Class A | | | 132,851 | | | | 1,982,137 | |
| TransDigm Group, Inc.* | | | 21,705 | | | | 4,782,480 | |
| Union Pacific Corp. | | | 62,190 | | | | 4,947,215 | |
| United Continental Holdings, Inc.* | | | 100,140 | | | | 5,994,380 | |
| United Parcel Service, Inc. - Class B | | | 29,560 | | | | 3,117,693 | |
| | | | | | | | 36,721,883 | |
| | | | | | | | | |
| Consumer Staples — 7.4% | | | | | | | | |
| Coca-Cola Enterprises, Inc. | | | 105,200 | | | | 5,337,848 | |
| Constellation Brands, Inc. - Class A | | | 41,280 | | | | 6,236,995 | |
| Costco Wholesale Corp. | | | 35,550 | | | | 5,601,969 | |
| Kroger Co.(The) | | | 151,010 | | | | 5,776,133 | |
| | | | | | | | 22,952,945 | |
| | | | | | | | | |
| Financials — 5.7% | | | | | | | | |
| BankUnited, Inc. | | | 144,882 | | | | 4,989,736 | |
| CBRE Group, Inc. - Class A* | | | 116,920 | | | | 3,369,634 | |
| East West Bancorp, Inc. | | | 148,612 | | | | 4,826,918 | |
| Synchrony Financial* | | | 159,800 | | | | 4,579,868 | |
| | | | | | | | 17,766,156 | |
| | | | | | | | | |
| Materials — 3.6% | | | | | | | | |
| Dow Chemical Co.(The) | | | 125,440 | | | | 6,379,878 | |
| Vulcan Materials Co. | | | 44,210 | | | | 4,667,250 | |
| | | | | | | | 11,047,128 | |
| | | | | | | | | |
| Energy — 2.2% | | | | | | | | |
| Baker Hughes, Inc. | | | 47,670 | | | | 2,089,376 | |
| Valero Energy Corp. | | | 71,910 | | | | 4,612,307 | |
| | | | | | | | 6,701,683 | |
| Total Common Stocks | | | | | | $ | 299,352,076 | |
| | | | | | | | | |
| Investment Funds — 8.0% | | | | | | | | |
| Dreyfus Cash Management, Institutional Shares, 0.30%∞ Ω | | | 9,024,840 | | | | 9,024,840 | |
| Invesco Government & Agency Portfolio, Institutional Class, 0.26%**∞ Ω | | | 15,719,585 | | | | 15,719,585 | |
| Total Investment Funds | | | | | | $ | 24,744,425 | |
| | | | | | | | | |
| Total Investment Securities —104.6% | | | | | | | | |
| (Cost $298,042,142) | | | | | | $ | 324,096,501 | |
| | | | | | | | | |
| Liabilities in Excess of Other Assets — (4.6%) | | | | | | | (14,222,264 | ) |
| | | | | | | | | |
| Net Assets — 100.0% | | | | | | $ | 309,874,237 | |
| * | Non-income producing security. |
| ** | Represents collateral for securities loaned. |
| † | All or a portion of the security is on loan. The total market value of the securities on loan as of March 31, 2016 was $15,356,209. |
| Ω | Represents the 7-day SEC yield as of March 31, 2016. |
Touchstone Growth Opportunities Fund (Continued)
Portfolio Abbreviations:
ADR - American Depositary Receipt
PLC - Public Limited Company
Other Information:
The inputs or methodology used for valuing securities may not be an indication of the risk associated with investing in those securities. For more information on valuation inputs, and their aggregation into the levels used in the table below, please refer to the security valuation section in the accompanying Notes to Financial Statements.
Valuation inputs at Reporting Date:
| Description | | Level 1 | | | Level 2 | | | Level 3 | | | Total | |
| | | | | | | | | | | | | | | | | |
| Common Stocks | | $ | 299,352,076 | | | $ | — | | | $ | — | | | $ | 299,352,076 | |
| Investment Funds | | | 24,744,425 | | | | — | | | | — | | | | 24,744,425 | |
| Total | | $ | 324,096,501 | | | $ | — | | | $ | — | | | $ | 324,096,501 | |
See accompanying Notes to Financial Statements.
Portfolio of Investments
Touchstone International Value Fund – March 31, 2016
| | | | | | Market | |
| | | Shares | | | Value | |
| | | | | | | | | |
| Common Stocks — 98.3% | | | | | | | | |
| | | | | | | | | |
| United Kingdom — 22.7% | | | | | | | | |
| | | | | | | | | |
| Consumer Discretionary — 2.3% | | | | | | | | |
| Kingfisher PLC | | | 179,600 | | | $ | 968,685 | |
| | | | | | | | | |
| Consumer Staples — 8.3% | | | | | | | | |
| Dairy Crest Group PLC | | | 206,147 | | | | 1,831,240 | |
| Imperial Tobacco Group PLC | | | 31,839 | | | | 1,762,832 | |
| | | | | | | | | |
| Energy — 2.5% | | | | | | | | |
| BP PLC | | | 134,100 | | | | 670,949 | |
| BP PLC ADR | | | 13,800 | | | | 416,484 | |
| | | | | | | | | |
| Health Care — 2.6% | | | | | | | | |
| Glaxosmithkline PLC | | | 55,700 | | | | 1,127,546 | |
| | | | | | | | | |
| Industrials — 1.5% | | | | | | | | |
| Rolls-Royce Holdings PLC | | | 68,000 | | | | 664,583 | |
| | | | | | | | | |
| Materials — 3.8% | | | | | | | | |
| DS Smith PLC | | | 275,928 | | | | 1,614,269 | |
| | | | | | | | | |
| Utilities — 1.7% | | | | | | | | |
| National Grid PLC | | | 51,805 | | | | 733,005 | |
| Total United Kingdom | | | | | | | 9,789,593 | |
| | | | | | | | | |
| Netherlands — 13.6% | | | | | | | | |
| | | | | | | | | |
| Consumer Discretionary — 2.5% | | | | | | | | |
| Fiat Chrysler Automobiles N.V. | | | 133,500 | | | | 1,077,321 | |
| | | | | | | | | |
| Financials — 4.3% | | | | | | | | |
| Aegon N.V. | | | 73,300 | | | | 402,842 | |
| Delta Lloyd N.V. Expiration 04/13/16 Strike Price EUR $1.12† | | | 76,800 | | | | 355,992 | |
| ING Groep NV | | | 91,243 | | | | 1,091,891 | |
| | | | | | | | | |
| Industrials — 6.8% | | | | | | | | |
| Airbus Group N.V. | | | 17,100 | | | | 1,133,004 | |
| CNH Industrial N.V. | | | 97,700 | | | | 663,306 | |
| CNH Industrial N.V.† | | | 24,400 | | | | 164,944 | |
| Koninklijke Philips N.V. | | | 34,000 | | | | 968,435 | |
| Total Netherlands | | | | | | | 5,857,735 | |
| | | | | | | | | |
| Japan — 12.2% | | | | | | | | |
| | | | | | | | | |
| Industrials — 5.9% | | | | | | | | |
| Fuji Electric Co. Ltd. | | | 234,000 | | | | 809,073 | |
| IHI Corp. | | | 323,000 | | | | 683,692 | |
| Mabuchi Motor Co. Ltd. | | | 7,800 | | | | 362,891 | |
| Sumitomo Corp. | | | 71,500 | | | | 709,491 | |
| | | | | | | | | |
| Information Technology — 5.1% | | | | | | | | |
| Canon, Inc. | | | 32,100 | | | | 957,317 | |
| Hitachi Ltd. | | | 152,000 | | | | 712,401 | |
| Trend Micro, Inc. | | | 14,300 | | | | 523,379 | |
| | | | | | | | | |
| Materials — 1.2% | | | | | | | | |
| Sumitomo Osaka Cement Co. Ltd. | | | 131,000 | | | | 514,578 | |
| Total Japan | | | | | | | 5,272,822 | |
| | | | | | | | | |
| Switzerland — 8.0% | | | | | | | | |
| | | | | | | | | |
| Financials — 3.6% | | | | | | | | |
| Credit Suisse Group AG | | | 38,556 | | | | 544,486 | |
| Helvetia Holding AG | | | 877 | | | | 501,141 | |
| Swiss Life Holding AG | | | 1,900 | | | | 504,199 | |
| | | | | | | | | |
| Health Care — 1.4% | | | | | | | | |
| Novartis AG | | | 8,549 | | | | 618,537 | |
| | | | | | | | | |
| Industrials — 3.0% | | | | | | | | |
| ABB Ltd. | | | 28,372 | | | | 552,724 | |
| ABB Ltd. ADR | | | 13,600 | | | | 264,112 | |
| OC Oerlikon Corp. AG | | | 46,700 | | | | 481,642 | |
| Total Switzerland | | | | | | | 3,466,841 | |
| | | | | | | | | |
| France — 6.7% | | | | | | | | |
| | | | | | | | | |
| Consumer Staples — 0.3% | | | | | | | | |
| Casino Guichard Perrachon SA | | | 2,317 | | | | 132,604 | |
| | | | | | | | | |
| Energy — 1.2% | | | | | | | | |
| Technip SA | | | 9,700 | | | | 537,567 | |
| | | | | | | | | |
| Health Care — 2.9% | | | | | | | | |
| Sanofi | | | 15,325 | | | | 1,232,068 | |
| | | | | | | | | |
| Industrials — 2.3% | | | | | | | | |
| Cie de Saint-Gobain | | | 22,300 | | | | 979,512 | |
| Total France | | | | | | | 2,881,751 | |
| | | | | | | | | |
| Singapore — 4.9% | | | | | | | | |
| | | | | | | | | |
| Consumer Discretionary — 2.8% | | | | | | | | |
| Jardine Cycle & Carriage Ltd. | | | 40,900 | | | | 1,214,467 | |
| | | | | | | | | |
| Financials — 2.1% | | | | | | | | |
| United Overseas Bank Ltd. | | | 64,100 | | | | 896,631 | |
| Total Singapore | | | | | | | 2,111,098 | |
| | | | | | | | | |
| Spain — 3.3% | | | | | | | | |
| | | | | | | | | |
| Financials — 3.3% | | | | | | | | |
| Banco de Sabadell SA | | | 439,000 | | | | 788,380 | |
| Banco Santander SA | | | 148,488 | | | | 652,143 | |
| Total Spain | | | | | | | 1,440,523 | |
| | | | | | | | | |
| Denmark — 3.1% | | | | | | | | |
| | | | | | | | | |
| Financials — 3.1% | | | | | | | | |
| Danske Bank A/S | | | 47,425 | | | | 1,338,355 | |
| | | | | | | | | |
| South Korea — 3.0% | | | | | | | | |
| | | | | | | | | |
| Consumer Discretionary — 1.3% | | | | | | | | |
| Hankook Tire Co. Ltd. | | | 11,700 | | | | 556,524 | |
| | | | | | | | | |
| Financials — 1.7% | | | | | | | | |
| Shinhan Financial Group Co. Ltd. | | | 21,050 | | | | 740,957 | |
| Total South Korea | | | | | | | 1,297,481 | |
Touchstone International Value Fund (Continued)
| | | | | | Market | |
| | | Shares | | | Value | |
| | | | | | | |
| Common Stocks — 98.3% (Continued) | | | | | | | | |
| | | | | | | | | |
| Germany — 3.0% | | | | | | | | |
| | | | | | | | | |
| Consumer Discretionary — 1.2% | | | | | | | | |
| Daimler AG | | | 7,000 | | | $ | 535,729 | |
| | | | | | | | | |
| Financials — 1.8% | | | | | | | | |
| Deutsche Boerse AG | | | 8,906 | | | | 758,294 | |
| Total Germany | | | | | | | 1,294,023 | |
| | | | | | | | | |
| Ireland — 3.0% | | | | | | | | |
| | | | | | | | | |
| Materials — 3.0% | | | | | | | | |
| CRH PLC | | | 45,100 | | | | 1,272,432 | |
| | | | | | | | | |
| Israel — 2.5% | | | | | | | | |
| | | | | | | | | |
| Health Care — 2.5% | | | | | | | | |
| Teva Pharmaceutical Industries Ltd. | | | | | | | | |
| ADR | | | 20,300 | | | | 1,086,253 | |
| | | | | | | | | |
| Austria — 2.3% | | | | | | | | |
| | | | | | | | | |
| Financials — 2.3% | | | | | | | | |
| Erste Group Bank AG* | | | 34,900 | | | | 979,542 | |
| | | | | | | | | |
| Thailand — 2.1% | | | | | | | | |
| | | | | | | | | |
| Consumer Staples — 1.7% | | | | | | | | |
| Charoen Pokphand Foods PCL | | | 1,094,300 | | | | 758,627 | |
| | | | | | | | | |
| Financials — 0.4% | | | | | | | | |
| Bangkok Bank PCL | | | 31,300 | | | | 161,683 | |
| Total Thailand | | | | | | | 920,310 | |
| | | | | | | | | |
| Italy — 2.0% | | | | | | | | |
| | | | | | | | | |
| Energy — 2.0% | | | | | | | | |
| Eni SpA | | | 56,291 | | | | 850,147 | |
| | | | | | | | | |
| Norway — 1.9% | | | | | | | | |
| | | | | | | | | |
| Consumer Staples — 1.9% | | | | | | | | |
| Orkla ASA | | | 92,167 | | | | 833,631 | |
| | | | | | | | | |
| Brazil — 1.8% | | | | | | | | |
| | | | | | | | | |
| Industrials — 1.8% | | | | | | | | |
| Embraer SA ADR | | | 28,900 | | | | 761,804 | |
| | | | | | | | | |
| Hong Kong — 0.9% | | | | | | | | |
| | | | | | | | | |
| Utilities — 0.9% | | | | | | | | |
| Guangdong Investment Ltd. | | | 314,600 | | | | 397,801 | |
| | | | | | | | | |
| United States — 0.8% | | | | | | | | |
| | | | | | | | | |
| Consumer Staples — 0.8% | | | | | | | | |
| Philip Morris International, Inc. | | | 3,600 | | | | 353,196 | |
| | | | | | | | | |
| Indonesia — 0.5% | | | | | | | | |
| | | | | | | | | |
| Telecommunication Services — 0.5% | | | | | | | | |
| Telekomunikasi Indonesia Persero Tbk | | | | | | | | |
| PT | | | 847,600 | | | $ | 213,650 | |
| Total Common Stocks | | | | | | $ | 42,418,988 | |
| | | Number | | | | |
| | | of | | | | |
| | | Rights | | | | |
| | | | | | | |
| Rights — 0.2% | | | | | | | | |
| | | | | | | | | |
| Netherlands — 0.2% | | | | | | | | |
| | | | | | | | | |
| Financials — 0.2% | | | | | | | | |
| Delta Lloyd N.V. | | | | | | | | |
| Expiration 04/13/16 Strike Price EUR $1.12*† | | | 76,800 | | | | 106,704 | |
| | | Shares | | | | |
| | | | | | | |
| Investment Funds — 2.2% | | | | | | | | |
| Dreyfus Cash Management, Institutional Shares, 0.30%∞Ω | | | 279,466 | | | $ | 279,466 | |
| Invesco Government & Agency Portfolio, Institutional Class, 0.26%**∞Ω | | | 658,560 | | | | 658,560 | |
| Total Investment Funds | | | | | | $ | 938,026 | |
| | | | | | | | | |
| Total Investment Securities —100.7% | | | | | | | | |
| (Cost $50,862,954) | | | | | | $ | 43,463,718 | |
| | | | | | | | | |
| Liabilities in Excess of Other Assets — (0.7%) | | | | | | | (317,101 | ) |
| | | | | | | | | |
| Net Assets — 100.0% | | | | | | $ | 43,146,617 | |
| * | Non-income producing security. |
| ** | Represents collateral for securities loaned. |
| † | All or a portion of the security is on loan. The total market value of the securities on loan as of March 31, 2016 was $442,478. |
| Ω | Represents the 7-day SEC yield as of March 31, 2016. |
Portfolio Abbreviations:
ADR - American Depositary Receipt
EUR - European Currency Unit
PCL - Public Company Limited
PLC - Public Limited Company
Touchstone International Value Fund (Continued)
Other Information:
The inputs or methodology used for valuing securities may not be an indication of the risk associated with investing in those securities. For more information on valuation inputs, and their aggregation into the levels used in the table below, please refer to the security valuation section in the accompanying Notes to Financial Statements.
Valuation inputs at Reporting Date:
| Description | | Level 1 | | | Level 2 | | | Level 3 | | | Total | |
| Common Stocks | | | | | | | | | | | | | | | | |
| United Kingdom | | $ | 2,247,724 | | | $ | 7,541,869 | | | $ | — | | | $ | 9,789,593 | |
| Netherlands | | | 164,944 | | | | 5,692,791 | | | | — | | | | 5,857,735 | |
| Japan | | | — | | | | 5,272,822 | | | | — | | | | 5,272,822 | |
| Switzerland | | | 264,112 | | | | 3,202,729 | | | | — | | | | 3,466,841 | |
| France | | | — | | | | 2,881,751 | | | | — | | | | 2,881,751 | |
| Singapore | | | — | | | | 2,111,098 | | | | — | | | | 2,111,098 | |
| Spain | | | — | | | | 1,440,523 | | | | — | | | | 1,440,523 | |
| Denmark | | | — | | | | 1,338,355 | | | | — | | | | 1,338,355 | |
| South Korea | | | — | | | | 1,297,481 | | | | — | | | | 1,297,481 | |
| Germany | | | — | | | | 1,294,023 | | | | — | | | | 1,294,023 | |
| Ireland | | | — | | | | 1,272,432 | | | | — | | | | 1,272,432 | |
| Israel | | | 1,086,253 | | | | — | | | | — | | | | 1,086,253 | |
| Austria | | | — | | | | 979,542 | | | | — | | | | 979,542 | |
| Thailand | | | — | | | | 920,310 | | | | — | | | | 920,310 | |
| Italy | | | — | | | | 850,147 | | | | — | | | | 850,147 | |
| Norway | | | — | | | | 833,631 | | | | — | | | | 833,631 | |
| Brazil | | | 761,804 | | | | — | | | | — | | | | 761,804 | |
| Hong Kong | | | — | | | | 397,801 | | | | — | | | | 397,801 | |
| United States | | | 353,196 | | | | — | | | | — | | | | 353,196 | |
| Indonesia | | | — | | | | 213,650 | | | | — | | | | 213,650 | |
| Rights | | | 106,704 | | | | — | | | | — | | | | 106,704 | |
| Investment Funds | | | 938,026 | | | | — | | | | — | | | | 938,026 | |
| Total | | $ | 5,922,763 | | | $ | 37,540,955 | | | $ | — | | | $ | 43,463,718 | |
At March 31, 2016, equity securities valued at $1,831,240 were transferred from Level 2 to Level 1. Transfers from Level 1 to Level 2 are due to significant movement of a designated U.S. market index, triggering a systematic valuation model, provided by an independent third party, when required confidence level are achieved to fair value the international equity securities. Transfers from Level 2 to Level 1 occur when the movement of the designated U.S. market index is no longer significant or required confidence levels were not reached in the systematic model.
See accompanying Notes to Financial Statements.
Portfolio of Investments
Touchstone Mid Cap Growth Fund – March 31, 2016
| | | | | | Market | |
| | | Shares | | | Value | |
| | | | | | | |
| Common Stocks — 96.9% | | | | | | | | |
| | | | | | | | | |
| Consumer Discretionary — 20.6% | | | | | | | | |
| Aramark | | | 364,465 | | | $ | 12,071,081 | |
| BorgWarner, Inc. | | | 244,600 | | | | 9,392,640 | |
| Charter Communications, Inc.*† | | | 79,900 | | | | 16,174,157 | |
| Chipotle Mexican Grill, Inc.* | | | 15,508 | | | | 7,303,803 | |
| Dollar General Corp. | | | 171,460 | | | | 14,676,976 | |
| Dollar Tree, Inc.* | | | 158,555 | | | | 13,074,445 | |
| Expedia, Inc. | | | 102,070 | | | | 11,005,187 | |
| Jarden Corp.* | | | 326,562 | | | | 19,250,830 | |
| Liberty Interactive Corp. QVC Group - Class A* | | | 431,900 | | | | 10,905,475 | |
| Michael Kors Holdings Ltd. (British Virgin Islands)* | | | 98,440 | | | | 5,607,142 | |
| Scripps Networks Interactive, Inc. - Class A | | | 215,550 | | | | 14,118,525 | |
| Six Flags Entertainment Corp. | | | 349,880 | | | | 19,414,841 | |
| Ulta Salon Cosmetics & Fragrance, Inc.* | | | 48,300 | | | | 9,357,642 | |
| | | | | | | | 162,352,744 | |
| | | | | | | | | |
| Industrials — 17.1% | | | | | | | | |
| Fortune Brands Home & Security, Inc. | | | 267,890 | | | | 15,012,556 | |
| IHS, Inc. - Class A* | | | 100,250 | | | | 12,447,040 | |
| JB Hunt Transport Services, Inc. | | | 101,160 | | | | 8,521,718 | |
| Lennox International, Inc. | | | 98,051 | | | | 13,255,515 | |
| Macquarie Infrastructure Co. LLC | | | 162,190 | | | | 10,938,094 | |
| ManpowerGroup, Inc. | | | 147,600 | | | | 12,017,592 | |
| Middleby Corp. (The)* | | | 107,525 | | | | 11,480,444 | |
| Nielsen Holdings PLC* | | | 315,251 | | | | 16,601,118 | |
| TransDigm Group, Inc.* | | | 53,760 | | | | 11,845,478 | |
| United Continental Holdings, Inc.* | | | 380,870 | | | | 22,798,878 | |
| | | | | | | | 134,918,433 | |
| | | | | | | | | |
| Information Technology — 16.4% | | | | | | | | |
| Alliance Data Systems Corp.* | | | 66,525 | | | | 14,635,500 | |
| Imperva, Inc.* | | | 206,420 | | | | 10,424,210 | |
| Lam Research Corp. | | | 123,945 | | | | 10,237,857 | |
| NICE Systems Ltd. ADR | | | 208,573 | | | | 13,513,445 | |
| NXP Semiconductors N.V. (Netherlands)* | | | 119,965 | | | | 9,725,563 | |
| Red Hat, Inc.* | | | 169,800 | | | | 12,651,798 | |
| Sabre Corp. | | | 291,020 | | | | 8,416,298 | |
| Skyworks Solutions, Inc. | | | 146,724 | | | | 11,429,800 | |
| Splunk, Inc.* | | | 206,420 | | | | 10,100,131 | |
| Vantiv, Inc.* | | | 269,710 | | | | 14,531,975 | |
| Zebra Technologies Corp. - Class A* | | | 198,825 | | | | 13,718,925 | |
| | | | | | | | 129,385,502 | |
| | | | | | | | | |
| Health Care — 16.3% | | | | | | | | |
| Agilent Technologies, Inc. | | | 286,110 | | | | 11,401,483 | |
| Align Technology, Inc.* | | | 159,401 | | | | 11,586,859 | |
| Cooper Cos., Inc. (The) | | | 85,659 | | | | 13,188,916 | |
| DENTSPLY SIRONA, Inc. | | | 180,610 | | | | 11,130,994 | |
| Endo International PLC (Ireland)* | | | 189,522 | | | | 5,335,044 | |
| ICON PLC (Ireland)* | | | 235,990 | | | | 17,722,849 | |
| Jazz Pharmaceuticals PLC (Ireland)* | | | 124,469 | | | | 16,249,428 | |
| Teleflex, Inc. | | | 104,645 | | | | 16,430,311 | |
| Veeva Systems, Inc.* | | | 461,070 | | | | 11,545,193 | |
| Zoetis, Inc. | | | 304,480 | | | | 13,497,598 | |
| | | | | | | | 128,088,675 | |
| | | | | | | | | |
| Financials — 10.8% | | | | | | | | |
| Affiliated Managers Group, Inc.* | | | 74,530 | | | | 12,103,673 | |
| Assurant, Inc. | | | 143,970 | | | | 11,107,285 | |
| BankUnited, Inc. | | | 441,030 | | | | 15,189,073 | |
| CBRE Group, Inc. - Class A* | | | 435,533 | | | | 12,552,061 | |
| Crown Castle International Corp. REIT | | | 154,915 | | | | 13,400,148 | |
| Equinix, Inc. REIT | | | 25,341 | | | | 8,380,522 | |
| MSCI, Inc. | | | 164,010 | | | | 12,149,861 | |
| | | | | | | | 84,882,623 | |
| | | | | | | | | |
| Materials — 8.0% | | | | | | | | |
| Celanese Corp. | | | 201,910 | | | | 13,225,105 | |
| Eastman Chemical Co. | | | 208,734 | | | | 15,076,857 | |
| Scotts Miracle-Gro Co. (The) - Class A | | | 203,282 | | | | 14,792,831 | |
| Vulcan Materials Co. | | | 111,860 | | | | 11,809,060 | |
| WR Grace & Co.* | | | 110,700 | | | | 7,879,626 | |
| | | | | | | | 62,783,479 | |
| | | | | | | | | |
| Consumer Staples — 4.3% | | | | | | | | |
| Constellation Brands, Inc. - Class A | | | 143,966 | | | | 21,751,823 | |
| Kellogg Co. | | | 153,150 | | | | 11,723,632 | |
| | | | | | | | 33,475,455 | |
| | | | | | | | | |
| Energy — 3.4% | | | | | | | | |
| Baker Hughes, Inc. | | | 212,690 | | | | 9,322,203 | |
| Tesoro Corp. | | | 114,852 | | | | 9,878,421 | |
| Valero Energy Corp. | | | 123,013 | | | | 7,890,054 | |
| | | | | | | | 27,090,678 | |
| Total Common Stocks | | | | | | $ | 762,977,589 | |
| | | | | | | | | |
| Investment Funds — 5.4% | | | | | | | | |
| Dreyfus Cash Management, Institutional Shares, 0.30%∞Ω | | | 25,942,552 | | | | 25,942,552 | |
| Invesco Government & Agency Portfolio, Institutional Class, 0.26%**∞Ω | | | 16,416,533 | | | | 16,416,533 | |
| Total Investment Funds | | | | | | $ | 42,359,085 | |
| | | | | | | | | |
| Total Investment Securities —102.3% | | | | | | | | |
| (Cost $682,724,806) | | | | | | $ | 805,336,674 | |
| | | | | | | | | |
| Liabilities in Excess of Other Assets — (2.3%) | | | | | | | (18,285,219 | ) |
| | | | | | | | | |
| Net Assets — 100.0% | | | | | | $ | 787,051,455 | |
Touchstone Mid Cap Growth Fund (Continued)
| * | Non-income producing security. |
| ** | Represents collateral for securities loaned. |
| † | All or a portion of the security is on loan. The total market value of the securities on loan as of March 31, 2016 was $16,001,687. |
| Ω | Represents the 7-day SEC yield as of March 31, 2016. |
Portfolio Abbreviations:
ADR - American Depositary Receipt
LLC - Limited Liability Company
PLC - Public Limited Company
REIT - Real Estate Investment Trust
Other Information:
The inputs or methodology used for valuing securities may not be an indication of the risk associated with investing in those securities. For more information on valuation inputs, and their aggregation into the levels used in the table below, please refer to the security valuation section in the accompanying Notes to Financial Statements.
Valuation inputs at Reporting Date:
| Description | | Level 1 | | | Level 2 | | | Level 3 | | | Total | |
| Common Stocks | | $ | 762,977,589 | | | $ | — | | | $ | — | | | $ | 762,977,589 | |
| Investment Funds | | | 42,359,085 | | | | — | | | | — | | | | 42,359,085 | |
| Total | | $ | 805,336,674 | | | $ | — | | | $ | — | | | $ | 805,336,674 | |
See accompanying Notes to Financial Statements.
Portfolio of Investments
Touchstone Sands Capital Emerging Markets Growth Fund – March 31, 2016
| | | | | | Market | |
| | | Shares | | | Value | |
| | | | | | | |
| Common Stocks — 66.6% | | | | | | | | |
| | | | | | | | | |
| Cayman Islands — 19.5% | | | | | | | | |
| | | | | | | | | |
| Consumer Discretionary — 4.2% | | | | | | | | |
| NagaCorp Ltd. | | | 2,858,000 | | | $ | 1,831,448 | |
| Sands China Ltd. | | | 1,193,600 | | | | 4,872,765 | |
| | | | | | | | | |
| Information Technology — 15.3% | | | | | | | | |
| Alibaba Group Holding Ltd. ADR* | | | 136,800 | | | | 10,811,304 | |
| Baidu, Inc. ADR* | | | 55,400 | | | | 10,574,752 | |
| Tencent Holdings Ltd. | | | 151,400 | | | | 3,095,277 | |
| Total Cayman Islands | | | | | | | 31,185,546 | |
| | | | | | | | | |
| South Africa — 6.4% | | | | | | | | |
| | | | | | | | | |
| Consumer Discretionary — 5.4% | | | | | | | | |
| Naspers Ltd. - Class N | | | 62,000 | | | | 8,642,785 | |
| | | | | | | | | |
| Consumer Staples — 1.0% | | | | | | | | |
| Shoprite Holdings Ltd. | | | 137,300 | | | | 1,611,620 | |
| Total South Africa | | | | | | | 10,254,405 | |
| | | | | | | | | |
| Brazil — 5.2% | | | | | | | | |
| | | | | | | | | |
| Consumer Staples — 3.6% | | | | | | | | |
| Raia Drogasil SA | | | 393,300 | | | | 5,706,468 | |
| | | | | | | | | |
| Information Technology — 1.6% | | | | | | | | |
| Cielo SA | | | 259,380 | | | | 2,517,587 | |
| Total Brazil | | | | | | | 8,224,055 | |
| | | | | | | | | |
| South Korea — 4.3% | | | | | | | | |
| | | | | | | | | |
| Consumer Staples — 2.8% | | | | | | | | |
| Amorepacific Corp. | | | 6,200 | | | | 2,096,660 | |
| LG Household & Health Care Ltd. | | | 2,900 | | | | 2,397,887 | |
| | | | | | | | | |
| Health Care — 1.5% | | | | | | | | |
| Medy-Tox, Inc.† | | | 6,075 | | | | 2,343,616 | |
| Total South Korea | | | | | | | 6,838,163 | |
| | | | | | | | | |
| Philippines — 4.0% | | | | | | | | |
| | | | | | | | | |
| Consumer Staples — 2.4% | | | | | | | | |
| Universal Robina Corp. | | | 820,100 | | | | 3,861,419 | |
| | | | | | | | | |
| Financials — 1.6% | | | | | | | | |
| SM Prime Holdings, Inc. | | | 5,273,100 | | | | 2,515,159 | |
| Total Philippines | | | | | | | 6,376,578 | |
| | | | | | | | | |
| Indonesia — 3.8% | | | | | | | | |
| | | | | | | | | |
| Financials — 2.7% | | | | | | | | |
| Bank Rakyat Indonesia Persero Tbk PT | | | 5,065,500 | | | | 4,359,094 | |
| | | | | | | | | |
| Health Care — 1.1% | | | | | | | | |
| Kalbe Farma Tbk PT | | | 15,771,600 | | | | 1,717,353 | |
| Total Indonesia | | | | | | | 6,076,447 | |
| | | | | | | | | |
| Thailand — 3.2% | | | | | | | | |
| | | | | | | | | |
| Consumer Staples — 2.0% | | | | | | | | |
| CP ALL PCL | | | 2,486,500 | | | | 3,229,543 | |
| | | | | | | | | |
| Health Care — 1.2% | | | | | | | | |
| Bangkok Dusit Medical Services PCL - Class F | | | 2,883,400 | | | | 1,915,588 | |
| Total Thailand | | | | | | | 5,145,131 | |
| | | | | | | | | |
| China — 3.0% | | | | | | | | |
| | | | | | | | | |
| Consumer Discretionary — 1.4% | | | | | | | | |
| Ctrip.com International Ltd. ADR* | | | 51,300 | | | | 2,270,538 | |
| | | | | | | | | |
| Health Care — 1.6% | | | | | | | | |
| Shandong Weigao Group Medical Polymer Co. Ltd. - Class H | | | 3,836,000 | | | | 2,446,423 | |
| Total China | | | | | | | 4,716,961 | |
| | | | | | | | | |
| United States — 2.8% | | | | | | | | |
| | | | | | | | | |
| Information Technology — 2.8% | | | | | | | | |
| MercadoLibre, Inc.† | | | 38,050 | | | | 4,484,192 | |
| | | | | | | | | |
| United Kingdom — 2.8% | | | | | | | | |
| | | | | | | | | |
| Health Care — 2.8% | | | | | | | | |
| Hikma Pharmaceuticals PLC | | | 155,500 | | | | 4,415,638 | |
| | | | | | | | | |
| Peru — 2.4% | | | | | | | | |
| | | | | | | | | |
| Financials — 2.4% | | | | | | | | |
| Credicorp Ltd. | | | 28,764 | | | | 3,768,372 | |
| | | | | | | | | |
| Turkey — 2.1% | | | | | | | | |
| | | | | | | | | |
| Consumer Staples — 2.1% | | | | | | | | |
| BIM Birlesik Magazalar AS | | | 151,800 | | | | 3,291,463 | |
| | | | | | | | | |
| Taiwan — 1.8% | | | | | | | | |
| | | | | | | | | |
| Information Technology — 1.8% | | | | | | | | |
| Taiwan Semiconductor Manufacturing Co. Ltd. ADR | | | 112,540 | | | | 2,948,548 | |
| | | | | | | | | |
| Virgin Islands (British) — 1.8% | | | | | | | | |
| | | | | | | | | |
| Information Technology — 1.8% | | | | | | | | |
| Mail.Ru Group Ltd. GDR* | | | 133,000 | | | | 2,886,100 | |
| | | | | | | | | |
| Russia — 1.8% | | | | | | | | |
| | | | | | | | | |
| Consumer Staples — 1.8% | | | | | | | | |
| Magnit OJSC GDR | | | 72,300 | | | | 2,884,387 | |
| | | | | | | | | |
| Malaysia — 1.7% | | | | | | | | |
| | | | | | | | | |
| Health Care — 1.7% | | | | | | | | |
| IHH Healthcare Bhd | | | 1,621,100 | | | | 2,725,725 | |
| Total Common Stocks | | | | | | $ | 106,221,711 | |
Touchstone Sands Capital Emerging Markets Growth Fund (Continued)
| | | Number | | | Market | |
| | | of Contracts | | | Value | |
| | | | | | | |
| Low Exercise Price Warrants — 29.2% | | | | | | | | |
| | | | | | | | | |
| India — 27.2% | | | | | | | | |
| | | | | | | | | |
| Adani Ports and Special Economic Zone | | | | | | | | |
| Strike $0.0001, Exp 9/21/16 | | | 1,350,700 | | | $ | 5,024,604 | |
| Apollo Hospitals Enterprise Ltd. | | | | | | | | |
| Strike $0.0001, Exp 9/23/16 | | | 143,100 | | | | 2,856,276 | |
| Asian Paints Ltd. | | | | | | | | |
| Strike $0.01, Exp 7/31/18 | | | 328,600 | | | | 4,284,944 | |
| Bharat Forge Ltd. | | | | | | | | |
| Strike $0.01, Exp 4/22/19 | | | 90,200 | | | | 1,182,522 | |
| Britannia Industries Ltd. | | | | | | | | |
| Strike $0.01, Exp 4/17/20 | | | 34,800 | | | | 1,411,140 | |
| Eicher Motors Ltd. | | | | | | | | |
| Strike $0.01, Exp 5/14/20 | | | 9,500 | | | | 2,750,345 | |
| Housing Development Finance Corp. | | | | | | | | |
| Strike $0.0001, Exp 5/5/16 | | | 457,000 | | | | 7,586,200 | |
| ITC Ltd. | | | | | | | | |
| Strike $0.0001, Exp 8/4/16 | | | 578,700 | | | | 2,852,991 | |
| Jubilant Foodworks Ltd. | | | | | | | | |
| Strike $0.01, Exp 7/25/17 | | | 218,200 | | | | 4,185,076 | |
| Larsen & Toubro Ltd. | | | | | | | | |
| Strike $0.01, Exp 09/18/17 | | | 141,800 | | | | 2,590,686 | |
| Lupin Ltd. | | | | | | | | |
| Strike $0.001, Exp 6/8/17 | | | 125,100 | | | | 2,779,722 | |
| Shriram Transport Finance Co. Ltd. | | | | | | | | |
| Strike $0.01, Exp 8/29/18 | | | 206,100 | | | | 2,949,291 | |
| Zee Entertainment Enterprises Ltd. | | | | | | | | |
| Strike $0.01, Exp 3/1/17 | | | 492,600 | | | | 2,862,006 | |
| Total India | | | | | | | 43,315,803 | |
| | | | | | | | | |
| Saudi Arabia — 2.0% | | | | | | | | |
| | | | | | | | | |
| Almarai Co. Ltd. | | | | | | | | |
| Strike $0.0001, Exp 3/13/17 | | | 66,700 | | | | 1,214,808 | |
| Almarai Co. Ltd. | | | | | | | | |
| Strike $0.0001, Exp 4/08/19 | | | 110,200 | | | | 2,007,260 | |
| Total Saudi Arabia | | | | | | | 3,222,068 | |
| Total Low Exercise Price Warrants | | | | | | $ | 46,537,871 | |
| | | Shares | | | | |
| | | | | | | |
| Investment Funds — 8.0% | | | | | | | | |
| Dreyfus Cash Management, Institutional Shares, 0.30%∞Ω | | | 7,767,346 | | | | 7,767,346 | |
| Invesco Government & Agency Portfolio, Institutional Class, 0.26%**∞Ω | | | 5,072,381 | | | | 5,072,381 | |
| Total Investment Funds | | | | | | $ | 12,839,727 | |
| | | Market | |
| | | Value | |
| | | | |
| Total Investment Securities —103.8% | | | | |
| (Cost $161,430,840) | | $ | 165,599,309 | |
| | | | | |
| Liabilities in Excess of Other Assets — (3.8%) | | | (6,092,570 | ) |
| | | | | |
| Net Assets — 100.0% | | $ | 159,506,739 | |
| * | Non-income producing security. |
| ** | Represents collateral for securities loaned. |
| † | All or a portion of the security is on loan. The total market value of the securities on loan as of March 31, 2016 was $4,942,540. |
| Ω | Represents the 7-day SEC yield as of March 31, 2016. |
Portfolio Abbreviations:
ADR - American Depositary Receipt
GDR - Global Depositary Receipt
PCL - Public Company Limited
PLC - Public Limited Company
Touchstone Sands Capital Emerging Markets Growth Fund (Continued)
Other Information:
The inputs or methodology used for valuing securities may not be an indication of the risk associated with investing in those securities. For more information on valuation inputs, and their aggregation into the levels used in the table below, please refer to the security valuation section in the accompanying Notes to Financial Statements.
Valuation inputs at Reporting Date:
| Description | | Level 1 | | | Level 2 | | | Level 3 | | | Total | |
| | | | | | | | | | | | | |
| Common Stocks | | | | | | | | | | | | | | | | |
| Cayman Islands | | $ | 21,386,056 | | | $ | 9,799,490 | | | $ | — | | | $ | 31,185,546 | |
| South Africa | | | — | | | | 10,254,405 | | | | — | | | | 10,254,405 | |
| Brazil | | | 8,224,055 | | | | — | | | | — | | | | 8,224,055 | |
| South Korea | | | — | | | | 6,838,163 | | | | — | | | | 6,838,163 | |
| Philippines | | | — | | | | 6,376,578 | | | | — | | | | 6,376,578 | |
| Indonesia | | | — | | | | 6,076,447 | | | | — | | | | 6,076,447 | |
| Thailand | | | — | | | | 5,145,131 | | | | — | | | | 5,145,131 | |
| China | | | 2,270,538 | | | | 2,446,423 | | | | — | | | | 4,716,961 | |
| United States | | | 4,484,192 | | | | — | | | | — | | | | 4,484,192 | |
| United Kingdom | | | — | | | | 4,415,638 | | | | — | | | | 4,415,638 | |
| Peru | | | 3,768,372 | | | | — | | | | — | | | | 3,768,372 | |
| Turkey | | | — | | | | 3,291,463 | | | | — | | | | 3,291,463 | |
| Taiwan | | | 2,948,548 | | | | — | | | | — | | | | 2,948,548 | |
| Virgin Islands (British) | | | 2,886,100 | | | | — | | | | — | | | | 2,886,100 | |
| Russia | | | — | | | | 2,884,387 | | | | — | | | | 2,884,387 | |
| Malaysia | | | 2,725,725 | | | | — | | | | — | | | | 2,725,725 | |
| Low Exercise Price Warrants | | | | | | | | | | | | | | | | |
| India | | | — | | | | 43,315,803 | | | | — | | | | 43,315,803 | |
| Saudi Arabia | | | — | | | | 3,222,068 | | | | — | | | | 3,222,068 | |
| Investment Funds | | | 12,839,727 | | | | — | | | | — | | | | 12,839,727 | |
| Total | | $ | 61,533,313 | | | $ | 104,065,996 | | | $ | — | | | $ | 165,599,309 | |
At March 31, 2016, equity securities valued at $4,134,475 and $2,886,100 were transferred from Level 1 to Level 2 and from Level 2 to Level 1, respectively. Transfers from Level 1 to Level 2 are due to significant movement of a designated U.S. market index, triggering a systematic valuation model, provided by an independent third party, when required confidence levels are achieved to fair value the international equity securities. Transfers from Level 2 to Level 1 occur when the movement of the designated U.S. market index is no longer significant or required confidence levels were not reached in the systematic model.
See accompanying Notes to Financial Statements.
Portfolio of Investments
Touchstone Small Cap Growth Fund – March 31, 2016
| | | | | | Market | |
| | | Shares | | | Value | |
| | | | | | | |
| Common Stocks — 99.0% | | | | | | | | |
| | | | | | | | | |
| Information Technology — 26.2% | | | | | | | | |
| Arris International PLC* | | | 260,537 | | | $ | 5,971,508 | |
| BroadSoft, Inc.* | | | 183,154 | | | | 7,390,264 | |
| Ciena Corp.* | | | 349,732 | | | | 6,651,903 | |
| Cimpress NV (Netherlands)*† | | | 78,193 | | | | 7,091,323 | |
| Cirrus Logic, Inc.* | | | 216,942 | | | | 7,898,858 | |
| comScore, Inc.* | | | 173,239 | | | | 5,204,100 | |
| Euronet Worldwide, Inc.* | | | 240,681 | | | | 17,836,869 | |
| Infinera Corp.* | | | 485,486 | | | | 7,796,905 | |
| j2 Global, Inc.† | | | 125,153 | | | | 7,706,922 | |
| Manhattan Associates, Inc.* | | | 223,679 | | | | 12,720,625 | |
| MAXIMUS, Inc. | | | 162,620 | | | | 8,560,317 | |
| Mellanox Technologies Ltd. (Israel)* | | | 183,843 | | | | 9,988,190 | |
| Mentor Graphics Corp. | | | 284,668 | | | | 5,787,300 | |
| Power Integrations, Inc. | | | 135,948 | | | | 6,751,178 | |
| Super Micro Computer, Inc.* | | | 167,090 | | | | 5,694,427 | |
| Synaptics, Inc.* | | | 78,285 | | | | 6,242,446 | |
| Syntel, Inc.* | | | 136,760 | | | | 6,828,427 | |
| VeriFone Systems, Inc.* | | | 273,842 | | | | 7,733,298 | |
| Verint Systems, Inc.* | | | 167,205 | | | | 5,581,303 | |
| Virtusa Corp.* | | | 184,229 | | | | 6,901,218 | |
| | | | | | | | 156,337,381 | |
| | | | | | | | | |
| Health Care — 25.7% | | | | | | | | |
| ABIOMED, Inc.* | | | 158,234 | | | | 15,002,166 | |
| Acadia Pharmaceuticals, Inc.* | | | 115,647 | | | | 3,233,490 | |
| Agios Pharmaceuticals, Inc.*† | | | 42,177 | | | | 1,712,386 | |
| Akorn, Inc.* | | | 259,024 | | | | 6,094,835 | |
| Alder Biopharmaceuticals, Inc.* | | | 71,234 | | | | 1,744,521 | |
| AMN Healthcare Services, Inc.* | | | 255,915 | | | | 8,601,303 | |
| Anacor Pharmaceuticals, Inc.* | | | 31,538 | | | | 1,685,706 | |
| ANI Pharmaceuticals, Inc.*† | | | 112,344 | | | | 3,781,499 | |
| Bluebird Bio, Inc.* | | | 34,013 | | | | 1,445,553 | |
| Cambrex Corp.* | | | 195,479 | | | | 8,601,076 | |
| Charles River Laboratories International, Inc.* | | | 160,271 | | | | 12,170,980 | |
| Chemed Corp. | | | 74,126 | | | | 10,040,367 | |
| China Biologic Products, Inc.* | | | 75,388 | | | | 8,630,418 | |
| Enanta Pharmaceuticals, Inc.*† | | | 139,828 | | | | 4,106,748 | |
| Globus Medical, Inc. - Class A* | | | 169,472 | | | | 4,024,960 | |
| Horizon Pharma PLC* | | | 360,847 | | | | 5,979,235 | |
| ICON PLC (Ireland)* | | | 222,220 | | | | 16,688,722 | |
| Insulet Corp.* | | | 117,123 | | | | 3,883,799 | |
| Medidata Solutions, Inc.* | | | 173,991 | | | | 6,735,192 | |
| Momenta Pharmaceuticals, Inc.* | | | 271,164 | | | | 2,505,555 | |
| Natus Medical, Inc.* | | | 217,289 | | | | 8,350,416 | |
| Ophthotech Corp.* | | | 119,375 | | | | 5,045,981 | |
| Radius Health, Inc.*† | | | 53,068 | | | | 1,668,458 | |
| Steris PLC | | | 103,865 | | | | 7,379,608 | |
| Tandem Diabetes Care, Inc.* | | | 187,313 | | | | 1,631,496 | |
| Veeva Systems, Inc.*† | | | 123,308 | | | | 3,087,632 | |
| | | | | | | | 153,832,102 | |
| | | | | | | | | |
| Consumer Discretionary — 19.1% | | | | | | | | |
| Burlington Stores, Inc.* | | | 242,601 | | | | 13,643,880 | |
| Columbia Sportswear Co. | | | 63,162 | | | | 3,795,405 | |
| Cooper Tire & Rubber Co. | | | 215,809 | | | | 7,989,249 | |
| Cracker Barrel Old Country Store, Inc.† | | | 59,174 | | | | 9,034,095 | |
| DineEquity, Inc. | | | 81,787 | | | | 7,641,359 | |
| G-III Apparel Group Ltd.* | | | 193,432 | | | | 9,456,891 | |
| Imax Corp. (Canada)*† | | | 190,371 | | | | 5,918,634 | |
| La-Z-Boy, Inc. | | | 313,602 | | | | 8,385,717 | |
| Lithia Motors, Inc. - Class A | | | 101,282 | | | | 8,844,957 | |
| Marriott Vacations Worldwide Corp. | | | 112,205 | | | | 7,573,838 | |
| Pinnacle Entertainment, Inc.* | | | 129,753 | | | | 4,554,330 | |
| Restoration Hardware Holdings, Inc.*† | | | 116,532 | | | | 4,882,691 | |
| Ruth’s Hospitality Group, Inc. | | | 251,625 | | | | 4,632,416 | |
| Skechers U.S.A., Inc. - Class A* | | | 371,640 | | | | 11,316,438 | |
| Sportsman’s Warehouse Holdings, Inc.*† | | | 510,864 | | | | 6,436,886 | |
| | | | | | | | 114,106,786 | |
| | | | | | | | | |
| Industrials — 9.7% | | | | | | | | |
| Astronics Corp.* | | | 174,489 | | | | 6,656,755 | |
| AZZ, Inc. | | | 145,626 | | | | 8,242,432 | |
| CaesarStone Sdot - Yam Ltd. (Israel)* | | | 159,559 | | | | 5,480,852 | |
| Hexcel Corp. | | | 163,994 | | | | 7,168,178 | |
| Korn/Ferry International | | | 250,809 | | | | 7,095,387 | |
| Proto Labs, Inc.*† | | | 100,008 | | | | 7,709,617 | |
| Saia, Inc.* | | | 195,303 | | | | 5,497,779 | |
| Trex Co., Inc.* | | | 130,159 | | | | 6,238,521 | |
| Tutor Perini Corp.* | | | 261,916 | | | | 4,070,175 | |
| | | | | | | | 58,159,696 | |
| | | | | | | | | |
| Financials — 9.5% | | | | | | | | |
| Amtrust Financial Services, Inc. | | | 147,967 | | | | 3,829,386 | |
| BofI Holding, Inc.*† | | | 290,495 | | | | 6,199,163 | |
| E-House China Holdings Ltd. ADR† | | | 391,708 | | | | 2,436,424 | |
| Financial Engines, Inc.† | | | 176,870 | | | | 5,559,024 | |
| Green Dot Corp. - Class A* | | | 356,137 | | | | 8,180,467 | |
| HFF, Inc. - Class A | | | 150,416 | | | | 4,140,952 | |
| Interactive Brokers Group, Inc. - Class A | | | 206,126 | | | | 8,104,874 | |
| Janus Capital Group, Inc. | | | 491,020 | | | | 7,183,623 | |
| MarketAxess Holdings, Inc. | | | 59,433 | | | | 7,419,021 | |
| PRA Group, Inc.* | | | 133,345 | | | | 3,919,010 | |
| | | | | | | | 56,971,944 | |
| | | | | | | | | |
| Energy — 3.5% | | | | | | | | |
| Carrizo Oil & Gas, Inc.* | | | 191,686 | | | | 5,926,931 | |
| Diamondback Energy, Inc.* | | | 85,290 | | | | 6,582,682 | |
| Matador Resources Co.* | | | 207,724 | | | | 3,938,447 | |
| Matrix Service Co.* | | | 265,244 | | | | 4,694,819 | |
| | | | | | | | 21,142,879 | |
| | | | | | | | | |
| Consumer Staples — 3.3% | | | | | | | | |
| B&G Foods, Inc. | | | 183,025 | | | | 6,371,100 | |
| Boston Beer Co., Inc. (The) - Class A*† | | | 31,699 | | | | 5,866,534 | |
| Hain Celestial Group, Inc. (The)* | | | 186,997 | | | | 7,650,047 | |
| | | | | | | | 19,887,681 | |
| | | | | | | | | |
| Materials — 2.0% | | | | | | | | |
| KapStone Paper and Packaging Corp. | | | 292,593 | | | | 4,052,413 | |
| Silgan Holdings, Inc. | | | 145,901 | | | | 7,757,556 | |
| | | | | | | | 11,809,969 | |
| Total Common Stocks | | | | | | $ | 592,248,438 | |
Touchstone Small Cap Growth Fund (Continued)
| | | | | | Market | |
| | | Shares | | | Value | |
| | | | | | | |
| Investment Funds — 8.8% | | | | | | | | |
| Dreyfus Cash Management, Institutional Shares, 0.30%∞Ω | | | 4,204,714 | | | $ | 4,204,714 | |
| Invesco Government & Agency Portfolio, Institutional Class, 0.26%**∞Ω | | | 48,567,709 | | | | 48,567,709 | |
| Total Investment Funds | | | | | | $ | 52,772,423 | |
| | | | | | | | | |
| Total Investment Securities —107.8% | | | | | | | | |
| (Cost $664,685,978) | | | | | | $ | 645,020,861 | |
| | | | | | | | | |
| Liabilities in Excess of Other Assets — (7.8%) | | | | | | | (46,821,324 | ) |
| | | | | | | | | |
| Net Assets — 100.0% | | | | | | $ | 598,199,537 | |
| * | Non-income producing security. |
| ** | Represents collateral for securities loaned. |
| † | All or a portion of the security is on loan. The total market value of the securities on loan as of March 31, 2016 was $47,715,562. |
| Ω | Represents the 7-day SEC yield as of March 31, 2016. |
Portfolio Abbreviations:
ADR - American Depositary Receipt
PLC - Public Limited Company
Other Information:
The inputs or methodology used for valuing securities may not be an indication of the risk associated with investing in those securities. For more information on valuation inputs, and their aggregation into the levels used in the table below, please refer to the security valuation section in the accompanying Notes to Financial Statements.
Valuation inputs at Reporting Date:
| Description | | Level 1 | | | Level 2 | | | Level 3 | | | Total | |
| | | | | | | | | | | | | |
| Common Stocks | | $ | 592,248,438 | | | $ | — | | | $ | — | | | $ | 592,248,438 | |
| Investment Funds | | | 52,772,423 | | | | — | | | | — | | | | 52,772,423 | |
| Total | | $ | 645,020,861 | | | $ | — | | | $ | — | | | $ | 645,020,861 | |
See accompanying Notes to Financial Statements.
Portfolio of Investments
Touchstone Sustainability and Impact Equity Fund – March 31, 2016
| | | | | | Market | |
| | | Shares | | | Value | |
| | | | | | | |
| Common Stocks — 96.6% | | | | | | | | |
| | | | | | | | | |
| United States — 58.0% | | | | | | | | |
| | | | | | | | | |
| Consumer Discretionary — 4.4% | | | | | | | | |
| Buffalo Wild Wings, Inc.* | | | 19,699 | | | $ | 2,917,816 | |
| Comcast Corp. - Class A | | | 88,964 | | | | 5,433,921 | |
| Ford Motor Co. | | | 259,331 | | | | 3,500,968 | |
| | | | | | | | | |
| Consumer Staples — 2.5% | | | | | | | | |
| CVS Health Corp. | | | 65,443 | | | | 6,788,402 | |
| | | | | | | | | |
| Energy — 2.2% | | | | | | | | |
| Apache Corp. | | | 81,972 | | | | 4,001,053 | |
| Noble Energy, Inc. | | | 57,010 | | | | 1,790,684 | |
| | | | | | | | | |
| Financials — 11.8% | | | | | | | | |
| Aflac, Inc. | | | 91,914 | | | | 5,803,450 | |
| Annaly Capital Management, Inc. REIT | | | 352,851 | | | | 3,620,251 | |
| Discover Financial Services | | | 60,723 | | | | 3,092,015 | |
| JPMorgan Chase & Co. | | | 116,168 | | | | 6,879,469 | |
| Reinsurance Group of America, Inc. | | | 69,774 | | | | 6,715,748 | |
| Wells Fargo & Co. | | | 114,588 | | | | 5,541,476 | |
| | | | | | | | | |
| Health Care — 10.0% | | | | | | | | |
| Basalt, Inc. | | | 51,313 | | | | 2,073,045 | |
| Becton Dickinson and Co. | | | 27,439 | | | | 4,165,789 | |
| Cerner Corp.* | | | 59,068 | | | | 3,128,241 | |
| Express Scripts Holding Co.* | | | 64,681 | | | | 4,442,938 | |
| Merck & Co., Inc. | | | 94,467 | | | | 4,998,249 | |
| Regeneron Pharmaceuticals, Inc.* | | | 6,825 | | | | 2,460,003 | |
| St Jude Medical, Inc. | | | 74,556 | | | | 4,100,580 | |
| Ultragenyx Pharmaceutical, Inc.* | | | 22,533 | | | | 1,426,564 | |
| | | | | | | | | |
| Industrials — 6.6% | | | | | | | | |
| Roper Technologies, Inc. | | | 22,992 | | | | 4,202,247 | |
| Southwest Airlines Co. | | | 169,998 | | | | 7,615,910 | |
| United Continental Holdings, Inc.* | | | 96,271 | | | | 5,762,782 | |
| | | | | | | | | |
| Information Technology — 14.6% | | | | | | | | |
| Alphabet, Inc. - Class A* | | | 14,412 | | | | 10,994,915 | |
| Apple, Inc. | | | 75,182 | | | | 8,194,086 | |
| Microsoft Corp. | | | 148,147 | | | | 8,182,159 | |
| Oracle Corp. | | | 121,459 | | | | 4,968,887 | |
| Visa, Inc. - Class A | | | 90,045 | | | | 6,886,642 | |
| | | | | | | | | |
| Materials — 0.8% | | | | | | | | |
| Praxair, Inc. | | | 18,689 | | | | 2,138,956 | |
| | | | | | | | | |
| Telecommunication Services — 1.4% | | | | | | | | |
| SBA Communications Corp. - Class A* | | | 38,710 | | | | 3,877,581 | |
| | | | | | | | | |
| Utilities — 3.7% | | | | | | | | |
| American Water Works Co., Inc. | | | 145,387 | | | | 10,021,526 | |
| Total United States | | | | | | | 155,726,353 | |
| | | | | | | | | |
| Japan — 10.4% | | | | | | | | |
| | | | | | | | | |
| Consumer Discretionary — 0.6% | | | | | | | | |
| NGK Spark Plug Co. Ltd. | | | 81,200 | | | | 1,554,919 | |
| | | | | | | | | |
| Industrials — 4.3% | | | | | | | | |
| Amada Holdings Co. Ltd. | | | 302,100 | | | | 2,943,595 | |
| Kinden Corp. | | | 321,300 | | | | 3,938,258 | |
| Nabtesco Corp. | | | 100,900 | | | | 2,263,223 | |
| SMC Corp. | | | 10,600 | | | | 2,456,318 | |
| | | | | | | | | |
| Telecommunication Services — 4.1% | | | | | | | | |
| Nippon Telegraph & Telephone Corp. | | | 256,900 | | | | 11,097,440 | |
| | | | | | | | | |
| Utilities — 1.4% | | | | | | | | |
| Tokyo Gas Co. Ltd. | | | 790,000 | | | | 3,682,543 | |
| Total Japan | | | | | | | 27,936,296 | |
| | | | | | | | | |
| United Kingdom — 9.5% | | | | | | | | |
| | | | | | | | | |
| Consumer Discretionary — 3.2% | | | | | | | | |
| Delphi Automotive PLC | | | 76,353 | | | | 5,728,002 | |
| InterContinental Hotels Group PLC | | | 70,128 | | | | 2,885,505 | |
| | | | | | | | | |
| Consumer Staples — 1.1% | | | | | | | | |
| Unilever PLC ADR | | | 64,560 | | | | 2,916,821 | |
| | | | | | | | | |
| Financials — 2.5% | | | | | | | | |
| Lloyds Banking Group PLC | | | 3,762,032 | | | | 3,664,201 | |
| Prudential PLC | | | 166,571 | | | | 3,099,621 | |
| | | | | | | | | |
| Industrials — 2.7% | | | | | | | | |
| Intertie Group PLC | | | 53,545 | | | | 2,431,190 | |
| Pentair PLC | | | 86,515 | | | | 4,694,304 | |
| Total United Kingdom | | | | | | | 25,419,644 | |
| | | | | | | | | |
| Netherlands — 3.6% | | | | | | | | |
| | | | | | | | | |
| Financials — 2.9% | | | | | | | | |
| ABN AMRO Group N.V.* | | | 71,880 | | | | 1,472,672 | |
| ING Groep NV | | | 532,722 | | | | 6,375,001 | |
| | | | | | | | | |
| Information Technology — 0.7% | | | | | | | | |
| InterXion Holding NV* | | | 56,982 | | | | 1,970,438 | |
| Total Netherlands | | | | | | | 9,818,111 | |
| | | | | | | | | |
| Germany — 3.3% | | | | | | | | |
| | | | | | | | | |
| Consumer Discretionary — 0.6% | | | | | | | | |
| Bayerische Motoren Werke AG | | | 17,241 | | | | 1,582,826 | |
| | | | | | | | | |
| Materials — 2.7% | | | | | | | | |
| Heidelberg Cement AG | | | 86,359 | | | | 7,379,847 | |
| Total Germany | | | | | | | 8,962,673 | |
| | | | | | | | | |
| Switzerland — 3.0% | | | | | | | | |
| | | | | | | | | |
| Health Care — 2.0% | | | | | | | | |
| Novartis AG | | | 73,608 | | | | 5,325,681 | |
| | | | | | | | | |
| Information Technology — 1.0% | | | | | | | | |
| TE Connectivity Ltd. | | | 42,305 | | | | 2,619,526 | |
| Total Switzerland | | | | | | | 7,945,207 | |
Touchstone Sustainability and Impact Equity Fund (Continued)
| | | | | | Market | |
| | | Shares | | | Value | |
| | | | | | | |
| Common Stocks — 96.6% (Continued) | | | | | | | | |
| | | | | | | | | |
| China — 2.4% | | | | | | | | |
| | | | | | | | | |
| Consumer Discretionary — 0.8% | | | | | | | | |
| Ctrip.com International Ltd. ADR* | | | 50,162 | | | $ | 2,220,170 | |
| | | | | | | | | |
| Information Technology — 1.6% | | | | | | | | |
| Baidu, Inc. ADR* | | | 22,398 | | | | 4,275,330 | |
| Total China | | | | | | | 6,495,500 | |
| | | | | | | | | |
| France — 2.1% | | | | | | | | |
| | | | | | | | | |
| Industrials — 2.1% | | | | | | | | |
| Cie de Saint-Gobain | | | 90,861 | | | | 3,991,006 | |
| Schneider Electric SE | | | 27,902 | | | | 1,758,401 | |
| Total France | | | | | | | 5,749,407 | |
| | | | | | | | | |
| Ireland — 2.0% | | | | | | | | |
| | | | | | | | | |
| Health Care — 2.0% | | | | | | | | |
| Mallinckrodt PLC* | | | 54,820 | | | | 3,359,370 | |
| Shire PLC ADR | | | 12,334 | | | | 2,120,215 | |
| Total Ireland | | | | | | | 5,479,585 | |
| | | | | | | | | |
| Sweden — 1.3% | | | | | | | | |
| | | | | | | | | |
| Financials — 1.3% | | | | | | | | |
| Swedbank AB - Class A | | | 158,177 | | | | 3,397,090 | |
| | | | | | | | | |
| Indonesia — 0.7% | | | | | | | | |
| | | | | | | | | |
| Financials — 0.7% | | | | | | | | |
| Bank Rakyat Indonesia Persero Tbk PT | | | 2,081,200 | | | | 1,790,967 | |
| | | | | | | | | |
| South Korea — 0.3% | | | | | | | | |
| | | | | | | | | |
| Telecommunication Services — 0.3% | | | | | | | | |
| KT Corp. ADR* | | | 67,504 | | | | 905,904 | |
| Total Common Stocks | | | | | | $ | 259,626,737 | |
| | | | | | | | | |
| Investment Fund — 3.2% | | | | | | | | |
| Dreyfus Cash Management, Institutional Shares, 0.30%∞Ω | | | 8,639,596 | | | $ | 8,639,596 | |
| | | | | | | | | |
| Total Investment Securities —99.8% | | | | | | | | |
| (Cost $270,831,888) | | | | | | $ | 268,266,333 | |
| | | | | | | | | |
| Other Assets in Excess of Liabilities — 0.2% | | | | | | | 412,016 | |
| | | | | | | | | |
| Net Assets — 100.0% | | | | | | $ | 268,678,349 | |
| * | Non-income producing security. |
| Ω | Represents the 7-day SEC yield as of March 31, 2016. |
Portfolio Abbreviations:
ADR - American Depositary Receipt
PLC - Public Limited Company
REIT - Real Estate Investment Trust
Other Information:
The inputs or methodology used for valuing securities may not be an indication of the risk associated with investing in those securities. For more information on valuation inputs, and their aggregation into the levels used in the table below, please refer to the security valuation section in the accompanying Notes to Financial Statements.
Valuation inputs at Reporting Date:
| Description | | Level 1 | | | Level 2 | | | Level 3 | | | Total | |
| | | | | | | | | | | | | |
| Common Stocks | | | | | | | | | | | | | | | | |
| United States | | $ | 155,726,353 | | | $ | — | | | $ | — | | | $ | 155,726,353 | |
| Japan | | | — | | | | 27,936,296 | | | | — | | | | 27,936,296 | |
| United Kingdom | | | 13,339,127 | | | | 12,080,517 | | | | — | | | | 25,419,644 | |
| Netherlands | | | 3,443,110 | | | | 6,375,001 | | | | — | | | | 9,818,111 | |
| Germany | | | — | | | | 8,962,673 | | | | — | | | | 8,962,673 | |
| Switzerland | | | 2,619,526 | | | | 5,325,681 | | | | — | | | | 7,945,207 | |
| China | | | 6,495,500 | | | | — | | | | — | | | | 6,495,500 | |
| France | | | — | | | | 5,749,407 | | | | — | | | | 5,749,407 | |
| Ireland | | | 5,479,585 | | | | — | | | | — | | | | 5,479,585 | |
| Sweden | | | — | | | | 3,397,090 | | | | — | | | | 3,397,090 | |
| Indonesia | | | — | | | | 1,790,967 | | | | — | | | | 1,790,967 | |
| South Korea | | | 905,904 | | | | — | | | | — | | | | 905,904 | |
| Investment Fund | | | 8,639,596 | | | | — | | | | — | | | | 8,639,596 | |
| Total | | $ | 196,648,701 | | | $ | 71,617,632 | | | $ | — | | | $ | 268,266,333 | |
See accompanying Notes to Financial Statements.
Statements of Assets and Liabilities
March 31, 2016
| | | Touchstone | | | | | | Touchstone | | | Touchstone | |
| | | Flexible | | | Touchstone | | | Growth | | | International | |
| | | Income | | | Focused | | | Opportunities | | | Value | |
| | | Fund | | | Fund | | | Fund | | | Fund | |
| Assets | | | | | | | | | | | | | | | | |
| Investments, at cost | | $ | 560,576,034 | | | $ | 1,198,452,351 | | | $ | 298,042,142 | | | $ | 50,862,954 | |
| Investments, at market value (A) | | $ | 563,954,519 | | | $ | 1,368,388,833 | | | $ | 324,096,501 | | | $ | 43,463,718 | |
| Cash | | | — | | | | — | | | | — | | | | — | |
| Cash deposits held at prime broker* | | | 270,000 | | | | — | | | | — | | | | — | |
| Foreign Currency (B) | | | 5,665 | | | | — | | | | — | | | | 118,019 | |
| Unrealized appreciation on forward foreign currency contracts | | | 124,674 | | | | — | | | | — | | | | — | |
| Dividends and interest receivable | | | 4,323,171 | | | | 2,731,235 | | | | 190,863 | | | | 164,119 | |
| Receivable for capital shares sold | | | 6,320,717 | | | | 7,060,720 | | | | 197,556 | | | | 2,529 | |
| Receivable for investments sold | | | 1,532,632 | | | | 9,911,311 | | | | 1,512,317 | | | | 23,544 | |
| Receivable for swap agreements sold | | | 23,999 | | | | — | | | | — | | | | — | |
| Receivable for securities lending income | | | 5,176 | | | | 7,950 | | | | 4,809 | | | | 1,218 | |
| Tax reclaim receivable | | | 20,100 | | | | 144,903 | | | | 1,896 | | | | 137,140 | |
| Other assets | | | 30,480 | | | | 34,935 | | | | 20,657 | | | | 5,241 | |
| Total Assets | | | 576,611,133 | | | | 1,388,279,887 | | | | 326,024,599 | | | | 43,915,528 | |
| | | | | | | | | | | | | | | | | |
| Liabilities | | | | | | | | | | | | | | | | |
| Bank overdrafts | | | 55,319 | | | | — | | | | 5,557 | | | | — | |
| Unrealized depreciation on forward foreign currency contracts | | | 1,675,788 | | | | — | | | | — | | | | — | |
| Payable for return of collateral for securities on loan | | | 10,694,764 | | | | 27,236,852 | | | | 15,719,585 | | | | 658,560 | |
| Payable for capital shares redeemed | | | 1,014,475 | | | | 1,538,884 | | | | 104,792 | | | | 10,498 | |
| Payable for investments purchased | | | 19,221,544 | | | | 5,542,360 | | | | — | | | | — | |
| Payable to Investment Advisor | | | 270,183 | | | | 691,972 | | | | 182,556 | | | | 32,197 | |
| Payable to other affiliates | | | 40,538 | | | | 249,446 | | | | 37,184 | | | | 245 | |
| Payable to Trustees | | | 4,202 | | | | 4,202 | | | | 4,202 | | | | 4,202 | |
| Payable for professional services | | | 28,867 | | | | 35,121 | | | | 23,763 | | | | 27,249 | |
| Payable to Transfer Agent | | | 116,396 | | | | 422,431 | | | | 53,106 | | | | 6,739 | |
| Other accrued expenses and liabilities | | | 29,541 | | | | 57,991 | | | | 19,617 | | | | 29,221 | |
| Total Liabilities | | | 33,151,617 | | | | 35,779,259 | | | | 16,150,362 | | | | 768,911 | |
| | | | | | | | | | | | | | | | | |
| Net Assets | | $ | 543,459,516 | | | $ | 1,352,500,628 | | | $ | 309,874,237 | | | $ | 43,146,617 | |
| | | | | | | | | | | | | | | | | |
| Net assets consist of: | | | | | | | | | | | | | | | | |
| Paid-in capital | | $ | 552,541,698 | | | $ | 1,162,894,819 | | | $ | 297,611,594 | | | $ | 171,274,916 | |
| Accumulated net investment income (loss) | | | 487,772 | | | | 7,223,788 | | | | — | | | | 2,225,347 | |
| Accumulated net realized gains (losses) on investments, futures contracts, written options, swap agreements and foreign currency transactions | | | (11,355,945 | ) | | | 12,445,539 | | | | (13,791,716 | ) | | | (122,949,900 | ) |
| Net unrealized appreciation (depreciation) on investments and foreign currency transactions | | | 1,785,991 | | | | 169,936,482 | | | | 26,054,359 | | | | (7,403,746 | ) |
| Net Assets | | $ | 543,459,516 | | | $ | 1,352,500,628 | | | $ | 309,874,237 | | | $ | 43,146,617 | |
| (A) Includes market value of securities on loan of: | | $ | 10,313,899 | | | $ | 26,090,591 | | | $ | 15,356,209 | | | $ | 442,478 | |
| (B) Cost of foreign currency: | | $ | 6,041 | | | $ | — | | | $ | — | | | $ | 118,131 | |
* Represents segregated cash for forward foreign currency contracts.
See accompanying Notes to Financial Statements.
Statements of Assets and Liabilities (Continued)
| | | | Touchstone | | | | | | | |
| Touchstone | | | Sands Capital | | | | | | Touchstone | |
| Mid Cap | | | Emerging | | | Touchstone | | | Sustainability | |
| Growth | | | Markets | | | Small Cap | | | and Impact | |
| Fund | | | Growth Fund | | | Growth Fund | | | Equity Fund | |
| | | | | | | | | | | | | | | |
| $ | 682,724,806 | | | $ | 161,430,840 | | | $ | 664,685,978 | | | $ | 270,831,888 | |
| $ | 805,336,674 | | | $ | 165,599,309 | | | $ | 645,020,861 | | | $ | 268,266,333 | |
| | — | | | | 68,009 | | | | 21 | | | | — | |
| | — | | | | — | | | | — | | | | — | |
| | — | | | | 19,732 | | | | — | | | | 14 | |
| | — | | | | — | | | | — | | | | — | |
| | 213,392 | | | | 147,961 | | | | 237,415 | | | | 565,566 | |
| | 1,099,859 | | | | 375,694 | | | | 4,284,858 | | | | 371,471 | |
| | 2,730,047 | | | | — | | | | — | | | | 2,394,384 | |
| | — | | | | — | | | | — | | | | — | |
| | 19,600 | | | | 1,986 | | | | 39,671 | | | | 74 | |
| | — | | | | 5,434 | | | | 1,156 | | | | 64,179 | |
| | 31,918 | | | | 14,893 | | | | 63,902 | | �� | | 21,579 | |
| | 809,431,490 | | | | 166,233,018 | | | | 649,647,884 | | | | 271,683,600 | |
| | | | | | | | | | | | | | | |
| | | | | | | | | | | | | | | |
| | — | | | | — | | | | — | | | | — | |
| | — | | | | — | | | | — | | | | — | |
| | 16,416,533 | | | | 5,072,381 | | | | 48,567,709 | | | | — | |
| | 1,530,371 | | | | 81,591 | | | | 2,222,490 | | | | 500,777 | |
| | 3,434,274 | | | | 1,364,172 | | | | — | | | | 2,096,441 | |
| | 475,906 | | | | 133,210 | | | | 452,970 | | | | 176,454 | |
| | 246,831 | | | | 727 | | | | 25,061 | | | | 74,482 | |
| | 4,202 | | | | 4,202 | | | | 4,202 | | | | 4,202 | |
| | 30,158 | | | | 34,538 | | | | 24,966 | | | | 26,183 | |
| | 191,979 | | | | 14,854 | | | | 112,477 | | | | 88,298 | |
| | 49,781 | | | | 20,604 | | | | 38,472 | | | | 38,414 | |
| | 22,380,035 | | | | 6,726,279 | | | | 51,448,347 | | | | 3,005,251 | |
| | | | | | | | | | | | | | | |
| $ | 787,051,455 | | | $ | 159,506,739 | | | $ | 598,199,537 | | | $ | 268,678,349 | |
| | | | | | | | | | | | | | | |
| | | | | | | | | | | | | | | |
| $ | 690,945,366 | | | $ | 167,194,532 | | | $ | 617,493,659 | | | $ | 285,898,163 | |
| | 224,351 | | | | (168,033 | ) | | | (695,134 | ) | | | — | |
| | | | | | | | | | | | | | | |
| | | | | | | | | | | | | | | |
| | (26,730,130 | ) | | | (11,684,861 | ) | | | 1,066,129 | | | | (14,658,758 | ) |
| | | | | | | | | | | | | | | |
| | 122,611,868 | | | | 4,165,101 | | | | (19,665,117 | ) | | | (2,561,056 | ) |
| $ | 787,051,455 | | | $ | 159,506,739 | | | $ | 598,199,537 | | | $ | 268,678,349 | |
| $ | 16,001,687 | | | $ | 4,942,540 | | | $ | 47,715,562 | | | $ | — | |
| $ | — | | | $ | 19,626 | | | $ | — | | | $ | 14 | |
Statements of Assets and Liabilities (Continued)
| | | Touchstone | | | | | | Touchstone | | | Touchstone | |
| | | Flexible | | | Touchstone | | | Growth | | | International | |
| | | Income | | | Focused | | | Opportunities | | | Value | |
| | | Fund | | | Fund | | | Fund | | | Fund | |
| Pricing of Class A Shares | | | | | | | | | | | | | | | | |
| Net assets applicable to Class A shares | | $ | 57,670,942 | | | $ | 405,457,570 | | | $ | 38,297,223 | | | $ | 3,699,972 | |
| Shares of beneficial interest outstanding | | | | | | | | | | | | | | | | |
| (unlimited number of shares authorized, no par value) | | | 5,452,463 | | | | 11,055,332 | | | | 1,400,310 | | | | 502,331 | |
| Net asset value price per share* | | $ | 10.58 | | | $ | 36.68 | | | $ | 27.35 | | | $ | 7.37 | |
| Maximum sales charge - Class A shares | | | 5.75% | | | | 5.75% | | | | 5.75% | | | | 5.75% | |
| Maximum offering price per share | | | | | | | | | | | | | | | | |
| (100%/(100%-maximum sales charge) of net asset value | | | | | | | | | | | | | | | | |
| adjusted to the nearest cent) per share - Class A shares | | $ | 11.23 | | | $ | 38.92 | | | $ | 29.02 | | | $ | 7.82 | |
| | | | | | | | | | | | | | | | | |
| Pricing of Class B Shares | | | | | | | | | | | | | | | | |
| Net assets applicable to Class B shares | | $ | — | | | $ | — | | | $ | — | | | $ | — | |
| Shares of beneficial interest outstanding | | | | | | | | | | | | | | | | |
| (unlimited number of shares authorized, no par value) | | | — | | | | — | | | | — | | | | — | |
| Net asset value, offering price per share** | | $ | — | | | $ | — | | | $ | — | | | $ | — | |
| | | | | | | | | | | | | | | | | |
| Pricing of Class C Shares | | | | | | | | | | | | | | | | |
| Net assets applicable to Class C shares | | $ | 45,078,907 | | | $ | 44,338,002 | | | $ | 11,664,856 | | | $ | 121,563 | |
| Shares of beneficial interest outstanding | | | | | | | | | | | | | | | | |
| (unlimited number of shares authorized, no par value) | | | 4,317,278 | | | | 1,247,508 | | | | 496,182 | | | | 17,805 | |
| Net asset value, offering price per share** | | $ | 10.44 | | | $ | 35.54 | | | $ | 23.51 | | | $ | 6.83 | |
| | | | | | | | | | | | | | | | | |
| Pricing of Class Y Shares | | | | | | | | | | | | | | | | |
| Net assets applicable to Class Y shares | | $ | 358,423,210 | | | $ | 853,900,316 | | | $ | 83,721,150 | | | $ | 4,583,174 | |
| Shares of beneficial interest outstanding | | | | | | | | | | | | | | | | |
| (unlimited number of shares authorized, no par value) | | | 33,789,984 | | | | 22,897,396 | | | | 3,001,230 | | | | 620,413 | |
| Net asset value, offering price and redemption price per share | | $ | 10.61 | | | $ | 37.29 | | | $ | 27.90 | | | $ | 7.39 | |
| | | | | | | | | | | | | | | | | |
| Pricing of Institutional Class Shares | | | | | | | | | | | | | | | | |
| Net assets applicable to Institutional Class Shares | | $ | 82,286,457 | | | $ | 48,804,740 | | | $ | 176,191,008 | | | $ | 34,741,908 | |
| Shares of beneficial interest outstanding | | | | | | | | | | | | | | | | |
| (unlimited number of shares authorized, no par value) | | | 7,759,711 | | | | 1,303,306 | | | | 6,258,916 | | | | 4,724,209 | |
| Net asset value, offering price and redemption price per share | | $ | 10.60 | | | $ | 37.45 | | | $ | 28.15 | | | $ | 7.35 | |
* There is no sales load on subscriptions of $1 million or more. Redemptions that were part of a $1 million or more subscription may be subject to a contingent deferred sales load if redeemed within a one-year period from the date of purchase.
** Redemption price per share varies by length of time shares are held due to the terms of the contingent deferred sales charge.
See accompanying Notes to Financial Statements.
Statements of Assets and Liabilities (Continued)
| | | | Touchstone | | | | | | | |
| Touchstone | | | Sands Capital | | | | | | Touchstone | |
| Mid Cap | | | Emerging | | | Touchstone | | | Sustainability | |
| Growth | | | Markets | | | Small Cap | | | and Impact | |
| Fund | | | Growth Fund | | | Growth Fund | | | Equity Fund | |
| | | | | | | | | | | |
| $ | 226,200,967 | | | $ | — | | | $ | 48,649,903 | | | $ | 137,306,011 | |
| | | | | | | | | | | | | | | |
| | 9,715,459 | | | | — | | | | 9,767,594 | | | | 7,234,570 | |
| $ | 23.28 | | | $ | — | | | $ | 4.98 | | | $ | 18.98 | |
| | 5.75% | | | | — | | | | 5.75% | | | | 5.75% | |
| | | | | | | | | | | | | | | |
| | | | | | | | | | | | | | | |
| $ | 24.70 | | | $ | — | | | $ | 5.28 | | | $ | 20.14 | |
| | | | | | | | | | | | | | | |
| | | | | | | | | | | | | | | |
| $ | 1,140,350 | | | $ | — | | | $ | — | | | $ | 456,734 | |
| | | | | | | | | | | | | | | |
| | 67,822 | | | | — | | | | — | | | | 27,123 | |
| $ | 16.81 | | | $ | — | | | $ | — | | | $ | 16.84 | |
| | | | | | | | | | | | | | | |
| | | | | | | | | | | | | | | |
| $ | 127,852,141 | | | $ | — | | | $ | 18,237,030 | | | $ | 56,434,582 | |
| | | | | | | | | | | | | | | |
| | 7,829,116 | | | | — | | | | 4,406,659 | | | | 3,426,990 | |
| $ | 16.33 | | | $ | — | | | $ | 4.14 | | | $ | 16.47 | |
| | | | | | | | | | | | | | | |
| | | | | | | | | | | | | | | |
| $ | 347,706,383 | | | $ | 58,105,917 | | | $ | 508,449,620 | | | $ | 67,637,789 | |
| | | | | | | | | | | | | | | |
| | 14,538,025 | | | | 6,181,927 | | | | 91,634,513 | | | | 3,470,260 | |
| $ | 23.92 | | | $ | 9.40 | | | $ | 5.55 | | | $ | 19.49 | |
| | | | | | | | | | | | | | | |
| | | | | | | | | | | | | | | |
| $ | 84,151,614 | | | $ | 101,400,822 | | | $ | 22,862,984 | | | $ | 6,843,233 | |
| | | | | | | | | | | | | | | |
| | 3,495,692 | | | | 10,774,506 | | | | 4,094,834 | | | | 350,960 | |
| $ | 24.07 | | | $ | 9.41 | | | $ | 5.58 | | | $ | 19.50 | |
Statements of Operations
For the Year Ended March 31, 2016
| | | Touchstone | | | | | | Touchstone | | | Touchstone | |
| | | Flexible | | | Touchstone | | | Growth | | | International | |
| | | Income | | | Focused | | | Opportunities | | | Value | |
| | | Fund | | | Fund | | | Fund | | | Fund | |
| Investment Income (loss) | | | | | | | | | | | | | | | | |
| Dividends from affiliated funds | | $ | 323 | | | $ | 475 | | | $ | 191 | | | $ | 44 | |
| Dividends from non-affiliated securities(A) | | | 5,271,349 | | | | 19,374,117 | | | | 2,892,788 | | | | 3,091,203 | |
| Interest | | | 11,548,048 | | | | — | | | | — | | | | — | |
| Income from securities loaned | | | 20,053 | | | | 64,883 | | | | 30,577 | | | | 71,336 | |
| Total Investment Income | | | 16,839,773 | | | | 19,439,475 | | | | 2,923,556 | | | | 3,162,583 | |
| Expenses | | | | | | | | | | | | | | | | |
| Investment advisory fees | | | 2,752,187 | | | | 7,462,036 | | | | 2,191,000 | | | | 1,006,229 | |
| Administration fees | | | 570,329 | | | | 1,730,826 | | | | 423,593 | | | | 145,903 | |
| Compliance fees and expenses | | | 2,620 | | | | 2,620 | | | | 2,620 | | | | 2,620 | |
| Custody fees | | | 60,796 | | | | 26,769 | | | | 12,560 | | | | 31,877 | |
| Professional fees | | | 41,241 | | | | 60,559 | | | | 30,514 | | | | 35,308 | |
| Transfer Agent fees, Class A | | | 41,770 | | | | 719,824 | | | | 60,946 | | | | 12,134 | |
| Transfer Agent fees, Class B | | | — | | | | — | | | | — | | | | — | |
| Transfer Agent fees, Class C | | | 28,390 | | | | 15,639 | | | | 15,591 | | | | 593 | |
| Transfer Agent fees, Class Y | | | 387,081 | | | | 785,729 | | | | 114,219 | | | | 11,834 | |
| Transfer Agent fees, Institutional Class | | | 3,097 | | | | 12,799 | | | | 42,686 | | | | 136 | |
| Registration fees, Class A | | | 17,593 | | | | 27,446 | | | | 13,349 | | | | 6,424 | |
| Registration fees, Class B | | | — | | | | — | | | | — | | | | — | |
| Registration fees, Class C | | | 12,789 | | | | 8,503 | | | | 10,659 | | | | 5,139 | |
| Registration fees, Class Y | | | 18,850 | | | | 21,668 | | | | 15,084 | | | | 4,468 | |
| Registration fees, Institutional Class | | | 8,961 | | | | 14,787 | | | | 13,187 | | | | 3,452 | |
| Reports to Shareholders, Class A | | | 10,129 | | | | 40,495 | | | | 10,729 | | | | 6,959 | |
| Reports to Shareholders, Class B | | | — | | | | — | | | | — | | | | — | |
| Reports to Shareholders, Class C | | | 9,366 | | | | 9,170 | | | | 7,624 | | | | 6,254 | |
| Reports to Shareholders, Class Y | | | 11,559 | | | | 60,102 | | | | 8,288 | | | | 6,322 | |
| Reports to Shareholders, Institutional Class | | | 7,201 | | | | 4,958 | | | | 7,363 | | | | 13,562 | |
| Distribution expenses, Class A | | | 97,868 | | | | 875,478 | | | | 109,477 | | | | 10,874 | |
| Distribution expenses, Class B | | | — | | | | — | | | | — | | | | — | |
| Distribution and shareholder servicing expenses, Class C | | | 331,602 | | | | 203,321 | | | | 128,482 | | | | 1,722 | |
| Trustee fees | | | 15,414 | | | | 15,414 | | | | 15,414 | | | | 15,414 | |
| Other expenses | | | 83,065 | | | | 638,111 | | | | 48,608 | | | | 36,796 | |
| Total Expenses | | | 4,511,908 | | | | 12,736,254 | | | | 3,281,993 | | | | 1,364,020 | |
| Fees waived and/or reimbursed by the Advisor and/or Affiliates(B) | | | (823,918 | ) | | | (520,583 | ) | | | (289,817 | ) | | | (340,234 | ) |
| Net Expenses | | | 3,687,990 | | | | 12,215,671 | | | | 2,992,176 | | | | 1,023,786 | |
| Net Investment Income (Loss) | | | 13,151,783 | | | | 7,223,804 | | | | (68,620 | ) | | | 2,138,797 | |
| Realized and Unrealized Gains (Losses) on Investments | | | | | | | | | | | | | | | | |
| Net realized gains (losses) on investments from non-affiliated securities | | | (2,769,372 | ) | | | 12,445,754 | | | | 13,188,606 | | | | (4,183,768 | ) |
| Net realized gains on futures contracts | | | 28,930 | | | | — | | | | — | | | | — | |
| Net realized gains on written options | | | 75,463 | | | | — | | | | — | | | | — | |
| Net realized losses on swap agreements | | | (143,942 | ) | | | — | | | | — | | | | — | |
| Net realized gains (losses) on foreign currency transactions | | | 2,047,006 | | | | — | | | | — | | | | 194,900 | |
| Net change in unrealized appreciation (depreciation) on investments | | | (688,273 | ) | | | 3,867,659 | | | | (38,294,449 | ) | | | (12,136,686 | ) |
| Net change in unrealized appreciation (depreciation) on futures contracts | | | 255,143 | | | | — | | | | — | | | | — | |
| Net change in unrealized appreciation (depreciation) on foreign currency transactions | | | (1,476,427 | ) | | | — | | | | — | | | | 7,403 | |
| Net Realized and Unrealized Gains (Losses) on Investments | | | (2,671,472 | ) | | | 16,313,413 | | | | (25,105,843 | ) | | | (16,118,151 | ) |
| Change in Net Assets Resulting from Operations | | $ | 10,480,311 | | | $ | 23,537,217 | | | $ | (25,174,463 | ) | | $ | (13,979,354 | ) |
| (A) Net of foreign tax withholding of: | | $ | — | | | $ | 386,441 | | | $ | 33,670 | | | $ | 267,224 | |
(B)See Note 4 in Notes to Financial Statements.
See accompanying Notes to Financial Statements.
Statements of Operations (Continued)
| | | | Touchstone | | | | | | | |
| Touchstone | | | Sands Capital | | | | | | Touchstone | |
| Mid Cap | | | Emerging | | | Touchstone | | | Sustainability | |
| Growth | | | Markets | | | Small Cap | | | and Impact | |
| Fund | | | Growth Fund | | | Growth Fund | | | Equity Fund | |
| | | | | | | | | | | |
| $ | 362 | | | $ | 111 | | | $ | 487 | | | $ | 405 | |
| | 6,906,764 | | | | 944,880 | | | | 1,980,430 | | | | 5,562,720 | |
| | — | | | | — | | | | — | | | | — | |
| | 93,279 | | | | 6,700 | | | | 364,500 | | | | 1,461 | |
| | 7,000,405 | | | | 951,691 | | | | 2,345,417 | | | | 5,564,586 | |
| | | | | | | | | | | | | | | |
| | 5,744,515 | | | | 1,123,762 | | | | 4,630,456 | | | | 2,614,064 | |
| | 1,138,149 | | | | 141,692 | | | | 683,859 | | | | 520,771 | |
| | 2,620 | | | | 2,620 | | | | 2,620 | | | | 2,620 | |
| | 22,205 | | | | 62,945 | | | | 17,657 | | | | 41,864 | |
| | 47,582 | | | | 37,875 | | | | 36,518 | | | | 116,793 | |
| | 338,502 | | | | — | | | | 65,088 | | | | 224,284 | |
| | 5,687 | | | | — | | | | — | | | | 2,699 | |
| | 187,139 | | | | — | | | | 26,857 | | | | 85,402 | |
| | 398,671 | | | | 41,350 | | | | 452,606 | | | | 152,982 | |
| | 16,408 | | | | 11,505 | | | | 3,526 | | | | 656 | |
| | 15,933 | | | | — | | | | 19,107 | | | | 22,701 | |
| | 6,877 | | | | — | | | | — | | | | 11,392 | |
| | 15,788 | | | | — | | | | 15,055 | | | | 16,140 | |
| | 25,847 | | | | 20,699 | | | | 111,849 | | | | 21,404 | |
| | 16,785 | | | | 15,768 | | | | 4,282 | | | | 5,281 | |
| | 27,830 | | | | — | | | | 15,913 | | | | 64,354 | |
| | 6,878 | | | | — | | | | — | | | | 11,832 | |
| | 24,024 | | | | — | | | | 12,851 | | | | 30,514 | |
| | 39,761 | | | | 9,585 | | | | 72,261 | | | | 40,454 | |
| | 6,882 | | | | 7,307 | | | | 10,804 | | | | 9,433 | |
| | 600,047 | | | | — | | | | 96,713 | | | | 424,898 | |
| | 6,222 | | | | — | | | | — | | | | 3,786 | |
| | 1,423,760 | | | | — | | | | 174,635 | | | | 715,503 | |
| | 15,414 | | | | 15,414 | | | | 15,414 | | | | 15,414 | |
| | 107,049 | | | | 20,109 | | | | 35,317 | | | | 127,533 | |
| | 10,240,575 | | | | 1,510,631 | | | | 6,503,388 | | | | 5,282,774 | |
| | (2,994 | ) | | | (105,154 | ) | | | (654,174 | ) | | | (575,573 | ) |
| | 10,237,581 | | | | 1,405,477 | | | | 5,849,214 | | �� | | 4,707,201 | |
| | (3,237,176 | ) | | | (453,786 | ) | | | (3,503,797 | ) | | | 857,385 | |
| | | | | | | | | | | | | | | |
| | 14,147,440 | | | | (4,519,036 | ) | | | 2,826,756 | | | | 185,694,458 | |
| | — | | | | — | | | | — | | | | — | |
| | — | | | | — | | | | — | | | | — | |
| | — | | | | — | | | | — | | | | — | |
| | — | | | | (37,698 | ) | | | — | | | | (217,379 | ) |
| | | | | | | | | | | | | | | |
| | (67,538,238 | ) | | | (742,093 | ) | | | (54,037,671 | ) | | | (219,014,101 | ) |
| | | | | | | | | | | | | | | |
| | — | | | | — | | | | — | | | | — | |
| | | | | | | | | | | | | | | |
| | — | | | | (849 | ) | | | — | | | | 4,499 | |
| | (53,390,798 | ) | | | (5,299,676 | ) | | | (51,210,915 | ) | | | (33,532,523 | ) |
| $ | (56,627,974 | ) | | $ | (5,753,462 | ) | | $ | (54,714,712 | ) | | $ | (32,675,138 | ) |
| $ | 33,085 | | | $ | 65,721 | | | $ | 14,535 | | | $ | 223,743 | |
Statements of Changes in Net Assets
| | | Touchstone | |
| | | Flexible Income Fund | |
| | | For the | | | For the | |
| | | Year Ended | | | Year Ended | |
| | | March 31, 2016 | | | March 31, 2015 | |
| From Operations | | | | | | | | |
| Net investment income (loss) | | $ | 13,151,783 | | | $ | 11,657,624 | |
| Net realized gains (losses) on investments, futures contracts, written options, swap agreements and foreign currency transactions | | | (761,915 | ) | | | 2,518,007 | |
| Net change in unrealized appreciation (depreciation) on investments, futures contracts and foreign currency transactions | | | (1,909,557 | ) | | | 846,788 | |
| Change in Net Assets from Operations | | | 10,480,311 | | | | 15,022,419 | |
| | | | | | | | | |
| Distributions to Shareholders from: | | | | | | | | |
| Net investment income, Class A | | | (1,150,620 | ) | | | (1,186,826 | ) |
| Net investment income, Class C | | | (745,990 | ) | | | (852,702 | ) |
| Net investment income, Class Y | | | (8,778,715 | ) | | | (8,991,916 | ) |
| Net investment income, Institutional Class | | | (1,541,524 | ) | | | (1,984,856 | ) |
| Net realized gains, Class A | | | — | | | | — | |
| Net realized gains, Class C | | | — | | | | — | |
| Net realized gains, Class Y | | | — | | | | — | |
| Net realized gains, Institutional Class | | | — | | | | — | |
| Total Distributions | | | (12,216,849 | ) | | | (13,016,300 | ) |
| | | | | | | | | |
| Net Increase (Decrease) from Share Transactions (A) | | | 203,835,986 | | | | 99,369,792 | |
| | | | | | | | | |
| Total Increase (Decrease) in Net Assets | | | 202,099,448 | | | | 101,375,911 | |
| | | | | | | | | |
| Net Assets | | | | | | | | |
| Beginning of period | | | 341,360,068 | | | | 239,984,157 | |
| End of period | | $ | 543,459,516 | | | $ | 341,360,068 | |
| Accumulated Net Investment Income (Loss) | | $ | 487,772 | | | $ | 191,484 | |
(A) For details on share transaction by class, see Statements of Changes in Net Assets - Capital Stock Activity on pages 70 to 72.
See accompanying Notes to Financial Statements.
Statements of Changes in Net Assets (Continued)
| Touchstone | | | Touchstone | | | Touchstone | |
| Focused Fund | | | Growth Opportunities Fund | | | International Value Fund | |
| For the | | | For the | | | For the | | | For the | | | For the | | | For the | |
| Year Ended | | | Year Ended | | | Year Ended | | | Year Ended | | | Year Ended | | | Year Ended | |
| March 31, 2016 | | | March 31, 2015 | | | March 31, 2016 | | | March 31, 2015 | | | March 31, 2016 | | | March 31, 2015 | |
| | | | | | | | | | | | | | | | | | | | | | | |
| $ | 7,223,804 | | | $ | 8,434,858 | | | $ | (68,620 | ) | | $ | (674,540 | ) | | $ | 2,138,797 | | | $ | 2,690,286 | |
| | | | | | | | | | | | | | | | | | | | | | | |
| | 12,445,754 | | | | 91,238,577 | | | | 13,188,606 | | | | 34,721,011 | | | | (3,988,868 | ) | | | 5,215,929 | |
| | | | | | | | | | | | | | | | | | | | | | | |
| | 3,867,659 | | | | (25,277,992 | ) | | | (38,294,449 | ) | | | 6,533,250 | | | | (12,129,283 | ) | | | (13,187,468 | ) |
| | 23,537,217 | | | | 74,395,443 | | | | (25,174,463 | ) | | | 40,579,721 | | | | (13,979,354 | ) | | | (5,281,253 | ) |
| | | | | | | | | | | | | | | | | | | | | | | |
| | | | | | | | | | | | | | | | | | | | | | | |
| | (2,150,136 | ) | | | (941,516 | ) | | | — | | | | — | | | | (105,908 | ) | | | (180,686 | ) |
| | (177,711 | ) | | | (25,942 | ) | | | — | | | | — | | | | (2,309 | ) | | | (6,039 | ) |
| | (5,719,362 | ) | | | (3,155,003 | ) | | | — | | | | (36,931 | ) | | | (141,641 | ) | | | (1,189,716 | ) |
| | (387,665 | ) | | | (262,423 | ) | | | — | | | | (97,196 | ) | | | (3,515,661 | ) | | | (2,410,749 | ) |
| | (8,694,608 | ) | | | — | | | | (4,005,557 | ) | | | (5,356,411 | ) | | | — | | | | — | |
| | (615,987 | ) | | | — | | | | (1,368,829 | ) | | | (1,589,389 | ) | | | — | | | | — | |
| | (17,448,933 | ) | | | — | | | | (8,848,646 | ) | | | (11,420,388 | ) | | | — | | | | — | |
| | (1,032,227 | ) | | | — | | | | (11,326,115 | ) | | | (13,871,626 | ) | | | — | | | | — | |
| | (36,226,629 | ) | | | (4,384,884 | ) | | | (25,549,147 | ) | | | (32,371,941 | ) | | | (3,765,519 | ) | | | (3,787,190 | ) |
| | | | | | | | | | | | | | | | | | | | | | | |
| | 250,157,293 | | | | 39,085,885 | | | | 55,533,470 | | | | 28,975,532 | | | | (52,336,712 | ) | | | (11,372,032 | ) |
| | | | | | | | | | | | | | | | | | | | | | | |
| | 237,467,881 | | | | 109,096,444 | | | | 4,809,860 | | | | 37,183,312 | | | | (70,081,585 | ) | | | (20,440,475 | ) |
| | | | | | | | | | | | | | | | | | | | | | | |
| | | | | | | | | | | | | | | | | | | | | | | |
| | 1,115,032,747 | | | | 1,005,936,303 | | | | 305,064,377 | | | | 267,881,065 | | | | 113,228,202 | | | | 133,668,677 | |
| $ | 1,352,500,628 | | | $ | 1,115,032,747 | | | $ | 309,874,237 | | | $ | 305,064,377 | | | $ | 43,146,617 | | | $ | 113,228,202 | |
| $ | 7,223,788 | | | $ | 8,434,858 | | | $ | — | | | $ | (43,218 | ) | | $ | 2,225,347 | | | $ | 2,786,103 | |
Statements of Changes in Net Assets (Continued)
| | | Touchstone | |
| | | Mid Cap | |
| | | Growth Fund | |
| | | | |
| | | For the | | | For the | |
| | | Year Ended | | | Year Ended | |
| | | March 31, 2016 | | | March 31, 2015 | |
| From Operations | | | | | | | | |
| Net investment income (loss) | | $ | (3,237,176 | ) | | $ | (4,344,388 | ) |
| Net realized gains (losses) on investments and foreign currency transactions | | | 14,147,440 | | | | 80,961,938 | |
| Net change in unrealized appreciation (depreciation) on investments and foreign currency transactions | | | (67,538,238 | ) | | | 39,284,609 | |
| Change in Net Assets from Operations | | | (56,627,974 | ) | | | 115,902,159 | |
| | | | | | | | | |
| Distributions to Shareholders from: | | | | | | | | |
| Net investment income, Class A | | | — | | | | — | |
| Net investment income, Class Y | | | (610,615 | ) | | | — | |
| Net investment income, Institutional Class | | | (189,405 | ) | | | — | |
| Net realized gains, Class A | | | (19,006,999 | ) | | | (29,865,535 | ) |
| Net realized gains, Class B | | | (157,363 | ) | | | (509,754 | ) |
| Net realized gains, Class C | | | (15,562,432 | ) | | | (24,200,128 | ) |
| Net realized gains, Class Y | | | (27,767,750 | ) | | | (38,685,139 | ) |
| Net realized gains, Institutional Class | | | (6,878,222 | ) | | | (6,272,879 | ) |
| Total Distributions | | | (70,172,786 | ) | | | (99,533,435 | ) |
| | | | | | | | | |
| Net Increase (Decrease) from Share Transactions(B) | | | 84,655,180 | | | | 51,202,285 | |
| | | | | | | | | |
| Total Increase (Decrease) in Net Assets | | | (42,145,580 | ) | | | 67,571,009 | |
| | | | | | | | | |
| Net Assets | | | | | | | | |
| Beginning of period | | | 829,197,035 | | | | 761,626,026 | |
| End of period | | $ | 787,051,455 | | | $ | 829,197,035 | |
| Accumulated Net Investment Income (Loss) | | $ | 224,351 | | | $ | — | |
(A)Represents the period from commencement of operations (May 12, 2014) through March 31, 2015.
(B) For details on share transaction by class, see Statements of Changes in Net Assets - Capital Stock Activity on pages 73 to 75.
See accompanying Notes to Financial Statements.
Statements of Changes in Net Assets (Continued)
| Touchstone | | | Touchstone | | | Touchstone | |
| Sands Capital Emerging | | | Small Cap | | | Sustainability and Impact | |
| Markets Growth Fund | | | Growth Fund | | | Equity Fund | |
| | | | For the | | | | | | | | | | | | | |
| For the | | | Period Ended | | | For the | | | For the | | | For the | | | For the | |
| Year Ended | | | March 31, | | | Year Ended | | | Year Ended | | | Year Ended | | | Year Ended | |
| March 31, 2016 | | | 2015(A) | | | March 31, 2016 | | | March 31, 2015 | | | March 31, 2016 | | | March 31, 2015 | |
| | | | | | | | | | | | | | | | | | | | | | | |
| $ | (453,786 | ) | | $ | (238,719 | ) | | $ | (3,503,797 | ) | | $ | (990,511 | ) | | $ | 857,385 | | | $ | 3,449,054 | |
| | (4,556,734 | ) | | | (6,996,731 | ) | | | 2,826,756 | | | | 9,263,865 | | | | 185,477,079 | | | | 138,413,617 | |
| | (742,942 | ) | | | 4,908,043 | | | | (54,037,671 | ) | | | 24,011,741 | | | | (219,009,602 | ) | | | (6,842,007 | ) |
| | (5,753,462 | ) | | | (2,327,407 | ) | | | (54,714,712 | ) | | | 32,285,095 | | | | (32,675,138 | ) | | | 135,020,664 | |
| | | | | | | | | | | | | | | | | | | | | | | |
| | | | | | | | | | | | | | | | | | | | | | | |
| | — | | | | — | | | | — | | | | — | | | | (227,036 | ) | | | (480,900 | ) |
| | — | | | | — | | | | — | | | | — | | | | (333,095 | ) | | | (1,346,092 | ) |
| | — | | | | — | | | | — | | | | — | | | | (4 | ) | | | — | |
| | — | | | | — | | | | (416,539 | ) | | | (609,635 | ) | | | (71,291,821 | ) | | | (46,799,076 | ) |
| | — | | | | — | | | | — | | | | — | | | | (566,514 | ) | | | (337,045 | ) |
| | — | | | | — | | | | (247,389 | ) | | | (256,827 | ) | | | (32,073,111 | ) | | | (19,910,700 | ) |
| | — | | | | — | | | | (3,876,576 | ) | | | (4,260,535 | ) | | | (66,294,607 | ) | | | (63,673,005 | ) |
| | — | | | | — | | | | (229,599 | ) | | | (229,689 | ) | | | (797 | ) | | | — | |
| | — | | | | — | | | | (4,770,103 | ) | | | (5,356,686 | ) | | | (170,786,985 | ) | | | (132,546,818 | ) |
| | | | | | | | | | | | | | | | | | | | | | | |
| | 92,975,954 | | | | 74,611,654 | | | | 284,669,125 | | | | 253,953,941 | | | | (307,457,200 | ) | | | (203,698,867 | ) |
| | | | | | | | | | | | | | | | | | | | | | | |
| | 87,222,492 | | | | 72,284,247 | | | | 225,184,310 | | | | 280,882,350 | | | | (510,919,323 | ) | | | (201,225,021 | ) |
| | | | | | | | | | | | | | | | | | | | | | | |
| | | | | | | | | | | | | | | | | | | | | | | |
| | 72,284,247 | | | | — | | | | 373,015,227 | | | | 92,132,877 | | | | 779,597,672 | | | | 980,822,693 | |
| $ | 159,506,739 | | | $ | 72,284,247 | | | $ | 598,199,537 | | | $ | 373,015,227 | | | $ | 268,678,349 | | | $ | 779,597,672 | |
| $ | (168,033 | ) | | $ | (37,729 | ) | | $ | (695,134 | ) | | $ | — | | | $ | — | | | $ | 560,135 | |
Statements of Changes in Net Assets - Capital Stock Activity
| | | Touchstone Flexible Income Fund | |
| | | For the Year | | | For the Year | |
| | | Ended | | | Ended | |
| | | March 31, 2016 | | | March 31, 2015 | |
| | | Shares | | | Dollars | | | Shares | | | Dollars | |
| Class A | | | | | | | | | | | | | | | | |
| Proceeds from Shares issued | | | 4,144,466 | | | $ | 43,577,789 | | | | 1,568,107 | | | $ | 16,647,089 | |
| Reinvestment of distributions | | | 88,980 | | | | 934,026 | | | | 91,957 | | | | 977,939 | |
| Cost of Shares redeemed | | | (1,845,689 | ) | | | (19,376,167 | ) | | | (1,041,961 | ) | | | (11,102,406 | ) |
| Change from Class A Share Transactions | | | 2,387,757 | | | | 25,135,648 | | | | 618,103 | | | | 6,522,622 | |
| Class C | | | | | | | | | | | | | | | | |
| Proceeds from Shares issued | | | 2,392,983 | | | | 24,851,358 | | | | 1,009,134 | | | | 10,610,844 | |
| Reinvestment of distributions | | | 57,328 | | | | 593,349 | | | | 61,208 | | | | 642,259 | |
| Cost of Shares redeemed | | | (586,781 | ) | | | (6,087,647 | ) | | | (625,702 | ) | | | (6,573,211 | ) |
| Change from Class C Share Transactions | | | 1,863,530 | | | | 19,357,060 | | | | 444,640 | | | | 4,679,892 | |
| Class Y | | | | | | | | | | | | | | | | |
| Proceeds from Shares issued | | | 18,472,408 | | | | 194,854,094 | | | | 12,611,049 | | | | 134,491,445 | |
| Reinvestment of distributions | | | 318,651 | | | | 3,356,635 | | | | 299,733 | | | | 3,195,742 | |
| Cost of Shares redeemed | | | (7,260,579 | ) | | | (76,486,863 | ) | | | (4,925,847 | ) | | | (52,581,170 | ) |
| Change from Class Y Share Transactions | | | 11,530,480 | | | | 121,723,866 | | | | 7,984,935 | | | | 85,106,017 | |
| Institutional Class | | | | | | | | | | | | | | | | |
| Proceeds from Shares issued | | | 6,063,065 | | | | 63,851,043 | | | | 2,370,726 | | | | 25,298,460 | |
| Reinvestment of distributions | | | 79,391 | | | | 837,163 | | | | 146,325 | | | | 1,558,506 | |
| Cost of Shares redeemed | | | (2,566,505 | ) | | | (27,068,794 | ) | | | (2,228,208 | ) | | | (23,795,705 | ) |
| Change from Institutional Class Share Transactions | | | 3,575,951 | | | | 37,619,412 | | | | 288,843 | | | | 3,061,261 | |
| | | | | | | | | | | | | | | | | |
| Change from Share Transactions | | | 19,357,718 | | | $ | 203,835,986 | | | | 9,336,521 | | | $ | 99,369,792 | |
See accompanying Notes to Financial Statements.
Statements of Changes in Net Assets - Capital Stock Activity (Continued)
| Touchstone Focused Fund | | | Touchstone Growth Opportunities Fund | |
| For the Year | | | For the Year | | | For the Year | | | For the Year | |
| Ended | | | Ended | | | Ended | | | Ended | |
| March 31, 2016 | | | March 31, 2015 | | | March 31, 2016 | | | March 31, 2015 | |
| Shares | | | Dollars | | | Shares | | | Dollars | | | Shares | | | Dollars | | | Shares | | | Dollars | |
| | | | | | | | | | | | | | | | | | | | | | | | | | | | | | | |
| | 4,522,535 | | | $ | 167,698,473 | | | | 3,152,316 | | | $ | 112,384,035 | | | | 70,196 | | | $ | 2,177,325 | | | | 84,413 | | | $ | 2,845,518 | |
| | 265,208 | | | | 9,641,766 | | | | 22,772 | | | | 838,923 | | | | 133,527 | | | | 3,725,398 | | | | 159,204 | | | | 5,041,988 | |
| | (1,720,071 | ) | | | (62,801,078 | ) | | | (1,893,895 | ) | | | (67,449,289 | ) | | | (280,258 | ) | | | (8,429,913 | ) | | | (225,176 | ) | | | (7,572,967 | ) |
| | 3,067,672 | | | | 114,539,161 | | | | 1,281,193 | | | | 45,773,669 | | | | (76,535 | ) | | | (2,527,190 | ) | | | 18,441 | | | | 314,539 | |
| | | | | | | | | | | | | | | | | | | | | | | | | | | | | | | |
| | 1,057,840 | | | | 37,371,654 | | | | 135,463 | | | | 4,710,743 | | | | 54,550 | | | | 1,468,821 | | | | 74,380 | | | | 2,139,654 | |
| | 15,031 | | | | 530,969 | | | | 511 | | | | 18,421 | | | | 45,779 | | | | 1,100,527 | | | | 45,058 | | | | 1,257,568 | |
| | (89,966 | ) | | | (3,169,913 | ) | | | (35,330 | ) | | | (1,248,168 | ) | | | (76,004 | ) | | | (1,995,073 | ) | | | (73,809 | ) | | | (2,181,241 | ) |
| | 982,905 | | | | 34,732,710 | | | | 100,644 | | | | 3,480,996 | | | | 24,325 | | | | 574,275 | | | | 45,629 | | | | 1,215,981 | |
| | | | | | | | | | | | | | | | | | | | | | | | | | | | | | | |
| | 4,496,401 | | | | 165,513,223 | | | | 1,684,633 | | | | 60,620,741 | | | | 591,080 | | | | 18,203,037 | | | | 736,523 | | | | 24,823,240 | |
| | 593,413 | | | | 21,964,792 | | | | 80,766 | | | | 3,019,030 | | | | 291,572 | | | | 8,292,326 | | | | 336,781 | | | | 10,828,282 | |
| | (2,227,174 | ) | | | (83,643,397 | ) | | | (2,556,883 | ) | | | (92,606,372 | ) | | | (1,055,096 | ) | | | (31,885,449 | ) | | | (691,848 | ) | | | (23,251,906 | ) |
| | 2,862,640 | | | | 103,834,618 | | | | (791,484 | ) | | | (28,966,601 | ) | | | (172,444 | ) | | | (5,390,086 | ) | | | 381,456 | | | | 12,399,616 | |
| | | | | | | | | | | | | | | | | | | | | | | | | | | | | | | |
| | 446,318 | | | | 16,652,226 | | | | 683,501 | | | | 25,263,165 | | | | 3,616,634 | | | | 103,753,183 | | | | 463,974 | | | | 15,743,329 | |
| | 38,164 | | | | 1,419,892 | | | | 6,994 | | | | 262,423 | | | | 394,776 | | | | 11,326,115 | | | | 431,068 | | | | 13,964,383 | |
| | (546,524 | ) | | | (21,021,314 | ) | | | (183,374 | ) | | | (6,727,767 | ) | | | (1,710,927 | ) | | | (52,202,827 | ) | | | (425,828 | ) | | | (14,662,316 | ) |
| | (62,042 | ) | | | (2,949,196 | ) | | | 507,121 | | | | 18,797,821 | | | | 2,300,483 | | | | 62,876,471 | | | | 469,214 | | | | 15,045,396 | |
| | | | | | | | | | | | | | | | | | | | | | | | | | | | | | | |
| | 6,851,175 | | | $ | 250,157,293 | | | | 1,097,474 | | | $ | 39,085,885 | | | | 2,075,829 | | | $ | 55,533,470 | | | | 914,740 | | | $ | 28,975,532 | |
Statements of Changes in Net Assets - Capital Stock Activity (Continued)
| | | Touchstone International Value Fund | |
| | | For the Year | | | For the Year | |
| | | Ended | | | Ended | |
| | | March 31, 2016 | | | March 31, 2015 | |
| | | Shares | | | Dollars | | | Shares | | | Dollars | |
| Class A | | | | | | | | | | | | | | | | |
| Proceeds from Shares issued | | | 41,430 | | | $ | 344,810 | | | | 242,961 | | | $ | 2,225,707 | |
| Reinvestment of distributions | | | 12,693 | | | | 96,845 | | | | 15,281 | | | | 129,122 | |
| Cost of Shares redeemed | | | (179,854 | ) | | | (1,484,202 | ) | | | (291,385 | ) | | | (2,557,979 | ) |
| Change from Class A Share Transactions | | | (125,731 | ) | | | (1,042,547 | ) | | | (33,143 | ) | | | (203,150 | ) |
| Class B | | | | | | | | | | | | | | | | |
| Proceeds from Shares issued | | | — | | | | — | | | | — | | | | — | |
| Reinvestment of distributions | | | — | | | | — | | | | — | | | | — | |
| Cost of Shares redeemed | | | — | | | | — | | | | — | | | | — | |
| Change from Class B Share Transactions | | | — | | | | — | | | | — | | | | — | |
| Class C | | | | | | | | | | | | | | | | |
| Proceeds from Shares issued | | | 304 | | | | 2,552 | | | | 6,400 | | | | 53,197 | |
| Reinvestment of distributions | | | 279 | | | | 1,975 | | | | 495 | | | | 3,872 | |
| Cost of Shares redeemed | | | (12,727 | ) | | | (97,186 | ) | | | (2,416 | ) | | | (19,123 | ) |
| Change from Class C Share Transactions | | | (12,144 | ) | | | (92,659 | ) | | | 4,479 | | | | 37,946 | |
| Class Y | | | | | | | | | | | | | | | | |
| Proceeds from Shares issued | | | 74,049 | | | | 546,922 | | | | 130,791 | | | | 1,181,538 | |
| Reinvestment of distributions | | | 6,369 | | | | 48,722 | | | | 122,049 | | | | 1,030,093 | |
| Cost of Shares redeemed | | | (3,636,320 | ) | | | (31,264,810 | ) | | | (874,635 | ) | | | (8,042,647 | ) |
| Change from Class Y Share Transactions | | | (3,555,902 | ) | | | (30,669,166 | ) | | | (621,795 | ) | | | (5,831,016 | ) |
| Institutional Class | | | | | | | | | | | | | | | | |
| Proceeds from Shares issued | | | 6,466,412 | | | | 54,344,378 | | | | 963,317 | | | | 8,463,575 | |
| Reinvestment of distributions | | | 332,824 | | | | 2,536,116 | | | | 285,296 | | | | 2,410,749 | |
| Cost of Shares redeemed | | | (10,700,358 | ) | | | (77,412,834 | ) | | | (1,776,767 | ) | | | (16,250,136 | ) |
| Change from Institutional Class Share Transactions | | | (3,901,122 | ) | | | (20,532,340 | ) | | | (528,154 | ) | | | (5,375,812 | ) |
| | | | | | | | | | | | | | | | | |
| Change from Share Transactions | | | (7,594,899 | ) | | $ | (52,336,712 | ) | | | (1,178,613 | ) | | $ | (11,372,032 | ) |
(A)Represents the period from commencement of operations (May 12, 2014) through March 31, 2015.
See accompanying Notes to Financial Statements.
Statements of Changes in Net Assets - Capital Stock Activity (Continued)
| Touchstone Mid Cap Growth Fund | | | Touchstone Sands Capital Emerging Markets Growth Fund | |
| For the Year | | | For the Year | | | For the Year | | | For the Period | |
| Ended | | | Ended | | | Ended | | | Ended | |
| March 31, 2016 | | | March 31, 2015 | | | March 31, 2016 | | | March 31, 2015(A) | |
| Shares | | | Dollars | | | Shares | | | Dollars | | | Shares | | | Dollars | | | Shares | | | Dollars | |
| | | | | | | | | | | | | | | | | | | | | | | | | | | | | | | |
| | 1,904,282 | | | $ | 47,265,429 | | | | 1,872,551 | | | $ | 50,007,609 | | | | — | | | $ | — | | | | — | | | $ | — | |
| | 772,320 | | | | 17,933,276 | | | | 1,125,039 | | | | 28,080,973 | | | | — | | | | — | | | | — | | | | — | |
| | (2,844,621 | ) | | | (70,651,555 | ) | | | (4,747,824 | ) | | | (126,313,308 | ) | | | — | | | | — | | | | — | | | | — | |
| | (168,019 | ) | | | (5,452,850 | ) | | | (1,750,234 | ) | | | (48,224,726 | ) | | | — | | | | — | | | | — | | | | — | |
| | | | | | | | | | | | | | | | | | | | | | | | | | | | | | | |
| | 1,573 | | | | 29,154 | | | | 6,130 | | | | 115,182 | | | | — | | | | — | | | | — | | | | — | |
| | 8,303 | | | | 139,566 | | | | 19,952 | | | | 374,893 | | | | — | | | | — | | | | — | | | | — | |
| | (79,553 | ) | | | (1,508,549 | ) | | | (114,764 | ) | | | (2,371,823 | ) | | | — | | | | — | | | | — | | | | — | |
| | (69,677 | ) | | | (1,339,829 | ) | | | (88,682 | ) | | | (1,881,748 | ) | | | — | | | | — | | | | — | | | | — | |
| | | | | | | | | | | | | | | | | | | | | | | | | | | | | | | |
| | 551,868 | | | | 9,655,543 | | | | 671,140 | | | | 13,050,963 | | | | — | | | | — | | | | — | | | | — | |
| | 720,386 | | | | 11,756,699 | | | | 986,965 | | | | 18,051,587 | | | | — | | | | — | | | | — | | | | — | |
| | (1,396,724 | ) | | | (24,082,215 | ) | | | (1,056,855 | ) | | | (21,171,479 | ) | | | — | | | | — | | | | — | | | | — | |
| | (124,470 | ) | | | (2,669,973 | ) | | | 601,250 | | | | 9,931,071 | | | | — | | | | — | | | | — | | | | — | |
| | | | | | | | | | | | | | | | | | | | | | | | | | | | | | | |
| | 6,261,056 | | | | 161,597,769 | | | | 4,222,004 | | | | 115,570,817 | | | | 5,987,808 | | | | 55,295,001 | | | | 5,569,835 | | | | 58,995,354 | |
| | 1,114,876 | | | | 26,629,213 | | | | 1,408,843 | | | | 35,981,850 | | | | — | | | | — | | | | — | | | | — | |
| | (3,638,884 | ) | | | (89,071,569 | ) | | | (4,593,111 | ) | | | (125,737,465 | ) | | | (3,618,045 | ) | | | (32,366,796 | ) | | | (1,757,671 | ) | | | (17,937,981 | ) |
| | 3,737,048 | | | | 99,155,413 | | | | 1,037,736 | | | | 25,815,202 | | | | 2,369,763 | | | | 22,928,205 | | | | 3,812,164 | | | | 41,057,373 | |
| | | | | | | | | | | | | | | | | | | | | | | | | | | | | | | |
| | 827,272 | | | | 21,629,729 | | | | 3,919,787 | | | | 107,458,384 | | | | 10,054,252 | | | | 92,244,069 | | | | 6,670,345 | | | | 69,211,323 | |
| | 293,845 | | | | 7,066,529 | | | | 244,366 | | | | 6,272,879 | | | | — | | | | — | | | | — | | | | — | |
| | (1,302,404 | ) | | | (33,733,839 | ) | | | (1,782,352 | ) | | | (48,168,777 | ) | | | (2,436,608 | ) | | | (22,196,320 | ) | | | (3,513,483 | ) | | | (35,657,042 | ) |
| | (181,287 | ) | | | (5,037,581 | ) | | | 2,381,801 | | | | 65,562,486 | | | | 7,617,644 | | | | 70,047,749 | | | | 3,156,862 | | | | 33,554,281 | |
| | | | | | | | | | | | | | | | | | | | | | | | | | | | | | | |
| | 3,193,595 | | | $ | 84,655,180 | | | | 2,181,871 | | | $ | 51,202,285 | | | | 9,987,407 | | | $ | 92,975,954 | | | | 6,969,026 | | | $ | 74,611,654 | |
Statements of Changes in Net Assets - Capital Stock Activity (Continued)
| | | Touchstone Small Cap Growth Fund | |
| | | For the Year | | | For the Year | |
| | | Ended | | | Ended | |
| | | March 31, 2016 | | | March 31, 2015 | |
| | | Shares | | | Dollars | | | Shares | | | Dollars | |
| Class A | | | | | | | | | | | | | | | | |
| Proceeds from Shares issued | | | 6,334,906 | | | $ | 33,165,487 | | | | 3,471,875 | | | $ | 18,298,115 | |
| Reinvestment of distributions | | | 69,622 | | | | 364,827 | | | | 99,703 | | | | 516,460 | |
| Cost of Shares redeemed | | | (2,604,243 | ) | | | (13,452,965 | ) | | | (4,346,943 | ) | | | (23,027,280 | ) |
| Change from Class A Share Transactions | | | 3,800,285 | | | | 20,077,349 | | | | (775,365 | ) | | | (4,212,705 | ) |
| Class B | | | | | | | | | | | | | | | | |
| Proceeds from Shares issued | | | — | | | | — | | | | — | | | | — | |
| Reinvestment of distributions | | | — | | | | — | | | | — | | | | — | |
| Cost of Shares redeemed | | | — | | | | — | | | | — | | | | — | |
| Change from Class B Share Transactions | | | — | | | | — | | | | — | | | | — | |
| Class C | | | | | | | | | | | | | | | | |
| Proceeds from Shares issued | | | 2,482,325 | | | | 11,675,961 | | | | 1,219,696 | | | | 5,470,688 | |
| Reinvestment of distributions | | | 48,018 | | | | 209,357 | | | | 42,376 | | | | 184,335 | |
| Cost of Shares redeemed | | | (769,650 | ) | | | (3,344,482 | ) | | | (286,977 | ) | | | (1,275,972 | ) |
| Change from Class C Share Transactions | | | 1,760,693 | | | | 8,540,836 | | | | 975,095 | | | | 4,379,051 | |
| Class Y | | | | | | | | | | | | | | | | |
| Proceeds from Shares issued | | | 75,312,271 | | | | 437,335,735 | | | | 48,212,803 | | | | 284,235,179 | |
| Reinvestment of distributions | | | 471,446 | | | | 2,748,545 | | | | 475,858 | | | | 2,731,426 | |
| Cost of Shares redeemed | | | (33,791,885 | ) | | | (198,401,163 | ) | | | (5,449,256 | ) | | | (32,054,575 | ) |
| Change from Class Y Share Transactions | | | 41,991,832 | | | | 241,683,117 | | | | 43,239,405 | | | | 254,912,030 | |
| Institutional Class(A) | | | | | | | | | | | | | | | | |
| Proceeds from Shares issued | | | 4,210,401 | | | | 26,472,516 | | | | 498,835 | | | | 3,036,246 | |
| Reinvestment of distributions | | | 18,374 | | | | 107,673 | | | | 37,058 | | | | 213,452 | |
| Cost of Shares redeemed | | | (2,067,243 | ) | | | (12,212,366 | ) | | | (735,591 | ) | | | (4,374,133 | ) |
| Change from Institutional Class Share Transactions | | | 2,161,532 | | | | 14,367,823 | | | | (199,698 | ) | | | (1,124,435 | ) |
| | | | | | | | | | | | | | | | | |
| Change from Share Transactions | | | 49,714,342 | | | $ | 284,669,125 | | | | 43,239,437 | | | $ | 253,953,941 | |
(A)Touchstone Sustainability and Impact Equity Fund began issuing Institutional Class shares on May 4, 2015.
See accompanying Notes to Financial Statements.
Statements of Changes in Net Assets - Capital Stock Activity (Continued)
| Touchstone Sustainability and Impact Equity Fund | |
| For the Year | | | For the Year | |
| Ended | | | Ended | |
| March 31, 2016 | | | March 31, 2015 | |
| Shares | | | Dollars | | | Shares | | | Dollars | |
| | | | | | | | | | | | | | | |
| | 706,280 | | | $ | 14,839,030 | | | | 1,212,442 | | | $ | 37,540,815 | |
| | 3,095,277 | | | | 63,666,766 | | | | 1,455,219 | | | | 41,686,465 | |
| | (4,875,781 | ) | | | (110,529,641 | ) | | | (3,405,798 | ) | | | (106,608,779 | ) |
| | (1,074,224 | ) | | | (32,023,845 | ) | | | (738,137 | ) | | | (27,381,499 | ) |
| | | | | | | | | | | | | | | |
| | 8,519 | | | | 156,498 | | | | 3,086 | | | | 82,059 | |
| | 19,366 | | | | 355,752 | | | | 8,288 | | | | 220,385 | |
| | (60,699 | ) | | | (1,082,423 | ) | | | (73,489 | ) | | | (2,212,439 | ) |
| | (32,814 | ) | | | (570,173 | ) | | | (62,115 | ) | | | (1,909,995 | ) |
| | | | | | | | | | | | | | | |
| | 759,874 | | | | 13,625,313 | | | | 366,203 | | | | 10,074,312 | |
| | 1,146,660 | | | | 20,605,480 | | | | 509,331 | | | | 13,349,581 | |
| | (2,146,573 | ) | | | (42,123,412 | ) | | | (964,054 | ) | | | (27,689,759 | ) |
| | (240,039 | ) | | | (7,892,619 | ) | | | (88,520 | ) | | | (4,265,866 | ) |
| | | | | | | | | | | | | | | |
| | 1,864,952 | | | | 39,445,520 | | | | 2,356,443 | | | | 74,338,638 | |
| | 2,799,042 | | | | 59,003,816 | | | | 2,061,399 | | | | 60,113,790 | |
| | (14,428,732 | ) | | | (372,515,157 | ) | | | (9,109,245 | ) | | | (304,593,935 | ) |
| | (9,764,738 | ) | | | (274,065,821 | ) | | | (4,691,403 | ) | | | (170,141,507 | ) |
| | | | | | | | | | | | | | | |
| | 393,939 | | | | 7,896,474 | | | | — | | | | — | |
| | 38 | | | | 801 | | | | — | | | | — | |
| | (43,017 | ) | | | (802,017 | ) | | | — | | | | — | |
| | 350,960 | | | | 7,095,258 | | | | — | | | | — | |
| | | | | | | | | | | | | | | |
| | (10,760,855 | ) | | $ | (307,457,200 | ) | | | (5,580,175 | ) | | $ | (203,698,867 | ) |
Financial Highlights
| Touchstone Flexible Income Fund—Class A |
| Selected Data for a Share Outstanding Throughout Each Period |
| | | | | | | | | | | | Eight | | | | | | | |
| | | | | | | | | | | | Months | | | | | | | |
| | | | | | | | | | | | Ended | | | | | | | |
| | | | | | | | | | | | March | | | | | | | |
| | | Year Ended March 31, | | | 31, | | | Year Ended July 31, | |
| | | 2016 | | | 2015 | | | 2014 | | | 2013(A) | | | 2012 | | | 2011 | |
| Net asset value at beginning of period | | $ | 10.67 | | | $ | 10.60 | | | $ | 10.94 | | | $ | 10.76 | | | $ | 10.47 | | | $ | 10.00 | |
| Income (loss) from investment operations: | | | | | | | | | | | | | | | | | | | | | | | | |
| Net investment income | | | 0.32 | | | | 0.43 | | | | 0.51 | | | | 0.35 | (B) | | | 0.49 | (C) | | | 0.52 | (C) |
| Net realized and unrealized gains (losses) on investments | | | (0.10 | ) | | | 0.11 | | | | (0.37 | ) | | | 0.16 | | | | 0.31 | | | | 0.44 | |
| Total from investment operations | | | 0.22 | | | | 0.54 | | | | 0.14 | | | | 0.51 | | | | 0.80 | | | | 0.96 | |
| Distributions from: | | | | | | | | | | | | | | | | | | | | | | | | |
| Net investment income | | | (0.31 | ) | | | (0.47 | ) | | | (0.48 | ) | | | (0.33 | ) | | | (0.51 | ) | | | (0.49 | ) |
| Net asset value at end of period | | $ | 10.58 | | | $ | 10.67 | | | $ | 10.60 | | | $ | 10.94 | | | $ | 10.76 | | | $ | 10.47 | |
| Total return(D) | | | 2.13 | % | | | 5.22 | % | | | 1.45 | % | | | 4.77 | %(E) | | | 7.86 | % | | | 9.90 | % |
| Ratios and supplemental data: | | | | | | | | | | | | | | | | | | | | | | | | |
| Net assets at end of period (000’s) | | $ | 57,671 | | | $ | 32,695 | | | $ | 25,928 | | | $ | 41,301 | | | $ | 49,458 | | | $ | 25,400 | |
| Ratio to average net assets: | | | | | | | | | | | | | | | | | | | | | | | | |
| Net expenses | | | 1.09 | % | | | 1.09 | % | | | 0.98 | % | | | 0.94 | %(F) | | | 0.95 | % | | | 1.02 | % |
| Gross expenses | | | 1.32 | % | | | 1.35 | % | | | 1.35 | % | | | 1.37 | %(F) | | | 1.60 | % | | | 1.61 | % |
| Net investment income | | | 3.19 | % | | | 3.95 | % | | | 4.82 | % | | | 4.76 | %(B)(F) | | | 4.65 | % | | | 4.99 | % |
| Portfolio turnover rate | | | 122 | % | | | 102 | % | | | 44 | % | | | 41 | %(E) | | | 47 | % | | | 42 | % |
| Touchstone Flexible Income Fund—Class C |
| Selected Data for a Share Outstanding Throughout Each Period |
| | | | | | | | | | | | Eight | | | | | | | |
| | | | | | | | | | | | Months | | | | | | | |
| | | | | | | | | | | | Ended | | | | | | | |
| | | | | | | | | | | | March | | | | | | | |
| | | Year Ended March 31, | | | 31, | | | Year Ended July 31, | |
| | | 2016 | | | 2015 | | | 2014 | | | 2013(A) | | | 2012 | | | 2011 | |
| Net asset value at beginning of period | | $ | 10.54 | | | $ | 10.47 | | | $ | 10.82 | | | $ | 10.65 | | | $ | 10.36 | | | $ | 9.90 | |
| Income (loss) from investment operations: | | | | | | | | | | | | | | | | | | | | | | | | |
| Net investment income | | | 0.26 | | | | 0.34 | | | | 0.43 | | | | 0.29 | (B) | | | 0.40 | (C) | | | 0.44 | (C) |
| Net realized and unrealized gains (losses) on investments | | | (0.12 | ) | | | 0.12 | | | | (0.37 | ) | | | 0.15 | | | | 0.32 | | | | 0.44 | |
| Total from investment operations | | | 0.14 | | | | 0.46 | | | | 0.06 | | | | 0.44 | | | | 0.72 | | | | 0.88 | |
| Distributions from: | | | | | | | | | | | | | | | | | | | | | | | | |
| Net investment income | | | (0.24 | ) | | | (0.39 | ) | | | (0.41 | ) | | | (0.27 | ) | | | (0.43 | ) | | | (0.42 | ) |
| Net asset value at end of period | | $ | 10.44 | | | $ | 10.54 | | | $ | 10.47 | | | $ | 10.82 | | | $ | 10.65 | | | $ | 10.36 | |
| Total return(D) | | | 1.32 | % | | | 4.52 | % | | | 0.61 | % | | | 4.20 | %(E) | | | 7.16 | % | | | 9.09 | % |
| Ratios and supplemental data: | | | | | | | | | | | | | | | | | | | | | | | | |
| Net assets at end of period (000’s) | | $ | 45,079 | | | $ | 25,853 | | | $ | 21,043 | | | $ | 26,087 | | | $ | 25,115 | | | $ | 16,818 | |
| Ratio to average net assets: | | | | | | | | | | | | | | | | | | | | | | | | |
| Net expenses | | | 1.84 | % | | | 1.84 | % | | | 1.74 | % | | | 1.69 | %(F) | | | 1.70 | % | | | 1.77 | % |
| Gross expenses | | | 2.05 | % | | | 2.10 | % | | | 2.09 | % | | | 2.16 | %(F) | | | 2.35 | % | | | 2.36 | % |
| Net investment income | | | 2.44 | % | | | 3.20 | % | | | 4.07 | % | | | 4.01 | %(B)(F) | | | 3.82 | % | | | 4.25 | % |
| Portfolio turnover rate | | | 122 | % | | | 102 | % | | | 44 | % | | | 41 | %(E) | | | 47 | % | | | 42 | % |
| (A) | The Fund changed its fiscal year end from July 31 to March 31. |
| (B) | Reflects the impact of a corporate action event that resulted in a one-time increase to net investment income. If the corporate action event had not occurred, the Class A and Class C net investment income per share and ratio of net investment income to average net assets would have been lower by $0.01 and 0.13%, respectively. |
| (C) | The net investment income per share is based on average shares outstanding for the period. |
| (D) | Total returns shown exclude the effect of applicable sales loads. If these charges were included, the returns would be lower. |
See accompanying Notes to Financial Statements.
Financial Highlights (Continued)
| Touchstone Flexible Income Fund—Class Y |
| Selected Data for a Share Outstanding Throughout Each Period |
| | | | | | | | | | | | Eight
Months | | | | | | | |
| | | | | | | | | | | | Ended | | | | | | | |
| | | | | | | | | | | | March | | | | | | | |
| | | Year Ended March 31, | | | 31, | | | Year Ended July 31, | |
| | | 2016 | | | 2015 | | | 2014 | | | 2013(A)(B) | | | 2012 | | | 2011 | |
| Net asset value at beginning of period | | $ | 10.70 | | | $ | 10.62 | | | $ | 10.97 | | | $ | 10.79 | | | $ | 10.49 | | | $ | 10.02 | |
| Income (loss) from investment operations: | | | | | | | | | | | | | | | | | | | | | | | | |
| Net investment income | | | 0.36 | | | | 0.46 | | | | 0.54 | | | | 0.37 | (C) | | | 0.50 | (D) | | | 0.54 | (D) |
| Net realized and unrealized gains (losses) on investments | | | (0.11 | ) | | | 0.12 | | | | (0.38 | ) | | | 0.16 | | | | 0.33 | | | | 0.45 | |
| Total from investment operations | | | 0.25 | | | | 0.58 | | | | 0.16 | | | | 0.53 | | | | 0.83 | | | | 0.99 | |
| Distributions from: | | | | | | | | | | | | | | | | | | | | | | | | |
| Net investment income | | | (0.34 | ) | | | (0.50 | ) | | | (0.51 | ) | | | (0.35 | ) | | | (0.53 | ) | | | (0.52 | ) |
| Net asset value at end of period | | $ | 10.61 | | | $ | 10.70 | | | $ | 10.62 | | | $ | 10.97 | | | $ | 10.79 | | | $ | 10.49 | |
| Total return | | | 2.38 | % | | | 5.58 | % | | | 1.63 | % | | | 4.96 | %(E) | | | 8.21 | % | | | 10.15 | % |
| Ratios and supplemental data: | | | | | | | | | | | | | | | | | | | | | | | | |
| Net assets at end of period (000’s) | | $ | 358,423 | | | $ | 238,081 | | | $ | 151,652 | | | $ | 199,293 | | | $ | 200,325 | | | $ | 122,125 | |
| Ratio to average net assets: | | | | | | | | | | | | | | | | | | | | | | | | |
| Net expenses | | | 0.84 | % | | | 0.84 | % | | | 0.71 | % | | | 0.64 | %(F) | | | 0.70 | % | | | 0.77 | % |
| Gross expenses | | | 1.05 | % | | | 1.01 | % | | | 1.00 | % | | | 1.05 | %(F) | | | 1.35 | % | | | 1.36 | % |
| Net investment income | | | 3.44 | % | | | 4.21 | % | | | 5.10 | % | | | 5.06 | %(C)(F) | | | 4.80 | % | | | 5.22 | % |
| Portfolio turnover rate | | | 122 | % | | | 102 | % | | | 44 | % | | | 41 | %(E) | | | 47 | % | | | 42 | % |
| Touchstone Flexible Income Fund—Institutional Class |
| Selected Data for a Share Outstanding Throughout Each Period |
| | | | | | | | | | | | Eight | |
| | | | | | | | | | | | Months | |
| | | | | | | | | | | | Ended | |
| | | | | | | | | | | | March | |
| | | Year Ended March 31, | | | 31, | |
| | | 2016 | | | 2015 | | | 2014 | | | 2013(B)(G) | |
| Net asset value at beginning of period | | $ | 10.69 | | | $ | 10.62 | | | $ | 10.96 | | | $ | 10.86 | |
| Income (loss) from investment operations: | | | | | | | | | | | | | | | | |
| Net investment income | | | 0.36 | | | | 0.46 | | | | 0.54 | | | | 0.30 | (C) |
| Net realized and unrealized gains (losses) on investments | | | (0.10 | ) | | | 0.12 | | | | (0.36 | ) | | | 0.12 | |
| Total from investment operations | | | 0.26 | | | | 0.58 | | | | 0.18 | | | | 0.42 | |
| Distributions from: | | | | | | | | | | | | | | | | |
| Net investment income | | | (0.35 | ) | | | (0.51 | ) | | | (0.52 | ) | | | (0.32 | ) |
| Net asset value at end of period | | $ | 10.60 | | | $ | 10.69 | | | $ | 10.62 | | | $ | 10.96 | |
| Total return | | | 2.57 | % | | | 5.58 | % | | | 1.81 | % | | | 3.93 | %(E) |
| Ratios and supplemental data: | | | | | | | | | | | | | | | | |
| Net assets at end of period (000’s) | | $ | 82,286 | | | $ | 44,732 | | | $ | 41,361 | | | $ | 20,589 | |
| Ratio to average net assets: | | | | | | | | | | | | | | | | |
| Net expenses | | | 0.74 | % | | | 0.74 | % | | | 0.65 | % | | | 0.59 | %(F) |
| Gross expenses | | | 0.94 | % | | | 0.95 | % | | | 0.95 | % | | | 1.03 | %(F) |
| Net investment income | | | 3.54 | % | | | 4.30 | % | | | 5.16 | % | | | 5.11 | %(C)(F) |
| Portfolio turnover rate | | | 122 | % | | | 102 | % | | | 44 | % | | | 41 | %(E) |
| (A) | Effective September 10, 2012, Institutional Class shares were renamed Class Y shares. |
| (B) | The Fund changed its fiscal year end from July 31 to March 31. |
| (C) | Reflects the impact of a corporate action event that resulted in a one-time increase to net investment income. If the corporate action event had not occurred, the Class Y and Institutional Class net investment income per share and ratio of net investment income to average net assets would have been lower by $0.01 and 0.13%, respectively. |
| (D) | The net investment income per share is based on average shares outstanding for the period. |
| (G) | The Fund began issuing Institutional Class shares on September 10, 2012. |
See accompanying Notes to Financial Statements.
Financial Highlights (Continued)
| Touchstone Focused Fund—Class A |
| Selected Data for a Share Outstanding Throughout Each Period |
| | | Year Ended March 31, | |
| | | 2016 | | | 2015 | | | 2014 | | | 2013 | | | 2012 | |
| Net asset value at beginning of period | | $ | 37.19 | | | $ | 34.87 | | | $ | 27.55 | | | $ | 23.63 | | | $ | 21.92 | |
| Income from investment operations: | | | | | | | | | | | | | | | | | | | | |
| Net investment income(A) | | | 0.16 | | | | 0.20 | | | | 0.11 | | | | 0.16 | | | | 0.12 | |
| Net realized and unrealized gains on investments | | | 0.38 | | | | 2.23 | | | | 7.46 | | | | 3.79 | (B) | | | 1.67 | |
| Total from investment operations | | | 0.54 | | | | 2.43 | | | | 7.57 | | | | 3.95 | | | | 1.79 | |
| Distributions from: | | | | | | | | | | | | | | | | | | | | |
| Net investment income | | | (0.20 | ) | | | (0.11 | ) | | | (0.25 | ) | | | (0.03 | ) | | | (0.24 | ) |
| Realized capital gains | | | (0.85 | ) | | | — | | | | — | | | | — | | | | — | |
| Total distributions | | | (1.05 | ) | | | (0.11 | ) | | | (0.25 | ) | | | (0.03 | ) | | | (0.24 | ) |
| Capital Contribution | | | — | | | | — | | | | — | | | | — | | | | 0.16 | (C) |
| Net asset value at end of period | | $ | 36.68 | | | $ | 37.19 | | | $ | 34.87 | | | $ | 27.55 | | | $ | 23.63 | |
| Total return(D) | | | 1.47 | % | | | 6.99 | % | | | 27.67 | % | | | 16.75 | %(B) | | | 9.08 | %(C) |
| Ratios and supplemental data: | | | | | | | | | | | | | | | | | | | | |
| Net assets at end of period (000’s) | | $ | 405,458 | | | $ | 297,072 | | | $ | 233,841 | | | $ | 8,497 | | | $ | 7,352 | |
| Ratio to average net assets: | | | | | | | | | | | | | | | | | | | | |
| Net expenses | | | 1.20 | % | | | 1.20 | % | | | 1.20 | % | | | 1.20 | % | | | 1.20 | % |
| Gross expenses | | | 1.31 | % | | | 1.37 | % | | | 1.46 | % | | | 1.90 | % | | | 1.44 | % |
| Net investment income | | | 0.43 | % | | | 0.57 | % | | | 0.35 | % | | | 0.66 | % | | | 0.58 | % |
| Portfolio turnover rate | | | 28 | % | | | 33 | % | | | 27 | %(E) | | | 189 | % | | | 99 | % |
| Touchstone Focused Fund—Class C |
| Selected Data for a Share Outstanding Throughout Each Period |
| | | | | | | | | | | | Period Ended | |
| | | Year Ended March 31, | | | March 31, | |
| | | 2016 | | | 2015 | | | 2014 | | | 2013(F) | |
| Net asset value at beginning of period | | $ | 36.34 | | | $ | 34.32 | | | $ | 27.33 | | | $ | 22.61 | |
| Income (loss) from investment operations: | | | | | | | | | | | | | | | | |
| Net investment loss(A) | | | (0.11 | ) | | | (0.06 | ) | | | (0.13 | ) | | | (0.02 | ) |
| Net realized and unrealized gains on investments | | | 0.37 | | | | 2.18 | | | | 7.38 | | | | 4.80 | (B) |
| Total from investment operations | | | 0.26 | | | | 2.12 | | | | 7.25 | | | | 4.78 | |
| Distributions from: | | | | | | | | | | | | | | | | |
| Net investment income | | | (0.21 | ) | | | (0.10 | ) | | | (0.26 | ) | | | (0.06 | ) |
| Realized capital gains | | | (0.85 | ) | | | — | | | | — | | | | — | |
| Total distributions | | | (1.06 | ) | | | (0.10 | ) | | | (0.26 | ) | | | (0.06 | ) |
| Net asset value at end of period | | $ | 35.54 | | | $ | 36.34 | | | $ | 34.32 | | | $ | 27.33 | |
| Total return(D) | | | 0.73 | % | | | 6.18 | % | | | 26.72 | % | | | 21.19 | %(B)(G) |
| Ratios and supplemental data: | | | | | | | | | | | | | | | | |
| Net assets at end of period (000’s) | | $ | 44,338 | | | $ | 9,617 | | | $ | 5,626 | | | $ | 60 | |
| Ratio to average net assets: | | | | | | | | | | | | | | | | |
| Net expenses | | | 1.95 | % | | | 1.95 | % | | | 1.95 | % | | | 1.95 | %(H) |
| Gross expenses | | | 2.00 | % | | | 2.09 | % | | | 2.84 | % | | | 258.39 | %(H) |
| Net investment loss | | | (0.32 | )% | | | (0.18 | )% | | | (0.40 | )% | | | (0.09 | )%(H) |
| Portfolio turnover rate | | | 28 | % | | | 33 | % | | | 27 | %(E) | | | 189 | % |
| (A) | The net investment income per share is based on average shares outstanding for the period. |
| (B) | Net realized gains (losses) on investments per share and total return reflect non-recurring litigation settlements. These resulted in an increase in net realized gains per share of $0.18 and an increase in total return of 0.76% and 0.78% for Class A and Class C, respectively. |
| (C) | Impact of one time distribution of settlement funds from the Bank of America Fair Fund. If the distribution had not occurred the total return would have been lower. |
| (D) | Total returns shown exclude the effect of applicable sales loads. If these charges were included, the returns would be lower. |
| (E) | Portfolio turnover excludes the purchases and sales of the Touchstone Focused Equity Fund acquired on May 17, 2013. If these transactions were included, portfolio turnover would have been higher. |
| (F) | Represents the period from commencement of operations (April 16, 2012) through March 31, 2013. |
See accompanying Notes to Financial Statements
Financial Highlights (Continued)
| Touchstone Focused Fund—Class Y |
| Selected Data for a Share Outstanding Throughout Each Period |
| | | Year Ended March 31, | |
| | | 2016 | | | 2015 | | | 2014 | | | 2013 | | | 2012 | |
| Net asset value at beginning of period | | $ | 37.76 | | | $ | 35.34 | | | $ | 27.86 | | | $ | 23.85 | | | $ | 22.17 | |
| Income from investment operations: | | | | | | | | | | | | | | | | | | | | |
| Net investment income(A) | | | 0.26 | | | | 0.31 | | | | 0.19 | | | | 0.22 | | | | 0.18 | |
| Net realized and unrealized gains on investments | | | 0.39 | | | | 2.26 | | | | 7.54 | | | | 3.84 | (B) | | | 1.66 | |
| Total from investment operations | | | 0.65 | | | | 2.57 | | | | 7.73 | | | | 4.06 | | | | 1.84 | |
| Distributions from: | | | | | | | | | | | | | | | | | | | | |
| Net investment income | | | (0.27 | ) | | | (0.15 | ) | | | (0.25 | ) | | | (0.05 | ) | | | (0.32 | ) |
| Realized capital gains | | | (0.85 | ) | | | — | | | | — | | | | — | | | | — | |
| Total distributions | | | (1.12 | ) | | | (0.15 | ) | | | (0.25 | ) | | | (0.05 | ) | | | (0.32 | ) |
| Capital Contribution | | | — | | | | — | | | | — | | | | — | | | | 0.16 | (C) |
| Net asset value at end of period | | $ | 37.29 | | | $ | 37.76 | | | $ | 35.34 | | | $ | 27.86 | | | $ | 23.85 | |
| Total return | | | 1.75 | % | | | 7.29 | % | | | 27.95 | % | | | 17.07 | %(B) | | | 9.29 | %(C) |
| Ratios and supplemental data: | | | | | | | | | | | | | | | | | | | | |
| Net assets at end of period (000’s) | | $ | 853,900 | | | $ | 756,579 | | | $ | 736,023 | | | $ | 578,006 | | | $ | 555,142 | |
| Ratio to average net assets: | | | | | | | | | | | | | | | | | | | | |
| Net expenses | | | 0.93 | % | | | 0.92 | % | | | 0.94 | % | | | 0.95 | % | | | 0.95 | % |
| Gross expenses | | | 0.94 | % | | | 0.97 | % | | | 1.02 | % | | | 1.05 | % | | | 1.28 | % |
| Net investment income | | | 0.70 | % | | | 0.85 | % | | | 0.61 | % | | | 0.91 | % | | | 0.85 | % |
| Portfolio turnover rate | | | 28 | % | | | 33 | % | | | 27 | %(D) | | | 189 | % | | | 99 | % |
| Touchstone Focused Fund—Institutional Class |
| Selected Data for a Share Outstanding Throughout Each Period |
| | | Year Ended March 31, | |
| | | 2016 | | | 2015 | | | 2014 | | | 2013 | | | 2012 | |
| Net asset value at beginning of period | | $ | 37.91 | | | $ | 35.47 | | | $ | 27.96 | | | $ | 23.91 | | | $ | 22.23 | |
| Income from investment operations: | | | | | | | | | | | | | | | | | | | | |
| Net investment income(A) | | | 0.31 | | | | 0.35 | | | | 0.24 | | | | 0.25 | | | | 0.22 | |
| Net realized and unrealized gains on investments | | | 0.39 | | | | 2.28 | | | | 7.57 | | | | 3.86 | (B) | | | 1.66 | |
| Total from investment operations | | | 0.70 | | | | 2.63 | | | | 7.81 | | | | 4.11 | | | | 1.88 | |
| Distributions from: | | | | | | | | | | | | | | | | | | | | |
| Net investment income | | | (0.31 | ) | | | (0.19 | ) | | | (0.30 | ) | | | (0.06 | ) | | | (0.36 | ) |
| Realized capital gains | | | (0.85 | ) | | | — | | | | — | | | | — | | | | — | |
| Total distributions | | | (1.16 | ) | | | (0.19 | ) | | | (0.30 | ) | | | (0.06 | ) | | | (0.36 | ) |
| Capital Contribution | | | — | | | | — | | | | — | | | | — | | | | 0.16 | (C) |
| Net asset value at end of period | | $ | 37.45 | | | $ | 37.91 | | | $ | 35.47 | | | $ | 27.96 | | | $ | 23.91 | |
| Total return | | | 1.89 | % | | | 7.40 | % | | | 28.19 | % | | | 17.24 | %(B) | | | 9.45 | %(C) |
| Ratios and supplemental data: | | | | | | | | | | | | | | | | | | | | |
| Net assets at end of period (000’s) | | $ | 48,805 | | | $ | 51,765 | | | $ | 30,446 | | | $ | 589 | | | $ | 29,879 | |
| Ratio to average net assets: | | | | | | | | | | | | | | | | | | | | |
| Net expenses | | | 0.82 | % | | | 0.80 | % | | | 0.80 | % | | | 0.80 | % | | | 0.80 | % |
| Gross expenses | | | 0.90 | % | | | 0.88 | % | | | 1.00 | % | | | 1.16 | % | | | 0.89 | % |
| Net investment income | | | 0.81 | % | | | 0.97 | % | | | 0.75 | % | | | 1.06 | % | | | 1.02 | % |
| Portfolio turnover rate | | | 28 | % | | | 33 | % | | | 27 | %(D) | | | 189 | % | | | 99 | % |
| (A) | The net investment income per share is based on average shares outstanding for the period. |
| (B) | Net realized gains (losses) on investments per share and total return reflect non-recurring litigation settlements. These resulted in an increase in net realized gains per share of $0.18 and an increase in total return of 0.76% and 0.75% for Class Y and Institutional Class, respectively. |
| (C) | Impact of one time distribution of settlement funds from the Bank of America Fair Fund. If the distribution had not occurred the total return would have been lower. |
| (D) | Portfolio turnover excludes the purchases and sales of the Touchstone Focused Equity Fund acquired on May 17, 2013. If these transactions were included, portfolio turnover would have been higher. |
See accompanying Notes to Financial Statements.
Financial Highlights (Continued)
| Touchstone Growth Opportunities Fund—Class A |
| Selected Data for a Share Outstanding Throughout Each Period |
| | Year Ended March 31, | |
| | | 2016 | | | 2015 | | | 2014 | | | 2013 | | | 2012 | |
| Net asset value at beginning of period | | $ | 33.29 | | | $ | 32.61 | | | $ | 27.05 | | | $ | 25.64 | | | $ | 25.27 | |
| Income (loss) from investment operations: | | | | | | | | | | | | | | | | | | | | |
| Net investment income (loss) | | | (0.08 | ) | | | (0.15 | ) | | | 0.01 | | | | (0.01 | ) | | | (0.16 | ) |
| Net realized and unrealized gains (losses) on investments | | | (2.90 | ) | | | 4.82 | | | | 6.91 | | | | 3.35 | | | | 0.53 | |
| Total from investment operations | | | (2.98 | ) | | | 4.67 | | | | 6.92 | | | | 3.34 | | | | 0.37 | |
| Distributions from: | | | | | | | | | | | | | | | | | | | | |
| Realized capital gains | | | (2.96 | ) | | | (3.99 | ) | | | (1.36 | ) | | | (1.93 | ) | | | — | |
| Net asset value at end of period | | $ | 27.35 | | | $ | 33.29 | | | $ | 32.61 | | | $ | 27.05 | | | $ | 25.64 | |
| Total return(A) | | | (9.12 | )% | | | 14.99 | % | | | 25.84 | % | | | 14.08 | % | | | 1.47 | % |
| Ratios and supplemental data: | | | | | | | | | | | | | | | | | | | | |
| Net assets at end of period (000’s) | | $ | 38,297 | | | $ | 49,162 | | | $ | 47,552 | | | $ | 74,588 | | | $ | 62,274 | |
| Ratio to average net assets: | | | | | | | | | | | | | | | | | | | | |
| Net expenses | | | 1.24 | % | | | 1.24 | % | | | 1.22 | % | | | 1.22 | % | | | 1.21 | % |
| Gross expenses | | | 1.38 | % | | | 1.40 | % | | | 1.43 | % | | | 1.37 | % | | | 1.43 | % |
| Net investment income (loss) | | | (0.24 | )% | | | (0.47 | )% | | | 0.09 | % | | | (0.06 | )% | | | (0.52 | )% |
| Portfolio turnover rate | | | 137 | % | | | 87 | % | | | 79 | % | | | 95 | %(B) | | | 204 | % |
| Touchstone Growth Opportunities Fund — Class C |
| Selected Data for a Share Outstanding Throughout Each Period |
| | | Year Ended March 31, | |
| | | 2016 | | | 2015 | | | 2014 | | | 2013 | | | 2012 | |
| Net asset value at beginning of period | | $ | 29.27 | | | $ | 29.32 | | | $ | 24.62 | | | $ | 23.68 | | | $ | 23.50 | |
| Income (loss) from investment operations: | | | | | | | | | | | | | | | | | | | | |
| Net investment loss | | | (0.24 | ) | | | (0.33 | ) | | | (0.18 | ) | | | (0.17 | ) | | | (0.29 | ) |
| Net realized and unrealized gains (losses) on investments | | | (2.56 | ) | | | 4.27 | | | | 6.24 | | | | 3.04 | | | | 0.47 | |
| Total from investment operations | | | (2.80 | ) | | | 3.94 | | | | 6.06 | | | | 2.87 | | | | 0.18 | |
| Distributions from: | | | | | | | | | | | | | | | | | | | | |
| Realized capital gains | | | (2.96 | ) | | | (3.99 | ) | | | (1.36 | ) | | | (1.93 | ) | | | — | |
| Net asset value at end of period | | $ | 23.51 | | | $ | 29.27 | | | $ | 29.32 | | | $ | 24.62 | | | $ | 23.68 | |
| Total return(A) | | | (9.78 | )% | | | 14.11 | % | | | 24.92 | % | | | 13.24 | % | | | 0.77 | % |
| Ratios and supplemental data: | | | | | | | | | | | | | | | | | | | | |
| Net assets at end of period (000’s) | | $ | 11,665 | | | $ | 13,813 | | | $ | 12,498 | | | $ | 10,375 | | | $ | 9,132 | |
| Ratio to average net assets: | | | | | | | | | | | | | | | | | | | | |
| Net expenses | | | 1.99 | % | | | 1.99 | % | | | 1.97 | % | | | 1.97 | % | | | 1.96 | % |
| Gross expenses | | | 2.20 | % | | | 2.21 | % | | | 2.25 | % | | | 2.37 | % | | | 2.45 | % |
| Net investment loss | | | (0.99 | )% | | | (1.22 | )% | | | (0.66 | )% | | | (0.81 | )% | | | (1.27 | )% |
| Portfolio turnover rate | | | 137 | % | | | 87 | % | | | 79 | % | | | 95 | %(B) | | | 204 | % |
| (A) | Total returns shown exclude the effect of applicable sales loads. If these charges were included, the returns would be lower. |
| (B) | Portfolio turnover excludes the purchases and sales of the Fifth Third Mid Cap Growth Fund acquired on September 10, 2012. If these transactions were included, portfolio turnover would have been higher. |
See accompanying Notes to Financial Statements.
Financial Highlights (Continued)
| Touchstone Growth Opportunities Fund—Class Y |
| Selected Data for a Share Outstanding Throughout Each Period |
| | | Year Ended March 31, | |
| | | 2016 | | | 2015 | | | 2014 | | | 2013 | | | 2012 | |
| Net asset value at beginning of period | | $ | 33.81 | | | $ | 32.97 | | | $ | 27.27 | | | $ | 25.80 | | | $ | 25.38 | |
| Income (loss) from investment operations: | | | | | | | | | | | | | | | | | | | | |
| Net investment income (loss) | | | — | (A) | | | (0.06 | ) | | | 0.11 | | | | 0.03 | | | | (0.05 | ) |
| Net realized and unrealized gains (losses) on investments | | | (2.95 | ) | | | 4.90 | | | | 6.96 | | | | 3.40 | | | | 0.47 | |
| Total from investment operations | | | (2.95 | ) | | | 4.84 | | | | 7.07 | | | | 3.43 | | | | 0.42 | |
| Distributions from: | | | | | | | | | | | | | | | | | | | | |
| Net investment income | | | — | | | | (0.01 | ) | | | (0.01 | ) | | | (0.03 | ) | | | — | |
| Realized capital gains | | | (2.96 | ) | | | (3.99 | ) | | | (1.36 | ) | | | (1.93 | ) | | | — | |
| Total distributions | | | (2.96 | ) | | | (4.00 | ) | | | (1.37 | ) | | | (1.96 | ) | | | — | |
| Net asset value at end of period | | $ | 27.90 | | | $ | 33.81 | | | $ | 32.97 | | | $ | 27.27 | | | $ | 25.80 | |
| Total return | | | (8.88 | )% | | | 15.32 | % | | | 26.23 | % | | | 14.38 | % | | | 1.66 | % |
| Ratios and supplemental data: | | | | | | | | | | | | | | | | | | | | |
| Net assets at end of period (000’s) | | $ | 83,721 | | | $ | 107,295 | | | $ | 92,063 | | | $ | 35,354 | | | $ | 12,254 | |
| Ratio to average net assets: | | | | | | | | | | | | | | | | | | | | |
| Net expenses | | | 0.99 | % | | | 0.94 | % | | | 0.92 | % | | | 0.96 | % | | | 0.96 | % |
| Gross expenses | | | 1.07 | % | | | 1.01 | % | | | 1.03 | % | | | 1.16 | % | | | 1.42 | % |
| Net investment income (loss) | | | 0.01 | % | | | (0.17 | )% | | | 0.39 | % | | | 0.19 | % | | | (0.27 | )% |
| Portfolio turnover rate | | | 137 | % | | | 87 | % | | | 79 | % | | | 95 | %(B) | | | 204 | % |
| Touchstone Growth Opportunities Fund—Institutional Class |
| Selected data for a Share Outstanding Throughout Each Period |
| | | Year Ended March 31, | |
| | | 2016 | | | 2015 | | | 2014 | | | 2013 | | | 2012 | |
| Net asset value at beginning of period | | $ | 34.05 | | | $ | 33.18 | | | $ | 27.42 | | | $ | 25.92 | | | $ | 25.46 | |
| Income (loss) from investment operations: | | | | | | | | | | | | | | | | | | | | |
| Net investment income (loss) | | | 0.01 | | | | (0.04 | ) | | | 0.14 | | | | 0.07 | | | | (0.03 | ) |
| Net realized and unrealized gains (losses) on investments | | | (2.95 | ) | | | 4.92 | | | | 7.01 | | | | 3.41 | | | | 0.49 | |
| Total from investment operations | | | (2.94 | ) | | | 4.88 | | | | 7.15 | | | | 3.48 | | | | 0.46 | |
| Distributions from: | | | | | | | | | | | | | | | | | | | | |
| Net investment income | | | — | | | | (0.02 | ) | | | (0.03 | ) | | | (0.05 | ) | | | — | |
| Realized capital gains | | | (2.96 | ) | | | (3.99 | ) | | | (1.36 | ) | | | (1.93 | ) | | | — | |
| Total distributions | | | (2.96 | ) | | | (4.01 | ) | | | (1.39 | ) | | | (1.98 | ) | | | — | |
| Net asset value at end of period | | $ | 28.15 | | | $ | 34.05 | | | $ | 33.18 | | | $ | 27.42 | | | $ | 25.92 | |
| Total return | | | (8.79 | )% | | | 15.39 | % | | | 26.34 | % | | | 14.50 | % | | | 1.81 | % |
| Ratios and supplemental data: | | | | | | | | | | | | | | | | | | | | |
| Net assets at end of period (000’s) | | $ | 176,191 | | | $ | 134,795 | | | $ | 115,769 | | | $ | 93,800 | | | $ | 70,643 | |
| Ratio to average net assets: | | | | | | | | | | | | | | | | | | | | |
| Net expenses | | | 0.89 | % | | | 0.87 | % | | | 0.84 | % | | | 0.84 | % | | | 0.81 | % |
| Gross expenses | | | 0.98 | % | | | 0.97 | % | | | 0.98 | % | | | 1.00 | % | | | 1.06 | % |
| Net investment income (loss) | | | 0.11 | % | | | (0.10 | )% | | | 0.47 | % | | | 0.31 | % | | | (0.12 | )% |
| Portfolio turnover rate | | | 137 | % | | | 87 | % | | | 79 | % | | | 95 | %(B) | | | 204 | % |
| (A) | Less than $(0.005) per share. |
| (B) | Portfolio turnover excludes the purchases and sales of the Fifth Third Mid Cap Growth Fund acquired on September 10, 2012. If these transactions were included, portfolio turnover would have been higher. |
See accompanying Notes to Financial Statements.
Financial Highlights (Continued)
| Touchstone International Value Fund—Class A |
| Selected Data for a Share Outstanding Throughout Each Period |
| | | | | | | | | | | | Eight | | | | | | | |
| | | | | | | | | | | | Months | | | | | | | |
| | | | | | | | | | | | Ended | | | | | | | |
| | | | | | | | | | | | March | | | | | | | |
| | | Year Ended March 31, | | | 31, | | | Year Ended July 31, | |
| | | 2016 | | | 2015 | | | 2014 | | | 2013(A) | | | 2012 | | | 2011 | |
| Net asset value at beginning of period | | $ | 8.41 | | | $ | 9.12 | | | $ | 7.62 | | | $ | 7.06 | | | $ | 8.42 | | | $ | 7.33 | |
| Income (loss) from investment operations: | | | | | | | | | | | | | | | | | | | | | | | | |
| Net investment income | | | 0.14 | (B) | | | 0.18 | | | | 0.24 | | | | 0.06 | (B) | | | 0.14 | (B) | | | 0.17 | (B) |
| Net realized and unrealized gains (losses) on investments | | | (0.97 | ) | | | (0.63 | ) | | | 1.35 | | | | 0.73 | | | | (1.30 | ) | | | 1.09 | |
| Total from investment operations | | | (0.83 | ) | | | (0.45 | ) | | | 1.59 | | | | 0.79 | | | | (1.16 | ) | | | 1.26 | |
| Distributions from: | | | | | | | | | | | | | | | | | | | | | | | | |
| Net investment income | | | (0.21 | ) | | | (0.26 | ) | | | (0.09 | ) | | | (0.23 | ) | | | (0.20 | ) | | | (0.17 | ) |
| Net asset value at end of period | | $ | 7.37 | | | $ | 8.41 | | | $ | 9.12 | | | $ | 7.62 | | | $ | 7.06 | | | $ | 8.42 | |
| Total return(C) | | | (9.97 | )% | | | (4.95 | )% | | | 20.90 | % | | | 11.15 | %(D) | | | (13.67 | )% | | | 17.17 | % |
| Ratios and supplemental data: | | | | | | | | | | | | | | | | | | | | | | | | |
| Net assets at end of period (000’s) | | $ | 3,700 | | | $ | 5,280 | | | $ | 6,032 | | | $ | 6,394 | | | $ | 7,266 | | | $ | 10,258 | |
| Ratio to average net assets: | | | | | | | | | | | | | | | | | | | | | | | | |
| Net expenses | | | 1.36 | % | | | 1.39 | % | | | 1.37 | % | | | 1.36 | %(E)(F) | | | 1.40 | %(E) | | | 1.42 | %(E) |
| Gross expenses | | | 2.10 | % | | | 1.97 | % | | | 1.79 | % | | | 2.22 | %(F) | | | 1.68 | % | | | 1.61 | % |
| Net investment income | | | 1.78 | % | | | 1.89 | % | | | 2.32 | % | | | 1.21 | %(F) | | | 2.00 | % | | | 2.10 | % |
| Portfolio turnover rate | | | 38 | % | | | 26 | % | | | 31 | % | | | 133 | %(D) | | | 121 | % | | | 131 | % |
| Touchstone International Value Fund—Class C |
| Selected Data for a Share Outstanding Throughout Each Period |
| | | | | | | | | | | | Eight | | | | | | | |
| | | | | | | | | | | | Months | | | | | | | |
| | | | | | | | | | | | Ended | | | | | | | |
| | | | | | | | | | | | March | | | | | | | |
| | | Year Ended March 31, | | | 31, | | | Year Ended July 31, | |
| | | 2016 | | | 2015 | | | 2014 | | | 2013(A) | | | 2012 | | | 2011 | |
| Net asset value at beginning of period | | $ | 7.77 | | | $ | 8.46 | | | $ | 7.10 | | | $ | 6.59 | | | $ | 7.85 | | | $ | 6.84 | |
| Income (loss) from investment operations: | | | | | | | | | | | | | | | | | | | | | | | | |
| Net investment income | | | 0.08 | (B) | | | 0.07 | | | | 0.15 | | | | 0.02 | (B) | | | 0.08 | (B) | | | 0.10 | (B) |
| Net realized and unrealized gains (losses) on investments | | | (0.90 | ) | | | (0.55 | ) | | | 1.27 | | | | 0.67 | | | | (1.21 | ) | | | 1.01 | |
| Total from investment operations | | | (0.82 | ) | | | (0.48 | ) | | | 1.42 | | | | 0.69 | | | | (1.13 | ) | | | 1.11 | |
| Distributions from: | | | | | | | | | | | | | | | | | | | | | | | | |
| Net investment income | | | (0.12 | ) | | | (0.21 | ) | | | (0.06 | ) | | | (0.18 | ) | | | (0.13 | ) | | | (0.10 | ) |
| Net asset value at end of period | | $ | 6.83 | | | $ | 7.77 | | | $ | 8.46 | | | $ | 7.10 | | | $ | 6.59 | | | $ | 7.85 | |
| Total return(C) | | | (10.61 | )% | | | (5.72 | )% | | | 20.05 | % | | | 10.53 | %(D) | | | (14.37 | )% | | | 16.23 | % |
| Ratios and supplemental data: | | | | | | | | | | | | | | | | | | | | | | | | |
| Net assets at end of period (000’s) | | $ | 122 | | | $ | 233 | | | $ | 216 | | | $ | 217 | | | $ | 169 | | | $ | 275 | |
| Ratio to average net assets: | | | | | | | | | | | | | | | | | | | | | | | | |
| Net expenses | | | 2.11 | % | | | 2.14 | % | | | 2.12 | % | | | 2.11 | %(E)(F) | | | 2.15 | %(E) | | | 2.17 | %(E) |
| Gross expenses | | | 9.23 | % | | | 8.35 | % | | | 6.04 | % | | | 9.33 | %(F) | | | 2.43 | % | | | 2.36 | % |
| Net investment income | | | 1.03 | % | | | 1.14 | % | | | 1.57 | % | | | 0.46 | %(F) | | | 1.24 | % | | | 1.28 | % |
| Portfolio turnover rate | | | 38 | % | | | 26 | % | | | 31 | % | | | 133 | %(D) | | | 121 | % | | | 131 | % |
| (A) | The Fund changed its fiscal year end from July 31 to March 31. |
| (B) | The net investment income per share is based on average shares outstanding for the period. |
| (C) | Total returns shown exclude the effect of applicable sales loads. If these charges were included, the returns would be lower. |
| (E) | Includes interest expense relating to settlement of foreign futures. Interest expense was less than 0.005% for the eight months ended March 31, 2013 and 0.02% and 0.01% for the years ended July 31, 2012 and 2011, respectively. |
See accompanying Notes to Financial Statements.
Financial Highlights (Continued)
| Touchstone International Value Fund—Class Y |
| Selected Data for a Share Outstanding Throughout Each Period |
| | | | | | | | | | | | Eight | | | | | | | |
| | | | | | | | | | | | Months | | | | | | | |
| | | | | | | | | | | | Ended | | | | | | | |
| | | | | | | | | | | | March | | | | | | | |
| | | Year Ended March 31, | | | 31, | | | Year Ended July 31, | |
| | | 2016 | | | 2015 | | | 2014 | | | 2013(A)(B) | | | 2012 | | | 2011 | |
| Net asset value at beginning of period | | $ | 8.41 | | | $ | 9.13 | | | $ | 7.62 | | | $ | 7.07 | | | $ | 8.44 | | | $ | 7.35 | |
| Income (loss) from investment operations: | | | | | | | | | | | | | | | | | | | | | | | | |
| Net investment income | | | 0.17 | (C) | | | 0.23 | | | | 0.19 | | | | 0.07 | (C) | | | 0.16 | (C) | | | 0.18 | (C) |
| Net realized and unrealized gains (losses) on investments | | | (0.98 | ) | | | (0.66 | ) | | | 1.43 | | | | 0.73 | | | | (1.31 | ) | | | 1.10 | |
| Total from investment operations | | | (0.81 | ) | | | (0.43 | ) | | | 1.62 | | | | 0.80 | | | | (1.15 | ) | | | 1.28 | |
| Distributions from: | | | | | | | | | | | | | | | | | | | | | | | | |
| Net investment income | | | (0.21 | ) | | | (0.29 | ) | | | (0.11 | ) | | | (0.25 | ) | | | (0.22 | ) | | | (0.19 | ) |
| Net asset value at end of period | | $ | 7.39 | | | $ | 8.41 | | | $ | 9.13 | | | $ | 7.62 | | | $ | 7.07 | | | $ | 8.44 | |
| Total return | | | (9.77 | )% | | | (4.72 | )% | | | 21.32 | % | | | 11.33 | %(D) | | | (13.47 | )% | | | 17.42 | % |
| Ratios and supplemental data: | | | | | | | | | | | | | | | | | | | | | | | | |
| Net assets at end of period (000’s) | | $ | 4,583 | | | $ | 35,108 | | | $ | 43,794 | | | $ | 31,527 | | | $ | 123,607 | | | $ | 176,521 | |
| Ratio to average net assets: | | | | | | | | | | | | | | | | | | | | | | | | |
| Net expenses | | | 1.12 | % | | | 1.09 | % | | | 1.04 | % | | | 1.08 | %(E)(F) | | | 1.15 | %(E) | | | 1.17 | %(E) |
| Gross expenses | | | 1.56 | % | | | 1.36 | % | | | 1.33 | % | | | 1.51 | %(F) | | | 1.43 | % | | | 1.36 | % |
| Net investment income | | | 2.02 | % | | | 2.19 | % | | | 2.65 | % | | | 1.49 | %(F) | | | 2.27 | % | | | 2.22 | % |
| Portfolio turnover rate | | | 38 | % | | | 26 | % | | | 31 | % | | | 133 | %(D) | | | 121 | % | | | 131 | % |
| Touchstone International Value Fund—Institutional Class |
| Selected Data for a Share Outstanding Throughout Each Period |
| | | | | | | | | | | | Period | |
| | | | | | | | | | | | Ended | |
| | | Year Ended March 31, | | | March 31, | |
| | | 2016 | | | 2015 | | | 2014 | | | 2013(B)(G) | |
| Net asset value at beginning of period | | $ | 8.42 | | | $ | 9.14 | | | $ | 7.62 | | | $ | 7.43 | |
| Income (loss) from investment operations: | | | | | | | | | | | | | | | | |
| Net investment income | | | 0.17 | (C) | | | 0.24 | | | | 0.28 | | | | 0.08 | (C) |
| Net realized and unrealized gains (losses) on investments | | | (0.98 | ) | | | (0.66 | ) | | | 1.36 | | | | 0.36 | |
| Total from investment operations | | | (0.81 | ) | | | (0.42 | ) | | | 1.64 | | | | 0.44 | |
| Distributions from: | | | | | | | | | | | | | | | | |
| Net investment income | | | (0.26 | ) | | | (0.30 | ) | | | (0.12 | ) | | | (0.25 | ) |
| Net asset value at end of period | | $ | 7.35 | | | $ | 8.42 | | | $ | 9.14 | | | $ | 7.62 | |
| Total return | | | (9.74 | )% | | | (4.66 | )% | | | 21.51 | % | | | 5.94 | %(D) |
| Ratios and supplemental data: | | | | | | | | | | | | | | | | |
| Net assets at end of period (000’s) | | $ | 34,742 | | | $ | 72,607 | | | $ | 83,628 | | | $ | 88,931 | |
| Ratio to average net assets: | | | | | | | | | | | | | | | | |
| Net expenses | | | 0.99 | % | | | 0.99 | % | | | 0.97 | % | | | 0.96 | %(F) |
| Gross expenses | | | 1.29 | % | | | 1.28 | % | | | 1.29 | % | | | 1.36 | %(F) |
| Net investment income | | | 2.15 | % | | | 2.29 | % | | | 2.72 | % | | | 1.61 | %(F) |
| Portfolio turnover rate | | | 38 | % | | | 26 | % | | | 31 | % | | | 133 | %(D) |
| (A) | Effective September 10, 2012, Institutional Class shares were renamed Class Y shares. |
| (B) | The Fund changed its fiscal year end from July 31 to March 31. |
| (C) | The net investment income per share is based on average shares outstanding for the period. |
| (E) | Includes interest expense relating to settlement of foreign futures. Interest expense was less than 0.005% for the eight months ended March 31, 2013 and 0.02% and 0.01% for the years ended July 31, 2012 and 2011, respectively. |
| (G) | The Fund began issuing Institutional Class shares on September 10, 2012. |
See accompanying Notes to Financial Statements.
Financial Highlights (Continued)
| Touchstone Mid Cap Growth Fund—Class A |
| Selected Data for a Share Outstanding Throughout Each Period |
| | | Year Ended March 31, | |
| | | 2016 | | | 2015 | | | 2014 | | | 2013 | | | 2012 | |
| Net asset value at beginning of period | | $ | 27.06 | | | $ | 26.50 | | | $ | 23.61 | | | $ | 22.41 | | | $ | 24.91 | |
| Income (loss) from investment operations: | | | | | | | | | | | | | | | | | | | | |
| Net investment loss | | | (0.10 | ) | | | (0.14 | ) | | | (0.10 | ) | | | (0.05 | ) | | | (0.16 | ) |
| Net realized and unrealized gains (losses) on investments | | | (1.62 | ) | | | 4.19 | | | | 5.74 | | | | 2.71 | | | | (1.05 | ) |
| Total from investment operations | | | (1.72 | ) | | | 4.05 | | | | 5.64 | | | | 2.66 | | | | (1.21 | ) |
| Distributions from: | | | | | | | | | | | | | | | | | | | | |
| Realized capital gains | | | (2.06 | ) | | | (3.49 | ) | | | (2.75 | ) | | | (1.46 | ) | | | (1.29 | ) |
| Net asset value at end of period | | $ | 23.28 | | | $ | 27.06 | | | $ | 26.50 | | | $ | 23.61 | | | $ | 22.41 | |
| Total return(A) | | | (6.34 | )% | | | 16.34 | % | | | 24.82 | % | | | 12.73 | % | | | (3.68 | )% |
| Ratios and supplemental data: | | | | | | | | | | | | | | | | | | | | |
| Net assets at end of period (000’s) | | $ | 226,201 | | | $ | 267,421 | | | $ | 308,316 | | | $ | 299,834 | | | $ | 330,808 | |
| Ratio to average net assets: | | | | | | | | | | | | | | | | | | | | |
| Net expenses | | | 1.31 | % | | | 1.34 | % | | | 1.38 | % | | | 1.40 | % | | | 1.40 | % |
| Gross expenses | | | 1.31 | % | | | 1.34 | % | | | 1.38 | % | | | 1.40 | % | | | 1.40 | % |
| Net investment loss | | | (0.42 | )% | | | (0.55 | )% | | | (0.41 | )% | | | (0.21 | )% | | | (0.79 | )% |
| Portfolio turnover rate | | | 92 | % | | | 73 | % | | | 79 | % | | | 70 | % | | | 64 | % |
| Touchstone Mid Cap Growth Fund—Class B |
| Selected Data for a Share Outstanding Throughout Each Period |
| | | Year Ended March 31, | |
| | | 2016 | | | 2015 | | | 2014 | | | 2013 | | | 2012 | |
| Net asset value at beginning of period | | $ | 20.32 | | | $ | 20.82 | | | $ | 19.12 | | | $ | 18.48 | | | $ | 20.89 | |
| Income (loss) from investment operations: | | | | | | | | | | | | | | | | | | | | |
| Net investment loss | | | (0.34 | ) | | | (0.29 | ) | | | (0.19 | ) | | | (0.12 | ) | | | (0.48 | ) |
| Net realized and unrealized gains (losses) on investments | | | (1.11 | ) | | | 3.28 | | | | 4.64 | | | | 2.22 | | | | (0.64 | ) |
| Total from investment operations | | | (1.45 | ) | | | 2.99 | | | | 4.45 | | | | 2.10 | | | | (1.12 | ) |
| Distributions from: | | | | | | | | | | | | | | | | | | | | |
| Realized capital gains | | | (2.06 | ) | | | (3.49 | ) | | | (2.75 | ) | | | (1.46 | ) | | | (1.29 | ) |
| Net asset value at end of period | | $ | 16.81 | | | $ | 20.32 | | | $ | 20.82 | | | $ | 19.12 | | | $ | 18.48 | |
| Total return(A) | | | (7.14 | )% | | | 15.72 | % | | | 24.36 | % | | | 12.41 | % | | | (3.99 | )% |
| Ratios and supplemental data: | | | | | | | | | | | | | | | | | | | | |
| Net assets at end of period (000’s) | | $ | 1,140 | | | $ | 2,793 | | | $ | 4,709 | | | $ | 5,880 | | | $ | 10,681 | |
| Ratio to average net assets: | | | | | | | | | | | | | | | | | | | | |
| Net expenses | | | 2.14 | % | | | 1.89 | % | | | 1.73 | % | | | 1.72 | % | | | 1.59 | % |
| Gross expenses | | | 2.30 | % | | | 1.89 | % | | | 1.73 | % | | | 1.72 | % | | | 1.59 | % |
| Net investment loss | | | (1.25 | )% | | | (1.10 | )% | | | (0.76 | )% | | | (0.52 | )% | | | (0.97 | )% |
| Portfolio turnover rate | | | 92 | % | | | 73 | % | | | 79 | % | | | 70 | % | | | 64 | % |
| (A) | Total returns shown exclude the effect of applicable sales loads. If these charges were included, the returns would be lower. |
See accompanying Notes to Financial Statements.
Financial Highlights (Continued)
| Touchstone Mid Cap Growth Fund—Class C |
| Selected Data for a Share Outstanding Throughout Each Period |
| | | Year Ended March 31, | |
| | | 2016 | | | 2015 | | | 2014 | | | 2013 | | | 2012 | |
| Net asset value at beginning of period | | $ | 19.78 | | | $ | 20.39 | | | $ | 18.84 | | | $ | 18.31 | | | $ | 20.81 | |
| Income (loss) from investment operations: | | | | | | | | | | | | | | | | | | | | |
| Net investment loss | | | (0.21 | ) | | | (0.24 | ) | | | (0.22 | ) | | | (0.18 | ) | | | (0.36 | ) |
| Net realized and unrealized gains (losses) on investments | | | (1.18 | ) | | | 3.12 | | | | 4.52 | | | | 2.17 | | | | (0.85 | ) |
| Total from investment operations | | | (1.39 | ) | | | 2.88 | | | | 4.30 | | | | 1.99 | | | | (1.21 | ) |
| Distributions from: | | | | | | | | | | | | | | | | | | | | |
| Realized capital gains | | | (2.06 | ) | | | (3.49 | ) | | | (2.75 | ) | | | (1.46 | ) | | | (1.29 | ) |
| Net asset value at end of period | | $ | 16.33 | | | $ | 19.78 | | | $ | 20.39 | | | $ | 18.84 | | | $ | 18.31 | |
| Total return(A) | | | (7.02 | )% | | | 15.51 | % | | | 23.90 | % | | | 11.90 | % | | | (4.43 | )% |
| Ratios and supplemental data: | | | | | | | | | | | | | | | | | | | | |
| Net assets at end of period (000’s) | | $ | 127,852 | | | $ | 157,315 | | | $ | 149,927 | | | $ | 141,485 | | | $ | 162,693 | |
| Ratio to average net assets: | | | | | | | | | | | | | | | | | | | | |
| Net expenses | | | 2.06 | % | | | 2.07 | % | | | 2.11 | % | | | 2.15 | % | | | 2.17 | % |
| Gross expenses | | | 2.06 | % | | | 2.07 | % | | | 2.11 | % | | | 2.15 | % | | | 2.17 | % |
| Net investment loss | | | (1.17 | )% | | | (1.29 | )% | | | (1.14 | )% | | | (0.95 | )% | | | (1.56 | )% |
| Portfolio turnover rate | | | 92 | % | | | 73 | % | | | 79 | % | | | 70 | % | | | 64 | % |
| Touchstone Mid Cap Growth Fund — Class Y |
| Selected Data for a Share Outstanding Throughout Each Period |
| | | Year Ended March 31, | |
| | | 2016 | | | 2015 | | | 2014 | | | 2013 | | | 2012 | |
| Net asset value at beginning of period | | $ | 27.71 | | | $ | 27.00 | | | $ | 23.93 | | | $ | 22.63 | | | $ | 25.07 | |
| Income (loss) from investment operations: | | | | | | | | | | | | | | | | | | | | |
| Net investment income (loss) | | | (0.04 | ) | | | (0.08 | ) | | | (0.05 | ) | | | 0.01 | | | | (0.10 | ) |
| Net realized and unrealized gains (losses) on investments | | | (1.65 | ) | | | 4.28 | | | | 5.87 | | | | 2.75 | | | | (1.05 | ) |
| Total from investment operations | | | (1.69 | ) | | | 4.20 | | | | 5.82 | | | | 2.76 | | | | (1.15 | ) |
| Distributions from: | | | | | | | | | | | | | | | | | | | | |
| Net investment income | | | (0.04 | ) | | | — | | | | — | | | | — | | | | — | |
| Realized capital gains | | | (2.06 | ) | | | (3.49 | ) | | | (2.75 | ) | | | (1.46 | ) | | | (1.29 | ) |
| Total distributions | | | (2.10 | ) | | | (3.49 | ) | | | (2.75 | ) | | | (1.46 | ) | | | (1.29 | ) |
| Net asset value at end of period | | $ | 23.92 | | | $ | 27.71 | | | $ | 27.00 | | | $ | 23.93 | | | $ | 22.63 | |
| Total return | | | (6.08 | )% | | | 16.69 | % | | | 25.17 | % | | | 13.05 | % | | | (3.42 | )% |
| Ratios and supplemental data: | | | | | | | | | | | | | | | | | | | | |
| Net assets at end of period (000’s) | | $ | 347,706 | | | $ | 299,247 | | | $ | 263,578 | | | $ | 164,267 | | | $ | 123,593 | |
| Ratio to average net assets: | | | | | | | | | | | | | | | | | | | | |
| Net expenses | | | 1.05 | % | | | 1.07 | % | | | 1.07 | % | | | 1.16 | % | | | 1.11 | % |
| Gross expenses | | | 1.05 | % | | | 1.07 | % | | | 1.07 | % | | | 1.16 | % | | | 1.11 | % |
| Net investment income (loss) | | | (0.16 | )% | | | (0.29 | )% | | | (0.11 | )% | | | 0.04 | % | | | (0.49 | )% |
| Portfolio turnover rate | | | 92 | % | | | 73 | % | | | 79 | % | | | 70 | % | | | 64 | % |
| (A) | Total returns shown exclude the effect of applicable sales loads. If these charges were included, the returns would be lower. |
See accompanying Notes to Financial Statements.
Financial Highlights (Continued)
| Touchstone Mid Cap Growth Fund—Institutional Class |
| Selected Data for a Share Outstanding Throughout Each Period |
| | | Year Ended March 31, | |
| | | 2016 | | | 2015 | | | 2014 | | | 2013 | | | 2012(A) | |
| Net asset value at beginning of period | | $ | 27.85 | | | $ | 27.10 | | | $ | 23.99 | | | $ | 22.65 | | | $ | 25.30 | |
| Income (loss) from investment operations: | | | | | | | | | | | | | | | | | | | | |
| Net investment income (loss) | | | (0.02 | ) | | | (0.03 | ) | | | 0.03 | | | | 0.04 | | | | (0.03 | ) |
| Net realized and unrealized gains (losses) on investments | | | (1.65 | ) | | | 4.27 | | | | 5.83 | | | | 2.76 | | | | (1.33 | ) |
| Total from investment operations | | | (1.67 | ) | | | 4.24 | | | | 5.86 | | | | 2.80 | | | | (1.36 | ) |
| Distributions from: | | | | | | | | | | | | | | | | | | | | |
| Net investment income | | | (0.05 | ) | | | — | | | | — | | | | — | | | | — | |
| Realized capital gains | | | (2.06 | ) | | | (3.49 | ) | | | (2.75 | ) | | | (1.46 | ) | | | (1.29 | ) |
| Total distributions | | | (2.11 | ) | | | (3.49 | ) | | | (2.75 | ) | | | (1.46 | ) | | | (1.29 | ) |
| Net asset value at end of period | | $ | 24.07 | | | $ | 27.85 | | | $ | 27.10 | | | $ | 23.99 | | | $ | 22.65 | |
| Total return | | | (5.97 | )% | | | 16.73 | % | | | 25.32 | % | | | 13.23 | % | | | (4.22 | )%(B) |
| Ratios and supplemental data: | | | | | | | | | | | | | | | | | | | | |
| Net assets at end of period (000’s) | | $ | 84,152 | | | $ | 102,420 | | | $ | 35,097 | | | $ | 38,821 | | | $ | 25,550 | |
| Ratio to average net assets: | | | | | | | | | | | | | | | | | | | | |
| Net expenses | | | 0.95 | % | | | 0.98 | % | | | 0.97 | % | | | 0.98 | % | | | 1.03 | %(C) |
| Gross expenses | | | 0.95 | % | | | 0.98 | % | | | 0.97 | % | | | 0.98 | % | | | 1.17 | %(C) |
| Net investment income (loss) | | | (0.05 | )% | | | (0.20 | )% | | | 0.00 | %(D) | | | 0.21 | % | | | (0.41 | )%(C) |
| Portfolio turnover rate | | | 92 | % | | | 73 | % | | | 79 | % | | | 70 | % | | | 64 | % |
| (A) | Represents the period from commencement of operations (April 1, 2011) through March 31, 2012. |
See accompanying Notes to Financial Statements.
Financial Highlights (Continued)
| Touchstone Sands Capital Emerging Markets Growth Fund—Class Y |
| Selected Data for a Share Outstanding Throughout Each Period |
| | | | | | Period | |
| | | Year Ended | | | Ended | |
| | | March 31, | | | March 31, | |
| | | 2016 | | | 2015(A) | |
| Net asset value at beginning of period | | $ | 10.37 | | | $ | 10.00 | |
| Income (loss) from investment operations: | | | | | | | | |
| Net investment loss | | | (0.04 | ) | | | (0.03 | ) |
| Net realized and unrealized gains (losses) on investments | | | (0.93 | ) | | | 0.40 | |
| Total from investment operations | | | (0.97 | ) | | | 0.37 | |
| Net asset value at end of period | | $ | 9.40 | | | $ | 10.37 | |
| Total return | | | (9.35 | )% | | | 3.70 | %(B) |
| Ratios and supplemental data: | | | | | | | | |
| Net assets at end of period (000’s) | | $ | 58,106 | | | $ | 39,541 | |
| Ratio to average net assets: | | | | | | | | |
| Net expenses | | | 1.49 | % | | | 1.49 | %(C) |
| Gross expenses | | | 1.59 | % | | | 1.68 | %(C) |
| Net investment loss | | | (0.52 | )% | | | (0.46 | )%(C) |
| Portfolio turnover rate | | | 32 | % | | | 90 | %(B) |
| Touchstone Sands Capital Emerging Markets Growth Fund—Institutional Class |
| Selected Data for a Share Outstanding Throughout Each Period |
| | | | | | Period | |
| | | Year Ended | | | Ended | |
| | | March 31, | | | March 31, | |
| | | 2016 | | | 2015(A) | |
| Net asset value at beginning of period | | $ | 10.37 | | | $ | 10.00 | |
| Income (loss) from investment operations: | | | | | | | | |
| Net investment loss | | | (0.02 | ) | | | (0.03 | ) |
| Net realized and unrealized gains (losses) on investments | | | (0.94 | ) | | | 0.40 | |
| Total from investment operations | | | (0.96 | ) | | | 0.37 | |
| Net asset value at end of period | | $ | 9.41 | | | $ | 10.37 | |
| Total return | | | (9.26 | )% | | | 3.70 | %(B) |
| Ratios and supplemental data: | | | | | | | | |
| Net assets at end of period (000’s) | | $ | 101,401 | | | $ | 32,743 | |
| Ratio to average net assets: | | | | | | | | |
| Net expenses | | | 1.39 | % | | | 1.39 | %(C) |
| Gross expenses | | | 1.51 | % | | | 1.59 | %(C) |
| Net investment loss | | | (0.42 | )% | | | (0.36 | )%(C) |
| Portfolio turnover rate | | | 32 | % | | | 90 | %(B) |
| (A) | Represents the period from commencement of operations (May 12, 2014) through March 31, 2015. |
See accompanying Notes to Financial Statements.
Financial Highlights (Continued)
| Touchstone Small Cap Growth Fund—Class A |
| Selected Data for a Share Outstanding Throughout Each Period |
| | | | | | | | | | | | Eight | | | | | | | |
| | | | | | | | | | | | Months | | | | | | | |
| | | | | | | | | | | | Ended | | | | | | | |
| | | Year Ended March 31, | | March 31, | | | Year Ended July 31, |
| | | 2016 | | | 2015 | | | 2014 | | | 2013(A) | | | 2012 | | | 2011 | |
| Net asset value at beginning of period | | $ | 5.70 | | | $ | 5.24 | | | $ | 4.84 | | | $ | 4.25 | | | $ | 4.24 | | | $ | 3.63 | |
| Income (loss) from investment operations: | | | | | | | | | | | | | | | | | | | | | | | | |
| Net investment income (loss) | | | (0.04 | ) | | | (0.04 | ) | | | (0.01 | ) | | | — | (B)(C) | | | — | (B)(C) | | | (0.01 | )(B) |
| Net realized and unrealized gains (losses) on investments | | | (0.62 | ) | | | 0.63 | | | | 1.02 | | | | 0.85 | | | | 0.01 | | | | 0.62 | |
| Total from investment operations | | | (0.66 | ) | | | 0.59 | | | | 1.01 | | | | 0.85 | | | | 0.01 | | | | 0.61 | |
| Distributions from: | | | | | | | | | | | | | | | | | | | | | | | | |
| Net investment income | | | — | | | | — | | | | — | | | | (0.02 | ) | | | — | | | | — | |
| Realized capital gains | | | (0.06 | ) | | | (0.13 | ) | | | (0.61 | ) | | | (0.24 | ) | | | — | | | | — | |
| Total distributions | | | (0.06 | ) | | | (0.13 | ) | | | (0.61 | ) | | | (0.26 | ) | | | — | | | | — | |
| Net asset value at end of period | | $ | 4.98 | | | $ | 5.70 | | | $ | 5.24 | | | $ | 4.84 | | | $ | 4.25 | | | $ | 4.24 | |
| Total return(D) | | | (11.68 | )% | | | 11.52 | % | | | 22.63 | % | | | 20.93 | %(E) | | | 0.24 | % | | | 16.80 | % |
| Ratios and supplemental data: | | | | | | | | | | | | | | | | | | | | | | | | |
| Net assets at end of period (000’s) | | $ | 48,650 | | | $ | 34,017 | | | $ | 35,303 | | | $ | 14,243 | | | $ | 15,010 | | | $ | 18,117 | |
| Ratio to average net assets: | | | | | | | | | | | | | | | | | | | | | | | | |
| Net expenses | | | 1.44 | % | | | 1.44 | % | | | 1.45 | % | | | 1.60 | %(F) | | | 1.60 | % | | | 1.60 | % |
| Gross expenses | | | 1.66 | % | | | 1.69 | % | | | 1.81 | % | | | 2.13 | %(F) | | | 2.01 | % | | | 1.96 | % |
| Net investment income (loss) | | | (0.94 | )% | | | (0.71 | )% | | | (0.48 | )% | | | 0.15 | %(F) | | | (0.07 | )% | | | (0.33 | )% |
| Portfolio turnover rate | | | 36 | % | | | 46 | % | | | 195 | %(G) | | | 45 | %(E)(H) | | | 48 | % | | | 59 | % |
| Touchstone Small Cap Growth Fund—Class C |
| Selected Data for a Share Outstanding Throughout Each Period |
| | | | | | | | | | | | Eight | | | | | | | |
| | | | | | | | | | | | Months | | | | | | | |
| | | | | | | | | | | | Ended | | | | | | | |
| | | Year Ended March 31, | | | March 31, | | | Year Ended July 31, | |
| | | 2016 | | | 2015 | | | 2014 | | | 2013(A) | | | 2012 | | | 2011 | |
| Net asset value at beginning of period | | $ | 4.78 | | | $ | 4.45 | | | $ | 4.22 | | | $ | 3.75 | | | $ | 3.77 | | | $ | 3.25 | |
| Income (loss) from investment operations: | | | | | | | | | | | | | | | | | | | | | | | | |
| Net investment loss | | | (0.07 | ) | | | (0.05 | ) | | | (0.04 | ) | | | (0.02 | )(B) | | | (0.03 | )(B) | | | (0.04 | )(B) |
| Net realized and unrealized gains (losses) on investments | | | (0.51 | ) | | | 0.51 | | | | 0.88 | | | | 0.74 | | | | 0.01 | | | | 0.56 | |
| Total from investment operations | | | (0.58 | ) | | | 0.46 | | | | 0.84 | | | | 0.72 | | | | (0.02 | ) | | | 0.52 | |
| Distributions from: | | | | | | | | | | | | | | | | | | | | | | | | |
| Net investment income | | | — | | | | — | | | | — | | | | (0.01 | ) | | | — | | | | — | |
| Realized capital gains | | | (0.06 | ) | | | (0.13 | ) | | | (0.61 | ) | | | (0.24 | ) | | | — | | | | — | |
| Total distributions | | | (0.06 | ) | | | (0.13 | ) | | | (0.61 | ) | | | (0.25 | ) | | | — | | | | — | |
| Net asset value at end of period | | $ | 4.14 | | | $ | 4.78 | | | $ | 4.45 | | | $ | 4.22 | | | $ | 3.75 | | | $ | 3.77 | |
| Total return(D) | | | (12.26 | )% | | | 10.64 | % | | | 21.85 | % | | | 20.17 | %(E) | | | (0.53 | )% | | | 16.00 | % |
| Ratios and supplemental data: | | | | | | | | | | | | | | | | | | | | | | | | |
| Net assets at end of period (000’s) | | $ | 18,237 | | | $ | 12,651 | | | $ | 7,429 | | | $ | 3,509 | | | $ | 3,830 | | | $ | 5,563 | |
| Ratio to average net assets: | | | | | | | | | | | | | | | | | | | | | | | | |
| Net expenses | | | 2.19 | % | | | 2.19 | % | | | 2.20 | % | | | 2.35 | %(F) | | | 2.35 | % | | | 2.35 | % |
| Gross expenses | | | 2.46 | % | | | 2.55 | % | | | 2.65 | % | | | 3.16 | %(F) | | | 2.76 | % | | | 2.71 | % |
| Net investment loss | | | (1.69 | )% | | | (1.46 | )% | | | (1.23 | )% | | | (0.60 | )%(F) | | | (0.82 | )% | | | (1.10 | )% |
| Portfolio turnover rate | | | 36 | % | | | 46 | % | | | 195 | %(G) | | | 45 | %(E)(H) | | | 48 | % | | | 59 | % |
| (A) | The Fund changed its fiscal year end from July 31 to March 31. |
| (B) | The net investment income (loss) per share is based on average shares outstanding for the period. |
| (C) | Less than $0.005 per share. |
| (D) | Total returns shown exclude the effect of applicable sales loads. If these charges were included, the returns would be lower. |
| (G) | Portfolio turnover excludes the purchases and sales of the Touchstone Diversified Small Cap Growth Fund. If these transactions were included, portfolio turnover would have been higher. |
| (H) | Portfolio turnover rate excludes securities delivered from processing a redemption-in-kind. |
See accompanying Notes to Financial Statements.
Financial Highlights (Continued)
| Touchstone Small Cap Growth Fund—Class Y |
| Selected Data for a Share Outstanding Throughout Each Period |
| | | | | | | | | | | | Eight | | | | | | | |
| | | | | | | | | | | | Months | | | | | | | |
| | | | | | | | | | | | Ended | | | | | | | |
| | | Year Ended March 31, | | | March 31, | | | Year Ended July 31, | |
| | | 2016 | | | 2015 | | | 2014 | | | 2013 (A)(B) | | | 2012 | | | 2011 | |
| Net asset value at beginning of period | | $ | 6.33 | | | $ | 5.78 | | | $ | 5.27 | | | $ | 4.61 | | | $ | 4.58 | | | $ | 3.92 | |
| Income (loss) from investment operations: | | | | | | | | | | | | | | | | | | | | | | | | |
| Net investment income (loss) | | | (0.03 | ) | | | (0.01 | ) | | | (0.01 | ) | | | 0.01 | (C) | | | 0.01 | (C) | | | — | (C)(D) |
| Net realized and unrealized gains (losses) on investments | | | (0.69 | ) | | | 0.69 | | | | 1.13 | | | | 0.92 | | | | 0.02 | | | | 0.66 | |
| Total from investment operations | | | (0.72 | ) | | | 0.68 | | | | 1.12 | | | | 0.93 | | | | 0.03 | | | | 0.66 | |
| Distributions from: | | | | | | | | | | | | | | | | | | | | | | | | |
| Net investment income | | | — | | | | — | | | | — | | | | (0.03 | ) | | | — | | | | — | |
| Realized capital gains | | | (0.06 | ) | | | (0.13 | ) | | | (0.61 | ) | | | (0.24 | ) | | | — | | | | — | |
| Total distributions | | | (0.06 | ) | | | (0.13 | ) | | | (0.61 | ) | | | (0.27 | ) | | | — | | | | — | |
| Net asset value at end of period | | $ | 5.55 | | | $ | 6.33 | | | $ | 5.78 | | | $ | 5.27 | | | $ | 4.61 | | | $ | 4.58 | |
| Total return | | | (11.46 | )% | | | 12.01 | % | | | 22.88 | % | | | 20.94 | %(E) | | | 0.66 | % | | | 16.84 | % |
| Ratios and supplemental data: | | | | | | | | | | | | | | | | | | | | | | | | |
| Net assets at end of period (000’s) | | $ | 508,450 | | | $ | 314,062 | | | $ | 37,030 | | | $ | 18,123 | | | $ | 23,232 | | | $ | 26,317 | |
| Ratio to average net assets: | | | | | | | | | | | | | | | | | | | | | | | | |
| Net expenses | | | 1.19 | % | | | 1.19 | % | | | 1.20 | % | | | 1.35 | %(F) | | | 1.35 | % | | | 1.35 | % |
| Gross expenses | | | 1.31 | % | | | 1.36 | % | | | 1.50 | % | | | 1.77 | %(F) | | | 1.76 | % | | | 1.71 | % |
| Net investment income (loss) | | | (0.69 | )% | | | (0.46 | )% | | | (0.23 | )% | | | 0.40 | %(F) | | | 0.17 | % | | | (0.08 | )% |
| Portfolio turnover rate | | | 36 | % | | | 46 | % | | | 195 | %(G) | | | 45 | %(E)(H) | | | 48 | % | | | 59 | % |
| Touchstone Small Cap Growth Fund—Institutional Class |
| Selected Data for a Share Outstanding Throughout Each Period |
| | | | | | | | | | | | Period | |
| | | | | | | | | | | | Ended | |
| | | Year Ended March 31, | | | March 31, | |
| | | 2016 | | | 2015 | | | 2014 | | | 2013(B)(I) | |
| Net asset value at beginning of period | | $ | 6.35 | | | $ | 5.80 | | | $ | 5.28 | | | $ | 4.92 | |
| Income (loss) from investment operations: | | | | | | | | | | | | | | | | |
| Net investment income (loss) | | | (0.03 | ) | | | (0.02 | ) | | | (— | )(D) | | | 0.02 | (C) |
| Net realized and unrealized gains (losses) on investments | �� | | (0.68 | ) | | | 0.70 | | | | 1.13 | | | | 0.61 | |
| Total from investment operations | | | (0.71 | ) | | | 0.68 | | | | 1.13 | | | | 0.63 | |
| Distributions from: | | | | | | | | | | | | | | | | |
| Net investment income | | | — | | | | — | | | | — | | | | (0.03 | ) |
| Realized capital gains | | | (0.06 | ) | | | (0.13 | ) | | | (0.61 | ) | | | (0.24 | ) |
| Total distributions | | | (0.06 | ) | | | (0.13 | ) | | | (0.61 | ) | | | (0.27 | ) |
| Net asset value at end of period | | $ | 5.58 | | | $ | 6.35 | | | $ | 5.80 | | | $ | 5.28 | |
| Total return | | | (11.27 | )% | | | 11.97 | % | | | 23.04 | % | | | 13.56 | %(E) |
| Ratios and supplemental data: | | | | | | | | | | | | | | | | |
| Net assets at end of period (000’s) | | $ | 22,863 | | | $ | 12,285 | | | $ | 12,372 | | | $ | 3 | |
| Ratio to average net assets: | | | | | | | | | | | | | | | | |
| Net expenses | | | 1.04 | % | | | 1.04 | % | | | 1.04 | % | | | 1.25 | %(F) |
| Gross expenses | | | 1.23 | % | | | 1.31 | % | | | 1.40 | % | | | 945.43 | %(F) |
| Net investment income (loss) | | | (0.54 | )% | | | (0.32 | )% | | | (0.07 | )% | | | 0.50 | %(F) |
| Portfolio turnover rate | | | 36 | % | | | 46 | % | | | 195 | %(G) | | | 45 | %(E)(H) |
| (A) | Effective September 10, 2012, Institutional Class shares were renamed Class Y shares. |
| (B) | The Fund changed its fiscal year end from July 31 to March 31. |
| (C) | The net investment income (loss) per share is based on average shares outstanding for the period. |
| (D) | Less than $0.005 per share. |
| (G) | Portfolio turnover excludes the purchases and sales of the Touchstone Diversified Small Cap Growth Fund. If these transactions were included, portfolio turnover would have been higher. |
| (H) | Portfolio turnover rate excludes securities delivered from processing a redemption-in-kind. |
| (I) | The Fund began issuing Institutional Class shares on September 10, 2012. |
See accompanying Notes to Financial Statements.
Financial Highlights (Continued)
| Touchstone Sustainability and Impact Equity Fund—Class A |
| Selected Data for a Share Outstanding Throughout Each Period |
| | | Year Ended March 31, | |
| | | 2016 | | | 2015 | | | 2014 | | | 2013 | | | 2012 | |
| Net asset value at beginning of period | | $ | 30.96 | | | $ | 31.81 | | | $ | 28.74 | | | $ | 27.74 | | | $ | 24.95 | |
| Income (loss) from investment operations: | | | | | | | | | | | | | | | | | | | | |
| Net investment income | | | 0.06 | (A) | | | 0.11 | | | | 0.02 | | | | 0.11 | | | | 0.02 | (A) |
| Net realized and unrealized gains (losses) on investments | | | (1.99 | ) | | | 4.87 | | | | 5.96 | | | | 1.00 | | | | 2.77 | |
| Total from investment operations | | | (1.93 | ) | | | 4.98 | | | | 5.98 | | | | 1.11 | | | | 2.79 | |
| Distributions from: | | | | | | | | | | | | | | | | | | | | |
| Net investment income | | | (0.03 | ) | | | (0.05 | ) | | | (0.05 | ) | | | (0.11 | ) | | | — | |
| Realized capital gains | | | (10.02 | ) | | | (5.78 | ) | | | (2.86 | ) | | | — | | | | — | |
| Total distributions | | | (10.05 | ) | | | (5.83 | ) | | | (2.91 | ) | | | (0.11 | ) | | | — | |
| Net asset value at end of period | | $ | 18.98 | | | $ | 30.96 | | | $ | 31.81 | | | $ | 28.74 | | | $ | 27.74 | |
| Total return(B) | | | (8.73 | )% | | | 17.17 | % | | | 21.27 | % | | | 4.05 | % | | | 11.18 | % |
| Ratios and supplemental data: | | | | | | | | | | | | | | | | | | | | |
| Net assets at end of period (000’s) | | $ | 137,306 | | | $ | 257,273 | | | $ | 287,813 | | | $ | 286,572 | | | $ | 238,488 | |
| Ratio to average net assets: | | | | | | | | | | | | | | | | | | | | |
| Net expenses | | | 1.24 | % | | | 1.25 | % | | | 1.23 | % | | | 1.22 | % | | | 1.25 | % |
| Gross expenses | | | 1.39 | % | | | 1.28 | % | | | 1.29 | % | | | 1.32 | % | | | 1.35 | % |
| Net investment income | | | 0.31 | % | | | 0.35 | % | | | 0.06 | % | | | 0.47 | % | | | 0.08 | % |
| Portfolio turnover rate | | | 304 | % | | | 98 | % | | | 92 | % | | | 109 | %(C) | | | 91 | % |
| Touchstone Sustainability and Impact Equity Fund—Class B |
| Selected Data for a Share Outstanding Throughout Each Period |
| | | Year Ended March 31, | |
| | | 2016 | | | 2015 | | | 2014 | | | 2013 | | | 2012 | |
| Net asset value at beginning of period | | $ | 28.74 | | | $ | 30.08 | | | $ | 27.41 | | | $ | 26.47 | | | $ | 23.85 | |
| Income (loss) from investment operations: | | | | | | | | | | | | | | | | | | | | |
| Net investment income (loss) | | | (0.08 | )(A) | | | (0.15 | ) | | | (0.19 | ) | | | 0.01 | | | | (0.03 | )(A) |
| Net realized and unrealized gains (losses) on investments | | | (1.80 | ) | | | 4.59 | | | | 5.72 | | | | 0.93 | | | | 2.65 | |
| Total from investment operations | | | (1.88 | ) | | | 4.44 | | | | 5.53 | | | | 0.94 | | | | 2.62 | |
| Distributions from: | | | | | | | | | | | | | | | | | | | | |
| Realized capital gains | | | (10.02 | ) | | | (5.78 | ) | | | (2.86 | ) | | | — | | | | — | |
| Net asset value at end of period | | $ | 16.84 | | | $ | 28.74 | | | $ | 30.08 | | | $ | 27.41 | | | $ | 26.47 | |
| Total return(B) | | | (9.41 | )% | | | 16.27 | % | | | 20.62 | % | | | 3.55 | % | | | 10.99 | % |
| Ratios and supplemental data: | | | | | | | | | | | | | | | | | | | | |
| Net assets at end of period (000’s) | | $ | 457 | | | $ | 1,722 | | | $ | 3,671 | | | $ | 6,671 | | | $ | 10,949 | |
| Ratio to average net assets: | | | | | | | | | | | | | | | | | | | | |
| Net expenses | | | 1.99 | % | | | 2.00 | % | | | 1.79 | % | | | 1.68 | % | | | 1.45 | % |
| Gross expenses | | | 3.78 | % | | | 2.27 | % | | | 1.79 | % | | | 1.68 | % | | | 1.45 | % |
| Net investment income (loss) | | | (0.44 | )% | | | (0.40 | )% | | | (0.50 | )% | | | 0.00 | %(D) | | | (0.12 | )% |
| Portfolio turnover rate | | | 304 | % | | | 98 | % | | | 92 | % | | | 109 | %(C) | | | 91 | % |
| (A) | The net investment income (loss) per share is based on average shares outstanding for the period. |
| (B) | Total returns shown exclude the effect of applicable sales loads. If these charges were included, the returns would be lower. |
| (C) | Portfolio turnover excludes the purchases and sales of the Fifth Third Quality Growth Fund acquired on September 10, 2012. If these transactions were included, portfolio turnover would have been higher. |
See accompanying Notes to Financial Statements.
Financial Highlights (Continued)
| Touchstone Sustainability and Impact Equity Fund—Class C |
| Selected Data for a Share Outstanding Throughout Each Period |
| | | Year Ended March 31, | |
| | | 2016 | | | 2015 | | | 2014 | | | 2013 | | | 2012 | |
| Net asset value at beginning of period | | $ | 28.32 | | | $ | 29.72 | | | $ | 27.17 | | | $ | 26.31 | | | $ | 23.84 | |
| Income (loss) from investment operations: | | | | | | | | | | | | | | | | | | | | |
| Net investment loss | | | (0.08 | )(A) | | | (0.12 | ) | | | (0.21 | ) | | | (0.08 | ) | | | (0.16 | )(A) |
| Net realized and unrealized gains (losses) on investments | | | (1.75 | ) | | | 4.50 | | | | 5.62 | | | | 0.94 | | | | 2.63 | |
| Total from investment operations | | | (1.83 | ) | | | 4.38 | | | | 5.41 | | | | 0.86 | | | | 2.47 | |
| Distributions from: | | | | | | | | | | | | | | | | | | | | |
| Realized capital gains | | | (10.02 | ) | | | (5.78 | ) | | | (2.86 | ) | | | — | | | | — | |
| Net asset value at end of period | | $ | 16.47 | | | $ | 28.32 | | | $ | 29.72 | | | $ | 27.17 | | | $ | 26.31 | |
| Total return(B) | | | (9.41 | )% | | | 16.30 | % | | | 20.35 | % | | | 3.27 | % | | | 10.36 | % |
| Ratios and supplemental data: | | | | | | | | | | | | | | | | | | | | |
| Net assets at end of period (000’s) | | $ | 56,435 | | | $ | 103,861 | | | $ | 111,631 | | | $ | 107,572 | | | $ | 116,350 | |
| Ratio to average net assets: | | | | | | | | | | | | | | | | | | | | |
| Net expenses | | | 1.99 | % | | | 2.00 | % | | | 1.98 | % | | | 1.97 | % | | | 2.00 | % |
| Gross expenses | | | 2.15 | % | | | 2.03 | % | | | 2.04 | % | | | 2.08 | % | | | 2.09 | % |
| Net investment loss | | | (0.44 | )% | | | (0.40 | )% | | | (0.69 | )% | | | (0.28 | )% | | | (0.67 | )% |
| Portfolio turnover rate | | | 304 | % | | | 98 | % | | | 92 | % | | | 109 | %(C) | | | 91 | % |
| Touchstone Sustainability and Impact Equity Fund—Class Y |
| Selected Data for a Share Outstanding Throughout Each Period |
| | | Year Ended March 31, | |
| | | 2016 | | | 2015 | | | 2014 | | | 2013 | | | 2012 | |
| Net asset value at beginning of period | | $ | 31.49 | | | $ | 32.23 | | | $ | 29.07 | | | $ | 28.09 | | | $ | 25.19 | |
| Income (loss) from investment operations: | | | | | | | | | | | | | | | | | | | | |
| Net investment income | | | 0.13 | (A) | | | 0.22 | | | | 0.09 | | | | 0.18 | | | | 0.09 | (A) |
| Net realized and unrealized gains (losses) on investments | | | (2.06 | ) | | | 4.92 | | | | 6.06 | | | | 1.00 | | | | 2.81 | |
| Total from investment operations | | | (1.93 | ) | | | 5.14 | | | | 6.15 | | | | 1.18 | | | | 2.90 | |
| Distributions from: | | | | | | | | | | | | | | | | | | | | |
| Net investment income | | | (0.05 | ) | | | (0.10 | ) | | | (0.13 | ) | | | (0.20 | ) | | | — | |
| Realized capital gains | | | (10.02 | ) | | | (5.78 | ) | | | (2.86 | ) | | | — | | | | — | |
| Total distributions | | | (10.07 | ) | | | (5.88 | ) | | | (2.99 | ) | | | (0.20 | ) | | | — | |
| Net asset value at end of period | | $ | 19.49 | | | $ | 31.49 | | | $ | 32.23 | | | $ | 29.07 | | | $ | 28.09 | |
| Total return | | | (8.54 | )% | | | 17.48 | % | | | 21.62 | % | | | 4.32 | % | | | 11.47 | % |
| Ratios and supplemental data: | | | | | | | | | | | | | | | | | | | | |
| Net assets at end of period (000’s) | | $ | 67,638 | | | $ | 416,741 | | | $ | 577,708 | | | $ | 523,413 | | | $ | 385,411 | |
| Ratio to average net assets: | | | | | | | | | | | | | | | | | | | | |
| Net expenses | | | 0.99 | % | | | 0.99 | % | | | 0.97 | % | | | 0.96 | % | | | 0.99 | % |
| Gross expenses | | | 1.14 | % | | | 1.00 | % | | | 1.05 | % | | | 1.08 | % | | | 1.14 | % |
| Net investment income | | | 0.56 | % | | | 0.61 | % | | | 0.32 | % | | | 0.72 | % | | | 0.34 | % |
| Portfolio turnover rate | | | 304 | % | | | 98 | % | | | 92 | % | | | 109 | %(C) | | | 91 | % |
| (A) | The net investment income (loss) per share is based on average shares outstanding for the period. |
| (B) | Total returns shown exclude the effect of applicable sales loads. If these charges were included, the returns would be lower. |
| (C) | Portfolio turnover excludes the purchases and sales of the Fifth Third Quality Growth Fund acquired on September 10, 2012. If these transactions were included, portfolio turnover would have been higher. |
See accompanying Notes to Financial Statements.
Financial Highlights (Continued)
| Touchstone Sustainability and Impact Equity Fund—Institutional Class |
| Selected Data for a Share Outstanding Throughout Each Period |
| | | Period | |
| | | Ended | |
| | | March 31, | |
| | | 2016(A) | |
| Net asset value at beginning of period | | $ | 31.44 | |
| Income from investment operations: | | | | |
| Net Investment income | | | 0.11 | (B) |
| Net realized and unrealized losses on investments | | | (1.98 | ) |
| Total from investment operations | | | (1.87 | ) |
| Distributions from: | | | | |
| Net investment income | | | (0.05 | ) |
| Realized capital gains | | | (10.02 | ) |
| Total distributions | | | (10.07 | ) |
| Net asset value at end of period | | $ | 19.50 | |
| Total return | | | (8.49 | )%(C) |
| Ratios and supplemental data: | | | | |
| Net assets at end of period (000’s) | | $ | 6,843 | |
| Ratio to average net assets: | | | | |
| Net expenses | | | 0.89 | %(D) |
| Gross expenses | | | 1.48 | %(D) |
| Net investment income | | | 0.66 | %(D) |
| Portfolio turnover rate | | | 304 | %(C) |
| (A) | Represents the period from commencement of operations (May 4, 2015) through March 31, 2016. |
| (B) | The net investment income per share is based on average shares outstanding for the period. |
See accompanying Notes to Financial Statements.
| Notes to Financial Statements |
| March 31, 2016 |
1. Organization
The Touchstone Strategic Trust (the “Trust”) is registered under the Investment Company Act of 1940, as amended (the “1940 Act”), as an open-end management investment company. The Trust was established as a Massachusetts business trust pursuant to an Agreement and Declaration of Trust dated November 18, 1982. The Trust consists of seventeen funds, including the following eight funds (individually, a “Fund”, and collectively, the “Funds”):
Touchstone Flexible Income Fund (“Flexible Income Fund”)
Touchstone Focused Fund (“Focused Fund”)
Touchstone Growth Opportunities Fund (“Growth Opportunities Fund”)
Touchstone International Value Fund (“International Value Fund”)
Touchstone Mid Cap Growth Fund (“Mid Cap Growth Fund”)
Touchstone Sands Capital Emerging Markets Growth Fund (“Sands Capital Emerging Markets Growth Fund”) Touchstone Small Cap Growth Fund (“Small Cap Growth Fund”)
Touchstone Sustainability and Impact Equity Fund (“Sustainability and Impact Equity Fund”)
Each Fund is diversified, with the exception of the Focused Fund, the Growth Opportunities Fund and the Sands Capital Emerging Markets Growth Fund, which are non-diversified.
The Agreement and Declaration of Trust permits the Trust to issue an unlimited number of shares of beneficial interest of each Fund. The table below indicates the classes of shares that each Fund is registered to offer:
| | | | | | Institutional |
| | Class A | Class B | Class C | Class Y | Class |
| Flexible Income Fund | X | — | X | X | X |
| Focused Fund | X | — | X | X | X |
| Growth Opportunities Fund | X | — | X | X | X |
| International Value Fund | X | — | X | X | X |
| Mid Cap Growth Fund | X | X | X | X | X |
| Sands Capital Emerging Markets Growth Fund | — | — | — | X | X |
| Small Cap Growth Fund | X | — | X | X | X |
| Sustainability and Impact Equity Fund | X | X | X | X | X |
Class B shares are closed to new investors and subsequent purchases. The assets of each Fund are segregated, and a shareholder’s interest is limited to the Fund in which shares are held. The Funds’ prospectus provides a description of each Fund’s investment goals, policies, and strategies along with information on the classes of shares currently being offered.
2. Significant Accounting Policies
The following is a summary of the Funds’ significant accounting policies:
Each Fund is an investment company that follows the accounting and reporting guidance of Accounting Standards Codification Topic 946 applicable to investment companies.
Security valuation and fair value measurements — U.S. generally accepted accounting principles (“U.S. GAAP”) define fair value as the price the Funds would receive to sell an asset or pay to transfer a liability in an orderly transaction between market participants at the measurement date. All investments in securities are recorded at their estimated fair value. The Funds define the term “market value”, as used throughout this report, as the estimated fair value. The Funds use various methods to measure fair value of their portfolio securities on a recurring basis. U.S. GAAP fair value measurement standards require disclosure of a hierarchy that prioritizes inputs to valuation methods. These inputs are summarized in the three broad levels listed below:
| • | Level 1 – quoted prices in active markets for identical securities |
| Notes to Financial Statements (Continued) |
| • | Level 2 – | other significant observable inputs (including quoted prices for similar securities, interest rates, prepayment speeds, credit risk, etc.) |
| | | |
| • | Level 3 – | significant unobservable inputs (including a Fund’s own assumptions in determining the fair value of investments) |
The inputs or methodology used for valuing securities are not necessarily an indication of the risk associated with investing in those securities.
The aggregate value by input level, as of March 31, 2016, for each Fund’s investments, as well as a reconciliation of assets for which significant unobservable inputs (Level 3) were used in determining value, if applicable, is included in each Fund’s Portfolio of Investments, which also includes a breakdown of the Fund’s investments by geographic allocation or sector allocation. The Funds did not hold any Level 3 categorized securities during the year ended March 31, 2016.
Changes in valuation techniques may result in transfers into or out of an investment’s assigned level within the hierarchy. All transfers in and out of the levels are recognized at the value at the end of the period. During the year ended March 31, 2016, there were no transfers between Levels 1, 2 and 3 for all Funds, except as shown in the Portfolio of Investments for the International Value Fund and Sands Capital Emerging Markets Growth Fund.
The Funds’ portfolio securities are valued as of the close of the regular session of trading on the New York Stock Exchange (“NYSE”) (currently 4:00 p.m., Eastern Time). Portfolio securities traded on stock exchanges are valued at the last reported sale price, official close price, or last bid price if no sales are reported. Portfolio securities quoted by NASDAQ are valued at the NASDAQ Official Closing Price (“NOCP”) or from the primary exchange on which the security trades. To the extent these securities are actively traded, they are categorized in Level 1 of the fair value hierarchy. Options are valued at the last quoted sales price. If there is no such reported sale on valuation date, long option positions are valued at the most recent bid price, and short option positions are valued at the most recent ask price and are categorized in Level 1. Shares of mutual funds in which the Funds invest are valued at their respective net asset values (“NAV”) as reported by the underlying funds (“Underlying Funds”) and are categorized in Level 1.
Debt securities held by the Funds are valued at their evaluated bid by an independent pricing service or at their last broker-quoted bid prices as obtained from one or more of the major market makers for such securities. Independent pricing services use information provided by market makers or estimates of market values through accepted market modeling conventions. Observable inputs to the models may include prepayment speeds, pricing spread, yield, trade information, dealer quotes, market color, cash flow models, the securities’ terms and conditions, among others, and are generally categorized in Level 2. Debt securities with a remaining maturity of 60 days or less may be valued at amortized cost, provided such amount approximates market value and are categorized in Level 2. While this method provides consistency in valuation (and may only be used if it approximates market value), it may result in periods during which value, as determined by amortized cost, is higher or lower than the price that would be received if the Fund sold the investment.
Foreign currency exchange contracts are valued at the mean between the bid and ask prices and are determined as of the close of regular trading on the NYSE. Interpolated values are derived when the settlement date of the contract is an interim date for which quotations are not available and categorized in Level 2.
Securities mainly traded on a non-U.S. exchange or denominated in foreign currencies are generally valued according to the preceding closing values on that exchange, translated to U.S. dollars using currency exchange rates as of the close of regular trading on the NYSE, and are generally categorized in Level 1. However, if an event that may change the value of a security occurs after the time that the closing value on the non-U.S. exchange was determined, but before the close of regular trading on the NYSE, the security may be priced
| Notes to Financial Statements (Continued) |
based on fair value and generally categorized in Level 2. This may cause the value of the security, if held on the books of a Fund to be different from the closing value on the non-U.S. exchange and may affect the calculation of that Fund’s NAV.
The Funds may use fair value pricing under the following circumstances, among others:
| • | If the value of a security has been materially affected by events occurring before the Funds’ pricing time but after the close of the primary markets on which the security is traded. |
| • | If the exchange on which a portfolio security is principally traded closes early or if trading in a particular portfolio security was halted during the day and did not resume prior to the Funds’ NAV calculation. |
| • | If a security is so thinly traded that reliable market quotations are unavailable due to infrequent trading. |
| • | If the validity of market quotations is not reliable. |
Securities held by the Funds that do not have readily available market quotations, significant observable inputs, or securities for which the available market quotations are not reliable, are priced at their estimated fair value using procedures approved by the Funds’ Board of Trustees and are generally categorized in Level 3.
Investment companies — Certain Funds may invest in securities of other investment companies, including exchange-traded funds (“ETFs”), open-end funds, and closed-end funds. Open-end funds are investment companies that issue new shares continuously and redeem shares daily. Closed-end funds are investment companies that typically issue a fixed number of shares that trade on a securities exchange or over-the-counter. An ETF is an investment company that typically seeks to track the performance of an index by holding in its portfolio shares of all the companies, or a representative sample of the companies, that are components of a particular index. ETF shares are traded on a securities exchange based on their market value. The risks of investment in other investment companies typically reflect the risks of the types of securities in which the other investment companies invest. Investments in ETFs and closed-end funds are subject to the additional risk that their shares may trade at a premium or discount to their NAV. When a Fund invests in another investment company, shareholders of the Fund indirectly bear their proportionate share of the other investment company’s fees and expenses, including operating, registration, trustee, licensing, and marketing, as well as their share of the Fund’s fees and expenses.
Options — The Flexible Income Fund may write or purchase financial option contracts primarily to hedge against changes in the value of equity securities (or securities that the Fund intends to purchase), against fluctuations in fair value caused by changes in prevailing market interest rates or foreign currency exchange rates and against changes in overall equity market volatility. In addition, the Fund may utilize options in an attempt to generate gains from option premiums or to reduce overall portfolio risk. The Fund’s option strategy primarily focuses on the use of writing call options on equity indexes. When the Fund writes or purchases an option, an amount equal to the premium received or paid by the Fund is recorded as a liability or an asset and is subsequently adjusted to the current market value of the option written or purchased. Premiums received or paid from writing or purchasing options which expire unexercised are treated by the Fund on the expiration date as realized gains or losses. The difference between the premium and the amount paid or received on effecting a closing purchase or sale transaction, including brokerage commissions, is also treated as a realized gain or loss. If an option is exercised, the premium paid or received is added to the cost of the purchase or proceeds from the sale in determining whether the Fund has realized a gain or loss on investment transactions. The Fund, as writer of an option, may have no control over whether the underlying securities may be sold (call) or purchased (put) and as a result bears the market risk of an unfavorable change in the price of the security underlying the written option. The Fund, as purchaser of an option, bears the risk that the counterparties to the option may not have the ability to meet the terms of the option contracts. There is minimal counterparty credit risk involved
| Notes to Financial Statements (Continued) |
in entering into option contracts since they are exchange-traded instruments and the exchange’s clearinghouse, as counterparty to all exchange-traded options, guarantees the options against default. Options are valued at the last quoted sales price. If there is no such reported sale on the valuation date, long option positions are valued at the most recent bid price, and short option positions are valued at the most recent ask price. As of March 31, 2016, the Flexible Income Fund held purchased options with a fair value of $138,400.
Futures Contracts — The Flexible Income Fund may buy and sell futures contracts and related options to manage its exposure to changing interest rates and securities prices. Some strategies reduce the Fund’s exposure to price fluctuations, while others tend to increase its market exposure. Futures and options on futures can be volatile instruments and involve certain risks that could negatively impact the Fund’s return. In order to avoid leveraging and related risks, when the Fund purchases futures contracts, it will collateralize its position by depositing an amount of cash or liquid securities, equal to the market value of the futures positions held, less margin deposits, in a segregated account with its custodian or otherwise “cover” its position in a manner consistent with the 1940 Act, or the rules of the Securities and Exchange Commission (the “SEC”) or interpretations thereunder. Collateral equal to the current market value of the futures position will be marked to market on a daily basis.
When the contract is closed, the Fund records a realized gain or loss equal to the difference between the proceeds from (or cost of) the closing transactions and the Fund’s basis in the contract. Risks of entering into futures contracts include the possibility that a change in the value of the contract may not correlate with the changes in the value of the underlying instruments. Second, it is possible that a lack of liquidity for futures contracts could exist in the secondary market resulting in an inability to close a futures position prior to its maturity date. Third, the purchase of a futures contract involves the risk that the Fund could lose more than the original margin deposit required to initiate the futures transaction. Finally, the risk exists that losses could exceed amounts disclosed on the Statements of Assets and Liabilities. There is minimal counterparty credit risk involved in entering into futures contracts since they are exchange-traded instruments and the exchange’s clearinghouse, as counterparty to all exchange-traded futures, guarantees the futures against default. As of March 31, 2016, the Flexible Income Fund did not hold any futures contracts.
Swap Contracts — The Flexible Income Fund may enter into swap transactions to help enhance the value of its portfolio or manage its exposure to different types of investments. Swaps are financial instruments that typically involve the exchange of cash flows between two parties on specified dates (settlement dates), where the cash flows are based on agreed-upon prices, rates, indexes, etc. The nominal amount on which the cash flows are calculated is called the notional amount. Swaps are individually negotiated and structured to include exposure to a variety of different types of investments or market factors, such as interest rates, foreign currency rates, mortgage securities, corporate borrowing rates, security prices, indexes or inflation rates.
Swap agreements may increase or decrease the overall volatility of the investments of the Fund and its share price. The performance of swap agreements may be affected by a change in the specific interest rate, currency, or other factors that determine the amounts of payments due to and from the Fund. If a swap agreement calls for payments by the Fund, the Fund must be prepared to make such payments when due. In addition, if the counterparty’s creditworthiness declines, the value of a swap agreement would be likely to decline, potentially resulting in losses.
Generally, bilateral swap agreements, over-the-counter (“OTC”) swaps, have a fixed maturity date that will be agreed upon by the parties. The agreement can be terminated before the maturity date only under limited circumstances, such as default by one of the parties or insolvency, among others, and can be transferred by a party only with the prior written consent of the other party. The Fund may be able to eliminate its exposure under a swap agreement either by assignment or by other disposition, or by entering into an offsetting swap agreement with the same party or a similarly creditworthy party. If the counterparty is unable to meet its obligations
| Notes to Financial Statements (Continued) |
under the contract, declares bankruptcy, defaults or becomes insolvent, the Fund may not be able to recover the money it expected to receive under the contract.
Centrally cleared swaps are transacted through futures commission merchants that are members of central clearinghouses with the clearinghouses servicing as a central counterparty. Pursuant to rules promulgated under the Dodd-Frank Act, central clearing of swap agreements is currently required for certain market participants trading certain instruments, and central clearing for additional instruments is expected to be implemented by regulators until the majority of the swaps market is ultimately subject to central clearing.
Swaps are marked-to-market daily based upon values received from third party vendors or quotations from market makers. For OTC swaps, any upfront premiums paid or received are recorded as assets or liabilities, respectively, and are shown as premium paid on swap agreements or premium received on swap agreements in the Statements of Assets and Liabilities. For swaps that are centrally cleared, initial margins, determined by each relevant clearing agency, are posted and segregated at a broker account registered with the Commodity Futures Trading Commission (“CFTC”), or the applicable regulator. The change in value of swaps, including accruals of periodic amounts of interest to be paid or received on swaps, is recorded as unrealized appreciation or depreciation. Daily changes in the value of centrally cleared swaps are recorded on the Statements of Assets and Liabilities as receivable or payable for variation margin on swap agreements and settled daily. Upfront premiums and liquidation payments received or paid are recorded as realized gains or losses at the termination or maturity of the swap. Net periodic payments received or paid by the Fund are recorded as realized gain or loss.
A swap agreement can be a form of leverage, which can magnify the Fund’s gains or losses. In order to reduce the risk associated with leveraging, the Fund may cover its current obligations under swap agreements according to guidelines established by the SEC. If the Fund enters into a swap agreement on a net basis, it will segregate assets with a daily value at least equal to the excess, if any, of the Fund’s accrued obligations under the swap agreement over the accrued amount the Fund is entitled to receive under the agreement. If the Fund enters into a swap agreement on other than a net basis, it will segregate assets with a value equal to the full amount of the Fund’s accrued obligations under the agreement.
As of March 31, 2016, the Flexible Income Fund did not hold any swap agreements.
Foreign currency translation — The books and records of the Funds are maintained in U.S. dollars and translated into U.S. dollars on the following basis:
| (1) | market value of investment securities, assets and liabilities at the current rate of exchange on the valuation date; and |
| (2) | purchases and sales of investment securities, income, and expenses at the relevant rates of exchange prevailing on the respective dates of such transactions. |
The Funds do not isolate that portion of gains and losses on investments in equity securities that is due to changes in the foreign exchange rates from that which is due to changes in market prices of equity securities.
Forward foreign currency contracts — A forward foreign currency contract is an agreement between two parties to buy and sell a specific currency at a price that is set on the date of the contract. The forward contract calls for delivery of the currency on a future date that is specified in the contract. Risks related to the use of forwards include the possible failure of counterparties to meet the terms of the forward agreement, the failure of the counterparties to timely post collateral, the risk that currency movements will not occur thereby reducing a Fund’s total return, and the potential for losses in excess of a Fund’s initial investment.
The market value of a forward foreign currency contract fluctuates with changes in foreign currency exchange rates. Forward foreign currency contracts are marked to market daily and the change in value is recorded by a
| Notes to Financial Statements (Continued) |
Fund as an unrealized gain or loss. Realized gains or losses, equal to the difference between the value of the contract at the time it was opened and the value at the time it was closed, are recorded upon delivery or receipt of the currency.
During the year ended March 31, 2016, the Flexible Income Fund used forward foreign currency contracts to enhance potential gains, hedge against anticipated currency exchange rates, maintain diversity and liquidity of the portfolio and adjust exposure to foreign currencies.
Real Estate Investment Trusts — The Funds may invest in real estate investment trusts (“REITs”) that involve risks not associated with investing in stocks. Risks include declines in the value of real estate, general and economic conditions, changes in the value of the underlying property and defaults by borrowers. The value of assets in the real estate industry may go through cycles of relative underperformance and outperformance in comparison to equity securities markets in general. Dividend income is recorded using management’s estimate of the income included in distributions received from REIT investments. The actual amounts of income, return of capital and capital gains are only determined by each REIT after its fiscal year-end and may differ from the estimated amount. Estimates of income are adjusted in the Funds to the actual amounts when the amounts are determined.
Derivative instruments and hedging activities — The Flexible Income Fund may enter into an International Swaps and Derivatives Association, Inc. Master Agreement (“ISDA Master Agreement” or “MNA”) or similar agreement with certain counterparties. An ISDA Master Agreement is a bilateral agreement between the Fund and a counterparty that governs OTC derivatives and foreign exchange contracts, and typically contains, among other things, collateral posting terms and master netting provisions in the event of a default or termination. Under an ISDA Master Agreement, a party may, under certain circumstances, offset with the counterparty certain derivative financial instrument’s payables or receivables with collateral held or posted and create one single net payment. The provisions of the ISDA Master Agreement typically permit a single net payment in the event of default (close-out netting). These default events include bankruptcy or insolvency of the counterparty. Note, however, that bankruptcy or insolvency laws of a particular jurisdiction may impose restrictions on or prohibitions against the right of offset.
When entering into a derivative transaction, the Fund may be required to post and maintain collateral or margin (including both initial and maintenance margin). Collateral and margin requirements differ by type of derivative. Margin requirements are established by the broker or clearing house for exchange traded and centrally cleared derivatives (financial futures contracts, options, and centrally cleared swaps). Brokers can ask for margining in excess of the clearing house’s minimum in certain circumstances. Collateral terms are contract specific for OTC derivatives (foreign currency exchange contracts, options, and swaps). For derivatives traded under an ISDA Master Agreement, the collateral requirements are typically calculated by netting the marked-to-market amount for each transaction under such agreement and comparing that amount to the value of any collateral currently pledged by the Fund and the counterparty. For financial reporting purposes, cash collateral that has been pledged to cover obligations of the Fund and cash collateral received from the counterparty, if any, is reported separately on the Statements of Assets and Liabilities as cash pledged as collateral and cash received as collateral, respectively. Non-cash collateral pledged by the Fund, if any, is noted in the Portfolio of Investments. To the extent amounts due to the Fund from its counterparties are not fully collateralized, contractually or otherwise, the Fund bears the risk of loss from counterparty non-performance.
Certain ISDA Master Agreements allow counterparties to OTC derivatives transactions to terminate derivative contracts prior to maturity in the event the Fund’s net assets decline by a stated percentage or the Fund fails to meet the terms of its ISDA Master Agreement, which would cause the Fund (counterparty) to accelerate payment of any net liability owed to the counterparty (Fund).
| Notes to Financial Statements (Continued) |
For financial reporting purposes, the Flexible Income Fund does not offset derivative assets and derivative liabilities that are subject to netting arrangements in the Statements of Assets and Liabilities.
As of March 31, 2016, the Flexible Income Fund’s assets and liabilities that were subject to a MNA on a gross basis were as follows:
| | | Assets | | | Liabilities | |
| Flexible Income Fund | | | | | | | | |
| Forward Foreign Currency Contracts | | $ | 124,674 | | | $ | (1,675,788 | ) |
| Total gross amount of assets and liabilities subject to MNA | | $ | 124,674 | | | $ | (1,675,788 | ) |
The following table presents the Flexible Income Fund’s assets net of amounts available for offset under a MNA and net of the related collateral pledged to the Fund as of March 31, 2016:
| | | | | Gross | | | | | | | | | | | | | |
| | | | | Amount | | | Gross Amount Available | | | | | | | | | | |
| | | | | of | | | for Offset in Statement of | | | Non-Cash | | | Cash | | | | |
| | | Derivative | | Recognized | | | Assets | | | Collateral | | | Collateral | | | Net | |
| Counterparty | | Type | | Assets | | | and Liabilities | | | Received | | | Received | | | Amount(A) | |
| Morgan Stanley | | Forward Foreign Currency Contracts | | $ | 124,674 | | | $ | (124,674 | ) | | $ | — | | | $ | — | | | $ | — | |
(A) Net amount represents the net amount receivable from the counterparty in the event of default.
The following table presents the Flexible Income Fund’s liabilities net of amounts available for offset under a MNA and net of the related collateral pledged by the Fund as of March 31, 2016:
| | | | | Gross | | | | | | | | | | | | | |
| | | | | Amount | | | | | | | | | | | | | |
| | | | | of | | | Gross Amount Available | | | Non-Cash | | | Cash | | | | |
| | | Derivative | | Recognized | | | for Offset in Statement of | | | Collateral | | | Collateral | | | Net | |
| Counterparty | | Type | | Liabilities | | | Assets and Liabilities | | | Pledged | | | Pledged | | | Amount(A) | |
| ANZ Capital Markets | | Forward Foreign Currency Contracts | | $ | 547,989 | | | $ | — | | | $ | — | | | $ | — | | | $ | 547,989 | |
| BNY ConvergEx | | Forward Foreign Currency Contracts | | | 334,813 | | | | — | | | | — | | | | (270,000 | ) | | | 64,813 | |
| Morgan Stanley | | Forward Foreign Currency Contracts | | | 792,986 | | | | (124,674 | ) | | | — | | | | — | | | | 668,312 | |
(A) Net amount represents the net amount payable due to the counterparty in the event of default.
The following table sets forth the fair value of the Flexible Income Fund’s derivative financial instruments by primary risk exposure as of March 31, 2016:
| Fair Value of Derivative Investments |
| As of March 31, 2016 |
| | | Derivatives not accounted for as hedging | | Asset | | | Liability | |
| Fund | | instruments under ASC 815 | | Derivatives | | | Derivatives | |
| Flexible Income Fund | | Forward Foreign Currency Contracts* | | $ | 124,674 | | | $ | 1,675,788 | |
| | | Purchased Options - Equity Contracts** | | | 138,400 | | | | — | |
* Statements of Assets and Liabilities Location: Unrealized appreciation on forward foreign currency contracts and unrealized depreciation on forward foreign currency contracts, respectively.
** Statements of Assets and Liabilities Location: Investments, at market value.
| Notes to Financial Statements (Continued) |
The following table sets forth the effect of the Flexible Income Fund’s derivative financial instruments by primary risk exposure on the Statements of Operations for the year ended March 31, 2016:
| The Effect of Derivative Investments on the Statement of Operations |
| for the Year Ended March 31, 2016 |
| | | | | | | | Change in | |
| | | | | | | | Unrealized | |
| | | | | Realized Gain | | | Appreciation | |
| | | Derivatives not accounted for as hedging | | (Loss) | | | (Depreciation) | |
| Fund | | instruments under ASC 815 | | on Derivatives | | | on Derivatives | |
| Flexible Income Fund | | Forward - Foreign Currency Contracts* | | $ | 3,457,337 | | | $ | (1,448,960 | ) |
| | | Futures - Equity Contracts** | | | (422,847 | ) | | | 122,123 | |
| | | Futures - Interest Rate Contracts** | | | 451,777 | | | | 133,020 | |
| | | Purchased Options - Equity Contracts*** | | | 273,314 | | | | (193,669 | ) |
| | | Written Options - Equity Contracts**** | | | 75,463 | | | | — | |
| | | Swap Agreements - Credit Contracts***** | | | (143,942 | ) | | | — | |
* Statements of Operations Location: Net realized gains on foreign currency transactions and net change in unrealized appreciation (depreciation) on foreign currency transactions, respectively.
** Statements of Operations Location: Net realized gains on futures contracts and net change in unrealized appreciation (depreciation) on futures contracts, respectively.
*** Statements of Operations Location: Net realized gains (losses) on investments from non-affiliated securities and net change in unrealized appreciation (depreciation) on investments, respectively.
**** Statements of Operations Location: Net realized gains on written options.
***** Statements of Operations Location: Net realized losses on swap agreements.
For the year ended March 31, 2016, the average quarterly balance of outstanding value of derivative financial instruments for the Flexible Income Fund was as follows:
| | | Flexible | |
| | | Income | |
| | | Fund | |
| Equity contracts: | | | | |
| Written Options - Premiums Received* | | $ | — | |
| Purchased Options - Cost | | $ | 412,924 | |
| Futures - Average notional value | | $ | 289,075 | |
| Interest rate contracts: | | | | |
| Futures - Average notional value | | $ | 194,179,403 | |
| Credit Contracts: | | | | |
| Credit Default Swaps - Average notional value | | $ | 6,000,000 | |
| Forward foreign currency contracts: | | | | |
| Average number of contracts | | | 18 | |
| Average U.S. dollar amount purchased | | $ | 19,816,698 | |
| Average U.S. dollar amount sold | | $ | 42,963,627 | |
* The Fund held no written options at each quarter end.
Portfolio securities loaned — Each Fund may lend its portfolio securities. Lending portfolio securities exposes the Funds to the risk that the borrower may fail to return the loaned securities or may not be able to provide additional collateral or that the Funds may experience delays in recovery of the loaned securities or loss of rights in the collateral if the borrower fails financially. To minimize these risks, the borrower must agree to maintain cash collateral with the Funds’ custodian. The loaned securities are secured by collateral valued at least equal, at all times, to the market value of the loaned securities plus accrued interest, if any. When the collateral falls below specified amounts, the lending agent will use its best effort to obtain additional collateral on the next
| Notes to Financial Statements (Continued) |
business day to meet required amounts under the security lending agreement. The cash collateral is reinvested by the Funds’ custodian into an approved investment vehicle. The approved investment vehicle is subject to market risk.
As of March 31, 2016, the following Funds loaned securities and received collateral as follows:
| | | | | Market
Value of | | | Market Value | | | | |
| | | | | Securities | | | of Collateral | | | | |
| Fund | | Security Type | | Loaned* | | | Received** | | | Net Amount | |
| Flexible Income Fund | | Corporate Bond | | $ | 10,260,167 | | | $ | 10,639,464 | | | $ | 379,297 | |
| | | Investment Fund | | | 53,732 | | | | 55,300 | | | | 1,568 | |
| Total Flexible Income Fund | | | | | 10,313,899 | | | | 10,694,764 | | | | 380,865 | |
| Focused Fund | | Common Stock | | | 26,090,591 | | | | 27,236,852 | | | | 1,146,261 | |
| Growth Opportunities Fund | | Common Stock | | | 15,356,209 | | | | 15,719,585 | | | | 363,376 | |
| International Value Fund | | Common Stock | | | 343,554 | | | | 546,064 | | | | 202,510 | |
| | | Right | | | 98,924 | | | | 112,496 | | | | 13,572 | |
| Total International Value Fund | | | | | 442,478 | | | | 658,560 | | | | 216,082 | |
| Mid Cap Growth Fund | | Common Stock | | | 16,001,687 | | | | 16,416,533 | | | | 414,846 | |
| Sands Capital Emerging Markets Growth Fund | | Common Stock | | | 4,942,540 | | | | 5,072,381 | | | | 129,841 | |
| Small Cap Growth Fund | | Common Stock | | | 47,715,562 | | | | 48,567,709 | | | | 852,147 | |
* The remaining contractual maturity is overnight for all securities.
** Gross amount of recognized liabilities for securities lending included in the Statements of Assets and Liabilities.
All cash collateral is received, held, and administered by the Funds’ custodian for the benefit of the lending Fund in its custody account or other account established for the purpose of holding collateral.
Funds participating in securities lending receive compensation in the form of fees. Securities lending income is derived from lending long securities from the Funds to creditworthy approved borrowers at rates that are determined based on trading volumes, float, short-term interest rates and market liquidity. When a Fund lends securities, it retains the interest or dividends on the investment of any cash received as collateral, and the Fund continues to receive interest or dividends on the loaned securities.
Unrealized gain or loss on the market value of the loaned securities that may occur during the term of the loan is recognized by the Fund. The Fund has the right under the lending agreement to recover any loaned securities from the borrower on demand.
Share valuation — The NAV per share of each class of shares of each Fund is calculated daily by dividing the total value of a Fund’s assets attributable to that class, less liabilities attributable to that class, by the number of outstanding shares of that class.
The maximum offering price per share of Class A shares of the Funds is equal to the NAV per share plus a sales load equal to 6.10% of the NAV (or 5.75% of the offering price). There is no sales load on purchases of $1 million or more of Class A shares. The maximum offering price per share of Classes B, C, Y, and Institutional Class shares of the Funds is equal to the NAV per share.
The redemption price per share of each class of shares of the Funds is generally equal to the NAV per share. However, Class A redemptions that were part of a no-load $1 million subscription may be subject to a contingent deferred sales charge (“CDSC”) of up to 1.00% if redeemed within a one-year period from the date of purchase. Class B shares of the Funds are subject to a CDSC of 5.00% in the event of a shareholder redemption within a one-year period of purchase. The CDSC will be incrementally reduced over time. After the 6th year, there is no CDSC. Additionally, Class C shares of the Funds are subject to a CDSC of 1.00%. The CDSC will be assessed on an
Notes to Financial Statements (Continued)
amount equal to the lesser of (1) the NAV at the time of purchase of the shares being redeemed or (2) the NAV of such shares being redeemed, if redeemed within a one-year period from the date of purchase.
Investment income — Dividend income from securities is recognized on the ex-dividend date, net of foreign withholding taxes, if any, which are reduced by any amounts reclaimable by the Funds, where applicable. Interest income from securities is recorded on the basis of interest accrued, premium amortized and discount accreted. Realized gains and losses resulting from principal paydowns on mortgage-backed and asset-backed securities are included in interest income. Market discounts, original issues discount (“OID”) and market premiums on debt securities are accreted/amortized to interest income over the life of the security with a corresponding adjustment in the cost basis of that security.
Distributions to shareholders — Each Fund intends to distribute to its shareholders substantially all of its income and capital gains. Each Fund, except for the Flexible Income Fund, declares and distributes net investment income, if any, annually, as a dividend to shareholders. The Flexible Income Fund declares and distributes net investment income, if any, monthly, as a dividend to shareholders. Each Fund makes distributions of capital gains, if any, at least annually, net of applicable capital loss carryforwards. Income distributions and capital gain distributions are determined in accordance with income tax regulations. Recognition of the Funds’ net investment income from investments in Underlying Funds is affected by the timing of dividend declarations by Underlying Funds.
Allocations — Investment income earned, realized capital gains and losses, and unrealized appreciation and depreciation for a Fund are allocated daily to each class of shares based upon its proportionate share of total net assets of the Fund. Class-specific expenses are charged directly to the class incurring the expense. Common expenses, which are not attributable to a specific class, are allocated daily to each class of shares based upon their proportionate share of total net assets of the Fund. Expenses not directly billed to a Fund are allocated proportionally among all the Funds in the Trust, and, if applicable, Touchstone Funds Group Trust, Touchstone Institutional Funds Trust, Touchstone Investment Trust, Touchstone Tax-Free Trust, and Touchstone Variable Series Trust (collectively with the Trust, “Touchstone Fund Complex”), daily in relation to net assets of each Fund or another reasonable measure.
Security transactions — Security transactions are reflected for financial reporting purposes as of the trade date. Realized gains and losses on sales of portfolio securities are calculated using the identified cost basis.
Estimates — The preparation of financial statements in conformity with U.S. GAAP requires management to make estimates and assumptions that affect the reported amounts of assets and liabilities and disclosure of contingent assets and liabilities at the date of the financial statements and the reported amounts of income and expenses during the reporting period. Actual results could differ from those estimates.
3. Investment Transactions
Investment transactions (excluding short-term investments and U.S. Government securities) were as follows for the year ended March 31, 2016:
| | | Flexible
Income | | | Focused | | | Growth
Opportunities | | | International
Value | |
| | | Fund | | | Fund | | | Fund | | | Fund | |
| Purchases of investment securities | | $ | 350,329,257 | | | $ | 451,223,721 | | | $ | 421,879,764 | | | $ | 35,730,763 | |
| Proceeds from sales and maturities | | $ | 234,804,034 | | | $ | 319,192,988 | | | $ | 392,600,840 | | | $ | 87,514,670 | |
Notes to Financial Statements (Continued)
| | | | | | Sands Capital | | | | | | | |
| | | | | | Emerging | | | | | | Sustainability | |
| | | Mid Cap | | | Markets | | | Small Cap | | | and Impact | |
| | | Growth | | | Growth | | | Growth | | | Equity | |
| | | Fund | | | Fund | | | Fund | | | Fund | |
| Purchases of investment securities | | $ | 700,907,809 | | | $ | 120,213,414 | | | $ | 448,012,238 | | | $ | 1,115,763,859 | |
| Proceeds from sales and maturities | | $ | 701,586,513 | | | $ | 30,450,767 | | | $ | 165,211,084 | | | $ | 1,582,538,465 | |
For the year ended March 31, 2016, purchases and proceeds from sales and maturities in U.S. Government securities were $177,514,414 and $228,369,433 for the Flexible Income Fund, respectively.
4. Transactions with Affiliates and Other Related Parties
Certain officers of the Trust are also officers of Touchstone Advisors, Inc. (the “Advisor”), Touchstone Securities, Inc. (the “Underwriter”), or BNY Mellon Investment Servicing (U.S.) Inc. (“BNY Mellon”), the Sub-Administrator and Transfer Agent to the Funds. Such officers receive no compensation from the Trust. The Advisor and the Underwriter are each wholly-owned, indirect subsidiaries of Western & Southern Financial Group, Inc. (“Western & Southern”).
On behalf of the Funds, the Advisor pays each Independent Trustee a quarterly retainer plus additional retainers to the Lead Independent Trustee and the chairs of each standing committee. Interested Trustees do not receive compensation from the Funds. Each Independent Trustee also receives compensation for each board meeting and committee meeting attended. Each standing committee chair receives additional compensation for each committee meeting that he or she oversees. The Advisor is reimbursed by the Funds for the Independent Trustees’ compensation and out-of-pocket expenses relating to their services. The Funds accrued Trustee-related expenses of $123,312 for the year ended March 31, 2016.
MANAGEMENT & EXPENSE LIMITATION AGREEMENTS
The Advisor provides general investment supervisory services for the Funds, under terms of an advisory agreement (“Advisory Agreement”). Under the Advisory Agreement, each Fund pays the Advisor a fee, which is computed and accrued daily and paid monthly, at an annual rate based on average daily net assets of each Fund as shown in the table below.
| Flexible Income Fund | 0.70% on the first $500 million |
| | 0.60% on such assets in excess of $500 million |
| Focused Fund | 0.70% on the first $100 million |
| | 0.65% on the next $400 million |
| | 0.60% on such assets in excess of $500 million |
| Growth Opportunities Fund | 0.75% on the first $500 million |
| | 0.70% on the next $500 million |
| | 0.65% on such assets in excess of $1 billion |
| International Value Fund | 1.00% |
| Mid Cap Growth Fund | 0.75% on the first $500 million |
| | 0.70% on the next $500 million |
| | 0.65% on such assets in excess of $1 billion |
| Sands Capital Emerging Markets Growth Fund | 1.15% |
| Small Cap Growth Fund | 1.00% on the first $300 million |
| | 0.95% on such assets in excess of $300 million |
| Sustainability and Impact Equity Fund | 0.75% on the first $200 million |
| | 0.70% on the next $800 million |
| | 0.65% on such assets in excess of $1 billion |
Notes to Financial Statements (Continued)
The Advisor has entered into investment sub-advisory agreements with the following parties (each, a “Sub-Advisor”):
| Apex Capital Management, Inc. | Rockefeller & Co., Inc.** |
| Small Cap Growth Fund | Sustainability and Impact Equity Fund |
| Barrow, Hanley, Mewhinney & Strauss, LLC | Sands Capital Management, LLC |
| International Value Fund | Sands Capital Emerging Markets Growth Fund |
| ClearArc Capital, Inc. | Westfield Capital Management Company, L.P. |
| Flexible Income Fund | Growth Opportunities Fund |
| Fort Washington Investment Advisors, Inc.* | Mid Cap Growth Fund |
| Focused Fund | |
*Affiliate of the Advisor and wholly-owned subsidiary of Western & Southern.
**Effective May 4, 2015, Rockefeller & Co., Inc. became the sub-advisor of the Sustainability and Impact Equity Fund; prior to May 4, 2015, Navellier & Associates, Inc. was the sub-advisor.
The Advisor, not the Funds, pays sub-advisory fees to each Sub-Advisor.
The Advisor entered into an expense limitation agreement (the “Expense Limitation Agreement”) to contractually limit the annual operating expenses of the Funds, excluding: dividend and interest expenses relating to short sales; interest; taxes; brokerage commissions and other transaction costs; portfolio transactions and investment related expenses; other expenditures which are capitalized in accordance with U.S. GAAP; the cost of “Acquired Fund Fees and Expenses”; if any, and other extraordinary expenses not incurred in the ordinary course of business. The maximum annual operating expense limit in any year with respect to the Funds is based on a percentage of the average daily net assets of the Funds. The Advisor has agreed to separately waive class-level expenses, advisory fees and administration fees, and to reimburse expenses in order to maintain expense limitations for the Funds:
| | | | | | | | | | | | | | | Institutional | |
| | | Class A | | | Class B | | | Class C | | | Class Y | | | Class | |
| Flexible Income Fund | | | 1.09 | % | | | — | | | | 1.84 | % | | | 0.84 | % | | | 0.74 | % |
| Focused Fund* | | | 1.20 | % | | | — | | | | 1.95 | % | | | 0.95 | % | | | 0.83 | % |
| Growth Opportunities Fund | | | 1.24 | % | | | — | | | | 1.99 | % | | | 0.99 | % | | | 0.89 | % |
| International Value Fund** | | | 1.34 | % | | | — | | | | 2.09 | % | | | 1.09 | % | | | 0.99 | % |
| Mid Cap Growth Fund | | | 1.39 | % | | | 2.14 | % | | | 2.14 | % | | | 1.14 | % | | | 0.99 | % |
| Sands Capital Emerging Markets Growth Fund | | | — | | | | — | | | | — | | | | 1.49 | % | | | 1.39 | % |
| Small Cap Growth Fund | | | 1.44 | % | | | — | | | | 2.19 | % | | | 1.19 | % | | | 1.04 | % |
| Sustainability and Impact Equity Fund*** | | | 1.24 | % | | | 1.99 | % | | | 1.99 | % | | | 0.99 | % | | | 0.89 | % |
*Prior to July 30, 2015, the expense limitation for Institutional Class shares was 0.80%.
**Prior to July 30, 2015, the expense limitations for Classes A, C, and Y shares were 1.39%, 2.14%, and 1.14%, respectively.
***Prior to May 1, 2015, the expense limitations for Classes A, B and C shares were 1.25%, 2.00% and 2.00%, respectively. Prior to May 4, 2015, the Sustainability and Impact Equity Fund did not issue Institutional Class shares.
These expense limitations will remain in effect for all Funds through at least July 29, 2016, but can be terminated by a vote of the Board of Trustees of the Trust if it deems the termination to be beneficial to the Fund’s shareholders.
Notes to Financial Statements (Continued)
During the year ended March 31, 2016, the Advisor or its affiliates waived investment advisory fees and administration fees or reimbursed expenses, including distribution fees of the Funds, as follows:
| | | Investment | | | | | | Other Operating | | | | |
| | | Advisory | | | | | | Expenses | | | | |
| | | Fees | | | Administration | | | Reimbursed/ | | | | |
| Fund | | Waived | | | Fees Waived | | | Waived | | | Total | |
| Flexible Income Fund | | $ | 39,009 | | | $ | 570,329 | | | $ | 214,580 | | | $ | 823,918 | |
| Focused Fund | | | — | | | | 145,607 | | | | 374,976 | | | | 520,583 | |
| Growth Opportunities Fund | | | — | | | | 124,613 | | | | 165,204 | | | | 289,817 | |
| International Value Fund | | | 131,927 | | | | 145,903 | | | | 62,404 | | | | 340,234 | |
| Mid Cap Growth Fund | | | — | | | | — | | | | 2,994 | | | | 2,994 | |
| Sands Capital Emerging Markets Growth Fund | | | — | | | | 54,528 | | | | 50,626 | | | | 105,154 | |
| Small Cap Growth Fund | | | — | | | | 517,876 | | | | 136,298 | | | | 654,174 | |
| Sustainability and Impact Equity Fund | | | — | | | | 242,065 | | | | 333,508 | | | | 575,573 | |
Under the terms of the Expense Limitation Agreement the Advisor is entitled to recover, subject to approval by the Funds’ Board, such amounts waived or reimbursed for a period of up to three years from the year in which the Advisor reduced its compensation or assumed expenses for the Funds. No recoupment will occur unless a Fund’s operating expenses are below the expense limitation amount in effect at the time of waiver or reimbursement. As of March 31, 2016, the Advisor may seek recoupment of previously waived fees and reimbursed expenses as follows:
| | | Expiration | | | Expiration | | | Expiration | | | | |
| | | March 31, | | | March 31, | | | March 31, | | | | |
| Fund | | 2017 | | | 2018 | | | 2019 | | | Total | |
| Flexible Income Fund | | $ | 772,157 | | | $ | 506,352 | | | $ | 775,043 | | | $ | 2,053,552 | |
| Focused Fund | | | 712,383 | | | | 502,116 | | | | 178,123 | | | | 1,392,622 | |
| Growth Opportunities Fund | | | 317,974 | | | | 223,185 | | | | 227,669 | | | | 768,828 | |
| International Value Fund | | | 397,344 | | | | 357,335 | | | | 327,638 | | | | 1,082,317 | |
| Sands Capital Emerging Markets Growth Fund | | | — | | | | 119,351 | | | | 105,154 | | | | 224,505 | |
| Small Cap Growth Fund | | | 180,962 | | | | 313,619 | | | | 583,974 | | | | 1,078,555 | |
| Sustainability and Impact Equity Fund | | | 432,998 | | | | 65,536 | | | | 372,980 | | | | 871,514 | |
The Advisor did not recoup any amounts it previously waived or reimbursed during the year ended March 31, 2016.
ADMINISTRATION AGREEMENT
The Advisor entered into an Administration Agreement with the Trust, whereby the Advisor is responsible for: supplying executive and regulatory compliance services; supervising the preparation of tax returns; coordinating the preparation of reports to shareholders and reports to, and filings with, the SEC and state securities authorities, as well as materials for meetings of the Board; calculating the daily NAV per share; and maintaining the financial books and records of each Fund.
For its services, the Advisor’s annual administrative fee is:
0.145% on the first $20 billion of the aggregate average daily net assets;
0.11% on the next $10 billion of aggregate average daily net assets;
0.09% on the next $10 billion of aggregate average daily net assets; and
0.07% on the aggregate average daily net assets over $40 billion.
The fee is computed and allocated among the Touchstone Fund Complex (excluding Touchstone Institutional Funds Trust) on the basis of relative daily net assets.
Notes to Financial Statements (Continued)
The Advisor has engaged BNY Mellon as the Sub-Administrator to the Trust. BNY Mellon provides administrative and accounting services to the Trust and is compensated directly by the Advisor, not the Trust.
TRANSFER AGENT AGREEMENT
Under the terms of the Transfer Agent Agreement between the Trust and BNY Mellon, BNY Mellon maintains the records of each shareholder’s account, answers shareholders’ inquiries concerning their accounts, processes purchases and redemptions of each Fund’s shares, acts as dividend and distribution disbursing agent, and performs other shareholder service functions. For these services, BNY Mellon receives a monthly fee from each Fund. In addition, each Fund pays out-of-pocket expenses incurred by BNY Mellon, including, but not limited to, postage and supplies.
The Funds may reimburse the Advisor for fees paid to intermediaries such as banks, broker-dealers, financial advisors or other financial institutions for sub-transfer agency, sub-administration and other services provided to investors whose shares of record are held in omnibus, other group accounts, retirement plans or accounts traded through registered securities clearing agents. These fees may vary based on, for example, the nature of services provided, but generally range up to 0.15% of the assets of the class serviced or maintained by the intermediary or up to $22 per sub-account maintained by the intermediary.
PLANS OF DISTRIBUTION AND SHAREHOLDER SERVICING FEE ARRANGEMENTS
The Trust has adopted distribution plans pursuant to Rule 12b-1 under the 1940 Act for each class of shares it offers that is subject to 12b-1 distribution fees. The plans allow each Fund to pay distribution and other fees for the sale and distribution of its shares and for services provided to shareholders. The fees charged to the Funds are limited to the actual expenses incurred. Under the Class A plan, each Fund offering Class A shares pays an annual fee of up to 0.25% of average daily net assets that are attributable to Class A shares. Under the Class B plan, each Fund offering Class B shares pays an annual fee of up to 1.00% of average daily net assets that are attributable to Class B shares. Under the Class C plan, each Fund offering Class C shares pays an annual fee of up to 1.00% of average daily net assets that are attributable to Class C shares (of which up to 0.75% is a distribution fee and up to 0.25% is a shareholder servicing fee).
UNDERWRITING AGREEMENT
The Underwriter is the Funds’ principal underwriter and, as such, acts as exclusive agent for distribution of the Funds’ shares. Under the terms of the Underwriting Agreement between the Trust and the Underwriter, the Underwriter earned the following from underwriting and broker commissions on the sale of Class A shares of the Funds listed below during the year ended March 31, 2016:
| Fund | | Amount | |
| Flexible Income Fund | | $ | 16,296 | |
| Focused Fund | | | 79,408 | |
| Growth Opportunities Fund | | | 6,804 | |
| International Value Fund | | | 611 | |
| Mid Cap Growth Fund | | | 36,601 | |
| Small Cap Growth Fund | | | 17,803 | |
| Sustainability and Impact Equity Fund | | | 16,932 | |
Notes to Financial Statements (Continued)
In addition, the Underwriter collected CDSC on the redemption of Classes A, B, and C shares of the Funds listed below during the year ended March 31, 2016:
| Fund | | Class A | | | Class B | | | Class C | |
| Flexible Income Fund | | $ | 26 | | | $ | — | | | $ | 1,984 | |
| Focused Fund | | | — | | | | — | | | | 472 | |
| Growth Opportunities Fund | | | — | | | | — | | | | 53 | |
| International Value Fund | | | — | | | | — | | | | 74 | |
| Mid Cap Growth Fund | | | — | | | | 153 | | | | 922 | |
| Small Cap Growth Fund | | | — | | | | — | | | | 661 | |
| Sustainability and Impact Equity Fund | | | 2 | | | | — | | | | 1,535 | |
AFFILIATED INVESTMENTS
Each Fund may have invested in the Touchstone Institutional Money Market Fund through June 19, 2015, subject to compliance with several conditions set forth in an exemptive order received by the Trust from the SEC. To the extent that the Funds were invested in the Touchstone Institutional Money Market Fund, the Advisor and Administrator were paid additional fees from the Touchstone Institutional Money Market Fund that were not waived or reimbursed.
A summary of each Fund’s investment in the Touchstone Institutional Money Market Fund for year ended March 31, 2016, is as follows:
| �� | | Share Activity | | | | | | | |
| | | Balance | | | | | | | | | Balance | | | | | | Value | |
| Fund | | 3/31/15 | | | Purchases | | | Sales | | | 3/31/16 | | | Dividends | | | 3/31/16 | |
| Flexible Income Fund | | | 16,053,570 | | | | 39,654,146 | | | | (55,707,716 | ) | | | — | | | $ | 323 | | | $ | — | |
| Focused Fund | | | 24,293,946 | | | | 20,022,211 | | | | (44,316,157 | ) | | | — | | | | 475 | | | | — | |
| Growth Opportunities Fund | | | 11,013,158 | | | | 44,877,418 | | | | (55,890,576 | ) | | | — | | | | 191 | | | | — | |
| International Value Fund | | | 2,842,409 | | | | 6,747,741 | | | | (9,590,150 | ) | | | — | | | | 44 | | | | — | |
| Mid Cap Growth Fund | | | 7,981,283 | | | | 67,683,703 | | | | (75,664,986 | ) | | | — | | | | 362 | | | | — | |
| Sands Capital Emerging Markets Growth Fund | | | 6,137,187 | | | | 4,025,586 | | | | (10,162,773 | ) | | | — | | | | 111 | | | | — | |
| Small Cap Growth Fund | | | 13,781,617 | | | | 47,003,144 | | | | (60,784,761 | ) | | | — | | | | 487 | | | | — | |
| Sustainability and Impact Equity Fund | | | 3,692,824 | | | | 221,018,168 | | | | (224,710,992 | ) | | | — | | | | 405 | | | | — | |
At a meeting of the Board of Trustees (the “Board”) of the Trust held on February 12, 2015, the Board approved an Agreement and Plan of Reorganization between the Institutional Money Market Fund and the Dreyfus Cash Management Fund advised by The Dreyfus Corporation (“Dreyfus”), pursuant to which the Institutional Money Market Fund would be reorganized on a tax-free basis with and into the Dreyfus Cash Management Fund.
At a special meeting of shareholders of the Institutional Money Market Fund, held on May 8, 2015, shareholders voted to approve the Agreement and Plan of Reorganization. The reorganization took place on June 19, 2015.
5. Federal Tax Information
Federal income tax — It is each Fund’s policy to continue to comply with the special provisions of the Internal Revenue Code applicable to regulated investment companies. As provided therein, in any fiscal year in which a Fund so qualifies and distributes at least 90% of its investment company taxable income, the Fund (but not the shareholders) will be relieved of federal income tax on the income distributed. It is each Fund’s policy to distribute all of its taxable income and accordingly, no provision for income taxes has been made.
In order to avoid imposition of the excise tax applicable to regulated investment companies, it is also each Fund’s intention to declare and pay as dividends in each calendar year at least 98% of its investment company
Notes to Financial Statements (Continued)
taxable income (earned during the calendar year) and 98.2% of its net realized capital gains (earned during the twelve months ending October 31) plus undistributed amounts from prior years.
The tax character of distributions paid are as follows:
| | | Flexible | | | | |
| | | Income Fund | | | Focused Fund | |
| | | Year Ended | | | Year Ended | | | Year Ended | | | Year Ended | |
| | | March 31, | | | March 31, | | | March 31, | | | March 31, | |
| | | 2016 | | | 2015 | | | 2016 | | | 2015 | |
| From ordinary income | | $ | 12,216,849 | | | $ | 13,016,300 | | | $ | 8,434,874 | | | $ | 4,384,884 | |
| From long-term capital gains | | | — | | | | — | | | | 27,791,755 | | | | — | |
| Total distributions | | $ | 12,216,849 | | | $ | 13,016,300 | | | $ | 36,226,629 | | | $ | 4,384,884 | |
| | | Growth | | | International | | | Mid Cap | |
| | | Opportunities Fund | | | Value Fund | | | Growth Fund | |
| | | Year Ended | | | Year Ended | | | Year Ended | | | Year Ended | | | Year Ended | | | Year Ended | |
| | | March 31, | | | March 31, | | | March 31, | | | March 31, | | | March 31, | | | March 31, | |
| | | 2016 | | | 2015 | | | 2016 | | | 2015 | | | 2016 | | | 2015 | |
| From ordinary income | | $ | 1,772,322 | | | $ | — | | | $ | 3,765,519 | | | $ | 3,787,190 | | | $ | 8,520,663 | | | $ | 30,998,259 | |
| From long-term capital gains | | | 23,776,825 | | | | 32,371,941 | | | | — | | | | — | | | | 61,652,123 | | | | 68,535,176 | |
| Total distributions | | $ | 25,549,147 | | | $ | 32,371,941 | | | $ | 3,765,519 | | | $ | 3,787,190 | | | $ | 70,172,786 | | | $ | 99,533,435 | |
| | | Sands Capital | | | | | | Sustainability | |
| | | Emerging Markets | | | Small Cap | | | and Impact Equity | |
| | | Growth Fund | | | Growth Fund | | | Fund | |
| | | Year Ended | | | Period Ended | | | Year Ended | | | Year Ended | | | Year Ended | | | Year Ended | |
| | | March 31, | | | March 31, | | | March 31, | | | March 31, | | | March 31, | | | March 31, | |
| | | 2016 | | | 2015 | | | 2016 | | | 2015 | | | 2016 | | | 2015 | |
| From ordinary income | | $ | — | | | $ | — | | | $ | 870,393 | | | $ | 2,738,627 | | | $ | 54,125,427 | | | $ | 4,739,291 | |
| From long-term capital gains | | | — | | | | — | | | | 3,899,710 | | | | 2,618,059 | | | | 116,661,558 | | | | 127,807,527 | |
| Total distributions | | $ | — | | | $ | — | | | $ | 4,770,103 | | | $ | 5,356,686 | | | $ | 170,786,985 | | | $ | 132,546,818 | |
The following information is computed on a tax basis for each item as of March 31, 2016:
| | | Flexible | | | | | | Growth | | | International | |
| | | Income | | | Focused | | | Opportunities | | | Value | |
| | | Fund | | | Fund | | | Fund | | | Fund | |
| Tax cost of portfolio investments | | $ | 560,302,632 | | | $ | 1,198,452,351 | | | $ | 298,929,030 | | | $ | 51,073,577 | |
| Gross unrealized appreciation | | | 10,089,315 | | | | 200,630,707 | | | | 31,188,893 | | | | 1,704,947 | |
| Gross unrealized depreciation | | | (6,437,428 | ) | | | (30,694,225 | ) | | | (6,021,422 | ) | | | (9,314,806 | ) |
| Net unrealized (depreciation) on investments | | | 3,651,887 | | | | 169,936,482 | | | | 25,167,471 | | | | (7,609,859 | ) |
| Net unrealized appreciation (depreciation) on foreign currency contracts and translation of other assets and liabilities denominated in foreign currency | | | (94,641 | ) | | | — | | | | — | | | | (4,510 | ) |
| Post-October and Qualified Late-Year Losses | | | — | | | | — | | | | (12,395,567 | ) | | | (5,545,202 | ) |
| Accumulated capital and other losses | | | (12,989,296 | ) | | | — | | | | (509,261 | ) | | | (117,302,408 | ) |
| Other temporary differences | | | (2,895 | ) | | | — | | | | — | | | | — | |
| Undistributed ordinary income | | | 352,763 | | | | 7,223,788 | | | | — | | | | 2,333,680 | |
| Undistributed capital gains | | | — | | | | 12,445,539 | | | | — | | | | — | |
| Accumulated earnings (deficit) | | $ | (9,082,182 | ) | | $ | 189,605,809 | | | $ | 12,262,643 | | | $ | (128,128,299 | ) |
Notes to Financial Statements (Continued)
| | | | | | Sands Capital | | | | | | | |
| | | | | | Emerging | | | | | | Sustainability | |
| | | Mid Cap | | | Markets | | | Small Cap | | | and Impact | |
| | | Growth | | | Growth | | | Growth | | | Equity | |
| | | Fund | | | Fund | | | Fund | | | Fund | |
| Tax cost of portfolio investments | | $ | 685,491,483 | | | $ | 165,528,501 | | | $ | 664,783,863 | | | $ | 271,737,605 | |
| Gross unrealized appreciation | | | 134,747,830 | | | | 9,831,116 | | | | 38,632,859 | | | | 20,657,903 | |
| Gross unrealized depreciation | | | (14,902,639 | ) | | | (9,760,308 | ) | | | (58,395,861 | ) | | | (24,129,175 | ) |
| Net unrealized (depreciation) on investments | | | 119,845,191 | | | | 70,808 | | | | (19,763,002 | ) | | | (3,471,272 | ) |
| Net unrealized appreciation (depreciation) on translation of other assets and liabilities denominated in foreign currency | | | — | | | | (3,368 | ) | | | — | | | | 4,499 | |
| Post-October and Qualified Late-Year Losses | | | (23,739,102 | ) | | | (168,033 | ) | | | (695,134 | ) | | | (13,753,041 | ) |
| Accumulated capital and other losses | | | — | | | | (7,587,200 | ) | | | (809,083 | ) | | | — | |
| Undistributed ordinary income | | | — | | | | — | | | | — | | | | — | |
| Undistributed capital gains | | | — | | | | — | | | | 1,973,097 | | | | — | |
| Accumulated earnings (deficit) | | $ | 96,106,089 | | | $ | (7,687,793 | ) | | $ | (19,294,122 | ) | | $ | (17,219,814 | ) |
The difference between the tax cost of portfolio investments and the financial statement cost is primarily due to wash sale loss deferrals, trust preferred securities and investments in regulated investment companies.
As of March 31, 2016, the Funds had the following capital loss carryforwards for federal income tax purposes:
| | | | | | | | | | | | No | | | No | | | | |
| | | Short Term Expiring in | | | Expiration | | | Expiration | | | | |
| Fund | | 2017 | | | 2018 | | | 2019 | | | Short Term * | | | Long Term * | | | Total | |
| Flexible Income Fund | | $ | — | | | $ | — | | | $ | 9,461,280 | | | $ | 1,167,799 | | | $ | 2,360,217 | | | $ | 12,989,296 | |
| Growth Opportunities Fund | | | — | | | | 509,261 | | | | — | | | | — | | | | — | | | | 509,261 | |
| International Value Fund | | | 46,390,273 | | | | 70,912,135 | | | | — | | | | — | | | | — | | | | 117,302,408 | |
| Sands Capital Emerging Markets Growth Fund | | | — | | | | — | | | | — | | | | 7,281,473 | | | | 305,727 | | | | 7,587,200 | |
| Small Cap Growth Fund | | | 809,083 | | | | — | | | | — | | | | — | | | | — | | | | 809,083 | |
* The Regulated Investment Company Modernization Act of 2010 (the “Act”) was enacted on December 22, 2010. The Act made changes to several tax rules impacting the Funds. The provisions of the Act first became effective for the Funds’ fiscal year ended March 31, 2012 and are applicable to all subsequent fiscal years. Although the Act provides several benefits, including the unlimited carryover of future capital losses, there may be a greater likelihood that all or a portion of each Fund’s pre-enactment capital loss carryovers may expire without being utilized due to the fact that post-enactment capital losses must be utilized before pre-enactment capital loss carryovers may be utilized. Under the Act, new capital losses may now be carried forward indefinitely, and retain the character of the original loss as compared with pre-enactment law, where capital losses could be carried forward for up to eight years, and carried forward as short-term capital losses, irrespective of the character of the original loss.
The capital loss carryforwards may be utilized in future years to offset net realized capital gains, if any, prior to distributing such gains to shareholders.
During the year ended March 31, 2016, the following Funds utilized capital loss carryforwards:
| Fund | | Amount | |
| Growth Opportunities Fund | | $ | 1,887,706 | |
| International Value Fund | | | 127,848 | |
| Small Cap Growth Fund | | | 809,083 | |
Under current laws, certain capital losses realized after October 31 and ordinary losses realized after December 31 may be deferred (and certain ordinary losses after October and/or December 31 may be deferred) and treated as occurring on the first day of the following fiscal year. For the year ended March 31, 2016, the Funds elected to defer the following losses:
Notes to Financial Statements (Continued)
| | | Realized | | | Ordinary | | | | |
| Fund | | Capital Losses | | | Losses | | | Total | |
| Growth Opportunities Fund | | $ | 12,395,567 | | | $ | — | | | $ | 12,395,567 | |
| International Value Fund | | | 5,545,202 | | | | — | | | | 5,545,202 | |
| Mid Cap Growth Fund | | | 23,739,102 | | | | — | | | | 23,739,102 | |
| Sands Capital Emerging Markets Growth Fund | | | — | | | | 168,033 | | | | 168,033 | |
| Small Cap Growth Fund | | | — | | | | 695,134 | | | | 695,134 | |
| Sustainability and Impact Equity Fund | | | 13,753,041 | | | | — | | | | 13,753,041 | |
The Funds have analyzed their tax positions taken on federal income tax returns for all open tax years (tax years ended March 31, 2013 through 2016) and have concluded that no provision for income tax is required in their financial statements.
Certain reclassifications, the result of permanent differences between financial statement and income tax reporting requirements, have been made to the components of capital. These reclassifications have no impact on the net assets or NAV per share of the Funds. The following reclassifications, which are primarily attributed to the tax treatment of foreign currency gains/losses, paydown gains/losses on mortgage backed and asset backed securities, gains/losses from passive foreign investment companies, non-taxable distributions from underlying investments, net operating losses netted against short-term gains, re-designation of dividends paid, swap reclassifications, forward currency contracts reclassifications, deemed distributions on shareholder redemptions and U.S. Treasury Inflation Protected Debt Instruments adjustments have been made to the following Funds for the year ended March 31, 2016:
| | | | | | Accumulated | | | Accumulated | |
| | | Paid-In | | | Net Investment | | | Net Realized | |
| Fund | | Capital | | | Income(Loss) | | | Gains(Losses) | |
| Flexible Income Fund | | $ | — | | | $ | (638,646 | ) | | $ | 638,646 | |
| Growth Opportunities Fund | | | (1,884,160 | ) | | | 111,838 | | | | 1,772,322 | |
| International Value Fund | | | — | | | | 1,065,966 | | | | (1,065,966 | ) |
| Mid Cap Growth Fund | | | (5,485,554 | ) | | | 4,261,547 | | | | 1,224,007 | |
| Sands Capital Emerging Markets Growth Fund | | | (361,180 | ) | | | 323,482 | | | | 37,698 | |
| Small Cap Growth Fund | | | (2,808,663 | ) | | | 2,808,663 | | | | — | |
| Sustainability and Impact Equity Fund | | | 50,135,112 | | | | (857,385 | ) | | | (49,277,727 | ) |
6. Commitments and Contingencies
The Funds indemnify the Trust’s officers and Trustees for certain liabilities that might arise from their performance of their duties to the Funds. Additionally, in the normal course of business, the Funds enter into contracts that contain a variety of representations and warranties and which provide general indemnifications. The Funds’ maximum exposure under these arrangements is unknown, as this would involve future claims that may be made against the Funds.
7. Principal Risks
Risks Associated with Foreign Investments — Some of the Funds may invest in the securities of foreign issuers. Investing in securities issued by companies whose principal business activities are outside the U.S. may involve significant risks not present in domestic investments. For example, there is generally less publicly available information about foreign companies, particularly those not subject to the disclosure and reporting requirements of the U.S. securities laws. Foreign issuers are generally not bound by uniform accounting, auditing, and financial reporting requirements and standards of practice comparable to those applicable to domestic issuers. Investments in foreign securities also involve the risk of possible adverse changes in investment or exchange control regulations, expropriation or confiscatory taxation, limitations on the removal of funds or other assets of a Fund, political or financial instability or diplomatic and other developments which could affect such investments. Foreign
Notes to Financial Statements (Continued)
stock markets, while growing in volume and sophistication, are generally not as developed as those in the U.S., and securities of some foreign issuers (particularly those located in developing countries) may be less liquid and more volatile than securities of comparable U.S. companies. In general, there is less overall governmental supervision and regulation of foreign securities markets, broker-dealers, and issuers than in the U.S.
Risks Associated with Concentration — Certain Funds may invest a high percentage of their assets in specific sectors of the market in order to achieve a potentially greater investment return. As a result, these Funds may be more susceptible to economic, political, and regulatory developments in a particular sector of the market, positive or negative, and may experience increased volatility in the Funds’ NAVs and magnified effect on the total return.
Risks Associated with Credit — An issuer may be unable to make timely payments of either principal or interest. This may cause the issuer’s securities to decline in value. Credit risk is particularly relevant to those Funds that invest a significant amount of their assets in junk bonds or lower-rated securities.
Risks Associated with Interest Rate Changes — As interest rates rise, the value of fixed-income securities a Fund owns will likely decrease. The price of debt securities is generally linked to the prevailing market interest rates. In general, when interest rates rise, the price of debt securities falls, and when interest rates fall, the price of debt securities rises. The price volatility of a debt security also depends on its maturity. Longer-term securities are generally more volatile, so the longer the average maturity or duration of these securities, the greater their price risk. Duration is a measure of the expected life, taking into account any prepayment or call features of the security, that is used to determine the price sensitivity of the security for a given change in interest rates. Specifically, duration is the change in the value of a fixed-income security that will result from a 1% change in interest rates, and generally is stated in years. For example, as a general rule a 1% rise in interest rates means a 1% fall in value for every year of duration. Maturity, on the other hand, is the date on which a fixed-income security becomes due for payment of principal. The negative impact on fixed income securities if interest rates increase as a result could negatively impact a Fund’s NAV.
Please see the Funds’ prospectus for a complete discussion of these and other risks.
8. Subsequent Events
Subsequent events occurring after the date of this report have been evaluated for potential impact to this report through the date financial statements were issued. There were no subsequent events that necessitated recognition or disclosure on the Funds’ financial statement.
Report of Independent Registered Public Accounting Firm
The Board of Trustees and Shareholders of Touchstone Flexible Income Fund, Touchstone Focused Fund, Touchstone Growth Opportunities Fund, Touchstone International Value Fund, Touchstone Mid Cap Growth Fund, Touchstone Sands Capital Emerging Markets Growth Fund, Touchstone Small Cap Growth Fund and Touchstone Sustainability and Impact Equity Fund, (formerly, Touchstone Large Cap Growth Fund).
We have audited the accompanying statements of assets and liabilities, including the portfolios of investments, of Touchstone Flexible Income Fund, Touchstone Focused Fund, Touchstone Growth Opportunities Fund, Touchstone International Value Fund, Touchstone Mid Cap Growth Fund, Touchstone Sands Capital Emerging Markets Growth Fund, Touchstone Small Cap Growth Fund and Touchstone Sustainability and Impact Equity Fund (the “Funds”) (eight of the funds constituting Touchstone Strategic Trust) as of March 31, 2016, and the related statements of operations for the year then ended, the statements of changes in net assets for each of the years or periods indicated therein, the financial highlights of the Touchstone Growth Opportunities Fund, Touchstone Mid Cap Growth Fund, Touchstone Sands Capital Emerging Markets Growth Fund and Touchstone Sustainability and Impact Equity Fund for each of the years or periods indicated therein, and the financial highlights of the Touchstone Flexible Income Fund, Touchstone Focused Fund, Touchstone International Value Fund and Touchstone Small Cap Growth Fund for each of the three years in the period ended March 31, 2016. These financial statements and financial highlights are the responsibility of the Funds’ management. Our responsibility is to express an opinion on these financial statements and financial highlights based on our audits. The financial highlights for each of the periods presented through March 31, 2013 of Touchstone Flexible Income Fund, Touchstone Focused Fund, Touchstone International Value Fund and Touchstone Small Cap Growth Fund were audited by other auditors, whose report dated May 23, 2013 expressed an unqualified opinion on those financial highlights.
We conducted our audits in accordance with the standards of the Public Company Accounting Oversight Board (United States). Those standards require that we plan and perform the audit to obtain reasonable assurance about whether the financial statements and financial highlights are free of material misstatement. We were not engaged to perform an audit of the Funds’ internal control over financial reporting. Our audits included consideration of internal control over financial reporting as a basis for designing audit procedures that are appropriate in the circumstances, but not for the purpose of expressing an opinion on the effectiveness of the Funds’ internal control over financial reporting. Accordingly, we express no such opinion. An audit also includes examining, on a test basis, evidence supporting the amounts and disclosures in the financial statements and financial highlights, assessing the accounting principles used and significant estimates made by management, and evaluating the overall financial statement presentation. Our procedures included confirmation of securities owned as of March 31, 2016, by correspondence with the custodian, transfer agent, and brokers or by other appropriate auditing procedures where replies from brokers were not received. We believe that our audits provide a reasonable basis for our opinion.
In our opinion, the financial statements and financial highlights referred to above present fairly, in all material respects, the financial position of Touchstone Flexible Income Fund, Touchstone Focused Fund, Touchstone Growth Opportunities Fund, Touchstone International Value Fund, Touchstone Mid Cap Growth Fund, Touchstone Sands Capital Emerging Markets Growth Fund, Touchstone Small Cap Growth Fund and Touchstone Sustainability and Impact Equity Fund (eight of the funds constituting Touchstone Strategic Trust) at March 31, 2016, the results of their operations for the year then ended, the changes in their net assets for each of the years or periods indicated therein, the financial highlights of the Touchstone Growth Opportunities Fund, Touchstone Mid Cap Growth Fund, Touchstone Sands Capital Emerging Markets Growth Fund and Touchstone Sustainability and Impact Equity Fund for each of the years or periods indicated therein, and the financial highlights of the
Report of Independent Registered Public Accounting Firm (Continued)
Touchstone Flexible Income Fund, Touchstone Focused Fund, Touchstone International Value Fund and Touchstone Small Cap Growth Fund for each of the three years in the period ended March 31, 2016, in conformity with U.S. generally accepted accounting principles.

Cincinnati, Ohio
May 24, 2016
Other Items (Unaudited)
Qualified Dividend Income
Under the Jobs and Growth Tax Relief Reconciliation Act of 2003 (the “Act”), the following percentages of ordinary dividends paid during the fiscal year ended March 31, 2016 are designated as “qualified dividend income,” as defined in the Act, and are subject to reduced tax rates in 2015. The Funds intend to pass through the maximum allowable percentage for Form 1099Div.
| Flexible Income Fund | | | 27.81 | % |
| Focused Fund | | | 100.00 | % |
| Growth Opportunities Fund | | | 13.92 | % |
| International Value Fund | | | 72.64 | % |
| Mid Cap Growth Fund | | | 64.90 | % |
| Small Cap Growth Fund | | | 100.00 | % |
| Sustainability and Impact Equity Fund | | | 8.13 | % |
Dividend Received Deduction
For corporate shareholders, the following ordinary distributions paid during the current fiscal year ended March 31, 2016 qualify for the corporate dividends received deduction. The Funds intend to pass through the maximum allowable percentage.
| Flexible Income Fund | | | 12.78 | % |
| Focused Fund | | | 100.00 | % |
| Growth Opportunities Fund | | | 12.34 | % |
| International Value Fund | | | 1.27 | % |
| Mid Cap Growth Fund | | | 60.03 | % |
| Small Cap Growth Fund | | | 92.89 | % |
| Sustainability and Impact Equity Fund | | | 4.50 | % |
For the fiscal year ended March 31, 2016, the Funds designated long-term capital gains as follows:
| Focused Fund | | $ | 27,791,755 | |
| Growth Opportunities Fund | | | 23,776,825 | |
| Mid Cap Growth Fund | | | 61,652,123 | |
| Small Cap Growth Fund | | | 3,899,710 | �� |
| Sustainability and Impact Equity Fund | | | 155,439,665 | |
Foreign Tax Income & Foreign Tax Credit
International Value Fund intends to pass through a foreign tax credit to its shareholders. For the fiscal year ended March 31, 2016, the total amount of foreign source income was $3,311,837 or $0.56 per share. The total amount of foreign taxes to be paid was $116,127 or $0.02 per share. Shareholders’ allocable share of the foreign tax credit will be reported on Form 1099Div.
Proxy Voting Guidelines
The Sub-Advisors are responsible for exercising the voting rights associated with the securities purchased and held by the Funds. A description of the policies and procedures that the Sub-Advisors use in fulfilling this responsibility is available as an appendix to the most recent Statement of Additional Information, which can be obtained without charge by calling toll free 1.800.543.0407 or by visiting the Touchstone website at TouchstoneInvestments.com or on the Securities and Exchange Commission’s (the “Commission”) website sec.gov. Information regarding how those proxies were voted during the most recent twelve-month period ended June 30 is also available without charge by calling toll free 1.800.543.0407 or on the Commission’s website at sec.gov.
Other Items (Unaudited) (Continued)
Quarterly Portfolio Disclosure
The Trust files a complete listing of portfolio holdings for each Fund as of the end of the first and third quarters of each fiscal year on Form N-Q. The complete listing (i) is available on the Commission’s website; (ii) may be reviewed and copied at the Commission’s Public Reference Room in Washington, DC; or (iii) will be made available to shareholders upon request by calling 1.800.543.0407. Information on the operation of the Public Reference Room may be obtained by calling 1-800-SEC-0330.
Schedule of Shareholder Expenses
As a shareholder of the Funds, you incur two types of costs: (1) transaction costs, including reinvested dividends or other distributions; and (2) ongoing costs, including investment advisory fees; distribution (12b-1) fees; and other Fund expenses. This example is intended to help you understand your ongoing costs (in dollars) of investing in the Funds and to compare these costs with the ongoing costs of investing in other mutual funds. The example is based on an investment of $1,000 invested at the beginning of the period and held for the entire period (October 1, 2015 through March 31, 2016).
Actual Expenses
The first line of the table below for each share class of a Fund provides information about actual account values and actual expenses. You may use the information in this line, together with the amount you invested, to estimate the expenses that you paid over the period. Simply divide your account value by $1,000 (for example, an $8,600 account value divided by $1,000 = 8.6), then multiply the result by the number in the first line under the heading entitled “Expenses Paid During the Six Months Ended March 31, 2016” to estimate the expenses you paid on your account during this period.
Hypothetical Example for Comparison Purposes
The second line of the table below for each share class of a Fund provides information about hypothetical account values and hypothetical expenses based on the Funds’ actual expense ratio and an assumed rate of return of 5% per year before expenses, which is not the Funds’ actual return. The hypothetical account values and expenses may not be used to estimate the actual ending account balance or expenses you paid for the period. You may use this information to compare the ongoing costs of investing in the Funds and other funds. To do so, compare this 5% hypothetical example with the 5% hypothetical examples that appear in the shareholder reports of the other funds.
Please note that the expenses shown in the table are meant to highlight your ongoing costs only and do not reflect any transactional costs, such as sales charges (loads), redemption fees, or exchange fees. Therefore, the second line for each share class of a Fund in the table below is useful in comparing ongoing costs only, and will not help you determine the relative total costs of owning different funds. In addition, if these transactional costs were included, your costs would have been higher.
| | | | | | | | | | | | | | Expenses | |
| | | | | Net Expense | | | Beginning | | | Ending | | | Paid During | |
| | | | | Ratio | | | Account | | | Account | | | the Six Months | |
| | | | | Annualized | | | Value | | | Value | | | Ended | |
| | | | | March 31, | | | October 1, | | | March 31, | | | March 31, | |
| | | | | 2016 | | | 2015 | | | 2016 | | | 2016* | |
| Touchstone Flexible Income Fund | | | | | | | | | | | | | | | | | | |
| Class A | | Actual | | | 1.09 | % | | $ | 1,000.00 | | | $ | 1,020.80 | | | $ | 5.51 | |
| Class A | | Hypothetical | | | 1.09 | % | | $ | 1,000.00 | | | $ | 1,019.55 | | | $ | 5.50 | |
| | | | | | | | | | | | | | | | | | | |
| Class C | | Actual | | | 1.84 | % | | $ | 1,000.00 | | | $ | 1,016.40 | | | $ | 9.28 | |
| Class C | | Hypothetical | | | 1.84 | % | | $ | 1,000.00 | | | $ | 1,015.80 | | | $ | 9.27 | |
| | | | | | | | | | | | | | | | | | | |
| Class Y | | Actual | | | 0.84 | % | | $ | 1,000.00 | | | $ | 1,022.00 | | | $ | 4.25 | |
| Class Y | | Hypothetical | | | 0.84 | % | | $ | 1,000.00 | | | $ | 1,020.80 | | | $ | 4.24 | |
| | | | | | | | | | | | | | | | | | | |
| Institutional Class | | Actual | | | 0.74 | % | | $ | 1,000.00 | | | $ | 1,022.50 | | | $ | 3.74 | |
| Institutional Class | | Hypothetical | | | 0.74 | % | | $ | 1,000.00 | | | $ | 1,021.30 | | | $ | 3.74 | |
Other Items (Unaudited) (Continued)
Schedule of Shareholder Expenses (continued)
| | | | | | | | | | | | | | Expenses | |
| | | | | Net Expense | | | Beginning | | | Ending | | | Paid During | |
| | | | | Ratio | | | Account | | | Account | | | the Six Months | |
| | | | | Annualized | | | Value | | | Value | | | Ended | |
| | | | | March 31, | | | October 1, | | | March 31, | | | March 31, | |
| | | | | 2016 | | | 2015 | | | 2016 | | | 2016* | |
| Touchstone Focused Fund | | | | | | | | | | | | | | | | | | |
| Class A | | Actual | | | 1.20 | % | | $ | 1,000.00 | | | $ | 1,071.80 | | | $ | 6.22 | |
| Class A | | Hypothetical | | | 1.20 | % | | $ | 1,000.00 | | | $ | 1,019.00 | | | $ | 6.06 | |
| | | | | | | | | | | | | | | | | | | |
| Class C | | Actual | | | 1.95 | % | | $ | 1,000.00 | | | $ | 1,067.90 | | | $ | 10.08 | |
| Class C | | Hypothetical | | | 1.95 | % | | $ | 1,000.00 | | | $ | 1,015.25 | | | $ | 9.82 | |
| | | | | | | | | | | | | | | | | | | |
| Class Y | | Actual | | | 0.93 | % | | $ | 1,000.00 | | | $ | 1,073.20 | | | $ | 4.82 | |
| Class Y | | Hypothetical | | | 0.93 | % | | $ | 1,000.00 | | | $ | 1,020.35 | | | $ | 4.70 | |
| | | | | | | | | | | | | | | | | | | |
| Institutional Class | | Actual | | | 0.83 | % | | $ | 1,000.00 | | | $ | 1,074.10 | | | $ | 4.30 | |
| Institutional Class | | Hypothetical | | | 0.83 | % | | $ | 1,000.00 | | | $ | 1,020.85 | | | $ | 4.19 | |
| | | | | | | | | | | | | | | | | | | |
| Touchstone Growth Opportunities Fund | | | | | | | | | | | | | | | |
| Class A | | Actual | | | 1.24 | % | | $ | 1,000.00 | | | $ | 1,023.80 | | | $ | 6.27 | |
| Class A | | Hypothetical | | | 1.24 | % | | $ | 1,000.00 | | | $ | 1,018.80 | | | $ | 6.26 | |
| | | | | | | | | | | | | | | | | | | |
| Class C | | Actual | | | 1.99 | % | | $ | 1,000.00 | | | $ | 1,020.40 | | | $ | 10.05 | |
| Class C | | Hypothetical | | | 1.99 | % | | $ | 1,000.00 | | | $ | 1,015.05 | | | $ | 10.02 | |
| | | | | | | | | | | | | | | | | | | |
| Class Y | | Actual | | | 0.99 | % | | $ | 1,000.00 | | | $ | 1,025.50 | | | $ | 5.01 | |
| Class Y | | Hypothetical | | | 0.99 | % | | $ | 1,000.00 | | | $ | 1,020.05 | | | $ | 5.00 | |
| | | | | | | | | | | | | | | | | | | |
| Institutional Class | | Actual | | | 0.89 | % | | $ | 1,000.00 | | | $ | 1,025.70 | | | $ | 4.51 | |
| Institutional Class | | Hypothetical | | | 0.89 | % | | $ | 1,000.00 | | | $ | 1,020.55 | | | $ | 4.50 | |
| | | | | | | | | | | | | | | | | | | |
| Touchstone International Value Fund | | | | | | | | | | | | | | | | | | |
| Class A | | Actual | | | 1.34 | % | | $ | 1,000.00 | | | $ | 1,004.20 | | | $ | 6.71 | |
| Class A | | Hypothetical | | | 1.34 | % | | $ | 1,000.00 | | | $ | 1,018.30 | | | $ | 6.76 | |
| | | | | | | | | | | | | | | | | | | |
| Class C | | Actual | | | 2.09 | % | | $ | 1,000.00 | | | $ | 1,000.90 | | | $ | 10.45 | |
| Class C | | Hypothetical | | | 2.09 | % | | $ | 1,000.00 | | | $ | 1,014.55 | | | $ | 10.53 | |
| | | | | | | | | | | | | | | | | | | |
| Class Y | | Actual | | | 1.09 | % | | $ | 1,000.00 | | | $ | 1,005.10 | | | $ | 5.46 | |
| Class Y | | Hypothetical | | | 1.09 | % | | $ | 1,000.00 | | | $ | 1,019.55 | | | $ | 5.50 | |
| | | | | | | | | | | | | | | | | | | |
| Institutional Class | | Actual | | | 0.99 | % | | $ | 1,000.00 | | | $ | 1,005.30 | | | $ | 4.96 | |
| Institutional Class | | Hypothetical | | | 0.99 | % | | $ | 1,000.00 | | | $ | 1,020.55 | | | $ | 5.00 | |
| | | | | | | | | | | | | | | | | | | |
| Touchstone Mid Cap Growth Fund | | | | | | | | | | | | | | | | | | |
| Class A | | Actual | | | 1.31 | % | | $ | 1,000.00 | | | $ | 1,058.20 | | | $ | 6.74 | |
| Class A | | Hypothetical | | | 1.31 | % | | $ | 1,000.00 | | | $ | 1,018.45 | | | $ | 6.61 | |
| | | | | | | | | | | | | | | | | | | |
| Class B | | Actual | | | 2.14 | % | | $ | 1,000.00 | | | $ | 1,054.20 | | | $ | 10.99 | |
| Class B | | Hypothetical | | | 2.14 | % | | $ | 1,000.00 | | | $ | 1,014.30 | | | $ | 10.78 | |
| | | | | | | | | | | | | | | | | | | |
| Class C | | Actual | | | 2.06 | % | | $ | 1,000.00 | | | $ | 1,054.50 | | | $ | 10.58 | |
| Class C | | Hypothetical | | | 2.06 | % | | $ | 1,000.00 | | | $ | 1,014.70 | | | $ | 10.38 | |
| | | | | | | | | | | | | | | | | | | |
| Class Y | | Actual | | | 1.05 | % | | $ | 1,000.00 | | | $ | 1,060.10 | | | $ | 5.41 | |
| Class Y | | Hypothetical | | | 1.05 | % | | $ | 1,000.00 | | | $ | 1,019.75 | | | $ | 5.30 | |
| | | | | | | | | | | | | | | | | | | |
| Institutional Class | | Actual | | | 0.95 | % | | $ | 1,000.00 | | | $ | 1,060.30 | | | $ | 4.89 | |
| Institutional Class | | Hypothetical | | | 0.95 | % | | $ | 1,000.00 | | | $ | 1,020.25 | | | $ | 4.80 | |
Other Items (Unaudited) (Continued)
Schedule of Shareholder Expenses (continued)
| | | | | | | | | | | | | | Expenses | |
| | | | | Net Expense | | | Beginning | | | Ending | | | Paid During | |
| | | | | Ratio | | | Account | | | Account | | | the Six Months | |
| | | | | Annualized | | | Value | | | Value | | | Ended | |
| | | | | March 31, | | | October 1, | | | March 31, | | | March 31, | |
| | | | | 2016 | | | 2015 | | | 2016 | | | 2016* | |
| Touchstone Sands Capital Emerging Markets Growth Fund | | | | | | | | | | | |
| Class Y | | Actual | | | 1.49 | % | | $ | 1,000.00 | | | $ | 1,069.40 | | | $ | 7.71 | |
| Class Y | | Hypothetical | | | 1.49 | % | | $ | 1,000.00 | | | $ | 1,017.55 | | | $ | 7.52 | |
| | | | | | | | | | | | | | | | | | | |
| Class I | | Actual | | | 1.39 | % | | $ | 1,000.00 | | | $ | 1,070.50 | | | $ | 7.19 | |
| Class I | | Hypothetical | | | 1.39 | % | | $ | 1,000.00 | | | $ | 1,018.05 | | | $ | 7.01 | |
| | | | | | | | | | | | | | | | | | | |
| Touchstone Small Cap Growth Fund | | | | | | | | | | | | | | | | | | |
| Class A | | Actual | | | 1.44 | % | | $ | 1,000.00 | | | $ | 964.40 | | | $ | 7.07 | |
| Class A | | Hypothetical | | | 1.44 | % | | $ | 1,000.00 | | | $ | 1,017.80 | | | $ | 7.26 | |
| | | | | | | | | | | | | | | | | | | |
| Class C | | Actual | | | 2.19 | % | | $ | 1,000.00 | | | $ | 962.00 | | | $ | 10.74 | |
| Class C | | Hypothetical | | | 2.19 | % | | $ | 1,000.00 | | | $ | 1,014.05 | | | $ | 11.03 | |
| | | | | | | | | | | | | | | | | | | |
| Class Y | | Actual | | | 1.19 | % | | $ | 1,000.00 | | | $ | 966.30 | | | $ | 5.85 | |
| Class Y | | Hypothetical | | | 1.19 | % | | $ | 1,000.00 | | | $ | 1,019.05 | | | $ | 6.01 | |
| | | | | | | | | | | | | | | | | | | |
| Institutional Class | | Actual | | | 1.04 | % | | $ | 1,000.00 | | | $ | 966.40 | | | $ | 5.11 | |
| Institutional Class | | Hypothetical | | | 1.04 | % | | $ | 1,000.00 | | | $ | 1,019.80 | | | $ | 5.25 | |
| | | | | | | | | | | | | | | | | | | |
| Touchstone Sustainability and Impact Equity Fund | | | | | | | | | | | | | | | | |
| Class A | | Actual | | | 1.24 | % | | $ | 1,000.00 | | | $ | 1,049.20 | | | $ | 6.35 | |
| Class A | | Hypothetical | | | 1.24 | % | | $ | 1,000.00 | | | $ | 1,018.80 | | | $ | 6.26 | |
| | | | | | | | | | | | | | | | | | | |
| Class B | | Actual | | | 1.99 | % | | $ | 1,000.00 | | | $ | 1,045.30 | | | $ | 10.18 | |
| Class B | | Hypothetical | | | 1.99 | % | | $ | 1,000.00 | | | $ | 1,015.05 | | | $ | 10.02 | |
| | | | | | | | | | | | | | | | | | | |
| Class C | | Actual | | | 1.99 | % | | $ | 1,000.00 | | | $ | 1,045.10 | | | $ | 10.17 | |
| Class C | | Hypothetical | | | 1.99 | % | | $ | 1,000.00 | | | $ | 1,015.05 | | | $ | 10.02 | |
| | | | | | | | | | | | | | | | | | | |
| Class Y | | Actual | | | 0.99 | % | | $ | 1,000.00 | | | $ | 1,050.10 | | | $ | 5.07 | |
| Class Y | | Hypothetical | | | 0.99 | % | | $ | 1,000.00 | | | $ | 1,020.05 | | | $ | 5.00 | |
| | | | | | | | | | | | | | | | | | | |
| Institutional Class | | Actual | | | 0.89 | % | | $ | 1,000.00 | | | $ | 1,050.60 | | | $ | 4.56 | |
| Institutional Class | | Hypothetical | | | 0.89 | % | | $ | 1,000.00 | | | $ | 1,020.55 | | | $ | 4.50 | |
* Expenses are equal to the Fund’s annualized expense ratio, multiplied by the average account value over the period, multiplied by 183/366 (to reflect one-half year period).
Other Items (Unaudited) (Continued)
Advisory and Sub-Advisory Agreement Approval Disclosure
At a meeting held on November 20, 2015, the Board of Trustees (the “Board” or “Trustees”) of the Touchstone Strategic Trust (the “Trust”), and by a separate vote, the Independent Trustees of the Trust, approved the continuance of the Investment Advisory Agreement between the Trust and the Advisor with respect to each Fund of the Trust, and the continuance of each Sub-Advisory Agreement between the Advisor and each Fund’s respective Sub-Advisor.
In determining whether to approve the continuation of the Investment Advisory Agreement and the Sub-Advisory Agreements, the Advisor furnished information necessary for a majority of the Independent Trustees to make the determination that the continuance of the Investment Advisory Agreement and each Sub-Advisory Agreement was in the best interests of the respective Funds and their shareholders. The information provided to the Board included: (1) industry data comparing advisory fees and expense ratios of comparable investment companies; (2) comparative performance information; (3) the Advisor’s and its affiliates’ revenues and costs of providing services to the Funds; and (4) information about the Advisor’s and Sub-Advisors’ personnel. Prior to voting, the Independent Trustees reviewed the proposed continuance of the Investment Advisory Agreement and the Sub-Advisory Agreements with management and with experienced independent legal counsel and received materials from such counsel discussing the legal standards for their consideration of the proposed continuation of the Investment Advisory Agreement and each Sub-Advisory Agreement. The Independent Trustees also reviewed the proposed continuation of the Investment Advisory Agreement and each Sub-Advisory Agreement with independent legal counsel in private sessions at which no representatives of management were present.
In approving the Funds’ Investment Advisory Agreement, the Board considered various factors, among them: (1) the nature, extent and quality of services provided to the Funds, including the personnel providing such services; (2) the Advisor’s compensation and profitability; (3) a comparison of fees and performance with other advisors; (4) economies of scale; and (5) the terms of the Investment Advisory Agreement. The Board’s analysis of these factors is set forth below. The Independent Trustees were advised by independent legal counsel throughout the process.
Nature, Extent and Quality of Advisor Services. The Board considered the level and depth of knowledge of the Advisor, including the professional experience and qualifications of senior personnel. In evaluating the quality of services provided by the Advisor, the Board took into account its familiarity with the Advisor’s senior management through Board meetings, discussions and reports during the preceding year. The Board also took into account the Advisor’s compliance policies and procedures. The quality of administrative and other services, including the Advisor’s role in coordinating the activities of the Funds’ other service providers, was also considered. The Board also considered the Advisor’s relationship with its affiliates and the resources available to them, as well as any potential conflicts of interest.
The Board discussed the Advisor’s effectiveness in monitoring the performance of each Sub-Advisor, including the Sub-Advisor that was an affiliate of the Advisor, and the Advisor’s timeliness in responding to performance issues. The Board considered the Advisor’s process for monitoring each of the Sub-Advisors, which includes an examination of both qualitative and quantitative elements of the Sub-Advisor’s organization, personnel, procedures, investment discipline, infrastructure and performance. The Board considered that the Advisor conducts regular on-site compliance visits with each Sub-Advisor, during which the Advisor examines a wide variety of factors, such as the financial condition of the Sub-Advisor, the quality of the Sub-Advisor’s systems, the effectiveness of the Sub-Advisor’s disaster recovery programs, trade allocation and execution procedures, compliance with the Sub-Advisor’s policies and procedures, results of regulatory examinations and any other factors that might affect the quality of services that the Sub-Advisor provides to the applicable Fund(s). The Board noted that the Advisor’s compliance monitoring processes also include quarterly reviews of compliance
Other Items (Unaudited) (Continued)
reports, and that any significant issues arising from such reports and the Advisor’s compliance visits to the Sub-Advisors are reported to the Board.
The Trustees concluded that they were satisfied with the nature, extent and quality of services provided to each Fund by the Advisor under the Investment Advisory Agreement.
Advisor’s Compensation and Profitability. The Board took into consideration the financial condition and profitability of the Advisor and its affiliates (including the Sub-Advisor to one of the Funds) and the direct and indirect benefits derived by the Advisor and its affiliates from the Advisor’s relationship with the Funds. The information considered by the Board included operating profit margin information for the Advisor’s business as a whole. The Board noted that the Advisor had waived a portion of advisory fees and administrative fees and/or reimbursed expenses in order to limit each Fund’s net operating expenses. The Board also noted that the Advisor pays the Sub-Advisors’ sub-advisory fees out of the advisory fees the Advisor receives from the Funds. The Board reviewed the profitability of the Advisor’s relationship with the Funds both before and after tax expenses, and also considered whether the Advisor has the financial wherewithal to continue to provide services to the Funds, noting the ongoing commitment of the Advisor’s parent company with respect to providing support and resources as needed. The Board considered that the Funds’ distributor, an affiliate of the Advisor, receives Rule 12b-1 distribution fees from the Funds and receives a portion of the sales charges on sales or redemptions of certain classes of shares. The Board also noted that the Advisor derives benefits to its reputation and other benefits from its association with the Funds.
The Board recognized that the Advisor should be entitled to earn a reasonable level of profits in exchange for the level of services it provides to each Fund and the entrepreneurial risk that it assumes as Advisor. Based upon their review, the Trustees concluded that the Advisor’s and its affiliates’ level of profitability, if any, from their relationship with each Fund was reasonable and not excessive.
Expenses and Performance. The Board compared the respective advisory fees and total expense ratios for each of the Funds with various comparative data, including the median and average advisory fees and total expense ratios of each Fund’s respective peer group. The Board also considered, among other data, the Funds’ respective performance results during the six-month, twelve-month, and thirty-six month periods ended June 30, 2015, as applicable, and noted that the Board reviews on a quarterly basis detailed information about each Fund’s performance results, portfolio composition and investment strategies. The Board also took into account current market conditions and their effect on the Funds’ performance.
The Board also considered the effect of each Fund’s growth and size on its performance and expenses. The Board noted that the Advisor had waived a portion of the fees and/or reimbursed expenses of each Fund in order to reduce the Funds’ respective operating expenses to targeted levels. The Board noted that the sub-advisory fees under the Sub-Advisory Agreement with respect to each Fund were paid by the Advisor out of the advisory fees it receives from the Fund and considered the impact of such sub-advisory fees on the profitability of the Advisor. In reviewing the respective expense ratios and performance of each of the Funds, the Board also took into account the nature, extent and quality of the services provided to the Funds by the Advisor and its affiliates.
The Board considered, among other data, the specific factors and related conclusions set forth below with respect to each Fund:
Touchstone Flexible Income Fund. The Fund’s advisory fee and total expense ratio (net of applicable expense waivers and reimbursements) were above the median and at the median, respectively, of its peer group. The Board noted that the Advisor was waiving a portion of the Fund’s fees and/or reimbursing a portion of the Fund’s operating expenses. The Fund’s performance for the six- and thirty-six month periods ended June 30, 2015 was in the 1st quintile of its peer group. The Fund’s performance for the twelve-month period ended
Other Items (Unaudited) (Continued)
June 30, 2015 was in the 2nd quintile of its peer group. Based upon their review, the Trustees concluded that the overall performance of the Fund was satisfactory relative to the performance of funds with similar investment objectives and relevant indices, and that the advisory fee was reasonable in light of the services received by the Fund from the Advisor and the other factors considered.
Touchstone Focused Fund. The Fund’s advisory fee and total expense ratio (net of applicable expense waivers and reimbursements) were below the median and above the median, respectively, of its peer group. The Board noted that the Advisor was waiving a portion of the Fund’s fees and/or reimbursing a portion of the Fund’s operating expenses. The Fund’s performance for the six-, twelve-, and thirty-six month periods ended June 30, 2015 was in the 1st quintile of its peer group. Based upon their review, the Trustees concluded that the overall performance of the Fund was satisfactory relative to the performance of funds with similar investment objectives and relevant indices, and that the advisory fee was reasonable in light of the services received by the Fund from the Advisor and the other factors considered.
Touchstone Growth Opportunities Fund. The Fund’s advisory fee and total expense ratio (net of applicable expense waivers and reimbursements) were above the median of its peer group. The Board noted that the Advisor was waiving a portion of the Fund’s fees and/or reimbursing a portion of the Fund’s operating expenses. The Fund’s performance for the six-month period ended June 30, 2015 was in the 5th quintile of its peer group. The Fund’s performance for the twelve-month period ended June 30, 2015 was in the 4th quintile of its peer group, and the Fund’s performance for the thirty-six month period ended June 30, 2015 was in the 1st quintile of its peer group. The Board considered management’s discussion of the Portfolio’s recent performance and management’s continued monitoring of Fund performance. Based upon their review, the Trustees concluded that the overall performance of the Fund was satisfactory relative to the performance of funds with similar investment objectives and relevant indices, and that the advisory fee was reasonable in light of the services received by the Fund from the Advisor and the other factors considered.
Touchstone International Value Fund. The Fund’s advisory fee and total expense ratio (net of applicable expense waivers and reimbursements) were above the median and below the median, respectively, of its peer group. The Board noted that the Advisor was waiving a portion of the Fund’s fees and/or reimbursing a portion of the Fund’s operating expenses. The Fund’s performance for the six-month period ended June 30, 2015 was in the 5th quintile of its peer group. The Fund’s performance for the twelve- and thirty-six-month periods ended June 30, 2015 was in the 4th quintile of its peer group. The Board considered management’s discussion of the Portfolio’s performance and management’s continued monitoring of Fund performance. Based upon their review, the Trustees concluded that appropriate action was being taken in regard to the Fund’s performance, and that the advisory fee was reasonable in light of the services received by the Fund from the Advisor and the other factors considered.
Touchstone Mid Cap Growth Fund The Fund’s advisory fee and total expense ratio (net of applicable expense waivers and reimbursements) were below the median and above the median, respectively, of its peer group. The Board noted that the Advisor was waiving a portion of the Fund’s fees and/or reimbursing a portion of the Fund’s operating expenses. The Fund’s performance for the six-month period ended June 30, 2015 was in the 4th quintile of its peer group. The Fund’s performance for the twelve-month period ended June 30, 2015 was in the 2nd quintile of its peer group, and the Fund’s performance for the thirty-six month period ended June 30, 2015 was in the 1st quintile of its peer group. Based upon their review, the Trustees concluded that the overall performance of the Fund was satisfactory relative to the performance of funds with similar investment objectives and relevant indices, and that the advisory fee was reasonable in light of the services received by the Fund from the Advisor and the other factors considered.
Touchstone Sands Capital Emerging Markets Growth Fund. The Fund’s advisory fee and total expense ratio (net of applicable expense waivers and reimbursements) were above the median of its peer group. The Board
Other Items (Unaudited) (Continued)
noted that the Advisor was waiving a portion of the Fund’s fees and/or reimbursing a portion of the Fund’s operating expenses. The Fund’s performance for the six-month period ended June 30, 2015 was in the 2nd quintile of its peer group. The Fund’s performance for the twelve-month period ended June 30, 2015 was in the 1st quintile of its peer group. Based upon their review, the Trustees concluded that the overall performance of the Fund was satisfactory relative to the performance of funds with similar investment objectives and relevant indices, and that the advisory fee was reasonable in light of the services received by the Fund from the Advisor and the other factors considered.
Touchstone Small Cap Growth Fund. The Fund’s advisory fee and total expense ratio (net of applicable expense waivers and reimbursements) were above the median of its peer group. The Board noted that the Advisor was waiving a portion of the Fund’s fees and/or reimbursing a portion of the Fund’s operating expenses. The Fund’s performance for the six- and twelve-month periods ended June 30, 2015 was in the 1st quintile of its peer group. The Fund’s performance for the thirty-six-month period ended June 30, 2015 was in the 2nd quintile of its peer group. Based upon their review, the Trustees concluded that the overall performance of the Fund was satisfactory relative to the performance of funds with similar investment objectives and relevant indices, and that the advisory fee was reasonable in light of the services received by the Fund from the Advisor and the other factors considered.
Touchstone Sustainability and Impact Equity Fund. The Fund’s advisory fee and total expense ratio (net of applicable expense waivers and reimbursements) were below the median of its peer group. The Board noted that the Advisor was waiving a portion of the Fund’s fees and/or reimbursing a portion of the Fund’s operating expenses. The Fund’s performance for the six-month period ended June 30, 2015 was in the 2nd quintile of its peer group. The Fund’s performance for the twelve-month period ended June 30, 2015 was in the 1st quintile of its peer group, and the Fund’s performance for the thirty-six month period ended June 30, 2015 was in the 3rd quintile of its peer group. Based upon their review, the Trustees concluded that the overall performance of the Fund was satisfactory relative to the performance of funds with similar investment objectives and relevant indices, and that the advisory fee was reasonable in light of the services received by the Fund from the Advisor and the other factors considered.
Economies of Scale. The Board considered the effect of each Fund’s current size and potential growth on its performance and expenses. The Board took into account management’s discussion of the Funds’ advisory fee structure. The Board considered the effective advisory fees under the Investment Advisory Agreement as a percentage of assets at different asset levels and possible economies of scale that might be realized if the assets of each Fund increase. The Board noted that the advisory fee schedule for each Fund, except the Touchstone International Value Fund, contains breakpoints that would reduce the respective advisory fee rate on assets above specified levels as the applicable Fund’s assets increased and considered the necessity of adding breakpoints with respect to the Funds that did not currently have such breakpoints in their advisory fee schedules. The Board determined that adding breakpoints at specified levels to the advisory fee schedule of the Touchstone International Value Fund would not be appropriate at this time. The Board noted that if a Fund’s assets increase over time, the Fund might realize other economies of scale if assets increase proportionally more than certain other expenses. The Board also considered the fact that, under the Investment Advisory Agreement, the advisory fee payable to the Advisor by a Fund was reduced by the total sub-advisory fee paid by the Advisor to the Fund’s Sub-Advisor.
Conclusion. In considering the renewal of the Funds’ Investment Advisory Agreement, the Board, including the Independent Trustees, did not identify any single factor as controlling, and each Trustee may have attributed different weights to the various factors. The Trustees evaluated all information available to them on a Fund-by-Fund basis, and their determinations were made separately with respect to each Fund. The Board reached the following conclusions regarding the Funds’ Investment Advisory Agreement with the Advisor, among others: (a) the Advisor demonstrated that it possesses the capability and resources to perform the duties required of it under
Other Items (Unaudited) (Continued)
the Investment Advisory Agreement; (b) the Advisor maintains an appropriate compliance program; (c) the overall performance of each Fund is satisfactory relative to the performance of funds with similar investment objectives and relevant indices or, as discussed above, is being addressed; and (d) each Fund’s advisory fee is reasonable in light of the services received by the Fund from the Advisor and other factors considered. Based on their conclusions, the Trustees determined with respect to each Fund that continuation of the Investment Advisory Agreement was in the best interests of the Fund and its shareholders.
In approving the Funds’ respective Sub-Advisory Agreements, the Board considered various factors with respect to each Fund and the applicable Sub-Advisory Agreement, among them: (1) the nature, extent and quality of services provided to the Fund, including the personnel providing such services; (2) the Sub-Advisor’s compensation; (3) a comparison of the sub-advisory fee and performance with other advisors; and (4) the terms of the Sub-Advisory Agreement. The Board’s analysis of these factors is set forth below. The Independent Trustees were advised by independent legal counsel throughout the process.
Nature, Extent and Quality of Services Provided; Investment Personnel. The Board considered information provided by the Advisor regarding the services provided by each Sub-Advisor, including information presented periodically throughout the previous year. The Board noted the affiliation of one of the Sub-Advisors with the Advisor, noting any potential conflicts of interest. The Board also noted that, on a periodic basis, the Board meets with portfolio managers of the Sub-Advisors to discuss their respective performance and investment processes and strategies. The Board considered each Sub-Advisor’s level of knowledge and investment style. The Board reviewed the experience and credentials of the applicable investment personnel who are responsible for managing the investment of portfolio securities with respect to the Funds. The Board also noted each Sub-Advisor’s brokerage practices.
Sub-Advisor’s Compensation, Profitability and Economies of Scale. The Board also took into consideration the financial condition of each Sub-Advisor and any indirect benefits derived by each Sub-Advisor and its affiliates from the Sub-Advisor’s relationship with the Funds. In considering the profitability to each Sub-Advisor of its relationship with the Funds, the Board noted the undertakings of the Advisor to maintain expense limitations for the Funds and also noted that the sub-advisory fees under the Sub-Advisory Agreements were paid by the Advisor out of the advisory fees that it receives under the Investment Advisory Agreement and in addition, with respect to the unaffiliated Sub-Advisors, are negotiated at arm’s length. As a consequence, the profitability to each Sub-Advisor of its relationship with a Fund was not a substantial factor in the Board’s deliberations. For similar reasons, the Board did not consider the potential economies of scale in each Sub-Advisor’s management of the applicable Fund to be a substantial factor in its consideration, although the Board noted that the sub-advisory fee schedule for all but one of the Funds contained breakpoints that would reduce the sub-advisory fee rate on assets above specified levels as the applicable Fund’s assets increased.
Sub-Advisory Fees and Fund Performance. The Board considered that each Fund pays an advisory fee to the Advisor and that the Advisor pays the sub-advisory fee to the Sub-Advisor out of the advisory fee it receives from the respective Fund. The Board also compared the sub-advisory fees paid by the Advisor to fees charged by the Sub-Advisor to manage comparable institutional separate accounts. The Board considered the amount retained by the Advisor and the sub-advisory fee paid to each Sub-Advisor with respect to the various services provided by the Advisor and the Sub-Advisor. The Board also noted that the Advisor negotiated the sub-advisory fee with each of the unaffiliated Sub-Advisors at arm’s length. The Board reviewed the sub-advisory fee for each Fund in relation to various comparative data, including the median and average sub-advisory fees of each Fund’s peer group, and considered the following information:
Touchstone Flexible Income Fund. The Fund’s sub-advisory fee was above the median of its peer group. Based upon their review, the Trustees concluded that the sub-advisory fee was reasonable in light of the services received by the Fund from the Sub-Advisor and the other factors considered.
Other Items (Unaudited) (Continued)
Touchstone Focused Fund. The Fund’s sub-advisory fee was at the median of its peer group. Based upon their review, the Trustees concluded that the sub-advisory fee was reasonable in light of the services received by the Fund from the Sub-Advisor and the other factors considered.
Touchstone Growth Opportunities Fund. The Fund’s sub-advisory fee was above the median of its peer group. Based upon their review, the Trustees concluded that the sub-advisory fee was reasonable in light of the services received by the Fund from the Sub-Advisor and the other factors considered.
Touchstone International Value Fund. The Fund’s sub-advisory fee was above the median of its peer group. Based upon their review, the Trustees concluded that the sub-advisory fee was reasonable in light of the services received by the Fund from the Sub-Advisor and the other factors considered.
Touchstone Mid Cap Growth Fund. The Fund’s sub-advisory fee was above the median of its peer group. Based upon their review, the Trustees concluded that the sub-advisory fee was reasonable in light of the services received by the Fund from the Sub-Advisor and the other factors considered.
Touchstone Sands Capital Emerging Markets Growth Fund. The Fund’s sub-advisory fee was above the median of its peer group. Based upon their review, the Trustees concluded that the sub-advisory fee was reasonable in light of the services received by the Fund from the Sub-Advisor and the other factors considered.
Touchstone Small Cap Growth Fund. The Fund’s sub-advisory fee was below the median of its peer group. Based upon their review, the Trustees concluded that the sub-advisory fee was reasonable in light of the services received by the Fund from the Sub-Advisor and the other factors considered.
Touchstone Sustainability and Impact Equity Fund. The Fund’s sub-advisory fee was below the median of its peer group. Based upon their review, the Trustees concluded that the sub-advisory fee was reasonable in light of the services received by the Fund from the Sub-Advisor and the other factors considered.
As noted above, the Board considered each Fund’s performance during the six-month, twelve-month, and thirty-six month periods ended June 30, 2015, as applicable, as compared to each Fund’s peer group and noted that the Board reviews on a quarterly basis detailed information about each Fund’s performance results, portfolio composition and investment strategies. The Board also noted the Advisor’s expertise and resources in monitoring the performance, investment style and risk-adjusted performance of each Sub-Advisor. The Board was mindful of the Advisor’s focus on each Sub-Advisor’s performance and the Advisor’s ways of addressing underperformance.
Conclusion. In considering the renewal of the Sub-Advisory Agreement with respect to each Fund, the Board, including the Independent Trustees, did not identify any single factor as controlling, and each Trustee may have attributed different weights to the various factors. The Board reached the following conclusions regarding each Sub-Advisory Agreement, among others: (a) the Sub-Advisor is qualified to manage each Fund’s assets in accordance with the Fund’s investment goals and policies; (b) the Sub-Advisor maintains an appropriate compliance program; (c) the overall performance of each Fund is satisfactory relative to the performance of funds with similar investment objectives and relevant indices or, as discussed above, is being addressed; (d) each Fund’s sub-advisory fees are reasonable in light of the services received by the Fund from the Sub-Advisor and the other factors considered; and (e) the Sub-Advisor’s investment strategies are appropriate for pursuing the investment goals of each Fund. Based on its conclusions, the Board determined that approval of the Sub-Advisory Agreement with respect to each Fund was in the best interests of the Fund and its shareholders.
Management of the Trust (Unaudited)
Listed below is required information regarding the Trustees and principal officers of the Trust. The Trust’s Statement of Additional Information includes additional information about the Trustees and is available, without charge, upon request by calling 1.800.543.0407 or by visiting the Touchstone website at TouchstoneInvestments.com.
| Interested Trustee1: | | | | | | | | |
| | | | | | | | | Number | | |
| | | | | | | | | of Funds | | |
| | | | | | | | | Overseen | | |
| | | | | Term of | | | | in the | | |
| Name | | Position(s) | | Office And | | | | Touchstone | | Other |
| Address | | Held with | | Length of | | Principal Occupation(s) | | Fund | | Directorships |
| Age | | Trust | | Time Served | | During Past 5 Years | | Complex2 | | Held During the Past 5 Years3 |
Jill T. McGruder
c/o Touchstone Advisors, Inc
303 Broadway
Suite 1100
Cincinnati, OH 45202
Year of Birth: 1955 | | President
and Trustee | | Until retirement at age 75 or until she resigns or is removed Trustee since 1999 | | President and CEO of IFS Financial Services, Inc. (a holding company). | | 38 | | Director of LaRosa’s, Inc. (a restaurant chain) from 1999 to 2011; IFS Financial Services, Inc. (a holding company) from 1999 to the present; Integrity and National Integrity Life Insurance Co. from 2005 to the present; Touchstone Securities (the Trust’s distributor) from 1999 to the present; Touchstone Advisors (the Trust’s investment advisor and administrator) from 1999 to the present; W&S Brokerage Services (a brokerage company) from 1999 to the present; W&S Financial Group Distributors (a distribution company) from 1999 to the present; Every Child Succeeds (a social services agency) from 2007 to the present; Taft Museum of Art from 2007 to the present; and YWCA of Greater Cincinnati from 2012 to the present. |
| Independent Trustees: | | | | | | | | |
Phillip R. Cox
c/o Touchstone Advisors, Inc.
303 Broadway
Suite 1100
Cincinnati, OH 45202
Year of Birth: 1947 | | Trustee | | Until retirement at age 75 or until he resigns or is removed Trustee since
1999 | | President and Chief Executive Officer of Cox Financial Corp. (a financial services company) from 1971 to the present. | | 38 | | Director of Cincinnati Bell (a communications company) from 1994 to the present; Bethesda Inc. (a hospital) from 2005 to the present; Timken Co. (a manufacturing company) from 2004 to 2014; TimkenSteel from 2014 to the present; Diebold, Inc. (a technology solutions company) from 2004 to the present; and Ohio Business Alliance for Higher Education and the Economy from 2005 to the present. |
William C. Gale
c/o Touchstone Advisors, Inc.
303 Broadway
Suite 1100
Cincinnati, OH 45202
Year of Birth: 1952 | | Trustee | | Until retirement at age 75 or until he resigns or is removed Trustee since
2013 | | Senior Vice President and Chief Financial Officer (from 2003 to January 2015) of Cintas Corporation (a business services company). | | 38 | | None. |
Management of the Trust (Unaudited) (Continued)
| Independent Trustees (Continued): | | | | | |
| | | | | | | | | Number | | |
| | | | | | | | | of Funds | | |
| | | | | | | | | Overseen | | |
| | | | | Term of | | | | in the | | |
| Name | | Position(s) | | Office And | | | | Touchstone | | Other |
| Address | | Held with | | Length of | | Principal Occupation(s) | | Fund | | Directorships |
| Age | | Trust | | Time Served | | During Past 5 Years | | Complex2 | | Held During the Past 5 Years3 |
Susan J. Hickenlooper
c/o Touchstone Advisors, Inc.
303 Broadway
Suite 1100
Cincinnati, OH 45202
Year of Birth: 1946 | | Trustee | | Until retirement at age 75 or until she resigns or is removed Trustee since 2009 | | Financial Analyst for Impact 100 (charitable organization) from 2012 to 2013. | | 38 | | Trustee of Diocese of Southern Ohio from 2014 to the present; and Trustee of Episcopal Retirement Homes Foundation from 1998 to 2011 (a charitable organization). |
Kevin A. Robie
c/o Touchstone Advisors, Inc.
303 Broadway
Suite 1100
Cincinnati, OH 45202
Year of Birth: 1956 | | Trustee | | Until retirement at age 75 or until he resigns or is removed Trustee since 2013 | | Vice President of Portfolio Management at Soin International LLC (a multinational holding company) from 2004 to the present. | | 38 | | Director of Buckeye EcoCare, Inc. (a lawn care company) from 2013 to the present; Trustee of Dayton Region New Market Fund, LLC (a private fund) from 2010 to the present; Trustee of the Entrepreneurs Center, Inc. (a small business incubator) from 2006 to the present; and Director of Interventional Imaging, Inc. (a medical device company) from 2004 to 2011. |
Edward J. VonderBrink
c/o Touchstone Advisors, Inc.
303 Broadway
Suite 1100
Cincinnati, OH 45202
Year of Birth: 1944 | | Trustee | | Until retirement at age 75 or until he resigns or is removed Trustee since 2013 | | Consultant, VonderBrink Consulting LLC from 2000 to the present. | | 38 | | Director of Streamline Health Solutions, Inc. (healthcare IT) from 2006 to the present; Mercy Health from 2013 to the present; Mercy Health Foundation (healthcare nonprofit) from 2008 to the present; and Al Neyer Inc. (a construction company) from 2013 to the present. |
| 1 | Ms. McGruder, as a director of the Advisor and the Trust’s Distributor, and an officer of affiliates of the Advisor and the Trust’s Distributor, is an “interested person” of the Trust within the meaning of Section 2(a)(19) of the 1940 Act. |
| 2 | As of March 31, 2016, the Touchstone Fund Complex consists of 17 series of the Trust, 1 series of Touchstone Institutional Funds Trust, 2 series of Touchstone Investment Trust, 11 series of Touchstone Funds Group Trust, 1 series of Touchstone Tax-Free Trust, and 6 variable annuity series of Touchstone Variable Series Trust. |
| 3 | Each Trustee is also a Trustee of Touchstone Institutional Funds Trust, Touchstone Investment Trust, Touchstone Funds Group Trust, Touchstone Tax-Free Trust, and Touchstone Variable Series Trust. |
Management of the Trust (Unaudited) (Continued)
The following is a list of the Principal Officers of the Trusts, the length of time served and principal occupations for the past five years.
| Principal Officers: | | | | | | |
| | | | | Term of | | |
| Name | | Position(s) | | Office And | | |
| Address | | Held with | | Length of | | Principal Occupation(s) |
| Age | | Trust1 | | Time Served | | During the Past 5 Years |
Jill T. McGruder
Touchstone Advisors, Inc.
303 Broadway
Suite 1100
Cincinnati, OH 45202
Year of Birth: 1955 | | President | | Until resignation, removal or disqualification President since 2006 | | See biography above. |
Steven M. Graziano
Touchstone Advisors, Inc.
303 Broadway
Suite 1100
Cincinnati, OH 45202
Year of Birth: 1954 | | Vice President | | Until resignation, removal or disqualification Vice President since 2009 | | President of Touchstone Advisors, Inc. |
Timothy D. Paulin
Touchstone Advisors, Inc.
303 Broadway
Suite 1100
Cincinnati, OH 45202
Year of Birth: 1963 | | Vice President | | Until resignation, removal or disqualification Vice President since 2010 | | Senior Vice President of Investment Research and Product Management of Touchstone Advisors, Inc. |
Timothy S. Stearns Touchstone Advisors, Inc.
303 Broadway
Suite 1100
Cincinnati, OH 45202
Year of Birth: 1963 | | Chief Compliance Officer | | Until resignation, removal or disqualification Chief Compliance Officer since 2013 | | Chief Compliance Officer of Touchstone Advisors, Inc.; Chief Compliance Officer of Envestnet Asset Management, Inc. (2009 to 2013). |
Terrie A. Wiedenheft Touchstone Advisors, Inc.
303 Broadway
Suite 1100
Cincinnati, OH 45202
Year of Birth: 1962 | | Controller and Treasurer | | Until resignation, removal or disqualification Controller and Treasurer since 2006 | | Senior Vice President, Chief Financial Officer and Chief Operations Officer of IFS Financial Services, Inc. (a holding company). |
Ellen Blanchard
BNY Mellon
201 Washington St, 34th Fl.
Boston, MA 02108
Year of Birth: 1973 | | Secretary | | Until resignation, removal or disqualification Secretary since 2015 | | Director and Senior Counsel of BNY Mellon Investment Servicing (US) Inc. |
1 Each Trustee is also a Trustee of Touchstone Institutional Funds Trust, Touchstone Investment Trust, Touchstone Funds Group Trust, Touchstone Tax-Free Trust, and Touchstone Variable Series Trust.
PRIVACY PROTECTION POLICY
We Respect Your Privacy
Thank you for your decision to invest with us. Touchstone and its affiliates have always placed a high value on the trust and confidence our clients place in us. We believe that confidence must be earned and validated through time. In today’s world, when technology allows the sharing of information at light speeds, trust must be reinforced by our sincere pledge to take the steps necessary to ensure that the information you share with us is treated with respect and confidentiality.
Our Pledge to Our Clients
| · | We collect only the information we need to service your account and administer our business. |
| · | We are committed to keeping your information confidential and we place strict limits and controls on the use and sharing of your information. |
| · | We make every effort to ensure the accuracy of your information. |
We Collect the Following Nonpublic Personal Information About You:
| · | Information we receive from you on or in applications or other forms, correspondence, or conversations, including, but not limited to, your name, address, phone number, social security number, assets, income and date of birth; and |
| · | Information about your transactions with us, our affiliates, or others, including, but not limited to, your account number and balance, payment history, parties to transactions, cost basis information, and other financial information. |
Categories of Information We Disclose and Parties to Whom We Disclose
We do not disclose any nonpublic personal information about our current or former clients to nonaffiliated third parties, except as required or permitted by law.
We Place Strict Limits and Controls on the Use and Sharing of Your Information
| · | We restrict access to nonpublic personal information about you to authorized employees who need the information to administer your business. |
| · | We maintain physical, electronic and procedural safeguards that comply with federal standards to protect this information. |
| · | We do not disclose any nonpublic personal information about our current or former clients to anyone, except as required or permitted by law or as described in this document. |
| · | We will not sell your personal information to anyone. |
We May Provide Information to Service Your Account
Sometimes it is necessary to provide information about you to various companies such as transfer agents, custodians, broker-dealers and marketing service firms to facilitate the servicing of your account. These organizations have a legitimate business need to see some of your personal information in order for us to provide service to you. We may disclose to these various companies the information that we collect as described above. We require that these companies, including our own subsidiaries and affiliates, strictly maintain the confidentiality of this information and abide by all applicable laws. Companies within our corporate family that may receive this information are financial service providers and insurance companies. We do not permit these associated companies to sell the information for their own purposes, and we never sell our customer information.
This policy is applicable to the following affiliated companies: Touchstone Funds Group Trust, Touchstone Investment Trust, Touchstone Strategic Trust, Touchstone Tax-Free Trust, Touchstone Variable Series Trust, Touchstone Institutional Funds Trust, Touchstone Securities, Inc.,* and W&S Brokerage Services, Inc.
* Touchstone Securities, Inc. serves as the underwriter to the Touchstone Funds.
A Member of Western & Southern Financial Group®
The Privacy Protection Policy is not part of the Annual Report.


Touchstone Investments
Distributor
Touchstone Securities, Inc.*
303 Broadway
Cincinnati, Ohio 45202-4203
800.638.8194
www.touchstoneinvestments.com
Investment Advisor
Touchstone Advisors, Inc.*
303 Broadway
Cincinnati, Ohio 45202-4203
Transfer Agent
BNY Mellon Investment Servicing (US) Inc.
4400 Computer Drive
Westborough, MA 01581
Shareholder Service
800.543.0407
* A Member of Western & Southern Financial Group
TSF-54-TST-AR-1603
Item 2. Code of Ethics.
| (a) | The registrant, as of the end of the period covered by this report, has adopted a code of ethics that applies to the registrant’s principal executive officer, principal financial officer, principal accounting officer or controller, or persons performing similar functions, regardless of whether these individuals are employed by the registrant or a third party. |
| (c) | There have been no amendments, during the period covered by this report, to a provision of the code of ethics that applies to the registrant’s principal executive officer, principal financial officer, principal accounting officer or controller, or persons performing similar functions, regardless of whether these individuals are employed by the registrant or a third party, and that relates to any element of the code of ethics description. |
| (d) | The registrant has not granted any waivers, including an implicit waiver, from a provision of the code of ethics that applies to the registrant’s principal executive officer, principal financial officer, principal accounting officer or controller, or persons performing similar functions, regardless of whether these individuals are employed by the registrant or a third party, that relates to one or more of the items set forth in paragraph (b) of this item’s instructions. |
Item 3. Audit Committee Financial Expert.
The registrant’s Board of Trustees has determined that the registrant has at least one audit committee financial expert serving on its audit committee. Mr. William Gale is the registrant’s audit committee financial expert and is an independent trustee within the meaning of the Investment Company Act of 1940, as amended (the “1940 Act”).
Item 4. Principal Accountant Fees and Services.
Audit Fees
| (a) | Audit fees for Touchstone Strategic Trust totaled $128,900 and $112,800 in fiscal 2016 and 2015, respectively, including fees associated with the annual audits and filings of Form N-1A and Form N-SAR. |
Audit-Related Fees
| (b) | The aggregate fees billed in each of the last two fiscal years for assurance and related services by the principal accountant that are reasonably related to the performance of the audit of the registrant's financial statements and are not reported under paragraph (a) of this Item are $8,000 for 2016 and $0 for 2015. The fees relate to the review of a 485(b) filing and response to SEC letter. |
Tax Fees
| (c) | The Fees for tax compliance services totaled $39,420 and $37,550 in fiscal 2016 and 2015, respectively. The fees relate to the preparation of federal income and excise tax returns and review of capital gains distribution calculations. |
All Other Fees
| (d) | The aggregate fees billed in each of the last two fiscal years for products and services provided by the principal accountant, other than the services reported in paragraphs (a) through (c) of this Item are $20,231 for 2016 and $13,192 for 2015. The fees relate to the PFIC Analyzer and Global Withholding Tax Reporter subscriptions. |
| (e)(1) | Disclose the audit committee's pre-approval policies and procedures described in paragraph (c)(7) of Rule 2-01 of Regulation S-X. |
The Audit Committee’s pre-approval policies describe the types of audit, audit-related, tax and other services that have the general pre-approval of the Audit Committee. The pre-approval policies provide that annual audit service fees, tax services not specifically granted pre-approval, services exceeding pre-approved cost levels and other services that have not received general pre-approval will be subject to specific pre-approval by the Audit Committee. The pre-approval policies further provide that the Committee may grant general pre-approval to other audit services (statutory audits and services associated with SEC registration statements, periodic reports and other documents filed with the SEC or other documents issued in connection with securities offerings), audit-related services (accounting consultations related to accounting, financial reporting or disclosure matters not classified as “audit services,” assistance with understanding and implementing new accounting and financial reporting guidance from rulemaking authorities, agreed-upon or expanded audit procedures related to accounting and/or billing records required to respond to or comply with financial, accounting or regulatory reporting matters and assistance with internal control reporting requirements under Form N-SAR and Form N-CSR), tax services that have historically been provided by the auditor that the Committee believes would not impair the independence of the auditor and are consistent with the SEC’s rules on auditor independence and permissible non-audit services classified as “all other services” that are routine and recurring services.
| (e)(2) | All services described in paragraphs (b) through (d) of Item 4 were approved by the Audit Committee. |
| (f) | The percentage of hours expended on the principal accountant's engagement to audit the registrant's financial statements for the most recent fiscal year that were attributed to work performed by persons other than the principal accountant's full-time, permanent employees was less than fifty percent. |
| (g) | The aggregate non-audit fees for Touchstone Strategic Trust and certain entities*, totaled approximately $59,651 and $50,742 in 2016 and 2015, respectively. |
* These include the advisors (excluding sub-advisors) and any entity controlling, controlled by or under common control with the advisors that provides ongoing services to the registrant (Funds).
| (h) | The registrant's audit committee of the board of trustees has considered whether the provision of non-audit services that were rendered to the registrant's investment adviser (not including any sub-adviser whose role is primarily portfolio management and is subcontracted with or overseen by another investment adviser), and any entity controlling, controlled by, or under common control with the investment adviser that provides ongoing services to the registrant that were not pre-approved pursuant to paragraph (c)(7)(ii) of Rule 2-01 of Regulation S-X is compatible with maintaining the principal accountant's independence. |
Item 5. Audit Committee of Listed Registrants.
Not applicable.
Item 6. Investments.
| (a) | Schedule of Investments in securities of unaffiliated issuers as of the close of the reporting period is included as part of the report to shareholders filed under Item 1 of this form. |
Item 7. Disclosure of Proxy Voting Policies and Procedures for Closed-End Management Investment Companies.
Not applicable.
Item 8. Portfolio Managers of Closed-End Management Investment Companies.
Not applicable.
Item 9. Purchases of Equity Securities by Closed-End Management Investment Company and Affiliated Purchasers.
Not applicable.
Item 10. Submission of Matters to a Vote of Security Holders.
There have been no material changes to the procedures by which the shareholders may recommend nominees to the registrant’s board of trustees, where those changes were implemented after the registrant last provided disclosure in response to the requirements of Item 407(c)(2)(iv) of Regulation S-K (17 CFR 229.407) (as required by Item 22(b)(15) of Schedule 14A (17 CFR 240.14a-101)), or this Item.
Item 11. Controls and Procedures.
| (a) | The registrant’s principal executive and principal financial officers, or persons performing similar functions, have concluded that the registrant’s disclosure controls and procedures (as defined in Rule 30a-3(c) under the Investment Company Act of 1940, as amended (the “1940 Act”) (17 CFR 270.30a-3(c))) are effective, as of a date within 90 days of the filing date of the report that includes the disclosure required by this paragraph, based on their evaluation of these controls and procedures required by Rule 30a-3(b) under the 1940 Act (17 CFR 270.30a-3(b)) and Rules 13a-15(b) or 15d-15(b) under the Securities Exchange Act of 1934, as amended (17 CFR 240.13a-15(b) or 240.15d-15(b)). |
| (b) | There were no changes in the registrant’s internal control over financial reporting (as defined in Rule 30a-3(d) under the 1940 Act (17 CFR 270.30a-3(d))) that occurred during the registrant’s second fiscal quarter of the period covered by this report that has materially affected, or is reasonably likely to materially affect, the registrant’s internal control over financial reporting. |
Item 12. Exhibits.
| (a)(1) | Code of ethics, or any amendment thereto, that is the subject of disclosure required by Item 2 is attached hereto. |
| (a)(2) | Certifications pursuant to Rule 30a-2(a) under the 1940 Act and Section 302 of the Sarbanes-Oxley Act of 2002 are attached hereto. |
| (b) | Certifications pursuant to Rule 30a-2(b) under the 1940 Act and Section 906 of the Sarbanes- Oxley Act of 2002 are attached hereto. |
| (12.other) | Not applicable. |
SIGNATURES
Pursuant to the requirements of the Securities Exchange Act of 1934 and the Investment Company Act of 1940, the registrant has duly caused this report to be signed on its behalf by the undersigned, thereunto duly authorized.
(Registrant) Touchstone Strategic Trust
By (Signature and Title)* /s/ Jill T. McGruder
Jill T. McGruder, President
(principal executive officer)
Date 5/27/16
Pursuant to the requirements of the Securities Exchange Act of 1934 and the Investment Company Act of 1940, this report has been signed below by the following persons on behalf of the registrant and in the capacities and on the dates indicated.
By (Signature and Title)* /s/ Jill T. McGruder
Jill T. McGruder, President
(principal executive officer)
Date 5/27/16
By (Signature and Title)* /s/ Terrie A. Wiedenheft
Terrie A. Wiedenheft, Controller and Treasurer
(principal financial officer)
Date 5/27/16
* Print the name and title of each signing officer under his or her signature.